state of oregon department of geology and … · gorda ridge displayed the highest concentrations...
TRANSCRIPT

STATE OF OREGON DEPARTMENT OF GEOLOGY AND MINERAL INDUSTRIES
910 State Office Building Portland, Oregon 97201
OPEN-FILE RePORT 0-86-14
RADON-222 AS A REAL-TIME TRACER OF HYDROTHERMAL ACTIVITY ON THE GORDA RIDGE
By David Kadko, College of Oceanography, Oregon State University,
Corvallis, Oregon 97331
Final Report for Contract No. 63-630-8505
Submitted to:
Oregon Department of Geology and Mineral Industries
and the
Gorda Ridge Technical Task Force
Released July 1986

NOTICE
This report is based on results oE a research program directed by the joint federal-state Gorda Ridge Technical Task ForcP, managed by the Oregon DPpartment oE Geology and Mineral Industries, and funded by the Minerals Management Service, U.S. Department of the Interior, through Cooperative Agreement. opinions expressed are those of the authors and do not constitute endorsement by the sponsoring agencies or the Task Force.
The Oregon Department of Geology and Mineral Industries is publishing this paper because the subject matter is consistent with the mission of the Department. To facilitate timely distribution of information, camera-ready copy submitted by the authors has not been edited by the staff of the Oregon Department of Geology and Mineral Industries.

TABLE OF CONTENTS
Abstract Page 1
Introduction
Method
Results : Surveyor Expedition Wecoma Expedition
Conclusions
References
LIST OF TABLES
Table
Table 1 - Radon-222 Results - Surveyor May 1985 Table 2 - Radon-222 Results - Wecoma August 1985
LIST OF FIGURES
Fieure
I. Location of stations occupied during the 1985 expeditions to the Gorda Ridge by the research vessels Surveyor and Wecoma
2. Excess radon-222 from Surveyor station GR-1 11
3. Excess radon-222 from Surveyor station GR-3 11
4. Excess radon-222 profiles from Surveyor station GR-5 12
5. Excess radon-222 profiles from Surveyor station GR-10 12
6. Excess radon-222 profiles from Surveyor station GR-9 13
7. Excess radon-222 profiles from Surveyor station GR-14 13
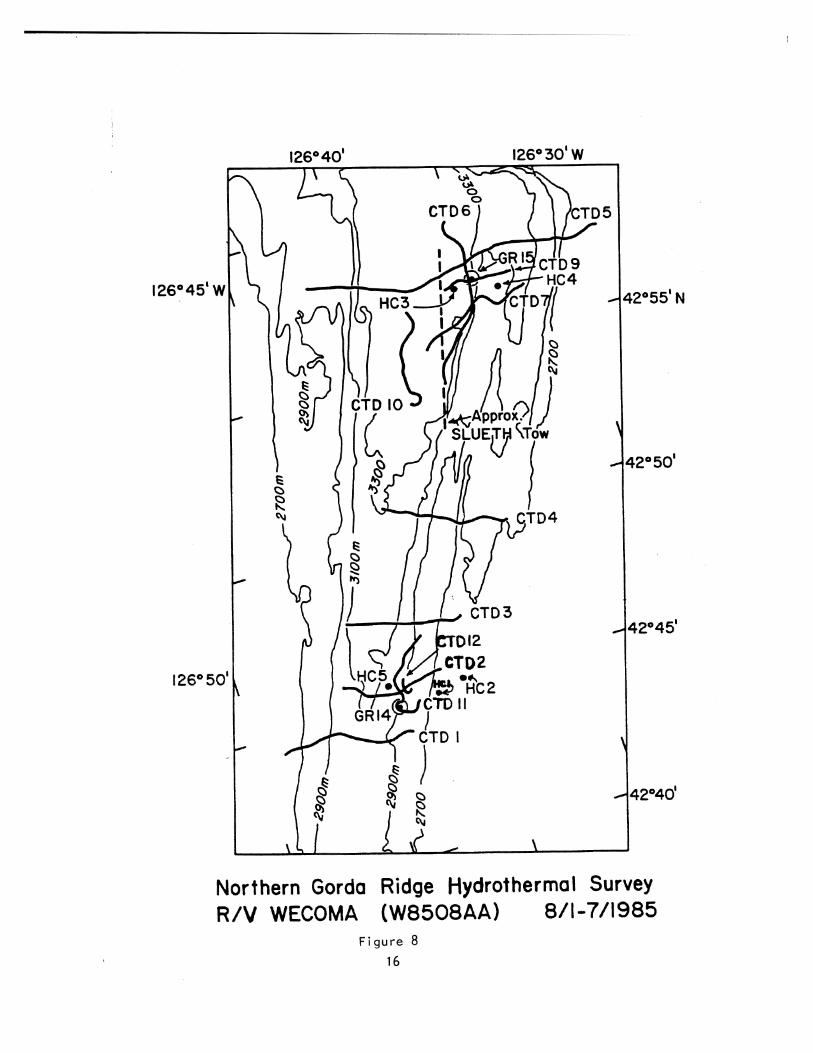
8. Northern Gorda Ridge Hydrothermal Survey R/V Wecoma 16 (W8508AA) 8/1-7/1985
9. Excess radon-222 profiles fromWecomastations GR-14 17 and GR-15

ABSTRACT
Radon-222 is a chemically inert, radioactive gas with a relative-
ly short (3.8 day) half life. It is highly enriched in venting hydro-
thermal fluids, and because it is measured at sea, may be used in
real-time detection of seafloor hydrothermal systems. In 1985, during
two cruises to the Gorda Ridge, radon profiles were obtained by hydro-
casts. High concentrations of this isotope, and of other tracers such
as dissolved manganese, indicated the presence of hydrothermal activi-
ty at several locations along the ridge. Stations at the northern
Gorda Ridge displayed the highest concentrations of these indicators,
which suggests that this area has the greatest potential for locating
active venting .

INTRODUCTION
Several water-column reconnaissance methods exist that are used
to detect the occurrence of active submarine hydrothermal systems.
These include chemical tracers (such as Mn, CHq, and 3~e), physical
tracers (such as temperature), and the use of deeply towed cameras
(Weiss et al. , 1977; Lupton et al. , 1977; Lupton et al. , 1980). These
methods, however, either lack sensitivity (weak signal or high back-
ground) or cannot be used on a real-time basis. Radon-222 is a chemi-
cal tracer that is highly enriched in hydrothermal waters. It is a
chemically inert, radioactive gas (half life = 3.8 d) that is easily
measured at sea. It offers two advantages over other tracers: 1) Be-
cause it is measured at sea, it is valuable in locating hydrothermal
plumes on a real-time basis. Samples are collected from 30-1 Niskin
bottles by hydrocasts, and this water can be analyzed for the 222~n
within hours after collection. 2) Because it is radioactive with a
relatively short half life, its presence in the water column must
indicate a nearby source. Thus the detection of plumes of radon-222
above a mid-ocean spreading center would imply a local occurrence of
hydrothermal venting (Kadko and Lupton, 1984).
In 1985, radon-222 analyses were performed on hydrocast samples
taken during two expeditions to the Gorda Ridge. The first occurred
in May and covered 18 days on the NOAA research vessel Surveyor and
the second was a 7 day cruise in August on the Oregon State University
research vessel Wecoma. The Surveyor expedition surveyed nearly the
entire length of the Gorda Ridge, including a station on the Blanco
Fracture Zone, for the purpose of obtaining the general distribution
of hydrothermal activity in the area (Fig. 1). The Wecoma cruise
centered on the northern Gorda Ridge where an attempt was made to
pinpoint the sources of hydrothermal signals detected in that region
during the earlier Surveyor expedition.

In addition to the radon-222 analyses, investigations of other
hydrothermal indicators were performed by NOAA and OSU personnel dur-
ing this project. Included in this work were measurements of tempera-
ture, relative particle concentration, and trace metal concentrations.
The occurrence of anomalous values for more than one of these parame-
ters was a strong indication of hydrothermal venting. The concurrent
presence of radon further suggested nearbv venting. In this report,
the results of the radon surveys performed on the Gorda Ridge in 1985
are presented.

= i g 1 . Loca t i on o f s t a t i o n s occupied d u r i n g t h e 1985 e x p e d i t i c t o the Gorda Ridge by t he research vesse ls Surveyor anc Wecoma.

METHOD
Water for the radon analysis was collected in 30-1 Niskin bottles
by hydrocast or rosette sampling. Twenty liters of the sample were
transferred into an evacuated glass bottle. The radon was stripped
from the sample by continuous bubbling of He and then trapped on an
activated charcoal column at dry ice temperature. The column was then
heated to approximately 375°C during which time the radon was pulled
into an evacuated ZnS scintillation cell. The cell was placed against
a photomultiplier tube detector and counts were allowed to accumulate
for approximately 8 hours. The data were converted to disintegrations
per minute per 100 liters of seawater (dpm/100 I). (For details of
the procedure see Mathieu reference).
In the following disc.ussion the data is presented as excess radon
(tables 1 and 2). This is the radon present in seawater over the
background level supported by dissolved radium-226, which is the par-
ent nuclide of radon. For this region, this background is
27-30 dpm 100 I. This is determined by either direct measurement of
the radium, or by measuring the radon well above any bottom source
(i.e. only the background will be sampled). Aside from hydrothermal
venting, some excess radon can diffuse out of the sediment into the
bottom water. This bottom excess is usually distinguishable from
mid-depth plumes of radon caused by hydrothermal emission, as radon
atoms from the sediments rapidly decay as they are transported away
from the bottom.

TABLE 1
Radon-222 Results - Surveyor May 1985
Station Cast Depth Excess 222~n Comments
GR- 1 1 3533 3423 3342 3251 3139 3047 2845 2631
GR- 3
GR- 5
GR- 5
33.0 10.1 14.8 3.7
- 7 Below background? >7 Some sample lost -0.7 0.4
BGD - 27 dmp/100 2
31.3 sample lost
6.1 sample lost sample lost
7.1 2.3 0
BGD - 27 dpm/100 R
40.7 27.3 30.7 4.6 5.1 10.4 10.9 1.2
BGD - 27 dpm/100 R

Table 1 (continued)
Station Cast Depth Excess 222~n Comments
GR- 10 8 3312 3085 2935 2835 2669 2521 2372 2224
GR- 9
GR- 14
BGD - 27 dpm/100 1
Below background
BDG -27 dpm/100 I
BGD - 29.7 + 2.6* BGD = 28.9 + 1.0* BGD = 30.8 k 1.1* BGD - 30 ** BGD - 30 ** BGD - 33.9 ? 1.6*
* measured Ra-226 ** assumed values

TABLE 2 Radon-222 Results - Wecoma - August 1985
Station Depth (m) Excess 222~n (dpm/100 P)* Mn (nM)**
GR-14 Hydro #1 2625
2550 2475 2400 2325 2250 2175 2100
Hydro #2 2565 2485 2425 2365 2305 2245 2185 2125
Hydro #5 2610 2510 2460 2410 2360 2310 2260 2160
GR- 15 Hydro #3 3200
3150 3100 3050 3000 2925 2850 2750

Table 2 (continued)
Station Depth (m) Excess 2 2 2 ~ n (dpm/100 R)* Mn (nM)**
GR- 15 (continued) Hydro #4 2965
2915 2865 2815 2765 2715 2665 2615
* BGD - 28 dpm/100 R ** Data from R. Collier (OSU)

RESULTS
Survevor ex~edition
Station GR-1 was located in the Cascadia Basin (fig. 1) in the
Blanco Fracture Zone. Fig. 2 shows the excess radon profile obtained
at that site. The near bottom excess (below 3200 m depth) is from the
sediment source, and it decreases with height above bottom in a fash-
ion typical for deep sea areas. At 3050 m, however, a mid-depth plume
was detected. This corresponded with both a small dissolved Mn anoma-
ly (R. Collier, OSU) and slightly higher particulate Fe/Al and Mn/Al
ratios (G. Massoth, NOAA). A hydrothermal influence within this layer
is suggested, but the weak signal suggests either a distant or low
intensity source.
Station GR-3, in the axial valley of the Gorda Ridge, displayed a
strong hydrothermal signal. In figure 3 bottom excess radon is seen
below 3100 m which is readily distinguished from two mid-water plumes
at 2780 m and about 2400 m. The lower peak corresponded to elevated
Mn concentrations, while the peak at 2400 m corresponded to both a
broad maximum in Mn and in particle content as detected by the nephe-
lometer system (E. Baker, NOAA). These observations certainly sug-
gested a more intense, nearby source of hydrothermal venting.
Station GR-5 consisted of two casts. The first (#7) was situated
towards the eastern wall of the axial valley at a bottom depth of
about 3450 m. The second (#11) was in the central axial valley at a
depth of about 3670 m. Both casts had indicators suggestive of hydro-
thermal venting, but the signals were not strong (fig. 4). Cast #7
showed small elevations of radon and manganese throughout the water
column. Cast #11 showed a distinct radon plume at about 3000 m depth,
which corresponded to a Mn and particle minimum. This is an unusudl
feature with no obvious explanation at this time.

G R - I
Cast # I
Excess "'Rn (dpm/100!) F i g 2 . Excess radon-222 f rom Surveyor s t a t i o n G R - 1
G R - 3
Cast #4
Mn, Nephel. mox.
Mn. max
Excess ' * ' ~ n (dprn/~ooR) F i g 3 . Excess radon-222 f rom Surveyor s t a t i o n GR-3
1 1

G R-5
a Cast # 7 -East Wall, Axial Val ley
0 Cast # I I-Center, Axial Val ley
F i g . 4 Excess radon-222 p r o f i l e s f r om Surveyor s t a t i o n G R - 5
F i g . 5 Excess radon-222 p r o f i l e f r om Surveyor s t a t i o n G R - 1 0
Excess Rn (dpm/100!)
2233; .,
Excess 22'Rn (dpm/lOOR) 12
2600-
C
E e
I k n W 0
3000-
34001
\ \ G R- I0 \ \
/ Cast # 8
/
4' /
/ /
*: \ \ \
\a\ \ \ \\.
1 1
1 0- --- - - - - - - - - - - - - - -_ - --*-
1101 6 I I I I I L I
10 20 30 40 50 60 70

G R - 9
Cost # 9
Excess 222Rn (dpm/1001)
F i g 6 . Excess radon-222 p r o f i l e f rom Surveyor s t a t i o n GR-9
Excess "'Rn (dprn/lOOX)
F i g . 7 Excess radon-222 p r o f i l e f rom Surveyor s t a t i o n G R - 1 4

Station GR-10 was situated in the northern Escanaba trough of the
Gorda Ridge, and represents the southernmost station of the survey.
As at station GR-1, a bottom excess of radon from the sediments is
distinguished from a weak signal higher in the water column (fig. 5).
This mid-water excess of radon at 2400 m does correspond to a weak
dissolved Mn anomaly. This suggests either a distal source of venting
or less intense local venting. It should be noted that massive sul-
fides were later dredged in the southern Escanaba trough, approximate-
ly 50 km from our site.
Station GR-1, a bottom excess of radon from the sediments is
distinguished from a weak signal higher in the water column (fig. 5).
This mid-water excess of radon at 2400 m does correspond to a weak
dissolved Mn anomaly. This suggests either a distal source of venting
or less intense local venting. It should be noted that massive sul-
fides were later dredged in the southern Escanaba trough, approximate-
ly 50 km from our site.
Station GR-9 (fig. 1) was another axial valley station but one
which did not display any indication of nearby hydrothermal venting.
Oceanographically, the site was of interest because of a strongly
mixed benthic layer which displaced bottom radon, Mn, and particles
over 500 meters above the seafloor. A constant temperature was also
observed in the bottom 400 m (E. Baker, NOAA). The presence of hydro
thermal activity at this site cannot be ruled out completely, because
the intense bottom mixing may have dispersed any measurable signals.
The radon profile is shown in fig. 6.
Station GR-14, located on the northern Gorda Ridge (fig. l),
showed sharp hydrothermal signals in Rn-222 (fig. 7), Mn (R. Collier,
OSU) and particulate concentration (E. Baker, NOAA) at a clearly de-
fined depth of 2800 m. This site was chosen for reoccupation in the
following Wecorna cruise.

Wecoma Exuedition
The purpose of this cruise was to reoccupy the northern Gorda
Ridge stations (GR-14 and 15) and pinpoint sources of the strong
hydrothermal signals which were observed there during the Survevor
cruise. The CTD tows and hydrocast locations are shown in fig. 8.
Station GR-14 was surveyed extensively with CTD, and transmisso-
meter tows as well as with three hydrocasts. Temperature and particu-
late anomalies were detected but the signals showed appreciable spa-
tial variability; i.e., there was no strong, extensive plume of hydro-
thermal material observed over the entire surveyed area. Rather,
there appeared to be a generally pervasive low level signal with an
occasionally more intense anomaly. Results of the hydrocasts are
shown in table 2 and fig. 9. These casts were somewhat shallower than
the strong hydrothermal signal detected at 2800 m in the Surveyor
GR-14 cast (fig. 7). A somewhat weaker signal in radon and manganese
is seen here at about 2400 m depth which did coincide with a particle
maximum. During the Survevor cruise, particulate plumes were also
detected at this depth but no radon and manganese were sampled at that
time. The combined GR-14 data from the two cruises suggest several
sources of venting in the area, probably from different depths up
along the axial valley walls.
Station GR-15 was also reoccupied during the Wecoma cruise.
During the Survevor expedition, a very large Mn and particle signal
was detected at a depth of 2800-2900 meters at this site. Hydrocast
#4 which was somewhat to the east of the GR-15 axial valley site
(fig. 8), displayed a very large plume of radon-222 at this depth,
suggesting a venting source up along the valley wall rather than from
the valley floor which is located at depths greater than 3300 m.
Hydrocast #3 which was west of GR-15 displayed a less intense radon
signal (fig. 9). The site of hydrocast #4 has the greacest potential
for locating active venting of all the areas surveyed in this study.
1260 40' 1260 30' W
H 42040'
Northern Gorda Ridge Hydrothermal Survey R/V WECOMA ( W 8 5 0 8 A A ) 8/1-711985
F i g u r e 8 16

G R - 14
Hydro # l
A Hydro # 2
0 Hydro # 5
Excess 222Rn ( d p m / l ~ O f )
Excess '"Rn (dprn/ i00A)
F i g . 9 Excess radon-222 p r o f i l e s f r om Wecoma s t a t i o n s GR-14 and G R - 1 5 .

CONCLUSIONS
Radon-222 surveys were performed during two expeditions in 1985
which attempted to locate active hydrothermal venting along the Gorda
Ridge. These analyses were made in conjunction with other investiga-
tors who measured additional parameters which are useful indicators of
hydrothermal activity, such as Mn, temperature and particle concentra-
tion. Parti.cularly high concentrations of radon and anomalous signals
in these other indicators were detected over two stations in the
Northern Gorda Ridge. Though the exact location of the source of
these signals was not found, the depths of the apparent hydrothermal
"plumes" suggest a source higher along the valley walls, rather than
on the much deeper axial valley floor. Station GR-15, located at the
intersection with the Blanco Fracture Zone, displayed not only the
highest radon concentrations of all stations studied, but revealed
high Mn and particulate concentrations as well. It perhaps has the
greatest potential for locating active hydrothermal venting and hope-
fully will be reoccupied in future work on the Gorda Ridge.

REFERENCES
Kadko, D. and J.E. Lupton, 1984, Radon-222 and temperature measure-
ments on the Endeavour Ridge, EOS, Trans. Amer. Geophys. Union,
65:974.
Lupton, J.E., R.F. Weiss and H. Craig, 1977, Mantle helium in hydro-
thermal plumes in the Galapagos Rift, Nature, 267:603-604.
Lupton, J.E., G.P. Klinkhammer, W.R. Normark, R. Haymon,
K.C. MacDonald, R.F. Weiss and H. Craig, 1980, Helium-3 and
Manganese at the 21°N East Pacific Rise hydrothermal site, Earth
Planet. Sci. Lett., 50:115-127.
Mathieu, G., 1977, Rn222- Ra226 Technique of Analyses. h Annual report to the Energy Research and Development Administration,
Contract EY 76-S-02-2185. Appendix 1:l-30.
Weiss, R.F., P. Lonsdale, J.E. Lupton, A.E. Brainbridge and H. Craig,
1977, Hydrothermal plumes in the Galapagos Rift, Nature,
267:600-603.