state of the art thermal energy storage - jyx
TRANSCRIPT
STATE OF THE ART THERMAL ENERGY STORAGE
SOLUTIONS FOR HIGH PERFORMANCE BUILDINGS
Cao Sunliang
Master’s Thesis University of Jyväskylä Department of Physics
Master’s Degree Programme in Renewable Energy 3.6.2010

Supervisors: Professor Arild Gustavsen Norwegian University of Science and Technology (NTNU), Norway Dr. Jussi Maunuksela Department of Physics, University of Jyväskylä, Finland

ABSTRACT
In this thesis, the general thermal energy storage solutions for high performance buildings have
been comprehensively reviewed. Based on the properties of storage material, the thermal
storage solutions can be classified into sensible, latent and thermochemical heat storages. Their
categories, characteristics and certain applications have been systematically introduced. Special
emphases are put on the latent thermal storage technologies. Different classifications of phase
change materials (PCMs), i.e. organic-, inorganic-, and eutectic- PCMs, have been carefully
presented with their particular features and material candidates. PCM applications can cover
almost every part of the building envelopes, such as wall, floor, ceiling, roof, window and
sunshading systems. They can function either as a thermal buffer to alleviate the exterior
environmental influences, or as an “automatic” indoor temperature regulator to attenuate the
indoor temperature fluctuations and improve the thermal comfort. An experimental work
conducted by me in NTNU/SINTEF Building and Infrastructure’s Laboratory has also been
presented, analysed and discussed in this thesis. The laboratory work focused on the PCM
integrated wall with the purpose to investigate the influences caused by convective conditions
and attachment of PCM layer: their influences on the temperatures, heat fluxes, stratifications
(temperature and heat flux), energy storage effect, heat conductive loss, convection coefficient,
and energy saving effect will be carefully compared and analysed in this thesis. The much
enhanced energy storage and release effects by attachment of PCM layer during phase change
processes resulted in a less fluctuated interior environment and much significant energy saving
effect. Meanwhile, the interior convective conditions would influence the foregoing effects
caused by attachment of PCM layer, thus the best optimization of PCM layer and convective
conditions should be based on the analysis of thermal comfort zone under certain conditions in
room environment.
Keywords: Thermal energy storage, Phase change material, PCM

PREFACE
This Master’s thesis project was conducted between Nov. 1st 2009 – Apr. 30th 2010 in
Norwegian University of Science and Technology (NTNU, Norway) as part of the ZEB (Zero
Emission Building) project. The work in this thesis project combined the state of the art
review for different thermal storage technologies and an experimental work for the
investigation of PCM (Phase Change Material) integrated wall. The experimental work of this
thesis project was carried out in NTNU/SINTEF Building and Infrastructure’s Laboratory.
The status for me to do this thesis project in NTNU was as a Nordplus Exchange student. The
fundings for my thesis project were from two organizations: (1) Thesis Scholarship from
Department of Physics, University of Jyväskylä; (2) Nordplus Exchange Programme
Scholarship.
Firstly, I would like to express my most sincere appreciations for my supervisor in NTNU
Professor Arild Gustavsen. During these 6 months’ thesis project in Norway, he provided me
very valuable advice on my work, timely feedbacks on the content, great encouragement for
the progresses and also substantial help for my life in Norway. The working load in this thesis
project was rather heavy, but with Professor Arild Gustavsen’s encouragement, I finally
overcame all kinds of difficulties and reached my destination.
I also would like to thank my supervisor in University of Jyväskylä Dr. Jussi Maunuksela. He
helped me a lot when applying for the scholarships, and provided me significant instructions
and advice on how to better arrange the working schedule, organize the thesis content, and
solve particular technical problems I met in my work.
Furthermore, I would like to acknowledge Senior Scientist Sivert Uvsløkk from SINTEF.
Without his instruction and guidance in the NTNU/SINTEF Building and Infrastructure’s
Laboratory, it is impossible to proceed so smooth with the experimental work. I was rather
impressed that Sivert was always so patient to me and my various questions. Every time I met
involved technical problems with the test rig, Sivert would always help me in time to find out
the solution together and explain the detailed principles to me. A lot of theoretical and
practical knowledge has been learnt from him. Most important, he let me understand what
capabilities a professional engineer should obtain in practical work.
I also would like to thank so many excellent experts and colleagues I met or contacted during
this 6 months’ project: Bjørn Petter Jelle from SINTEF for his help in my experimental work,
especially during the planning period; Jacques Gilbert from Dupont to provide us the
DupontTM Energain® Panels and his technical help; John Nygård and Øystein Holmberget
from SINTEF for their assistants in installing the tested wall; Egil Rognvik from SINTEF for
his help in operating the electrical components of the test rig; Manager Einar Bergheim from
SINTEF for his arrangement of the laboratory; my two office colleagues Nora Klungseth and
Nicola Lolli for their great help in the office and my life in Trondheim. Thanks for all the
friends who helped my work and life during my staying in Norway.
Life is a journey. There is no doubt that this thesis project is one of the most memorable
periods in my whole life. The knowledge and experiences gained from this thesis project will
accompany, guide and provide me more knowledge, confidence and determination for the
new journey ahead in future.
Cao Sunliang
May 2010

CONTENT
ABSTRACT ..............................................................................................................................3
PREFACE..................................................................................................................................5
CONTENT ................................................................................................................................7
1 INTRODUCTION...............................................................................................................9
1.1 Overview for the thesis .............................................................................................9
2 THERMAL ENERGY STORAGE TECHNOLOGY ....................................................... 11
2.1 Sensible Heat Storage .............................................................................................13
2.1.1 Liquids form .................................................................................................14
2.1.2 Solids form ...................................................................................................25
2.2 Thermochemical Heat Storage................................................................................37
3 LATENT HEAT STORAGE / PCM STORAGE FOR BUILDINGS ...............................42
3.1 Phase Change Materials ..........................................................................................42
3.1.1 Organic PCM................................................................................................47
3.1.2 Inorganic PCM .............................................................................................52
3.1.3 Eutectic PCM................................................................................................54
3.1.4 Commercial product .....................................................................................54
3.2 PCM Applications for high performance buildings ................................................57
3.2.1 PCM integrated wall.....................................................................................57
3.2.2 PCM assisted under-floor electrical heating system.....................................66
3.2.3 PCM assisted ceiling heating and cooling....................................................70
3.2.4 PCM integrated roof .....................................................................................75
3.2.5 PCM filled glass windows............................................................................77
3.2.6 Sunshading with PCM..................................................................................79
3.2.7 PCM Seasonal storage..................................................................................82

4 PCM WALLBOARD EXPERIMENTS............................................................................ 89
4.1 Review of previous PCM wallboard experiments.................................................. 89
4.2 Overview of the experiments................................................................................ 105
4.3 Descriptions of the test rig.................................................................................... 105
4.4 Test wall configurations.........................................................................................110
4.5 Measurement devices ............................................................................................115
4.6 Experimental procedure........................................................................................ 120
4.7 Experimental results and analysis ........................................................................ 123
4.7.1 Air and surface temperatures in the metering box ..................................... 123
4.7.2 Temperature stratifications in the metering box ........................................ 126
4.7.3 Heat fluxes and energy storage effect ........................................................ 137
4.7.4 The stratification of heat fluxes ................................................................. 139
4.7.5 Mean heat conductive loss of the tested wall............................................. 144
4.7.6 Convection coefficient of the interior surface of the tested wall ............... 145
4.7.7 Energy saving effect................................................................................... 150
4.7.8 Comparison with the computer simulations............................................... 152
4.8 Future work .......................................................................................................... 161
5 CONCLUSIONS............................................................................................................. 163
5.1 Conclusions for the review of thermal energy storages ....................................... 163
5.2 Conclusions for PCM wall experiments............................................................... 164
6 REFERENCES................................................................................................................ 168
APPENDIX I ........................................................................................................................ 177

9
1 INTRODUCTION
Nowadays, as global warming is becoming one of the most urgent problems in the world, we
need to find a better way to utilize energy: not only in the field of energy production,
transmission, distribution, and consumption, but also in the area of energy storage. With the
energy storage technology, we can overcome the imbalance between the energy production and
consumption, alleviate the stressed production load of the power plant at the peak hours, and
reduce consumers’ electricity costs by avoiding higher peak hour tariffs. Moreover, the energy
storage is badly needed to minimize the shortcomings of renewable energy technologies.
Currently, most of the renewable energy sources, especially wind energy and solar energy, are
timely-based energy sources, whose available energy densities are variable during different
hours. Here, the energy storage technology can be used for storing the excess renewable energy
in high production hours, to make up the trough during low production hours, and to better
integrate the energy generator into the local electricity grid.
Generally speaking, energy storage technology can be divided into two main categories:
thermal energy storage and electrical energy storage, both of which are also the main energy
consumption types in our daily life. In this thesis, I will focus on the thermal energy storage,
especially on the phase change thermal storage technology.
1.1 Overview for the thesis
In the following parts of the thesis, Section 2 will mainly introduce the sensible and
thermochemical heat storage solutions, while Section 3 will particularly focus on the latent
heat storage for high performance buildings. In Section 4, the previous PCM wallboard
experiments done by other researchers will firstly be reviewed, and thereafter a PCM

10
integrated wall experiment conducted by me in our NTNU/SINTEF Building and
Infrastructure Laboratory as part of the ZEB project [1] will be presented and analysed in
detail.

11
2 THERMAL ENERGY STORAGE TECHNOLOGY
There are two main energy storage technologies: thermal and electrical energy storages. In
essence, they are not exactly separate technologies. In theory, the thermal energy storage can be
used to store the electrical energy, while the electrical storage can also be used to store the
thermal energy. The reason that we seldom use the thermal storage technology to store the
electrical energy (or use the electrical storage to store the thermal energy) is that the
transformation between thermal and electrical energy will lead to a relatively large amount of
energy lost.
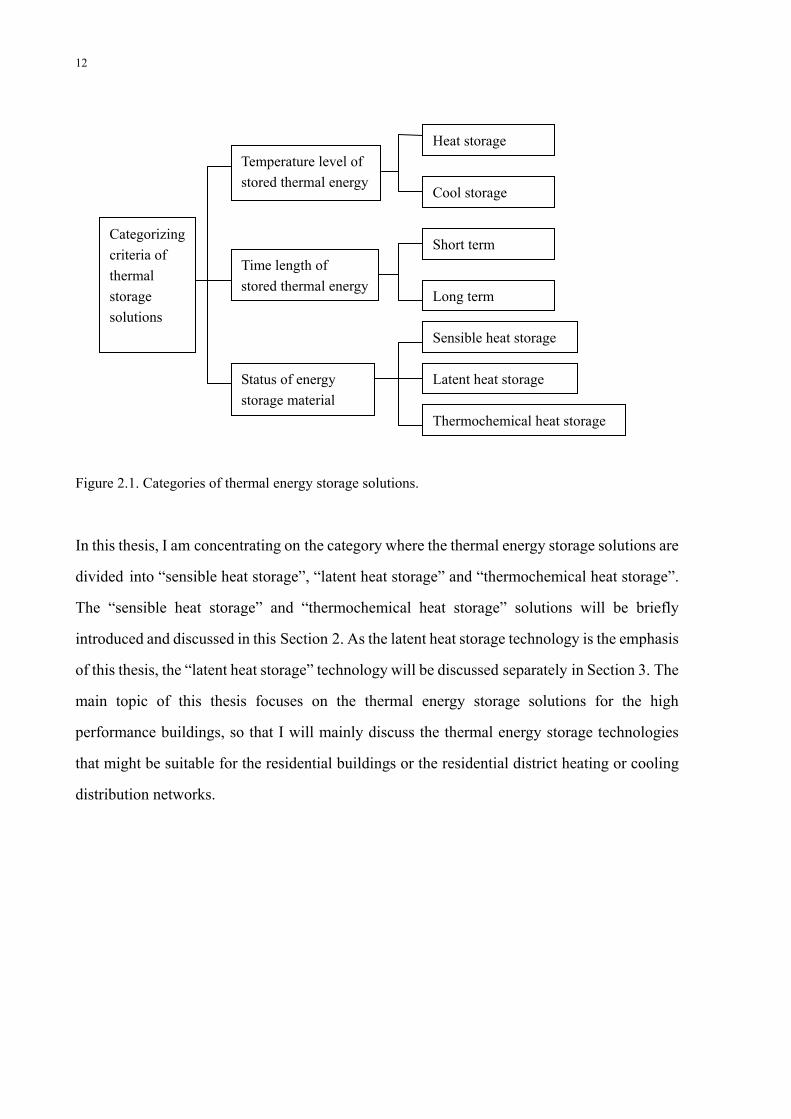
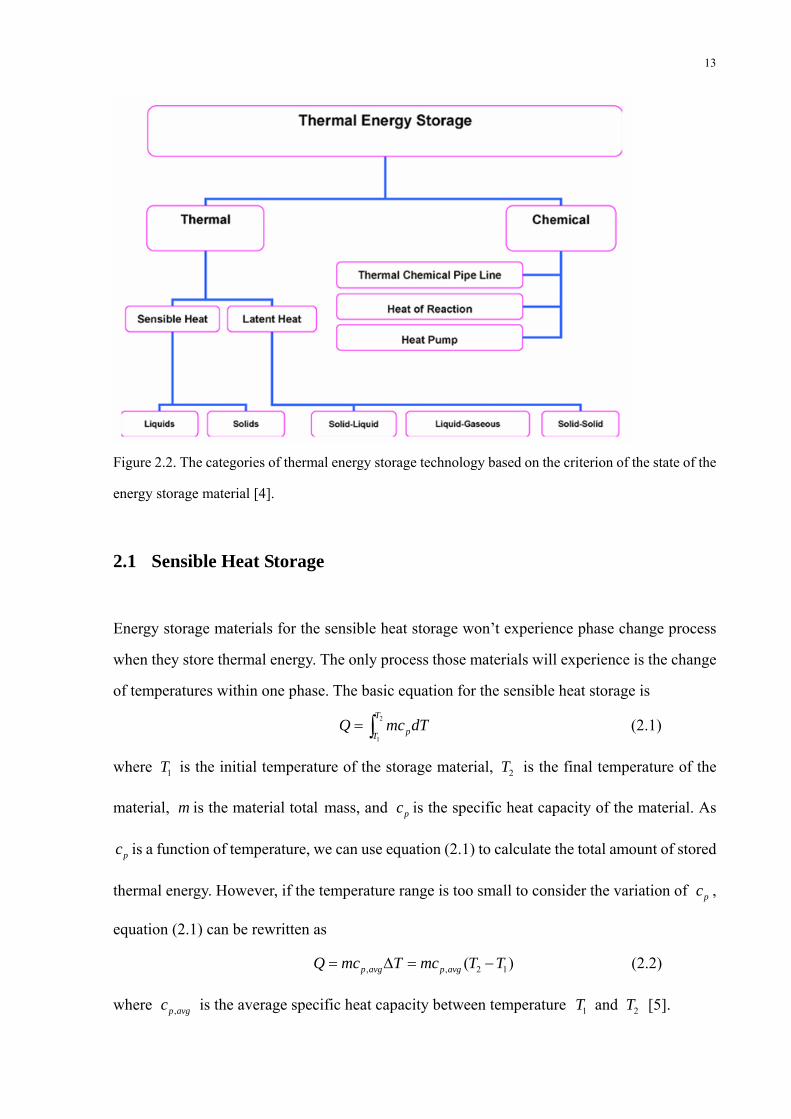
Different criteria lead to various categories of thermal energy storage technologies (Figure 2.1).
If the criterion is based on the temperature level of stored thermal energy, the thermal storage
solutions can be divided into “heat storage” and “cool storage” [2, 3]; if based on the time
length of stored thermal heat, it can be divided into “short term” and “long term”; if based on
the state of energy storage material, it can be divided into “sensible heat storage”, “latent heat
storage” and “thermochemical heat storage” [4]. Sharma et al. [4] made a very compelling
schematic (Figure 2.2) of the categories based on the criterion of state of the energy storage
material.
12
Figure 2.1. Categories of thermal energy storage solutions.
In this thesis, I am concentrating on the category where the thermal energy storage solutions are
divided into “sensible heat storage”, “latent heat storage” and “thermochemical heat storage”.
The “sensible heat storage” and “thermochemical heat storage” solutions will be briefly
introduced and discussed in this Section 2. As the latent heat storage technology is the emphasis
of this thesis, the “latent heat storage” technology will be discussed separately in Section 3. The
main topic of this thesis focuses on the thermal energy storage solutions for the high
performance buildings, so that I will mainly discuss the thermal energy storage technologies
that might be suitable for the residential buildings or the residential district heating or cooling
distribution networks.
Categorizing criteria of thermal storage solutions
Temperature level of stored thermal energy
Time length of stored thermal energy
Status of energy storage material
Heat storage
Cool storage
Short term
Long term
Sensible heat storage
Latent heat storage
Thermochemical heat storage
13
Figure 2.2. The categories of thermal energy storage technology based on the criterion of the state of the
energy storage material [4].
2.1 Sensible Heat Storage
Energy storage materials for the sensible heat storage won’t experience phase change process
when they store thermal energy. The only process those materials will experience is the change
of temperatures within one phase. The basic equation for the sensible heat storage is
2
1
T
pTQ mc dT= ∫ (2.1)
where 1T is the initial temperature of the storage material, 2T is the final temperature of the
material, m is the material total mass, and pc is the specific heat capacity of the material. As
pc is a function of temperature, we can use equation (2.1) to calculate the total amount of stored
thermal energy. However, if the temperature range is too small to consider the variation of pc ,
equation (2.1) can be rewritten as
, , 2 1( )p avg p avgQ mc T mc T T= Δ = − (2.2)
where ,p avgc is the average specific heat capacity between temperature 1T and 2T [5].
14
From the foregoing definition as well as equations (2.1) and (2.2), we can see that desirable
sensible heat storage requires the energy storage material to have four characteristics [2]:
high specific heat capacity
long term stability under thermal cycling
good compatibility with its containment
low cost
The high specific heat capacity pc can have direct impact on the amount of stored thermal
energy based on equations (2.1) and (2.2). The long term stability assures the low degradation
of the heat storage material after hundreds or thousands of thermal cycling. Good compatibility
with its containment is the requirement for both the heat storage material and the containment,
and is one of the main factors of the total cost of the storage system. The cost of the sensible
heat storage solution mainly depends on the characteristics of the storage material. It is very
common to utilize very cheap materials such as water, rocks, pebbles, sands, etc, as the storage
medium.
It has been illustrated in Figure 2.2 that the sensible heat storage can be categorized by the state
of storage material into liquids and solids. Both states have their own characteristics and
application fields, which will be discussed next.
2.1.1 Liquids form
(1) Water storage.
The most commonly used liquid for sensible heat storage is water. According to the
aforementioned four characteristics, water has relatively high specific heat capacity, almost no
degradation under thermal cycling, good compatibility with most of containment material
(stable, mild and no corrosive chemical properties), and most importantly, widely available and
cheap.

15
Figure 2.3. A typical solar thermal system using water storage technology [6].
Nowadays, with the reasonable cost and simple implementation, water storage technology is
widely used in the solar thermal engineering field (Figure 2.3). Duffie and Beckman [6]
provided a basic theoretical introduction for the water storage in solar thermal systems as well
as analytical models for the water storage stratification. Stratification is the temperature
gradient existing in the water storage, where typically the water temperature at the bottom will
be relatively lower than the water at the top. Almost all the water storage tanks have certain
degrees of stratification, depending on the size, volume, geometries, water flow rates, and
circulation conditions of the storage system.
Duffie and Beckham introduced two methods to quantitatively analyse the stratified water
storage models [6]: “multimode” and “plug flow” approaches. In the “multimode” approach, a
water storage tank is modeled as divided into N nodes (sections), so that N differential
equations (energy balance equations for each node) can be solved for each Node’s
temperature as a function of time; in the “plug flow” approach, it is assumed that segments of
liquid at various temperatures move through the water storage tank in plug flow, so that we
can keep track of the size, temperature, and position of different segments as a bookkeeping
method [6]. Both of these approaches can be solved numerically with certain mathematical
programmes (C++, Matlab, TRNSYS, etc).
Water Storage Tank at Ts
Solar Collector
To Collector Return from Load
Ts to Load To
Ti=Ts
16
(2) Seasonal water storage
Due to the relatively developed theoretical and practical technology, the sensible water
thermal storage technology has not only been used for short term (diurnal) thermal storage,
but also for long term (seasonal) thermal storage. Seasonal thermal storage has longer thermal
storage period, generally three or more months. Thus, the seasonal energy storage can fully
utilize the temperature differences between summer and winter, meeting or supplementing the
heating/cooling demands for both seasons. Different from short term thermal storage
technology, the seasonal thermal storage keeps the storage material at a lower temperature
than that of short term storage, in order to reduce the thermal losses during the long storage
period. Considering the low storage temperature for the seasonal thermal storage, heat pumps
are usually used to assist supplying the heating or cooling demand [7].
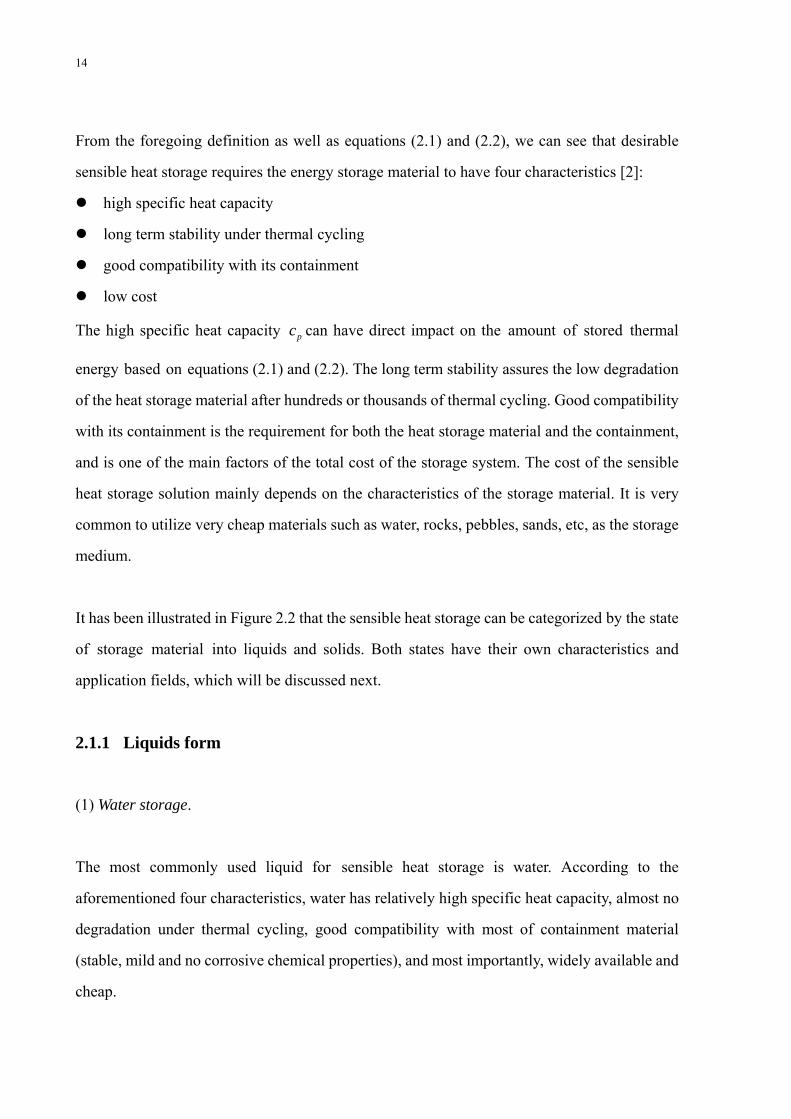
Figure 2.4. Different types of sensible seasonal heat storage.
Generally speaking, there are five types of sensible seasonal thermal storage: hot water
thermal energy storage (HWTES), aquifer thermal energy storage (ATES), gravel-water
thermal energy storage (GWTES), borehole thermal energy storage (BTES), and cavern
thermal energy storage (CTES) [7, 8]. Among these five storage methods, HWTES, ATES,
Sensible Seasonal Heat Storage
Liquids
Solids
Hot water thermal energy storage (HWTES)
Aquifer thermal energy storage (ATES)
Gravel-water thermal energy storage (GWTES)
Borehole thermal energy storage (BTES)
Cavern thermal energy storage (CTES)

17
and CTES belong to the type of sensible water thermal storage; BTES belongs to the type of
sensible solid storage; while GWTES is a combination of sensible liquids and sensible solids
storage (Figure 2.4). As this Section 2.1.1 focuses on the sensible liquid form of storage
material, here will only briefly introduce HWTES, ATES and CTES, while BTES and
GWTES will be discussed in Section 2.1.2.
HWTES, ATES and CTES are all water storage and thus obey the theoretical and numerical
principles introduced in [6]. Among these three types of seasonal water storage methods,
cavern thermal energy storage (CTES) needs construction of large underground water
reservoirs to serve as the thermal energy system. Therefore, immense investment limits the
practical application of the cavern storage method, which is seldom used nowadays [7].
HWTES and ATES are, however, both realized and studied in Germany [8]. HWTES uses
large volumes of water as the storage material with reinforced concrete tank as the
containment (Figure 2.5) [8]. It can be partially buried in the ground, and is thus allowed to be
designed and manufactured almost independently of geological conditions [7]. The thermal
insulation is provided by embedding insulation materials at least on the roof areas and the
vertical walls, while the steel liners are also incorporated to avoid the heat losses due to the
vapor diffusion through the wall structure (thus also strengthen the water tightness) [7].
According to the analysis based on the monitoring results from a system in Friedrichshafen,
Germany, this system hasn’t reached the expected design criteria [8]. Generalising from the
results with the system in Friedrichshafen, Germany, the main problems with this kind of
HWTES system might include [7, 8]:
Wrong estimation of heat demand during the design period;
Higher thermal storage temperatures result from the higher net return temperatures than
the design value, which leads to higher heat losses of thermal storage; the higher net
return temperatures than the design value are either due to a higher heating demand in
practice, or due to poor performances of the heat exchangers (for example, fouling
problem) in the distribution network;
Poor thermal insulation of the heat storage envelope can also leads to higher heat losses

18
of the heat storage;
Although the water storage tank does not need heavy excavation work, the requirements
for the tank structures and envelopes are very high. This kind of large volume water tank
with high insulation requirement is usually very expensive;
The water tank is quite visible and usually influences the view of landscape.
(a)
(b)
Figure 2.5. (a) Hot water thermal energy storage; (b) A heating distribution system equipped with
typical sensible seasonal hot water thermal storage (HWTES), backup boilers and solar collectors in
Friedrichshafen, Germany. [8]

19
(a)
(b)
Figure 2.6. (a) Aquifer thermal energy storage (ATES); (b) A heating distribution system equipped with
typical sensible seasonal aquifer water thermal storage (ATES), heat pumps and solar collectors in
Rostock, Germany. [8]
Different from artificial HWTES, aquifer thermal energy storage (ATES) relies on the natural
aquifer layer, which avoids both the expenses of heavy excavation and the construction of the
water tank. In the basic concept of ATES, groundwater is extracted from one of the well
groups, and then heated or cooled within the building before being reinjected back into the
aquifer in the other well group [9]. Figure 2.6 is a typical system utilizing ATES technology in

20
Rostock, Germany [8]. From Figure 2.6 we can see that the framework of this system is very
similar to that of water source heat pump. The similar frame and principle between ATES and
heat pump present a fantastic way to integrate both of the technologies together.
In essence, heat pump is usually combined with the ATES system to increase the efficiency of
the whole system. The heat pump can take the advantage of the relatively higher heat source
temperature in the ATES to increase the coefficient of performance (COP), while ATES can
have the possibility to keep the storage water at a relatively lower temperature with the help
of heat pump, so that the heat losses can also be well limited. The similar framework can also
help to cut down the total prices without compromising the efficiency.
According to the analysis based on the monitoring results from the system in Rostock, this
system had gained a reasonable performance before a fault happened at the end of 2006 [8].
Many applications have proved that ATES performs quite good and viable. Anderson [10]
made an overview and showed that ATES can conserve 90-95% of energy in direct heating
and cooling, 80-85% in heat pump assisted heating and cooling, 60-75% in heat pump
assisted heating system, 90-95% in industrial process cooling, and 90-95% in district cooling.
Some of the problems and future issues with ATES may include:
Interference between wells, especially between group of “warm” wells and group of
“cold” wells. Detailed investigation, calculation and simulation should be conducted to
establish the optimal well density, interval, and interactions before the practical
implementation. Some of the programmes, such as CONFLOW, can be used to simulate
the spread of thermal fonts under different well plannings [9].
Better combination of heat pump and ATES. It is better to find the optimal ways to
combine heat pumps and ATES, because different combination methods will influence the
design value of warm/cold well temperature and heating/cooling effect of the whole
system. Furthermore, it is very useful and significant to investigate the compatibility
between ATES, heat pumps and the whole distribution system. Their individual viable
and vulnerable features need to be checked when the other components fail. For example,
for the ATES heating system in Rostock introduced in [8], the failure of heat pumps lead

21
directly to the poor performance of ATES after 2006; if this problem can be solved, ATES
will be more desirable.
Currently, very few researches are focusing on the environmental impact of ATES to the
surrounding aquifer and soil layers. Will the increased or decreased temperatures around
the warm or cold wells influence the local biological communities? Will the varied
temperatures influence the chemistry composition and properties of the local aquifer
water? Will the varied temperatures and the well operations influence the geological
structures of the local soils? All these questions are lacking enough investigations,
simulations, research and references.
(3) Salty water storage / Solar ponds
In some natural lakes with high salty ingredient (for example Dead Sea), it is observed that
the temperature gradients are inversed compared to other typical water storage solutions. The
normal temperature gradient in the water storage tank is that the temperature at the top of the
tank is higher than that of the bottom, while the temperature gradients in the salty natural lake
has a temperature higher at the bottom of the lake than the top. Meanwhile, the bottom of the
lake also has higher density and concentration of salts than the top (Figure 2.7). Most
importantly, this kind of high salinity lakes has the capability to store solar thermal energy in
long terms. Thus, imitating the features of those high salinity natural lakes, a special kind of
“salty water storage” or “solar pond” has been proposed and put into practice as one of the
seasonal storage solutions [6, 11].
22
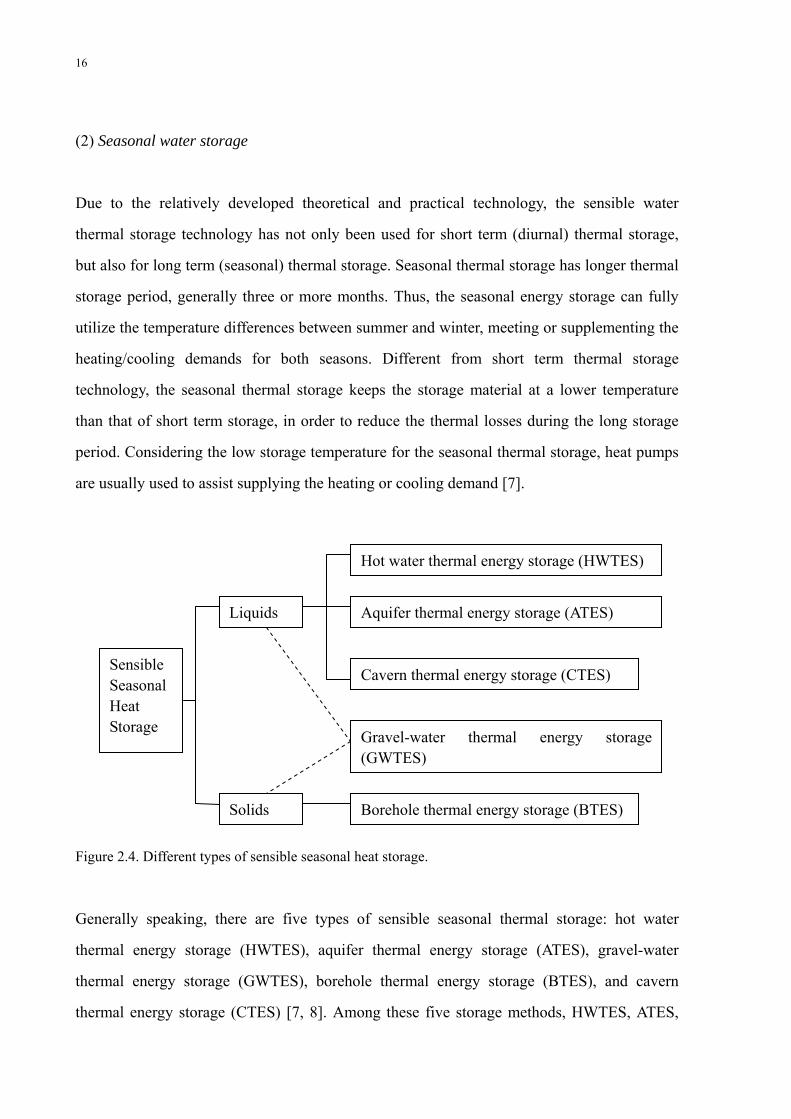
Figure 2.7. General concentration and temperature profiles of the solar pond [11].
UCZ: upper convective zone; NCZ: non-convective zone; LCZ: lower convective zone.
From Figure 2.7, we can see that the solar pond can be divided into three zones or layers:
upper convective zone (UCZ), non-convective zone (NCZ) and lower convective zone (LCZ).
The reason that this kind of salty water storage can be used to store the solar thermal energy is
determined by the thermal characteristics of these three layers, especially by the layer of NCZ.
The large concentration gradient in NCZ greatly suppresses the convective heat transfer
process in this layer. Furthermore, the extremely low transmittance of infrared radiation by
water blocks much of the radiative thermal energy emitted from the hot layer of LCZ (this
characteristic also determines that LCZ mainly absorbs the parts of solar radiation at the
wavelength smaller than the infrared). Therefore, the main heat transfer process in NCZ is by
conductive heat transfer which obviously leads to higher thermal resistance, forming a
desirable thermal insulation layer for LCZ [6, 11]. The heat transfer types in each layers of
solar pond have been presented in Figure 2.8.
Kurt et al. [11] set up a small solar pond as an experimental test rig and compared the
experimental results with the mathematical model. Their testing results compared well with
the mathematical model and they concluded that if the solar pond is correctly designed and
constructed, then long term thermal storage can be possible. The most commonly used salts in
the solar pond are sodium chloride (NaCl) and magnesium chloride (MgCl) [2]. Some other
salts can also be used, such as natural brine and fertilizer salts, but Velmurugan et al.
Temperature (ºC)

23
concluded that sodium chloride (NaCl) shows better results than most other salts [12, 13, 14].
Furthermore, Folchitto made a study on the viability of the solar pond with seawater as the
salt and water source, and found that only a coastal solar pond with seawater as the storage
material will be competitive with traditional energy sources [15].
Figure 2.8. The heat transfer types of each layers of solar pond.
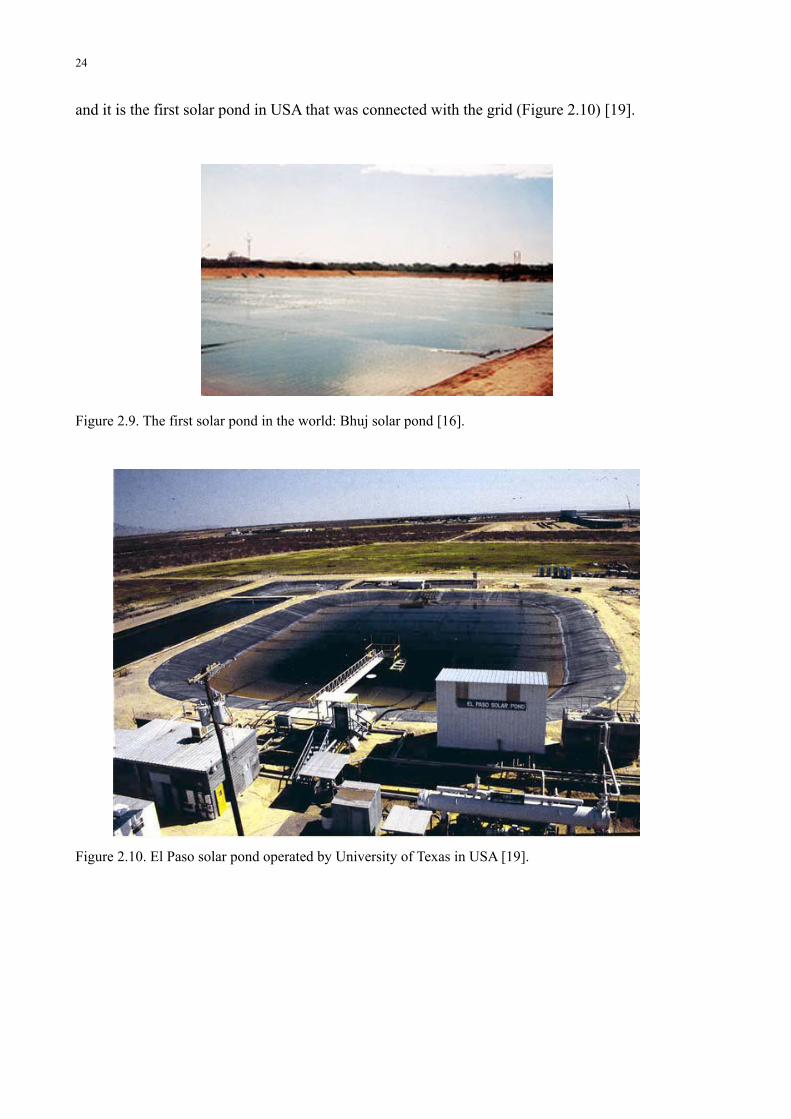
The first solar pond in the world was constructed in Bhuj, India in 1983 (Figure 2.9) [16], and
since then many projects have been operated all over the world. The world’s largest artificial
solar pond with an area of 210,000 m2 was built at Beit Ha’Arava in Israel in 1980s [17, 18].
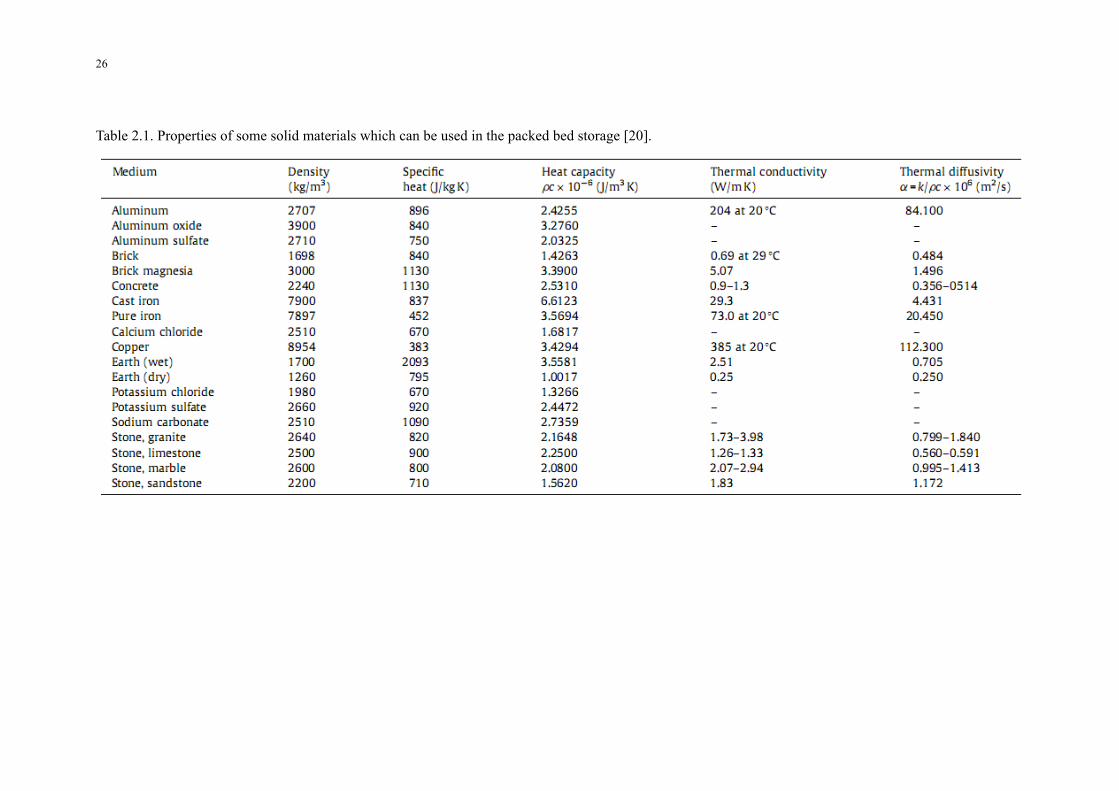
In USA, one successful solar pond project has been operated by University of Texas at El
Paso since 1986 which can produce process heat, electricity and freshwater simultaneously,
UCZ
NCZ
LCZ
Conductive heat transfer
Ambient air
Sediment or specific containment
Convective heat transfer
Conductive heat transfer
Conductive heat transfer
Convective heat transfer
Radiative heat transfer
Convective heat transfer
Evaporative heat transfer (due to mass transfer)
24
and it is the first solar pond in USA that was connected with the grid (Figure 2.10) [19].
Figure 2.9. The first solar pond in the world: Bhuj solar pond [16].
Figure 2.10. El Paso solar pond operated by University of Texas in USA [19].

25
2.1.2 Solids form
(1) Packed bed storage
The packed bed storage is a typical thermal storage method with solids as the storage
materials. The storage materials in this kind of storage method are usually loosely packed
solid granules: such as pebbles, grits, rock piles, etc. Some metals can also be used as the
storage material when high thermal conductivity is required and cost is a less important factor
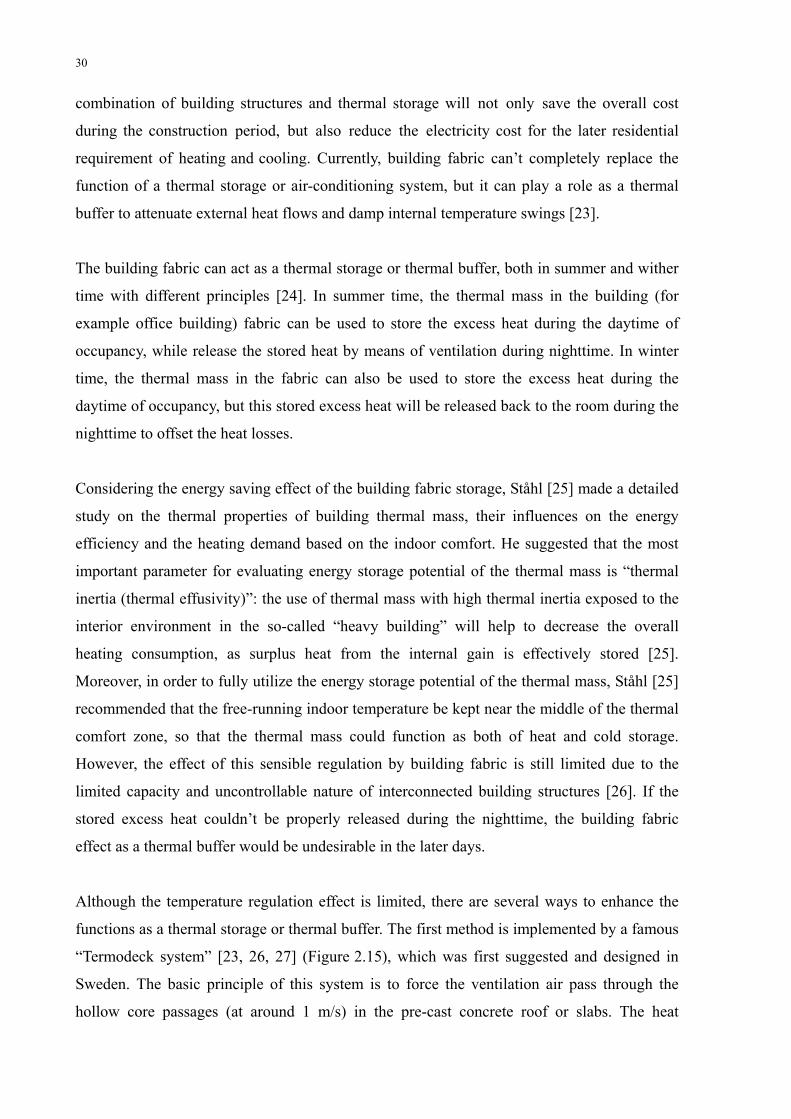
[20]. Table 2.1 is a property table of some solid materials that can be used in the packed bed
storage. The charging and discharging processes are implemented by making the heat transfer
fluid (such as water or air) flowing through those loosely granules to exchange the thermal
energy. Figure 2.11 is a schematic of a typical packed bed storage unit, from which we can see
that packed bed storage is normally composed of a container, a screen to support the storage
material, supports beneath the screen, hot/cold openings and ducts for the heat transfer fluids
[6].
Figure 2.11. A typical packed bed storage unit (Solaron Corp) [6].
26
Table 2.1. Properties of some solid materials which can be used in the packed bed storage [20].

27
Figure 2.12. A typical solar air heating system equipped with packed bed storage [20].
Duffie and Beckman [6] made a detailed introduction and review of some useful analytical
models for packed bed storage, such as Schumann model, complicated and simpler Hughes
models, etc, all of which can be used to simulate the temperature profiles in the storage for both
storage material and heat transfer fluid. Generally speaking, this kind of packed bed storage is
particularly suitable for storing the solar thermal energy in buildings [2]. Figure 2.12 is a brief
schematic of a typical solar air heating system equipped with packed bed storage [20].
Hasnain [2] found that a rule of thumb [Equation (2.3)] can be used to size the rock pile bed
storage for solar thermal storage with the purpose of residential heating: 2 2[ ] (300 ~ 500) [ / ] [ ]
1 ~ 5 [ ]rock sol
piece
m kg kg m A mD cm
= ×=
(2.3)
where rockm [kg] is the total mass of rocks required in the packed bed storage; solA [m2] is
the total solar collector area; and (300~500) [kg/m2] is the coefficient which means that every
square meter solar collector area requires 300 to 500 kilogram rocks as the storage material.
The rock pieces used in this kind of packed bed storage are usually with a diameter around 1
to 5 cm, which is also the perquisite of the thumb rule. However, this thumb rule is a very
rough estimation; the detailed calculation is based on:
Rock parameters: size, shape, density, thermal properties, packing densities, etc [2];
Heat transfer fluid parameters: flow rate, thermal properties, etc [2];
The parameters of the solar collectors: collector efficiency, heat loss coefficient, collector
geometries, plate/glass thermal and optical properties, etc [6].
Many interesting proposals and applications with packed bed storage have been conducted up
Dampers

28
till now. Jain [21] proposed and quantitatively analysed a greenhouse system with packed bed
storage to dry onions (Figure 2.13). An interesting but old idea of combined pebble bed
storage inside the solar collector as the air heater, shown in Figure 2.14, was studied by Paul
and Saini, and they also suggested the optimum conditions for this kind of pebble bed-solar
collector [22]. As long as the space allows, the packed bed storage with pebble or rock as the
storage material are generally preferred in the building applications as a result of their
relatively low cost [2]. Therefore, with a thorough life cycle and economical assessment, the
packed bed storage solution can be considered as one of the choices for the thermal energy
storage in high performance buildings.
Figure 2.13. A greenhouse system with packed bed storage to dry the onions [21].

29
(a)
(b)
Figure 2.14. (a) Combined pebble bed storage inside the solar collector as the air heater; (b) The
geometries of the pebble bed in this kind of special solar collector [22].
(2) Building fabric thermal storage
Besides using a separate thermal storage unit as the aforementioned “packed bed storage”, the
building structure itself can also be used as the medium to store the thermal energy. The
30
combination of building structures and thermal storage will not only save the overall cost
during the construction period, but also reduce the electricity cost for the later residential
requirement of heating and cooling. Currently, building fabric can’t completely replace the
function of a thermal storage or air-conditioning system, but it can play a role as a thermal
buffer to attenuate external heat flows and damp internal temperature swings [23].
The building fabric can act as a thermal storage or thermal buffer, both in summer and wither
time with different principles [24]. In summer time, the thermal mass in the building (for
example office building) fabric can be used to store the excess heat during the daytime of
occupancy, while release the stored heat by means of ventilation during nighttime. In winter
time, the thermal mass in the fabric can also be used to store the excess heat during the
daytime of occupancy, but this stored excess heat will be released back to the room during the
nighttime to offset the heat losses.
Considering the energy saving effect of the building fabric storage, Ståhl [25] made a detailed
study on the thermal properties of building thermal mass, their influences on the energy
efficiency and the heating demand based on the indoor comfort. He suggested that the most
important parameter for evaluating energy storage potential of the thermal mass is “thermal
inertia (thermal effusivity)”: the use of thermal mass with high thermal inertia exposed to the
interior environment in the so-called “heavy building” will help to decrease the overall
heating consumption, as surplus heat from the internal gain is effectively stored [25].
Moreover, in order to fully utilize the energy storage potential of the thermal mass, Ståhl [25]
recommended that the free-running indoor temperature be kept near the middle of the thermal
comfort zone, so that the thermal mass could function as both of heat and cold storage.
However, the effect of this sensible regulation by building fabric is still limited due to the
limited capacity and uncontrollable nature of interconnected building structures [26]. If the
stored excess heat couldn’t be properly released during the nighttime, the building fabric
effect as a thermal buffer would be undesirable in the later days.
Although the temperature regulation effect is limited, there are several ways to enhance the
functions as a thermal storage or thermal buffer. The first method is implemented by a famous
“Termodeck system” [23, 26, 27] (Figure 2.15), which was first suggested and designed in
Sweden. The basic principle of this system is to force the ventilation air pass through the
hollow core passages (at around 1 m/s) in the pre-cast concrete roof or slabs. The heat

31
exchange between air and the slab is enhanced by this extended air pathway. Thus, the
thermal storage potential in the building fabric and the air ventilation system could be best
coupled, significantly reducing or even eliminating the reliance on the traditional
air-conditioning systems. The summer and winter functioning principles of this Termodeck
system are the same as the foregoing ways of releasing the daytime stored excess heat.
However, with this enhanced Termodeck system, the pre-cooling or pre-heating with stored
thermal energy for the beginning of next daytime can also be possible [23, 26, 27].
Figure 2.15. The schematic of the Termodeck system [27].
Barton et al. [27] made some reviews of the previous researches and did a quantitative
analysis of the Termodeck system. With the a finite difference model, Barton et al. found that
five-core Termodeck system performs better than three-core systems due to longer allowed
extended pathway. Moreover, they found that the bend sections between the hollow core tubes
have a minimal effect on the overall heat transfer rate between air and Termodeck system
[27].
The second method to enhance the use of building fabric as thermal storage or thermal buffer
is to integrate the water pipes with the concrete slabs [23]. By controlling the temperature and
flow rates of the circulating water, the heat exchange between the building fabric and flowing
32
water would be enhanced. The circulation and flow rate of water is controlled by the pumps.
The water temperatures can be adjusted by different methods actively or passively: by a
conventional refrigeration / heat pump system, by radiative cooling, or just by being
circulated through the heat exchangers integrated indoor or outdoor [23]. Furthermore, the
third method to enhance the thermal storage / buffer effect is to utilize the phase change
material (PCM) as part of the building fabric, which is currently considered as one of the most
effective and promising ways in the thermal energy storage field. As the PCM technology will
be discussed in detail separately in Section 3, this third method is omitted in this section.
(3) Seasonal solid storage
In Section 2.1.1, the categories of seasonal storage have been introduced in detail. “Hot water
thermal energy storage (HWTES)”, “Aquifer thermal energy storage (ATES)” and “Cavern
thermal energy storage (CTES)” all belong to the seasonal sensible liquid storage, and have
been discussed in Section 2.1.1. In this section, we will focus on the other two types of
seasonal sensible storage methods: “Borehole thermal energy storage (BTES)” and
“Gravel-water thermal energy storage (GWTES)”. BTES can be considered as one kind of
sensible solid storage, although it is still influenced by the local hydrological and
geographical conditions. GWTES is a combination of sensible liquids and sensible solids
storage. By comparing GWTES with seasonal liquid storage and solid storage, we can see the
typical characteristics of this kind of special combined seasonal storage form. This is also why
I introduce GWTES in this Section 2.1.2 of Solids form instead of in Section 2.1.1.
The most essential part of BTES is the “borehole heat exchangers” which is normally
vertically inserted in the ground (sand, soil, rock, gravel, etc), so that the thermal heat can be
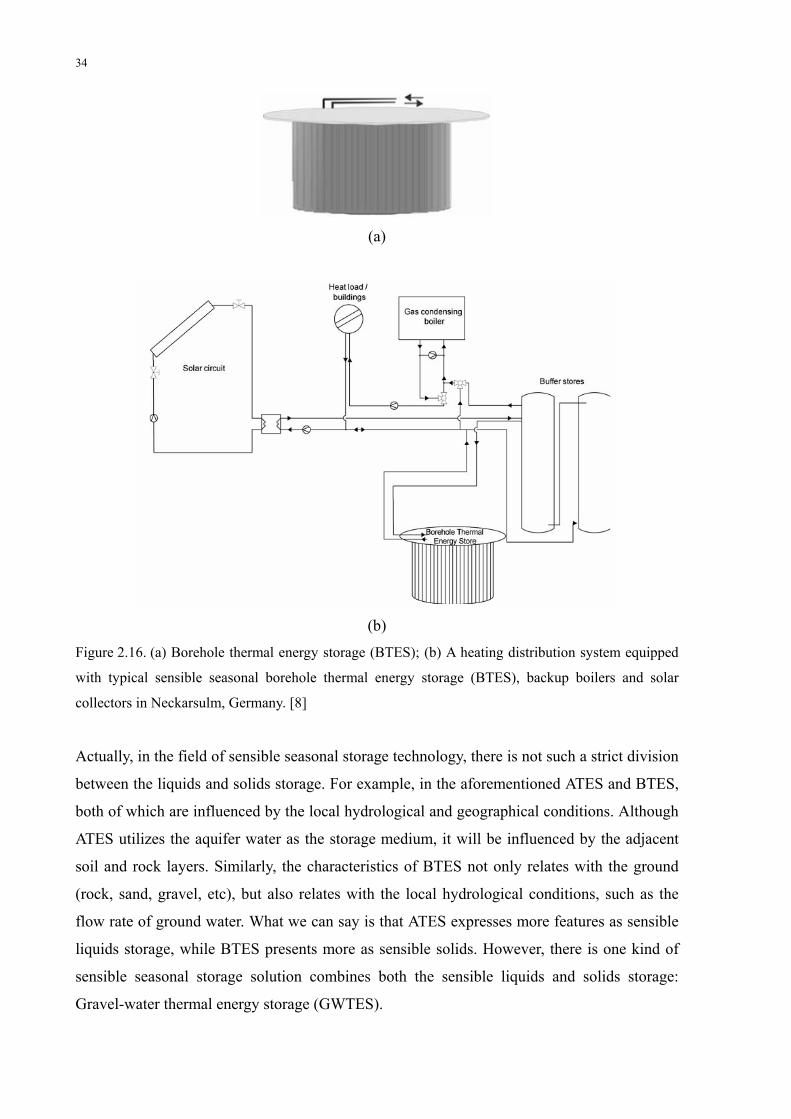
exchanged between the storage system and the ground. In Neckarsulm, Germany, BTES has
been in operation with the central solar heating plant since 1997. Figure 2.16 is a brief
schematic of BTES and the heating distribution system. The heat load of the building is either
supplied from the BTES or the buffer stores (short-term thermal storage), while the gas
condensing boiler acts as a backup of heating if the supply from the thermal storages is not
enough. From Figure 2.16, we can see that the framework of this system is very similar with
the borehole ground source heat pump. Therefore, BTES is usually combined with heat pump
to increase the efficiency of the whole system. This kind of combination is also the
recommendation in the aforementioned ATES system. Moreover, in order to increase the

33
efficiency of the heat exchange between the borehole and ground, it is favourable that the
groundwater exists in the same area (but with a low water flow rate). [7, 8]
According to the analysis based on the monitoring results from the system in Neckarsulm, this
system hasn’t reached the expected design criteria, although the performance has been better
after BTES had been heated up to the usable temperature after 2002 [8]. The main problems
and some future issues with this kind of BTES system might include [7, 8]:
The disappointing discharging process of BTES. Since BTES can’t be discharged until
the temperature reaches the usable level, it may need to wait several years before the
whole system can be properly operated. From the monitoring results in the system in
Neckarsulm [8], we can see that five years have been spent for heating up the thermal
storage, which directly resulted in the low performance of the whole system in these
years. Anyway, five years are not a short period, and would very possibly lead to
disappointment by consumers. In order to avoid this problem, it is recommended that the
heat pump system should be integrated with the heating distribution system, so that the
allowable temperature level of storage can be much lower.
Inconsistency between the BTES and solar collectors. From reference [8], it is presented
that the solar collector area is smaller than the design value. The smaller collector area
not only leads to the lower solar fraction of the whole system, but also leads to the lower
BTES temperatures than planned. From reference [8], we can also see that many seasonal
storage applications failed to reach the planned value due to the inconsistency between
the design and practical construction. Therefore, it is very important that the design
should be comprehensively investigated and performed at the very beginning of the
whole project.
We do see the improvement of the system after BTES being extended. However, does it
mean that the more extension of BTES, the better the performance of the whole system?
In order to increase the efficiency and save the overall cost, it is better that the
relationship between the system characteristic and the extension of BTES could be
studied both qualitatively and quantitatively.
34
(a)
(b)
Figure 2.16. (a) Borehole thermal energy storage (BTES); (b) A heating distribution system equipped
with typical sensible seasonal borehole thermal energy storage (BTES), backup boilers and solar
collectors in Neckarsulm, Germany. [8]
Actually, in the field of sensible seasonal storage technology, there is not such a strict division
between the liquids and solids storage. For example, in the aforementioned ATES and BTES,
both of which are influenced by the local hydrological and geographical conditions. Although
ATES utilizes the aquifer water as the storage medium, it will be influenced by the adjacent
soil and rock layers. Similarly, the characteristics of BTES not only relates with the ground
(rock, sand, gravel, etc), but also relates with the local hydrological conditions, such as the
flow rate of ground water. What we can say is that ATES expresses more features as sensible
liquids storage, while BTES presents more as sensible solids. However, there is one kind of
sensible seasonal storage solution combines both the sensible liquids and solids storage:
Gravel-water thermal energy storage (GWTES).
35
(a)
(b)
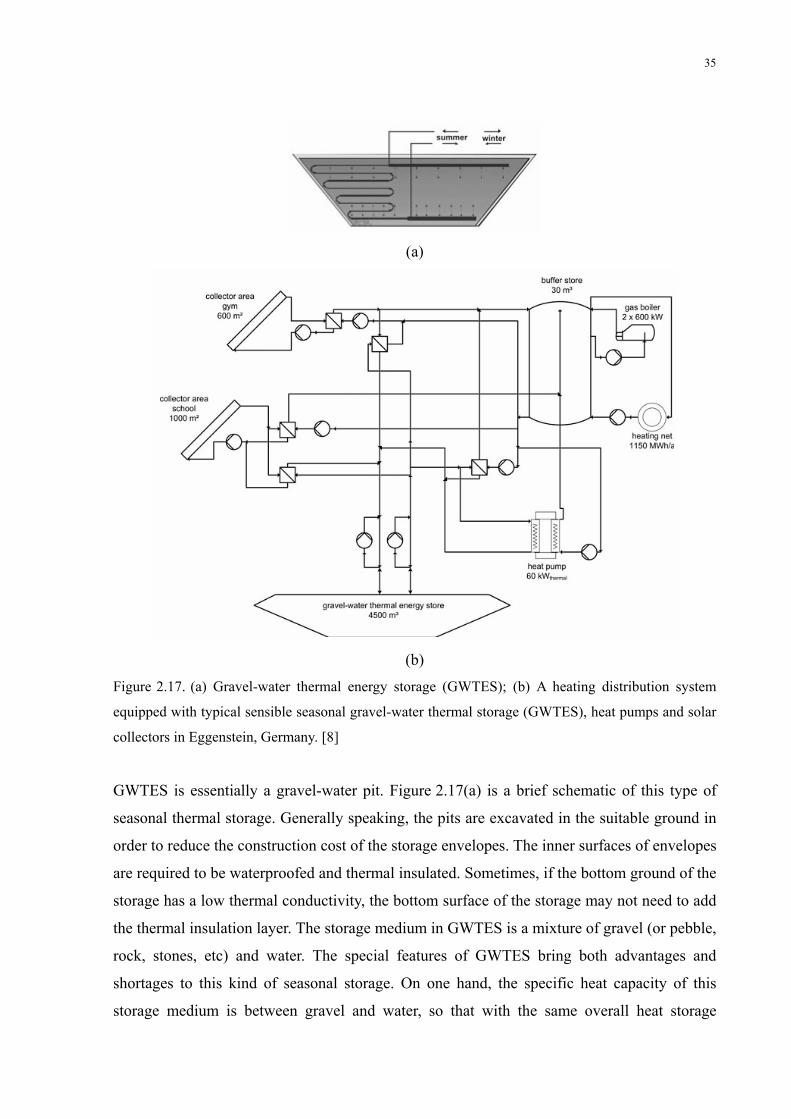
Figure 2.17. (a) Gravel-water thermal energy storage (GWTES); (b) A heating distribution system
equipped with typical sensible seasonal gravel-water thermal storage (GWTES), heat pumps and solar
collectors in Eggenstein, Germany. [8]
GWTES is essentially a gravel-water pit. Figure 2.17(a) is a brief schematic of this type of
seasonal thermal storage. Generally speaking, the pits are excavated in the suitable ground in
order to reduce the construction cost of the storage envelopes. The inner surfaces of envelopes
are required to be waterproofed and thermal insulated. Sometimes, if the bottom ground of the
storage has a low thermal conductivity, the bottom surface of the storage may not need to add
the thermal insulation layer. The storage medium in GWTES is a mixture of gravel (or pebble,
rock, stones, etc) and water. The special features of GWTES bring both advantages and
shortages to this kind of seasonal storage. On one hand, the specific heat capacity of this
storage medium is between gravel and water, so that with the same overall heat storage

36
capacity, the storage volume of GWTES will be higher than those seasonal storages which
simply use water as storage medium, such as HWTES. On the other hand, the low cost of the
envelope structure and storage medium of gravel make GWTES much cheaper than HWTES
with the same overall heat capacity. The top lid of the storage may be used for other
residential purposes; if so, the bearing requirement of the top structure needs to be
considered. [7, 8]
In Eggenstein, Germany, one heating distribution system equipped with GWTES was newly
established in 2009 for the heating demand of 12000 m2 renovated buildings. Figure 2.17(b)
illustrates the brief schematic of this distribution system, from which we can see that, besides
GWTES, the system is also equipped with back-up gas boilers, buffer stores, heat pumps, and
solar collectors. All the inner surfaces of this storage have been insulated with foam glass
gravel and expanded glass granules. Moreover, the insulation layers have all been inserted
into the evacuated chambers of HDPE (High-density polyethylene) liners to prevent from
getting wet. The overall volume of GWTES in this system is 4500 m3. The back-up gas
condensing boilers will be used to charge the 30 m3 buffer store (short-term storage) when the
heat supply from GWTES or solar collectors is not enough. Furthermore, the heat pump is
also integrated, so that the efficiency of the system will be even higher and the temperature
level of GWTES can be much lower. Currently, there are still no available monitoring records
from this system yet. The planned primary energy saving and the solar fraction are as much as
65% and 40%, respectively. [8]
Several excellent points which might be learned from this heating distribution system in
Eggenstein, Germany [8]:
It presents a good example of the utilization of sensible seasonal storage in the renovated
buildings, which has a rather broad market for this kind of system.
The well insulation of the storage envelope surfaces and the low operation temperature of
GWTES due to the integration of heat pump will significantly reduce the heat losses from
the seasonal storage. These all provide us an excellent example of how to improve the
efficiency of the seasonal storage system.
The final choice of the seasonal storage solution comprehensively considered the
boundary conditions of this system, such as site location, safety issues, allowable
construction area and overall construction cost [8]. This presents us a meaningful and
referential example to choose the best seasonal storage method in real application.

37
2.2 Thermochemical Heat Storage
Some reversible chemical reactions can also be used as one of the solutions to store the
thermal energy. The basic principle of this thermochemical heat storage has been depicted in
Equation (2.4) [6]:
1
2
Endothermic reaction: AB + Q A + B
Exothermic reaction: A + B AB + Q
→
→ (2.4)
During the endothermic reaction, i.e. charge process, the compound reactant “AB” absorbs
certain amount of thermal energy under relatively higher temperature conditions (compared
with reverse exothermic reaction, except for the photochemical reactions), decomposing into
the resultants of “A” and “B”. On the other hand, during the exothermic reaction, i.e.
discharge process, the resultants of “A” and “B” experience a combination reaction, forming
the compound “AB” while releasing certain amount of thermal energy. In order to avoid the
simultaneous reverse reaction during the charge process, resultants “A” and “B” are advised
to be separately collected. Therefore, if “A” and “B” are in different phase forms, for example
one is in gas and the other one is in solid phase, then the corresponding reversible reaction
will be more convenient for the implementation of thermochemical heat storage. Well
separation of resultants “A” and “B” guarantees the stable storages for the reactants, and this
feature is very important for the long-term thermal energy storage. However, up till now, most
of the endothermic reactions are operated either under a much higher temperature or with
more special reaction requirements than the condition for normal building applications, thus
the thermochemical heat storage has been scarcely utilized in this area. [6]
Some candidates that might be used as the material for the thermochemical heat storage: first,
metal oxides might be utilized, such as 2KO and 2PbO as shown in Equations (2.5) and
(2.6) [6, 28]:
2 2 24KO 2K O + 3O←⎯→ (2.5)
2 22PbO 2PbO + O←⎯→ (2.6)
The charge process with 2KO as the storage material requires a high reaction temperature of
about 300-800 ºC with an absorbing rate of thermal energy at 2.1 MJ/kg; while the charge
process with 2PbO requires a temperature of about 300-350 ºC with an absorbing rate of
38
thermal energy at 0.26 MJ/kg. These reversible reactions are very useful, as oxygen can be
produced and separately collected in this way. For conducting the reverse exothermic reaction,
either the produced O2 or the air can be used under a much lower reaction temperature than
the endothermic reaction. [6, 28]
Second, the reversible decomposition of calcium hydroxide 2Ca(OH) has attracted many
researchers’ attentions [6, 29, 30, 31]. Azpiazu et al. [31] made a detailed study on the
thermochemical properties of 2Ca(OH) for the thermal storage. The basic principle of this
reversible themochemical reaction has been shown in Figure 2.18. During the charge process,
the endothermic reaction should be operated under a relatively high temperature at around 510
ºC, generating the resultants of CaO and H2O [31]. The DSC curve for the decomposition
process of 2Ca(OH) , i.e. charge process, has been shown in Figure 2.19, from which we can
see that the starting endothermic reaction temperature is around 450 ºC [6, 29, 30] while 510
ºC [31] is the peak reaction temperature.
According to Figure 2.18, if both the reactant of 2Ca(OH) and resultants of CaO and H2O
are under the same condition of 510 ºC, the absorbed thermal energy during the
decomposition process will be 94.6 kJ per mol 2Ca(OH) . Some catalysts might be added to
enhance this endothermic reaction rate, such as Zn and Al [6, 29, 30]. Furthermore, the
separation of CaO and H2O need to be done when H2O is still at the vapor phase, and the solid
dry CaO can then be cooled and stored with stability. On the other hand, the reverse
exothermic reaction can be conducted at a room temperature of 25 ºC, releasing 63.6 kJ
thermal energy per mol 2Ca(OH) . The cooling of CaO and H2O from 510 ºC to 25 ºC releases
a total amount of 85 kJ thermal energy per mol 2Ca(OH) , while the heating of 2Ca(OH)
from 25 ºC to 510 ºC absorbs 54.0 kJ/mol. Therefore, if we can fully utilize the thermal
energy released during the cooling process of CaO and H2O, for example to preheat
2Ca(OH) during the charge process, the maximum recovery rate of stored thermal energy can
be as much as 67.2% (63.6 kJ/94.6kJ). However, if those 85 kJ/mol thermal energy is wasted,
the recovery rate of stored thermal energy will be reduced to only 42.8%
(63.6kJ/(54.0kJ+94.6kJ)) or even lower. [31]

39
Figure 2.18. The basic principle of the reversible thermochemical reaction of
2 2Ca(OH) CaO + H O↔ [31].
Figure 2.19. The DSC curve for the decomposition process of 2Ca(OH) , i.e. charge process [31].
Solid line “—”: grade 2Ca(OH) ; dashed line “---”: commercial 2Ca(OH) .
Third, a special kind of photochemical reactant nitrosyl chloride NOCl might also be
utilized as shown in Equation (2.7) [6, 32]:
photons
1 2
2 2
Endothermic reaction: 2NOCl + Q 2NO + Cl
Exothermic reaction: 2NO + Cl 2NOCl + Q
⎯⎯⎯→
→ (2.7)

40
During the charge process, the reactant NOCl will absorb certain amount of thermal energy
with the help of luminated photons, decomposing into the resultants of NO and Cl2. On the
other aspect, during the discharge process, NO and Cl2 experience an exothermic combination
reaction, forming the NOCl again. Different from the aforementioned metal oxides and
2Ca(OH) , the endothermic reaction in Equation (2.7) is operated under a much lower
temperature (can be at 40 ºC) than the reverse exothermic reaction (can be at about 100 ºC
with a desirable thermal energy output). With this characteristic, this photochemical reaction
can be utilized for the solar thermal energy system to reduce the heat losses to the ambient.
Carlson and Wettermark suggested and analysed a photochemical solar collector system as
shown in Figure 2.20. By the reversible photochemical reaction, the temperature of
endothermic reactor (solar collector) can be maintained at a relatively low temperature
(around 40 ºC) while the exothermic reactor can however be kept at a high temperature
(around 100 ºC), significantly reducing the heat losses from solar collector to the ambient
without compromising the heat supply. [6, 32]
Figure 2.20. The brief schematic of the photochemical solar collector system [32].
Strictly, the hydrated salt should also be considered as one type of thermochemical storage
material. However, its characteristic is more similar with the phase change material (PCM).
For example, most of the charge and discharge processes of thermochemical heat storage are
conducted under very different temperatures, whereas those processes of thermal storage with
hydrated salt are conducted under almost the same temperature. Therefore, most researchers
classified hydrated salt as one type of inorganic PCM. These will be discussed in Section

41
3.1.2 in detail.
42
3 LATENT HEAT STORAGE / PCM STORAGE FOR BUILDINGS
As mentioned in Section 2.1.2, in order to enhance the thermal storage effect of the building
fabric, the thermal mass with high thermal inertia, such as phase change materials (PCMs), is
advised to be used. Different from the foregoing sensible energy storage materials, PCMs
experience phase change processes with unique features during their operation periods, such
as significantly enhanced thermal properties. In this Section 3, different categories of PCMs,
their particular characteristics, and the experimental and commercial applications of PCM
storage for high performance buildings will be discussed in detail.
3.1 Phase Change Materials
The phase change materials (PCMs) are heat storage mediums used in latent heat storage, as it
will experience a phase transition during the heat charge or release process. Theoretically,
PCM has a phase change point when the phase transition happens, but in practice the phase
change process happens in a certain temperature range instead of one exact point. Figure 3.1
shows the specific heat capacity ( pc )-temperature (T) curve and specific enthalpy
(h)-temperature (T) curve of certain PCM. We can see that on the temperature range [T1, T2],
pc -T curve experiences a peak interval, while the h-T curve presents a corresponding slope
change in the same temperature range due to the relations between h-T and pc -T functions:
( ) ( )p
dh T c TdT
= (3.1)
In practice, the phase change temperatures and enthalpy changes of a certain PCM during the
phase change process are measured by a device called differential scanning calorimeter (DSC).
When testing with DSC, a net dynamic heating power will be input to the tested sample to
make its temperature increase at a constant rate, and the value of this net dynamic heating
power is recorded and finally plotted in the form of DSC curves. In order to get the correct
“net” dynamic heating power input to the tested sample, a reference material should be used.
The reference materials normally used during DSC testings are those with a constant heating
or cooling rate, i.e. with constant specific heat capacity, such as Alumina [33], Indium metal
43
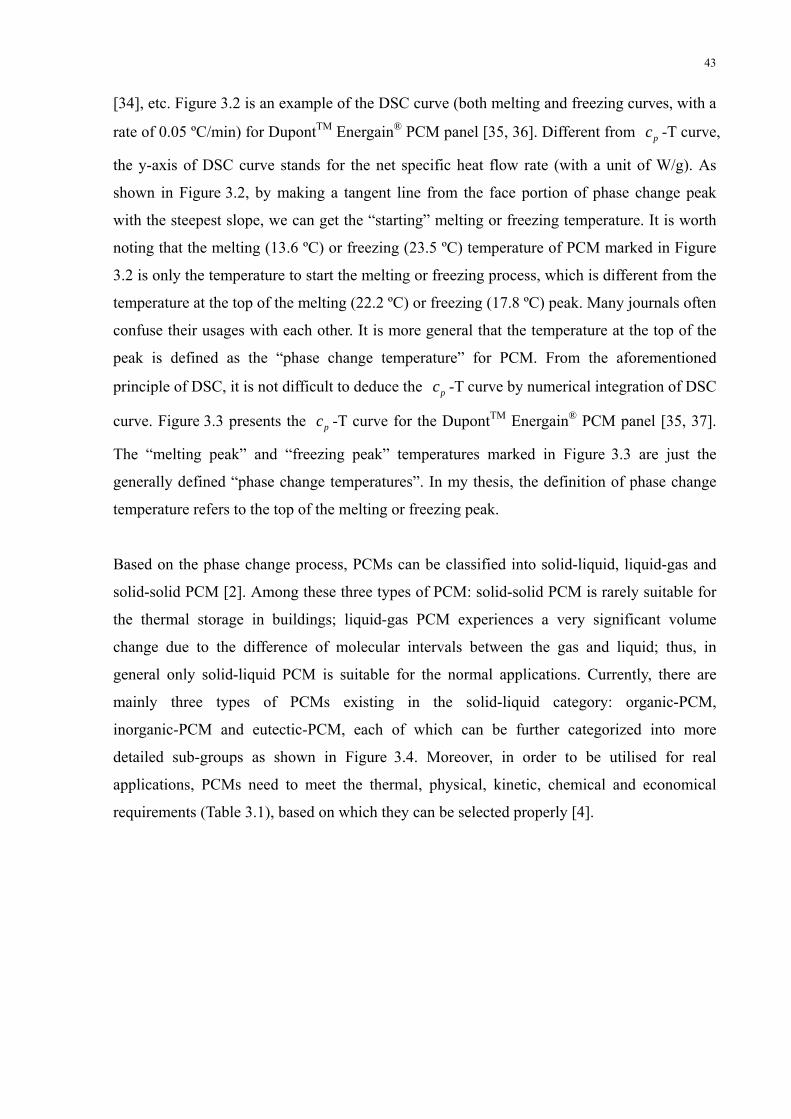
[34], etc. Figure 3.2 is an example of the DSC curve (both melting and freezing curves, with a
rate of 0.05 ºC/min) for DupontTM Energain® PCM panel [35, 36]. Different from pc -T curve,
the y-axis of DSC curve stands for the net specific heat flow rate (with a unit of W/g). As
shown in Figure 3.2, by making a tangent line from the face portion of phase change peak
with the steepest slope, we can get the “starting” melting or freezing temperature. It is worth
noting that the melting (13.6 ºC) or freezing (23.5 ºC) temperature of PCM marked in Figure
3.2 is only the temperature to start the melting or freezing process, which is different from the
temperature at the top of the melting (22.2 ºC) or freezing (17.8 ºC) peak. Many journals often
confuse their usages with each other. It is more general that the temperature at the top of the
peak is defined as the “phase change temperature” for PCM. From the aforementioned
principle of DSC, it is not difficult to deduce the pc -T curve by numerical integration of DSC
curve. Figure 3.3 presents the pc -T curve for the DupontTM Energain® PCM panel [35, 37].
The “melting peak” and “freezing peak” temperatures marked in Figure 3.3 are just the
generally defined “phase change temperatures”. In my thesis, the definition of phase change
temperature refers to the top of the melting or freezing peak.
Based on the phase change process, PCMs can be classified into solid-liquid, liquid-gas and
solid-solid PCM [2]. Among these three types of PCM: solid-solid PCM is rarely suitable for
the thermal storage in buildings; liquid-gas PCM experiences a very significant volume
change due to the difference of molecular intervals between the gas and liquid; thus, in
general only solid-liquid PCM is suitable for the normal applications. Currently, there are
mainly three types of PCMs existing in the solid-liquid category: organic-PCM,
inorganic-PCM and eutectic-PCM, each of which can be further categorized into more
detailed sub-groups as shown in Figure 3.4. Moreover, in order to be utilised for real
applications, PCMs need to meet the thermal, physical, kinetic, chemical and economical
requirements (Table 3.1), based on which they can be selected properly [4].

44
0 T (°C)
cp (kJ/kg.K)
TpT1 T2
0 T1 Tp T2 T (°C)
h (kJ/kg)
Figure 3.1. The specific heat capacity ( pc ) - temperature (T) curve, and specific enthalpy (h) -
temperature (T) curve of certain PCM.

45
Figure 3.2. DSC curve (both melting and freezing curves, with a rate of 0.05 ºC/min) for a commercial
product of DupontTM Energain® PCM panel [35, 36].
Figure 3.3. pc -T curve (both melting and freezing curves) deduced from DSC curve (0.05 ºC/min) for
a commercial product of DupontTM Energain® PCM panel [35, 37].

46
Figure 3.4. Classification of phase change materials [4].
Table 3.1. Requirements of PCMs for real applications [4].
The requirements of PCMs for real applications
Thermal
requirement
Proper phase change temperature
High latent heat storage capacity during phase change process
Desirable heat transfer characteristics (eg. good thermal
conductivity)
Physical
requirement
Small volume change during phase change process
Low vapor pressure
Kinetic
requirement
No or limited supercooling
Sufficient crystallization rate
Chemical
requirement
Long term chemical stability
Compatible with the storage container or integrated thermal
mass
No toxicity
No fire risk
Economical
requirement
Plenty of resources
Available for application
Cost effective for large production

47
3.1.1 Organic PCM
Organic PCM can be classified into the subgroups of paraffin PCM and non-paraffin PCM,
both of which have the merits of “long term chemical stability”, “sufficient crystallization
rate” and “no or limited supercooling” described in Table 3.1. “Long term chemical stability”
is represented by organic PCM’s characteristics of repeated phase change processes without
phase segregation or property degradation. Normally, organic PCMs are not corrosive [4].
(1) Paraffin PCM
The paraffins [2, 4] used for the thermal storage applications usually refer to “paraffin waxes”
with a chemical formula of n 2n+2C H , where 20 40n≤ ≤ . More precisely, paraffin wax is an
alkane hydrocarbon with long straight n-alkane chains as the composition of
“ 3 2 n 3CH (CH ) CH− − ”. Paraffin wax has a very regular characteristic that the phase change
temperature increases with the number of alkane chains in its composition [4] (as shown in
Table 3.2. Some articles incorrectly say that the heat of fusion also increases with alkane
chains). Therefore, paraffin wax is available for a large range of phase change temperatures in
different applications. However, pure paraffin waxes are very expensive and generally only
technical grade paraffins are used [2]. Technical grade paraffins are a mixture of different
hydrocarbons, and thus have a larger temperature ranges during phase change process than
pure paraffin wax. Different manufacturers may add their own special amount of impurities
when they are producing certain technical grade paraffin. In this case, it is advised that the
thermophysical properties of certain technical grade paraffins should be either directly
checked from the manufacturer or measured by users themselves [2]. The advantages of
paraffin PCM can be concluded as:
Proper phase change temperatures;
High latent heat storage capacity during phase change process;
Low vapor pressure;
No or limited supercooling;
Sufficient crystallization rate;
Long term chemical stability (repeated phase change processes without phase segregation
or property degradation) [4];

48
Reliable and predictable thermophysical properties due to its stable chemical composition
[4];
Non-corrosive;
Available for different applications and commercial available in the market.
Whereas the disadvantages and corresponding solutions can be concluded as:
Not suitable for the pure paraffin due to the relatively high cost. The solution is to use the
technical grade paraffin which is a mixture of different hydrocarbons and available in the
commercial market with a reasonable price [2].
Low thermal conductivity. The solutions might be the installation of metallic fins [2] or
other extended / embedded heat exchangers, tubes or heat pipes.
Non-compatibility with the plastic storage container. The problem can be solved by
selecting proper storage containers under typical conditions [4].
Moderately flammable [4]. Flammability is the main disadvantage for organic PCM for
the application in buildings. The potential of fire hazard also depends on the fire
characteristics of building material requirement in certain countries for certain
applications. In those applications with high fire resistance requirement, the flame
retardant can be incorporated to decrease the fire risk [38, 39, 40].
One contradiction has been found when I was reviewing some journals about the
characteristic of volume change during the phase change processes for paraffin waxes.
Sharma et al. concluded that paraffins “show little volume changes” [4], while Hasnain
mentioned that “large volume change during phase transition” is one of the shortages of PCM
[2]. In order to investigate this contradiction, it is better to directly refer to the density
properties of different paraffins. Table 3.3 lists the thermophysical properties of some
technical grade paraffins in the liquid and solid phases collected by Abhat in [41]. Among the
paraffins listed in Table 3.3, we can see that between the solid and liquid phases, Paraffin
6106 has the biggest volume change of as much as 19%, while Paraffin Octadecane has the
smallest change of only as much as 5.2%. Therefore, the volume change of paraffin depends
on the type of the paraffin itself. Neither simply describing as “little” nor “large” is
appropriate.

49
Table 3.2. Phase change temperature and latent heat of fusion for pure paraffins [4].
Number of carbon atoms
Phase change temperature (ºC)
Latent heat of fusion (kJ/kg)
Group(a)
14 5.5 228 I
15 10 205 II
16 16.7 237.1 I
17 21.7 213 II
18 28.0 244 I
19 32.0 222 II
20 36.7 246 I
21 40.2 200 II
22 44.0 249 II
23 47.5 232 II
24 50.6 255 II
(a) Group: I, most promising; II, promising; III, less promising.
Table 3.3. The thermolphysical properties of some paraffins collected by Abhat in [41].
Density (kg/m3) Paraffin Distribution of C-Atoms
Phase change temperature (ºC)
Latent heat of fusion (kJ/kg)
Thermal conductivity ( W/m K⋅ )
Solid (20 ºC)
Liquid (70 ºC)
5913(a) C13-C24 22-24 189 0.21 (solid) 900 760
Octadecane C18 28 244 0.15 (solid) 814 774
6106(a) C16-C28 42-44 189 0.21 (solid) 910 765
P116(b) -(c) 45-48 210 - 817 786
5838(a) C20-C33 48-50 189 0.21 (solid) 912 769
6035(a) C22-C45 58-60 189 0.21 (solid) 920 795
6403 C23-C45 62-64 189 0.21 (solid) 915 790
6499(a) C21-C50 66-68 189 0.21 (solid) 930 830
(a) Manufacturer of technical grade paraffins 5913, 6106, 5838, 6035 and 6499: Ter Hell
Paraffin Hamburg, FRG.
(b) Manufacturer of Paraffin P116: Sun Oil Company, USA.
(c) “-” implies data is not sufficient.

50
(2) Non-paraffin PCM
Non-paraffin PCM can be further categorized into fatty acids ( 3 2 2nCH (CH ) COOH ) and other
non-paraffin PCM (such as esters and glycols) [4]. Non-paraffin organic PCM has a large
number of varieties with diverse characteristics rather than the regular features as paraffins.
Although non-paraffin PCMs are versatile and very variable between each other, they still
have some common features. Their advantages include:
With a large candidates to be selected, the proper phase change temperatures will be met
for typical applications;
High latent heat storage capacity during phase change process;
No or limited supercooling for fatty acids;
Long term chemical stability for fatty acids under proper temperatures (repeated phase
change processes without phase segregation or property degradation) [4].
Whereas the shortages include [4]:
Low thermal conductivity;
Flammability;
Possible toxicity with respect to certain non-paraffin PCM;
Instability at high temperatures;
Fatty acids are mild corrosive;
The fatty acids are still expensive, thus not very cost effective.
Some of the non-paraffin PCMs whose phase change temperatures are suitable for the
application of buildings (15-35 ºC) have been listed in Table 3.4.
51
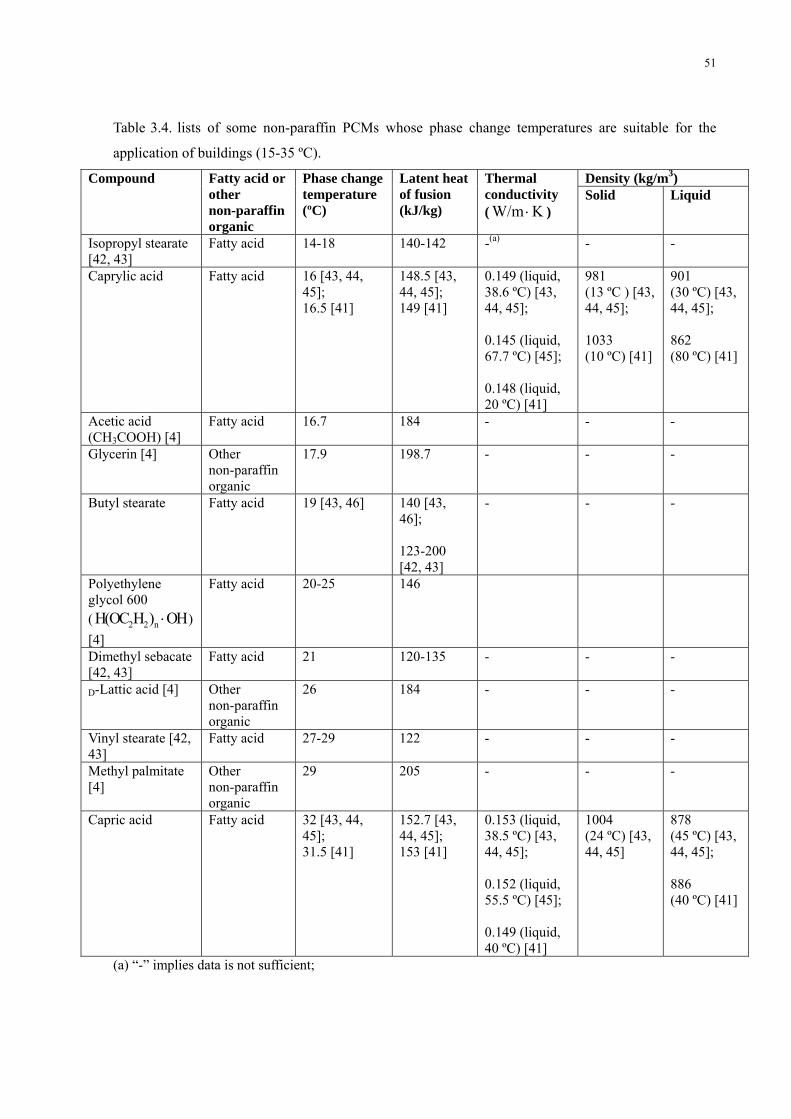
Table 3.4. lists of some non-paraffin PCMs whose phase change temperatures are suitable for the
application of buildings (15-35 ºC).
Density (kg/m3) Compound Fatty acid or other non-paraffin organic
Phase change temperature (ºC)
Latent heat of fusion (kJ/kg)
Thermal conductivity ( W/m K⋅ )
Solid Liquid
Isopropyl stearate [42, 43]
Fatty acid 14-18 140-142 -(a) - -
Caprylic acid Fatty acid 16 [43, 44, 45]; 16.5 [41]
148.5 [43, 44, 45]; 149 [41]
0.149 (liquid, 38.6 ºC) [43, 44, 45]; 0.145 (liquid, 67.7 ºC) [45]; 0.148 (liquid, 20 ºC) [41]
981 (13 ºC ) [43, 44, 45]; 1033 (10 ºC) [41]
901 (30 ºC) [43, 44, 45]; 862 (80 ºC) [41]
Acetic acid (CH3COOH) [4]
Fatty acid 16.7 184 - - -
Glycerin [4] Other non-paraffin organic
17.9 198.7 - - -
Butyl stearate Fatty acid 19 [43, 46] 140 [43, 46]; 123-200 [42, 43]
- - -
Polyethylene glycol 600 ( 2 2 nH(OC H ) OH⋅ ) [4]
Fatty acid 20-25 146
Dimethyl sebacate [42, 43]
Fatty acid 21 120-135 - - -
D-Lattic acid [4] Other non-paraffin organic
26 184 - - -
Vinyl stearate [42, 43]
Fatty acid 27-29 122 - - -
Methyl palmitate [4]
Other non-paraffin organic
29 205 - - -
Capric acid Fatty acid 32 [43, 44, 45]; 31.5 [41]
152.7 [43, 44, 45]; 153 [41]
0.153 (liquid, 38.5 ºC) [43, 44, 45]; 0.152 (liquid, 55.5 ºC) [45]; 0.149 (liquid, 40 ºC) [41]
1004 (24 ºC) [43, 44, 45]
878 (45 ºC) [43, 44, 45]; 886 (40 ºC) [41]
(a) “-” implies data is not sufficient;

52
3.1.2 Inorganic PCM
Inorganic PCM can be classified into the subgroups of salt hydrates and metallics.
Considering for the building applications, the metallics are seldom used due to their scarce
availability and high cost of resources. However, in some special cases when the space is
limited (such as in the field of astronautics), the metallic PCMs can be utilized as they have a
much higher latent heat of fusion per unit volume than other PCMs. Since the main topic of
my thesis is thermal storage for building application, the metallic PCMs won’t be explicitly
introduced here. The more commonly used inorganic PCM is hydrated salts which can be
considered as the alloys of inorganic salt and water: 2AB H On⋅ (“AB” represents some
inorganic salt) [4]. The phase change process of this hydrated salt is essentially the process of
hydration and anhydration [as shown in Equation (3.2)], or the process of partially hydration
and partially anhydration [as shown in Equation (3.3)]:
2 2 1
2 1 2
Hydration: AB + H O AB H O + Q
Anhydration: AB H O + Q AB + H O
n n
n n
→ ⋅
⋅ → (3.2)
2 2 2
2 2 2 2
Partially hydration: AB + H O AB H O + Q ( )
Partially anhydration: AB H O + Q AB H O + ( - )H O ( )
m m m n
n m n m m n
→ ⋅ <
⋅ → ⋅ < (3.3)
Although hydrated salts can not be denoted by a general formula, they have some common
merits:
Proper phase change temperatures due to the large amount of candidates and suitable
properties;
High latent heat of fusion per unit volume during phase change process [4];
Relatively high thermal conductivity. Generally speaking, the thermal conductivity of
hydrated salts can be as much as two times of paraffins [4];
Limited corrosive and compatible with plastic containers [4]. However, if the container is
made of mild steel metal, special care must be taken upon the internal and external
lacquer finishes to prevent the possible corrosion [2].
Slightly toxic [4];
No or limited fire risk;
Plenty of resources and products in the commercial market;
Cheap and cost effective for the application in buildings.

53
However, the shortages of hydrated salts are also very obvious compared to other types of
PCM [2,4]. Firstly, the physical problem of incongruent melting during phase change
processes. As shown in Equation (3.2), during the anhydration process (melting process), the
hydrated salt will be decomposed into one molar unit salt and n molar unit 2H O . The
involved problem is that this n molar unit 2H O is not sufficient enough to melt one molar
unit salt, resulting in the sedimentation of the unsolved solid salt. The solid sediment layer
further prevents the smooth recombination of salt and water molecules during the hydration
process (freezing process), thus the long-term melt-freeze cycle will be interrupted. Some
solutions can be adopted for the incongruent melting problem [2,4]:
Mechanical stirring;
Rotating storage devices;
Direct contacting with heat exchangers;
Macro- or micro-encapsulating the PCM, so that the sedimentation and segregation won’t
happen;
Adding the thickening agents to hold the suspension of the unsolved salt;
Adding excess water to completely solve the salt;
Using some chemical ways to make the materials congruent.
Secondly, the kinetic problem of supercooling results from insufficient crystallization rate.
Several solutions to this problem can be utilized:
Adding nucleating agents;
Enhancing nucleation effect by rough container walls or cold finger techniques [2];
Leaving some crystals in small cold regions to serve as nuclei [4];
The third problem is the possible interruption due to the spontaneous partial hydration or
partial anhydration process, as shown in Equation (3.3). These hydrated salts with lower water
molecules ( 2AB H Om⋅ ) also lead to the problem of incongruent melting as well as the low
efficiency of the PCM storage system. The solution is to add certain amount of latent solvent
or catalyst to prevent their generation during the phase change processes [4]. Some of the
hydrated salts whose phase change temperatures are suitable for the building applications
(15-35 ºC) have been listed in Table 3.5.
From Table 3.5, we can also see that the volume change before and after the phase change
process depends on the type of hydrated salt itself: the volume change can be as high as 15%
for 2 2CaCl 6H O⋅ , and can also be as low as 0.55% for 2KF 4H O⋅ . Therefore, similarly with

54
the discussion for paraffin volume changes in Section 3.1.1, neither simply describing as
“little” nor “large” for the volume changes of hydrated salts is appropriate.
3.1.3 Eutectic PCM
Eutectic is a minimum-melting mixture of several different PCMs, which has a fixed phase
change temperature [4]. The components of the eutectic can be either inorganic or organic
PCM, based on which eutectic PCMs are normally classified into three subgroups:
inorganic-inorganic eutectic, organic-organic eutectic, and organic-inorganic eutectic [2]. The
components of the eutectic almost melt and freeze congruently and simultaneously, so that
segregation won’t happen [4]. Some of the eutectic PCMs whose phase change temperatures
are suitable for the building applications (15-35 ºC) have been listed in Table 3.6.
3.1.4 Commercial product
There are many commercial PCM products already been available in the market, either in the
form of phase change materials, or the form of PCM integrated products (such as PCM
integrated gypsum board, concrete, plasters, etc). I collected some of them from internet and
made a PCM portrait in APPENDIX I, which will be helpful for the future work in project of
ZEB.

55
Table 3.5. Lists of some hydrated salt PCMs whose phase change temperatures are suitable for the
application of buildings (15-35 ºC).
Density (kg/m3) Compound Phase change temperature (ºC)
Latent heat of fusion (kJ/kg)
Thermal conductivity ( W/m K⋅ )
Solid Liquid
21NaOH 3 H O2
⋅ 15 [43, 47] 15.4 [43, 48]
-[a] - - -
2 4 2Na CrO 10H O⋅ [43, 47]
18 - - - -
2KF 4H O⋅ [43, 41] 18.5 231 - 1455 (18 ºC) 1447 (20 ºC)
3 2 2Mn(NO ) 6H O⋅ 25.5 [4] 25.8 [43, 49]
148 [4] 125.9 [43, 50]
- 1795 (5 ºC) [43, 50]
1738 (20 ºC) [43, 50]; 1728 (40 ºC) [43, 50]
3 2FeBr 6H O⋅ [4] 27.0 105 - - -
2 2CaCl 6H O⋅ 29 [43, 44, 45]; 29.7 [41, 46]
190.8 [43, 44, 45]; 171 [41, 46]
0.540 (liquid 38.7 ºC) [43, 44, 45]; 0.561 (liquid 61.2 ºC) [43, 45]; 1.088 (solid 23 ºC) [43, 44, 45]
1802 (24 ºC) [43, 44, 45]; 1710 (25 ºC) [43, 45];
1562 (32 ºC) [43, 44, 45]; 1496 [43, 45];
3 2LiNO 2H O⋅ [b] [4] 30 296 - - -
3 2LiNO 3H O⋅ [b] [4] 30 189 - - -
1485 [41] 2 4 2Na SO 10H O⋅ 32.4 [41];
31-32 [43, 51] 254 [41]; 241 [4]
0.544 [41] 1458[c] [43, 51]
2 3 2Na CO 10H O⋅ 32-36 [43, 51]; 33 [43, 48]
246.5 [43, 51];
- 1442[c] [43, 51]
4 2 2KFe(SO ) 12H O⋅ [4]
33 173 - - -
2 2CaBr 6H O⋅ [43, 44, 45]
34 115.5 - 2194 (24 ºC) 1956 (35 ºC)
2 2LiBr 2H O⋅ [4] 34 124 - - -
2 4 2Na HPO 12H O⋅ 35 [43, 46]; 35.2 [43, 48]; 35.5 [43, 47]; 36 [43, 51]; 40 [4]
265 [43, 51]; 279 [4]; 281 [43, 46]
- 1522[c] [43, 51]
(a) “-” implies data is not sufficient. (b) There are some contradictions in the data properties of hydrated 3LiNO . In [43], the latent heat of
fusion for 3 2LiNO 3H O⋅ is “296 kJ/kg”. However, in [4], “296 kJ/kg” is the value for 3 2LiNO 2H O⋅ ,
while the latent heat of fusion for 3 2LiNO 3H O⋅ in [4] has been listed as “189 kJ/kg”. (c) The cited references haven’t given the phase conditions for this density value.

56
Table 3.6. Lists of some eutectic PCMs whose phase change temperatures are suitable for the
application of buildings (15-35 ºC).
Density (kg/m3) Compound(a) Phase change temperature (ºC)
Latent heat of fusion (kJ/kg)
Thermal conductivity ( W/m K⋅ )
Solid Liquid
Capric-lauric acid (65 mol%-35 mol%) [43, 52]
18.0 148 -(a) - -
Capric-lauric acid (45%-55%)(b) [43, 46]
21 143 - - -
34% Mistiric acid + 66% Capric acid(b) [43, 45]
24 147.7 0.164 (liquid, 39.1 ºC); 0.154 (liquid, 61.2 ºC)
1018 (1 ºC)
888 (25 ºC)
66.6 wt% 2 2CaCl 6H O⋅ + 33.3 wt%
2 2MgCl 6H O⋅ [43]
25 127 - 1590(c)
48 wt% 2CaCl +4.3 wt% NaCl +0.4 wt% KCl +47.3 wt% 2H O [43]
26.8 188 - 1640[c]
50 wt% 3 2CH CONH +50
wt% 2 2NH CONH [4]
27 163 - - -
62.5 wt% Triethylolethane+37.5 wt%urea [4]
29.8 218 - - -
67 wt% 3 2 2Ca(NO ) 4H O⋅ +33 wt%
3 2 2Mg(NO ) 6H O⋅ [41]
30 136 - - -
40 wt%
3 2Na(CH COO) 3H O⋅+60 wt% 2 2CO(NH ) [4, 53]
30 200.5 - - -
(a) “-” implies data is not sufficient. (b) The cited references haven’t described the meaning of “%” (molar, mass/weight, or volume percent?) for the composition. (c) The cited references haven’t given the phase conditions for this density value.

57
3.2 PCM Applications for high performance buildings
In Section 2.1.2, it was mentioned that PCM can be integrated into the building fabric to
enhance the thermal storage effect and improve the thermal comfort for the inhabitants. In this
section, we will have an overall look at some representative applications of this PCM
technology for high performance buildings. Generally speaking, PCM can be integrated with
almost all kinds and components of building envelopes, but different application areas have
their own unique configurations and characteristics. This section will focus on the most
commonly utilized application areas in buildings, which include PCM integrated wall, PCM
assisted under-floor electrical heating, PCM assisted ceiling heating and cooling, PCM
integrated roof, PCM filled glass windows, PCM sunshading, and PCM seasonal storage.
3.2.1 PCM integrated wall
Among all the PCM applications for high performance buildings, the PCM integrated wall is
most commonly studied and concerned due to its relatively more effective heat exchange area
and more convenient implementation. Generally speaking, there are two ways to integrate
phase change materials with building walls: “immersion” and “attachment”. The solution of
“immersion” is to integrate the phase change materials with the construction material of the
building envelope, such as concrete, bricks and plaster. There are normally three ways to
immerse PCM with the building construction material: direct immersion, macro-encapsulated
PCM and micro-encapsulated PCM [4]. According to Sharma et al.’s description in their
review [4], none of the applications of “direct immersion” and “macro-encapsulated PCM”
has ever been successful in the commercial market. Currently, the most effective method is to
immerse the “micro-encapsulated PCM” with the building structure material.
The concept of “micro-encapsulated PCM” is that the phase change material is encapsulated
inside the polymer/membrane, and the dimension of each “micro-capsule” is generally a few
micrometers. This kind of micro-encapsulated PCM effectively avoids the shortages of the
macro-encapsulated or direct immersed PCM, such as the problem of poor handling, leakage,
shape-distortion and hard maintenance. There have already been many commercial products
of micro-encapsulated PCM, such as Micronal® PCM produced by a German company BASF
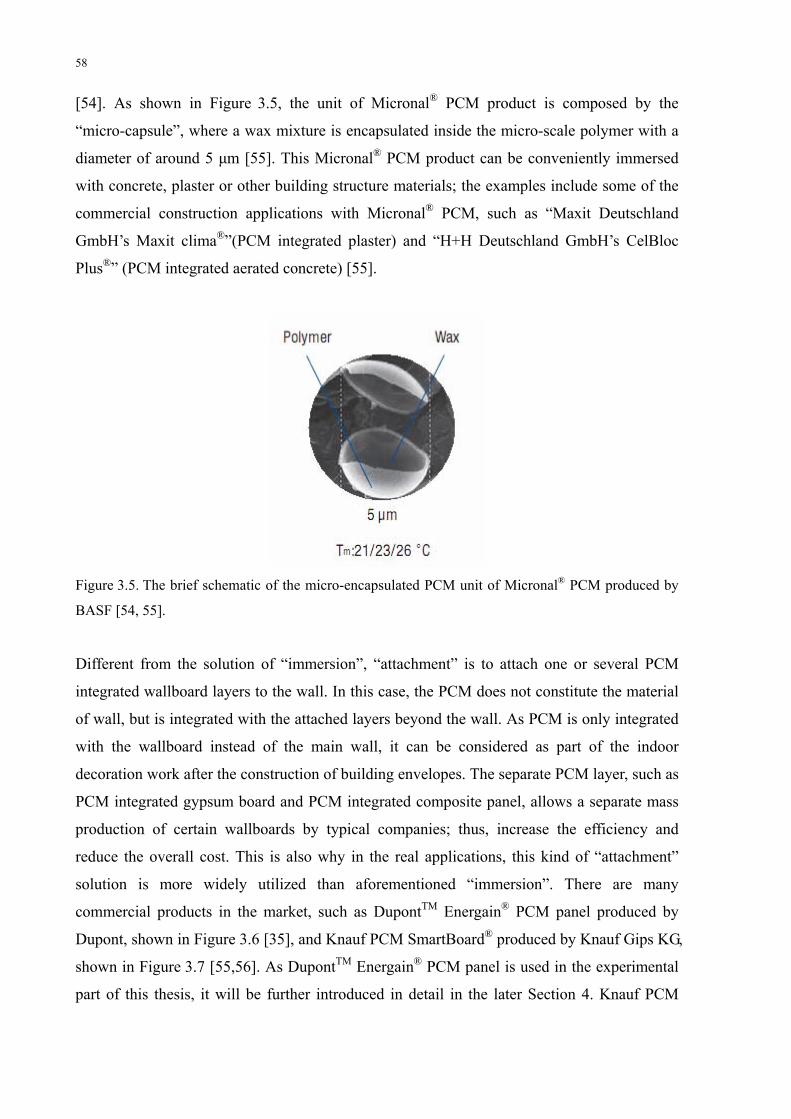
58
[54]. As shown in Figure 3.5, the unit of Micronal® PCM product is composed by the
“micro-capsule”, where a wax mixture is encapsulated inside the micro-scale polymer with a
diameter of around 5 μm [55]. This Micronal® PCM product can be conveniently immersed
with concrete, plaster or other building structure materials; the examples include some of the
commercial construction applications with Micronal® PCM, such as “Maxit Deutschland
GmbH’s Maxit clima®”(PCM integrated plaster) and “H+H Deutschland GmbH’s CelBloc
Plus®” (PCM integrated aerated concrete) [55].
Figure 3.5. The brief schematic of the micro-encapsulated PCM unit of Micronal® PCM produced by
BASF [54, 55].
Different from the solution of “immersion”, “attachment” is to attach one or several PCM
integrated wallboard layers to the wall. In this case, the PCM does not constitute the material
of wall, but is integrated with the attached layers beyond the wall. As PCM is only integrated
with the wallboard instead of the main wall, it can be considered as part of the indoor
decoration work after the construction of building envelopes. The separate PCM layer, such as
PCM integrated gypsum board and PCM integrated composite panel, allows a separate mass
production of certain wallboards by typical companies; thus, increase the efficiency and
reduce the overall cost. This is also why in the real applications, this kind of “attachment”
solution is more widely utilized than aforementioned “immersion”. There are many
commercial products in the market, such as DupontTM Energain® PCM panel produced by
Dupont, shown in Figure 3.6 [35], and Knauf PCM SmartBoard® produced by Knauf Gips KG,
shown in Figure 3.7 [55,56]. As DupontTM Energain® PCM panel is used in the experimental
part of this thesis, it will be further introduced in detail in the later Section 4. Knauf PCM
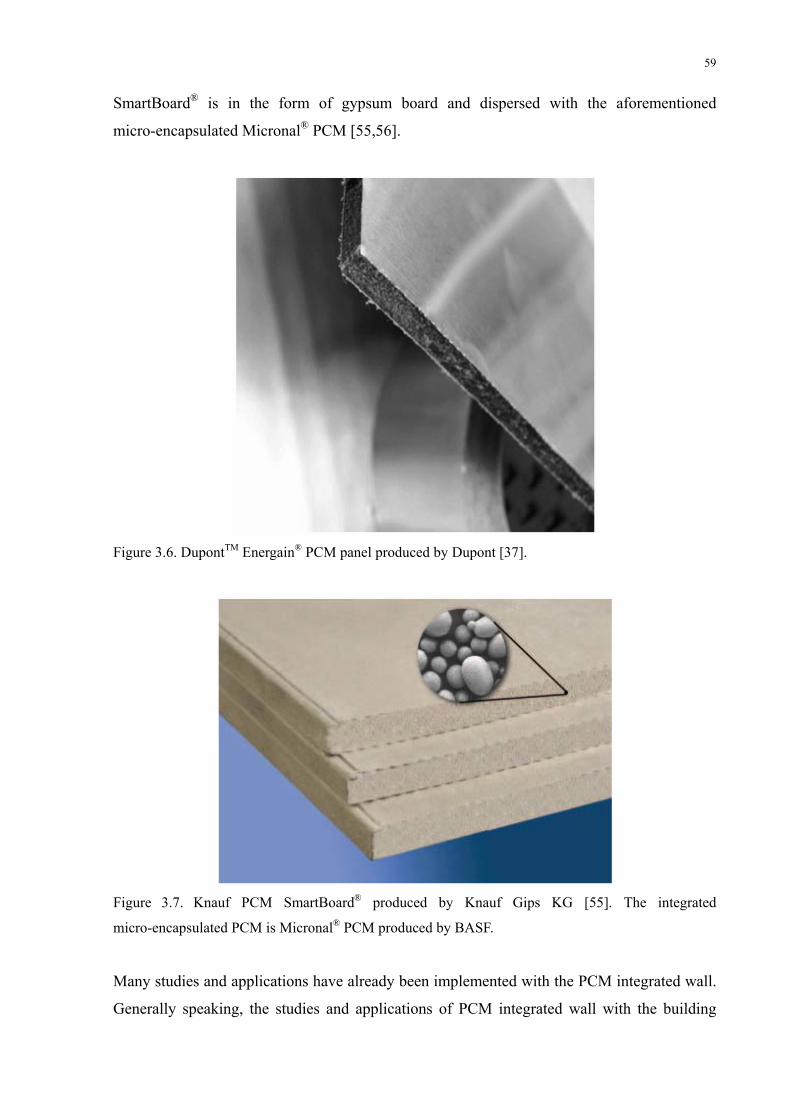
59
SmartBoard® is in the form of gypsum board and dispersed with the aforementioned
micro-encapsulated Micronal® PCM [55,56].
Figure 3.6. DupontTM Energain® PCM panel produced by Dupont [37].
Figure 3.7. Knauf PCM SmartBoard® produced by Knauf Gips KG [55]. The integrated
micro-encapsulated PCM is Micronal® PCM produced by BASF.
Many studies and applications have already been implemented with the PCM integrated wall.
Generally speaking, the studies and applications of PCM integrated wall with the building

60
envelope can be categorized into two types: (1) research and application for the wall between
indoor and outdoor environment, and (2) for the wall between indoor and adjacent room. The
principles of these two research and application types are a bit different. Simply speaking, if
PCM is utilized in type (1), it mainly functions as either a “heat sink” or a “thermal buffer”
between the indoor and outdoor environment; on the other hand, if PCM is utilized in type (2),
it mainly functions as an “automatic indoor environment controller”. Some of the
representative applications will be discussed below.
(1) Research and application for the wall between indoor and outdoor environment
Besides windows, the “active walls” between indoor and outdoor environment are also an
important portion of the envelope which should be responsible for the heat gains and losses
with the exterior environment. Many early studies focused on PCM playing a role as a better
thermal storage mass than the traditional masonry wall in the application of collector-storage
building wall (“Trombe Wall”). For the famous Trombe Wall, the building wall itself
functions as a thermal storage medium to absorb the solar radiation, which could be later used
for heating the ventilation air or other purposes. As early as the end of 1970s, Benard et al. [57]
began to make a series of experiments to compare the Trombe Wall (without natural air
circulation) performance with sensible and latent materials. They set up a test cell and its front
wall was tested with three different walls: wall A made of hard paraffin (Acro-wax 45-48, as
shown in Figure 3.8 for the test cell with wall A), wall B made of soft paraffin (Total SW2),
and wall C made of traditional concrete. Their testing results show that with the similar
storage effect, the wall with paraffin is about 1/5 thickness and 1/12 weight of a traditional
concrete wall. Therefore, the accomplishment of lightweight thermal storage envelope
becomes possible with certain phase change materials [57]. Later in the beginning of 1990s,
Ghoneim et al. [58] did a numerical analysis and simulation of the collector-storage building
wall (“Trombe Wall”) with different thermal storage mediums: sodium sulphate decahydrate,
medicinal paraffin, P116-wax, and traditional concrete. Their simulation compared the
performances (mainly investigate the parameter of Solar Saving Fraction) of different Trombe
walls with different wall thickness, ventilation conditions, thermal conductivities, PCM
melting temperatures and load collector ratios. Their simulation results show that, with the
same physical conditions, phase change materials have much better thermal storage
performance than the traditional concrete; among the phase change materials, with the same
physical conditions, sodium sulphate decahydrate presents the best thermal storage
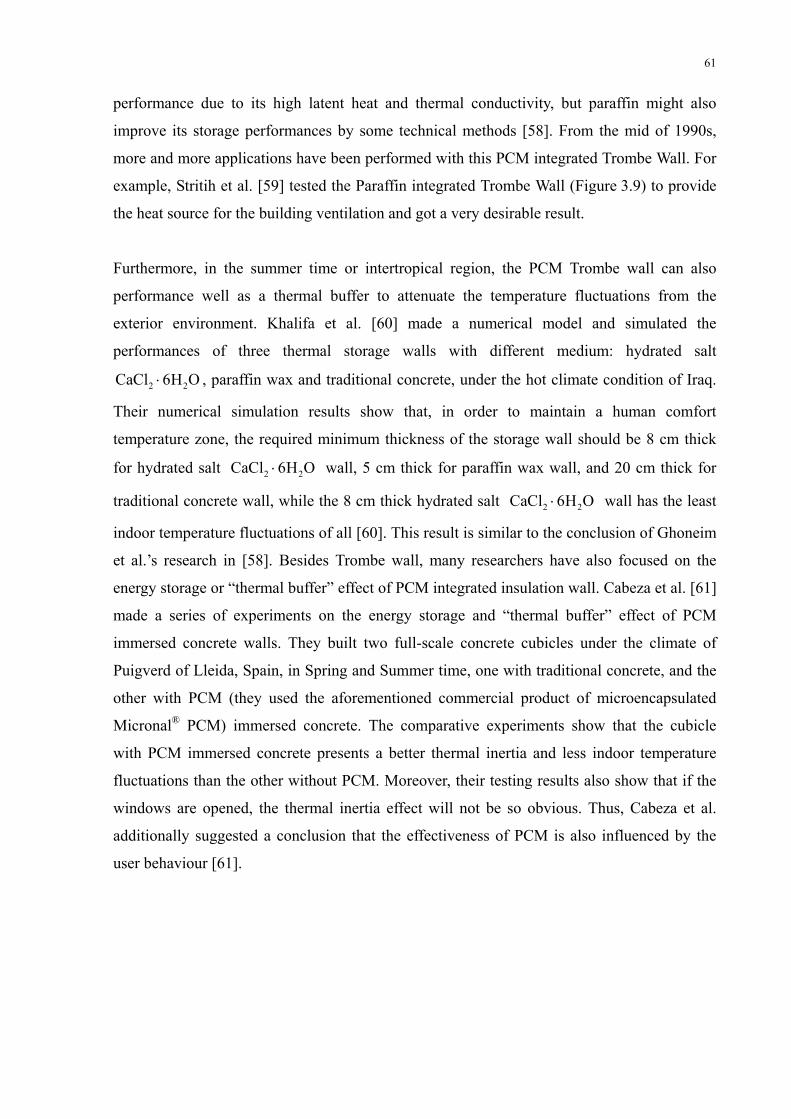
61
performance due to its high latent heat and thermal conductivity, but paraffin might also
improve its storage performances by some technical methods [58]. From the mid of 1990s,
more and more applications have been performed with this PCM integrated Trombe Wall. For
example, Stritih et al. [59] tested the Paraffin integrated Trombe Wall (Figure 3.9) to provide
the heat source for the building ventilation and got a very desirable result.
Furthermore, in the summer time or intertropical region, the PCM Trombe wall can also
performance well as a thermal buffer to attenuate the temperature fluctuations from the
exterior environment. Khalifa et al. [60] made a numerical model and simulated the
performances of three thermal storage walls with different medium: hydrated salt
2 2CaCl 6H O⋅ , paraffin wax and traditional concrete, under the hot climate condition of Iraq.
Their numerical simulation results show that, in order to maintain a human comfort
temperature zone, the required minimum thickness of the storage wall should be 8 cm thick
for hydrated salt 2 2CaCl 6H O⋅ wall, 5 cm thick for paraffin wax wall, and 20 cm thick for
traditional concrete wall, while the 8 cm thick hydrated salt 2 2CaCl 6H O⋅ wall has the least
indoor temperature fluctuations of all [60]. This result is similar to the conclusion of Ghoneim
et al.’s research in [58]. Besides Trombe wall, many researchers have also focused on the
energy storage or “thermal buffer” effect of PCM integrated insulation wall. Cabeza et al. [61]
made a series of experiments on the energy storage and “thermal buffer” effect of PCM
immersed concrete walls. They built two full-scale concrete cubicles under the climate of
Puigverd of Lleida, Spain, in Spring and Summer time, one with traditional concrete, and the
other with PCM (they used the aforementioned commercial product of microencapsulated
Micronal® PCM) immersed concrete. The comparative experiments show that the cubicle
with PCM immersed concrete presents a better thermal inertia and less indoor temperature
fluctuations than the other without PCM. Moreover, their testing results also show that if the
windows are opened, the thermal inertia effect will not be so obvious. Thus, Cabeza et al.
additionally suggested a conclusion that the effectiveness of PCM is also influenced by the
user behaviour [61].
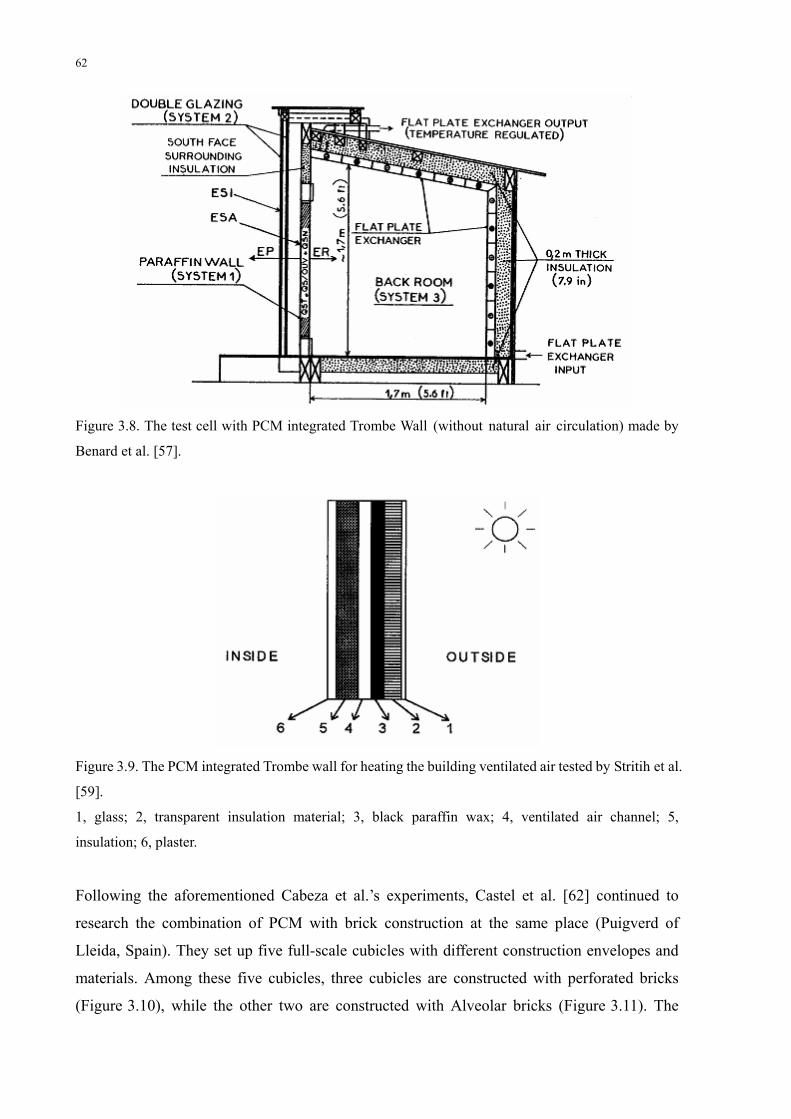
62
Figure 3.8. The test cell with PCM integrated Trombe Wall (without natural air circulation) made by
Benard et al. [57].
Figure 3.9. The PCM integrated Trombe wall for heating the building ventilated air tested by Stritih et al.
[59].
1, glass; 2, transparent insulation material; 3, black paraffin wax; 4, ventilated air channel; 5,
insulation; 6, plaster.
Following the aforementioned Cabeza et al.’s experiments, Castel et al. [62] continued to
research the combination of PCM with brick construction at the same place (Puigverd of
Lleida, Spain). They set up five full-scale cubicles with different construction envelopes and
materials. Among these five cubicles, three cubicles are constructed with perforated bricks
(Figure 3.10), while the other two are constructed with Alveolar bricks (Figure 3.11). The

63
different wall layers and components of those five cubicles have been listed in Table 3.7. The
combination of PCM with bricks follows the method of “attachment”, as a separate PCM
layer in the form of CSM (compact storage module – Rubitherm® CSM [63]) panels (Figure
3.12) has been attached to the bricks. A series of comparative experiments were conducted in
August 2008. These experiments could be further categorized into two groups, one with
“free-floating temperature” without any cooling system, while the other one with “controlled
temperature” equipped with a refrigeration system to maintain the indoor temperature at a
constant level (24 ºC in the experiments). Their testing results from the group of “free floating
temperature” present a similar effect with the aforementioned Cabeza et al.’s experiments [61],
where an attenuation effect of the temperature amplitudes (as much as 1 ºC compared to the
structure without PCM layer) and indoor fluctuations were observed. One important problem
with the solidification of PCM during the nighttime has been noticed in their experiments
under “free-floating conditions”, which may lead to poor temperature regulating effect during
the next day. Thus, Castel et al. suggested that a passive or active night cooling or ventilation
method should be implemented for the PCM integrated envelope with “free-floating
conditions”. The testing results from the group of “controlled temperature” show the energy
saving effect for the refrigeration system in the PCM integrated cubicles: the electricity
consumption was reduced as much as 15% for the perforated brick cubicle with PCM (RT-27)
than the one without PCM, while the data was 17% for the Alveolar brick cubicle with PCM
(SP-25). The corresponding reduced CO2 emissions were as much as 1-1.5 kg/year/m2 under
the Spanish CO2 emission/electricity rate [62]. Therefore, the energy saving effect is very
obvious with this combination of PCM and brick constructions under hot climate.
Many experiments [37, 64, 65] in a small scale test cell have been conducted during recent
years to explicitly examine the effect of PCM integrated wall between the interior and exterior
environment. With the convenient small size, these test cells can be conveniently located
either in the artificial climatic chamber or directly in the outdoor ambient. Most of the test cell
experiments were conducted in the comparative ways, and normally the results show that the
attenuation and “thermal buffer” effect of the wall between the interior and exterior
environment are obvious. The detailed review for these test cell experiments will be
introduced in Section 4.1.
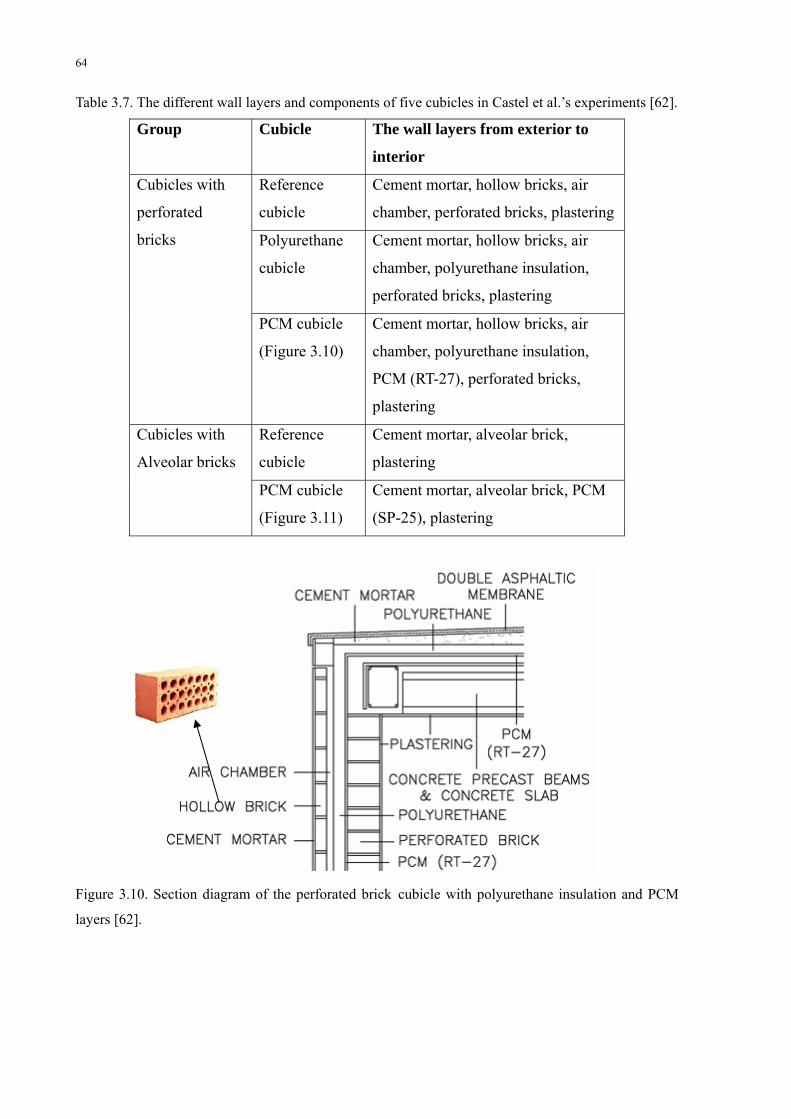
64
Table 3.7. The different wall layers and components of five cubicles in Castel et al.’s experiments [62].
Group Cubicle The wall layers from exterior to
interior
Reference
cubicle
Cement mortar, hollow bricks, air
chamber, perforated bricks, plastering
Polyurethane
cubicle
Cement mortar, hollow bricks, air
chamber, polyurethane insulation,
perforated bricks, plastering
Cubicles with
perforated
bricks
PCM cubicle
(Figure 3.10)
Cement mortar, hollow bricks, air
chamber, polyurethane insulation,
PCM (RT-27), perforated bricks,
plastering
Reference
cubicle
Cement mortar, alveolar brick,
plastering
Cubicles with
Alveolar bricks
PCM cubicle
(Figure 3.11)
Cement mortar, alveolar brick, PCM
(SP-25), plastering
Figure 3.10. Section diagram of the perforated brick cubicle with polyurethane insulation and PCM
layers [62].
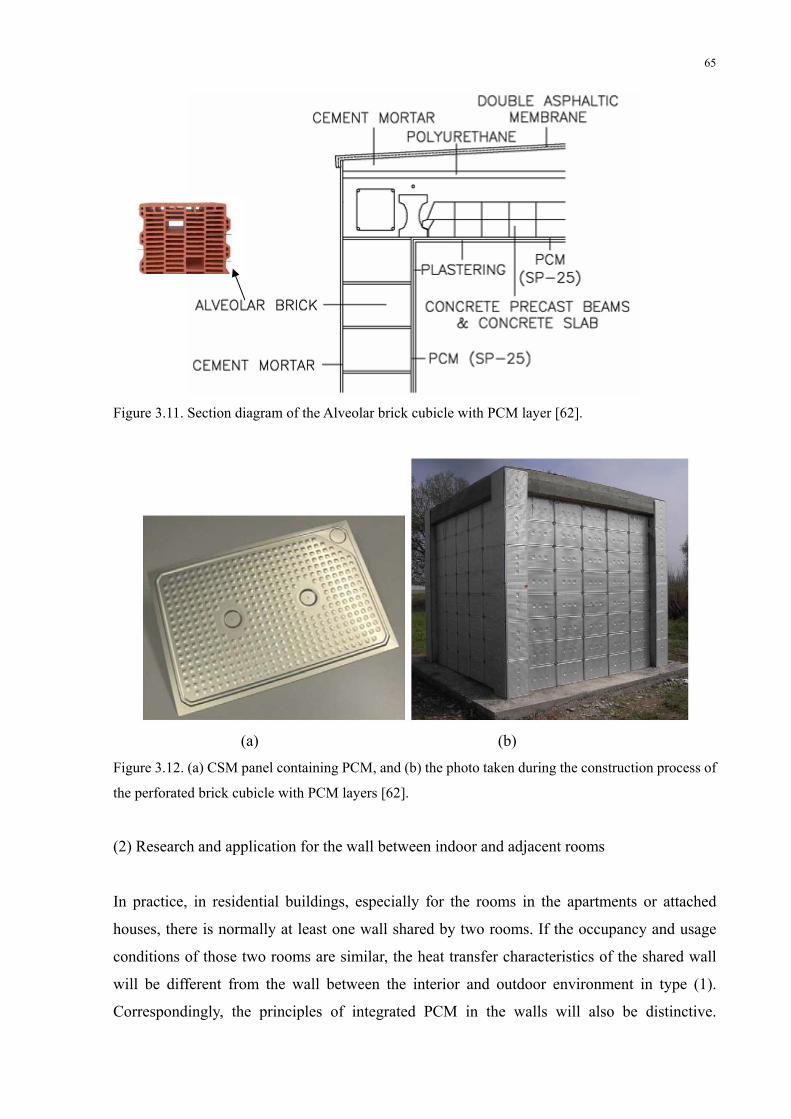
65
Figure 3.11. Section diagram of the Alveolar brick cubicle with PCM layer [62].
(a) (b)
Figure 3.12. (a) CSM panel containing PCM, and (b) the photo taken during the construction process of
the perforated brick cubicle with PCM layers [62].
(2) Research and application for the wall between indoor and adjacent rooms
In practice, in residential buildings, especially for the rooms in the apartments or attached
houses, there is normally at least one wall shared by two rooms. If the occupancy and usage
conditions of those two rooms are similar, the heat transfer characteristics of the shared wall
will be different from the wall between the interior and outdoor environment in type (1).
Correspondingly, the principles of integrated PCM in the walls will also be distinctive.

66
Kuznik and Virgone did a series of experiments in their full scale test room MINIBAT with
the commercial product DupontTM Energain® PCM panel [36, 66]. The PCM panels were
attached to the interior side of the walls which were treated as a shared wall between two
adjacent rooms, because the other side of the wall is controlled by the thermal guard with a
constant temperature to simulate the adjacent room. Their testing results show that integrating
PCM panel into the wall board can help to reduce the fluctuations of both air and wall surface
temperatures, enhance the natural convection and avoid thermal stratification [36]. Thus, it
improves the indoor thermal comfort as an “automatic indoor environment controller”.
Similar conclusions can be found in Liu and Awbi’s experiments [67], where they further
examined the influences of PCM wallboard on the heat flux, heat conductive loss and natural
convection coefficient. The detailed review of experiments by Kuznik et al. and Liu et al. will
be introduced in Section 4.1.
3.2.2 PCM assisted under-floor electrical heating system
Electrical under-floor heating system is one of the most commonly used methods to provide
heating to the indoor environment. In many countries, the electricity tariffs are different
between peak hours (usually during daytime) and off peak hours (usually during nighttime).
In order to shift the electrical heating load from high-tariff daytime to low-tariff nighttime, the
thermal storage is advised to be combined with the heating system.
At first, the sensible heat storage solutions were suggested. Athienitis and Chen [68, 69]
introduced and examined many floor heating systems with sensible thermal mass as the
storage medium. The thermal storage in [68] was composed of 1 cm thick sand and 4 cm
concrete blocks, while in [69] it was composed of concrete or gypcrete (mixture of gypsum
and concrete). During the last two decades, with the fast development of phase change
materials, more and more researchers and engineers have paid attention on the utilization of
PCM as the thermal storage method for floor heating systems. Amir et al. [70] did a
comparison between two floor heating panels with different thermal storage methods, one
with sensible heat storage of water and concrete as the medium, while the other with latent
heat storage of n-octadecane paraffin as the medium. The results from the comparison in [70]
show that the floor heating system combined with latent heat storage (Paraffin) presents more
advantages than the one with sensible heat storage (water and concrete): the much larger
thermal capacity of paraffin not only stores more thermal energy with a more compact
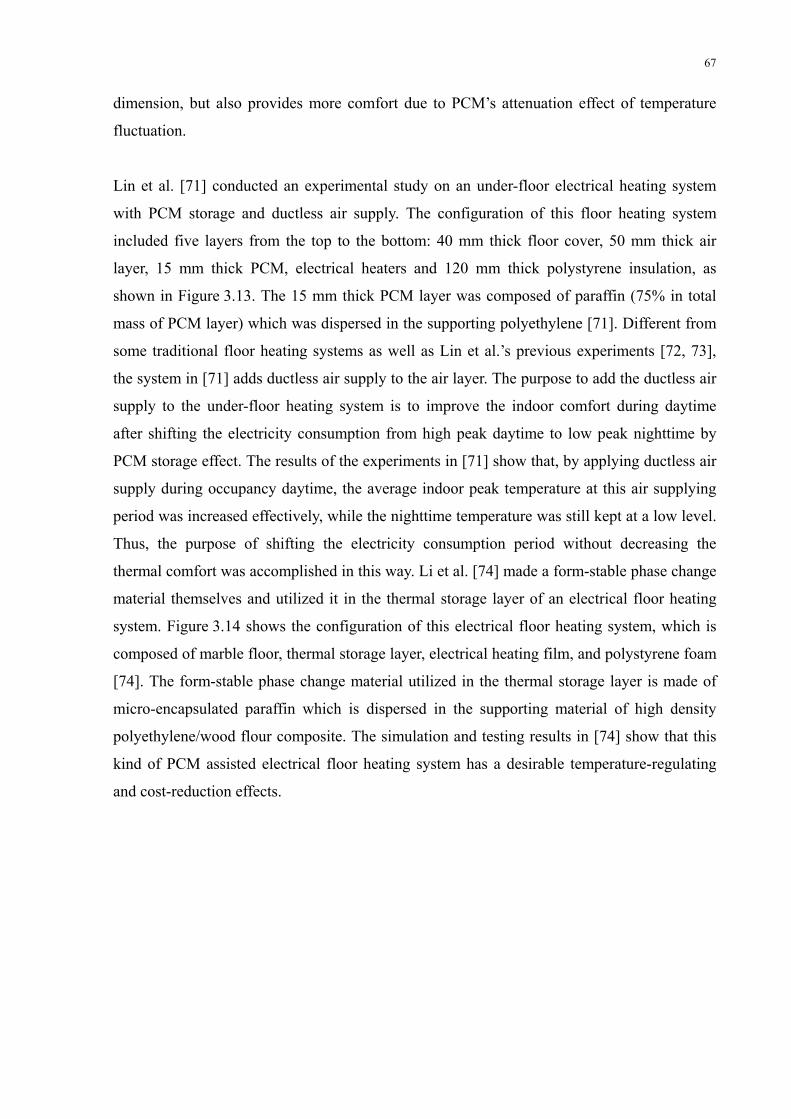
67
dimension, but also provides more comfort due to PCM’s attenuation effect of temperature
fluctuation.
Lin et al. [71] conducted an experimental study on an under-floor electrical heating system
with PCM storage and ductless air supply. The configuration of this floor heating system
included five layers from the top to the bottom: 40 mm thick floor cover, 50 mm thick air
layer, 15 mm thick PCM, electrical heaters and 120 mm thick polystyrene insulation, as
shown in Figure 3.13. The 15 mm thick PCM layer was composed of paraffin (75% in total
mass of PCM layer) which was dispersed in the supporting polyethylene [71]. Different from
some traditional floor heating systems as well as Lin et al.’s previous experiments [72, 73],
the system in [71] adds ductless air supply to the air layer. The purpose to add the ductless air
supply to the under-floor heating system is to improve the indoor comfort during daytime
after shifting the electricity consumption from high peak daytime to low peak nighttime by
PCM storage effect. The results of the experiments in [71] show that, by applying ductless air
supply during occupancy daytime, the average indoor peak temperature at this air supplying
period was increased effectively, while the nighttime temperature was still kept at a low level.
Thus, the purpose of shifting the electricity consumption period without decreasing the
thermal comfort was accomplished in this way. Li et al. [74] made a form-stable phase change
material themselves and utilized it in the thermal storage layer of an electrical floor heating
system. Figure 3.14 shows the configuration of this electrical floor heating system, which is
composed of marble floor, thermal storage layer, electrical heating film, and polystyrene foam
[74]. The form-stable phase change material utilized in the thermal storage layer is made of
micro-encapsulated paraffin which is dispersed in the supporting material of high density
polyethylene/wood flour composite. The simulation and testing results in [74] show that this
kind of PCM assisted electrical floor heating system has a desirable temperature-regulating
and cost-reduction effects.
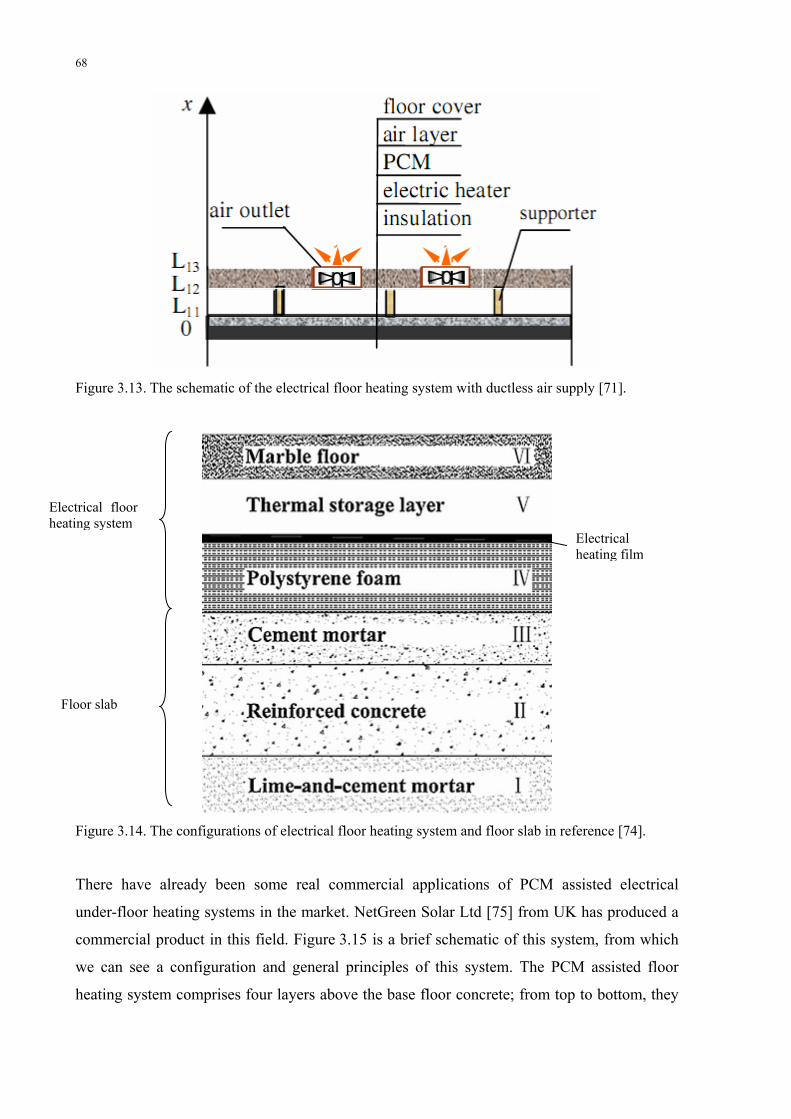
68
Figure 3.13. The schematic of the electrical floor heating system with ductless air supply [71].
Figure 3.14. The configurations of electrical floor heating system and floor slab in reference [74].
There have already been some real commercial applications of PCM assisted electrical
under-floor heating systems in the market. NetGreen Solar Ltd [75] from UK has produced a
commercial product in this field. Figure 3.15 is a brief schematic of this system, from which
we can see a configuration and general principles of this system. The PCM assisted floor
heating system comprises four layers above the base floor concrete; from top to bottom, they
Electrical heating film
Electrical floor heating system
Floor slab

69
are: floor covering, concrete, PCM storage panels and insulation. Different from the PCM
storage systems shown in [71] and [74], the PCM storage in NetGreen Solar Ltd’s system is
constructed into a series of cone-frustums (as shown in Figure 3.16). The gaps between the
columns of cone-frustums are laid with water pipes. After laying the water pipes onto the
PCM panels, the concrete should be cast onto the whole PCM panel forming the concrete
layer. The direct heat source is from the circulation of hot water in the water pipes, which can
be pumped from a solar heating or heat pump system. During the charging period, the thermal
energy from the hot water is stored in both the PCM storage and the concrete layer, thus
essentially the thermal storage layer might be considered as the combination of latent heat
storage (PCM panels) and sensible heat storage (the concrete layer) [75].
Figure 3.15. The schematic of the commercial product of PCM assisted under-floor electrical heating
system produced by NetGreen Solar Ltd [76].
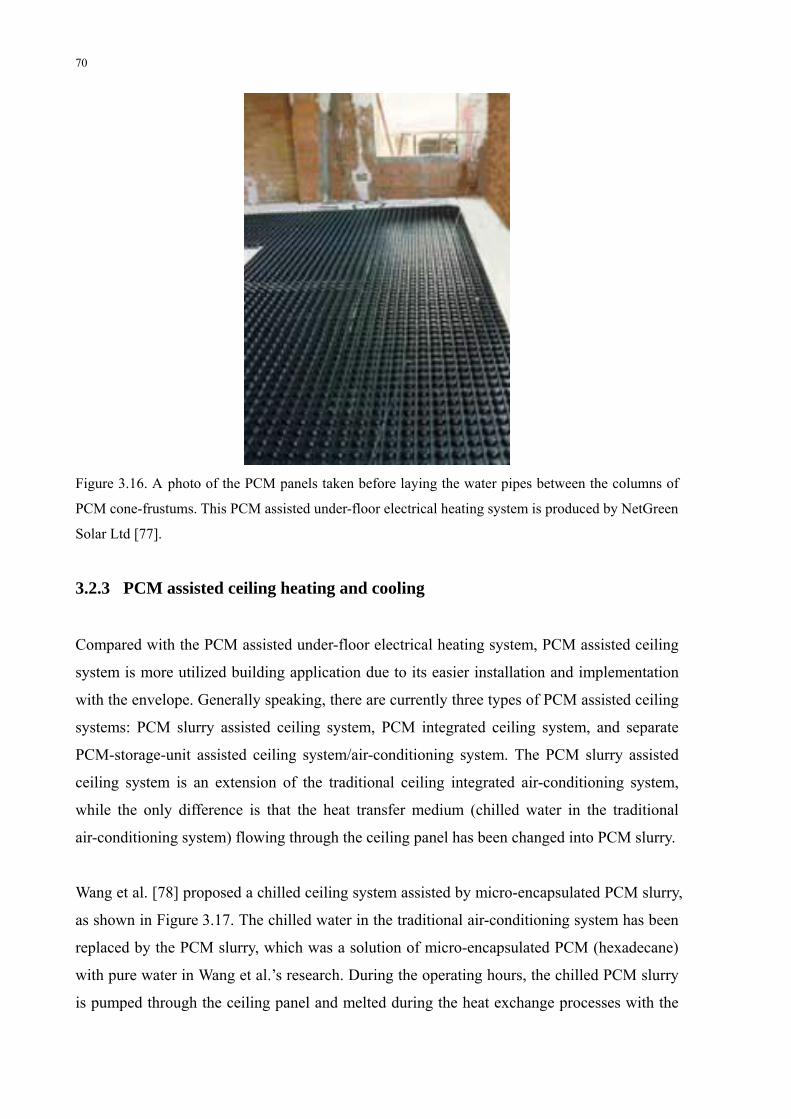
70
Figure 3.16. A photo of the PCM panels taken before laying the water pipes between the columns of
PCM cone-frustums. This PCM assisted under-floor electrical heating system is produced by NetGreen
Solar Ltd [77].
3.2.3 PCM assisted ceiling heating and cooling
Compared with the PCM assisted under-floor electrical heating system, PCM assisted ceiling
system is more utilized building application due to its easier installation and implementation
with the envelope. Generally speaking, there are currently three types of PCM assisted ceiling
systems: PCM slurry assisted ceiling system, PCM integrated ceiling system, and separate
PCM-storage-unit assisted ceiling system/air-conditioning system. The PCM slurry assisted
ceiling system is an extension of the traditional ceiling integrated air-conditioning system,
while the only difference is that the heat transfer medium (chilled water in the traditional
air-conditioning system) flowing through the ceiling panel has been changed into PCM slurry.
Wang et al. [78] proposed a chilled ceiling system assisted by micro-encapsulated PCM slurry,
as shown in Figure 3.17. The chilled water in the traditional air-conditioning system has been
replaced by the PCM slurry, which was a solution of micro-encapsulated PCM (hexadecane)
with pure water in Wang et al.’s research. During the operating hours, the chilled PCM slurry
is pumped through the ceiling panel and melted during the heat exchange processes with the

71
warm air in the room. The liquefied PCM medium will thereafter return to the PCM slurry
storage tank to mix with other chilled PCM slurry. Wang et al. also simulated and compared
the chilled ceiling air-conditioning system with three different heat transfer mediums flowing
through the ceiling panel: PCM slurry (with PCM slurry storage), water-ice slurry (with
ice-water storage), and traditional chilled water (without thermal storage). The simulation
results show that the system assisted by PCM slurry has the highest efficiency, while the
economical feasibility is also favourable especially for low day/night electricity tariff ratios
[78]. Griffiths et al. [79] set up a test chamber with the PCM slurry (40% concentration of
micro-encapsulated PCM with water) assisted chilled ceiling system and compared it with the
situation using chilled water as the heat transfer fluid. The testing results in their experiments
show that, with higher heat capacity, the PCM slurry can be circulated as a much lower flow
rate than water as the heat transfer fluid, thus the energy consumption and the system noise
can both be reduced without compromising the cooling effects [79].
Figure 3.17. The brief schematic of chilled ceiling system assisted by micro-encapsulated PCM slurry
(MPCM is short for micro-encapsulated PCM) [78].
The second type is the PCM integrated ceiling system. Different from PCM slurry, this second
type integrates PCM into the ceiling envelopes instead of acting as the heat transfer fluid. This
kind of ceiling system can be considered as a further development of the building fabric
thermal storage as mentioned in Section 2.1.2; the only difference is that the thermal mass
will be PCM which may have a higher heat capacity and thermal inertia than the sensible
thermal mass. Koschenz et al. [80] designed a PCM integrated thermally activated ceiling
panel, as shown in Figure 3.18. The thermal mass of this ceiling panel is made of a mixture of
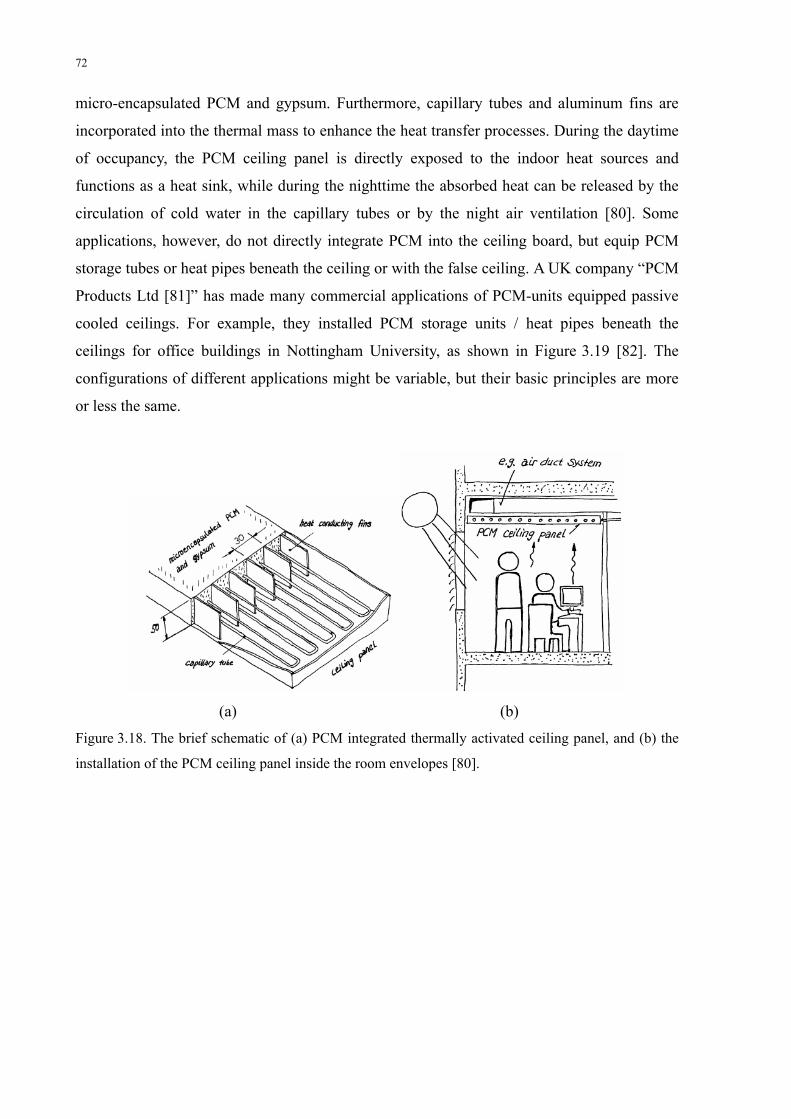
72
micro-encapsulated PCM and gypsum. Furthermore, capillary tubes and aluminum fins are
incorporated into the thermal mass to enhance the heat transfer processes. During the daytime
of occupancy, the PCM ceiling panel is directly exposed to the indoor heat sources and
functions as a heat sink, while during the nighttime the absorbed heat can be released by the
circulation of cold water in the capillary tubes or by the night air ventilation [80]. Some
applications, however, do not directly integrate PCM into the ceiling board, but equip PCM
storage tubes or heat pipes beneath the ceiling or with the false ceiling. A UK company “PCM
Products Ltd [81]” has made many commercial applications of PCM-units equipped passive
cooled ceilings. For example, they installed PCM storage units / heat pipes beneath the
ceilings for office buildings in Nottingham University, as shown in Figure 3.19 [82]. The
configurations of different applications might be variable, but their basic principles are more
or less the same.
(a) (b)
Figure 3.18. The brief schematic of (a) PCM integrated thermally activated ceiling panel, and (b) the
installation of the PCM ceiling panel inside the room envelopes [80].

73
(a)
(b)
Figure 3.19. The UK company “PCM Products Ltd [81] installed PCM storage units / heat pipes
beneath the ceilings for office buildings in Nottingham University: (a) The schematic of basic
principles during day-time and night-time modes, (b) real photo of this PCM-unit equipped passive
cooled ceiling [82].
The third type is the separate PCM-storage-unit assisted ceiling system/air-conditioning

74
system. Different from the aforementioned two types, the PCM is not directly related with
ceiling or even false ceiling in this third type. Strictly, this system is still an air-conditioning
system with the chilled water flowing through the ceiling; the only difference is that a
separate PCM storage unit has been added between the air-conditioning system and the
distribution system of the chilled water. Therefore, the chilled ceiling system is still the same
as what has been described in the part of “Building fabric sensible thermal storage” in Section
2.1.2. This is also why it is so difficult to strictly divide the thermal storage solutions simply
into Sensible storage and Latent storage, as they are coupled with each other. Anyway, the
combination of PCM storage unit directly influences the temperature of the chilled water
flowing through the ceiling panels and many commercial applications have been implemented
in this way due to the easier compatibility of PCM storage with the traditional
air-conditioning system. The aforementioned UK company “PCM Products Ltd [81]”
conducted one commercial application with this third type in a “China Shipping Building” in
Felixstowe, UK [83]. The brief schematic of its system has been presented in Figure 3.20,
from which we can see that a thermal energy storage with 6000 FlatICETM Containers [84]
has been combined with the air-conditioning system [83].
Figure 3.20. A brief schematic of a separate PCM-storage-unit assisted passive chilled ceiling system,
implemented by a UK company “PCM Products Ltd [81]” in a “China Shipping Building” in
Felixstowe, UK [83].
Chiller Capacity

75
3.2.4 PCM integrated roof
Different from ceiling, roof is exposed to the exterior ambient, and thus, is a significant
thermal buffer between the indoor and outdoor environment. Theoretically, the principle of
roof is the same as the wall between indoor and outdoor environment as described in Section
3.2.1. In Section 3.2.1, during the review of Castell et al.’s research [62], we also noticed that
they combined PCM layer also into the roof of their test cubicles (Figure 3.10 and Figure
3.11). The “thermal buffer” and attenuation effect between the indoor and outdoor
temperatures can be clearly seen by Castell et al [62].
To examine the thermal buffering effect of PCM integrated roof, Pasupathy et al. did some
experiments and a series of numerical simulation with their test rig in Chennai, India [85, 86].
From exterior to interior, the components of their PCM integrated roof were: roof top slab
(brick mixture and mortar), PCM panel, and concrete slab (Figure 3.21). Water pipes were
embedded inside the PCM panel to provide auxiliary cooling when PCM temperature was
much higher than its phase change point. The cold water flowing through the water pipe was
stored in a tank at the edge of the roof as shown in Figure 3.22. In order to conduct
comparative experiments, two identical test rooms were built, one of which contained PCM
layer, while the other did not. During Pasupathy et al.’s initial experiments, there was only
one layer of PCM panel in the roof [85]. The PCM they used in their initial experiments [85]
for that single PCM layer was a mixture of inorganic salt hydrate with a phase change
temperature of 26-28 ºC. Their experimental and simulated results show that the thermal
buffering effect of single PCM integrated roof in their test rig (with a PCM layer thickness of
2.5 cm) is relatively desirable from December to April, but is very unsatisfactory from May to
November [85].
According to Pasupathy et al.’s analysis, increase of PCM layer thickness or circulation of
cold water during the hot summer season only has a theoretical capability but not feasibility
for the practical applications [85]. Therefore, in their later research, they investigated utilizing
two layers of PCM with different phase change temperatures within the roof [86]. Their
simulations show that, under the weather condition of Chennai, India, in order to maintain a
relatively constant temperature for the bottom concrete slab, the PCM melting temperature of
top layer should be at least 6-7 ºC higher than the ambient temperature during the early

76
morning (3-6 AM) in hot summer [86]. In this case, Pasupathy et al. chose a commercial PCM
product “Climsel C 32 [87]” with a phase change temperature of 32 ºC for the top PCM layer.
Their simulating results also show that with a thickness of 4 cm for their top PCM layer, the
bottom PCM layer will then remain at a relatively constant temperature around its phase
change point, thus definitely desirable for the roof application [86]. However, it is a pity that
Pasupathy et al. haven’t examined and compared the thermal buffering effect of the roof with
PCM layer(s) attached beneath the bottom concrete slab, which can be considered as one of
the prevailing methods utilized nowadays for the ceiling applications in Section 3.2.3.
Anyway, most importantly, the creative ideas of attaching double PCM layers with different
melting temperatures suggested by Pasupathy et al. provide us a new thermal buffering and
insulation method to combine PCM with building envelopes under some typical climate
conditions [86].
Figure 3.21. Components of the PCM integrated roof in Pasupathy et al.’s test room [85].

77
Figure 3.22. A photo of Pasupathy et al.’s PCM integrated roof [85].
3.2.5 PCM filled glass windows
From the above descriptions of the PCM applications, we can see that most of the studies and
applications have focused on the “opaque” part of building envelopes, such as walls, ceilings,
and floors. However, we should notice one fact: generally speaking, “transparent” part of the
building envelopes, i.e. window, has much lower thermal resistance than other parts of the
envelopes. Many methods have been utilized to increase the insulation properties of windows,
such as using vacuum glazing [88, 89], filling the gap between the glass sheets with absorbing
gases [90, 91] or certain aerogels [92, 93], combining vacuum glazing with aerogel
technology [94], adding spectrally selective coatings on the glass sheets [95, 96], etc.
However, very few researchers have investigated the “PCM filled glass windows” due to the
characteristics of PCM and relatively difficult implementation. Ismail and coworkers did a
series of theoretical and experimental studies on the composite and PCM glass systems
[97,98,99]. The test rig of Ismail and coworkers’ experiment is shown in Figure 3.23. The
whole system is mainly composed of five parts: the control system, PCM tank, electrical
pump, thermocouples, and tested glasses. The components of control system, thermocouples
and the electrical pump constitute a feedback system. When the thermocouples have
monitored certain interior or exterior temperatures (preset by the control system), the
feedback system will automatically turn on the electrical pump and fill the gap between
glasses with certain PCM liquid from the PCM tank [97]. The PCM they used in their test rig

78
is a mixture of glycol with specific melting point in different experiments and testing modes
[99].
Figure 3.23. The experimental test rig of the PCM filled glass windows [97].
In the papers of Ismail and coworkers, both of the summer and winter modes of the test rig of
this PCM filled window have been introduced [97,98,99]. In the winter mode, when the
exterior temperature decreases to a preset point, the pump is turned on and fills the gap with
PCM liquid. Due to the cold exterior condition (lower than the melting point of PCM), the
outer surface of PCM starts to freeze, forming a solid PCM layer whose thickness increases
with time. A well designed PCM window system for the winter mode has the characteristic
that the PCM layer will have completely solidified before the exterior temperature starts to
increase [97]. On the other aspect, in the summer mode, during the night time with lower
exterior temperature than the melting point, the gap of the glasses will be filled with PCM
liquid and it needs to be solidified completely before the daytime with high temperature.
During the daytime, due to the high exterior temperature, the outer surface of the PCM solid

79
starts to melt (when the exterior temperature is higher than the melting point), forming a
liquid PCM layer whose thickness increases with time. Similarly, a well designed PCM
window system for the summer mode has the characteristic that the PCM layer will have
completely liquefied before the exterior temperature starts to decrease [98,99].
After Ismail and coworkers’ theoretical and experimental study, they have found some
important characteristics for the PCM filled windows [97,98,99]. With the incorporation of
PCM, a significant reduction in the infrared and ultraviolet radiations has been noticed, which
greatly reduces both heat gain and losses during the phase change processes [97,99]. After
comparison between PCM-filled and air-filled windows with the same dimensions and
climate conditions, PCM-filled (glycol mixture) window shows a better thermal effectiveness
than the air-filled one [97]. However, the comparison between PCM-filled (glycol mixture)
and absorbing gas mixture-filled windows, shows that the thermal effectiveness of PCM-filled
window might not be better than the absorbing gas filled-ones, depending on the properties of
those absorbing gases [98]. The comparison between different coloured PCM and pure PCM
shows that green colour has the highest thermal effectiveness of all [97].
The viability of this PCM filled window requires more research and comparison between
different materials and conditions. It is hard to simply say that PCM filled window has the
best thermal and optical properties of all. Up till now, no commercial applications on PCM
filled window have been found.
3.2.6 Sunshading with PCM
Besides the PCM filled glass windows to overcome the poor buffering effect of transparent
windows described in Section 3.2.5, PCM assisted sunshading system can also be utilised to
enhance the thermal buffer effect. Mehling from ZAE Bayern collaborated with Warema
Rebkhoff GmbH and Merck KGaA to set up a PCM sunshading system shown in Figure 3.24
and Figure 3.25 [100, 101]. The PCM utilized in Mehling’s PCM sunshading system is
hydrated salt 2 2CaCl 6H O⋅ (the detailed thermophysical properties of 2 2CaCl 6H O⋅ has
been listed in Table 3.5). His PCM sunshading system is very suitable to be utilized under the
hot summer climate, especially for those areas with significant daytime and nighttime
temperature fluctuations [100, 101].

80
Mehling’s idea is very creative because it fully utilized the characteristics of a conventional
sunshading system. During the daytime with high temperatures (compared to the thermal
comfort value), the face of the inner blind integrated with PCM is rotated to be exposed to the
solar radiation so that excess solar energy is stored in PCM, attenuating the temperature
fluctuations inside the room. During the nighttime with relatively low temperatures
(compared to the thermal comfort value), the face of the inner blind integrated with PCM is
roated to be exposed to the room air so that the stored energy is released back to the room,
avoiding over-reduction of the room temperature below the thermal comfort value. Some of
Mehling’s experimental results have been shown in Figure 3.26, from which we can see that,
under the typical climate conditions with significant daytime and nighttime temperature
fluctuations, the attenuation effect to the indoor air temperature is very effective with the help
of PCM sunshading system. [100, 101]
As both the references [100] and [101] only provide a brief introduction for Mehling’s
experiments, very limited information can be obtained about his research on this topic. In my
opinion, some of the questions are important for Mehling’s system to be viable in the practical
applications:
How does this PCM sunshading system collaborate with varied window glazings? Are
there any relations and influences between each other?
How will this PCM sunshading system be influenced by the actions of opening and
closing the window?
How can it be used in the hot summer climate conditions with less temperature
fluctuations between daytime and nighttime? Will the nighttime ventilation mode be
suitable for this situation?
What will be the effect of this system in the winter mode? How can it be operated in
winter?

81
Figure 3.24. A brief schematic of the sunshading systems with and without PCM [100].
(a) (b)
Figure 3.25. A photo of sunshading system with PCM: (a) vertical inner blinds with PCM, (b) horizontal
inner blinds with PCM [100].
Conventional sunshading system
Sunshading system with PCM
inner blind with PCM
inner blind without
glazingglazing

82
Figure 3.26. Some of Mehling’s experimental results with PCM sunshading system [100, 101].
3.2.7 PCM Seasonal storage
Similar with the sensible seasonal storage technologies, latent thermal energy can also be
utilized for long term seasonal storage. The most traditional and historical phase change
material utilized in the seasonal storage is 2H O , whose liquid form is commonly-known as
water while the solid form is ice or snow. Seasonal ice/snow storage for residential cooling
dates back to the time of ancient Greece, where ice and snow were collected from lakes or
fields during winter and insulated with sawdust [102]. At the end of 1970s, the energy crisis
around the world stimulated the research for this renewable way to produce cooling for
residential buildings, as traditional air-source refrigeration system consumed large amount of
electricity. Princeton University (USA) set up an ice pond as a seasonal storage in 1979 and
did a series of experiments and studies with it. Their detailed theoretical and experimental
analyses can be found in references [103, 104]. Fischer [105] set up a demonstration hybrid
system of seasonal ice-pond and heat pump in Knoxville (Tennessee, USA) in the late 1970s,
as shown in Figure 3.27. Its combination of heat pump with the seasonal ice-pond fully
utilized the merits of both systems, largely increasing the coefficient of performance (COP)
for the heat pump. In winter time, the pond filled with liquid water played a role as the heat
source for the outdoor evaporators, thus ice was formed during the heat extraction processes.

83
This ice was stored over several months and used to provide the cooling for the demonstration
house in summer time. In case the stored ice was melted during the summer season, the heat
pump system would chill the water in the night time for next day’s cooling [105].
A recent successful application of snow/ice seasonal storage has been implemented in
Sundsvall hospital in Sweden which has been researched by Skogsberg and Nordell [102].
The most creative idea compared to the former snow/ice storage is that this seasonal system is
equipped with the polluted water treatment unit, so that it not only serves as an urban snow
collection spot, but also as a fantastic pollution (polluted snow) treatment centre. The brief
schematic of the whole snow storage system has been shown in Figure 3.28. The Sundsvall
regional hospital has a floor area of 190 000 m2 with an annual cooling demand of 1000 MWh
and maximum cooling power of 1500 kW. In winter time, the snow transported from the
surrounding urban area is centrally collected in the slightly bowl-shaped watertight asphalt pit
with a total storage volume around 60 000 m3. The bottom surface of the pit has a slight slope
for draining the melted water, while the top of the pit is covered with 0.2 m thick wood chips
as the insulation layer. This layer of wood chips also acts as a natural cooler due to its
absorption and water evaporation effects. The melted water from the snow storage
successively flows through the coarse-meshed filter, oil and gravel separator, pumps,
automatically rinsed fine filters and finally extracts the heat from the exchanger. Thereafter
the heated water from the exchanger returns back to the snow storage through the preinstalled
distributed pipes. The recirculation process is controlled by the adjustment of the pump
through the feedback system, so that proper cooling power can be provided. During the first
year’s operation in 2000, 30 000 m3 snow with an overall potential cooling capacity of 2000
MWh and maximum cooling power of 2000 kW was stored, satisfactorily covering the
cooling demand of the hospital. Moreover, under the same condition, several numerical
simulations have been done. Some important results have been obtained from the numerical
simulations [102]:
More than 80% of the natural melting is contributed to the heat transfer from air.
Therefore, if the storage pit or container can be designed in a more compact shape, the
heat losses will be significantly reduced.
The insulation layer is very important for the functioning of the seasonal snow storage.
According to the simulation result, the snow in the storage will completely melt even
before July (the cooling season is May -August) without the absence of insulation layer
under the natural melting situation. On the other hand, 0.1 m thick sawdust insulation can

84
already keep the presence of snow in the storage until the end of the cooling season under
the total melting situation (considering both natural melting and cold extraction by heat
exchanger).
With the same condition of Sundsvall hospital in Sweden, the estimated lifetime of the
seasonal snow storage cooling system is around 40 years while the payback time is about 3
years. Therefore, this kind of seasonal snow storage system is quite competitive in the Nordic
countries [102].
Figure 3.27. A demonstration hybrid system of seasonal ice-pond and heat pump in Knoxville
(Tennessee, USA) [105].
Figure 3.28. The brief schematic of the Seasonal snow storage cooling system for the Sundsvall
hospital in Sweden [102].

85
Besides the utilization of water in the “traditional” PCM seasonal storage, some newly
developed phase change materials (as discussed in Section 3.1) can also be used in the PCM
seasonal storage. Öztürk set up a hybrid system of solar collectors and seasonal PCM storage
for heating a green house with a floor area of 180 m2 in Turkey [106]. The PCM utilized in
the seasonal storage unit was technical grade paraffin with the distribution of C-atoms as
C22-C45. Its phase change temperature range is around 48-60 ºC, while the latent heat of fusion
is 190 kJ/kg. Approximately 6000 kg paraffin was filled into the storage unit. The brief
schematic of the system is shown in Figure 3.29(a). On a rack with a tilted angle of 55º beside
the greenhouse, the 27 m2 south facing flat plate solar air collectors act as the overall heat
sources for the whole system. The configuration of the heat storage unit is presented in Figure
3.29(b), from which we can see that the basic principle of heat transfer processes is
accomplished by passing the air through the polyethylene pipes inside the PCM filled
cylindrical tank. During the charging process in warm seasons, the heated air from the solar
collectors passes through the polyethylene pipes; while during the discharging process in
winter, the recirculated air from the greenhouse passes through the storage. Since the charging
and discharging proceeses are precisely controlled by the preset feedback system through the
valves and fans (Figure 3.29(a)), air from solar collectors and greenhouse can share the same
polyethylene pipes in the PCM storage unit. Öztürk [106] did a detailed energy and exergy
analysis based on the experimental results for this hybrid heating system. The results show
that this PCM seasonal storage system is relatively efficient in the aspect of net energy
analysis (40.4%) but inefficient in the net exergy analysis (4.2%). However, Öztürk [106]
points out that the exergy efficiency is indeed more essential, because exergy is the criteria of
useful and cost-effective thermal energy stored by the PCM storage. Thus, emphasis should
be focused on the methods to investigate the exergy loss and auxiliary energy consumptions to
improve the exergy efficiency [106].

86
(a)
(b)
Figure 3.29. Brief schematics of (a) the hybrid heating system of solar air collectors and seasonal PCM
storage, and (b) configuration of the heat storage unit [106].
Some simulations have been conducted by Qi et al. [107] with their suggested hybrid heating
system of solar assisted heat pump and seasonal PCM storage. Their assumed application’s
location is a villa building with a floor area of 325 m2 in Beijing, China. The PCM they used
in their seasonal storage is hydrated salt 2 2CaCl 6H O⋅ with a phase change temperature at
29 ºC (the detailed thermophysical properties of 2 2CaCl 6H O⋅ has been listed in Table 3.5).
The brief schematic of the system is shown in Figure 3.30. During the periods beyond the
heating season, the parallelly arrayed flat plate solar collectors act as the heat sources for the
87
PCM seasonal storage. During the heating season in winter (mid November to mid March),
the heat transfer fluid (water in this system) circulates through the seasonal storage and the
heat exchangers in the evaporator, thus providng desirable heat sources for the heat pump
system. A bit different from the storage unit described in the aforementioned Öztürk’s test rig
[106], the PCM storage tank in Qi et al.’s system contains hundreds of parallelly connected
cylindrical PCM storage units (Figure 3.31), each of which consists of seven small storage
cells. These small storage cells are composed of two concentric cylindrical shells, so that the
heat transfer fluid can pass through the inner shell while PCM is filled between those two
concentric shells. Detailed numerical simulations of this system have been done by Qi et al. In
their simulations, they compared the functioning of the system with respect to different solar
collector areas (30, 40, 50 and 60 m2) and storage volumes (228 and 456 m3). From their
simulation results, they concluded that a well designed hybrid heating system should avoild
overheating of PCM to keep the mean temperatures of PCM and heat transfer fluid at a
relatively low level. In this way, the heat losses to the ambient can be reduced. Furthermore,
in order to avoid the overheating of PCM without compromising the heating effect, a
relatively larger storage volume with proper solar collector areas might be adopted. In Qi et
al.’s simulations, the best arrangement was that 456 m3 storage volume matched with 50 m2
solar collectors. The payback time of this hybrid system is still unknown, as Qi et al. haven’t
conducted any economical analysis in [107]. Anyway, the creative idea of using PCM
seasonal storage in the solar assisted heat pump system is definitely a fantastic step for the
future application.

88
Figure 3.30. A brief schematic of the hybrid heating system of solar assisted heat pump and seasonal
PCM storage [107].
1, solar collector; 2, storage tank; 3, evaporator; 4, throttling valve; 5, condenser; 6, compressor; 7,
pump; 8 and 11, three-way valve; 9, 10 and 13, valve; 12, heat exchanger; 14, heated space.
Figure 3.31. Configuration of a PCM storage unit [107].

89
4 PCM WALLBOARD EXPERIMENTS
4.1 Review of previous PCM wallboard experiments
In order to plan our PCM wallboard experiments, we needed to review some of the
representative experiments done by researchers in the past. Since the PCM product “DupontTM
Energain® panel [35]” was used, some of the articles particularly focused on the experiments
with DupontTM Energain® panel will be reviewed, compared and discussed first. Some of the
other experiments with PCM integrated wallboard will also be briefly discussed below.
Kuznik and Virgone [36, 37, 64, 66] have done a series of experiments for different research
purposes with DupontTM Energain® PCM panels both in full scale test room MINIBAT and
small scale test cell MICROBAT. Although the technical descriptions of this product are a bit
different between references [36, 37, 64, 66], the official data sheet of this product can be found
on the website of DupontTM Energain® in [35]. According to [35], the main constitution of this
product is 60% molecularencapsulated paraffin wax within a copolymer. Some of the most
important thermal parameters of this product have been listed in Table 4.1.
Table 4.1. Important thermal parameters of DupontTM Energain® PCM panel [35].
Thermal parameter Value
Melting point 21.7 ºC
Latent heat storage capacity >70 kJ/kg
Total heat storage capacity (from 14 ºC to 30 ºC) >170 kJ/kg
Conductivity in solid phase 0.18 W/m·K
Conductivity in liquid phase 0.14 W/m·K
In [36, 66], the experiments were conducted in the full scale test room MINIBAT. Figure 4.1 is
a schematic of the MINIBAT test rig. The operating principle of this test rig is that by
controlling the temperatures and artificial solar radiation in the climatic chamber which is
directly attached to the glazing wall (Figure 4.1), one can test the corresponding thermal

90
reactions of the envelope surfaces (with or without PCM) and room conditions in the test cells.
During the experiments either in [36] or [66], only test cell 1 was used during the experiments,
the locations of PCM modified walls and the artificial solar light can be seen in Figure 4.2. Two
key elements in MINIBAT to simulate the boundary thermal conditions are “climatic chamber”
and “thermal guard” (marked as “2” and “12” in Figure 4.1). In “Climatic Chamber”, air
temperature can be dynamically controlled from -10 ºC to 40 ºC with certain temperature
evolution profiles. The “Thermal Guard” is used to simulate the temperature of adjacent rooms
which are assumed to be at a constant temperature. In the experiments, the thermal guard
temperature was set to be 20.5± 0.5 ºC. The configuration of the walls (with or without PCM)
in the test cell is illustrated in Figure 4.3, from which we can see that the PCM panel is located
between the layers of polystyrene and plaster for the PCM modified wall [36, 66].
Figure 4.1. Schematic of full scale MINIBAT test rig [36].
1, cooling unit; 2, climatic chamber; 3, simple glazing; 4, protection glass of the solar simulator; 5, test
cell; 6, concrete; 7, air blowing plenum; 8, solar simulator’s heat removal ventilators; 9, air extraction
plenum; 10, HVAC unit of the thermal guard; 11, solar simulator; 12, thermal guard. (Metric units)

91
Three types of temperature evolutions were generated in the climatic chamber to simulate three
different testing cases: “a summer day case”, “a mid-season day case” and “a winter day case”.
However, solar radiative fluxes were the same in each testing case. Figure 4.4 shows the
profiles of temperature evolutions of those three testing cases generated in climatic chamber
and simultaneous artificial solar radiative flux. Their testing results are rather satisfactory and
are in accordance with the anticipation. Figure 4.5 and Figure 4.6 show the testing results of
room air temperatures and interior wall surface temperatures respectively under the summer
case with ventilation. Similar temperature regulating effects can also be seen in the
mid-season and winter cases. These results show that integrating PCM panel into the wall
board can help to reduce the fluctuations of both air and wall surface temperatures, enhance the
natural convection and avoid thermal stratification. Thus, the thermal comfort will be much
improved with this kind of PCM modified wall board [36].
Figure 4.2. Locations of PCM modified walls and the artificial solar light in test cell 1 of Figure 4.1 [36].

92
Figure 4.3. Configuration of the walls (with or without PCM) in the test cell [36].
Figure 4.4. Profiles of temperature evolutions of three testing cases generated in climatic chamber and
simultaneous artificial solar radiative flux [36].

93
Figure 4.5. Testing results of the air temperatures in the room under the summer case with ventilation
(T1: sensors at the height of 0.85 m; T2: sensors at the height of 1.70 m) [36].
Figure 4.6. Testing results of the interior wall surface temperatures under the summer case with
ventilation (a: east wall; b: west wall; c: north wall) [36].

94
In [37] and [64], Kuznik and Virgone did the PCM experiments in a small scale test cell
MICROBAT (Figure 4.7) and examined the PCM influence and impact with respect to the
change of conditions in the climatic chamber. Different from the MINIBAT experiment, the test
cell MICROBAT was completely placed inside the climatic chamber. There are some
differences between the experiments described in [37] and [64], even if they all utilize
MICROBAT test cells in the experiments:
The first difference is the “active face” which is used to enhance the heat transfer between
the exterior and interior of the test cell. In [37], the active face is a 2 mm thick aluminum
plate, while in [64] it uses glazing as the active face. With the opaque thin aluminum plate
in [37], it could only test the reaction with respect to temperature evolutions, but with the
transparent glazing active face in [64], the reaction of PCM wallboard with respect to the
radiated solar radiation (or artificial solar radiation) could additionally be tested.
The second difference is the dimensions. The dimension of MICROBAT test cell in [37] is 30.5 0.5 0.5 m× × , while it is 30.62 0.62 0.62 m× × in [64].
The third difference is the number of modified PCM faces in the test cell with PCM. In [64],
all the faces except the active glazing face are modified with PCM layer, while in [37] only
left, right and back faces are modified.
The fourth difference is the composition of the PCM modified face. Figure 4.8 and Figure
4.9 are the schematics of the wallboard composition with or without PCM, in [37] and [64],
respectively. From Figure 4.8, we can see that the PCM layer of modified face is directly
exposed to the interior air, whereas from Figure 4.9, it has been shown that the PCM layer
is installed between the layers of insulation material and plaster instead of directly
contacting with air. Strictly, it is recommended that the PCM wallboard should be
constructed in the way as what has been shown in Figure 4.9, because very few
applications would directly expose the PCM layer to the air.
The basic principle of the climatic chamber is the same as the one described in the
aforementioned full scale test room MINIBAT. The temperature evolutions in the climatic
chamber in [37] have two types of profiles: temperature step (heating or cooling) or sinusoidal
evolution. On the other hand, in [64], there is only one type of generated temperature evolution
“heating step”, but since its active face is glazing, the condition under solar radiative effects
was also tested. The testing results from [37] and [64] show that an obvious time lag between
the interior and exterior temperature evolutions was caused by the installation of PCM panels
95
into the wallboard structure. Moreover, with PCM wallboard, the interior temperature
fluctuations were attenuated compared to the exterior temperature. Based on the τ value
suggested by Kuznik and Virgone in [37], they also found that the more rapid the thermal
excitation (step heating/cooling, external sinusoidal temperature) was, the more efficient the
PCM would be. Some numerical analyses have also been done by Kuznik and Virgone in [37].
They found that the testing results of heating/cooling steps are in well accordance with the
numerical modeling using the specific heat curves of PCM. Nevertheless, they are not in
accordance with the case of sinusoidal temperature evolution, which is possibly due to the
effect of hysteresis [37, 64].
In Kuznik and Virgone’s experiments with full scale test room MINIBAT in [36, 66], there are
several problems worth consideration. Firstly, the configuration of MINIBAT is such that the
climatic chamber is directly attached to the active glazing face of test cell 1 (Figure 4.1). The
good heat transfer characteristic of the glazing wall determines that the climatic chamber
directly influence the temperature evolution inside test cell 1, and then the PCM wallboard will
react to the variation of indoor temperature and thereafter exert the influence on indoor
condition. As the thermal guard guarantees a constant temperature at the other side of the PCM
wallboard, it actually means that the whole MINIBAT can only test the performance of PCM
wallboard with respect to the temperature change inside the room. However, in reality, it is very
rare that an entire exterior wall exposed to the outdoor environment is substituted by glazing.
Generally, the glazing, such as window, only constitutes a small portion of the exterior wall of
the building. Therefore, if the glazing in MINIBAT can be replaced by a PCM wall with a
normal window on it, then experiments can be used to further test the performance of PCM
wallboard with respect to the temperature evolutions starting from the outdoor environment,
and be much closer to the practical reality. Secondly, although the idea of using thermal guard to
simulate the adjacent room condition is very useful and convenient for the later analysis, it is
not always the case that the adjacent rooms will remain at a constant temperature, and it is more
common that the temperature in the adjacent rooms also presents a fluctuated evolution. This
problem is related and similar with the first one, where only one side of PCM wallboard has
been considered. It is worthy to further consider the performance of PCM wallboard when the
condition of the other side of the room wall has also been taken into account.
Kuznik and Virgone’s experiments with small scale test cell MICROBAT in [37, 64], however,
can test the performance of PCM wallboards when conditions on both sides of the wall have
96
been taken into account. This is because the whole test cell has been placed inside the climatic
chamber instead of only one face. Nevertheless, the utilization of “active face” (thin aluminum
plate in [37], glazing in [64]) leaves MICROBAT with a similar problem as MINIBAT, where
“active face” significantly enhances the heat exchange between the interior and exterior of the
test cell. The purpose of this configuration is to test the reaction and influence of PCM
wallboards on the interior temperature evolution, but this arrangement of active face is
obviously not the common case in practical buildings. It might be better to simulate the
practical case that the active face was substituted by another PCM wallboard (could be with a
small fraction of active surface on it). Furthermore, the reduced test space of MICROBAT
makes the results be more or less deviated from reality.
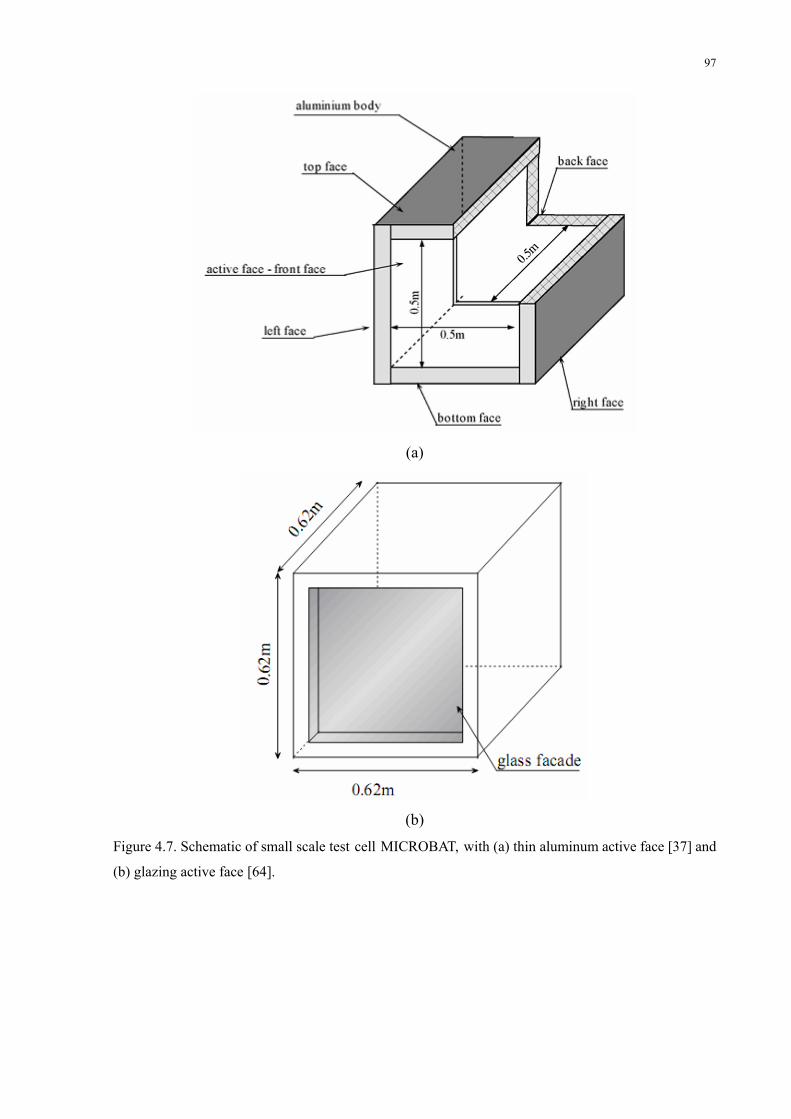
97
(a)
(b)
Figure 4.7. Schematic of small scale test cell MICROBAT, with (a) thin aluminum active face [37] and
(b) glazing active face [64].

98
Figure 4.8. Composition of the face wallboard with and without PCM in reference [37].
Figure 4.9. Composition of the face wallboard with and without PCM in reference [64].
Liu and Awbi also used DupontTM Energain® panel in their experiments [67]. Besides
examining the influence of PCM wallboard on the interior wall surface temperatures, the
influences on the heat flux, heat conductive loss and natural convection coefficient were also
investigated and analysed. Therefore, this experiment done by Liu and Awbi in [67] can be
considered as a very good supplement to the PCM experiments done by Kuznik and Virgone in
[36, 66]. The test rig is a full scale test room consisting of a cool chamber and a main working
chamber, as shown in Figure 4.10. It is a bit similar with the full scale test room MINIBAT in
[36] (Figure 4.1): the “cool chamber” in Figure 4.10 is comparable to the “climatic chamber” in
Figure 4.1, while the main working chamber is comparable to test cell 1. However, there are
still several differences between this test rig and MINIBAT. First, the location of the PCM
modified wall is different. In this test rig, only the back wall (marked as “Wall 5” in Figure 4.10)
is modified with PCM layer. Second, five heating plates have been attached to the right wall
(marked as “Wall 2” in Figure 4.10) to provide one of the two ways (the other way is to turn on
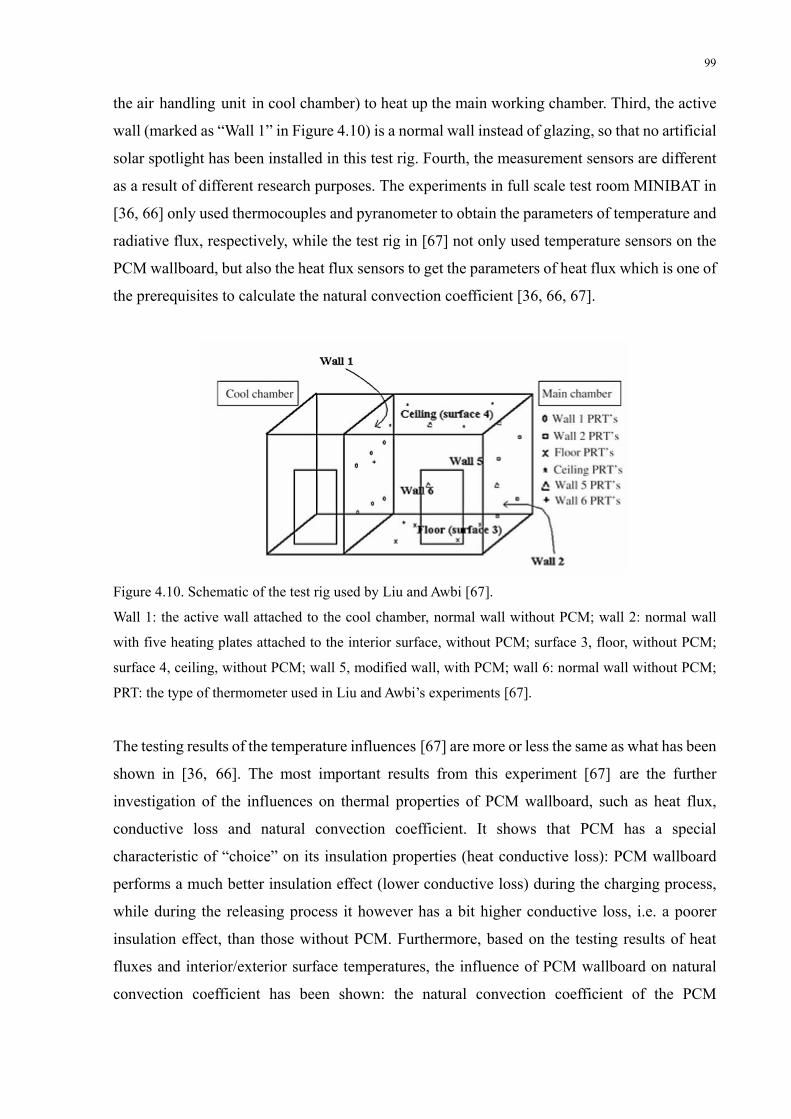
99
the air handling unit in cool chamber) to heat up the main working chamber. Third, the active
wall (marked as “Wall 1” in Figure 4.10) is a normal wall instead of glazing, so that no artificial
solar spotlight has been installed in this test rig. Fourth, the measurement sensors are different
as a result of different research purposes. The experiments in full scale test room MINIBAT in
[36, 66] only used thermocouples and pyranometer to obtain the parameters of temperature and
radiative flux, respectively, while the test rig in [67] not only used temperature sensors on the
PCM wallboard, but also the heat flux sensors to get the parameters of heat flux which is one of
the prerequisites to calculate the natural convection coefficient [36, 66, 67].
Figure 4.10. Schematic of the test rig used by Liu and Awbi [67].
Wall 1: the active wall attached to the cool chamber, normal wall without PCM; wall 2: normal wall
with five heating plates attached to the interior surface, without PCM; surface 3, floor, without PCM;
surface 4, ceiling, without PCM; wall 5, modified wall, with PCM; wall 6: normal wall without PCM;
PRT: the type of thermometer used in Liu and Awbi’s experiments [67].
The testing results of the temperature influences [67] are more or less the same as what has been
shown in [36, 66]. The most important results from this experiment [67] are the further
investigation of the influences on thermal properties of PCM wallboard, such as heat flux,
conductive loss and natural convection coefficient. It shows that PCM has a special
characteristic of “choice” on its insulation properties (heat conductive loss): PCM wallboard
performs a much better insulation effect (lower conductive loss) during the charging process,
while during the releasing process it however has a bit higher conductive loss, i.e. a poorer
insulation effect, than those without PCM. Furthermore, based on the testing results of heat
fluxes and interior/exterior surface temperatures, the influence of PCM wallboard on natural
convection coefficient has been shown: the natural convection coefficient of the PCM
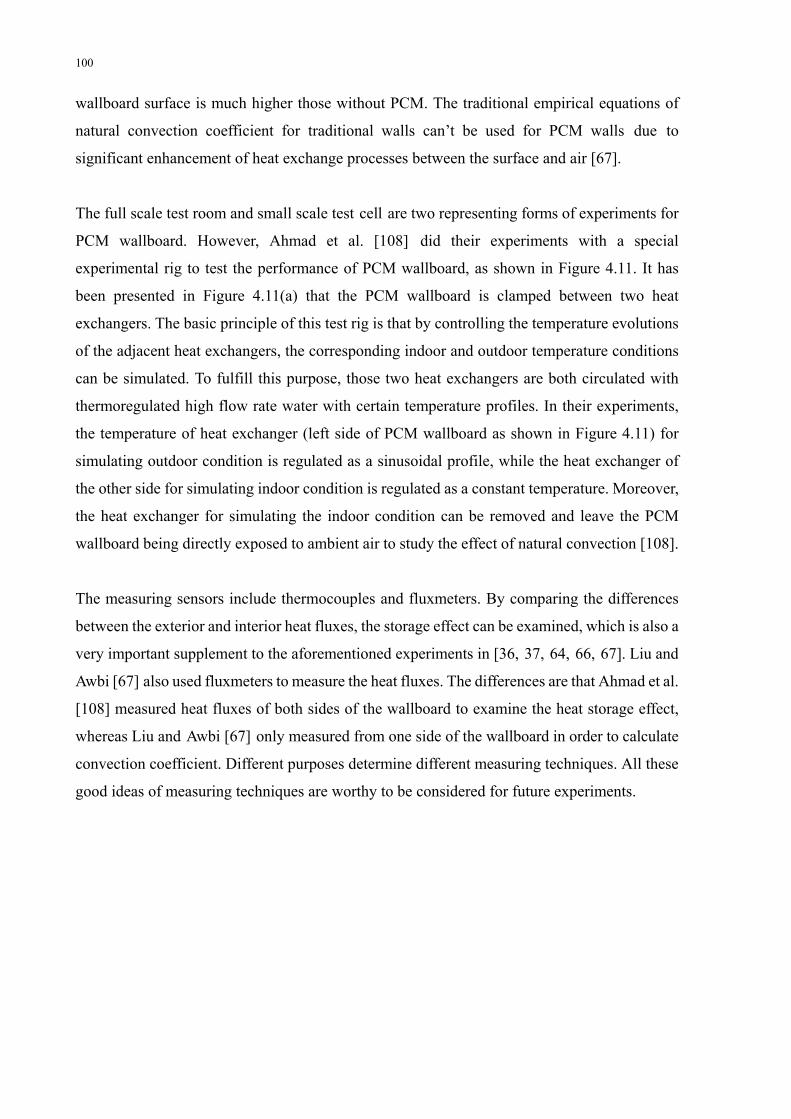
100
wallboard surface is much higher those without PCM. The traditional empirical equations of
natural convection coefficient for traditional walls can’t be used for PCM walls due to
significant enhancement of heat exchange processes between the surface and air [67].
The full scale test room and small scale test cell are two representing forms of experiments for
PCM wallboard. However, Ahmad et al. [108] did their experiments with a special
experimental rig to test the performance of PCM wallboard, as shown in Figure 4.11. It has
been presented in Figure 4.11(a) that the PCM wallboard is clamped between two heat
exchangers. The basic principle of this test rig is that by controlling the temperature evolutions
of the adjacent heat exchangers, the corresponding indoor and outdoor temperature conditions
can be simulated. To fulfill this purpose, those two heat exchangers are both circulated with
thermoregulated high flow rate water with certain temperature profiles. In their experiments,
the temperature of heat exchanger (left side of PCM wallboard as shown in Figure 4.11) for
simulating outdoor condition is regulated as a sinusoidal profile, while the heat exchanger of
the other side for simulating indoor condition is regulated as a constant temperature. Moreover,
the heat exchanger for simulating the indoor condition can be removed and leave the PCM
wallboard being directly exposed to ambient air to study the effect of natural convection [108].
The measuring sensors include thermocouples and fluxmeters. By comparing the differences
between the exterior and interior heat fluxes, the storage effect can be examined, which is also a
very important supplement to the aforementioned experiments in [36, 37, 64, 66, 67]. Liu and
Awbi [67] also used fluxmeters to measure the heat fluxes. The differences are that Ahmad et al.
[108] measured heat fluxes of both sides of the wallboard to examine the heat storage effect,
whereas Liu and Awbi [67] only measured from one side of the wallboard in order to calculate
convection coefficient. Different purposes determine different measuring techniques. All these
good ideas of measuring techniques are worthy to be considered for future experiments.
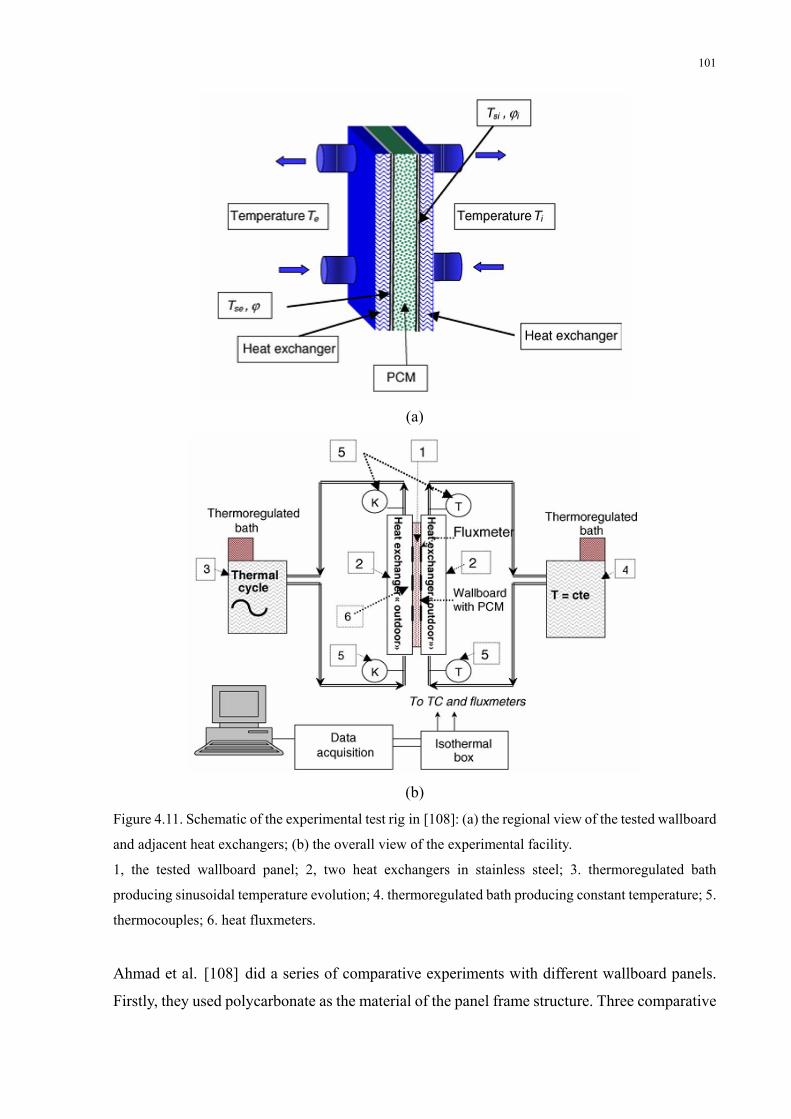
101
(a)
(b)
Figure 4.11. Schematic of the experimental test rig in [108]: (a) the regional view of the tested wallboard
and adjacent heat exchangers; (b) the overall view of the experimental facility.
1, the tested wallboard panel; 2, two heat exchangers in stainless steel; 3. thermoregulated bath
producing sinusoidal temperature evolution; 4. thermoregulated bath producing constant temperature; 5.
thermocouples; 6. heat fluxmeters.
Ahmad et al. [108] did a series of comparative experiments with different wallboard panels.
Firstly, they used polycarbonate as the material of the panel frame structure. Three comparative

102
experiments were conducted with this polycarbonate panel depending on different filling
materials within the panel: empty panel, panel filled with paraffin granulates, and panel filled
with polyethylene glycol (PEG 600). Secondly, one more comparative experiment was done
with Polyvinyl Chloride (PVC) as the material of the panel frame structure, and this PVC panel
was filled with polyethylene glycol (PEG 600). The testing results present some characteristics
of different PCM wallboard panels [108]. First, when polycarbonate panel is filled with paraffin
granulates, the damping effect of temperature evolution is not so obvious, but the thermal
storage effect can be noticed, compared to the results with empty panel. Second, with
polycarbonate panel filled with PEG 600, both the damping effects of temperature evolution
and storage effect of thermal energy can be clearly noticed. The shortage of PEG 600 filled
polycarbonate panel is that some separate liquid zones may crack the panel wall during
liquefaction process [108].
Comparing Ahmad et al.’s experiments [108] with other experiments in small scale test cell or
full scale test room, we can see the disadvantages and advantages of the test rig shown in Figure
4.11. The conditions simulated in full scale test room and small scale hot box are much closer to
practical application situations than the test rig in Figure 4.11. Although the test rig in Figure
4.11 can use the temperature evolution of flowing water to simulate the indoor and outdoor
conditions, the heat transfer principles are far from the practical reality. In real PCM wallboard
applications, the thermal properties (of indoor / outdoor air) and the convection coefficient
(between the wallboard surface and air) are all different from those of test rig in Figure 4.11
where flowing water and heat exchangers are substituting. However, the test rig in Figure 4.11
can further simulate many special temperature evolutions which is hard to realize in test cells or
full scale test rooms, thus it can be used for simulating some unique purposes for PCM panels,
for example in the field of aeronautics and astronautics.

103
Figure 4.12. Schematic of small scale test cell with solar radiation [65].
As a follow-up study of the experiments done in [108], Ahmad et al. did a series of comparative
experiments in the small scale test cell with and without PCM in the outdoor environment
(Figure 4.12) [65].The wallboard of PCM test cell utilized a structure coupling PCM (PEG 600)
panel with a vacuum insulation panel (VIP). Here, the frame structure of PCM panel used PVC
instead of polycarbonate as its material to avoid cracks during liquefaction. The composition of
the wallboard with and without PCM panel in the small scale test cell has been shown in Figure
4.13. Similar as the measuring techniques utilized in [108], thermocouples and fluxmeters were
both installed in the wallboard (as shown in Figure 4.14) to measure the temperature and heat
flux evolutions, respectively. Different from the experiments with small scale test cell
MICROBAT done by Kuznik and Virgone [37, 64], the test cell in Ahmad et al.’s experiments
[65] was located in the outdoor environment instead of the artificial climatic chamber.
Therefore, the influences of PCM wallboard on the real climatic condition under both
temperature and solar radiation evolutions could be examined. The test results measured from
thermocouples and fluxmeters show that, with PCM wallboards, the attenuation effect of
interior temperature fluctuations and storage / release effect of (solar) thermal energy are much
more obvious than those without PCM. In other words, the utilization of PCM in the wallboard
significantly increases the thermal inertia of the test cell envelope without increasing too much
thickness. And these results are very important for both building application and solar thermal
storage development [65].

104
(a)
(b)
Figure 4.13. (a) Composition of the PCM wallboard [108]. 1, plywood; 2, PVC. (b) The cross section
view of the wallboards in small scale test cell with and without PCM panel [65].
Figure 4.14. Location of measuring sensors in the wallboard (also suitable for wallboard without PCM
layer) [65].
Te Ti

105
4.2 Overview of the experiments
As part of the ZEB project, my experimental work with the PCM integrated wall was
conducted in the NTNU/SINTEF Building and Infrastructure Laboratory. The main purposes
of these experiments include:
examine the influence on the temperatures and (temperature) stratifications of the
metering box air and interior surface of the tested wall by the convective condition and
attachment of PCM layer;
examine the influence on the heat fluxes and the energy storage effect of the tested wall
by attachment of PCM layer;
examine the influence on the stratifications of heat fluxes through the tested wall by
attachment of PCM layer;
examine the influence on the mean heat conductive loss of the tested wall by convective
condition and attachment of PCM layer;
examine the influence on the convection coefficient of the interior surface of the tested
wall by convective condition and attachment of PCM layer;
examine the energy saving effect by attachment of PCM layer and convective condition;
compare the experimental temperature evolutions at different layers of the tested wall
with the computational simulation results.
In Section 4.3, the structures and operating principles of the test rig will be described, and
thereafter in Section 4.4 the configurations of the tested wall will be introduced in detail.
Furthermore, the measurement devices and experimental procedure will be carefully stated in
Section 4.5 and 4.6, respectively. In the end, the experimental results will be presented and
systematically analysed in Section 4.7.
4.3 Descriptions of the test rig
The test rig used in experiments is in accordance with ISO 8990:1994 [109] and ISO
12567-1:2000 [110]. A brief schematic of the test rig with the tested specimen is shown in
Figure 4.15. The test rig is composed of two boxes: box 1 and box 2. Box 2 is normally called
“cold box” which acts as the climatic chamber. This climatic chamber has been equipped with
refrigeration system and fans to provide the required temperature. Moreover, heating elements

106
have also been attached to the evaporator coils inside the climatic chamber to defrost the ice if
necessary. During the testing, the temperature in the climatic chamber will be kept at a
constant value around -20 ºC.
Figure 4.15. Schematic of the test rig with the tested specimen.

107
Figure 4.16. The dimensions of the metering box.
Figure 4.17. The dimensions of the climatic chamber (cold box).
In Figure 4.15, box 1 is called “hot box” which comprises a metering box. The metering box
functions as the main test cell that is equipped with two heaters and a fan (as shown in Figure
4.15). Heater 1 is used as an automatic thermostat to guarantee the temperature inside the

108
metering box won’t drop below 20 ºC; heater 2 is an electrical heater that provides constant
heating power when turned on. The fan can be used to generate air circulations inside the
metering box, whose electrical power with corresponding air velocities over the tested wall
have been shown in Table 4.2. Since the fan is completely inside the metering box, it can be
assumed that all the electrical power driving the fan will be converted into another heating
source. The metering box is surrounded by a thermal guard. The heating element in the
thermal guard is controlled by a feedback system to maintain the air temperature inside the
thermal guard identical to that of the air in the metering box, so that no or limited heat flux
will pass through the metering box wall. In this way, according to the energy balance, during
the steady-state condition, the heat generated from the heater sources inside the metering box
will be equal to the heat flowing through the tested wall.
Table 4.2. The air velocities generated by the fan and the corresponding electrical power.
Air velocity (m/s) Electrical power (W)
0 0
0.1 9.5~10.0
0.2 29.5~30.5
0.3 66.6~67.6
0.4 90.0~91.0

109
Figure 4.18. A photo of the test rig with the tested specimen in the laboratory.
The baffle in Figure 4.15 over the interior or exterior surface of the tested wall is used to
achieve a more evenly distributed air flow [109] over the tested wall, to better control the
convective heat transfer over the interior or exterior surface, and to shield the radiative thermal
effects from most of other surfaces in the corresponding chamber. From the analysis of heat
transfer processes, since the baffle is parallel to the interior or exterior surface, the radiative
heat flux between those two parallel surfaces can be easier to calculate. Therefore, the
convective heat flux through the tested wall will be obtained more accurate than without the
baffle. The dimensions of the metering box and climatic chamber are shown in Figure 4.16
and Figure 4.17, respectively, while Figure 4.18 is a photo of the test rig taken in the
laboratory.

110
4.4 Test wall configurations
The commercial PCM product used in the experiment is DupontTM Energain® PCM panel [35].
As introduced in Section 4.1, the main constitution of this product is 60%
molecularencapsulated paraffin wax within a copolymer [35]. The thermophysical properties
have already been listed in Table 4.1. Since contradictions of thermal conductivities in the
solid and liquid phases were found between [35] and [36, 37, 64, 66], I contacted Dupont
company and got the reply that the recommended average thermal conductivity of the product
is 0.18 W/m·K. Thus, I use 0.18 W/m·K as the value for its thermal conductivity in both solid
and liquid phases. The specific heat capacity ( pc )-temperature (T) curve of this product used
in this thesis is based on the results from the CSTB report [111] provided by Dupont company,
and has been shown in Figure 4.19. The hysteresis effect [37] during the heating and cooling
processes is neglected, and the pc -T curve shown in Figure 4.19 is based only on the DSC
measurements with a heating rate of 0.05 ºC/min. The corresponding specific enthalpy
(h)-temperature (T) curve based on pc -T curve has been shown in Figure 4.20. The width and
length of this DupontTM Energain® PCM panel are 1000 mm and 1198 mm, respectively,
while the thickness is 5.26 mm [35]. A photo taken after the PCM panels attaching to the
vapor barrier surface is shown in Figure 4.21.
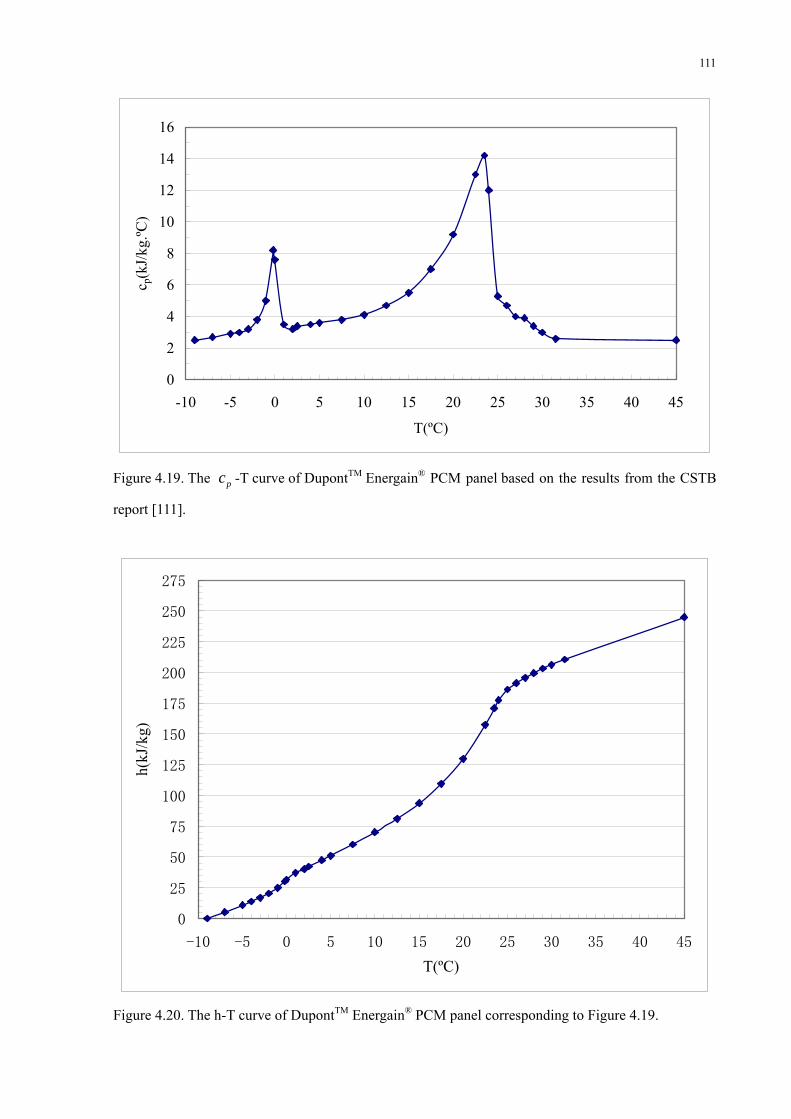
111
0
2
4
6
8
10
12
14
16
-10 -5 0 5 10 15 20 25 30 35 40 45
T(ºC)
c p(k
J/kg
.ºC)
Figure 4.19. The pc -T curve of DupontTM Energain® PCM panel based on the results from the CSTB
report [111].
0
25
50
75
100
125
150
175
200
225
250
275
-10 -5 0 5 10 15 20 25 30 35 40 45
T(ºC)
h(kJ
/kg)
Figure 4.20. The h-T curve of DupontTM Energain® PCM panel corresponding to Figure 4.19.
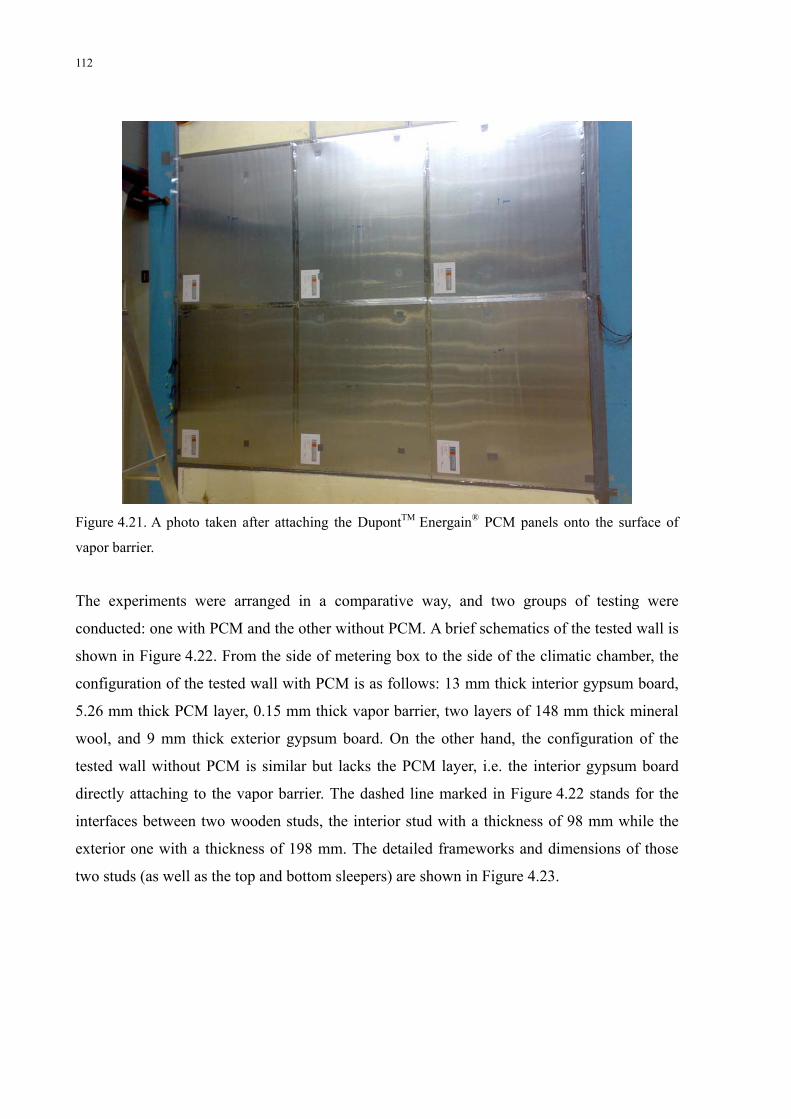
112
Figure 4.21. A photo taken after attaching the DupontTM Energain® PCM panels onto the surface of
vapor barrier.
The experiments were arranged in a comparative way, and two groups of testing were
conducted: one with PCM and the other without PCM. A brief schematics of the tested wall is
shown in Figure 4.22. From the side of metering box to the side of the climatic chamber, the
configuration of the tested wall with PCM is as follows: 13 mm thick interior gypsum board,
5.26 mm thick PCM layer, 0.15 mm thick vapor barrier, two layers of 148 mm thick mineral
wool, and 9 mm thick exterior gypsum board. On the other hand, the configuration of the
tested wall without PCM is similar but lacks the PCM layer, i.e. the interior gypsum board
directly attaching to the vapor barrier. The dashed line marked in Figure 4.22 stands for the
interfaces between two wooden studs, the interior stud with a thickness of 98 mm while the
exterior one with a thickness of 198 mm. The detailed frameworks and dimensions of those
two studs (as well as the top and bottom sleepers) are shown in Figure 4.23.

113
Gypsum Board
Stud 1Stud 2
top sleeperGypsum Board
bottom sleeper
Vapor barrier
Mineral wool
(a)
Gypsum Board
PCM layer Stud 1
Stud 2
top sleeperGypsum Board
bottom sleeper
Vapor barrier
Mineral wool
(b)
Figure 4.22. Configurations of (a) the tested wall without PCM and (b) the tested wall with PCM. (unit
in mm)
Metering box
Climatic chamber
Metering box
Climatic chamber

114
(a)
(b)
Figure 4.23. The detailed frameworks and dimensions of (a) stud 1 and (b) stud 2 with the sleepers. The
dashed line in figure stands for the area of the metering chamber. (Unit in mm)

115
4.5 Measurement devices
The thermocouples used in our test rig are type T30/2/506 made by Gordon with an accuracy
of ±0.1 ºC, while the heat flux meters are type PU_43T made by Hukseflux with an accuracy
of ±5%. The data logging system of Orchestrator was used to monitor and collect the
temperature and heat flux data per 10 minutes. The thermocouples and heat flux meters were
distributed in different layers of the tested wall and the hot boxes. The detailed positions and
dimensions of the thermocouples and heat fluxes at different layers of the tested wall,
metering box and climatic box have been presented in Figure 4.24 to Figure 4.31. In addition,
one air velocity meter Type AVM501TC made by Prosser Scientific Instruments Ltd. was
used to measure the air velocity over the interior surface of the tested wall. This air velocity
was near the position of thermocouple “TC266” (Figure 4.24).
TC277
TC278
TC279
TC261
TC265
TC266
TC267
TC268
TC269
TC270
HFM024
HFM025
HFM155
TC264
TC262
TC280
TC263
Figure 4.24. Positions of the thermocouples and heat flux meters on the surface of the interior gypsum
board (seen from the hot side).
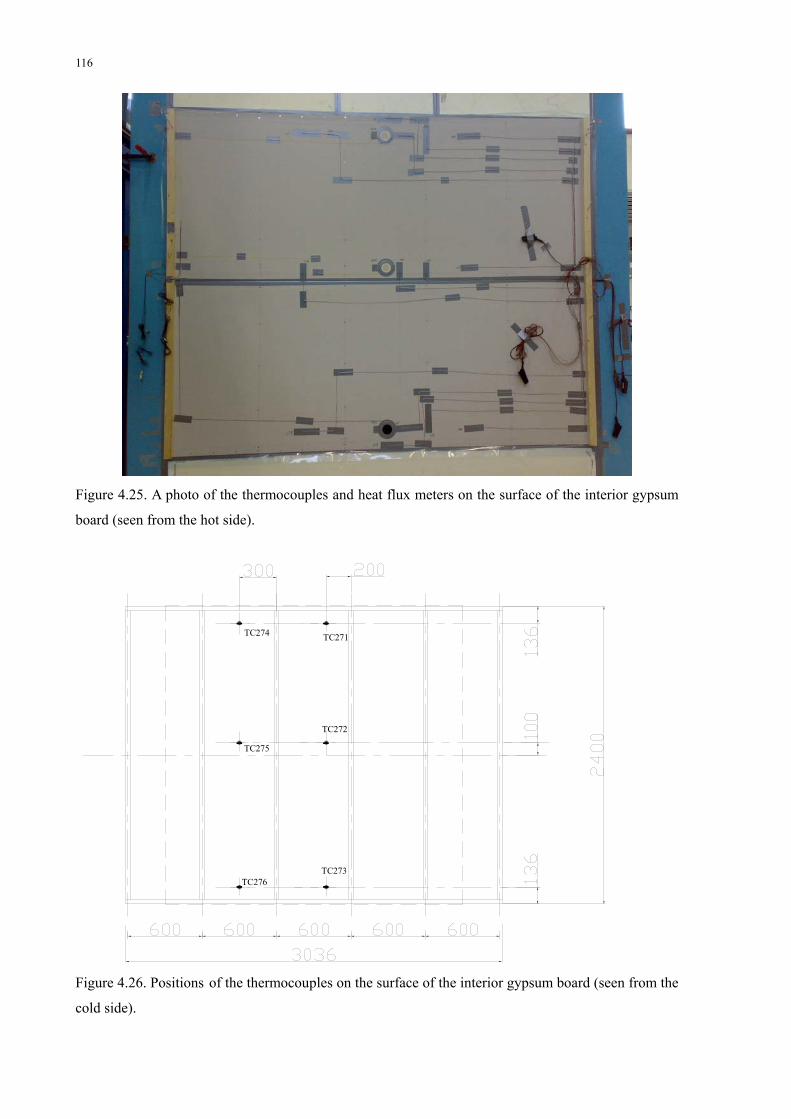
116
Figure 4.25. A photo of the thermocouples and heat flux meters on the surface of the interior gypsum
board (seen from the hot side).
TC274
TC275
TC276
TC271
TC272
TC273
Figure 4.26. Positions of the thermocouples on the surface of the interior gypsum board (seen from the
cold side).

117
TC297
TC298
TC299
TC300
HFM156
HFM157
HFM158
Figure 4.27. Positions of the thermocouples and heat flux meters on the surface of the vapor barrier
(seen from the hot side).
TC294
TC295
TC296
TC291
TC292
TC293
Figure 4.28. Positions of the thermocouples between the interface of two layers of mineral wools, 148
mm to the surface of the vapor barrier (seen from the hot side).

118
TC288
TC289
TC290
TC281
TC285
TC286
TC287
TC284
TC282
TC283
Figure 4.29. Positions of the thermocouples on the surface of the exterior gypsum board (seen from the
cold side).

119
Figure 4.30. Positions of the thermocouples for the measurements of air and baffle surface in the
metering box. The distance from the thermocouples for air measurements to the baffle surface is 100
mm.

120
Figure 4.31. Positions of the thermocouples for the measurements of air and baffle surface in the
climatic box. The distance from the thermocouples for air measurements to the baffle surface is 60
mm.
4.6 Experimental procedure
As mentioned above, the experiments were arranged in a comparative way. Two groups of
testing for the tested wall with and without PCM were successively conducted. Under both
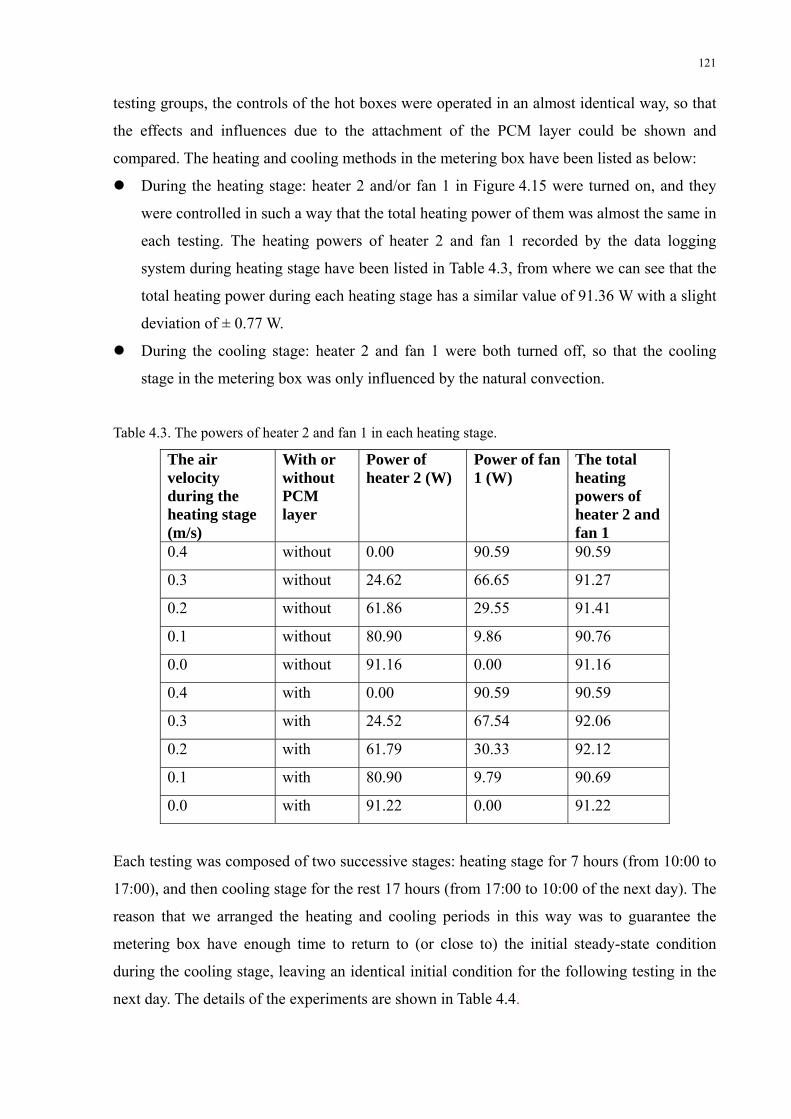
121
testing groups, the controls of the hot boxes were operated in an almost identical way, so that
the effects and influences due to the attachment of the PCM layer could be shown and
compared. The heating and cooling methods in the metering box have been listed as below:
During the heating stage: heater 2 and/or fan 1 in Figure 4.15 were turned on, and they
were controlled in such a way that the total heating power of them was almost the same in
each testing. The heating powers of heater 2 and fan 1 recorded by the data logging
system during heating stage have been listed in Table 4.3, from where we can see that the
total heating power during each heating stage has a similar value of 91.36 W with a slight
deviation of ± 0.77 W.
During the cooling stage: heater 2 and fan 1 were both turned off, so that the cooling
stage in the metering box was only influenced by the natural convection.
Table 4.3. The powers of heater 2 and fan 1 in each heating stage.
The air velocity during the heating stage (m/s)
With or without PCM layer
Power of heater 2 (W)
Power of fan 1 (W)
The total heating powers of heater 2 and fan 1
0.4 without 0.00 90.59 90.59
0.3 without 24.62 66.65 91.27
0.2 without 61.86 29.55 91.41
0.1 without 80.90 9.86 90.76
0.0 without 91.16 0.00 91.16
0.4 with 0.00 90.59 90.59
0.3 with 24.52 67.54 92.06
0.2 with 61.79 30.33 92.12
0.1 with 80.90 9.79 90.69
0.0 with 91.22 0.00 91.22
Each testing was composed of two successive stages: heating stage for 7 hours (from 10:00 to
17:00), and then cooling stage for the rest 17 hours (from 17:00 to 10:00 of the next day). The
reason that we arranged the heating and cooling periods in this way was to guarantee the
metering box have enough time to return to (or close to) the initial steady-state condition
during the cooling stage, leaving an identical initial condition for the following testing in the
next day. The details of the experiments are shown in Table 4.4.
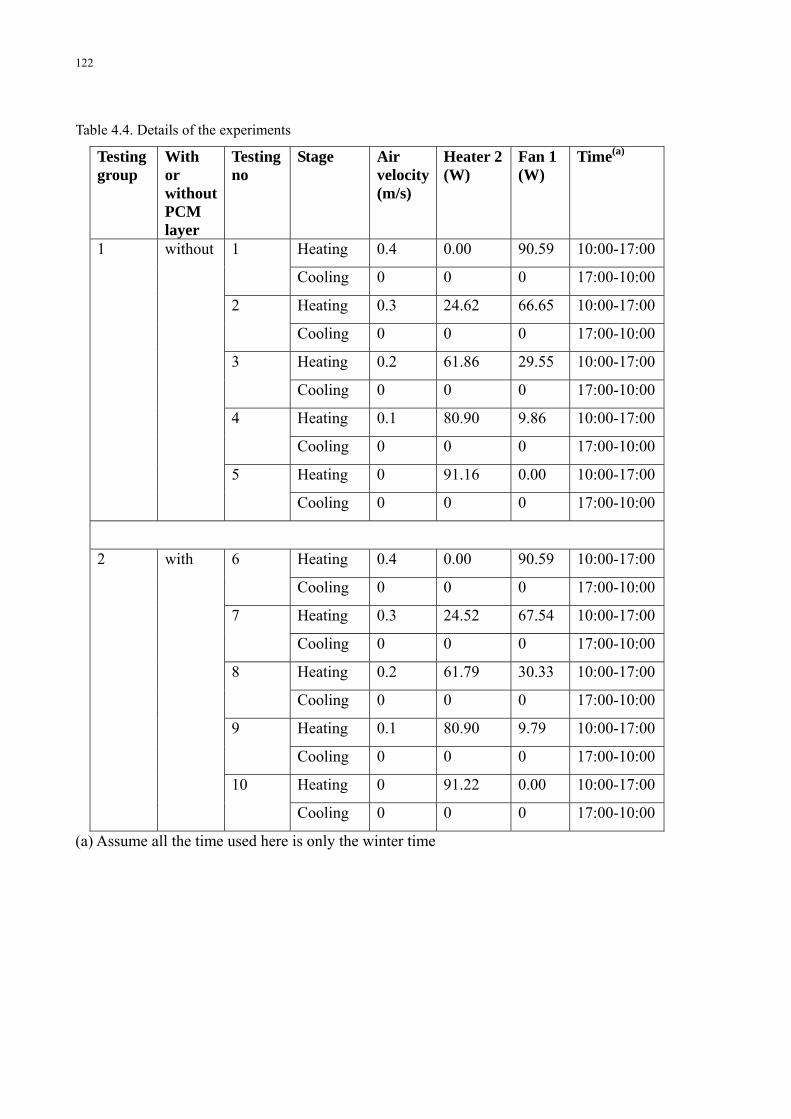
122
Table 4.4. Details of the experiments
Testing group
With or without PCM layer
Testing no
Stage Air velocity(m/s)
Heater 2(W)
Fan 1 (W)
Time(a)
Heating 0.4 0.00 90.59 10:00-17:001
Cooling 0 0 0 17:00-10:00
Heating 0.3 24.62 66.65 10:00-17:002
Cooling 0 0 0 17:00-10:00
Heating 0.2 61.86 29.55 10:00-17:003
Cooling 0 0 0 17:00-10:00
Heating 0.1 80.90 9.86 10:00-17:004
Cooling 0 0 0 17:00-10:00
Heating 0 91.16 0.00 10:00-17:00
1 without
5
Cooling 0 0 0 17:00-10:00
Heating 0.4 0.00 90.59 10:00-17:006
Cooling 0 0 0 17:00-10:00
Heating 0.3 24.52 67.54 10:00-17:007
Cooling 0 0 0 17:00-10:00
Heating 0.2 61.79 30.33 10:00-17:008
Cooling 0 0 0 17:00-10:00
Heating 0.1 80.90 9.79 10:00-17:009
Cooling 0 0 0 17:00-10:00
Heating 0 91.22 0.00 10:00-17:00
2 with
10
Cooling 0 0 0 17:00-10:00
(a) Assume all the time used here is only the winter time
123
4.7 Experimental results and analysis
4.7.1 Air and surface temperatures in the metering box
The surface temperature described in this Section 4.7.1 only refers to the interior surface
temperature of the tested wall, i.e. the surface temperature of the gypsum board. Figure 4.32
shows the (weighted) mean temperature of the metering box air and the interior surface of the
tested wall. The calculation of the (weighted) mean temperature is based on the methods
described in ISO 8990:1994 [109]. From Figure 4.32, several important characteristics of the
tested wall with/without PCM layer under different conditions can be concluded: first, the
attenuation effect of the mean air and interior surface temperatures by the attachment of PCM
panels is very obvious. The maximum temperatures during each test were reached by the end
of the heating stage at 17:00, and it has been shown in Figure 4.32 that, compared with the
condition without PCM layer, the maximum temperatures of air and surface were almost
decreased by an amount of 2 ºC. Second, the time lag effect during the cooling period for the
air temperature to return to 20 ºC was seen in each test. During the 10th test, the longest time
lag of about 120 min could be noticed from the results. Similar phenomenon could be found
for the interior surface temperature of the tested wall. Third, it is easier to see that the higher
the air velocity over the interior surface during the heating stage, the lower the maximum air
and surface temperatures would be by the end of the heating stage. This is because the higher
the air velocity, the more effective the heat exchanging process between the air and the tested
wall would be; this point will be discussed later in Section 4.7.6.
Fourth, from Figure 4.32, we can see that the air temperature presents a quasi linear increase
profile during the heating stage without PCM layer. However, with PCM, the increase rate of
the air temperature was continuously decreased during the heating stage especially after the
air temperature reached 22 ºC. On the other hand, during the cooling stage, the air temperature
presents a quasi linear decrease profile without PCM, whereas the decrease rate was slowed
down with PCM. The reason of this phenomenon was mainly due to the phase change
processes. This means that during the phase change processes of the PCM layer, the heat
exchange between the interior air and tested wall was significantly enhanced, resulting in the
slowing down of the increase or decrease rate of the air temperature in the metering box. This

124
effect was very obvious when the air temperature in the metering box was between 22-24 ºC,
as the phase change processes mainly happened during this period.
Fifth, it has been depicted in Figure 4.32 that the temperature difference between the metering
box air and surface temperature of the tested wall with PCM layer was larger than that
without PCM, especially during the heating stage. Some factors may cause this phenomenon.
When the PCM layer underwent the phase change processes, the temperature of the PCM
layer would be increased at a much lower rate than the air temperature in the metering box. In
this way, the gypsum board would be influenced by the PCM layer so that the increase rate of
the surface temperature would be also lower than that of the air. On the other hand, without
PCM layer, the gypsum board was directly attached with the traditional thermal insulation
materials-“vapor barrier and the mineral wools”. Thus, the lack of phase change processes of
the traditional insulation materials and the lower heat flow rate through the gypsum board
would make the temperature increase rate of the interior surface similar as that of the air.

125
18
18,519
19,5
20
20,521
21,5
22
22,523
23,5
24
24,525
25,5
26
26,527
27,5
10:0
2:29
14:0
2:29
18:0
2:29
22:0
2:29
2:02
:29
6:02
:29
10:0
2:29
14:0
2:29
18:0
2:29
22:0
2:29
2:02
:29
6:02
:29
10:0
2:29
14:0
2:29
18:0
2:29
22:0
2:29
2:02
:29
6:02
:29
10:0
2:29
14:0
2:29
18:0
2:29
22:0
2:29
2:02
:29
6:02
:29
10:0
2:29
14:0
2:29
18:0
2:29
22:0
2:29
2:02
:29
6:02
:29
time
tem
pera
ture
(C)
air temperature without PCMair temperature with PCMsurface temperature without PCMsurface temperature with PCM
Figure 4.32. The (weighted) mean temperature evolutions of the metering box air and the interior surface of the tested wall with and without PCM layer
during the experiments.
Heating stage
airv =0.4m/s
Heating stage
airv =0.3m/s
Heating stage
airv =0.2m/s
Heating stage
airv =0.1m/s
Heating stage
airv =0.0m/s
1st and 6th testing 2nd and 7th testing 5th and 10th testing3rd and 8th testing 4th and 9th testing
tem
pera
ture
(ºC
)
126
4.7.2 Temperature stratifications in the metering box
In this section, the temperature stratifications of the metering box air and interior surface of
the tested wall will be discussed. The thermocouples of “TC265”, “TC266” and “TC267” in
Figure 4.24 have been selected for the analysis of the stratifications of interior surface
temperatures, while the thermocouples of “TC238”, “TC240” and “TC242” in Figure 4.30
have been selected for the analysis of the stratifications of air temperatures in the metering
box. The heights of the thermocouples “TC265”, “TC266” and “TC267” to the bottom of the
gypsum board are 2264 mm, 1300 mm, and 136 mm, respectively; the heights of
thermocouples “TC238”, “TC240”, and “TC242” to the bottom of the metering chamber are
2030 mm, 1130 mm, and 200 mm, respectively. The profiles of the surface temperatures at the
points of “TC265”, “TC266” and “TC267” on the interior surface of the tested wall (seen
from the hot side) with and without PCM have been depicted in Figure 4.33, while the profiles
of the air temperatures at the points of “TC238”, “TC240” and “TC242” in the metering
chamber with and without PCM have been presented in Figure 4.37. Furthermore, in order to
compare the stratification effects, the temperature differences of top-middle
(“TC265”-“TC266” for surface, “TC238”-“TC240” for air), middle-bottom
(“TC266”-“TC267” for surface, “TC240”-“TC242” for air), and top-bottom
(“TC265”-“TC267” for surface, “TC238”-“TC242” for air) are shown in Figure 4.34 to
Figure 4.40 (except Figure 4.37).
Several important features of the temperature stratifications with respect to the convective
condition and attachment of PCM layer can be discussed: first, from the testing results, we
can see that stratifications of both air and surface temperatures will be directly influenced by
the air flow rates over the tested wall with and without PCM layer. Generally speaking, as
long as fan 1 (Figure 4.15) is operating, the lower the air flow rate, the higher the temperature
stratifications between different heights will be, as shown in Figure 4.33 to Figure 4.40.
However, the results also present an unusual phenomenon: the stratifications of the surface
temperature during the heating stage under natural convective condition ( airv = 0.0 m/s) were
lower than those under the mechanical convective condition with airv = 0.1 m/s. Nevertheless,
this unusual phenomenon didn’t appear for the stratifications of air temperatures. Considering
this unusual phenomenon, we can conclude that the mechanical convection can reduce the
127
stratifications of the air temperatures in the metering box; whereas for the interior surface
temperatures of the tested wall, we can only say that, as long as the fan is operating, the lower
the generated air flow rate, the higher the stratifications will be. The unusual increase of the
surface temperature stratifications during the natural convective condition in the heating stage
of 10th testing needs more experiments and investigations.
Second, the temperature stratifications with respect to the attached PCM layer are more
complicated than the influence of convective condition, but we can still find several
characteristics: (a) During the steady state condition after the temperature in the metering box
returned to 20 ºC in the ending period of each testing, the attached PCM layer would decrease
the stratifications of both air and surface temperatures; (b) During the unsteady state, i.e.
when the temperature is increasing or decreasing, the attached PCM had a reversed effect on
the surface temperature stratifications (Figure 4.34, Figure 4.35, and Figure 4.36) —the
stratifications were enhanced with PCM. Nevertheless, this reversed effect was almost
negligible for the air temperature stratifications (Figure 4.38, Figure 4.39, and Figure 4.40).
The reason for the reversed effect for the surface temperature might either result from the
asynchronous step of the phase change processes in the PCM panels with different heights, or
result from the unevenly distributed phase change materials in the PCM panels. More
researches are required to be done with it in further experiments.
Third, comparing the differences between the air stratifications and surface stratifications, an
interesting phenomenon could be noticed. As shown in Figure 4.34, Figure 4.35, and Figure
4.36, we can see that the surface temperature stratifications, during the period when there
were heat sources operating in the metering chamber (the heating stage from 10:00-17:00 and
the period in the cooling stage when heater 1 were operating), were normally higher than
those during the period when there were no heat sources operating. Furthermore, the lower the
air velocity, the more enhanced of this phenomenon will be. However, Figure 4.38, Figure
4.39, and Figure 4.40 show that the air stratifications, during the period when there were heat
sources operating in the metering chamber, were reversely lower than those during the period
with no heat sources operating, except under the natural convective condition. Furthermore,
the lower the air velocity, the less obvious the aforementioned phenomenon will be. We can
further deduce that when the air velocity is reduced to a certain value, the air temperature
stratifications during the heat supplying period will be comparable to the period without
heating; when the air velocity continues to decrease, the air temperature stratification during

128
the heat supplying period will be higher than the period without heating, as what has been
shown in the 10th testing of natural convective heating. This means that the air temperature
stratifications are more influenced by the air flow rate than the heat supplying, whereas the
surface temperature stratifications are in the reverse way. This phenomenon is very important
for the improvement of indoor thermal comfort in real applications, with respect to the
optimization of the ventilation and heat producers in the room space.
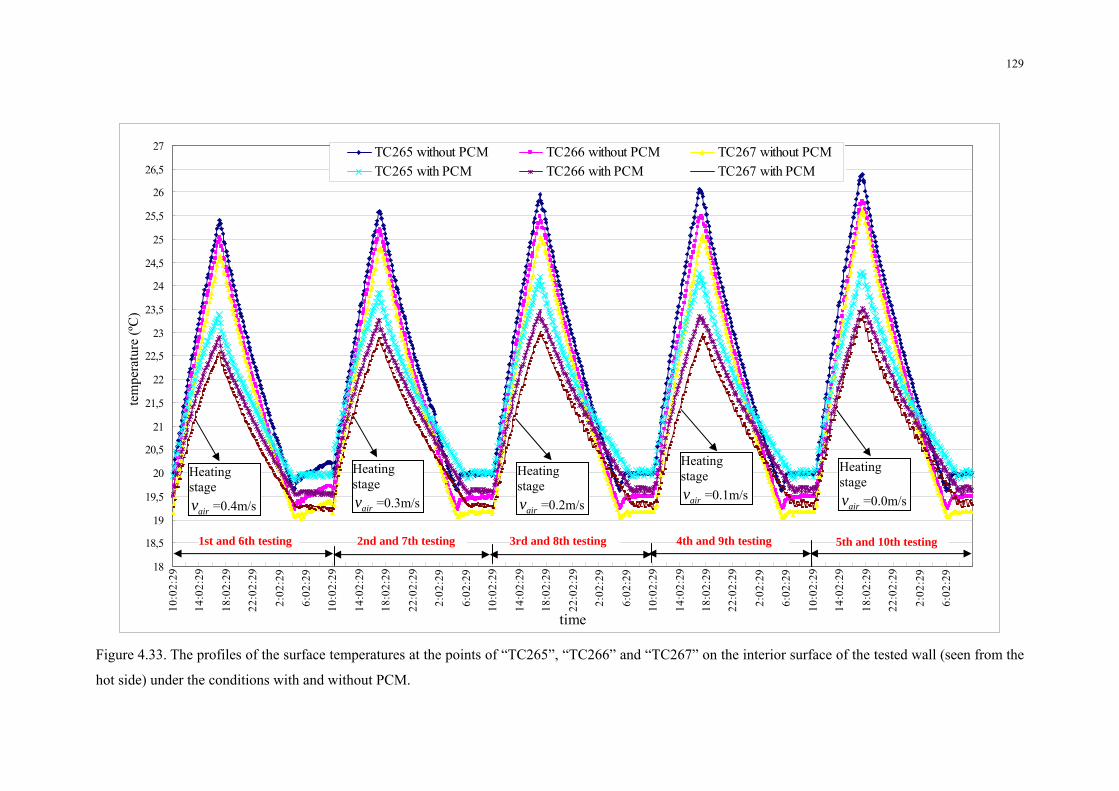
129
18
18,5
19
19,5
20
20,5
21
21,5
22
22,5
23
23,5
24
24,5
25
25,5
26
26,5
27
10:0
2:29
14:0
2:29
18:0
2:29
22:0
2:29
2:02
:29
6:02
:29
10:0
2:29
14:0
2:29
18:0
2:29
22:0
2:29
2:02
:29
6:02
:29
10:0
2:29
14:0
2:29
18:0
2:29
22:0
2:29
2:02
:29
6:02
:29
10:0
2:29
14:0
2:29
18:0
2:29
22:0
2:29
2:02
:29
6:02
:29
10:0
2:29
14:0
2:29
18:0
2:29
22:0
2:29
2:02
:29
6:02
:29
time
tem
pera
ture
(C)
TC265 without PCM TC266 without PCM TC267 without PCMTC265 with PCM TC266 with PCM TC267 with PCM
Figure 4.33. The profiles of the surface temperatures at the points of “TC265”, “TC266” and “TC267” on the interior surface of the tested wall (seen from the
hot side) under the conditions with and without PCM.
Heating stage
airv =0.4m/s
Heating stage
airv =0.3m/s
Heating stage
airv =0.2m/s
Heating stage
airv =0.1m/s
Heating stage
airv =0.0m/s
1st and 6th testing 2nd and 7th testing 3rd and 8th testing 4th and 9th testing 5th and 10th testing
tem
pera
ture
(ºC
)

130
Surface temperature differences (top-middle)
00,10,20,30,40,50,60,70,80,9
1
10:0
2:29
14:0
2:29
18:0
2:29
22:0
2:29
2:02
:29
6:02
:29
10:0
2:29
14:0
2:29
18:0
2:29
22:0
2:29
2:02
:29
6:02
:29
10:0
2:29
14:0
2:29
18:0
2:29
22:0
2:29
2:02
:29
6:02
:29
10:0
2:29
14:0
2:29
18:0
2:29
22:0
2:29
2:02
:29
6:02
:29
10:0
2:29
14:0
2:29
18:0
2:29
22:0
2:29
2:02
:29
6:02
:29
time
tem
pera
ture
(C)
without PCM_top-middle
with PCM_top-middle
Figure 4.34. Surface temperature stratifications of top-middle (the measured value of “TC265”- the measured value of “TC266”) with and without PCM.
Heating Stage 0.4m/s
Heating Stage 0.3m/s
Heating Stage 0.2m/s
Heating Stage 0.1m/s
Heating Stage 0.0m/s
1st and 6th testing 2nd and 7th testing 3rd and 8th testing 4th and 9th testing 5th and 10th testing
tem
pera
ture
(ºC
)
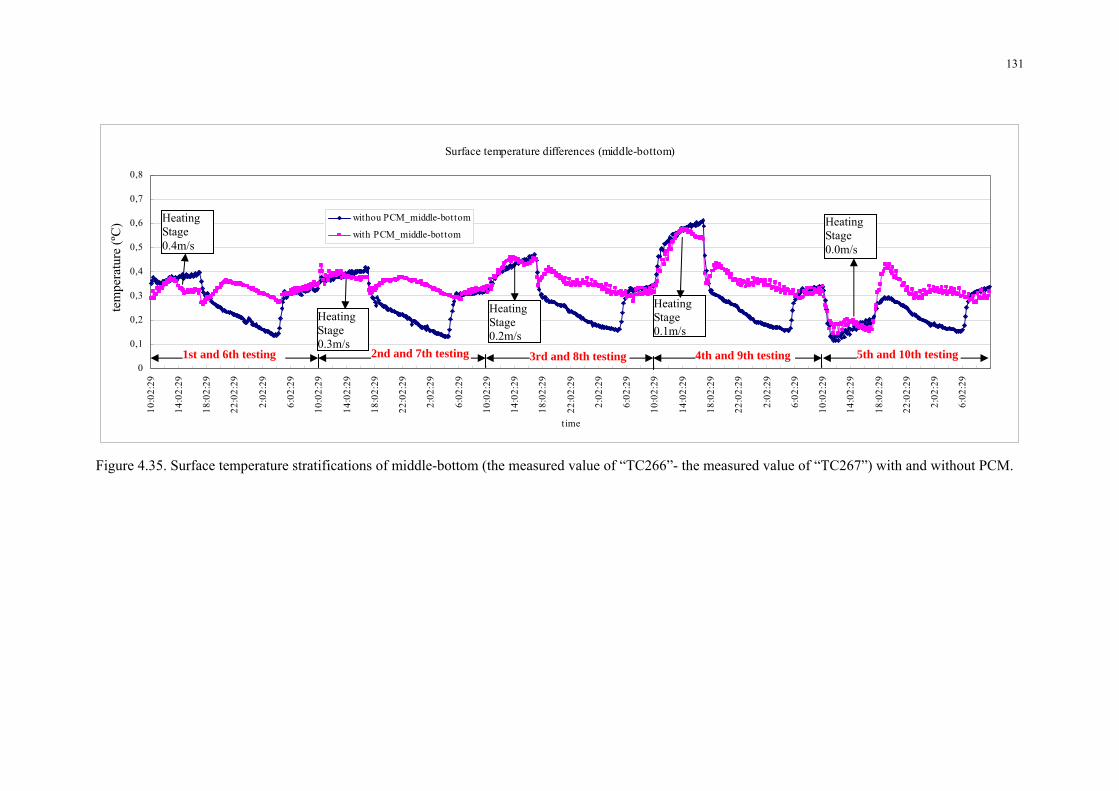
131
Surface temperature differences (middle-bottom)
0
0,1
0,2
0,3
0,4
0,5
0,6
0,7
0,8
10:0
2:29
14:0
2:29
18:0
2:29
22:0
2:29
2:02
:29
6:02
:29
10:0
2:29
14:0
2:29
18:0
2:29
22:0
2:29
2:02
:29
6:02
:29
10:0
2:29
14:0
2:29
18:0
2:29
22:0
2:29
2:02
:29
6:02
:29
10:0
2:29
14:0
2:29
18:0
2:29
22:0
2:29
2:02
:29
6:02
:29
10:0
2:29
14:0
2:29
18:0
2:29
22:0
2:29
2:02
:29
6:02
:29
t ime
tem
pera
ture
(C)
withou PCM_middle-bottom
with PCM_middle-bottom
Figure 4.35. Surface temperature stratifications of middle-bottom (the measured value of “TC266”- the measured value of “TC267”) with and without PCM.
Heating Stage 0.4m/s
Heating Stage 0.3m/s
Heating Stage 0.2m/s
Heating Stage 0.1m/s
Heating Stage 0.0m/s
1st and 6th testing 2nd and 7th testing 3rd and 8th testing 4th and 9th testing 5th and 10th testing
tem
pera
ture
(ºC
)
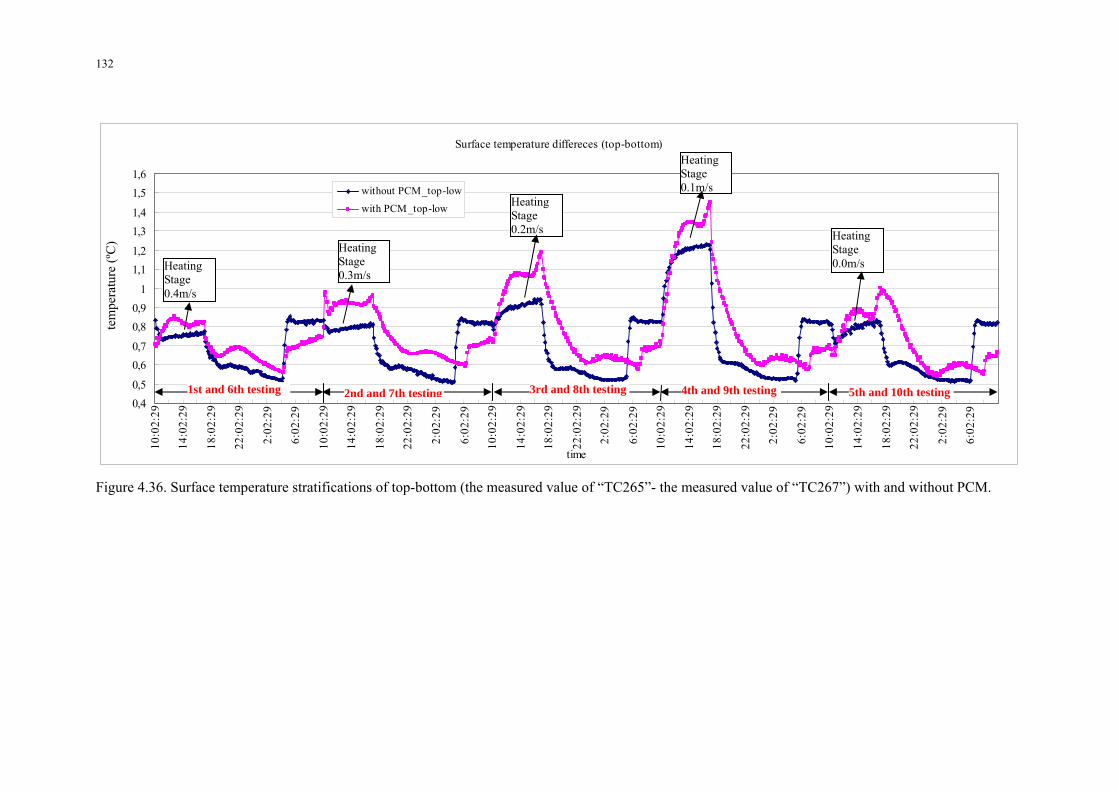
132
Surface temperature differeces (top-bottom)
0,40,5
0,60,7
0,80,9
1
1,11,2
1,31,4
1,51,6
10:0
2:29
14:0
2:29
18:0
2:29
22:0
2:29
2:02
:29
6:02
:29
10:0
2:29
14:0
2:29
18:0
2:29
22:0
2:29
2:02
:29
6:02
:29
10:0
2:29
14:0
2:29
18:0
2:29
22:0
2:29
2:02
:29
6:02
:29
10:0
2:29
14:0
2:29
18:0
2:29
22:0
2:29
2:02
:29
6:02
:29
10:0
2:29
14:0
2:29
18:0
2:29
22:0
2:29
2:02
:29
6:02
:29
time
tem
pera
ture
(C)
without PCM_top-low
with PCM_top-low
Figure 4.36. Surface temperature stratifications of top-bottom (the measured value of “TC265”- the measured value of “TC267”) with and without PCM.
Heating Stage 0.4m/s
Heating Stage 0.3m/s
Heating Stage 0.2m/s
Heating Stage 0.1m/s
Heating Stage 0.0m/s
1st and 6th testing 2nd and 7th testing 3rd and 8th testing 4th and 9th testing 5th and 10th testing
tem
pera
ture
(ºC
)
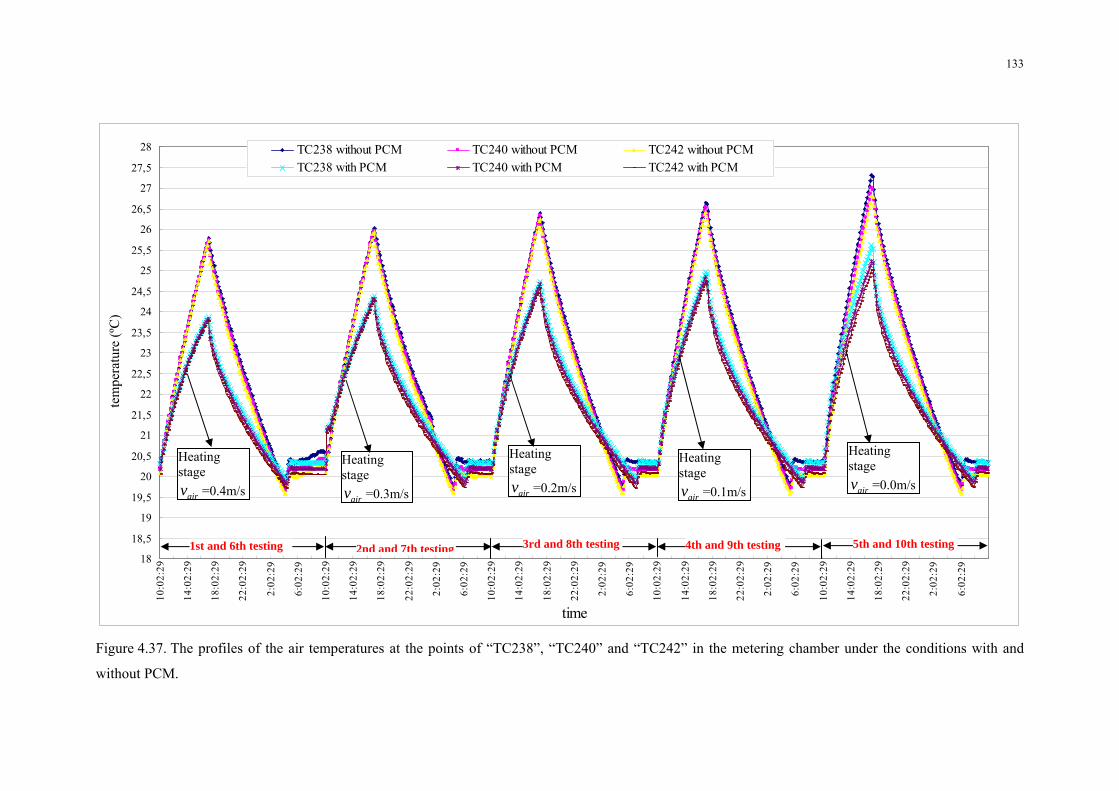
133
18
18,5
19
19,5
20
20,5
21
21,5
22
22,5
23
23,5
24
24,5
25
25,5
26
26,5
27
27,5
2810
:02:
29
14:0
2:29
18:0
2:29
22:0
2:29
2:02
:29
6:02
:29
10:0
2:29
14:0
2:29
18:0
2:29
22:0
2:29
2:02
:29
6:02
:29
10:0
2:29
14:0
2:29
18:0
2:29
22:0
2:29
2:02
:29
6:02
:29
10:0
2:29
14:0
2:29
18:0
2:29
22:0
2:29
2:02
:29
6:02
:29
10:0
2:29
14:0
2:29
18:0
2:29
22:0
2:29
2:02
:29
6:02
:29
time
tem
pera
ture
(C)
TC238 without PCM TC240 without PCM TC242 without PCMTC238 with PCM TC240 with PCM TC242 with PCM
Figure 4.37. The profiles of the air temperatures at the points of “TC238”, “TC240” and “TC242” in the metering chamber under the conditions with and
without PCM.
Heating stage
airv =0.4m/s
Heating stage
airv =0.3m/s
Heating stage
airv =0.2m/s
Heating stage
airv =0.1m/s
Heating stage
airv =0.0m/s
1st and 6th testing 2nd and 7th testing 3rd and 8th testing 4th and 9th testing 5th and 10th testing
tem
pera
ture
(ºC
)

134
Air temperature differences (top-middle)
0
0,05
0,1
0,15
0,2
0,25
0,3
0,35
0,4
0,45
10:0
2:29
14:0
2:29
18:0
2:29
22:0
2:29
2:02
:29
6:02
:29
10:0
2:29
14:0
2:29
18:0
2:29
22:0
2:29
2:02
:29
6:02
:29
10:0
2:29
14:0
2:29
18:0
2:29
22:0
2:29
2:02
:29
6:02
:29
10:0
2:29
14:0
2:29
18:0
2:29
22:0
2:29
2:02
:29
6:02
:29
10:0
2:29
14:0
2:29
18:0
2:29
22:0
2:29
2:02
:29
6:02
:29
time
tem
pera
ture
(C)
without PCM_top-middle
with PCM_top-middle
Figure 4.38. Air temperature stratifications of top-middle (the measured value of “TC238”- the measured value of “TC240”) with and without PCM.
Heating Stage 0.4m/s
Heating Stage 0.3m/s
Heating Stage 0.2m/s
Heating Stage 0.1m/s
Heating Stage 0.0m/s
1st and 6th testing 2nd and 7th testing 3rd and 8th testing 4th and 9th testing 5th and 10th testing
tem
pera
ture
(ºC
)
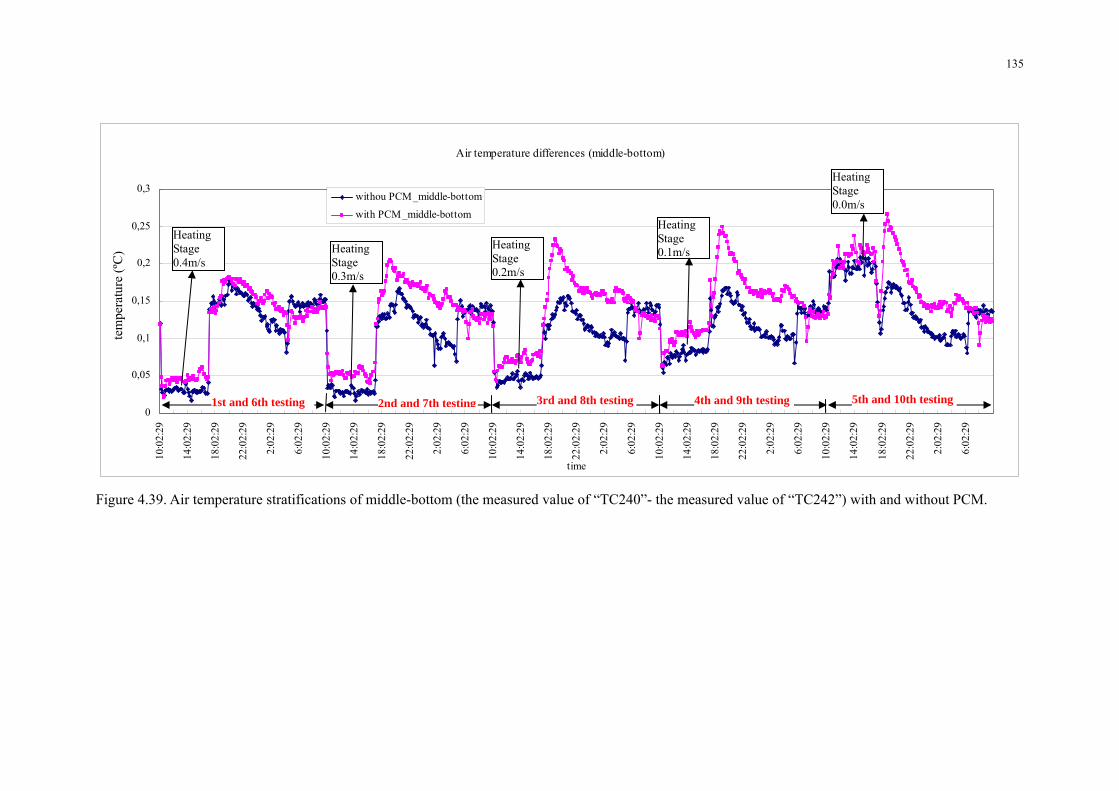
135
Air temperature differences (middle-bottom)
0
0,05
0,1
0,15
0,2
0,25
0,3
10:0
2:29
14:0
2:29
18:0
2:29
22:0
2:29
2:02
:29
6:02
:29
10:0
2:29
14:0
2:29
18:0
2:29
22:0
2:29
2:02
:29
6:02
:29
10:0
2:29
14:0
2:29
18:0
2:29
22:0
2:29
2:02
:29
6:02
:29
10:0
2:29
14:0
2:29
18:0
2:29
22:0
2:29
2:02
:29
6:02
:29
10:0
2:29
14:0
2:29
18:0
2:29
22:0
2:29
2:02
:29
6:02
:29
time
tem
pera
ture
(C)
withou PCM_middle-bottom
with PCM_middle-bottom
Figure 4.39. Air temperature stratifications of middle-bottom (the measured value of “TC240”- the measured value of “TC242”) with and without PCM.
Heating Stage 0.4m/s
Heating Stage 0.3m/s
Heating Stage 0.2m/s
Heating Stage 0.1m/s
Heating Stage 0.0m/s
1st and 6th testing 2nd and 7th testing 3rd and 8th testing 4th and 9th testing 5th and 10th testing
tem
pera
ture
(ºC
)

136
Air temperature differeces (top-bottom)
0
0,1
0,2
0,3
0,4
0,5
0,6
0,710
:02:
29
14:0
2:29
18:0
2:29
22:0
2:29
2:02
:29
6:02
:29
10:0
2:29
14:0
2:29
18:0
2:29
22:0
2:29
2:02
:29
6:02
:29
10:0
2:29
14:0
2:29
18:0
2:29
22:0
2:29
2:02
:29
6:02
:29
10:0
2:29
14:0
2:29
18:0
2:29
22:0
2:29
2:02
:29
6:02
:29
10:0
2:29
14:0
2:29
18:0
2:29
22:0
2:29
2:02
:29
6:02
:29
time
tem
pera
ture
(C)
without PCM_top-lowwith PCM_top-low
Figure 4.40. Air temperature stratifications of top-bottom (the measured value of “TC238”- the measured value of “TC242”) with and without PCM.
Heating Stage 0.4m/s
Heating Stage 0.3m/s
Heating Stage 0.2m/s
Heating Stage 0.1m/s
Heating Stage 0.0m/s
1st and 6th testing 2nd and 7th testing 3rd and 8th testing 4th and 9th testing 5th and 10th testing
tem
pera
ture
(ºC
)

137
4.7.3 Heat fluxes and energy storage effect
In order to further investigate the heat transfer and energy storage effect with respect to the
attachment of PCM layer, the profiles of the measurement results from the heat flux meters on
the surface of the interior gypsum board (seen from the hot side) and on the surface of the
vapor barrier (seen from the hot side) have been presented in Figure 4.41 and Figure 4.42,
respectively. The positions and of heat flux meters “HFM024”, “HFM025”, and “HFM155”
are shown in Figure 4.24, from which we can see that the heights of these three heat flux
meters to the bottom of the gypsum board are 2264 mm, 1300 mm, and 136 mm, respectively.
The positions of “HFM156”, “HFM157” and “HFM158” on the plane of the vapor barrier
surface are exactly the same as those of “HFM024”, “HFM025”, and “HFM155” on the plane
of the interior gypsum board surface. The influence of the convective condition on the heat
flux rates were hard to compare in this section, because the evaluation of the convective
condition should be based on both the heat flux rates and the temperature differences between
the air and surface, i.e. the convection coefficient. The influence on the convection coefficient
will be discussed in detail in Section 4.7.6.
From the measurement results of the heat flux meters in the test rig, several important
phenomena could be noticed here. First, during the heating stage (10:00-17:00), the heat flux
rates at the surface of the interior gypsum board (seen from the hot side) were significantly
enhanced, while those at the surface of the vapor barrier (seen from the hot side) were
correspondingly attenuated by the attachment of PCM layer, but the former enhancement
extent were much higher than the latter attenuation extent. For example, at 16:52 under the
convective condition airv = 0.4 m/s, the heat flux rates of HFM 024 with and without PCM
were 10.82 W/m2 and 7.56 W/m2, respectively, thus increase by 43%; whereas the heat flux
rates of HFM 156 with and without PCM were 4.01 W/m2 and 4.90 W/m2, respectively, thus
decrease by 18%.
Second, during the cooling stage (17:00-10:00), the heat flux rates at the surface of the
interior gypsum board (seen from the hot side) were attenuated by the attachment of PCM
layer. At the surface of the vapor barrier (seen from the hot side), the situation was a bit
complicated, but the main trends of the heat fluxes with PCM at this period were flatter than

138
those without PCM; in other words, by the attachment of PCM, the fluctuations of the heat
fluxes during the cooling period were attenuated.
The essential reasons of the above two phenomena can be explained by the phase change
processes of PCM panels. According to the measurement results, the temperatures of each
testing at the surface of interior gypsum board (seen from cold side) were between 19 and 26
ºC, which were within the temperature range for the phase change processes (according to
Figure 4.19 and Figure 4.20), thus the enhanced specific heat capacity of the phase change
material would influence the heat fluxes. During the heating stage, the enhanced specific heat
capacity within the PCM panel would increase the heat flow rate through the interior gypsum
board so that more thermal energy could be stored in PCM panel. The enhanced heat storage
effect would consequently decrease the heat flow rate through the opposite surface of the
PCM panel (seen from the cold side), thus the attenuation effect of the heat flux rates at the
vapor barrier surface could also be seen. During the cooling stage, the stored energy in the
PCM panel would be released. At the surface of the interior gypsum board (seen from hot
side), this release effect would suppress the heat flux flowing into the gypsum board, thus the
attenuation effect at that surface could be noticed. At the surface of the vapor barrier (seen
from hot side), this release effect would then slow down the decrease rate of the heat flux
flowing through the surface, thus a flatter decrease curve could be seen.
All these energy storage and release effects have been clearly depicted in Figure 4.43, which
shows the differences between the heat fluxes flowing through the surface of the interior
gypsum board (seen from hot side) and the surface of the vapor barrier (seen from hot side).
When the difference value was higher than 0, it means that the storage effect of PCM panel
happened; otherwise, the release effect happened. For example in Figure 4.43, during the
heating stage, the energy storage effect of “HFM025-HFM157 with PCM” was more and
more enhanced with the time which means that the temperature of the PCM layer was
increased towards the peak melting point; while during the cooling stage, the energy release
effect was firstly more and more enhanced until the thermostat (heater 1) was automatically
turned on; After heater 1 was turned on, the energy release effect became less obvious towards
the direction of steady-state condition.

139
4.7.4 The stratification of heat fluxes
Besides the temperature stratification, the heat flux stratification also existed, as shown in
Figure 4.41 and Figure 4.42:
(a) For the heat fluxes at the surface of the interior gypsum board (seen from the hot side).
Without PCM, the heat flux stratification was in such a way that the higher the position,
the lower the heat fluxes would be for both the heating and cooling periods. However,
with PCM, the heat flux stratification showed different situations in the heating and
cooling stages. During the heating stage, generally speaking, the higher the position, the
higher the heat fluxes would be; whereas during the cooling stage, the situation was in
reverse.
(b) For the heat fluxes at the surface of the vapor barrier (seen from the hot side). The
situation was simpler than that at the surface of the interior gypsum board. The heat flux
stratification was always in such an order that, the higher the position, the lower the heat
fluxes would be.
Phenomenon (a) can be explained as follow. Without PCM layer, the temperature stratification
of the surface was greater than that of the air (as discussed in Section 4.7.2), thus the
temperature differences between the air and surface was larger at the higher position.
Therefore, the higher the position, the larger the heat fluxes would be. However, after the
PCM layer had been attached, the asynchronous step of the phase change processes at
different heights of the PCM layer would lead to different heat flux rates:
During the heating stage with PCM (10:00-17:00). Due to the temperature stratification,
higher position of the PCM layer would get close to the peak melting point earlier than
the lower position. As we know, the more close to the melting peak temperature, the more
enhanced the energy storage effect will be, thus resulting in more enhancement of the
heat fluxes at the surface of the interior gypsum board (seen from the hot side).
Furthermore, the influence of the phase change processes on the heat flux rates is much
larger than the temperature difference between air and surface. Therefore, this
asynchronous step of phase change processes determines that during the heating stage,
the higher the position, the larger the heat fluxes would be.
During the cooling stage with PCM (17:00-10:00). At the beginning of the cooling stage,
the energy stored in the PCM layer was larger at the higher position due to the more

140
enhanced energy storage effect during the heating stage (as shown in Figure 4.43). Thus
during the cooling stage, the energy release effect would be also more enhanced at the
higher position and the attenuation effect of the heat fluxes would be more obvious.
During the steady-state condition when there was no phase change process happened, the
situation would be similar as the sensible material, thus the order of the heat flux
stratification would be similar as that without PCM.
The reason of phenomena (b) was also due to the phase change processes. Under the
condition without PCM, the heat flux stratification on the vapor barrier surface (seen from the
hot side) should be similar as the order on the surface of the interior gypsum board (seen from
the hot side) due to the low thermal inertia of the gypsum board. After the PCM layer was
attached:
During the heating stage with PCM (10:00-17:00). As analysed in Section 4.7.3, the heat
flux rate at the surface of the vapor barrier (seen from the hot side) would be attenuated
by the attachment of PCM. Furthermore, due to the temperature stratification, the higher
position of the PCM layer would get close to the peak melting point earlier than the lower
position. Thus, the asynchronous step of phase change processes would let the attenuation
effect of the heat flux at the higher position earlier than the lower position. In this way,
the order of the heat flux stratification with PCM would be similar as that without PCM,
but the extent would be enhanced as shown in Figure 4.42.
During the cooling stage with PCM (17:00-10:00). After the PCM layer was attached, the
decrease rate of heat flux would slow down as analysed in Section 4.7.3. Furthermore,
due to the temperature stratification, the lower position of the PCM layer would get close
to the peak freezing point earlier than the higher position. Thus, the asynchronous step of
phase change processes would let the decrease rate at lower position slow down earlier
than the higher position. In this way, the order of the heat flux stratification with PCM
would be similar as that without PCM, but the extent would be enhanced as shown in
Figure 4.42.

141
00,5
11,5
22,5
33,5
44,5
55,5
66,5
77,5
88,5
99,510
10,511
11,512
12,513
13,514
10:0
2:29
14:0
2:29
18:0
2:29
22:0
2:29
2:02
:29
6:02
:29
10:0
2:29
14:0
2:29
18:0
2:29
22:0
2:29
2:02
:29
6:02
:29
10:0
2:29
14:0
2:29
18:0
2:29
22:0
2:29
2:02
:29
6:02
:29
10:0
2:29
14:0
2:29
18:0
2:29
22:0
2:29
2:02
:29
6:02
:29
10:0
2:29
14:0
2:29
18:0
2:29
22:0
2:29
2:02
:29
6:02
:29
time
heat
flux
(W/m
2)
15
16
17
18
19
20
21
22
23
24
25
26
27
28
29
30
tem
pera
ture
(C)
HFM024 without PCM HFM025 without PCM HFM155 without PCMHFM024 with PCM HFM025 with PCM HFM155 with PCMTC271 with PCM TC272 with PCM TC273 with PCM
Figure 4.41. The profiles of the measurement results from the heat flux meters “HFM024”, “HFM025”, and “HFM155” on the surface of the interior gypsum
board (seen from the hot side) under the conditions with and without PCM. The heights of “HFM024”, “HFM025”, and “HFM155” to the bottom of the
gypsum board are 2264 mm, 1300 mm, and 136 mm, respectively. Temperature profiles at the corresponding heights (“TC271 with PCM”, “TC272 with
PCM”, and “TC273 with PCM”) on the hot side of the PCM layer have also been presented.
Heating Stage 0.4m/s
Heating Stage 0.3m/s
Heating Stage 0.2m/s
Heating Stage 0.1m/s
Heating Stage 0.0m/s
1st and 6th testing 2nd and 7th testing 3rd and 8th testing 4th and 9th testing 5th and 10th testing
heat
flux
(W/m
2 )

142
1,5
2
2,5
3
3,5
4
4,5
5
5,5
6
6,5
7
7,5
810
:02:
29
14:0
2:29
18:0
2:29
22:0
2:29
2:02
:29
6:02
:29
10:0
2:29
14:0
2:29
18:0
2:29
22:0
2:29
2:02
:29
6:02
:29
10:0
2:29
14:0
2:29
18:0
2:29
22:0
2:29
2:02
:29
6:02
:29
10:0
2:29
14:0
2:29
18:0
2:29
22:0
2:29
2:02
:29
6:02
:29
10:0
2:29
14:0
2:29
18:0
2:29
22:0
2:29
2:02
:29
6:02
:29
time
heat
flux
(W/m
2)
01234567891011121314151617181920212223242526
tem
pera
ture
(C)
HFM156 without PCM HFM157 without PCM HFM158 without PCMHFM156 with PCM HFM157 with PCM HFM158 with PCMTC297 with PCM TC298 with PCM TC299 with PCM
Figure 4.42. The profiles of the measurement results from the heat flux meters “HFM156”, “HFM157”, and “HFM158” on the surface of the vapor barrier
(seen from the hot side) under the conditions with and without PCM. The heights of “HFM156”, “HFM157”, and “HFM158” to the bottom of the gypsum
board are 2264 mm, 1300 mm, and 136 mm, respectively. Temperature profiles at the corresponding heights (“TC297 with PCM”, “TC298 with PCM”, and
“TC299 with PCM”) on the cold side of the PCM layer have also been presented.
Heating Stage 0.4m/s
Heating Stage 0.3m/s
Heating Stage 0.2m/s
Heating Stage 0.1m/s
Heating Stage 0.0m/s
1st and 6th testing 2nd and 7th testing 3rd and 8th testing 4th and 9th testing 5th and 10th testing
heat
flux
(W/m
2 )
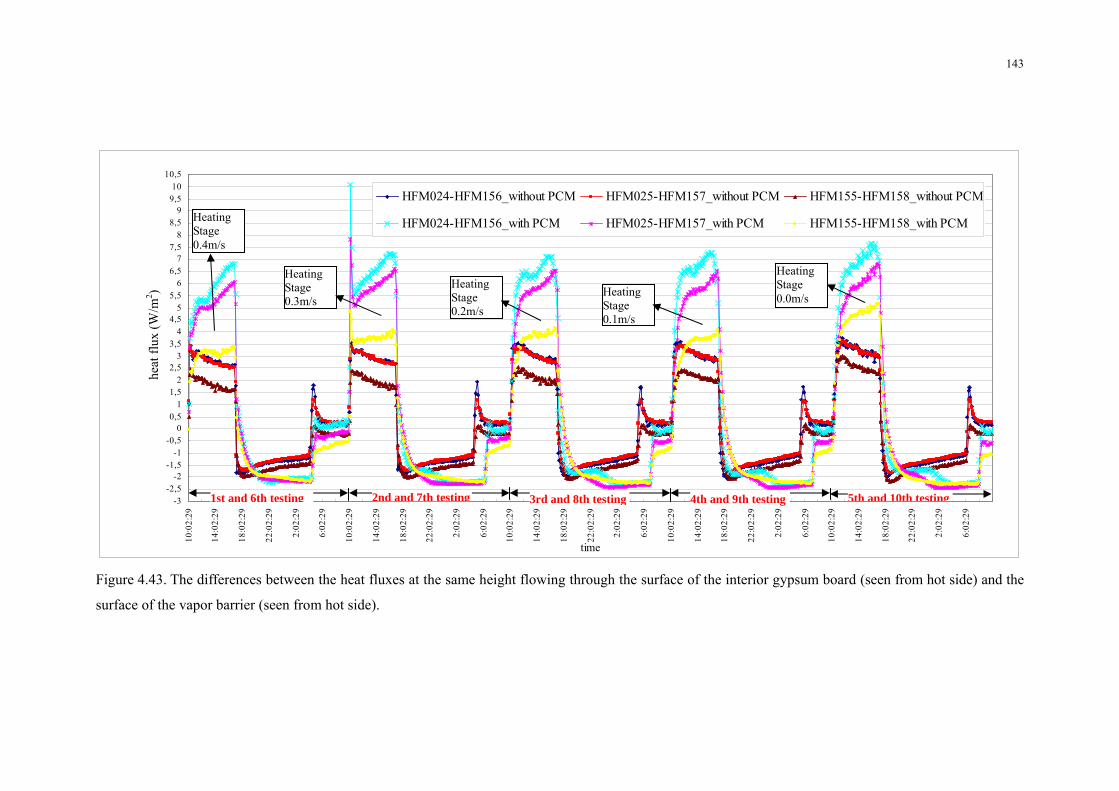
143
-3-2,5
-2-1,5
-1-0,5
00,5
11,5
22,5
33,5
44,5
55,5
66,5
77,5
88,5
99,510
10,510
:02:
29
14:0
2:29
18:0
2:29
22:0
2:29
2:02
:29
6:02
:29
10:0
2:29
14:0
2:29
18:0
2:29
22:0
2:29
2:02
:29
6:02
:29
10:0
2:29
14:0
2:29
18:0
2:29
22:0
2:29
2:02
:29
6:02
:29
10:0
2:29
14:0
2:29
18:0
2:29
22:0
2:29
2:02
:29
6:02
:29
10:0
2:29
14:0
2:29
18:0
2:29
22:0
2:29
2:02
:29
6:02
:29
time
heat
flux
(w/m
2)
HFM024-HFM156_without PCM HFM025-HFM157_without PCM HFM155-HFM158_without PCM
HFM024-HFM156_with PCM HFM025-HFM157_with PCM HFM155-HFM158_with PCM
Figure 4.43. The differences between the heat fluxes at the same height flowing through the surface of the interior gypsum board (seen from hot side) and the
surface of the vapor barrier (seen from hot side).
Heating Stage 0.4m/s
Heating Stage 0.3m/s
Heating Stage 0.2m/s
Heating Stage 0.1m/s
Heating Stage 0.0m/s
1st and 6th testing 2nd and 7th testing 3rd and 8th testing 4th and 9th testing 5th and 10th testing
heat
flux
(W/m
2 )

144
4.7.5 Mean heat conductive loss of the tested wall
One method to investigate the influence of PCM layer on the thermal insulation of the tested
wall is based on the “heat conductive loss”. This method I used here refers to the calculation
method described in Liu and Awbi’s experiment [67]. As shown in Equation (4.1) [67],
heat conductive loss temperature differences between interior and exterior wall surface=
conductive thermal resistance (4.1)
the heat conductive loss through the tested wall can be calculated by the ratio of wall surface
temperature differences and the conductive thermal resistance. In this section, I only analyse
the mean heat conductive loss, thus the surface temperature differences in Equation (4.1) also
refer to the differences between the mean surface temperatures. Moreover, the conductive
thermal resistances with and without PCM are 7.53 and 7.50 2m C/W° , respectively. The
profiles of the mean heat conductive losses of the tested wall under the conditions with and
without PCM layer have been depicted in Figure 4.44.
First, as shown in Figure 4.44, the heat conductive loss is influenced by the convective
condition. Generally speaking, the higher the air flow rate in the metering box during the
heating stage, the lower the heat conductive loss would be. The reason of this phenomenon
was due to the enhanced attenuation effect of the air and surface temperatures in the metering
box by the mechanical convection (as discussed in Section 4.7.1), thus the wall surface
temperature differences would be correspondingly attenuated.
Second, during the heating and cooling stages of the testing, the heat conductive losses were
all influenced by the attachment of PCM layer:
(a) During the heating stage (10:00-17:00). As shown in Figure 4.44, the heat conductive loss
was obviously suppressed by the attachment of PCM layer. Furthermore, without PCM,
the increase of the conductive loss was almost linear; whereas with PCM, the increase rate
of the conductive loss clearly slowed down with the increase of the temperature in the
metering chamber. The energy storage effect of the PCM layer during the heating stage
significantly decreased the heat conductive loss through the tested wall, thus presenting a
better insulation function during the heating stage.

145
(b) During the cooling stage (17:00-10:00). Before the thermostat was automatically turned
on, the decrease of the heat conductive loss was almost linear without PCM; whereas with
PCM, the decrease rate of the heat conductive loss slowed down. However, it does not
mean that the thermal insulation function of the wall with PCM during the cooling stage
became worse, because the attenuation of the decrease rate of the conductive loss was
mainly due to the attenuation effect of the decrease rate of the air and surface temperature
in the metering box. After the thermostat was automatically turned on, the thermal
conductive losses with and without PCM remained at a similar value especially during the
steady state due to the similar conductivities of the tested walls.
4.7.6 Convection coefficient of the interior surface of the tested wall
The convection coefficient is one of the most important criteria for evaluating the convective
heat transfer processes between air and surface, which is calculated by Equation (4.2):
heat flux through the surfaceconvection coefficient
air temperature surface temperature=
− (4.2)
The convection coefficient discussed here refers to the mean convection coefficient, thus the
heat flux and temperatures in equation (4.2) all need to use the mean values over the interior
surface of the tested wall. The profiles of convection coefficients with and without PCM layer
under different air flow rates have been presented in Figure 4.45. Furthermore, the average
values during the heating and cooling periods in each testing have been listed in Table 4.5. As
mentioned in Section 4.7.3, during the unsteady state period in the testing, the PCM panels
were all within the phase change processes. Thus, the convection coefficient discussed in this
section would reflect the influences by the phase change processes if PCM layer was attached.
From Figure 4.45 and Table 4.5, several important phenomena can be found. First, during the
heating stage, the convection coefficients with and without PCM layer all present a similar
phenomenon that, as long as fan 1 was operating, the higher the air velocity over the tested
surface, the higher the convection coefficient would be (as shown in Figure 4.45). However,
when fan 1 was not operating during the heating stage, i.e. under natural convective heating,
the convection coefficient was abnormally slightly lower than airv = 0.1 m/s. This unusual
phenomenon needs more comparative experiments in further research. Anyway, from the
overall experimental results under mechanical convection, we can still conclude that the

146
increased fan flow rate would effectively enhance the convective heat transfer process
through the interior surface.
Table 4.5. The average convection coefficient during the heating and cooling periods in each testing.
airv (m/s)
Stage Time Average convection coefficient without PCM ( 2W/m C° )
Average convection coefficient with PCM( 2W/m C° )
Increase percent by adding PCM(a) (%)
0.4 Heating 10:00-17:00 11.38 12.11 6.41
0.0 Cooling 17:00-10:00 6.71 7.47 11.33
0.3 Heating 10:00-17:00 11.14 11.74 5.39
0.0 Cooling 17:00-10:00 6.72 7.44 10.71
0.2 Heating 10:00-17:00 10.11 10.44 3.26
0.0 Cooling 17:00-10:00 6.86 7.62 11.08
0.1 Heating 10:00-17:00 8.37 8.57 2.39
0.0 Cooling 17:00-10:00 6.88 7.65 11.19
0.0 Heating 10:00-17:00 8.94 8.82 -1.34
0.0 Cooling 17:00-10:00 6.99 7.85 12.30
(a) In case the value is smaller than 0, then it means the decrease percent.
Second, the influences on the convection coefficient by attachment of PCM layer are various
under different conditions:
(a) During the heating stage (10:00-17:00). Under different convective conditions, the
influences by the attachment of PCM layer are a bit complicated here. As shown in Figure
4.45, as long as fan 1 was operating, the higher the air flow rate over the interior surface,
the more enhanced the convection coefficient would be. The similar order can be noticed
in Table 4.5 when airv changes from 0.1 to 0.4 m/s. However, when the fan was not
operating, i.e. under natural convective heating, the convection coefficients with and
without PCM layer are similar, while the average value in Table 4.5 even presents a slight
attenuation effect. This unusual phenomenon contradicts with the results from Liu and
Awbi’s experiments [67], which showed that the convection coefficient would be
enhanced during the melting processes of PCM under natural convective heating. This
unusual phenomenon also requires more comparative experiments for investigation in the

147
future research. Nevertheless, from the overall results of our experiments, we can still
conclude that the convection coefficient would be enhanced by the attachment of PCM
layer under mechanical convection (during the phase change processes), and the higher
the fan flow rate, the larger the convection coefficient would be.
(b) During the cooling stage (17:00-10:00). Since fan 1 should be turned off during each
cooling stage, only the natural convective condition would exist during this period. As
shown in Figure 4.45, the natural convection coefficient during the cooling period of each
testing was significantly enhanced by the attachment of PCM. According to Table 4.5, this
enhancement extent could reach a maximum value of 12.3% in the 10th testing. However,
generally speaking, this enhancement is irrelevant with the air flow rate during the heating
stage, as the values of increase extent are rather fluctuated in Table 4.5. Moreover, as
shown in Figure 4.45, after the attachment of PCM layer, the convection coefficients were
rather fluctuated in cooling stages during the 8th, 9th and 10th testing. The reason for
these large fluctuations is still uncertain and needs more experiments in future.

148
4,8
4,9
5
5,1
5,2
5,3
5,4
5,5
5,6
5,7
5,8
5,9
6
6,1
6,2
6,3
10:0
2:29
14:0
2:29
18:0
2:29
22:0
2:29
2:02
:29
6:02
:29
10:0
2:29
14:0
2:29
18:0
2:29
22:0
2:29
2:02
:29
6:02
:29
10:0
2:29
14:0
2:29
18:0
2:29
22:0
2:29
2:02
:29
6:02
:29
10:0
2:29
14:0
2:29
18:0
2:29
22:0
2:29
2:02
:29
6:02
:29
10:0
2:29
14:0
2:29
18:0
2:29
22:0
2:29
2:02
:29
6:02
:29
time
heat
con
duct
ive
loss
(W/m
2)mean heat conductive loss without PCM mean heat conductive loss with PCM
Figure 4.44. The profiles of the mean heat conductive losses under the conditions with and without PCM layer.
Heating stage
airv =0.4m/s
Heating stage
airv =0.3m/s
Heating stage
airv =0.2m/s
Heating stage
airv =0.1m/s
Heating stage
airv =0.0m/s
1st and 6th testing 2nd and 7th testing 3rd and 8th testing 4th and 9th testing 5th and 10th testing
heat
con
duct
ive
loss
(W/m
2 )

149
5
5,5
6
6,5
7
7,5
8
8,5
9
9,5
10
10,5
11
11,5
12
12,5
13
13,5
14
14,5
15
10:0
2:29
14:0
2:29
18:0
2:29
22:0
2:29
2:02
:29
6:02
:29
10:0
2:29
14:0
2:29
18:0
2:29
22:0
2:29
2:02
:29
6:02
:29
10:0
2:29
14:0
2:29
18:0
2:29
22:0
2:29
2:02
:29
6:02
:29
10:0
2:29
14:0
2:29
18:0
2:29
22:0
2:29
2:02
:29
6:02
:29
10:0
2:29
14:0
2:29
18:0
2:29
22:0
2:29
2:02
:29
6:02
:29
time
conv
ectio
n co
effic
ient
(W/m
2.C)
convection coefficient without PCM convection coefficient with PCM
Figure 4.45. The profiles of convection coefficients with and without PCM layer under different air flow rates.
Heating stage
airv =0.4m/s Heating stage
airv =0.3m/s Heating stage
airv =0.2m/s Heating stage
airv =0.1m/s
Heating stage
airv =0.0m/s
1st and 6th testing 2nd and 7th testing 3rd and 8th testing 4th and 9th testing 5th and 10th testing
conv
ectio
n co
effic
ient
(W/m
2 .ºC)
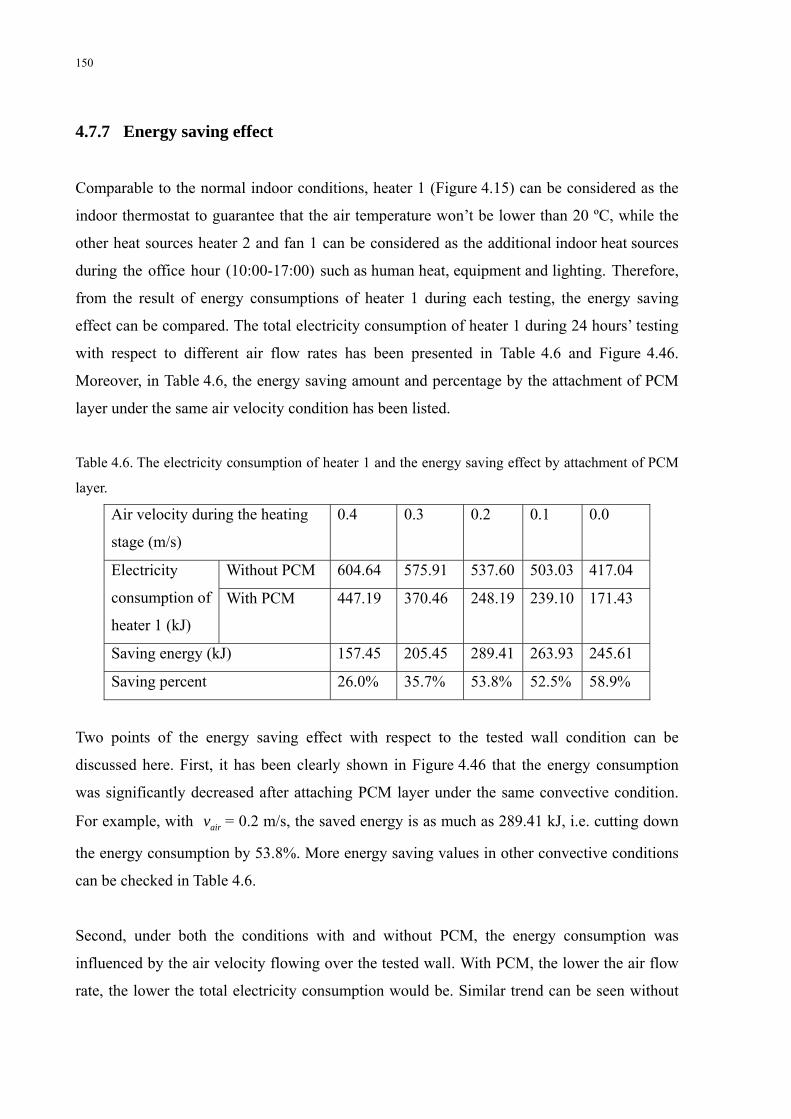
150
4.7.7 Energy saving effect
Comparable to the normal indoor conditions, heater 1 (Figure 4.15) can be considered as the
indoor thermostat to guarantee that the air temperature won’t be lower than 20 ºC, while the
other heat sources heater 2 and fan 1 can be considered as the additional indoor heat sources
during the office hour (10:00-17:00) such as human heat, equipment and lighting. Therefore,
from the result of energy consumptions of heater 1 during each testing, the energy saving
effect can be compared. The total electricity consumption of heater 1 during 24 hours’ testing
with respect to different air flow rates has been presented in Table 4.6 and Figure 4.46.
Moreover, in Table 4.6, the energy saving amount and percentage by the attachment of PCM
layer under the same air velocity condition has been listed.
Table 4.6. The electricity consumption of heater 1 and the energy saving effect by attachment of PCM
layer.
Air velocity during the heating
stage (m/s)
0.4 0.3 0.2 0.1 0.0
Without PCM 604.64 575.91 537.60 503.03 417.04 Electricity
consumption of
heater 1 (kJ)
With PCM 447.19 370.46 248.19 239.10 171.43
Saving energy (kJ) 157.45 205.45 289.41 263.93 245.61
Saving percent 26.0% 35.7% 53.8% 52.5% 58.9%
Two points of the energy saving effect with respect to the tested wall condition can be
discussed here. First, it has been clearly shown in Figure 4.46 that the energy consumption
was significantly decreased after attaching PCM layer under the same convective condition.
For example, with airv = 0.2 m/s, the saved energy is as much as 289.41 kJ, i.e. cutting down
the energy consumption by 53.8%. More energy saving values in other convective conditions
can be checked in Table 4.6.
Second, under both the conditions with and without PCM, the energy consumption was
influenced by the air velocity flowing over the tested wall. With PCM, the lower the air flow
rate, the lower the total electricity consumption would be. Similar trend can be seen without

151
PCM. This phenomenon can be explained by the energy storage effect of the tested wall. As
analysed above, within the temperature range of our experiments (19-26.5 ºC), normally the
lower the air flow rate, the higher the mean air and surface temperatures would reach during
the heating stage. In this way, the energy storage effect would be more obvious, and
correspondingly more stored energy would be released during the cooling stage, as shown in
Figure 4.43. The trend would be more significant for the tested wall with PCM as a result of
the more enhanced energy storage effect. This is also why the energy saving percentage was
highest when airv = 0 m/s. However, it does not mean that the natural convection would be
the best choice in real applications, as the higher indoor temperature during the natural
convection might exceed the human comfort zone. Therefore, the best optimization of
convective condition should be based on the analysis of human comfort zone under certain
conditions in room environment.
0,0050,00
100,00150,00200,00250,00300,00350,00400,00450,00500,00550,00600,00650,00
0,4 0,3 0,2 0,1 0
air flow rate during the heating procedure (m/s)
ener
gy c
onsu
mpt
ion
of h
eate
r 1 (k
J)
without PCMwith PCM
Figure 4.46. The comparison of total electricity consumption of heater 1 in each 24 hours’ testing with
respect to different air flow rates and wall conditions.
152
4.7.8 Comparison with the computer simulations
One additional purpose of this experiment is to compare the experimental temperature
evolutions at different layers of the tested wall with the computer simulations. The
computational simulation software used in this thesis is WUFI 5.0 which is available for the
simulation of PCM integrated wall. Here, I chose the periods of 3rd and 8th testing (as shown
in Table 4.4) to compare experimental and simulated results. The thermocouple points
selected for comparison are “TC292”, “TC298”, “TC272” and “TC266” for “interface
between two layers of mineral wools (seen from hot side)”, “vapor barrier surface(seen from
hot side)”, “interior gypsum board surface (seen from cold side)”, and “interior gypsum board
surface (seen from hot side)”, respectively. The detailed positions and dimensions of these
thermocouples can be seen in Section 4.5.
(a) The test wall without PCM in the 3rd testing.
The experimental and simulated results of “TC292”, “TC298”, “TC272” and “TC266” have
been presented in Figure 4.47 to Figure 4.50. As shown in Figure 4.48, Figure 4.49 and Figure
4.50, the simulation results of “TC298”, “TC272” and “TC266” are quite consistent with the
experimental results, especially during the cooling stage. During the heating stage, the
differences between the simulated and experimental results of “TC298”, “TC272” and
“TC266” are all within 1 ºC from the second hour, whereas during the first hour the errors are
a bit high. The possible reasons for this first hour’s error might be the inconsistence between
the surface conditions in the real test rig and the settings in software. In the interface between
two layers of mineral wools, the experimental and simulated results of “TC292” show similar
trends of temperature evolution, but the simulated result is always lower than the
experimental data, while the differences are mainly within 1.5 ºC.
Furthermore, from WUFI 5.0, the heat fluxes flowing through the surface of interior gypsum
board (seen from the hot side) and the vapor barrier (seen from the hot side) can also be
generated. Thus, we can compare the simulated heat fluxes of “HFM025” and “HFM157”
with the experimental results, as shown in Figure 4.51. First, abnormally large increases
happened for both the simulated results of “HFM025” and “HFM157”during the first two
hours, while for the rest hours they showed similar evolution trends with the experimental
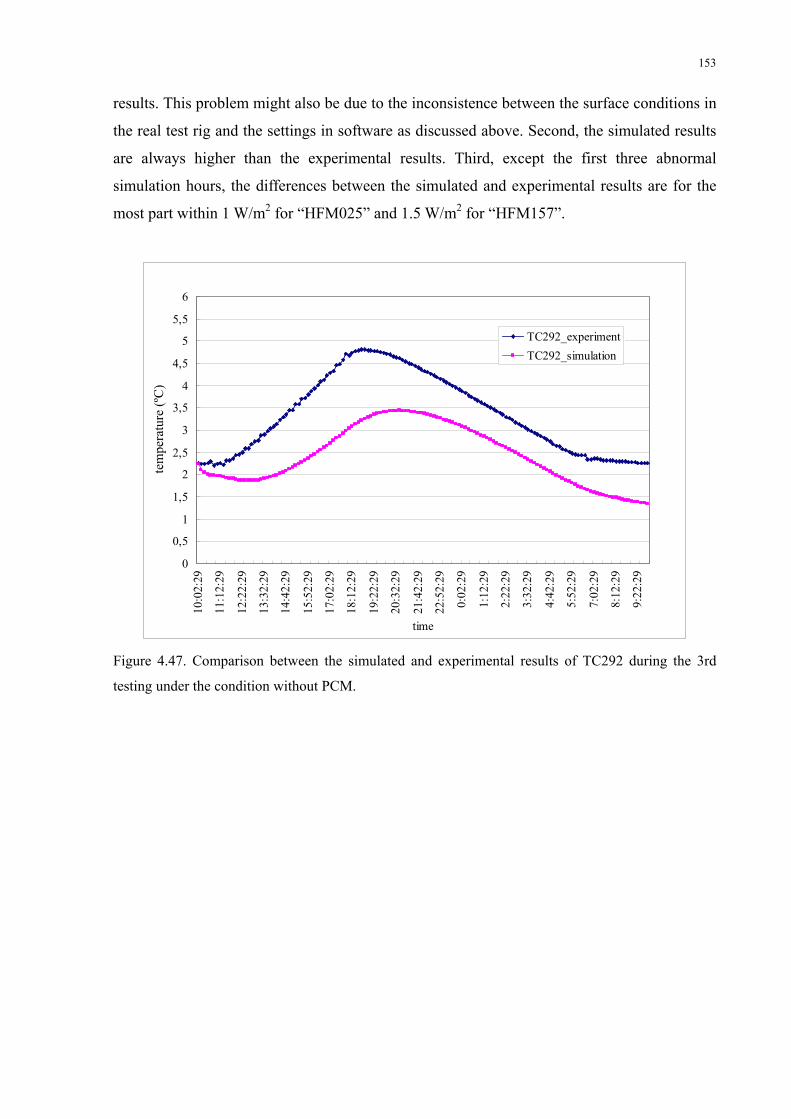
153
results. This problem might also be due to the inconsistence between the surface conditions in
the real test rig and the settings in software as discussed above. Second, the simulated results
are always higher than the experimental results. Third, except the first three abnormal
simulation hours, the differences between the simulated and experimental results are for the
most part within 1 W/m2 for “HFM025” and 1.5 W/m2 for “HFM157”.
0
0,5
1
1,5
2
2,5
3
3,5
4
4,5
5
5,5
6
10:0
2:29
11:1
2:29
12:2
2:29
13:3
2:29
14:4
2:29
15:5
2:29
17:0
2:29
18:1
2:29
19:2
2:29
20:3
2:29
21:4
2:29
22:5
2:29
0:02
:29
1:12
:29
2:22
:29
3:32
:29
4:42
:29
5:52
:29
7:02
:29
8:12
:29
9:22
:29
time
tem
pera
ture
(C)
TC292_experimentTC292_simulation
Figure 4.47. Comparison between the simulated and experimental results of TC292 during the 3rd
testing under the condition without PCM.
tem
pera
ture
(ºC
)

154
1717,5
1818,5
1919,5
2020,5
2121,5
2222,5
2323,5
2424,5
2525,5
26
10:0
2:29
11:0
2:29
12:0
2:29
13:0
2:29
14:0
2:29
15:0
2:29
16:0
2:29
17:0
2:29
18:0
2:29
19:0
2:29
20:0
2:29
21:0
2:29
22:0
2:29
23:0
2:29
0:02
:29
1:02
:29
2:02
:29
3:02
:29
4:02
:29
5:02
:29
6:02
:29
7:02
:29
8:02
:29
9:02
:29
time
tem
pera
ture
(C)
TC298_experiment
TC298_simulation
Figure 4.48. Comparison between the simulated and experimental results of TC298 during the 3rd
testing under the condition without PCM.
1717,5
1818,5
1919,5
2020,5
2121,5
2222,5
2323,5
2424,5
2525,5
26
10:0
2:29
11:0
2:29
12:0
2:29
13:0
2:29
14:0
2:29
15:0
2:29
16:0
2:29
17:0
2:29
18:0
2:29
19:0
2:29
20:0
2:29
21:0
2:29
22:0
2:29
23:0
2:29
0:02
:29
1:02
:29
2:02
:29
3:02
:29
4:02
:29
5:02
:29
6:02
:29
7:02
:29
8:02
:29
9:02
:29
time
tem
pera
ture
(C)
TC272_experimentTC272_simulation
Figure 4.49. Comparison between the simulated and experimental results of TC272 during the 3rd
testing under the condition without PCM.
tem
pera
ture
(ºC
) te
mpe
ratu
re (º
C)
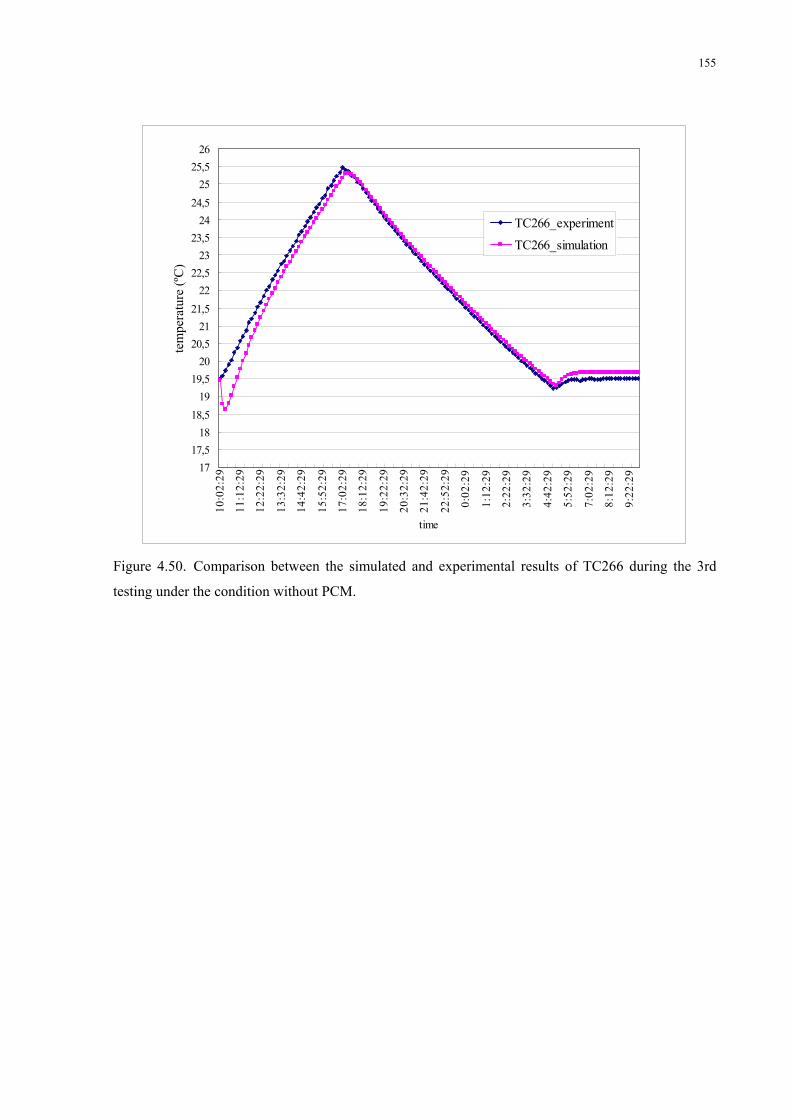
155
1717,5
1818,5
1919,5
2020,5
2121,5
2222,5
2323,5
2424,5
2525,5
26
10:0
2:29
11:1
2:29
12:2
2:29
13:3
2:29
14:4
2:29
15:5
2:29
17:0
2:29
18:1
2:29
19:2
2:29
20:3
2:29
21:4
2:29
22:5
2:29
0:02
:29
1:12
:29
2:22
:29
3:32
:29
4:42
:29
5:52
:29
7:02
:29
8:12
:29
9:22
:29
time
tem
pera
ture
(C)
TC266_experiment
TC266_simulation
Figure 4.50. Comparison between the simulated and experimental results of TC266 during the 3rd
testing under the condition without PCM.
tem
pera
ture
(ºC
)

156
0123456789
101112131415161718192021222324252627282930
10:0
2:29
11:0
2:29
12:0
2:29
13:0
2:29
14:0
2:29
15:0
2:29
16:0
2:29
17:0
2:29
18:0
2:29
19:0
2:29
20:0
2:29
21:0
2:29
22:0
2:29
23:0
2:29
0:02
:29
1:02
:29
2:02
:29
3:02
:29
4:02
:29
5:02
:29
6:02
:29
7:02
:29
8:02
:29
9:02
:29
time
tem
pera
ture
(C)
HFM157_experimentHFM157_simulationHFM025_experimentHFM025_simulation
Figure 4.51. Comparison between the simulated and experimental results of HFM025 and HFM157
during the 3rd testing under the condition without PCM.
(b) Test wall with PCM in the 8th testing.
With PCM layer, the simulated and experimental results of “TC292”, “TC298”, “TC272”,
“TC266”, “HFM025” and “HFM157” have been depicted in Figure 4.52 to Figure 4.56.
First, for the points of “TC298”, “TC272”, “TC266”, the simulated results are quite a good fit
with the experimental results within a difference of 1 ºC. During the heating stage, the
heat
flux
(W/m
2 )
157
simulated values are always lower than the experimental results, while the situation reverses
during the cooling stage. This means that the computational simulation overestimated the
thermal energy storage and release effect of PCM layer, which will be more clearly shown in
the later comparison of heat fluxes.
Second, the comparison for “TC292” is similar with the situation without PCM as discussed
above: the simulated and experimental results show similar trends of temperature evolution,
but the simulated result is always lower than the experimental data, while the differences are
mainly within 1.5 ºC.
Third, for the comparison of heat fluxes, first two hours’ abnormally increased simulation still
exists for “HFM157”, whereas this increase becomes not so obvious for “HFM025”. During
the rest hours, the energy storage and release effect of PCM layer has been clearly presented
by simulation as shown in Figure 4.56. Compared between the simulated and experimental
curves, their trends are similar but the energy storage and release effect of PCM layer are
obviously overestimated. During the heating stage, the simulated result of “HFM025” is 3-4
W/m2 higher than the experimental result, while the simulated value is a bit lower than the
experimental value before heater 1 was automatically turned on during the heating stage. On
the other hand, the trend of simulated result of “HFM157” agrees quite well with the
experimental results while the simulated value remains about 1 W/m2 higher.

158
0
0,5
1
1,5
2
2,5
3
3,5
4
4,5
5
5,5
6
10:0
2:29
11:0
2:29
12:0
2:29
13:0
2:29
14:0
2:29
15:0
2:29
16:0
2:29
17:0
2:29
18:0
2:29
19:0
2:29
20:0
2:29
21:0
2:29
22:0
2:29
23:0
2:29
0:02
:29
1:02
:29
2:02
:29
3:02
:29
4:02
:29
5:02
:29
6:02
:29
7:02
:29
8:02
:29
9:02
:29
time
tem
pera
ture
(C)
TC292_experiment
TC292_simulation
Figure 4.52. Comparison between the simulated and experimental results of TC292 during the 8th
testing under the condition with PCM.
1717,5
1818,5
1919,5
2020,5
2121,5
2222,5
2323,5
2424,5
2525,5
26
10:0
2:29
11:1
2:29
12:2
2:29
13:3
2:29
14:4
2:29
15:5
2:29
17:0
2:29
18:1
2:29
19:2
2:29
20:3
2:29
21:4
2:29
22:5
2:29
0:02
:29
1:12
:29
2:22
:29
3:32
:29
4:42
:29
5:52
:29
7:02
:29
8:12
:29
9:22
:29
time
tem
pera
ture
(C)
TC298_experimentTC298_simulation
Figure 4.53. Comparison between the simulated and experimental results of TC298 during the 8th
testing under the condition with PCM.
tem
pera
ture
(ºC
) te
mpe
ratu
re (º
C)
tem
pera
ture
(ºC
)

159
1717,5
1818,5
1919,5
2020,5
2121,5
2222,5
2323,5
2424,5
2525,5
26
10:0
2:29
11:1
2:29
12:2
2:29
13:3
2:29
14:4
2:29
15:5
2:29
17:0
2:29
18:1
2:29
19:2
2:29
20:3
2:29
21:4
2:29
22:5
2:29
0:02
:29
1:12
:29
2:22
:29
3:32
:29
4:42
:29
5:52
:29
7:02
:29
8:12
:29
9:22
:29
time
tem
pera
ture
(C)
TC272_experimentTC272_simulation
Figure 4.54. Comparison between the simulated and experimental results of TC272 during the 8th
testing under the condition with PCM.
1717,5
1818,5
1919,5
2020,5
2121,5
2222,5
2323,5
2424,5
2525,5
26
10:0
2:29
11:0
2:29
12:0
2:29
13:0
2:29
14:0
2:29
15:0
2:29
16:0
2:29
17:0
2:29
18:0
2:29
19:0
2:29
20:0
2:29
21:0
2:29
22:0
2:29
23:0
2:29
0:02
:29
1:02
:29
2:02
:29
3:02
:29
4:02
:29
5:02
:29
6:02
:29
7:02
:29
8:02
:29
9:02
:29
time
tem
pera
ture
(C)
TC266_experimentTC266_simulation
Figure 4.55. Comparison between the simulated and experimental results of TC266 during the 8th
testing under the condition with PCM.
tem
pera
ture
(ºC
) te
mpe
ratu
re (º
C)

160
01
2345
6789
10111213
14151617
18192021
22232425
26272829
3031
10:0
2:29
11:0
2:29
12:0
2:29
13:0
2:29
14:0
2:29
15:0
2:29
16:0
2:29
17:0
2:29
18:0
2:29
19:0
2:29
20:0
2:29
21:0
2:29
22:0
2:29
23:0
2:29
0:02
:29
1:02
:29
2:02
:29
3:02
:29
4:02
:29
5:02
:29
6:02
:29
7:02
:29
8:02
:29
9:02
:29
time
tem
pera
ture
(C)
HFM157_experiment
HFM157_simulation
HFM025_experiment
HFM025_simulation
Figure 4.56. Comparison between the simulated and experimental results of HFM025 and HFM157
during the 8th testing under the condition with PCM.
heat
flux
(W/m
2 )

161
4.8 Future work
From the experimental analysis, we can see that there are many places in the test rig which
could be improved in the future. First, in our experiment, in order to let the air temperature in
the metering box return to 20 ºC, we set the climatic box temperature to be at -20 ºC while the
air temperature in metering box was lower than 27 ºC. These operations restricted the
environment conditions in both the metering box and the climatic chamber. Furthermore,
according to the pc -T curve of DupontTM Energain® PCM panel in Figure 4.19, all the
experienced temperatures at the layer of PCM (-19~26.5 ºC ) were all within the phase change
ranges during the experiment. Therefore, in future experiments, we need to examine some
“extreme” conditions (for example increase the metering box air temperature to a level above
30 ºC) in the metering chamber to check the complete phase change processes. On the other
hand, we might try more temperature evolutions in the climatic box to test more situations.
Some recommendations to modifications of the test rig based on the above purposes include:
Adding the refrigeration system to the hot box (metering box and guard box), so that we
may also check the conditions in the metering box with a temperature lower than 20 ºC.
Adding the heating system to the climatic box, so that we may also simulate the summer
exterior conditions with a temperature higher than 25 ºC
Second, due to the structure of the metering box, there exists no ventilation system. However,
in the future experiments, it is necessary to be required to test the condition under certain
ventilation patterns to the tested wall, for example simulating the night ventilation. However,
how to equip a ventilation tunnel to the metering box without compromising the international
hot box standard (ISO 8990:1994 [109] and ISO 12567-1:2000 [110]) is a challenge for the
further modifications for the test rig.
Third, due to the fan in the metering box, the air velocities in this experiment were restrained
below 0.4 m/s. It is important that in the future larger velocities could be tested, for example
higher than 1 m/s, to further examine the influence of mechanical convection. Moreover, it is
a pity that the air velocities measured in the experiment were fluctuating and not so accurate,
thus it is recommended that in the future, a more sophisticated air velocity meter should be
installed to the metering box and connected to the logging system.
162
Furthermore, the experiments conducted in this thesis project are just a beginning of the
research for PCM integrated wall, and much more work and studies should be conducted in
future. Some possible topics include:
Investigatation of the relationships and influences between PCM wallboards and the
air-conditioning system.
Investigation of the temperature-regulating/buffering performances under different layout
of PCM panels inside the room envelope.
Investigation of the arrangement of PCM panels in different wall layers.
Investigation of the combination of PCM with other traditional sensible thermal storage
methods.
As the hot boxes are prepared to be modified so that the whole test rig can be rotated, we
may further test the conditions of PCM walls with tilted angles, horizontal roofs, ceilings
and floors in future.

163
5 CONCLUSIONS
5.1 Conclusions for the review of thermal energy storages
In this thesis, the thermal energy storage solutions with their categories, characteristics and
certain applications have been systematically described. Based on the energy storage material,
the thermal energy storage solutions can be classified into the sensible, latent and
thermochemical heat storages.
Considering the sensible thermal storage solutions, the theoretical and technological research
and applications for the liquids and solids form have been developed to a relatively mature
stage. For the residential and building applications, the liquids thermal storage are normally
utilized as a separate storage unit, such as water storage and solar pond; while the solids form
can not only be implemented as a separate storage unit, such as packed bed storage, but also
further extend its applications to be part of building, such as an envelope integrated energy
storage.
Considering the themochemical energy storage, this technology utilizes the reversible chemical
reactions during the charging and discharging periods. The advantages of this technology is that
if the resultants of the reaction can be well separated, the storage mediums will be very stable,
thus suitable for long term storage. However, up till now, almost no reversible chemical
reaction is known to be within the temperature ranges of building applications.
As a further evolution of the envelope integrated sensible thermal storage solution, phase
change materials (PCMs) have been developed as an excellent candidate for the building
thermal mass due to their enhanced thermophysical properties during the phase change
processes. Normally solid-liquid PCMs are utilized for the building applications, which can be
further subclassified into organic-, inorganic- and eutectic-PCMs. Their applications can cover
almost every part of the building envelopes, such as wall, floor, ceiling, roof, window and
sunshading systems. They can either be functioned as a thermal buffer to alleviate the exterior
164
environmental influences, or as an “automatic” indoor temperature regulator to attenuate the
indoor temperature fluctuations and improve the thermal comfort.
Up till now, there still exist theoretical and technical problems for the seasonal thermal energy
storage solutions. Several applications of sensible seasonal thermal storage have been
implemented in the forms of “HWTES”, “ATES”, “CTES”, “BTES” and “GWTES” with some
technical problems in certain projects. Some problems of these sensible seasonal storage
systems include wrong estimation of the design value during the planning period, undesirable
high temperatures of the storage medium, poor insulation of the storage envelopes,
inconsistency between the heat supplying and storage system, and the size problems of the
storage volume [8]. For PCM seasonal storage, the enhanced thermal storage capability of PCM
allows the reduction of storage size, relatively constant storage temperatures and desirable heat
exchange rate. The technology is relatively mature for the snow/ice as the medium in the PCM
seasonal storage and many successful projects of snow/ice seasonal storage systems have been
operated in USA and Europe. However, the implementations of modern PCM (instead of water)
as the storage medium are very limited and require further development. According to Öztürk’s
research [106], how to improve the exergy efficiency of the PCM seasonal storage is the most
critical challenge in this technology. Furthermore, the economical effects for both sensible and
latent seasonal storages need more researches in future.
5.2 Conclusions for PCM wall experiments
The laboratory work in this thesis project was focused on the PCM integrated wall with the
purposes to investigate the influences by the convective conditions and attachment of PCM
layer. Based on the analysis of the experimental results, several important conclusions can be
made.
First, the influence on the temperatures of metering box air and tested wall surface by the
convective condition and attachment of PCM layer. The attenuation effect of the mean air and
interior surface temperatures by the attachment of PCM panels is very obvious, and the time
lag effect during the cooling period for the air temperature to return to 20 ºC could be noticed
in each testing. Furthermore, the higher the air velocity over the interior surface during the
heating stage, the lower the maximum air and surface temperatures would be by the end of the
165
heating stage. The increase or decrease rate of the air temperature in the metering box slowed
down due to the enhanced heat exchange between the interior air and tested wall during the
phase change processes of the PCM layer. Moreover, the temperature difference between the
metering box air and surface temperature of the tested wall with PCM layer was larger than
the condition without PCM, especially during the heating stage.
Second, the influence on the temperature stratifications in the metering box by the convective
condition and attachment of PCM layer. Considering the influence by convective condition,
higher air flow rate can more effectively reduce the stratifications of the air temperatures in
the metering box; whereas for the interior surface temperatures of the tested wall, we can only
say that, as long as the fan is operating, the lower the generated air flow rate, the higher the
stratifications will be. In addition, we also find that the air temperature stratifications are more
influenced by the air flow rate than the heat supplying, whereas the surface temperature
stratifications are in the reverse way. Considering the influence by the attachment of PCM
layer: during the steady state condition (after the temperature in the metering box returned to
20 ºC in the ending period of each testing), the attachment of PCM layer would decrease the
stratifications of both air and surface temperatures; however, during the unsteady state, i.e. the
temperature in the increase or decrease state, the surface temperature stratifications were
enhanced by the attachment of PCM layer, but this reversed effect was almost negligible for
the air temperature stratifications.
Third, the influence on the heat fluxes by attachment of PCM layer. During the heating stage
(10:00-17:00), the heat flux rates at the surface of the interior gypsum board (seen from the
hot side) were significantly enhanced, while those at the surface of the vapor barrier (seen
from the hot side) were correspondingly attenuated by the attachment of PCM layer, but the
former enhancement extent were much higher than the latter attenuation extent. On the other
aspect, during the cooling stage (17:00-10:00), the heat flux rates at the surface of the interior
gypsum board (seen from the hot side) were decreased by the attachment of PCM layer, while
the fluctuations of the heat fluxes at the surface of the vapor barrier (seen from the hot side)
were attenuated. The above two phenomena are essentially due to the enhanced energy
storage and release effect of the tested wall by the attachment of PCM layer whose
enhancement effects can be noticed in Figure 4.43.
Fourth, the influence on the heat flux stratifications by the attachment of PCM layer.

166
Considering the heat fluxes at the surface of the interior gypsum board (seen from the hot
side), the heat flux stratification under the condition without PCM was in such a way that the
higher the position, the lower the heat fluxes would be for both the heating and cooling
periods; under the condition with PCM, during the heating stage, normally the higher the
position, the higher the heat fluxes would be, but the situation was in reverse during the
cooling stage. Considering the heat fluxes at the surface of the vapor barrier (seen from the
hot side), the heat flux stratification was always in such an order that, the higher the position,
the lower the heat fluxes would be. The above two phenomena were mainly due to
asynchronous step of the phase change processes of the PCM layer at different heights as well
as the different stratification extents in air and surface temperatures.
Fifth, the influence on the mean conductive loss of the tested wall by convective condition and
attachment of PCM layer. Considering the influence by convective condition, generally
speaking, the higher the air flow rate in the metering box during the heating stage, the lower
the heat conductive loss would be, due to the enhanced attenuation effect of the air and
surface temperatures in the metering box. Considering the influence by attachment of PCM
layer, during the heating stage (10:00-17:00), the energy storage effect of the PCM layer
significantly decreased the heat conductive loss through the tested wall, thus presenting a
better insulation function during the heating stage. On the other hand, during the cooling stage
(17:00-10:00), before the thermostat was automatically turned on, the decrease rate of the heat
conductive loss slowed down by attachment of PCM due to the attenuation effect of the
decrease rate for air and surface temperatures in the metering box; after the thermostat was
automatically turned on, the thermal conductive losses with and without PCM remained at a
similar value especially during the steady state due to the similar conductivities of the tested
walls.
Sixth, the influence on the convection coefficient of the interior surface of the tested wall by
convective condition and attachment of PCM layer. Considering the influence by convective
condition during the heating stage, under mechanical convection, the increased fan flow rate
would effectively enhance the convective heat transfer process through the interior surface.
Considering the influence by attachment of PCM layer, during the heating stage (10:00-17:00),
the convection coefficient would be enhanced by the attachment of PCM layer under
mechanical convection (as the phase change processes), and the higher the fan flow rate, the
larger the convection coefficient would be; while during the cooling stage (17:00-10:00), the
167
natural convection coefficient during the cooling period of each testing was significantly
enhanced by attachment of PCM, and this enhancement effect was irrelevant with the air flow
rate during the heating stage. However, under natural convective heating, the convection
coefficients with and without PCM layer are similar in our experiment, which is contradictive
with some previous researches.
Seventh, the influence on the energy saving effect by attachment of PCM layer and convective
condition. Considering the influence by attachment of PCM layer, the energy consumption
was significantly decreased under the same convective condition due to the enhanced heat
storage and release effect by PCM layer. Considering the influence by convective condition,
under both the conditions with and without PCM layer, the lower the air flow rate, the lower
the total electricity consumption would be, but it does not mean that the natural convection
would be the best choice in real applications. The best optimization of convective condition
should be based on the analysis of human comfort zone under certain conditions in room
environment.
As an additional purpose of this experiment, the simulated results have been compared with
the experimental results for the temperature evolutions at different layers of the tested wall as
well as the heat fluxes. It has been found that, under both the conditions with and without
PCM layer, the main trends of the simulated temperatures are in accordance with the
experimental ones, but the differences still exist throughout the whole testing period
especially for the interface between two layers of mineral wools (seen from hot side).
Furthermore, during the first hour of each testing, relatively large temperature errors of
simulation occurred at the surfaces of vapor barrier and interior gypsum board, which might
result from the inconsistence between the surface conditions in the real test rig and the
settings in software. Moreover, from the comparison of heat fluxes, it has been found that the
simulation overestimated the energy storage and release effect of PCM layer than real
situation.

168
6 REFERENCES
[1] The Research Centre on Zero Emission Buildings (ZEB), “ZEB,” The Research Centre on
Zero Emission Buildings (ZEB). [Online]. Available:
http://www.sintef.no/projectweb/zeb. [Accessed: April 23, 2010].
[2] S. M. Hasnain, “Review on sustainable thermal energy storage technologies, part I: Heat
storage materials and techniques,” Energy Conversion and Management, Vol. 39, pp.
1127-1138, 1998.
[3] S. M. Hasnain, “Review on sustainable thermal energy storage technologies, part II: Cool
Thermal Storage,” Energy Conversion and Management, Vol. 39, pp. 1139-1153, 1998.
[4] A. Sharma, V.V. Tyagi, C.R. Chen, D. Buddhi, “Review on thermal energy storage with
phase change materials and applications,” Renewable and Sustainable Energy Reviews, Vol.
13, pp. 318-345, 2009.
[5] F. P. Incropera and D. P. Dewitt, Fundamentals of Heat and Mass Transfer, 5th ed., John
Wiley and Sons, 2002.
[6] J. A. Duffie and W. A. Beckham, Solar engineering of thermal processes, 3rd ed., John
Wiley and Sons, 2006.
[7] A. V. Novo, J. R. Bayon, D. Castro-Fresno, J. Rodriguez-Hernandez. “Review of seasonal
heat storage in large basins: Water tanks and gravel–water pits,” Applied Energy, Vol. 87,
pp. 390-397, 2010.
[8] D. Bauer, R. Marx, J. Nußbicker-Lux, F. Ochs, W. Heidemann, H. Müller-Steinhagen,
“German central solar heating plants with seasonal heat storage,” Solar Energy, Vol. 84,
pp. 612-623, 2010.
[9] H. O. Paksoy, O. Andersson, S. Abaci, H. Evliya, B. Turgut, “Heating and cooling of a
hospital using solar energy coupled with seasonal thermal energy storage in an aquifer,”
Renewable Energy, Vol. 19, pp. 117-122, 2000.
[10] O. Andersson, “ATES utilization in Sweden-An overview,” Proceedings of
MEGASTOCK’97 7th International Conference on Thermal Energy Storage, Vol. 2, pp.
925-930, 1997.
[11] H. Kurt, F. Halici, A. Korhan Binarkc, “Solar pond conception - experimental and
169
theoretical studies,” Energy Conversion and Management, Vol. 41, pp. 939-951, 2000.
[12] V. Velmurugan, K. Srithar, “Prospects and scopes of solar pond: A detailed review,”
Renewable and Sustainable Energy Reviews, Vol. 12, pp. 2253-2263, 2008.
[13] M. Hassairi, M. J. Safi, S. Chibani, “Natural brine solar pond: an experimental study,”
Solar Energy, Vol. 70, pp. 45-50, 2001.
[14] G. R. Ramakrishna Murthy, K. P. Pandey, “Scope of fertilizer solar ponds in Indian
agriculture,” Energy, Vol. 27, pp. 117-126, 2002.
[15] S. Folchitto, “Seawater as salt and water source for solar ponds,” Solar Energy, Vol. 46,
pp. 343-351, 1991.
[16] The Energy and Resources Institute (TERI), “Salt-gradient solar ponds Salt of the earth,”
The Energy and Resources Institute. [Online]. Available:
http://www.teriin.org/tech_solarponds.php. [Accessed April 22, 2010].
[17] C. Nielson, A. Akbarzedeh, J. Andrews, Humberto R Becerra L and P. Golding, “The
History of Solar Pond Science & Technology,” Proceedings of the International Solar
Energy Society, 2005.
[18] Research Institute for Sustainable Energy (RISE), “Solar ponds,” Research Institute for
Sustainable Energy. [Online]. Available:
http://www.rise.org.au/info/Tech/lowtemp/ponds.html. [Accessed April 22, 2010].
[19] “Texas Renewable Energy Projects,” Texas State Energy Conservation Office. [Online].
Available: http://www.infinitepower.org/projects.htm. [Accessed April 22, 2010].
[20] H. Singh, R. P. Saini, J. S. Saini, “A review on packed bed solar energy storage systems,”
Renewable and Sustainable Energy Reviews, Vol. 14, pp. 1059-1069, 2010.
[21] D. Jain, “Modeling the performance of greenhouse with packed bed thermal storage on
crop drying application,” Journal of Food Engineering, Vol. 71, pp. 170-178, 2005.
[22] B. Paul, J. S. Saini, “Optimization of bed parameters for packed bed solar energy
collection system,” Renewable Energy, Vol. 29, pp. 1863-1876, 2004.
[23] M. B. Russell, P. N. Surendran, “Influence of active heat sinks on fabric thermal storage
in building mass,” Applied Energy, Vol. 70, pp. 17-33, 2001.
[24] D. Horton, Max Fordham LLP, “The importance of thermal mass: lightweight or
heavyweight,” AECB annual Conference 2006. [Online]. Available:
http://www.aecb.net/conference2006.php. [Accessed: April 22, 2010].
[25] F. Ståhl, “Influence of thermal mass on the heating and cooling demands of a building
unit,” PhD thesis, Chalmers University of Technology, Göteborg, Sweden, 2009.
[26] M. R. Shaw, K. W. Treadaway, and S. T. P. Willis, “Effective use of building mass,”
170
Renewable Energy, Vol. 5, pp. 1028-1038, 1994.
[27] P. Barton, C. B. Beggs, P. A. Sleigh, “A theoretical study of the thermal performance of
the TermoDeck hollow core slab system,” Applied Thermal Engineering, Vol. 22, pp.
1485-1499, 2002.
[28] J. A. Simmons, “Reversible oxidation of metal oxides for thermal energy storage,”
Proceedings of ISES Meeting, Vol. 8, pp. 219-225, 1976.
[29] I. Fujii, K. Tsuchiya, M. Higano, and J. Yamada, “Studies of an energy storage system by
use of the reversible chemical reaction: 2 2CaO + H O Ca(OH)↔ ,” Solar Energy, Vol.
34, pp. 367-377, 1985.
[30] I. Fujii, K. Tsuchiya, and M. S. Murthy, “Consideration on thermal decomposition of
calcium hydroxide pellets for energy storage,” Journal of Solar Energy Engineering, Vol.
111, pp. 245-250, 1989
[31] M. N. Azpiazu, J. M. Morquillas, and A. Vazquez, “Heat recovery from a thermal energy
storage based on the Ca(OH)2/CaO cycle,” Applied Thermal Engineering, Vol. 23, pp.
733-741, 2003.
[32] B. Carlsson and G. Wettermark, “The photochemical heat pipe,” Solar Energy, Vol. 21,
pp. 87-92, 1978.
[33] V. V. Tyagi, D. Buddhi, “Thermal cycle testing of calcium chloride hexahydrate as a
possible PCM for latent heat storage,” Solar Energy Materials & Solar Cells, Vol. 92, pp.
891-899, 2008.
[34] D. Feldman, D. Banu, “DSC analysis for the evaluation of an energy storing wallboard,”
Thermochimica Acta, Vol. 272, pp. 243-251, 1996.
[35] DupontTM Energain®, “DupontTM Energain® Energy-Saving Thermal Mass Systems, Data
Sheet-Measured Properties,” DupontTM Energain®, 2007. [Online]. Available:
http://energain.co.uk/Energain/en_GB/assets/downloads/tech_info/dupont_energain_dat
asheet.pdf. [Accessed: April 23, 2010].
[36] F. Kuznik, J. Virgone, “Experimental assessment of a phase change material for wall
building use,” Applied Energy, vol. 86, pp. 2038-2046, 2009.
[37] F. Kuznik, J. Virgone, “Experimental investigation of wallboard containing phase change
material: Data for validation of numerical modeling,” Energy and Building, vol. 41, pp.
561-570, 2009.
[38] I.O. Salyer, A. K. Sircar, “Phase change materials for heating and cooling of residential
buildings and other applications,” Proceedings of the 25th intersociety energy conversion
171
engineering conference IECEC’90, 1990.
[39] D. Banu, D. Feldman, F. Haghighat, J. Paris, “Hawes D. Energy-storing wallboard:
flammability tests,” Journal of Materials in Civil Engineering, Vol. 10, pp. 98-105, 1998.
[40] Y. Zhang, G. Zhou, K. Lin, Q. Zhang, H. Di, “Application of latent heat thermal energy
storage in buildings: State-of-the-art and outlook,” Building and Environment, Vol. 42,
pp. 2197-2209, 2007.
[41] A. Abhat, “Low temperature latent heat thermal energy storage: heat storage materials,”
Solar Energy, Vol. 30, pp. 313–332, 1983.
[42] D. Feldman, M. M. Shapiro, D. Banu, “Organic phase change materials for thermal
energy storage,” Solar Energy Materials, Vol. 13, pp. 1-10, 1986.
[43] B. Zalba, J. M. Marin, L. F. Cabeza, H. Mehling, “Review on thermal energy storage with
phase change: materials, heat transfer analysis and applications,” Applied Thermal
Engineering, Vol. 23, pp. 251-283, 2003.
[44] I. Dincer, M. A. Rosen, Thermal energy storage, Systems and Applications, Chichester
(England): John Wiley & Sons, 2002.
[45] G. A. Lane, “Low temperature heat storage with phase change materials,” Internal
Journal of Ambient Energy, Vol. 1, pp. 155-168, 1980.
[46] D. W. Hawes, D. Feldman, D. Banu, “Latent heat storage in building materials,” Energy
and Buildings, Vol. 20, pp. 77-86, 1993.
[47] G. Belton, F. Ajami, “Thermochemistry of salt hydrates,” Report No.
NSF/RANN/SE/GI27976/TR/73/4, Philadelphia (Pennsylvania, USA), 1973.
[48] R. Naumann, H. H. Emons, “Results of thermal analysis for investigation of salt hydrates
as latent heat-storage materials,” Journal of Thermal Analysis, Vol. 35, pp. 1009-1031,
1989.
[49] T. Wada, F. Yokotani, Y. Matsuo, “Equilibria in the aqueous ternary system containing +Na , 3 2CH CO− , 4
2 7P O − between 38 and 85 ºC,” Bulletin of the Chemical Society of
Japan, Vol. 57, pp. 1671-1672, 1984.
[50] K. Nagano, T. Mochida, K. Iwata, H. Hiroyoshi, R. Domanski, “Thermal performance of
3 2 2Mn(NO ) 6H O⋅ as a new PCM for cooling system,” 5th Workshop of the IEA ECES
IA Annex 10, Tsu (Japan), 2000.
[51] M. Telkes, “Thermal storage for solar heating and cooling,” Proceedings of the Workshop
on Solar Energy Storage Subsystems for the Heating and Cooling of Buildings,
Charlottesville (Virginia, USA), 1975.

172
[52] M. N. R. Dimaano, T. Watanabe, “The capric and lauric acid mixture with chemical
additives as latent heat storage materials for cooling application,” Energy, Vol. 27, pp.
869-888, 2002.
[53] J.-H. Li, G.-E Zhang, J.-Y. Wang, “Investigation of a eutectic mixture of sodium acetate
trihydrate and urea as latent heat storage,” Solar Energy, Vol. 47, pp. 443-445, 1991.
[54] “Micronal® PCM,” BASF. [Online]. Available: www.micronal.de. [Accessed: April 23,
2010].
[55] BASF, “Micronal® PCM Intelligent Temperature Management for Buildings,” BASF.
[Online]. Available: http://www.micronal.de/portal/streamer?fid=443847. [Accessed:
April 23, 2010].
[56] “Knauf Gips KG,” Knauf Gips KG. [Online]. Available: www.knauf.de. [Accessed: April
23, 2010].
[57] C. Benard, Y. Body, A. Zanoli, “Experimental Comparison of latent and sensible heat
thermal walls,” Solar Energy, Vol. 34, pp. 475-487, 1985.
[58] A. A. Ghoneim, S. A. Klein, and J. A. Duffie, “Analysis of collector-storage building
walls using phase-change materials,” Solar Energy, Vol. 47, pp. 237-242, 1991.
[59] U. Stritih, P. Novak, “Solar heat storage wall for building ventilation,” Renewable Energy,
Vol. 8, pp. 268-271, 1996.
[60] A. J. N. Khalifa, E. F. Abbas, “A comparative performance study of some thermal storage
materials used for solar space heating,” Energy and Buildings, Vol. 41, pp. 407-415,
2009.
[61] L. F. Cabeza, C. Castellon, M. Nogues, M. Medrano, R. Leppers, O. Zubillaga, “Use of
microencapsulated PCM in concrete walls for energy savings,” Energy and Buildings,
vol. 39, pp. 113-119, 2007.
[62] A. Castell, I. Martorell, M. Medrano, G. Perez, L. F. Cabeza, “Experimental study of
using PCM in brick constructive solutions for passive cooling,” Energy and Buildings,
Vol. 42, pp. 534-540, 2010.
[63] Rubitherm GmbH, “PCM compact storage, Rubitherm® CSM,” Rubitherm GmbH.
[Online]. Available: http://www.rubitherm.de/english/index.htm. [Accessed: April 23,
2010].
[64] F. Kuznik, J. Virgone, R. Reisdorf, “Experimental investigation of thermal behaviour of
phase change materials under dynamical thermal effects,” DupontTM Energain®, 2006.
[Online]. Available:
http://energain.co.uk/Energain/en_GB/assets/downloads/tech_papers/experimental_inves

173
tigation_of_thermal_behaviour_of_phase_change_materials_under_dynamical_thermal_
effects.pdf. [Accessed: April 23, 2010].
[65] M. Ahmad, A. Bontemps, H. Sallee, D. Quenard, “Thermal testing and numerical
simulation of a prototype cell using light wallboards coupling vacuum isolation panels and
phase change material,” Energy and Buildings, Vol. 38, pp. 673-681, 2006.
[66] J. Virgone, F. Kuznik, “Effect of PCM in internal temperature: Experiments in the test
room MINIBAT,” DupontTM Energain®, 2006. [Online]. Available:
http://energain.co.uk/Energain/en_GB/assets/downloads/tech_papers/effect_of_pcm_in_i
nternal_temperature.pdf. [Accessed: April 23, 2010].
[67] H. Liu, H. B. Awbi, “Performance of phase change material boards under natural
convection,” Building and Environment, vol. 44, pp. 1788-1793, 2009.
[68] A. K. Athienitis, Y. Chen, “Experimental and theoretical investigation of floor heating
with thermal storage,” ASHRAE Transactions, Vol. 99, pp. 1049-1057, 1993.
[69] A. K. Athienitis, Y. Chen, “The effect of solar radiation on dynamic thermal performance
of floor heating systems,” Solar Energy, Vol. 69, pp. 229-237, 2000.
[70] M. Amir, M. Lacroix, N. Galanis, “Thermal analysis of electric heating floor panels with
daily heat storage,” Revue Generale de Thermique, Vol. 38, pp. 121-131, 1999.
[71] K. Lin, Y. Zhang, H. Di, R. Yang, “Study of electrical heating system with ductless air
supply and shape-stabilized PCM for thermal storage,” Energy Conversion and
Management, Vol. 48, pp. 2016-2024, 2007.
[72] K. Lin, Y. Zhang, X. Xu, H. Di, R. Yang, P. Qin, “Experimental study of under-floor
electric heating system with shape-stabilised PCM plates,” Energy and Buildings, Vol. 37,
pp. 215-220, 2005.
[73] K. Lin, Y. Zhang, X. Xu, H. Di, R. Yang, P. Qin, “Modeling and simulation of
under-floor electric heating system with shape-stabilised PCM plates,” Building and
Environment, Vol. 39, pp. 1427-1434, 2004.
[74] J. Li, P. Xue, H. He, W. Ding, J. Han, “Preparation and application effects of a novel
form-stable phase change material as the thermal storage layer of an electric floor
heating system,” Energy and Buildings, Vol. 41, pp. 871-880, 2009.
[75] NetGreen Solar Ltd., “NetGreen Solar, Products,” NetGreen Solar Ltd. [Online].
Available: http://www.netgreensolar.com/page2.html. [Accessed: Jan 28, 2010].
[76] “PCM under-floor heating system,” NetGreen Solar Ltd. [Online]. Available:
http://www.netgreensolar.com/images/products/pcm_floor_system.htm. [Accessed: Jan
28, 2010].

174
[77] “PCM floor panel installation,” NetGreen Solar Ltd. [Online]. Available:
http://www.netgreensolar.com/images/products/pcm_floor_panels.htm. [Accessed: Jan
28, 2010].
[78] X. Wang, J. Niu, “Performance of cooled-ceiling operating with MPCM slurry,” Energy
Conversion and Management, Vol. 50, pp. 583-591, 2009.
[79] P. W. Griffiths, P. C. Eames, “Performance of chilled ceiling panels using phase change
material slurries as the heat transport medium,” Applied Thermal Engineering, Vol. 27,
pp. 1756-1760, 2007.
[80] M. Koschenz, B. Lehmann, “Development of a thermally activated ceiling panel with
PCM for application in lightweight and retrofitted buildings,” Energy and Buildings, Vol.
36, pp. 567-578, 2004.
[81] PCM Products Ltd., “Phase Change Materials Thermal Energy Storage,” PCM Products
Ltd. [Online]. Available: http://www.pcmproducts.net/home.htm. [Accessed: April 23,
2010].
[82] PCM Products Ltd., “Nottingham Passive Cooling,” PCM Products Ltd. [Online].
Available: http://www.pcmproducts.net/files/nottingham_passive_cooling.pdf. [Accessed:
April 23, 2010].
[83] PCM Products Ltd., “China Shipping FlatICE System,” PCM Products Ltd. [Online].
Available:
http://www.pcmproducts.net/files/china_shipping_flatice_system_1_.pdf. [Accessed:
April 23, 2010].
[84] PCM Products Ltd., “FlatICETM Catalogue,” PCM Products Ltd. [Online]. Available:
http://www.pcmproducts.net/files/flatice.pdf. [Accessed: April 23, 2010].
[85] A. Pasupathy, L. Athanasius, R. Velraj, R. V. Seeniraj, “Experimental investigation and
numerical simulation analysis on the thermal performance of a building roof
incorporating phase change material (PCM) for thermal management,” Applied Thermal
Engineering, Vol. 28, pp. 556-565, 2008.
[86] A. Pasupathy, R. Velraj, “Effect of double layer phase change material in building roof
for year round thermal management,” Energy and Buildings, Vol. 40, pp. 193-203, 2008.
[87] Climator Sweden AB, “Climator producr: ClimSel C32,” Climator Sweden AB. [Online].
Available: http://www.climator.com/files/climsel%20c32.pdf. [Accessed: April 23,
2010].
[88] Y. Fang, P. C. Eames, T. J. Hyde, B. Norton, “Complex multimaterial insulating frames
for windows with evacuated glazing,” Solar Energy, Vol. 79, pp. 245-261, 2005.

175
[89] Y. Fang, P. C. Eames, B. Norton, “Effect of glass thickness on the thermal performance
of evacuated glazing,” Solar Energy, Vol. 81, pp. 395-404, 2007.
[90] K. A. R. Ismail, C. T. Salinas, J. R. Henriquez, “A comparative study of naturally
ventilated and gas filled windows for hot climates,” Energy Conversion and
Management, Vol. 50, pp. 1691-1703, 2009.
[91] S. Reilly, D. Arasteh, M. Rubin, “The effects of infrared absorbing gases on window heat
transfer: a comparison of theory and experiment,” Solar Energy Materials, Vol. 20, pp.
277-288, 1990.
[92] K. I. Jensen, J. M. Schultz, F. H. Kristiansen, “Development of windows based on highly
insulating aerogel glazings,” Journal of Non-Crystalline Solids, Vol. 350, pp. 351-357,
2004.
[93] J. M. Schultz, K. I. Jensen, F. H. Kristiansen, “Super insulating aerogel glazing,” Solar
Energy Materials & Solar Cells, Vol. 89, pp. 275-285, 2005.
[94] J. M. Schultz, K. I. Jensen, “Evacuated aerogel glazings,” Vacuum, Vol. 82, pp. 723-729,
2008.
[95] A. M. Al-Shukri, “Thin film coated energy-efficient glass windows for warm climates,”
Desalination, Vol. 209, pp. 290-297, 2007.
[96] R. Baetens, B. P. Jelle, A. Gustavsen, “Properties, requirements and possibilities of smart
windows for dynamic daylight and solar energy control in buildings: A state-of-the-art
review,” Solar Energy Materials & Solar Cells, Vol. 94, pp. 87-105, 2010.
[97] K.A.R. Ismail, J.R. Henriquez, “Thermally effective windows with moving phase change
material curtains,” Applied Thermal Engineeing, Vol. 21, pp. 1909-1923, 2001.
[98] K. A. R. Ismail, C. T. Salinas, J. R. Henriquez, “Comparison between PCM filled glass
windows and absorbing gas filled windows,” Energy and Buildings, Vol. 40, pp. 710-719,
2008.
[99] K. A. R Ismail, J. R. Henriquez, “Parametric study on composite and PCM glass
systems,” Energy Conversion and Management, Vol. 43, pp. 973-993, 2002.
[100] H. Mehling, “Strategic project ‘Innovative PCM-Technology,’-Results and future
perspectives,” 8th Expert Meeting and Workshop, Kizkalesi, Turkey, April 18-20, 2005.
[Online]. Available:
http://www.fskab.com/Annex17/Workshops/EM8%20Kizkalesi/Presentations/Innovative
%20PCM-Technology.pdf. [Accessed: April 23, 2010].
[101] ZAE Bayern, “Tätigkeitsbericht 2004, Annual Report,” ZAE Bayern, Dec. 31st, 2004.
[Online]. Available:

176
http://www.zae-bayern.de/deutsch/abteilung-allgemein/publikationen/jahresberichte/arch
iv.html. [Accessed: April 23, 2010].
[102] K. Skogsberg, B. Nordell, “The Sundsvall hospital snow storage,” Cold Region Science
and Technology, Vol. 32, pp. 63-70, 2001.
[103] M. Masoero, “Refrigeration systems based on long-term storage of ice,” International
Journal of Refrigeration, Vol. 7, pp. 93-100, 1984.
[104] D. L. Kirkpatrick, M. Masoero, A. Rabl, C. E. Roedder, R. H. Socolow, and T. B. Taylor,
“The ice pond - production and seasonal storage of ice for cooling,” Solar Energy, Vol.
35, pp. 435-445, 1985.
[105] H. C. Fischer, “Seasonal ice storage for domestic heat pumps,” International Journal of
Refrigeration, Vol. 4, pp. 135-138, 1981.
[106] H. H. Öztürk, “Experimental evaluation of energy and exergy efficiency of a seasonal
latent heat storage system for greenhouse heating,” Energy Conversion and
Management, Vol. 46, pp. 1523-1542, 2005.
[107] Q. Qi, S. Deng, Y. Jiang, “A simulation study on a solar heat pump heating system with
seasonal latent heat storage,” Solar Energy, Vol. 82, pp. 669-675, 2008.
[108] M. Ahmad, A. Bontemps, H. Sallee, D. Quenard, “Experimental investigation and
computer simulation of thermal behaviour of wallboards containing a phase change
material,” Energy and Buildings, Vol. 38, pp. 357-366, 2006.
[109] Standard Norge, “Thermal insulation - Determination of steady-state thermal
transmission properties - Calibrated and guarded hot box (ISO 8990: 1994),” Norsk
Standard NS-EN ISO 8990, April 1997.
[110] Standard Norge, “Thermal performance of windows and doors – Determination of
thermal transmittance by hot box method – Part 1: Complete windows and doors (ISO
12567-1: 2000),” Norsk Standard NS-EN ISO 12567-1, December 2000.
[111] H. Sallee, “Thermal characterization, before and after aging of DupontTM Energain®
Panels,” CSTB, Saint Martin d’Hères, N/Réf. CPM/09-035/HS/MLE/, February 13,
2008.

177
APPENDIX I Building-focused PCM portrait (Phase change temperature in the region of 15-35 ºC which is suitable for the buildings) Manufacturer Product Name Phase Change
Material Phase change temp (ºC)
Latent heat of fusion (kJ/kg)
Conducti-vity k (W/(m·K))
Other technical properties Ref
DuPont de Nemours (Luxembourg) S.à r.l. Rue General Patton L-2984 Luxembourg Tel: 00352 3666 5885 Fax: 00352 3666 5021 E-mail: [email protected] www.energain.dupont.com
DuPont™ Energain® Thermal Mass Panel
Paraffin Wax (The core material of the panel is a mix of a copolymer and a paraffin wax)
21.7 >70 Solid: 0.18; Liquid: 0.14
See the data sheet on: http://energain.co.uk/Energain/en_GB/assets/downloads/tech_info/dupont_energain_datasheet.pdf
www.energain.dupont.com; http://energain.co.uk/Energain/en_GB/products/panel.html/index.html; http://energain.co.uk/Energain/en_GB/assets/downloads/tech_info/dupont_energain_datasheet.pdf;
PureTemp™ PCMs PureTemp 15
vegetable-based fats and oils during a Phase 1 and 2 SBIR Program
15 205 - -
PureTemp™ PCMs PureTemp 18
vegetable-based fats and oils during a Phase 1 and 2 SBIR Program
18 195 - -
Entropy Solutions, Inc. 9827 Valley View Road, Minneapolis, MN 55344, USA Tel: 952-941-0306 Fax: 952-944-6893 http://www.entropysolutionsinc.com/default.htm
PureTemp™ PCMs PureTemp 23
vegetable-based fats and oils during a Phase 1 and 2 SBIR Program
23 208 - See the Entropy DSC Curve: www.entropysolutionsinc.com/images/i/DSC_23.gif
http://www.entropysolutionsinc.com/default.htm; http://www.entropysolutionsinc.com/technology.htm#product
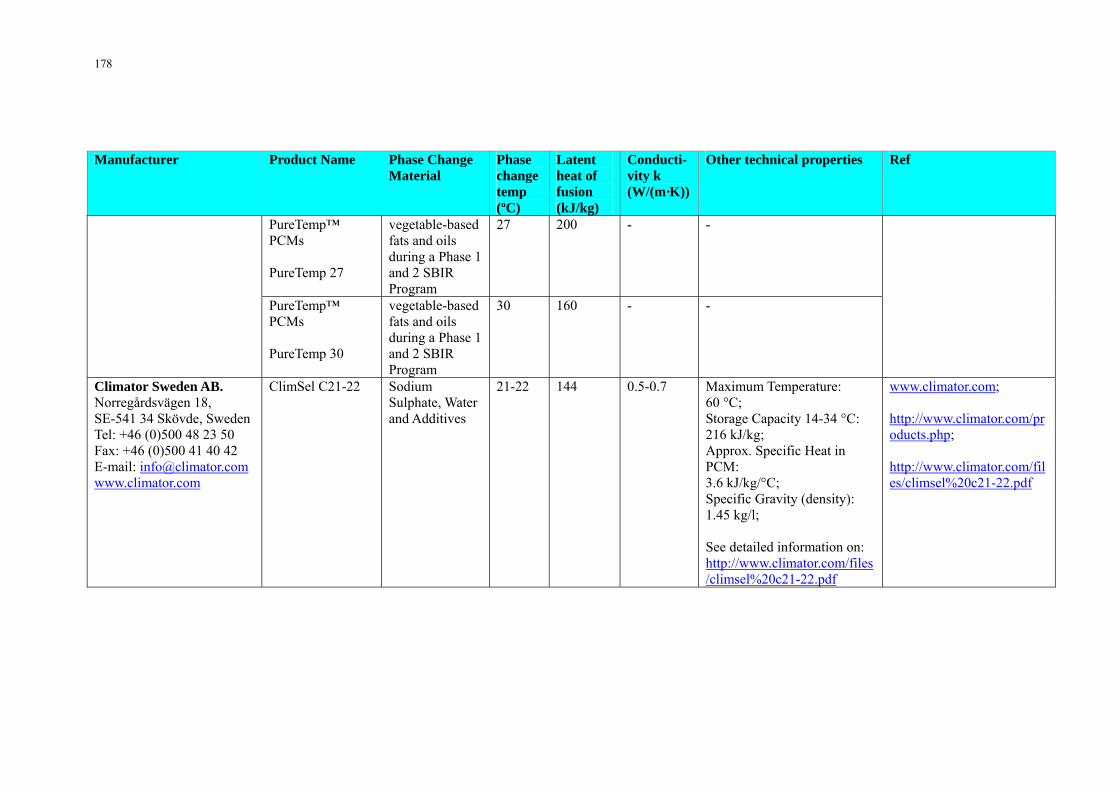
178
Manufacturer Product Name Phase Change Material
Phase change temp (ºC)
Latent heat of fusion (kJ/kg)
Conducti-vity k (W/(m·K))
Other technical properties Ref
PureTemp™ PCMs PureTemp 27
vegetable-based fats and oils during a Phase 1 and 2 SBIR Program
27 200 - -
PureTemp™ PCMs PureTemp 30
vegetable-based fats and oils during a Phase 1 and 2 SBIR Program
30 160 - -
Climator Sweden AB. Norregårdsvägen 18, SE-541 34 Skövde, Sweden Tel: +46 (0)500 48 23 50 Fax: +46 (0)500 41 40 42 E-mail: [email protected] www.climator.com
ClimSel C21-22 Sodium Sulphate, Water and Additives
21-22 144 0.5-0.7 Maximum Temperature: 60 °C; Storage Capacity 14-34 °C: 216 kJ/kg; Approx. Specific Heat in PCM: 3.6 kJ/kg/°C; Specific Gravity (density): 1.45 kg/l; See detailed information on: http://www.climator.com/files/climsel%20c21-22.pdf
www.climator.com; http://www.climator.com/products.php; http://www.climator.com/files/climsel%20c21-22.pdf

179
Manufacturer Product Name Phase Change Material
Phase change temp (ºC)
Latent heat of fusion (kJ/kg)
Conducti-vity k (W/(m·K))
Other technical properties Ref
ClimSel C24 Sodium Sulphate, Water and Additives
24 144 0.5-0.7 Maximum Temperature: 60 °C; Storage Capacity 15-35 °C: 216 kJ/kg; Approx. Specific Heat in PCM: 3.6 kJ/kg/°C; Specific Gravity (density): 1.48 kg/l; See detailed information on: http://www.climator.com/files/climsel%20c24.pdf
www.climator.com; http://www.climator.com/products.php; http://www.climator.com/files/climsel%20c24.pdf
ClimSel C28 Sodium Sulphate, Water and Additives
28 162 0.5-0.7 Maximum Temperature: 60 °C; Storage Capacity 20-40 °C: 234 kJ/kg; Approx. Specific Heat in PCM: 3.6 kJ/kg/°C; Specific Gravity (density): 1.45 kg/l; See detailed information on: http://www.climator.com/files/climsel%20c28.pdf
www.climator.com; http://www.climator.com/products.php; http://www.climator.com/files/climsel%20c28.pdf

180
Manufacturer Product Name Phase Change Material
Phase change temp (ºC)
Latent heat of fusion (kJ/kg)
Conducti-vity k (W/(m·K))
Other technical properties Ref
ClimSel C32 Sodium Sulphate, Water and Additives
32 162 0.5-0.7 Maximum Temperature: 60 °C; Storage Capacity 0-15 °C: 234 kJ/kg; Approx. Specific Heat in PCM: 3.6 kJ/kg/°C; Specific Gravity (density): 1.45 kg/l; See detailed information on: http://www.climator.com/files/climsel%20c32.pdf
www.climator.com; http://www.climator.com/products.php; http://www.climator.com/files/climsel%20c32.pdf
PCM Energy P. Ltd 1504 Sarkar Tower One, 50 Nesbit Road, Mumbai 400 010, India Tel: 91-22-23770100, 91-22-23774610, Fax: 91-22-23728264 Email: [email protected] www.pcmenergy.com
PCM Latest™ Latest™18T
Inorganic Salts 17-19 Theoreti-cal: 188 Practical:175
1 Maximum Temperature: 100 °C; Approx. Specific Heat in PCM: 2 kJ/kg/°C; Specific Gravity (density): 1.48-1.50 kg/l; Sub-cooling: 2 °C max; Congruent Melting: Yes; Flammability: No; Hazardous: No; Thermal Stability: >10000
cycles; See detailed information on: http://www.pcmenergy.com/products.htm
www.pcmenergy.com http://www.pcmenergy.com/products.htm

181
Manufacturer Product Name Phase Change Material
Phase change temp (ºC)
Latent heat of fusion (kJ/kg)
Conducti-vity k (W/(m·K))
Other technical properties Ref
PCM Latest™ Latest™20T
Inorganic Salts 19-20 Theoreti-cal: 188 Practical:175
1 Maximum Temperature: 100 °C; Approx. Specific Heat in PCM: 2 kJ/kg/°C; Specific Gravity (density): 1.48-1.50 kg/l; Sub-cooling: 2 °C max; Congruent Melting: Yes; Flammability: No; Hazardous: No; Thermal Stability: >10000
cycles; See detailed information on: http://www.pcmenergy.com/products.htm
www.pcmenergy.com http://www.pcmenergy.com/products.htm

182
Manufacturer Product Name Phase Change Material
Phase change temp (ºC)
Latent heat of fusion (kJ/kg)
Conducti-vity k (W/(m·K))
Other technical properties Ref
PCM Latest™ Latest™25T
Inorganic Salts 24-26 Theoreti-cal: 188 Practical:175
1 Maximum Temperature: 100 °C; Approx. Specific Heat in PCM: 2 kJ/kg/°C; Specific Gravity (density): 1.48-1.50 kg/l; Sub-cooling: 2 °C max; Congruent Melting: Yes; Flammability: No; Hazardous: No; Thermal Stability: >10000
cycles; See detailed information on: http://www.pcmenergy.com/products.htm
www.pcmenergy.com http://www.pcmenergy.com/products.htm

183
Manufacturer Product Name Phase Change Material
Phase change temp (ºC)
Latent heat of fusion (kJ/kg)
Conducti-vity k (W/(m·K))
Other technical properties Ref
PCM Latest™ Latest™29T
Inorganic Salts 28-30 Theoreti-cal: 188 Practical:175
1 Maximum Temperature: 100 °C; Approx. Specific Heat in PCM: 2 kJ/kg/°C; Specific Gravity (density): 1.48-1.50 kg/l; Sub-cooling: 2 °C max; Congruent Melting: Yes; Flammability: No; Hazardous: No; Thermal Stability: >10000
cycles; See detailed information on: http://www.pcmenergy.com/products.htm
www.pcmenergy.com http://www.pcmenergy.com/products.htm

184
Manufacturer Product Name Phase Change Material
Phase change temp (ºC)
Latent heat of fusion (kJ/kg)
Conducti-vity k (W/(m·K))
Other technical properties Ref
PCM Latest™ Latest™32T
Inorganic Salts 31-32 Theoreti-cal: 230 Practical:>200
0.6 Maximum Temperature: 100 °C; Approx. Specific Heat in PCM: 2 kJ/kg/°C; Specific Gravity (density): 1.45 kg/l; Sub-cooling@1000 cycles: Small; Congruent Melting: Yes; Flammability: No; Hazardous: No; Thermal Stability: >10000
cycles; See detailed information on: http://www.pcmenergy.com/products.htm
www.pcmenergy.com http://www.pcmenergy.com/products.htm

185
Manufacturer Product Name Phase Change Material
Phase change temp (ºC)
Latent heat of fusion (kJ/kg)
Conducti-vity k (W/(m·K))
Other technical properties Ref
PCM Latest™ Latest™34T
Inorganic Salts 33-34 Theoreti-cal: 250 Practical:>220
0.6 Maximum Temperature: 100 °C; Approx. Specific Heat in PCM: 2 kJ/kg/°C; Specific Gravity (density): 1.45 kg/l; Sub-cooling@1000 cycles: Small; Congruent Melting: Yes; Flammability: No; Hazardous: No; Thermal Stability: >10000
cycles; See detailed information on: http://www.pcmenergy.com/products.htm
www.pcmenergy.com http://www.pcmenergy.com/products.htm

186
Manufacturer Product Name Phase Change Material
Phase change temp (ºC)
Latent heat of fusion (kJ/kg)
Conducti-vity k (W/(m·K))
Other technical properties Ref
PlusICE® PCM (Hydrated Salt) Type: S34
Hydrated Salt 34 115 0.520 Density: 2100 kg/m3; Specific heat capacity: 2.10 kJ/kg.K; See detailed information on: http://www.pcmproducts.net/files/plusice_range_2007_hydrates.pdf
http://www.pcmproducts.net http://www.pcmproducts.net/Salt_Hydrate_PCMs.htm http://www.pcmproducts.net/files/plusice_range_2007_hydrates.pdf
PCM Products Ltd Unit 32, Mere View Industrial Estate, Yaxley, Cambridgeshire, PE7 3HS United Kingdom Tel: +44 -(0)-1733-245511 Fax: +44 -(0)-1733-243344 Email: [email protected] http://www.pcmproducts.net
PlusICE® PCM (Hydrated Salt) Type: S32
Hydrated Salt 32 186 0.510 Density: 1460 kg/m3; Specific heat capacity: 1.91 kJ/kg.K; See detailed information on: http://www.pcmproducts.net/files/plusice_range_2007_hydrates.pdf
http://www.pcmproducts.net http://www.pcmproducts.net/Salt_Hydrate_PCMs.htm http://www.pcmproducts.net/files/plusice_range_2007_hydrates.pdf

187
Manufacturer Product Name Phase Change Material
Phase change temp (ºC)
Latent heat of fusion (kJ/kg)
Conducti-vity k (W/(m·K))
Other technical properties Ref
PlusICE® PCM (Hydrated Salt) Type: S30
Hydrated Salt 30 201 0.480 Density: 1304 kg/m3; Specific heat capacity: 1.90 kJ/kg.K; See detailed information on: http://www.pcmproducts.net/files/plusice_range_2007_hydrates.pdf
http://www.pcmproducts.net http://www.pcmproducts.net/Salt_Hydrate_PCMs.htm http://www.pcmproducts.net/files/plusice_range_2007_hydrates.pdf
PlusICE® PCM (Hydrated Salt) Type: S27
Hydrated Salt 27 192 0.540 Density: 1530 kg/m3; Specific heat capacity: 2.20 kJ/kg.K; See detailed information on: http://www.pcmproducts.net/files/plusice_range_2007_hydrates.pdf
http://www.pcmproducts.net http://www.pcmproducts.net/Salt_Hydrate_PCMs.htm http://www.pcmproducts.net/files/plusice_range_2007_hydrates.pdf
PlusICE® PCM (Hydrated Salt) Type: S25
Hydrated Salt 25 190 0.540 Density: 1530 kg/m3; Specific heat capacity: 2.20 kJ/kg.K; See detailed information on: http://www.pcmproducts.net/files/plusice_range_2007_hydrates.pdf
http://www.pcmproducts.net http://www.pcmproducts.net/Salt_Hydrate_PCMs.htm http://www.pcmproducts.net/files/plusice_range_2007_hydrates.pdf

188
Manufacturer Product Name Phase Change Material
Phase change temp (ºC)
Latent heat of fusion (kJ/kg)
Conducti-vity k (W/(m·K))
Other technical properties Ref
PlusICE® PCM (Hydrated Salt) Type: S23
Hydrated Salt 23 190 0.540 Density: 1530 kg/m3; Specific heat capacity: 2.20 kJ/kg.K; See detailed information on: http://www.pcmproducts.net/files/plusice_range_2007_hydrates.pdf
http://www.pcmproducts.net http://www.pcmproducts.net/Salt_Hydrate_PCMs.htm http://www.pcmproducts.net/files/plusice_range_2007_hydrates.pdf
PlusICE® PCM (Hydrated Salt) Type: S21
Hydrated Salt 22 190 0.540 Density: 1530 kg/m3; Specific heat capacity: 2.20 kJ/kg.K; See detailed information on: http://www.pcmproducts.net/files/plusice_range_2007_hydrates.pdf
http://www.pcmproducts.net http://www.pcmproducts.net/Salt_Hydrate_PCMs.htm http://www.pcmproducts.net/files/plusice_range_2007_hydrates.pdf
PlusICE® PCM (Hydrated Salt) Type: S19
Hydrated Salt 19 146 0.430 Density: 1520 kg/m3; Specific heat capacity: 1.90 kJ/kg.K; See detailed information on: http://www.pcmproducts.net/files/plusice_range_2007_hydrates.pdf
http://www.pcmproducts.net http://www.pcmproducts.net/Salt_Hydrate_PCMs.htm http://www.pcmproducts.net/files/plusice_range_2007_hydrates.pdf

189
Manufacturer Product Name Phase Change Material
Phase change temp (ºC)
Latent heat of fusion (kJ/kg)
Conducti-vity k (W/(m·K))
Other technical properties Ref
PlusICE® PCM (Hydrated Salt) Type: S17
Hydrated Salt 17 143 0.430 Density: 1525 kg/m3; Specific heat capacity: 1.90 kJ/kg.K; See detailed information on: http://www.pcmproducts.net/files/plusice_range_2007_hydrates.pdf
http://www.pcmproducts.net http://www.pcmproducts.net/Salt_Hydrate_PCMs.htm http://www.pcmproducts.net/files/plusice_range_2007_hydrates.pdf
PlusICE® PCM (Hydrated Salt) Type: S15
Hydrated Salt 15 142 0.430 Density: 1510 kg/m3; Specific heat capacity: 1.90 kJ/kg.K; See detailed information on: http://www.pcmproducts.net/files/plusice_range_2007_hydrates.pdf
http://www.pcmproducts.net http://www.pcmproducts.net/Salt_Hydrate_PCMs.htm http://www.pcmproducts.net/files/plusice_range_2007_hydrates.pdf
PlusICE® PCM (Organic PCM) Type: A32
Organic PCM 32 215 0.210 Density: 845 kg/m3; Specific heat capacity: 2.20 kJ/kg.K; See detailed information on: http://www.pcmproducts.net/files/plusice_range_2007_organics.pdf
http://www.pcmproducts.net http://www.pcmproducts.net/Organic_Positive_Temperature_PCMs.htm http://www.pcmproducts.net/files/plusice_range_2007_organics.pdf

190
Manufacturer Product Name Phase Change Material
Phase change temp (ºC)
Latent heat of fusion (kJ/kg)
Conducti-vity k (W/(m·K))
Other technical properties Ref
PlusICE® PCM (Organic PCM) Type: A28
Organic PCM 28 230 0.210 Density: 789 kg/m3; Specific heat capacity: 2.22 kJ/kg.K; See detailed information on: http://www.pcmproducts.net/files/plusice_range_2007_organics.pdf
http://www.pcmproducts.net http://www.pcmproducts.net/Organic_Positive_Temperature_PCMs.htm http://www.pcmproducts.net/files/plusice_range_2007_organics.pdf
PlusICE® PCM (Organic PCM) Type: A26
Organic PCM 26 225 0.210 Density: 790 kg/m3; Specific heat capacity: 2.22 kJ/kg.K; See detailed information on: http://www.pcmproducts.net/files/plusice_range_2007_organics.pdf
http://www.pcmproducts.net http://www.pcmproducts.net/Organic_Positive_Temperature_PCMs.htm http://www.pcmproducts.net/files/plusice_range_2007_organics.pdf
PlusICE® PCM (Organic PCM) Type: A25
Organic PCM 25 172 0.180 Density: 785 kg/m3; Specific heat capacity: 2.26 kJ/kg.K; See detailed information on: http://www.pcmproducts.net/files/plusice_range_2007_organics.pdf
http://www.pcmproducts.net http://www.pcmproducts.net/Organic_Positive_Temperature_PCMs.htm http://www.pcmproducts.net/files/plusice_range_2007_organics.pdf
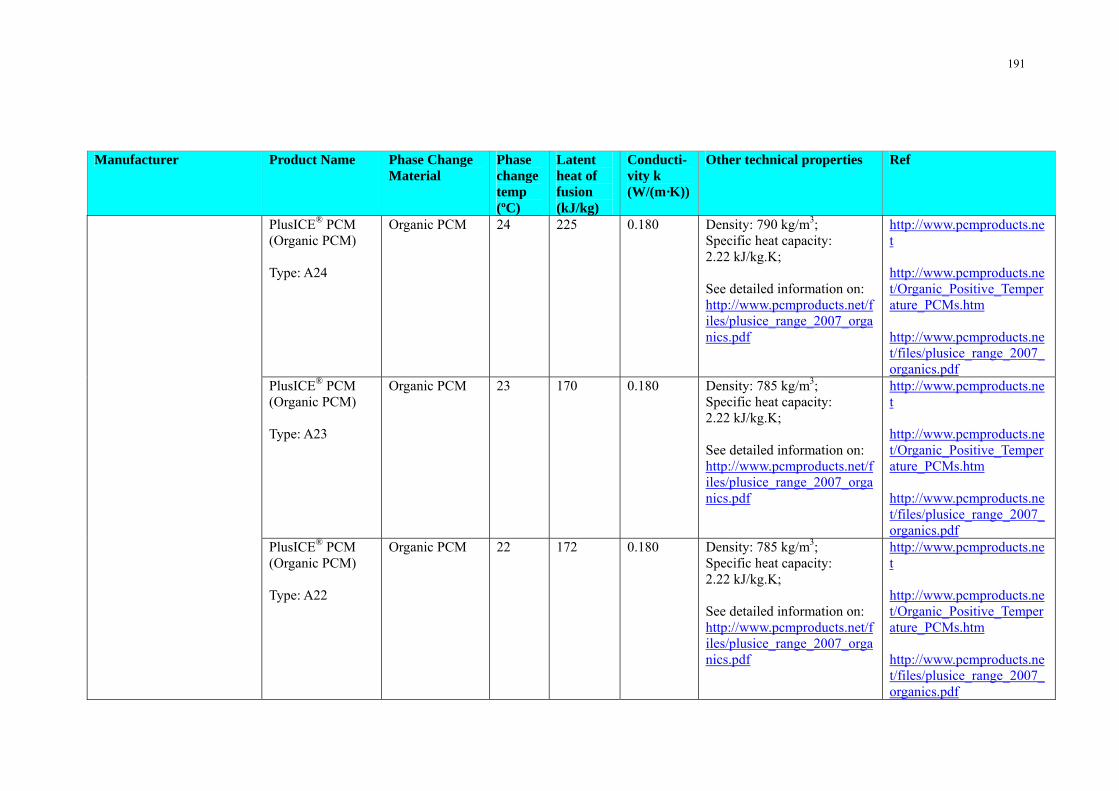
191
Manufacturer Product Name Phase Change Material
Phase change temp (ºC)
Latent heat of fusion (kJ/kg)
Conducti-vity k (W/(m·K))
Other technical properties Ref
PlusICE® PCM (Organic PCM) Type: A24
Organic PCM 24 225 0.180 Density: 790 kg/m3; Specific heat capacity: 2.22 kJ/kg.K; See detailed information on: http://www.pcmproducts.net/files/plusice_range_2007_organics.pdf
http://www.pcmproducts.net http://www.pcmproducts.net/Organic_Positive_Temperature_PCMs.htm http://www.pcmproducts.net/files/plusice_range_2007_organics.pdf
PlusICE® PCM (Organic PCM) Type: A23
Organic PCM 23 170 0.180 Density: 785 kg/m3; Specific heat capacity: 2.22 kJ/kg.K; See detailed information on: http://www.pcmproducts.net/files/plusice_range_2007_organics.pdf
http://www.pcmproducts.net http://www.pcmproducts.net/Organic_Positive_Temperature_PCMs.htm http://www.pcmproducts.net/files/plusice_range_2007_organics.pdf
PlusICE® PCM (Organic PCM) Type: A22
Organic PCM 22 172 0.180 Density: 785 kg/m3; Specific heat capacity: 2.22 kJ/kg.K; See detailed information on: http://www.pcmproducts.net/files/plusice_range_2007_organics.pdf
http://www.pcmproducts.net http://www.pcmproducts.net/Organic_Positive_Temperature_PCMs.htm http://www.pcmproducts.net/files/plusice_range_2007_organics.pdf
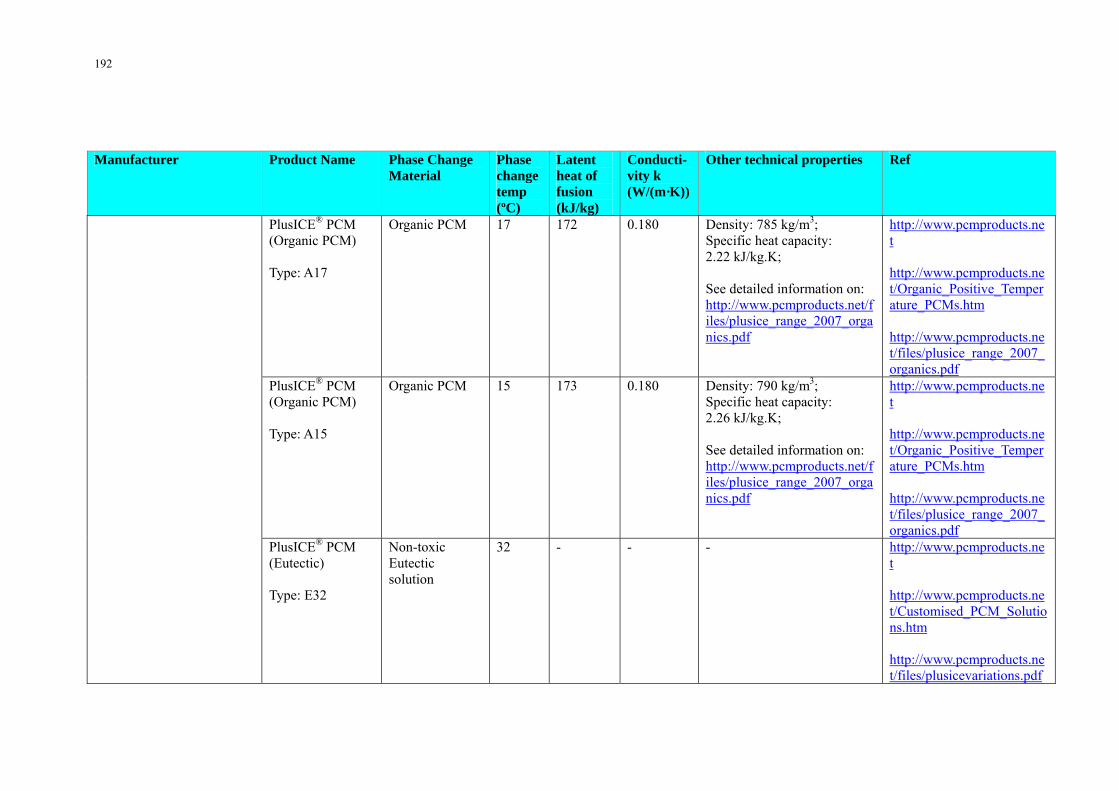
192
Manufacturer Product Name Phase Change Material
Phase change temp (ºC)
Latent heat of fusion (kJ/kg)
Conducti-vity k (W/(m·K))
Other technical properties Ref
PlusICE® PCM (Organic PCM) Type: A17
Organic PCM 17 172 0.180 Density: 785 kg/m3; Specific heat capacity: 2.22 kJ/kg.K; See detailed information on: http://www.pcmproducts.net/files/plusice_range_2007_organics.pdf
http://www.pcmproducts.net http://www.pcmproducts.net/Organic_Positive_Temperature_PCMs.htm http://www.pcmproducts.net/files/plusice_range_2007_organics.pdf
PlusICE® PCM (Organic PCM) Type: A15
Organic PCM 15 173 0.180 Density: 790 kg/m3; Specific heat capacity: 2.26 kJ/kg.K; See detailed information on: http://www.pcmproducts.net/files/plusice_range_2007_organics.pdf
http://www.pcmproducts.net http://www.pcmproducts.net/Organic_Positive_Temperature_PCMs.htm http://www.pcmproducts.net/files/plusice_range_2007_organics.pdf
PlusICE® PCM (Eutectic) Type: E32
Non-toxic Eutectic solution
32 - - - http://www.pcmproducts.net http://www.pcmproducts.net/Customised_PCM_Solutions.htm http://www.pcmproducts.net/files/plusicevariations.pdf

193
Manufacturer Product Name Phase Change Material
Phase change temp (ºC)
Latent heat of fusion (kJ/kg)
Conducti-vity k (W/(m·K))
Other technical properties Ref
PlusICE® PCM (Eutectic) Type: E30
Non-toxic Eutectic solution
30 - - - http://www.pcmproducts.net http://www.pcmproducts.net/Customised_PCM_Solutions.htm http://www.pcmproducts.net/files/plusicevariations.pdf
PlusICE® PCM (Eutectic) Type: E21
Non-toxic Eutectic solution
21 - - - http://www.pcmproducts.net http://www.pcmproducts.net/Customised_PCM_Solutions.htm http://www.pcmproducts.net/files/plusicevariations.pdf
PlusICE® PCM (Eutectic) Type: E19
Non-toxic Eutectic solution
19 - - - http://www.pcmproducts.net http://www.pcmproducts.net/Customised_PCM_Solutions.htm http://www.pcmproducts.net/files/plusicevariations.pdf

194
Manufacturer Product Name Phase Change Material
Phase change temp (ºC)
Latent heat of fusion (kJ/kg)
Conducti-vity k (W/(m·K))
Other technical properties Ref
PlusICE® PCM (Eutectic) Type: E17
Non-toxic Eutectic solution
17 - - - http://www.pcmproducts.net http://www.pcmproducts.net/Customised_PCM_Solutions.htm http://www.pcmproducts.net/files/plusicevariations.pdf
Rubitherm Technologies GmbH Sperenberger Str. 5a, D-12277 Berlin, Germany. Tel: +49 (0)30 720 004 62 Fax: +49 (0)30 720 004 99 Email: [email protected] http://www.rubitherm.com/english/index.htm
RUBITHERM® RT Type: RT 21
n-paraffins and waxes
Melting: 18-23 (typical being 21); Freezing: 22-19 (typical being 22)
134 (Temp range: 15-30 ºC)
0.2 Density solid at 15 ºC: 0.88 kg/l; Density liquid at 25 ºC: 0.77 kg/l; Volume expansion in phase change range: 14%; Kinetic viscosity at 50 ºC: 25.71 mm2/s; Flash point (PCM): 154 ºC; See detailed information on: http://www.rubitherm.com/english/download/techdata_RT21_en.pdf
http://www.rubitherm.com/english/index.htm http://www.rubitherm.com/english/pages/02a_latent_heat_paraffins.htm http://www.rubitherm.com/english/download/techdata_RT21_en.pdf

195
Manufacturer Product Name Phase Change Material
Phase change temp (ºC)
Latent heat of fusion (kJ/kg)
Conducti-vity k (W/(m·K))
Other technical properties Ref
RUBITHERM® RT Type: RT 27
n-paraffins and waxes
Melting: 25-28 (typical being 27); Freezing: 28-25 (typical being 27)
184 (Temp range: 20-35 ºC)
0.2 Density solid at 15 ºC: 0.88 kg/l; Density liquid at 40 ºC: 0.76 kg/l; Volume expansion in phase change range: 16%; Kinetic viscosity at 50 ºC: 26.32 mm2/s; Flash point (PCM): 164 ºC; See detailed information on: http://www.rubitherm.com/english/download/techdata_RT27_en.pdf http://www.rubitherm.com/deutsch/download/techdata_RT27_de.pdf
http://www.rubitherm.com/english/index.htm http://www.rubitherm.com/english/pages/02a_latent_heat_paraffins.htm http://www.rubitherm.com/english/download/techdata_RT27_en.pdf http://www.rubitherm.com/deutsch/download/techdata_RT27_de.pdf
RUBITHERM® RT Type: RT 31
n-paraffins and waxes
Melting: 27-31 (typical being 29); Freezing: 31-27 (typical being 29)
169 (Temp range: 20-35 ºC)
0.2 Density solid at 15 ºC: 0.88 kg/l; Density liquid at 45 ºC: 0.76 kg/l; Volume expansion in phase change range: 16%; Kinetic viscosity at 50 ºC: 28.57 mm2/s; Flash point (PCM): 174 ºC; See detailed information on: http://www.rubitherm.com/english/download/techdata_RT31_en.pdf
http://www.rubitherm.com/english/index.htm http://www.rubitherm.com/english/pages/02a_latent_heat_paraffins.htm http://www.rubitherm.com/english/download/techdata_RT31_en.pdf

196
Manufacturer Product Name Phase Change Material
Phase change temp (ºC)
Latent heat of fusion (kJ/kg)
Conducti-vity k (W/(m·K))
Other technical properties Ref
RUBITHERM® SP Type: SP 22 A17
A unique composition of salt hydrates and organic compounds
Melting: 22-24 (typical being 23); Freezing: 21-19 (typical being 20)
150 (Temp range: 13-28 ºC)
0.6 Density solid at 15 ºC: 1.49 kg/l; Density liquid at 35 ºC: 1.43 kg/l; Volume expansion with phase change and ΔT=20 K: 4.03%;Kinetic viscosity at 55 ºC: 111.1 mm2/s; See detailed information on: http://www.rubitherm.com/english/download/Techdata_SP22A17_en.pdf
http://www.rubitherm.com/english/index.htm http://www.rubitherm.com/english/pages/02f_latent_heat_blend.htm http://www.rubitherm.com/english/download/Techdata_SP22A17_en.pdf
RUBITHERM® SP Type: SP 25 A8
A unique composition of salt hydrates and organic compounds
Melting: typical being 26; Freezing: typical being 25.
180 (Temp range: 15-30 ºC)
0.6 Density solid at -15 ºC: 1.38 kg/l; Volume expansion: 0.001 K-1;Specific heat capacity: 2.5 kJ/kg.K; Heat conductivity: 0.6 W/(m.K) Viscosity: Shear thinning; See detailed information on: http://www.rubitherm.com/english/download/latent_heat_blend_sp25_ds.pdf
http://www.rubitherm.com/english/index.htm http://www.rubitherm.com/english/pages/02f_latent_heat_blend.htm http://www.rubitherm.com/english/download/latent_heat_blend_sp25_ds.pdf

197
Manufacturer Product Name Phase Change Material
Phase change temp (ºC)
Latent heat of fusion (kJ/kg)
Conducti-vity k (W/(m·K))
Other technical properties Ref
Capzo International BV De Mors 112, NL-7631 AK Ootmarsum, Netherlands. Tel: 0031 (0) 541 294946 Fax: 0031 (0) 541 294446 Email: [email protected] http://www.capzo.nl/
Thermusol® HD35SE
Miro-encapsula-ted salt hydrate
35 160 - Physical form: white powder;Density: 1.3 kg/l; Bulk density: 0.78 kg/l; Heat storage temperature range: 30 ºC - 40 ºC; Volumetric heat storage capacity: 208 kJ/l; Specific heat capacity: 2.5 kJ/kg.K; See detailed information on: http://www.capzo.nl/index.asp?CategorieID=2&PaginaID=15&Taal=EN
http://www.capzo.nl/ http://www.capzo.nl/index.asp?CategorieID=1&PaginaID=5&Taal=EN http://www.capzo.nl/index.asp?CategorieID=2&PaginaID=15&Taal=EN
BASF SE Business Management Micronal® PCM, Marketing Polymer Dispersions for Construction, 67056 Ludwigshafen, Germany. Tel: 00 800 - 227 66 257 or 00
Micronal® PCM Product designation: DS 5000 Product type: Dispersion
Micro-encapsul-ated special wax mixture
26 45 - Operational range: 10-30 ºC Overall storage capacity approx.: 59 kJ/kg; Solid content: Approx 42%; Density: Approx 0.98 (no unit given by reference); See detailed information on: http://www.micronal.de/portal/streamer?fid=443847
www.micronal.de http://www.micronal.de/portal/streamer?fid=443847

198
Manufacturer Product Name Phase Change Material
Phase change temp (ºC)
Latent heat of fusion (kJ/kg)
Conducti-vity k (W/(m·K))
Other technical properties Ref
Micronal® PCM Product designation: DS 5007 Product type: Dispersion
Micro-encapsul-ated special wax mixture
23 41 - Operational range: 10-30 ºC Overall storage capacity approx.: 55 kJ/kg; Solid content: Approx 42%; Density: Approx 0.98 (no unit given by reference); See detailed information on: http://www.micronal.de/portal/streamer?fid=443847
www.micronal.de http://www.micronal.de/portal/streamer?fid=443847
Micronal® PCM Product designation: DS 5030 Product type: Dispersion
Micro-encapsul-ated special wax mixture
21 37 - Operational range: 10-30 ºC Overall storage capacity approx.: 51 kJ/kg; Solid content: Approx 42%; Density: Approx 0.98 (no unit given by reference); See detailed information on: http://www.micronal.de/portal/streamer?fid=443847
www.micronal.de http://www.micronal.de/portal/streamer?fid=443847
800 - ACRONALS; 00 800 - 227 66 259 or 00 800 - ACRONALX Email: [email protected] www.micronal.de
Micronal® PCM Product designation: DS 5001 Product type: Pulver
Micro-encapsul-ated special wax mixture
26 110 - Operational range: 10-30 ºC Overall storage capacity approx.: 145 kJ/kg; Solid content: in powder form;Apparent density: Approx 250-350 kg/m3; See detailed information on: http://www.micronal.de/portal/streamer?fid=443847
www.micronal.de http://www.micronal.de/portal/streamer?fid=443847

199
Manufacturer Product Name Phase Change Material
Phase change temp (ºC)
Latent heat of fusion (kJ/kg)
Conducti-vity k (W/(m·K))
Other technical properties Ref
Micronal® PCM Product designation: DS 5008 Product type: Pulver
Micro-encapsul-ated special wax mixture
23 100 - Operational range: 10-30 ºC Overall storage capacity approx.: 135 kJ/kg; Solid content: in powder form;Apparent density: Approx 250-350 kg/m3; See detailed information on: http://www.micronal.de/portal/streamer?fid=443847
www.micronal.de http://www.micronal.de/portal/streamer?fid=443847
Micronal® PCM Product designation: DS 5029 Product type: Pulver
Micro-encapsul-ated special wax mixture
21 90 - Operational range: 10-30 ºC Overall storage capacity approx.: 125 kJ/kg; Solid content: in powder form;Apparent density: Approx 250-350 kg/m3; See detailed information on: http://www.micronal.de/portal/streamer?fid=443847
www.micronal.de http://www.micronal.de/portal/streamer?fid=443847

200
Manufacturer Product Name Phase Change Material
Phase change temp (ºC)
Latent heat of fusion (kJ/kg)
Conducti-vity k (W/(m·K))
Other technical properties Ref
DELTA® PCM Type: DELTA®-COOL 24
Salt hydrate Melting Temp: 22-28; Crystallisation Temp: 22
158 Solid: 1.12; Liquid: 0.56
Cooling capacity: 25-40 W/m2; Density (solid/liquid): 1.6/1.5 kg/l; Specific heat capacity (solid/liquid): 2.7/2.2 kJ/kg.K;Max service temperature: 60 ºC; Dimensions: 300 x 600 mm; See detailed information on: http://www.doerken.de/bvf-en/pdf/prospekt/Cool.pdf
http://www.doerken.de/bvf-en/ http://www.doerken.de/bvf-en/produkte/pcm/index.php http://www.doerken.de/bvf-en/produkte/pcm/produkte/cool24.php http://www.doerken.de/bvf-en/pdf/prospekt/Cool.pdf
Dörken GmbH & Co. KG Wetterstraße 58, D-58313 Herdecke, Germany Tel.: +49 23 30/63-0 Fax: +49 23 30/63-355 [email protected] http://www.doerken.de/bvf-en/
DELTA® PCM Type: DELTA®-COOL 28
Salt hydrate Melting Temp: 26-30; Crystallisation Temp: 26
188 Solid: 1.12; Liquid: 0.56
Density (solid/liquid): 1.6/1.5 kg/l; Specific heat capacity (solid/liquid): 2.7/2.2 kJ/kg.K;Max service temperature: 60 ºC; See detailed information on: http://www.doerken.de/bvf-en/produkte/pcm/produkte/cool28.php
http://www.doerken.de/bvf-en/ http://www.doerken.de/bvf-en/produkte/pcm/index.php http://www.doerken.de/bvf-en/produkte/pcm/produkte/cool28.php
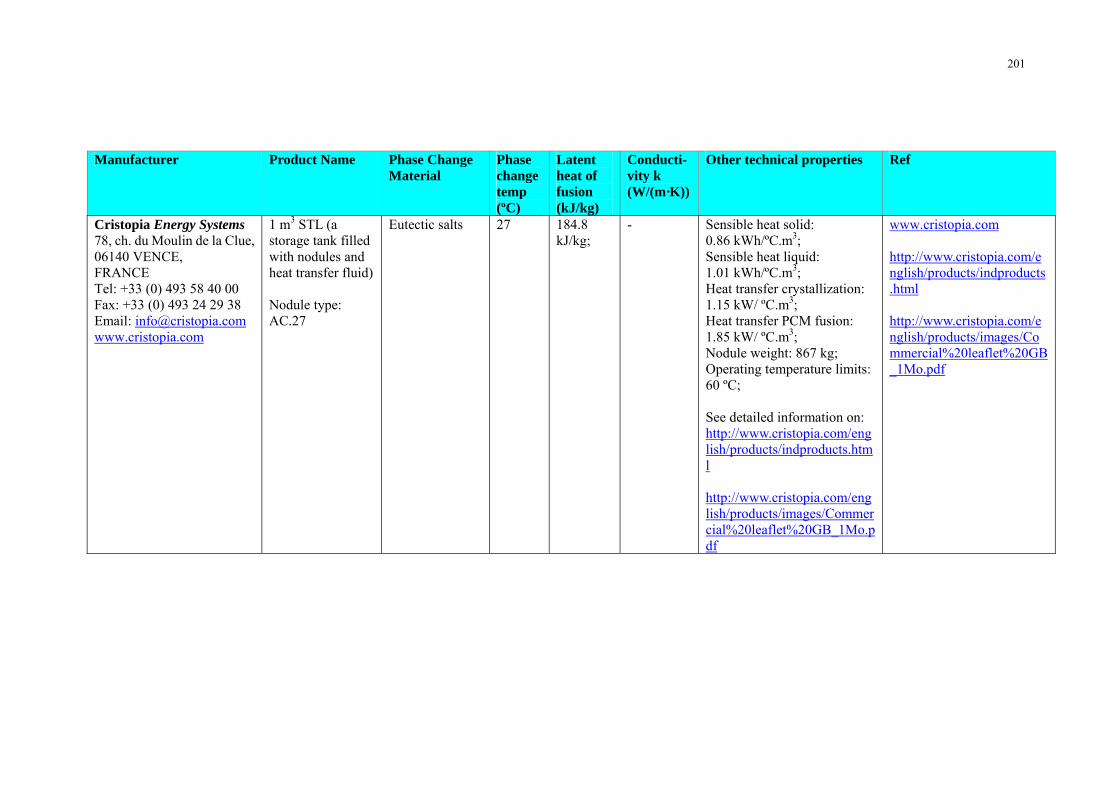
201
Manufacturer Product Name Phase Change Material
Phase change temp (ºC)
Latent heat of fusion (kJ/kg)
Conducti-vity k (W/(m·K))
Other technical properties Ref
Cristopia Energy Systems 78, ch. du Moulin de la Clue, 06140 VENCE, FRANCE Tel: +33 (0) 493 58 40 00 Fax: +33 (0) 493 24 29 38 Email: [email protected] www.cristopia.com
1 m3 STL (a storage tank filled with nodules and heat transfer fluid) Nodule type: AC.27
Eutectic salts 27 184.8 kJ/kg;
- Sensible heat solid: 0.86 kWh/ºC.m3; Sensible heat liquid: 1.01 kWh/ºC.m3; Heat transfer crystallization: 1.15 kW/ ºC.m3; Heat transfer PCM fusion: 1.85 kW/ ºC.m3; Nodule weight: 867 kg; Operating temperature limits:60 ºC; See detailed information on: http://www.cristopia.com/english/products/indproducts.html http://www.cristopia.com/english/products/images/Commercial%20leaflet%20GB_1Mo.pdf
www.cristopia.com http://www.cristopia.com/english/products/indproducts.html http://www.cristopia.com/english/products/images/Commercial%20leaflet%20GB_1Mo.pdf