state of the business - american logistics association (ala) · for deca shoppers as deca sow...
TRANSCRIPT

Copyright © 2017 The Nielsen Company. Confidential and proprietary.
July 2018
Andy HarbNadja Stein
STATE OF THE BUSINESS

Co
pyr
igh
t ©
20
17
Th
e N
iels
en
Co
mp
an
y. C
on
fid
en
tia
l an
d p
rop
rie
tary
.
2
AGENDA
Retail and Consumer Areas of Growth
DeCA Business Review
Appendix: Methodology
Economic Indicators

Co
pyr
igh
t ©
20
17
Th
e N
iels
en
Co
mp
an
y. C
on
fid
en
tia
l an
d p
rop
rie
tary
.
3
$791 $813 $832 $836 $845
253 254 254 253 252
52 weeks ending4/5/14
52 weeks ending4/4/15
52 weeks ending4/2/16
52 weeks ending4/1/17
52 weeks ending3/31/18
Billi
on
s Dollar Sales
Unit Volume
Source: Nielsen Answers, Total U.S. All Outlets Combined (plus Convenience), All Departments,
All Brands, “trend” means % change 52 weeks vs. year ago
All Departments
MODEST IMPROVEMENT IN U.S. RETAIL SALES
UPC-coded items
Dollar Trend (%) +2.7 +2.3 +0.5 +1.2
Unit Trend (%) +0.4 +0.2 -0.5 -0.3
Avg U Price Trend (%) +2.3 +2.1 +1.0 +1.5
% U sold on Promo 31.6 30.7 30.9 30.5
$ sales up 1.2%
as unit sales fell
0.3% with a price
increase of 1.5%

Co
pyr
igh
t ©
20
17
Th
e N
iels
en
Co
mp
an
y. C
on
fid
en
tia
l an
d p
rop
rie
tary
.
4
2.11.9
-0.4
0.7
2Q2015 3Q2015 4Q2015 1Q2016 2Q2016 3Q2016 4Q2016 1Q2017 2Q2017 3Q2017 4Q2017 1Q2018
DOLLARSUNITS
Source: Nielsen Answers, Total U.S. All Outlets Combined (plus Convenience), All Departments, All Brands, January 2015 – March 2018
All Departments sales growth vs. year ago quarter
U.S. FMCG MARKET – UPTICK IN DOLLARS AND UNITS IN Q1 2018
UPC-coded items
As we dissect these declines, it is clear
that changes afoot are not a slowdown,
but rather a shift in where growth is
occurring

Co
pyr
igh
t ©
20
17
Th
e N
iels
en
Co
mp
an
y. C
on
fid
en
tia
l an
d p
rop
rie
tary
.
5
WHERE ARE RETAILERS FINDING GROWTH?
Driving the health & wellness growth wave
Winning the eating occasion
Engaging in digital & e-commerce
Staying connected with the right assortment

Co
pyr
igh
t ©
20
17
Th
e N
iels
en
Co
mp
an
y. C
on
fid
en
tia
l an
d p
rop
rie
tary
.
6
31%
28%
14%
11%
9%
3%
2%
2%
1%
1%
1%
1%
Beauty Care
Pet Care
Health Care
Personal Care
Household Care
Packaged Grocery
Produce
Meat
Dairy
Bakery
Alcohol
Frozen Foods
26.9%
73.3%
27.3%
28.7%
17.8%
41.4%
18.4%
46.0%
67.4%
57.0%
0.8%
49.3%
NON-EDIBLE MOST COMMONLY PURCHASED ONLINE
E-COMM
E-COMMERCE – DEPARTMENT INSIGHTS
$ GROWTH
% OF ONLINE SHOPPERS PURCHASING THIS DEPT
Source: Nielsen Total Store Report, E-commerce measurement, 52 weeks ended Oct. 28, 2017 vs. year-ago
49% OF SHOPPERS

Co
pyr
igh
t ©
20
17
Th
e N
iels
en
Co
mp
an
y. C
on
fid
en
tia
l an
d p
rop
rie
tary
.
7
GENERATION X SPENDING HEAVILY ON MEAL KITS AND E-GROCERY
E-COMM
Source: Nielsen Buyer Insights, April 2016 – March 2017, Total U.S.; percentages may not total 100% due to rounding
28%
46%
33% 35%
47%
42%
52% 51%
25%
12% 14% 14%
U.S. Population Digital Meal Order &Delivery
E-Grocery Meal Kits
Baby Boomers
(55+)
Generation X
(35-54)
Millennials
(18-34)
DOLLAR SHARE BY GENERATIONAL COHORT
“Kroger’s newest
acquisition is a fast-
growing meal kit
company”Kroger will make Home
Chef meal kits available
online and in its storesCSA news, May 23 2018
“Ahold/Delhaize and
Giant Landover
partner with Hello
Fresh”CSA news, June 52018

Co
pyr
igh
t ©
20
17
Th
e N
iels
en
Co
mp
an
y. C
on
fid
en
tia
l an
d p
rop
rie
tary
.
8
CONSUMERS CONTINUING TO SPEND MORE AWAY FROM HOME
OCCASION
Source: U.S. Department of Agriculture – Economic Research Service (ERS), Food Expenditure Data *Preliminary 2017 results, dated to Nov. 2017
54.6%
49.7%
45.4%
50.3%
2003 2004 2005 2006 2007 2008 2009 2010 2011 2012 2013 2014 2015 2016 2017
At Home Away From Home
TOTAL FOOD EXPENDITURE - $ SHARE

Co
pyr
igh
t ©
20
17
Th
e N
iels
en
Co
mp
an
y. C
on
fid
en
tia
l an
d p
rop
rie
tary
.
9
HEALTH CLAIMS SEEING GROWTH IN U.S. FOOD – AND THERE IS
OPPORTUNITY IN COMMISSARIES
Source: Nielsen AOD H&W Characteristics; Fiscal 2018 - 52 Weeks Ending 05/19/18, UPC-Coded Items Only
-0.2
4.2
5.6
9.0
6.5
8.5
-5.9
-1.0
2.3
0.7
-0.9-0.1
TOTAL STORE GLUTEN FREE NATURAL GMO FREE NO ARTIFICIALCOLORS OR
FLAVORS
ORGANIC
Growth by Health Claim
Total U.S. Food DeCA
$40B $29B $20B $14B $13BTotal US Health
Claim Sales:
H&W

Co
pyr
igh
t ©
20
17
Th
e N
iels
en
Co
mp
an
y. C
on
fid
en
tia
l an
d p
rop
rie
tary
.
10
FREE FROM AND REDUCED CLAIMS STILL SHOWING LARGE GROWTH
H&W
FASTEST GROWING HEALTH & WELLNESS CLAIMS BY DOLLAR GROWTH
LATEST 52 WEEKS VS. YEAR-AGO
H&W Claim Dollars $ % Growth
Grain Free $795M 51.2%
Calorie Claim $1.12B 33.9%
Cruelty Free $925M 30.0%
Grass Fed $677M 27.6%
Corn Free $1.44B 22.1%
Source: Nielsen Retail Measurement Services, Core syndicated hierarchy, Total U.S., periods ended Dec. 30, 2017, UPC-coded
+27.2%
+19%
+13.3%
+23.3%
+9.3%
DeCA %$
growth

Co
pyr
igh
t ©
20
17
Th
e N
iels
en
Co
mp
an
y. C
on
fid
en
tia
l an
d p
rop
rie
tary
.
11
PRIVATE BRANDS RESURGENCE
PRIVATE BRANDS & SHARE – ALL DEPARTMENTS
Sources: Nielsen Strategic Planner (2009 data) & Nielsen Answers (2010-2017 data), Total U.S. – All Outlets Combined (xAOC), Total All Departments, * 52 weeks ending 3/31/2018
16.2%
16.8%
17.4% 17.4% 17.6%17.8% 17.8%
17.6%
18.1% 18.3%
2009 2010 2011 2012 2013 2014 2015 2016 2017 2018*
Dollar Sales Percent Change vs. Year Ago
Private Brand +4.9% +8.1% +3.0% +2.5% +2.8% +2.2% 0.0% +3.4% +4.5%
Branded +1.2% +3.3% +2.7% +1.6% +1.5% +2.6% +1.2% -0.4% +0.4%
UPC-coded items
ASSORTMENT

Co
pyr
igh
t ©
20
17
Th
e N
iels
en
Co
mp
an
y. C
on
fid
en
tia
l an
d p
rop
rie
tary
.
12
PREMIUM OFFERINGS ALSO SEEING GROWTH
ASSORTMENT
DOLLAR SHARE BY PRICE TIER
30%
11%
34%
27%
19%
26%
10%
19%
7%
17%
Private Label Branded
Tier 5 (Premium)
Tier 4
Tier 3
Tier 2
Tier 1 (Discount)
$ Growth
+6.3%
+1.8%
-0.7%
-1.6%
-7.4%
$ Growth
+10.6%
+4.1%
+3.7%
+1.6%
-2.3%
Source: Nielsen Analytic Product Attribute (APA) database by Nielsen Advanced Solutions Group, 52 weeks ended July 22, 2017 vs . year-ago

Co
pyr
igh
t ©
20
17
Th
e N
iels
en
Co
mp
an
y. C
on
fid
en
tia
l an
d p
rop
rie
tary
.
13
• Aldi’s SimplyNature
• CVS’s Gold Emblem Abound
• Food Lion’s Nature’s Place
• Giant Food’s Nature’s Promise Free from
• H-E-B’s Select Ingredients
• Kroger’s Simple Truth
• Meijer’s True Goodness
• Supervalu’s Wild Harvest
• Target’s Simply Balanced
• ShopRite’s Wholesome Pantry
• Stop & Shop’s Nature’s Promise Free from
Sources: cspinet.org and company websites
PRIVATE BRANDS ON BOARD WITH HEALTH & WELLNESS TRENDS
ASSORTMENT

Copyright © 2017 The Nielsen Company. Confidential and proprietary.
ECONOMIC INDICATORS

Co
pyr
igh
t ©
20
17
Th
e N
iels
en
Co
mp
an
y. C
on
fid
en
tia
l an
d p
rop
rie
tary
.
15
INCREASED CONSUMER CONFIDENCE TRANSLATES INTO INCREASED
PERSONAL CONSUMPTION
Sources: https://fred.stlouisfed.orgThe Conference Board® Global Consumer Confidence™ Survey, in collaboration with Nielsen; Total U.S. responsesData through June 2018 unless noted otherwise
124
131
127128.7 128.8
126.4
Jan Feb Mar April May June
Consumer Confidence
0.8 vs LY
Personal Savings Rate
3.2%
• Consumer Confidence continues to
trend upward • Continued gains in Employment &
Wages that outpace Inflation
• Personal Savings Rate is down vs
LY
• Consumers are taking on more
revolving debt
Employment
0.5% vs LY
70.6%
2.7% vs LYWages$26.98
4.4% vs LY
Personal Consumption Expenditures

Co
pyr
igh
t ©
20
17
Th
e N
iels
en
Co
mp
an
y. C
on
fid
en
tia
l an
d p
rop
rie
tary
.
16
INCREASED DEMAND IS PUTTING PRESSURE ON PRICE
Source: https://fred.stlouisfed.orgData through June 2018
• Consumer Price Index continues to steadily increase vs LY
• At Home Food prices up slightly vs LY• Away From Home prices increase in
line with CPI
• Inflation is up vs. LY
• The Fed continues to raise the Federal Funds Rate with additional hikes planned in 2018
• Consumer revolving credit is up vs last year, as is student loan borrowing
Credit Card
Consumer Debt
5.2% vs LY
Student Loan5.6% vs LY
Consumer Price Indices (CPI)
All Items
2.8% vs LY
At Home0.4% vs LY
Away from Home2.8% vs LY
CPI - Food1.4% vs LY
76% vs LY
Inflation
2.87%
2.00%
Up +.50% since Jan
Fed. Funds TGT

Co
pyr
igh
t ©
20
17
Th
e N
iels
en
Co
mp
an
y. C
on
fid
en
tia
l an
d p
rop
rie
tary
.
17
-30.0
-20.0
-10.0
0.0
10.0
20.0
30.0
Pri
ce %
Ch
g v
s LY
MORE CATEGORIES REFLECT AN INCREASE IN PRICE FOR DeCA AND
COMPETITORS
Source: Answers on Demand, DeCA RDH, (52 WE 4/28/2018)
DeCA has more categories raising prices by 5% or more than retailers outside the gate
-30.0
-20.0
-10.0
0.0
10.0
20.0
30.0
Pri
ce %
Ch
g v
s LY
DeCA – Unit Price Trends xAOC – Unit Price Trends
L3 – Categories Experiencing a Price Increase >5%: 124
L3 – Categories Experiencing a Price Increase > 5%: 66
• 167 categories with negative price change• 259 categories with increases 0% to 4.9%• 37 categories with increases 5% to 9.9%• 10 categories with increases 10% to 14.9%• 19 categories with increases 15% and more
• 139 categories with negative price change• 204 categories with increases 0% to 4.9%• 75 categories with increases 5% to 9.9%• 24 categories with increases 10% to 14.9%• 25 categories with increases 15% and more

Co
pyr
igh
t ©
20
17
Th
e N
iels
en
Co
mp
an
y. C
on
fid
en
tia
l an
d p
rop
rie
tary
.
18
7 Predictions
Stars Aligned For Growth – Are you?
Clean Label, Ethnic, Comfort, & Convenience Innovation
Basket Building Personalized Marketing
Fresh Ideas For Center-Store
Department Trip Magnets
Private Brands Resurgence
Strange Bedfellows

Copyright © 2017 The Nielsen Company. Confidential and proprietary.
STATE OF THE BUSINESS
DeCA BUSINESS REVIEW

20
Co
pyr
igh
t ©
20
18
Th
e N
iels
en C
om
pan
y. C
on
fid
enti
al a
nd
pro
pri
etar
y.
Walmart and Value Grocery remain top competitors for DeCA Shoppers as DeCA SOW declines
Leverage Private Label to improve buyer conversion and limit trips to Value Grocery and Walmart
Capitalize on growing importance of key Health & Wellness Claims within DeCA assortment to drive
buyer conversion across departments
SUMMARY

Co
pyr
igh
t ©
20
17
Th
e N
iels
en
Co
mp
an
y. C
on
fid
en
tia
l an
d p
rop
rie
tary
.
21
154
35 33 32 28 28 25 22 21 16 15 14 12 11 10
-5 -6 -6 -6 -7 -8 -9 -9 -12 -15 -16 -17 -23 -31 -34
variance Q1/18 vs Q1/17
Source: Retail ACView, Store Count Change Calendar Q1/18 vs Calendar Q1/17
AMONG GROCERS, ALDI LEADS THE EXPANSION IN THE U.S., FOLLOWED
BY WHOLE FOODS, SPROUTS AND PUBLIX
Top/Bottom 15 Food and Mass Retailer by store count change
Walmart and Target also added stores
Store count
chg. 837
FOOD 1
DRUG -383
MASS* -239
DOLLAR 1,458
*Mass: Closure of 304 Sears’ stores
Lidl operates now about 50 stores in the
U.S. (DE, GA, NJ, NC, SC and VA)

Co
pyr
igh
t ©
20
17
Th
e N
iels
en
Co
mp
an
y. C
on
fid
en
tia
l an
d p
rop
rie
tary
.
22
CHANNEL PERFORMANCE
UNDERSTANDING TOTAL US SHOPPER BEHAVIOR

Co
pyr
igh
t ©
20
17
Th
e N
iels
en
Co
mp
an
y. C
on
fid
en
tia
l an
d p
rop
rie
tary
.
23
92.1
25.3 $43.60
Penetration Frequency Basket Size
Commissary Conventional Premier Value Walmart Target Club Online
$ Share 0.5% 39.2% 1.3% 4.3% 22.8% 3.8% 11.3% 2.0%
Pt Chg. NC 0.2 0.2 0.2 0.4 NC -0.1 0.2
% Penetration 2.3% 96.8% 21.2% 39.0% 81.5% 50.6% 52.3% 34.8%
Pt Chg. -0.1 -0.1 1.1 1.1 0.4 0.5 0.0 1.3
Item Buy Rate ($) $821 $1,522 $235 $416 $1,056 $280 $810 $221
Absolute Chg. -$29 NC $16 $1 $5 -$7 -$12 $15
Frequency 14.1 42.8 9.6 14.2 22.9 7.8 11.4 5.6
Absolute Chg. 0.1 -0.3 0.2 -0.2 0.4 0.1 -0.1 0.4
Basket Size $58.08 $35.60 $24.40 $29.36 $46.12 $36.01 $71.02 $39.57
Absolute Chg. -$2.26 $0.29 $1.12 $0.45 -$0.50 -$1.22 -$0.20 -$0.05
COMMISSARIES MAINTAINED SHARE IN A CHALLENGING RETAIL
ENVIRONMENT
131.4%
Source: Nielsen Homescan Panel; US Total TA, 52 weeks ending 03/31/18 v YAG
98.1
49.9 $34.43
Penetration Frequency Basket Size
Grocery Channel – Total USNC
-0.1 trip+$0.54 +0.2 trips
-$0.28
Mass w/ Super – Total US+0.4 pts
All Shoppers in All Outlets
Q2 2018 TOTAL US SHOPPERS: Purchase Behaviors
Premier: Whole Foods, Wegmans, etc
Value: Aldi, Lidl, Save-a-Lot, etc
Limited share changes occurred amongst retailers/channels with only Club declining

Co
pyr
igh
t ©
20
17
Th
e N
iels
en
Co
mp
an
y. C
on
fid
en
tia
l an
d p
rop
rie
tary
.
24
SHOPPER PERFORMANCE
UNDERSTANDING COMMISSARY SHOPPER BEHAVIOR

Co
pyr
igh
t ©
20
17
Th
e N
iels
en
Co
mp
an
y. C
on
fid
en
tia
l an
d p
rop
rie
tary
.
25
96.0
+0.2 Pt chg
52 W/E 03/31/18% of Military Commissary
Shoppers in Grocery
131.4%
Source: Nielsen Homescan Panel, Total Outlets, Military Commissary Shoppers, L52W/E 03/31/18 v YAGO
Military Commissary
HOUSEHOLDS IN…Military
CommissaryConv. Premier Value Wal-Mart Target Club Online
% of Shoppers 100.0% 94.8% 19.1% 35.7% 90.3% 57.3% 63.8% 34.9%
Pt Chg. -0.3 -1.6 2.0 1.3 1.4 0.6 2.3
Share of Wallet 19.3% 22.9% 0.7% 2.8% 19.2% 2.8% 13.0% 1.8%
Pt Chg. -0.3 0.4 0.1 0.3 0.4 -0.2 0.7 0.2
Item Buy Rate ($) $821 $1,053 $156 $337 $908 $210 $869 $227
Absolute Chg -$28.77 $28.52 $28.61 $16.21 -$10.35 -$26.78 $23.97 $10.38
Frequency 14.1 36.4 6.3 13.2 24.4 6.5 12.5 5.1
Absolute Chg. 0.1 0.4 -0.3 0.7 0.1 -0.4 0.2 -0.1
Basket Size $58.08 $28.95 $24.73 $25.58 $37.18 $32.07 $69.77 $44.37
Absolute Chg. -$2.26 $0.44 $5.56 -$0.12 -$0.64 -$2.23 $0.79 $2.81
27.3$36.06
Frequency Basket Size
131.4%42.1
$28.43
Frequency Basket Size
+0.6 trip-$0.67
+$0.54
Military Commissary Shoppers in All Outlets Combined (Leakage)
Grocery Channel – Total US Mass w/ Super – Total US
-0.5 trips
The Club Channel increased household penetration and SOW of Military Commissary Shoppers through higher annual
spend
Premier: Whole Foods, Wegmans, etc
Value: Aldi, Lidl, Save-a-Lot, etc
DeCA STRUGGLES TO MAINTAIN SHARE DUE TO SMALLER BASKETS AS
MORE SHOPPERS GO TO VALUE GROCERY, WALMART, & CLUB
2018 Q2 COMMISSARY SHOPPERS – PURCHASE BEHAVIORS

Co
pyr
igh
t ©
20
17
Th
e N
iels
en
Co
mp
an
y. C
on
fid
en
tia
l an
d p
rop
rie
tary
.
26
Commissary Shopper% Share of Wallet
19.3%
80.7%
-0.3pts
COMMISSARY SHOPPERS’ SHARE OF WALLET TO MILITARY BASES
DECREASED SLIGHTLY IN Q2 2018Walmart is DeCA’s #1 competitor while Grocery is #2 but fragmented Share of
WalletPt Chg vs YA
+0.3pts
Nielsen Homescan,, Household Projected, L52W/E 3/31/18 v YAG
Military
Commissary
Rest of Market
Military Commissary 19.3% -0.3
Walmart 19.2% 0.4
Kroger 6.0% 0.2
Costco 5.6% 0.1
Sams 5.6% 0.3
Exchanges 3.0% -0.5
Target 2.8% -0.2
Dollar Stores* 2.1% 0.2
Walmart NHD 2.0% 0.4
Online 1.8% 0.2
Aldi 1.7% 0.3
HEB 1.6% 0.6
Walgreens 1.6% 0.3
Bj's 1.6% 0.2
Publix 1.6% 0.1
Food Lion 1.4% 0.0
Safeway 1.2% -0.4
Rem. Market 19.5% -1.7
Grocery Military Mass Clubs Drug Online Dollar
*Added since 6-12 meeting
Co
pyr
igh
t ©
20
17
Th
e N
iels
en
Co
mp
an
y. C
on
fid
en
tia
l an
d p
rop
rie
tary
.
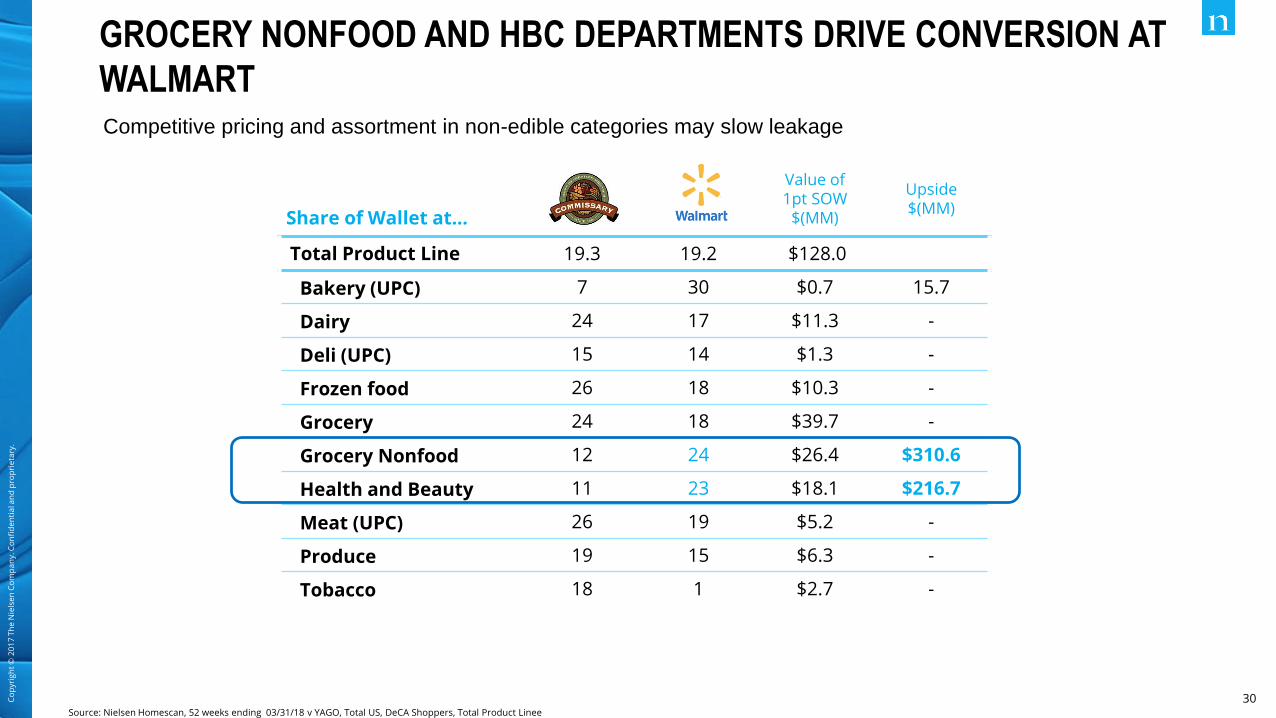
30Source: Nielsen Homescan, 52 weeks ending 03/31/18 v YAGO, Total US, DeCA Shoppers, Total Product Linee
GROCERY NONFOOD AND HBC DEPARTMENTS DRIVE CONVERSION AT
WALMARTCompetitive pricing and assortment in non-edible categories may slow leakage
Commissary
Walmart Value of 1pt SOW
$(MM)
Upside $(MM)
Total Product Line 19.3 19.2 $128.0
Bakery (UPC) 7 30 $0.7 15.7
Dairy 24 17 $11.3 -
Deli (UPC) 15 14 $1.3 -
Frozen food 26 18 $10.3 -
Grocery 24 18 $39.7 -
Grocery Nonfood 12 24 $26.4 $310.6
Health and Beauty 11 23 $18.1 $216.7
Meat (UPC) 26 19 $5.2 -
Produce 19 15 $6.3 -
Tobacco 18 1 $2.7 -
Share of Wallet at…

Co
pyr
igh
t ©
20
17
Th
e N
iels
en
Co
mp
an
y. C
on
fid
en
tia
l an
d p
rop
rie
tary
.
31Source: Nielsen Homescan, 52 weeks ending 03/31/18, Total US, DeCA Shoppers, Total Product Line, UPC Coded Items
COMMISSARY SHOPPERS INCREASED SPEND ACROSS ALL
CATEGORIES AT VALUE GROCERYWhile the Commissary retains highest Share of Wallet across categories, competitive pricing and assortment
reviews will be necessary to halt grocery growth within conventional and value grocery retailers
Commissary
Premier Grocery
PT ChgConventional
GroceryPT Chg Value Grocery PT Chg
Total Product Line 19 1 0.1 23 0.7 3 0.5
Bakery (UPC) 7 2 0.1 34 -2.4 5 1.6
Dairy 24 1 0.2 36 -0.6 5 0.7
Deli (UPC) 15 2 -0.3 38 2.2 4 0.9
Frozen food 26 1 NC 33 -0.1 4 0.3
Grocery 24 1 NC 28 0.1 4 0.7
Grocery Nonfood 12 0.2 NC 10 0.9 1 0.2
Health and Beauty 11 1 NC 11 0.2 0.4 0.0
Meat (UPC) 26 1 0.1 34 0.9 1 0.9
Produce 19 2 -0.1 31 0.7 8 1.6
Share of Wallet at…

32Co
pyr
igh
t ©
20
17
Th
e N
iels
en
Co
mp
an
y. C
on
fid
en
tia
l an
d p
rop
rie
tary
.
PRIVATE & BRANDED LABELS ATTRACTING DeCA SHOPPERS IN VALUE
GROCERY DRIVEN BY FREQUENCY & BASKET SIZE
PRIVATE
BRANDS
NATIONAL
BRANDS
PRIVATE
BRANDS
NATIONAL
BRANDS
PRIVATE
BRANDS
NATIONAL
BRANDS
PRIVATE
BRANDS
NATIONAL
BRANDS
1.5M 2.8M 2.5M 2.6M 1.0M 1.1M 2.7M 2.8M
$15 $820 $204 $738 $186 $178 $226 $835
5.2 14.2 17.8 23.0 12.3 12.1 23.8 33.9
$4.43 $57.85 $11.47 $32.05 $15.17 $14.67 $9.52 $24.63
+9% +6%+129% -4%
+56% -4% +16% +4% 0%
-1%
-5% +10% +2%+52%
+6%
0%
+2%
-7%
0%
-2% -3%
Source: Nielsen Homescan Panel; All Shoppers Total US RTA, 52 weeks ending 03/31/18 v YAG
Commissary WalmartDiv1+Super Value GroceryConventional Grocery
Aldi, Save A Lot, Lidl
Sho
pper
s$
Bas
ket
Fre
quen
cyA
vg $
Spe
nd
Military Commissary Shoppers in …
+4%
-1%
+8% -4%
+1% +2%
-3%
+12% +2%
+6%
-1%

Co
pyr
igh
t ©
20
17
Th
e N
iels
en
Co
mp
an
y. C
on
fid
en
tia
l an
d p
rop
rie
tary
.
33Source: Nielsen Homescan, 52 weeks ending 03/31/18, Total US, DeCA Shoppers, Total Product Line, UPC Coded Items
WALMART LOST SHARE OF WALLET ACROSS ALL CATEGORIES
WHERE DeCA LAUNCHED PRIVATE LABEL
These launches, however, did not reverse negative share of wallet trends for those categories at DeCA
Commissary
PT Chg Total Grocery PT Chg Walmart PT Chg
Cheese 28 -0.4 39 0.4 17 -1.3
Private Label Cheese 7 - 55 -9.2 21 -0.4
Water 17 -3.3 30 5.1 16 -0.8
Private Label Water 10 - 40 8.4 18 -5.0
Disposable Bags 15 -1.3 19 0.4 19 -1.0
Private Label Disposable Bags 10 - 19 0.6 15 -2.3
Share of Wallet at…
Cheese: -1.4 Pt Chg 2YAGO
Water: +5.1 Pt Chg 2YAGO
Disposable Bags: -4.0 Pt. Chg 2YAGO

Co
pyr
igh
t ©
20
17
Th
e N
iels
en
Co
mp
an
y. C
on
fid
en
tia
l an
d p
rop
rie
tary
.
34Co
pyr
igh
t ©
20
17
Th
e N
iels
en
Co
mp
an
y. C
on
fid
en
tia
l an
d p
rop
rie
tary
.
CHEESE SHOPPER ACTIVITY AT WALMART IS DOWN
Decline due to fewer trips
Walmart Cheese Sales
Buyer Penetration
$33 (-$2)
$6 ($0.24)X
X1.2% (NC)
Dollars per HH per year
5.5 (-0.3)
Trips per HH Dollars Per Trip
Q1 2018 (Chg vs. YA)
Source: Nielsen Homescan XOF, 52 weeks ending 12/31/16, Total US, DeCA Shoppers, Total Product Line, UPC Coded Items

Co
pyr
igh
t ©
20
17
Th
e N
iels
en
Co
mp
an
y. C
on
fid
en
tia
l an
d p
rop
rie
tary
.
35
HEALTH & WELLNESS
OPPORTUNITIES

36
Co
pyr
igh
t ©
20
18
Th
e N
iels
en C
om
pan
y. C
on
fid
enti
al a
nd
pro
pri
etar
y.
-15.0 -10.0 -5.0 0.0 5.0 10.0 15.0
LOW SALT OR SODIUM
VITAMIN PRESENCE
NATURALLY NO CAFFEINE
LOW FAT
HIGH FRUCTOSE CORN SYRUP FREE
CHOLESTEROL FREE
Total Store
NO ARTIFICIAL FLAVOR
PRESERVATIVE FREE
WHOLE GRAIN
KOSHER
NO TRANS FAT
SOY
NATURAL PRESENCE
GLUTEN FREE
NO ARTIFICIAL COLORS OR FLAVORS
ORGANIC
ORGANIC CONTENT 95-100 PERCENT
GMO FREE
NO ARTIFICIAL PRESERVATIVES
NATURAL
Top 20 H&W Label by $ Sales
DeCA $ % Chg YA xAOC $ % Chg YA
MOST HEALTH & WELLNESS CLAIMS DISPLAY DECLINING SALES AT
DeCA AND ARE NOT KEEPING PACE WITH TOTAL MARKET
Source: Nielsen RWS, 52 weeks ending 04/28/18 v YAG, Total US Source: Nielsen Homescan, 52 weeks ending 03/31/18 v YAG, Total US, DeCA Shoppers, Total Product Line, UPC Coded Items
-80.0 -60.0 -40.0 -20.0 0.0 20.0 40.0 60.0
Total Convenience / Gas
Whole Foods Market
Safeway
Target
Premiere Fresh Grocery
Sams
Dollar Stores
Trader Joe's
Publix
Warehouse Club
All Outlets
Conventional Grocery
Walmart
Food Lion
BJ's
Costco
Kroger
Military Commissary
Value Grocery
Aldi Discount
Wegmans
Drug Store
H-E-B
NATURAL CLAIM $ % Chg for DeCA Shoppers
Natural claim products in Panel for DeCA Shoppers show that Value Grocery retailers are winning ahead of Military
Commissaries

37
Co
pyr
igh
t ©
20
18
Th
e N
iels
en C
om
pan
y. C
on
fid
enti
al a
nd
pro
pri
etar
y.
As Private Label resurge, continue to expand own brands to improve buyer conversion and limit trips to Value
Grocery and Walmart
Value Grocery expands and continues to engage Commissary shoppers. Competitive pricing will be key
to win.
SUMMARY
Capitalize on the H&W opportunity across national and own brands.

Copyright © 2018 The Nielsen Company. Confidential and proprietary.