state of the industry - fsc // financial services council
TRANSCRIPT

STATE OF THE INDUSTRY

Foreword FSC 2
Snapshot of the Industry 3
Financial Services 4
Contribution to economy 4Financial Services – State by State 5Productivity 6Exports 8Employment 9Gender equality 11Wages and training 12Taxation of financial services 12
Superannuation & Retirement Incomes 13
Introduction 13Industry forecasts 18Australia’s superannuation system in an international context 19Performance of Australia’s superannuation system 23How much have Australians invested in super? 24Asset allocation of superannuation 26Taxation of superannuation in an international context 27Protecting Your Super reforms 29Response of superannuation industry to Royal Commission 29
Investment & Funds Management 30
Introduction 30The Asia Region Funds Passport 36Export of funds management 36
Exchange Traded Products 38
Introduction 38Asset allocation for ETPs 41
Financial Advice 43
Introduction 43Financial advice and platforms 47Financial advice and life insurance 48Response of advice industry to Royal Commission 48
Life Insurance 49
Introduction 49Life insurance claims 51Impact of life insurance on Government Budgets 53Channels for purchasing life insurance 55Life insurance industry premiums and assets 56Life Insurance Code of Practice 59
Table of Figures 60
1FSC STATE OF THE INDUSTRY 2019
Contents

services industry as a whole – acknowledging the $161bn industry’s contribution to the Australian economy, as well as highlights of the life insurance, superannuation, financial advice and funds management sectors.
Financial services touch every Australian in some way, from mortgages and superannuation; how people get paid; right through to how our people in call centres deal with consumers. Financial services is the largest industry in NSW and Victoria, and enjoys one of the fastest rates of productivity growth in the national economy. Its contribution to our export economy however remains nowhere near full potential.
Australia’s superannuation system is the fourth largest in the world, behind the US, UK and Canada. It continues to be the powerful driver of the financial services industry’s growth, and wields increasing influence on the economy, with predictions
Welcome to the Financial Services Council’s State of the Industry Report for 2019. This year marks the fourth edition of the high-level summary of Australia’s largest industry, the financial services sector.
that super funds will own 20 per cent of all listed companies in Australia in 15 years’ time.
Post the Hayne Royal Commission, our industry has the opportunity to strengthen community trust. The Financial Services Council will continue to advocate for reforms which will protect and enhance Australians’ confidence in a strong, sustainable financial services sector that serves them with integrity. We will continue to assist our members to deliver products and services that ensure all Australians have a fair and financially secure future.
In bringing this report to publication, I would like to acknowledge the professional and diligent work of the FSC team, most particularly the FSC’s Economics and Tax Senior Policy Manager Michael Potter.
Thanks also to Morningstar, the ASX and Rice Warner for the data, research and analysis delivered in this excellent report.
The State of the Industry Report by the Financial Services Council (FSC) delivers new insights into this complex, often highly technical and tightly regulated sector and its unique place in the domestic and global economy, making it an essential and reliable reference tool.
The 2019 issue outlines the landscape of the financial
SALLY LOANEChief Executive OfficerFinancial Services Council
FSC STATE OF THE INDUSTRY 20192
Foreword FSCSally Loane CEO

Economic ContributionLargest Australian industry
Low volatility, high productivity growth
Employs 450,000 people, 3.5% of total employment
Contributes $161 billion to Australian economy
5.9% of service exports
Superannuation & Retirement Incomes$2.8 trillion in funds under management, with growth of 72% over 5 years
MySuper assets of $677 billion, 25% of total
Fourth largest private pension system in world
Highest 5 year returns in developed world
596,225 SMSFs
190 APRA regulated funds with more than 4 members
Investment & Funds Management Total funds under management: $3.6 trillion
Funds in managed funds: $2.9 trillion
Percentage of funds exported: 5.7%
Exchange Traded ProductsNumber of products: 194
Total market capitalisation of products: $47.7 billion
• Growth of 27% over 1 year; 328% over 5 years
Financial AdviceNumber of active financial advisers: 26,793
Number of Australian financial service licensees: 2,237
Life InsuranceNumber of companies: 29
Claims paid: $10.5 billion, with 68% growth over 5 years
Top three product types:
• Life cover, covering 16 million people
• Total & Permanent Disability, covering 13 million people
• Income Protection, covering 7 million people
FSC STATE OF THE INDUSTRY 2019 3
Snapshot of the Industry

Contribution to economyThe financial services industry is the largest industry in the economy, as shown in Figure 1 below.1 The industry is worth $161bn to the economy, measured by gross value added, which is 10.3 per cent of the total of all industries and $6,400 per person (financial services is about 9 per cent of GDP, as GDP also includes ownership of dwellings and taxes less subsidies, which are omitted from industry shares). Financial services was the second largest industry, after manufacturing, from about 1994 until about 2006, and has been the largest industry since then except for a short period during the mining boom. Currently, mining is second largest at 9.3 per cent and construction is third at 8.8 per cent.
Figure 1 – Industry share of economy
Source: ABS Australian National Accounts, Table 6.2 Industry total omits ownership of dwellings.
1 Financial services includes banking, funds management, insurance, superannuation, financial markets, and related services such as broking and trading. It is Division K in the ANZSIC code system.
2 The total of all industries (shown in Figure 1) adds to GDP when ownership of dwellings and taxes on products are added and subsidies on products are subtracted.
Key StatisticsLargest Australian industry
Low volatility, high productivity growth
Employs 450,000 people, 3.5% of total employment
Contributes $161 billion to Australian economy
5.9% of service exports
Figure 1 – Industry share of economy
Source: ABS Australian National Accounts, Table 6.2 Industry total omits ownership of dwellings.
Manufacturing
Construction
Mining
Financial services
0%
2%
4%
6%
8%
10%
12%
14%
16%
18%
20%
1974 1978 1982 1986 1990 1994 1998 2002 2006 2010 2014 2018
Sh
are
of
tota
l in
du
stry
gro
ss v
alu
e added
Financial year ending
FSC STATE OF THE INDUSTRY 20194
Financial ServicesContribution to economy

About 70 per cent of the value of the financial services industry is from banking and funds management (excluding superannuation), while the remainder is from insurance, superannuation, financial markets and related businesses.
The financial services industry is also the largest industry contributor to economic growth. Financial services contributed 32.5 percentage points to total industry growth from 1974 to 2018 in real terms, the largest of any industry, ahead of mining at 28.8 percentage points.3
It is also one of the industries with least volatile growth, with the second lowest deviation of quarterly growth relative to average growth (the least volatile industry is information technology).4
3 Total industry growth over the period 1974 to 2018 was 297 per cent.
4 Technically, the coefficient of variation, which is standard deviation of divided by the average, for quarterly industry growth from 1974 to 2018 is 1.53 for financial services and 1.50 for information technology.
Financial Services – State by StateAlmost half of the production of Australia’s financial services occurs in New South Wales, or 44 per cent of the total. Victoria produces 29 per cent, and Queensland 13 per cent. The remaining States and Territories produce 14 per cent of industry value added, as shown in Table 1 below. Since 1990, the share has remained unchanged in New South Wales, while the share in Victoria has increased by 2 percentage points, and Queensland by 1 percentage point, while the shares in South Australia and Western Australia have each fallen by just under 1 percentage point.
Table 1 – Share of total Australian financial services contributed by each State
State Per cent of Australian production in State
NSW 43.6%
VIC 28.8%
QLD 13.3%
SA 4.9%
WA 6.9%
TAS 1.4%
NT 0.4%
ACT 0.8%
Total 100.0%
Source: ABS State Accounts for 2017–18. The figure is the percentage of the total Australian financial services value added that is contributed by each State. Numbers may not add due to rounding.
Looking within each State, financial services is the largest industry in New South Wales and Victoria, as shown in Table 2 below.
Table 2 – Importance of Financial Services to each State
State Ranking within stateFinancial services as share of industries
in State
NSW 1 14.2%
VIC 1 12.9%
QLD 4 7.2%
SA 2 8.9%
WA 6 4.8%
TAS 3 8.8%
NT 12 3.2%
ACT 8 3.8%
Australia 1 10.3%
Source: ABS State Accounts for 2017–18. Comparisons are based on industry value added, excluding ownership of dwellings.
FSC STATE OF THE INDUSTRY 2019 5
Financial ServicesContribution to economy
Financial Services – State by State

ProductivityFinancial services has one of the fastest rates of productivity growth in the Australian economy. Since 1990, the industry had the second highest rate of labour productivity growth, as shown in Figure 2 below. Productivity in the industry increased by 180 per cent over the period 1990 to 2018, or 3.7 per cent per year on average. This is well above the all industry average of 95 per cent over the same period (or 2.4 per cent per year).
Figure 2 – Labour productivity growth by industry (cumulative)
Source: ABS Estimates of Industry Multifactor Productivity, Table 6. The average does not include some industries – Rental, Hiring and Real Estate Services; Professional, Scientific and Technical Services; Administrative and Support Services and Arts and Recreation Services and Other Services.
The industry’s performance in multifactor productivity growth (see definition in box on page 7) is also strong, with growth since 1990 being the third highest of all the measured industries at 85 per cent, or 2.2 per cent per year – see Figure 3 on page 7. The productivity performance of financial services is again well above the average of 32 per cent or 1.0 per cent per year.
The strong productivity performance of financial services can be attributed to factors including business transformation linked to information technology; increased competition (including from foreign owned businesses); and increased scale resulting in lower costs.5
5 Ben Dolman and David Gruen (2012) “Productivity and Structural Change”, Address to the Australian Conference of Economists, Melbourne, 10 July, Australian Treasury; Thomas Holmes and James Schmitz (2010) Competition and productivity: a review of evidence, Staff Report no 439, Federal Reserve Bank of Minneapolis; and Productivity Commission (2018) Economies of scale in superannuation, Technical Supplement 8 to the Inquiry Report Superannuation: Assessing Efficiency and Competitiveness, December.
IT
Financial Services
Average
0
50
100
150
200
250
300
350
400
1990 1992 1994 1996 1998 2000 2002 2004 2006 2008 2010 2012 2014 2016 2018
Index
, 19
89
-90
= 1
00
Financial year ending
FSC STATE OF THE INDUSTRY 20196
Financial ServicesProductivity
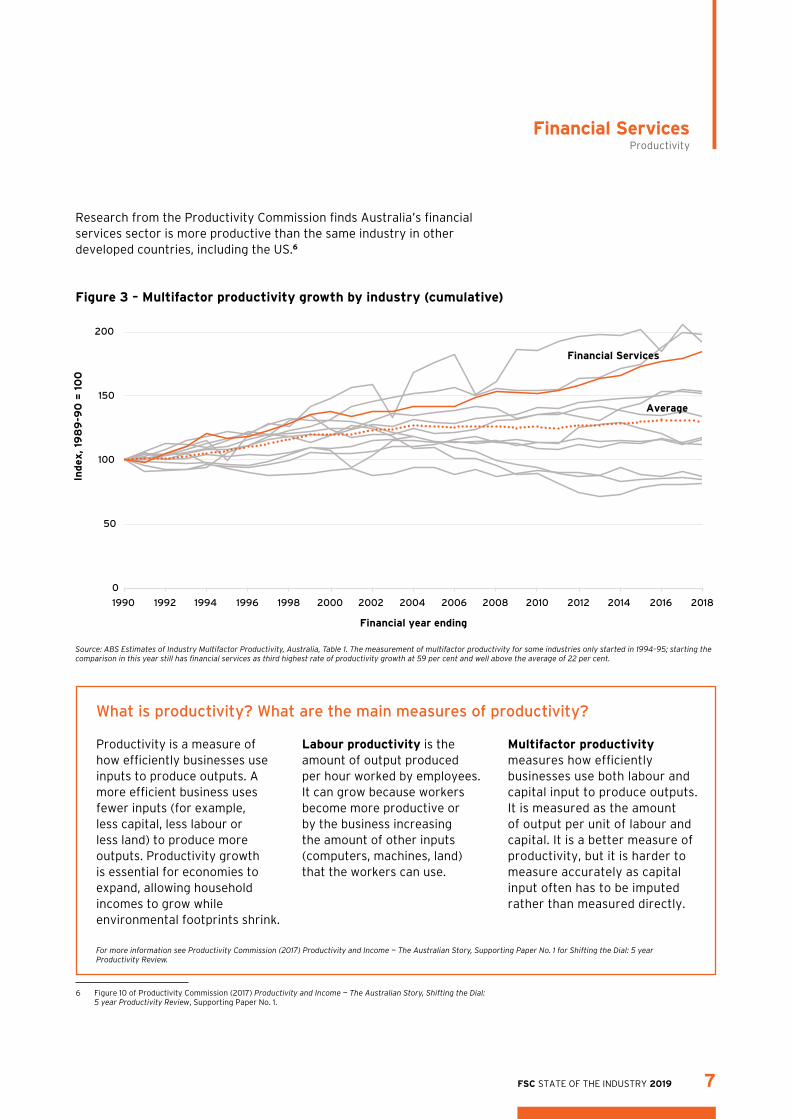
Research from the Productivity Commission finds Australia’s financial services sector is more productive than the same industry in other developed countries, including the US.6
6 Figure 10 of Productivity Commission (2017) Productivity and Income — The Australian Story, Shifting the Dial: 5 year Productivity Review, Supporting Paper No. 1.
Figure 3 – Multifactor productivity growth by industry (cumulative)
Source: ABS Estimates of Industry Multifactor Productivity, Australia, Table 1. The measurement of multifactor productivity for some industries only started in 1994–95; starting the comparison in this year still has financial services as third highest rate of productivity growth at 59 per cent and well above the average of 22 per cent.
What is productivity? What are the main measures of productivity?
Productivity is a measure of how efficiently businesses use inputs to produce outputs. A more efficient business uses fewer inputs (for example, less capital, less labour or less land) to produce more outputs. Productivity growth is essential for economies to expand, allowing household incomes to grow while environmental footprints shrink.
Labour productivity is the amount of output produced per hour worked by employees. It can grow because workers become more productive or by the business increasing the amount of other inputs (computers, machines, land) that the workers can use.
Multifactor productivity measures how efficiently businesses use both labour and capital input to produce outputs. It is measured as the amount of output per unit of labour and capital. It is a better measure of productivity, but it is harder to measure accurately as capital input often has to be imputed rather than measured directly.
For more information see Productivity Commission (2017) Productivity and Income — The Australian Story, Supporting Paper No. 1 for Shifting the Dial: 5 year Productivity Review.
Financial Services
Average
0
50
100
150
200
250
1990 1992 1994 1996 1998 2000 2002 2004 2006 2008 2010 2012 2014 2016 2018
Index
, 19
89
-90
= 1
00
Financial year ending
FSC STATE OF THE INDUSTRY 2019 7
Financial ServicesProductivity
ExportsAustralian exports continue to be dominated by sectors other than financial services. While the industry is the largest in the economy, it largely works for the domestic market and is less export focused.
In the year 2018, Australia exported $438bn in goods and services, of which $93bn (or 21 per cent) was services. Most of Australia’s exports are goods, $345bn worth (or 79 per cent).
Within service exports, $61bn related to travel (or 65 per cent). Financial services exports were $5.4bn, which is only 5.9 per cent of total services exports. Of this, $0.6bn related to insurance and pension services (or 0.6 per cent of total services exports) while $4.9bn (5.2 per cent) related to other financial services including banking, funds management and financial markets. While Australia has an advantage in terms of the domestic performance of its financial services industry, we are not making full use of this to export these services to the rest of the world.
Based on World Bank data, Australia’s financial services exports in 2018 were 5.9 per cent of all service exports, well below the OECD average of 12.7 per cent, the high income average of 13.3 per cent and the world average of 11.7 per cent.7
In 2018, the OECD released the report Australian Services Trade in the Global Economy, which argues:• More could be done to improve Australia’s competitive edge
in services. • Australia exports less of our services production than the OECD
average; while the share of services exported has increased on average in the OECD since the early 2000s, it has declined in Australia over this period.
• The primary way Australia exports services is as intermediate inputs into other exports (for example as financial services used to produce exported mining products).
• Australia is well below average compared to other OECD countries for the share of financial services production that is exported.8
7 Source: https://data.worldbank.org/indicator/BX.GSR.INSF.ZS
8 OECD (2018) Australian Services Trade in the Global Economy.
FSC STATE OF THE INDUSTRY 20198
Financial ServicesExports

Figure 4 – Financial services share of total employment
Source: ABS Labour Force, Australia, Detailed, Quarterly, Table 6. Figures are four quarter moving averages.
EmploymentFinancial services employs about 450,000 people as at the start of 2019. This is about 3.5 per cent of total employment in Australia, a proportion that has declined only slightly over the past few decades (see Figure 4 below). In the 1980s, 5–6 per cent of employed women worked in financial services, while 3–4 per cent of employed men worked in the industry; this gender difference has gradually disappeared over time.
Total
Males
Females
0%
1%
2%
3%
4%
5%
6%
7%
1984 1988 1992 1996 2000 2004 2008 2012 2016
Financial year ended
FSC STATE OF THE INDUSTRY 2019 9
Financial ServicesEmployment
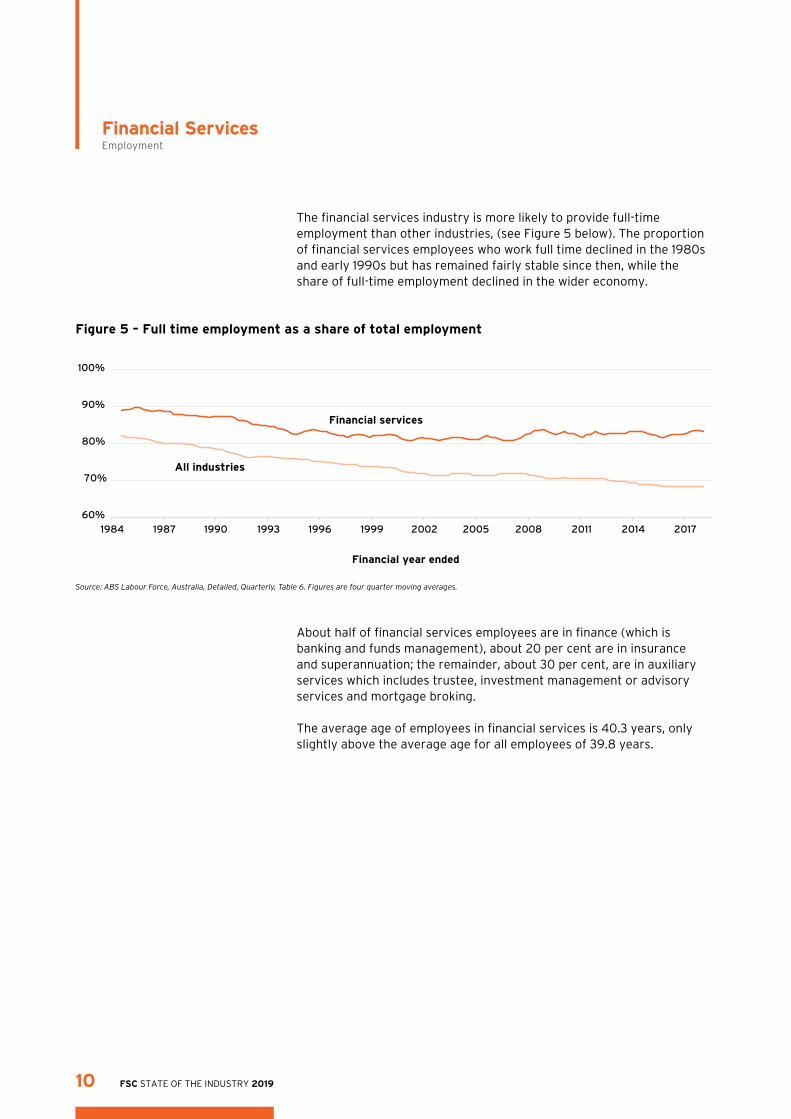
Figure 5 – Full time employment as a share of total employment
Source: ABS Labour Force, Australia, Detailed, Quarterly, Table 6. Figures are four quarter moving averages.
About half of financial services employees are in finance (which is banking and funds management), about 20 per cent are in insurance and superannuation; the remainder, about 30 per cent, are in auxiliary services which includes trustee, investment management or advisory services and mortgage broking.
The average age of employees in financial services is 40.3 years, only slightly above the average age for all employees of 39.8 years.
The financial services industry is more likely to provide full-time employment than other industries, (see Figure 5 below). The proportion of financial services employees who work full time declined in the 1980s and early 1990s but has remained fairly stable since then, while the share of full-time employment declined in the wider economy.
Financial services
All industries
60%
70%
80%
90%
100%
1984 1987 1990 1993 1996 1999 2002 2005 2008 2011 2014 2017
Financial year ended
FSC STATE OF THE INDUSTRY 201910
Financial ServicesEmployment

Gender equalityIn the early 1980s, the number of women employed in financial services was approximately equal to the number of men; the female to male ratio declined in the 1980s and early 1990s but increased in the early 2000s and has now returned to have approximately equal numbers of males and females (see Figure 6 below).
In 2018, the employment of women in financial services was as follows:9
• For key management personnel in financial services, 29 per cent were women, slightly less than the average for all industries of 31 per cent.
• For board directors in financial services, 26 per cent were women, the same as the average for all industries.
• For CEOs in financial services, 9 per cent were women, significantly lower than the average for all industries of 17 per cent.
9 Workplace Gender Equality Agency data, accessed 28 June 2019, available from: https://data.wgea.gov.au/comparison/?id1=1&id2=27#gender_comp_content
Figure 6 – Male to female employment ratio in financial services
Source: ABS Labour Force, Australia, Detailed, Quarterly, Table 6. Figures are four quarter moving averages. Financial services had a greater share of employed women than employed men in the 1980s (see Figure 4 above), but the gender ratio was about 1:1 because the employment of women in the whole economy was lower.
0%
20%
40%
60%
80%
100%
120%
1984 1988 1992 1996 2000 2004 2008 2012 2016
Financial year ended
FSC STATE OF THE INDUSTRY 2019 11
Financial ServicesGender equality
Wages and trainingAverage wages in financial services are well above average, with total earnings 34 per cent above the all industry average in November 2018. This to some extent reflects the greater training requirements for many jobs in financial services. In 2016–17, 39 per cent of employees in financial services participated in work-related training, well above the average of 28 per cent.10 In 2018, 50 per cent of financial services employees had a bachelor’s degree or higher, well above the average of 32 per cent and third highest of all industries.11
The growth in wages in financial services has also been slightly above average, with the Wage Price Index growing in the industry by 102 per cent from 1997 to 2018, compared to the all industry increase of 96 per cent.
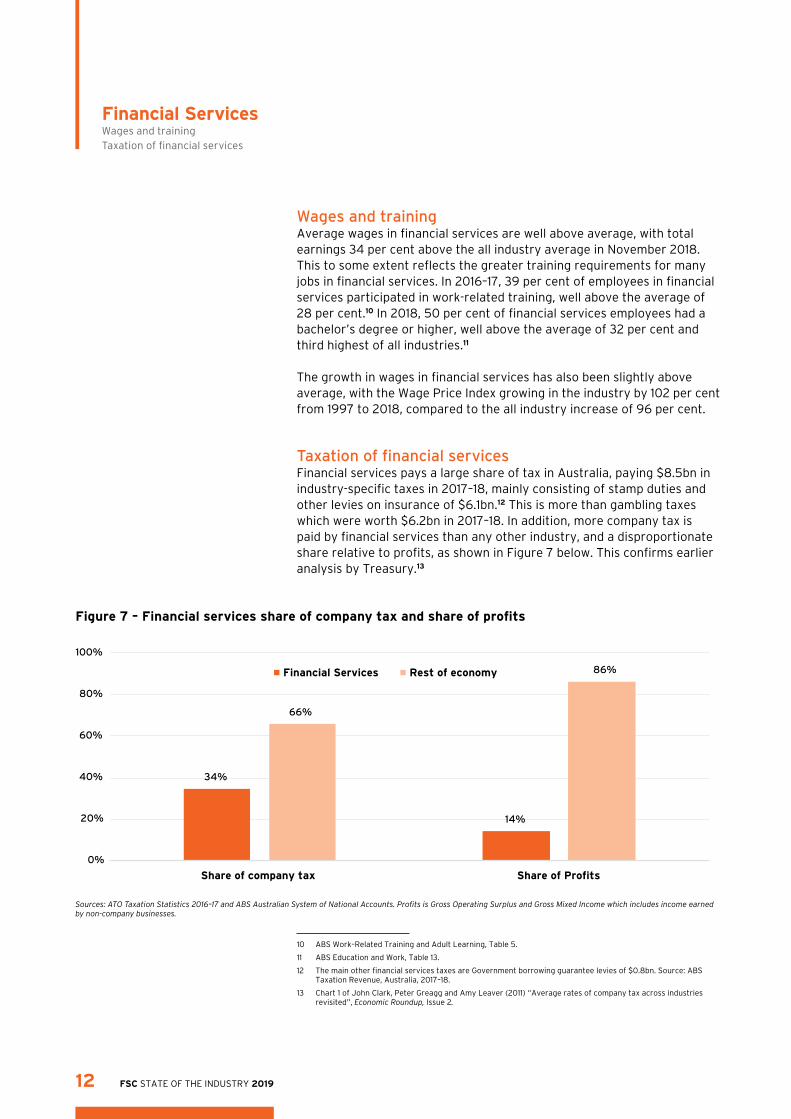
Taxation of financial servicesFinancial services pays a large share of tax in Australia, paying $8.5bn in industry-specific taxes in 2017–18, mainly consisting of stamp duties and other levies on insurance of $6.1bn.12 This is more than gambling taxes which were worth $6.2bn in 2017–18. In addition, more company tax is paid by financial services than any other industry, and a disproportionate share relative to profits, as shown in Figure 7 below. This confirms earlier analysis by Treasury.13
10 ABS Work–Related Training and Adult Learning, Table 5.
11 ABS Education and Work, Table 13.
12 The main other financial services taxes are Government borrowing guarantee levies of $0.8bn. Source: ABS Taxation Revenue, Australia, 2017–18.
13 Chart 1 of John Clark, Peter Greagg and Amy Leaver (2011) “Average rates of company tax across industries revisited”, Economic Roundup, Issue 2.
Figure 7 – Financial services share of company tax and share of profits
Sources: ATO Taxation Statistics 2016–17 and ABS Australian System of National Accounts. Profits is Gross Operating Surplus and Gross Mixed Income which includes income earned by non-company businesses.
34%
14%
66%
86%
0%
20%
40%
60%
80%
100%
Share of company tax Share of Profits
Financial Services Rest of economy
FSC STATE OF THE INDUSTRY 201912
Financial ServicesWages and trainingTaxation of financial services

Key Statistics$2.8 trillion in funds under management, with growth of 72% over 5 years
MySuper assets of $677 billion, 25% of total
Fourth largest private pension system in world
Highest 5 year returns in developed world
596,225 SMSFs
190 APRA regulated funds with more than 4 members
IntroductionThe Australian superannuation system is designed to enable individuals to save during their working lives to provide income in retirement, either to supplement or replace the Age Pension. This also helps to sustain public finances by reducing Government outlays as our population ages.
The total value of assets in Australia’s superannuation system is $2.8tr, which is about 150 per cent of GDP. Superannuation funds under management are expected to reach $5.0tr by June 2028, or 167 per cent of projected GDP in that year.14
Since 1992, employers have been required by law to make minimum payments into a superannuation fund for their employees. Most Australian employees currently receive 9.5 per cent of their income as compulsory employer superannuation contributions, with this rate scheduled to reach 12 per cent by 2025.
The industry has four main segments: industry funds, retail funds, public sector funds, and Self Managed Superannuation Funds (SMSFs), with a much smaller part of the industry made up of corporate funds and other.15 Assets of these components are shown in Table 3 over the page.
14 Rice Warner (2019) Superannuation Market Projections Report 2018, Table 1; FSC estimate for GDP.
15 The “Other” segment of the superannuation industry is comprised of small APRA funds; Approved Deposit Funds (ADFs), and balance of life office statutory funds. The segments are explained in https://superfundlookup.gov.au/Help/FundTypeDefinitions and https://www.moneysmart.gov.au/superannuation-and-retirement/how-super-works/choosing-a-super-fund/types-of-super-funds
FSC STATE OF THE INDUSTRY 2019 13
Superannuation & Retirement IncomesIntroduction
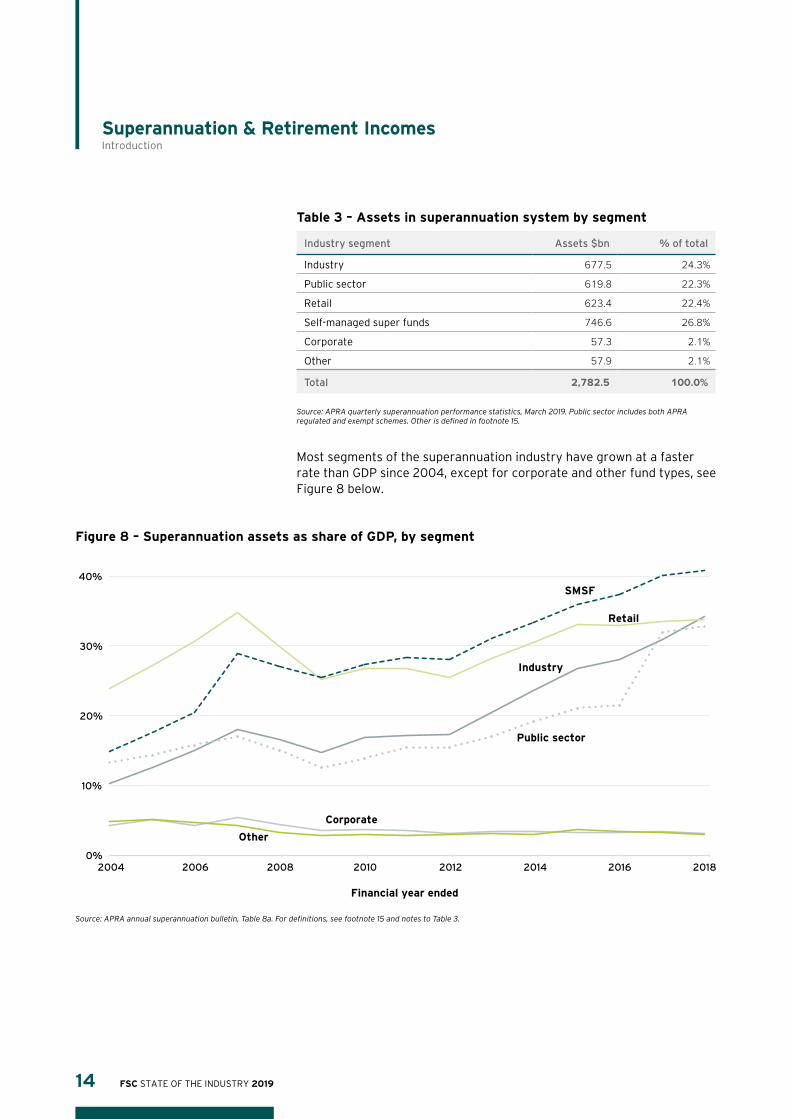
Table 3 – Assets in superannuation system by segment
Industry segment Assets $bn % of total
Industry 677.5 24.3%
Public sector 619.8 22.3%
Retail 623.4 22.4%
Self-managed super funds 746.6 26.8%
Corporate 57.3 2.1%
Other 57.9 2.1%
Total 2,782.5 100.0%
Source: APRA quarterly superannuation performance statistics, March 2019. Public sector includes both APRA regulated and exempt schemes. Other is defined in footnote 15.
Most segments of the superannuation industry have grown at a faster rate than GDP since 2004, except for corporate and other fund types, see Figure 8 below.
Figure 8 – Superannuation assets as share of GDP, by segment
Source: APRA annual superannuation bulletin, Table 8a. For definitions, see footnote 15 and notes to Table 3.
Corporate
Industry
Public sector
Retail
SMSF
Other
0%
10%
20%
30%
40%
50%
2004 2006 2008 2010 2012 2014 2016 2018
Financial year ended
FSC STATE OF THE INDUSTRY 201914
Superannuation & Retirement IncomesIntroduction
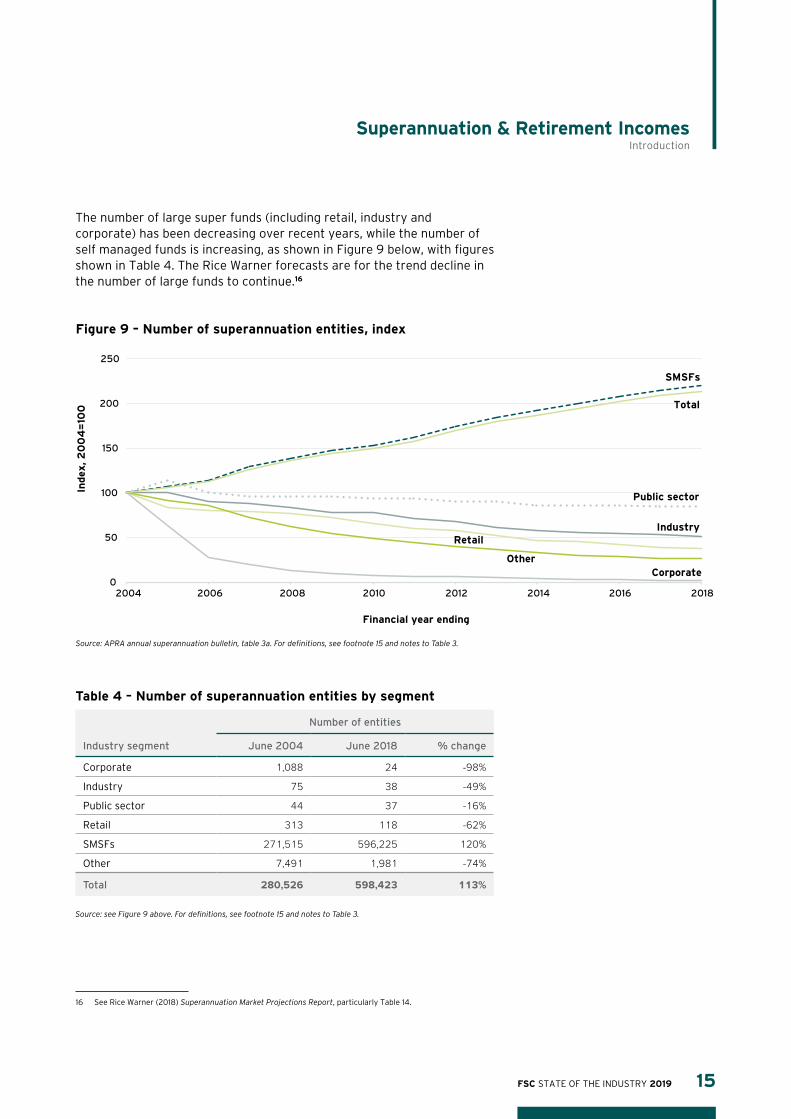
The number of large super funds (including retail, industry and corporate) has been decreasing over recent years, while the number of self managed funds is increasing, as shown in Figure 9 below, with figures shown in Table 4. The Rice Warner forecasts are for the trend decline in the number of large funds to continue.16
Table 4 – Number of superannuation entities by segment
Number of entities
Industry segment June 2004 June 2018 % change
Corporate 1,088 24 -98%
Industry 75 38 -49%
Public sector 44 37 -16%
Retail 313 118 -62%
SMSFs 271,515 596,225 120%
Other 7,491 1,981 -74%
Total 280,526 598,423 113%
Source: see Figure 9 above. For definitions, see footnote 15 and notes to Table 3.
16 See Rice Warner (2018) Superannuation Market Projections Report, particularly Table 14.
Figure 9 – Number of superannuation entities, index
Source: APRA annual superannuation bulletin, table 3a. For definitions, see footnote 15 and notes to Table 3.
Corporate
Industry
Public sector
Retail
SMSFs
Other
Total
0
50
100
150
200
250
2004 2006 2008 2010 2012 2014 2016 2018
Index
, 2
00
4=
100
Financial year ending
FSC STATE OF THE INDUSTRY 2019 15
Superannuation & Retirement IncomesIntroduction
MySuper products are the default superannuation account option. These products have a single investment option – either a balanced investment option or a lifecycle strategy. MySuper products are intended to be simple, low cost, and have consistent product features, regardless of the provider.
MySuper accounts make up 55 per cent of superannuation accounts, and 25 per cent of funds, as shown in Table 5 below.
Table 5 – Choice and MySuper assets and accounts
Choice MySuper
% of total % of total
Assets ($bn) $2,041bn 75% $677bn 25%
change 2014 to 2018 41% NA 88% NA
Number of accounts (millions) 12.5m 45% 15.5m 55%
change 2014 to 2018 -23% NA 8% NA
Source: APRA annual superannuation bulletin 2018, Table 8a & 11a. Choice means all non-MySuper products.
While many individuals will have defaulted into a MySuper option, some retain these products by choice because they best meet their investment needs.
FSC STATE OF THE INDUSTRY 201916
Superannuation & Retirement IncomesIntroduction

Figure 10 – Distribution of superannuation fund sizes
Source: APRA Annual superannuation fund-level statistics, 2018. This diagram only includes large APRA-regulated funds, excluding small APRA regulated funds, SMSFs, and exempt funds. Other means corporate and Eligible Rollover Funds.
Among larger APRA regulated super funds, the industry is dominated by a small number of large funds, as shown in Figure 10 below. The largest ten funds have assets in total of $824bn, which is 47 per cent of the total assets in large APRA regulated funds. There were 36 funds with more than $10bn in assets, the total assets of this group is $1,504bn which is 85 per cent of total assets of the larger funds.
20
40
60
80
100
120
140
160
1 26 51 76 101 126 151
Ass
ets
$bn
Retail Industry Public Sector Other
FSC STATE OF THE INDUSTRY 2019 17
Superannuation & Retirement IncomesIntroduction
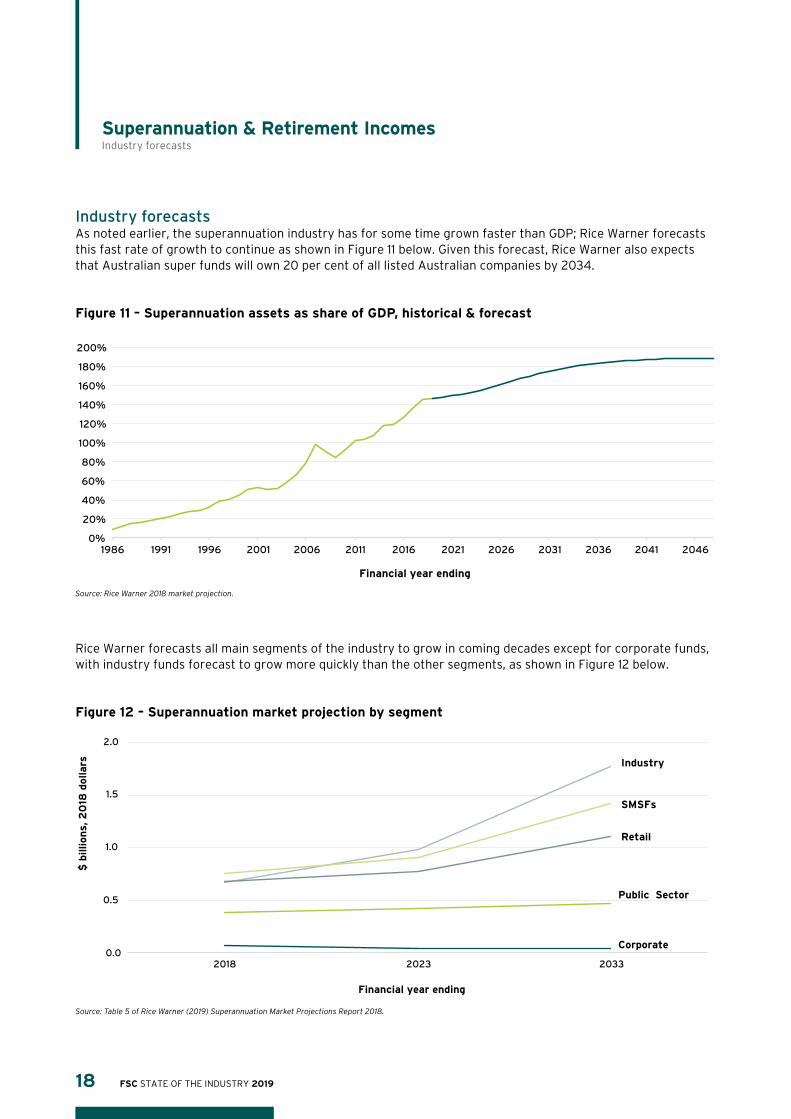
Industry forecastsAs noted earlier, the superannuation industry has for some time grown faster than GDP; Rice Warner forecasts this fast rate of growth to continue as shown in Figure 11 below. Given this forecast, Rice Warner also expects that Australian super funds will own 20 per cent of all listed Australian companies by 2034.
Figure 11 – Superannuation assets as share of GDP, historical & forecast
Source: Rice Warner 2018 market projection.
Rice Warner forecasts all main segments of the industry to grow in coming decades except for corporate funds, with industry funds forecast to grow more quickly than the other segments, as shown in Figure 12 below.
Figure 12 – Superannuation market projection by segment
Source: Table 5 of Rice Warner (2019) Superannuation Market Projections Report 2018.
0%
20%
40%
60%
80%
100%
120%
140%
160%
180%
200%
1986 1991 1996 2001 2006 2011 2016 2021 2026 2031 2036 2041 2046
Financial year ending
Corporate
Industry
Public Sector
Retail
SMSFs
0.0
0.5
1.0
1.5
2.0
2018 2023 2033
$ b
illion
s, 2
018
dollars
Financial year ending
FSC STATE OF THE INDUSTRY 201918
Superannuation & Retirement IncomesIndustry forecasts
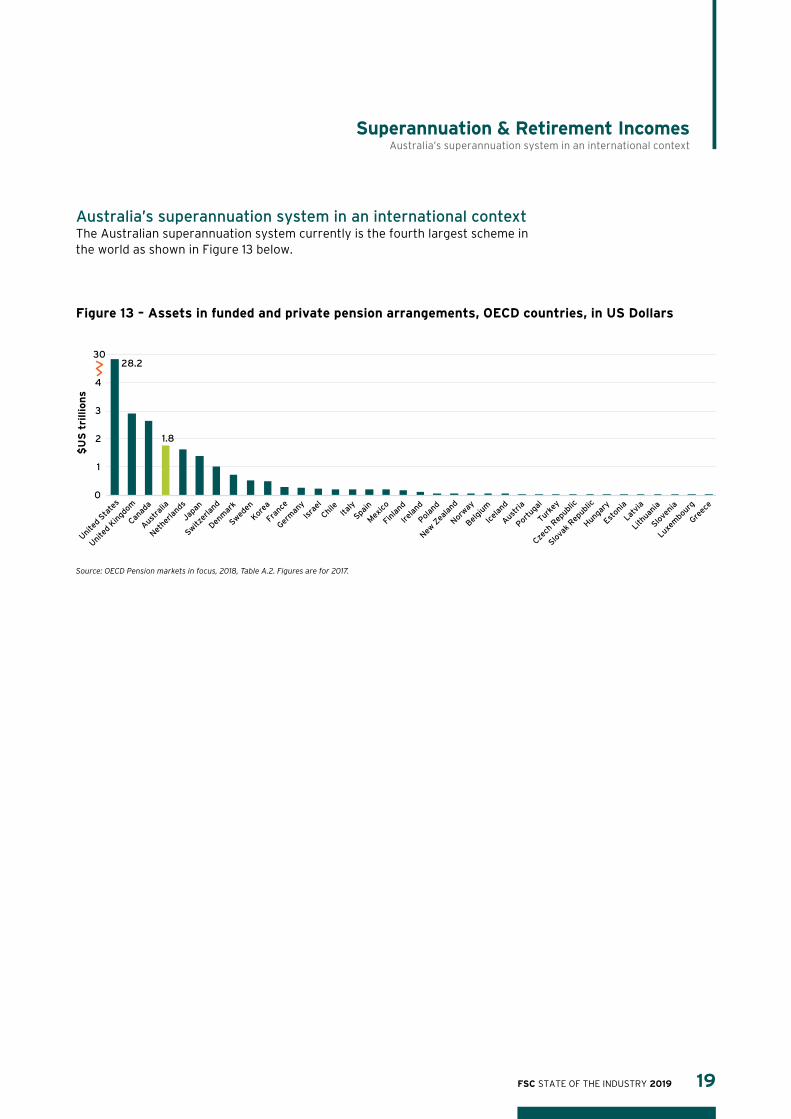
Australia’s superannuation system in an international contextThe Australian superannuation system currently is the fourth largest scheme in the world as shown in Figure 13 below.
Figure 13 – Assets in funded and private pension arrangements, OECD countries, in US Dollars
Source: OECD Pension markets in focus, 2018, Table A.2. Figures are for 2017.
28.2
1.8
0
1
2
3
4
30
Unite
d Sta
tes
Unite
d Kin
gdom
Canad
a
Austr
alia
Nethe
rland
s
Japan
Switzer
land
Denm
ark
Sweden
Korea
Franc
e
Germ
any
Isra
el
Chile
Ita
ly
Spain
Mex
ico
Finla
nd
Irela
nd
Polan
d
New Z
eala
nd
Norway
Belgi
um
Icel
and
Austr
ia
Portu
gal
Turke
y
Czech
Rep
ublic
Slova
k Rep
ublic
Hunga
ry
Eston
ia
Latvi
a
Lithua
nia
Slove
nia
Luxem
bour
g
Greec
e
$U
S t
rillio
ns
FSC STATE OF THE INDUSTRY 2019 19
Superannuation & Retirement IncomesAustralia’s superannuation system in an international context

The Australian private and public pension system operates well to limit the cost of ageing on the Budget, with Australia having one of the lowest levels of spending on Government pensions compared with other advanced countries; and the OECD forecast is for Australia to have the lowest level by some margin in 2025, 2035 and 2045.17 The OECD projections for 2035 are shown in Figure 14 below.
17 OECD Pensions at a Glance 2018 database.
18 See https://www.oecd-ilibrary.org/finance-and-investment/data/oecd-pensions-statistics/pensions-statistics-edition-2018_db4e6e35-en
Figure 14 – Forecast spending on Age Pension as share of GDP – OECD projection for 2035
Source: OECD Pensions at a Glance 2018 database.18
2.5
10.7 11.7
0
5
10
15
20
Au
stra
lia
Lat
via
Est
on
ia
Slo
vak
Re
pu
blic
Sw
ed
en
Ne
the
rlan
ds
De
nm
ark
Un
ite
d K
ing
do
m
Cze
ch R
ep
ub
lic
Hu
ng
ary
Ire
lan
d
Po
lan
d
Ave
rag
e
No
rway
Sp
ain
EU
ave
rag
e
Ge
rman
y
Lu
xem
bo
urg
Slo
ven
ia
Gre
ece
Fra
nce
Fin
lan
d
Au
stri
a
Po
rtu
gal
Be
lgiu
m
Ital
y
% o
f G
DP
FSC STATE OF THE INDUSTRY 201920
Superannuation & Retirement IncomesAustralia’s superannuation system in an international context

Australia’s Age Pension provides one of the highest replacement rates for low income earners (the replacement rate is retirement income as a proportion of working age income). The low overall pension cost for Australia is because our Age Pension is much less generous at higher income levels, as shown in Figure 15 below. The projected retirement income for a low income earner in Australia starting work in 2016 is 95 per cent of income during work (first graph). This is well above the OECD average of 73 per cent for this group. By comparison, the projected retirement income for an Australian average income earner starting work in 2016 is 43 per cent of work income, well below the OECD average of 63 per cent for this group (second graph).
Figure 15 – Forecast net replacement rates for low and average income earners
Source: OECD Pensions at a Glance 2017, Figure 1.8. Replacement rate is retirement income divided by working income. Figures are estimates by OECD for a person starting work in 2016 at age 20 and working to retirement age, and cover both mandatory private and public pensions (see table 4.5 of OECD report). Low income earner is earning 50% of average.
42.6
62.9
0%
20%
40%
60%
80%
100%
120%
Unite
d Kin
gdom
Mex
ico
Polan
d
Japan
Chile
Irela
nd
Austr
alia
New Z
eala
nd
Switzer
land
Korea
Norway
Unite
d Sta
tes
Germ
any
Canad
a
Greec
e
Sweden
Slove
nia
Eston
ia
Latvi
a
Czech
Rep
ublic
OECD ave
rage
Finla
nd
Belgi
um
Franc
e
Isra
el
Icel
and
Denm
ark
Spain
Slova
k Rep
ublic
Luxem
bour
g
Hunga
ry
Austr
ia
Italy
Portu
gal
Nethe
rland
s
Turke
y
South
Afri
ca
Russia
n Fed
erat
ion
Saudi
Ara
bia
Indo
nesia
Brazi
l
China
Argen
tina
Indi
a
Average income earners
73.2
95.0
0%
20%
40%
60%
80%
100%
120%
Low income earners
Mex
ico
Polan
d
Chile
Unite
d Kin
gdom
Japan
Germ
any
Latvi
a
Slove
nia
Switzer
land
Unite
d Sta
tes
Greec
e
Canad
a
Belgi
um
Sweden
Korea
Norway
Finla
nd
Irela
nd
Franc
e
OECD ave
rage
Eston
ia
Spain
New Z
eala
nd
Slova
k Rep
ublic
Icel
and
Czech
Rep
ublic
Hunga
ry
Austr
ia
Portu
gal
Italy
Austr
alia
Luxem
bour
g
Turke
y
Isra
el
Nethe
rland
s
Denm
ark
South
Afri
ca
Russia
n Fed
erat
ion
Indo
nesia
Saudi
Ara
bia
Brazi
l
Argen
tina
Indi
a
China
FSC STATE OF THE INDUSTRY 2019 21
Superannuation & Retirement IncomesAustralia’s superannuation system in an international context
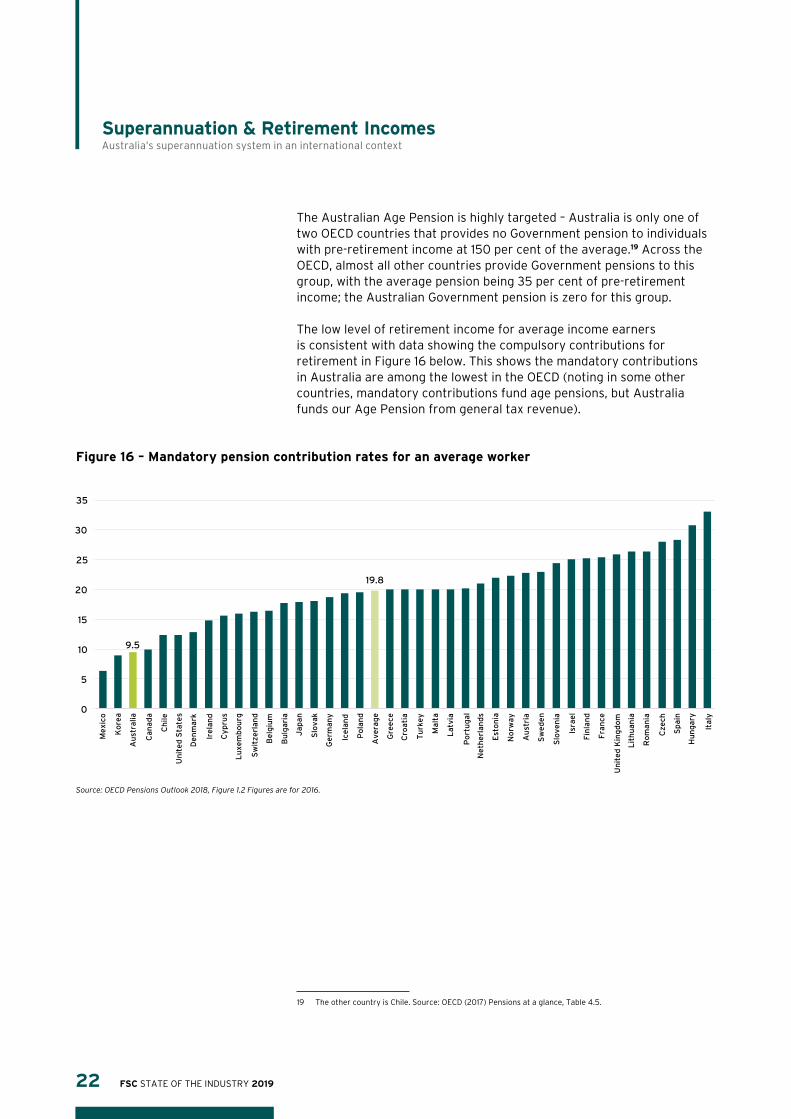
The Australian Age Pension is highly targeted – Australia is only one of two OECD countries that provides no Government pension to individuals with pre-retirement income at 150 per cent of the average.19 Across the OECD, almost all other countries provide Government pensions to this group, with the average pension being 35 per cent of pre-retirement income; the Australian Government pension is zero for this group.
The low level of retirement income for average income earners is consistent with data showing the compulsory contributions for retirement in Figure 16 below. This shows the mandatory contributions in Australia are among the lowest in the OECD (noting in some other countries, mandatory contributions fund age pensions, but Australia funds our Age Pension from general tax revenue).
19 The other country is Chile. Source: OECD (2017) Pensions at a glance, Table 4.5.
Figure 16 – Mandatory pension contribution rates for an average worker
Source: OECD Pensions Outlook 2018, Figure 1.2 Figures are for 2016.
9.5
19.8
0
5
10
15
20
25
30
35
Me
xico
Ko
rea
Au
stra
lia
Can
ada
Ch
ile
Un
ite
d S
tate
s
De
nm
ark
Ire
lan
d
Cy
pru
s
Lu
xem
bo
urg
Sw
itze
rlan
d
Be
lgiu
m
Bu
lgar
ia
Jap
an
Slo
vak
Ge
rman
y
Ice
lan
d
Po
lan
d
Ave
rag
e
Gre
ece
Cro
atia
Tu
rke
y
Mal
ta
Lat
via
Po
rtu
gal
Ne
the
rlan
ds
Est
on
ia
No
rway
Au
stri
a
Sw
ed
en
Slo
ven
ia
Isra
el
Fin
lan
d
Fra
nce
Un
ite
d K
ing
do
m
Lit
hu
ania
Ro
man
ia
Cze
ch
Sp
ain
Hu
ng
ary
Ital
y
FSC STATE OF THE INDUSTRY 201922
Superannuation & Retirement IncomesAustralia’s superannuation system in an international context
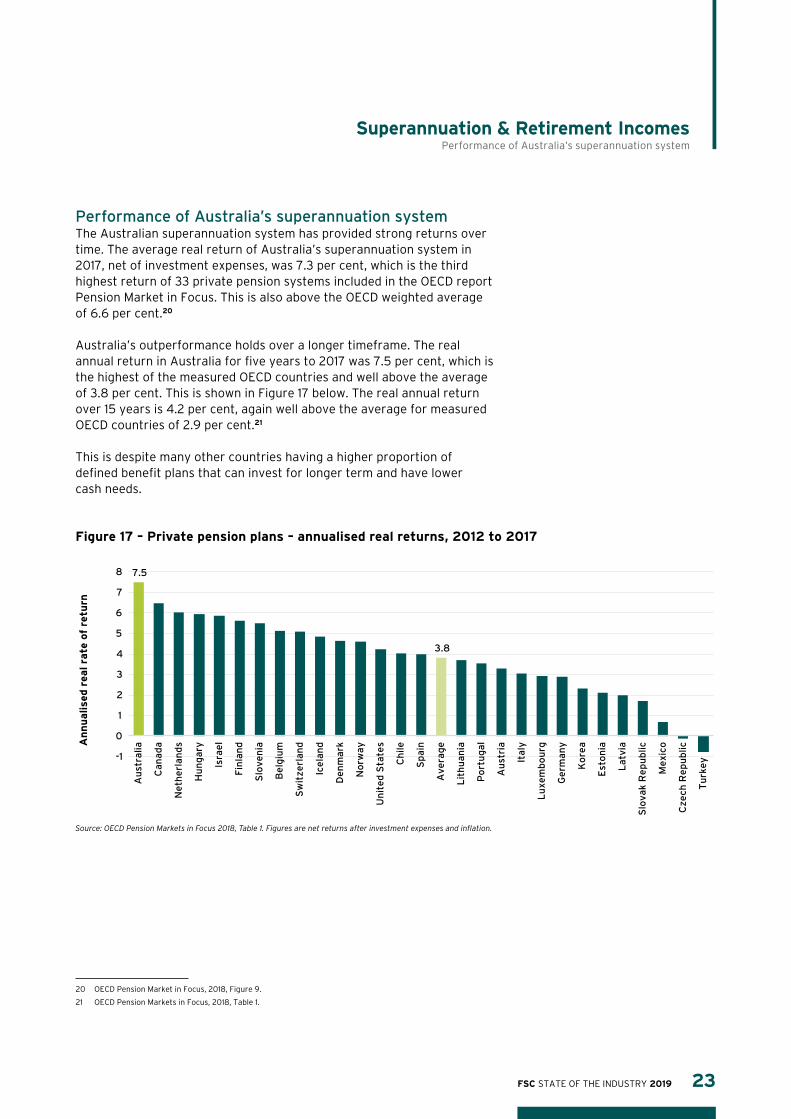
Performance of Australia’s superannuation systemThe Australian superannuation system has provided strong returns over time. The average real return of Australia’s superannuation system in 2017, net of investment expenses, was 7.3 per cent, which is the third highest return of 33 private pension systems included in the OECD report Pension Market in Focus. This is also above the OECD weighted average of 6.6 per cent.20
Australia’s outperformance holds over a longer timeframe. The real annual return in Australia for five years to 2017 was 7.5 per cent, which is the highest of the measured OECD countries and well above the average of 3.8 per cent. This is shown in Figure 17 below. The real annual return over 15 years is 4.2 per cent, again well above the average for measured OECD countries of 2.9 per cent.21
This is despite many other countries having a higher proportion of defined benefit plans that can invest for longer term and have lower cash needs.
20 OECD Pension Market in Focus, 2018, Figure 9.
21 OECD Pension Markets in Focus, 2018, Table 1.
Figure 17 – Private pension plans – annualised real returns, 2012 to 2017
Source: OECD Pension Markets in Focus 2018, Table 1. Figures are net returns after investment expenses and inflation.
7.5
3.8
-1
0
1
2
3
4
5
6
7
8
Au
stra
lia
Can
ada
Ne
the
rlan
ds
Hu
ng
ary
Isra
el
Fin
lan
d
Slo
ven
ia
Be
lgiu
m
Sw
itze
rlan
d
Ice
lan
d
De
nm
ark
No
rway
Un
ite
d S
tate
s
Ch
ile
Sp
ain
Ave
rag
e
Lit
hu
ania
Po
rtu
gal
Au
stri
a
Ital
y
Lu
xem
bo
urg
Ge
rman
y
Ko
rea
Est
on
ia
Lat
via
Slo
vak
Re
pu
blic
Me
xico
Cze
ch R
ep
ub
lic
Tu
rke
y
An
nu
alise
d r
eal ra
te o
f re
turn
FSC STATE OF THE INDUSTRY 2019 23
Superannuation & Retirement IncomesPerformance of Australia’s superannuation system

On some comparisons, the Australian superannuation system may have higher fees than other countries, however:• There are many problems with international fee data.• A reliance on historical fee data for Australia will belie the many
reforms underway that should reduce fees, such as the cap on low balance fees, the ban on exit fees, and the consolidation of low balance accounts.
• Some comparisons treat insurance premiums inside Australian super funds as a fee when they are not.
As a result, these international fee comparisons are of little or no value.22
How much have Australians invested in super?The average superannuation account balance per person in Australia was $144,900 in 2017–18.23 The median balance per person is substantially lower, at $52,000.24 The median is a better measure for comparisons because it is largely unaffected by outlying high balances, unlike the average. Figure 18 below shows the median superannuation account balance for various age groups, adjusted for inflation, showing the significant increase in balances from 2004 to 2018. Across all ages, the median balance increased by 146 per cent in real terms over this period.
22 See FSC submission to the Productivity Commission on the draft report Superannuation: Assessing Efficiency and Competitiveness, available from: https://fsc.org.au/resources-category/submission/1121-fsc-submisison-pc-draft-report-july-2018-final/file
23 ABS Household Income and Wealth, 2017–18, Table 12.3.
24 ABS Household Income and Wealth, 2017–18, Table 12.3.
Figure 18 – Median superannuation balances by age
Source: ABS Household Income and Wealth, 2017–18, Table 12.3.
0
50
100
150
200
250
15–24 years 25–34 years 35–44 years 45–54 years 55–64 years 65–74 years 75 years+ 65 years+ Total
$ t
hou
san
ds
2004 2012 2018
FSC STATE OF THE INDUSTRY 201924
Superannuation & Retirement IncomesPerformance of Australia’s superannuation systemHow much have Australians invested in super?
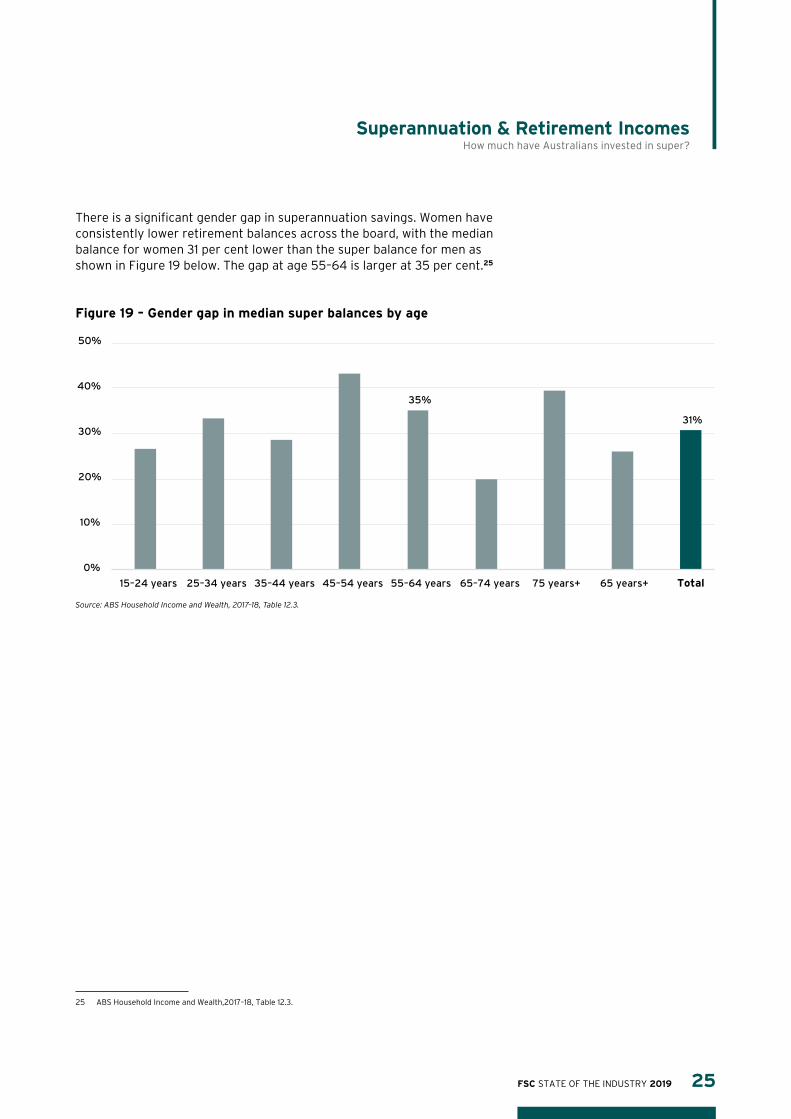
There is a significant gender gap in superannuation savings. Women have consistently lower retirement balances across the board, with the median balance for women 31 per cent lower than the super balance for men as shown in Figure 19 below. The gap at age 55–64 is larger at 35 per cent.25
Figure 19 – Gender gap in median super balances by age
Source: ABS Household Income and Wealth, 2017–18, Table 12.3.
25 ABS Household Income and Wealth,2017–18, Table 12.3.
35%
31%
0%
10%
20%
30%
40%
50%
15–24 years 25–34 years 35–44 years 45–54 years 55–64 years 65–74 years 75 years+ 65 years+ Total
FSC STATE OF THE INDUSTRY 2019 25
Superannuation & Retirement IncomesHow much have Australians invested in super?

Asset allocation of superannuationFigure 20 below shows the asset allocation of large super funds from 1988 to 2018. Super funds have increased their investment into unit trusts, mirroring a reduction in investment into life offices – so in aggregate super funds have switched from one type of collective investment (life offices) to another (unit trusts).26 Investment into debt has fallen substantially over this period, while there have been smaller shifts in other asset classes – the main increase being in overseas investments while (direct) property investment has declined.
The investment strategy of individual super funds, and investment options within those funds, will differ substantially and may not mirror the industry-wide data above.
26 Note the money invested into unit trusts and life offices will, in turn, be invested into other asset classes such as debt, equity and property.
Figure 20 – Superannuation fund asset allocation
Source: ABS Managed Funds, Australia, Cat No 5655.0, Table 4. Figures are four quarter moving averages. Non-financial assets is mainly property, particularly since 1998. The substantial increase in ‘other financial’ in 2016 is explained in the note to Figure 25.
Life Office
Debt
Units in trusts
Australian shares
Assets overseas
Non-financial assets
Other financial assets
0%
10%
20%
30%
40%
1988 1993 1998 2003 2008 2013 2018
Financial year ending
FSC STATE OF THE INDUSTRY 201926
Superannuation & Retirement IncomesAsset allocation of superannuation

Taxation of superannuation in an international contextIn most cases, there is a 15 per cent tax on contributions to superannuation in Australia and a 15 per cent tax on earnings before retirement. Earnings are generally tax free on retirement and most withdrawals from super are tax free. In some cases, the Government provides additional financial support to superannuation savings of individuals. The combined effect of all these measures means that saving in super often receives a tax preference over other types of saving. It is sometimes thought this makes the Australian superannuation system very generous, but this is not true – Australia is ranked below average compared to other developed countries in terms of the tax advantages provided to private pension plans, as shown in Figure 21 below.
Australia has an uncommon tax treatment of private pension plans – we tax contributions and earnings, while many other countries defer taxation until the withdrawal of benefits.27 This bring forward of tax in Australia would be one reason why our superannuation system provides a lower tax advantage in present value terms.
27 See for example table 2.1 of OECD (2018) Financial Incentives and Retirement Savings.
Figure 21 – Tax advantage provided to average earner investing in pension fund
Source: OECD Pensions Outlook 2018, Figure 2.2. The figure is the present value of taxes saved over a lifetime as a percentage of the present value of contributions. More details of calculations are in OECD (2018) Financial Incentives and Retirement Savings. Weighted average is calculated by FSC based on IMF World Economic Outlook figures for GDP at Purchasing Power Parity as at 2018 and relates to the OECD countries only. The unweighted average is 28 per cent.
32.1% 25%
0%
20%
40%
60%
Isra
el
Me
xico
Ire
lan
d
Lit
hu
ania
Ne
the
rlan
ds
Un
ite
d S
tate
s
Slo
vak
Re
pu
blic
Slo
ven
ia
Cze
ch R
ep
ub
lic
Lu
xem
bo
urg
We
igh
ted
ave
rag
e
Jap
an
Tu
rke
y
Ice
lan
d
Hu
ng
ary
Ital
y
No
rway
Fra
nce
Est
on
ia
Sw
itze
rlan
d
Can
ada
Au
stra
lia
Po
rtu
gal
De
nm
ark
Un
ite
d K
ing
do
m
Ge
rman
y
Lat
via
Fin
lan
d
Ko
rea
Po
lan
d
Be
lgiu
m
Sp
ain
Au
stri
a
Gre
ece
Ch
ile
Ne
w Z
eal
and
Sw
ed
en
Cy
pru
s C
roat
ia
Mal
ta
Ro
man
ia
Bu
lgar
ia
Co
lom
bia
FSC STATE OF THE INDUSTRY 2019 27
Superannuation & Retirement IncomesTaxation of superannuation in an international context

According to OECD analysis, the Australian superannuation tax system provides roughly equivalent tax benefits to low, middle and higher income earners (the tax benefit is measured as a proportion of contributions). Figure 22 below shows that the relative value of tax benefits does not change with income levels in Australia, while it varies with income in almost all other developed countries – sometimes to the significant detriment of low income earners. On average across the OECD, the tax incentives are larger for high income earners, and smaller for low income earners (see light red and dark red columns respectively in Figure 22 below). By contrast, the value of the tax concession in Australia is roughly the same for people on average incomes, 60 per cent of average, and four times average (see green columns in Figure 22 below).
Figure 22 – Tax advantage provided to earner investing in pension fund, by income level
See Figure 21 for notes and sources. Figures are all relative to average, so a value of 100 per cent means the relative tax advantage is the same for low, middle and high income earners.
0%
50%
100%
150%
200%
Po
lan
d
Ne
the
rlan
ds
Ko
rea
Ch
ile
Cy
pru
s
Slo
ven
ia
Jap
an
Fra
nce
Ital
y
Sw
itze
rlan
d
De
nm
ark
Au
stri
a
Lu
xem
bo
urg
Un
ite
d S
tate
s
Ire
lan
d
We
igh
ted
Avg
Mal
ta
Me
xico
Ice
lan
d
Cze
ch R
ep
ub
lic
Au
stra
lia
Hu
ng
ary
Slo
vak
Re
pu
blic
Gre
ece
Cro
atia
Bu
lgar
ia
Isra
el
Ge
rman
y
Un
ite
d K
ing
do
m
Po
rtu
gal
Sp
ain
Ro
man
ia
Be
lgiu
m
Tu
rke
y
Fin
lan
d
Est
on
ia
Can
ada
Lit
hu
ania
Ne
w Z
eal
and
No
rway
Lat
via
Sw
ed
en
60% of average vs average 4 times average vs average
FSC STATE OF THE INDUSTRY 201928
Superannuation & Retirement IncomesTaxation of superannuation in an international context
Protecting Your Super reformsThe Productivity Commission has estimated that one third of all super accounts (or 10 million accounts) are unintended duplicate accounts.28
To address this proliferation of duplicate accounts and prevent unnecessary balance erosion, the Government has implemented the following changes, effective from 1 July 2019:• A three per cent fee cap is imposed on accounts with a low balance
(below $6,000).• Exit fees are banned for all superannuation products.• Superannuation members need to opt-in to retain insurance for
accounts that are inactive for 16 months.• Accounts that are inactive for 16 months and have a low balance
will be transferred to the ATO, to be reunited with an active account where possible.
These changes are expected to significantly reduce the number of inactive accounts in the system, as well as the number of accounts with insurance coverage. Reflecting this policy and other market shifts, Rice Warner forecasts the number of superannuation accounts to fall from 27.8m in 2018 to 24.4m in 2020, a decline of 12 per cent.29
Response of superannuation industry to Royal CommissionThe Royal Commission into Misconduct in the Banking, Superannuation and Financial Services Industry (Royal Commission) made a series of recommendations which would significantly reshape the superannuation system.
The most significant is the recommendation that individuals should have only one default account, ending the practice of workers being defaulted into a new fund, and creating a new account, each time they start a new job. This could substantially change the operation of the default superannuation market and significantly reduce costs to the system.
Other major superannuation recommendations include:• Strengthening of the prohibition on funds providing inducements to
employers with the objective of becoming the employer’s default fund.• Limitations on the payment of advice fees from superannuation accounts.• Introduction of civil penalties for directors and trustees for breaches of
their best interest duties.
28 Productivity Commission (2019) Superannuation: Assessing Efficiency and Competitiveness, p16.
29 Rice Warner (2019) Superannuation Market Projections Report 2018.
FSC STATE OF THE INDUSTRY 2019 29
Superannuation & Retirement IncomesProtecting Your Super reforms
Response of superannuation industry to Royal Commission

Key StatisticsTotal funds under management $3.6 trillion
Funds in managed funds $2.9 trillion
Percentage of funds exported 5.7%
IntroductionManaged funds, also known as mutual funds, operate by pooling money together from investors, and an investment manager uses these pooled funds to purchase assets on behalf of the investors. In Australia managed funds are worth $2.9tr, as at March 2019, which is about 150 per cent of Australia’s GDP. The industry also includes institutions that provide investment advice to others, but do not own the assets on behalf of the investors. The makeup of the industry as a whole is shown in the graphic below.
Diagram 1
Domestic sources
Source: ABS Managed Funds, Australia, March 2019.
Total Managed Funds Industry
$3,590.4bn
Overseas investors
$126.4bn
Other resident investors
$555.6bn
$1,398.9bn
Placed with non-resident investment managers or directly
invested into the markets
$2,203.4bn
Placed with resident investment managers
Resident managed funds institutions
$2,920.3bn
$1,521.4bn $1,398.9bn$119.4bn
FSC STATE OF THE INDUSTRY 201930
Investment & Funds Management Introduction

For funds placed with Australian investment managers, the majority (54 per cent) is sourced from superannuation funds, with a range of other sources shown in Figure 23 below.
Figure 23 – Source of funds under management
Source: ABS Managed Funds, Australia, December 2018, Table 9. ‘Other’ includes charities, friendly societies, common funds and other investment managers.
54.4%
10.2%
8.5%
6.7%
6.5%
5.7%
3.1%
1.9%
1.9%
1.1%
0% 10% 20% 30% 40% 50% 60%
Superannuation funds
Wholesale financial trusts
Government
Life insurance
Retail unit trusts
Funds from overseas
Other
General insurance
Non-government businesses
Cash management trusts
FSC STATE OF THE INDUSTRY 2019 31
Investment & Funds Management Introduction

The size of the Australian funds management industry relative to GDP is in Figure 24 below, showing the significant growth in the industry over recent decades. Since about 1996, the largest component of the industry has been superannuation which has grown faster than GDP over the long term (see superannuation section of this report).
Figure 24 – Australian funds under management as share of GDP
Source: ABS Managed Funds, Australia, Table 9; ABS national accounts. Note only some segments of the industry are included in the graph – some omitted categories include friendly societies, common funds, general insurance, non-government trading corporations and charities.
Life companies
Super
Retail
Total
Wholesale
0%
20%
40%
60%
80%
100%
120%
140%
1988 1993 1998 2003 2008 2013 2018
Financial year ended
FSC STATE OF THE INDUSTRY 201932
Investment & Funds Management Introduction

Asset allocation by managed funds is shown in Figure 25 below (this is ‘resident managed funds institutions’ in Diagram 1 on page 30). There has been a substantial decline in the share of assets allocated to debt from about 45 per cent in the late 1980s to 17 per cent in 2018. There has also been a large increase in investment into units in trusts, which grew from just over 1 per cent in 1988 to about 27 per cent today.30 There was also a substantial increase in assets invested overseas in the late 1980s and 1990s. The proportion of assets invested into property fell in the late 1980s and early 1990s but has remained fairly constant since then, while share investment reached a peak in the early 1990s and has declined as a proportion of assets slowly since then.
30 Note the money invested into unit trusts will, in turn, be invested into other asset classes such as debt, equity and property.
31 See: Main Features of the September 2017 issue of ABS Managed Funds, available from: http://www.abs.gov.au/AUSSTATS/[email protected]/allprimarymainfeatures/5DA8EDD4DF230042CA258249000F8009?opendocument
Figure 25 – Funds management asset allocation, share of total
Source: ABS Managed Funds, Australia, Table 2. Notes: lines are four quarter moving averages. Other non-financial assets are omitted, but represent at most 2.3 per cent over the time period shown. “Other financial” is mainly derivatives and receivables by some Public Sector Superannuation Entities which were recognised for the first time in September 2016, explaining the large increase at that date.31 “Overseas assets” includes debt, equity, and property claims on non-residents and is irrespective of where the asset is bought.
Debt
Shares Units in trusts
Overseas assets
Property
Other financial assets
0%
10%
20%
30%
40%
50%
1988 1993 1998 2003 2008 2013 2018
Financial year ending
FSC STATE OF THE INDUSTRY 2019 33
Investment & Funds Management Introduction

Figure 26 below shows the growth in the various types of managed funds since 1988. According to Morningstar data, most of the growth in superannuation fund numbers occurred in the period before 2005, while for investment trusts the growth in number of funds occurred before 2010. The growth in Exchange Traded Funds (ETFs) and Listed Investment Companies (LICs) has been much more recent. A separate section of this report examines ETFs in more detail.
Figure 26 – Number of managed funds in Australia
Source: Morningstar.
LIC
Investment Bonds
Investment Trusts
Pension/Annuity
Super
ETF
0
1
2
3
4
5
1988 1993 1998 2003 2008 2013 2018
Th
ou
san
ds
FSC STATE OF THE INDUSTRY 201934
Investment & Funds Management Introduction

There are a small number of large managed funds in Australia, and a significant tail of much smaller funds, as shown in Figure 27 below. The actual distribution is more skewed than shown, as the figure only shows the 1,185 funds with assets of $50m or more – there are an additional 1,740 funds below $50m in assets.
Figure 27 – Distribution of managed fund sizes
Source: Morningstar. This figure only shows funds with assets of $50m or more.
The top 10 managed funds each have assets of more than $4bn, and the assets of this group are $73.8bn in total. This represents 13 per cent of total assets in managed funds, while the top 10 funds are only 0.3 per cent of the number of funds in the Morningstar database for Australia. There are 118 funds with assets of more than $1bn each, representing just under half (48 per cent) of total managed funds assets, but only 4 per cent of the number of funds.
0
2
4
6
8
10
12
14
1 201 401 601 801 1001
Fu
nds
un
der
man
agem
ent,
$bn
FSC STATE OF THE INDUSTRY 2019 35
Investment & Funds Management Introduction

The Asia Region Funds PassportThe 2010 report, Australia as a Financial Centre – Building on Our Strengths, by the Australian Financial Centre Forum (known as the Johnson report) recommended the establishment of an Asia Region Funds Passport (Passport) as a region-wide initiative to allow managed funds from any Passport country to be sold directly to retail investors in any other Passport country while maintaining appropriate investor protections.
After a lengthy development period, the Passport commenced on 1 February 2019 with Japan, Thailand and Australia now able to process applications from managed funds to become Passport funds. New Zealand and the Republic of Korea are expected to implement the required framework within their respective jurisdictions in the not too distant future.
With forecast economic growth in Asia, along with increasing wealth and an ageing population, the Asian region is expected to be a significant driver of future growth in the global funds management industry. The Passport, if supported by the right regulatory settings, presents an excellent opportunity to export Australian funds management within the Asia region, given Australia has untapped potential in exporting its recognised funds management expertise.
Export of funds managementAs noted earlier, Australia is currently exporting financial services, but not to its full potential. Australia still has significant opportunities to expand exports of funds management, with Australia managing only a small fraction of total funds on behalf of overseas investors – in terms of Diagram 1 on page 30, 5.7 per cent of the investment into Australian managed funds is sourced from offshore ($126bn as a proportion of $2,203bn). A time series of this measure is shown in Figure 28, showing funds management exports have grown in some periods but this growth has essentially stalled since 2012, which was when a tax increase was imposed on managed funds (see next page).
FSC STATE OF THE INDUSTRY 201936
Investment & Funds Management The Asia Region Funds PassportExport of funds management
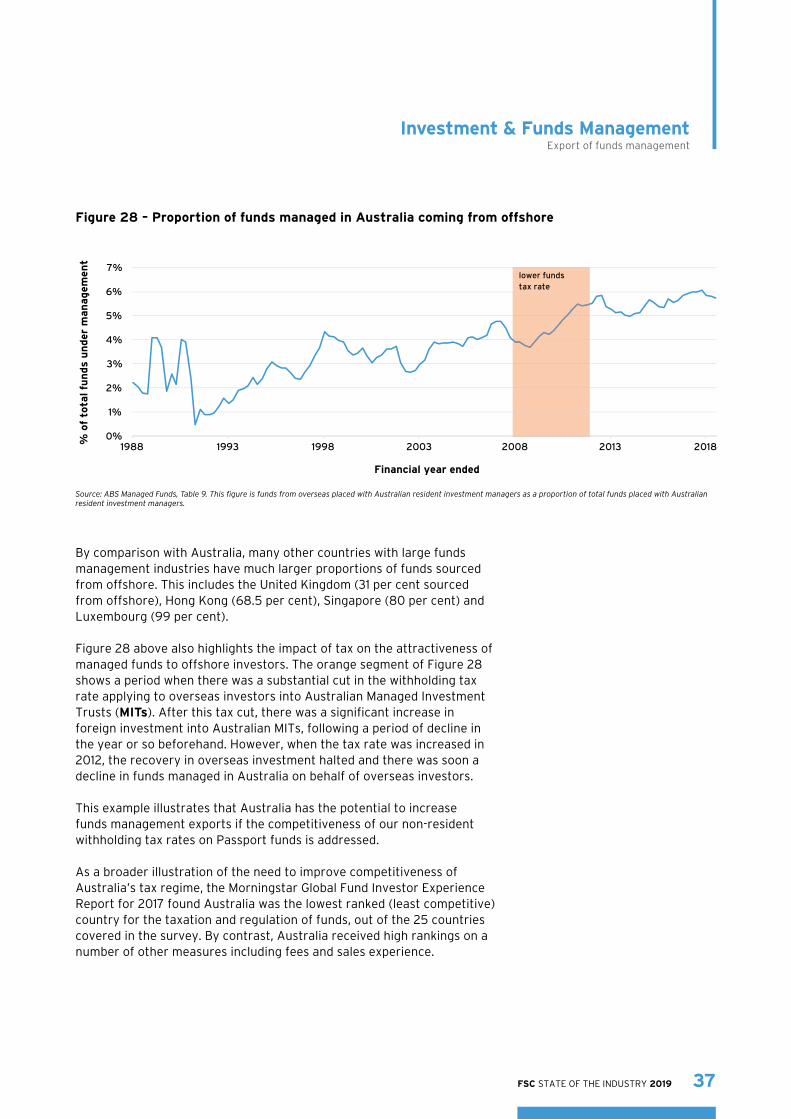
Figure 28 – Proportion of funds managed in Australia coming from offshore
Source: ABS Managed Funds, Table 9. This figure is funds from overseas placed with Australian resident investment managers as a proportion of total funds placed with Australian resident investment managers.
By comparison with Australia, many other countries with large funds management industries have much larger proportions of funds sourced from offshore. This includes the United Kingdom (31 per cent sourced from offshore), Hong Kong (68.5 per cent), Singapore (80 per cent) and Luxembourg (99 per cent).
Figure 28 above also highlights the impact of tax on the attractiveness of managed funds to offshore investors. The orange segment of Figure 28 shows a period when there was a substantial cut in the withholding tax rate applying to overseas investors into Australian Managed Investment Trusts (MITs). After this tax cut, there was a significant increase in foreign investment into Australian MITs, following a period of decline in the year or so beforehand. However, when the tax rate was increased in 2012, the recovery in overseas investment halted and there was soon a decline in funds managed in Australia on behalf of overseas investors.
This example illustrates that Australia has the potential to increase funds management exports if the competitiveness of our non-resident withholding tax rates on Passport funds is addressed.
As a broader illustration of the need to improve competitiveness of Australia’s tax regime, the Morningstar Global Fund Investor Experience Report for 2017 found Australia was the lowest ranked (least competitive) country for the taxation and regulation of funds, out of the 25 countries covered in the survey. By contrast, Australia received high rankings on a number of other measures including fees and sales experience.
0%
1%
2%
3%
4%
5%
6%
7%
1988 1993 1998 2003 2008 2013 2018 % o
f to
tal fu
nds
un
der
man
agem
ent
Financial year ended
lower funds tax rate
FSC STATE OF THE INDUSTRY 2019 37
Investment & Funds Management Export of funds management
Key Statistics Number of products: 194
Total market capitalisation of products: $47.7 billion
• Growth of 27% over 1 year; 328% over 5 years
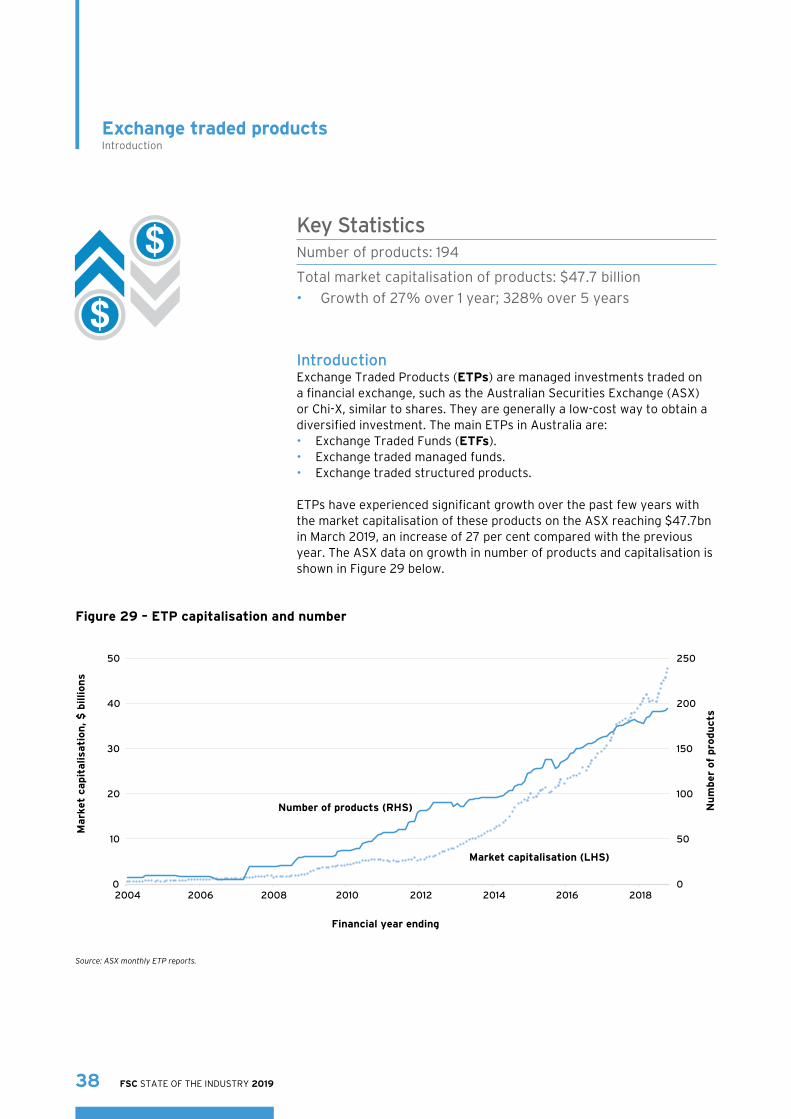
IntroductionExchange Traded Products (ETPs) are managed investments traded on a financial exchange, such as the Australian Securities Exchange (ASX) or Chi-X, similar to shares. They are generally a low-cost way to obtain a diversified investment. The main ETPs in Australia are: • Exchange Traded Funds (ETFs).• Exchange traded managed funds.• Exchange traded structured products.
ETPs have experienced significant growth over the past few years with the market capitalisation of these products on the ASX reaching $47.7bn in March 2019, an increase of 27 per cent compared with the previous year. The ASX data on growth in number of products and capitalisation is shown in Figure 29 below.
Figure 29 – ETP capitalisation and number
Source: ASX monthly ETP reports.
Market capitalisation (LHS)
Number of products (RHS)
0
50
100
150
200
250
0
10
20
30
40
50
2004 2006 2008 2010 2012 2014 2016 2018
Nu
mber
of
pro
du
cts
Mark
et c
apit
alisa
tion
, $
billion
s
Financial year ending
FSC STATE OF THE INDUSTRY 201938
Exchange traded productsIntroduction
There are now 194 ETPs listed on the ASX, up from 157 ETPs in 2017, an increase of 24 per cent over the past two years. The increase over five years is extraordinary, with the market capitalisation increasing by 328 per cent and the number of funds by 102 per cent.
Globally, there is about $5.4tr invested in ETF products (as at April 2019); the Australian market is about 0.9 per cent of the global ETF market. Global growth in ETF assets over the year to April 2019 in ETF assets was 11.2 per cent, which compares to Australian growth of 26.7 per cent.32
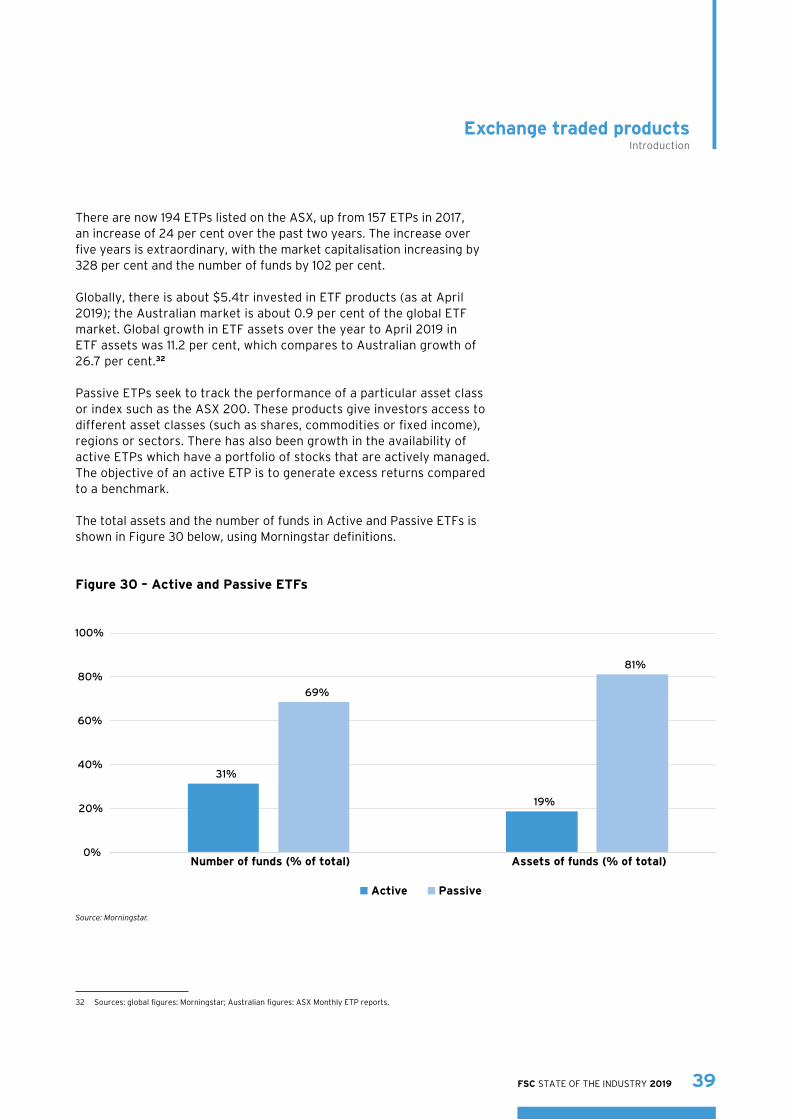
Passive ETPs seek to track the performance of a particular asset class or index such as the ASX 200. These products give investors access to different asset classes (such as shares, commodities or fixed income), regions or sectors. There has also been growth in the availability of active ETPs which have a portfolio of stocks that are actively managed. The objective of an active ETP is to generate excess returns compared to a benchmark.
The total assets and the number of funds in Active and Passive ETFs is shown in Figure 30 below, using Morningstar definitions.
32 Sources: global figures: Morningstar; Australian figures: ASX Monthly ETP reports.
Figure 30 – Active and Passive ETFs
Source: Morningstar.
31%
19%
69%
81%
0%
20%
40%
60%
80%
100%
Number of funds (% of total) Assets of funds (% of total)
Active Passive
FSC STATE OF THE INDUSTRY 2019 39
Exchange traded productsIntroduction

There are a small number of very large ETFs, with 12 ETFs having a value of over $1bn, according to Morningstar data (two active and ten passive), representing just under half (48 per cent) of all ETF assets. The distribution of ETF size is shown in Figure 31 below.
ETFs are open-ended, meaning that the number of units in the ETF is not fixed and can change over time as there are net redemptions or purchases by investors. This helps to ensure ETFs trade at or near their net asset value.
The appeal of ETFs to investors include:• Ease of access, generally without minimum investment amounts as
can be the case with other managed funds.• Increased liquidity, as buying ETFs is as simple as purchasing
shares. This also means readier access to capital during times of market disruption.
• Often low cost, particularly for traditional ETFs which track an index.• Diversification (the ability to invest in a basket of assets).• Low risk of the price of the ETF diverging significantly from
underlying assets.
Figure 31 – Distribution of ETF sizes
Source: Morningstar. Active Passive
0
1
2
3
4
Net
ass
ets,
$billion
s
FSC STATE OF THE INDUSTRY 201940
Exchange traded productsIntroduction

The growth in ETFs has been supported by strong growth in the number of investors using ETFs and financial advisers recommending ETFs. The 2019 BetaShares/Investment Trends Australian ETF Report33 found:• There are 385,000 investors using ETFs, with the number of ETF
investors growing substantially (increasing by 22 per cent from the previous year).
• SMSFs are big users of ETFs, with almost a third of the total ETF market invested through SMSFs.
• More than half of all financial advisers use ETFs (up 8 per cent from the previous year).
Asset allocation for ETPsInternational equities is the largest category for asset allocation by ETP funds, with 45 per cent of all ETP assets in this category as at March 2019. This has been increasing over time, as shown in Figure 32 below. While Australian equity remains the second largest category at 34 per cent of assets, the share allocated to this category has been declining over time.
33 See https://www.betashares.com.au/insights/latest-betashares-investment-trends-etf-report/
Figure 32 – ETP asset allocation over time
Source: Morningstar. ‘Other’ includes listed property in Australia and overseas assets.
Cash
Fixed Interest
Australian Equity
International Equity
Other 0%
10%
20%
30%
40%
50%
Mar-2017 Mar-2018 Mar-2019
FSC STATE OF THE INDUSTRY 2019 41
Exchange traded productsIntroduction
Asset allocation for ETPs

More detailed asset allocation as at March 2019 is shown in Figure 33 below. In total, equity is 79 per cent of the total assets of all ETPs in Australia, while fixed interest is 9.9 per cent of total assets.
Figure 33 – ETP detailed asset allocation
Source: Morningstar.
45.1%
33.9%
7.7%
6.5%
2.7%
2.3%
1.8%
International Equity
Australian Equity
Australian Fixed Interest
Cash
Australian Listed Property
International Fixed Interest
Other
0% 10% 20% 30% 40% 50%
FSC STATE OF THE INDUSTRY 201942
Exchange traded productsAsset allocation for ETPs

Key StatisticsNumber of active financial advisers: 26,793
Number of Australian financial service licensees: 2,237
IntroductionFinancial advisers provide a range of services which help Australians to save, invest wisely, manage investments, prepare for retirement, assess risk and manage risks including through insurance. In Australia, financial advisers provide advice through Australian financial services licensees.
Financial advice is an industry in a state of flux. Following the Government’s introduction, in late 2016, of legislation into Parliament to raise the education, training and ethical standards (Professional Standards Laws), the financial advice industry is moving towards becoming a profession. The industry is also undergoing significant change as a result of issues raised by the Royal Commission into Misconduct in the Banking, Superannuation and Financial Services Industry (Royal Commission).
The Professional Standards Laws established a new independent standards body, the Financial Adviser Standards and Ethics Authority (FASEA) which has been charged with setting education standards for financial advisers.
Under the Professional Standards Laws, financial advisers must meet the following standards:• Have a relevant degree.• Complete a Professional Year (new advisers only). • Comply with FASEA’s Financial Planners and Advisers Code of Ethics.• Undertake mandatory continuing professional development annually.• Pass an exam.
The new framework commenced on 1 January 2019.
Transitional arrangements will require existing advisers to have completed the exam by 1 January 2021 and the degree or equivalent qualification by 1 January 2024.
FASEA has consulted with industry on numerous parts of the Professional Standards Law, including the following:• Education pathways for existing and new advisers.• The contents of the Code of Ethics.• The timing and content of the exam.• Required qualifications for foreign advisers.
FSC STATE OF THE INDUSTRY 2019 43
Financial AdviceIntroduction
From January 2016, advisers who provide tax advice which is incidental to the financial advice they provide to clients must also be registered with the Tax Practitioners Board (TPB). Such registration entails advisers meeting the following requirements from the TPB:• Qualifications and experience standards.• Continuing professional development requirements.• Complying with the TPB’s Code of Professional Conduct.
These standards are separate to those under the Professional Standards Laws.
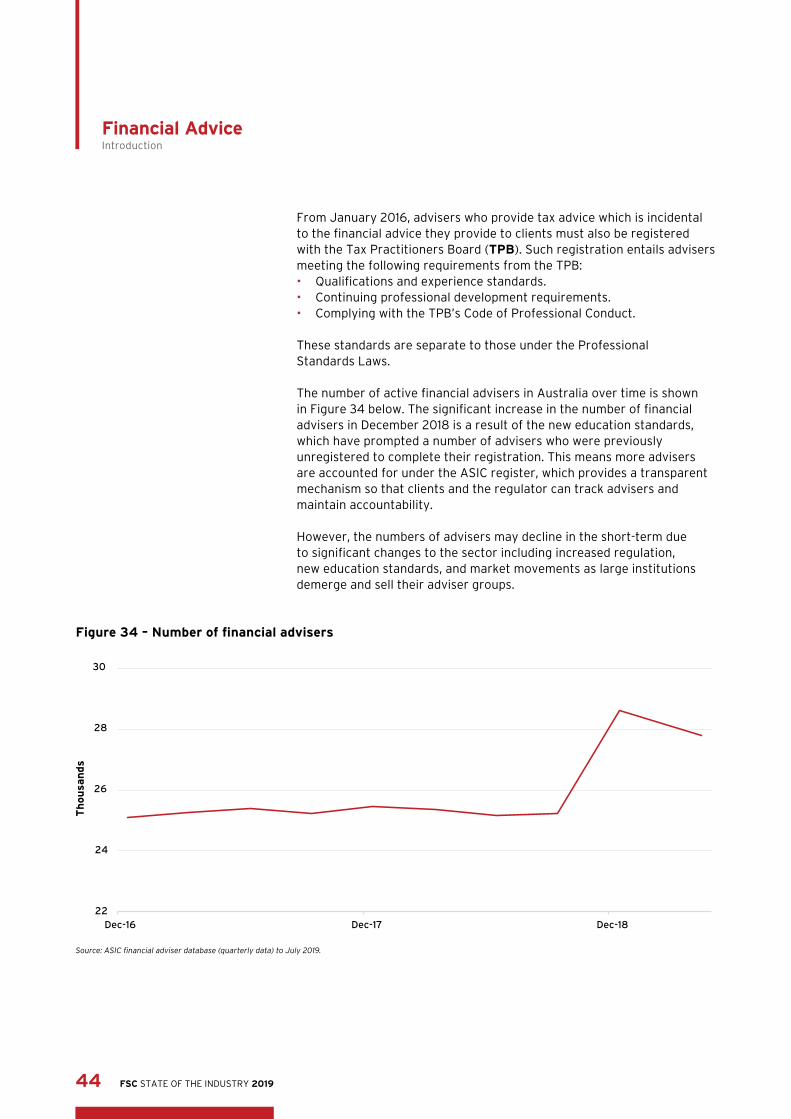
The number of active financial advisers in Australia over time is shown in Figure 34 below. The significant increase in the number of financial advisers in December 2018 is a result of the new education standards, which have prompted a number of advisers who were previously unregistered to complete their registration. This means more advisers are accounted for under the ASIC register, which provides a transparent mechanism so that clients and the regulator can track advisers and maintain accountability.
However, the numbers of advisers may decline in the short-term due to significant changes to the sector including increased regulation, new education standards, and market movements as large institutions demerge and sell their adviser groups.
Figure 34 – Number of financial advisers
Source: ASIC financial adviser database (quarterly data) to July 2019.
22
24
26
28
30
Dec-16 Dec-17 Dec-18
Th
ou
san
ds
FSC STATE OF THE INDUSTRY 201944
Financial AdviceIntroduction
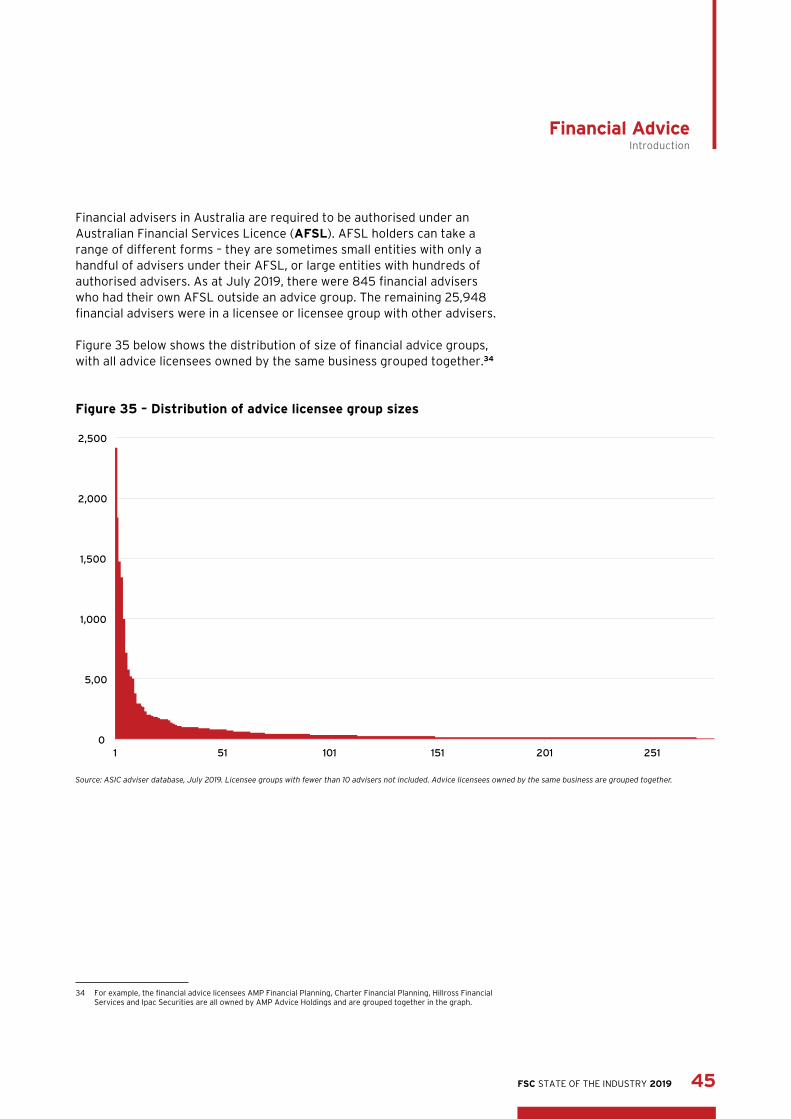
Financial advisers in Australia are required to be authorised under an Australian Financial Services Licence (AFSL). AFSL holders can take a range of different forms – they are sometimes small entities with only a handful of advisers under their AFSL, or large entities with hundreds of authorised advisers. As at July 2019, there were 845 financial advisers who had their own AFSL outside an advice group. The remaining 25,948 financial advisers were in a licensee or licensee group with other advisers.
Figure 35 below shows the distribution of size of financial advice groups, with all advice licensees owned by the same business grouped together.34
34 For example, the financial advice licensees AMP Financial Planning, Charter Financial Planning, Hillross Financial Services and Ipac Securities are all owned by AMP Advice Holdings and are grouped together in the graph.
Figure 35 – Distribution of advice licensee group sizes
Source: ASIC adviser database, July 2019. Licensee groups with fewer than 10 advisers not included. Advice licensees owned by the same business are grouped together.
0
5,00
1,000
1,500
2,000
2,500
1 51 101 151 201 251
FSC STATE OF THE INDUSTRY 2019 45
Financial AdviceIntroduction
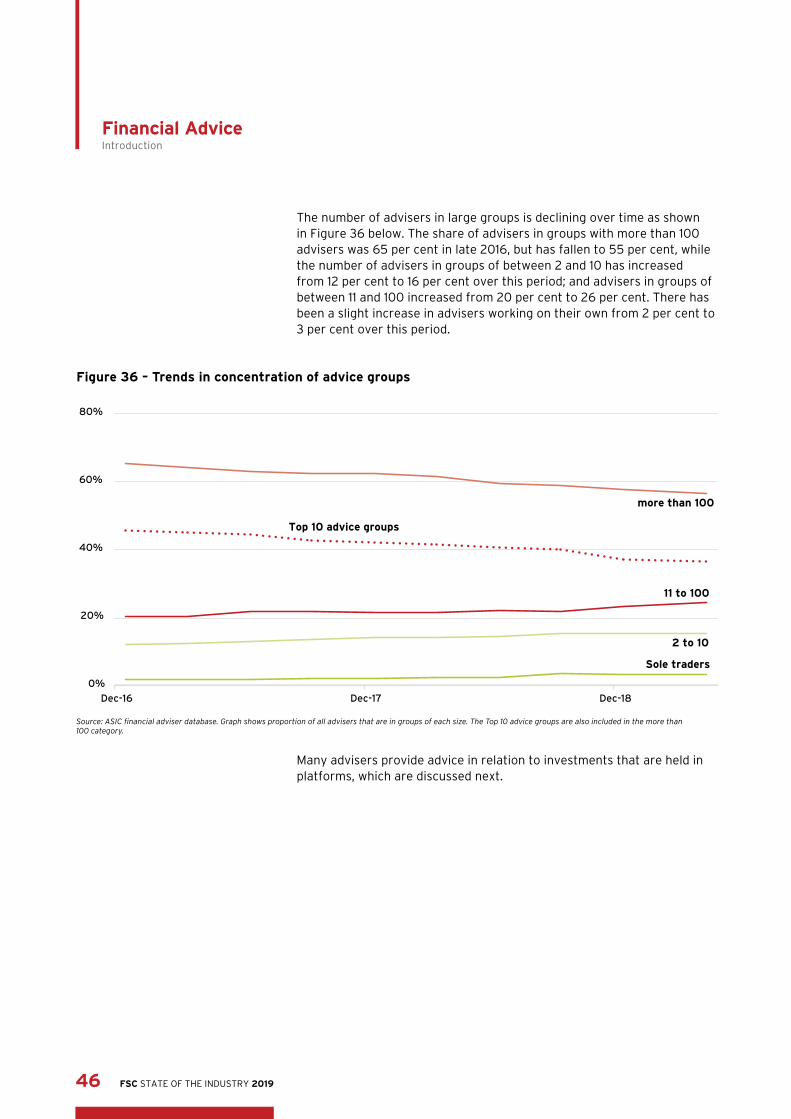
Figure 36 – Trends in concentration of advice groups
Source: ASIC financial adviser database. Graph shows proportion of all advisers that are in groups of each size. The Top 10 advice groups are also included in the more than 100 category.
Many advisers provide advice in relation to investments that are held in platforms, which are discussed next.
The number of advisers in large groups is declining over time as shown in Figure 36 below. The share of advisers in groups with more than 100 advisers was 65 per cent in late 2016, but has fallen to 55 per cent, while the number of advisers in groups of between 2 and 10 has increased from 12 per cent to 16 per cent over this period; and advisers in groups of between 11 and 100 increased from 20 per cent to 26 per cent. There has been a slight increase in advisers working on their own from 2 per cent to 3 per cent over this period.
Sole traders
more than 100
2 to 10
11 to 100
Top 10 advice groups
0%
20%
40%
60%
80%
Dec-16 Dec-17 Dec-18
Trend in concentration of advice groups proportion of total advisers in each category
FSC STATE OF THE INDUSTRY 201946
Financial AdviceIntroduction
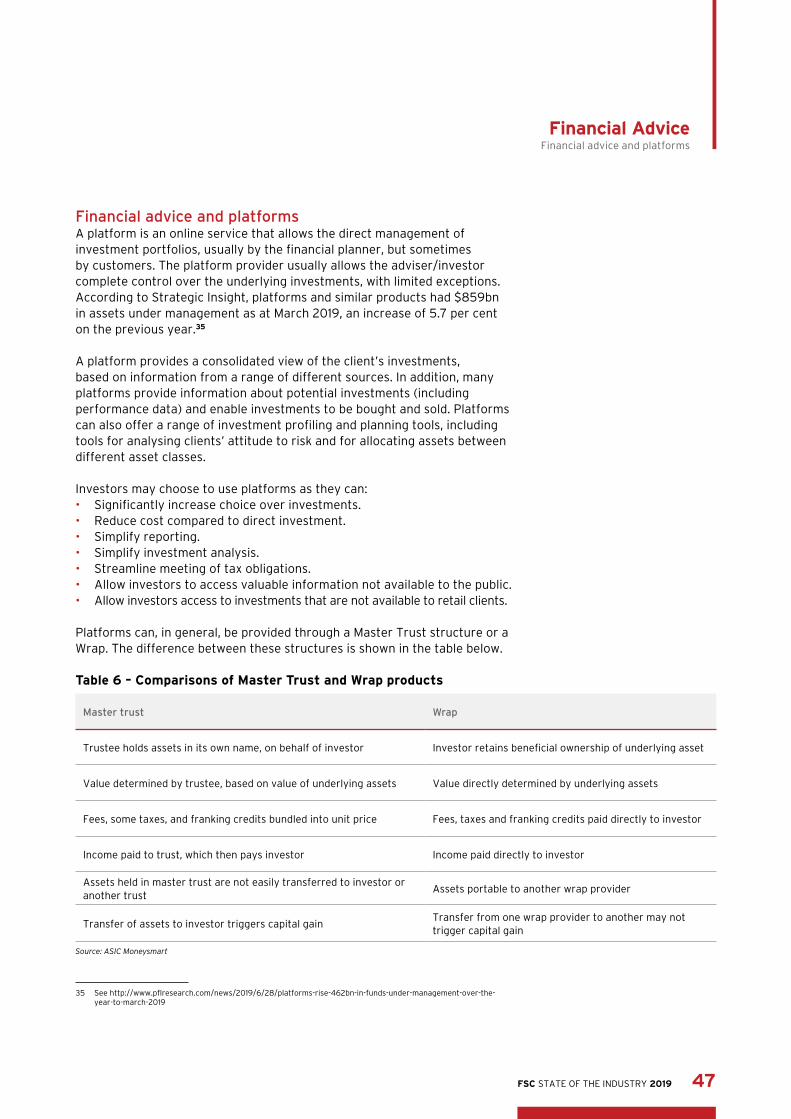
Financial advice and platformsA platform is an online service that allows the direct management of investment portfolios, usually by the financial planner, but sometimes by customers. The platform provider usually allows the adviser/investor complete control over the underlying investments, with limited exceptions. According to Strategic Insight, platforms and similar products had $859bn in assets under management as at March 2019, an increase of 5.7 per cent on the previous year.35
A platform provides a consolidated view of the client’s investments, based on information from a range of different sources. In addition, many platforms provide information about potential investments (including performance data) and enable investments to be bought and sold. Platforms can also offer a range of investment profiling and planning tools, including tools for analysing clients’ attitude to risk and for allocating assets between different asset classes.
Investors may choose to use platforms as they can:• Significantly increase choice over investments.• Reduce cost compared to direct investment.• Simplify reporting. • Simplify investment analysis.• Streamline meeting of tax obligations.• Allow investors to access valuable information not available to the public.• Allow investors access to investments that are not available to retail clients.
Platforms can, in general, be provided through a Master Trust structure or a Wrap. The difference between these structures is shown in the table below.
Table 6 – Comparisons of Master Trust and Wrap products
Master trust Wrap
Trustee holds assets in its own name, on behalf of investor Investor retains beneficial ownership of underlying asset
Value determined by trustee, based on value of underlying assets Value directly determined by underlying assets
Fees, some taxes, and franking credits bundled into unit price Fees, taxes and franking credits paid directly to investor
Income paid to trust, which then pays investor Income paid directly to investor
Assets held in master trust are not easily transferred to investor or another trust
Assets portable to another wrap provider
Transfer of assets to investor triggers capital gainTransfer from one wrap provider to another may not trigger capital gain
Source: ASIC Moneysmart
35 See http://www.pflresearch.com/news/2019/6/28/platforms-rise-462bn-in-funds-under-management-over-the-year-to-march-2019
FSC STATE OF THE INDUSTRY 2019 47
Financial AdviceFinancial advice and platforms

Response of advice industry to Royal CommissionThe advice industry is implementing a number of the recommendations of the Royal Commission. Broadly speaking, the recommendations seek to adopt a range of measures to improve the following:• The transparency of fees.• The independence and
impartiality of advisers.• The overall quality of advice.• Adviser standards and
discipline for breaches.
The Royal Commission also recommended the cessation of grandfathered commissions for investments and the implementation of a compensation scheme of last resort (CSLR) which will result in further changes to the advice industry.
Financial advice and life insuranceIn 2013, when the Future of Financial Advice Reforms came into effect, commissions relating to life insurance advice were generally exempted from the ban on conflicted remuneration.
Following ASIC’s review of life insurance advice in October 2014, the FSC and the Association of Financial Advisers commissioned John Trowbridge to conduct an independent review of ASIC’s findings and to make recommendations for reform. Mr Trowbridge made 11 recommendations designed to improve alignment of interests across the life insurance value chain.
Following the release of the Trowbridge Report in November 2015, the Government announced a number of significant reforms that came into effect in January 2018, including:• Maximum upfront commissions an adviser can receive to be
60 per cent of the premium from January 2020. • Upfront commissions to be phased down gradually, mandating a
maximum of 80 per cent from January 2018; and a maximum of 70 per cent from January 2019 to January 2020.
• Maximum ongoing commissions to be 20 per cent.• The ban on conflicted remuneration to apply to direct sales channels.• A two year retention or “clawback” period:
• If a policy is cancelled or not continued in its first year, the adviser must return 100 per cent of the commission to the life insurer.
• If a policy is cancelled or not continued in its second year, the adviser must return 60 per cent of the commission to the life insurer.
The Government also announced: • The FSC would develop the Life Insurance Code of Practice by
1 July 2016 (the Code is now in place — see details on page 59).• Industry will be responsible for widening Approved Product Lists for
life insurance products through the development of a standard.• ASIC will review the impact of these changes in 2021. In 2017 the
Government stated that, if this review determines that there has not been significant improvement in advice quality, the Government will mandate that advisers are able to receive level commissions only.
In its Final Report, the Royal Commission recommended that ASIC consider reducing the commission cap to zero. The Government continues to support the proposed ASIC review, and agreed with the Royal Commission that ASIC should also consider whether or not the current caps on commissions have contributed to underinsurance.
FSC STATE OF THE INDUSTRY 201948
Financial AdviceFinancial advice and life insuranceResponse of advice industry to Royal Commission

Key StatisticsNumber of companies: 29
Claims paid: $10.5 billion, with 68% growth over 5 years
Top three product types:
• Life cover, covering 16 million people
• Total & Permanent Disability, covering 13 million people
• Income Protection, covering 7 million people
IntroductionLife insurance plays a critical role in providing Australian households with financial security in the event of unexpected death, disease or disability.
The certainty of having critical expenses covered, such as payments for the mortgage or rent, school fees, medical fees, and grocery bills allows Australians to focus on what’s most important – keeping the family together and getting back to normality without major additional disruption to their life, or the fear of losing the family home.
The main types of life insurance are:• Life cover – pays a lump sum on death.36
• Total & permanent disability cover (TPD) – pays a lump sum on becoming unable to work ever again.
• Income protection, also known as disability income or salary continuance insurance – pays an income during periods of being unable to work due to illness or injury.
• Trauma/critical illness insurance – pays a lump sum on being diagnosed with one of a number of specified illnesses.
• Consumer credit insurance – pays off a loan on death and may provide other benefits.
• Funeral insurance – pays a lump sum on death intended to meet funeral and other costs.
• Accident insurance – pays on death or injury caused by an accident.
36 In this publication, life cover is used for the specific product that pays a lump sum on death, while life insurance is used for the whole industry.
FSC STATE OF THE INDUSTRY 2019 49
Life InsuranceIntroduction
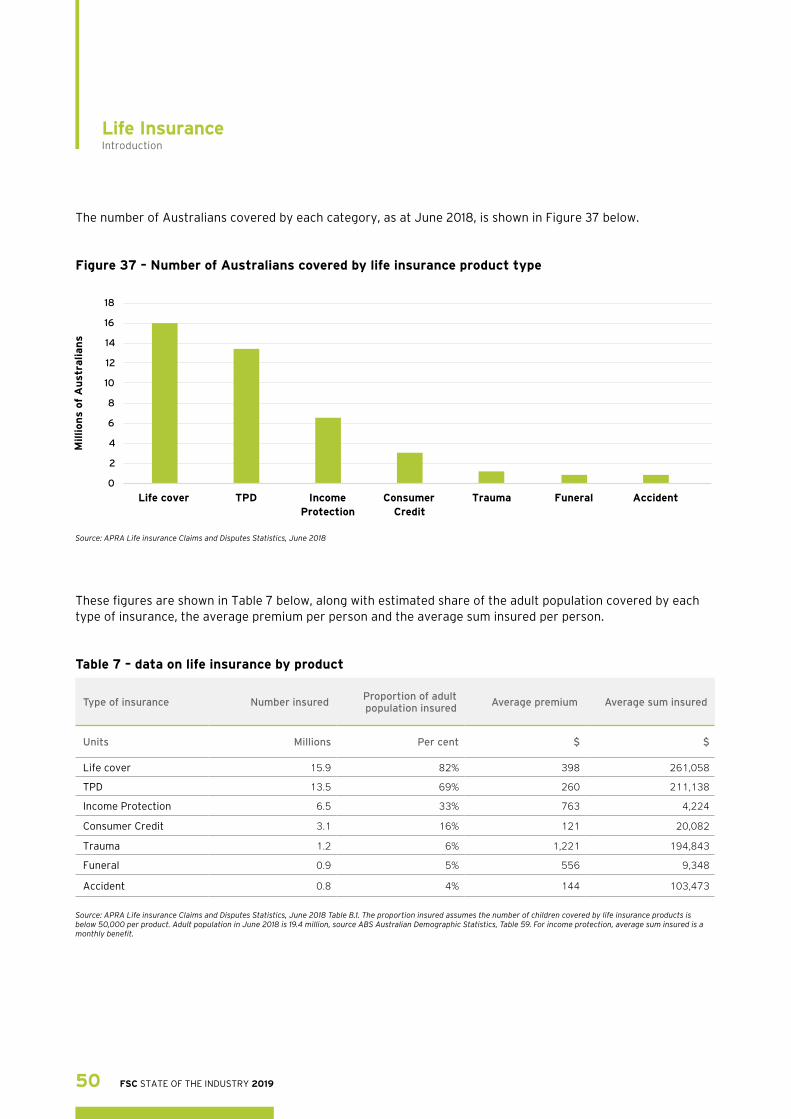
The number of Australians covered by each category, as at June 2018, is shown in Figure 37 below.
Figure 37 – Number of Australians covered by life insurance product type
Source: APRA Life insurance Claims and Disputes Statistics, June 2018
These figures are shown in Table 7 below, along with estimated share of the adult population covered by each type of insurance, the average premium per person and the average sum insured per person.
Table 7 – data on life insurance by product
Type of insurance Number insuredProportion of adult population insured
Average premium Average sum insured
Units Millions Per cent $ $
Life cover 15.9 82% 398 261,058
TPD 13.5 69% 260 211,138
Income Protection 6.5 33% 763 4,224
Consumer Credit 3.1 16% 121 20,082
Trauma 1.2 6% 1,221 194,843
Funeral 0.9 5% 556 9,348
Accident 0.8 4% 144 103,473
Source: APRA Life insurance Claims and Disputes Statistics, June 2018 Table B.1. The proportion insured assumes the number of children covered by life insurance products is below 50,000 per product. Adult population in June 2018 is 19.4 million, source ABS Australian Demographic Statistics, Table 59. For income protection, average sum insured is a monthly benefit.
0
2
4
6
8
10
12
14
16
18
Life cover TPD Income Protection
Consumer Credit
Trauma Funeral Accident
Million
s of
Au
stra
lian
s
FSC STATE OF THE INDUSTRY 201950
Life InsuranceIntroduction

There are currently 29 institutions licenced to offer life insurance products within Australia, but the number is expected to reduce through mergers and acquisitions.
The life insurance market is undergoing a period of unprecedented regulatory change in the wake of the Royal Commission, structural change through merger and acquisition activity, and change as a result of the Protecting Your Super reforms (discussed in the superannuation section of this report) and other likely or potential reforms.
Life insurance claimsLife insurance provides a significant benefit to the community, with life insurers paying $10.5bn in claims in the year to March 2019. The value of claims has been growing faster than GDP since 2008,37 as shown in Figure 38 below – growth in the value of claims over the past five years has been 68 per cent.
APRA data also shows that life insurers paid claims to about 100,000 Australians in the year to December 2018, and 93 per cent of claims received are paid in the first instance.
37 The APRA data on claims commences in 2008.
Figure 38 – Value of life cover & income protection claims as share of GDP
Source: APRA quarterly life insurance statistics, ABS national accounts. The figures are four quarter moving averages.
0.0%
0.1%
0.2%
0.3%
0.4%
0.5%
0.6%
2008 2010 2012 2014 2016 2018
FSC STATE OF THE INDUSTRY 2019 51
Life InsuranceIntroduction
Life insurance claims

The main causes of claim for all types of life insurance products for the calendar year 2018 are shown in Figure 39 below, while the value of these claims by cause is shown in Figure 40.
Figure 39 – Number of life insurance claims by cause of claim, 2018
Source: FSC-KPMG Cause of Claims data, calendar year 2018. The figures above represent 85 per cent of total number of claims. The remainder of claims has unknown cause or cause not provided. Definitions are based on the 10th version of the WHO International Classification of Diseases.
Figure 40 – Value of life insurance claims by cause of claim, 2018
For notes and source see Figure 39.
0 2 4 6 8 10 12 14 16 18 20
Accident
Cancer (neoplasm)
Musculoskeletal disorder
Mental Disorders
Heart & circulatory disorders
Other conditions
Abnormal Clinical Findings
Nervous disorder
Respiratory disorder
Digestive disorder
Urinary and reproductive disorder
Infectious disease
Hormonal, nutritional and metabolic disorder
Eye condition
Blood diseases
Skin diseases
Congenital Conditions
Ear and hearing diseases
Pregnancy related disorder
Newborn condition
Thousands of claims
1.70 1.25
0.75 0.63
0.58 0.39
0.23 0.17
0.13 0.10
0.0 0.4 0.8 1.2 1.6
Cancer (neoplasm)
Accident
Mental Disorders
Heart & circulatory disorders
Musculoskeletal disorder
Nervous disorder
Abnormal Clinical Findings
Digestive disorder
Respiratory disorder
Other condition
Urinary and reproductive disorder
Infectious disease
Hormonal, nutritional and metabolic disorder
Blood Diseases
Eye Diseases
Congenital Conditions
Ear & hearing diseases
Skin Diseases
Pregnancy related disorder
Newborn condition
$ billions
FSC STATE OF THE INDUSTRY 201952
Life InsuranceLife insurance claims

Life insurance pays out for a diverse range of reasons set out in Figures 39 and 40. Australia is the only nation in the world to compile and collect detailed industry-wide data on cause of claim. The data also provides an up-to-date snapshot on the health of Australians as a nation.
Figure 40 above shows mental health conditions rank third in the cost of claims across all life insurance categories, with $750m paid out for this category in 2018. Population studies show 22 per cent of all disabilities in Australians result from a mental health condition, and similarly, FSC figures show 20 per cent of all disability claims are due to a mental health condition. This shows Australian life insurers are paying out mental health claims at a similar rate as they are occurring in the community.
Impact of life insurance on Government BudgetsResearch by the Productivity Commission (PC) found38 that income protection insurance (also called disability income or salary continuance insurance) can provide a substantial benefit to Government budgets over the long term. The research estimates the overall impact of the following:39
• The impact on Budgets of the tax concessions for insurance, offset by the stamp duty charged on insurance premiums and the tax on insurance payouts.
• Any increase in the Age Pension caused by insurance reducing superannuation balances at retirement.
• Any reduction in Government income payments for people who make an insurance claim, particularly the Government Disability Support Pension (DSP).
For middle- and higher-income earning individuals and couples, income protection insurance is estimated to provide a substantial benefit to the Government budgets. This means restricting the availability of this type of insurance could easily cost Governments money in the long term.
For total and permanent disability (TPD) insurance, the PC estimated the impact on the Budget to be small for middle- and higher-income earning individuals and couples. This means that any Budget benefit from restrictions on this type of insurance are likely to disappear in the long term.
38 Productivity Commission (2018) Fiscal impacts of insurance in superannuation, Technical Supplement 9 to the Inquiry Report Superannuation: Assessing Efficiency and Competitiveness.
39 The impact is the combined effect on the Commonwealth, State and Territory Budgets.
FSC STATE OF THE INDUSTRY 2019 53
Life InsuranceLife insurance claims
Impact of life insurance on Government Budgets
The PC estimated income protection insurance and TPD insurance have a long term cost to Government for low income individuals and couples. However, it is quite common for Governments to provide net subsidies to low income earners, including through subsidising the use of a particular product or service, so that products can be more affordable for this group. Restricting insurance for this group may save the Government money, but would likely make low income earners worse off, particularly by reducing their disposable income if they make a claim.
The PC’s research also shows the net tax concession for income protection insurance and TPD insurance is progressive, with a larger concession provided to low income individuals and couples and a smaller concession to middle- and higher- income earning individuals and couples.
The PC’s analysis may underestimate the Budget benefit of insurance – in particular the analysis appears to omit the benefit to budgets from the taxation of the insurance margin.40
Importantly, the PC’s analysis does not cover the benefit to individuals from having insurance, which can be substantial. The benefits include reducing financial risks, providing peace of mind and supporting income for injured people above the Government’s modest safety net. When the benefit to individuals is combined with the impact on Government Budgets, the overall benefit of life insurance products should be clear.
Note: Government income support through the DSP can be income and asset tested, so payouts of income protection and TPD insurance can reduce Government spending on the DSP.41 By contrast, the provision of disability services under the National Disability Income Scheme (NDIS) is not income or asset tested, so income protection and TPD insurance should not affect Government spending on the NDIS.42
40 Specifically the company tax and GST applying to the insurance margin.
41 See https://www.humanservices.gov.au/individuals/services/centrelink/disability-support-pension/eligibility/income-and-assets-tests
42 See https://newsandviews.benevolent.org.au/building-ability/is-the-ndis-means-tested and http://guides.dss.gov.au/guide-social-security-law/1/1/n/03
FSC STATE OF THE INDUSTRY 201954
Life InsuranceImpact of life insurance on Government Budgets

Channels for purchasing life insuranceAustralians purchase life insurance in these ways:• By being a member of a group scheme, for example, through a group
policy taken out by the trustee of a superannuation fund to cover its members, or by an employer for its employees.
• As an individual policy, arranged by a financial adviser, directly with the life insurer, or through their partners/affiliates.
In the year to March 2019, $10.4bn in life insurance net policy revenue related to an individual policy, or 66 per cent of the total, while $5.4bn related to group policies usually purchased through superannuation, or 34 per cent of the total.43 A time series of the two channels for purchasing life insurance is in Figure 41 below. Both channels increased as a share of GDP until about 2015, then fell; individually purchased insurance recovered from about 2017 while group insurance has continued its downward trend.
43 APRA Quarterly life insurance data.
44 The outlier relates to a reinsurance transaction occurring during this period. APRA is unable to provide more information on this transaction due to data confidentiality.
Figure 41 – Net policy revenue as share of GDP, by channel of purchase
Source: APRA quarterly life insurance statistics, ABS national accounts. The figures are four quarter moving averages. An outlier in March 2017 is omitted from income protection insurance figures.44 There are other types of life insurance products included in the total, including conventional participating, annuities, and participating investment, which generally have small net policy revenue components.
Group
Individual
0.0%
0.2%
0.4%
0.6%
0.8%
2008 2010 2012 2014 2016 2018
FSC STATE OF THE INDUSTRY 2019 55
Life InsuranceChannels for purchasing life insurance

Life insurance industry premiums and assetsPremiums from life insurance grew faster than GDP until about 2016, and have grown more slowly since then, as shown in Figure 42 below. Figure 42 also indicates the premiums from the two largest segments of life insurance premiums: lump sum insurance, which includes TPD, trauma and life cover; and income protection insurance, also called disability income insurance. These two components of premiums broadly followed the trend of overall premium revenue.
Figure 42 – Net policy revenue as share of GDP, by type of insurance
Source and notes: see Figure 41.
For the year to March 2019, lump sum premiums were $12.1bn, or 76 per cent of the total, while income protection premiums were $3.7bn, or 24 per cent of the total.
Policy revenue from particular types of life insurance can be further divided based upon whether the policy is purchased by an individual or purchased on a group basis (see details above). This division is shown in Figure 43 on following page. Lump sum insurance purchased by individuals has been growing as a share of GDP over time, while lump sum insurance bought on a group basis reached a peak in about 2015 and has declined since then. Individual income protection insurance grew as a share of GDP until about 2014 and has remained fairly constant since then, while group income protection has remained fairly constant as a share of the economy.
Lump sum
Income protection
Total
0.0%
0.2%
0.4%
0.6%
0.8%
1.0%
1.2%
2008 2010 2012 2014 2016 2018
FSC STATE OF THE INDUSTRY 201956
Life InsuranceLife insurance industry premiums and assets

Figure 43 – Net policy revenue as share of GDP, by channel and type of insurance
Source and notes: see Figure 41.
The distribution of net policy revenue by insurer is shown in Figure 44 on following page. These figures are as at December 2018 and there have been, substantial changes in the industry since that date which will affect the figures and will increase the proportion of foreign owned life insurance companies in Australia. For example:• The expected acquisition of CommInsure’s life insurance business
by AIA.• The acquisition of OnePath Life by Zurich.• The acquisition of Suncorp’s life insurance business, Asteron Life,
by TAL.• The acquisition of 80 per cent of MLC Life by Nippon Life.
As at December 2018, there were eight insurers with net policy revenue of over $1bn in the financial year ending on or before December 2018.Collectively these insurers received 68 per cent of the industry-wide net policy revenue. Note the figures do not include non-policy revenue, such as revenue relating to investments.
Individual lump sum
Individual income protection
Group income protection
Group lump sum
0.0%
0.1%
0.2%
0.3%
0.4%
0.5%
2008 2010 2012 2014 2016 2018
FSC STATE OF THE INDUSTRY 2019 57
Life InsuranceLife insurance industry premiums and assets
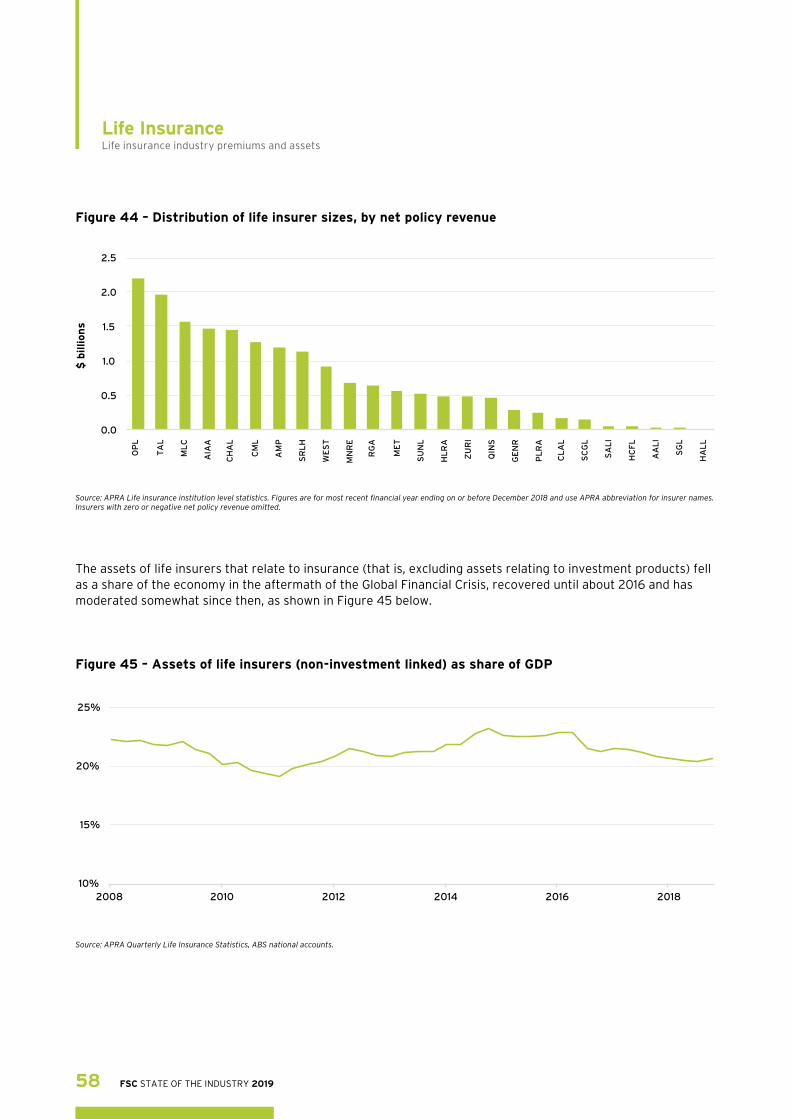
Figure 44 – Distribution of life insurer sizes, by net policy revenue
Source: APRA Life insurance institution level statistics. Figures are for most recent financial year ending on or before December 2018 and use APRA abbreviation for insurer names. Insurers with zero or negative net policy revenue omitted.
Figure 45 – Assets of life insurers (non-investment linked) as share of GDP
Source: APRA Quarterly Life Insurance Statistics, ABS national accounts.
The assets of life insurers that relate to insurance (that is, excluding assets relating to investment products) fell as a share of the economy in the aftermath of the Global Financial Crisis, recovered until about 2016 and has moderated somewhat since then, as shown in Figure 45 below.
0.0
0.5
1.0
1.5
2.0
2.5
OP
L
TA
L
ML
C
AIA
A
CH
AL
CM
L
AM
P
SR
LH
WE
ST
MN
RE
RG
A
ME
T
SU
NL
HL
RA
ZU
RI
QIN
S
GE
NR
PL
RA
CL
AL
SC
GL
SA
LI
HC
FL
AA
LI
SG
L
HA
LL
$ b
illion
s
10%
15%
20%
25%
2008 2010 2012 2014 2016 2018
FSC STATE OF THE INDUSTRY 201958
Life InsuranceLife insurance industry premiums and assets
Life Insurance Code of PracticeThe FSC Life Insurance Code of Practice (the Code) commenced operation on 30 June 2017 and has been instrumental in improving industry standards. The Code covers every aspect of a customer’s interaction with life insurers from product design, sales, underwriting, communications, vulnerable customers, claims and, when things go wrong, complaints. The Royal Commission stated:
“…the Life Insurance Code of Practice has played an important role in addressing previously problematic behaviours within that industry. The two clearest examples related to reducing the use of surveillance of claimants and reducing the use of outdated medical definitions.”
ASIC’s submission to the review of the Life Insurance Code of Practice also stated that the Code has resulted in improvements in industry practices.
The Code is monitored by an independent Life Code Compliance Committee (LCCC), which monitors compliance with the Code and can sanction Code subscribers for failing to correct Code breaches. The LCCC’s first yearly report shows that 92 per cent of lump sum claims and 89 per cent of income claims were paid in a timely manner within the Code time limits of six months and two months respectively.
The current review of the Code is proposing comprehensive enhancements that will deliver substantive new consumer protections, including the following:• Product design – strengthening consumer protection on funeral
plans, consumer credit insurance & accident insurance .• Sales – sales remuneration consistent with good consumer outcomes
and new protections to prevent pressure selling .• Access to Insurance – requirement for clearer, unambiguous, fairer
underwriting questions, including mental health examples .• Mental Health – requirement to take into account individual
circumstances of mental health conditions, such as history and severity, with examples.
• Retention – no coercive retention tactics .• Superannuation Trustees – the Code to be binding on FSC
superannuation trustees members .
Additionally, the FSC has announced the following changes, which will also be included in the next iteration of the Code:• Genetics Moratorium, which commenced on 1 July 2019, allows
people to take out up to $500,000 of life cover without disclosing the results of genetic tests.
• Consent – agreement with RACGP on the wording used by insurers when obtaining consent for access to health information for underwriting applications and claims. This agreement aims to protect privacy and ensure customers are fully informed about what they are consenting to and when and how their consent is used.
FSC STATE OF THE INDUSTRY 2019 59
Life InsuranceLife Insurance Code of Practice

Figure 1 – Industry share of economy 4
Figure 2 – Labour productivity growth by industry (cumulative) 6
Figure 3 – Multifactor productivity growth by industry (cumulative) 7
Figure 4 – Financial services share of total employment 9
Figure 5 – Full time employment as a share of total employment 10
Figure 6 – Male to female employment ratio in financial services 11
Figure 7 – Financial services share of company tax and share of profits 12
Figure 8 – Superannuation assets as share of GDP, by segment 14
Figure 9 – Number of superannuation entities, index 15
Figure 10 – Distribution of superannuation fund sizes 17
Figure 11 – Superannuation assets as share of GDP, historical & forecast 18
Figure 12 – Superannuation market projection by segment 18
Figure 13 – Assets in funded and private pension arrangements, OECD countries, in US Dollars 19
Figure 14 – Forecast spending on Age Pension as share of GDP – OECD projection for 2035 20
Figure 15 – Forecast net replacement rates for low and average income earners 21
Figure 16 – Mandatory pension contribution rates for an average worker 22
Figure 17 – Private pension plans – annualised real returns, 2012 to 2017 23
Figure 18 – Median superannuation balances by age 24
Figure 19 – Gender gap in median super balances by age 25
Figure 20 – Superannuation fund asset allocation 26
Figure 21 – Tax advantage provided to average earner investing in pension fund 27
Figure 22 – Tax advantage provided to earner investing in pension fund, by income level 28
Figure 23 – Source of funds under management 31
Figure 24 – Australian funds under management as share of GDP 32
Figure 25 – Funds management asset allocation, share of total 33
Figure 26 – Number of managed funds in Australia 34
Figure 27 – Distribution of managed fund sizes 35
Figure 28 – Proportion of funds managed in Australia coming from offshore 37
Figure 29 – ETP capitalisation and number 38
Figure 30 – Active and Passive ETFs 39
Figure 31 – Distribution of ETF sizes 40
Figure 32 – ETP asset allocation over time 41
Figure 33 – ETP detailed asset allocation 42
Figure 34 – Number of financial advisers 44
Figure 35 – Distribution of advice licensee group sizes 45
Figure 36 – Trends in concentration of advice groups 46
Figure 37 – Number of Australians covered by life insurance product type 50
Figure 38 – Value of life cover & income protection claims as share of GDP 51
Figure 39 – Number of life insurance claims by cause of claim, 2018 52
Figure 40 – Value of life insurance claims by cause of claim, 2018 52
Figure 41 – Net policy revenue as share of GDP, by channel of purchase 55
Figure 42 – Net policy revenue as share of GDP, by type of insurance 56
Figure 43 – Net policy revenue as share of GDP, by channel and type of insurance 57
Figure 44 – Distribution of life insurer sizes, by net policy revenue 58
Figure 45 – Assets of life insurers (non-investment linked) as share of GDP 58
FSC STATE OF THE INDUSTRY 201960
Table of Figures

Disclaimer
This document provides information only. You should seek independent, professional advice before making any decision based on this information. Information in this report is believed to be accurate, however, subject to any contrary provision in any applicable law, neither the data providers, the Financial Services Council, nor any related parties, their employees or directors, provide any warranty of accuracy or reliability in relation to such information or accept any liability to any person who relies on it.

Financial Services Council
Level 24, 44 Market Street Sydney NSW 2000 Australia
Phone +61 (2) 9299 3022 Fax +61 (2) 9299 3198 Email [email protected]
www.fsc.org.au