state of the ipv4 market...
TRANSCRIPT

2016 State of the IPv4 Market Report

Welcome to Avenue4’s 2016 State of the IPv4 Market Report
The IPv4 market experienced dramatic change in 2016. 2015 ended with a high volume of numbers transferred, a growing but still moderate number of transactions, with mid to large block prices remaining at their lowest levels to date. In 2016, the number of transactions in the ARIN region more than tripled, the mid to large block pricing almost doubled, and the total volume of numbers transferred dropped by 50%. Once abundant, the supply of large legacy blocks (relative to demand) contracted considerably in the first few months of 2016.
Applying our knowledge of the domestic and global IPv4 markets and extensive custom deal experience, we enabled our clients to thrive during this tumultuous period. In the last year, we paid close attention to the dynamic market trends, and structured and closed deals that have provided value for both sellers and buyers notwithstanding market volatility and uncertainty.
By the close of 2016, the broader Internet community embraced the IPv4 market as the only viable means to acquire IPv4 numbers. This drove many sellers and buyers out of the shadows. It also offered space for professional IPv4 market advisors like Avenue4 to contribute meaningfully to RIR transfer policy development, and to make significant investments in market-maturing solutions. Buoyed by this pro-market climate, for example, we spent much of 2016 designing and developing a trading platform that will bring technology and process innovation to the IPv4 marketplace.
In this second annual State of the IPv4 Market Report, we examine how the IPv4 market progressed over 2016, expose the important market forces that shaped the year and will affect the market’s future, evaluate the influence of IPv6 deployment on IPv4 market activity, and spotlight key takeaways that should inform market participants’ decisions over the next year.
At Avenue4, we try to see around the corners to anticipate challenges, and help our clients and their buyers succeed by navigating the route ahead with discernment.
We hope you find this look back at 2016 a useful guide to charting your path forward in 2017.
Marc Lindsey Janine GoodmanPresident Vice PresidentAvenue4 LLC Avenue4 LLC
Avenue4 | 2016 State of the IPv4 Market Report
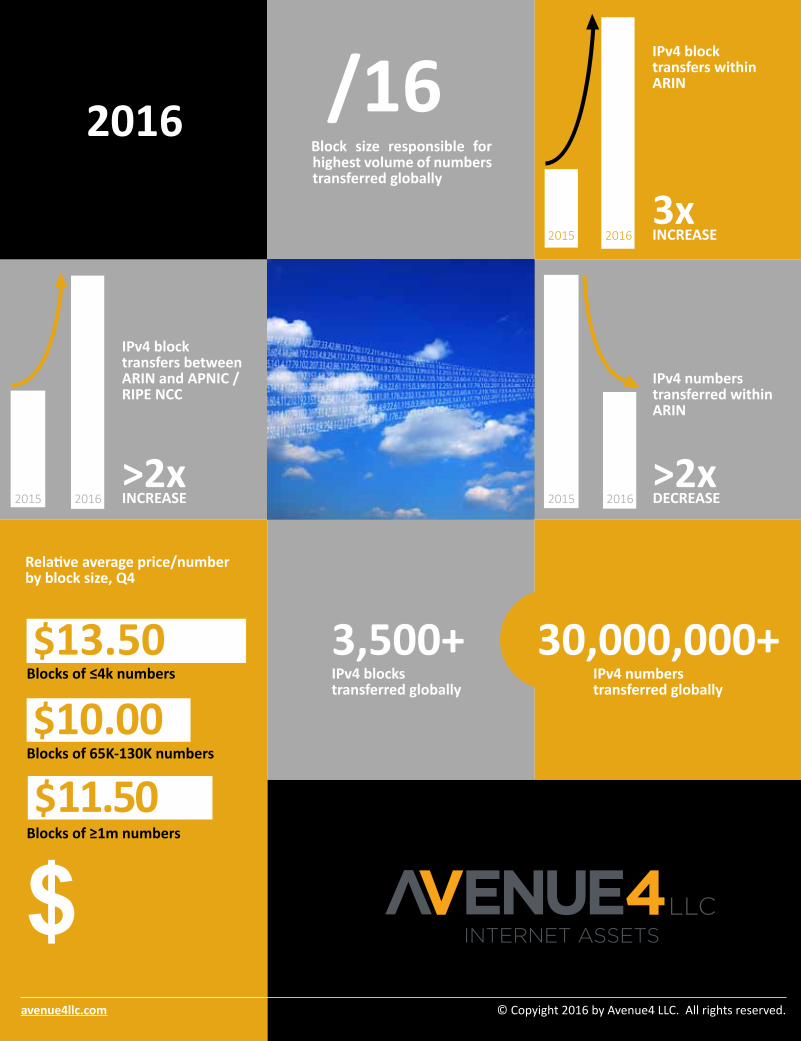
/16Block size responsible for highest volume of numbers transferred globally
Blocks of ≤4k numbers
Blocks of 65K-130K numbers
Blocks of ≥1m numbers
IPv4 blocktransfers within ARIN
3x INCREASE
IPv4 blocktransfers between ARIN and APNIC / RIPE NCC
>2xINCREASE
2016
30,000,000+IPv4 numbers transferred globally
$13.50
$10.00
$11.50
Relative average price/number by block size, Q4
$
3,500+IPv4 blocks transferred globally
2015
2015 2016
2016
IPv4 numberstransferred withinARIN
>2xDECREASE 2015 2016
avenue4llc.com © Copyight 2016 by Avenue4 LLC. All rights reserved.

2016: Running the NumbersOverview of North American Market Activity in 20161
In 2015, the monthly rate of IPv4 transactions involving the ARIN region trended upward over the course of the year, and the volume of transferred numbers jumped significantly over the prior year’s total.2 This pattern changed in 2016. At the beginning of 2016, the monthly rate of transactions climbed sharply to nearly double the average monthly number of transactions at the end of 2015, but then leveled out by Q2 and remained relatively flat for the remainder of the year. See Table 1. The total annual volume of transferred numbers plummeted. Over 39.76 million IPv4 numbers were transferred in 2015. In 2016, that figure dropped by 48% to just over 20.75 million numbers transferred. See Table 2.
The 2016 decline in the total numbers transferred corresponds to last year’s decline in large block transactions (i.e., blocks comprising 1M+ numbers). There were 14 large
blocks transferred from or within the ARIN region in 2015, but only 3 such blocks were transferred in 2016.
In our 2015 State of the IPv4 Market Report, we anticipated this market shift. We forecasted that the number of large transactions would shrink as the result of three key factors: (i) the depletion of available large block supply, (ii) some large block holders would elect to sell their inventory in smaller quantities to realize higher unit prices available for small block trades, and (iii) other large block holders would decide to hold off entering the market until large block unit pricing improved. Although we pointed out that reduced large block supply would affect the market in 2016, the full extent of the shortage did not become apparent until the end of Q1 2016. Several large, unadvertised legacy blocks were not actually available for sale.
Many large block holders received their blocks more than 20 years ago. Over that time, some of them allocated large swaths of their IP address space for use among and
between business units and locations resulting in fragmented utilization that is not optimal for participation in the IPv4 market. Selling small, available fragments can produce too little total yield to garner internal support in large organizations. Alternatively, conducting internal assessments and renumbering projects to create large unused contiguous IPv4 address space requires considerable planning and investment. For potential large block holders faced with this decision, entering the market in the short term (particularly in 2014 and 2015 when unit prices were low) seemed infeasible. Many organizations struggled to justify funding a large-scale renumbering project without a reliable and compelling financial case for realizing value by selling unused IPv4 numbers (supported by an efficient and liquid market). Furthermore, renumbering projects are often met with resistance by IT and network departments that are uninterested in introducing changes to stable legacy infrastructure environments.
0
10
20
30
40
50
60
70
80
90
2015 2016
Table 1: Number of Transfers in ARIN, 2015 and 2016
0
5,000,000
10,000,000
15,000,000
20,000,000
25,000,000
30,000,000
35,000,000
40,000,000
2015 2016
2015 2016
Table 2: Volume of Addresses Transferred in ARIN, 2015 and 2016
1 Avenue4 | 2016 State of the IPv4 Market Report
Data Analysis

With far fewer large blocks available for sale early in 2016, the price per IP address for large blocks began to rise rapidly, which in turn boosted seller confidence in the potential returns on IP renumbering project investments. In the latter half of 2016, the volume of numbers transferred grew from just shy of 5.8 million numbers in the first half of 2016 to nearly 15 million numbers in the last 6 months of 2016. See Table 3. We also believe the resurgence of large block deals in the latter half of 2016 is partly attributable to wider-spread use of flexible contract structures that ease some of the financial burden of front-loaded renumbering projects for sellers, and guarantee future supply for large buyers who are willing to accept delivery of their inventory over an extended time period.
While large block sellers slowly re-entered the market in Q2 and Q3 2016, large block buyers reset their own expectations and began buying in smaller increments. Large block buyers purchased over 36.5 million IPv4 numbers from the ARIN region in 2015. Of that total volume, 786,432 (or 2%) of those numbers were purchased as /16 (65,636 numbers) blocks. In contrast, large block buyers in 2016 purchased 13.7 million IPv4 numbers out of the ARIN region, and over 13% of that volume was purchased in the form of individual /16 blocks.
Expanding the view to all purchases in 2016, a full 50% of all numbers were transferred as /16 blocks. Table 4 shows that /16 block trades produced more transferred numbers in 2016 than any other block size.
Meanwhile, the Inter-RIR transfer market showed some muscle in 2016. Last year, we predicted that the market would see a significant rise in global transactions among RIPE, ARIN and APNIC caused by globalization of the market under the RIPE inter-RIR policy. Although the volume of numbers transferred via ARIN’s inter-RIR transfer policy (8.4 of its policy manual) was still shy of the volumes transferred in 2015, there were 4 times more 8.4 transactions in 2016 than in 2015.
This is not the whole story. See Table 5. When comparing the percentage of 8.4 transactions to the total number of transactions involving the ARIN region, the data shows that there was actually a slight decrease between 2015 and 2016. However, the volume of numbers transacted via 8.4 as a percentage of total volumes transacted in the ARIN region grew by over 70% in 2016. Inter-RIR transactions indeed comprised a larger portion of the ARIN IPv4 market because the total volume of numbers traded out of ARIN under the inter-RIR transfer policy remained relatively stable between 2015 and 2016 (dropping by only 14%) while
domestic volumes dropped by more than half. As a consequence of this development, the average trade size for inter-RIR transactions in 2016 was nearly twice the average size for domestic trades, which contrasts with 2015 when there was near parity in the average size of domestic and inter-RIR transactions.
Table 4: Volume of Addresses Transferred and Number of Transfers by Block Size in ARIN, 2016
0
2,000,000
4,000,000
6,000,000
8,000,000
10,000,000
12,000,000
14,000,000
16,000,000
January-June 2016 July-December 2016
Table 3: Volume of Addresses Transferred in ARIN, 2016
0
50
100
150
200
250
300
350
0
1,000,000
2,000,000
3,000,000
4,000,000
5,000,000
6,000,000
/10 /12 /13 /14 /15 /16 /17 /18 /19 /20 /21 /22 /23 /24
Tran
sfer
s
Addr
esse
s Tra
nsfe
rred
0%
5%
10%
15%
20%
25%
% Inter-RIR ofTransactions
% Inter-RIR of Volume ofAddresses Transacted
2015 2016
Table 5: Inter-RIR Segment of Total Number of Transactions and Volume of Addresses Transacted
in ARIN, 2015-2016
2016 State of the IPv4 Market Report | Avenue4 2
Data Analysis
Pricing TrendsThe distorting effects of the ARIN
IPv4 free pool are now eliminated, however, lack of transparency remains a major challenge for buyers and sellers. Pricing opacity has been adversely affecting efficient market outcomes the behavior of market participants.
Today, the best way for buyers and sellers to ascertain current market prices is to engage an experienced broker or other intermediary with sufficient data points to provide pricing guidance based on recent and comparable transactions. Some buyers and sellers have attempted to employ traditional sourcing methodologies, such as RFIs and RFPs.
While these approaches can yield some usable information, many sellers, buyers and intermediaries will not participate in these formal solicitations because they inherently are burdened with extended timelines, inefficient and bespoke bidding procedures, and assume an imbalance of leverage (favoring whichever side of the transaction issued the RFx) that is often out of step with market realities. As a result, the RFx issuer typically receives incomplete and distorted information, which means an experienced IPv4 market adviser is still required to help benchmark the bids. The least reliable sources of pricing information are unsourced articles and blogs from authors with no direct or casual experience in market transactions.
To provide our pricing guidance, we draw from both our own considerable portfolio of closed transactions, and the bid-ask spread on failed pricing negotiations. We augment our primary data with secondary sources, including print media research and direct interviews with our extensive network of active market participants.
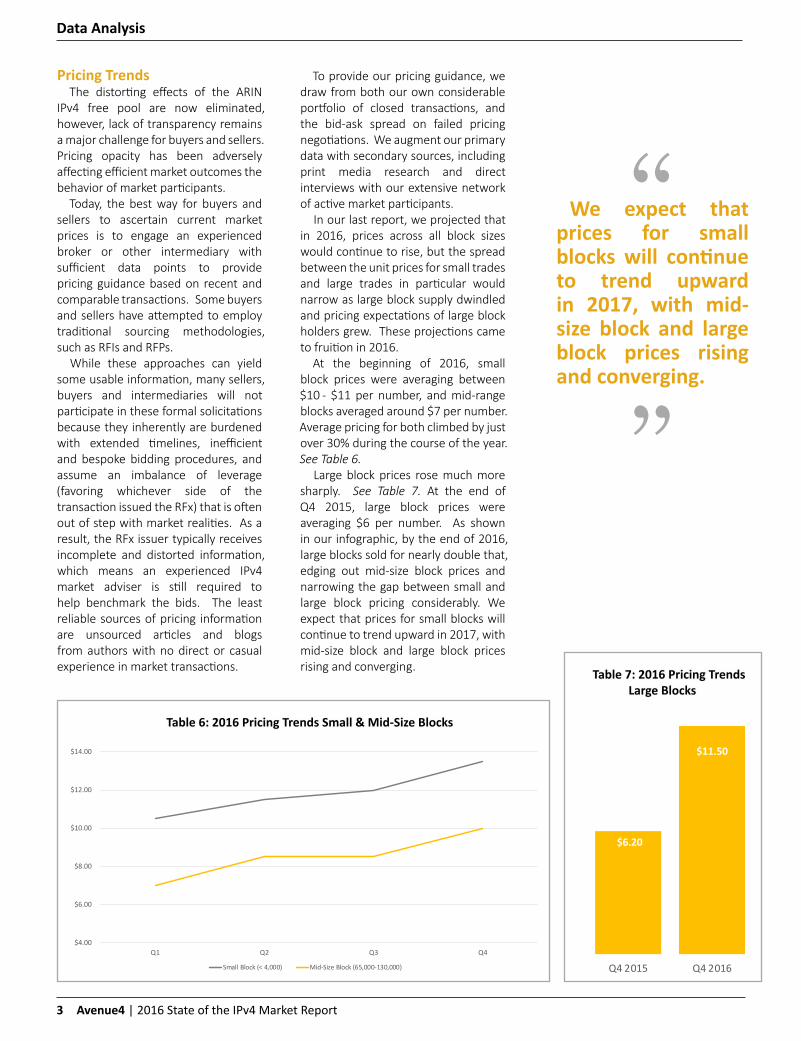
In our last report, we projected that in 2016, prices across all block sizes would continue to rise, but the spread between the unit prices for small trades and large trades in particular would narrow as large block supply dwindled and pricing expectations of large block holders grew. These projections came to fruition in 2016.
At the beginning of 2016, small block prices were averaging between $10 - $11 per number, and mid-range blocks averaged around $7 per number. Average pricing for both climbed by just over 30% during the course of the year. See Table 6.
Large block prices rose much more sharply. See Table 7. At the end of Q4 2015, large block prices were averaging $6 per number. As shown in our infographic, by the end of 2016, large blocks sold for nearly double that, edging out mid-size block prices and narrowing the gap between small and large block pricing considerably. We expect that prices for small blocks will continue to trend upward in 2017, with mid-size block and large block prices rising and converging.
$4.00
$6.00
$8.00
$10.00
$12.00
$14.00
Q1 Q2 Q3 Q4
Small Block (< 4,000) Mid-Size Block (65,000-130,000)
Table 6: 2016 Pricing Trends Small & Mid-Size Blocks
$6.20
$11.50
Q4 2015 Q4 2016
Table 7: 2016 Pricing Trends Large Blocks
“ We expect that prices for small blocks will continue to trend upward in 2017, with mid-size block and large block prices rising and converging.
“
3 Avenue4 | 2016 State of the IPv4 Market Report
Data Analysis

Impact of IPv6 IPv6 global deployment accelerated modestly in 2016. As
seen in Table 8, however, this acceleration occurred mostly in the last quarter of 2016.
According to the IPv6 deployment model created by Cisco engineer Eric Vyncke3 at the beginning of 2016, global IPv6 deployment was expected to hit 50% in August 2021. At the end of 2016, the projections were revised and moved forward by just one month, to July 2021. Several countries have made real progress toward IPv6 in 2016. However, of the nearly 200 countries worldwide that are tracked by Vyncke, IPv6 deployment is at or above 5% or more in just 33 countries (as of the end of 2016); and of those, only 5 countries – the U.S., Belgium, Switzerland, Greece and Luxembourg – have IPv6 deployment in excess of 25%.
Over the last year, IPv6 deployments have been occurring as predicted. At the beginning of 2016, the Vynke analysis projected that global deployment would hit around 13.5% at the beginning of 2017. Although Google’s IPv6 connectivity measurements4 show IPv6 traffic hovering in the 16% range during weekends and holidays, the average business day traffic during the first five business days of January averaged 13.6%, which is just .1% above the Vynke projections. The data also reveals that while personal use of IPv6 may be taking off, IPv6 use in the business community is still lagging behind.
The Vynke projections, which predict 35% IPv6 deployment by 2020, also track with Cisco’s Visual Network Indexing report. In its July 2015 report, Cisco predicted that IPv6 traffic would hit 34% global IPv6 deployment by 2019. Cisco revised that to 2020 in its most recent report.5
The recent acceleration of IPv6 deployment may be the shift the Internet community has been waiting for. The next 6 months of data will show whether this burst of activity represents the new normal.
Although IPv6 deployments are on the uptick consistently, there appears to be no correlation between growth in IPv6 deployment and the pace of the IPv4 market. Last year, we tracked growth in IPv6 deployment based on Google’s measurements with the number of IPv4 transactions recorded in the ARIN, APNIC and RIPE NCC registries (including both internal transactions and inter-RIR transactions)6 and found that IPv6 deployment and IPv4 marketplace activity were running on separate tracks. We found this unsurprising given that the path to full IPv6 deployment requires that organizations run dual stack environments (i.e., operating IPv6 and IPv4 networks concurrently) as an interim step.
One year later, little has changed. See Table 9. While IPv6 deployment has been steadily progressing so has activity in the IPv4 transfer market.
5.00%
7.00%
9.00%
11.00%
13.00%
15.00%
17.00%
Jan-
15Fe
b-15
Mar
-15
Apr-
15M
ay-1
5Ju
n-15
Jul-1
5Au
g-15
Sep-
15O
ct-1
5N
ov-1
5De
c-15
Jan-
16Fe
b-16
Mar
-16
Apr-
16M
ay-1
6Ju
n-16
Jul-1
6Au
g-16
Sep-
16O
ct-1
6N
ov-1
6De
c-16
Table 8: Global IPv6 Deployment2015-2016
0
2
4
6
8
10
12
14
16
18
0
1,000,000
2,000,000
3,000,000
4,000,000
5,000,000
6,000,000
7,000,000
Jan-16 Feb-16 Mar-16 Apr-16 May-16 Jun-16 Jul-16 Aug-16 Sep-16 Oct-16 Nov-16 Dec-16
Volume of Addresses Transferred % IPv6 Deployment
Table 9: Addresses Transferred Globally and Native IPv6 Deployment
2016 State of the IPv4 Market Report | Avenue4 4
Data Analysis

1 This report (other than pricing) uses publicly available data provided by three regional Internet registries: ARIN, RIPE NCC and APNIC. Although many IPv4 transactions involve RIR approval, some transactions occur outside of RIR transfer policies. Buyers and sellers occasionally decide, under various transaction structures, to trade numbers without seeking RIR approval or updating the registrant of record in the RIR registry. While not insignificant, these “dark” transactions do not materially distort the rest of the market nor do they impair an effective analysis of it. For pur-poses of this report, we believe Avenue4 source data and the public RIR data, taken together, rea-sonably reflect the market even though it almost certainly underestimates total market activity. See also Geoff Huston, Addressing 2016, The ISP Column, www.potaroo.net/ispcol/2017-01/addr2016.html where Huston concludes, based on an evaluation of the routing table changes in 2016, that operational control for some addresses changed hands without corresponding up-dates to the RIR registry databases. 2 We measure market activity both by the volume of IPv4 numbers transferred, and the number of transactions. We count trades conducted solely within the ARIN region and inter-RIR trades where at least one party is in the ARIN region and the other party is either in the APAC and European regions. For purposes of the analysis in this report, a single transaction represents a transfer of numbers (which may include multiple blocks) between the same parties in the same time period.
3 https://www.vyncke.org/ipv6status/project.php?metric=p&timeforward=365&timebackward=365&country=us
4 https://www.google.com/intl/en/ipv6/statistics.html
5 http://www.cisco.com/c/m/en_us/solutions/service-provider/vni-forecast-highlights.html
6 RIPE NCC does not report on legacy transfers, and therefore, the global transfer data in terms of both number of transactions and volumes transferred is, if anything, under-represented.
Key Takeaways• Large block supply is tightening but
available at the right price and with a flexible contract structure in place.
• Large block buyers are adjusting to satisfying their demand in smaller increments.
• Prices across the board are escalating at a relatively brisk pace and likely will continue at least over the first half of 2017.
• There continues to be little, if any, correlation between growth in IPv6 deployment and IPv4 market activity.
• Inter-region transfer activity between ARIN and RIPE or APNIC is comprising a greater portion of the ARIN market as a whole.
How Accurate Were Our 2016 Predictions?
We predicted… At the end of 2016 …
IPv6 connectivity hits 17% On December 31, global IPv6 connectivity hit a high of 16.79%.
Average market price for small blocks (/20 or less) exceeds $12 with unit prices driven by the influx of RIPE purchases
Small block pricing averaged $12.50.
The number of large transactions (/12s or higher) drops considerably, but prices for large blocks increase sharply to at least $8.00/number
The number of large 8.3 and 8.4 transactions dropped by more than half, and the average price doubled.
Inter-RIR transfers from ARIN to the RIPE region will comprise at least 25% of the total volume of transfers
The number of ARIN/RIPE NCC transactions climbed to nearly 40% of all inter-RIR transactions and the volume totaled almost 30% of global transactions.
ARIN adopts a policy that relaxes needs justi-fication for small to medium 8.3 transfers on a “trial basis”
ARIN adopted Policy 2016-5, which reduces the utili-zation requirement applicable to transferred blocks, and automatically qualifies certain organizations for a /24.
5 Avenue4 | 2016 State of the IPv4 Market Report
Data Analysis

Avenue4 LLC2001 L Street NW Suite 900Washington, DC 20036
202.741.9525
avenue4llc.com
.
Avenue4 was founded in September 2014 by Marc Lindsey and Janine Goodman. Together Janine and Marc have consulted some of the most demanding market participants and closed many of the largest deals in the market to date. Avenue4 helps its clients strategize and execute IPv4 transactions in an opaque and rapidly evolving market. We provide advice on managing, preserving and monetizing IPv4 numbers as an asset.
We dedicate our reputation, knowledge, experience and resources to minimize risk and deliver value for our clients.
In 2017, Avenue4 will bring this same knowledge, experience and expertise to the small and mid-size block markets with the launch of ACCELR/8, an IPv4 trading solution.
Our custom services include:
• Conducting due diligence
• Developing go-to-market strategies
• Matching buyers with sellers
• Identifying value enhancing
opportunities
• Structuring, negotiating and closing
transactions
• Facilitating registration transfers
• Maintaining IPv4 registry records
and preserving entitlements
Predictions for 2017 • The IPv4 market will go fully global with the passage of
Inter-RIR transfer policies in AFRINIC and LACNIC • Market pricing for small blocks will creep up to $20 per
number • Mid-size and large block pricing will converge and aver-
age $15 per number by year end• The number of ARIN transactions will hold steady with
2016 trends• Global IPv6 deployment will reach a high of 24%

The fast lane to IPv4 addresses by
avenue4llc.com/accelr8
LB3083@-Accelr8_Handdout_16jc.indd 1 2/2/17 8:30 AM