state of the nation india 2012
DESCRIPTION
The India Report: State of the nation 2012 All the statistics you need to know about how India fared in 2012. Download the attached pdf for the full reportTRANSCRIPT

The India Report: State of the nation 2012(Compiled by Daniel Edwin and Anita Cheria, OpenSpace, Bangalore)
State of the Nation 2012 Page [1]
Anita Cheria and Daniel Edwin, OpenSpace, Bangalore

The context of IndiaIndia in the world
India is the world’s second fastest growing economy, and the 10 th largest (World Bank 2011). Of sub-continental dimensions, India can be described in many ways, all of them reflecting a part of reality—so much so that DfID (Department of International Development, Government of UK) has termed it three Indias: developed, developing and under-developed India. The India that exports food is also home to the largest number of malnourished children in the world. The India of IT coexists with the India which practices manual scavenging. Space-faring India is home to 626 million who practice open defecation, more than the rest of the world combined (474 million). The lower middle income country India is also one with the largest number of poor and illiterates, but producing 700,000 engineering graduates and 35,000 doctors per annum. India has 287 million illiterate adults, the most in any country in the world, equivalent to almost four times the population of France (UN, 2012). India is the world’s largest importer of arms, accounting for 10% of global arms imports between 2007 to 2011 (Stockholm International Peace Research Institute, SIPRI, 2012).
India is the world’s second most populous nation with 1.21 billion citizens, 48 of whom are billionaires and 400 million who live in absolute poverty (World Bank 2011)—more than the combined population of 50 countries in Africa, almost 80% of the entire population of the EU (503 million). Only the richest 10% of Indians have an average monthly per capita expenditure (MPCE) of Rs 3,459.77 (rural, $63) and Rs 7651.68 (urban, $140)—meaning the ‘richest 10%’ in rural areas live on $2 per day, and the ‘richest 10%’ in urban areas live on $3 per day. The per capita annual income is just $3,500 (PPP rates, OECD 2011). 1 The high ‘rate’ of economic growth hides the low base of calculation. India will take 40 years at 6% compounded growth to reach the present per capita income of the UK ($35,000).2 If the long term average (LTA) growth is factored in, India (LTA=3.69) will take 65 years to catch up with the present UK per capita income and 170 years to catch up if UK’s LTA growth, (2.29%) is factored in.
Despite strong economic growth, the incidence and extent of poverty in India is severe and extensive. The UNDP’s multidimensional poverty index (MPI, 2010)3 reveals the persistence of acute poverty in India. There are more MPI poor in eight Indian states (421 million in Bihar, Chhattisgarh, Jharkhand, Madhya Pradesh, Orissa, Rajasthan, Uttar Pradesh, and West Bengal) than in the 26 poorest African countries combined (410 million). The intensity of the poverty in parts of India is equal to, or worse than, that in war torn Africa (MPI, UNDP).
At the peak of India’s economic growth (2004-05 to 2009-10) fewer than 2 million jobs were created, though 55 million joined the work force.4 Even in areas of Indian ‘dominance’ such as information technology, India has a broadband (≥ 256 Kbps download) subscriber base of 14.5 million—meaning just about 12% of the Indian population is covered at extremely slow speeds5—an indicator of the deep digital divide that accentuates the India development paradox in virtually every development indicator. Broadband speeds of over 4Mbps are available for just 8% in India, compared to 90% in the UK, and is ranked 112 among countries in internet speed in 2012.6 The digital divide is stark in telephones too (overall coverage (79.58%), with urban coverage (169.03%) far outstripping the rural (40.66%).7
India fares poorly on governance and development indicators. India ranks 129 of 183 countries (2011) in per capita GDP (PPP terms). India ranks 112 out of 141 countries in the Child Development Index (CDI, 2011), lower than Bangladesh and Sri Lanka, and the lowest among the BRICS nations. India ranks 129 of 187 countries in the Gender Inequality Index 20118 (0.617) the lowest ranked country in South Asia, and BRICS—the world’s fastest growing economies, comprising Brazil (0.449), Russia (0.338), India, China (0.209) and South Africa (0.49). Bangladesh (0.55), Bhutan (0.495), Pakistan (0.573), Nepal (0.558), and Sri Lanka (0.419) all have a lower GII than India (0.617). In comparison, UK’s GII is 0.209. India is ranked 94 of 176 countries with a score of 36 on 100 (2012) in the Corruption Perception Index 9 of Transparency International, below Sri Lanka (ranked 79 with 40 marks) and China (80, 39) and, but above Nepal and Pakistan (rank 139, 27 marks)

and Bangladesh (144 with 26 marks).10 India was ranked 8 of 150 countries in illicit (black) money outflow, losing US$ 1.6billion in 2010 alone and US$123 billion from 2001-2010.11
Almost any composite index of indicators of governance, equity, health, education, and nutrition would place India very close to the bottom in a ranking of all countries outside Africa. 12 India is ranked 134 of 187 countries in the UNDP Human Development Index 2011, above Bhutan (141), Pakistan (145), Bangladesh (146) and Nepal (157) but below Sri Lanka (97), China (101), and even Iraq (132) or Palestine (114) and the lowest amongst the BRICS. India is ranked 66 of 105 countries in the 2012 Global Food Security Index 13 lower than China (39) and Sri Lanka (62), but better than Pakistan (75) and Bangladesh (81). Only five countries outside Africa Afghanistan, Bhutan, Pakistan, Papua New Guinea and Yemen) have a lower youth female literacy rate than India. Only four countries (Afghanistan, Tajikistan, Myanmar, and Pakistan) do worse than India in infant mortality rate (48 deaths/1,000 live births, UNICEF 2010); only three (Bolivia, Cambodia and Haiti) have lower levels of access to improved sanitation than India (31%); and none (anywhere—not even in Africa) have a higher proportion of underweight children (46%).
Despite improved incomes and increased production (from 50.8 million tons of food grain in 1951 to 241.6 million tons in 2011),14 per capita availability and per capita intake of most food items (except milk) declined during the last decade. Per capita food grain availability rose from 468.7 grams per day (GPD) in 1961 to 510.1 GPD in 1991 and then fell to 438.6 GPD in 2011. Availability of pulses has more than halved—from 69.0 GPD in 1961 to 31.6 GPD in 2011.15 With India expected to be the most populous country in the world by 2025, feeding the population is likely to be one of the more serious challenges that the country will face in the coming decades.
Calorific intake figures from the National Sample Survey Organisation NSSO consumption surveys point to a continuing decline, except in the case of milk. The decline is simultaneously seen in food such as eggs, meat, fish, fruits, and vegetables. The decline in calorie intake during 2005-10 is the highest in any five-year period.16 The India Human Development Report 2011, prepared by the Institute of Applied Manpower research, a Planning Commission body, admits that ‘by WHO standards,17 India is in a state of famine’. The poor nutritional standards make Indians susceptible to various infections. HIV has been brought under control and stabilised to a degree with new infections down by more than 50%—from 270,000 in 2000 to 120,668 in 2009 (NACO Fact Sheet-2011)—though the risk of opportunistic infections (especially TB) remains high.
India’s global footprintIndia is considered one of the five fastest growing economies or emerging markets in the world, along with
Brazil, Russia, China and South Africa, collectively called ‘BRICS’. The alliance seeks to be for ‘stability, security, and growth’ for all citizens in the world and acknowledges that growing inequality is a cause for concern.18 With conflicting interests, diverse economic, political, and social systems this is India’s global role is more likely to be channelled through G-20. The economic growth of the past decade has made India increasingly self-confident and assertive in international fora, leading to the rejection of bilateral aid since 200319 from all but a handful of countries (EU, UK, US, Germany, Japan, and Russia).
Despite the challenges—including being home to the largest number of people living in absolute poverty and the largest illiterate population in the world—India takes its role as an emerging power seriously. India has been part of several UN peacekeeping missions, especially in fragile states of Africa. India has occasionally not shied away from putting its money where its mouth is, such as the AFRICA Fund20 in 1986, explicitly to abolish apartheid in South Africa when the governments of the West were reluctant to do so.
Most times however, India has not given substantial aid outside the sub-continent, being content with the Non-Aligned Movement (NAM). Most of India’s aid goes to Afghanistan, Bhutan, Nepal, and Myanmar. India has pledged USD 2 billion for development in Afghanistan since 2006. India’s involvement in Sri Lankan reconstruction is marked by the much delayed USD 270 million full grant assistance commitment to build 50,000 houses for the internally displaced persons in 2010, in collaboration with UN-Habitat, International
State of the Nation 2012 Page [3]
Anita Cheria and Daniel Edwin, OpenSpace, Bangalore
Federation of Red Cross in partnership with Sri Lanka Red Cross, National Housing Development Agency of Sri Lanka and Habitat for Humanity.
2012 marks a departure in that India pledged USD 10 billion to the IMF during the Euro crisis. India has also established the Development Partnership Administration (DPA), to cater to low income countries. India is part of the India Brazil South Africa Fund for the Alleviation of Poverty and Hunger. Together with the engagement with the UN Development Forum and the G-20 Development Working Group, the synergies in fragile states are expected to lead to a larger international role, moving beyond soft power.
Wide disparities due to social exclusion induced povertySocial exclusion in India is not a self-imposed or voluntary choice. It is a rigorously enforced social norm,
seldom voluntary, but is enforced on certain sections of society, primarily based on notions of purity of the caste system. The prime minister21 has called it apartheid due to its practices of segregation, untouchability, and stigmatisation. The UN-CERD Committee has termed it a form of racism (General Comment 29 in 2002, and February 2007). It is included in the UK Equality Act, 2010 Section 9 and EU resolution B6-0021/2007 on the human rights situation of the Dalits in India.
In the context of poverty being a direct result of multiple, and intersecting, forms of discrimination, it becomes important to recognise that poverty is created and maintained by formal and non-formal institutions. The web of social exclusion thus prevents those from the excluded sections entry into these power wielding structures. Entry is restricted based on caste, ethnicity, gender, age, and many more.
Poverty is disproportionately experienced in scale and intensity by specific socially excluded communities such as Dalits (Scheduled Castes, SC, and others discriminated based on caste) and Adivasis (Scheduled Tribes, ST, and indigenous and tribal peoples), who lag behind other communities in varying degrees in various human development indicators (SCs -6% to -48% variation from national mean and STs -2% to 125% from the national mean, NFHS-3). This demonstrates that poverty in India is not just economic but closely intertwined with social and non-economic factors. Not only are these sections shut out from the benefits of national progress and economic growth, they have to bear its costs and consequences. As a result of the chosen pattern of development and investment there has been unprecedented distress migration from rural to urban areas and development induced displacement. A vast majority of poverty in India can thus be identified as social exclusion induced poverty.
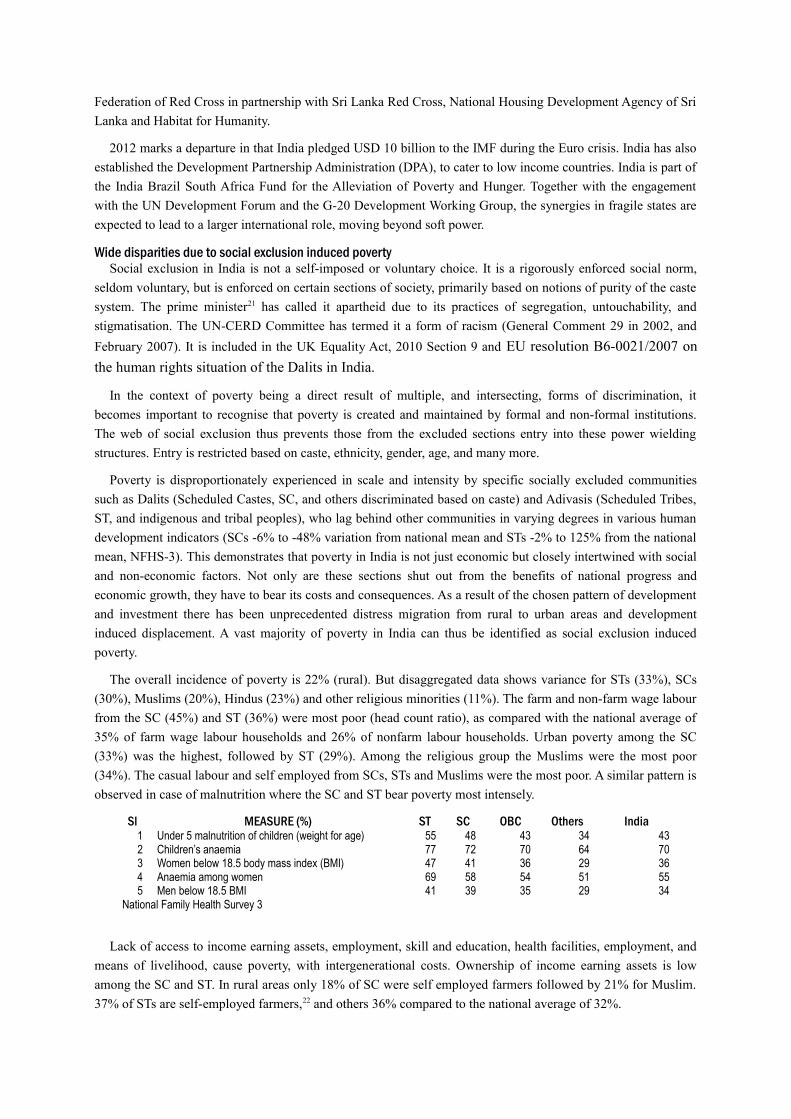
The overall incidence of poverty is 22% (rural). But disaggregated data shows variance for STs (33%), SCs (30%), Muslims (20%), Hindus (23%) and other religious minorities (11%). The farm and non-farm wage labour from the SC (45%) and ST (36%) were most poor (head count ratio), as compared with the national average of 35% of farm wage labour households and 26% of nonfarm labour households. Urban poverty among the SC (33%) was the highest, followed by ST (29%). Among the religious group the Muslims were the most poor (34%). The casual labour and self employed from SCs, STs and Muslims were the most poor. A similar pattern is observed in case of malnutrition where the SC and ST bear poverty most intensely.
Sl MEASURE (%) ST SC OBC Others India1 Under 5 malnutrition of children (weight for age) 55 48 43 34 432 Children’s anaemia 77 72 70 64 703 Women below 18.5 body mass index (BMI) 47 41 36 29 364 Anaemia among women 69 58 54 51 555 Men below 18.5 BMI 41 39 35 29 34
National Family Health Survey 3
Lack of access to income earning assets, employment, skill and education, health facilities, employment, and means of livelihood, cause poverty, with intergenerational costs. Ownership of income earning assets is low among the SC and ST. In rural areas only 18% of SC were self employed farmers followed by 21% for Muslim. 37% of STs are self-employed farmers,22 and others 36% compared to the national average of 32%.

In the case of non-farm self employed activities again the NSSO data shows that SCs (14%) and STs (7%) lag compared to other castes (17%), Muslims (24%) and other religious minorities (33%). This pattern is repeated in private enterprises in rural and urban areas.
Infrastructure and basic services: the social gap (between SC, STs vis-à-vis All India average)The disaggregated data shows that basic infrastructure and modern services are heavily skewed against certain
social groups. The benefits are cornered by a few social groups, and the socially excluded groups have marginal benefit.
Household amenities (% population)2001 2011 Variance 2011
Sl Amenity SC ST National SC ST National SC % ST%
1 Concrete roof 13.14 6.12 19.8 21.93 10.11 29.0 24% 65%2 Tap drinking water 32.17 20.04 36.7 41.28 24.44 43.5 5% 44%3 Electricity access 44.32 36.51 55.9 59.02 51.70 67.3 12% 23%4 Toilet within the house 23.7 17.00 36.4 33.86 22.64 47.0 28% 52%5 LPG as cooking fuel 7.95 5.38 17.5 16.92 9.26 28.5 41% 68%6 Banking 25.17 19.17 35.5 50.94 44.98 58.7 13% 23%7 Telephone 3.47 2.51 9.1 53.14 34.82 63.2 16% 45%
Source: Census of India 2011, House-listing data.There is a clear divide in access to basic services based on social strata. Telecom and banking—the success
stories of India—has seen more inclusion in absolute terms.23 Though there has been substantial progress in these two, there is very slow progress in most others, and the gap is closing ever so slowly. The STs are outliers even in this slow progress with above 65% lag in concrete roofs, 68% for LPG as cooking fuel, 44% in tap drinking water, 52% toilet within the house, 45% telephones, 23% in banking and access to electricity (above 23% deficit in all indicators, above 65% in 2). For the SCs, the gap is 24% in concrete roofs, 28% toilet within the house, 41% LPG as cooking fuel, and telephones (3 of 7 indicators show a deficit of more than 24%).
This result of social exclusion is collaborated by the Multidimensional Poverty Index which reveals that poverty is not uniform but has a strong correlation to discrimination and impacts socially excluded sections disproportionately. Multidimensional poverty is highest (81.4%) among Scheduled Tribes, followed by Scheduled Castes (65.8%), Other Backward Classes (58.3%) and others (33.3%).
Breakdown of Multidimensional Poverty across Hindu Castes and Tribes
States MPIPercentage of MPI
Poor Average IntensityScheduled Caste 0.361 65.80% 54.80%Scheduled Tribe 0.482 81.40% 59.20%Other Backward Class 0.305 58.30% 52.30%General 0.157 33.30% 47.20%Source: Oxford Poverty and Human Development Initiative (OPHI) India Country Brief p5
This is despite having sufficient policy space for focussed development of the socially excluded communities. The Scheduled Castes Special Component Plan (SCSP) in every budget and the Tribal Sub Plan (TSP) in every five year plan are meant to ensure sufficient investment in infrastructure and human resource development of the socially excluded sections. However, allocation is seldom made, and when made it is diverted or misused with creative accounting as in the case of the commonwealth games. As the Minister for Home Affairs admitted in parliament on 31 August 2010—the situation was actually worse—rather than being an exception, all states divert these funds—with the Government of Delhi alone diverting Rs 70.6 billion ($1.57billion) of which Rs 6.8 billion ($150million) was diverted for the Commonwealth games from the SCSP. Among all the governments in India, union and state, only in Andhra Pradesh is it legally mandatory for the state to make such allotment.24
Exclusion in employment: Public and privateStudies show that there is discrimination in employment, both in the public and private sectors, so much so
that these sections have to be ‘self-employed’ in very unremunerative ‘jobs’. The SCs in rural areas (farm and
State of the Nation 2012 Page [5]
Anita Cheria and Daniel Edwin, OpenSpace, Bangalore

non-farm wage labour) livelihoods are made unviable in the development priorities and form a substantial part of distress migrants. In ownership of private enterprises many are run with family labour with low capital and use traditional techniques. The poverty rates (overall 21%) of self-employed households in rural area (engaged in production and business) was 43% for ST and 27% among SC groups compared to 17% for other households. In urban areas 46 % of self-employed households among the SCs and 42% among STs were poor compared to 25% among others.
India does have a quota system for SCs (15%) and STs (7.5%) in the public sector, government and government aided higher educational institutions.25 However, the sanctioned positions are kept vacant for years. About 50% of the teaching posts reserved for SCs and STs are vacant in the Central Universities alone. For 2010-11, backlog in SC category is 46% and for STs it is 53%. At the professor level it is over 92%. 26 In the private sector, those with Dalit (33%) or Muslim (66%) sounding names (the study covered only SCs and Muslims and did not track STs) are not even called for an interview, even with equivalent educational qualifications.27
There is virtually no representation of SCs in editorial or senior positions in the mass media. The picture in the higher echelons of other industries is much the same.28 Of the board members of the 1000 top Indian companies 46% were Vaishya and 44.6% were Brahmin. Kshatriyas (0.5%) and other dominant castes (1.5%) bring the dominant caste representation on the boards to a staggering 92.6%. Other Backward Classes (3.8%), SCs and STs (3.5%) were far behind. Nearly 65% of the Indian corporate boards are composed of just one single caste group.
A study done by the Confederation of Indian Industry (CII) in 201129 reveals that but for Tamilnadu, most of the industrial states lag in the proportion of SC and ST employees in the private sector compared to their proportion in the general population in the state.
Implementation of the voluntary Code of Conduct (CoC) evolved by India Inc and accepted by the Confederation of Indian Industry (CII), Federation of Indian Chambers of Commerce & Industry (FICCI) and Associated Chambers of Commerce and Industry of India (ASSOCHAM) announced with the consent of Government of India in 2007 for promoting affirmative action, adequate representation, and participation of discriminated groups at various levels in the private sector and economy have shown little positive result, leading to Dalit movements and CSOs demanding legally mandated affirmative action.
Strong (economic) ‘growth’, weak foundationsIndia has had a dream run with the economy growing at 7.4% in 2001-10. It grew 8.9% (2003-2008), before
slowing to 6.7% (2008-09), along with the global economy. It recovered to 8.4% in 2009-11 and has managed 6.88% in 2011-12.30 The outlook is 6% or below for 2012-13, primarily due to global conditions. That this is at a time when the global economy is under stress makes it all the more creditable. That this is done on a weak economic base makes it deceptive both as an indicator of national development and prowess and as an indicator of the wellbeing of its citizens. Inflation has been in the double digits, and fiscal deficit is high. The Indian economy is under stress, with bank loan delinquencies rising. Gross non-performing assets (NPAs) is about 2.9% in 2011-12, up from 2.4% from 2007-08 to 2010-11. In the half-year (April 2012-September 2012) it has slipped to 3.6%—even after ‘restructuring’.31 ‘Restructured Advances’ have gone up from 3.5% in 2010-11 to 5.9% in September 2012.32 The Financial Stability Report of the Reserve Bank of India notes that the overall macro-economic risks in the financial system seem to have increased since the publication of the previous FSR in June 2012. India’s economy is expected to grow 5.7-5.9 per cent for the fiscal year ending in March, the slowest since 2002-03. The current account deficit also remains a concern as exports fall due to weak demand in key markets like the United States and Europe, while imports of gold and oil have remained high. There a shortfall in tax and non-tax revenue because of the economic slowdown. A significant portion of foreign exchange exposures at companies remained unhedged, posing another risk to macro-economic stability. Gross non-performing assets (NPA) continue to tread above the credit growth and on the back of rising slippages. State-run banks saw a high
degree of deterioration in asset quality. If the adverse macroeconomic conditions persists, the system level gross NPA could rise from 3.6% (end September 2012) to 4% by end March 2013 and 4.4% by end March 2014.33
The decadal 7.4% growth (2001-2010) has been possible because of the growth in the services sector, which has had five years in which growth was above 10%, and two more years above 9%. Industrial growth was above 10% for one year and above 9% for another three. In contrast, agriculture which employs two out of three workers, had just one year of 10% growth, on the back of a negative growth year. Agriculture shrunk in two years, and had below 2% growth for another three.34 The ‘development’ thus was restricted to off-farm, industrial, and services sectors. This form of development excluded most of the low skilled, land dependent sections of society—a large section of whom are the women, Dalits, and Adivasis. At the peak of India’s economic growth (2004-05 to 2009-10) fewer than 2 million jobs were created, though 55 million joined the work force. The previous five year period saw 62 million jobs being created,35 a clear indicator of jobless growth and wealth concentration.
According to the National Sample Survey Organisation (NSSO) 2009-10 survey,36 ‘evidence suggests that the Indian economy has witnessed a tendency towards casualisation of labour’. Of India’s 471 million strong workforce, nearly 30 million is unemployed, 26 million are officially underemployed, 40 million want additional work and 35 million are looking for alternative livelihoods a total of 131 million, more than the population of countries such as France, UK, Italy, South Korea, Spain and Canada. The sex ratio of the employed persons is 259 females employed per 1000 employed males overall (278 rural and 204 urban). The unemployment rate is estimated at 9.4% (10.% rural, 7.3% urban; 14.6 female, 8% male). The labour force participation rate (LFPR) is 35.9% (36.5% rural and 34% urban). The sex ratio of the labour force is 279 females per 1000 males (299 rural and 222 urban). Within the employed population, self employment is 43.9%, 16.8% persons are regular wage/salaried and 39.3% are casual labour (rural: 45.7% self employed, 43.5% casual labour, 10.8% regular wage/salaried class). Sector-wise, 45.5% are employed in agriculture, forestry and fisheries, 8.9% in manufacturing, 8.8% in wholesale & retail trade, 8.4% in community services and 7.5% in construction (Rural: 57.6% in agriculture, forestry & fisheries, 7.2% in construction and 6.7% in manufacturing. Urban: 17.3% in wholesale & retail trade, 15.4% in manufacturing, 14.6% in community services). Among the self employed a majority are employed in agriculture, forestry & fisheries (57.2%), 13.5% in wholesale & retail trade (Rural: 69.4% in agriculture, forestry & fisheries; Urban: wholesale retail trade 29.9%, 173 persons in manufacturing 17.3%). The employment generation strategy of the Eleventh Five Year Plan is reduction in underemployment and a movement of surplus low wage labour in agriculture sector to higher wage and more gainful employment in the non-agricultural sector. Agriculture sector is projected to generate no additional employment during the Eleventh Plan period, manufacturing is expected to grow at 4%, construction at 8.2% and transport & communication at 7.6%. The projected increase in total labour force during the 11th Plan is 45 million. 58 million employment opportunities are targeted to be created during the Eleventh Plan to reduce the unemployment rate to below 5%.
The Indian economic growth is based more on low wages and transfer of natural resources (land, minerals) and high externalities rather than innovation and higher output with less resource use as shown in the UNDPs Inclusive Wealth Index37 (IWI, 2012), and the nature of wealth created. IWI shows that India’s growth is negative when the environmental cost is included.38 The IWI rose by 18%, GDP by 120%, natural capital decreased by 31%, produced capital increased by 168% and human capital by 24%. It indicates that the natural resources extracted are not turned into knowledge and economic capital. Sustainable growth is under threat. Indian billionaires are more from the natural resources and rent seeking sectors rather than from technology and innovation.39 This is reflected in the conflicts over natural resources, including 26 of 173 districts under Maoist influence that account for 80% of the violence,40 the resource curse and governance deficit.
Food inflation, which makes up a large part of the household spending of the poor and tends to be sticky, has hovered been at or above double digits for most of 2009—12. Growing inequality between social strata and entrenched discrimination within public and private institutions are cause for concern.
State of the Nation 2012 Page [7]
Anita Cheria and Daniel Edwin, OpenSpace, Bangalore

Enforcing exclusionWith some mobility due to the global dynamics, increasing access to education, and job reservation in the
public sector, some Dalits have refused to be degraded or be the waste absorbers of the nation. The social reaction has been to find more brutal ways of countering mobility and assertion. Mass gang-rapes of Dalit women in whole villages, burning entire families, total destruction of Dalit property in cycles of 12 to 15 years, denial of modern services, destruction of traditional livelihoods, and new forms of discrimination are being invented to keep the Dalits under subjugation.
Water, electricity, roads, schools and community halls—not to speak of the location of government offices and services—all reach the Dalit part of the village or city last. Segregated eating exists even in the mid-day meals given to students in government schools. Dalit children are forced to sweep the school and do domestic work in the homes of teachers—something that dominant caste children are not asked to do.
Besides exclusion, the SC and ST also faced violence and atrocities in the process of accessing the rights and entitlements. The Constitution of India has provided legal safeguards through abolishing untouchability (Article 17) and key legislation such as The Untouchability Offences Act 1955 which was amended and updated to the Protection of Civil Rights Act 1976, followed by the SCs and STs (Prevention of Atrocities) Act, 1989. However they continue to face violence and atrocities.
Despite stringent laws, the National Crime Records Bureau (NCRB) statistics do not show any decline in the atrocities against SCs and STs. The number of cases registered of atrocities against the SCs is increasing. 41 Many cases are simply not registered. NCRB 2011 figures report one crime against SCs every 16 minutes (total 33,719) and one crime against STs every 90 minutes (total 5,756).
Approximately 33,000 cases are being registered as atrocities against Scheduled Castes in one year. These are the worst kind of crimes… murder, rape, kidnapping, abduction and arson. These are pre–meditated crimes…. among the worst crimes in the Indian Penal Code. This shows how vulnerable the Scheduled Castes and the Scheduled Tribes are. [...]
One of the reasons why atrocities take place in those places is to cripple them economically. Every riot, every arson cripples them economically.
Minister for Home Affairs P Chidambaram, Lok Sabha, 30 Aug 2010
Pendency rates in courts are high (80% annually) leading to high acquittal rates, enhancing impunity. Conviction rates are 32% for crimes against SCs and 19% for crimes against STs that are charge sheeted. Conviction rates are in single digits when compared to cases filed, but disposed off before being handed over to the courts.
When the SCs and STs attempt to enjoy the fruits of development, they break the caste taboo that enjoins them not to better themselves. This results in brutal backlash, as acknowledged by the Minister of Home Affairs (quoted above). The progress achieved by affirmative action in government and public sector since 1950 to address the results of centuries old caste discrimination, has increased the violence and hostility towards the excluded communities, nullifying the spirit of reservations and the gains made over a period of time. The inability of the state to adequately meet the challenge of protecting the excluded communities, ensuring inclusion, nor stewardship and equitable distribution of national resources has resulted in the increasing use of violence as the response of first resort.
UrbanisationThe changing nature of the development paradigm has led to many being pushed out of their land-based
livelihood to urban areas for sustenance. The bulk of these are the already excluded—the farm and non-farm workers—who have the least ‘staying power’ and are forced into distress migration for survival since the rural economy has no place for them. These people, most of them SCs and STs, become agriculture drop outs and contribute to the urbanisation process mainly as unskilled labour in construction that has seen a decadal growth between census at 31%. They are more likely to be displaced, sometimes multiple times, due to development

induced displacement. Therefore these sections form the majority of the poor and absolute poor, both rural and urban, especially the manifold increase in distress migration to urban areas.
‘Census towns’, (habitations with a population of at least 5,000, population density of over 400 per sq km and over 75% engaging in non-agricultural activities), went up from 1,362 in 2001 to 3,894 in census 2011. Statutory towns, those officially towns with municipalities, etc, have increased from 3,799 in the previous census to 4,041—a rise of only 242. These people are particularly vulnerable because they have less social or economic capital, and their skill sets are rendered useless in the new milieu, and survival mechanisms are precarious given the lack of commons.
The multiple displacement has detrimental effects on the children and has intergenerational costs. This migration creates a new class of un-citizens, deprived of their social and citizenship rights, becoming a major development challenge.
Manual scavengingIndia has the largest number of people defecating in the open—626 million, 60% of the world’s total. In
contrast, the second country Indonesia has just 63 million.42 Only 10% of the 240,000 gram panchayats in the country are open defecation free. There are 126 districts spread over 16 states and the NCT of Delhi, each having more than 5,000 insanitary latrines.43 About 794,390 households with insanitary latrines are serviced manually, despite the government at the highest levels giving several deadlines and it being officially ‘abolished’ and ‘eradicated’ many times—an indicator of deep rooted, structural bias. The Employment of Manual Scavengers and Construction of Dry Latrines (Prohibition) Act, 1993 enacted specifically for its eradication, remains in the statute books. The fact that ‘developed and industrialised’ states (including the National Capital Territory of Delhi) figure in the list with higher than national average rates or high in absolute numbers of persons doing manual scavenging testifies to the presence of manual scavenging in the country.
A World Bank study Economic Impact of Inadequate Sanitation in India (2010) estimated the economic impact of lack of toilets at Rs 2.4 trillion annually—$54 billion, 6.4% of GDP—due to deaths (especially of children), hygiene related illness, and reduced productivity. According to the Census of India 2011, 53% of Indian households lack toilets. A higher proportion of SCs (66%) and STs (87%) households lack toilets. The figure for SCs is particularly ironic, since most manual scavenging and a substantial part of all sanitation work in this country is done by SC women. They do so without protective gear, including entry into closed sewage lines and septic tanks, with extreme consequences to their health.
Violence against women and widening gender gapIndia ranks 129 of 187 countries in the Gender Inequality Index 2011.44 The UN Millennium Development
Goals (MDG) Report 2012 discloses that India has already met some of the goals, but is likely to miss gender equality and maternal mortality (212 per 100,000 live births). Most of the agricultural labourers who face the brunt of poverty as demonstrated above are women. They are effectively single women, heading households since their husbands migrate with the scarcity of livelihood support systems and options in the rural areas.
Violence against women has shown a sharp increase, according to the National Crime Records Bureau (NCRB) report 2011. This is for domestic violence (spousal and close family) and external violence and harassment both of which can have fatal consequences. Over 20,000 women are raped every year since 2007 (24,206 in 2011). Over 8,000 women are killed every year for dowry since 2007 (8,618 in 2011), over 23 dowry deaths every day—almost one every hour. Sexual harassment increased 11.55% in 2008 (12,214) over 2007 (10,950). The 5-year trend analysis showed an increase of 14.7% over the average of 2003–2007. India faces a declining sex ratio (0—6 age group) in 80% of its districts.45 The all-India sex ratio is 940 girls to 1,000 boys,46 which puts the country right at the bottom of the global charts, worse off than countries like Nigeria (965) and Pakistan (958). However, this is an improvement from 933 girls to 1000 boys in 2001.
The plight of SC and ST women is worse. 1,557 SC women and 772 ST women were raped in 2011—meaning four SC woman and two ST woman every day, right through the year (NCRB). There are increasing
State of the Nation 2012 Page [9]
Anita Cheria and Daniel Edwin, OpenSpace, Bangalore

cases of parading women naked, ‘moral policing’, acid attacks, dishonour killings, multiple rapes and brutal assault on women especially during caste and communal conflict. Dependency on the dominant castes for livelihood makes sexual exploitation normative in a significant number of cases, and even ritually sanctioned.
These women not only experience discrimination based on caste, ethnicity, and gender, but experience gender discrimination within caste discrimination—dominant caste women are as likely to oppress and discriminate against Dalit and Adivasi women as dominant caste men. The solidarity is more on the lines of caste rather than gender. This translates into practice and effects of discrimination, stigma, and violence. Added to this is the discrimination within the community, in effect having to endure patriarchy within, inter, and intra community. Though the Dalit women have stood shoulder to shoulder with ‘their’ men, the Dalit women are sometimes invisible and called ‘Dalits among Dalits’. In the words of the black women’s movement of USA, ‘all Blacks are men, all women are white’. The situation is no different in India. The SC and ST women are invisible to the Dalit and Adivasi movements on the one hand and the women’s movements on the other.
Access to justice due to exclusionary practices and insufficient resource allocation, as well as delayed police reforms, remain the primary hurdle to the enjoyment of civil and political rights and entitlements related to social, economic, and cultural (SEC) rights by the excluded communities.
Discrimination during disastersIndia is one of the most disaster prone countries in the world. Some of the prominent natural hazards include
floods, droughts, tropical cyclones, earthquake, landslides and tsunami. About 60% of India’s landmass is prone to earthquakes, 40 million hectares are affected by recurrent floods, 8% of the total area is prone to cyclones and 68% affected by droughts, making disasters recurrent and preparation, management, and mitigation critical in the progress and development of the country. Global changes in the climatic patterns and their local impacts are becoming a bigger concern and pose a major threat to human security. It is a silent crisis impacting millions of people in India. The socially excluded communities are the first affected, and most discrimination and excluded during emergencies, disasters, and calamities and increasingly pay the cost of climate change induced extreme weather events. Contrariwise, socially excluded communities face the brunt of the disasters and calamities because of discrimination in housing, habitation, and livelihood. They are forced to live in the periphery of the dominant caste village, in the most vulnerable locations despite knowing of the vulnerability due to caste and ethnicity based discrimination which does not allow them space within the main village. For this reason, the annual flooding of the Nile makes Egypt the gift of the Nile, and the Kosi, Ganga and their tributaries the curse of Bihar.
There is documented evidence of relief being denied to Dalits during the 2004 Tsunami, the Gujarat earthquakes, Bihar floods 2008, and the North Karnataka floods 2009. For instance, in Karaikal the fishers received 60 kgs of rice while the landless agricultural labourers—mainly Dalits—received only 5 kgs. This is bizarre since both have lost their livelihoods: the fishers lost their boats and nets and thus the ability to fish while the Dalits lost their ability to get work on lands since the land became saline with the ingress of the sea. Even the government segregated the relief camps. So strong is the hold of the caste system that even in their distress, others refused to inter-dine or share relief camps with Dalits. Ironically, Dalits were imported from other areas to bury the dead.
The estimated 260 million caste-affected people in the India face discrimination in the day to day life as well as during disaster relief. India is home to caste based discrimination (CBD) which makes the Dalits most vulnerable to natural and human-made disasters by virtue of their inherent socio-economic vulnerability. Dalits have been systematically excluded from humanitarian assistance. The norms of untouchability place many limitations on how Dalits can access safety, security, and relief assistance during disasters. Fear of caste conflicts and internalisation of the ascribed caste status hold them back from claiming their rights and seeking redress from the state. They are almost always neglected in terms of participation during and post disaster mitigation plan. Addressing ‘discrimination by default’ becomes important as the caste system plays out even during
disaster situations. Thousands of years of non-confronting the caste norms have led to both civil society and the administration operating on existing norms of exclusion and discrimination rather than on equity and inclusion.
State of the Nation 2012 Page [11]
Anita Cheria and Daniel Edwin, OpenSpace, Bangalore
Justice in IndiaThe justice benchmarks
Benchmarking the fulfilment of the human rights obligations especially in the context of the international covenants that India is signatory to, even if restricted to the Universal Bill of Rights (UDHR, ICCPR and ICESCR)47 and the constitutional obligations of the state shows a great human rights deficit. Even within the permissible ‘progressive realisation’ ambit India fares poorly due to the systemic discrimination demonstrated by virtually every human development index as demonstrated above. Those who are lower in the power hierarchy (where power is mediated by the intersection of patriarchy, caste, class, language, religion and ethnicity) are more vulnerable, and suffer actual discrimination by design or default.
Justice in the Indian context would mean equal opportunity in every aspect of nation building—both the costs and the benefits. Sacrifice of entire communities at the altar of industrial development is simply unacceptable. Holding the state accountable to its constitutional obligations is the first step in ensuring justice. This is not an easy task since, in the words of The Hindu, the state has suffered multi-organ failure, moving from democracy to kleptocracy and from economic justice to crony capitalism. Virtually all institutions have been systematically decimated, hollowed out and are in terminal decline. The task of justice means building the capacity of the communities and the state institutions. Advocacy for the rule of law is intrinsic to this agenda.
The constitutional rightsThe Constitution of India, especially Articles 38,39 (Part IV Directive Principles of State Policy) powerfully
advocates for the State to secure and protect a social order in which justice, social, economic and political, shall inform all the institutions of the national life for the promotion of welfare of the people (Article 38(1)) and in particular, strive to minimise the inequalities in income, eliminate inequalities in status, facilities and opportunities, not only amongst individuals but also amongst groups of people (Article 38(2)). The right to adequate means of livelihood, distributive ownership and control of the material resources and an economic system does not result in the concentration of wealth and means of production to the common detriment, equal pay for equal work for both men and women, and child, youth, and workers rights are spelt out in detail in Article 39 sub-sections (a) to (f).
In addition to general civil, political, social, economic, cultural and fundamental rights, the constitution is specific about the Promotion of educational and economic interests of Scheduled Castes, Scheduled Tribes and other weaker sections—and makes it the duty of the State to promote with special care the educational and economic interests of the weaker sections of the people, and, in particular, of the Scheduled Castes and the Scheduled Tribes, and protect them from social injustice and all forms of exploitation (Article 46).
The highest constitutional functionaries of every state—the governor and the chief minister—are responsible for the welfare of the STs and SCs. The governor of each state that has Schedule 5 areas or STs (if directed by the president) has to report on the status of STs in the state to the President of India annually (Article 244(1)). Similarly, each state government has to constitute a State Vigilance and Monitoring Committee (SVMC) under the Scheduled Caste and Scheduled Tribes (Prevention of Atrocities) Act 1989, (popularly called POA) review the status of the SCs and STs in the state in January and July and submit an annual report to the parliament.
The policiesTo ensure social and economic justice and political representation, there are a series of policies grounded in
constitutional provisions. There is separate budgetary allocation in the five year plans for the STs called the Tribal Sub Plan (TSP) and the Scheduled Castes Special Component Plan (SCSP) to secure budgetary allocations for SC and ST development, at least proportionate to their population, to bring them at par with other sections of society and to protect them from exploitation. In addition, there are grants, specific welfare and development schemes, and specific Finance and Development Corporations to give focused attention to the economic development of SCs and STs. All these are available both at the central and state levels.

India’s Eleventh (2006–07 to 2011–12) and the Twelfth Five Year Plans (2012–13 to 2017–18) bring inclusiveness at the core of the growth strategy. The growth of GDP is not treated as end in itself, but only as means to reduce poverty and create employment opportunities, improve access to essential services in health and skill and education and other amenities, simultaneously ensuring equality of opportunity for all, especially the poor, SCs, STs, OBC, religious and linguistic minorities and women (11th Plan Vol 1, p 2).
The approach paper of the 12th plan observed:Inclusive growth should result in lower incidence of poverty, improvement in health outcomes,
universal access to school education, increased access to higher education, including skill development - better opportunities for both wage employment and livelihoods and improvement in provision of basic amenities like water, electricity, roads, sanitation and housing. Particular attention needs to be paid to the needs of the SC, ST and OBC population, women and children as also minorities and other excluded groups.
Planning Commission, August 2011, pp. 4
To realise these goals, the document also focused on better opportunities for both wage employment and livelihoods for the poor in general and among them the social groups in particular.
The legal frameworkIndian society has always considered the State to be its protector and guardian. The State has responded in
kind, with several constitutional protections, path breaking legislation, welfare measures and social security schemes, especially for the most vulnerable—the SCs, STs, children, women, and the challenged. Particularly vulnerable specific sections within them, for instance single women, have been brought under the ambit of the state welfare measures.
The constitutional and policy framework has translated into several laws that protect and protect the socially excluded, prominent among which are the following: The Protection of Civil Rights Act of 1955 and 1976; POA 1989 and Rules, 1995; The Employment of Manual Scavengers and Construction of Dry Latrines (Prohibition) Act 1993; Abolition of Jogini, Devadasi and Mathamma System Act 1988 (prohibiting the custom of temple prostitution), Bonded labour Prohibition Act and Child Labour Act 1986.
In recent years there has been a spate of enabling laws and social welfare schemes creating a far more enabling environment. The state has incorporated the best ideas from civil society into state policy and law such as the Right to Information Act 2005 (RTI), the Scheduled Tribes and Other Traditional Forest Dwellers (Recognition of Forest Rights) Act 2006 (in popular usage Forest Rights Act, FRA), the Right to Education Act 2009 (RTE), and the National Rural Employment Guarantee Employment Act (NREGA). On the anvil are the Food Security Bill, Communal Violence Bill, and Land Acquisition, Rehabilitation, and Resettlement Bill. Another bold initiative is provision of generic medicine free of cost in government hospitals from 1 October 2012 remains on paper.
The 100 days of assured employment per annum under the Mahatma Gandhi National Employment Guarantee Scheme (MGNREGS) has, for the first time in this country, made the minimum wages a reality with some semblance of gender parity, leading to the shortage of cheap, exploitative rural labour. The annual transfer of over $7-8 billion (Rs 375.48 billion in 2011-12 and Rs 393.77 billion 2010-11) resulted in minimum wages being paid across sectors. However, implementation has been beset with corruption, with the national average of working days per household decreasing since the peak of 54 days in 2009-10 to 47 in 2010-11 and just 42 days per household in 20011-12 (GoI).
RTI galvanised the citizens into a virtual people’s movement for accountability and whistleblowers took the RTI route to expose the government at all levels. There have been attempts to amend the RTI, but a vigilant civil society has foiled those attempts. The Right to Education (RTE) is being opposed by several sections of society and faces hurdles in implementation.
State of the Nation 2012 Page [13]
Anita Cheria and Daniel Edwin, OpenSpace, Bangalore
The gap in implementation of the POA Act has already been mentioned. The landmark FRA has been plagued with non-implementation. Even land already being used is excluded from recognition of rights and community rights are routinely ignored—so much so that the Minister for Tribal Affairs was forced to write on 24 May 2012 to the Chief Ministers of 19 states that the Ministry of Tribal Affairs was the nodal ministry for the Act. He reminded the Chief Ministers that ‘Rejection rates for claims for rights are very high... where land rights are recognised, the area for which the title is issued is only a fraction of what the people are entitled to... large numbers of forest dwellers are facing eviction or harassment by forest authorities. Large numbers of them have also been illegally displaced from forest land without respect for their rights or due process of law. Rights to own, use, and dispose off minor forest produce has not been recognised.... the Act took a key step forward in empowering communities to protect and manage forests. However, this has not been implemented or been mis-implemented; .... officials should be instructed to respect the decisions of communities...’.48
The reluctance to let go control over the forest could be that the mineral map of India, forest areas, indigenous and tribal communities are all virtually in the same overlapping geographical areas.
Development perspectiveWith the world’s largest number of poor, illiterate and malnourished, India’s key development challenge is
social exclusion induced poverty—poverty that is maintained and reinforced by nested social norms of caste, ethnicity, class, and gender working in tandem. The extent, intensity, and scale of poverty among the excluded communities is systemic and is incontrovertibly a structural construct, despite policy instruments and operates even during disasters. Attempts to break free are met with large scale violence, including communal, caste and ethnic pogroms. The violence of development including forced displacement and skill obsolescence leading to casualisation of labour, land alienation and dependency on state doles even to meet basic human needs.
India understands justice and discrimination but there is also a fatigue, and a normalisation of this discrimination by the society, so much so that the youth—who otherwise are society’s bellwether for justice—see any affirmative action as injustice.
The highest levels of government have consistently acknowledged the violence and discrimination against Dalits and Adivasis.
Attempts by the Scheduled Castes and Scheduled Tribes to … improve their lot and claim what is rightfully theirs, are often the principal cause of the atrocities that are perpetrated on them. There is a lack of sensitivity on the part of the police and the district administration … The law enforcers themselves, in many cases, fail to act promptly or collude with the other side.
Prime Minister P V Narasimha Rao, 4 October 1991
The offences of atrocities are committed to humiliate and subjugate the SCs and STs with a view to keep them in a state of servitude. Hence, they constitute a separate class of offences and cannot be compared with offences under the Indian Penal Code.
Supreme Court 1995; State of Madhya Pradesh and Anr vs. Ram Krishna Balothia and Anr (1995 (2) SCC 221)
Untouchability has been abolished by the law but the shades of it remain in the ingrained attitude nurtured by the caste system. Though the provisions of reservation in educational institutions and public services flow from our constitution, these provisions remain unfulfilled through bureaucratic and administrative deformation or by narrow interpretations of these special provisions.
President K R Narayanan, 26 January 2000
The only parallel to the practice of ‘untouchability’ was Apartheid in South Africa. Untouchability is not just social discrimination. It is a blot on humanity. I recognise, even after 60 years of Constitutional and legal protection and state support, there is still social discrimination against Dalits in many parts of our country.
Prime Minister Manmohan Singh’s address at the Dalit—Minority International Conference, 27 December 2006.
Approximately 33,000 cases are being registered as atrocities against Scheduled Castes in one year. These are the worst kind of crimes… murder, rape, kidnapping, abduction and arson. These are pre–meditated crimes…. among the worst crimes in the Indian Penal Code. This shows how vulnerable the Scheduled Castes and the Scheduled Tribes are. [...]
One of the reasons why atrocities take place in those places is to cripple them economically. Every riot, every arson cripples them economically.
Minister for Home Affairs P Chidambaram, Lok Sabha, 30 Aug 2010
India spends about 41% of its annual development budget (Rs 8.22 trillion, US$182 billion) on social services (education, medical & public health, family welfare, housing, urban development, and other social services). That works out to about 3% of GDP on education and 1.3% on health.49 The gap in implementation of even well intended schemes for poor and excluded communities is stark. Despite the best intentions and efforts at the highest levels of government, many of the rules, policies, and welfare schemes remain largely on paper.
State of the Nation 2012 Page [15]
Anita Cheria and Daniel Edwin, OpenSpace, Bangalore
On to 2013: Urban middle class and youth powerIndia has the largest youth population in the world 800 million below the age of 35—fully 66% of its
population—and about half its population below 25. India is fast urbanising and is close to an urban majority if the 3,894 census towns50 are included. This translates into an easily organised demographic dividend that is betrayed by low skill levels due to systemic failure. This results in demographic dynamite51 that, together with the growing middle class aspirations—makes for a potent mix, ready for revolution. The first wave was captured by the Hindutva forces in 1992 to demolish the Babri Mosque. However, as the middle class matured and mass media came to their aid, the increasingly confident middle class began to slowly hold the state accountable, rather than become part of the lunatic fringe led by self-deluded demagogues. Exposed to 24x7 news and entertainment channels, they have come to expect world class service even from the state. Starting in trickles such as the Nitish Katara case and the Jessica Lal case in the 1990s, an increasingly combative middle class came out in large numbers in the anti-corruption movement of Hazare, Ramdev and Kejriwal in 2012 with the media actively fanning the flames.
Increasing aspirations, desire fanning, and closing opportunities (just one million jobs in 2013 against the required 12 million, and virtually jobless economic growth from 2004-05 to 2009-10) amongst growing income inequality and fed on a diet of caste superiority and entitlement has led to a veritable army of angst ridden middle class youth. This angst was quickly channelized by the techno-savvy but few understood the depth of disenchantment and the deep-rooted multifaceted systemic failure that has not spared a single institution—from patronage driven civil administration, dysfunctional police, regressive judiciary, dynastic, identity based politics to crony capitalists, not sparing even the army and the judiciary—that is at the root of this tremendous upsurge, only vague contours of which are still visible.
The late December 2012 protests in New Delhi are an indication of the times to come, and are eerily similar to Nepal before the revolution there. Though there were thousands of rapes of women (especially Dalit and Adivasi women) it took the rape of a middle class student in the national capital for the anger to again find focus against the state. The protest was without a leader and the oligarchy was clueless as to a response, let alone a coherent one. Offering ‘fast-track courts’ showed how out of touch the kleptocracy is—when the aspiration is for a system that works all the time as a matter of course, not ‘special’ instruments that would work as an exception. It is a tragic commentary on who makes a difference India and the ‘plus’ syndrome—the monopoly of India’s anger and grief is reserved for people like us within Delhi. Lumpenisation of polity and impunity continues to gather pace in federal India.
The combination of youth (idealism, sense of justice, quick solutions), growing middle class aspirations, and a feudal political and administrative system that works on patronage rather than rule of law makes for an India that is on the cusp of a revolution. This leaderless middle class youth frustration is there for the taking for any task—positive or negative—that can be framed in a simple, idealistic, achievable narrative within a short timeframe. Historically the demographic has led to the youth choosing a leader who would lead them into war. Since external war is no longer possible, it remains to be seen if India will see a civil war or a war on corruption... or nation building (including institutions of state such as a rule of law based society) on a war footing. Channelizing the middle class youth energy and idealism is a national imperative.
The gathering storm has been under the radar. An analogy from disasters is worth recalling: a disaster takes a long time to come, for they need many small but crucial elements to be just right. But when they come they hit harder and faster than we expect. Interesting times lie ahead in 2013 that will see a fundamental shift in Indian polity and normative values in the short-term itself as we move towards a critical mass of organised, enlightened, active citizens to become an inexorable, grinding march towards ‘that heaven of freedom’.

Data tablesAnnex 1: India’s Real GDP Growth Rates (Factor Cost) %
India’s Real GDP Growth Rates (Factor Cost) %Year Growth Agriculture Industry Services
1999-00 6.04 0.50 4.6 9.5
2000-01 4.35 -0.20 6.4 5.7
2001-02 5.81 6.30 2.7 7.2
2002-03 3.84 -7.20 7.1 7.5
2003-04 8.52 10.00 7.4 8.5
2004-05 7.60 1.60 9.4 9.4
2005-06 9.49 5.10 9.7 10.9
2006-07 9.60 4.20 12.2 10.1
2007-08 9.30 5.80 9.7 10.3
2008-09 6.70 0.10 4.4 10
2009-10 8.40 1.00 8.4 10.5
2010-11 8.39 7.00 7.2 9.3
2011-12 6.88 2.50 3.9 9.4Source: Planning Commission as on 1 April 2012 http://planningcommission.nic.in/data/datatable/0904/tab_1.pdf 2011-12 figures are advance estimates.
Annex 2: Multidimensional Poverty across Indian StatesMultidimensional Poverty across Indian States
MPI Rank States Population
(million) 2007 MPI Proportion of poor
Average intensity
Contribution to overall poverty
Number of MPI poor (million)
1 Kerala 35 0.065 15.9% 40.9% 0.6% 5.6
2 Goa 1.6 0.094 21.7% 43.4% 0.0% 0.4
3 Punjab 27.1 0.120 26.2% 46.0% 1.0% 7.1
4 Himachal Pradesh 6.7 0.131 31.0% 42.3% 0.3% 2.1
5 Tamil Nadu 68 0.141 32.4% 43.6% 2.6% 22.0
6 Uttaranchal 9.6 0.189 40.3% 46.9% 0.5% 3.9
7 Maharashtra 108.7 0.193 40.1% 48.1% 6.0% 43.6
8 Haryana 24.1 0.199 41.6% 47.9% 1.3% 10.0
9 Gujarat 57.3 0.205 41.5% 49.2% 3.4% 23.8
10 Jammu and Kashmir 12.2 0.209 43.8% 47.7% 0.7% 5.4
11 Andhra Pradesh 83.9 0.211 44.7% 47.1% 5.1% 37.5
12 Karnataka 58.6 0.223 46.1% 48.3% 4.2% 27.0
13 Eastern Indian States 44.2 0.303 57.6% 52.5% 4.0% 25.5
14 West Bengal 89.5 0.317 58.3% 54.3% 8.5% 52.2
15 Orissa 40.7 0.345 64.0% 54.0% 4.3% 26.0
16 Rajasthan 65.4 0.351 64.2% 54.7% 7.0% 41.9
17 Uttar Pradesh 192.6 0.386 69.9% 55.2% 21.3% 134.7
18 Chhattisgarh 23.9 0.387 71.9% 53.9% 2.9% 17.2
19 Madhya Pradesh 70 0.389 69.5% 56.0% 8.5% 48.6
State of the Nation 2012 Page [17]
Anita Cheria and Daniel Edwin, OpenSpace, Bangalore

Multidimensional Poverty across Indian States
MPI Rank States Population
(million) 2007 MPI Proportion of poor
Average intensity
Contribution to overall poverty
Number of MPI poor (million)
20 Jharkhand 30.5 0.463 77.0% 60.2% 4.2% 23.5
21 Bihar 95 0.499 81.4% 61.3% 13.5% 77.3
India 1,164.70 0.296 55.4% 53.5% - 645.0
The calculation includes Delhi but this table shows only Indian states. The estimation of state-wise poor is based on the actual population in 2007. The proportion of MPI poor is estimated using the DHS dataset 2005-6, so the total number of poor people in the last column may not sum up exactly. ‘Eastern Indian states’ include Assam, Arunachal Pradesh, Manipur, Meghalaya, Mizoram, Nagaland, Sikkim, and Tripura.
The MPI for India reveals that 81% are multi-dimensionally poor in Bihar. Poverty in Bihar and Jharkand is most intense—poor people are deprived in 60% of the MPI’s weighted indicators. The largest number (134.7 million, 21%) of India’s poor live in Uttar Pradesh. West Bengal has the third largest number of poor. The top five states have only 4.5% of the poor. The five poorest states have more than 50% of the poor.52
Annex 3: All India average MPCEURP (Rs.)All India average MPCEURP (Rs.)
Rural Urban
Decile ClassDecile Class Limits
(Rs) MPCEURP
Decile Class Limits (Rs) MPCEURP
1 up to 597 503.49 upto 860 702.262 597-719 661.19 860-1086 977.253 719-824 770.88 1086-1295 1189.574 824-922 873.73 1295-1509 1398.765 922-1030 974.03 1509- 1759 1630.676 1030-1162 1094.92 1759-2070 1908.467 1162-1334 1243.95 2070-2464 2248.58 1334-1581 1448.61 2464-3077 2737.719 1581- 2054 1783.87 3077-4281 3571.3110 2054 –more 3459.77 4282 -more 7651.68
All 1281.45 2401.68MPCEURP= monthly per capita expenditure with uniform reference period.Source: NSS 68th Round, Consumer Expenditure over decile classes of population (Provisional figures)
In rural India, half of the population belonged to households with MPCE below Rs.1030 (median value) and nearly 40% were below Rs.922. About 60% were below Rs. 1162. About 10% were above Rs.2054. In rural areas, half the population had a per capita daily expenditure of Rs 34.33, and half the households had a MPCE below Rs 1,030 and nearly 40% of the rural population had MCPE of below Rs 922.
According to NSSO data, average household monthly spending in 2011-12 was Rs 1,281.45 (rural) and Rs 2,401.68 (urban). Monthly per capita expenditure (MPCE) of 10% poorest Indians was Rs 503.49 (rural) and 702.26 (urban). For 2009-10, the figures were Rs 453 (rural) and Rs 599 (urban). The ratio of the top 10% of the economic group and the bottom 10% of the economic group in rural India rose to 6.9 in the 68th round of the survey carried out in 2011-12, from 5.8 in the earlier 66th round in 2009-10. In urban India, the ratio of the top and bottom 10% of the economic group increased to 10.9% from 10.1%.
The richest 10% had an average MPCE of Rs 3,459.77 (rural) and Rs 7651.68 (urban). Income disparity (highest 10% to lowest 10%) is 6.9 times (rural) and 10.9 times (in the metros) meaning the metros are more iniquitous. The income gap between rural and urban India is declining. While the 66th round survey carried out in 2009-10 showed MPCE in urban India was double (100.3%) that in rural areas, it came down to 92.3% in the 68th round survey.
The 66th round of NSSO survey distorted consumption levels because it was a drought year, and therefore comparisons with the 68th round data should be avoided. The right way to measure growth in consumption expenditure is by comparing the 68th round with the 61st round.53

Annex 4: Net availability of cereals and pulsesTable A22 Economic Survey 2011-12
1.17 : NET AVAILABILITY OF CEREALS AND PULSESYear Population Cereals Pulses Net per day (grams)
1961 442.4 399.70 69.00 468.71971 551.3 417.60 51.20 468.81981 688.5 417.30 37.50 454.81991 851.7 468.50 41.60 510.12001 1033.2 386.20 30.00 416.22002 1050.6 458.70 35.40 494.12003 1068.2 408.50 29.10 437.62004 1085.6 426.90 35.80 462.72005 1102.8 390.90 31.50 422.42006 1119.8 412.80 32.50 445.32007 1136.6 407.40 35.50 442.82008 1153.1 394.20 41.80 436.02009 1169.4 407.00 37.00 444.0
2010 (p) 1185.8 407.00 31.60 438.6P=Provisional Sources :1. Directorate of Economics and Statistics, Department of Agriculture & Cooperation.2. Registrar General of India.Notes : 1. Population figure relates to mid year.2. Production figures relate to the agricultural year July-June: 1951 figures correspond to the production of 1950-51 and so on for subsequent years.3. The net availability of foodgrains is estimated to be gross production [-] seed,feed and wastage ,[-] exports[+]imports,[+/-] change in stocks.4. The net availability of foodgrains divided by the population estimates for a particular year indicate per capita availability of foodgrains in terms of kg/year. Net availability, thus worked out further divided by the number of days in a year i.e., 365 days gives us net availability of foodgrains in terms of grams/day.5. Figures in respect of per capita net availability given above are not strictly representative of actual level of consumption in the country especially as they do not take in to account any change in stocks in possession of trader, producers and consumers.6. For calculation of per capita net availability, the figure of net imports from 1981 to 1994 are based on imports and exports on Government of India account only. Net import from 1995 are, however, based on the total exports and imports (both Government as well as private accounts). Cereals includes rice, wheat and other cereals. Pulses include all kharif and rabi pulses. Foodgrains include rice, wheat, other cereals and all pulses.
Annex 5: India’s child recordIndia’s child record
7 per 1,000 live births result in deaths42 % of children under-weight58% stunted by age of two years8.1 million out of school children out of 190 millionIndia has least score on child development index among emerging economies—Brazil, Russia, India, China, and South Africa (BRICS).India’s position fell the most on the Child Development Index (CDI) in the last five years.
Annex 6: Discrimination: The NFHS 3 Story
State of the Nation 2012 Page [19]
Anita Cheria and Daniel Edwin, OpenSpace, Bangalore

Discrimination: The NFHS 3 StoryBackground characteristic
Neonatal mortality
Post–neonatal mortal
Infant mortality
Child mortality
Under–five mortality
Women, no education
Women, education >
Men, no education
Men, no education >
all basic vaccinations
no vaccinations
safe stool disposal
SC 46.3 20.1 66.4 23.2 88.1 50.9 6.3 22.8 13.4 39.7 5.4 13.2
ST 39.9 22.3 62.1 35.8 95.7 61.7 3.9 34.2 8.7 31.3 11.5 10.2
OBC 38.3 18.3 56.6 17.3 72.8 43.9 9.8 17.6 18.6 40.7 3.9 17.4
Others 34.5 14.5 48.9 10.8 59.2 25.6 19.9 11.7 27.6 53.8 4.3 34.9
Total 39.0 18.0 57.0 18.4 74.3 40.6 12.0 18.0 19.7 43.5 5.1 21.1
Variance
SC –7.3 –2.1 –9.4 –4.8 –13.8 –10.3 –5.7 –4.8 –6.3 –3.8 –0.3 –7.9
ST –0.9 –4.3 –5.1 –17.4 –21.4 –21.1 –8.1 –16.2 –11.0 –12.2 –6.4 –10.9
OBC 0.7 –0.3 0.4 1.1 1.5 –3.3 –2.2 0.4 –1.1 –2.8 1.2 –3.7
Others 4.5 3.5 8.1 7.6 15.1 15.0 7.9 6.3 7.9 10.3 0.8 13.8
Variance %
SC –19% –12% –16% –26% –19% –25% –48% –27% –32% –9% –6% –37%
ST –2% –24% –9% –95% –29% –52% –68% –90% –56% –28% –125% –52%OBC
2% –2% 1% 6% 2% –8% –18% 2% –6% –6% 24% –18%
Others 12% 19% 14% 41% 20% 37% 66% 35% 40% 24% 16% 65%Source: NFHS 3, (Corrected 2008); Table 7.2 Early childhood mortality rates by background characteristics; Table 3.2.1 Respondent’s level of education: Women; Table 3.2.2 Respondent’s level of education: Men; Table 9.4 Vaccinations by background characteristics; Table 9.17 Disposal of children’s stool

1 India's per capita GDP on Purchasing Power Parity (PPP) basis was USD 3,403 in 2010 and is estimated at USD 3,662.69 in 2011 and USD 3,851.31 in 2012. The latest base year is 2004-05. The per capita income at current prices for the year 2004-05 is estimated at Rs 16,414 in rural areas and Rs 44,172 in urban areas. The per capita net national income rose by 5.2% while wholesale price index based inflation was at 8.9% in 2011-12. In 2010-11, per capita net national income grew by 6.4% against a WPI inflation rise of 9.6%. In 2009-10, it was 6.6% and 3.8% respectively. Minister of State for Parliamentary Affairs and Planning Rajeev Shukla in a written reply to the Lok Sabha quoting The Central Statistics Office.http://www.financialexpress.com/news/india-lags-several-nations-in-per-capita-income-govt/1047596/0
2 Organisation for Economic Cooperation and Development (OECD) Economic Data.3 UNDP and Oxford Human Development Initiative http://www.ophi.org.uk/policy/multidimensional-poverty-index/ 4 National Sample Survey Office (NSSO), 66th round.5 India’s average internet speed is 885Kbps, compared to 4909 for UK.6 Akamai State of the Internet, 2012.7 The number of mobile phone subscribers in India rose to 934.09 million in June 2012. Of the total mobile subscribers, 597.59
million are urban and 336.51 million are rural. 695.82 million (74.49%) are active. Nine states have teledensity of over 90%. Haryana, Gujarat, Maharashtra, and Karnataka have a teledensity of over 90%, Kerala, Punjab, Himachal, and Tamilnadu over 100% and Delhi has 238.6%, indicating multiple connections. When counting only mobile phones, urban subscribers (63.98%) are more than the rural (36.02). Telecom Regulatory Authority of India (Trai), July 2012. Press release 171/2012 http://trai.gov.in/WriteReadData/PressRealease/Document/PR-TSD-Jun12.pdfThere is a decrease in number of connections since then, subsequent to disconnections of the padded numbers by the telcos after the norms for spectrum allocation were changed, but the overall pattern is likely to remain the same.
8 GII- Human Development Report 2011.9 http://www.transparency.org/cpi2012/results10 In the 2011 report, India was 95 of the 183 countries with a score of 3.1 on 10 below China (75, 3.6) and Sri Lanka (86, 3.3), but
above Bangladesh (120, 2.7) and Pakistan (134, 2.5).11 http://www.gfintegrity.org/content/view/591/70/ For the full report go here: http://iff.gfintegrity.org/iff2012/2012report.html12 World Development Indicators 2011, quoted by Amartya Sen and Jean Dreze http://outlookindia.com/printarticle.aspx?278843. 13 The 2012 Global Food Security Index, developed by the Economicst Intelligence Unit (EIU) and commissioned by DuPont, ranks
105 countries in accordance to their relative level of food security in three categories – affordability, availability, and quality and safety. India scores slightly higher in 'availability' than in the other two categories. The presence of food safety net programmes and access to farm credit has helped the country achieve some level of food security, according to the report.
14 Table 0.1 Select indicators, Economic Survey of India 2011-12.15 Table A22 Economic Survey of India 2011-12.16 Per capita calorie intake in rural areas was 2,266 in 1972-73, 2,149 in 1999-2000, 2,047 in 2004-05 and 1,929 in 2009-10 on
comparable basis. Calorie intake in urban areas was 2,107 in 1972-73, 2,156 in 1999-2000, 2,020 in 2004-05 and 1,908 in 2009-10. The decline in calorie intake during 2005-10 is the highest in any five-year period. Per capita calorie intake in rural areas was 2,266 in 1972-73, 2,149 in 1999-2000, 2,047 in 2004-05 and 1,929 in 2009-10 on comparable basis. Calorie intake in urban areas was 2,107 in 1972-73, 2,156 in 1999-2000, 2,020 in 2004-05 and 1,908 in 2009-10. The consumption of most common items of fruits and vegetables also shows a decline after 1999-2000 compared with an increase before that. Potatoes, bananas, mangoes, apples and other vegetables and fruits show similar trends.http://www.livemint.com/2012/04/26215211/A-consumption-puzzle-in-India.html
17 According to the World Health Organisation (WHO), famine is when 40% or more of the population has a body mass index (BMI) less than 18.5.
18 Declaration at Sanya, China; April 2011.19 Budget speech by Finance Minister 2003. Aid through NGOs is permitted for all countries. 20 The Action for Resistance to Invasion, Colonialism, and Apartheid, AFRICA Fund, was launched at the eighth Non-Aligned
Summit in Zimbabwe in September 1986. It was designed by a group of Non-Aligned Nations which met in New Delhi on 24 January 1986 at the invitation of Prime Minister Rajiv Gandhi, one of the Fund’s initiators. Its main purpose was ‘to develop and enhance the self-reliance of the front-line states’, such as Angola, Zimbabwe, and Zambia bordering South Africa. The fund also extended political and financial support to the liberation movements in South Africa and the region.
21 Prime Minister Manmohan Singh at the Dalit—Minority International Conference, 27 December 2006.22 ST land holdings are higher, so they are not agricultural -labour in that sense. But neither are they landlords/ zamindars. This
figure therefore is deceptive, and does not reflect actual economic situation of the Adivasi on the ground.23 Census of India 2011, House-listing data.24 Andhra Pradesh Scheduled Caste Sub-Plan/Scheduled Tribe Sub-Plan Planning, Allocation and Utilization of Financial
Resources Bill 2012, effective from Financial Year 2013-14.25 At the state level it depends on their proportion in the state population.26 Government of India, reply to RTI Query by Mahendra Pratap Singh in December 2011. The Hindu, 2 July 2012.27 Urban Labour Market Discrimination, Sukhadeo Thorat, Paul Attewell, Firdaus Fatima Rizvi, Indian Institute of Dalit Studies
(IIDS) working paper series Vol III Number 01, 2009, with Princeton University.28 Corporate Boards in India: Blocked By Caste?, by D.Ajit, H.Donker, R. Saxena) Economic and Political Weekly, August 11,
2012, based on their study at the University of Northern British Columbia, Canada, on the caste composition of the boards of the top 1,000 Indian companies. These companies account for 80% of market capitalisation in National Stock Exchange (NSE) and Bombay Stock Exchange (BSE). http://www.epw.in/system/files/IN_XLVII_32_110812_D_Ajit_Han_Donker_Ravi_Saxena.pdf
29 In the backdrop of calls for inclusive employment in the private sector, the CII undertook a caste census of its members spread across 22 states and union territories in 2010. The survey covered to 8,250 members of the association, which together employ 35 lakh people. SCs and STs make up 19.1% of Maharashtra’s population, but their share in private sector human resources is only 5%. In Gujarat and Karnataka, SCs and STs are just about 9% of the staff strength, but account for 22% and 23%, respectively of the state population. In Madhya Pradesh SCs and STs account for 11% of the private sector’s total staff strength, less than a third of
their strength in state’s population. Only in Kerala and Uttarakhand, the percentage of SCs and STs in the private sector is higher than their share in population. Chhattisgarh is a shade better with more number of factories, but half its workforce comprises SCs, STs, comparable to its total SC, ST population of 43.4%. Delhi and Haryana are relatively egalitarian. The CII survey of the private sector’s human resource composition in Chandigarh, Punjab and Rajasthan shows that SC, ST proportion is 25-50% lower than their strength in the total population. http://www.financialexpress.com/news/india-incs-caste-census-finds-st-scs-missing/739803/0
30 Planning Commission as on 1 April 2012 http://planningcommission.nic.in/data/datatable/0904/tab_1.pdf 2011-12 figures are advance estimates.
31 ‘Restructuring’ includes reduction in interest rates, rescheduling of repayment periods, part waiver of interest or even principal.32 Trend and Progress of Banking in 2011-12, RBI, November 2012;
http://rbidocs.rbi.org.in/rdocs/Publications/PDFs/0TPB021112FLS.pdf33 Financial Stability Report, Issue no 6, Reserve Bank of India (RBI), December 2012;
http://rbidocs.rbi.org.in/rdocs/PublicationReport/Pdfs/FFSR261212_FL.pdf34 Planning Commission as on 1 April 2012 http://planningcommission.nic.in/data/datatable/0904/tab_1.pdf 2011-12 figures are
advance estimates.35 National Sample Survey Office (NSSO), 66th round.36 http://labourbureau.nic.in/Final_Report_Emp_Unemp_2009_10.pdf37 The Inclusive Wealth Index includes the environmental costs in the calculation of GDP. It shows whether the natural resources
(especially the non-renewable ones) are being used for building long-term capital or are just used for consumption. The IWI includes natural capital, in addition to human and manufactured capital, when looking at a country’s capital assets to see the true wealth and sustainability of its growth. Under the IWI, natural capital calculations include fossil fuels, minerals, forest resources, agricultural land and fisheries. Ecosystem services and water accounting were not included due to lack of reliable data. (Inclusive Wealth Index Shows Economic Impact of Natural Capital, J. Mijin Cha, Dēmos).
38 India is 6th of the 20 countries ranked. The total changes in the Inclusive Wealth Index were measured from 1990-2008.39 The top two Indian billionaires have more wealth than the top 20 Chinese billionaires combined (2008). In 2012 India has 48
billionaires, down from 55 in 2011. The Indian billionaires’ networth is 10.6% of GDP (USD194.6 billion), while for the 95 Chinese it is 2.9% (USD 205.4 billion).
40 Ministry of Home Affairs, GoI, 30 June 2012. Quoted in http://indiatoday.intoday.in/story/maoists-at-capitals-doorstep/1/212627.html accessed 14 August 2012.
41 From 26,665 (2006), 29,825 (2007) 33,365 (2008), 33,594 (2009), 32,665 (2010) to a peak of 33,719 (2011). NCRB.42 UNICEF and WHO, 2012.43 As per Census 2011 data insanitary latrines are those where human faeces is (i) disposed into open drains, (ii) serviced
manually, or (iii) serviced by animals.44 GII- Human Development Report 2011.45 State of the World’s children 2006.46 Census of India 2011.47 UDHR: Universal Declaration of Human Rights; ICCPR: International Covenant on Civil and Political Rights; ICESCR:
International Covenant on Economic Social and Cultural Rights48 KV Kishore Chandra Deo, D.O. No. MTA/VIP/18/44 2012, dated 24 May 2012.49 Economic survey of India 2011-12, table 2.10.50 Habitations with a population of at least 5,000, population density of over 400 per sq km and over 75% engaging in non-
agricultural activities, but are not legally classified as municipalities etc.51 See for instance our note (http://openspace.org.in/node/31) India: A Revolution from below, 2006.52 For the variation in per capita income by state see: http://pib.nic.in/archieve/others/2012/mar/d2012032902.pdf53 Himanshu http://www.livemint.com/2012/08/02000232/Disparity-in-incomegetting-sh.html
—oO(end of document)Oo—