state of the union in the drayage...
TRANSCRIPT

Single Source Solutions That Connect
State of the Union in the Drayage Industry
Agriculture Transportation CoalitionJune 24-26, 2015
Ken Kellaway- President & CEORoadOne IntermodaLogistics

Single Source Solutions That Connect Single Source Solutions That Connect
RoadOne is a leading National provider of intermodal
logistics service, delivering transportation, terminal
management and distribution solutions across the
United States. 40 National Locations
Domestic Intermodal
Trucking
International Intermodal
Trucking
National Warehousing &
Transloading
Container Terminal Solutions
Regional Dedicated Truckload
1,200+ Power Units

Single Source Solutions That Connect
New Haven
La Habra
Tacoma
Portland
Lathrop
Houston
Randolph
Buffalo
Syracuse
Albany
Savannah
Charleston
Jacksonville
Nashville
Memphis
Atlanta
Greenville
Charlotte
Greensboro
Norfolk
Wolcott
Channahon
Chicago
Rochelle
St. Louis
Cleveland
Detroit
Cincinnati
ColumbusBaltimore
Bethlehem
Harrisburg
Philadelphia
Chambersburg
South Kearney
Rutherford
Los Angeles
Corporate Offices
RoadOne IntermodaLogistics
Miami
Salt Lake City
Value Add Services Intermodal Trucking both Port & Rail Based Warehousing (Dry and Climate Controlled) Transloading, Cross Docking, &Pool Point
Distribution Dedicated Truck Network Solutions TL and TLT Consolidation to major retailers

Single Source Solutions That Connect
Intermodal trucking is a $15 billion segment of the transportation
industry, approximately 70% international and 30% domestic
Intermodal growth has averaged approximately 2x GDP growth
2013- 2014 CAGR = >4.5% International and >5.5% Domestic

Single Source Solutions That Connect
Intermodal is expected to be the fastest growing transportation
segment over the next ten years
3.5%3.4%
3.1%
1.7%
6.6%
2.0%
0.6%
4.7%
2.7%
1.3%
2.5%
1.1%
0.3%
5.5%
0.2%0.4%
3.9%
1.0%
2.4%
2.9%
2.1%
1.0%
6.1%
1.1%
0.5%
4.3%
1.9%
TL LTL Private Truck Rail Carload Rail Intermodal Water Pipeline Air Total
2011-2022 Projected Tonnage Growth Source : ATA forecast to 2022
2011-2016 2017-2022 2011-2022

Single Source Solutions That Connect
• NS Investments
• $3 B in Crescent Corridor from New York to Memphis and New Orleans, new terminals in Birmingham, Charlotte, Memphis, and Greencastle, PA
• $300 M in Meridian Speedway joint venture with Kansas City Southern connects Dallas to Meridian, MS and points East
• $290 M in Heartland Corridor from the Port of Virginia to the Chicago, included tunnel expansion to support double stack trains
• CSX Investments
• National Gateway project to support double stack intermodal from Mid-Atlantic ports to Midwestern markets
• Opening new terminals in Central Florida, Pittsburg, and Montreal
• Expanding major Northwest Ohio terminal that was opened in 2011
• YTD 2015 intermodal volume is up for eastern railroads CSX and NS, but down for western railroads BNSF and UP
Source: Norfolk Southern Railway website,
Norfolk Southern Intermodal Map

Single Source Solutions That Connect
• Intermodal length of haul declined from 2009
to 2014
• Domestic 53’ container length of haul has
decreased by 9% - this change is due in
part to the development of new shorter
DST corridors in the East
• ISO containers length of haul declined by
2% - this decline is driven by the shift to
domestic transload on the west coast and
all-water east coast service
• The “short-haul” intra-Southeast intermodal
corridor was the fastest growth high volume
corridor in 2014 with >10% annual growth rate
• 3Q2014 domestic volume increased 11.7%
• 3Q2014 international volume increased
12%
• 4Q2014 combined annual growth was
12.8%
1,400
1,500
1,600
1,700
2009 2010 2011 2012 2013 2014
Average Intermodal Length of Haul (miles)
International 53' Container
Source: FRT Intermodal Update, 4/2015; IANA 3Q2014 Intermodal Market Trends and Statistics; IANA 4Q2014
Corridor Growth Chart
Single Source Solutions That Connect
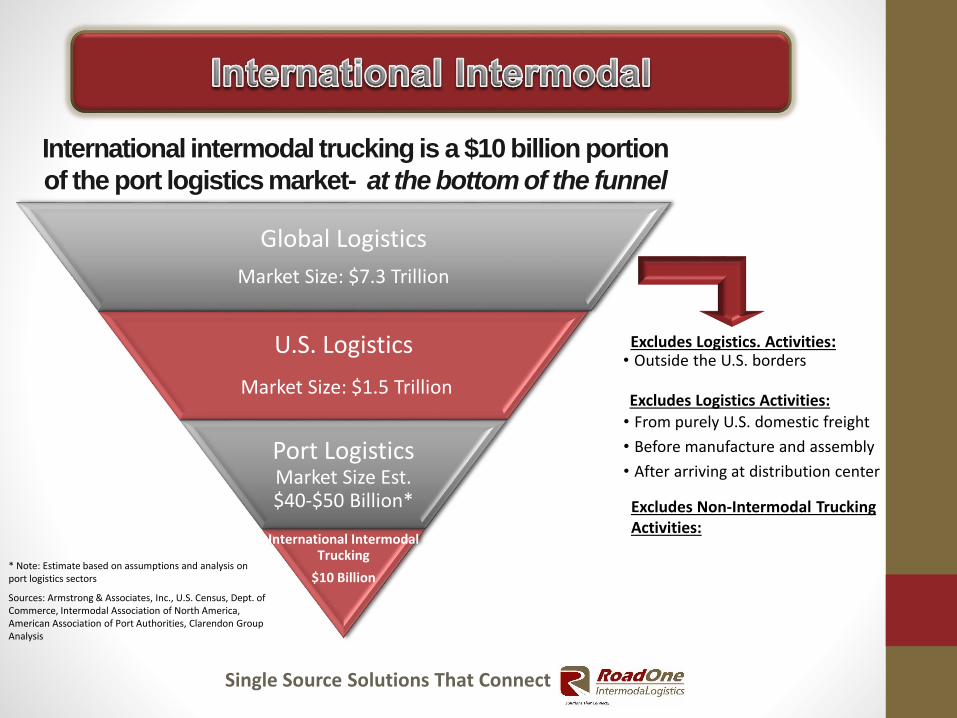
International intermodal trucking is a $10 billion portion
of the port logistics market- at the bottom of the funnel
Global Logistics
Market Size: $7.3 Trillion
U.S. Logistics
Market Size: $1.5 Trillion
Port Logistics Market Size Est. $40-$50 Billion*
International Intermodal Trucking
$10 Billion
• Outside the U.S. bordersExcludes Logistics. Activities:
Excludes Non-Intermodal Trucking Activities:
Sources: Armstrong & Associates, Inc., U.S. Census, Dept. of Commerce, Intermodal Association of North America, American Association of Port Authorities, Clarendon Group Analysis
• From purely U.S. domestic freight
• Before manufacture and assembly
• After arriving at distribution center
Excludes Logistics Activities:
* Note: Estimate based on assumptions and analysis on port logistics sectors

Single Source Solutions That Connect
There are about 5,000 for-hire intermodal trucking carriers, with the top
10 independent providers operating about 8 percent of total capacity
* Highly Fragmented * High company turnover * Undercapitalized * Aging ownership
Note: Clarendon estimates. Excludes integrated firms whose trucking primarily serve as an in-house fleet, such as JB Hunt, Schneider, Maersk/BTT and Hub/Comtrak
Source = Clarendon Group
- 500 1,000 1,500
For-Hire Intermodal Trucking Fleets Truck Counts
Top 10, 7,545
8%
All Others, 83,841
92%
Single Source Solutions That Connect
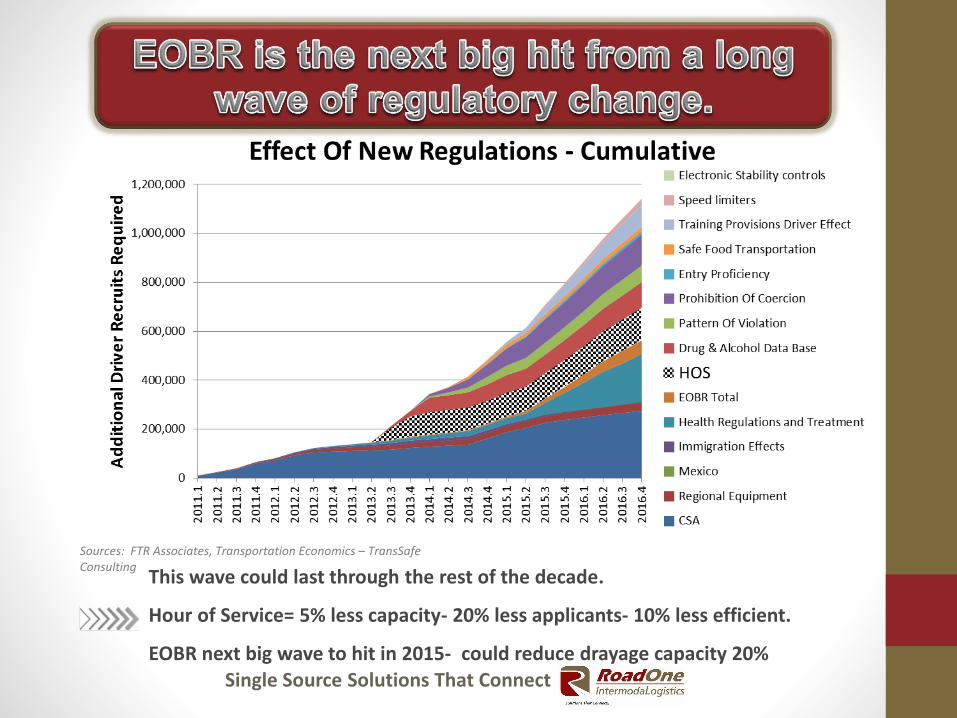
This wave could last through the rest of the decade.
Hour of Service= 5% less capacity- 20% less applicants- 10% less efficient.
EOBR next big wave to hit in 2015- could reduce drayage capacity 20%
Sources: FTR Associates, Transportation Economics – TransSafe Consulting

Single Source Solutions That Connect
Driver Terminal
Pre-mounted on Chassis
Customer Location
Return Process
1 Hour = Full Cycle

Single Source Solutions That Connect
Driver Terminal
Chassis PoolPort/Rail Live Lift
Customer Location
Empty Port/Rail Return
Chassis Pool Empty
1 Hour
30 Minutes
2-4 Hours
30 Minutes
30 MinutesNew Line
3-6 Hours = Full Cycle Port and Ramp operations need to focus on the true turn time at their Facilities
and need to adjust gate hours to service their customers. Gate turn times are NOT the total time it takes to pick up a box

Single Source Solutions That Connect
• Labor slow down “Safety Focus” due to PMA- ILWU negotiations• Big Vessels plugging up terminals- Our new future- Maersk –
Generation EEE- 19,630 TEU- 11 on order• VSA fragmenting lines equipment among multiple terminals• Declining Drayage capacity results in FREE TIME Chasing.
• Driver re-classification challenges- Independent to Company- Hub• Union pressure to organize Drayage- 6 companies under pressure
• Rail congestion causes delays on-dock to load outbound• Chassis conversion process from lines to pools.
• Wrong assets in the wrong location- dislocation issue .• Dislocation creates equipment shortage and delays.• Increased M & R issues and more OOS Chassis. • ILWU – increased inspection process on-dock
• Result = Port congestion fees - $150- Reduced Free Time – 1 hour• Delay Charges of $60-$90 per hour • Dedicated fleet Model growth/ Company Truck Model

Single Source Solutions That Connect
• Shift from west coast ports to east coast ports occurred over last decade
• 2014/2015 west coast labor issues exacerbated shift — may be short term
• Transit via all water to east coast could be + 2 weeks
• Many factors could impact the shift, including type and value of commodity, supply chain networks, port readiness and infrastructure, and relative economics
• Parsons Brinckerhoff estimates $100/container shipper savings
• Parsons Brinckerhoff (worked on Panama Canal study for U.S. DOT) expect some shifts, but not “explosive”
• Union Pacific Railway expects 3% shift
• Jones Lang LaSalle estimates 25% of Asia —west coast freight could shift to East
Source: Journal of Commerce; Stifel Nicolas; Parsons Brinckerhoff; Wall Street Journal
40.0%
42.5%
45.0%
47.5%
50.0%
52.5%
55.0%
57.5%
60.0%
Share of U.S. Import TEUs
WC EC/Gulf

Single Source Solutions That Connect
• Port of LA/LB*6 Months of extensive delays *Cycle times exceeding 4 hours*Significant backlog still exists *Port Surcharges in placePort of NY/NJ*Delays for full pick up cycle up to 4 hours, historically 2 hours*Bad, Older Chassis *Volume Spikes *Lack of road infrastructure tohandle lines *Police forcing drivers to circle
*RAPID driver exit from industry• Port of Norfolk
*Total Cycle time has increased from 1 hour to 3.5 hours*Drivers preparing to strike *Port surcharges need to be put in placeSoutheast Port Turn Times
-Jax, Sav, Charleston = 1 Hour! How long will it last?
Single Source Solutions That Connect
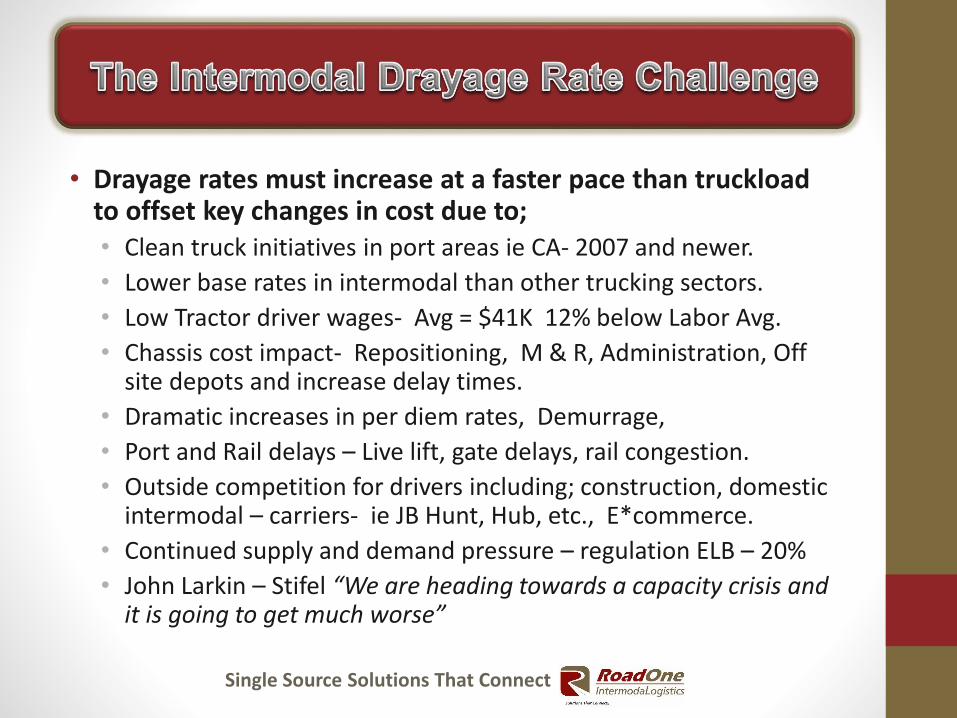
• Drayage rates must increase at a faster pace than truckload to offset key changes in cost due to; • Clean truck initiatives in port areas ie CA- 2007 and newer.
• Lower base rates in intermodal than other trucking sectors.
• Low Tractor driver wages- Avg = $41K 12% below Labor Avg.
• Chassis cost impact- Repositioning, M & R, Administration, Off site depots and increase delay times.
• Dramatic increases in per diem rates, Demurrage,
• Port and Rail delays – Live lift, gate delays, rail congestion.
• Outside competition for drivers including; construction, domestic intermodal – carriers- ie JB Hunt, Hub, etc., E*commerce.
• Continued supply and demand pressure – regulation ELB – 20%
• John Larkin – Stifel “We are heading towards a capacity crisis and it is going to get much worse”
Single Source Solutions That Connect
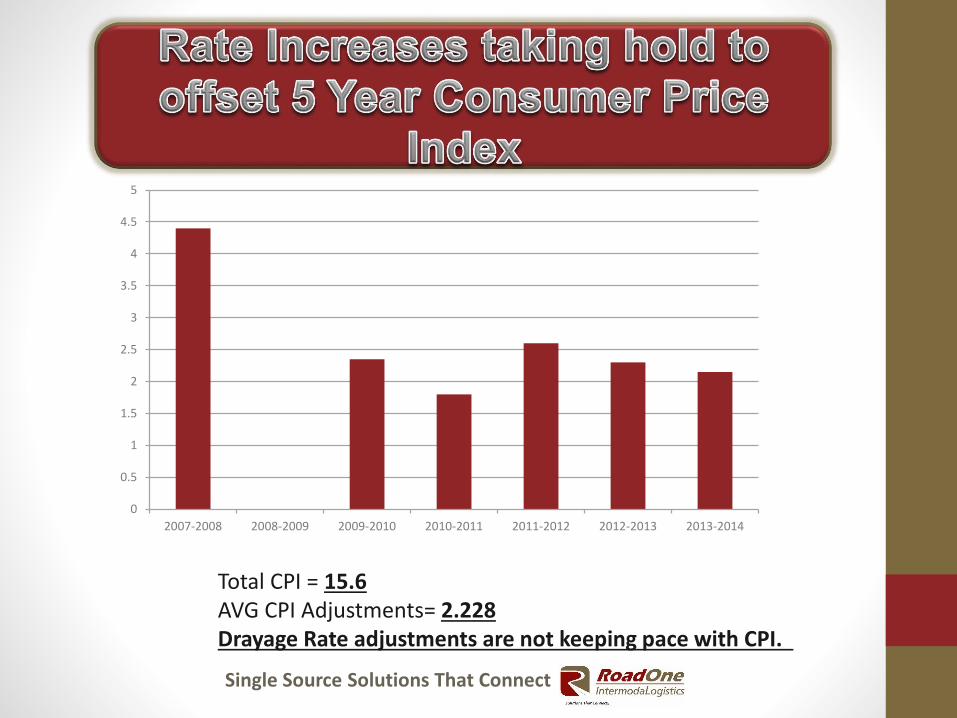
Total CPI = 15.6AVG CPI Adjustments= 2.228Drayage Rate adjustments are not keeping pace with CPI.
0
0.5
1
1.5
2
2.5
3
3.5
4
4.5
5
2007-2008 2008-2009 2009-2010 2010-2011 2011-2012 2012-2013 2013-2014

Single Source Solutions That Connect
1
2
3
4
5
6
7
8
9
10
Cap
acit
y
Serv
ice
Rel
iab
ility
Rel
atio
nsh
ips/
tru
st
Safe
ty
Pri
ce
Bac
k o
ffic
e/EO
DB
Dri
ver
Qu
alit
y
Equ
ipm
ent
qu
alit
y
Tech
no
logy
Ow
ner
ship
of
a ch
assi
s fl
eet
Nat
ion
al /
mu
lti-
regi
on
…
Oth
er s
ervi
ces
(war
eho
usi
ng,
…
Max
Min
Average
Most important
Leastimportant
Importance of Evaluation Criteria
Single Source Solutions That Connect
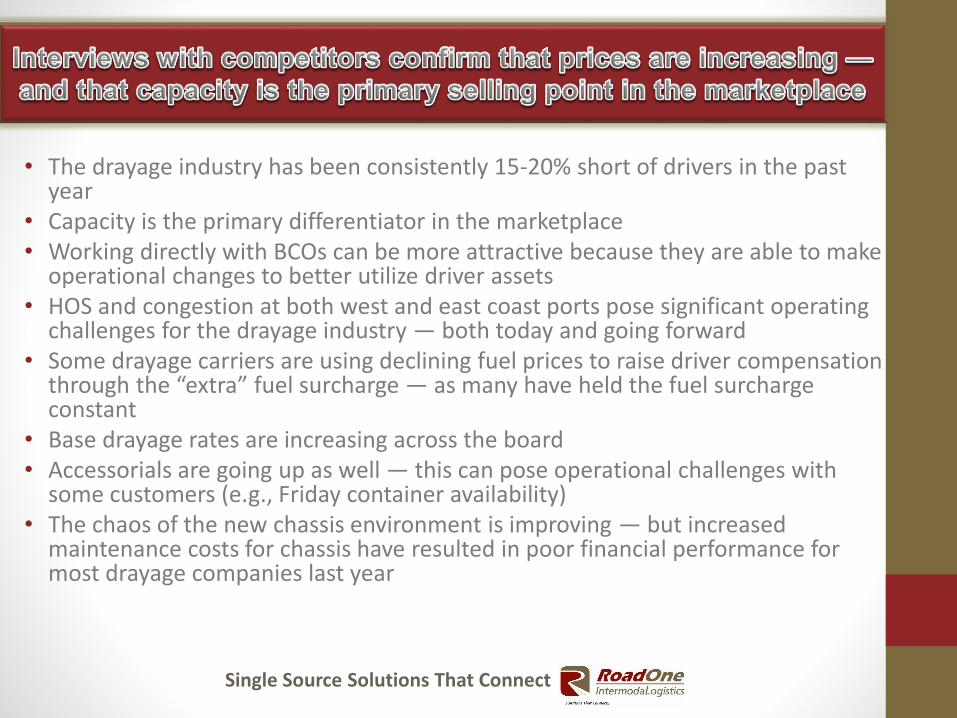
• The drayage industry has been consistently 15-20% short of drivers in the past year
• Capacity is the primary differentiator in the marketplace• Working directly with BCOs can be more attractive because they are able to make
operational changes to better utilize driver assets• HOS and congestion at both west and east coast ports pose significant operating
challenges for the drayage industry — both today and going forward• Some drayage carriers are using declining fuel prices to raise driver compensation
through the “extra” fuel surcharge — as many have held the fuel surcharge constant
• Base drayage rates are increasing across the board• Accessorials are going up as well — this can pose operational challenges with
some customers (e.g., Friday container availability)• The chaos of the new chassis environment is improving — but increased
maintenance costs for chassis have resulted in poor financial performance for most drayage companies last year

Single Source Solutions That Connect
• 2014 rate increases were stronger than prior years based on Cass price indices (ex. fuel)*
• Intermodal rates were up 2.5%
• Truckload rates were up 6%
• DAT truckload rates excluding fuel were up year over year (March 2015 vs March 2014)
• Contract rates: 2015 rates up 5.5%
• Spot rates: 2015 rates up 2.5%
• JOC article states drayage rates were flat to slightly up from 2011 to 2014
• According to our interviews, drayage rates increased over the last year and are expected to increase over the next 2 years
*Cass indices exclude fuel
Source: Cass Information Systems, DAT Solutions, Journal of
Commerce; Interviews

Single Source Solutions That Connect
The ATA expects about 100,000 total new hires will be needed each year
The majority of new drivers required are due to retirements and departures from the industry
Drivers will become increasingly more selective in what sector they want to work in .
Drivers will continue to reduce risk exposure due to regulation pressure, i.e. CSA alerts- overweight loads, etc.
Driver options will continue to expand as economy strengthens , construction, final mile, UBER , etc.
Source: U.S. DOT, U.S. Dept. of Labor, Bureau of Labor Statistics, and ATA
Non-Voluntary Departures
16%
Voluntary Departures
11%
Retirements37%
Industry Growth
36%
Projected New Driver Demand Sources

Single Source Solutions That Connect
$0 $20,000 $40,000 $60,000 $80,000
TL…
Flatb…
Dedi…
LTL…
Tank…
Refri…
LTL…
Priva…
Priva…
2013 Median Driver Pay by Type of Driver
Source: Stifel Nicolaus / U.S. Bureau of Labor Statistics, ATA, National Private Truck Council/Logistics Management Magazine; National Transportation Institute
Single Source Solutions That Connect
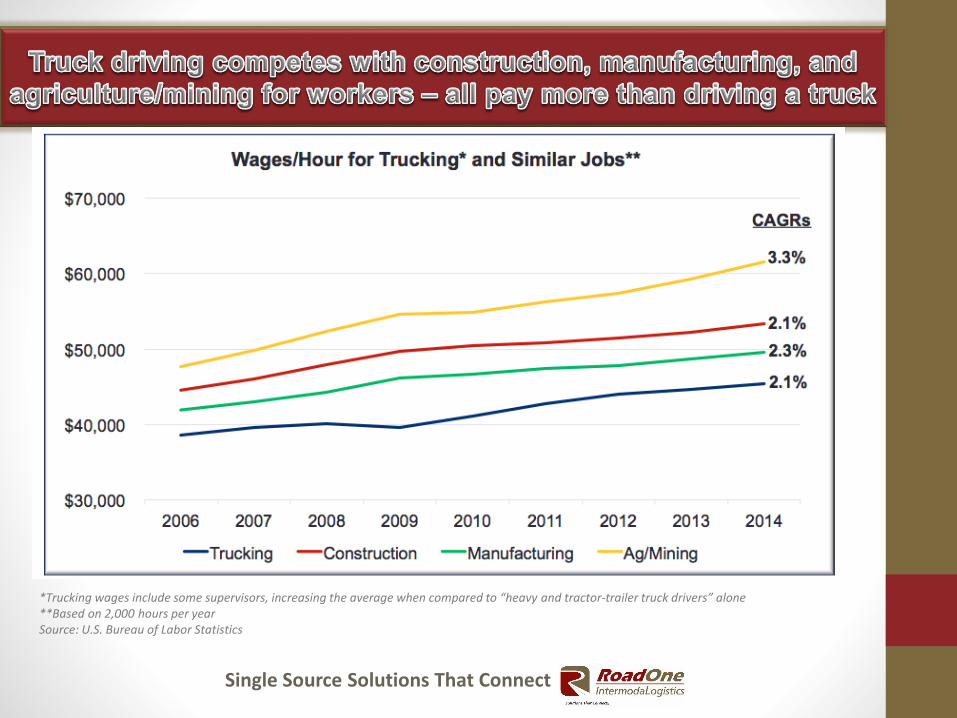
*Trucking wages include some supervisors, increasing the average when compared to “heavy and tractor-trailer truck drivers” alone**Based on 2,000 hours per year Source: U.S. Bureau of Labor Statistics
Single Source Solutions That Connect
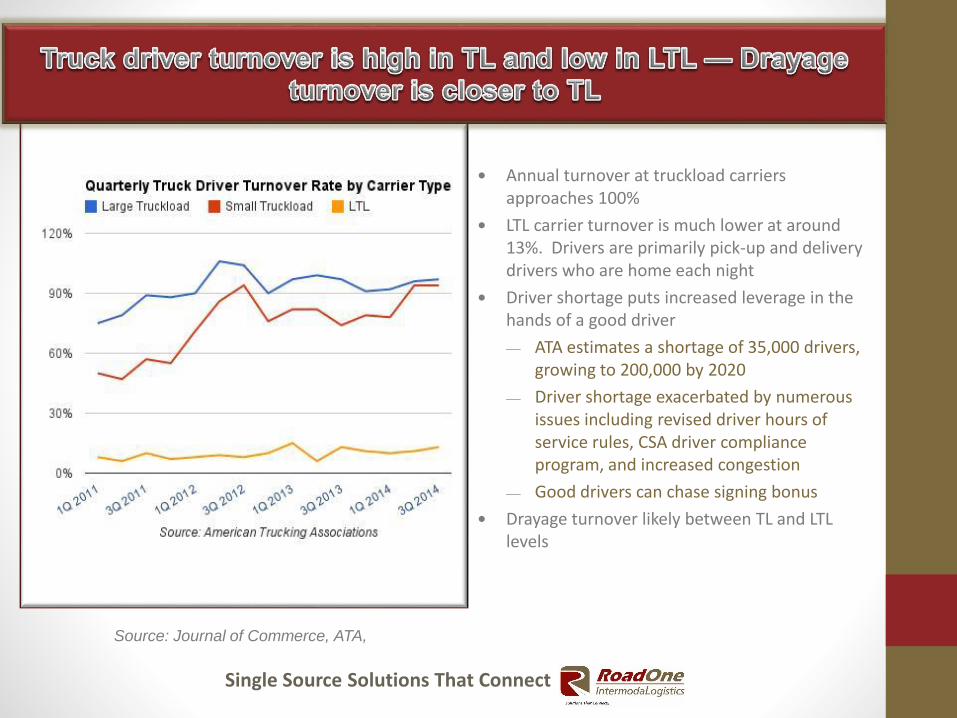
Source: Journal of Commerce, ATA,
Annual turnover at truckload carriers approaches 100%
LTL carrier turnover is much lower at around 13%. Drivers are primarily pick-up and delivery drivers who are home each night
Driver shortage puts increased leverage in the hands of a good driver
ATA estimates a shortage of 35,000 drivers, growing to 200,000 by 2020
Driver shortage exacerbated by numerous issues including revised driver hours of service rules, CSA driver compliance program, and increased congestion
Good drivers can chase signing bonus
Drayage turnover likely between TL and LTL levels

Single Source Solutions That Connect
0
50,000
100,000
150,000
200,000
250,000
2014 2015 2016 2017 2018 2019 2020
Truck Driver “Shortage”
Sources: ATA

Single Source Solutions That Connect
Improving compensation
Increasing pay
Increasing bonuses
Increasing benefits
Improving working conditions
Improved equipment
Flexible working arrangement
Increased dedicated
Increased recognition/ appreciation
0% 20% 40% 60%
Dedicated Operations
Improving Benefits
Flexible WorkArranagements
Recognition Programs
Performance Bonuses
Upgrading Equipment
Driver AppreciationEvents
Increasing Pay
Steps Taken to Retain DriversPercent of Respondents*
*Based on company survey responsesSource: HireRight 2015 Transportation Spotlight

Single Source Solutions That Connect
• Trucking typically competes for labor with manufacturing and construction – both of which can require lower skill, provide a better lifestyle and higher wages
• As manufacturing and construction recover, those industries draw labor away from trucking
• Within trucking, the private fleets provide the highest pay and have very low turnover – Drayage, a relatively small segment, pays the least and has the most significant shortage
• Solving the driver shortage for drayage will require annual income increasing over $60K, newer/better quality tractors, and improved lifestyle
• The average margin in drayage is around 5% with drivers pay comprising around 30% of the total drayage rate – an increase from the upper $40Ks to $60K+ cannot be absorbed without drayage rates rising
• If customers paid more for drayage, the driver shortage would largely be solved
Single Source Solutions That Connect
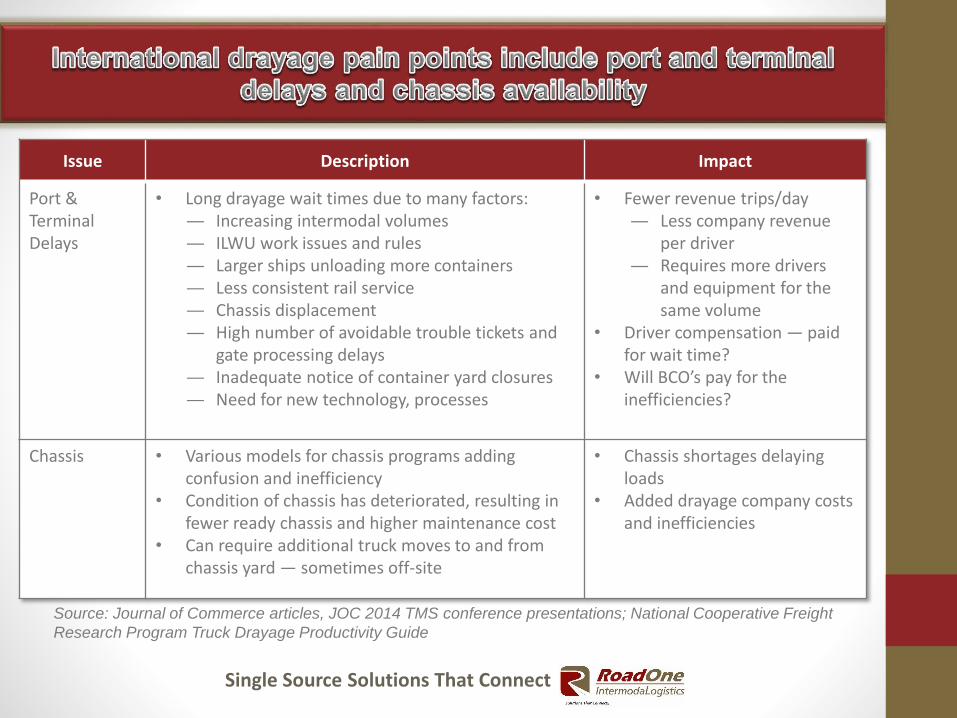
Source: Journal of Commerce articles, JOC 2014 TMS conference presentations; National Cooperative Freight
Research Program Truck Drayage Productivity Guide
Issue Description Impact
Port & Terminal Delays
• Long drayage wait times due to many factors:— Increasing intermodal volumes— ILWU work issues and rules— Larger ships unloading more containers— Less consistent rail service— Chassis displacement— High number of avoidable trouble tickets and
gate processing delays— Inadequate notice of container yard closures— Need for new technology, processes
• Fewer revenue trips/day— Less company revenue
per driver— Requires more drivers
and equipment for the same volume
• Driver compensation — paid for wait time?
• Will BCO’s pay for the inefficiencies?
Chassis • Various models for chassis programs adding confusion and inefficiency
• Condition of chassis has deteriorated, resulting in fewer ready chassis and higher maintenance cost
• Can require additional truck moves to and from chassis yard — sometimes off-site
• Chassis shortages delaying loads
• Added drayage company costs and inefficiencies

Single Source Solutions That Connect
Issue Description Impact
Driver Shortage • Long-term driver shortage issue— Driver requirements more strict
o Hours of service limitationso Government CSA rules
— Pay has been stagnant— Lifestyle not attractive — Inefficiencies require more drivers
• Driver pay very likely will have to rise
• Driver capacity will be constrained
• Renewed focus on recruitment, retention
Owner Operator Issues
• Owner operator trucks are the core of the drayage community
• Owner operator fleet is 38,000 trucks below 2006 levels in 2013
• Trucks more expensive to buy due to engine requirements
• Need to have healthy owner-operator community to support drayage companies
Source: Journal of Commerce articles, JOC 2014 TMS conference presentations; National Cooperative Freight
Research Program Truck Drayage Productivity Guide; Ken Kellaway 2014 Port Stakeholders Summit presentation;
Commercial Carrier Journal; Zubrod/Clair experience

Single Source Solutions That Connect
• Work in conjunction with shippers, railroads, ports and steamship lines to find ways to reduce inefficiencies in system and standardize the chassis process. ONE UNIFORM SOLUTION - TTX LIKE – Grey Chassis Pools- Grey Containers!!
• Increase velocity in system – i.e. more night gates,drops at destination, reduced port/ramp turn time, match imports and exports- load/load, faster roadability !
• Increase industry awareness of drayage issues and work to improve visibility within industry trade groupsand government segments. “ We need to be at the table.”
• Establish stronger partnerships with customers and if a third party involved then all parties should be involved in process & pricing. If we don’t fix the issues the FMC will or Sector will be Unionized.
• We must get paid for value added services. Need Standardized Terminal tariff with standard free time and compensation for delays.
• Pricing must rise equal to or greater than CPI and or cost increases in the market.