state of the wine industry 2016 - silicon valley bank · pdf filestate of the wine industry...
TRANSCRIPT
State of the Wine Industry 2016 Written by Rob McMillan, EVP and Founder Silicon Valley Bank Wine Division

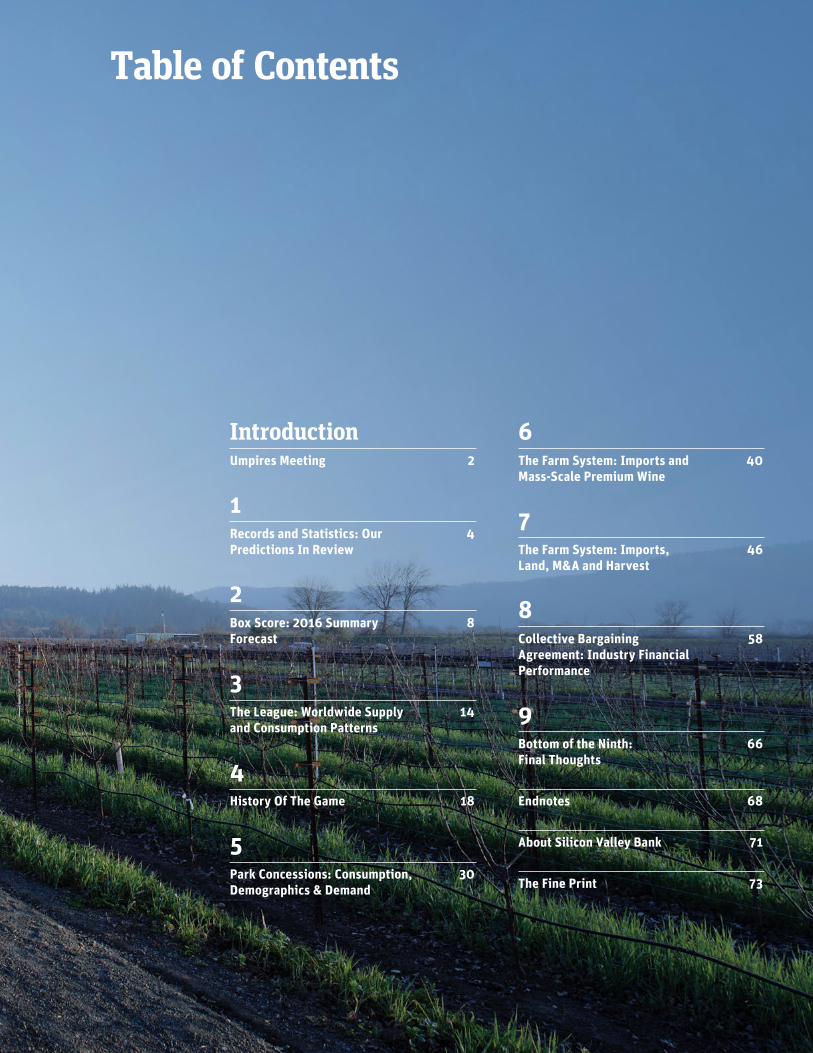
Table of Contents
IntroductionUmpires Meeting 2 1Records and Statistics: Our 4 Predictions In Review 2Box Score: 2016 Summary 8 Forecast 3The League: Worldwide Supply 14 and Consumption Patterns 4History Of The Game 18 5Park Concessions: Consumption, 30 Demographics & Demand
6The Farm System: Imports and 40 Mass-Scale Premium Wine 7The Farm System: Imports, 46 Land, M&A and Harvest 8Collective Bargaining 58 Agreement: Industry Financial Performance 9Bottom of the Ninth: 66 Final Thoughts
Endnotes 68
About Silicon Valley Bank 71
The Fine Print 73

Introduction
Um
pires Meeting: Introduction | 1 | 2 | 3 | 4 | 5 | 6 | 7 | 8 | 9
2
In the wine business, the grape harvest is regarded again as excellent in quality but with lower yields across most regions and varietals following a string of several good vintages. Premium wines are in very strong demand as buyers trade up4 into fighting varietals, but grapes destined for lower price segments are starting to lag, leading farmers to consider vineyard removals in the San Joaquin Valley.5
Imports are grabbing shelf space; in part the result of an unusually strong U.S. dollar. Distributors are proving fickle and starting to ignore wine made by small domestic producers, thus putting increased importance on tasting rooms and wine club sales channels. The change to direct to consumer sales has increased tourism, which is becoming very controversial in Napa County in particular.6
There are 1,541 working wineries in the U.S.7 The cost of a movie ticket is $4.11, and the movie Bull Durham is quietly released to theatres, coming in as the fourth most popular film of June … 1988.
If you work in the US Wine Business, that narrative seems familiar until you get to the end. While the circumstances seem a lot like today, the narrative is from industry conditions in 1988, not 2015.
We lead this year’s report with a reminder that the wine business often runs in cycles and endures very long trends. History, as we know, can be quite helpful when used to forecast the future, so this year we’ve taken a little time to remind ourselves where we’ve been before making our predictions. And once again we’re using a movie theme to frame the discussion and hopefully keep you entertained.
1988 looked a lot like 2015 in the wine business and was the year Bull Durham was released.8
Many elements of the movie can be overlain with events symbolic of today’s wine business, but one of the move’s themes in particular, adapting to change and pass- ing the torch, is a message the wine business should consider in 2016.
We’ll use America’s pastime and Bull Durham to frame our views in this year’s report. Hoping you catch a few ideas, we now invite you to lace up your cleats and dig in as we present our annual review, discussion and predictions for the U.S. wine business in 2016. ◻
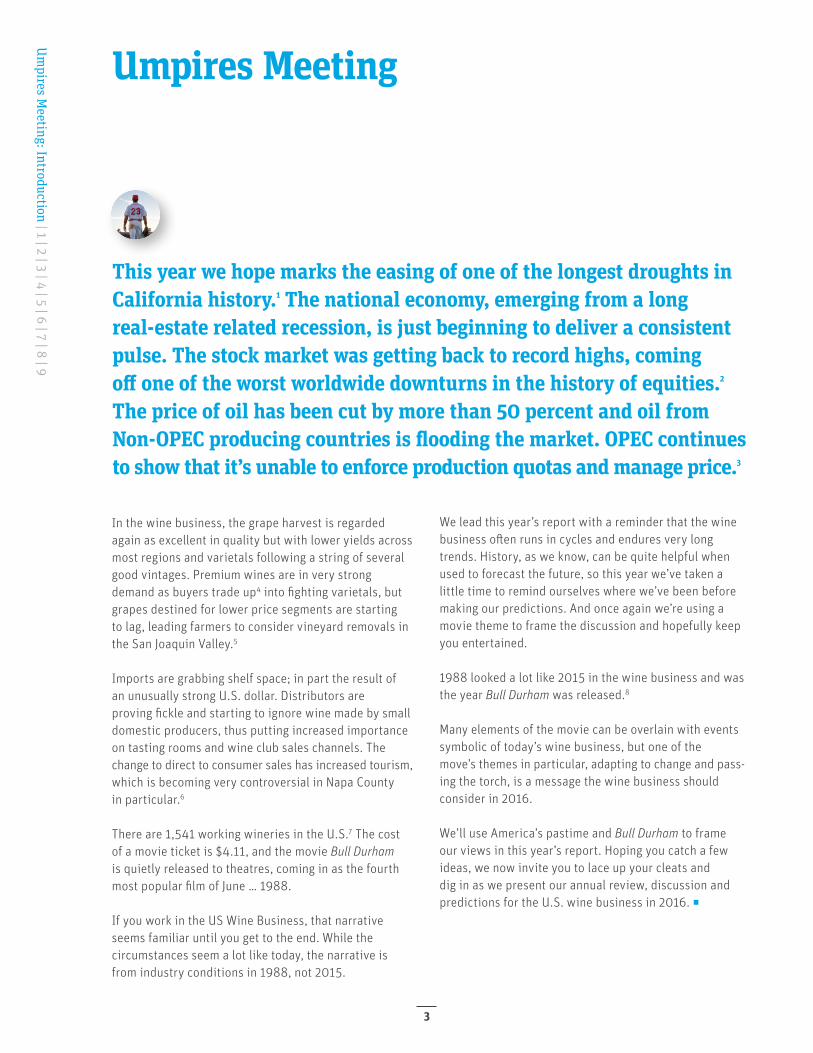
This year we hope marks the easing of one of the longest droughts in California history.1 The national economy, emerging from a long real-estate related recession, is just beginning to deliver a consistent pulse. The stock market was getting back to record highs, coming off one of the worst worldwide downturns in the history of equities.2 The price of oil has been cut by more than 50 percent and oil from Non-OPEC producing countries is flooding the market. OPEC continues to show that it’s unable to enforce production quotas and manage price.3
Umpires Meeting
Um
pires Meeting: Introduction | 1 | 2 | 3 | 4 | 5 | 6 | 7 | 8 | 9
3
1
Joe Readon: He walked 18.
Larry: New league record!
Joe Readon: Struck out 18.
Larry: Another new league record! In addition, he hit the sportswriter, the public address announcer, the bull mascot...twice!
Larry: Also new league records! But Joe, this guy’s got some serious sh*t.
Introduction | 1 Records and Statistics: Our Predictions in Review | 2 | 3 | 4 | 5 | 6 | 7 | 8 | 9
4
Records and Statistics:Our Predictions in Review
In the movie, Nuke had just pitched his first professional game and was already in the record books for strikeouts, walks and hitting the mascot. His grades were a little erratic, but at least they were keeping score. The same can’t be said for most economists who give “cautiously optimistic predictions.” I say you either point to the fence and call your shot like the Babe, or go sit on the bench.
We don’t weasel out in this report. We take a position and we will be judged on our record just like Nuke. We throw hard and let the chips fall where they may. Sometimes we throw strikes and on rare occasion, we hit the mascot. But we still review the forecasts made the prior year just to make sure we are presenting more strikeouts than walks. Here is what we said in last year’s report:
Global and U.S. Economic FactorsWe are seeing real strength in the U.S. economy going into 2015:
▸ Oil price declines are transferring wealth to oil- consuming countries and will deliver hundreds of mil-lions of dollars in stimulus to U.S. consumers in 2015.
▸ The employment picture is improving at an acceler- ating pace in the United States. We expect the U3 unemployment rate (the primary measure of unem-ployment) will approach 5 percent during the year.
▸ Japan, China and the EU are delivering sub-optimal results, and those currencies are weakening against the dollar.
▸ The likelihood the Fed will increase rates in 2015 has grown, and we predict some movement in messaging first in early 2015, and actual rate moves higher by Q3.
▸ Interest rate moves will happen at a slow pace given that inflation will be in check from lower-priced imports and fuel savings, leaving deflation still a concern.
▸ We predicted U.S. GDP would be better in 2015 compared to the prior year and come in near 3 percent. It appears as though it will end well below 3 percent and about even with 2014 when final Q4 numbers are released.
▸ The unknown in the world equation is unrest from countries such as Russia and Iran, should their oil-based economies falter more than they already have.
As long as the industrialized world economies can hold their own and not drag down the U.S. economy as their own recoveries catch up, the middle-income U.S. consumer will see improved prospects and will be toasting to that.
The drop in the price of oil has been due to sagging world demand early in the year, but we believe the impact of the fracking boom has added to the situation, putting oil prices into a strong downward trend. We expect oil prices to remain low throughout 2015. →
Introduction | 1 Records and Statistics: Our Predictions In Review | 2 | 3 | 4 | 5 | 6 | 7 | 8 | 9
5
Records and Statistics:Our Predictions in Reviewcontinued
SupplyWhen harvest is analyzed and reported, we expect we’ll announce a third consecutive harvest of heavy yield and great quality across most appellations. That is un-precedented.
While there are varietals and regions where there is excess supply, we believe fine wine producers who feel slightly long will find the gallons in their cellar to be a blessing in disguise by the end of 2015.
Massive bulk imports will continue to dominate the wine categories at the lowest price points, but bulk imports should be held back by the size of the 2014 harvest and supplies currently in cellar.
DemandStarting in mid-2014, wines priced above $20 a bottle broke out strongly higher. “Trading up” is a clear trend again. Red wines in particular showed the strongest growth. We expect that to continue throughout 2015.
Growth in 2014 sales of wines priced above $20 was driven by accelerating volume with little in the way of price increases getting through to the consumer.
PricingWhile the large supply of wines in winery cellars should normally indicate continued depressed pricing, we believe 2015 will be a year of both volume and price increases driven by an improving economy and higher demand in the higher-priced wine categories.
Wines priced below $9 per bottle performed poorly both on and off-premise in 2014. The poor performance is likely to continue into 2015.
After finishing the year at the top end of our predicted growth in sales of 6–10 percent, we are predicting a breakout year of sales growth in fine wine 9 and anticipate accelerating sales through the year, ending in the 14–18 percent range in 2015.
Planting Grape planting opportunity is shifting north: Oregon and Washington are showing strong growth in planting on a percentage basis, and we expect that will continue for the foreseeable future given favorable quality/price dynamics relative to the fine wine growing regions in California.
The growing regions in the North Coast are running into difficulty in permitting and with high land costs. Replanting is continuing in older vineyards and those with red blotch. Suitable sites for expansion are becoming more difficult with each passing year.
The Central Valley reports it will pull about 20,000 acres of grapes that were directed to wines priced under $7 given a structural oversupply.10
Financial PerformanceDirect-to-consumer sales will continue as the largest growth channel for most wineries.
Most wineries will say 2015 was one of their best seasons by the end of the year.
Introduction | 1 Records and Statistics: Our Predictions In Review | 2 | 3 | 4 | 5 | 6 | 7 | 8 | 9
6
What we got wrong:We predicted U.S. GDP would be better in 2015 compared to the prior year and come in near 3 percent. It appears as though it will end well below 3 percent and about even with 2014 when final Q4 numbers are released.
What we got close: We predicted the Fed would change their messag- ing and guidance in early 2015, which we got right. But we believed they would move rates by Q3, and instead they moved in Q4. Still not a bad guess if you tracked that debate through the year.
We said interest rate moves would be slow and deflation would be a concern. Deflation is not a real concern at this point, but in mid-2015 the Fed did clarify that any rate increases would be
“measured,” which was our expectation.
What we got right:We forecasted a 14–18 percent growth in the fine wine segment, and will come in at the low end of the range.
We predicted the unemployment rate would approach 5 percent, which was spot on.
We predicted strength in the U.S. dollar against the EU, China and Japan.
We expected oil prices to remain low through- out 2015.
We “guessed” we couldn’t have a record fourth harvest yield, and with higher consumption trends, we thought the heavy 2014 would end up being a blessing in disguise.
We said bulk foreign imports would drop in 2015.We said trading up was a clear trend again. Red wines in particular showed the strongest growth. We expected that to continue throughout 2015.It’s hard to imagine repeating the success of last year’s predictions. We focused on the economy as that’s where all the variability was for the year ahead, and we came in solid with predictions in interest rates, oil prices, and exchange rates — all things my economics professors told me never to forecast in writing. It’s probably not as rare as a triple play, but it was a good year with the crystal ball in 2015.
For 2016, we are going to throw a screwball and leave out most of the economic discussion we would normally present. Instead, we are going to spend all the report talking about the industry shifts underway so we all clearly see the pitch that’s being thrown. ◻
It seems when we look at last year’s report, we see that we hit the ball out of the park on predictions and came in with only one strike against us:
Introduction | 1 Records and Statistics: Our Predictions in Review | 2 | 3 | 4 | 5 | 6 | 7 | 8 | 9
7
2
Skip: You guys. You lollygag the ball around the infield. You lollygag your way down to first. You lollygag in and out of the dugout. You know what that makes you? … Larry?
Larry: Lollygaggers!
Skip: Lollygaggers!
Introduction | 1 | 2 Box Score: 2016 Summ
ary Forecast | 3 | 4 | 5 | 6 | 7 | 8 | 9
8
Lollygagging is not a winning strategy. A good baseball team can’t lollygag. They have to be a step ahead in the field to cut down the speed of the game. One strategy to get that extra step on the runner is called the “the wheel” play. That’s a scheme where the infield rotates to cover other positions while the third baseman charges to field a bunt.11
In the wine business today, we have a similar mass rotation underway where elements of the wine business are evolving to different roles and making new investments for the future.
There’s a permanent rotation to higher-priced wines, along with a pivot by large wine producers away from the mass-production wine brands of the past. Those big wineries still have overhead to cover so they are making acquisitions in premium wineries and positioning themselves in front of the play.
Existing luxury wineries are growing with brand and winery acquisitions, as are large wineries looking for strategic purchases to gain a toehold in the premium space or control land. Institutional players are in the game buying up vineyard holdings to diversify their investments.
Regarding the team composition in the year ahead, the mature generation has announced its retirement from the game in 2015 after having a great career. Baby boomers, who have dominated the business over the past twenty years, are rotating to cover the mature’s vacated bag. By 2021, Gen Xers will slide over to cover the baby boomer’s spot as the dominant fine wine consumer in the league.
The millennials, who have been hounding the coach for increased playing time but were just too young before, finally look like they will get a starting role this year. For the first time ever, their consumption habits have passed the mature generation with 16 percent of the consumption- share in fine wine. They are showing the promise that scouts have seen and talked about in the hot stove leagues for the past decade.
We are worrying a little about the popularity of the do-mestic game with so many choices and competition from foreign franchises. We believe we will see bottled fine wine imports begin to take a larger market share in the business this season, while bulk foreign wine loses market share. The bulk league is a low price show and fans are losing interest.
We believe attendance will be impacted a little this year, and the growth in per capita consumption of wine will reverse the long term growth trend, as the millennials now on the field are showing the willingness consume other alcoholic entertainment at this time in their drinking careers. As they get consistent playing time, we believe they will improve their focus, but sadly, foreign wine will be a per-manent part of that focus. →
Box Score: 2016 Summary Forecast
Introduction | 1 | 2 Box Score: 2016 Summ
ary Forecast | 3 | 4 | 5 | 6 | 7 | 8 | 9
9
Box Score: 2016 Summary Forecastcontinued
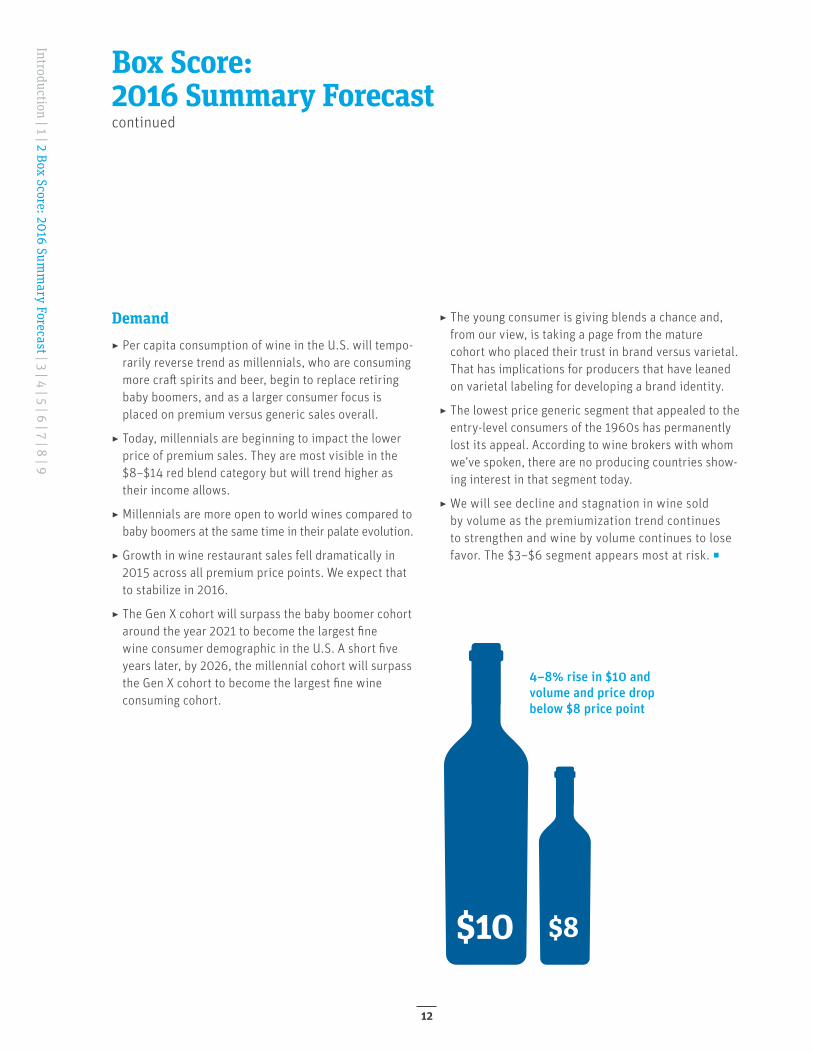
The cost of tickets will be going up this year. We expect to see bottle prices rise by 4–8 percent above the $10 price point, and we will see both volume and price drop below $8 bottle price.
Growth in the fine wine game will be slightly off of the 2015 season given demographic shifts, and slowing 2015 restaurant sales extending into 2016. There is a lot of good wine out there and some négociants are angling to take some of the fans interest away from established brands. That will make it a good year to be a consumer seeking new values.
A good ball club anticipates, and we want you to be ready when the play comes your direction. So, here are our observations and predictions for 2016 to help you make the best business decisions:
Wine Specific Predictions
▸ We are forecasting a sales growth range of 9–13 percent for the premium wine segment in 2016, down from 14–18 percent in the prior year.
▸ Growing local regulations around tourism will continue to damage opportunities for small wineries to sell direct.
▸ With the transactions we presently see in the queue, we will certainly start off the year again with some large and notable sales of premium vineyards and wineries. Mergers and acquisitions (M&A) will remain active throughout the year.
▸ Tens of thousands of additional grape acres will be per- manently removed from the California Central Valley.
▸ A strong and strengthening U.S. dollar, available foreign supply, and willing millennials will encourage imports at all premium price levels.
▸ Growing bottled market share of imports should be a heightened concern of U.S. producers.
▸ The narrowing supply of arable land suitable for higher-end wine production will drive vineyard prices higher.
▸ Oregon and Washington will continue to see high in-terest for vineyard acquisition for premium and luxury wine production.
▸ We expect to see bottle prices rise by 4–8 percent above the $10 price point, and see both volume and price drop below $8 bottle price.
Supply
▸ Worldwide supply is beginning to creep up into un-comfortably familiar territory, particularly in the EU. Area under vine is increasing, while world and EU per capita consumption is decreasing.12
▸ Our guess for total harvest in California is 3.6 million tons crushed, which is off about 8 percent from 3.9 million tons crushed in 2014. Quality was excel-lent, but some area-specific challenges will be noted from set issues in the spring. Harvest was early every- where. It was average crop size in the San Joaquin Valley, and light elsewhere.
▸ Oregon’s harvest was early, huge and another consec-utive vintage of the decade.
▸ The early read on Washington’s harvest suggests it was similar to Oregon’s in timing and quality, but more of a normal yield.
▸ Bulk imports will decrease, but that will be be due to shrinking consumer demand for low-priced wine rather than U.S. wine recovering market share.
▸ Overall supply in California is still slightly long, but close to balanced in premium wine regions. A light 2016 harvest wouldn’t be desirable. →
Introduction | 1 | 2 Box Score: 2016 Summ
ary Forecast | 3 | 4 | 5 | 6 | 7 | 8 | 9
10
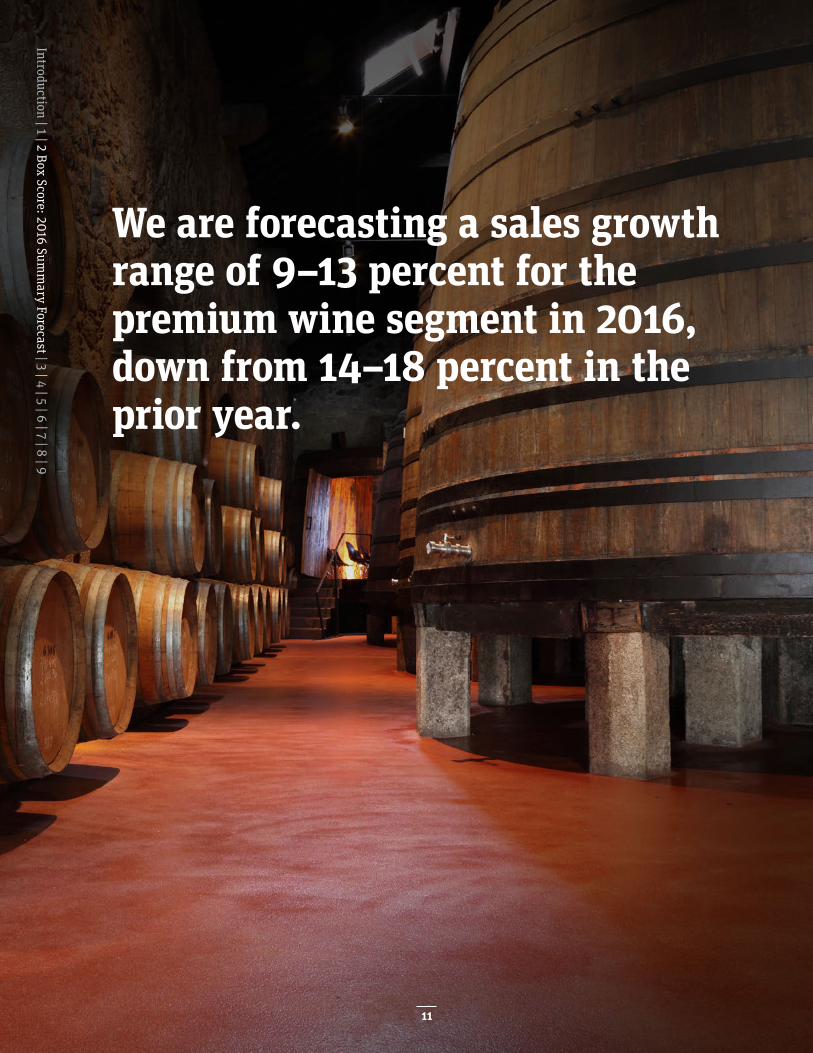
We are forecasting a sales growth range of 9–13 percent for the premium wine segment in 2016, down from 14–18 percent in the prior year.
Introduction | 1 | 2 Box Score: 2016 Summ
ary Forecast | 3 | 4 | 5 | 6 | 7 | 8 | 9
11
$10 $8
4–8% rise in $10 and volume and price drop below $8 price point
Box Score: 2016 Summary Forecastcontinued
Demand ▸ Per capita consumption of wine in the U.S. will tempo-rarily reverse trend as millennials, who are consuming more craft spirits and beer, begin to replace retiring baby boomers, and as a larger consumer focus is placed on premium versus generic sales overall.
▸ Today, millennials are beginning to impact the lower price of premium sales. They are most visible in the $8–$14 red blend category but will trend higher as their income allows.
▸ Millennials are more open to world wines compared to baby boomers at the same time in their palate evolution.
▸ Growth in wine restaurant sales fell dramatically in 2015 across all premium price points. We expect that to stabilize in 2016.
▸ The Gen X cohort will surpass the baby boomer cohort around the year 2021 to become the largest fine wine consumer demographic in the U.S. A short five years later, by 2026, the millennial cohort will surpass the Gen X cohort to become the largest fine wine consuming cohort.
▸ The young consumer is giving blends a chance and, from our view, is taking a page from the mature cohort who placed their trust in brand versus varietal. That has implications for producers that have leaned on varietal labeling for developing a brand identity.
▸ The lowest price generic segment that appealed to the entry-level consumers of the 1960s has permanently lost its appeal. According to wine brokers with whom we’ve spoken, there are no producing countries show-ing interest in that segment today.
▸ We will see decline and stagnation in wine sold by volume as the premiumization trend continues to strengthen and wine by volume continues to lose favor. The $3–$6 segment appears most at risk. ◻
Introduction | 1 | 2 Box Score: 2016 Summ
ary Forecast | 3 | 4 | 5 | 6 | 7 | 8 | 9
12
Per capita consumption will temporarily reverse trend as millennials, who are consuming more craft spirits and beer, begin to replace retiring baby boomers.
Introduction | 1 | 2 Box Score: 2016 Summ
ary Forecast | 3 | 4 | 5 | 6 | 7 | 8 | 9
13
Larry: [Larry jogs out to the mound to break up a players’ conference] Excuse me, but what the hell’s going on out here?
Crash Davis: Well, Nuke’s scared because his eyelids are jammed and his old man’s here. We need a live ... is it a live rooster? [Jose nods]
Crash Davis: We need a live rooster to take the curse off Jose’s glove, and nobody seems to know what to get Millie or Jimmy for their wedding present. [looks to the players]
Crash Davis: Is that about right? [the players nod] [looking at Larry again]
Crash Davis: We’re dealing with a lot of sh*t.
Larry: Okay, well, uh ... candlesticks always make a nice gift, and uh, maybe you could find out where she’s registered and maybe a place setting or maybe a silverware pattern. Okay, let’s get two! Go get ‘em.
3Introduction | 1 | 2 | 3 The League: W
orldwide Supply and Consum
ption Patterns | 4 | 5 | 6 | 7 | 8 | 9
14
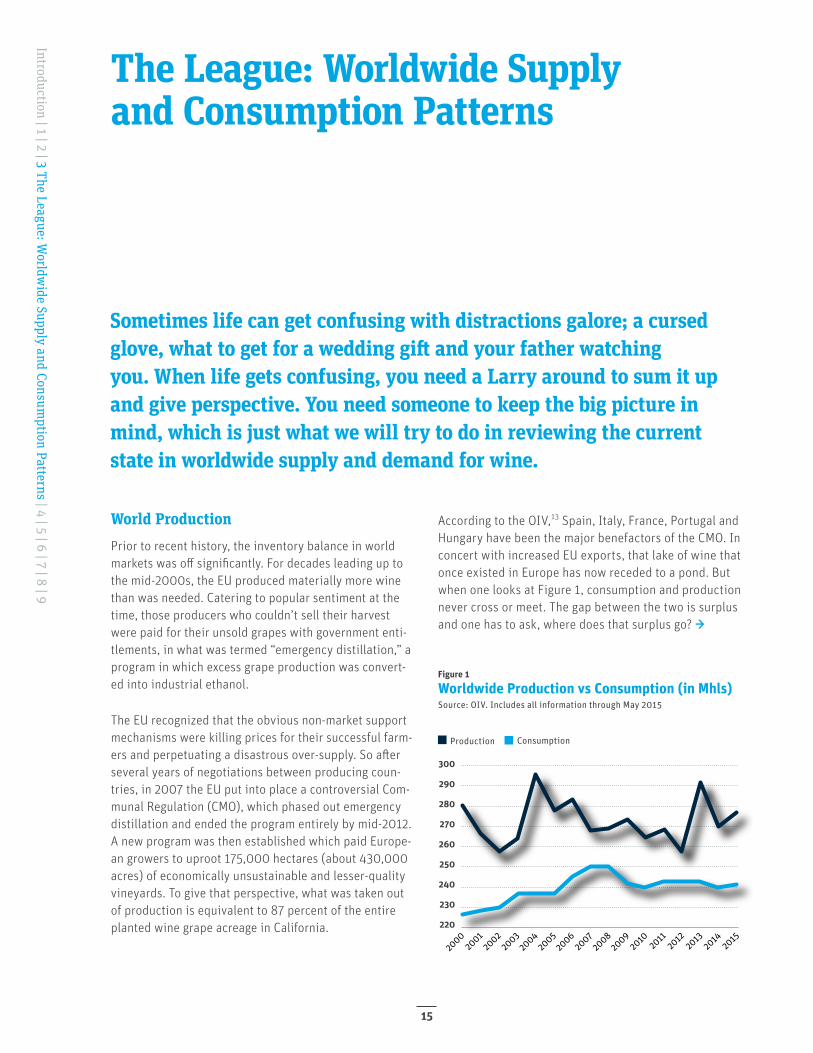
Production Consumption
Figure 1
Worldwide Production vs Consumption (in Mhls)Source: OIV. Includes all information through May 2015
220
230
240
250
260
270
280
290
300
2000
2001
2002
2003
2004
2005
2006
2007
2008
2009
2010
2011
2012
2013
2014
2015
Sometimes life can get confusing with distractions galore; a cursed glove, what to get for a wedding gift and your father watching you. When life gets confusing, you need a Larry around to sum it up and give perspective. You need someone to keep the big picture in mind, which is just what we will try to do in reviewing the current state in worldwide supply and demand for wine.
The League: Worldwide Supply and Consumption Patterns
World ProductionPrior to recent history, the inventory balance in world markets was off significantly. For decades leading up to the mid-2000s, the EU produced materially more wine than was needed. Catering to popular sentiment at the time, those producers who couldn’t sell their harvest were paid for their unsold grapes with government enti-tlements, in what was termed “emergency distillation,” a program in which excess grape production was convert-ed into industrial ethanol.
The EU recognized that the obvious non-market support mechanisms were killing prices for their successful farm-ers and perpetuating a disastrous over-supply. So after several years of negotiations between producing coun-tries, in 2007 the EU put into place a controversial Com-munal Regulation (CMO), which phased out emergency distillation and ended the program entirely by mid-2012. A new program was then established which paid Europe-an growers to uproot 175,000 hectares (about 430,000 acres) of economically unsustainable and lesser-quality vineyards. To give that perspective, what was taken out of production is equivalent to 87 percent of the entire planted wine grape acreage in California.
According to the OIV,13 Spain, Italy, France, Portugal and Hungary have been the major benefactors of the CMO. In concert with increased EU exports, that lake of wine that once existed in Europe has now receded to a pond. But when one looks at Figure 1, consumption and production never cross or meet. The gap between the two is surplus and one has to ask, where does that surplus go? →
Introduction | 1 | 2 | 3 The League: Worldw
ide Supply and Consumption Patterns | 4 | 5 | 6 | 7 | 8 | 9
15
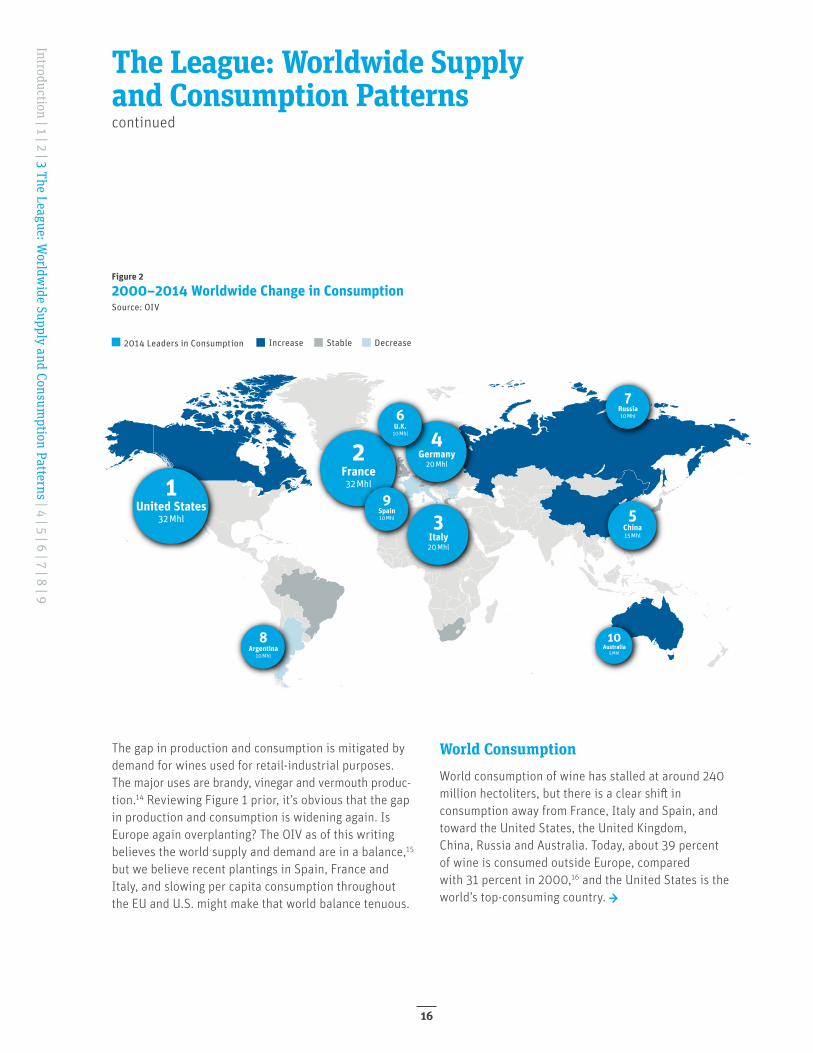
Figure 2
2000–2014 Worldwide Change in ConsumptionSource: OIV
2014 Leaders in Consumption Increase Stable Decrease
1United States
32Mhl
2France32Mhl
4Germany
20Mhl
5China15Mhl
7Russia10Mhl
10Australia
5Mhl
9Spain10Mhl
8Argentina
10Mhl
6U.K.10Mhl
3Italy20Mhl
The League: Worldwide Supply and Consumption Patternscontinued
The gap in production and consumption is mitigated by demand for wines used for retail-industrial purposes. The major uses are brandy, vinegar and vermouth produc- tion.14 Reviewing Figure 1 prior, it’s obvious that the gap in production and consumption is widening again. Is Europe again overplanting? The OIV as of this writing believes the world supply and demand are in a balance,15 but we believe recent plantings in Spain, France and Italy, and slowing per capita consumption throughout the EU and U.S. might make that world balance tenuous.
World ConsumptionWorld consumption of wine has stalled at around 240 million hectoliters, but there is a clear shift in consumption away from France, Italy and Spain, and toward the United States, the United Kingdom, China, Russia and Australia. Today, about 39 percent of wine is consumed outside Europe, compared with 31 percent in 2000,16 and the United States is the world’s top-consuming country. →
Introduction | 1 | 2 | 3 The League: Worldw
ide Supply and Consumption Patterns | 4 | 5 | 6 | 7 | 8 | 9
16
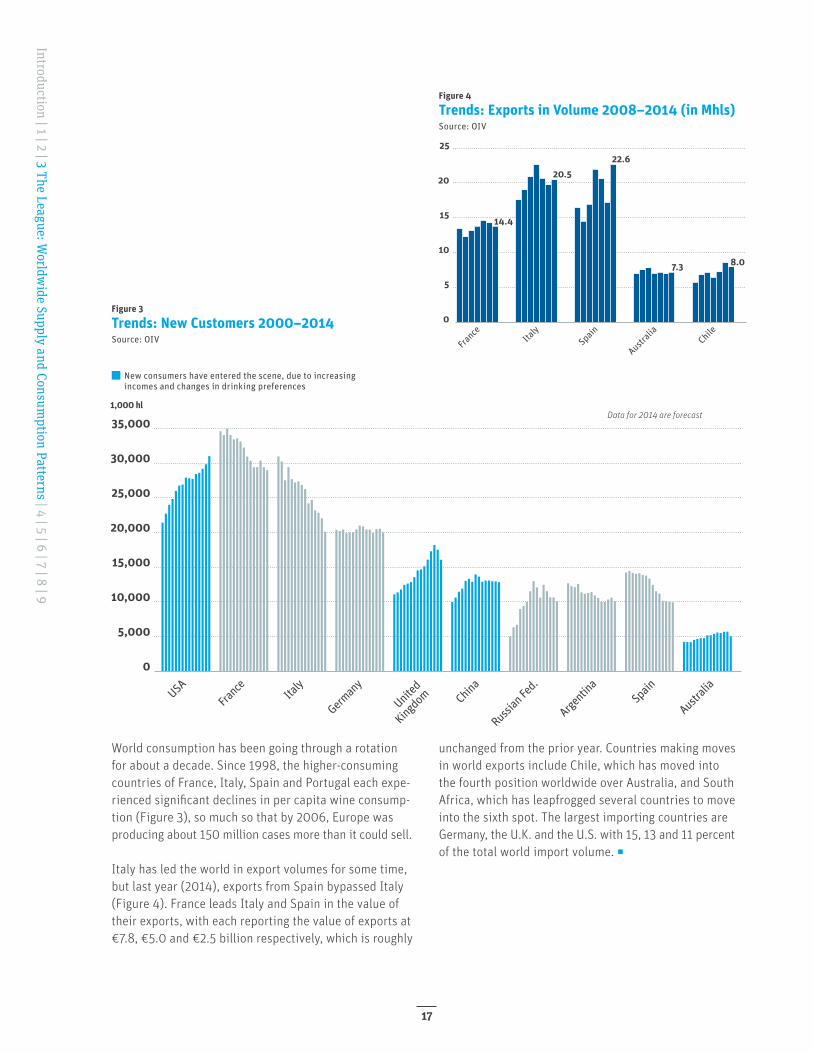
Figure 3
Trends: New Customers 2000–2014Source: OIV
Figure 4
Trends: Exports in Volume 2008–2014 (in Mhls)Source: OIV
5
10
15
20
25
0
France
Italy
Spain
Australi
aChile
14.4
20.522.6
7.3 8.0
New consumers have entered the scene, due to increasing incomes and changes in drinking preferences
France Ita
lySp
ain
Austral
ia
German
yUSA
United
Kingdom
Russian
Fed.
Argenti
naChin
a
40,000
35,000
30,000
25,000
20,000
15,000
10,000
5,000
0
1,000 hlData for 2014 are forecast
World consumption has been going through a rotation for about a decade. Since 1998, the higher-consuming countries of France, Italy, Spain and Portugal each expe-rienced significant declines in per capita wine consump-tion (Figure 3), so much so that by 2006, Europe was producing about 150 million cases more than it could sell.
Italy has led the world in export volumes for some time, but last year (2014), exports from Spain bypassed Italy (Figure 4). France leads Italy and Spain in the value of their exports, with each reporting the value of exports at €7.8, €5.0 and €2.5 billion respectively, which is roughly
unchanged from the prior year. Countries making moves in world exports include Chile, which has moved into the fourth position worldwide over Australia, and South Africa, which has leapfrogged several countries to move into the sixth spot. The largest importing countries are Germany, the U.K. and the U.S. with 15, 13 and 11 percent of the total world import volume. ◻
Introduction | 1 | 2 | 3 The League: Worldw
ide Supply and Consumption Patterns | 4 | 5 | 6 | 7 | 8 | 9
17
Annie Savoy: The world is made for people who aren’t cursed with self-awareness.
This is one of Annie’s unique views. Some-one who is unaware walks around in his or her own world. But the world today doesn’t stand for the unaware. They get run over
like a collision at home plate.17 If you want to succeed, you need to be smart, lucky, work hard and learn the lessons on how to be a pro from the vets around you.
4History of the Game
Introduction | 1 | 2 | 3 | 4 History of the Gam
e | 5 | 6 | 7 | 8 | 9
18
History has a thousand lessons, yet many even in the business don’t know the history of wine in America, so this year we are taking a different path with the report and spending time talking about how we got to 2016 as a commercial industry. While interesting in and of itself, the changes and trends in this business are long-lived and our predictions are much more impactful when one considers them in the context of historic industry events.
1800s–Today
Introduction | 1 | 2 | 3 | 4 History of the Gam
e | 5 | 6 | 7 | 8 | 9
19
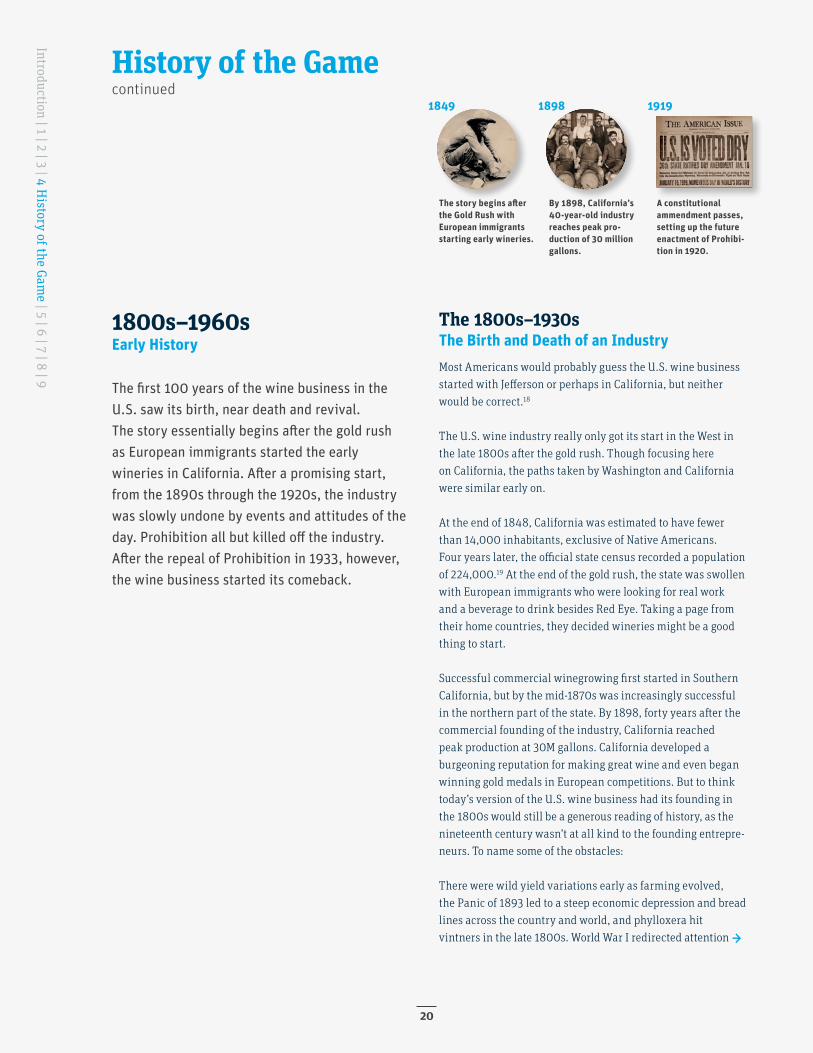
The story begins after the Gold Rush with European immigrants starting early wineries.
A constitutional ammendment passes, setting up the future enactment of Prohibi-tion in 1920.
By 1898, California’s 40-year-old industry reaches peak pro-duction of 30 million gallons.
1849 1898 1919
1800s–1960sEarly History
The 1800s–1930s The Birth and Death of an IndustryMost Americans would probably guess the U.S. wine business started with Jefferson or perhaps in California, but neither would be correct.18
The U.S. wine industry really only got its start in the West in the late 1800s after the gold rush. Though focusing here on California, the paths taken by Washington and California were similar early on.
At the end of 1848, California was estimated to have fewer than 14,000 inhabitants, exclusive of Native Americans. Four years later, the official state census recorded a population of 224,000.19 At the end of the gold rush, the state was swollen with European immigrants who were looking for real work and a beverage to drink besides Red Eye. Taking a page from their home countries, they decided wineries might be a good thing to start.
Successful commercial winegrowing first started in Southern California, but by the mid-1870s was increasingly successful in the northern part of the state. By 1898, forty years after the commercial founding of the industry, California reached peak production at 30M gallons. California developed a burgeoning reputation for making great wine and even began winning gold medals in European competitions. But to think today’s version of the U.S. wine business had its founding in the 1800s would still be a generous reading of history, as the nineteenth century wasn’t at all kind to the founding entrepre-neurs. To name some of the obstacles:
There were wild yield variations early as farming evolved, the Panic of 1893 led to a steep economic depression and bread lines across the country and world, and phylloxera hit vintners in the late 1800s. World War I redirected attention →
History of the Gamecontinued
The first 100 years of the wine business in the U.S. saw its birth, near death and revival. The story essentially begins after the gold rush as European immigrants started the early wineries in California. After a promising start, from the 1890s through the 1920s, the industry was slowly undone by events and attitudes of the day. Prohibition all but killed off the industry. After the repeal of Prohibition in 1933, however, the wine business started its comeback.
Introduction | 1 | 2 | 3 | 4 History of the Gam
e | 5 | 6 | 7 | 8 | 9
20
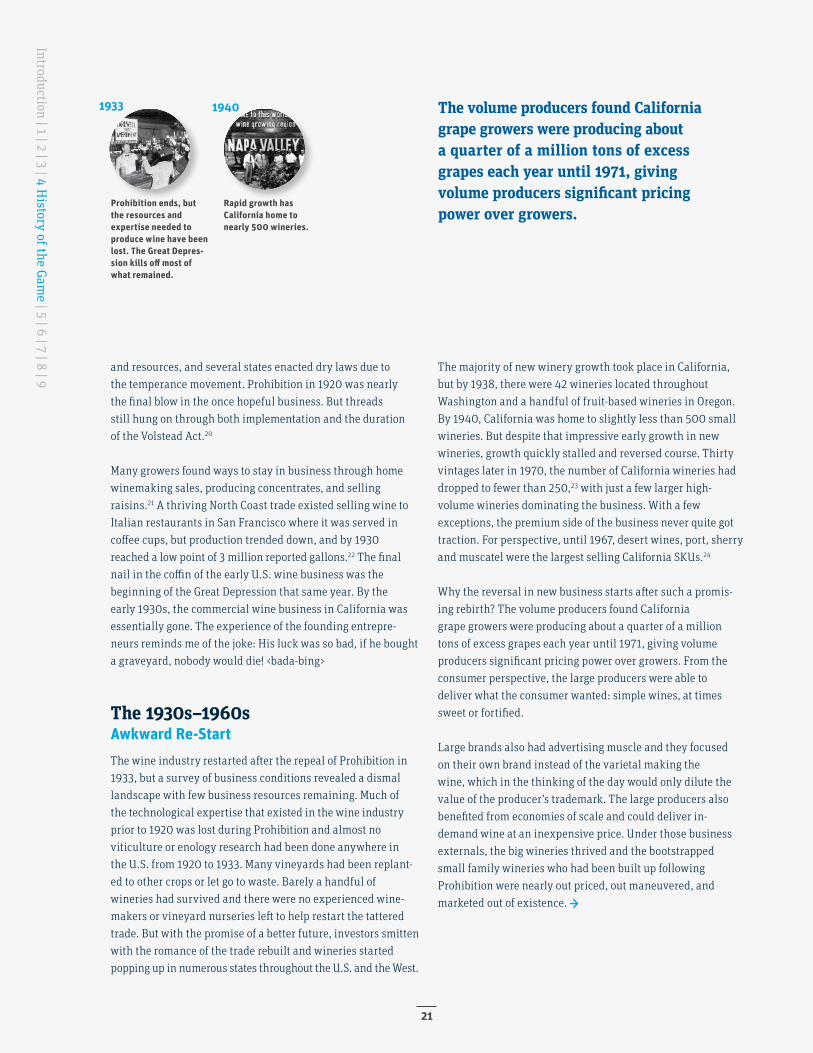
Prohibition ends, but the resources and expertise needed to produce wine have been lost. The Great Depres-sion kills off most of what remained.
Rapid growth has California home to nearly 500 wineries.
The volume producers found California grape growers were producing about a quarter of a million tons of excess grapes each year until 1971, giving volume producers significant pricing power over growers.
1933 1940
and resources, and several states enacted dry laws due to the temperance movement. Prohibition in 1920 was nearly the final blow in the once hopeful business. But threads still hung on through both implementation and the duration of the Volstead Act.20
Many growers found ways to stay in business through home winemaking sales, producing concentrates, and selling raisins.21 A thriving North Coast trade existed selling wine to Italian restaurants in San Francisco where it was served in coffee cups, but production trended down, and by 1930 reached a low point of 3 million reported gallons.22 The final nail in the coffin of the early U.S. wine business was the beginning of the Great Depression that same year. By the early 1930s, the commercial wine business in California was essentially gone. The experience of the founding entrepre-neurs reminds me of the joke: His luck was so bad, if he bought a graveyard, nobody would die! <bada-bing>
The 1930s–1960s Awkward Re-StartThe wine industry restarted after the repeal of Prohibition in 1933, but a survey of business conditions revealed a dismal landscape with few business resources remaining. Much of the technological expertise that existed in the wine industry prior to 1920 was lost during Prohibition and almost no viticulture or enology research had been done anywhere in the U.S. from 1920 to 1933. Many vineyards had been replant-ed to other crops or let go to waste. Barely a handful of wineries had survived and there were no experienced wine-makers or vineyard nurseries left to help restart the tattered trade. But with the promise of a better future, investors smitten with the romance of the trade rebuilt and wineries started popping up in numerous states throughout the U.S. and the West.
The majority of new winery growth took place in California, but by 1938, there were 42 wineries located throughout Washington and a handful of fruit-based wineries in Oregon. By 1940, California was home to slightly less than 500 small wineries. But despite that impressive early growth in new wineries, growth quickly stalled and reversed course. Thirty vintages later in 1970, the number of California wineries had dropped to fewer than 250,23 with just a few larger high- volume wineries dominating the business. With a few exceptions, the premium side of the business never quite got traction. For perspective, until 1967, desert wines, port, sherry and muscatel were the largest selling California SKUs.24
Why the reversal in new business starts after such a promis-ing rebirth? The volume producers found California grape growers were producing about a quarter of a million tons of excess grapes each year until 1971, giving volume producers significant pricing power over growers. From the consumer perspective, the large producers were able to deliver what the consumer wanted: simple wines, at times sweet or fortified.
Large brands also had advertising muscle and they focused on their own brand instead of the varietal making the wine, which in the thinking of the day would only dilute the value of the producer’s trademark. The large producers also benefited from economies of scale and could deliver in- demand wine at an inexpensive price. Under those business externals, the big wineries thrived and the bootstrapped small family wineries who had been built up following Prohibition were nearly out priced, out maneuvered, and marketed out of existence. →
Introduction | 1 | 2 | 3 | 4 History of the Gam
e | 5 | 6 | 7 | 8 | 9
21
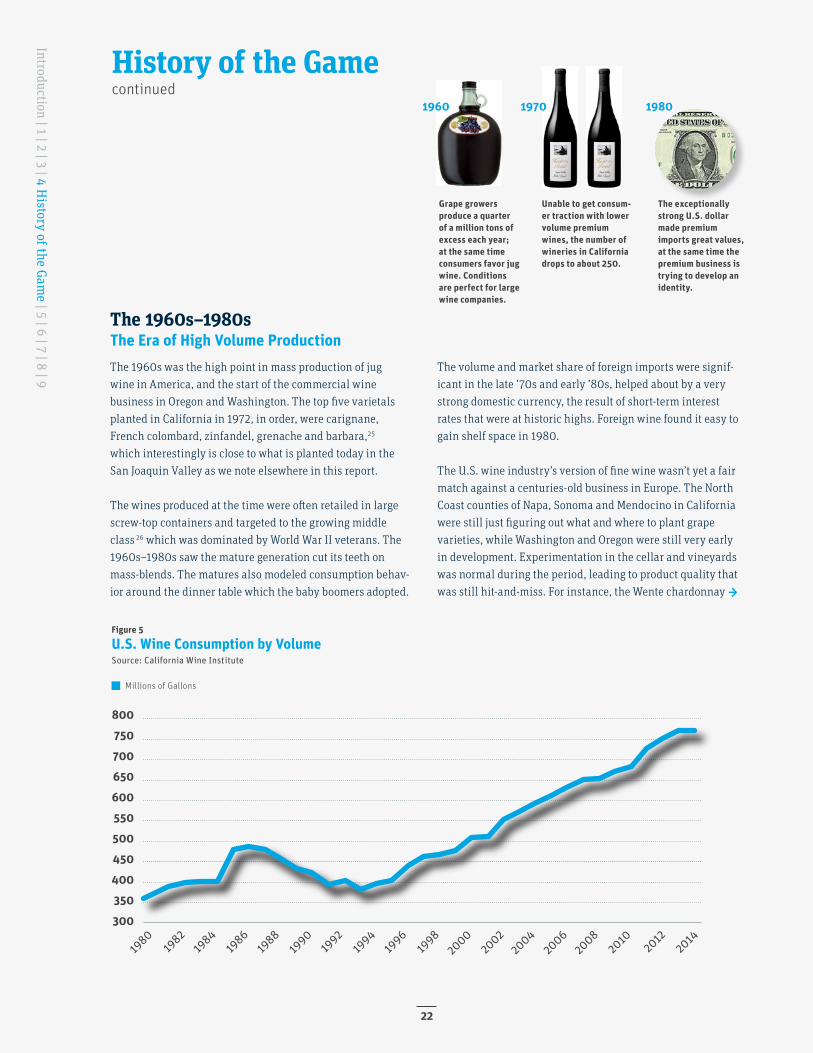
Figure 5
U.S. Wine Consumption by VolumeSource: California Wine Institute
Millions of Gallons
800
750
700
650
600
550
500
450
400
350
300
1980
1984
1988
1992
1996
2000
2004
2008
2012
1982
1986
1990
1994
1998
2002
2006
2010
2014
Grape growers produce a quarter of a million tons of excess each year; at the same time consumers favor jug wine. Conditions are perfect for large wine companies.
Unable to get consum-er traction with lower volume premium wines, the number of wineries in California drops to about 250.
The exceptionally strong U.S. dollar made premium imports great values, at the same time the premium business is trying to develop an identity.
The 1960s–1980s The Era of High Volume ProductionThe 1960s was the high point in mass production of jug wine in America, and the start of the commercial wine business in Oregon and Washington. The top five varietals planted in California in 1972, in order, were carignane, French colombard, zinfandel, grenache and barbara,25 which interestingly is close to what is planted today in the San Joaquin Valley as we note elsewhere in this report.
The wines produced at the time were often retailed in large screw-top containers and targeted to the growing middle class 26 which was dominated by World War II veterans. The 1960s–1980s saw the mature generation cut its teeth on mass-blends. The matures also modeled consumption behav-ior around the dinner table which the baby boomers adopted.
The volume and market share of foreign imports were signif-icant in the late ’70s and early ’80s, helped about by a very strong domestic currency, the result of short-term interest rates that were at historic highs. Foreign wine found it easy to gain shelf space in 1980.
The U.S. wine industry’s version of fine wine wasn’t yet a fair match against a centuries-old business in Europe. The North Coast counties of Napa, Sonoma and Mendocino in California were still just figuring out what and where to plant grape varieties, while Washington and Oregon were still very early in development. Experimentation in the cellar and vineyards was normal during the period, leading to product quality that was still hit-and-miss. For instance, the Wente chardonnay →
History of the Gamecontinued
1960 1970 1980
Introduction | 1 | 2 | 3 | 4 History of the Gam
e | 5 | 6 | 7 | 8 | 9
22
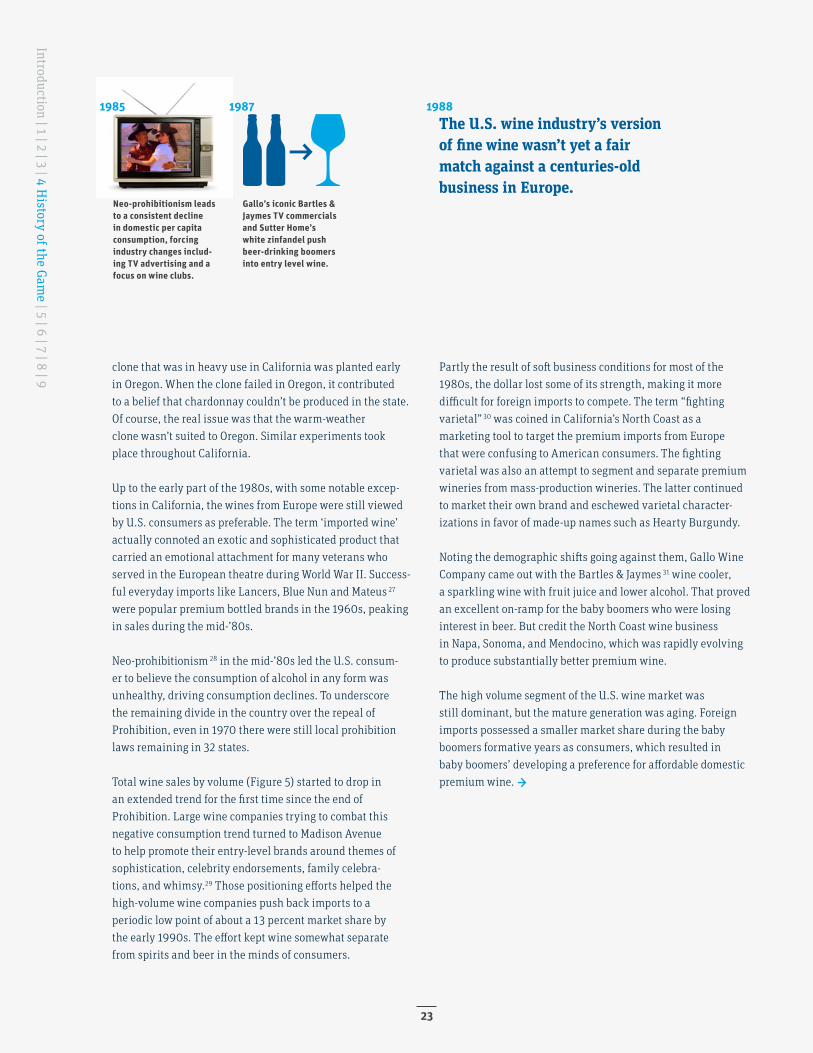
Neo-prohibitionism leads to a consistent decline in domestic per capita consumption, forcing industry changes includ-ing TV advertising and a focus on wine clubs.
Gallo’s iconic Bartles & Jaymes TV commercials and Sutter Home’s white zinfandel push beer-drinking boomers into entry level wine.
The U.S. wine industry’s version of fine wine wasn’t yet a fair match against a centuries-old business in Europe.
clone that was in heavy use in California was planted early in Oregon. When the clone failed in Oregon, it contributed to a belief that chardonnay couldn’t be produced in the state. Of course, the real issue was that the warm-weather clone wasn’t suited to Oregon. Similar experiments took place throughout California.
Up to the early part of the 1980s, with some notable excep-tions in California, the wines from Europe were still viewed by U.S. consumers as preferable. The term ‘imported wine’ actually connoted an exotic and sophisticated product that carried an emotional attachment for many veterans who served in the European theatre during World War II. Success-ful everyday imports like Lancers, Blue Nun and Mateus 27 were popular premium bottled brands in the 1960s, peaking in sales during the mid-’80s.
Neo-prohibitionism 28 in the mid-’80s led the U.S. consum- er to believe the consumption of alcohol in any form was unhealthy, driving consumption declines. To underscore the remaining divide in the country over the repeal of Prohibition, even in 1970 there were still local prohibition laws remaining in 32 states.
Total wine sales by volume (Figure 5) started to drop in an extended trend for the first time since the end of Prohibition. Large wine companies trying to combat this negative consumption trend turned to Madison Avenue to help promote their entry-level brands around themes of sophistication, celebrity endorsements, family celebra- tions, and whimsy.29 Those positioning efforts helped the high-volume wine companies push back imports to a periodic low point of about a 13 percent market share by the early 1990s. The effort kept wine somewhat separate from spirits and beer in the minds of consumers.
Partly the result of soft business conditions for most of the 1980s, the dollar lost some of its strength, making it more difficult for foreign imports to compete. The term “fighting varietal” 30 was coined in California’s North Coast as a marketing tool to target the premium imports from Europe that were confusing to American consumers. The fighting varietal was also an attempt to segment and separate premium wineries from mass-production wineries. The latter continued to market their own brand and eschewed varietal character- izations in favor of made-up names such as Hearty Burgundy.
Noting the demographic shifts going against them, Gallo Wine Company came out with the Bartles & Jaymes 31 wine cooler, a sparkling wine with fruit juice and lower alcohol. That proved an excellent on-ramp for the baby boomers who were losing interest in beer. But credit the North Coast wine business in Napa, Sonoma, and Mendocino, which was rapidly evolving to produce substantially better premium wine.
The high volume segment of the U.S. wine market was still dominant, but the mature generation was aging. Foreign imports possessed a smaller market share during the baby boomers formative years as consumers, which resulted in baby boomers’ developing a preference for affordable domestic premium wine. →
1985 1987 1988
Introduction | 1 | 2 | 3 | 4 History of the Gam
e | 5 | 6 | 7 | 8 | 9
23
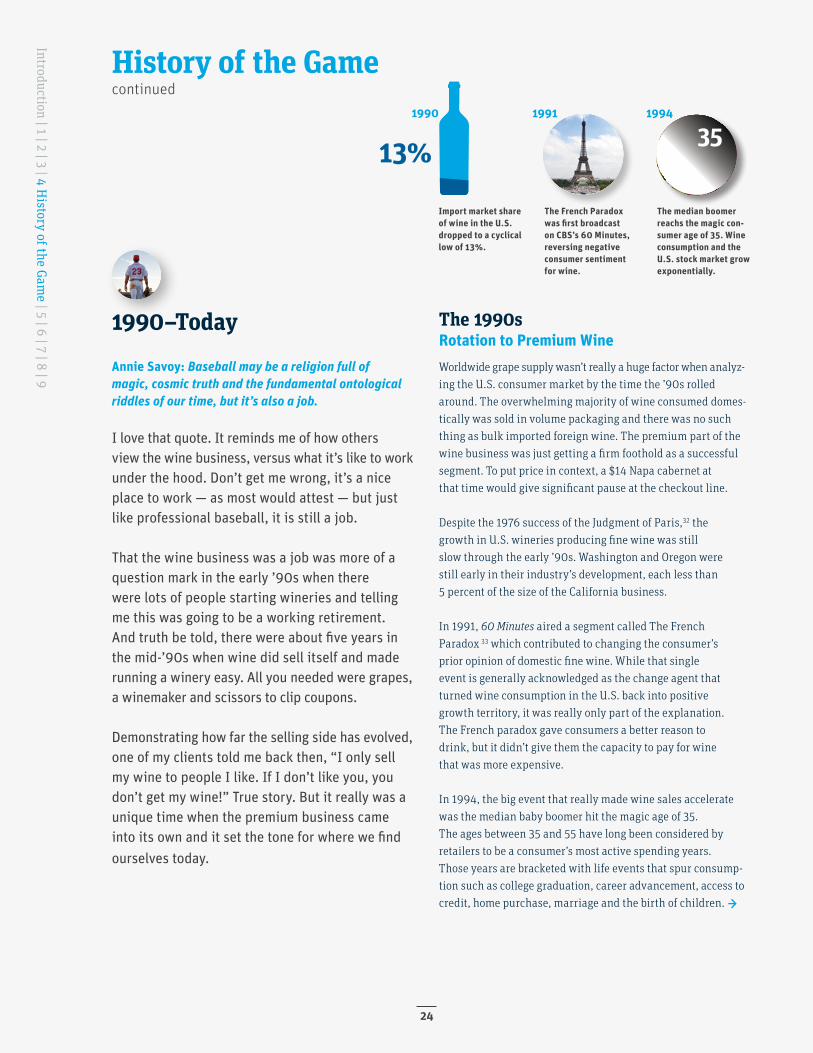
The median boomer reachs the magic con-sumer age of 35. Wine consumption and the U.S. stock market grow exponentially.
Import market share of wine in the U.S. dropped to a cyclical low of 13%.
19941990
The French Paradox was first broadcast on CBS’s 60 Minutes, reversing negative consumer sentiment for wine.
1991
Annie Savoy: Baseball may be a religion full of magic, cosmic truth and the fundamental ontological riddles of our time, but it’s also a job.
I love that quote. It reminds me of how others view the wine business, versus what it’s like to work under the hood. Don’t get me wrong, it’s a nice place to work — as most would attest — but just like professional baseball, it is still a job.
That the wine business was a job was more of a question mark in the early ’90s when there were lots of people starting wineries and telling me this was going to be a working retirement. And truth be told, there were about five years in the mid-’90s when wine did sell itself and made running a winery easy. All you needed were grapes, a winemaker and scissors to clip coupons.
Demonstrating how far the selling side has evolved, one of my clients told me back then, “I only sell my wine to people I like. If I don’t like you, you don’t get my wine!” True story. But it really was a unique time when the premium business came into its own and it set the tone for where we find ourselves today.
The 1990s Rotation to Premium WineWorldwide grape supply wasn’t really a huge factor when analyz- ing the U.S. consumer market by the time the ’90s rolled around. The overwhelming majority of wine consumed domes-tically was sold in volume packaging and there was no such thing as bulk imported foreign wine. The premium part of the wine business was just getting a firm foothold as a successful segment. To put price in context, a $14 Napa cabernet at that time would give significant pause at the checkout line.
Despite the 1976 success of the Judgment of Paris,32 the growth in U.S. wineries producing fine wine was still slow through the early ’90s. Washington and Oregon were still early in their industry’s development, each less than 5 percent of the size of the California business.
In 1991, 60 Minutes aired a segment called The French Paradox 33 which contributed to changing the consumer’s prior opinion of domestic fine wine. While that single event is generally acknowledged as the change agent that turned wine consumption in the U.S. back into positive growth territory, it was really only part of the explanation. The French paradox gave consumers a better reason to drink, but it didn’t give them the capacity to pay for wine that was more expensive.
In 1994, the big event that really made wine sales accelerate was the median baby boomer hit the magic age of 35. The ages between 35 and 55 have long been considered by retailers to be a consumer’s most active spending years. Those years are bracketed with life events that spur consump-tion such as college graduation, career advancement, access to credit, home purchase, marriage and the birth of children. →
1990–Today
13% 35
History of the Gamecontinued
Introduction | 1 | 2 | 3 | 4 History of the Gam
e | 5 | 6 | 7 | 8 | 9
24
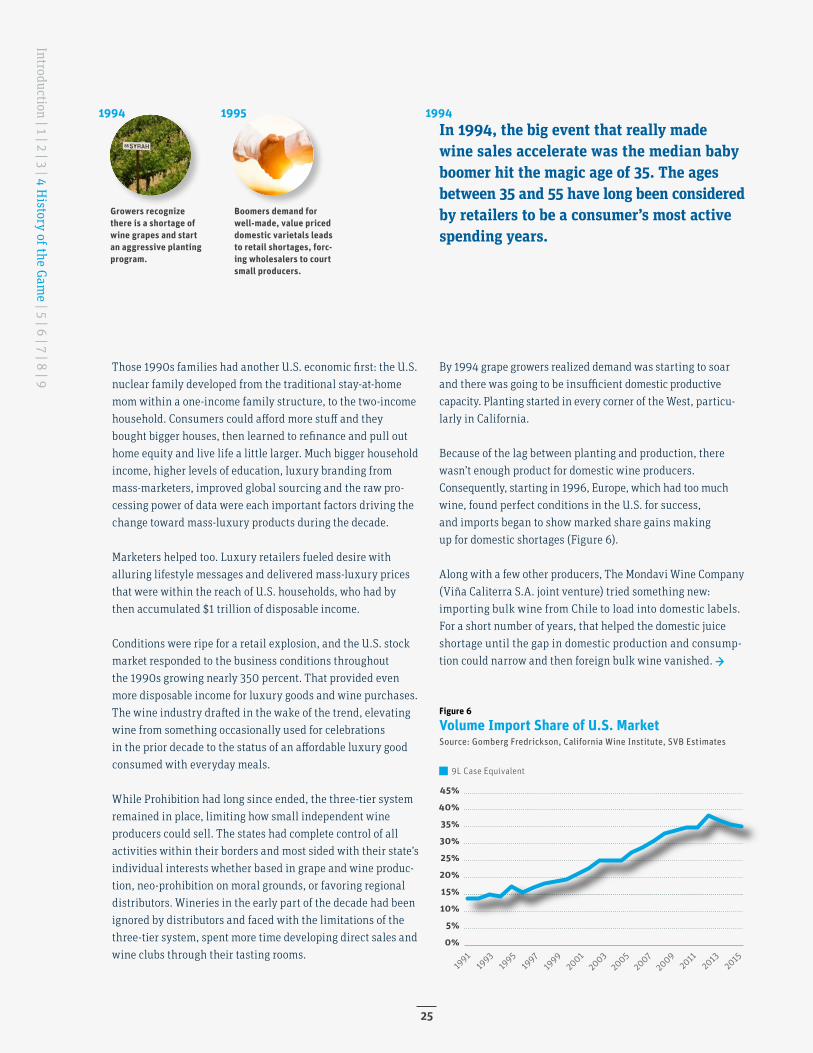
Figure 6
Volume Import Share of U.S. Market Source: Gomberg Fredrickson, California Wine Institute, SVB Estimates
45%
40%
35%
30%
25%
20%
15%
10%
5%
0%
1991
1993
1995
1997
1999
2001
2003
2005
2007
2009
2011
2013
2015
9L Case Equivalent
Growers recognize there is a shortage of wine grapes and start an aggressive planting program.
Boomers demand for well-made, value priced domestic varietals leads to retail shortages, forc-ing wholesalers to court small producers.
In 1994, the big event that really made wine sales accelerate was the median baby boomer hit the magic age of 35. The ages between 35 and 55 have long been considered by retailers to be a consumer’s most active spending years.
1994 1995 1994
Those 1990s families had another U.S. economic first: the U.S. nuclear family developed from the traditional stay-at-home mom within a one-income family structure, to the two-income household. Consumers could afford more stuff and they bought bigger houses, then learned to refinance and pull out home equity and live life a little larger. Much bigger household income, higher levels of education, luxury branding from mass-marketers, improved global sourcing and the raw pro-cessing power of data were each important factors driving the change toward mass-luxury products during the decade.
Marketers helped too. Luxury retailers fueled desire with alluring lifestyle messages and delivered mass-luxury prices that were within the reach of U.S. households, who had by then accumulated $1 trillion of disposable income.
Conditions were ripe for a retail explosion, and the U.S. stock market responded to the business conditions throughout the 1990s growing nearly 350 percent. That provided even more disposable income for luxury goods and wine purchases. The wine industry drafted in the wake of the trend, elevating wine from something occasionally used for celebrations in the prior decade to the status of an affordable luxury good consumed with everyday meals.
While Prohibition had long since ended, the three-tier system remained in place, limiting how small independent wine producers could sell. The states had complete control of all activities within their borders and most sided with their state’s individual interests whether based in grape and wine produc-tion, neo-prohibition on moral grounds, or favoring regional distributors. Wineries in the early part of the decade had been ignored by distributors and faced with the limitations of the three-tier system, spent more time developing direct sales and wine clubs through their tasting rooms.
By 1994 grape growers realized demand was starting to soar and there was going to be insufficient domestic productive capacity. Planting started in every corner of the West, particu-larly in California.
Because of the lag between planting and production, there wasn’t enough product for domestic wine producers. Consequently, starting in 1996, Europe, which had too much wine, found perfect conditions in the U.S. for success, and imports began to show marked share gains making up for domestic shortages (Figure 6).
Along with a few other producers, The Mondavi Wine Company (Viña Caliterra S.A. joint venture) tried something new: importing bulk wine from Chile to load into domestic labels. For a short number of years, that helped the domestic juice shortage until the gap in domestic production and consump-tion could narrow and then foreign bulk wine vanished. →
Introduction | 1 | 2 | 3 | 4 History of the Gam
e | 5 | 6 | 7 | 8 | 9
25
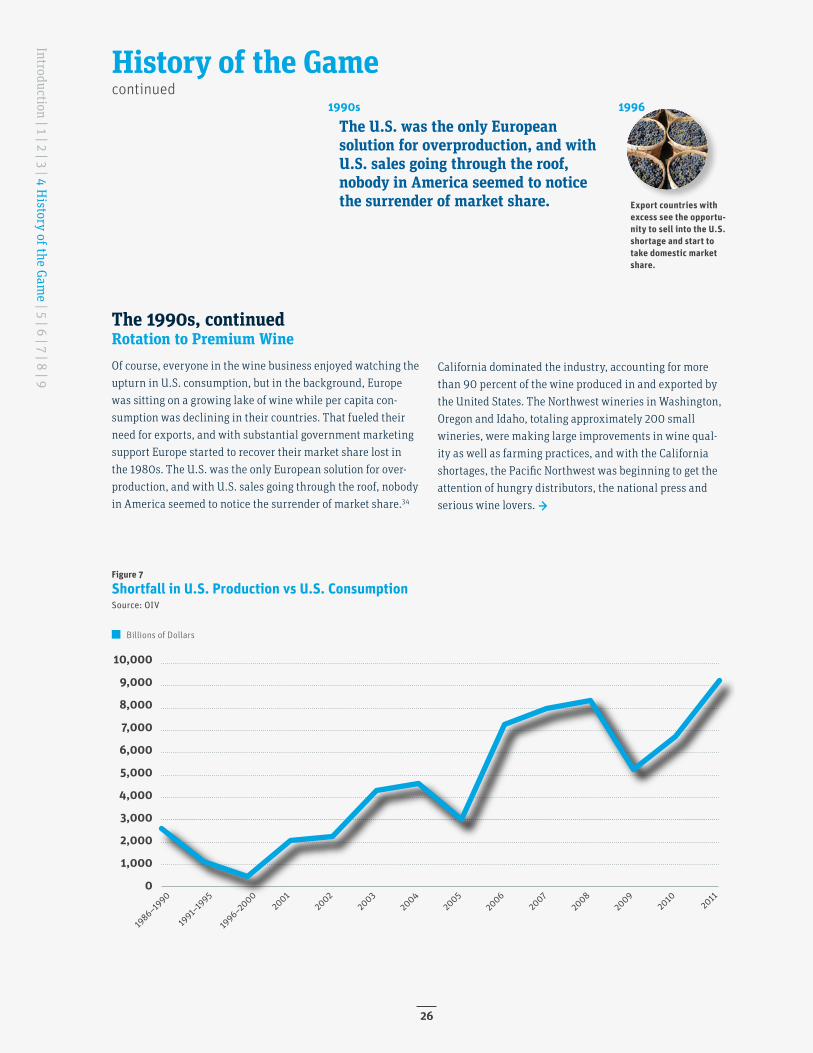
Figure 7
Shortfall in U.S. Production vs U.S. Consumption Source: OIV
Billions of Dollars
10,000
9,000
8,000
7,000
6,000
5,000
4,000
3,000
2,000
1,000
0
1986–19
90
1991–
1995
1996–20
0020
0120
0220
0320
0420
0520
0620
0720
0820
0920
1120
10
The U.S. was the only European solution for overproduction, and with U.S. sales going through the roof, nobody in America seemed to notice the surrender of market share.
19961990s
Export countries with excess see the opportu-nity to sell into the U.S. shortage and start to take domestic market share.
The 1990s, continuedRotation to Premium WineOf course, everyone in the wine business enjoyed watching the upturn in U.S. consumption, but in the background, Europe was sitting on a growing lake of wine while per capita con-sumption was declining in their countries. That fueled their need for exports, and with substantial government marketing support Europe started to recover their market share lost in the 1980s. The U.S. was the only European solution for over-production, and with U.S. sales going through the roof, nobody in America seemed to notice the surrender of market share.34
California dominated the industry, accounting for more than 90 percent of the wine produced in and exported by the United States. The Northwest wineries in Washington, Oregon and Idaho, totaling approximately 200 small wineries, were making large improvements in wine qual-ity as well as farming practices, and with the California shortages, the Pacific Northwest was beginning to get the attention of hungry distributors, the national press and serious wine lovers. →
History of the Gamecontinued
Introduction | 1 | 2 | 3 | 4 History of the Gam
e | 5 | 6 | 7 | 8 | 9
26
2000 20011999
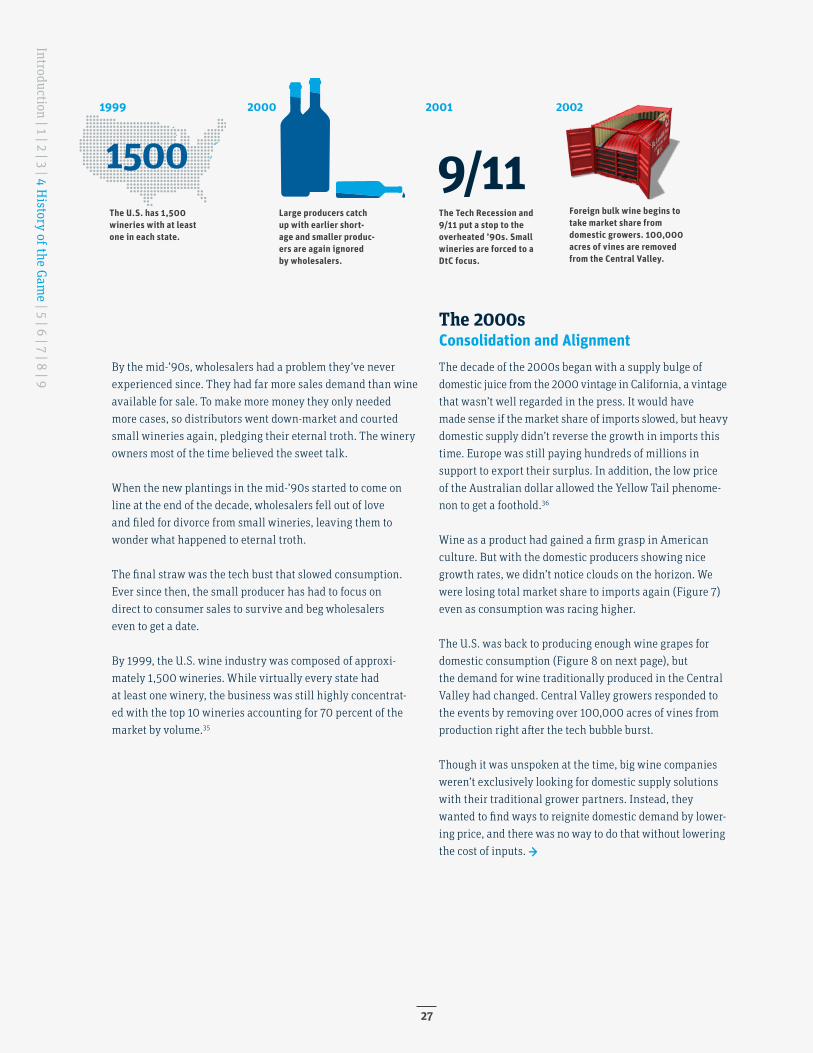
Large producers catch up with earlier short-age and smaller produc-ers are again ignored by wholesalers.
The U.S. has 1,500 wineries with at least one in each state.
The Tech Recession and 9/11 put a stop to the overheated ’90s. Small wineries are forced to a DtC focus.
2002
Foreign bulk wine begins to take market share from domestic growers. 100,000 acres of vines are removed from the Central Valley.
By the mid-’90s, wholesalers had a problem they’ve never experienced since. They had far more sales demand than wine available for sale. To make more money they only needed more cases, so distributors went down-market and courted small wineries again, pledging their eternal troth. The winery owners most of the time believed the sweet talk.
When the new plantings in the mid-’90s started to come on line at the end of the decade, wholesalers fell out of love and filed for divorce from small wineries, leaving them to wonder what happened to eternal troth.
The final straw was the tech bust that slowed consumption. Ever since then, the small producer has had to focus on direct to consumer sales to survive and beg wholesalers even to get a date.
By 1999, the U.S. wine industry was composed of approxi- mately 1,500 wineries. While virtually every state had at least one winery, the business was still highly concentrat-ed with the top 10 wineries accounting for 70 percent of the market by volume.35
The 2000s Consolidation and AlignmentThe decade of the 2000s began with a supply bulge of domestic juice from the 2000 vintage in California, a vintage that wasn’t well regarded in the press. It would have made sense if the market share of imports slowed, but heavy domestic supply didn’t reverse the growth in imports this time. Europe was still paying hundreds of millions in support to export their surplus. In addition, the low price of the Australian dollar allowed the Yellow Tail phenome-non to get a foothold.36
Wine as a product had gained a firm grasp in American culture. But with the domestic producers showing nice growth rates, we didn’t notice clouds on the horizon. We were losing total market share to imports again (Figure 7) even as consumption was racing higher.
The U.S. was back to producing enough wine grapes for domestic consumption (Figure 8 on next page), but the demand for wine traditionally produced in the Central Valley had changed. Central Valley growers responded to the events by removing over 100,000 acres of vines from production right after the tech bubble burst.
Though it was unspoken at the time, big wine companies weren’t exclusively looking for domestic supply solutions with their traditional grower partners. Instead, they wanted to find ways to reignite domestic demand by lower-ing price, and there was no way to do that without lowering the cost of inputs. →
9/111500
Introduction | 1 | 2 | 3 | 4 History of the Gam
e | 5 | 6 | 7 | 8 | 9
27
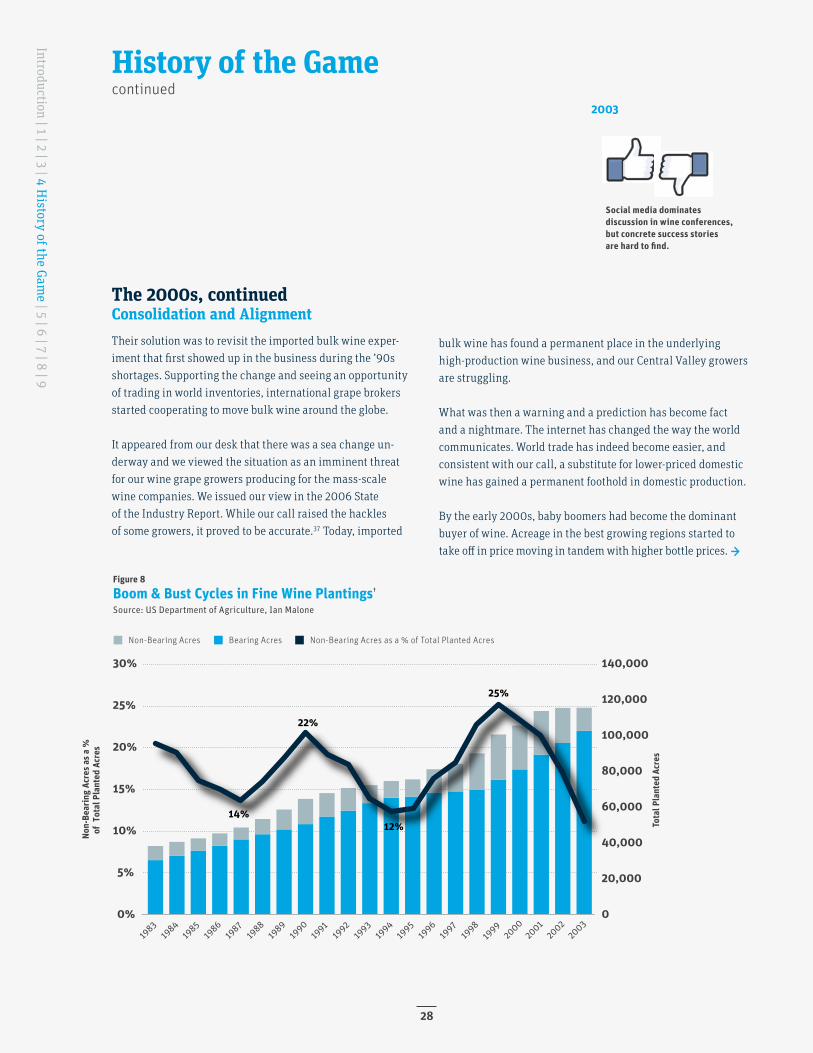
Figure 8
Boom & Bust Cycles in Fine Wine Plantings† Source: US Department of Agriculture, Ian Malone
12%
25%
22%
0
20,000
40,000
60,000
80,000
100,000
120,000
140,000
0%
5%
10%
15%
20%
25%
30%
1983
1984
1985
1986
1987
1988
1989
1990
1991
1992
1993
1994
1995
1996
1997
1998
1999
2000
2001
2002
2003
Tota
l Pla
nted
Acr
es
Non-
Bear
ing
Acre
s as a
%
of T
otal
Pla
nted
Acr
es
14%
Non-Bearing Acres Bearing Acres Non-Bearing Acres as a % of Total Planted Acres
2003
Social media dominates discussion in wine conferences, but concrete success stories are hard to find.
The 2000s, continuedConsolidation and AlignmentTheir solution was to revisit the imported bulk wine exper-iment that first showed up in the business during the ’90s shortages. Supporting the change and seeing an opportunity of trading in world inventories, international grape brokers started cooperating to move bulk wine around the globe.
It appeared from our desk that there was a sea change un-derway and we viewed the situation as an imminent threat for our wine grape growers producing for the mass-scale wine companies. We issued our view in the 2006 State of the Industry Report. While our call raised the hackles of some growers, it proved to be accurate.37 Today, imported
bulk wine has found a permanent place in the underlying high-production wine business, and our Central Valley growers are struggling.
What was then a warning and a prediction has become fact and a nightmare. The internet has changed the way the world communicates. World trade has indeed become easier, and consistent with our call, a substitute for lower-priced domestic wine has gained a permanent foothold in domestic production.
By the early 2000s, baby boomers had become the dominant buyer of wine. Acreage in the best growing regions started to take off in price moving in tandem with higher bottle prices. →
History of the Gamecontinued
Introduction | 1 | 2 | 3 | 4 History of the Gam
e | 5 | 6 | 7 | 8 | 9
28
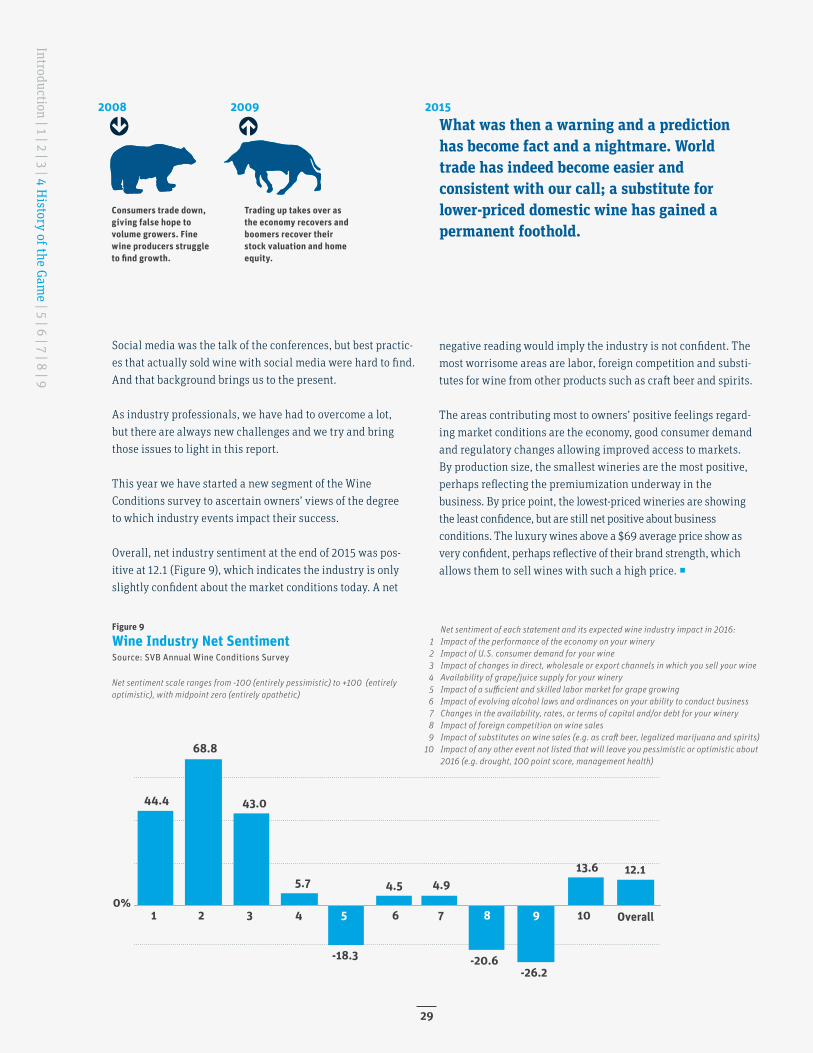
Figure 9
Wine Industry Net SentimentSource: SVB Annual Wine Conditions Survey
Net sentiment scale ranges from -100 (entirely pessimistic) to +100 (entirely optimistic), with midpoint zero (entirely apathetic)
Net sentiment of each statement and its expected wine industry impact in 2016: 1 Impact of the performance of the economy on your winery 2 Impact of U.S. consumer demand for your wine 3 Impact of changes in direct, wholesale or export channels in which you sell your wine 4 Availability of grape/juice supply for your winery 5 Impact of a sufficient and skilled labor market for grape growing 6 Impact of evolving alcohol laws and ordinances on your ability to conduct business 7 Changes in the availability, rates, or terms of capital and/or debt for your winery 8 Impact of foreign competition on wine sales 9 Impact of substitutes on wine sales (e.g. as craft beer, legalized marijuana and spirits) 10 Impact of any other event not listed that will leave you pessimistic or optimistic about 2016 (e.g. drought, 100 point score, management health)
0%1 2 3 4 5 6 7 8 9 10 Overall
44.4
68.8
43.0
5.7
-18.3
4.5 4.9
-20.6 -26.2
13.6 12.1
20152008 2009What was then a warning and a prediction has become fact and a nightmare. World trade has indeed become easier and consistent with our call; a substitute for lower-priced domestic wine has gained a permanent foothold.
Consumers trade down, giving false hope to volume growers. Fine wine producers struggle to find growth.
Trading up takes over as the economy recovers and boomers recover their stock valuation and home equity.
Social media was the talk of the conferences, but best practic-es that actually sold wine with social media were hard to find. And that background brings us to the present.
As industry professionals, we have had to overcome a lot, but there are always new challenges and we try and bring those issues to light in this report.
This year we have started a new segment of the Wine Conditions survey to ascertain owners’ views of the degree to which industry events impact their success.
Overall, net industry sentiment at the end of 2015 was pos-itive at 12.1 (Figure 9), which indicates the industry is only slightly confident about the market conditions today. A net
negative reading would imply the industry is not confident. The most worrisome areas are labor, foreign competition and substi-tutes for wine from other products such as craft beer and spirits.
The areas contributing most to owners’ positive feelings regard-ing market conditions are the economy, good consumer demand and regulatory changes allowing improved access to markets. By production size, the smallest wineries are the most positive, perhaps reflecting the premiumization underway in the business. By price point, the lowest-priced wineries are showing the least confidence, but are still net positive about business conditions. The luxury wines above a $69 average price show as very confident, perhaps reflective of their brand strength, which allows them to sell wines with such a high price. ◻
Introduction | 1 | 2 | 3 | 4 History of the Gam
e | 5 | 6 | 7 | 8 | 9
29

Larry: Sears sucks, Crash. Boy, I worked there once. Sold Lady Kenmores. Nasty, whoa, nasty.
5Introduction | 1 | 2 | 3 | 4 | 5 Park Concessions: Consum
ption, Demographics and Dem
and | 6 | 7 | 8 | 9
30
Remember Sears? When I grew up that brand meant quality, but as time passed, they couldn’t retain their image with new consumers. They needed to change, but brand change wasn’t easy. Some big wine companies have ended up in a similar place. They have been producing a lot of generic wine that has fallen out of favor, but they still have to feed their fixed overhead so they can’t produce in small lots. So what can they do? They are too big to make luxury wine aren’t they?
Park Concessions: Consumption, Demographics and Demand
What they do have is a war chest of money and a lot of smart business people. But producing interesting wines for tomorrow’s premium consumer will be a challenge for the large wine companies.
Changes to Consumption
The mature generation grew up during the Great Depres-sion.38 The matures ensuing behaviors such as thriftiness and monetary conservatism resulted from a lack of employment or ability to procure the bare neces-sities in life during their youth. Decades later, many still save everything and throw away nothing … ever.39 The same can’t be said for their children, the baby boomers.
After World War II, the mature generation had babies — lots of babies. With the rest of the industrialized society in ruins, the world came to the U.S. for manufacturing and materials. Our country experienced many golden years of prosperity and strong economic growth. The baby boomers were raised in a time of plenty, and due to their relative size, Madison Avenue marketed to their every
need. Without the same fear of financial failure as their parents, the baby boomers started to spend on goods and services at a historic clip, which drove GDP to new heights. They saved less, and as they entered the workforce in the 1970s, they began to spend ahead of their financial means by ramping up consumer credit.40
What is the life event that defines the up-and-coming millennial generation? Most will say it’s their exposure to the digital world — the first generation to be raised with computers. I don’t think that is what will define the generation any more than a color TV defined the baby boomers. Experiences define generations and their sub-sequent behaviors and preferences.
Some research now suggests that the millennials will be defined by their experience living through the Great Recession.41 Other issues will influence them as well, such as a decade-long zero interest rate environ-ment, no belief in Social Security for their retirement, delayed entry into the job market, loads of student debt and the slowdown in worldwide GDP. →
Park Concessions: Consumption, Demographics and Demand
Introduction | 1 | 2 | 3 | 4 | 5 Park Concessions: Consumption, Dem
ographics and Demand | 6 | 7 | 8 | 9
31
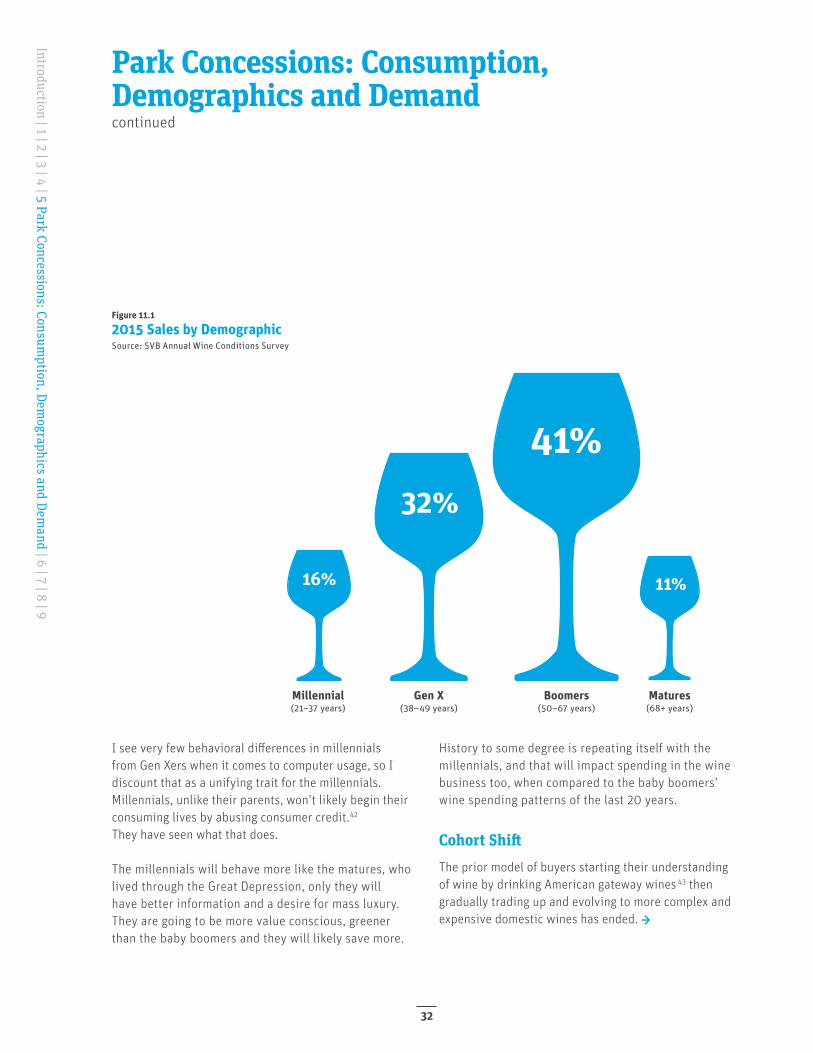
Figure 11.1
2015 Sales by DemographicSource: SVB Annual Wine Conditions Survey
41%32%
11%16%
Millennial(21–37 years)
Gen X(38–49 years)
Boomers(50–67 years)
Matures(68+ years)
Park Concessions: Consumption, Demographics and Demandcontinued
I see very few behavioral differences in millennials from Gen Xers when it comes to computer usage, so I discount that as a unifying trait for the millennials. Millennials, unlike their parents, won’t likely begin their consuming lives by abusing consumer credit.42 They have seen what that does.
The millennials will behave more like the matures, who lived through the Great Depression, only they will have better information and a desire for mass luxury. They are going to be more value conscious, greener than the baby boomers and they will likely save more.
History to some degree is repeating itself with the millennials, and that will impact spending in the wine business too, when compared to the baby boomers’ wine spending patterns of the last 20 years.
Cohort ShiftThe prior model of buyers starting their understanding of wine by drinking American gateway wines 43 then gradually trading up and evolving to more complex and expensive domestic wines has ended. →
Introduction | 1 | 2 | 3 | 4 | 5 Park Concessions: Consumption, Dem
ographics and Demand | 6 | 7 | 8 | 9
32
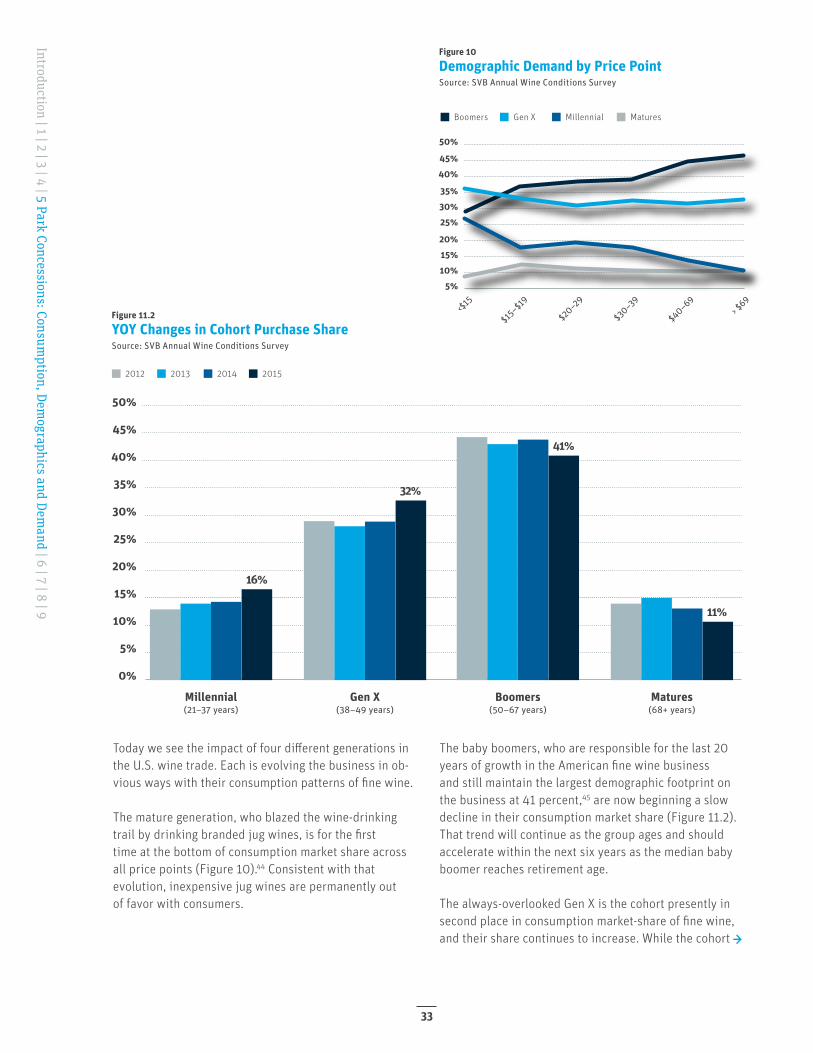
Figure 11.2
YOY Changes in Cohort Purchase ShareSource: SVB Annual Wine Conditions Survey
2012 2013 2014 2015
50%
45%
40%
35%
30%
25%
20%
15%
10%
5%
0%
16%
11%
32%
41%
Millennial(21–37 years)
Gen X(38–49 years)
Boomers(50–67 years)
Matures(68+ years)
Figure 10
Demographic Demand by Price PointSource: SVB Annual Wine Conditions Survey
5%
<$15
$15–$1
9
$20–29
$30–39
$40–69
> $69
10%15%20%
25%30%35%
40%45%
50%
Boomers Gen X Millennial Matures
Today we see the impact of four different generations in the U.S. wine trade. Each is evolving the business in ob-vious ways with their consumption patterns of fine wine.
The mature generation, who blazed the wine-drinking trail by drinking branded jug wines, is for the first time at the bottom of consumption market share across all price points (Figure 10).44 Consistent with that evolution, inexpensive jug wines are permanently out of favor with consumers.
The baby boomers, who are responsible for the last 20 years of growth in the American fine wine business and still maintain the largest demographic footprint on the business at 41 percent,45 are now beginning a slow decline in their consumption market share (Figure 11.2). That trend will continue as the group ages and should accelerate within the next six years as the median baby boomer reaches retirement age.
The always-overlooked Gen X is the cohort presently in second place in consumption market-share of fine wine, and their share continues to increase. While the cohort →
Introduction | 1 | 2 | 3 | 4 | 5 Park Concessions: Consumption, Dem
ographics and Demand | 6 | 7 | 8 | 9
33
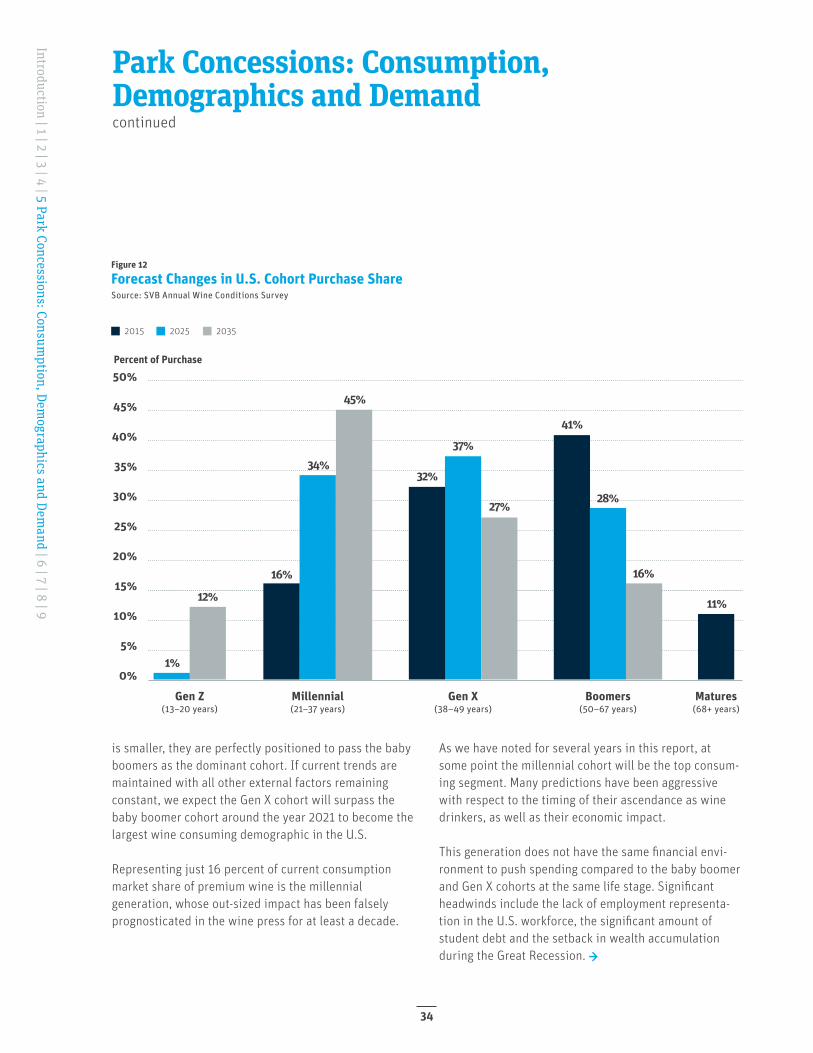
Figure 12
Forecast Changes in U.S. Cohort Purchase ShareSource: SVB Annual Wine Conditions Survey
2015 2025 2035
50%
45%
40%
35%
30%
25%
20%
15%
10%
5%
0%
Percent of Purchase
34%
45%
41%
37%
32%
27%28%
16%
11%12%
1%
16%
Gen Z(13–20 years)
Millennial(21–37 years)
Gen X(38–49 years)
Boomers(50–67 years)
Matures(68+ years)
Park Concessions: Consumption, Demographics and Demandcontinued
is smaller, they are perfectly positioned to pass the baby boomers as the dominant cohort. If current trends are maintained with all other external factors remaining constant, we expect the Gen X cohort will surpass the baby boomer cohort around the year 2021 to become the largest wine consuming demographic in the U.S.
Representing just 16 percent of current consumption market share of premium wine is the millennial generation, whose out-sized impact has been falsely prognosticated in the wine press for at least a decade.
As we have noted for several years in this report, at some point the millennial cohort will be the top consum-ing segment. Many predictions have been aggressive with respect to the timing of their ascendance as wine drinkers, as well as their economic impact.
This generation does not have the same financial envi-ronment to push spending compared to the baby boomer and Gen X cohorts at the same life stage. Significant headwinds include the lack of employment representa- tion in the U.S. workforce, the significant amount of student debt and the setback in wealth accumulation during the Great Recession. →
Introduction | 1 | 2 | 3 | 4 | 5 Park Concessions: Consumption, Dem
ographics and Demand | 6 | 7 | 8 | 9
34
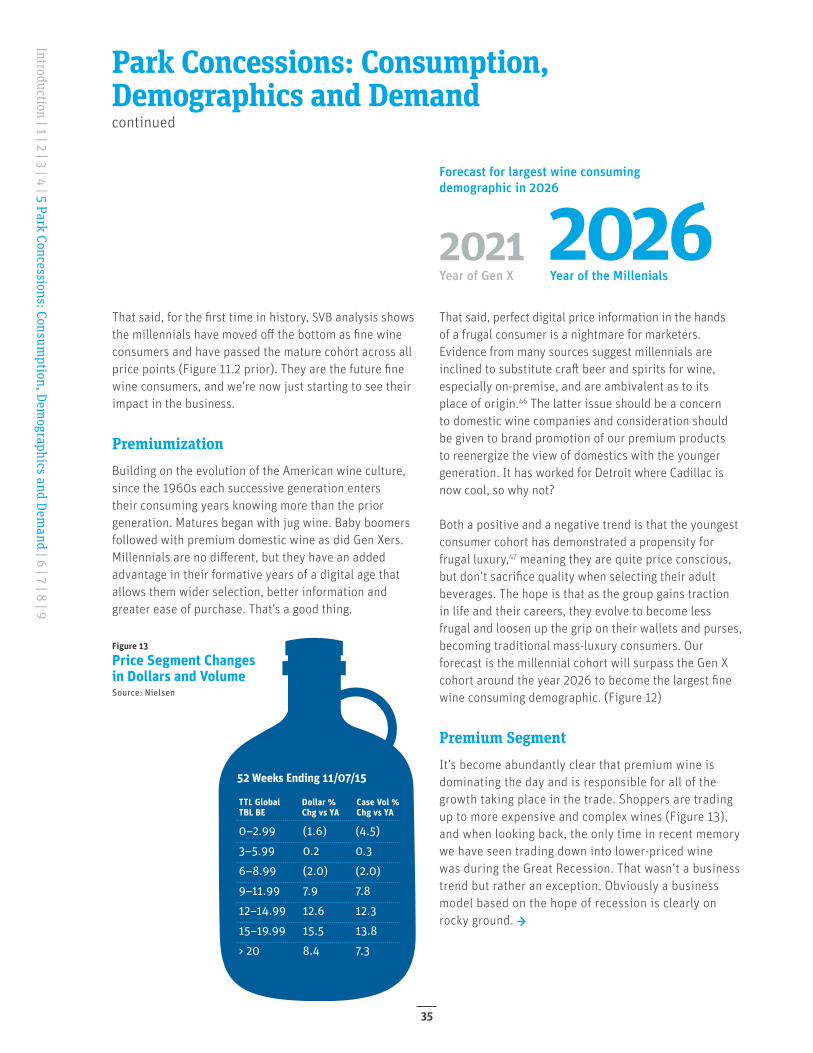
Figure 13
Price Segment Changes in Dollars and VolumeSource: Nielsen
TTL GlobalTBL BE
52 Weeks Ending 11/07/15
0–2.99
3–5.99
6–8.99
9–11.99
12–14.99
15–19.99
> 20
(1.6)
0.2
(2.0)
7.9
12.6
15.5
8.4
(4.5)
0.3
(2.0)
7.8
12.3
13.8
7.3
Dollar %Chg vs YA
Case Vol %Chg vs YA
Forecast for largest wine consuming demographic in 2026
Year of Gen X Year of the Millenials2021 2026
That said, for the first time in history, SVB analysis shows the millennials have moved off the bottom as fine wine consumers and have passed the mature cohort across all price points (Figure 11.2 prior). They are the future fine wine consumers, and we’re now just starting to see their impact in the business.
PremiumizationBuilding on the evolution of the American wine culture, since the 1960s each successive generation enters their consuming years knowing more than the prior generation. Matures began with jug wine. Baby boomers followed with premium domestic wine as did Gen Xers. Millennials are no different, but they have an added advantage in their formative years of a digital age that allows them wider selection, better information and greater ease of purchase. That’s a good thing.
That said, perfect digital price information in the hands of a frugal consumer is a nightmare for marketers. Evidence from many sources suggest millennials are inclined to substitute craft beer and spirits for wine, especially on-premise, and are ambivalent as to its place of origin.46 The latter issue should be a concern to domestic wine companies and consideration should be given to brand promotion of our premium products to reenergize the view of domestics with the younger generation. It has worked for Detroit where Cadillac is now cool, so why not?
Both a positive and a negative trend is that the youngest consumer cohort has demonstrated a propensity for frugal luxury,47 meaning they are quite price conscious, but don’t sacrifice quality when selecting their adult beverages. The hope is that as the group gains traction in life and their careers, they evolve to become less frugal and loosen up the grip on their wallets and purses, becoming traditional mass-luxury consumers. Our forecast is the millennial cohort will surpass the Gen X cohort around the year 2026 to become the largest fine wine consuming demographic. (Figure 12)
Premium SegmentIt’s become abundantly clear that premium wine is dominating the day and is responsible for all of the growth taking place in the trade. Shoppers are trading up to more expensive and complex wines (Figure 13), and when looking back, the only time in recent memory we have seen trading down into lower-priced wine was during the Great Recession. That wasn’t a business trend but rather an exception. Obviously a business model based on the hope of recession is clearly on rocky ground. →
Park Concessions: Consumption, Demographics and Demandcontinued
Introduction | 1 | 2 | 3 | 4 | 5 Park Concessions: Consumption, Dem
ographics and Demand | 6 | 7 | 8 | 9
35
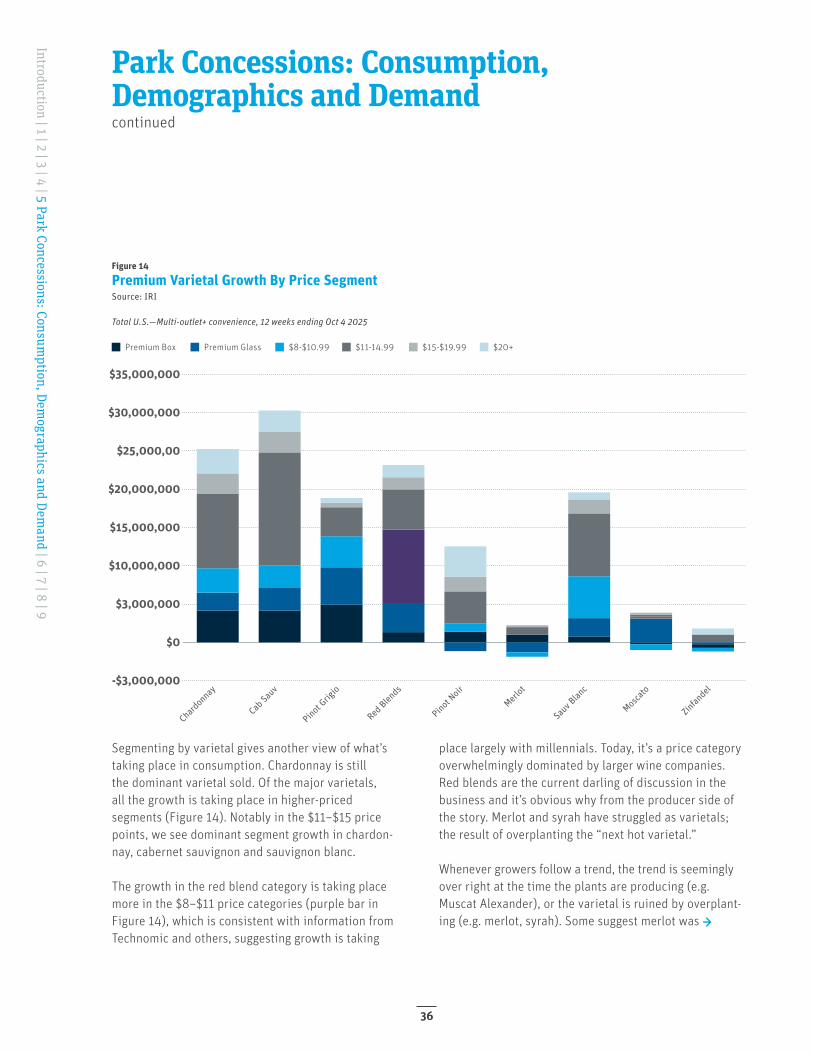
Figure 14
Premium Varietal Growth By Price SegmentSource: IRI
Total U.S.—Multi-outlet+ convenience, 12 weeks ending Oct 4 2025
Premium Box $20+$15-$19.99$11-14.99$8-$10.99Premium Glass
$0
$3,000,000
-$3,000,000
Chardonnay
Cab Sau
v
Pinot Grig
io
Red Blen
ds
Pinot Noir
Merlot
Sauv B
lanc
Moscato
Zinfan
del
$10,000,000
$15,000,000
$20,000,000
$25,000,00
$30,000,000
$35,000,000
Park Concessions: Consumption, Demographics and Demandcontinued
Segmenting by varietal gives another view of what’s taking place in consumption. Chardonnay is still the dominant varietal sold. Of the major varietals, all the growth is taking place in higher-priced segments (Figure 14). Notably in the $11–$15 price points, we see dominant segment growth in chardon- nay, cabernet sauvignon and sauvignon blanc.
The growth in the red blend category is taking place more in the $8–$11 price categories (purple bar in Figure 14), which is consistent with information from Technomic and others, suggesting growth is taking
place largely with millennials. Today, it’s a price category overwhelmingly dominated by larger wine companies. Red blends are the current darling of discussion in the business and it’s obvious why from the producer side of the story. Merlot and syrah have struggled as varietals; the result of overplanting the “next hot varietal.”
Whenever growers follow a trend, the trend is seemingly over right at the time the plants are producing (e.g. Muscat Alexander), or the varietal is ruined by overplant- ing (e.g. merlot, syrah). Some suggest merlot was →
Introduction | 1 | 2 | 3 | 4 | 5 Park Concessions: Consumption, Dem
ographics and Demand | 6 | 7 | 8 | 9
36
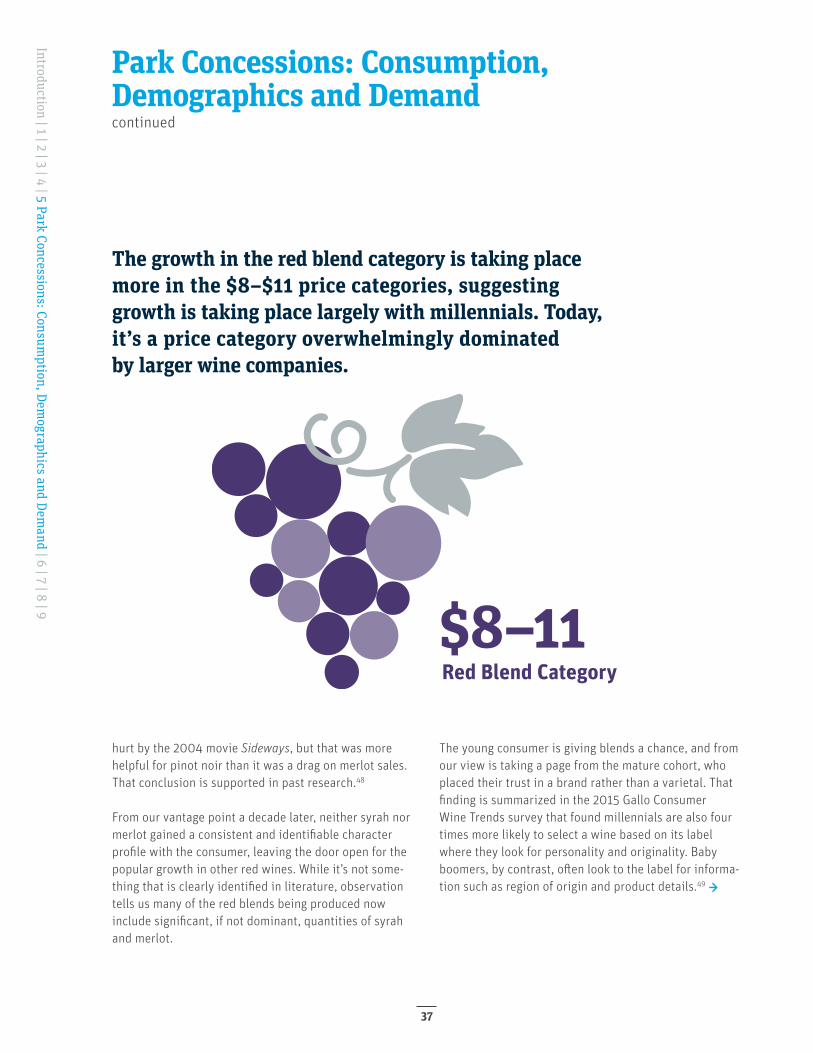
The growth in the red blend category is taking place more in the $8–$11 price categories, suggesting growth is taking place largely with millennials. Today, it’s a price category overwhelmingly dominated by larger wine companies.
Red Blend Category$8–11
hurt by the 2004 movie Sideways, but that was more helpful for pinot noir than it was a drag on merlot sales. That conclusion is supported in past research.48
From our vantage point a decade later, neither syrah nor merlot gained a consistent and identifiable character profile with the consumer, leaving the door open for the popular growth in other red wines. While it’s not some-thing that is clearly identified in literature, observation tells us many of the red blends being produced now include significant, if not dominant, quantities of syrah and merlot.
The young consumer is giving blends a chance, and from our view is taking a page from the mature cohort, who placed their trust in a brand rather than a varietal. That finding is summarized in the 2015 Gallo Consumer Wine Trends survey that found millennials are also four times more likely to select a wine based on its label where they look for personality and originality. Baby boomers, by contrast, often look to the label for informa-tion such as region of origin and product details.49 →
Park Concessions: Consumption, Demographics and Demandcontinued
Introduction | 1 | 2 | 3 | 4 | 5 Park Concessions: Consumption, Dem
ographics and Demand | 6 | 7 | 8 | 9
37
Percent of winery owners who feel tourism is appreciated
80%
Park Concessions: Consumption, Demographics and Demandcontinued
Small Winery SalesThe wine industry really dodged a bullet in the Granholm Decision in 2005.50 That decision knocked the legs out from protectionist state laws that favored in-state wine producers, and the timing couldn’t have been better for small wineries because they were being left by distributors.
In 1996 wineries could ship to only 13 reciprocal states and an additional 17 “personal use” states, many of whom allowed consumers to buy less than a quart of wine a year direct.51 At the time, direct-to-consumer sales were estimated by some to be less than $100 million per year.52 There were far more closed states where consum-ers couldn’t buy wine directly from a winery compared to states where shipping was legal.
As noted elsewhere in the report, the wholesalers moved away from the small winery around 2001. The small wineries were in a bind without the three-tier system willing to move their wine, and the direct options were limited. That all changed with the Granholm Decision, concurrent with the continuing evolution of the internet.
Today the smaller producers absolutely could not live without direct sales, and when we say small in this context, we are talking about wineries with less than 100,000 in case sales.
Direct-to-consumer sales are now a healthy part of a winery’s revenue base. While state laws vary and some permitted state laws can only be described as arcane, if not stealth protectionism, the only remaining pro- hibited states are Alabama, Delaware, Kentucky, Missis-sippi, Oklahoma, Pennsylvania and Utah. But in the wine business, it seems there is always a new challenge.
Evolving Local RegulationsSmall wineries take up space in oftentimes bucolic settings. Some would argue that the wine industry might even add to the beauty and culture of an area.53 But not everyone likes wineries, and local regulation aimed at slowing tourism and winery growth has started to gain traction in several regions. What seems common at this stage is an alignment of anti-change agendas using media and the political process to paint a negative view of the industry and its practices.
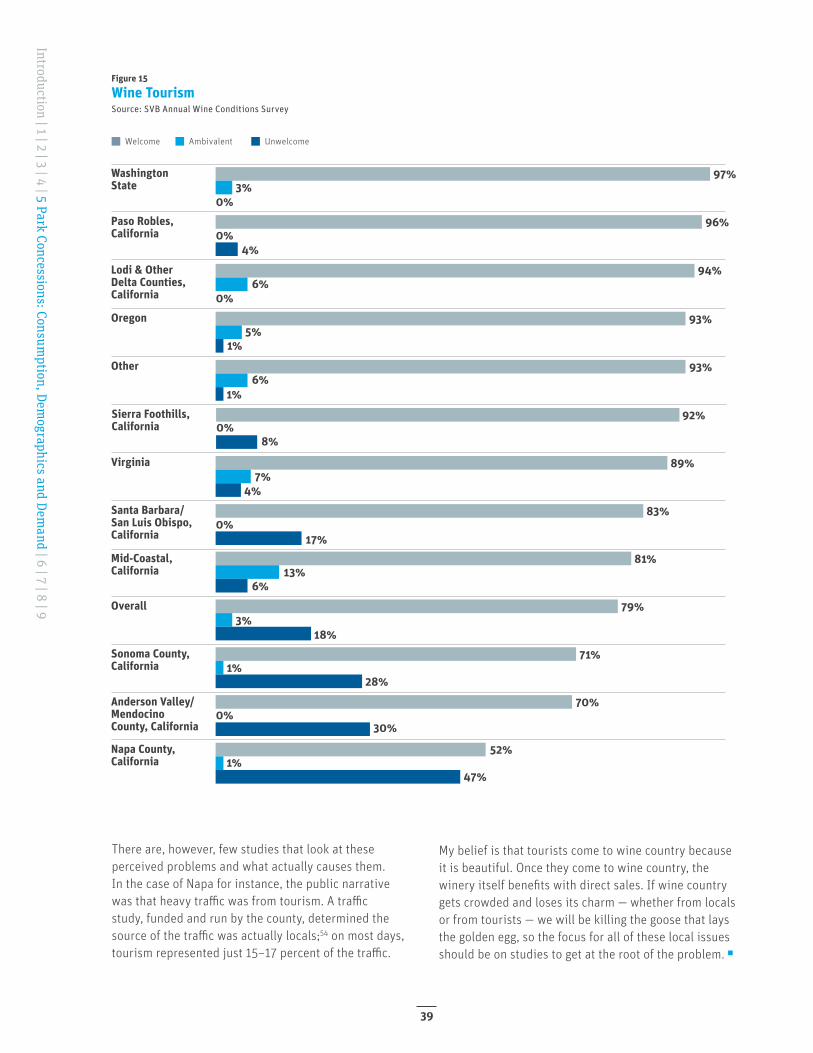
We asked winery owners what they thought locals felt about the growth of wine tourism in their region. The good news is 80 percent felt tourism was appre-ciated and wanted. Not surprisingly, Napa County wineries were the least positive about the question, but Sonoma, Mendocino and Santa Barbara weren’t far behind. (Figure 15)
According to articles and comments from readers in newspapers that cover the wine business, the debate is about a threat that is changing the character of [fill in your town or AVA here]. Those accusations are backstopped with references to the negative impacts from traffic, noise, tourism and heavier water use. →
Introduction | 1 | 2 | 3 | 4 | 5 Park Concessions: Consumption, Dem
ographics and Demand | 6 | 7 | 8 | 9
38
97%
96%
94%
93%
93%
92%
89%
83%
81%
79%
71%
70%
52%
3%0%
0%
0%
0%
0%
0%
4%
1%
1%
8%
4%
17%
6%
18%
28%
30%
47%
6%
5%
6%
7%
13%
3%
1%
1%
WashingtonState
Paso Robles, California
Lodi & OtherDelta Counties, California
Oregon
Other
Sierra Foothills, California
Virginia
Santa Barbara/San Luis Obispo, California
Mid-Coastal, California
Overall
Sonoma County, California
Anderson Valley/Mendocino County, California
Napa County, California
Figure 15
Wine TourismSource: SVB Annual Wine Conditions Survey
Welcome UnwelcomeAmbivalent
There are, however, few studies that look at these perceived problems and what actually causes them. In the case of Napa for instance, the public narrative was that heavy traffic was from tourism. A traffic study, funded and run by the county, determined the source of the traffic was actually locals;54 on most days, tourism represented just 15–17 percent of the traffic.
My belief is that tourists come to wine country because it is beautiful. Once they come to wine country, the winery itself benefits with direct sales. If wine country gets crowded and loses its charm — whether from locals or from tourists — we will be killing the goose that lays the golden egg, so the focus for all of these local issues should be on studies to get at the root of the problem. ◻
Introduction | 1 | 2 | 3 | 4 | 5 Park Concessions: Consumption, Dem
ographics and Demand | 6 | 7 | 8 | 9
39
Crash Davis: You don’t want a ballplayer; you want a stable pony.
Skip: Nah.
Crash Davis: Well, my Triple-A contract gets bought out so I can hold some flavor-of-the-month’s cup in the bus leagues, is that it? Well, hell with this game! [Pause]
Crash Davis: I quit, all right? I freaking quit!
[Crash exits the office and stands in the clubhouse for a minute before turning and sticking his head back through the door]
Crash Davis: Who we play tomorrow?
Skip: Winston-Salem. Batting practice at 11:30.55
6Introduction | 1 | 2 | 3 | 4 | 5 | 6 The Farm
System: Im
ports and Mass-Sale Prem
ium W
ine | 7 | 8 | 9
40
Even though the wine business is a job and we like what we do, some-times we find ourselves in places we never expected. Just ask anyone who is in national sales for stories about how they ended up in Winston- Salem or Durham. A little like Crash, some days we think things are going just fine, then something happens and it’s a new ballgame. Some brand or import takes our shelf space and we’re next selling wine in Greenville, Mississippi, and wishing we were lucky enough to be back in Durham.
The Farm System: Imports and Mass-Scale Premium Wine
ImportsThere can’t be a discussion of supply without having at least a short discussion of the impacts and threats from foreign wine. While the market share of foreign bottled wine is at present taking a break from a long growth march, bottled imported wine will start to take market share from domestic producers again. That conclusion comes from the following observations:
▸ Per capita consumption in the U.S. will slow as alcohol- switching millennials grab consumer share.56
▸ Good value bottled foreign wine is widely available for purchase in multiple retail outlets.
▸ Digital access and positively evolving direct shipping laws make foreign wine as available as domestic wine for the first time in history.
▸ Declining EU per capita consumption, changes to more “new world” wine styles in export brands, and in-country export marketing support provide the momentum to expand exports to the U.S.
▸ The growing millennial cohort has an evolved view of world wines versus the baby boomer and Gen X cohorts, who favored U.S. producers during the same period in their development. We shouldn’t expect millennials to repeat the baby boomers preference for domestics.
▸ Given a choice in sourcing, large producers have shown a willingness to switch to foreign sources when there are cost advantages. They can easily do the same with imports.
▸ Companies such as Constellation57, Treasury and Gallo already have domestic distribution, foreign supply and the marketing heft to deliver good value foreign fine wine to the U.S. consumer. →
Introduction | 1 | 2 | 3 | 4 | 5 | 6 The Farm System
: Imports and M
ass-Sale Premium
Wine | 7 | 8 | 9
41
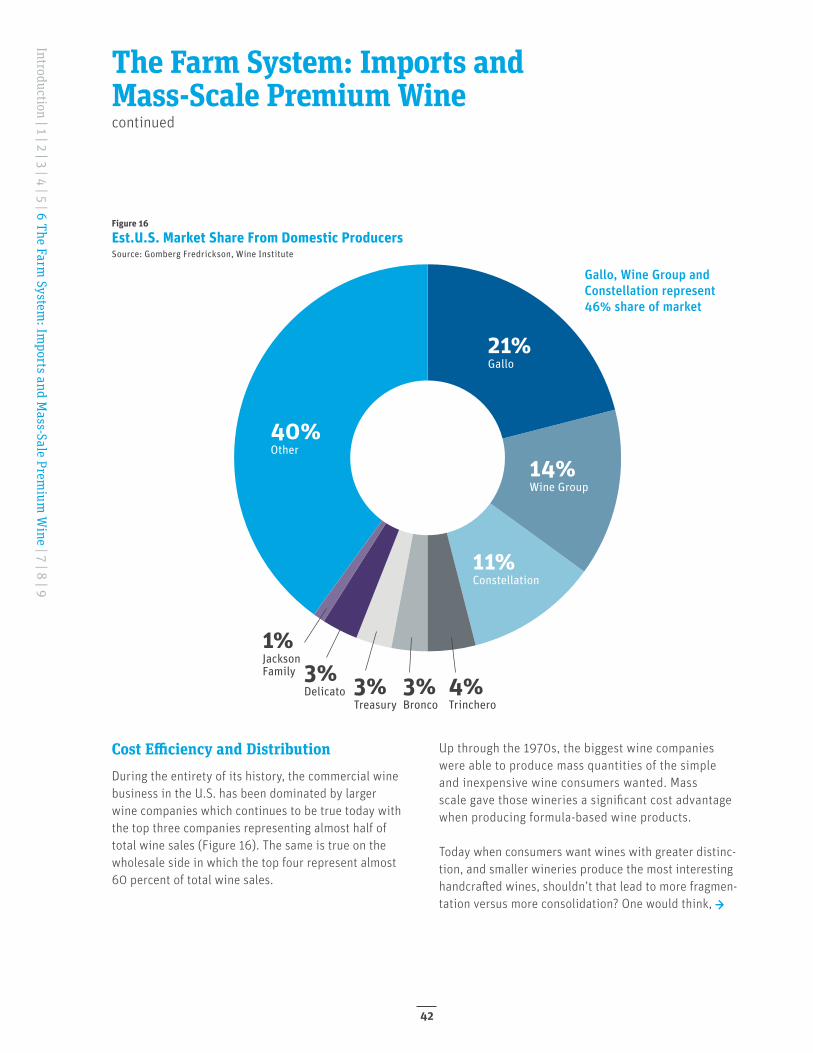
Figure 16
Est.U.S. Market Share From Domestic ProducersSource: Gomberg Fredrickson, Wine Institute
40%Other
21%Gallo
14%Wine Group
11%Constellation
4%Trinchero
3%Bronco
3%Treasury
3%Delicato
1%JacksonFamily
Gallo, Wine Group and Constellation represent 46% share of market
The Farm System: Imports and Mass-Scale Premium Winecontinued
Cost Efficiency and DistributionDuring the entirety of its history, the commercial wine business in the U.S. has been dominated by larger wine companies which continues to be true today with the top three companies representing almost half of total wine sales (Figure 16). The same is true on the wholesale side in which the top four represent almost 60 percent of total wine sales.
Up through the 1970s, the biggest wine companies were able to produce mass quantities of the simple and inexpensive wine consumers wanted. Mass scale gave those wineries a significant cost advantage when producing formula-based wine products.
Today when consumers want wines with greater distinc-tion, and smaller wineries produce the most interesting handcrafted wines, shouldn’t that lead to more fragmen-tation versus more consolidation? One would think, →
Introduction | 1 | 2 | 3 | 4 | 5 | 6 The Farm System
: Imports and M
ass-Sale Premium
Wine | 7 | 8 | 9
42
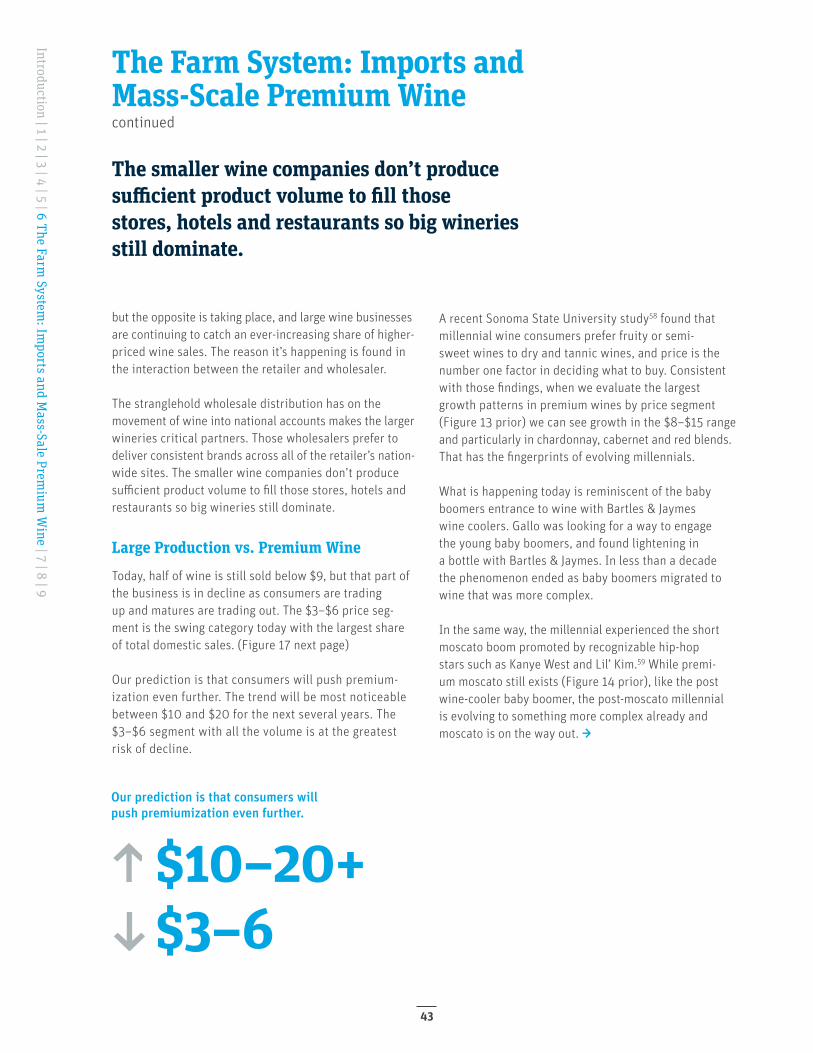
$10–20+$3–6
but the opposite is taking place, and large wine businesses are continuing to catch an ever-increasing share of higher- priced wine sales. The reason it’s happening is found in the interaction between the retailer and wholesaler.
The stranglehold wholesale distribution has on the movement of wine into national accounts makes the larger wineries critical partners. Those wholesalers prefer to deliver consistent brands across all of the retailer’s nation- wide sites. The smaller wine companies don’t produce sufficient product volume to fill those stores, hotels and restaurants so big wineries still dominate.
Large Production vs. Premium Wine
Today, half of wine is still sold below $9, but that part of the business is in decline as consumers are trading up and matures are trading out. The $3–$6 price seg-ment is the swing category today with the largest share of total domestic sales. (Figure 17 next page)
Our prediction is that consumers will push premium-ization even further. The trend will be most noticeable between $10 and $20 for the next several years. The $3–$6 segment with all the volume is at the greatest risk of decline.
A recent Sonoma State University study58 found that millennial wine consumers prefer fruity or semi- sweet wines to dry and tannic wines, and price is the number one factor in deciding what to buy. Consistent with those findings, when we evaluate the largest growth patterns in premium wines by price segment (Figure 13 prior) we can see growth in the $8–$15 range and particularly in chardonnay, cabernet and red blends. That has the fingerprints of evolving millennials.
What is happening today is reminiscent of the baby boomers entrance to wine with Bartles & Jaymes wine coolers. Gallo was looking for a way to engage the young baby boomers, and found lightening in a bottle with Bartles & Jaymes. In less than a decade the phenomenon ended as baby boomers migrated to wine that was more complex.
In the same way, the millennial experienced the short moscato boom promoted by recognizable hip-hop stars such as Kanye West and Lil’ Kim.59 While premi-um moscato still exists (Figure 14 prior), like the post wine-cooler baby boomer, the post-moscato millennial is evolving to something more complex already and moscato is on the way out. →
The smaller wine companies don’t produce sufficient product volume to fill those stores, hotels and restaurants so big wineries still dominate.
Our prediction is that consumers will push premiumization even further.
The Farm System: Imports and Mass-Scale Premium Winecontinued
Introduction | 1 | 2 | 3 | 4 | 5 | 6 The Farm System
: Imports and M
ass-Sale Premium
Wine | 7 | 8 | 9
43
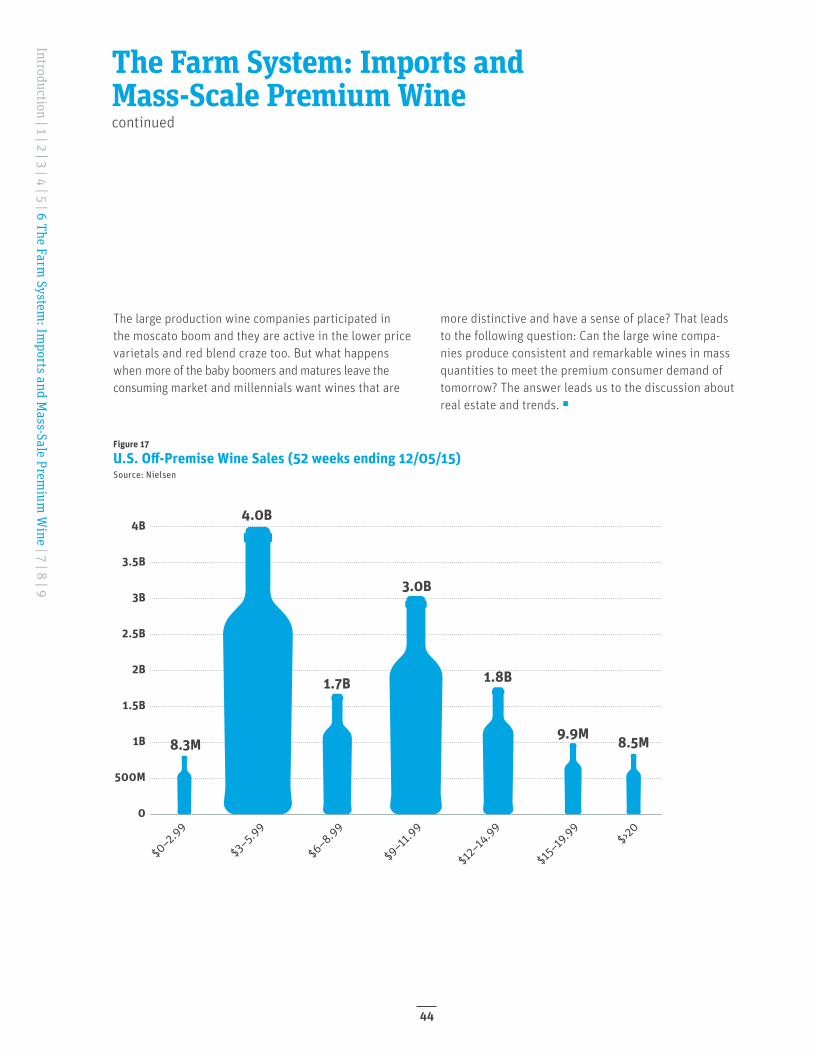
Figure 17
U.S. Off-Premise Wine Sales (52 weeks ending 12/05/15)Source: Nielsen
4B
3.5B
3B
2.5B
2B
1.5B
1B
500M
0
$0–2.9
9
$3–5.99
$6–8.99
$9–11.
99
$12–
14.99
$15–19
.99$>2
0
3.0B
1.7B
8.3M 8.5M
1.8B
9.9M
828,850,2524,041,378,6911,681,255,0253,049,547,5751,773,554,251991,226,591853,289,202
4.0B
The Farm System: Imports and Mass-Scale Premium Winecontinued
The large production wine companies participated in the moscato boom and they are active in the lower price varietals and red blend craze too. But what happens when more of the baby boomers and matures leave the consuming market and millennials want wines that are
more distinctive and have a sense of place? That leads to the following question: Can the large wine compa-nies produce consistent and remarkable wines in mass quantities to meet the premium consumer demand of tomorrow? The answer leads us to the discussion about real estate and trends. ◻
Introduction | 1 | 2 | 3 | 4 | 5 | 6 The Farm System
: Imports and M
ass-Sale Premium
Wine | 7 | 8 | 9
44
Our prediction is that consumers will push premiumization even further. The trend will be most noticeable between $10 and $20 for the next several years. The $3–$6 segment with all the volume is at the greatest risk of decline.
Introduction | 1 | 2 | 3 | 4 | 5 | 6 The Farm System
: Imports and M
ass-Sale Premium
Wine | 7 | 8 | 9
45

Crash Davis: This son of a bitch is throwing a two-hit shutout. He’s shaking me off. You believe that? Charlie, here comes the deuce. And when you speak of me, speak well.60
7Introduction | 1 | 2 | 3 | 4 | 5 | 6 | 7 The Farm
System: Im
ports, Land, M&
A and Harvest | 8 | 9
46
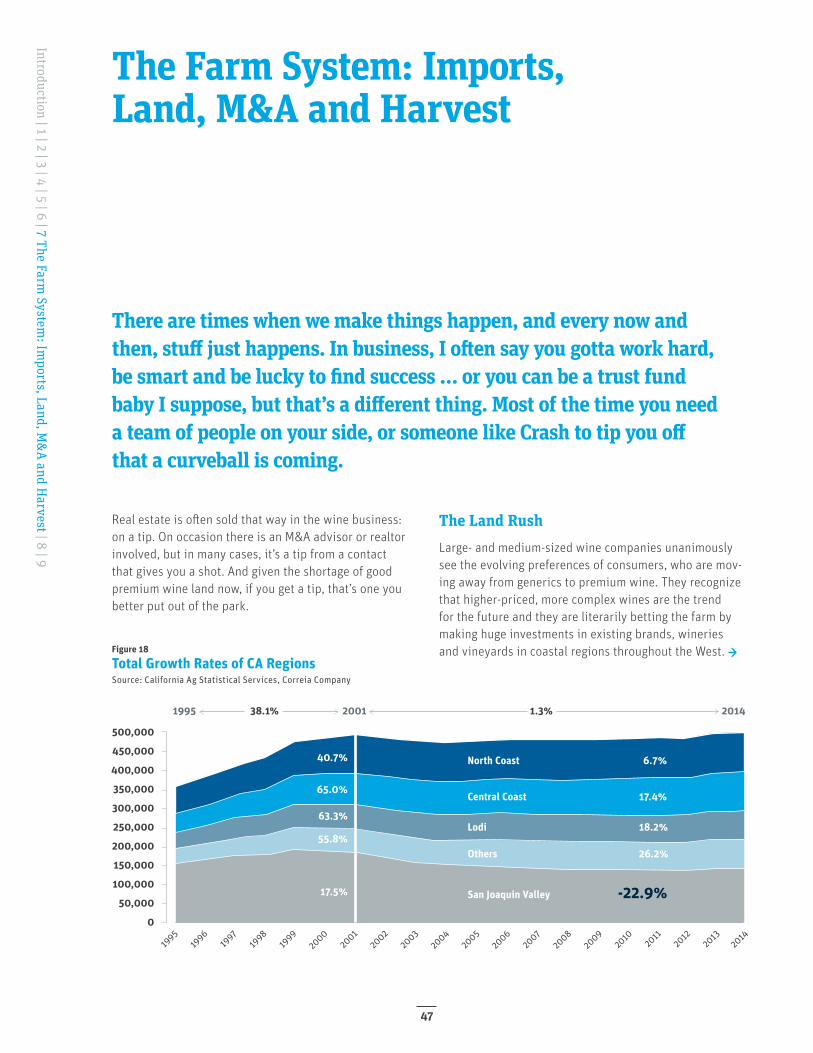
Figure 18
Total Growth Rates of CA RegionsSource: California Ag Statistical Services, Correia Company
500,000
450,000
400,000
350,000
300,000
250,000
200,000
150,000
100,000
50,000
0
1995
1996
1997
1998
1999
2000
2001
2002
2003
2004
2005
2006
2007
2008
2009
2010
2012
2011
2014
2013
40.7% North Coast 6.7%
Central Coast 17.4%
Lodi 18.2%
Others 26.2%
San Joaquin Valley -22.9%
65.0%
63.3%
55.8%
17.5%
1995 38.1% 2001 1.3% 2014
There are times when we make things happen, and every now and then, stuff just happens. In business, I often say you gotta work hard, be smart and be lucky to find success … or you can be a trust fund baby I suppose, but that’s a different thing. Most of the time you need a team of people on your side, or someone like Crash to tip you off that a curveball is coming.
The Farm System: Imports, Land, M&A and Harvest
Real estate is often sold that way in the wine business: on a tip. On occasion there is an M&A advisor or realtor involved, but in many cases, it’s a tip from a contact that gives you a shot. And given the shortage of good premium wine land now, if you get a tip, that’s one you better put out of the park.
The Land RushLarge- and medium-sized wine companies unanimously see the evolving preferences of consumers, who are mov-ing away from generics to premium wine. They recognize that higher-priced, more complex wines are the trend for the future and they are literarily betting the farm by making huge investments in existing brands, wineries and vineyards in coastal regions throughout the West. →
Introduction | 1 | 2 | 3 | 4 | 5 | 6 | 7 The Farm System
: Imports, Land, M
&A and H
arvest | 8 | 9
47
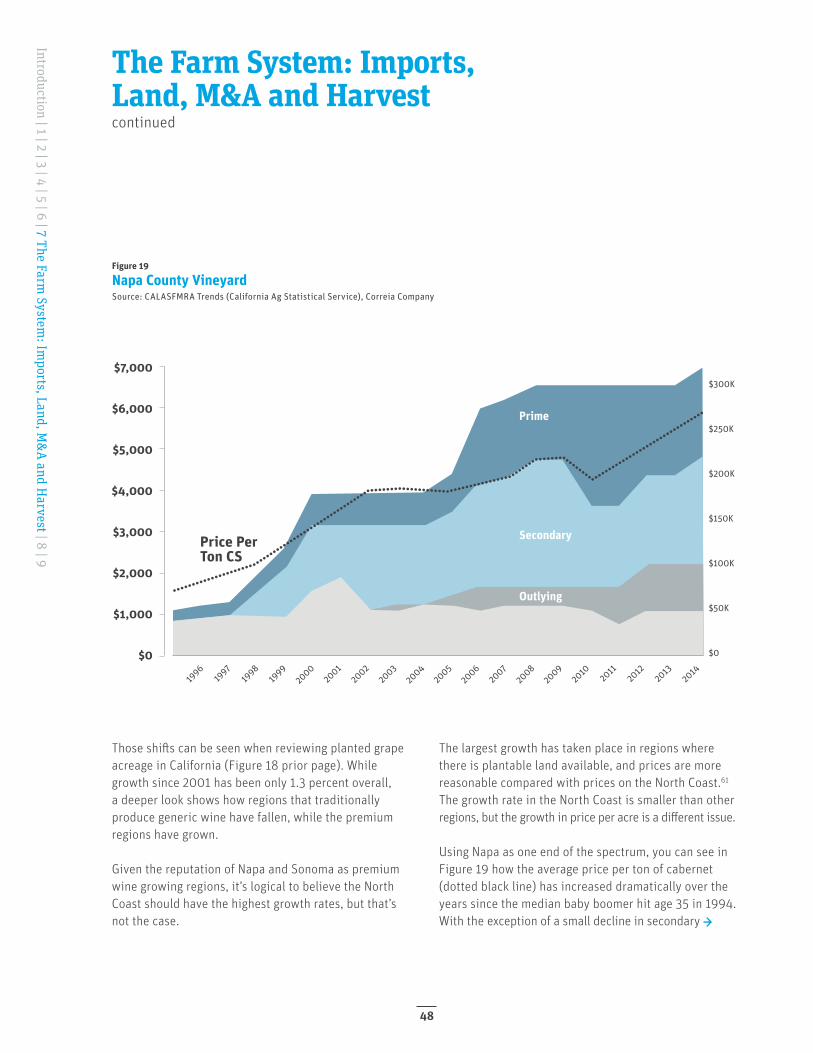
Figure 19
Napa County VineyardSource: CALASFMRA Trends (California Ag Statistical Service), Correia Company
Prime
Secondary
Outlying
$7,000
$6,000
$5,000
$4,000
$3,000
$2,000
$1,000
$0
$300K
$250K
$200K
$150K
$100K
$50K
$0
1996
1997
1998
1999
2000
2001
2002
2003
2004
2005
2006
2007
2008
2009
2010
2012
2011
2014
2013
Price Per Ton CS
Those shifts can be seen when reviewing planted grape acreage in California (Figure 18 prior page). While growth since 2001 has been only 1.3 percent overall, a deeper look shows how regions that traditionally produce generic wine have fallen, while the premium regions have grown.
Given the reputation of Napa and Sonoma as premium wine growing regions, it’s logical to believe the North Coast should have the highest growth rates, but that’s not the case.
The largest growth has taken place in regions where there is plantable land available, and prices are more reasonable compared with prices on the North Coast.61 The growth rate in the North Coast is smaller than other regions, but the growth in price per acre is a different issue. Using Napa as one end of the spectrum, you can see in Figure 19 how the average price per ton of cabernet (dotted black line) has increased dramatically over the years since the median baby boomer hit age 35 in 1994. With the exception of a small decline in secondary →
The Farm System: Imports, Land, M&A and Harvestcontinued
Introduction | 1 | 2 | 3 | 4 | 5 | 6 | 7 The Farm System
: Imports, Land, M
&A and H
arvest | 8 | 9
48
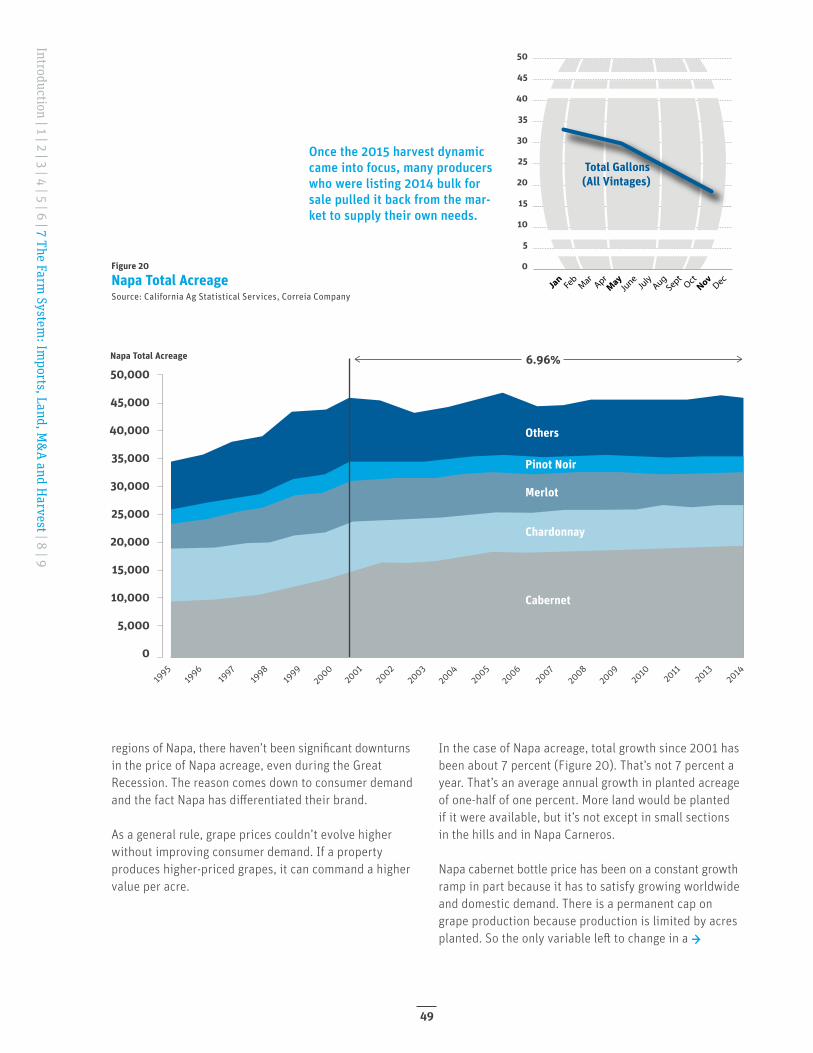
50,000
45,000
40,000
35,000
30,000
25,000
20,000
15,000
10,000
5,000
0
1995
1996
1997
1998
1999
2000
2001
2002
2003
2004
2005
2006
2007
2008
2009
2010
2011
2013
2014
Others
Pinot Noir
Merlot
Chardonnay
Cabernet
Napa Total Acreage 6.96%
Figure 20
Napa Total AcreageSource: California Ag Statistical Services, Correia Company
Once the 2015 harvest dynamic came into focus, many producers who were listing 2014 bulk for sale pulled it back from the mar-ket to supply their own needs.
50
45
40
35
30
25
20
15
10
5
0
Total Gallons(All Vintages)
JanFebMar Ap
rMayJune Ju
lyAugSept Oc
tNovDec
regions of Napa, there haven’t been significant downturns in the price of Napa acreage, even during the Great Recession. The reason comes down to consumer demand and the fact Napa has differentiated their brand.
As a general rule, grape prices couldn’t evolve higher without improving consumer demand. If a property produces higher-priced grapes, it can command a higher value per acre.
In the case of Napa acreage, total growth since 2001 has been about 7 percent (Figure 20). That’s not 7 percent a year. That’s an average annual growth in planted acreage of one-half of one percent. More land would be planted if it were available, but it’s not except in small sections in the hills and in Napa Carneros.
Napa cabernet bottle price has been on a constant growth ramp in part because it has to satisfy growing worldwide and domestic demand. There is a permanent cap on grape production because production is limited by acres planted. So the only variable left to change in a →
Introduction | 1 | 2 | 3 | 4 | 5 | 6 | 7 The Farm System
: Imports, Land, M
&A and H
arvest | 8 | 9
49
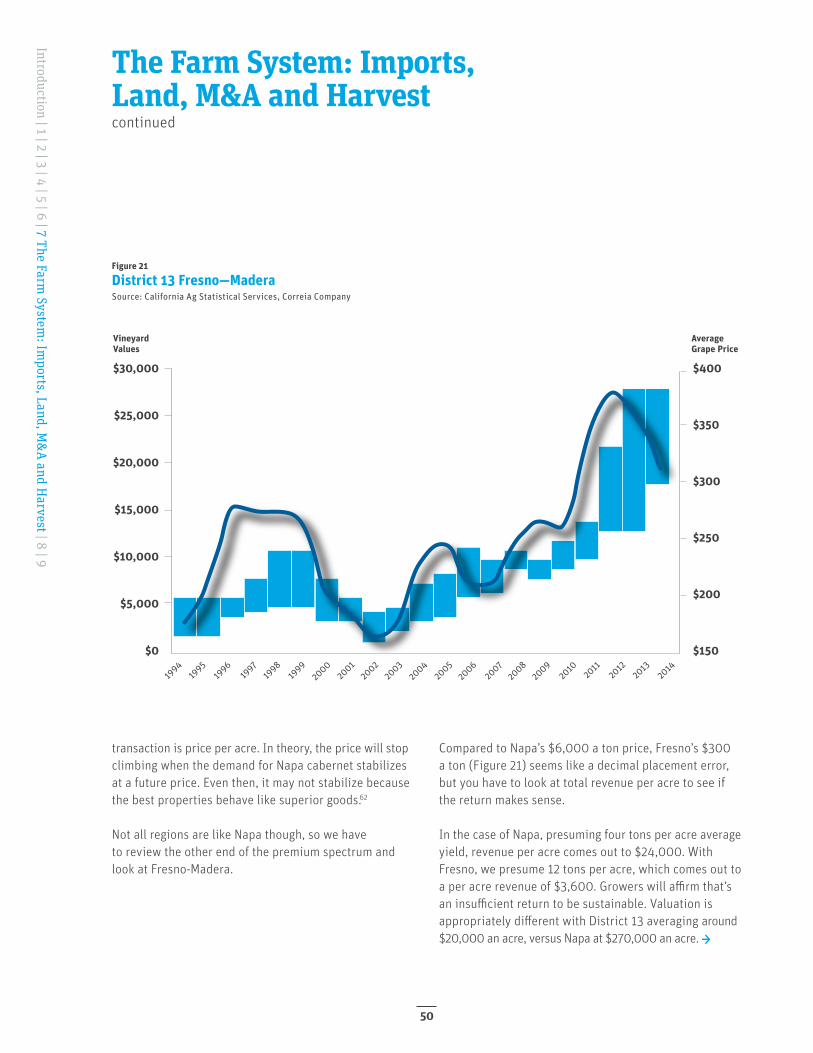
Figure 21
District 13 Fresno—MaderaSource: California Ag Statistical Services, Correia Company
$30,000
$25,000
$20,000
$15,000
$10,000
$5,000
$0
$400
$350
$300
$250
$200
$150
1994
1996
1998
2000
2002
2004
2006
2008
2010
2012
2014
1995
1997
1999
2001
2003
2005
2007
2009
2011
2013
VineyardValues
Average Grape Price
transaction is price per acre. In theory, the price will stop climbing when the demand for Napa cabernet stabilizes at a future price. Even then, it may not stabilize because the best properties behave like superior goods.62
Not all regions are like Napa though, so we have to review the other end of the premium spectrum and look at Fresno-Madera.
Compared to Napa’s $6,000 a ton price, Fresno’s $300 a ton (Figure 21) seems like a decimal placement error, but you have to look at total revenue per acre to see if the return makes sense.
In the case of Napa, presuming four tons per acre average yield, revenue per acre comes out to $24,000. With Fresno, we presume 12 tons per acre, which comes out to a per acre revenue of $3,600. Growers will affirm that’s an insufficient return to be sustainable. Valuation is appropriately different with District 13 averaging around $20,000 an acre, versus Napa at $270,000 an acre. →
The Farm System: Imports, Land, M&A and Harvestcontinued
Introduction | 1 | 2 | 3 | 4 | 5 | 6 | 7 The Farm System
: Imports, Land, M
&A and H
arvest | 8 | 9
50
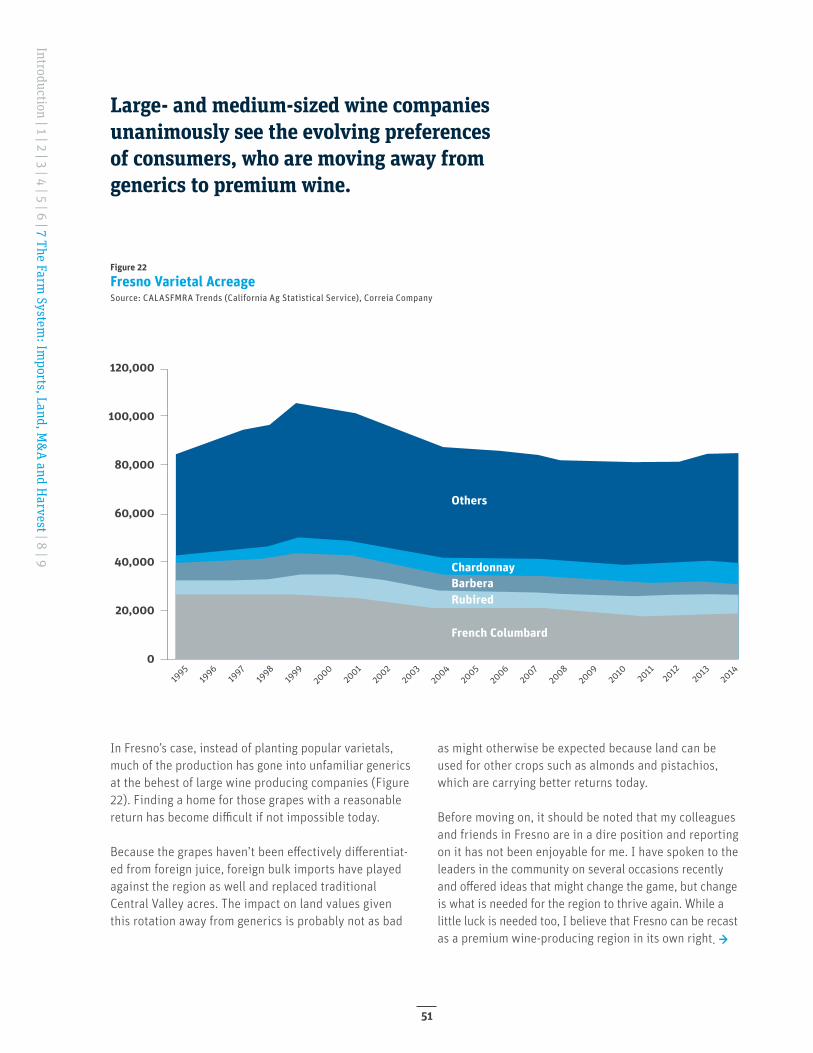
Figure 22
Fresno Varietal AcreageSource: CALASFMRA Trends (California Ag Statistical Service), Correia Company
120,000
100,000
80,000
60,000
40,000
20,000
0
1995
1996
1997
1998
1999
2000
2001
2002
2003
2004
2005
2006
2007
2008
2009
2010
2011
2012
2013
2014
Others
ChardonnayBarberaRubired
French Columbard
In Fresno’s case, instead of planting popular varietals, much of the production has gone into unfamiliar generics at the behest of large wine producing companies (Figure 22). Finding a home for those grapes with a reasonable return has become difficult if not impossible today.
Because the grapes haven’t been effectively differentiat-ed from foreign juice, foreign bulk imports have played against the region as well and replaced traditional Central Valley acres. The impact on land values given this rotation away from generics is probably not as bad
as might otherwise be expected because land can be used for other crops such as almonds and pistachios, which are carrying better returns today.
Before moving on, it should be noted that my colleagues and friends in Fresno are in a dire position and reporting on it has not been enjoyable for me. I have spoken to the leaders in the community on several occasions recently and offered ideas that might change the game, but change is what is needed for the region to thrive again. While a little luck is needed too, I believe that Fresno can be recast as a premium wine-producing region in its own right. →
Large- and medium-sized wine companies unanimously see the evolving preferences of consumers, who are moving away from generics to premium wine.
Introduction | 1 | 2 | 3 | 4 | 5 | 6 | 7 The Farm System
: Imports, Land, M
&A and H
arvest | 8 | 9
51
Red blend pricing: intersection of segment growth and consumer demand
$8–14
M&AInteresting wine can be produced in mass quantities, as long as the consumer is only looking for something round, ordinary and consistent in style. That is the current intersection of segment growth and consumer demand, where the $8–$14 red blends are prominently found. A wine with merlot, syrah and zinfandel will be interesting but not distinctive.
Large wine companies know that breakpoint will arrive when blending wines won’t move the needle, and they are already planning for the next wave of consum-er trends by buying foreign brands, buying domestic wineries and brands, or buying arable property that can support a future premium brand.63
In the past few years, we have seen large players like The Wine Group, Gallo, Treasury Wine estates, Jackson Family Wines, Constellation and others purchasing large swaths of land and wine businesses in coastal regions (Figure 23).
Always quick to anticipate consumer trends, Gallo started getting a foothold in Napa in 2002 with the purchase of the Louis Martini Winery, which came with 600 acres of vines and a historic permit in St Helena, California, and followed with the William Hill winery acquisition from Beam Wine Estates several years later. More recently, they have been aggressive in acquiring wineries and land in coastal regions such as J Wine Company, Talbot
Winery, and most recently the historic Asti Winery64 in Sonoma and The Ranch in Napa. The latter acquisition will triple Gallo’s Napa production capacity to about three million cases.
Constellation has been moving to grow their premium space for years, putting a huge stake in the ground with the Robert Mondavi Winery acquisition and following with a similar size purchase when they acquired Vincor, which included the Kim Crawford and Inneskillin labels among others. Constellation now manages 19 wineries in the U.S., using grapes grown in the California counties of Napa, Sonoma and Monterey. In addition, they manage eight wineries in Canada, four wineries in New Zealand and five wineries in Italy.
Without question, the deal environment in the wine business has been white hot this past year. While many even in the business predicted that 2015 deal forma-tion would slow given several consecutive good years already, the opposite has been true. Consistent with the rest of Wall Street, M&A in the wine business ran at a record pace for yet another year in 2015 and multiples have held, if not increased through the year.65 With the transactions we presently see in the queue, we will again start the year with some large and notable sales of premium vineyards and wineries. →
The Farm System: Imports, Land, M&A and Harvestcontinued
Introduction | 1 | 2 | 3 | 4 | 5 | 6 | 7 The Farm System
: Imports, Land, M
&A and H
arvest | 8 | 9
52
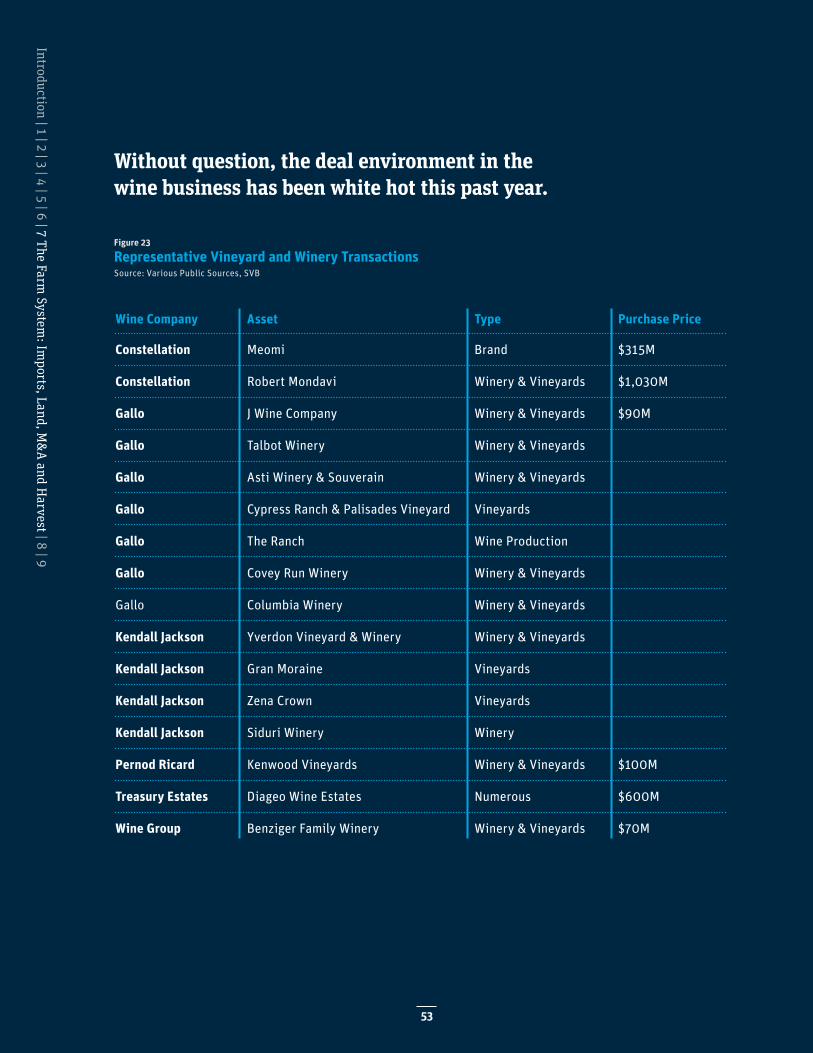
Figure 23
Representative Vineyard and Winery TransactionsSource: Various Public Sources, SVB
Wine Company Asset Type Purchase Price
Constellation Meomi Brand $315M
Constellation Robert Mondavi Winery & Vineyards $1,030M
Gallo J Wine Company Winery & Vineyards $90M
Gallo Talbot Winery Winery & Vineyards
Gallo Asti Winery & Souverain Winery & Vineyards
Gallo Cypress Ranch & Palisades Vineyard Vineyards
Gallo The Ranch Wine Production
Gallo Covey Run Winery Winery & Vineyards
Gallo Columbia Winery Winery & Vineyards
Kendall Jackson Yverdon Vineyard & Winery Winery & Vineyards
Kendall Jackson Gran Moraine Vineyards
Kendall Jackson Zena Crown Vineyards
Kendall Jackson Siduri Winery Winery
Pernod Ricard Kenwood Vineyards Winery & Vineyards $100M
Treasury Estates Diageo Wine Estates Numerous $600M
Wine Group Benziger Family Winery Winery & Vineyards $70M
Without question, the deal environment in the wine business has been white hot this past year.
Introduction | 1 | 2 | 3 | 4 | 5 | 6 | 7 The Farm System
: Imports, Land, M
&A and H
arvest | 8 | 9
53
Our guess for total harvest in California is 3.6 million tons crushed, which is off about 8 percent from 3.9 million tons crushed in 2014.
Land Summary Average land prices are moving strongly higher be- cause the large wine companies aren’t the only ones who see the need to buy land that can produce premium wine. Wine companies in the next tier down from the majors have been active in both Oregon and Washington where more favorable price/quality measures exist compared to the North Coast of California. The Napa Valley, known for cabernet, is effectively planted out. No more acreage exists of any size. The smaller wine companies with growth plans in Napa are desperately seeking land and/or vineyards to acquire there, but many are looking toward Sonoma County to start pinot noir programs.
Several years ago there were stories abounding about Chinese investors who were buying up California wine properties, but that was largely a tire-kicking experience with few transactions closing due to the difficulties in expatriating money. Today the phones for acquisitions are silent from the Far East, but are ringing off the hook from wealthy indiv- iduals, family offices and private equity firms who are sizing up the business, and in this case, the deals are closing.
The result of the high demand for coastal land, combined with the strong M&A market and low long-term rates has been that land prices in all wine producing regions have been moving strongly higher. While we have correctly predicted bubbles in the past, we don’t believe this is a bubble. Given that the underlying demand for premium wine will continue to grow, we can’t see any reasonable event that can change the current real estate trend from continuing for the next 20 years, unless bottled foreign premium wine takes materially greater market share.
Supply of WineOver the past several drought years, I’ve taken numer-ous calls from reporters who want to know how the lack of water is impacting the wine business. While it has clearly been an issue, especially for the Central Valley farmers, I have to disappoint the writers who were hoping to write something sensational: ‘Drought ruins harvest! No grapes to crush. Consumers discover milk.’
The fact is when it comes to wine grapes, droughts will more than likely make for good growing conditions and produce exceptional quality as well — as the harvests in 2012, 2013 and 2014 proved by delivering historic heavy yields and stunning quality in most of the West. →
The Farm System: Imports, Land, M&A and Harvestcontinued
Introduction | 1 | 2 | 3 | 4 | 5 | 6 | 7 The Farm System
: Imports, Land, M
&A and H
arvest | 8 | 9
54
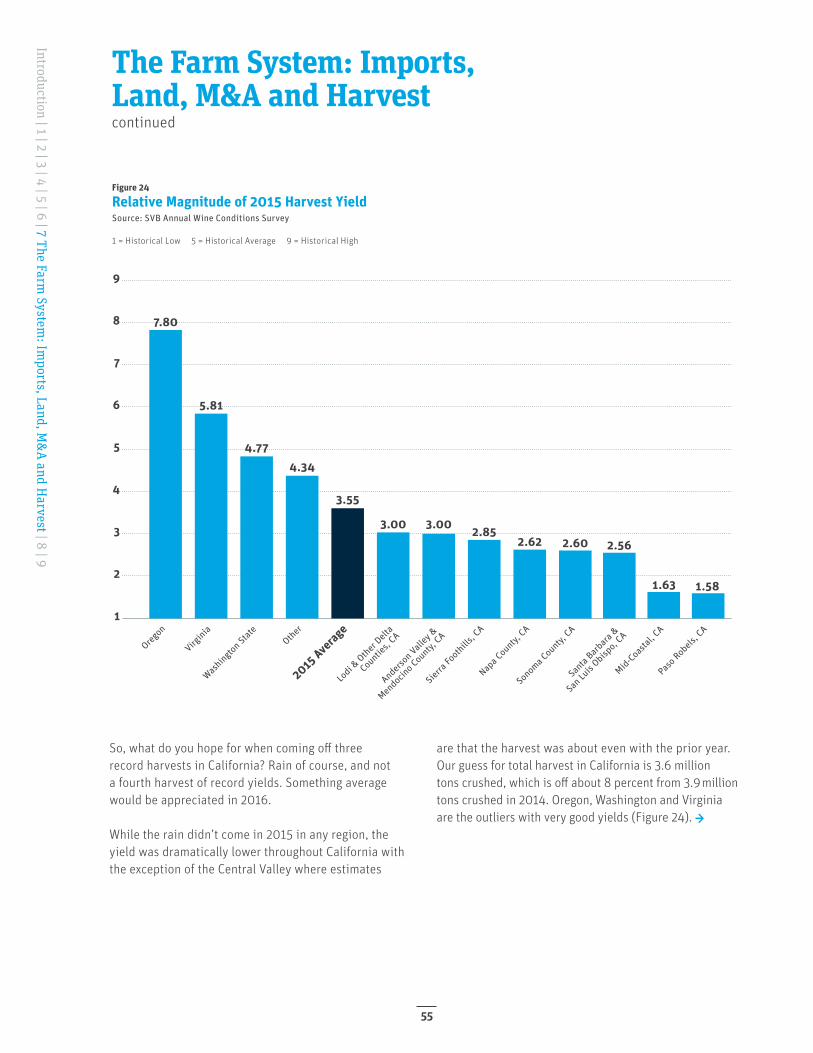
Figure 24
Relative Magnitude of 2015 Harvest YieldSource: SVB Annual Wine Conditions Survey
1
2
3
4
5
6
7
9
8
Oregon
Virginia
Washingto
n State
Other
2015 Average
Lodi &
Other Delt
a
Counties,
CA
Anderson Vall
ey &
Mendocin
o County, CA
Sierra
Foothills
, CA
Napa C
ounty, CA
Sonoma County,
CA
Santa
Barbara
&
San Lu
is Obisp
o, CA
Mid-Coastal
, CA
Paso Robels
, CA
7.80
5.81
4.774.34
3.55
3.00 3.00 2.852.62 2.60 2.56
1.63 1.58
1 = Historical Low 5 = Historical Average 9 = Historical High
So, what do you hope for when coming off three record harvests in California? Rain of course, and not a fourth harvest of record yields. Something average would be appreciated in 2016.
While the rain didn’t come in 2015 in any region, the yield was dramatically lower throughout California with the exception of the Central Valley where estimates
are that the harvest was about even with the prior year. Our guess for total harvest in California is 3.6 million tons crushed, which is off about 8 percent from 3.9million tons crushed in 2014. Oregon, Washington and Virginia are the outliers with very good yields (Figure 24). →
The Farm System: Imports, Land, M&A and Harvestcontinued
Introduction | 1 | 2 | 3 | 4 | 5 | 6 | 7 The Farm System
: Imports, Land, M
&A and H
arvest | 8 | 9
55
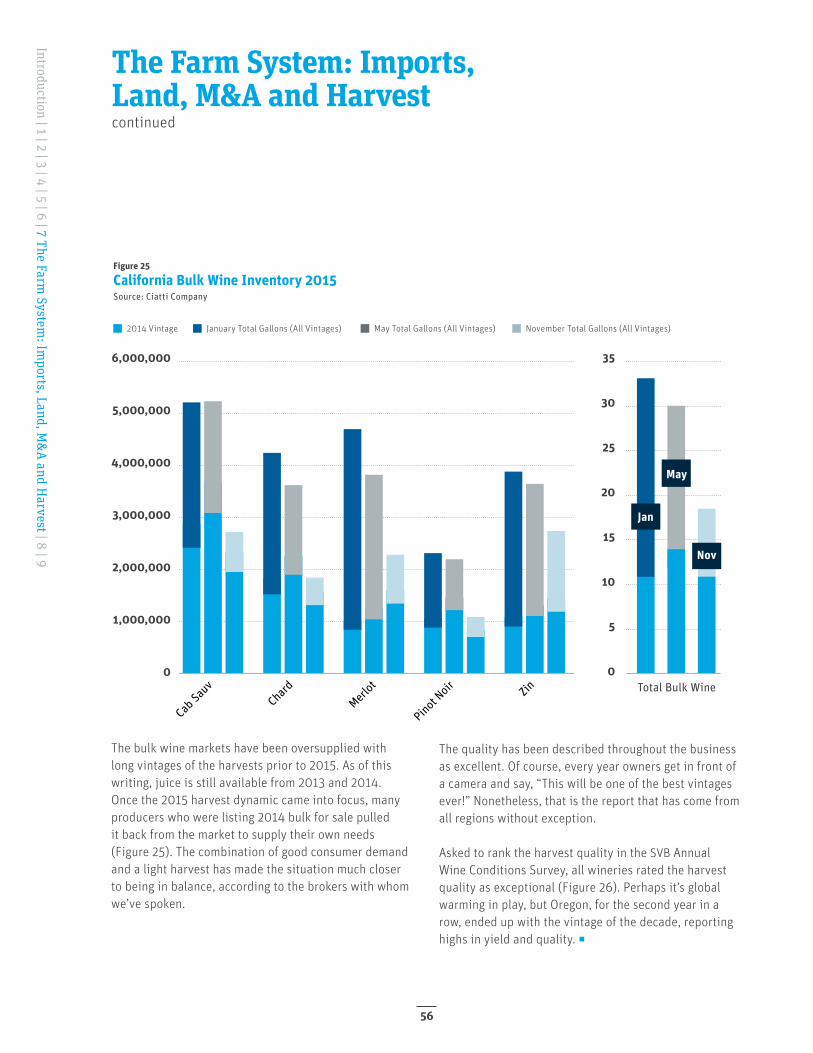
Figure 25
California Bulk Wine Inventory 2015Source: Ciatti Company
2014 Vintage January Total Gallons (All Vintages) May Total Gallons (All Vintages) November Total Gallons (All Vintages)
6,000,000
5,000,000
4,000,000
3,000,000
2,000,000
1,000,000
0
35
30
25
20
15
10
5
0Total Bulk Wine
Jan
May
Nov
Cab Sau
vChard
Merlot
Pinot Noir Zin
The Farm System: Imports, Land, M&A and Harvestcontinued
The bulk wine markets have been oversupplied with long vintages of the harvests prior to 2015. As of this writing, juice is still available from 2013 and 2014. Once the 2015 harvest dynamic came into focus, many producers who were listing 2014 bulk for sale pulled it back from the market to supply their own needs (Figure 25). The combination of good consumer demand and a light harvest has made the situation much closer to being in balance, according to the brokers with whom we’ve spoken.
The quality has been described throughout the business as excellent. Of course, every year owners get in front of a camera and say, “This will be one of the best vintages ever!” Nonetheless, that is the report that has come from all regions without exception.
Asked to rank the harvest quality in the SVB Annual Wine Conditions Survey, all wineries rated the harvest quality as exceptional (Figure 26). Perhaps it’s global warming in play, but Oregon, for the second year in a row, ended up with the vintage of the decade, reporting highs in yield and quality. ◻
Introduction | 1 | 2 | 3 | 4 | 5 | 6 | 7 The Farm System
: Imports, Land, M
&A and H
arvest | 8 | 9
56
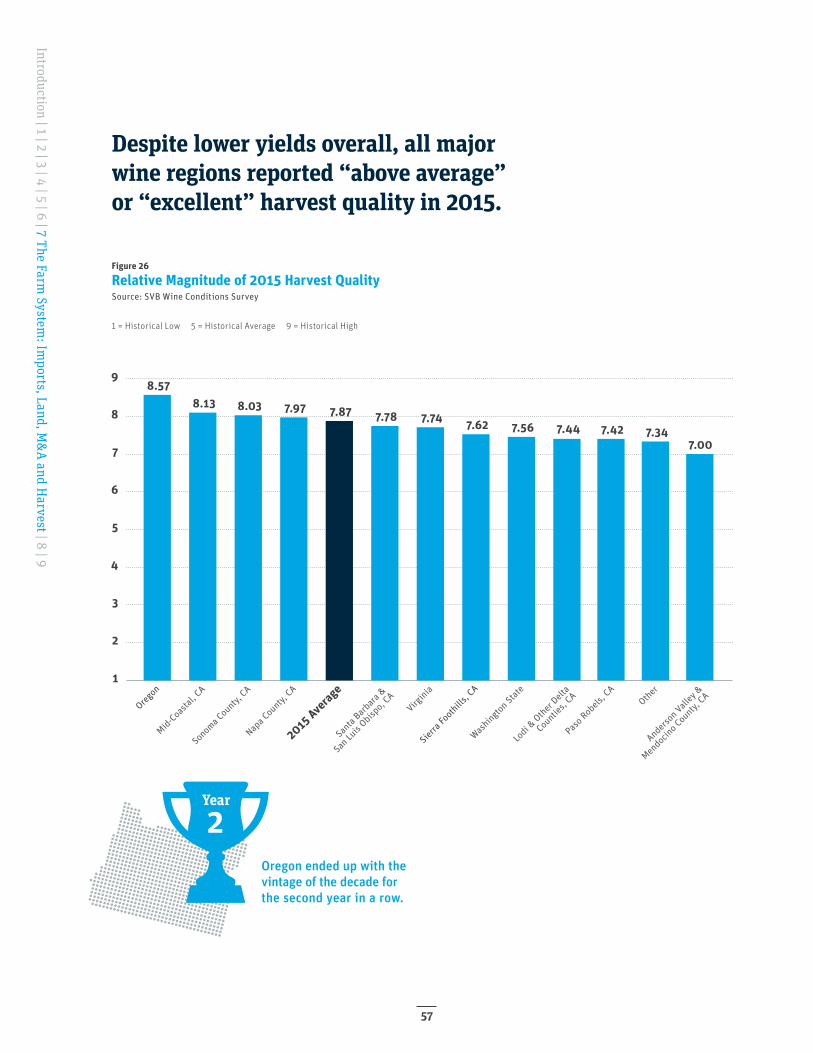
1
2
3
4
5
6
7
8
9
Oregon
Mid-Coastal
, CA
Sonoma County,
CA
Napa C
ounty, CA
2015 Average
Santa
Barbara
&
San Lu
is Obisp
o, CA
Virginia
Sierra
Foothills
, CA
Washingto
n State
Lodi &
Other Delt
a
Counties,
CA
Paso Robels
, CA
Other
Anderson Vall
ey &
Mendocin
o County, CA
8.578.13 8.03 7.97 7.87 7.78 7.74 7.62 7.56 7.44 7.42 7.34
7.00
Figure 26
Relative Magnitude of 2015 Harvest QualitySource: SVB Wine Conditions Survey
1 = Historical Low 5 = Historical Average 9 = Historical High
Oregon ended up with the vintage of the decade for the second year in a row.
Year
2
Despite lower yields overall, all major wine regions reported “above average” or “excellent” harvest quality in 2015.
Introduction | 1 | 2 | 3 | 4 | 5 | 6 | 7 The Farm System
: Imports, Land, M
&A and H
arvest | 8 | 9
57
Crash Davis: You be cocky and arrogant, even when you’re getting beat. That’s the secret. You gotta play this game with fear and arrogance.
Ebby Calvin LaLoosh: Right. Fear and ignorance.
Crash Davis: [exasperated] No. You hayseed. It’s arrogance not ‘ignorance.’
8Introduction | 1 | 2 | 3 | 4 | 5 | 6 | 7 | 8 Collective Bargaining Agreem
ent: Industry Financial Performance | 9
58
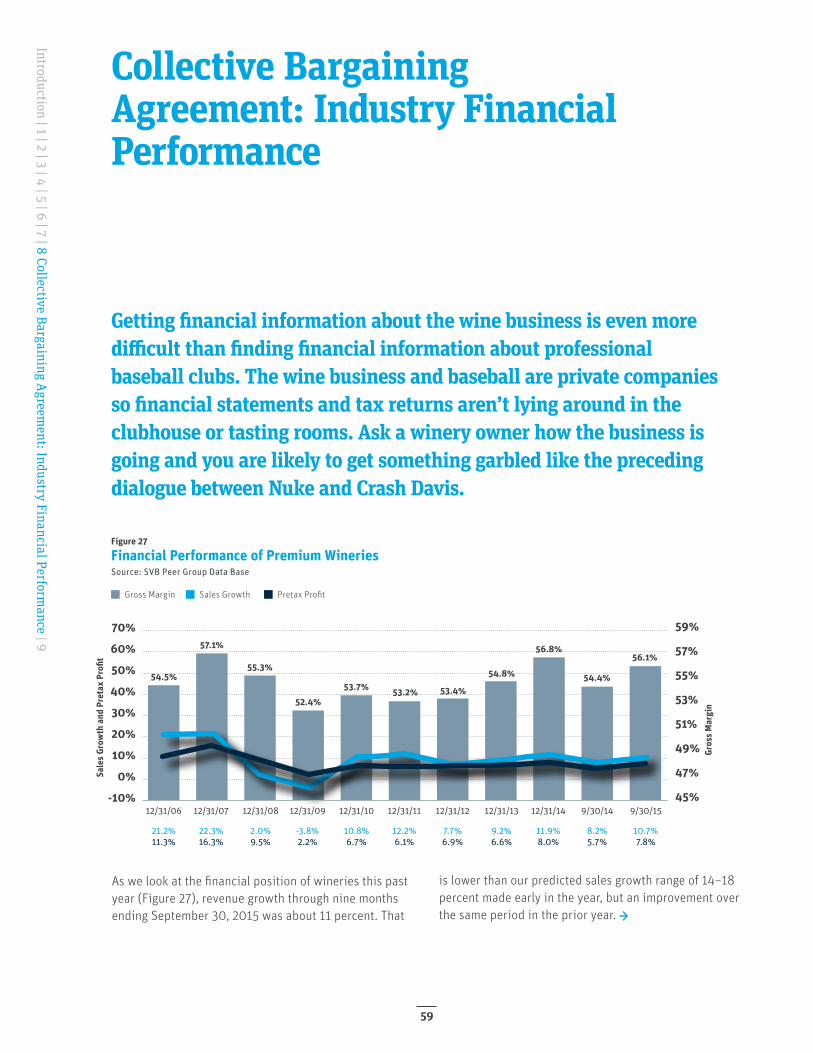
Figure 27
Financial Performance of Premium WineriesSource: SVB Peer Group Data Base
Gross Margin Sales Growth Pretax Profit
70%
60%
50%
40%
30%
20%
10%
0%
-10%
59%
57%
55%
53%
51%
49%
47%
45%
Gros
s Mar
gin
Sale
s Gro
wth
and
Pre
tax
Pro�
t
12/31/06 12/31/07 12/31/08 12/31/09 12/31/10 12/31/11 12/31/12 12/31/13 12/31/14 9/30/14 9/30/15
21.2%11.3%
22.3%16.3%
2.0%9.5%
-3.8%2.2%
10.8%6.7%
12.2%6.1%
7.7%6.9%
9.2%6.6%
11.9%8.0%
8.2%5.7%
10.7%7.8%
54.5%
57.1%
55.3%
52.4%53.7% 53.2% 53.4%
54.8%
56.8%
54.4%
56.1%
Getting financial information about the wine business is even more difficult than finding financial information about professional baseball clubs. The wine business and baseball are private companies so financial statements and tax returns aren’t lying around in the clubhouse or tasting rooms. Ask a winery owner how the business is going and you are likely to get something garbled like the preceding dialogue between Nuke and Crash Davis.
As we look at the financial position of wineries this past year (Figure 27), revenue growth through nine months ending September 30, 2015 was about 11 percent. That
is lower than our predicted sales growth range of 14–18 percent made early in the year, but an improvement over the same period in the prior year. →
Collective Bargaining Agreement: Industry Financial Performance
Introduction | 1 | 2 | 3 | 4 | 5 | 6 | 7 | 8 Collective Bargaining Agreement: Industry Financial Perform
ance | 9
59
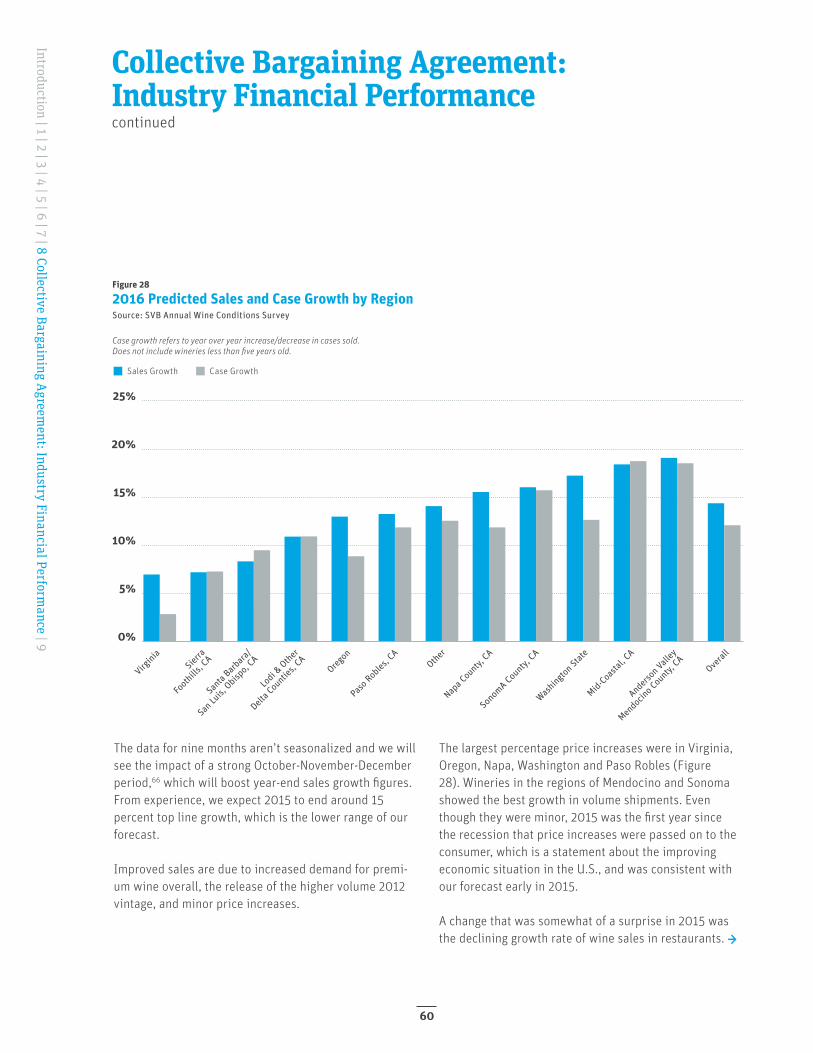
Figure 28
2016 Predicted Sales and Case Growth by RegionSource: SVB Annual Wine Conditions Survey
Case growth refers to year over year increase/decrease in cases sold.Does not include wineries less than five years old.
25%
20%
15%
10%
5%
0%
Virginia
Paso Robles
, CA
Lodi &
Other
Delta C
ounties,
CAOreg
onOther
Sierra
Foothills
, CA
Washingto
n State
Santa
Barbara
/
San Lu
is, Obisp
o, CA
Mid-Coastal
, CA
Overal
l
SonomA County, CA
Anderson Vall
ey
Mendocin
o County, CA
Napa C
ounty, CA
Sales Growth Case Growth
Collective Bargaining Agreement: Industry Financial Performancecontinued
The data for nine months aren’t seasonalized and we will see the impact of a strong October-November-December period,66 which will boost year-end sales growth figures. From experience, we expect 2015 to end around 15 percent top line growth, which is the lower range of our forecast.
Improved sales are due to increased demand for premi-um wine overall, the release of the higher volume 2012 vintage, and minor price increases.
The largest percentage price increases were in Virginia, Oregon, Napa, Washington and Paso Robles (Figure 28). Wineries in the regions of Mendocino and Sonoma showed the best growth in volume shipments. Even though they were minor, 2015 was the first year since the recession that price increases were passed on to the consumer, which is a statement about the improving economic situation in the U.S., and was consistent with our forecast early in 2015.
A change that was somewhat of a surprise in 2015 was the declining growth rate of wine sales in restaurants. →
Introduction | 1 | 2 | 3 | 4 | 5 | 6 | 7 | 8 Collective Bargaining Agreement: Industry Financial Perform
ance | 9
60
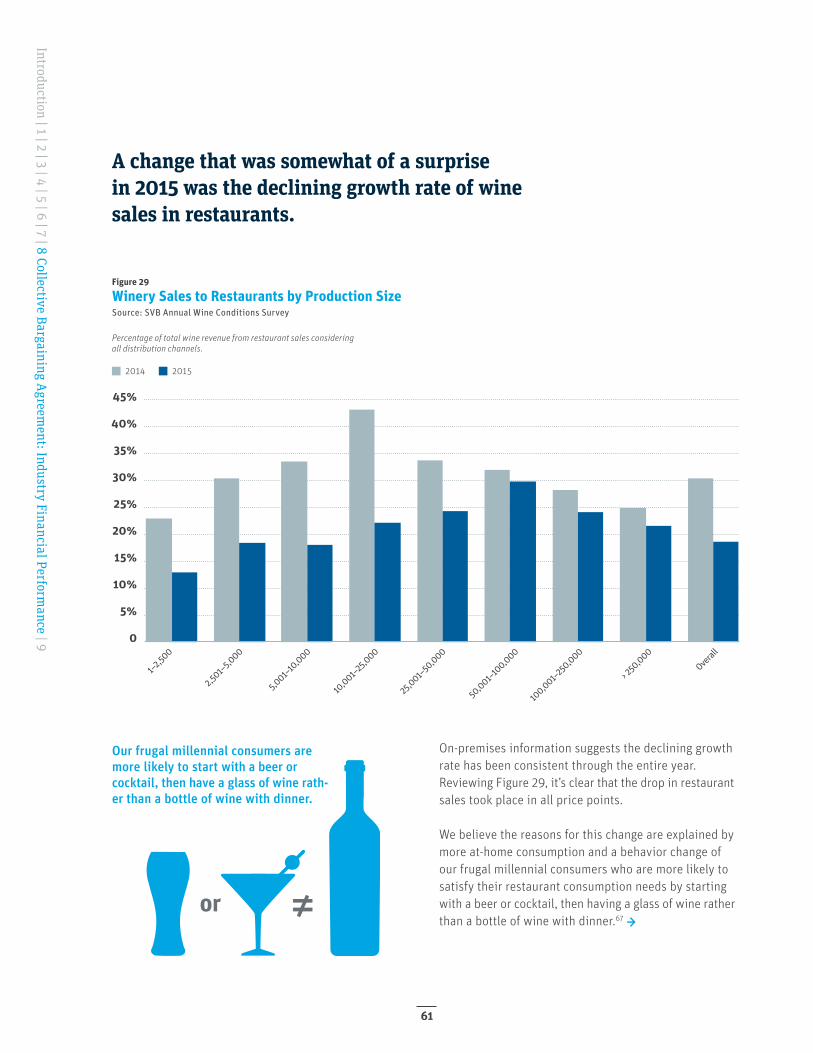
Figure 29
Winery Sales to Restaurants by Production SizeSource: SVB Annual Wine Conditions Survey
Percentage of total wine revenue from restaurant sales considering all distribution channels.
2014 2015
2,501–
5,000
5,001–1
0,000
10,001–2
5,000
25,001–
50,000
50,001–1
00,000
100,001–2
50,000
> 250
,000Over
all
1–2,50
0
45%
40%
35%
30%
25%
20%
15%
10%
5%
0
On-premises information suggests the declining growth rate has been consistent through the entire year. Reviewing Figure 29, it’s clear that the drop in restaurant sales took place in all price points.
We believe the reasons for this change are explained by more at-home consumption and a behavior change of our frugal millennial consumers who are more likely to satisfy their restaurant consumption needs by starting with a beer or cocktail, then having a glass of wine rather than a bottle of wine with dinner.67 →
A change that was somewhat of a surprise in 2015 was the declining growth rate of wine sales in restaurants.
Our frugal millennial consumers are more likely to start with a beer or cocktail, then have a glass of wine rath-er than a bottle of wine with dinner.
Introduction | 1 | 2 | 3 | 4 | 5 | 6 | 7 | 8 Collective Bargaining Agreement: Industry Financial Perform
ance | 9
61
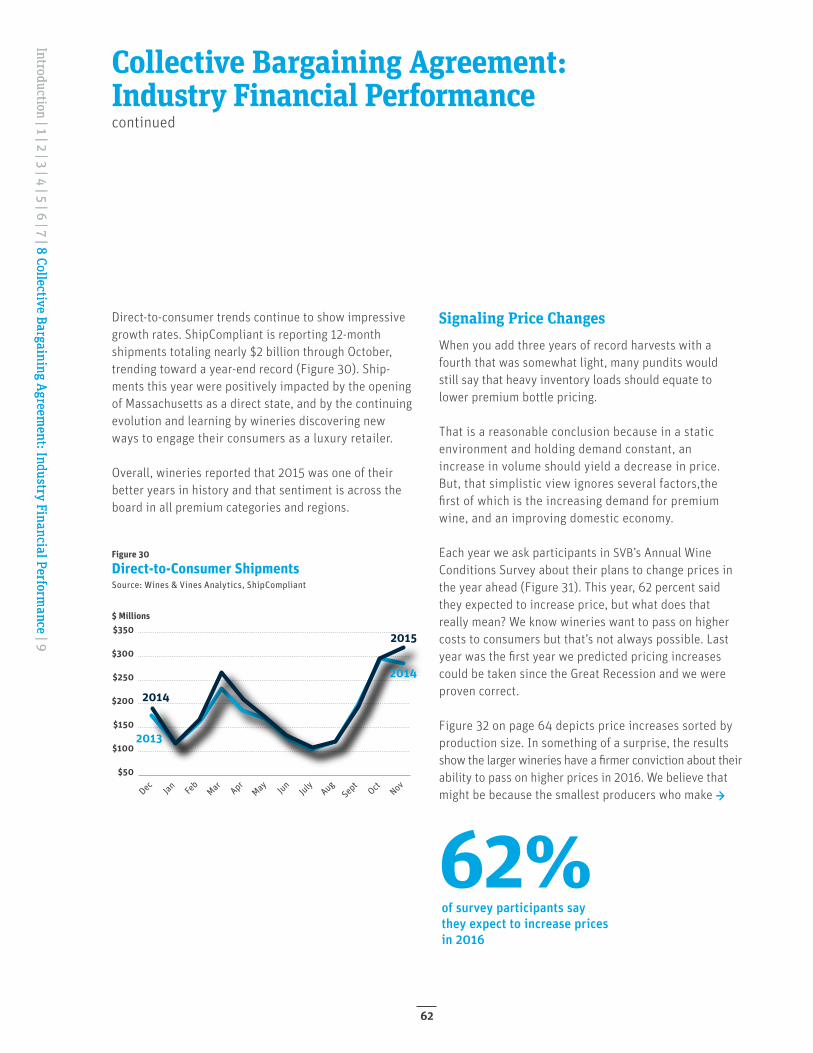
Figure 30
Direct-to-Consumer ShipmentsSource: Wines & Vines Analytics, ShipCompliant
$350
$300
$250
$200
$150
$100
$50
Dec Oct NovJan Fe
bMar Apr
May JunJuly Aug
Sept
$ Millions
2014
2015
2014
2013
Direct-to-consumer trends continue to show impressive growth rates. ShipCompliant is reporting 12-month shipments totaling nearly $2 billion through October, trending toward a year-end record (Figure 30). Ship-ments this year were positively impacted by the opening of Massachusetts as a direct state, and by the continuing evolution and learning by wineries discovering new ways to engage their consumers as a luxury retailer.
Overall, wineries reported that 2015 was one of their better years in history and that sentiment is across the board in all premium categories and regions.
Signaling Price ChangesWhen you add three years of record harvests with a fourth that was somewhat light, many pundits would still say that heavy inventory loads should equate to lower premium bottle pricing.
That is a reasonable conclusion because in a static environment and holding demand constant, an increase in volume should yield a decrease in price. But, that simplistic view ignores several factors,the first of which is the increasing demand for premium wine, and an improving domestic economy.
Each year we ask participants in SVB’s Annual Wine Conditions Survey about their plans to change prices in the year ahead (Figure 31). This year, 62 percent said they expected to increase price, but what does that really mean? We know wineries want to pass on higher costs to consumers but that’s not always possible. Last year was the first year we predicted pricing increases could be taken since the Great Recession and we were proven correct.
Figure 32 on page 64 depicts price increases sorted by production size. In something of a surprise, the results show the larger wineries have a firmer conviction about their ability to pass on higher prices in 2016. We believe that might be because the smallest producers who make →
Collective Bargaining Agreement: Industry Financial Performancecontinued
62%of survey participants say they expect to increase prices in 2016
Introduction | 1 | 2 | 3 | 4 | 5 | 6 | 7 | 8 Collective Bargaining Agreement: Industry Financial Perform
ance | 9 Introduction | 1 | 2 | 3 | 4 | 5 | 6 | 7 | 8 Collective Bargaining Agreem
ent: Industry Financial Performance | 9
62
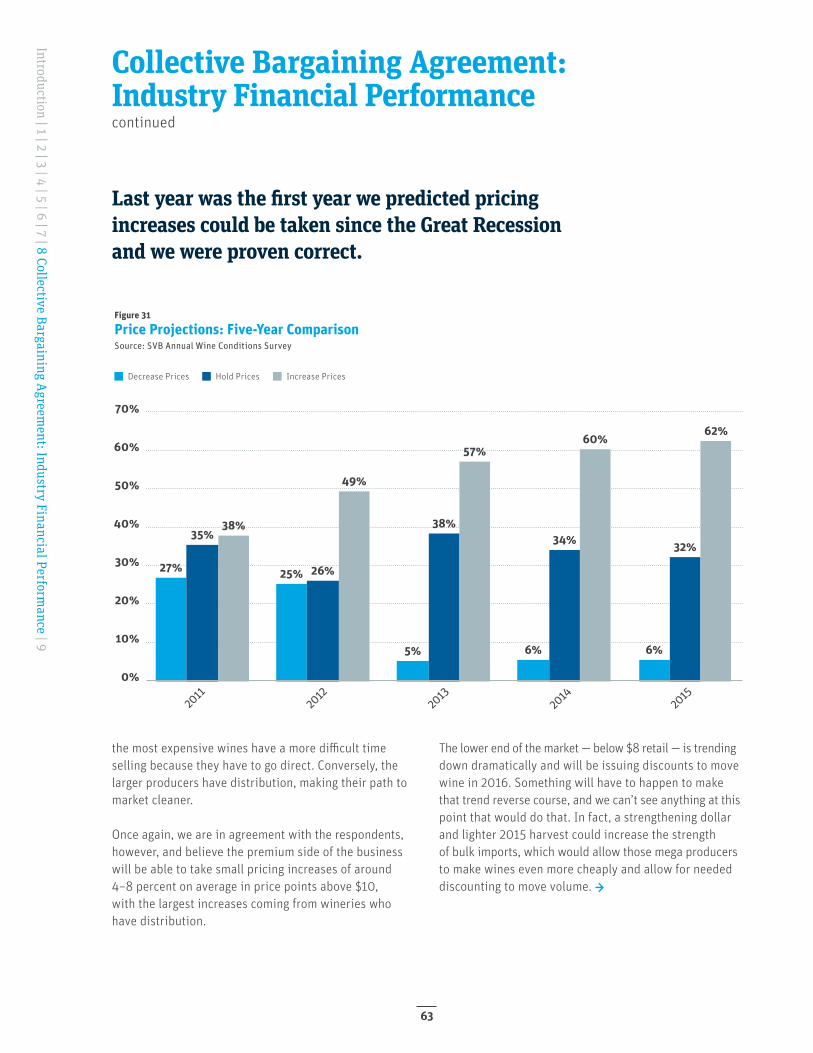
2012
2013
2014
2015
2011
70%
60%
50%
40%
30%
20%
10%
0%
27%
35%38%
25% 26%
49%
57%60%
34%
6%
62%
32%
6%
38%
5%
Figure 31
Price Projections: Five-Year ComparisonSource: SVB Annual Wine Conditions Survey
Decrease Prices Hold Prices Increase Prices
the most expensive wines have a more difficult time selling because they have to go direct. Conversely, the larger producers have distribution, making their path to market cleaner.
Once again, we are in agreement with the respondents, however, and believe the premium side of the business will be able to take small pricing increases of around 4–8 percent on average in price points above $10, with the largest increases coming from wineries who have distribution.
The lower end of the market — below $8 retail — is trending down dramatically and will be issuing discounts to move wine in 2016. Something will have to happen to make that trend reverse course, and we can’t see anything at this point that would do that. In fact, a strengthening dollar and lighter 2015 harvest could increase the strength of bulk imports, which would allow those mega producers to make wines even more cheaply and allow for needed discounting to move volume. →
Last year was the first year we predicted pricing increases could be taken since the Great Recession and we were proven correct.
Collective Bargaining Agreement: Industry Financial Performancecontinued
Introduction | 1 | 2 | 3 | 4 | 5 | 6 | 7 | 8 Collective Bargaining Agreement: Industry Financial Perform
ance | 9
63
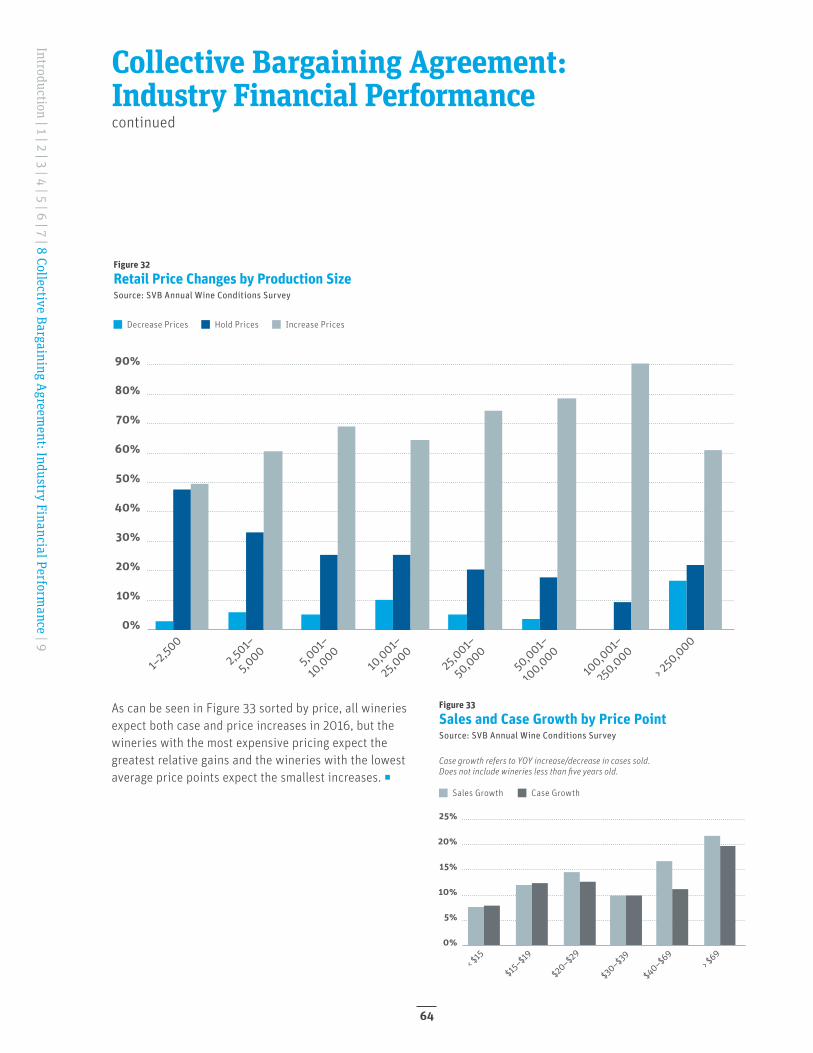
2,501–
5,000
5,001–
10,000
10,001–
25,000
25,001–
50,000
50,001–
100,000
100,001–
250
,000
> 250
,000
1–2,5
00
90%
80%
70%
60%
50%
40%
30%
20%
10%
0%
Figure 32
Retail Price Changes by Production SizeSource: SVB Annual Wine Conditions Survey
Decrease Prices Hold Prices Increase Prices
Figure 33
Sales and Case Growth by Price PointSource: SVB Annual Wine Conditions Survey
Case growth refers to YOY increase/decrease in cases sold. Does not include wineries less than five years old.
Sales Growth Case Growth
$15–
$19
$20–$2
9
$30–$3
9
$40–$6
9> $
69< $
15
25%
20%
15%
10%
5%
0%
As can be seen in Figure 33 sorted by price, all wineries expect both case and price increases in 2016, but the wineries with the most expensive pricing expect the greatest relative gains and the wineries with the lowest average price points expect the smallest increases. ◻
Collective Bargaining Agreement: Industry Financial Performancecontinued
Introduction | 1 | 2 | 3 | 4 | 5 | 6 | 7 | 8 Collective Bargaining Agreement: Industry Financial Perform
ance | 9
64
All wineries expect both case and price increases in 2016, but the wineries with the most expensive pricing expect the greatest relative gains.
Introduction | 1 | 2 | 3 | 4 | 5 | 6 | 7 | 8 Collective Bargaining Agreement: Industry Financial Perform
ance | 9
65
Crash Davis: It’s time to work on your interviews.
Ebby Calvin LaLoosh: My interviews? What do I gotta do?
Crash Davis: You’re gonna have to learn your clichés. You’re gonna have to study them, you’re gonna have to know them. They’re your friends. Write this down:
“We gotta play it one day at a time.”
Ebby Calvin LaLoosh: Got to play … that’s pretty boring.
Crash Davis: ‘Course it’s boring, that’s the point. Write it down.
9Introduction | 1 | 2 | 3 | 4 | 5 | 6 | 7 | 8 | 9 Bottom
of the Ninth: Final Thoughts
66
We started this report noting the theme was adapting to change and passing the torch. As the dominant cohort changes, the passing won’t be smooth and we are forecasting the evolution will result in a decline in overall consumption for a time. And while premiumization is good news for smaller wine companies, that isn’t going to protect them from mass producers who want that premium market too. But perhaps the largest emerging threat for the small premium winery outside of local anti-winery/tourism sentiment is competition from bottled imports. While this is a competitive business, like baseball there are a set of un-written rules. The relative youth of the business has created an industry that needed to be collaborative to succeed and that DNA remains. When there is a need, farmers, winemakers, industry organizations, winery owners — and maybe even an enlightened banker or two — come to-gether to find solutions. So we are quite confident the industry will find creative ways to overcome and succeed and remain thrilled to call this business our home field. Finally, we leave readers with the best advice from Ebby Calvin “Nuke” LaLoosh who, with all of his new interview skills said, “This is a very simple game. You throw the ball. You catch the ball. You hit the ball. Some-times you win, sometimes you lose, sometimes — it rains. Think about that for a while.” Play ball!
Bottom of the Ninth: Final Thoughts
Introduction | 1 | 2 | 3 | 4 | 5 | 6 | 7 | 8 | 9 Bottom of the N
inth: Final Thoughts
67
1 The 1988-1999 drought was historic and acute throughout the U.S. http://en.wikipedia.org/wiki/1988%E2%80%9389_North_American_drought
2 October 19, 1987 was Black Monday which is still the record for the biggest one day percentage loss in history of the U.S. stock market in a single day. https://en.wikipedia.org/wiki/Black_Mon-day_(1987)
3 The History of Oil Prices: http://politics.lilithezine.com/Histo-ry-of-Oil-Prices.html
4 The terms trading up, trading down and premiumization are used in the wine trade to explain the general direction of forward consumer pricing preference. The words do not appear in Webster’s dictionary in this context thus limiting their use in Scrabble. While the origins of said terms as they relate to wine are undocumented, at least one source has given original attri-bution to the author of this report. At a minimum, can inclusion in the Urban Dictionary be far behind? http://winecurmudgeon.com/?s=rob+mcmillan&x=0&y=0
5 See Allied Grape Growers Past & Present: http://www.allied-grapegrowers.org/pdf/AGGhistory.pdf
6 Napa County’s Wine Definition Ordinance was finalized in 1990 after a great deal of work from interested parties on all sides of the debate. http://bit.ly/1Rv6ySL
7 California Wine Institute shows 1,541 wineries existed in the U.S. in 1988. As of 2014, they list 10,417 wineries for a com-pound growth rate of a whopping 26 percent annually. http://www.wineinstitute.org/resources/statistics/article124
8 Bull Durham: http://www.imdb.com/title/tt0094812/
9 There is no agreed-upon reference point for the term “fine wine” in the industry. We use $20 a bottle as a definition, because we have access to several databases that have a breakpoint at $20 or more.
10 http://www.winesandvines.com/template.cfm?section=news&-content=142644
11 Yes, I know the wheel is more complex than that. Just go with me on it. It’s an analogy.
12 l’Organisation Internationale de la Vigne et du Vin, April 15 2015 press release. http://www.oiv.int/oiv/files/EN_Communique_de_Presse_15_avril_2015.pdf
13 Ibid
14 Ibid
15 Ciatti World Report, December 2014: http://www.ciatti.com/sites/default/files/november_2014_ciatti_world_report.pdf
16 L’Organisation Internationale de la Vigne et du Vin (OIV) statis-tical releases.
17 Yes, I know that the play at the plate has been altered to avoid collisions. You baseball purists need to get a life! Just pretend, OK? And besides, the section is on history so there were colli-sions at home plate in the olden days.
18 The first successful commercial winery in America was in Vevay, Indiana in about 1806. For more on the topic see my blog: http://svbwine.blogspot.com/2013/07/where-was-first-successful-win-ery-in-us.html
19 Bancroft, History of California , 5: 643; John Walton Caughey, California (New York, 1940), p. 305.
20 The Volstead Act was the enabling legislation underpinning the 18th Amendment to the U.S. Constitution. https://en.wikipedia.org/wiki/Volstead_Act
21 California Winery Oral History Project, Bancroft Library, Univer-sity of California Berkeley. http://digitalassets.lib.berkeley.edu/roho/ucb/text/adams_leon_ca_wine.pdf
22 Of course, not all production was captured as a large amount of wine was made illegally, but there were legal uses that were reported and that was the bottom of reported production.
23 California Wine Institute
24 Wine Institute, Dept. Of Commerce, Jon Fredrikson. https://www.wineinstitute.org/files/Jon%20Fredrikson%20Presentation%20WI%2075th.pdf
25 California Grape Acreage Report, California Agriculture Statistical Service, 1972.
26 In my family, we had a gallon of wine with a screw cap always available. It was kept in ideal storage conditions beneath the sink next to the garbage disposal. The value of the screw cap to a young man is that sampling could take place and all removals could be replaced with tap water without knowledge of household regulatory bodies.
27 Lancers and Mateus, from Portugal and Blue Nun from Germany were wildly successful brands which got their start post WWII, each peaking at well over 1 million cases imported in the mid-1980s.
28 Neo-Prohibitionism http://fxn.ws/1OIZuB0
Endnotes
Introduction | 1 | 2 | 3 | 4 | 5 | 6 | 7 | 8 | 9
68
29 Examples of the 1960s commercials: http://bit.ly/1XNqntf
30 Frank Schoonmaker (Encyclopedia of Wine, 1964) was an original proponent of the varietal labeling of wines in America. The term fighting varietal has no verifiable author, though several wineries have been suggested, including Glen Ellen and Mondavi. http://for.tn/1lHkXi6
31 Bartles & Jaymes was viewed in advertising circles as an iconic event. http://bit.ly/1llSOxD
32 Judgment of Paris https://en.wikipedia.org/wiki/Judgment_of_ Paris_(wine) see also Bottle Shock; http://www.imdb.com/title/tt0914797/ a stylized version of the Judgment of Paris from the perspectives of Chateau Montelena and Steven Spurrier.
33 The French Paradox, 60 Minutes, 1991: http://bit.ly/1R3Euq2
34 Small wine companies at the time were seeing sales growth as high as 35 percent and their production sold out in six to nine months.
35 1999 Adams Wine Handbook
36 The Yellow Tail Story: http://bit.ly/1NA3fDK
37 The prediction published in the 2006 State of the Industry Report intended to point out a threat and rock the boat a bit; it rocked it more than I had intended. The piece was sensation-alized by my now-departed friend Rich Cartiere, publisher of Wine Market Report. His coverage was picked up in newspapers elsewhere. While I can’t find his report today, I was able to locate a NYT article on Yellow Tail that cites Rich and the SVB report toward the end of the article. If nothing else, the article here is instructive of the perceptions at the time. The end of the story is I’ve since been invited back to speak several times by my Central Valley colleagues, and help find new solutions to make the region more successful. http://nyti.ms/1NaP88B
38 Great Depression: http://www.history.com/topics/great-depres-sion
39 I moved my 89-year-old mom from her home of 60+ years in July. She bought her house as part of the GI Bill with my dad. They had one mortgage and paid it off in 30 years. They never moved. You can’t begin to understand how much stuff she had ‘saved,’ and how hard that was to move because she couldn’t throw away any-thing. Every piece had to be reviewed and a call made to someone to see if it could be used by someone else … such as a Mr. Coffee coffee maker from 1973, and fabric scraps that someone could use, held from 25 years of making clothes for the kids. When we got to the end and had to make a few dump runs, she was almost sick thinking about adding to the landfills. It was made even worse knowing we had to pay to throw it away.
40 The first real revolving consumer charge card was the BankAmeriCard started in the late 1950s. https://en.wikipedia.org/wiki/Credit_card
41 Many articles are available about the millennials and the Great Recession. Here’s one: http://www.cheatsheet.com/politics/this-is-what-the-recession-did-to-millennials.html/?a=viewall
42 The Tax Reform Act of 1986 eliminated the deductibility of “per-sonal interest,” which effectively was credit card interest. Before that, baby boomer consumers could run up credit card balances and that interest was deductible. That practice is believed by many to have encouraged the overuse and abuse of revolving credit card debt.
43 Gateway wines are a term used in the trade for entry-level wine that has historically been produced in California’s Central Valley. They were simple, well-made wines, often with a little residual sugar remaining that appealed to wine consumers at the start of their discovery curve. That’s another word that should be added to the Urban Dictionary.
44 Silicon Valley Bank Annual Wine Conditions Survey, Dec. 2015. The survey is not weighted by volume. Results are averaged with all wineries carrying an equal weight. That allows us to create charts that can be used for benchmarking. The results are skewed to fine wine production since by number, most wineries take the high-quality low-volume path.
45 Ibid. The question asked in the survey of over 500 wineries was to share information about the demographic makeup of their direct sales. While we asked about direct sales only, we did so because it’s not possible for wineries to track cohort information once passed along into the three-tier system. We believe the responses should still be representative of their customers in all channels.
46 Technomic: https://blogs.technomic.com/technomic-finds-millen-nials-adult-beverage-choices-evolving-as-they-mature/
47 “Frugal luxury” is a term I’m coining to describe a consumer trend I’ve noticed but haven’t seen documented. Younger consumers understand artisanship and quality. Instead of consuming as much as they can by volume on credit as did my generation, they prefer to live in smaller homes, reduce their rent expense, stay away from consumer credit, drive less expensive cars that have appealing style and save their discretionary income for simple luxuries they truly enjoy.
48 Sideways Impact on Merlot and Pinot Noir sales. http://www.winesandvines.com/template.cfm?section=features&con-tent=61265
Endnotescontinued
Introduction | 1 | 2 | 3 | 4 | 5 | 6 | 7 | 8 | 9
69
Endnotescontinued
49 Gallo Consumer Wine Trends Survey: http://www.multivu.com/players/English/7693851-e-j-gallo-wine-trends-survey-2015/
50 Granholm v Heald: https://en.wikipedia.org/wiki/Granholm_v._Heald
51 Wine Sparks War Between the States, Peter Sinton, Chronicle Senior Writer April 6, 1996, p2.
52 Estimates of direct sales in the mid-1990s vary widely in the literature.
53 The findings of a Sonoma State survey on the locals’ views of tourism was revealing and covered in a blog post here: http://bit.ly/1NSAVmo
54 Napa Traffic is from Locals: http://napavalleyregister.com/news/local/study-reveals-who-s-clogging-napa-highways/arti-cle_267462a6-3de7-58fa-80f4-4055273d2621.html
55 The quote from Crash was edited slightly to keep a PG rating.
56 Wine Intelligence: http://bit.ly/1OOC8Ik
57 Constellation Acquires Vincor, Kim Crawford, and other labels: http://bit.ly/21GdxfQ
58 The Sonoma State University study has not yet been through peer review and the findings are still preliminary. The complete study hasn’t been published. The findings are skewed to millennial wine consumers, but the findings are useful, painting a good view of their current consumption patterns. A story on the survey can be found here: http://bit.ly/1NDkGDs
59 Moscato article: http://bit.ly/1XL1Hll
60 Slight edit of the quote to remove the ‘s’ word.
61 Information isn’t presented about Washington and Oregon land and values in this report because of a lack of data available. Without question, growth rates in both states exceed what is happening in California, precisely because there is plantable land in Oregon and Washington that fits consumer demand, at better values compared to California.
62 Superior good: https://en.wikipedia.org/wiki/Superior_good
63 Roger Nabedian, SVP and GM of Gallo’s Premium Wine Division said, “As we have an eye toward more luxury wine, we have been pretty aggressive about buying high-quality vineyard land in what I think are the most premium appellations across the coastal areas of California.” Similar quotes in the press can easily be found from other of the large producers.
64 The Asti Winery acquisition by Gallo had an interesting, almost artistic quality to it as in the 1960s, Italian Swiss Colony which occupied those digs, was bigger than Gallo.
65 I get a lot of calls about wine company multiples. While there is a range, the business is not homogenous so citing a multiple as a data point isn’t helpful. I cover the topic in a little more detail in my blog: http://bit.ly/1OITzfa
66 In the wine business, the months of October, November and December represent about 40 percent of annual sales.
67 Wine Market Council, 2015 and Technomic https://blogs.tech-nomic.com/2016-a-happy-new-year-on-premise/
Figure Notes:
† Includes: Napa Cabernet Sauvignon, Napa Merlot, Napa Cabernet Franc, Napa Pinot Noir, Napa Chardonnay, Sonoma Pinot Noir, Sonoma Chardonnay, Sonoma Cabernet Sauvignon, Sonoma Merlot, Mendocino Cabernet Sauvignon, Mendocino Merlot, Mendocino Pinot Noir, Mendocino Chardonnay, Central Coast (District 8 SB+SLO) Chardonnay, Central Coast (District 8) Pinot Noir, Oregon Pinot Noir, Oregon Chardonnay (Oregon Vineyard report not published in 2012; figures estimated).
Photos Courtesy of:
The Wine Cellar Insider/Jeff LeveThe Napa Valley Wine Library Association/St. Helen Public LibraryWPBT2The Anti-Saloon League Museum
Other images are in the public domain in its country of origin and other countries and areas where the copyright term is the author’s life plus 70 years or less or licensed under the Creative Commons Attribution-Share Alike 3.0 Unported license.
EPT’s BIG Red Wine-Pac is a registered trademark.
Introduction | 1 | 2 | 3 | 4 | 5 | 6 | 7 | 8 | 9
70
For more than 30 years, Silicon Valley Bank (SVB) has helped innovative companies and their investors move bold ideas forward, fast. SVB provides targeted financial services and expertise through its offices in innovation centers around the world. With commercial, international and private banking services, SVB helps address the unique needs of innovators. Forbes named SVB one of America’s best banks (2015) and one of America’s best-managed companies (2014). Learn more at svb.com.
About Silicon Valley Bank
Silicon Valley Bank’s Wine DivisionFounded in 1994, SVB’s Wine Division offers financial services and strategic advice to premium vineyards and wineries in the United States. With one of the largest banking teams in the country dedicated to the wine industry, SVB’s Wine Division has offices in Napa and Sonoma counties and serves clients in the fine wine pro-ducing regions of California, Oregon and Washington.Learn more at www.svb.com/winedivision.
For more information about this report or Silicon Valley Bank’s Wine Division, please call or email:
Rob McMillan Executive Vice President and FounderSilicon Valley Bank Wine Division 707.967.1367 [email protected] Tasman DriveSanta Clara, CA 95054
Introduction | 1 | 2 | 3 | 4 | 5 | 6 | 7 | 8 | 9
71
Introduction | 1 | 2 | 3 | 4 | 5 | 6 | 7 | 8 | 9
72
The Fine Print
This material, including without limitation to the statistical information herein, is provided for informational purposes only. The material is based in part on information from third-party sources that we believe to be reliable, but which have not been independently verified by us and for this reason we do not represent that the information is accurate or complete. The infor-mation should not be viewed as tax, investment, legal or other advice nor is it to be relied on in making an investment or other decision. You should obtain relevant and specific professional advice before making any investment decision. Nothing relating to the material should be construed as a solicitation, offer or recommendation to acquire or dispose of any investment or to engage in any other transaction.
©2016 SVB Financial Group. All rights reserved. SVB>, SVB Financial Group, and Silicon Valley Bank are registered trademarks. SVB Private Bank is a division of Silicon Valley Bank. Silicon Valley Bank is a member of FDIC and Federal Reserve System. SVB Financial Group is also a member of the Federal Reserve System.
SVB Private Bank is a division of Silicon Valley Bank. Financial advisors, wealth managers and estate planning attorneys introduced to clients by SVB Private Bank are not affiliates of Silicon Valley Bank. Investments recommended by these or any other third-party provider of wealth management and financial planning services are not guaranteed by Silicon Valley Bank, are not insured by the FDIC, and may lose value. Neither Silicon Valley Bank nor its affiliates provide tax or legal advice. Please consult your tax or legal advisors for such guidance.
0116-008
Introduction | 1 | 2 | 3 | 4 | 5 | 6 | 7 | 8 | 9
73