state of washington pension funding council...
TRANSCRIPT

Milliman Actuarial Valuation
Issued August 5, 2016
State of Washington Pension Funding Council LEOFF 2 Board Actuarial Audit of June 30, 2015 Actuarial Valuation
Prepared by: Mark C. Olleman, FSA, EA, MAAA Consulting Actuary Nick J. Collier, ASA, EA, MAAA Consulting Actuary Daniel R. Wade, FSA, EA, MAAA Consulting Actuary Milliman, Inc. 1301 Fifth Avenue, Suite 3800 Seattle, WA 98101-2605 Tel +1 1 206 624 7940 milliman.com

Offices in Principal Cities Worldwide
This work product was prepared solely for the PFC and the LEOFF 2 Retirement Board for the purposes described herein and may not be appropriate to use for other purposes. Milliman does not intend to benefit and assumes no duty or liability to other parties who receive this work. Milliman recommends
that third parties be aided by their own actuary or other qualified professional when reviewing the Milliman work product. pfc0019.docx - 1 0003 PFC 9 / 003.PFC.10.2015 / MCO/NJC/DRW/nlo
1301 Fifth Avenue Suite 3800 Seattle, WA 98101-2605 USA
Tel +1 206 624 7940 Fax +1 206 623 3485
milliman.com
August 5, 2016
Mr. Jacob White Mr. Steve Nelsen Legal and Legislative Services Manager Executive Director Department of Retirement Services LEOFF Plan 2 Retirement Board
Re: Actuarial Audit Report
Dear Jacob and Steve,
The enclosed report presents the findings and comments resulting from a detailed review of the June 30, 2015 actuarial valuation performed by the Office of the State Actuary (OSA) for the Pension Funding Council (PFC) and the LEOFF 2 Board. An overview of our major findings is included in the Executive Summary section of the report. More detailed commentary on our review process is included in the latter sections.
All calculations for the actuarial valuation are based on Revised Code of Washington (RCW) and the actuarial assumptions proposed by the OSA based on its 2007 – 2012 experience study for use in the June 30, 2015 actuarial valuation. Note that for the 2015-2017 biennium, the actual contribution rates were calculated based on a phasing-in of the mortality improvement assumption for all plans but LEOFF 2. In this report, we have calculated contribution rates based on two sets of mortality assumptions, both the full mortality improvement assumption recommended in the experience study, and a version with the 2nd step of a phase-in of that assumption. For LEOFF 2, only the full assumptions were considered.
As discussed in our report, we believe the package of actuarial assumptions and methods is reasonable (taking into account the experience of Washington State Public Retirement Systems and reasonable expectations). Nevertheless, the emerging costs will vary from those presented in this report to the extent that actual experience differs from that projected by the actuarial assumptions. Future actuarial measurements may differ significantly from the current measurements presented in this report due to factors such as the following:
Plan experience differing from the actuarial assumptions, Future changes in the actuarial assumptions, Increases or decreases expected as part of the natural operation of the methodology used for these
measurements (such as potential additional contribution requirements due to changes in the plan’s funded status), and
Changes in the plan provisions or accounting standards.
Due to the scope of this assignment, we did not perform an analysis of the potential range of such measurements.
In preparing this report, we relied, without audit, on information (some oral and some in writing) supplied by the OSA’s staff. This information includes information supplied to the OSA by the Department of Retirement Systems (DRS) and the Washington State Investment Board (WSIB). This information includes, but is not limited to, statutory provisions, employee data, and financial information. In our examination of these data, we have found

Pension Funding Council
LEOFF 2 Board August 5, 2016
Page 2
This work product was prepared solely for the PFC and the LEOFF 2 Retirement Board for the purposes described herein and may not be appropriate to use for other purposes. Milliman does not intend to benefit and assumes no duty or liability to other parties who receive this work. Milliman recommends
that third parties be aided by their own actuary or other qualified professional when reviewing the Milliman work product. pfc0019.docx - 2 0003 PFC 9 / 003.PFC.10.2015 / MCO/NJC/DRW/nlo
them to be reasonably consistent and comparable with data used for other purposes. Since the audit results are dependent on the integrity of the data supplied, the results can be expected to differ if the underlying data is incomplete or missing. It should be noted that if any data or other information is inaccurate or incomplete, our calculations may need to be revised.
On the basis of the foregoing, we hereby certify that, to the best of our knowledge and belief, this report is complete and accurate and has been prepared in accordance with generally recognized and accepted actuarial principles and practices which are consistent with the Actuarial Standards of Practice promulgated by the Actuarial Standards Board and the applicable Guides to Professional Conduct, amplifying Opinions, and supporting Recommendations of the American Academy of Actuaries.
Milliman's work product was prepared exclusively for the Pension Funding Council and the LEOFF 2 Board for a specific and limited purpose. It is a complex, technical analysis that assumes a high level of knowledge concerning the operations of the Washington State Public Retirement Systems, and uses DRS’s census data, which Milliman has not audited. It is not for the use or benefit of any third party for any purpose. Any third party recipient of Milliman's work product who desires professional guidance should not rely upon Milliman's work product, but should engage qualified professionals for advice appropriate to its own specific needs.
The consultants who worked on this assignment are pension actuaries. Milliman’s advice is not intended to be a substitute for qualified legal or accounting counsel. The signing actuaries are independent of the plan sponsor. We are not aware of any relationship that would impair the objectivity of our work. We would like to express our appreciation to the OSA’s staff for their assistance in supplying the data and information on which this report is based. We are members of the American Academy of Actuaries and meet the Qualification Standards of the American Academy of Actuaries to render the actuarial opinion contained herein.
We respectfully submit the following report, and we look forward to discussing it with you.
Sincerely,
Mark C. Olleman, FSA, EA, MAAA Nick J. Collier, ASA, EA, MAAA Consulting Actuary Consulting Actuary
Daniel R. Wade, FSA, EA, MAAA Consulting Actuary MCO/NJC/DRW/nlo

Milliman Pension Funding Council and LEOFF 2 Board Actuarial Audit of 2015 Actuarial Valuation
This work product was prepared solely for the PFC and the LEOFF 2 Retirement Board for the purposes described herein and may not be appropriate to use for other purposes. Milliman does not intend to benefit and assumes no duty or liability to other parties who receive this work. Milliman recommends that third parties be aided by their own actuary or other qualified professional when reviewing the Milliman work product.
i
pfc0019.docx
Table of Contents
Page Certification Letter
Section 1 Summary of the Findings .............................................................................................................. 1
Section 2 Membership Data ............................................................................................................................ 9 Exhibit 2-1 Member Statistics as of June 30, 2015 .......................................................................................... 10
Section 3 Actuarial Value of Assets ............................................................................................................ 19 Exhibit 3-1 Comparison of Actuarial Value of Assets by Plan .......................................................................... 20
Section 4 Actuarial Liabilities ....................................................................................................................... 23 Exhibit 4-1 Present Value of Future Benefits by Benefit Type ......................................................................... 24 Exhibit 4-2 Present Value of Future Benefits by System .................................................................................. 25 Exhibit 4-3 Comparison of Entry Age Normal Accrued Liability ....................................................................... 27 Exhibit 4-4 Present Value of Future Salaries and EANC Rate ......................................................................... 27
Section 5 Funding .......................................................................................................................................... 29
Section 6 Review of Preliminary Report and Recommendations from Prior Audit ................................ 39

Milliman Pension Funding Council and LEOFF 2 Board Actuarial Audit of 2015 Actuarial Valuation
This work product was prepared solely for the PFC and the LEOFF 2 Retirement Board for the purposes described herein and may not be appropriate to use for other purposes. Milliman does not intend to benefit and assumes no duty or liability to other parties who receive this work. Milliman recommends that third parties be aided by their own actuary or other qualified professional when reviewing the Milliman work product.
1
pfc0019.docx
Section 1 Summary of the Findings
Purpose and Scope of the Actuarial Audit
This actuarial audit reviews the June 30, 2015 actuarial valuation performed by the Office of the State Actuary (OSA). The purpose of this audit is to verify that the results of the valuation are accurate and that the assumptions the valuation is based upon are reasonable. The following tasks were performed in this audit:
Evaluation of the data used in the valuation
Full independent replication of the key valuation results
Evaluation of the reasonableness of the assumptions used in the valuation
Analysis of valuation results and reconciliation of material differences (if any)
Analysis of the written work product
Audit Conclusion
Overall
The results of this audit are very positive. Specifically, we want to highlight the following:
Reasonable Assumptions: We believe that all of the recommended assumptions used to value liabilities are reasonable. The recommended use of Scale BB for projecting future mortality improvements puts the state ahead of most other states when it comes to anticipating the impact of future mortality improvement. However, note that for the 2015-2017 biennium, the actual contribution rates were calculated based on a phasing-in of the mortality improvement assumption for all plans but LEOFF 2, so the full Scale BB projection scale was not the assumption used.
Contributions toward Funding: Washington State has funding that is superior to that of most statewide systems. The use of the aggregate actuarial cost method, along with relatively short amortization periods for the Plans 1 limit the contributions deferred to future generations in comparison to what is done in most other states.
Accurate Calculations: Our independent calculations matched OSA’s closely in all material aspects of the valuation.
Actuarial Valuation
Based upon our review of the June 30, 2015 actuarial valuation, we found the actuarial work performed by OSA was reasonable, appropriate, and accurate. We matched the assets, liabilities and contribution rates calculated by OSA closely.

Milliman Pension Funding Council and LEOFF 2 Board Actuarial Audit of 2015 Actuarial Valuation Summary of the Findings
This work product was prepared solely for the PFC and the LEOFF 2 Retirement Board for the purposes described herein and may not be appropriate to use for other purposes. Milliman does not intend to benefit and assumes no duty or liability to other parties who receive this work. Milliman recommends that third parties be aided by their own actuary or other qualified professional when reviewing the Milliman work product.
2
pfc0019.docx
Statement of Key Findings
Membership Data
We performed tests on both the raw data supplied by the Department of
Retirement Systems (DRS) and the processed data used by the OSA in the June 30, 2015 actuarial valuation. We feel that there is an excellent match between the data supplied by DRS and the data used by OSA. Based on this review, we feel the individual member data used is complete. A summary is shown in the chart below:
Actuarial Value of Assets
We have reviewed the calculations for the actuarial value of assets used for each plan in the June 30, 2015 valuation. We found the calculations to be reasonable and the methodology to be appropriate and in compliance with Actuarial Standards of Practice. The actuarial value of assets is discussed in more detail in Section 3 of this report.
All Plans in AggregateRatio
OSA Milliman OSA/Milliman
Active Members
Total Number 301,260 301,260 100.0% Total Salaries (millions) 17,823$ 17,825$ 100.0% Average Age 47.3 47.3 100.0% Average Service 12.0 12.0 100.0% Average Projected Compensation 59,160$ 59,168$ 100.0%
Retirees and Survivors
Total Number 163,788 163,788 100.0% Average Monthly Pension 1,849$ 1,848$ 100.1%
Terminated Members
Total Number Vested 57,981 57,981 100.0% Total Number Non-Vested 125,114 125,114 100.0%

Milliman Pension Funding Council and LEOFF 2 Board Actuarial Audit of 2015 Actuarial Valuation Summary of the Findings
This work product was prepared solely for the PFC and the LEOFF 2 Retirement Board for the purposes described herein and may not be appropriate to use for other purposes. Milliman does not intend to benefit and assumes no duty or liability to other parties who receive this work. Milliman recommends that third parties be aided by their own actuary or other qualified professional when reviewing the Milliman work product.
3
pfc0019.docx
Statement of Key Findings
Actuarial Liabilities We independently calculated the Present Value of Benefits, Normal Cost, and Actuarial Accrued Liability under the Entry Age Normal actuarial cost method for all systems. We found that all significant benefit provisions were accounted for in an accurate manner, the actuarial assumptions and methods are being applied as reported, and that our total liabilities matched those calculated by OSA closely. This was true both in aggregate and by individual plan. A summary of the results for each system is shown in the chart below. Further breakdowns are shown in Section 4.
In the process of comparing liability calculations with the OSA, we noted a minor difference regarding the death benefit for those projected to terminate employment with deferred benefits. The difference was clearly immaterial to the calculations, and it is our understanding that the OSA will make a revision to its methodology with the next valuation.
Funding We reviewed the funding methods and their application. We find them reasonable and consistent with the Actuarial Standards of Practice and the objectives stated in RCW 41.45.010. Based on the Systems’ funding methods and assumptions, we believe the employer contribution rates for each membership class are appropriately calculated.
RatioOSA Milliman OSA/Milliman
Present Value All Future Benefits (in $Millions)
PERS 1 12,654.5$ 12,619.7$ 100.3%PERS 2/3 39,236.0 38,948.1 100.7%TRS 1 9,144.2 9,168.4 99.7%TRS 2/3 14,508.8 14,587.3 99.5%SERS 2/3 5,410.5 5,404.0 100.1%PSERS 2 779.8 775.4 100.6%LEOFF 1 4,313.2 4,325.3 99.7%LEOFF 2 12,151.9 12,167.6 99.9%WSPRS 1,240.2 1,241.4 99.9%Total PVB 99,439.1$ 99,237.2$ 100.2%

Milliman Pension Funding Council and LEOFF 2 Board Actuarial Audit of 2015 Actuarial Valuation Summary of the Findings
This work product was prepared solely for the PFC and the LEOFF 2 Retirement Board for the purposes described herein and may not be appropriate to use for other purposes. Milliman does not intend to benefit and assumes no duty or liability to other parties who receive this work. Milliman recommends that third parties be aided by their own actuary or other qualified professional when reviewing the Milliman work product.
4
pfc0019.docx
Statement of Key Findings
Funding (continued)
When we used the liabilities, present value of future salaries, and actuarial assets calculated by OSA, we matched OSA’s contribution rate calculations. When we used the liabilities, present value of future salaries, and actuarial assets calculated by Milliman, the results were close to OSA’s calculated contribution rates as shown below.
We matched the contribution rates based on the full mortality improvement assumption (100% scale BB) as presented in the OSA’s preliminary valuation report. We also matched the contribution rates based on the second step of the phased-in mortality improvement assumption (80% scale BB) as OSA presented to the Pension Funding Council at its June 15, 2016 meeting. It is our understanding that the Pension Funding Council selected this option for the 2017-2019 biennium for plans other than LEOFF 2 at its July 25, 2016 meeting. Note that we only calculated the LEOFF 2 rates based on the full mortality improvement assumption.
Employer Contribution Rates Full Mortality Improvement Assumption (100% Scale BB)
Employee Contribution Rates Full Mortality Improvement Assumption (100% Scale BB)
* Based on a LEOFF 2 contribution rate calculation structure of 100% of EANC and the employers’ 30% share.
DifferenceOSA Milliman OSA - Milliman
Employer Contribution Rates (Percent of Member Pay)
PERS 1 5.22% 5.19% 0.03%PERS 2/3 8.03% 7.92% 0.11%TRS 1 7.60% 7.67% -0.07%TRS 2/3 8.25% 8.41% -0.16%SERS 2/3 8.80% 8.75% 0.05%PSERS 2 6.98% 6.97% 0.01%WSPRS 14.90% 14.84% 0.06%LEOFF 1 0.00% 0.00% 0.00%LEOFF 2* 5.25% 5.23% 0.02%
DifferenceOSA Milliman OSA - Milliman
Member Contribution Rates (Percent of Member Pay)
PERS 1 6.00% 6.00% 0.00%PERS 2 7.92% 7.81% 0.11%TRS 1 6.00% 6.00% 0.00%TRS 2 7.48% 7.64% -0.16%SERS 2 7.80% 7.75% 0.05%PSERS 2 6.98% 6.97% 0.01%WSPRS 7.34% 7.34% 0.00%LEOFF 1 0.00% 0.00% 0.00%LEOFF 2* 8.75% 8.71% 0.04%

Milliman Pension Funding Council and LEOFF 2 Board Actuarial Audit of 2015 Actuarial Valuation Summary of the Findings
This work product was prepared solely for the PFC and the LEOFF 2 Retirement Board for the purposes described herein and may not be appropriate to use for other purposes. Milliman does not intend to benefit and assumes no duty or liability to other parties who receive this work. Milliman recommends that third parties be aided by their own actuary or other qualified professional when reviewing the Milliman work product.
5
pfc0019.docx
Statement of Key Findings
Funding (continued)
Employer Contribution Rates Phased-In Mortality Improvement Assumption (80% Scale BB)
Employee Contribution Rates Phased-In Mortality Improvement Assumption (80% Scale BB)
Funding is discussed in more detail in Section 5.
DifferenceOSA Milliman OSA - Milliman
Employer Contribution Rates (Percent of Member Pay)
PERS 1 5.03% 5.00% 0.03%PERS 2/3 7.49% 7.39% 0.10%TRS 1 7.32% 7.40% -0.08%TRS 2/3 7.83% 7.99% -0.16%SERS 2/3 8.27% 8.24% 0.03%PSERS 2 6.73% 6.71% 0.02%WSPRS 12.81% 12.77% 0.04%LEOFF 1 0.00% 0.00% 0.00%LEOFF 2 N/A N/A N/A
DifferenceOSA Milliman OSA - Milliman
Member Contribution Rates (Percent of Member Pay)
PERS 1 6.00% 6.00% 0.00%PERS 2 7.38% 7.28% 0.10%TRS 1 6.00% 6.00% 0.00%TRS 2 7.06% 7.22% -0.16%SERS 2 7.27% 7.24% 0.03%PSERS 2 6.73% 6.71% 0.02%WSPRS 7.34% 7.34% 0.00%LEOFF 1 0.00% 0.00% 0.00%LEOFF 2 N/A N/A N/A

Milliman Pension Funding Council and LEOFF 2 Board Actuarial Audit of 2015 Actuarial Valuation Summary of the Findings
This work product was prepared solely for the PFC and the LEOFF 2 Retirement Board for the purposes described herein and may not be appropriate to use for other purposes. Milliman does not intend to benefit and assumes no duty or liability to other parties who receive this work. Milliman recommends that third parties be aided by their own actuary or other qualified professional when reviewing the Milliman work product.
6
pfc0019.docx
Statement of Key Findings
Actuarial Assumptions We reviewed the assumptions used in the valuation and found them to be reasonable. A complete analysis of the demographic assumptions was done with the previous actuarial audit, which also included an audit of the 2007 – 2012 Demographic Experience Study. For this audit, we did a brief review of the assumption for future mortality improvement, as the Retirement Plans Experience Committee (RPEC) of the Society of Actuaries (SoA) has issued two more recent tables, which feature two-dimensional assumption to allow for disparate improvements by age and calendar year. We continue to believe that 100% of Scale BB is a good assumption to use. We do not believe that the additional complexity of the new tables leads to a materially better prediction of life expectancies in the context of pension funding.
The economic assumptions used were based on the OSA’s 2015 Report on Financial Condition and Economic Experience Study completed in August 2015. While a full audit of that report is beyond the scope of our assignment, we feel an actuarial audit would be incomplete without a review of the important economic assumptions used in the actuarial valuation.
We have the following comments regarding the economic assumptions:
Our analysis supports the expected rate of return of 7.50% recommended by the OSA, after consideration of the inflation assumption. While the current assumption of 7.70% used for non-LEOFF 2 plans is also reasonable, we believe that 7.50% is a more realistic assumption and recommend that the investment return assumption continue to decrease. 7.50% (or lower) is consistent with the recommendations we are currently making to our retained clients.
It should be noted that there are recent revisions to Actuarial Standard of Practice No. 27 (ASOP No. 27) that are effective for the June 30, 2015 valuation. These revisions impact how an actuary determines a reasonable assumption. In particular, the new standard narrows an assumption to be considered reasonable only if it has no significant bias (i.e., it is neither significantly optimistic nor pessimistic). The standard does allow for a provision for adverse deviation. When viewed in the context of the new standard, we still believe the investment return assumption is reasonable.
The inflation assumption of 3.00% is reasonable, as is the real wage growth assumption of 0.75% for productivity. The general salary increase assumption of 3.75% is the sum of these two assumptions. Note that current expectations for inflation implied by financial markets are significantly lower than the 3.00% assumption. Also, the intermediate projection from the Social Security Administration was recently decreased from 2.70% to 2.60%. Consideration could be given to lowering the inflation assumption in future valuations. If that assumption is lowered, it could also impact the investment return assumption.

Milliman Pension Funding Council and LEOFF 2 Board Actuarial Audit of 2015 Actuarial Valuation Summary of the Findings
This work product was prepared solely for the PFC and the LEOFF 2 Retirement Board for the purposes described herein and may not be appropriate to use for other purposes. Milliman does not intend to benefit and assumes no duty or liability to other parties who receive this work. Milliman recommends that third parties be aided by their own actuary or other qualified professional when reviewing the Milliman work product.
7
pfc0019.docx
Statement of Key Findings
Actuarial Assumptions (continued)
As prescribed, OSA assumes annual growth in active membership varying by plan from 0.80% to 1.25%. Most public sector pension plans assume no future growth in system membership. Please note that this assumption only impacts the amortization of the Plan 1 Unfunded Actuarial Accrued Liability (UAAL) over 10 years. The small membership growth assumption over the 10-year amortization period has a modest impact on the calculated contribution rates.
Review of Preliminary Report
Because the final 2015 Actuarial Valuation reports have not been completed at this time, we base the comments on the preliminary report. Overall, we found OSA’s reports to be very thorough. We have made a few comments for consideration for the upcoming reports that may enhance an outside reader’s understanding. All of these comments are related to additional disclosure or alterations in the written communication. If implemented, none would have an impact on any of the actuarial calculations. Please see Section 6 of this report for more information about our comments.
Recommendations from Prior Audit
We have also reviewed the comments from our prior actuarial audit and reported on the incorporation of those comments. All of the recommendations pertaining to the valuation calculations were implemented.

Milliman Pension Funding Council and LEOFF 2 Board Actuarial Audit of 2015 Actuarial Valuation Summary of the Findings
This work product was prepared solely for the PFC and the LEOFF 2 Retirement Board for the purposes described herein and may not be appropriate to use for other purposes. Milliman does not intend to benefit and assumes no duty or liability to other parties who receive this work. Milliman recommends that third parties be aided by their own actuary or other qualified professional when reviewing the Milliman work product.
8
pfc0019.docx
Recommendations and Other Considerations
We are not recommending any changes to the current actuarial valuation. We have provided some recommendations for OSA, PFC, and the LEOFF 2 Board to consider in the future, as listed below and discussed in further detail in the body of this report.
Recommended Changes to the 2015 Valuation
None
Recommended Changes for Future Valuations with a Material Financial Impact
None
Recommended Changes for Future Valuations and Experience Studies with a Non-Material Financial Impact
We recommend that the following changes be considered.
In the process of comparing liability calculations with the OSA, we noted a minor difference regarding the death benefit for those projected to terminate employment with deferred benefits. The difference was clearly immaterial to the calculations, and it is our understanding that the OSA will make a revision to its methodology with the next valuation.
Recommendations from Prior Audit (see end of Section 6): All of the recommendations pertaining to the valuation calculations were implemented. There are recommendations for the next experience study which should be considered at that time.
Recommended Changes for Future Valuations and Experience Studies
with No Direct Financial Impact
We recommend that OSA consider the following actions for future valuations and the experience studies they are based on:
Information in Report (see Comments Regarding OSA’s Reports in Section 6).

Milliman Pension Funding Council and LEOFF 2 Board Actuarial Audit of 2015 Actuarial Valuation
This work product was prepared solely for the PFC and the LEOFF 2 Retirement Board for the purposes described herein and may not be appropriate to use for other purposes. Milliman does not intend to benefit and assumes no duty or liability to other parties who receive this work. Milliman recommends that third parties be aided by their own actuary or other qualified professional when reviewing the Milliman work product.
9
pfc0019.docx
Section 2 Membership Data
Audit Conclusion
We performed tests on both the raw data supplied by the Department of Retirement Systems (DRS) and the processed data used by the Office of the State Actuary (OSA) in the June 30, 2015 actuarial valuation. We found that the data used by OSA was consistent with the data supplied by DRS.
Based on this review, we feel the individual member data used is appropriate and complete.
Comments
Overall, the data process appears to be thorough and accurate. We would add the following comments:
Raw Data: OSA provided us with the same files that were given to them by DRS for use in the actuarial valuation.
Completeness: The data contained all the necessary fields to perform the actuarial valuation.
Quality: Although we did not audit the data at the source, we performed some independent checks to confirm the overall reasonableness of the data. We compared the total retiree and beneficiary benefit amounts with the actual benefit payments made, as reported in the asset statements.
We also compared the total active member compensation on the DRS data with the estimated active payroll for 2014-2015. The actual member contribution amounts in the asset statements provided by DRS were divided by the applicable contribution rates for the prior year for each plan. This results in an estimated payroll for each plan. Based on this analysis, we found the compensation data to be reasonable.
Parallel Data Processing: We performed independent edits on the raw data provided by DRS and then compared our results with the valuation data used by OSA, as summarized in the preliminary participant data summary on the OSA’s website. We found our results to be consistent. Our results do not match exactly. This is understandable, as some adjustments were made to annualize salary for those with less than one year of service during the valuation period and other adjustments were made for a few data elements outside of the expected range. Overall, each key data component matched well within an acceptable level and we believe the individual member data used by the OSA was appropriate for valuation purposes.

Milliman Pension Funding Council and LEOFF 2 Board Actuarial Audit of 2015 Actuarial Valuation Membership Data
This work product was prepared solely for the PFC and the LEOFF 2 Retirement Board for the purposes described herein and may not be appropriate to use for other purposes. Milliman does not intend to benefit and assumes no duty or liability to other parties who receive this work. Milliman recommends that third parties be aided by their own actuary or other qualified professional when reviewing the Milliman work product.
10
pfc0019.docx
Comments (continued)
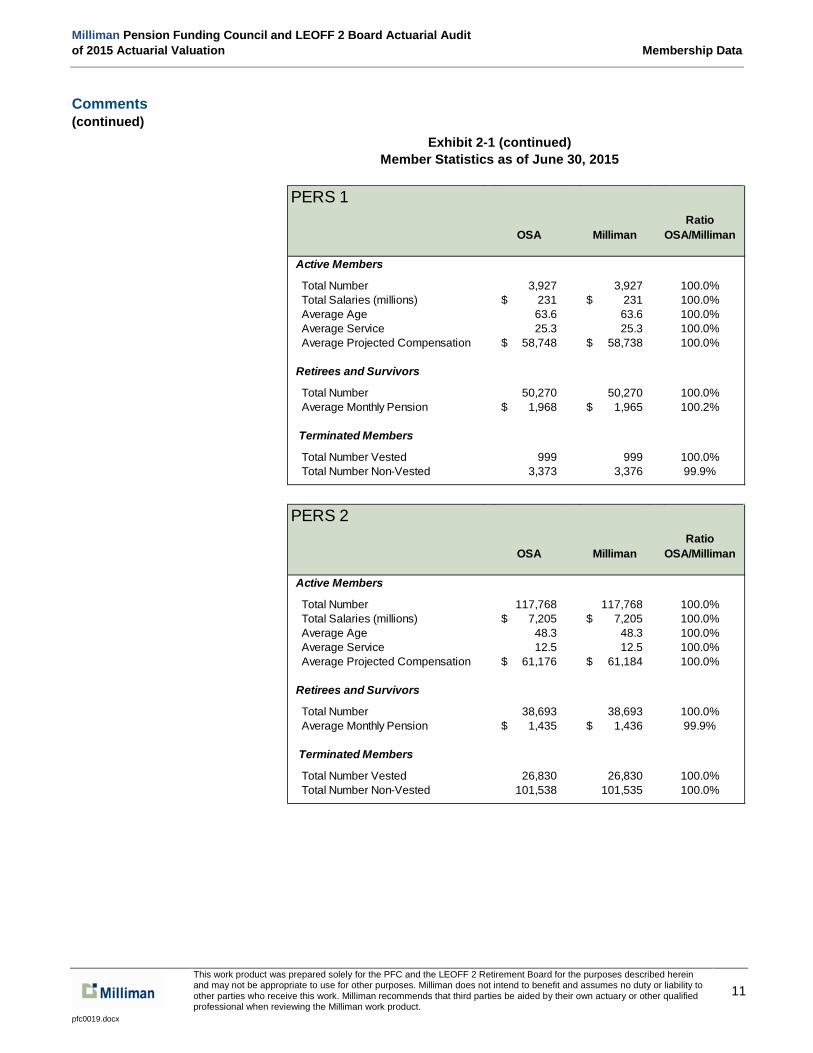
A summary of the data for each plan is shown in Exhibit 2-1. In all cases, the summarized totals for our edited data matched those for OSA’s valuation data closely. The “Milliman” column reflects the DRS data after adjustments by Milliman. The “OSA” column reflects the actual data used in the OSA’s valuation as summarized in the preliminary participant data summary on the OSA’s website.
Exhibit 2-1 Member Statistics as of June 30, 2015
All PlansRatio
OSA Milliman OSA/Milliman
Active Members
Total Number 301,260 301,260 100.0% Total Salaries (millions) 17,823$ 17,825$ 100.0% Average Age 47.3 47.3 100.0% Average Service 12.0 12.0 100.0% Average Projected Compensation 59,160$ 59,168$ 100.0%
Retirees and Survivors
Total Number 163,788 163,788 100.0% Average Monthly Pension 1,849$ 1,848$ 100.1%
Terminated Members
Total Number Vested 57,981 57,981 100.0% Total Number Non-Vested 125,114 125,114 100.0%
Milliman Pension Funding Council and LEOFF 2 Board Actuarial Audit of 2015 Actuarial Valuation Membership Data
This work product was prepared solely for the PFC and the LEOFF 2 Retirement Board for the purposes described herein and may not be appropriate to use for other purposes. Milliman does not intend to benefit and assumes no duty or liability to other parties who receive this work. Milliman recommends that third parties be aided by their own actuary or other qualified professional when reviewing the Milliman work product.
11
pfc0019.docx
Comments (continued)
Exhibit 2-1 (continued) Member Statistics as of June 30, 2015
PERS 1Ratio
OSA Milliman OSA/Milliman
Active Members
Total Number 3,927 3,927 100.0% Total Salaries (millions) 231$ 231$ 100.0% Average Age 63.6 63.6 100.0% Average Service 25.3 25.3 100.0% Average Projected Compensation 58,748$ 58,738$ 100.0%
Retirees and Survivors
Total Number 50,270 50,270 100.0% Average Monthly Pension 1,968$ 1,965$ 100.2%
Terminated Members
Total Number Vested 999 999 100.0% Total Number Non-Vested 3,373 3,376 99.9%
PERS 2Ratio
OSA Milliman OSA/Milliman
Active Members
Total Number 117,768 117,768 100.0% Total Salaries (millions) 7,205$ 7,205$ 100.0% Average Age 48.3 48.3 100.0% Average Service 12.5 12.5 100.0% Average Projected Compensation 61,176$ 61,184$ 100.0%
Retirees and Survivors
Total Number 38,693 38,693 100.0% Average Monthly Pension 1,435$ 1,436$ 99.9%
Terminated Members
Total Number Vested 26,830 26,830 100.0% Total Number Non-Vested 101,538 101,535 100.0%

Milliman Pension Funding Council and LEOFF 2 Board Actuarial Audit of 2015 Actuarial Valuation Membership Data
This work product was prepared solely for the PFC and the LEOFF 2 Retirement Board for the purposes described herein and may not be appropriate to use for other purposes. Milliman does not intend to benefit and assumes no duty or liability to other parties who receive this work. Milliman recommends that third parties be aided by their own actuary or other qualified professional when reviewing the Milliman work product.
12
pfc0019.docx
Comments (continued)
Exhibit 2-1 (continued) Member Statistics as of June 30, 2015
PERS 3Ratio
OSA Milliman OSA/Milliman
Active Members
Total Number 31,602 31,602 100.0% Total Salaries (millions) 1,780$ 1,780$ 100.0% Average Age 43.4 43.4 100.0% Average Service 8.6 8.6 100.0% Average Projected Compensation 56,320$ 56,333$ 100.0%
Retirees and Survivors
Total Number 3,186 3,186 100.0% Average Monthly Pension 823$ 822$ 100.1%
Terminated Members
Total Number Vested 4,961 4,961 100.0% Total Number Non-Vested N/A N/A 100.0%
TRS 1Ratio
OSA Milliman OSA/Milliman
Active Members
Total Number 1,353 1,353 100.0% Total Salaries (millions) 108$ 108$ 100.0% Average Age 64.5 64.5 100.0% Average Service 31.3 31.3 100.0% Average Projected Compensation 79,603$ 79,574$ 100.0%
Retirees and Survivors
Total Number 35,239 35,239 100.0% Average Monthly Pension 2,122$ 2,120$ 100.1%
Terminated Members
Total Number Vested 267 267 100.0% Total Number Non-Vested 381 381 100.0%
Milliman Pension Funding Council and LEOFF 2 Board Actuarial Audit of 2015 Actuarial Valuation Membership Data
This work product was prepared solely for the PFC and the LEOFF 2 Retirement Board for the purposes described herein and may not be appropriate to use for other purposes. Milliman does not intend to benefit and assumes no duty or liability to other parties who receive this work. Milliman recommends that third parties be aided by their own actuary or other qualified professional when reviewing the Milliman work product.
13
pfc0019.docx
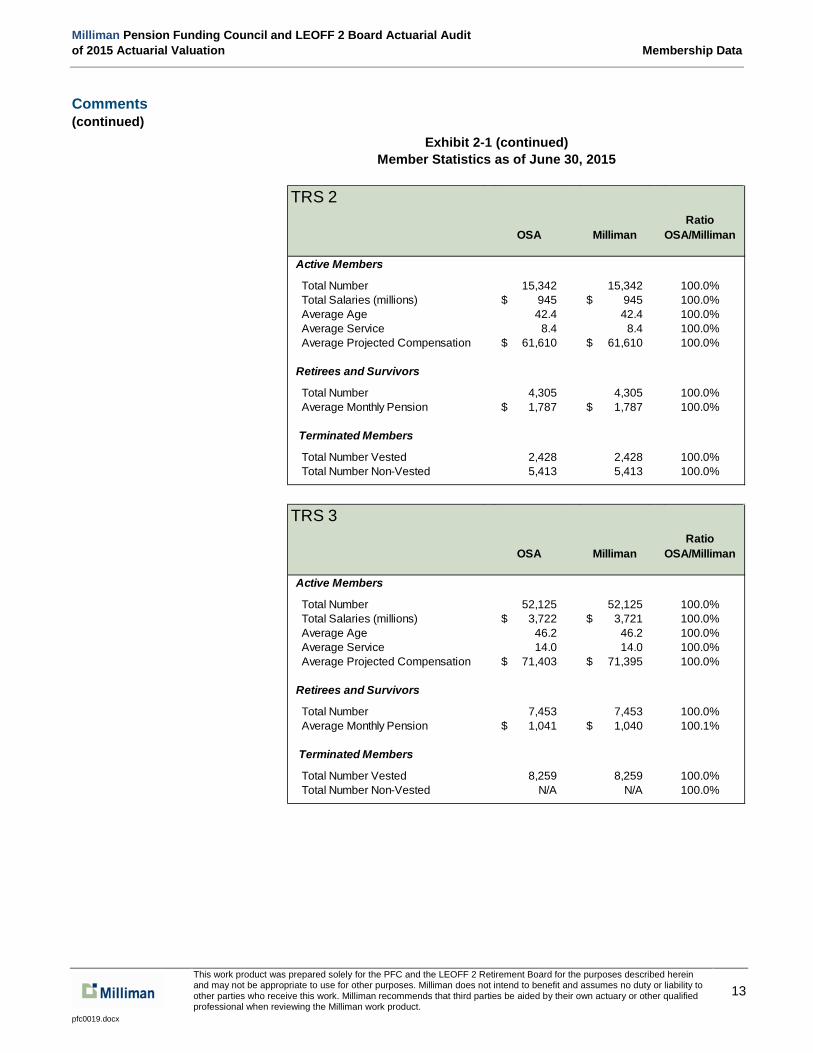
Comments (continued)
Exhibit 2-1 (continued) Member Statistics as of June 30, 2015
TRS 2Ratio
OSA Milliman OSA/Milliman
Active Members
Total Number 15,342 15,342 100.0% Total Salaries (millions) 945$ 945$ 100.0% Average Age 42.4 42.4 100.0% Average Service 8.4 8.4 100.0% Average Projected Compensation 61,610$ 61,610$ 100.0%
Retirees and Survivors
Total Number 4,305 4,305 100.0% Average Monthly Pension 1,787$ 1,787$ 100.0%
Terminated Members
Total Number Vested 2,428 2,428 100.0% Total Number Non-Vested 5,413 5,413 100.0%
TRS 3Ratio
OSA Milliman OSA/Milliman
Active Members
Total Number 52,125 52,125 100.0% Total Salaries (millions) 3,722$ 3,721$ 100.0% Average Age 46.2 46.2 100.0% Average Service 14.0 14.0 100.0% Average Projected Compensation 71,403$ 71,395$ 100.0%
Retirees and Survivors
Total Number 7,453 7,453 100.0% Average Monthly Pension 1,041$ 1,040$ 100.1%
Terminated Members
Total Number Vested 8,259 8,259 100.0% Total Number Non-Vested N/A N/A 100.0%

Milliman Pension Funding Council and LEOFF 2 Board Actuarial Audit of 2015 Actuarial Valuation Membership Data
This work product was prepared solely for the PFC and the LEOFF 2 Retirement Board for the purposes described herein and may not be appropriate to use for other purposes. Milliman does not intend to benefit and assumes no duty or liability to other parties who receive this work. Milliman recommends that third parties be aided by their own actuary or other qualified professional when reviewing the Milliman work product.
14
pfc0019.docx
Comments (continued)
Exhibit 2-1 (continued) Member Statistics as of June 30, 2015
SERS 2Ratio
OSA Milliman OSA/Milliman
Active Members
Total Number 24,479 24,479 100.0% Total Salaries (millions) 734$ 735$ 99.9% Average Age 50.2 50.2 100.0% Average Service 9.7 9.7 100.0% Average Projected Compensation 29,998$ 30,021$ 99.9%
Retirees and Survivors
Total Number 6,562 6,562 100.0% Average Monthly Pension 836$ 836$ 100.0%
Terminated Members
Total Number Vested 5,572 5,572 100.0% Total Number Non-Vested 10,940 10,940 100.0%
SERS 3Ratio
OSA Milliman OSA/Milliman
Active Members
Total Number 31,326 31,326 100.0% Total Salaries (millions) 962$ 963$ 100.0% Average Age 50.4 50.4 100.0% Average Service 10.6 10.6 100.0% Average Projected Compensation 30,725$ 30,740$ 100.0%
Retirees and Survivors
Total Number 5,750 5,750 100.0% Average Monthly Pension 454$ 454$ 100.0%
Terminated Members
Total Number Vested 7,491 7,491 100.0% Total Number Non-Vested N/A N/A 100.0%

Milliman Pension Funding Council and LEOFF 2 Board Actuarial Audit of 2015 Actuarial Valuation Membership Data
This work product was prepared solely for the PFC and the LEOFF 2 Retirement Board for the purposes described herein and may not be appropriate to use for other purposes. Milliman does not intend to benefit and assumes no duty or liability to other parties who receive this work. Milliman recommends that third parties be aided by their own actuary or other qualified professional when reviewing the Milliman work product.
15
pfc0019.docx
Comments (continued)
Exhibit 2-1 (continued) Member Statistics as of June 30, 2015
PSERS 2Ratio
OSA Milliman OSA/Milliman
Active Members
Total Number 5,202 5,202 100.0% Total Salaries (millions) 302$ 302$ 100.0% Average Age 40.3 40.3 100.0% Average Service 5.4 5.4 100.0% Average Projected Compensation 58,115$ 58,130$ 100.0%
Retirees and Survivors
Total Number 80 80 100.0% Average Monthly Pension 486$ 486$ 100.0%
Terminated Members
Total Number Vested 294 294 100.0% Total Number Non-Vested 1,694 1,694 100.0%
LEOFF 1Ratio
OSA Milliman OSA/Milliman
Active Members
Total Number 82 82 100.0% Total Salaries (millions) 9$ 9$ 100.0% Average Age 63.6 63.6 100.0% Average Service 39.6 39.6 100.0% Average Projected Compensation 106,683$ 106,683$ 100.0%
Retirees and Survivors
Total Number 7,507 7,507 100.0% Average Monthly Pension 4,008$ 4,008$ 100.0%
Terminated Members
Total Number Vested - - - Total Number Non-Vested 32 32 100.0%

Milliman Pension Funding Council and LEOFF 2 Board Actuarial Audit of 2015 Actuarial Valuation Membership Data
This work product was prepared solely for the PFC and the LEOFF 2 Retirement Board for the purposes described herein and may not be appropriate to use for other purposes. Milliman does not intend to benefit and assumes no duty or liability to other parties who receive this work. Milliman recommends that third parties be aided by their own actuary or other qualified professional when reviewing the Milliman work product.
16
pfc0019.docx
Comments (continued)
Exhibit 2-1 (continued) Member Statistics as of June 30, 2015
LEOFF 2Ratio
OSA Milliman OSA/Milliman
Active Members
Total Number 17,019 17,019 100.0% Total Salaries (millions) 1,743$ 1,743$ 100.0% Average Age 43.6 43.7 99.8% Average Service 14.7 14.7 100.0% Average Projected Compensation 102,411$ 102,434$ 100.0%
Retirees and Survivors
Total Number 3,710 3,710 100.0% Average Monthly Pension 3,529$ 3,529$ 100.0%
Terminated Members
Total Number Vested 785 785 100.0% Total Number Non-Vested 1,693 1,693 100.0%
WSPRS 1Ratio
OSA Milliman OSA/Milliman
Active Members
Total Number 560 560 100.0% Total Salaries (millions) 48$ 48$ 100.0% Average Age 47.0 47.0 100.0% Average Service 20.1 20.1 100.0% Average Projected Compensation 86,535$ 86,530$ 100.0%
Retirees and Survivors
Total Number 1,033 1,033 100.0% Average Monthly Pension 4,088$ 4,088$ 100.0%
Terminated Members
Total Number Vested 75 75 100.0% Total Number Non-Vested 17 17 100.0%

Milliman Pension Funding Council and LEOFF 2 Board Actuarial Audit of 2015 Actuarial Valuation Membership Data
This work product was prepared solely for the PFC and the LEOFF 2 Retirement Board for the purposes described herein and may not be appropriate to use for other purposes. Milliman does not intend to benefit and assumes no duty or liability to other parties who receive this work. Milliman recommends that third parties be aided by their own actuary or other qualified professional when reviewing the Milliman work product.
17
pfc0019.docx
Comments (continued)
Exhibit 2-1 (continued) Member Statistics as of June 30, 2015
WSPRS 2Ratio
OSA Milliman OSA/Milliman
Active Members
Total Number 475 475 100.0% Total Salaries (millions) 33$ 33$ 100.0% Average Age 33.2 33.2 100.0% Average Service 6.5 6.5 100.0% Average Projected Compensation 70,238$ 70,238$ 100.0%
Retirees and Survivors
Total Number - - 100.0% Average Monthly Pension -$ -$ 100.0%
Terminated Members
Total Number Vested 20 20 100.0% Total Number Non-Vested 33 33 100.0%

This work product was prepared solely for the PFC and the LEOFF 2 Retirement Board for the purposes described herein and may not be appropriate to use for other purposes. Milliman does not intend to benefit and assumes no duty or liability to other parties who receive this work. Milliman recommends that third parties be aided by their own actuary or other qualified professional when reviewing the Milliman work product.
18
pfc0019.docx
This page intentionally left blank.

Milliman Pension Funding Council and LEOFF 2 Board Actuarial Audit of 2015 Actuarial Valuation
This work product was prepared solely for the PFC and the LEOFF 2 Retirement Board for the purposes described herein and may not be appropriate to use for other purposes. Milliman does not intend to benefit and assumes no duty or liability to other parties who receive this work. Milliman recommends that third parties be aided by their own actuary or other qualified professional when reviewing the Milliman work product.
19
pfc0019.docx
Section 3 Actuarial Value of Assets Audit Conclusion
We have reviewed the calculations for the actuarial value of assets used for each plan in the June 30, 2015 valuation. We found the calculations to be reasonable and the methodology to be appropriate and in compliance with Actuarial Standards of Practice.
Comments
The method used to determine the actuarial value of assets smoothes investment gains and losses by reflecting a portion of the difference between the actual market value of assets and the expected market value for every fiscal year. For each year and each plan, a base for smoothed recognition over time is established equal to that difference.
The larger the deviation from expectation, the longer the recognition period for that base, with a level dollar amount recognized for each year of that period. For the largest deviations (more than 7% above or below the assumption), the gains or losses are recognized over eight years, whereas when the actual return is within 1% of the assumption, the gain or loss is recognized immediately. Additionally, a “corridor” is applied to make sure that the smoothed actuarial value of assets stays within 30% of the market value of assets.
Although it is unusual to recognize investment gains and losses over different periods, we believe it is a reasonable approach since the maximum smoothing period is reasonable and the method allows the actuarial value of assets to converge to market more rapidly if gains and losses are small.
We independently calculated the actuarial value of assets for each plan based on financial information provided by the Department of Retirement Systems (DRS) and the Washington State Investment Board (WSIB). DRS and WSIB both provide market values of assets by plan. Note that there are small differences between the values provided by DRS and WSIB. Per our conversation with OSA, the DRS values are used for the market value of assets. The WSIB data is only used to determine the monthly cash flows (contributions minus benefit payments) needed to calculate the expected value of assets.

Milliman Pension Funding Council and LEOFF 2 Board Actuarial Audit of 2015 Actuarial Valuation Actuarial Value of Assets
This work product was prepared solely for the PFC and the LEOFF 2 Retirement Board for the purposes described herein and may not be appropriate to use for other purposes. Milliman does not intend to benefit and assumes no duty or liability to other parties who receive this work. Milliman recommends that third parties be aided by their own actuary or other qualified professional when reviewing the Milliman work product.
20
pfc0019.docx
Comments (continued)
We used the information from DRS, WSIB, along with the outstanding gain/loss bases as published in the 2014 Actuarial Valuation Report. With this information and the asset methodology, our independent calculations were within 0.05% of the OSA’s calculation for every plan. Please see the following exhibit for a comparison.
Exhibit 3-1 Comparison of Actuarial Value of Assets by Plan
As discussed above, OSA uses an asset smoothing method to reduce volatility. A five-year smoothing method is the most commonly used method among large public retirement systems. OSA uses a variable length of smoothing period, with eight years as the longest possible period. We believe the use of an asset smoothing method is appropriate, and we generally recommend this to our clients, particularly in systems where contribution rates change annually or biennially.
When a smoothing method is used, the actuarial value of assets will deviate from the market value of assets. Many public retirement systems apply a corridor so that the actuarial value of assets is not allowed to deviate from the market value by more than a certain percentage. The potential downside of using a corridor is that it can cause significant contribution rate volatility when the assets are outside the corridor. OSA applies a corridor of 30%.
AVA (millions)
RatioOSA Milliman OSA/Milliman
PERS Plan 1 7,315$ 7,313$ 100.0% Plan 2/3 (DB) 28,292$ 28,287$ 100.0%
TRS Plan 1 5,870$ 5,869$ 100.0% Plan 2/3 (DB) 9,953$ 9,951$ 100.0%
SERS Plan 2/3 (DB) 3,901$ 3,900$ 100.0%
PSERS Plan 2 338$ 338$ 100.0%
LEOFF Plan 1 5,404$ 5,403$ 100.0% Plan 2 9,320$ 9,319$ 100.0%
WSPRS Plan 1 & 2 1,067$ 1,067$ 100.0%

Milliman Pension Funding Council and LEOFF 2 Board Actuarial Audit of 2015 Actuarial Valuation Actuarial Value of Assets
This work product was prepared solely for the PFC and the LEOFF 2 Retirement Board for the purposes described herein and may not be appropriate to use for other purposes. Milliman does not intend to benefit and assumes no duty or liability to other parties who receive this work. Milliman recommends that third parties be aided by their own actuary or other qualified professional when reviewing the Milliman work product.
21
pfc0019.docx
Comments (continued)
Typically, the longer the recognition period, the more important it is seen to have a corridor. We believe that the eight-year smoothing period, coupled with the application of the corridor, is in compliance with ASOP No. 44, the actuarial standard of practice for the selection and use of asset valuation methods for pension valuations.
In October 2014, the Conference of Consulting Actuaries (CCA) issued a white paper entitled Actuarial Funding Policies and Practices for Public Pension Plans which includes guidelines for asset smoothing methodologies. This paper was drafted in part as a response to the void left by the fact that the soon to be applicable statements of the Governmental Accounting Standards Board (GASB) no longer specify the parameters for an Annual Required Contribution (ARC). The CCA was comprised of a group of public plan actuaries from the major firms in public plan practice who met more than 24 times over two years.
OSA’s method of smoothing with recognition periods eight years or less, along with a 30% corridor, falls in the “Acceptable Practices” category under these guidelines (categories described below for reference). OSA’s method is almost inside of the CCA “Model Practices” category. That could be achieved with a smoothing period of five years or fewer with a 50% corridor or a smoothing period of seven years or fewer with a 40% corridor. Note that the “Model Practices” are not intended to be “best practices,” but are the ones considered to be most consistent with the Level Cost Allocation Model. Therefore, this is not a recommendation to change, just an observation.
OSA’s method is consistent with all of the CCA specific policy objectives and considerations for an asset smoothing method. Its consistency with the primary objectives is shown by the following:
All components of the asset method are specified: return subject to smoothing, smoothing period, corridor, and method of recognizing deferred amounts.
It is unbiased compared to market value. It does not selectively reset to market when market value is greater than
actuarial value. Realized and unrealized gains and losses are treated the same. It is consistent with the Actuarial Standard of Practice No. 44 concept of being
likely to return to market in a reasonable period and likely to stay within a reasonable range of market value.
We feel that the OSA’s method is reasonable and consistent with the policy objectives of the State which are described in RCW 41.45.010 as being “to provide a dependable and systematic process for funding the benefits provided to members and retirees” of the Washington State Retirement Systems.

Milliman Pension Funding Council and LEOFF 2 Board Actuarial Audit of 2015 Actuarial Valuation Actuarial Value of Assets
This work product was prepared solely for the PFC and the LEOFF 2 Retirement Board for the purposes described herein and may not be appropriate to use for other purposes. Milliman does not intend to benefit and assumes no duty or liability to other parties who receive this work. Milliman recommends that third parties be aided by their own actuary or other qualified professional when reviewing the Milliman work product.
22
pfc0019.docx
Comments (continued)
For reference, the categories in the CCA guidelines are shown below.
Model Practices Those practices most consistent with the Level Cost Allocation Model (LCAM).
Acceptable Practices Generally those which, while not consistent with the LCAM, are well established in practice and typically do not require additional analysis.
Acceptable Practices with Conditions
May be acceptable in some circumstances either to reflect different policy objectives or on the basis of additional analysis.
Non-Recommended Practices
Systems using these practices should acknowledge the policy concerns identified in the CCA Guidelines or acknowledge they reflect different policy objectives.
Unacceptable Practices
No description provided by CCA, but implication is that these should not be used.
Categories Under CCA Guidelines

Milliman Pension Funding Council and LEOFF 2 Board Actuarial Audit of 2015 Actuarial Valuation
This work product was prepared solely for the PFC and the LEOFF 2 Retirement Board for the purposes described herein and may not be appropriate to use for other purposes. Milliman does not intend to benefit and assumes no duty or liability to other parties who receive this work. Milliman recommends that third parties be aided by their own actuary or other qualified professional when reviewing the Milliman work product.
23
pfc0019.docx
Section 4 Actuarial Liabilities Audit Conclusion
We independently calculated the present value of future benefits and future salaries and the entry age normal costs for the Washington State Public Retirement Systems. We found that all significant benefit provisions were accounted for in an accurate manner and the actuarial assumptions and methods are being applied correctly. Our total liabilities closely matched those calculated by OSA. This was true both in aggregate and by System.
Note that there will always be differences in the calculated liabilities when different software is used by different actuaries; however, the results should not deviate significantly. The level of consistency we found in this audit provides a high level of assurance that the results of the valuation accurately reflect the liabilities of the Washington State Public Retirement Systems based on the plan provisions, assumptions, methods, and census and financial data.
Comments
We incorporated the following information into our valuation system:
Data – We used the data provided by DRS. As discussed in Section 2, we confirmed that this data was consistent with the valuation data used by OSA.
Assumptions and Methods – We used the assumptions and methods recommended by OSA for the June 30, 2015 actuarial valuation. This was supplemented by discussions between OSA and Milliman on the technical application of these methods.
Benefit Provisions – We obtained this information from the Revised Code of Washington and various member handbooks.
We then performed an independent parallel valuation as of June 30, 2015. Based on this valuation, we completed a detailed comparison of the Present Value of Future Benefits (PVFB) computed in our independent valuation and the amounts calculated by OSA. Exhibit 4-1 shows a summary of this analysis broken down by benefit type. Exhibit 4-2 shows a summary of this analysis broken down by System. The results were reasonable, and our calculated PVFB values match closely with those calculated by OSA.

Milliman Pension Funding Council and LEOFF 2 Board Actuarial Audit of 2015 Actuarial Valuation Actuarial Liabilities
This work product was prepared solely for the PFC and the LEOFF 2 Retirement Board for the purposes described herein and may not be appropriate to use for other purposes. Milliman does not intend to benefit and assumes no duty or liability to other parties who receive this work. Milliman recommends that third parties be aided by their own actuary or other qualified professional when reviewing the Milliman work product.
24
pfc0019.docx
Comments (continued)
Exhibit 4-1 Present Value of Future Benefits by Benefit Type
All Systems in Aggregate(in $Millions) OSA Milliman O / M Ratio
Present Value All Future Benefits
Retirement $51,291.2 51,010.0 100.6%Termination $2,095.6 2,113.7 99.1%Death $999.7 981.9 101.8%Disability $572.9 559.2 102.4%
Total Actives* $54,959.3 $54,664.9 100.5%
Terminated Vested $4,321.9 $4,310.9 100.3%Terminated Not Vested 307.8 308.2 99.9%
Total Inactive, not in Payment $4,629.7 $4,619.1 100.2%
Retired $35,295.2 $35,393.5 99.7%Disabled $2,258.1 2,258.4 100.0%Survivor $2,193.1 2,197.4 99.8%LOP Liability $103.8 103.9 99.9%
Total Annuitants* $39,850.1 $39,953.2 99.7%
Total Members $99,439.1 $99,237.2 100.2%

Milliman Pension Funding Council and LEOFF 2 Board Actuarial Audit of 2015 Actuarial Valuation Actuarial Liabilities
This work product was prepared solely for the PFC and the LEOFF 2 Retirement Board for the purposes described herein and may not be appropriate to use for other purposes. Milliman does not intend to benefit and assumes no duty or liability to other parties who receive this work. Milliman recommends that third parties be aided by their own actuary or other qualified professional when reviewing the Milliman work product.
25
pfc0019.docx
Comments (continued)
Exhibit 4-2 Present Value of Future Benefits by System
RatioOSA Milliman OSA/Milliman
Present Value All Future Benefits (in $Millions)
PERS 1 Active Members 1,214.6$ 1,185.6$ 102.4% Inactive Members 11,439.9 11,434.1 100.1% Total 12,654.5$ 12,619.7$ 100.3%
PERS 2/3 Active Members 27,694.2$ 27,366.0$ 101.2% Inactive Members 11,541.9 11,582.1 99.7% Total 39,236.0$ 38,948.1$ 100.7%
TRS 1 Active Members 581.6$ 585.3$ 99.4% Inactive Members 8,562.6 8,583.1 99.8% Total 9,144.2$ 9,168.4$ 99.7%
TRS 2/3 Active Members 11,065.0$ 11,125.4$ 99.5% Inactive Members 3,443.8 3,461.9 99.5% Total 14,508.8$ 14,587.3$ 99.5%

Milliman Pension Funding Council and LEOFF 2 Board Actuarial Audit of 2015 Actuarial Valuation Actuarial Liabilities
This work product was prepared solely for the PFC and the LEOFF 2 Retirement Board for the purposes described herein and may not be appropriate to use for other purposes. Milliman does not intend to benefit and assumes no duty or liability to other parties who receive this work. Milliman recommends that third parties be aided by their own actuary or other qualified professional when reviewing the Milliman work product.
26
pfc0019.docx
Comments (continued)
Exhibit 4-2 (continued) Present Value of Future Benefits by System
RatioOSA Milliman OSA/Milliman
Present Value All Future Benefits (in $Millions)
SERS 2/3 Active Members 3,659.1$ 3,645.0$ 100.4% Inactive Members 1,751.4 1,759.0 99.6% Total 5,410.5$ 5,404.0$ 100.1%
PSERS 2 Active Members 750.4$ 746.0$ 100.6% Inactive Members 29.5 29.3 100.5% Total 779.8$ 775.4$ 100.6%
LEOFF 1 Active Members 101.1$ 100.2$ 100.9% Inactive Members 4,212.1 4,225.1 99.7% Total 4,313.2$ 4,325.3$ 99.7%
LEOFF 2 Active Members 9,405.1$ 9,420.1$ 99.8% Inactive Members 2,746.8 2,747.6 100.0% Total 12,151.9$ 12,167.6$ 99.9%
WSPRS Active Members 488.2$ 491.2$ 99.4% Inactive Members 752.0 750.2 100.2% Total 1,240.2$ 1,241.4$ 99.9%

Milliman Pension Funding Council and LEOFF 2 Board Actuarial Audit of 2015 Actuarial Valuation Actuarial Liabilities
This work product was prepared solely for the PFC and the LEOFF 2 Retirement Board for the purposes described herein and may not be appropriate to use for other purposes. Milliman does not intend to benefit and assumes no duty or liability to other parties who receive this work. Milliman recommends that third parties be aided by their own actuary or other qualified professional when reviewing the Milliman work product.
27
pfc0019.docx
Comments (continued)
We also looked at the Entry Age Normal Accrued Liability (EAN AL). EAN AL is used by OSA to measure the funded ratios and is described in Section 5. Exhibit 4.3 shows the audit had a good match of EAN AL. The EAN AL is consistent with the requirements of the recently revised accounting standards, GASB No. 67 and GASB No. 68.
Exhibit 4-3 Comparison of Entry Age Normal Accrued Liability
Lastly, we looked at both the present value of future salaries and the entry age normal cost (EANC) rates, which are used in the determination of the minimum contribution rates.
Exhibit 4-4 Present Value of Future Salaries and EANC Rate
Recommendations
In the process of comparing liability calculations with the OSA, we noted a minor difference regarding the death benefit for those projected to terminate employment with deferred benefits. The difference was clearly immaterial to the calculations, and it is our understanding that the OSA will make a revision to its methodology with the next valuation.
RatioOSA Milliman OSA/Milliman
Entry Age Normal Accrued Liability (EAN AL) (in $Millions)
PERS 1 12,553.5$ 12,535.3$ 100.1%PERS 2/3 32,007.6 31,742.9 100.8%TRS 1 9,107.5 9,134.1 99.7%TRS 2/3 10,830.0 10,824.3 100.1%SERS 2/3 4,381.5 4,367.5 100.3%PSERS 2 356.9 352.6 101.2%LEOFF 1 4,307.1 4,324.6 99.6%LEOFF 2 8,838.5 8,876.9 99.6%WSPRS 1,093.0 1,088.5 100.4%Total EAN AL 83,475.5$ 83,246.6$ 100.3%
All Systems in Aggregate(in $Millions) OSA Milliman O / M Ratio
Present Value of Future Salaries $162,133.4 $160,700.3 100.9%
Entry Age Normal Cost Rate 10.03% 10.06% 99.7%

This work product was prepared solely for the PFC and the LEOFF 2 Retirement Board for the purposes described herein and may not be appropriate to use for other purposes. Milliman does not intend to benefit and assumes no duty or liability to other parties who receive this work. Milliman recommends that third parties be aided by their own actuary or other qualified professional when reviewing the Milliman work product.
28
pfc0019.docx
This page intentionally left blank.

Milliman Pension Funding Council and LEOFF 2 Board Actuarial Audit of 2015 Actuarial Valuation
This work product was prepared solely for the PFC and the LEOFF 2 Retirement Board for the purposes described herein and may not be appropriate to use for other purposes. Milliman does not intend to benefit and assumes no duty or liability to other parties who receive this work. Milliman recommends that third parties be aided by their own actuary or other qualified professional when reviewing the Milliman work product.
29
pfc0019.docx
Section 5 Funding Audit Conclusion
Comments
We reviewed the funding methods and their application. We find them reasonable and consistent with the Actuarial Standards of Practice and the objectives stated in RCW 41.45.010. Based on the Systems’ funding methods and assumptions, we believe the employer contribution rates for each membership class are appropriately calculated.
When we used the liabilities, present value of future salaries, and actuarial assets calculated by OSA, we matched OSA’s contribution rate calculations. When we used the liabilities, present value of future salaries, and actuarial assets calculated by Milliman, the results were close to OSA’s calculated contribution rates as shown below.
We matched the contribution rates based on the full mortality improvement assumption (100% scale BB) as presented in the OSA’s preliminary valuation report. We also matched the contribution rates based on the second step of the phased-in mortality improvement assumption (80% scale BB) as OSA presented to the Pension Funding Council at its June 15, 2016 meeting. It is our understanding that the Pension Funding Council selected this option for the 2017-2019 biennium for plans other than LEOFF 2 at its July 25, 2016 meeting. Note that we only calculated the LEOFF 2 rates based on the full mortality improvement assumption.

Milliman Pension Funding Council and LEOFF 2 Board Actuarial Audit of 2015 Actuarial Valuation Funding
This work product was prepared solely for the PFC and the LEOFF 2 Retirement Board for the purposes described herein and may not be appropriate to use for other purposes. Milliman does not intend to benefit and assumes no duty or liability to other parties who receive this work. Milliman recommends that third parties be aided by their own actuary or other qualified professional when reviewing the Milliman work product.
30
pfc0019.docx
Comments (continued)
Employer Contribution Rates Full Mortality Improvement Assumption (100% Scale BB)
Employee Contribution Rates Full Mortality Improvement Assumption (100% Scale BB)
* Based on a LEOFF 2 contribution rate calculation structure of 100% of EANC and the employers’ 30% share.
DifferenceOSA Milliman OSA - Milliman
Employer Contribution Rates (Percent of Member Pay)
PERS 1 5.22% 5.19% 0.03%PERS 2/3 8.03% 7.92% 0.11%TRS 1 7.60% 7.67% -0.07%TRS 2/3 8.25% 8.41% -0.16%SERS 2/3 8.80% 8.75% 0.05%PSERS 2 6.98% 6.97% 0.01%WSPRS 14.90% 14.84% 0.06%LEOFF 1 0.00% 0.00% 0.00%LEOFF 2* 5.25% 5.23% 0.02%
DifferenceOSA Milliman OSA - Milliman
Member Contribution Rates (Percent of Member Pay)
PERS 1 6.00% 6.00% 0.00%PERS 2 7.92% 7.81% 0.11%TRS 1 6.00% 6.00% 0.00%TRS 2 7.48% 7.64% -0.16%SERS 2 7.80% 7.75% 0.05%PSERS 2 6.98% 6.97% 0.01%WSPRS 7.34% 7.34% 0.00%LEOFF 1 0.00% 0.00% 0.00%LEOFF 2* 8.75% 8.71% 0.04%

Milliman Pension Funding Council and LEOFF 2 Board Actuarial Audit of 2015 Actuarial Valuation Funding
This work product was prepared solely for the PFC and the LEOFF 2 Retirement Board for the purposes described herein and may not be appropriate to use for other purposes. Milliman does not intend to benefit and assumes no duty or liability to other parties who receive this work. Milliman recommends that third parties be aided by their own actuary or other qualified professional when reviewing the Milliman work product.
31
pfc0019.docx
Comments (continued)
Employer Contribution Rates Phased-In Mortality Improvement Assumption (80% Scale BB)
Employee Contribution Rates Phased-In Mortality Improvement Assumption (80% Scale BB)
The remainder of this section describes in detail why we believe the funding policies used to calculate contribution rates are reasonable and consistent with the objectives described in the RCW.
DifferenceOSA Milliman OSA - Milliman
Employer Contribution Rates (Percent of Member Pay)
PERS 1 5.03% 5.00% 0.03%PERS 2/3 7.49% 7.39% 0.10%TRS 1 7.32% 7.40% -0.08%TRS 2/3 7.83% 7.99% -0.16%SERS 2/3 8.27% 8.24% 0.03%PSERS 2 6.73% 6.71% 0.02%WSPRS 12.81% 12.77% 0.04%LEOFF 1 0.00% 0.00% 0.00%LEOFF 2 N/A N/A N/A
DifferenceOSA Milliman OSA - Milliman
Member Contribution Rates (Percent of Member Pay)
PERS 1 6.00% 6.00% 0.00%PERS 2 7.38% 7.28% 0.10%TRS 1 6.00% 6.00% 0.00%TRS 2 7.06% 7.22% -0.16%SERS 2 7.27% 7.24% 0.03%PSERS 2 6.73% 6.71% 0.02%WSPRS 7.34% 7.34% 0.00%LEOFF 1 0.00% 0.00% 0.00%LEOFF 2 N/A N/A N/A

Milliman Pension Funding Council and LEOFF 2 Board Actuarial Audit of 2015 Actuarial Valuation Funding
This work product was prepared solely for the PFC and the LEOFF 2 Retirement Board for the purposes described herein and may not be appropriate to use for other purposes. Milliman does not intend to benefit and assumes no duty or liability to other parties who receive this work. Milliman recommends that third parties be aided by their own actuary or other qualified professional when reviewing the Milliman work product.
32
pfc0019.docx
Policy Objectives
The contribution rate calculations for the Washington State retirement systems are complex. Much of this complexity is due to efforts to conform to articulated policy objectives. RCW 41.45.010 states that it is the intent of the legislature to provide a dependable and systematic process for funding the benefits provided to members and retirees of the State’s retirement systems and sets out five specific goals:
1. To fully fund the Plans 2 and 3 as provided by law;
2. To fully amortize LEOFF Plan 1 costs not later than June 30, 2024;
3. To fully amortize the unfunded actuarial accrued liability for PERS and TRS Plans 1 within a rolling 10-year period, using methods and assumptions that balance needs for increased benefit security, decreased contribution rate volatility, and affordability of pension contribution rates;
4. To establish long-term employer contribution rates which will remain a relatively predictable proportion of the future state budgets; and
5. To fund, to the extent feasible, all benefits for plan 2 and 3 members over the working lives of those members so that the cost of those benefits are paid by the taxpayers who receive the benefit of those members' service.
Although not specifically stated in RCW 41.45.010, the funding policies also achieve the following goals:
1. The same employer contribution rate is maintained for all members in the same class regardless of Plan. For example: employers make the same contribution for all TRS members regardless of whether they are in Plans 1, 2, or 3.
2. Funding risk is shared by both employers and members. In Plan 2, both employer and member contribution rates vary based on plan experience. In Plan 3, members take the risk associated with their contributions since they are deposited in the defined contribution plan.
Actuarial Cost Methods
The funding policies of the Washington State Retirement Systems are based on two actuarial cost methods: the Aggregate cost method and the Entry Age cost method. The Funded Ratios are measured based on the Entry Age cost method. The following text describes these methods.
Purpose of a Cost Method and Normal Cost
The purpose of any actuarial cost method is to allocate the cost of future benefits to specific time periods, typically during a member’s projected working career. This is clearly stated in Pension Mathematics for Actuaries, A.W. Anderson, second edition, 1990, p. 5.
“The painful lesson which has been learned over and over again in the last century by various types of employers – first private employers, and later public employers – is that the cost of a pension plan must be recognized during the working lifetimes of the employees who are ultimately going to receive pensions, preferably by actually funding amounts sufficient to provide completely for each employee’s life annuity at the time of retirement.” The text goes on to state on p. 6: “This is where actuaries come into the picture, … The actuary can … assign to each fiscal year a portion of the present value of future benefit payments in such a way as generally to accrue costs over the working lifetimes of employees. Any scheme for making such an assignment of costs is called an actuarial cost method – which we shall henceforth refer to simply as a “cost method.”
The cost assigned to a specific year is called the Normal Cost.

Milliman Pension Funding Council and LEOFF 2 Board Actuarial Audit of 2015 Actuarial Valuation Funding
This work product was prepared solely for the PFC and the LEOFF 2 Retirement Board for the purposes described herein and may not be appropriate to use for other purposes. Milliman does not intend to benefit and assumes no duty or liability to other parties who receive this work. Milliman recommends that third parties be aided by their own actuary or other qualified professional when reviewing the Milliman work product.
33
pfc0019.docx
Aggregate Cost Method
Under the Aggregate cost method, the Normal Cost rate is equal to the level percentage of pay necessary to fund the difference between the present value of all future benefits for current members (PVFB) and the actuarial value of assets (AVA). The difference between PVFB and AVA is funded by future contributions. Each year, the Normal Cost spreads all required future contributions evenly over the present value of future salaries for current members. When actual experience is better or worse than expected experience, the Normal Cost in subsequent years will go down or up, respectively. The contribution calculated by the Aggregate cost method is therefore equal to the Aggregate Normal Cost.
Note that while appropriate for funding, this method does not result in a calculation of the liability independent of assets and therefore does not provide a meaningful “Funded Ratio.” OSA currently addresses this by use of the Entry Age actuarial cost method. That method is used to calculate the Funded Ratio and is used for GASB accounting and financial reporting.
Plans 2 and 3 employer and member contribution rates are primarily set using the Aggregate cost method.
Entry Age Actuarial Cost Method
The Entry Age cost method is the most common method used by public plans. The goal of the Entry Age method is the theoretical allocation of projected benefit costs as a level percent of pay over the members’ entire working lifetimes. The Entry Age Normal Cost (EANC) is the theoretical level percent of pay which, if contributed from the members’ dates of hire to their dates of projected retirement, would exactly fund their benefits if all experience exactly matched the actuarial assumptions. Actual experience better or worse than expected will not change the EANC. The EANC is not anticipated to increase or decrease from year to year. Experience better or worse than expected creates a positive or negative Unfunded Actuarial Accrued Liability (UAAL), which is funded separately from the EANC.
Therefore, systems using the Entry Age cost method have two components to their calculated costs: (1) the EANC, which is meant to be a level % of pay, and (2) the UAAL amortization contribution, which is the balancing item that makes sure all future benefits are financed if future experience follows the assumptions, and contributions are made according to schedule. For the purposes of the Washington State plans, the Entry Age method is only used to set minimum contribution rates based on the EANC. This is a logical use of EANC and should increase contribution stability since it represents the theoretical level percentage of pay contribution required to fund benefits if future experience follows the actuarial assumptions. Specifically, RCW sets minimum contribution rates as follows:
PERS, TRS, SERS and PSERS Plan 2/3 employers and Plan 2 members have a minimum contribution rate based on sharing 80% of EANC. [RCW 41.45.155 and RCW 41.45.158]
WSPRS employers and members have a minimum contribution rate based on sharing 70% of EANC [RCW 41.45.0631].
The LEOFF Plan 2 Board has established a policy that considers contribution rates equal to both 90% and 100% of the EANC and has recently established contribution rates based on 100% of the EANC.

Milliman Pension Funding Council and LEOFF 2 Board Actuarial Audit of 2015 Actuarial Valuation Funding
This work product was prepared solely for the PFC and the LEOFF 2 Retirement Board for the purposes described herein and may not be appropriate to use for other purposes. Milliman does not intend to benefit and assumes no duty or liability to other parties who receive this work. Milliman recommends that third parties be aided by their own actuary or other qualified professional when reviewing the Milliman work product.
34
pfc0019.docx
Plans 2 and 3 Funding Policy
In general, the Plans 2 and 3 funding policies for PERS, TRS, SERS, PSERS and WSPRS are based on the Aggregate Cost method and work as described below. Note that where the following text makes references to “Plans 2 and 3” the references should be substituted with “Plans 1 and 2” for WSPRS. Also, please note that PSERS has no Plan 3. RCW 41.45 describes the actuarial funding of state retirement systems. The primary references for Plans 1, 2, and 3 funding are [RCW 41.45.060 Basic State and Employer Contribution Rates], [RCW 41.45.061 Required Contribution Rates for Plan 2 Members] and [RCW 41.45.0631 Washington State Patrol Retirement System].
1. First, the remaining Plans 2 and 3 “past liability balances,” which are financed entirely by employer contributions, are determined. Currently for PERS, TRS and SERS, these are due to gain sharing, and for WSPRS these are due to distributions under RCW 43.43.270(2) for survivors of members who became disabled under RCW 43.43.040(2) prior to July 1, 2006. The remaining past liability balances are determined by taking the prior year’s balance, adding interest, and subtracting employer contributions based on the corresponding supplemental employer percent of pay contribution rates: PERS 0.11%, TRS 0.77%, SERS 1.00% and WSPRS 1.32%.
2. The Plans 2 and 3 Present Value of Future Contributions shared by employers and members is calculated as:
Present Value All Future Benefits minus Actuarial Value of Assets minus Past Liability Balance
Present Value of Future Contributions
3. The Plans 2 and 3 Aggregate Normal Cost Rate is determined by spreading the present value of future contributions shared by employers and members over the present value of future Plans 2 and 3 member salaries. The calculation takes into account that Plan 3 members do not contribute to the defined benefit plans.
4. Plans 2 and 3 minimum employer and member contribution rates are applied based on the EANC. The minimum rate for PERS, TRS, SERS and PSERS is 80% of EANC. The minimum rate for WSPRS is 70% of EANC. LEOFF 2 contributions for the 2015-2017 biennium are currently based on 100% of the EANC based on the 2013 actuarial valuation. This is currently larger than the Aggregate Normal Cost Rate.
5. Plans 2 maximum member contribution rates are applied to TRS [RCW 41.45.061] and WSPRS [RCW 41.45.0631]. This results in the Plan 2 member contribution rates. Note that the maximum for WSPRS was recently increased by 0.15% due a change in the duty-related death benefits upon remarriage under SHB 1194.
6. The Plans 2 and 3 employer rates are increased by the supplemental contributions rates used to finance past liability balances. As described above these are: PERS 0.11%, TRS 0.77%, SERS 1.00% and WSPRS 1.32%.
7. Plans 2 and 3 employer rates are also increased to account for any maximums applied to member contribution rates resulting in the final Plans 2 and 3 employer contribution rates.

Milliman Pension Funding Council and LEOFF 2 Board Actuarial Audit of 2015 Actuarial Valuation Funding
This work product was prepared solely for the PFC and the LEOFF 2 Retirement Board for the purposes described herein and may not be appropriate to use for other purposes. Milliman does not intend to benefit and assumes no duty or liability to other parties who receive this work. Milliman recommends that third parties be aided by their own actuary or other qualified professional when reviewing the Milliman work product.
35
pfc0019.docx
LEOFF 2 Funding Policy
The LEOFF 2 funding policy follows the same general pattern as the other Plans 2 and 3 with fewer details. As stated above, LEOFF 2 contributions are currently based on 100% of the EANC, which works like a minimum since it is currently larger than the Aggregate Normal Cost Rate. The total contribution is paid 50% by employees, 30% by employers, and 20% by the State [RCW 41.26.725]. In addition, RCW 41.26.720 states that the actuary shall “utilize the aggregate actuarial cost method, or other recognized actuarial cost method based on a level percentage of payroll.” Since (a) 100% of EANC is the theoretical contribution that will finance benefits if paid as a level percent of pay over the members’ full working careers, and (b) 100% of EANC is larger than the Aggregate Normal Cost, the method currently employed is consistent with the RCW.
The current LEOFF 2 funding policy might be interpreted as: paying the greater of 100% of EANC or the Aggregate Normal Cost. This works well to establish a stable contribution rate (100% EANC) while ensuring liabilities are financed over a responsible period (Aggregate Normal Cost). However, the current funding policy does not address how stable contribution rates will be maintained if the Plan’s funding ratio continues to increase. Specifically, the Board may wish to proactively consider: (a) If the funding ratio continues to increase, at what point action should be taken (b) What that action would be. For instance, two potential actions consistent with stable contribution rates would be to de-risk retiree liability, or to adopt more conservative assumptions.
Plans 1 Funding Policy (PERS, TRS, SERS and PSERS)
PERS and TRS Plans 1 are both closed to new members. The PERS and TRS Plans 1 funding policies have been designed to produce equal total contribution rates for PERS and TRS employers regardless of whether their employees are in Plans 1, 2 or 3, and to share the responsibility of PERS Plan 1 benefits with SERS and PSERS employers. It works as follows.
1. All PERS and TRS Plan 1 members have fixed contribution rates equal to 6.00% of pay.
2. The remaining balances for any liability from Plan 1 benefit improvements effective after June 30, 2009 are determined. These liabilities are financed based on rates that were calculated to amortize them over a fixed 10-year period using combined Plans 1, 2, and 3 salaries. The remaining balances are determined by taking the prior year’s balance, adding interest, and subtracting employer contributions based on the corresponding employer percent of pay contribution rates: PERS 0.14% and TRS 0.15%.
3. The Present Value of Future Normal Costs (PVFNC) is determined. The Plan 1 funding policy defines this to be the present value of future contributions made by Plan 1 employees plus the present value of future employer contributions made as a percent of Plan 1 member pay based on the Plans 2 and 3 employer contribution rates calculated above. This must be taken into account to keep the contribution rates equal for Plans 1, 2, and 3.

Milliman Pension Funding Council and LEOFF 2 Board Actuarial Audit of 2015 Actuarial Valuation Funding
This work product was prepared solely for the PFC and the LEOFF 2 Retirement Board for the purposes described herein and may not be appropriate to use for other purposes. Milliman does not intend to benefit and assumes no duty or liability to other parties who receive this work. Milliman recommends that third parties be aided by their own actuary or other qualified professional when reviewing the Milliman work product.
36
pfc0019.docx
Plans 1 Funding Policy (PERS, TRS, SERS and PSERS) (continued)
4. The Plan 1 UAAL is calculated as: Present Value All Future Benefits
minus PVFNC minus Actuarial Value of Assets minus Balance Post 2009 Improvements
Unfunded Actuarial Accrued Liability
5. The Unfunded Actuarial Accrued Liability Rate (UAAL Rate) is calculated as the percent of Plans 1, 2, and 3 member pay to amortize the Plan 1 UAAL over 10 years as a level percentage of projected payroll. This is based on a rolling 10-year period which means every year the UAAL is amortized over a new 10-year period. This helps to keep rates stable while amortizing a material portion of the remaining UAAL each year.
6. Minimum contribution rates of 3.50% of pay for PERS 1 UAAL and 5.75% of pay for TRS 1 UAAL are applied. When combined with the rolling 10-year period, these will help to get the UAAL for the Plans 1 completely financed over a reasonable period instead of indefinitely re-amortizing it over 10 years.
Conference of Consulting Actuaries White Paper
As mentioned in Section 3, in October 2014, the Conference of Consulting Actuaries (CCA) issued a white paper titled Actuarial Funding Policies and Practices for Public Pension Plans. The white paper was composed by a group of public plan actuaries from the major consulting firms that work with public plans and was the result of an extensive series of meetings which lasted for over two years. The white paper focuses on a Level Cost Allocation Model (LCAM) and provides detailed analysis for classifying each of the three major components of LCAM funding policies: (a) cost methods, (b) asset methods and (c) amortization methods. The classification system uses the following terms:
We will make reference to the CCA white paper in our discussion below.
Evaluation of Funding Policy
As stated earlier, we believe the funding policies are consistent with Actuarial Standards of Practice and with the intended policy objectives. Additional specific comments follow below.
Model Practices Those practices most consistent with the Level Cost Allocation Model (LCAM).
Acceptable Practices Generally those which, while not consistent with the LCAM, are well established in practice and typically do not require additional analysis.
Acceptable Practices with Conditions
May be acceptable in some circumstances either to reflect different policy objectives or on the basis of additional analysis.
Non-Recommended Practices
Systems using these practices should acknowledge the policy concerns identified in the CCA Guidelines or acknowledge they reflect different policy objectives.
Unacceptable Practices
No description provided by CCA, but implication is that these should not be used.
Categories Under CCA Guidelines

Milliman Pension Funding Council and LEOFF 2 Board Actuarial Audit of 2015 Actuarial Valuation Funding
This work product was prepared solely for the PFC and the LEOFF 2 Retirement Board for the purposes described herein and may not be appropriate to use for other purposes. Milliman does not intend to benefit and assumes no duty or liability to other parties who receive this work. Milliman recommends that third parties be aided by their own actuary or other qualified professional when reviewing the Milliman work product.
37
pfc0019.docx
Evaluation of Funding Policy (continued)
The Aggregate cost method is used as the foundation for the funding policies. The Aggregate cost method is classified as “Acceptable” by the CCA white paper, is well established in practice, and is consistent with the objectives in that document.
The Aggregate cost method is specifically designed to fully fund all future benefits for current members (that are not financed by accumulated assets) over the remaining projected working lifetimes of those members. This represents excellent “demographic matching,” which is to say benefits are funded over the working lifetimes of the members receiving them. It is also excellent at avoiding “agency risk” issues, which means use of the Aggregate method makes it very difficult to push the cost of benefits for current members onto future generations.
The Aggregate method is also consistent with the policy objectives identified in RCW 41.45.010, which is particularly evidenced by how well the fifth policy objective is satisfied: to fund, to the extent feasible, all benefits for Plan 2 and 3 members over the working lives of those members so that the cost of those benefits are paid by the taxpayers who receive the benefit of those members' service.
The Aggregate method’s primary shortcoming is that it passes all gains and losses through to the Normal Cost, which pays for them over the comparatively short, although very responsible, period of the active members’ projected remaining working lifetimes. The downside of this is that it can decrease the stability of short-term costs. This shortcoming is addressed in the funding policy by smoothing asset gains and losses over as much as eight years, as well as by applying the minimum contribution rates. Eight-year asset smoothing is longer than five years, which is the most common length of asset smoothing. The comparatively longer asset smoothing period helps partially offset the comparatively shorter financing period for gains and losses under the Aggregate cost method. The minimum contribution rates equal to 70% or 80% of the EANC help avoid temporary large decreases in contributions due to good investment experience at the peak of a market cycle.
The Plans 1 policy of contributing at a level which finances the Unfunded Actuarial Accrued Liability (UAAL) over a rolling 10-year period based on the pay of Plans 1, 2, and 3 is a rough equivalent of the Aggregate Cost Method. The 10-year rolling period bears a very general similarity to financing UAAL over the members’ projected remaining working lifetimes. When the minimum contribution rates of 3.50% for PERS 1 and 5.75% for TRS are added, the policy also has an element that will help to get the UAAL for the Plans 1 completely financed over a reasonable period instead of indefinitely re-amortizing it over a rolling 10-year period. The funding policy is very consistent with the third policy objective listed in RCW 41.45.010, which is to fully amortize the UAAL for PERS and TRS Plans 1 within a rolling 10-year period, using methods and assumptions that balance needs for increased benefit security, decreased contribution rate volatility, and affordability of pension contribution rates.

Milliman Pension Funding Council and LEOFF 2 Board Actuarial Audit of 2015 Actuarial Valuation Funding
This work product was prepared solely for the PFC and the LEOFF 2 Retirement Board for the purposes described herein and may not be appropriate to use for other purposes. Milliman does not intend to benefit and assumes no duty or liability to other parties who receive this work. Milliman recommends that third parties be aided by their own actuary or other qualified professional when reviewing the Milliman work product.
38
pfc0019.docx
Evaluation of Funding Policy (continued)
As stated above, the 100% of EANC currently contributed for LEOFF 2, which is larger than the Aggregate Normal Cost, is consistent with the RCW and shares the advantages discussed for the other Plans 2 and 3. Paying 100% of EANC also avoids making contributions which are less than the expected long-term cost of benefits. Short-term rate stability is increased since rates will not fluctuate every year due to gains and losses, particularly investment gains and losses, being reflected in the Aggregate Normal Cost. Some margin is provided for adverse experience since the rates are higher than the Aggregate Normal Cost. A contribution policy of 100% EANC does require consistent monitoring. However, this monitoring occurs automatically under the policy as long as the contribution is not allowed to be less than the Aggregate Normal Cost.

Milliman Pension Funding Council and LEOFF 2 Board Actuarial Audit of 2015 Actuarial Valuation
This work product was prepared solely for the PFC and the LEOFF 2 Retirement Board for the purposes described herein and may not be appropriate to use for other purposes. Milliman does not intend to benefit and assumes no duty or liability to other parties who receive this work. Milliman recommends that third parties be aided by their own actuary or other qualified professional when reviewing the Milliman work product.
39
pfc0019.docx
Section 6 Review of Preliminary Report and Recommendations from Prior Audit Audit Conclusion
Because the final 2015 Actuarial Valuation report has not been completed at this time, we base the comments in this section on the preliminary report. We have made a few comments for consideration for the upcoming reports that may enhance an outside reader’s understanding. All of these comments are related to additional disclosure, and, if implemented, none would have an impact on the contribution rates.
We have also reviewed the comments from our prior actuarial audit and reported on the incorporation of those comments. All of the recommendations pertaining to the valuation calculations were implemented.
Comments Regarding OSA’s Reports
In the preliminary valuation report, all of the calculations are based on the full mortality improvement assumption (100% scale BB). Because the Pension Funding Council and LEOFF 2 Board had not taken any action regarding the 2017-2019 contribution rates at the time that the preliminary report was published, there is no information regarding the actual contribution rates set for 2017-2019.
For the final valuation report, it is our recommendation that it be made clear what the actual contribution rates are and what assumptions were used to develop those rates. We also think it would be good to have a comparison to the actual contribution rates used for the 2015-2017 biennium.
The term Present Value of Accrued (Earned) Benefits is sometimes used in the preliminary report to identify the portion of the present value of future benefits that has been “earned” as of the valuation date based on the Entry Age Normal (EAN) actuarial cost method. As an example, on page 7 the term Present Value of Accrued (Earned) Benefits is used in the table describing Actuarial Liabilities. However, in the Funded Status table on page 8 the same numbers are labeled as “Accrued Liability.” We have not seen the term Present Value of Accrued (Earned) Benefits applied to this measure of liability before. However, the term Present Value of Accrued (Earned) Benefits is often used for a different purpose. Actuarial literature uses the term Entry Age Actuarial Accrued Liability, or simply the Actuarial Accrued Liability. This is because under the Entry Age method, liabilities are determined by allocating costs not benefits. Although the term “Present Value of Accrued (Earned) Benefits” may be easier for the general reader to accept, we recommend the report be changed to uniformly use the term “Accrued Liability” as is used in the Funded Status table on page 8, or the longer term “Actuarial Accrued Liability.” We base this recommendation on the need for a consistent set of terminology to be used across actuarial practice.
Some of the labels in the chart on page 25 of the preliminary valuation report were displayed incorrectly. We brought this to the attention of OSA, and OSA stated that the issue will be corrected for the final report.
We had a handful of additional suggestions for the text in the report. OSA indicated that those suggestions will be considered for the final valuation report.
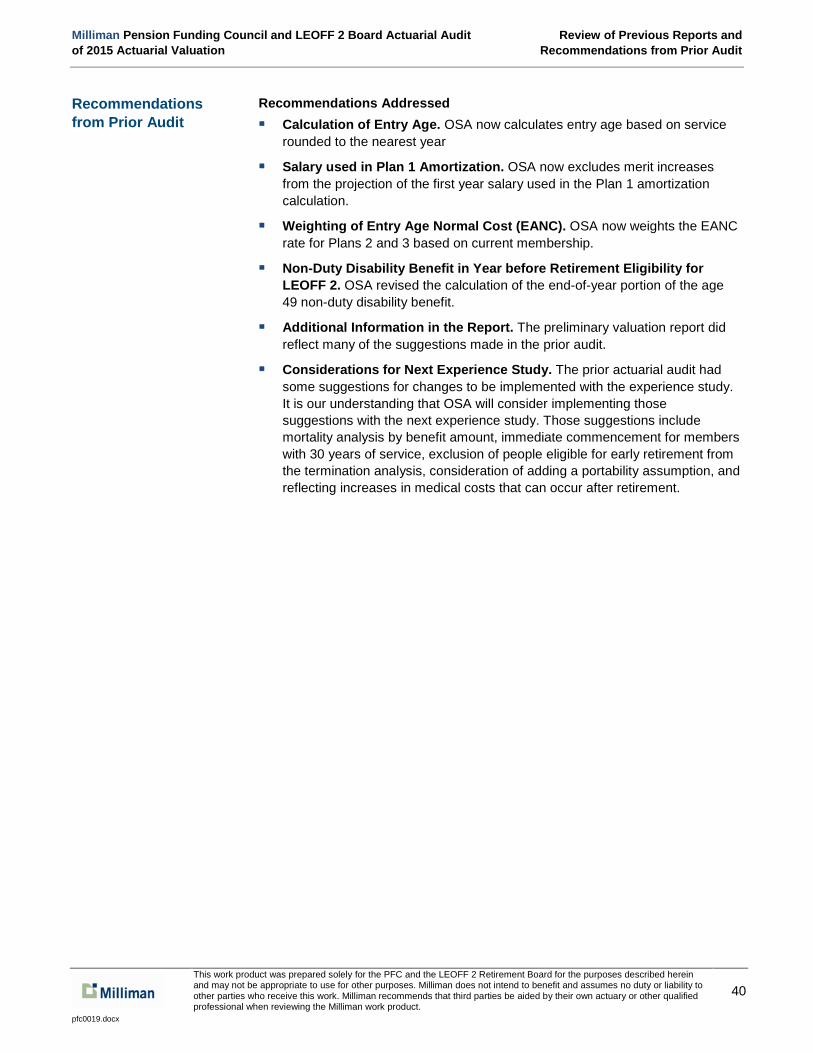
Milliman Pension Funding Council and LEOFF 2 Board Actuarial Audit Review of Previous Reports and of 2015 Actuarial Valuation Recommendations from Prior Audit
This work product was prepared solely for the PFC and the LEOFF 2 Retirement Board for the purposes described herein and may not be appropriate to use for other purposes. Milliman does not intend to benefit and assumes no duty or liability to other parties who receive this work. Milliman recommends that third parties be aided by their own actuary or other qualified professional when reviewing the Milliman work product.
40
pfc0019.docx
Recommendations from Prior Audit
Recommendations Addressed Calculation of Entry Age. OSA now calculates entry age based on service
rounded to the nearest year
Salary used in Plan 1 Amortization. OSA now excludes merit increases from the projection of the first year salary used in the Plan 1 amortization calculation.
Weighting of Entry Age Normal Cost (EANC). OSA now weights the EANC rate for Plans 2 and 3 based on current membership.
Non-Duty Disability Benefit in Year before Retirement Eligibility for LEOFF 2. OSA revised the calculation of the end-of-year portion of the age 49 non-duty disability benefit.
Additional Information in the Report. The preliminary valuation report did reflect many of the suggestions made in the prior audit.
Considerations for Next Experience Study. The prior actuarial audit had some suggestions for changes to be implemented with the experience study. It is our understanding that OSA will consider implementing those suggestions with the next experience study. Those suggestions include mortality analysis by benefit amount, immediate commencement for members with 30 years of service, exclusion of people eligible for early retirement from the termination analysis, consideration of adding a portability assumption, and reflecting increases in medical costs that can occur after retirement.