state purchase contracts · worth in 2016–17. one way that this purchasing power is harnessed is...
TRANSCRIPT

Level 31 / 35 Collins StreetMelbourne Vic 3000
T 03 8601 7000
—
—
Victorian Auditor -General’s Office
State Purchase Contracts2018–1
9: 1
2Septem
ber 2018
Independent assurance report to Parliament2018–19: 12
State PurchaseContracts
September 2018
17781 VAGO_State Purchase Contracts_Cover.pdf | Page 1 of 1 17781 VAGO_State Purchase Contracts_Cover.pdf | Page 1 of 1


State Purchase Contracts
Independent assurance report to Parliament
Ordered to be published
VICTORIAN GOVERNMENT PRINTER
September 2018
PP no 441, Session 2014–18

This report is printed on Monza Recycled paper. Monza Recycled is certified Carbon Neutral by The Carbon Reduction Institute
(CRI) in accordance with the global Greenhouse Gas Protocol and ISO 14040 framework. The Lifecycle Analysis for Monza
Recycled is cradle to grave including Scopes 1, 2 and 3. It has FSC Mix Certification combined with 99% recycled content.
ISBN 978 1 925678 36 9

The Hon Bruce Atkinson MLC The Hon Colin Brooks MP
President Speaker
Legislative Council Legislative Assembly
Parliament House Parliament House
Melbourne Melbourne
Dear Presiding Officers
Under the provisions of section 16AB of the Audit Act 1994, I transmit my report
State Purchase Contracts.
Yours faithfully
Andrew Greaves
Auditor-General
20 September 2018


Victorian Auditor‐General’s Report State Purchase Contracts 5
Contents
Audit overview ............................................................................................................. 7
Conclusion ......................................................................................................................................... 8 Findings .............................................................................................................................................. 8 Recommendations ........................................................................................................................... 13 Responses to recommendations ..................................................................................................... 14
1 Audit context ......................................................................................................... 17
1.1 Departmental goods and services expenditure ...................................................................... 18 1.2 Victorian public sector procurement framework ................................................................... 18 1.3 Roles and responsibilities ....................................................................................................... 21 1.4 State Purchase Contracts ........................................................................................................ 23 1.5 Previous VAGO audits ............................................................................................................. 29 1.6 Why this audit is important .................................................................................................... 30 1.7 What this audit examined and how ....................................................................................... 30 1.8 Report structure ..................................................................................................................... 31
2 Category planning ................................................................................................. 33
2.1 Conclusion .............................................................................................................................. 34 2.2 Development of category strategies ...................................................................................... 34 2.3 Department procurement spend ........................................................................................... 41
3 Overseeing and managing SPCs ............................................................................ 49
3.1 Conclusion .............................................................................................................................. 49 3.2 VGPB oversight of SPCs .......................................................................................................... 50 3.3 Lead agencies’ development and management of SPCs ........................................................ 51
4 Realisation of SPC benefits .................................................................................... 61
4.1 Conclusion .............................................................................................................................. 61 4.2 Targets .................................................................................................................................... 61 4.3 Measuring financial benefits .................................................................................................. 63 4.4 Benefits methodology ............................................................................................................ 67 4.5 Non‐financial benefits ............................................................................................................ 68 4.6 Reliability of data .................................................................................................................... 70
5 Understanding and managing contract leakage ................................................... 73
5.1 Conclusion .............................................................................................................................. 73 5.2 Roles and responsibilities to manage leakage ........................................................................ 74 5.3 Leakage from mandatory SPCs ............................................................................................... 75 5.4 Exemption process ................................................................................................................. 85

6 State Purchase Contracts Victorian Auditor‐General’s Report
Appendix A. Audit Act 1994 section 16—submissions and comments ..................... 89
Appendix B. Entities bound by VGPB policies .......................................................... 107
Appendix C. State Purchase Contracts ..................................................................... 109
Appendix D. Western Australian Department of Finance dashboard ..................... 113
Appendix E. Methodology for spend analysis .......................................................... 115
Appendix F. ANZSIC division descriptions ................................................................ 119
Appendix G. Goods and services spend by ANZSIC subdivision, group
and class categories ................................................................................................. 123
Appendix H. Spend and benefits .............................................................................. 129
Acronyms and abbreviations
ANZSIC Australian and New Zealand Standard
Industrial Classification
ASR Annual Supply Report
CAFAS Commercial and Financial Advisory
Services
CMP Category Management Plan
DEDJTR Department of Economic Development,
Jobs, Transport and Resources
DELWP Department of Environment, Land, Water
and Planning
DET Department of Education and Training
DHHS Department of Health and Human
Services
DJR Department of Justice and Regulation
DPC Department of Premier and Cabinet
DTF Department of Treasury and Finance
FMA Financial Management Act 1994
ICT information and communication
technology
IT information technology
NSW New South Wales
PAS Professional Advisory Services
SPC State Purchase Contract
VAGO Victorian Auditor‐General’s Office
VGPB Victorian Government Purchasing Board
VPS Victorian public sector
VPS 5 Victorian Public Service Grade 5
WA Western Australia

Victorian Auditor‐General’s Report State Purchase Contracts 7
Audit overview
The Victorian public sector (VPS) buys a lot of goods and services—$18.6 billion
worth in 2016–17. One way that this purchasing power is harnessed is through
State Purchase Contracts (SPC). SPCs aggregate demand for commonly used
goods and services such as utilities, office consumables, information and
communication technology (ICT), staffing and travel services.
The primary benefit of an SPC is financial—that is, government achieves direct
savings through lower unit costs and prices than would be possible through
fragmented VPS procurement. Other benefits include reduced transaction costs
for suppliers and buyers, as well as the ability to influence and improve the
quality of service offerings.
In 2016–17 the Victorian Government’s 34 SPCs had a combined annual spend
of approximately $1.47 billion, growing from $1.06 billion in 2014–15.
The Victorian Government Purchasing Board (VGPB) is responsible for
monitoring the compliance of departments and specified entities with VGPB
supply policies. The Market analysis and review policy includes the requirement
for these agencies to use mandated SPCs and outlines the process that lead
agencies must follow to establish an SPC. Four lead agencies manage SPCs—
primarily the Department of Premier and Cabinet (DPC) and the Department of
Treasury and Finance (DTF), but also the Department of Justice and Regulation
(DJR) and Cenitex. Each SPC can involve either a sole supplier or a panel
arrangement. The typical term for an SPC is three years with provision for
two one‐year extensions. During the term, the panel may be open, admitting
new suppliers, or closed.
Of the 34 SPCs, 23 are mandatory for use by all 34 agencies subject to VGPB
policies, with the remaining being optional. Statutory authorities, local councils,
organisations that government partly funds, and charitable or not‐for‐profit
organisations can use SPCs voluntarily, subject to approval from lead agencies.
VGPB reports to the Minister for Finance, with DTF providing it with secretariat
and other support. VGPB was established in 1995 under the Financial
Management Act 1994 (FMA) to:
develop, implement and review supply policies and practices
monitor compliance with supply policies
develop procurement capability
establish and maintain a comprehensive database of departments’ and
supply markets’ purchasing data, for access by departments
provide strategic oversight of major procurements
engage with stakeholders to drive greater procurement efficiencies.

8 State Purchase Contracts Victorian Auditor‐General’s Report
Our overall objective for this audit was to assess whether government agencies
realise financial and other benefits by using SPCs.
We examined whether VGPB and lead agencies oversee SPCs effectively. We
also examined whether the reported benefits are reliable and whether scope
exists to increase the financial benefits of these arrangements.
SPCs provide financial savings and other benefits. However, more savings are
possible if contract management activities are strengthened to better manage
suppliers, reduce the risk of leakage—expenditure made outside of mandatory
SPCs—and aggregate spending in new categories. The VPS cannot fully realise
these savings without comprehensive and detailed spend data, and it is the
absence of such centralised data that VGPB must address.
Financial management reform in the public sector over the past three decades
has included decentralised budgeting, accounting and reporting. This has led
to the siloed information systems that feature today in Victorian Government
departments. Departments need to harness today’s technology to redress this,
not just to secure better data for procurement but to make public sector
financial management broadly more efficient.
Informing procurement
Neither VGPB nor lead agencies have a complete picture of the goods
and services VPS agencies purchase. This is mainly due to the absence of
standardised systems and consistent business rules that govern how purchasers
collect and classify information.
As a result, VGPB and lead agencies do not know, who is buying what, from
which suppliers and at what cost. Instead, they rely on suppliers to self‐report.
This means they have limited insight into potential contract leakage, and they
do not fully understand all the categories of expenditure that could possibly be
aggregated.
Aggregation
Lead agencies undertake market analysis and consult with key stakeholders
including representatives from SPC users to support category strategy
development. However, VGPB and lead agencies lack consolidated, detailed
transaction data, so they are not well equipped to conduct meaningful and
insightful spend analysis to develop category strategies. Because they use
supplier‐reported data on existing SPCs, their category strategies relate only
to these existing SPCs rather than entire expenditure categories. This results
in potential missed opportunities to realise further benefits.
Lead agencies undertake ad hoc checks of the supplier‐reported data and
require SPC users to confirm spend for some SPCs, but their verification
activities are limited because they do not have all the information needed
to sufficiently assess and validate the supplier reports.
Conclusion
Findings

Victorian Auditor‐General’s Report State Purchase Contracts 9
We obtained and consolidated the past three years’ worth of expenditure data
from the seven Victorian Government departments. Our analysis of the
2016–17 year highlights the following areas of common goods and services
expenditure for which SPCs do not currently exist:
accounting services—of the $37.1 million total departmental spend in
2016–17, the top two suppliers account for 94 per cent
market analysis and statistical services—of the $13.4 million total
departmental spend in 2016–17, the top five suppliers account for
52 per cent.
Leakage
User departments and agencies are responsible for ensuring that expenditure
made outside of mandatory SPCs, or ‘leakage’ does not occur. However, they
do not understand or manage contract leakage in their organisations.
Lead agencies also do not effectively oversee user departments’ compliance
with mandatory SPCs.
We examined expenditure data at the seven departments to identify potential
leakage in four mandatory SPCs. In a significant number of transactions,
we were unable to determine the nature of the spend due to the limited
descriptions on the invoices. Given these limitations, our analysis is conservative
and indicative—it uses the best available data in departments’ finance systems.
Our analysis for 2016–17 shows potential leakage of:
$0.25 million, or 2.1 per cent of the total spend of $12.23 million, in the
stationery category
$0.06 million, or 0.1 per cent of the total spend of $48.64 million, in the
travel category
$2.07 million, or 0.7 per cent of the total spend of $289.37 million, in the
staffing category
we found no potential leakage in the legal services category.
This leakage, if confirmed, would contradict the statements of compliance made
by departments in their Annual Supply Reports (ASR) to VGPB.
Managing contracts
VGPB oversight of SPCs
VGPB does not have the resources to directly oversee the management of all
SPCs or ensure compliance with its supply policies. With its limited resources it
sensibly monitors only the compliance of the seven departments, Public
Transport Victoria, VicRoads, Victoria Police and Cenitex, as opposed to all
34 VPS agencies in its scope.

10 State Purchase Contracts Victorian Auditor‐General’s Report
VGPB acknowledges the limitations of its monitoring activities in assessing
compliance with its policies. For example, in their 2016–17 ASRs to VGPB, the
seven departments raised no compliance issues with their SPC obligations.
This is despite being unable to tell us whether contract leakage was occurring.
However, VGPB accepted these assertions without detailed scrutiny or auditing
of the information. VGPB stated that this was due to the lack of data and the
tight time frame specified in the FMA between entities submitting their ASRs
and VGPB including them as part of its annual report.
While VGPB’s audit program requires entities to verify compliance with
mandatory policy requirements and submit a report to VGPB every three years,
this verification takes place well after assertions are made.
VGPB oversees the establishment of SPCs, however, its oversight of lead
agencies’ contract management activities is minimal once the contract is
executed. While VGPB requests an update from lead agencies at certain
milestones, these milestones are at the one‐ or two‐year points of contracts
that run for three years.
Lead agencies’ management of SPCs
Lead agencies use contract management frameworks to manage SPCs. However,
there are inconsistent management practices across the four lead agencies.
There is an opportunity to improve SPC performance by better monitoring
suppliers’ performance and sharing information with users, including:
assessing client satisfaction
managing key suppliers
sharing savings opportunities with departments and entities
tracking SPC prices.
Assessing client satisfaction
DTF surveys SPC users annually to assess their satisfaction with SPCs. The
2016−17 results indicate that almost three‐quarters of users were satisfied
with their overall experiences. Although this survey is useful, it does not show
users’ assessments of suppliers on individual engagements. This is particularly
important for panel supplier arrangements such as the Professional Advisory
Services (PAS) SPC, where DTF could use this information to address
performance issues and notify users of issues with specific suppliers.
While the PAS SPC requires users to complete a satisfaction survey and forward
it to DTF at the completion of each engagement, only a limited number of users
do so. Consequently, as it acknowledges in the PAS category strategy, DTF has
little visibility of the SPC’s performance and buyer satisfaction.
In 2016–17, DJR undertook an extensive consultation process on the Legal
Services Panel SPC to develop a new client satisfaction survey. The survey
results feed into annual performance review meetings with suppliers. The
survey results indicate that users are generally satisfied with the services
provided by the panel.
Annual Supply Reports
The seven departments, Public Transport Victoria, VicRoads, Victoria Police and Cenitex each submit an ASR to VGPB each year. The ASRs summarise procurement activity and report instances of non‐compliance with VGPB policies, including the use of mandatory SPCs.

Victorian Auditor‐General’s Report State Purchase Contracts 11
DPC and Cenitex have limited visibility of users’ assessments of supplier
performance because they do not survey SPC users.
Managing key suppliers
The establishment of an SPC concentrates government expenditure with a
select number of suppliers. Eight of the top 10 suppliers to the seven
departments were SPC suppliers.
To manage an SPC well, lead agencies need to understand the level of supplier
spend and to use this information to leverage further savings. However, this is
not always occurring. For example, DPC’s June 2018 review into labour hire and
professional services found that despite the significant expenditure on PAS to a
limited number of suppliers, ‘there is no active account management of these
suppliers at the whole of government level and the aggregation of demand is
not actively used to drive better pricing outcomes’. DTF advised it is in the
process of developing a strategy for the future PAS SPC, focusing on more active
central category management.
Sharing savings opportunities with departments and entities
Lead agencies share high‐level information on departmental spend and usage
with VGPB and stakeholders on an ongoing basis. However, scope exists to
better communicate and highlight saving opportunities and trends across users
because, presently, users have no transparent way to assess if they are receiving
competitive rates from suppliers compared to other users.
Such information can be useful for the users of SPCs, where suppliers may
charge different users varying rates for equivalent goods or services. For
example, our analysis of the hourly rate achieved by four departments for
58 engagements of temporary Victorian Public Service Grade 5 (VPS 5) senior
policy officers through the Staffing Services SPC in 2016–17, revealed significant
variation in rates within and between departments.
As the lead agency, DTF should review and distribute such information to SPC
users to help them achieve the same level of savings as other users. Our analysis
also highlights the need for user departments to do more work to understand
where different parts of their businesses are paying varying rates for the same
service. Understanding internal spending patterns will help SPC users negotiate
lower prices during future engagements.
Tracking SPC prices
The SPC user is primarily responsible for ensuring that the prices it pays accord
with the SPC contract. However, purchasing decisions are made in user
departments by different business units and are not all centrally tracked
through their Internal Procurement Units. This hinders the ability of SPC users
to monitor compliance with SPC pricing. DPC’s June 2018 review into labour
hire and professional services raised concerns with how departments check the
compliance of invoices with agreed rates on the Staffing Services SPC and ceiling
rates on the PAS SPC.

12 State Purchase Contracts Victorian Auditor‐General’s Report
Lead agencies, as contract managers, should also conduct spot‐check analyses
of supplier‐reported invoices for high‐risk SPCs to ensure pricing validity and
accuracy, including ensuring ceiling rates are not exceeded. However, they have
not done so for all SPCs.
Measuring SPC benefits
The reported benefits calculated by lead agencies show significant savings by
using SPCs. Reported savings ranged from $192 million in 2014–15 to
$272 million in 2016–17. However, we found:
six DPC‐managed SPCs where the methodology for calculating savings
resulted in the overstatement of benefits
errors in spreadsheets used by DTF and DPC to track spend and benefits for
SPCs
seven SPCs, with a total spend in 2016–17 of more than $176 million, where
lead agencies did not track financial benefits
no documentation that reported the achievement of the non‐financial
benefits identified in many SPC business cases developed by DTF and DPC.
Targets
DTF is required to meet a financial‐benefit performance target specified in the
State Budget papers—‘Benefits delivered as a percentage of expenditure by
mandated agencies under DTF managed SPCs’. Between 2013–14 and 2016–17
DTF reported that it exceeded the target each year.
DTF advised that the target of 5 per cent was derived in 2013 from past
performance data. However, it is unclear whether this is a reasonable measure
against which to judge performance, because DTF has not documented the basis
for the target. There is also no documentation that outlines how each of DTF’s
17 SPCs contributes to the overall target. Further, the target has not changed
over the four years, despite changes to market conditions and SPCs across this
period.
While DTF identifies the expected financial benefit following the sourcing
process for each SPC, there is scope to enhance this process by ‘locking in’ these
financial benefits as targets. The next step for DTF would then be to measure
reported financial benefits against these targets for each SPC.
DJR has a documented financial benefit target for the Legal Services Panel,
which, since the panel’s establishment in March 2016, it has consistently
exceeded.
DPC and Cenitex do not have overall or individual SPC performance targets,
which means they cannot demonstrate that their SPCs deliver the expected
financial benefits, and therefore cannot demonstrate that their SPCs are
performing well.

Victorian Auditor‐General’s Report State Purchase Contracts 13
We recommend that the Victorian Government Purchasing Board:
1. in collaboration with portfolio departments and key State Purchase Contract
users, develop and implement a strategy for the central collection of
comprehensive procurement data across these agencies, that identifies:
the procurement data that agencies need to record, as well as common
rules around data entry through a common chart of accounts, to
consistently capture and code goods and services expenditure
how procurement data should be categorised, and includes a
universally recognised categorisation approach such as the Australian
and New Zealand Standard Industrial Classification or the United
Nations Standard Products and Services Code
the cost benefit of options for developing a centralised system to collect
and analyse procurement data from agencies
how the Victorian Government Purchasing Board will share this data
across agencies to improve decision making and identify potential new
State Purchase Contract opportunities
roles and responsibilities for the project and a time line for completion
(see Section 2.2).
We recommend that the lead agencies Department of Treasury and Finance,
Department of Premier and Cabinet and Department of Justice and Regulation
in collaboration with portfolio departments and key State Purchase Contract
users:
2. use the comprehensive procurement data collected as per recommendation
one to enhance contract management activities, including:
feeding into forward category strategies (see Section 2.2)
outlining the scale of potential leakage (see Section 5.2)
assisting in monitoring compliance with contract rules (see Section 3.3)
confirming supplier‐reported data (see Section 4.6)
3. set a benefits target (financial and or non‐financial) at the establishment or
renewal of each State Purchase Contract that includes a detailed
methodology—approved by the relevant project governance committee—
for the calculation of benefits (see Sections 4.2, 4.3 and 4.4)
4. use the approved benefits calculation methodology to track and report the
State Purchase Contract’s achievement of benefits against this target to the
Victorian Government Purchasing Board (see Sections 4.2, 4.3 and 4.4)
5. use a risk‐based approach to conduct checks of supplier reported data to
confirm the accuracy and completeness (see Section 4.6)
6. develop and implement a risk‐based approach to identify and monitor
contract leakage (see Section 5.2).
Recommendations

14 State Purchase Contracts Victorian Auditor‐General’s Report
We recommend that the lead agencies Department of Treasury and Finance and
Department of Premier and Cabinet:
7. develop and implement a survey strategy to seek and analyse user feedback
on specific State Purchase Contract suppliers and engagements—this
strategy should use a risk‐based approach to identify:
State Purchase Contracts that would benefit from analysis of user
feedback
the frequency of these surveys (see Section 3.3)
8. develop a central record of State Purchase Contract exemptions sought by
State Purchase Contracts users and report annually to the Victorian
Government Purchasing Board—this record should be used for trend
analysis to identify areas where users seek multiple exemptions, which
potentially indicates a problem with the State Purchase Contracts scope and
offerings (see Section 5.4).
We recommend that all departments as State Purchase Contract users:
9. undertake a risk‐based assessment of potential contract leakage by
analysing expenditure in accounts payable systems and report significant
contract leakage to lead agencies (see Section 5.2)
10. include reviews of State Purchase Contract management in their forward
internal audit programs, if warranted, based on the identified risk (see
Section 5.2)
11. develop a central record of applications for State Purchase Contract exemptions, which may necessitate a change in process to require all
exemption applications to be centrally managed within each department
according to its procurement frameworks (see Section 5.4).
We have consulted with Cenitex, the Department of Economic Development,
Jobs, Transport and Resources (DEDJTR), the Department of Education and
Training (DET), the Department of Environment, Land, Water and Planning
(DELWP), the Department of Health and Human Services (DHHS), DJR, DPC, DTF
and VGPB, and we considered their views when reaching our audit conclusions.
As required by section 16(3) of the Audit Act 1994, we gave a draft copy of this
report to those agencies and asked for their submissions or comments.
The following is a summary of those responses. The full responses are included
in Appendix A.
DPC and DJR accept all our recommendations as both lead agencies and users of
SPCs and developed action plans to address them.
DTF supports all our recommendations as both lead agencies and users of SPCs
and developed an implementation timetable.
DHHS, DET and DELWP accept all our recommendations as users of SPCs and
developed action plans to address them.
Responses to recommendations

Victorian Auditor‐General’s Report State Purchase Contracts 15
DEDJTR accept our findings and will work with DTF and other lead agencies to
implement the recommendations.
VGPB supports our recommendation to work with portfolio departments
and key SPC users to develop and implement an e‐procurement strategy for
the central collection of comprehensive procurement data. This work has
commenced as part of our procurement reform program and involves exploring
solutions such as standard categorisation and consistent data capture.
Cenitex supports the report’s findings.

Victorian Auditor‐General’s Report State Purchase Contracts 17
Audit context
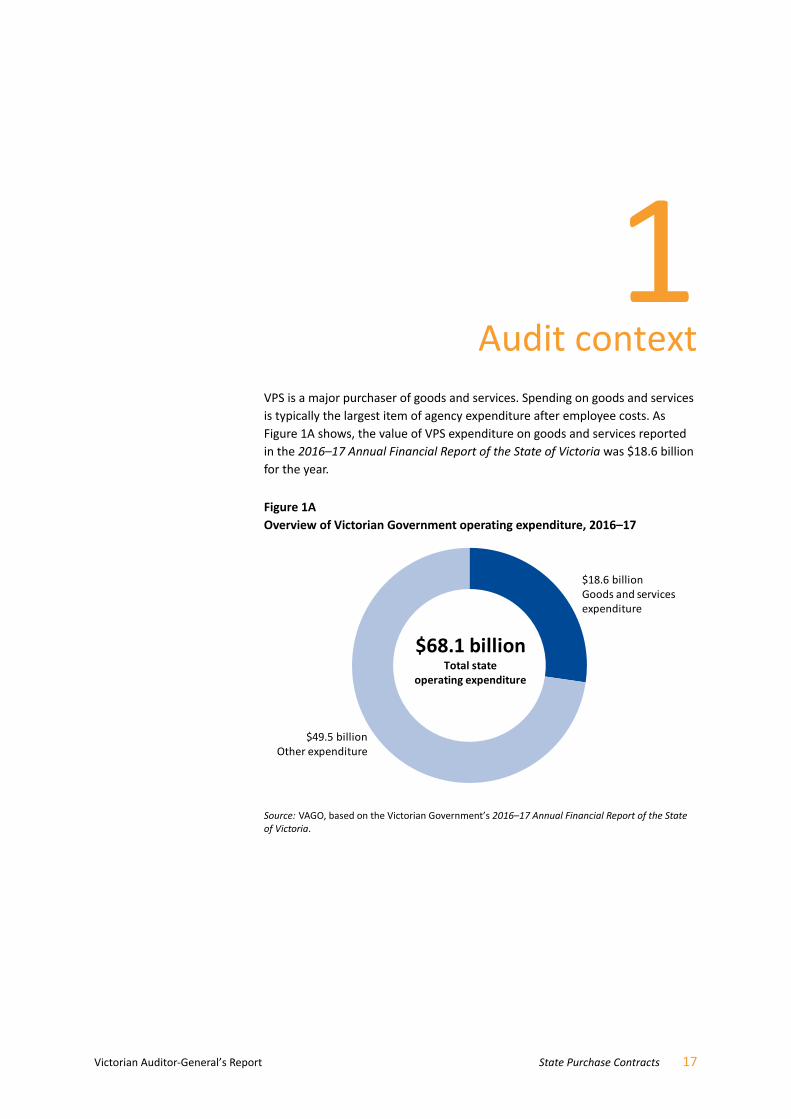
VPS is a major purchaser of goods and services. Spending on goods and services
is typically the largest item of agency expenditure after employee costs. As
Figure 1A shows, the value of VPS expenditure on goods and services reported
in the 2016–17 Annual Financial Report of the State of Victoria was $18.6 billion
for the year.
Figure 1A Overview of Victorian Government operating expenditure, 2016–17
Source: VAGO, based on the Victorian Government’s 2016–17 Annual Financial Report of the State of Victoria.
$68.1 billionTotal state
operating expenditure
$18.6 billion Goods and services expenditure
$49.5 billionOther expenditure

18 State Purchase Contracts Victorian Auditor‐General’s Report
VPS has seven government departments:
DEDJTR
DET
DELWP
DHHS
DJR
DPC
DTF.
In 2016–17 these departments accounted for $3.3 billion (17.7 per cent) of the
total VPS goods and services expenditure.
Given this level of expenditure, the public sector has many opportunities to use
its combined demand for common‐use goods and services to achieve better
value for money. This can be achieved through SPCs, which aim to:
achieve lower prices by aggregating demand for commonly used goods,
such as utilities, office consumables and ICT, and services such as staffing,
and travel
improve efficiency by reducing duplication of process.
Various legislation governs the VPS procurement framework, described in
Figure 1B, and the responsibility for policy advice, tools and training rests with
several entities.
Figure 1B VPS procurement framework
Entities Authorising legislation
Entity responsible for policy advice, tools, training
Goods and services
All seven government departments
VicRoads, Public Transport Victoria, Cenitex
Victorian Public Sector Commission
23 specified entities
FMA VGPB
Other non‐health entities Various Portfolio department or agency
Health entities Health Services Act 1988 DHHS, Health Purchasing Victoria
Construction
All entities Project Development and Construction Management Act 1994
DTF
Source: VAGO, based on information provided by DTF.
1.1 Departmental goods and services
expenditure
1.2 Victorian public sector procurement framework

Victorian Auditor‐General’s Report State Purchase Contracts 19
Victorian Government Purchasing Board
In 1995 VGPB was established under the FMA to:
develop, implement and review supply policies and practices
monitor compliance with supply policies
develop procurement capability
establish and maintain a comprehensive database of departments’ and
supply markets’ purchasing data, for access by departments
provide strategic oversight of major procurements
engage with stakeholders to drive greater procurement efficiencies.
In February 2017 the government gave approval in principle to draft a Bill to
amend the FMA and other legislation. The Financial Management and
Constitution Acts Amendment Bill 2017 was introduced into Parliament in
November 2017 and intends to update VGPB powers, functions and
responsibilities.
VGPB’s vision is to provide leadership in government procurement of goods and
services, in order to deliver value‐for‐money outcomes for Victoria. Figure 1C
depicts VGPB’s strategic priorities for 2016–21.
Figure 1C VGPB’s strategic priorities, 2016–21
Source: Victorian Government Purchasing Board Strategic Plan 2016–2021.
Strategic oversight and stakeholder collaboration
GovernanceComplexity and
capability assessmentMarket analysis and
reviewMarket approach
Contract management and contract disclosure
Value for money Accountability Probity Scalability
To ensure government develops procurement capability, delivers value‐for‐money and fit‐for‐purpose outcomes, minimises risk and enables access to procurement opportunities for all businesses
To provide leadership in government procurement of goods and services to deliver value‐for‐money outcomes for Victoria
Embed and enhance VGPB supply policies
Develop and implement a procurement
capability strategy across people, processes and
systems
Engage with suppliers and the market to improve doing
business with the Victorian public
sector
Broaden the VGPB’s impact on Victorian
public sector procurement
Measure the benefits of the VGPB’s procurement framework
3. Directives
4. Supply policies
5. Strategic objectives
2. Mission
1. Vision

20 State Purchase Contracts Victorian Auditor‐General’s Report
The five‐year strategic plan incorporates a priority for multi‐organisation
purchasing, which includes SPCs and other procurement models.
VGPB policies relate to the procurement of goods and services only, and apply
to the following mandated VPS entities:
all seven government departments
VicRoads, Public Transport Victoria, Cenitex
the Victorian Public Sector Commission
23 administrative offices or bodies specified in section 16(1) of the
Public Administration Act 2004.
Appendix B shows the entities bound by VGPB policies.
VGPB policy does not apply to non‐mandated public sector entities, local
government, the procurement of building and construction works and services,
or to health‐related goods, services and equipment, as shown in Figure 1D.
Figure 1D VGPB’s sphere of influence across the public sector
Source: VAGO, based on information provided by DTF.
General government including:• all seven government departments • specified entities (e.g. VicRoads, Public Transport Victoria and Cenitex)
• the Victorian Public Sector Commission• twenty‐three administrative offices or bodies specified in section 16(1) of the Public Administration Act 2004
Public financial corporations including: • the Victorian Managed Insurance Authority• the Transport Accident Commission
General government aligned/non‐mandated including:• court services• health services and hospitals • schools and technical and further education (TAFE) institutes
• catchment management authorities
Public non‐financial corporations including:• Victorian Rail Track Corporation• V/Line• water corporations• waste and resources recovery groups• alpine resorts
Other public sector entities including:• universities• local government
Mandated
Non‐mandated
InfluenceHigh Low

Victorian Auditor‐General’s Report State Purchase Contracts 21
VGPB works to improve procurement practices for the broader VPS and
publishes accessible better practice guidance for all entities regardless of
whether they are mandated to comply with VGPB policies or not. VGPB also
works with non‐mandated entities that want to bring their goods and services
spend within the VGPB scope.
VGPB is developing a program to broaden the number of mandated public
sector bodies and specified entities that it covers.
Victorian Government Purchasing Board
VGPB reports to the Minister for Finance, with DTF providing secretariat and
other support. The secretariat is also the conduit for communications between
VGPB and departments through procurement forums, the dissemination of
relevant procurement information on VGPB’s website, and by email to the
network of procurement personnel across government.
VGPB receives no direct funding and is instead resourced through DTF’s
allocation to the secretariat.
In April 2018 the Minister for Finance approved a VGPB request to change its
oversight process to a more pro‐active, engagement model. This approval
recognised the increased procurement capability and governance processes
of each department and stakeholder feedback from chief procurement officers.
The changes to VGPB oversight role are intended to drive delivery of the
government’s procurement reforms and to implement the recommendations
of a procurement review undertaken by DPC in conjunction with DTF in
December 2017.
SPC lead agencies
A lead agency is responsible for establishing and managing each SPC. The VGPB
Market analysis and review policy specifies that an entity that seeks to establish
an SPC must:
consult VGPB regarding the category of goods or services proposed for
aggregation and inform VGPB of any analysis of spend or assessment of
complexity that indicates grounds for aggregating demand
have a business case endorsed by VGPB prior to submitting it to the
relevant minister for approval
demonstrate to VGPB that it has the capability to establish and manage the
proposed SPC as the lead agency.
1.3 Roles and responsibilities

22 State Purchase Contracts Victorian Auditor‐General’s Report
Once the lead agency obtains ministerial approval, it must again notify VGPB.
The VGPB Market analysis and review policy requires SPC lead agencies to:
consider any comments made by VGPB and the relevant minister prior to
engaging with the market
inform VGPB and the relevant minister of the outcome of the market
engagement process
authorise an SPC head agreement setting out the key terms of a proposed
agreement between parties on behalf of the Victorian Government.
Figure 1E shows the lead agencies for the 34 SPCs.
Figure 1E SPC lead agencies
Source: VAGO.
• Cash and Banking Services• Document Mail Exchange
(DX Services)• Electricity – Large Sites • Electricity – Small and
Medium Enterprise and Residential Sites
• Fleet Disposals• Fuel and Associated Products • Marketing Services Register• Master Agency Media
Services • Motor Vehicles • Natural Gas• Postal Services • Print Management Services• Professional Advisory Services• Security Services • Staffing Services• Stationery and Workplace
Consumables • Travel Management Services
• Citrix Products and Services • Data Centre Facilities • End User Computing
Equipment Panel • eServices Register • IBM Enterprise Licensing
Agreement• Intra‐Government Secured
Network • IT Infrastructure Register • Microsoft Enterprise
Agreement• Microsoft Licensing Solution
Provider • Multifunction Devices and
Printers• Oracle Software and Support • Salesforce Customer
Relationship Management • Telecommunications
Purchasing and Management Strategy
• Victorian Office Telephony Services
• VMware Enterprise Licensing Agreement
• Legal Services Panel • Rosetta
VGPB
DTFDPC DJR Cenitex
SecretariatStrategic Sourcing

Victorian Auditor‐General’s Report State Purchase Contracts 23
DPC is the lead agency for SPCs relating to ICT, including hardware,
infrastructure, telecommunications and software. DJR is the lead agency for the
Legal Services Panel SPC. Cenitex is the lead agency for the Rosetta SPC, which
relates to identity management and security software. Cenitex advised that the
Rosetta SPC will likely terminate during 2018–19 given the government’s intent
to go to the market for a new identity and access management solution. DTF is
the lead agency for SPCs relating to a selection of other goods and services.
The value of SPCs is significant and growing. Figure 1F shows that reported
spend under SPCs increased from $1.06 billion in 2014–15 to approximately
$1.47 billion in 2016–17. This is an increase of 38.7 per cent and accounts for
around 8 per cent of total public sector expenditure on goods and service in
2016–17.
Figure 1F Reported SPC spend by lead agency, 2014–15 to 2016–17
Source: VAGO, based on data provided by DTF, DPC, DJR and Cenitex.
SPCs are either mandatory or non‐mandatory—based on an assessment by the
lead agency—for entities bound by VGPB policies. Unless the lead agency grants
a formal exemption, these entities must purchase from mandatory SPCs.
Statutory authorities, local councils, organisations that government partly funds,
and charitable or not‐for‐profit organisations can use SPCs voluntarily, subject to
approval from lead agencies. Where the lead agency grants access to a
non‐mandated entity, this is for the duration of the SPC—generally, three years
with provisions for two one‐year extensions.
At June 2017 there were 34 SPCs—23 mandatory and 11 non‐mandatory.
Figure 1G provides a breakdown of the reported spend under each SPC for
2016–17.
0.0 0.5 1.0 1.5
2014–15
2015–16
2016–17
$ (billion)
DTF DPC DJR Cenitex
1.4 State Purchase Contracts

24 State Purchase Contracts Victorian Auditor‐General’s Report
Figure 1G Reported SPC spend, 2016–17
SPC Mandatory or non‐mandatory
Estimated spend ($ million)
DTF
Staffing Services Mandatory 346.7
Motor Vehicles Mandatory 172.4
Master Agency Media Services Mandatory 87.5
Electricity—Large Sites Mandatory 84.6
Professional Advisory Services Mandatory 71.0
Fuel and Associated Products Mandatory 55.1
Security Services Mandatory 46.6
Cash and Banking Services Mandatory 26.6
Print Management Services Mandatory 18.7
Electricity—Small and Medium Enterprise and Residential Sites
Mandatory 17.6
Stationery and Workplace Consumables Mandatory 15.7
Natural Gas Mandatory 14.5
Travel Management Services Mandatory 13.9
Marketing Services Register Mandatory 5.5(a)
Document Mail Exchange (DX Services) Mandatory 2.3
Fleet Disposals Mandatory 1.2
Postal Services Non‐mandatory 1.0
Subtotal 980.9
DPC
Telecommunications Purchasing and Management Strategy
Mandatory 153.8
End User Computing Equipment Panel Mandatory 79.7
IT Infrastructure Register Mandatory 44.6
Microsoft Enterprise Agreement Non‐mandatory 25.5
Microsoft Licensing Solution Provider Non‐mandatory – (b)
Oracle Software and Support Non‐mandatory 22.0
Data Centre Facilities Non‐mandatory 14.9
Victorian Office Telephony Services Non‐mandatory 10.9
Multifunction Devices and Printers Mandatory 7.7
Citrix Products and Services Non‐mandatory 5.5
VMware Enterprise Licensing Agreement Non‐mandatory 4.5
IBM Enterprise Licensing Agreement Non‐mandatory 2.9
Salesforce Customer Relationship Management
Non‐mandatory 1.5
Intra‐Government Secured Network Mandatory 1.1
eServices Register Mandatory – (c)
Subtotal 374.6
Victorian Auditor‐General’s Report State Purchase Contracts 25
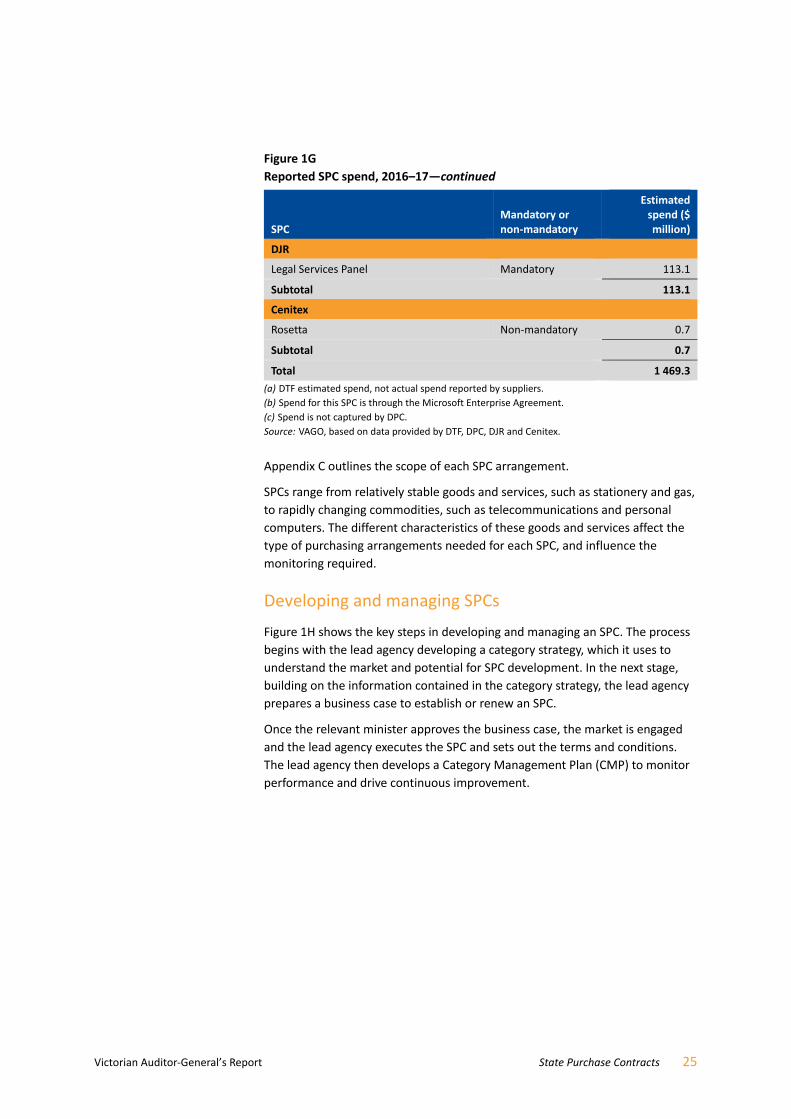
Figure 1G
Reported SPC spend, 2016–17—continued
SPC Mandatory or non‐mandatory
Estimated spend ($ million)
DJR
Legal Services Panel Mandatory 113.1
Subtotal 113.1
Cenitex
Rosetta Non‐mandatory 0.7
Subtotal 0.7
Total 1 469.3
(a) DTF estimated spend, not actual spend reported by suppliers.
(b) Spend for this SPC is through the Microsoft Enterprise Agreement.
(c) Spend is not captured by DPC. Source: VAGO, based on data provided by DTF, DPC, DJR and Cenitex.
Appendix C outlines the scope of each SPC arrangement.
SPCs range from relatively stable goods and services, such as stationery and gas,
to rapidly changing commodities, such as telecommunications and personal
computers. The different characteristics of these goods and services affect the
type of purchasing arrangements needed for each SPC, and influence the
monitoring required.
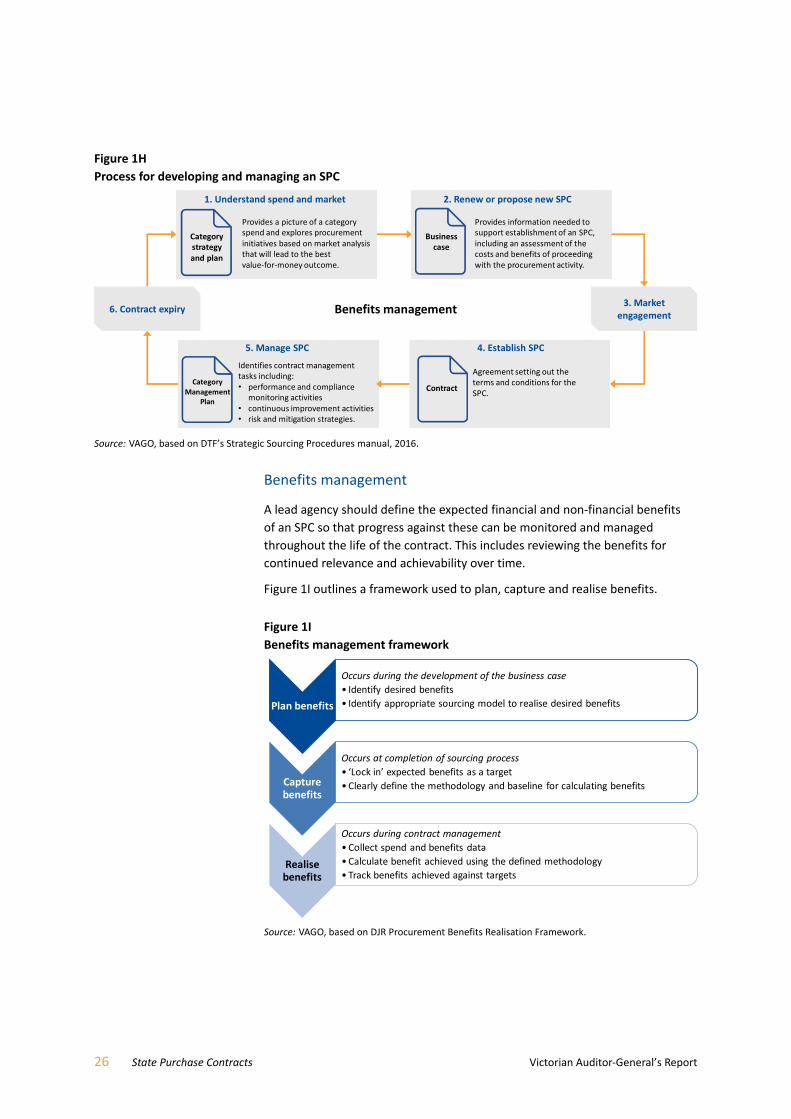
Developing and managing SPCs
Figure 1H shows the key steps in developing and managing an SPC. The process
begins with the lead agency developing a category strategy, which it uses to
understand the market and potential for SPC development. In the next stage,
building on the information contained in the category strategy, the lead agency
prepares a business case to establish or renew an SPC.
Once the relevant minister approves the business case, the market is engaged
and the lead agency executes the SPC and sets out the terms and conditions.
The lead agency then develops a Category Management Plan (CMP) to monitor
performance and drive continuous improvement.
26 State Purchase Contracts Victorian Auditor‐General’s Report
Figure 1H Process for developing and managing an SPC
Source: VAGO, based on DTF’s Strategic Sourcing Procedures manual, 2016.
Benefits management
A lead agency should define the expected financial and non‐financial benefits
of an SPC so that progress against these can be monitored and managed
throughout the life of the contract. This includes reviewing the benefits for
continued relevance and achievability over time.
Figure 1I outlines a framework used to plan, capture and realise benefits.
Figure 1I Benefits management framework
Source: VAGO, based on DJR Procurement Benefits Realisation Framework.
Benefits management
2. Renew or propose new SPC
Provides information needed to support establishment of an SPC, including an assessment of the costs and benefits of proceeding with the procurement activity.
1. Understand spend and market
Provides a picture of a category spend and explores procurement initiatives based on market analysis that will lead to the best value‐for‐money outcome.
Businesscase
Category strategy and plan
4. Establish SPC
Agreement setting out the terms and conditions for the SPC.
Contract
5. Manage SPC
Identifies contract management tasks including:• performance and compliance
monitoring activities• continuous improvement activities• risk and mitigation strategies.
Category Management
Plan
6. Contract expiry3. Market
engagement
Plan benefits
Occurs during the development of the business case
• Identify desired benefits
• Identify appropriate sourcing model to realise desired benefits
Capture benefits
Occurs at completion of sourcing process
• ‘Lock in’ expected benefits as a target
• Clearly define the methodology and baseline for calculating benefits
Realise benefits
Occurs during contract management
•Collect spend and benefits data
• Calculate benefit achieved using the defined methodology
• Track benefits achieved against targets
Victorian Auditor‐General’s Report State Purchase Contracts 27
Benefits tracking is critical to a lead agency’s ability to demonstrate an SPC’s
performance. A benefits management framework supports the achievement of
the expected outcomes identified in the business case and the benefits finally
secured on contract award.
Financial benefits are based on a question—if the SPC did not exist, would the
service or goods cost more and, if so, by how much? The answer will be the
financial benefit delivered by the SPC. Examples of financial benefits include
cost savings through reduced pricing, increased discounts and more favourable
payment terms.
Non‐financial benefits can relate to environmental, social and risk management
aspects. When assessing the impact of SPCs, potential non‐financial benefits
need to be considered. These can include:
availability of environmentally friendly alternatives
reduction in procurement risks through supplier vetting
better service quality from suppliers as they come to understand
government needs through repeat engagements
reduced commercial and legal risks from a consistent set of negotiated and
legally endorsed commercial terms and conditions used across government
rather than several different agency‐specific contracts.
DTF and DPC guidance makes SPC lead agencies responsible for delivering the
expected benefits or explaining variances when benefits do not meet
expectations.
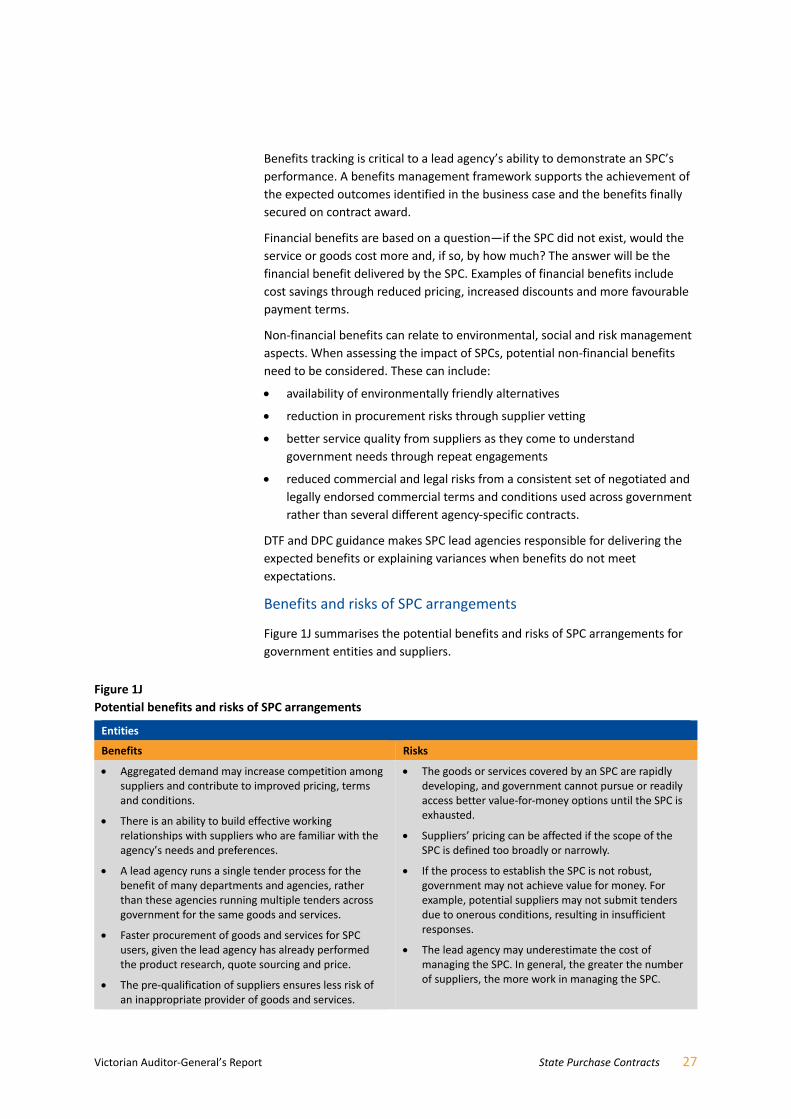
Benefits and risks of SPC arrangements
Figure 1J summarises the potential benefits and risks of SPC arrangements for
government entities and suppliers.
Figure 1J Potential benefits and risks of SPC arrangements
Entities
Benefits Risks
Aggregated demand may increase competition among suppliers and contribute to improved pricing, terms and conditions.
There is an ability to build effective working relationships with suppliers who are familiar with the agency’s needs and preferences.
A lead agency runs a single tender process for the benefit of many departments and agencies, rather than these agencies running multiple tenders across government for the same goods and services.
Faster procurement of goods and services for SPC users, given the lead agency has already performed the product research, quote sourcing and price.
The pre‐qualification of suppliers ensures less risk of an inappropriate provider of goods and services.
The goods or services covered by an SPC are rapidly developing, and government cannot pursue or readily access better value‐for‐money options until the SPC is exhausted.
Suppliers’ pricing can be affected if the scope of the SPC is defined too broadly or narrowly.
If the process to establish the SPC is not robust, government may not achieve value for money. For example, potential suppliers may not submit tenders due to onerous conditions, resulting in insufficient responses.
The lead agency may underestimate the cost of managing the SPC. In general, the greater the number of suppliers, the more work in managing the SPC.

28 State Purchase Contracts Victorian Auditor‐General’s Report
Figure 1J
Potential benefits and risks of SPC arrangements—continued
Suppliers
Benefits Risks
Access to a potentially lucrative market for goods or services for a set period.
An increased probability of future work, which assists forward planning.
Familiarity with common processes, terms, conditions and performance criteria for multiple requests for goods or services, which can lead to lower costs.
Being on an SPC may enhance the supplier’s reputation and legitimacy in the market.
Where unsuccessful in an SPC application, there is no opportunity to undertake this type of work with government for the SPC period.
Selection for an SPC may unduly raise supplier expectations regarding work opportunities, as participation does not guarantee a minimum amount of work.
Onerous selection processes may disadvantage small and medium firms.
Suppliers may be bound by agreed terms and conditions for the period of the SPC regardless of external impacts such as higher costs. For example, increase in raw material costs.
Source: VAGO, adapted from the Australian National Audit Office, May 2012, Establishment and Use of Procurement Panels.
SPC sourcing models
SPCs are either sole or multiple supplier arrangements, including panels or
pre‐approved registers. Panels can be open or closed. Open panels can accept
new suppliers during the term of the contract, closed panels cannot. Figure 1K
outlines the different SPC sourcing arrangements.
Figure 1K SPC sourcing arrangements
Sourcing model option Sourcing model description
Sole supplier A lead agency contracts a single supplier to provide goods and services. This is a closed arrangement for a set period. Examples include gas, electricity, and cash and banking SPCs.
Multiple supplier Panel—allows multiple suppliers, selected through a tender process, access to government work. Panels can be either open or closed.
Pre‐approved register—allows all suppliers access to government business through a pre‐qualification process.
Master vendor Generally, an arrangement with a single supplier, providing subject matter expertise and market knowledge. The master vendor is responsible for developing partnerships and managing relationships with tier‐2 suppliers to provide required services. Used to reduce complexity and administration in managing contracts and suppliers while ensuring a broader access to supply—for example, the Staffing Services SPC utilises a modified master vendor model.
Broker Typically, an individual supplier arrangement, engaged to source products or services from a third party such as various manufacturers. Quotations are based on pre‐defined statements of work and used where market expertise and buying power is low to deliver better value for money—for example, the Print Management Services SPC.
Source: VAGO, based on DTF’s Strategic Sourcing Procedures manual, 2016.

Victorian Auditor‐General’s Report State Purchase Contracts 29
In two previous VAGO audits of SPCs—Government Advertising and
Communications and Personal Expense Reimbursement, Travel Expenses
and Corporate Credit Cards—we found significant deficiencies with their
management.
Government Advertising and Communications
This February 2012 audit examined the management of the Master Agency
Media Services, Print Management Services and Marketing Services SPCs.
At the time of the audit, DPC was the lead agency for the Master Agency Media
Services SPC. DTF was the lead agency for the Print Management Services and
the Marketing Services SPCs, although DPC had been the lead agency until
December 2009, when management transferred to DTF.
The audit made the following findings:
DPC had not been effective in managing the contracts for the three SPCs
reviewed. DPC did not monitor whether contracts met objectives or confirm
if negotiated rates were competitive. In addition, there was little evidence
that it assessed service provider performance or consistently monitored
department and agency spending under each SPC.
Management of the Print Management Services and Marketing Services
SPCs improved significantly under DTF, with regular reporting from, and
close coordination with, the service providers.
The audit recommended that DPC improve its management of the Master
Agency Media Services contract, but in September 2015 the management
of this contract also transferred to DTF.
Personal Expense Reimbursement, Travel Expenses and Corporate Credit Cards
This May 2012 audit examined how well DTF oversaw, and user departments
managed, SPCs, including their understanding and management of contract
leakage. The audit examined the Travel Management Services and the
Stationery and Workplace Consumables SPCs.
The audit concluded that user departments had made significant savings from
using these contracts. However, user departments and DTF had not fully
realised potential savings because significant purchasing still occurred outside
these contracts. Apart from the former Department of Justice, user
departments had not understood or managed contract leakage.
The audit recommended that:
public sector agencies should report and address expenditure outside of
mandatory SPCs
DTF should request an acquittal of contract leakage from participating
agencies.
DTF noted in its response to the report that there were opportunities to work
with public sector agencies to review the extent of contract leakage.
1.5 Previous VAGO audits

30 State Purchase Contracts Victorian Auditor‐General’s Report
During 2014–15, VGPB reviewed its supply policies in response to the
government’s election commitments and broader operational feedback.
The review identified a need for VGPB to adopt a stronger role in establishing,
reporting and overseeing SPCs, which DTF oversaw prior to 1 July 2016.
It is timely to assess the extent to which SPCs provide value for money and
optimise other procurement benefits, given the total value of Victorian
Government agency expenditure on goods and services, including under
SPCs, and the relatively recent change in SPC oversight arrangements
(see Section 1.3).
Our objective was to assess whether state government agencies are realising
benefits in procurement by using SPCs. We examined whether:
SPCs are delivering value for money
SPCs are overseen effectively.
We included eight agencies in the scope of our audit:
Cenitex
DEDJTR
DELWP
DET
DHHS
DJR
DPC
DTF.
We also examined VGPB in its oversight role of state supply policies.
We examined a selection of SPCs based on factors such as strategic importance,
spend and stage of contract lifecycle to assess the appropriateness of strategies,
including governance, rules of use and reporting requirements. The scope of the
audit included the collection of expenditure data from the seven departments’
finance systems for the period 1 July 2014 to 30 June 2017.
Given the significant task of obtaining and analysing procurement data, we
could not extend analysis to include the 2017–18 financial year.
We conducted our audit in accordance with section 15 of the Audit Act 1994
and the Australian Auditing and Assurance Standards. The cost of this audit was
$725 000.
1.6 Why this audit is important
1.7 What this audit examined
and how

Victorian Auditor‐General’s Report State Purchase Contracts 31
The remainder of this report is structured as follows:
Part 2 examines the availability and quality of data used to inform category
planning
Part 3 examines VGPB’s oversight role and how well lead agencies oversee
and manage SPCs
Part 4 examines whether effective arrangements are in place to monitor
and evaluate the achievement of expected savings and benefits from SPCs
Part 5 examines whether departments are using SPCs when purchasing
goods and services, and how user and lead agencies manage contract
leakage as required by contract agreements and VGPB policies.
1.8 Report structure


Victorian Auditor‐General’s Report State Purchase Contracts 33
Category planning
Effectively managing the Victorian Government’s significant expenditure on
goods and services is an opportunity to deliver or improve value for money for
the community.
Spend across the VPS can be split into different expense and procurement
categories. Good category planning relies on sound knowledge of the market,
good quality procurement data and robust information systems to provide a
comprehensive picture of spend.
VGPB guidance defines procurement categories as groupings of similar goods or
services with similar suppliers. For example, a pen is a good whereas stationery
could be the procurement category.
To understand procurement categories, VGPB and lead agencies need to know
the goods and services that entities are purchasing, from whom and how much
they pay their suppliers, both in unit rates and in total.
The FMA requires VGPB to establish and maintain a comprehensive database of
departments’ and supply markets’ purchasing data, for access by departments.
The FMA also provides VGPB with the power to request information and data
from mandated agencies relating to the supply of goods and services.
The basis for developing a procurement category strategy is analysing and
understanding spend, business requirements, supply and demand, and the
market. The next step is to determine how these categories of expenditure can
create value for stakeholders.
In some cases, category strategies will recommend aggregation of demand
across government through SPCs. Other category strategies may recommend
that agencies establish their own arrangements. What is critical is developing
the right strategy for each category so that procurement is not driven by a
‘one size fits all’ approach.
This part examines the development of category strategies, including the
availability and quality of data used to inform category planning.

34 State Purchase Contracts Victorian Auditor‐General’s Report
VGPB and lead agencies do not have a complete picture of the goods and
services public sector agencies purchase due to the lack of good quality
procurement data and analysis tools. This limits their ability to fully harness the
state’s purchasing power and increases the risk that SPCs are not maximising
value for money. Better information would enhance category planning by
allowing insightful analysis of who is buying what, from which suppliers and at
what cost. This information would also help identify new SPC opportunities and
where the greatest benefits can be achieved.
VGPB has attempted to collect procurement information. However, it
has not fully met its legislative responsibilities to establish and maintain a
comprehensive database of purchasing data. This is mainly due to the absence
of appropriate systems in departments and entities to capture this information.
Departments and entities have designed and implemented their financial
systems to capture spend data to predominantly meet the needs of financial
reporting and payroll functions. They do not have complete procurement
information such as volumes, unit prices and products purchased.
The actions underway to establish e‐procurement systems, a common chart of
accounts across agencies, and standard goods and services classifications are
positive. However, this needs to be expedited to enable accurate data collection
across departments and entities. There also needs to be a commitment from
public sector agencies to improve data quality, and clear direction and support
from DTF and VGPB to drive the proposed improvements, and capture and
analyse the procurement data.
Effective and efficient purchasing requires a comprehensive picture of the spend
profile and of stakeholder and business needs, as well as an analysis of markets.
Figure 2A summarises key activities and questions leading to category strategy
development and implementation.
Figure 2A Category strategy development and implementation
Source: VAGO, based on DTF, Strategic Sourcing Procedures manual, 2016.
Develop spend profile
Identify stakeholder
needs
Analyse market
Develop category strategy
Implement strategy
Continuous improvement
• Who buys what goods and services and from whom?
• How often do they buy, and in what quantity?
• How much do they spend?
• Are there exclusions or constraints?
• Who are the buyers?
• What are their specific business needs?
• Why do they buy the way they do?
• What are their concerns?
• Who are the vendors?
• Is the market competitive?
• Where is the market heading?
• Is the current approach best practice?
• Identify the procurement solution
• Align strategy to business objectives
• Identify resources
• Build consensus on direction
• Gain cooperation and commitment
• Identify and manage risks
• Continually engage with stakeholders
• Identify opportunities for improvement
• Ensure the strategy is responsive to changes in the market and stakeholder needs
2.1 Conclusion
2.2 Development of category strategies

Victorian Auditor‐General’s Report State Purchase Contracts 35
Although lead agencies undertake market analysis and consult with key
stakeholders, including representatives from SPC users, to support category
strategy development, VGPB and lead agencies also need detailed expenditure
data to identify spend patterns. However, centrally captured, comprehensive
and consistently categorised procurement data is lacking, as is a tool to analyse
whole‐of‐government procurement spend.
The absence of appropriate technology and standard processes in departments
is a feature of the decentralised and devolved approaches to financial
management systems and reporting that arose from the new public sector
financial management paradigms of the 1990s. While these approaches have
had many positive impacts on improving financial governance and
accountability, they have nevertheless created and perpetuated information
silos that work against whole‐of‐government approaches.
What is missing is:
a central e‐procurement system to streamline and integrate procurement
processes and information across departments
a common chart of accounts across agencies subject to the FMA to
consistently capture and code goods and services expenditure to allow
better assessment and analysis
standard goods and services classification processes—that is, the use of the
United Nations Standard Products and Services Code or the Australian and
New Zealand Standard Industrial Classification (ANZSIC).
Departments have expressed interest in the use of a central e‐procurement
system. However, securing agreement across departments on how to meet all of
their needs has proven to be complicated.
In 2016 and 2017 the Victorian Secretaries’ Board endorsed Statements of
Direction to move towards a whole‐of‐Victorian Government approach to
implementing information technology (IT) systems that will support business
areas, including procurement. The Victorian Secretaries’ Board agreed that DPC
will develop a Statement of Direction on procurement systems for the VPS that
will outline the high‐level requirements for consistent procurement systems in
the Victorian Government.
The Statements of Direction aim to provide an agreed position across
departments to upgrade and modernise IT systems to simplify processes and
better manage resources. This technology has a five‐year implementation time
line.
VGPB advised that it expects the proposed adoption of e‐procurement systems,
a common chart of accounts and an expenditure classification framework to
play a key support role in better managing and overseeing the state’s
procurement spend.
The Victorian Secretaries’ Board comprises the Secretaries of each department, the Chief Commissioner of Police and the Victorian Public Sector Commissioner.

36 State Purchase Contracts Victorian Auditor‐General’s Report
While the proposed improvements in systems and processes to capture
procurement data are encouraging, VGPB and DTF need to centrally drive the
analysis of this procurement data to better understand existing, and identify
new, SPC opportunities.
VGPB’s role in capturing procurement data
The FMA requires VGPB to establish and maintain a comprehensive database of
purchasing data from departments and specified entities.
While the lack of standardised systems and business rules that govern how
agencies collect and classify procurement information has hampered its ability
to do so, VGPB has responsibility for fostering improvement in these areas.
However, VGPB has insufficient resources to actively lead and coordinate a
whole‐of‐government approach to procurement technology.
VGPB has attempted to meet this function by using data collected from ASRs
provided by departments and specified entities. However, this information is
limited because it includes only:
contract expenditure for non‐construction goods and services valued at
more than $100 000
procurement activity plans that outline planned procurement activity for
the next 12–18 months.
This information does not provide the detailed spend data—unit price, quantity
and supplier details—needed to develop category strategies. Consequently, this
is not comprehensive purchasing data, which the FMA requires VGPB to collect.
VGPB review of accounts payable data
The absence of comprehensive purchasing data impacts VGPB’s ability to meet
a key strategic direction in its Strategic Plan 2016–2021 that requires it ‘to
develop a prioritised program of future multi‐organisation procurement
opportunities using SPCs or other forms of procurement models in consultation
with VPS organisations’. The requirement to collect this purchasing data has
been in place since the VGPB was established in 1995, however it has taken over
20 years to address this. In November 2017 it worked with DTF to commission a
desktop review of accounts payable data from the seven departments, VicRoads
and Victoria Police, to identify procurement saving opportunities. The review
used data from 2014–15 and identified savings opportunities of between:
$70 million and $154 million by establishing new SPCs
$49 million and $106 million across existing SPCs, by expanding their scope
or by practicing better category management.
The achievement of some of these savings depends on improved technology.
The potential implementation of a whole‐of‐government e‐procurement system
is likely to enhance DTF’s ability to realise these savings.

Victorian Auditor‐General’s Report State Purchase Contracts 37
In the absence of a data classification framework, the review needed to make
assumptions when classifying data. For example, if a supplier was on multiple
SPCs—for example, PAS and the eServices Register—the review assigned it to
one SPC. The data also did not reflect the item that the agency purchased, only
the supplier and the value.
Given the limitations of the data, the review recommended a more detailed
investigation of individual categories to verify the savings. In May 2018 DTF
advised the Minister for Finance that a further ‘deep dive’ is not warranted at
this stage due to:
DTF activity already underway to assess new SPC opportunities—for
example, as part of the government’s Regional Partnership Policy, DTF is
investigating opportunities to aggregate purchasing contracts in regions,
and, is considering opportunities to aggregate education and training
services in regional locations
the significant level of expenditure identified as relating to building and
construction, which is outside VGPB’s scope
this audit, which includes more up‐to‐date data.
Potential changes to VGPB functions
VGPB advised that through the evolution of technology, the interpretation of
VGPB’s function under the FMA to ‘establish and maintain a comprehensive
database of purchasing data’ has changed to reflect a more complex data
management role than envisaged in 1994 when VGPB was established.
While we acknowledge that technology has changed, all government agencies
are required to adapt their processes to align with such changes. The evolution
of technology should have made it easier for VGPB to establish and maintain a
comprehensive database of purchasing data.
In February 2015, DTF undertook a legal review of VGPB’s functions and noted
that because the purchasing database needs to be comprehensive, the
threshold for data collection set by the FMA is high. The legal review stated that
VGPB should ‘query whether this function needs to be reviewed in light of
current practice and resources. This may depend on the kinds of data that it
would be useful to collect and why.’
In March 2017, VGPB put forward a legislative proposal to remove the function
that requires it ‘to establish and maintain a comprehensive data base of
purchasing data’. The removal of the function is subject to the passing of the
Financial Management and Constitution Acts Amendment Bill 2017, which was
introduced to Parliament in November 2017. If this function is not reassigned to
another body, it is unlikely that this important database will be delivered.

38 State Purchase Contracts Victorian Auditor‐General’s Report
Better practice in another jurisdiction
As Figure 2B shows, the Western Australian (WA) Department of Finance
provides a better practice example of how a central procurement body can
capture procurement data to analyse government spending patterns and help
identify opportunities to establish SPCs.
Figure 2B WA Department of Finance interactive dashboard reports of goods and
services expenditure
The WA Department of Finance has, since 2006 on behalf of the State Supply Commission, published an annual report—Who Buys What and How—on goods and services expenditure for government.
Agencies provide the Department of Finance with expenditure information categorised by the United Nations Standard Products and Services Code. The report is a valuable source of information for suppliers in identifying opportunities to provide goods and services and for government in identifying new aggregated purchasing opportunities.
More recently, the WA Department of Finance has used this information and data from sales reports provided by suppliers to develop a Who Buys What and How interactive dashboard that government agencies and the public can access. The public version excludes commercially sensitive information.
The dashboard, launched in July 2018, will help agencies understand the spend in different expenditure categories and identify potential contract aggregation opportunities. The interactive dashboard provides greater transparency of agency expenditure with the ability to ‘drill down’ several levels for more detailed information.
Appendix D shows screenshots of the type of information displayed by the dashboard.
Source: VAGO, based on information provided by the WA Department of Finance.
SPC category strategies
In developing a category strategy, lead agencies typically prepare a draft
strategy for discussion with the designated user reference group, which
comprises key user representatives from each of the departments. Lead
agencies also undertake extensive market analysis, including identifying
stakeholders and business needs.
However, the lack of accessible, quality expenditure data has compromised the
development of category strategies. Lead agency knowledge of procurement
expenditure is limited to departments’ and agencies’ spend on SPCs. Also, this
data comes from suppliers, rather than from users. Consequently, VGPB and
lead agencies have no visibility of all the spend data in an expenditure category.

Victorian Auditor‐General’s Report State Purchase Contracts 39
In comparison, the New South Wales (NSW) Government uses a system called
NSWBuy. This is a one‐stop shop for all NSW Government procurement.
Suppliers use the system to tender for government work and manage their
product catalogues, and buyers from government agencies use it to access
these product catalogues to make a purchase. Buyers can build shopping lists
from the product catalogue with current unit rates and purchase from
whole‐of‐government contracts online.
Users purchase goods and services centrally and the system records the
products that agencies have ordered, including the rates paid and quantities
ordered. This information can then be used to perform a spend analysis at a
product level for a department or at the whole‐of‐government level. This
analysis of an entire category of spend can underpin the development of
category strategies.
Victoria bases decisions about which SPC to establish or renew on analysis
of the supplier‐reported data of spend on existing SPCs, rather than on
comprehensive expenditure data from all users in an entire category of goods
and services. For this reason, the category strategies in place relate to specific
SPCs, rather than entire expenditure categories, which results in potential
missed opportunities to realise further benefits.
Travel category
The travel category strategy does not include an analysis of all government
expenditure on travel. This data is not available to the lead agency, DTF. DTF is
able to analyse spend data through the Travel Management Services SPC only,
as reported by the travel management supplier, not by government users. The
December 2014 category strategy for the Travel Management Services SPC
noted the absence of complete and reliable spend data, given DTF did not
mandate the booking of accommodation in Victoria under the previous SPC.
This means that DTF lacked comprehensive spend data on Victorian
accommodation.
Our review of departments’ accounts payable data identified that more than
$4 million was spent on accommodation in Victoria in 2016–17 outside the SPC.
This is almost half the value of what those seven departments spent on the SPC
that year. Since establishing the current Travel Management Services SPC, DTF
has acknowledged this and has worked with user departments to increase the
number of Victorian accommodation bookings that users make through the SPC.
These efforts have resulted in a doubling of accommodation bookings from
2016–17 to 2017–18. As usage of the Travel Management Services SPC
increases, DTF will have a more comprehensive view of travel spend across the
state. However, as the Travel Management Services SPC is only mandatory for
accommodation outside Victoria, DTF will still only capture travel spend booked
through the SPC, not the entire category spend.

40 State Purchase Contracts Victorian Auditor‐General’s Report
Professional Advisory Services SPC
As Figure 2C shows, the PAS SPC provides a case study of the importance of
category planning in establishing an SPC. This SPC commenced in September
2015 and expires in August 2019. It offers Commercial and Financial Advisory
Services (CAFAS), Tax Advisory Services, Financial Assessment Services and
Probity Services. DTF has broken these four categories down into
20 sub‐categories. Before DTF established the current PAS SPC, these
four services were available as four separate SPCs.
DTF has several challenges with the PAS SPC:
Its size makes management hard.
There is limited visibility of the hourly rates charged.
The high number of sub‐categories makes tracking compliance hard.
Figure 2C PAS category planning
PAS is an open panel SPC—suppliers can join at any time during the contract term following a tender process. DTF adopted the open panel model to align with the objective of providing greater access to government business.
PAS also aims to streamline government engagement with service providers by merging the four separate service contracts—CAFAS, Tax Advisory Services, Financial Assessment Services and Probity Services—into a single SPC.
When developing the PAS SPC category strategy and business case, no spend data was available for past CAFAS services engaged by government. Spend on CAFAS services has subsequently been shown to make up approximately 90 per cent of spend on the PAS SPC in 2016–17.
The March 2015 business case, for combining the four SPCs into one PAS SPC, states that DTF expected the annual contract value for the PAS SPC to be approximately $25 million a year. The actual value of the PAS SPC in 2016–17 was more than $71 million.
At contract commencement, DTF appointed 106 suppliers to the panel, with an additional 124 suppliers added. The sheer size of the PAS SPC, with 230 suppliers, has presented DTF with challenges in managing the contract. Without an automated system, the management of the SPC has primarily focused on contract administration and contract refreshes to ensure that the panel continues to deliver on the government’s commitment to support local jobs. DTF has lacked the resources to undertake more strategic contract management activities for the PAS SPC such as sharing savings opportunities with users and ensuring compliance with ceiling rates.
Given the significant challenges, DTF has commenced a review of the PAS SPC category strategy. As part of the process, DTF advises it will engage and collaborate with the chief procurement officers of the seven departments and the PAS SPC user reference group to identify improvement opportunities in the lead up to a new PAS SPC. DTF also intends to engage an external subject matter expert to obtain market intelligence and benchmarking in the PAS industry and consider how the current PAS SPC compares with best practice in the broader market.
While the review and collaboration with stakeholders will provide greater insight into user needs and the market, the issue around the lack of quality data remains because accurate and comprehensive spend data on professional services across government is still not captured.
Source: VAGO, based on information provided by DTF.
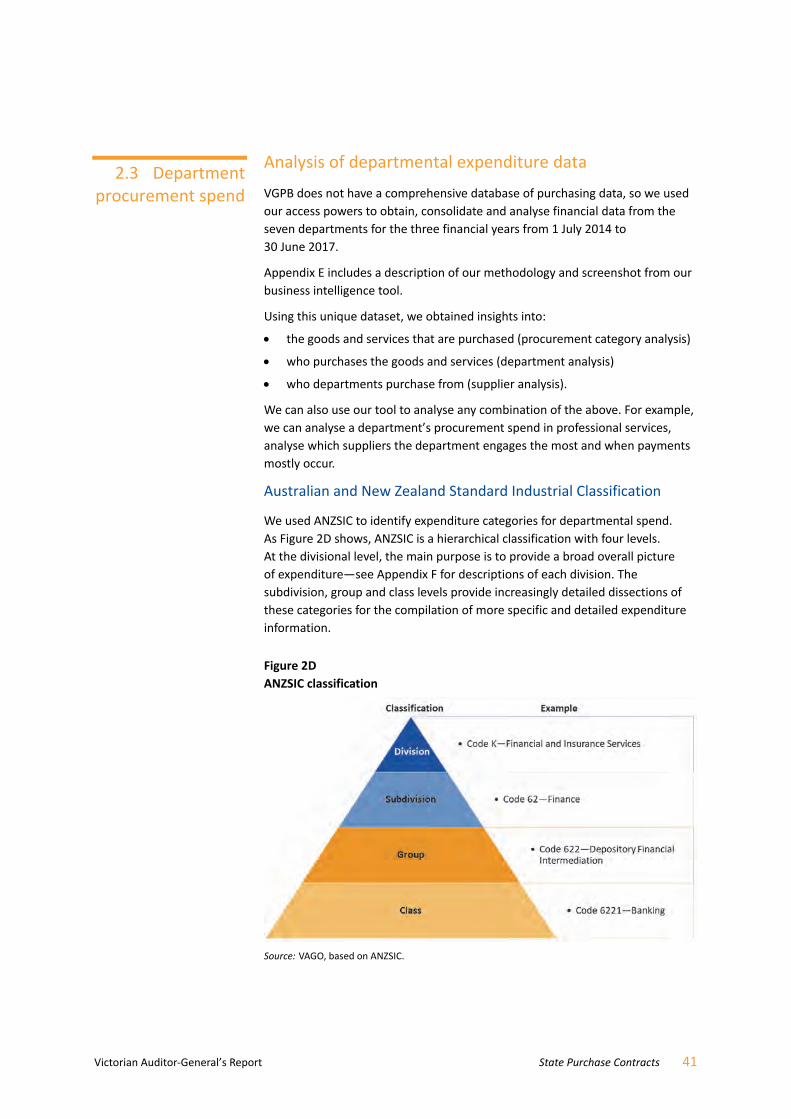
Victorian Auditor‐General’s Report State Purchase Contracts 41
Analysis of departmental expenditure data
VGPB does not have a comprehensive database of purchasing data, so we used
our access powers to obtain, consolidate and analyse financial data from the
seven departments for the three financial years from 1 July 2014 to
30 June 2017.
Appendix E includes a description of our methodology and screenshot from our
business intelligence tool.
Using this unique dataset, we obtained insights into:
the goods and services that are purchased (procurement category analysis)
who purchases the goods and services (department analysis)
who departments purchase from (supplier analysis).
We can also use our tool to analyse any combination of the above. For example,
we can analyse a department’s procurement spend in professional services,
analyse which suppliers the department engages the most and when payments
mostly occur.
Australian and New Zealand Standard Industrial Classification
We used ANZSIC to identify expenditure categories for departmental spend.
As Figure 2D shows, ANZSIC is a hierarchical classification with four levels.
At the divisional level, the main purpose is to provide a broad overall picture
of expenditure—see Appendix F for descriptions of each division. The
subdivision, group and class levels provide increasingly detailed dissections of
these categories for the compilation of more specific and detailed expenditure
information.
Figure 2D ANZSIC classification
Source: VAGO, based on ANZSIC.
2.3 Department procurement spend

42 State Purchase Contracts Victorian Auditor‐General’s Report
Departmental operational expenditure
Figure 2E displays total departmental operational expenditure, by ANZSIC
divisions, for 2014–15 to 2016–17. This expenditure includes goods and
services, as well as inter‐governmental spend, superannuation and grants.
Figure 2E Departmental operational expenditure summary, by ANZSIC division categories,
2014–15 to 2016–17
Division 2014–15
$ (million) 2015–16
$ (million) 2016–17
$ (million) Total
$ (million)
Public Administration and Safety 9 748.5 8 928.6 10 140.9 28 818.0
Education and Training 5 253.4 6 174.6 5 053.5 16 481.5
Professional, Scientific and Technical Services 1 758.2 1 809.9 2 452.0 6 020.1
Health Care and Social Assistance 1 603.4 1 722.7 2 011.2 5 337.3
Construction 1 234.3 505.1 2 150.2 3 889.6
Electricity, Gas, Water and Waste Services 1 130.2 1 106.4 1 338.3 3 574.9
Financial and Insurance Services 1 184.1 752.3 449.6 2 386.0
Arts and Recreation Services 515.6 653.3 587.9 1 756.8
Administrative and Support Services 491.0 497.8 501.5 1 490.3
Other Services 391.9 500.8 443.5 1 336.2
Transport, Postal and Warehousing 287.8 211.5 396.3 895.6
Information Media and Telecommunications 233.7 273.6 279.0 786.3
Wholesale Trade 230.8 248.0 291.7 770.5
Retail Trade 243.2 246.1 208.2 697.5
Manufacturing 161.0 161.0 217.4 539.4
Rental, Hiring and Real Estate Services 94.4 115.2 161.3 370.9
Agriculture, Forestry and Fishing 65.9 71.2 56.4 193.5
Accommodation and Food Services 35.2 32.9 37.1 105.2
Mining 5.6 3.1 2.4 11.1
Uncategorised 1 339.4 1 117.5 1 690.2 4 147.1
Total 26 007.6 25 131.6 28 468.6 79 607.8
Note: Uncategorised expenditure reflects items with missing or invalid Australian Business Numbers in the data we extracted from agencies. Further follow up could have identified these items, however, this was not warranted. It should be noted that, as a result, expenditure amounts in the other categories may be slightly understated, but not materially. Data provided by DHHS excludes payments pertaining to grants, housing procurement cards, clients (for example, concessions, gas, electricity and water, assistance), bushfire and flood disasters, and payroll, given the sensitive nature of the information.
Source: VAGO, based on data provided by DTF, DPC, DJR, DHHS, DET, DELWP and DEDJTR.
Around $60.5 billion (76 per cent) of the total expenditure of $79.6 billion
during the three‐year period is concentrated across five key ANZSIC division
categories.
Construction had the largest rise in expenditure across the three years,
increasing by $915.6 million—followed by Professional, Scientific and Technical
Services by $693.8 million.

Victorian Auditor‐General’s Report State Purchase Contracts 43
In percentage terms, Rental, Hiring and Real Estate Services had the greatest
increase—71 per cent.
Operational expenditure by departments
Figure 2F shows that DEDJTR (31 per cent) and DET (26 per cent) had the
largest spends during 2016–17, at $8.8 billion and $7.4 billion respectively.
Their combined expenditure made up 57 per cent of the total spend analysed
($28.5 billion).
Figure 2F Proportion of operational expenditure by department, 2016–17
Source: VAGO, based on data provided by DTF, DPC, DJR, DHHS, DET, DELWP and DEDJTR.
Goods and services purchased
Of the $28.5 billion expenditure across the seven departments in 2016–17,
we identified $3.3 billion (11.6 per cent) as spend on goods and services, as
Figure 2G shows. The remaining $25.2 billion includes inter‐governmental
payments, superannuation and grants.
31%
26%
12% 11%10%
9%
1%
0%
5%
10%
15%
20%
25%
30%
35%
DEDJTR DET DELWP DHHS DJR DTF DPC

44 State Purchase Contracts Victorian Auditor‐General’s Report
Figure 2G Departmental goods and services expenditure, 2016–17
Source: VAGO, based on data provided by DTF, DPC, DJR, DHHS, DET, DELWP and DEDJTR.
Of the $3.3 billion in departmental spend on goods and services, departments
spent $0.76 billion (23 per cent) through an SPC. This strongly indicates that
opportunities to aggregate purchasing through new SPCs remain unrealised.
Figure 2H shows the total goods and service expenditure by ANZSIC divisions for
2016–17.
Figure 2H Goods and services expenditure summary by ANZSIC divisions, 2016–17
Source: VAGO, based on data provided by DTF, DPC, DJR, DHHS, DET, DELWP and DEDJTR.
Non‐goods and services,
$25.16 billion
Goods and services,
$3.30 billion
Goods and services (non‐SPC), $2.54 billion
Goods and services (SPC), $0.76 billion
0 200 400 600 800
Mining
Arts and Recreation Services
Accommodation and Food Services
Rental, Hiring and Real Estate Services
Other Services
Agriculture, Forestry and Fishing
Retail Trade
Health Care and Social Assistance
Education and Training
Financial and Insurance Services
Information Media and Telecommunications
Manufacturing
Construction
Transport, Postal and Warehousing
Wholesale Trade
Administrative and Support Services
Public Administration and Safety
Uncategorised
Electricity, Gas, Water and Waste Services
Professional, Scientific and Technical Services
$ (million)

Victorian Auditor‐General’s Report State Purchase Contracts 45
Expenditure in the top five ANZSIC goods and services divisions (excluding
uncategorised) comprises around $2.2 billion, or 67 per cent, of the total
2016−17 goods and services spend.
Appendix G provides a further breakdown of 2016–17 departmental spend on
goods and services by subdivision, group and class.
Who purchases the goods and services?
As Figure 2I shows, the combined expenditure for DELWP, DJR and DHHS during
2016–17 makes up 72 per cent of the total goods and services spend for the
financial year.
Figure 2I Proportion of goods and services expenditure by department, 2016–17
Note: Figures may not total 100 per cent due to rounding.
Source: VAGO, based on data provided by DTF, DPC, DJR, DHHS, DET, DELWP and DEDJTR.
Figure 2J shows the breakdown of the top five expenditure categories by
departments.
33%
26%
13% 12%
9%
3% 3%
0%
5%
10%
15%
20%
25%
30%
35%
DELWP DJR DHHS DET DEDJTR DTF DPC

46 State Purchase Contracts Victorian Auditor‐General’s Report
Figure 2J Top five expenditure categories by department, 2016–17
Note: Uncategorised spend not included. Source: VAGO, based on data provided by DTF, DPC, DJR, DHHS, DET, DELWP and DEDJTR.
Who departments spend with
In 2016–17 the departments purchased goods and services from more than
20 000 individual suppliers. Figure 2K shows the top 10 suppliers, by value,
used by at least four departments. The value of spend across these suppliers
is $480.3 million (15 per cent) of total goods and services expenditure.
Figure 2K Top 10 goods and services suppliers, including ANZSIC divisions, 2016–17
Source: VAGO, based on data provided by DTF, DPC, DJR, DHHS, DET, DELWP and DEDJTR.
0%
10%
20%
30%
40%
50%
60%
70%
80%
90%
100%
Professional, Scientificand Technical Services
Electricity, Gas, Waterand Waste Services
Public Administrationand Safety
Administrative andSupport Services
Wholesale trade
DHHS DTF DPC DEDJTR DJR DELWP DET
0 50 100 150
KPMG
Acer Computer
Ernst & Young
Deloitte Touche Tohmatsu
Hudson Global Resources
Clicks Recruit
DTZ, a UGL Company
Hays Specialist Recruitment
Telstra Corporation
Cushman & Wakefield
$ (million)
DEDJTR DELWP DHHS DJR DTF DPC DET
Professional, Scientific and Technical Services
Wholesale Trade
Professional, Scientific and Technical Services
Professional, Scientific and Technical Services
Administrative and Support Services
Administrative and Support Services
Rental, Hiring and Real Estate Services
Administrative and Support Services
Information, Media and Telecommunications
Rental, Hiring and Real Estate Services

Victorian Auditor‐General’s Report State Purchase Contracts 47
Eight of the 10 suppliers in Figure 2K are nominated on an SPC. The
two suppliers that are not part of a current SPC arrangement receive the
highest spend (Cushman & Wakefield) and fourth‐highest spend (DTZ, a
UGL Company). Spend to these suppliers falls within the Rental, Hiring and
Real Estate Services expenditure division. The majority of this expenditure
is for office accommodation and property management services of
government‐leased and owned properties provided by Cushman & Wakefield
through the Shared Service Provider within DTF.
New SPC procurement opportunities
Lead agencies can achieve further savings by exploring new SPC opportunities.
Retenders for existing SPCs typically occur in a mature market where
government has already realised the initial savings from collective procurement,
which limits further benefits.
Using our tool, we identified areas of common goods and services expenditure
where current SPCs do not exist. These are categories where the Victorian
Government can potentially realise benefits if departments and other public
sector agencies work collaboratively to aggregate spend and coordinate market
engagement and procurement activity:
Accounting services, which had a $37.1 million total departmental spend
in 2016–17. DHHS had the largest spend—28 per cent—followed by DTF
and DPC at 26 per cent combined, and DET at 19 per cent. The remaining
three departments made up 27 per cent. The top two suppliers account
for 94 per cent of the total spend.
Market analysis and statistical services, which had a $13.4 million total
departmental spend in 2016–17. DET spent 27 per cent of this, DHHS
21 per cent, DEDJTR 17 per cent and other departments purchased the
remaining 35 per cent. The top five suppliers account for 52 per cent of
the total spend.
For these three categories, it is likely that departments are currently paying
different rates for the same goods and services, leading to potential
inefficiencies and waste.
Other new SPC opportunities may also be available. However, lead agencies will
need to use their knowledge of the relevant markets, and comprehensive and
quality spend data, to undertake more detailed investigation.


Victorian Auditor‐General’s Report State Purchase Contracts 49
Overseeing and managing SPCs
VGPB is responsible for monitoring the compliance of departments and
specified entities with VGPB supply policies.
Under VGPB’s oversight, lead agencies are responsible for the day‐to‐day
management of SPCs. Each SPC is different, however the fundamental principles
for managing contract performance are the same.
Effective SPC management ensures:
a high standard of service and quality delivered by the suppliers
value for money
reduced risk
the ability to address market changes or developments
the identification of poor contractor performance.
This part examines VGPB’s oversight role and how well lead agencies oversee
and manage their SPCs.
The split in responsibilities for managing SPCs has led to inconsistent
management practices across lead agencies. Further, VGPB does not have
the resources to directly oversee the management of all SPCs or ensure
compliance with its supply policies.
Lead agencies use contract management frameworks to manage SPCs, but
the lack of quality data limits the effectiveness of these frameworks. In some
instances, lead agencies have failed to actively manage SPCs despite holding
the data to do so. This has resulted in missed savings.
3.1 Conclusion

50 State Purchase Contracts Victorian Auditor‐General’s Report
Before June 2016, DTF was responsible for overseeing all SPCs. A 2016–17 policy
review conducted by VGPB identified a need for VGPB to take a stronger role in
establishing, reporting on and overseeing SPCs.
VGPB has only a small secretariat, provided by DTF, to undertake all monitoring
activities to ensure compliance with VGPB policies. With its limited resources,
it sensibly monitors only the compliance of the seven departments, Public
Transport Victoria, VicRoads, Victoria Police and Cenitex, as opposed to all
34 VPS agencies in its scope.
VGPB oversight of SPC users
The Market analysis and review policy outlines the requirement for agencies to
use mandatory SPCs. VGPB attempts to monitor compliance through:
ASRs, which entities submit to VGPB at the end of each financial year—
ASRs summarise procurement activity for the year and report instances of
non‐compliance with VGPB policies, including in the use of mandatory SPCs
an audit program—entities audit their own compliance with VGPB policies
and submit a report to VGPB once every three years.
While these mechanisms play a role in assessing compliance, VGPB
acknowledges their limitations. For example, in their 2016–17 ASR, the
seven departments raised no compliance issues with their SPC obligations. As
we discuss in Part 5, these departments were unable to tell us whether leakage
was occurring from SPCs, and three departments—DET, DPC and DELWP—were
unable to identify SPC spend within their own financial and procurement
systems.
How these departments were able to make an attestation of compliance given
these limitations is unclear. VGPB accepted these assertions on face value. VGPB
stated that this is because of the lack of data and tight time frames specified in
the FMA between when entities submit their ASRs and when VGPB tables these
ASRs in its annual report.
While VGPB’s audit program requires entities to verify compliance with
mandatory policy requirements and submit a report to VGPB every three years,
this verification takes place well after attestations are made.
VGPB is assessing whether the new Financial Compliance Management
Attestation will provide further assurance as to the accuracy of ASRs. However,
this does not address the underlying data limitations that hinder departments’
ability to attest to compliance with SPC requirements.
3.2 VGPB oversight of SPCs
The Financial Compliance Management Attestation process was introduced in 2017–18. It requires agencies to conduct an annual assessment of compliance with all applicable requirements in the FMA, including VGPB procurement policies.

Victorian Auditor‐General’s Report State Purchase Contracts 51
VGPB oversight of lead agencies
VGPB oversees lead agency management of SPCs by:
approving key documents—VGPB must endorse all SPC business cases
before the lead agency submits the business case for ministerial approval
overseeing strategic procurements—entities can nominate certain strategic
procurements for VGPB to oversee, and VGPB can identify specific
procurements to oversee, including the establishment or renewal of an SPC
reviewing procurement activity plans—entities submit procurement activity
plans every year for review by VGPB, which may identify potential
aggregation opportunities. As discussed in Section 2.2, this is not an
effective process for identifying new SPC opportunities.
Five SPCs that were renewed in 2016–17 progressed through the VGPB strategic
oversight program—Telecommunications Purchasing and Management Strategy,
eServices Register, Cash and Banking Services, Security Services and Master
Agency Media Services. Letters between VGPB and the lead agencies for these
SPCs show evidence of VGPB’s review of key documentation, including business
cases and category strategies.
While this oversight process requires lead agencies to provide evidence that
they have complied with VGPB policies throughout the SPC tendering process,
VGPB’s oversight of lead agencies’ contract management activities is minimal
once the contract is executed.
VGPB requests an update from lead agencies at certain milestones. However,
these milestones are at one‐ or two‐year points of contracts that run for
three years. Consequently, there is little oversight and reporting by VGPB
of contract management activities once a lead agency executes an SPC.
Active management of SPCs by lead agencies presents the opportunity to
improve SPC performance—not only in realising cost reduction by demand
aggregation, but also by monitoring suppliers’ performance and sharing
information with users to increase savings opportunities. The management
cycle for an SPC includes:
developing a business case
implementing a CMP
measuring client satisfaction
managing key suppliers
sharing savings opportunities with departments and entities
tracking SPC prices.
3.3 Lead agencies’ development and
management of SPCs
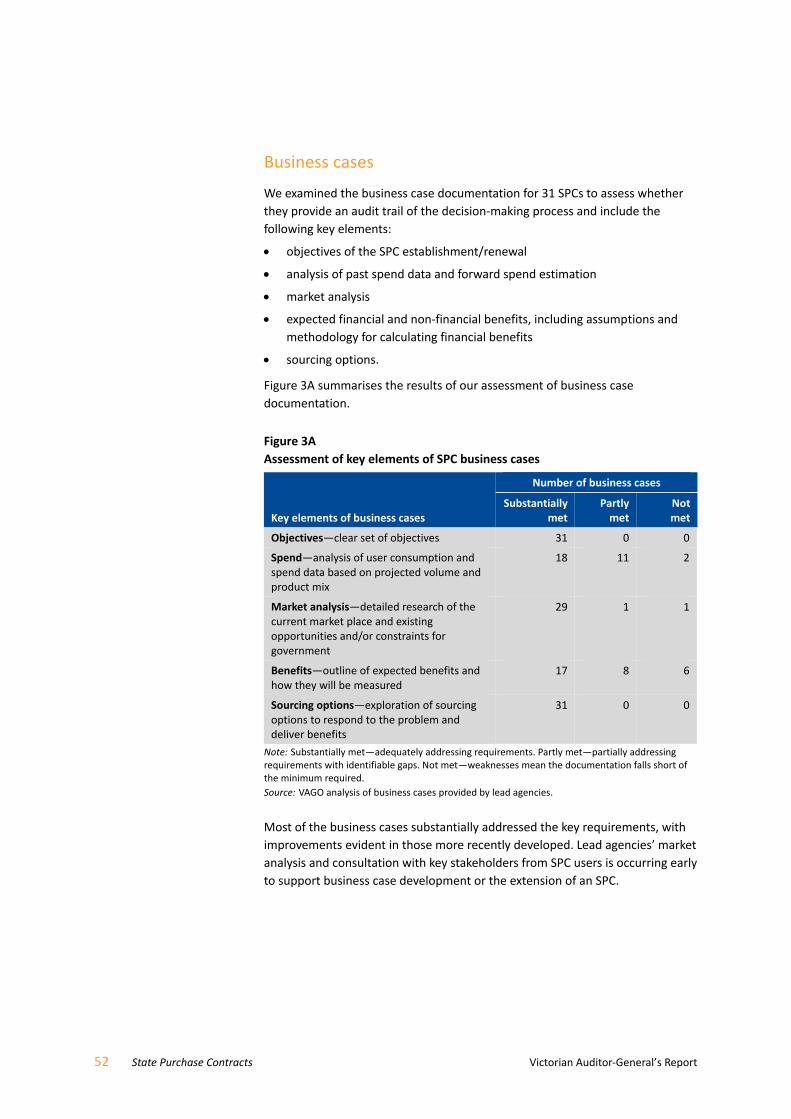
52 State Purchase Contracts Victorian Auditor‐General’s Report
Business cases
We examined the business case documentation for 31 SPCs to assess whether
they provide an audit trail of the decision‐making process and include the
following key elements:
objectives of the SPC establishment/renewal
analysis of past spend data and forward spend estimation
market analysis
expected financial and non‐financial benefits, including assumptions and
methodology for calculating financial benefits
sourcing options.
Figure 3A summarises the results of our assessment of business case
documentation.
Figure 3A Assessment of key elements of SPC business cases
Key elements of business cases
Number of business cases
Substantially met
Partly met
Notmet
Objectives—clear set of objectives 31 0 0
Spend—analysis of user consumption and spend data based on projected volume and product mix
18 11 2
Market analysis—detailed research of the current market place and existing opportunities and/or constraints for government
29 1 1
Benefits—outline of expected benefits and how they will be measured
17 8 6
Sourcing options—exploration of sourcing options to respond to the problem and deliver benefits
31 0 0
Note: Substantially met—adequately addressing requirements. Partly met—partially addressing requirements with identifiable gaps. Not met—weaknesses mean the documentation falls short of the minimum required.
Source: VAGO analysis of business cases provided by lead agencies.
Most of the business cases substantially addressed the key requirements, with
improvements evident in those more recently developed. Lead agencies’ market
analysis and consultation with key stakeholders from SPC users is occurring early
to support business case development or the extension of an SPC.

Victorian Auditor‐General’s Report State Purchase Contracts 53
However, we identified major shortcomings, including:
a lack of documented evidence outlining assumptions for calculating
financial and non‐financial benefits that have been agreed with
stakeholders
the absence of comprehensive and reliable spend and volume data—lead
agencies rely on historical self‐reported supplier spend and volume data,
which creates risks such as:
not considering category spend that has occurred outside an SPC
underestimating volumes or historical spend due to incomplete
information from suppliers
the possibility that lead agencies may not identify suppliers increasing
prices of non‐contract items, which counters the benefits from the
items included in the contract.
Category Management Plans
Once an SPC is executed, the lead agency must develop a CMP. CMPs outline the
activities associated with managing an SPC, including:
benefits tracking—specifying the methodology used to calculate financial
benefits
risk management—outlining risks specific to the SPC and mitigation
strategies
performance monitoring—outlining performance measures to assess
supplier performance
continuous improvement—outlining improvements that result in decreased
costs or improved service levels and quality.
Of the 34 SPCs, 29 have CMPs. The remaining five SPCs, with a combined spend
of more than $17.9 million in 2016–17, do not have CMPs:
DX Services—$2.3 million
Rosetta—$650 000
Data Centre Facilities—$14.9 million
eServices Register—spend data not collected by lead agency
Microsoft Licensing Solution Provider—no spend data attributable.
Lead agencies allocate resources to the management of SPCs by assessing
the importance of the category to government in terms of business impact,
value, risk and complexity. The DX Services SPC and Rosetta SPC have minimal
management and documentation, given the small spend amount and that there
is one supplier. This is a reasonable approach.

54 State Purchase Contracts Victorian Auditor‐General’s Report
The lack of CMPs for the Data Centre Facilities SPC, eServices Register and
Microsoft Licensing Solution Provider, limits DPC’s ability to ensure that these
SPCs are managed consistently and that they meet their objectives.
Figure 3B summarises the results of our assessment of the 29 CMPs across their
key elements.
Figure 3B Assessment of CMPs against better practice
Note: Substantially met—adequately addressing requirements. Partly met—partially addressing requirements with identifiable gaps. Not met—weaknesses mean the documentation falls short of the minimum required.
Note: Figures may not total 100 per cent due to rounding.
Source: VAGO analysis of category management plans provided by lead agencies.
The majority of CMPs substantially or partially met the requirement to identify
the methodology used to calculate financial benefits, and risks and mitigation
strategies associated with the SPC.
However, more than half of the CMPs included no continuous improvement
initiatives, and 14 (48 per cent) did not outline performance measures to assess
supplier performance. DPC manages 10 of these 14. The absence of
performance measures affects DPC’s ability to identify poor contract
performance and opportunities for improvements to service provision.
Four CMPs (14 per cent) did not adequately outline how lead agencies would
track and measure benefits, which heightens the risk of an inconsistent
approach to the calculation of benefits for these SPCs. We discuss this in
Section 4.4.
72% 69%
38% 34%
14%
3%
14%10%
14%28%
48%55%
0%
10%
20%
30%
40%
50%
60%
70%
80%
90%
100%
Benefits tracking Management ofrisks
Performancemeasures
Continuousimprovementactivities
Substantially met Partly met Not met

Victorian Auditor‐General’s Report State Purchase Contracts 55
Client satisfaction surveys
DTF surveys SPC users annually to assess their satisfaction with SPCs. The
2016−17 results indicate that almost three‐quarters of users were satisfied or
very satisfied with their overall experiences using the SPC. The survey also
revealed that:
81 per cent of users were satisfied or very satisfied that the SPC met their
departments’ needs
73 per cent of users were satisfied or very satisfied with the suppliers’
performance
77 per cent of users were satisfied or very satisfied with DTF engagement.
While the annual survey is useful in general, it does not show users’ assessment
of suppliers on individual engagements. This is particularly important for panel
supplier arrangements such as PAS, where DTF could use the information to
address performance issues and notify users of issues with specific suppliers.
Lead agencies engage with stakeholders to seek feedback on supplier
performance. This is predominately done through a user reference group—
which comprises key representatives from each of the user departments—
and through surveys.
While the PAS SPC requires users to complete a satisfaction survey and forward
it to DTF at the completion of each engagement, only a limited number of users
do so. Consequently, DTF has little visibility of the SPC performance and buyer
satisfaction.
In 2016–17 DJR undertook an extensive consultation process with all user
agencies and providers on the Legal Services Panel to develop a new client
satisfaction survey. The survey results feed into annual performance review
meetings with suppliers. Our review of survey results for the Legal Services
Panel indicates that users have generally been satisfied with services provided
under the Legal Services Panel.
DPC and Cenitex have limited visibility of users’ satisfaction with supplier
performance because they do not survey SPC users.
Managing key suppliers
The establishment of an SPC concentrates government expenditure with a
select number of suppliers—eight of the top 10 suppliers receiving government
expenditure are on SPC arrangements. To manage an SPC well, lead agencies
need to understand the level of spend on suppliers and to use this information
to potentially leverage further savings.

56 State Purchase Contracts Victorian Auditor‐General’s Report
Panel arrangements
Figure 3C shows our review of three SPCs with a panel of suppliers—PAS
(230 suppliers), Staffing Services (eight suppliers) and the Legal Services Panel
(23 suppliers) using data provided from the lead agencies—DTF and DJR. This
analysis highlights that a significant percentage of expenditure is concentrated
with a small number of suppliers on each of these SPCs. This may indicate user
preference for dealing with the known suppliers and some reluctance to engage
new suppliers, or that some suppliers provide a greater number of services
under the SPC. For example, on the Legal Services Panel there are 13 areas of
law that a panel firm can compete in. Some firms only provide services in one
area of law while others provide services in more than eight areas, meaning
they are able to generate more revenue.
Figure 3C SPC spend for PAS, Legal Services Panel and Staffing Services by supplier, 2016–17
Source: VAGO, based on information from DTF and DJR.
DPC’s June 2018 review into labour hire and professional services found that
despite the significant expenditure on PAS to a limited number of suppliers,
‘there is no active account management of these suppliers at the whole of
government level and the aggregation of demand is not actively used to drive
better pricing outcomes’.
DTF advised it is in the process of developing a strategy for the future PAS SPC,
focusing on more active central category management.
19%
9%
7%
6%5%
54%
Deloitte
Everything Infrastructure Services
KPMG
PwC
The Boston Consulting Group
Other suppliers
PAS
51%
16%
15%
6%
4%8%
Hays
Hudson
Clicks
Randstad
Hoban
Other suppliers
Staffing Services
30%
19%15%
6%
5%
25%
Victorian GovernmentSolicitor's Office
Clayton Utz
Minter Ellison
Corrs
Allens
Other suppliers
LegalServices Panel

Victorian Auditor‐General’s Report State Purchase Contracts 57
Suppliers on a register
Registers are typically used where a variety of skills and capabilities are sought
across a large supplier base. They allow pre‐qualification of suppliers who satisfy
certain key selection criteria relating to their capability to supply goods or
services to government business.
Pre‐qualified registers have the advantage of not ‘locking up’ a market, as
new entrants can be added at any time. One challenge is that although many
suppliers may be registered, many find that they do not receive government
work. Limited performance information about suppliers is available to user
agencies, so it is common for users to select firms they have previously used.
For example, Figure 3D shows that the top 10 suppliers, in terms of spend,
made up around 91 per cent ($40.6 million) of the total spend ($44.6 million).
Half the suppliers on the IT Infrastructure Register received no work from the
Victorian Government in 2016–17. This highlights that entities continually use
the same suppliers, which may compromise their ability to get the best value for
money.
Figure 3D IT Infrastructure spend by suppliers, 2016–17
Source: VAGO based on data from DPC.
10
21
31
0
5
10
15
20
25
30
35
40
45
0
5
10
15
20
25
30
35
40
45
Top 10 suppliers Other suppliers Suppliers who receivedno spend
$ (million)
Spend Number of suppliers
Number of suppliers

58 State Purchase Contracts Victorian Auditor‐General’s Report
Marketing Services Register
Our February 2012 Government Advertising and Communications audit
identified that DPC’s management of the Marketing Services SPC was poor,
with ineffective recording, reporting and monitoring of government expenditure
for marketing services. DTF has managed the original Marketing Services SPC
as a register since December 2009.
While the August 2013 business case for the Marketing Services SPC identified
the need for an online system that captures spend, this was not fully
implemented. Consequently, DTF has had to estimate spend and cannot
measure benefits.
An online system that captures procurement activity is crucial to the operations
of the Marketing Services Register to support compliance and visibility of
procurement activity, and to minimise the risk of contract leakage. Furthermore,
it would allow DTF to obtain accurate data to quantify the benefits of the
Marketing Services Register.
Sharing saving opportunities
Lead agencies share high‐level information on departmental spend and usage
with VGPB and stakeholders on an ongoing basis. However, an opportunity
exists to better communicate and highlight savings opportunities and trends
across users because, presently, users have no transparent way to assess if
they are receiving competitive rates from suppliers compared to other users.
This information can be useful for SPC users where suppliers may charge
different users varying rates for equivalent goods or services, such as on the
PAS, Legal Services Panel and Staffing Services SPCs.
As an example, we analysed 58 engagements of temporary senior policy officers
through the Staffing Services SPC in 2016–17 across four user departments:
17 engagements by DEDJTR
18 engagements by DELWP
9 engagements by DJR
14 engagements by DET.
All these engagements were for staff hired at a VPS 5 level for between three
and six months. The hourly rate varied within and across departments. Figure 3E
shows the minimum, maximum and average hourly rates achieved by the
departments.
The Staffing Services SPC is for the engagement of temporary staff to work in government agencies.

Victorian Auditor‐General’s Report State Purchase Contracts 59
Figure 3E Hourly rates for temporary VPS 5 senior policy officers, 2016–17
Source: VAGO, based on supplier reports.
While no staffing engagement is the same, this comparison of hourly rates is
valuable. As the lead agency, DTF should be reviewing and distributing such
information to SPC users to help them identify where they may not be achieving
the same level of savings as other users.
This analysis also highlights the need for user departments to do more work to
understand where different parts of their businesses are paying varying rates for
the same service. Understanding internal spending patterns will help SPC users
negotiate lower prices during future engagements.
In addition to the Who Buys What and How interactive dashboard—discussed in
Part 2 of this report—the WA Department of Finance is developing interactive
dashboards for its whole‐of‐government goods and service contracts that will
show the comparative rates agencies have paid the same supplier. The intention
of presenting a collective view of agency data is to encourage collaboration and
the proactive sharing of advice across agencies, resulting in better outcomes. To
protect the commercial sensitivity of this information it will only be available to
agencies.
$86.99 $85.61 $85.61$81.99
$69.46 $69.46$65.14
$68.96
0
10
20
30
40
50
60
70
80
90
100
DEDJTR DJR DET DELWP
$ per hour
Maximum per hour Minimum per hour Average

60 State Purchase Contracts Victorian Auditor‐General’s Report
Price tracking to ensure compliance
Some SPCs provide a negotiated discount—such as Oracle Software and
Support—or a ceiling rate—such as PAS—for the goods or services provided.
Price tracking against the contract is an important contract compliance
measure.
The SPC user is primarily responsible for ensuring that the prices it pays accord
with the SPC contract. However, purchasing decisions in user departments are
made by different business units and are not all centrally tracked through the
Internal Procurement Unit. This hinders the ability of SPC users to monitor
compliance with SPC pricing.
DPC’s June 2018 review into labour hire and professional services raised
concerns with how departments check compliance of invoices with agreed
rates on the Staffing Services SPC and ceiling rates on the PAS SPC.
Lead agencies also have a role in highlighting the variation in prices paid
compared to the agreed rates and discounts outlined in an SPC agreement.
However, they have limited visibility of purchasing decisions, partly due to the
lack of centralised procurement information.
Lead agencies, as contract managers, should also conduct spot‐check analyses
of supplier‐reported invoices for high‐risk SPCs to ensure pricing validity and
accuracy, including ensuring ceiling rates are not exceeded. However, they have
not done so.
As Figure 3F discusses, in June 2017 DTF engaged a third party to develop a
dashboard to identify spend above the ceiling rates agreed for the PAS SPC.
Figure 3F Price tracking for the PAS SPC
Suppliers on the PAS panel have submitted ‘not to exceed’ prices for hourly rates charged for their consultancy services. The PAS model, agreed with stakeholders, requires purchasers to negotiate improved fees, thereby maximising value for money at the point of procurement. This process depends on the SPC user. DTF, as the lead agency, only sees the hourly rates charged later, when it receives quarterly reported data from suppliers.
Our analysis of DTF’s dashboard revealed that although DTF has attempted to monitor compliance with PAS ceiling rates, significant work is required before the data is accurate, including on the number of hours worked. DTF advised that these numbers are not always accurate—consequently it is currently unable to monitor if SPC users have paid more than the ceiling rates.
With these data caveats in mind, we assessed the data reported by one PAS supplier in 2016–17. Using the number of hours and total spend reported by this supplier, we analysed how many transactions were above the ceiling rate. Of the 61 purchase orders, 10—or 16 per cent—appeared to be above the ceiling rate. Our analysis depends on the supplier correctly recording the number of hours charged, which may not be accurate. Regardless of whether this data is completely correct, it highlights the risk that payments above the ceiling rate may occur in the PAS SPC.
User departments are responsible for the amounts they agree to pay PAS suppliers. As a second layer of protection, DTF should continue to build capacity to perform this type of compliance monitoring to help user entities achieve value for money.
Source: VAGO based on information provided by DTF.
Each department has an Internal Procurement Unit responsible for ensuring that procurement activity complies with VGPB policy.

Victorian Auditor‐General’s Report State Purchase Contracts 61
Realisation of SPC benefits
Tracking and reporting SPC benefits is a key part of measuring the performance
of an SPC. Lead agencies should be able to show whether SPCs are delivering
the expected benefits.
This part examines whether effective arrangements are in place to monitor and
evaluate the achievement of expected savings and benefits from SPCs.
Lead agencies report that SPCs deliver significant financial benefits. However,
without individual targets for each SPC to measure these reported benefits
against, it is difficult to determine if they represent value for money.
For some SPCs managed by DPC, we disagree with the methodology used to
calculate these benefits and we believe the calculation has resulted in the
overstatement of benefits.
For seven SPCs, lead agencies did not report any financial or non‐financial
benefits. The lead agencies are unable to show that these SPCs deliver a benefit
to the state.
VGPB does not publicly report the overall financial benefits of SPCs and there is
no evidence of central oversight of the way lead agencies calculate financial
benefits for different SPCs.
Tracking and reporting SPC benefits is the key way lead agencies show the
performance of an SPC and the impact of contract management activities.
We assessed whether lead agencies reported on the overall performance of
the SPCs they managed, and whether lead agencies had targets to measure the
benefits of each SPC.
4.1 Conclusion
4.2 Targets

62 State Purchase Contracts Victorian Auditor‐General’s Report
Overall targets for lead agencies
DTF is the only lead agency that publicly reports on the performance of SPCs
against a target. DTF is required to meet a financial benefit performance target
specified in the State Budget papers—‘Benefits delivered as a percentage of
expenditure by mandated agencies under DTF managed SPCs’.
Figure 4A shows how DTF‐managed SPCs performed for 2013–14 to 2016–17
against the target of 5 per cent.
Figure 4A Reported financial benefits delivered as a percentage of expenditure by
mandated agencies on DTF‐managed SPCs, 2013–14 to 2016–17
Source: VAGO, based on information from 2013–14 to 2016–17 State Budget papers and DTF.
DTF reported that it exceeded the target each year. DTF advised that the
5 per cent target was derived in 2013 from past performance data. However,
DTF has not documented the basis for the target and it is unclear whether this
is a reasonable measure against which to judge performance. There is also no
documentation that outlines how each of DTF’s 17 SPCs should contribute to
the target. Further, the target has not changed over four years, despite changes
to market environments and SPCs across this period.
DPC and Cenitex do not have overall performance targets to meet for their SPCs,
which makes it difficult to assess reported benefits and track performance. DJR
has a target but only manages one SPC so is discussed in the next section.
0%
1%
2%
3%
4%
5%
6%
7%
8%
9%
2013–14 2014–15 2015–16 2016–17
Actual Target

Victorian Auditor‐General’s Report State Purchase Contracts 63
Individual targets for SPCs
Measuring and monitoring benefits against pre‐determined targets enables
lead agencies to determine if SPCs are performing as expected. Following the
sourcing process, the expected benefits of an SPC should be ‘locked in’ as
documented targets. Lead agencies should then report against these targets
to demonstrate that SPCs are achieving expected value for money.
The Legal Services Panel is the only SPC with a ‘locked‐in’ target against
which the lead agency, DJR, can track financial benefits. DJR’s target reflects
the discount in hourly rate that the SPC hopes to achieve compared to the
market. DJR undertakes an annual benchmark activity to measure whether
SPC rates have achieved this. Since the Legal Services Panel’s establishment in
March 2016, DJR has consistently exceeded this target. Given this is the only SPC
that DJR manages, it does not report publicly against this target to ensure the
financial benefit achieved remains confidential.
Although DTF identifies the expected financial benefit following the sourcing
process for an SPC, they do not lock in targets and measure against these. DPC
and Cenitex also do not have documented individual financial benefit targets for
each SPC they manage. Without ‘locked‐in’ targets, DPC and Cenitex cannot
demonstrate that their SPCs are performing well.
Lead agencies report the achievement of financial benefits for 26 of the
34 SPCs. Figure 4B shows all reported SPC spend and benefits for 2012–13
to 2016–17.
Figure 4B Overall reported spend and benefits, 2012–13 to 2016–17
Source: VAGO, based on data provided by DTF, DPC and DJR.
15%
14%
17%
20%
19%
0%
5%
10%
15%
20%
0
200
400
600
800
1 000
1 200
1 400
1 600
2012–13 2013–14 2014–15 2015–16 2016–17
$ (million)
Spend Benefits Benefits as a percentage of spend
4.3 Measuring financial benefits

64 State Purchase Contracts Victorian Auditor‐General’s Report
The total reported financial benefits as a percentage of expenditure ranged
from 14 to 20 per cent. This provided reported savings to SPC users of between
$192 million in 2014–15 and $272 million in 2016–17. Appendix H provides the
SPC spend and benefits reported by DTF and DPC for 2012–13 to 2016–17.
Financial benefits achieved by user entities
The reported financial benefits in 2016–17, as a percentage of spend, varied
between users and ranged from 9.5 per cent at DPC to 34.2 per cent at DET, as
Figure 4C shows. This variation can be due the nature of goods and services
purchased by entities and the different methodologies used to calculate
benefits for each SPC.
Figure 4C Reported financial benefit as a percentage of spend by user entity, 2016–17
Source: VAGO, based on data provided by DTF, DPC and DJR.
Financial benefits achieved by SPCs
Without targets we were unable to determine whether the reported financial
benefits for the SPCs managed by DTF, DPC and Cenitex were appropriate.
These SPCs exist in very different market environments and are in place for very
different goods and services. For this reason, it is hard to assess the reported
financial benefits for each SPC without an associated target.
0%
5%
10%
15%
20%
25%
30%
35%
40%
Benefits as percentage of spend Average

Victorian Auditor‐General’s Report State Purchase Contracts 65
For example, Figure 4D shows the reported financial benefits as a percentage of
spend for each of the 26 SPCs that report financial benefits. These percentages
vary widely, from 0.1 to 154 per cent. Without a target for each SPC it is difficult
to judge whether these percentages represent a good outcome for each SPC in
its own market environment.
Figure 4D Reported financial benefit as a percentage of spend by SPC, 2016–17
Source: VAGO, based on data provided by DTF, DPC and DJR.
Some SPCs—such as Stationery and Workplace Consumables, and Travel
Management Services—may report small financial benefits in relation to spend.
However, this may be a good result if the objective was to contain procurement
costs rather than achieve large savings, given they have been previously market
tested. Without a target we are unable to make this judgement.
0.1%
1%
3%
3%
4%
4%
9%
10%
11%
12%
16%
25%
26%
27%
32%
34%
41%
52%
56%
90%
93%
109%
111%
118%
151%
154%
0% 20% 40% 60% 80% 100% 120% 140% 160% 180%
SPC 1
SPC 2
SPC 3
SPC 4
SPC 5
SPC 6
SPC 7
SPC 8
SPC 9
SPC 10
SPC 11
SPC 12
SPC 13
SPC 14
SPC 15
SPC 16
SPC 17
SPC 18
SPC 19
SPC 20
SPC 21
SPC 22
SPC 23
SPC 24
SPC 25
SPC 26

66 State Purchase Contracts Victorian Auditor‐General’s Report
SPCs with no financial benefits
Lead agencies do not track financial benefits for all SPCs. As Figure 4E shows,
seven SPCs, with a total spend more than $176 million in 2016–17, do not have
their financial benefits tracked.
Figure 4E SPCs with no financial benefits tracking
SPC
SPC spend2016–17
($ millions) Reason financial benefits are not tracked
Marketing Services Register
5.5 (a) The system used for monitoring the Marketing Services Register does not capture spend. Expenditure reports from the 200‐plus suppliers are not received.
PAS 71.0 Savings/benefits not measured.
Security Services 46.5 The business case has no savings objectives, so financial benefits are not measured or reported.
According to the business case the focus is on non‐financial benefits with the key objective being supporting the security services industry and providing high‐quality services.
IT Infrastructure Register 44.6 Savings/benefits not measured.
eServices Register –(b) Savings/benefits not measured.
Multifunction Devices and Printers
7.7 Benefits have been difficult to quantify as not all large mandated departments and agencies have completed the transition to Multifunction Devices and Printers.
Rosetta 0.7 Savings/benefits not measured.
(a) DTF estimated spend not actual reported spend by suppliers. (b) Spend data not collected. Note: Financial benefits for the Microsoft Licensing Solution SPC are realised through the Microsoft Enterprise Agreement SPC.
Source: VAGO, based on data provided by DTF.
In some cases, it can be difficult to calculate the full financial benefit of an
SPC compared to if the SPC did not exist. For example, for an engagement of
consultancy services under the PAS SPC, no means is available to accurately
know the rates a department would have been able to negotiate for the same
engagement if the SPC was not in place. However, without attempting to
measure the financial benefits of these SPCS, lead agencies are unable to
determine if they are providing value for money.

Victorian Auditor‐General’s Report State Purchase Contracts 67
The method for calculating a financial benefit is different for each SPC since
contracts deliver different goods and services and exist in distinct markets.
DTF and DPC manage different types of SPCs and use different methods to
calculate financial benefits. Figure 4F shows the difference in reported financial
benefits between SPCs managed by DTF and those managed by DPC.
Figure 4F Reported financial benefit as a percentage of spend by DTF and DPC, 2016–17
Note: Cenitex did not report any financial benefits for the Rosetta SPC. We have not reported benefits data for the SPC managed by DJR due to commercial sensitivity.
Source: VAGO, based on data provided by DTF and DPC.
As Figure 4F shows, DPC reports significantly higher financial benefits than DTF.
We examined how lead agencies calculate financial benefits for 11 SPCs and
found inconsistencies and irregularities in the methods for six SPCs managed by
DPC. Figure 4G outlines these examples.
6%
50%
0%
10%
20%
30%
40%
50%
60%
DTF DPC
4.4 Benefits methodology
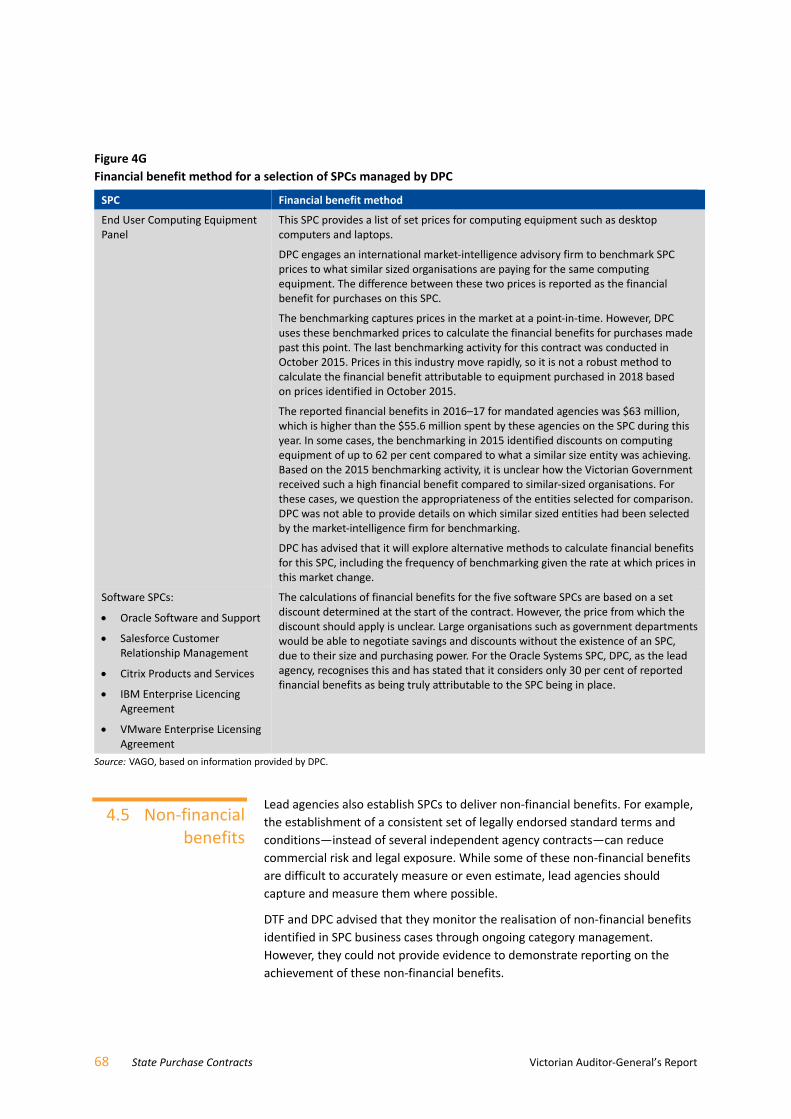
68 State Purchase Contracts Victorian Auditor‐General’s Report
Figure 4G Financial benefit method for a selection of SPCs managed by DPC
SPC Financial benefit method
End User Computing Equipment Panel
This SPC provides a list of set prices for computing equipment such as desktop computers and laptops.
DPC engages an international market‐intelligence advisory firm to benchmark SPC prices to what similar sized organisations are paying for the same computing equipment. The difference between these two prices is reported as the financial benefit for purchases on this SPC.
The benchmarking captures prices in the market at a point‐in‐time. However, DPC uses these benchmarked prices to calculate the financial benefits for purchases made past this point. The last benchmarking activity for this contract was conducted in October 2015. Prices in this industry move rapidly, so it is not a robust method to calculate the financial benefit attributable to equipment purchased in 2018 based on prices identified in October 2015.
The reported financial benefits in 2016–17 for mandated agencies was $63 million, which is higher than the $55.6 million spent by these agencies on the SPC during this year. In some cases, the benchmarking in 2015 identified discounts on computing equipment of up to 62 per cent compared to what a similar size entity was achieving. Based on the 2015 benchmarking activity, it is unclear how the Victorian Government received such a high financial benefit compared to similar‐sized organisations. For these cases, we question the appropriateness of the entities selected for comparison. DPC was not able to provide details on which similar sized entities had been selected by the market‐intelligence firm for benchmarking.
DPC has advised that it will explore alternative methods to calculate financial benefits for this SPC, including the frequency of benchmarking given the rate at which prices in this market change.
Software SPCs:
Oracle Software and Support
Salesforce Customer Relationship Management
Citrix Products and Services
IBM Enterprise Licencing Agreement
VMware Enterprise Licensing Agreement
The calculations of financial benefits for the five software SPCs are based on a set discount determined at the start of the contract. However, the price from which the discount should apply is unclear. Large organisations such as government departments would be able to negotiate savings and discounts without the existence of an SPC, due to their size and purchasing power. For the Oracle Systems SPC, DPC, as the lead agency, recognises this and has stated that it considers only 30 per cent of reported financial benefits as being truly attributable to the SPC being in place.
Source: VAGO, based on information provided by DPC.
Lead agencies also establish SPCs to deliver non‐financial benefits. For example,
the establishment of a consistent set of legally endorsed standard terms and
conditions—instead of several independent agency contracts—can reduce
commercial risk and legal exposure. While some of these non‐financial benefits
are difficult to accurately measure or even estimate, lead agencies should
capture and measure them where possible.
DTF and DPC advised that they monitor the realisation of non‐financial benefits
identified in SPC business cases through ongoing category management.
However, they could not provide evidence to demonstrate reporting on the
achievement of these non‐financial benefits.
4.5 Non‐financial benefits

Victorian Auditor-General’s Report State Purchase Contracts 69
DJR measures and reports on the non-financial benefits pertaining to the
operation of social justice policies incorporated in the Legal Services Panel SPC.
For example, DJR monitors whether suppliers are promoting corporate social
responsibility practices in the workplace, including:
pro bono activities—suppliers have committed to provide pro bono services
equivalent to 20 per cent on average of the net legal fees they earned
during the previous financial year
implementation of diverse work practices that promote gender equality and
flexible work arrangements
the briefing of female barristers by both panel firms and clients in
accordance with the Victorian Bar’s equal opportunity briefing policy.
As Figure 4H shows, the 2016–17 Legal Services Panel Annual Report analyses
and reports this information annually.
Figure 5H Example of the non-financial benefits monitored and reported by DJR in the
2016–17 Legal Services Panel Annual Report
This data indicates more female than male lawyers are receiving promotion, regardless of whether they work full-time or have flexible work arrangements.
Source: DJR 2016–17 Legal Services Panel Annual Report.

70 State Purchase Contracts Victorian Auditor‐General’s Report
In analysing spend and savings data for SPCs, significant data issues hamper the
VPS, both in terms of the quality of systems in departments and agencies, and
the unavailability of comprehensive data on spend, price and volume.
Because SPC spend is fragmented across many users, and there is no
whole‐of‐government procurement platform to provide overall visibility, lead
agencies rely on suppliers to capture and self‐report spend data. This is done
monthly for the Legal Service Panel SPC and quarterly for the remaining SPCs,
as Figure 4I shows.
Figure 4I Capture and recording of supplier‐reported spend and lead agency‐reported savings data
Source: VAGO based on information provided by DPC, DTF and DJR.
Lead agencies cannot easily validate self‐reported supplier data and the quality
of this data varies. Lead agencies undertake ad hoc checks of the data and
require SPC users to confirm spend for some SPCs. However, these verification
activities are limited, given lead agencies do not have all the information
needed to sufficiently assess and validate the supplier reports, including access
to the finance systems of SPC users.
Lead agencies should periodically audit provider reports to confirm their
accuracy. However, DTF and DPC have not done so, despite the current contracts
allowing for this. DTF and DPC need to address this because it affects the
effectiveness and integrity of spend and benefits monitoring for SPCs.
DTF
Goods and services providers
DTF spend and savings spreadsheet
Raw dataprovided quarterly
DPC
IT providers
DPC spend and savings spreadsheet
Raw dataprovided quarterly
DJR
Legal providers
Legal Services Panel Annual Report
Raw dataprovided monthly
Dashboard
4.6 Reliability of data

Victorian Auditor‐General’s Report State Purchase Contracts 71
Our review of information maintained by DTF and DPC also highlighted errors
in the spreadsheets they use to track spend and benefits for SPCs. We found
under‐reporting of:
$5.2 million in non‐mandated entity spend from 2015 to 2018 for the
Stationery and Workplace Consumables SPC
$0.89 million in financial benefits during 2016–17 for the Travel
Management Services SPC
$0.11 million in financial benefits in 2016–17 for the Salesforce Customer
Relationship Management SPC.
We also found a further issue with the accuracy of financial benefits calculated
for the Travel Management Services SPC. Spend for this SPC in 2016–17 was
over‐reported by $5.9 million due to changes in internal processes.
Given these data issues, the actual levels of savings achieved by SPC users is
very likely to be different from those reported by lead agencies.
DTF uses this information as the basis for publicly reported performance
information in the State Budget papers and its annual report, so it is important
that it has quality assurance measures to ensure the reported information is
accurate. DTF advised that it has rectified all errors identified by this audit.

Victorian Auditor‐General’s Report State Purchase Contracts 73
Understanding and managing contract
leakage
The Standing Directions of the Minister for Finance under the FMA require
effective controls over procurement so that specified public sector agencies
comply with government supply policies. All departments and entities bound by
VGPB policies must purchase from mandatory SPCs unless the lead agency has
granted a written exemption.
DTF internal guidance material, used also by DPC, identifies monitoring and
reducing expenditure made outside of SPCs, or ‘leakage’, as a minimum
requirement of lead agencies. Managing leakage is important if SPC users are
to fully realise potential savings and lead agencies are to effectively monitor
and evaluate the success of SPCs.
This part examines whether departments use SPCs when purchasing goods and
services, and the steps that user departments and lead agencies take to prevent
and identify contract leakage, as required by contract agreements, VGPB
policies and lead agency guidance material.
Our analysis of departments’ expenditure shows potential contract leakage in
three of the four SPCs we reviewed.
Due to limitations in procurement systems, four of the seven departments
cannot identify if a purchase was made through an SPC. Consequently, these
departments cannot identify how much they have spent outside of mandatory
SPC arrangements or act to reduce the occurrence of contract leakage.
Lead agencies have also not effectively overseen user departments’ compliance
with the requirement to purchase exclusively through mandatory SPCs. Lead
agencies do not have access to the data needed to understand the scale, nature
or significance of leakage that occurs.
5.1 Conclusion

74 State Purchase Contracts Victorian Auditor‐General’s Report
Understanding the scale and reasons for contract leakage, and targeting
non‐compliance with mandatory SPCs, will improve cost savings and realisation
of non‐financial benefits of SPCs.
Managing leakage as an SPC user
User departments and agencies are responsible for ensuring that SPC
contract leakage does not occur. This is done by having robust procurement
authorisation processes and procedures and by educating staff about the proper
use of SPCs. User departments and agencies are also best placed to detect
contract leakage because they have access to their own accounts payable data,
which can be used to detect instances of contract leakage after it occurs.
All departments have policies to promote the use of mandatory SPCs. However,
they could not demonstrate that they understood the extent of leakage from
mandatory SPCs, or managed it effectively.
The finance or procurement systems at four departments—DET, DTF, DPC
and DELWP—do not identify if a purchase was made through an SPC. Despite
this, DTF was able to estimate their SPC spend in 2016–17. DET, DPC and
DELWP were not, and using the data available to them in their financial and
procurement systems they would not be able to identify potential leakage from
SPCs. Due to data quality issues and limitations in procurement and finance
systems, it is difficult for these departments to ensure compliance with VGPB
policies, including the requirement to use mandatory SPCs.
User departments included in our 2012 audit report Personal Expense
Reimbursement, Travel Expenses and Corporate Credit Cards also need to
address the recommendation from that report, that public sector agencies
should report and address expenditure occurring outside of mandatory SPCs.
Four user departments included in this audit—DHHS (formerly the Department
of Human Services), DJR (formerly the Department of Justice), DEDJTR (formerly
the Department of Business and Innovation) and DPC—are yet to establish
processes to address this recommendation.
Aside from the requirement to comply with the FMA, it is important that
departments use SPC arrangements where required—otherwise they may not
achieve the best value for money on purchases and may undermine the broader
objectives of SPCs.
Managing leakage as a lead agency
Lead agencies rely on user departments complying with their own procurement
policies and SPC rules to control contract leakage. Lead agencies do not have
access to the necessary data to allow the identification of leakage from SPCs.
For this reason, lead agencies rely on SPC users to educate their staff and to use
their own expenditure data to identify contract leakage.
The ability of lead agencies to control contract leakage would be enhanced if
accurate accounts payable data could be obtained on a consistent basis from
the major SPC users.
5.2 Roles and responsibilities to manage leakage

Victorian Auditor‐General’s Report State Purchase Contracts 75
Due to the absence of adequate processes to monitor leakage at the user
departments, VGPB and lead agencies, we examined purchasing data at the
seven departments to identify potential leakage in selected mandatory SPCs:
Stationery and Workplace Consumables
Travel Management Services
Staffing Services
Legal Services Panel.
Methodology
Using expenditure data obtained from all departments, we used the
ANZSIC categorisation to highlight expenditure that appeared to fall within
the scope of one of the selected SPCs but did not go to a relevant SPC supplier.
These instances represented possible leakage from mandatory SPCs, and we
undertook further analysis of the invoices to confirm this. Where a lead agency
had granted a user department an exemption, we marked this spend as ‘not
leakage’.
In a significant number of transactions we were unable to determine the nature
of spend due to the limited description on the invoices. Given these limitations,
this analysis is conservative and indicative, using the best available data in
departments’ finance systems.
Our analysis categorises spend as one of the following:
not leakage
potential leakage
SPC spend.
Figure 5A outlines an example of this process using the leakage analysis for the
Staffing Services SPC.
Figure 5A Leakage analysis for the Staffing Services SPC
SPC spend Potential leakage Not leakage
Spend within the ANZSIC category that was through the SPC suppliers.
Spend within the ANZSIC category that was not through an SPC supplier, but the invoice description suggests that it was for a service mandated under the SPC. For example, the engagement of a temporary receptionist.
Spend within the ANZSIC category that is not within the scope of the SPC. For example, engagement of permanent staff. User departments are not mandated to make these engagements through the SPC.
Source: VAGO, based on ANZSIC.
5.3 Leakage from mandatory SPCs

76 State Purchase Contracts Victorian Auditor‐General’s Report
Results of our analysis of leakage
Figure 5B shows the high‐level results of our leakage analysis in the seven
departments, expressed as a percentage breakdown of the four ANZSIC spend
categories.
Figure 5B Breakdown of ANZSIC spend categories
Source: VAGO analysis of user departments’ 2016–17 accounts payable data and SPC spend data from lead agencies.
Our analysis of departments’ records for 2016–17 showed potential leakage of:
$0.25 million, or 2.1 per cent of total spend of $12.23 million, in the
stationery category
$0.06 million, or 0.1 per cent of total spend of $48.64 million, in the travel
category
$2.07 million, or 0.7 per cent of total spend of $289.37 million, in the
staffing category
We identified no leakage in the total spend of $122.7 million in the Legal
Services category.
0%
10%
20%
30%
40%
50%
60%
70%
80%
90%
100%
Stationery Travel Staffing Legal
SPC spend Potential leakage Not leakage

Victorian Auditor‐General’s Report State Purchase Contracts 77
Potential leakage by SPC
Figure 5C shows these leakage amounts by SPC as a percentage of the value.
Figure 5C Potential leakage as percentage of SPC value
Source: VAGO analysis of user departments’ 2016–17 accounts payable data and SPC spend data from lead agencies.
The value of potential leakage identified could include cases where a legitimate
exemption was approved by a lead agency but the record was not kept. See
Section 5.4 for more detail on exemptions.
Stationery and Workplace Consumables SPC
DTF is the lead agency for the Stationery and Workplace Consumables SPC,
which commenced in its current form in October 2015. User departments must
purchase all mandated goods through the nominated SPC supplier. Mandated
goods include:
paper
general stationery items such as pens, notebooks and folders
filing equipment
ICT consumables such as USB drives, keyboards and printer cartridges.
2.3%
1.0%
0.7%
0%
1%
1%
2%
2%
3%
Stationery and WorkplaceConsumables
Staffing Services Travel ManagementServices

78 State Purchase Contracts Victorian Auditor‐General’s Report
For items that DTF has classified as non‐mandated, such as janitorial and kitchen
supplies, office furniture and uniforms, user departments may purchase these
items through the SPC, or choose to purchase them elsewhere. The latter would
not constitute contract leakage because these items are non‐mandated under
the SPC. Figure 5D outlines our analysis of 2016–17 spend in the ANZSIC
stationery spend category.
Figure 5D User departments spend in stationery spend category, 2016–17
Note: Figures may not total 100 per cent due to rounding.
Source: VAGO analysis of departments’ 2016–17 accounts payable data and SPC spend data from lead agencies.
The seven departments spent $12.23 million in the ANZSIC stationery spend
category. It is positive that the majority of this (89.9 per cent) was through the
nominated SPC supplier.
From our review of invoices, 8.1 per cent of this spend was not leakage because
it was for non‐mandated items. We identified approximately $0.25 million of
spend (2.1 per cent) as potential leakage. This amount is 2.3 per cent of the
$10.99 million value of the SPC contract in 2016–17 for the seven departments.
Of the $253 000 identified as potential leakage, approximately 50 per cent of
this spend went to seven suppliers. Armed with this type of information, user
departments should conduct checks of their accounts payable systems over
time for transactions with these suppliers to identify potential leakage for
further investigation.
Figure 5E breaks down the total leakage amount to show the amount
identified in each user department, including this amount as a per cent of
that department’s spend on the SPC.
$10.99 million89.9%
$0.25 million2.1%
$0.99 million8.1%
SPC spend
Potential leakage
Not leakage$12.23 million
spend

Victorian Auditor‐General’s Report State Purchase Contracts 79
Figure 5E User departments leakage in the stationery spend category in, 2016–17
Source: VAGO analysis of departments’ 2016–17 accounts payable data.
We conducted a price comparison of popular stationery goods purchased
through the SPC to identify the potential impact of leakage where departments
purchased stationery items through other retailers.
We selected the 10 most commonly purchased stationery items through the SPC
by the seven departments in 2016–17. We compared the SPC price for these
items with the price for like‐for‐like items at a leading stationery retailer, as
shown in Figure 5F.
Figure 5F Lowest price on 10 most commonly purchased stationery items
Stationery Item
Did the SPC have the lowest price? SPC cost ($)
Stationery retailer cost
($) Variance (%)
Item 1 ✘ 28.55 24.95 –13
Item 2 ✔ 2.33 5.63 142
Item 3 ✔ 0.11 0.38 246
Item 4 ✔ 2.26 2.49 10
Item 5 ✔ 2.16 2.99 38
Item 6 ✔ 4.81 5.00 4
Item 7 ✔ 1.16 2.78 140
Item 8 ✔ 4.64 9.67 108
Item 9 ✔ 4.60 7.89 72
Item 10 ✔ 9.60 11.90 24
Source: VAGO analysis from data provided by DTF and online from a stationery retailer.
6.0%
8.0%
2.4%
0.8%
4.0%
3.3%
0.1%0%
1%
2%
3%
4%
5%
6%
7%
8%
0
10
20
30
40
50
60
70
80
DEDJTR DELWP DHHS DJR DPC DTF DET
$ (thousand)
Leakage Leakage as percentage of SPC spend

80 State Purchase Contracts Victorian Auditor‐General’s Report
When compared to the stationery retailer, the SPC delivered significantly
cheaper prices for nine of the 10 items. This highlights the necessity for user
departments to control for leakage. User departments must ensure that all
business units purchase stationery items through the SPC to prevent paying
higher prices at other stationery retailers.
Travel Management Services SPC
DTF is the lead agency for the Travel Management Services SPC, which
commenced in its current form in September 2016. The SPC contract states that
user departments must book all flights and travel accommodation through the
appointed SPC supplier, Corporate Travel Management. The Victorian Public
Service Travel Policy, established by DTF in November 2017, diverges from this
directive, stating that departments need only book Victorian accommodation
through the SPC ‘when possible’. In discussions with the category manager, we
have considered Victorian accommodation not to be mandated under the SPC.
Our analysis of departments’ records showed that in 2016–17 the seven
departments spent $48.64 million in the ANZSIC travel spend category. Of this,
17.7 per cent was through the nominated SPC supplier, as Figure 5G shows. This
indicates that the SPC is not capturing the majority of the spend in the wider
spend category.
Figure 5G Travel spend category in user departments, 2016–17
Note: Figures may not total 100 per cent due to rounding.
Source: VAGO analysis of departments’ 2016–17 accounts payable data and SPC spend data from lead agencies.
$8.62 million17.7%
$0.06 million0.1%
$4.00 million8.2%
$35.96 million73.9%
SPC spend
Potential leakage
Victorian accommodation (notmandated under the SPC)Not leakage
$48.64 millionspend

Victorian Auditor‐General’s Report State Purchase Contracts 81
Approximately 73.9 per cent of the total category spend was not leakage
because it was for services not mandated to be booked through the SPC. On
further investigation, we found that the majority of this spend was for venue
hire in hotels. For example, the booking of rooms in a hotel to run training
sessions or all‐staff forums. As these payments are not for accommodation,
they are not mandated by the SPC and cannot be considered contract leakage.
However, the volume and value of these payments does represent an
opportunity for aggregating this spend that DTF should explore.
We also identified that 8.2 per cent of the spend category was for
accommodation in Victoria that departments did not book through the SPC.
While this is not technically leakage, it does represent a significant amount
of spend and is a missed opportunity for the current SPC. As discussed in
Section 2.2, DTF recognises the need to ensure that departments book more
of their Victorian accommodation through the SPC. The number of Victorian
accommodation bookings through the SPC doubled between 2016–17 and
2017–18.
We identified approximately $0.06 million of spend—or 0.1 per cent
of the category spend—as potential contract leakage. This amount is
0.7 per cent of the $8.6 million value of the SPC contract in 2016–17 for
the seven departments.
Figure 5H breaks down the total leakage amount to show the amount identified
in each user department, including this amount as a per cent of that
department’s spend on the SPC.
Figure 5H Leakage in the Travel Management Services SPC in user departments, 2016–17
Source: VAGO analysis of departments’ 2016–17 accounts payable data.
2.0%
1.6%
3.0%
0.4% 0.4% 0.3%
0.01%
0%
1%
2%
3%
4%
5%
0
5
10
15
20
25
DPC DJR DTF DHHS DELWP DET DEDJTR
$ (thousand)
Leakage Leakage as a percentage of SPC spend

82 State Purchase Contracts Victorian Auditor‐General’s Report
We conducted a price comparison of SPC hotel rates to the market to identify
the potential impact of leakage where departments do not book travel
arrangements through the SPC.
As Figure 5I shows, we compared the rates for 10 hotel rooms between
the rates offered through the SPC and the rates offered on a popular
accommodation booking site. We searched comparable rates on the same
day to ensure consistency of pricing, and comparisons were for the same room
booked for the same night.
Figure 5I Lowest price on 10 hotel rooms
Hotel room
Did the SPC offer the cheapest rate? SPC rate ($)
Accommodation website rate ($)
Variance(%)
Room 1 ✔ 190 270 42
Room 2 ✔ 167 201 20
Room 3 ✔ 147 223 52
Room 4 ✔ 127 205 61
Room 5 ✔ 138 269 95
Room 6 ✔ 129 139 8
Room 7 ✔ 150 158 5
Room 8 ✔ 152 174 14
Room 9 ✔ 139 159 14
Room 10 ✔ 176 178 1
Source: VAGO, using the SPC booking system and a popular accommodation booking site on 11 July 2018.
The SPC offered lower rates for all 10 hotel rooms—in some cases by a
significant amount. For example, for Room 5, the nightly rate listed on the
accommodation site was 95 per cent more than the SPC rate. This again
highlights the importance of SPC users ensuring that staff book travel through
the SPC. It also reinforces the need for DTF as a lead agency to consider
mandating that all Victorian accommodation bookings be made through the
SPC.
Staffing Services SPC
DTF manages the Staffing Services SPC, which commenced in its current form
in January 2016. All engagements of temporary staff for administrative roles,
IT roles and specialist roles must be engaged through the Staffing Services SPC.
Engagement of permanent staff may also occur through the SPC but these
engagements are not mandatory.

Victorian Auditor‐General’s Report State Purchase Contracts 83
The SPC model includes eight master vendors and more than 200 ‘tier‐2’
vendors, which may provide staff on behalf of the master vendor. In this
circumstance, the user department engages solely with the master vendor,
including for payment. DTF considers payments made directly to tier‐2 vendors
to be contract leakage.
Our analysis of departments’ records showed that in 2016–17 the seven
departments spent $289.37 million in the ANZSIC staffing services spend
category. As Figure 5J shows, the majority of spend—70.8 per cent—was
through the eight nominated SPC suppliers. This is a positive indication
that the SPC captures the majority of spend in the wider spend category.
Figure 5J Staffing services category spend in user departments, 2016–17
Source: VAGO analysis of departments’ 2016–17 accounts payable data and SPC spend data from lead agencies.
From our review of invoices, 28.5 per cent of this spend was not leakage
because it was for non‐mandated engagements such as for permanent staff. We
identified approximately $2.07 million—or 0.7 per cent—as potential contract
leakage. This amount is 1 per cent of the $204.88 million value of the SPC
contract in 2016–17 for the seven departments.
Figure 5K breaks down the total leakage amount to show the amount
identified in each user department, including this amount as a per cent of
that department’s spend on the SPC. We identified no potential contract
leakage in DET or DTF.
$204.88 million70.8%
$2.07 million0.7%
$82.42 million28.5%
SPC spend
Potential leakage
Not leakage
$289.37 millionspend

84 State Purchase Contracts Victorian Auditor‐General’s Report
Figure 5K Leakage in the Staffing Services SPC in user departments, 2016–17
Source: VAGO analysis of departments’ 2016–17 accounts payable data.
Of the $2.07 million identified as potential leakage, more than 55 per cent went
to two suppliers. Armed with this type of information, user departments should
conduct their own checks of their accounts payable systems over time for
transactions with these suppliers to identify potential leakage for further
investigation.
We also identified that departments made payments directly to tier‐2 vendors.
When we queried these payments with user departments, a common response
was that these payments did not constitute leakage, which demonstrates
confusion among users regarding the contract rules.
Legal Services Panel SPC
DJR manages the Legal Services Panel, which commenced in its current form in
March 2016. All legal services in the mandated areas of law under the contract
must be engaged through the SPC. Legal services not in these mandated areas
are not required to be engaged through the SPC. This type of expenditure is not
contract leakage. The SPC has 23 nominated legal suppliers.
Our analysis of departments’ records showed that in 2016–17 the
seven departments spent $122.7 million in the ANZSIC legal services spend
category. Of this, more than half of the spend—63.1 per cent—was through
the SPC, as Figure 5L shows. This indicates that opportunities may be available
for DJR as the lead agency to consider other types of legal spend that could
be incorporated into the SPC.
2.6%
0.9% 0.8%
2.1%
0.5%
0%
1%
2%
3%
4%
5%
6%
7%
0
200
400
600
800
1 000
1 200
1 400
DEDJTR DJR DELWP DPC DHHS
$ (thousand)
Leakage Leakage as a percentage of SPC spend

Victorian Auditor‐General’s Report State Purchase Contracts 85
Figure 5L Legal services category spend in user departments, 2016–17
Source: VAGO analysis of departments’ 2016–17 accounts payable data and SPC spend data from lead agencies.
We identified no potential leakage for the Legal Services Panel.
If departments do not wish to use a mandated SPC, they must apply for an
exemption. If granted, this expenditure is not contract leakage. Departments
can apply for an exemption from an SPC to the:
the relevant minister prior to the establishment of a new SPC
accountable officer at the lead agency if they are a participating party in an
existing SPC
category manager at the lead agency for a one‐off purchase.
There are set criteria for granting exemptions. Acceptable reasons to grant an
exemption include:
a supplier is no longer able to service an area
a regional supplier can deliver better value for money
a conflict of interest arises with the SPC supplier.
It is important for lead agencies and user entities to keep track of exemptions
both requested and granted. For a user department, keeping a central record of
exemptions is an important part of understanding SPC spend and compliance.
For lead agencies, these records allow for trend analysis to identify potential
areas where users are seeking multiple exemptions, which potentially indicates
a problem with the SPC scope and offerings.
We sought information from user departments and lead agencies on the
number of exemptions requested and granted.
$77.47 million63.1%
$45.23 million36.9% SPC spend
Not leakage$122.7 million
spend
5.4 Exemption process

86 State Purchase Contracts Victorian Auditor‐General’s Report
User departments
We asked the seven user departments for exemptions requested and granted
for all SPCs. None of the user departments held a central register of SPC
exemptions. DEDJTR, DET, DTF, DPC and DJR were able to search for exemption
records for some SPCs, but DHHS and DELWP were unable to provide any
evidence of exemptions sought or granted because they do not keep central
records.
The devolution of the procurement function across all user departments makes
tracking exemptions very difficult. For example, in a large department like DHHS,
business units are responsible for their own procurements under a certain
value, with no involvement from the Internal Procurement Unit. If this business
unit seeks an exemption under an SPC, the Internal Procurement Division is
unaware. Consequently, even in the departments that are able to search for
some exemption records, they did not have a comprehensive view of all
exemptions sought under all SPCs across the entire department.
As a result, user departments have a limited understanding of SPC compliance
in their business units. User departments are less able to identify patterns
where exemption applications may be concentrated in certain business areas,
or where reoccurring exemption applications may represent a problem with the
SPC scope.
Lead agencies
We asked DTF, DPC and DJR as lead agencies for records of exemption
applications made to them by user departments and to flag where they had
approved these applications. Due to the low value of the Rosetta SPC, we
excluded Cenitex from our analysis.
Department of Justice and Regulation
DJR keeps a central register of all approved exemptions in an exemption policy
report. These records include the:
user making the application
name of the legal matter and the area of law
non‐SPC supplier that the user wishes to engage
reason for the exemption application
outcome and approving officer
cost of the legal matter subject to exemption
expected end date of the legal matter.
In 2016–17 DJR granted nine applications for exemption from the Legal Services
Panel SPC across four user departments. While we conducted leakage analysis in
the Legal Services Panel SPC, we were able to use this exemption policy report
to cross‐check potential instances of leakage with legal matters that DJR had
approved for exemption.

Victorian Auditor‐General’s Report State Purchase Contracts 87
Department of Treasury and Finance and Department of Premier and Cabinet
DTF and DPC do not keep central registers of exemptions. This limits their ability
to conduct trend analysis to identify potential areas where users are seeking
multiple exemptions that potentially indicate a problem with the SPC scope and
offerings.


Victorian Auditor‐General’s Report State Purchase Contracts 89
Appendix A Audit Act 1994 section 16—submissions and comments
We have consulted with Cenitex, DEDJTR, DET, DELWP, DHHS, DJR, DPC, DTF and
VGPB, and we considered their views when reaching our audit conclusions. As
required by section 16(3) of the Audit Act 1994, we gave a draft copy of this
report, or relevant extracts, to those agencies and asked for their submissions
and comments.
Responsibility for the accuracy, fairness and balance of those comments rests
solely with the agency head.
Responses were received as follows:
Cenitex ................................................................................................................. 90
DEDJTR ................................................................................................................. 91
DET ...................................................................................................................... 92
DELWP ................................................................................................................. 94
DHHS .................................................................................................................... 96
DJR ....................................................................................................................... 98
DPC .................................................................................................................... 101
DTF .................................................................................................................... 104
VGPB .................................................................................................................. 106

90 State Purchase Contracts Victorian Auditor‐General’s Report
RESPONSE provided by the Chief Executive, Cenitex

Victorian Auditor‐General’s Report State Purchase Contracts 91
RESPONSE provided by the Secretary, DEDJTR

92 State Purchase Contracts Victorian Auditor‐General’s Report
RESPONSE provided by the Secretary, DET
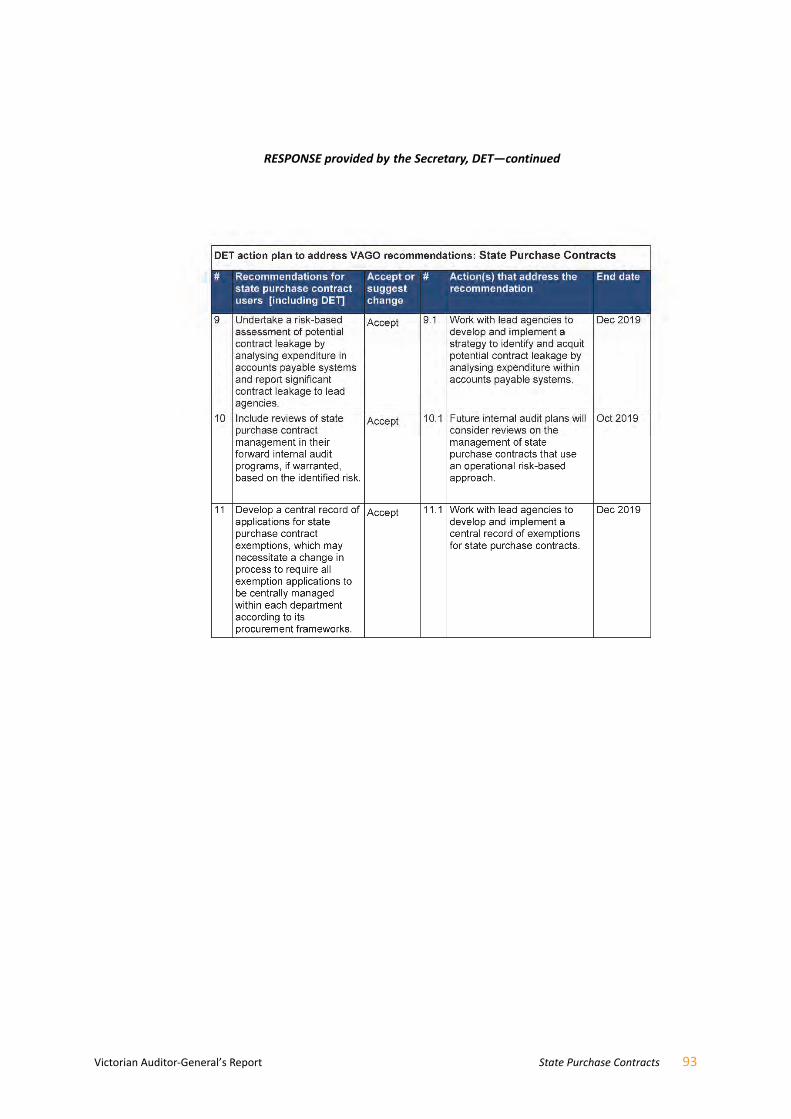
Victorian Auditor‐General’s Report State Purchase Contracts 93
RESPONSE provided by the Secretary, DET—continued

94 State Purchase Contracts Victorian Auditor‐General’s Report
RESPONSE provided by the Secretary, DELWP

Victorian Auditor‐General’s Report State Purchase Contracts 95
RESPONSE provided by the Secretary, DELWP—continued

96 State Purchase Contracts Victorian Auditor‐General’s Report
RESPONSE provided by the Secretary, DHHS

Victorian Auditor‐General’s Report State Purchase Contracts 97
RESPONSE provided by the Secretary, DHHS—continued

98 State Purchase Contracts Victorian Auditor‐General’s Report
RESPONSE provided by the Secretary, DJR

Victorian Auditor‐General’s Report State Purchase Contracts 99
RESPONSE provided by the Secretary, DJR—continued
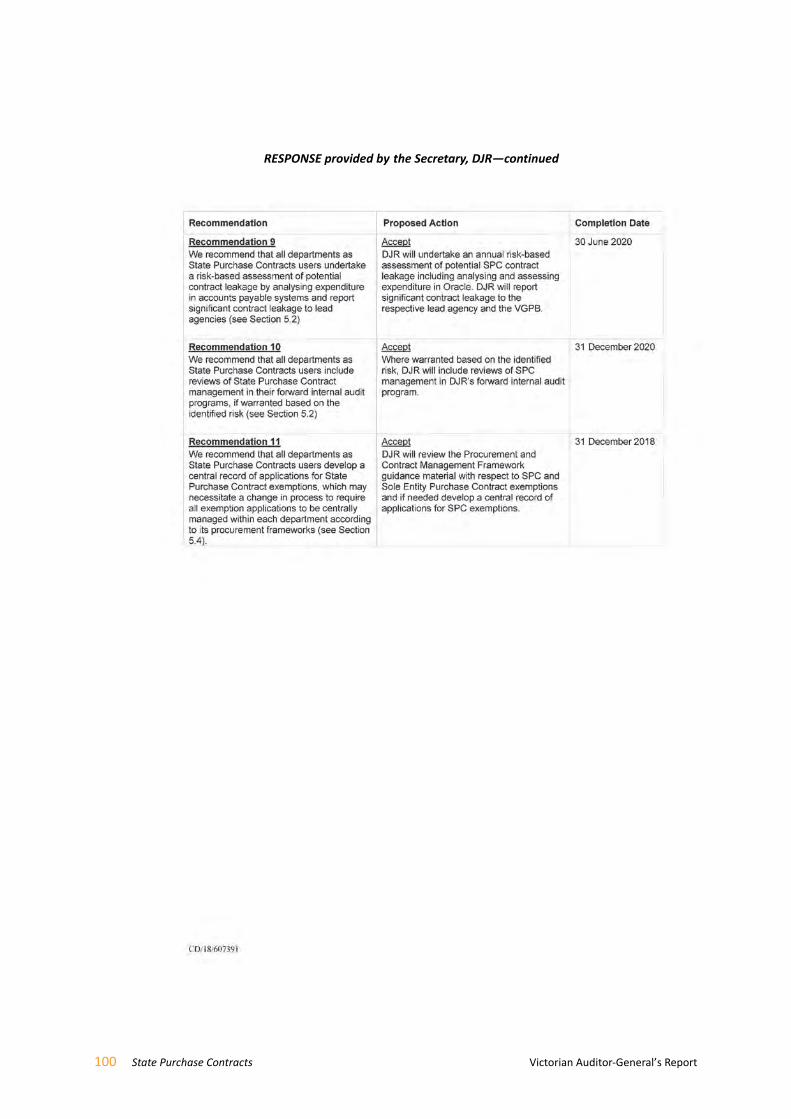
100 State Purchase Contracts Victorian Auditor‐General’s Report
RESPONSE provided by the Secretary, DJR—continued

Victorian Auditor‐General’s Report State Purchase Contracts 101
RESPONSE provided by the Secretary, DPC

102 State Purchase Contracts Victorian Auditor‐General’s Report
RESPONSE provided by the Secretary, DPC—continued

Victorian Auditor‐General’s Report State Purchase Contracts 103
RESPONSE provided by the Secretary, DPC—continued

104 State Purchase Contracts Victorian Auditor‐General’s Report
RESPONSE provided by the Secretary, DTF

Victorian Auditor‐General’s Report State Purchase Contracts 105
RESPONSE provided by the Secretary, DTF—continued

106 State Purchase Contracts Victorian Auditor‐General’s Report
RESPONSE provided by the Chair, VGPB

Victorian Auditor‐General’s Report State Purchase Contracts 107
Appendix B Entities bound by VGPB policies
As at the 1 July 2018 the following entities are bound by VGPB policies.
Departments
Department of Economic Development, Jobs, Transport and Resources
Department of Education and Training
Department of Environment, Land, Water and Planning
Department of Health and Human Services
Department of Justice and Regulation
Department of Premier and Cabinet
Department of Treasury and Finance
Specified agencies
VicRoads
Public Transport Victoria
Cenitex
Offices or bodies
Environment Protection Authority
Essential Services Commission
Game Management Authority
Independent Broad‐Based Anti‐Corruption Commission
Infrastructure Victoria
Office of the Chief Commissioner of Police (Victoria Police)
Office of Public Prosecutions and Associate Crown Prosecutors
Office of the Commissioner for Environmental Sustainability
Office of the Commission for Children and Young People
Office of the Freedom of Information Commissioner
Office of the Labour Hire Licensing Authority
Office of the Legal Services Commissioner
Office of the Ombudsman
Office of the Commissioner for Privacy and Data Protection
Office of the Road Safety Camera Commissioner
Taxi Services Commission

108 State Purchase Contracts Victorian Auditor‐General’s Report
Victorian Auditor‐General’s Office
Victorian Commission for Gambling and Liquor Regulation
Victorian Electoral Commission
Victorian Equal Opportunity and Human Rights Commission
Victorian Fisheries Authority
Victorian Inspectorate
Victorian Responsible Gaming Foundation
Other
Victorian Public Sector Commission

Victorian Auditor‐General’s Report State Purchase Contracts 109
Appendix C State Purchase Contracts
Figure C1 shows SPCs as at June 2017 and their sourcing arrangements.
Figure C1 SPCs as at 30 June 2017
SPC Goods and services provided Sourcing arrangement
DTF
Cash and Banking Services Cash and banking services including transaction processing and working capital management
Sole supplier
Document Mail Exchange (DX Services)
Government document pick‐up and delivery services
Sole supplier
Electricity—Small and Medium Enterprise and Residential Sites
Supply of electricity to sites consuming less than 40 megawatt hours per annum
Sole supplier
Electricity—Large sites Electricity for large sites Sole supplier
Fleet Disposals Vehicle disposal—collection, remediation/repair and sale
Sole supplier
Fuel and Associated Products Fuel cards that allow fleet users to purchase fuel at a discounted price, delivery of discounted‐price bulk fuel to government depots
Closed panel
Marketing Services Register Creative services in advertising and communication
Register
Master Agency Media Services Media strategy, planning, buying and reporting services for campaign, functional and recruitment advertising
Sole supplier
Motor Vehicles Motor vehicles—passenger, light commercial and motorcycles
Open panel
Natural Gas Supply of natural gas to both small and large sites
Sole supplier
Postal Services Selected postal services, i.e. domestic parcels—Parcel Post and e‐parcel and international mail
Sole supplier
Print Management Services Print management services, digital publishing, mail house and warehousing solutions
Sole supplier

110 State Purchase Contracts Victorian Auditor‐General’s Report
Figure C1
SPCs as at 30 June 2017—continued
SPC Goods and services provided Sourcing arrangement
DTF
PAS
Professional advisory services within four categories:
CAFAS
Tax Advisory Services
Financial Assessment Services
Probity Services
Open panel
Security Services
Static guarding, patrolling sites, mail and parcel scanning, alarm response and other ad hoc requirements
Closed panel
Staffing Services
Temporary staffing services (mandatory) and permanent personnel (optional) under the administration, information technology and specialised categories
Closed panel
Stationery and Workplace Consumables
Stationery and workplace consumables such as paper, ICT consumables, general stationery and filing
Sole supplier
Travel Management Services Travel management services including booking services, discounted airfares, hotel rates and car rental prices, account management and travel data reporting
Sole supplier
DPC
Citrix Products and Services
Citrix software, hardware, technical support, professional services and training
Sole supplier
Data Centre Facilities
Provision of data centre facilities
Sole supplier
End User Computing Equipment Panel
Apple devices, Chrome devices, desktop computers, mobility devices and notebook computers
Closed panel
eServices Register ICT services and related products such as geo‐spatial data services and ICT business process expertise
Register
IBM Enterprise Licensing Agreement
Software support for government’s fleet of IBM perpetual licences
Sole supplier

Victorian Auditor‐General’s Report State Purchase Contracts 111
Figure C1
SPCs as at 30 June 2017—continued
SPC Goods and services provided Sourcing arrangement
DPC—continued
Intra‐Government Secured Network
High bandwidth data network service links at bandwidths ranging from 100 MBps to 10 GBps
Sole supplier
IT Infrastructure Register Servers, storage and network equipment, maintenance and support of new and legacy network equipment
Register
Microsoft Enterprise Agreement Microsoft products and services
Sole supplier
Microsoft Licensing Solution Provider
Microsoft does not sell directly to government departments and agencies. This SPC appoints the approved third‐party supplier to provide Microsoft products
Sole supplier
Multifunction Devices and Printers
Devices and printers that can either scan, print, copy and facsimile—excludes publication printing and printing paper
Closed panel
Oracle Software and Support Specified range of Oracle products
Sole supplier
Salesforce Customer Relationship Management
Specified range of Salesforce cloud services
Sole supplier
Telecommunications Purchasing and Management Strategy
Telecommunication services including data, voice, mobile, internet and unified services
Closed panel
Victorian Office Telephony Services
Office telephony and related facilities management service
Sole supplier
VMware Enterprise Licensing Agreement
Specified range of VMware products
Open panel
DJR
Legal Services Panel Litigation and dispute resolution relating to various areas of law
Closed panel
Cenitex
Rosetta Identity management and security software
Sole supplier
Source: VAGO, based on information from DTF, DPC, DJR and Cenitex.


Victorian Auditor‐General’s Report State Purchase Contracts 113
Appendix D Western Australian Department of Finance dashboard
Figures D1 and D2 provide examples of the type of information publicly
available in the WA Department of Finance dashboard.
Figure D1 WA agency expenditure by the United Nations Standard Products and Services Code, 2016–17
Source: WA Department of Finance.

114 State Purchase Contracts Victorian Auditor‐General’s Report
Figure D2 Western Australian Common Use Arrangements, 2016–17
Note: Common Use Arrangement are whole‐of‐government goods and service contracts.
Source: WA Department of Finance.

Victorian Auditor‐General’s Report State Purchase Contracts 115
Appendix E Methodology for spend analysis
Step 1: Define scope
The scope of data for the audit included expenditure from the seven
departments for the financial years 2014–15, 2015–16 and 2016–17.
We used this expenditure data to perform the following tests:
categorise spend across the seven departments
identify expenditure categories for potential new SPCs
determine whether contract leakage was occurring in select SPCs
understand the spread of expenditure across different suppliers.
Step 2: Data extraction
To perform these tests, we extracted data from departments’ accounts payable
systems. The departments use these systems to pay invoices for goods and
services. All departments use Oracle Financials as their accounts payable
system. Data is stored in Oracle Financials in multiple data tables.
A script was written to extract data from the tables in Oracle Financials. This
script was originally created by DEDJTR, and then the same script was used to
extract data from the other departments’ accounts payable systems to ensure a
consistent approach.
Once the departments had completed the data extraction, a secure transfer link
was shared with the departments so that they could upload this data to VAGO’s
password‐secured database. After receiving confirmation that the data upload
was complete, we downloaded the data into a secure folder. A manual review
was performed to ensure that all data tables had been extracted and received.

116 State Purchase Contracts Victorian Auditor‐General’s Report
Step 3: Transformation of data
The data provided from all departments was uploaded into a secure server at
VAGO to be collated, cleaned and manipulated to make it fit for purpose. All
departments use Oracle Financials differently, which means that the data tables
extracted from accounts payable systems were not consistent across all
departments and could not be readily matched and compared. We used
two methods to standardise and categorise these transactions:
Chart of accounts—each department uses a chart of accounts to map,
organise and categorise expenditure. This chart provides a complete listing
of all accounts used by the department to categorise spend for reporting.
We used these charts of accounts to categorise each transaction across all
departments. However, departments use different charts of accounts,
which means we could not uniformly categorise across all departments.
ANZSIC 2006—to uniformly code transactions across the departments,
we used ANZSIC. VAGO obtained the Australian Business Register database,
which uses ANZSIC to categorise suppliers based on their Australian
Business Numbers. Each supplier is assigned an ANZSIC category based
on its Australian Business Number—for example, the supplier Hays
Recruitment is assigned the ANZSIC category Recruitment Services. The
Australian Business Register database was loaded onto VAGO’s server and
each supplier was matched with a specific categorisation. The
categorisation was then rolled up into broader categories to facilitate
multiple layers of analysis.
Step 4: Data validation
We used the following methods to validate the cleaned and consolidated data:
aggregated numbers were generated and presented to audited
departments for validation
a sense‐check validation of a sample of accounts with publicly available
annual reports of the agencies
based on feedback as part of the two steps above, data investigations were
conducted where the data did not reconcile and adjustments and
amendments were made to the dataset in consultation with departments.
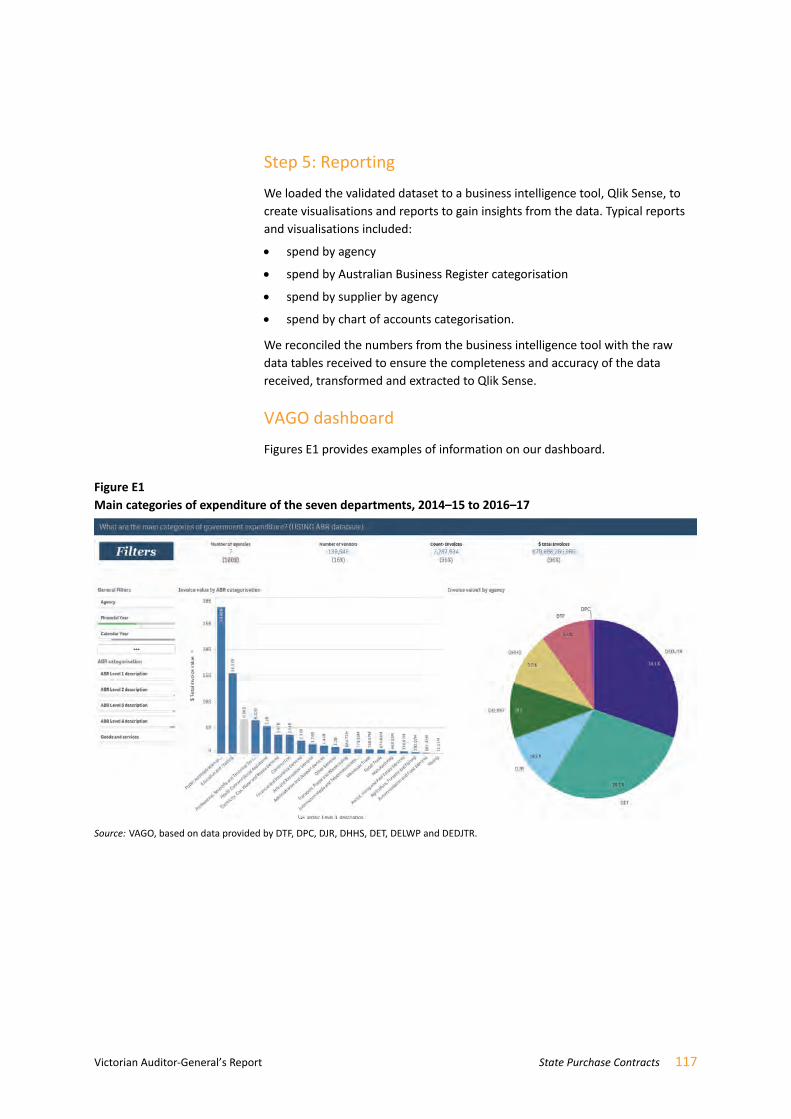
Victorian Auditor‐General’s Report State Purchase Contracts 117
Step 5: Reporting
We loaded the validated dataset to a business intelligence tool, Qlik Sense, to
create visualisations and reports to gain insights from the data. Typical reports
and visualisations included:
spend by agency
spend by Australian Business Register categorisation
spend by supplier by agency
spend by chart of accounts categorisation.
We reconciled the numbers from the business intelligence tool with the raw
data tables received to ensure the completeness and accuracy of the data
received, transformed and extracted to Qlik Sense.
VAGO dashboard
Figures E1 provides examples of information on our dashboard.
Figure E1 Main categories of expenditure of the seven departments, 2014–15 to 2016–17
Source: VAGO, based on data provided by DTF, DPC, DJR, DHHS, DET, DELWP and DEDJTR.

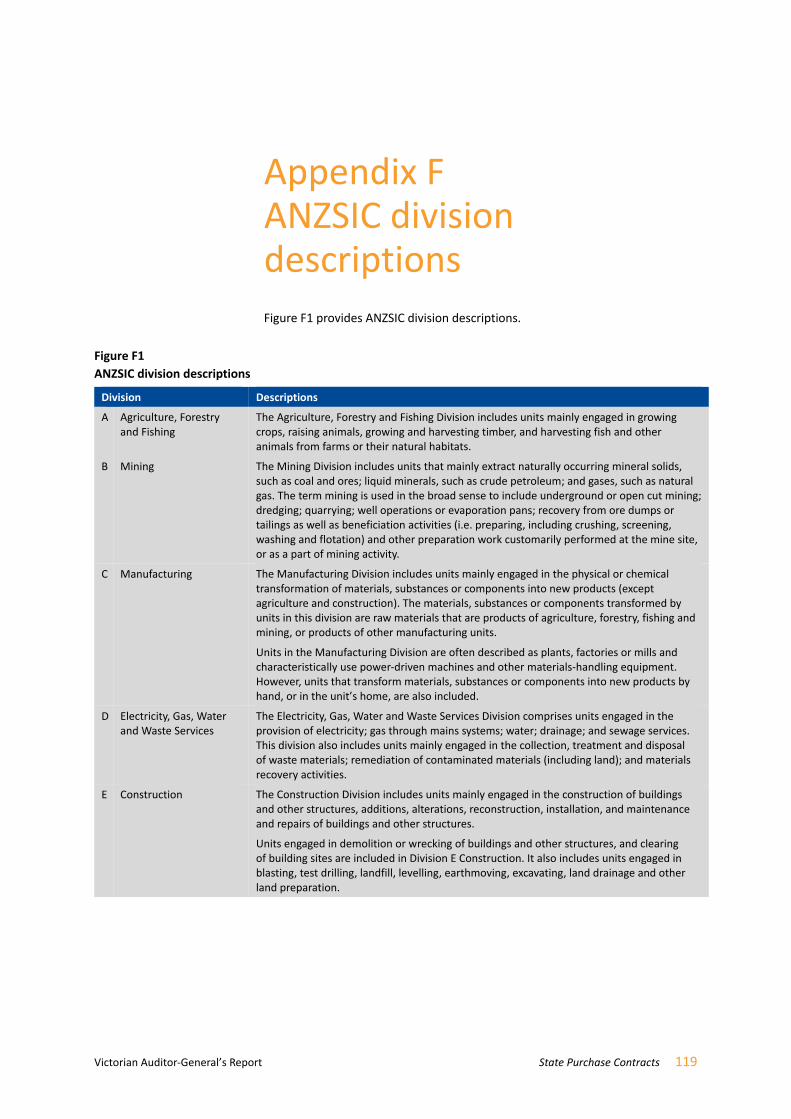
Victorian Auditor‐General’s Report State Purchase Contracts 119
Appendix F ANZSIC division descriptions
Figure F1 provides ANZSIC division descriptions.
Figure F1 ANZSIC division descriptions
Division Descriptions
A Agriculture, Forestry and Fishing
The Agriculture, Forestry and Fishing Division includes units mainly engaged in growing crops, raising animals, growing and harvesting timber, and harvesting fish and other animals from farms or their natural habitats.
B Mining The Mining Division includes units that mainly extract naturally occurring mineral solids, such as coal and ores; liquid minerals, such as crude petroleum; and gases, such as natural gas. The term mining is used in the broad sense to include underground or open cut mining; dredging; quarrying; well operations or evaporation pans; recovery from ore dumps or tailings as well as beneficiation activities (i.e. preparing, including crushing, screening, washing and flotation) and other preparation work customarily performed at the mine site, or as a part of mining activity.
C Manufacturing The Manufacturing Division includes units mainly engaged in the physical or chemical transformation of materials, substances or components into new products (except agriculture and construction). The materials, substances or components transformed by units in this division are raw materials that are products of agriculture, forestry, fishing and mining, or products of other manufacturing units.
Units in the Manufacturing Division are often described as plants, factories or mills and characteristically use power‐driven machines and other materials‐handling equipment. However, units that transform materials, substances or components into new products by hand, or in the unit’s home, are also included.
D Electricity, Gas, Water and Waste Services
The Electricity, Gas, Water and Waste Services Division comprises units engaged in the provision of electricity; gas through mains systems; water; drainage; and sewage services. This division also includes units mainly engaged in the collection, treatment and disposal of waste materials; remediation of contaminated materials (including land); and materials recovery activities.
E Construction The Construction Division includes units mainly engaged in the construction of buildings and other structures, additions, alterations, reconstruction, installation, and maintenance and repairs of buildings and other structures.
Units engaged in demolition or wrecking of buildings and other structures, and clearing of building sites are included in Division E Construction. It also includes units engaged in blasting, test drilling, landfill, levelling, earthmoving, excavating, land drainage and other land preparation.

120 State Purchase Contracts Victorian Auditor‐General’s Report
Figure F1
ANZSIC division descriptions—continued
Division Descriptions
F Wholesale Trade The Wholesale Trade Division includes units mainly engaged in the purchase and onselling, the commission‐based buying, and the commission‐based selling of goods, without significant transformation, to businesses. Units are classified to the Wholesale Trade Division in the first instance if they buy goods and then onsell them (including on a commission basis) to businesses.
Wholesalers’ premises are usually a warehouse or office with little or no display of their goods, large storage facilities, and are not generally located or designed to attract a high proportion of walk‐in customers. Wholesaling is often characterised by high value and/or bulk volume transactions, and customers are generally reached through trade‐specific contacts.
G Retail Trade The Retail Trade Division includes units mainly engaged in the purchase and/or onselling, the commission‐based buying, and the commission‐based selling of goods, without significant transformation, to the general public. The Retail Trade Division also includes units that purchase and onsell goods to the general public using non‐traditional means, including the internet. Units are classified to the Retail Trade Division in the first instance if they buy finished goods and then onsell them (including on a commission basis) to the general public.
Retail units generally operate from premises located and designed to attract a high volume of walk‐in customers, have an extensive display of goods, and/or use mass media advertising designed to attract customers. The display and advertising of goods may be physical or electronic.
H Accommodation and Food Services
The Accommodation and Food Services Division includes units mainly engaged in providing short‐term accommodation for visitors. Also included are units mainly engaged in providing food and beverage services, such as the preparation and serving of meals and the serving of alcoholic beverages for consumption by customers, both on and off‐site.
I Transport, Postal and Warehousing
The Transport, Postal and Warehousing Division includes units mainly engaged in providing transportation of passengers and freight by road, rail, water or air. Other transportation activities such as postal services, pipeline transport and scenic and sightseeing transport are included in this division.
Units mainly engaged in providing goods warehousing and storage activities are also included. The division also includes units mainly engaged in providing support services for the transportation of passengers and freight. These activities include stevedoring services, harbour services, navigation services, airport operations and customs agency services.
J Information Media and Telecommunications
The Information Media and Telecommunications Division includes units mainly engaged in:
creating, enhancing and storing information products in media that allows for their dissemination
transmitting information products using analogue and digital signals (via electronic, wireless, optical and other means)
providing transmission services and/or operating the infrastructure to enable the transmission and storage of information and information products.
Information products are defined as those which are not necessarily tangible, and, unlike traditional goods, are not associated with a particular form. The value of the information products is embedded in their content rather than in the format in which they are distributed.

Victorian Auditor‐General’s Report State Purchase Contracts 121
Figure F1
ANZSIC division descriptions—continued
Division Descriptions
K Financial and Insurance Services
The Financial and Insurance Services Division includes units mainly engaged in financial transactions involving the creation, liquidation, or change in ownership of financial assets, and/or in facilitating financial transactions.
The range of activities include raising funds by taking deposits and/or issuing securities and, in the process, incurring liabilities; units investing their own funds in a range of financial assets; pooling risk by underwriting insurance and annuities; separately constituted funds engaged in the provision of retirement incomes; and specialised services facilitating or supporting financial intermediation, insurance and employee benefit programs. Also included in this division are central banking, monetary control and the regulation of financial activities.
L Rental, Hiring and Real Estate Services
The Rental, Hiring and Real Estate Services Division includes units mainly engaged in renting, hiring, or otherwise allowing the use of tangible or intangible assets (except copyrights), and units providing related services.
The assets may be tangible, as in the case of real estate and equipment, or intangible, as in the case with patents and trademarks. The division also includes units engaged in providing real estate services such as selling, renting and/or buying real estate for others, managing real estate for others and appraising real estate.
M Professional, Scientific and Technical Services
The Professional, Scientific and Technical Services Division includes units mainly engaged in providing professional, scientific and technical services. Units engaged in providing these services apply common processes where labour inputs are integral to the production or service delivery. Units in this division specialise and sell their expertise. In most cases, equipment and materials are not major inputs. The activities undertaken generally require a high level of expertise and training and formal (usually tertiary level) qualifications.
These services include scientific research, architecture, engineering, computer systems design, law, accountancy, advertising, market research, management and other consultancy, veterinary science and professional photography.
Excluded are units mainly engaged in providing health care and social assistance services, which are included in Division Q Health Care and Social Assistance.
N Administrative and Support Services
The Administrative and Support Services Division includes units mainly engaged in performing routine support activities for the day‐to‐day operations of other businesses or organisations.
Units providing administrative support services are mainly engaged in activities such as office administration; hiring and placing personnel for others; preparing documents; taking orders for clients by telephone; providing credit reporting or collecting services; and arranging travel and travel tours.
Units providing other types of support services are mainly engaged in activities such as building and other cleaning services; pest control services; gardening services; and packaging products for others.

122 State Purchase Contracts Victorian Auditor‐General’s Report
Figure F1
ANZSIC division descriptions—continued
Division Descriptions
O Public Administration and Safety
The Public Administration and Safety Division includes units mainly engaged in Central, State or Local Government legislative, executive and judicial activities; in providing physical, social, economic and general public safety and security services; and in enforcing regulations. Also included are units of military defence, government representation and international government organisations.
Central, State or Local Government legislative, executive and judicial activities include the setting of policy; the oversight of government programs; collecting revenue to fund government programs; creating statute laws and by‐laws; creating case law through the judicial processes of civil, criminal and other courts; and distributing public funds.
The provision of physical, social, economic and general public safety and security services, and enforcing regulations, includes units that provide police services; investigation and security services; fire protection and other emergency services; correctional and detention services; regulatory services; border control; and other public order and safety services.
Also included are units of military defence, government representation and international government organisations.
P Education and Training The Education and Training Division includes units mainly engaged in the provision and support of education and training, except those engaged in the training of animals e.g. dog obedience training, horse training.
Education may be provided in a range of settings, such as educational institutions, the workplace, or the home. Generally, instruction is delivered through face‐to‐face interaction between teachers/instructors and students, although other means and mediums of delivery, such as by correspondence, radio, television or the internet, may be used.
Q Health Care and Social Assistance
The Health Care and Social Assistance Division includes units mainly engaged in providing human health care and social assistance. Units engaged in providing these services apply common processes, where the labour inputs of practitioners with the requisite expertise and qualifications are integral to production or service delivery.
R Arts and Recreation Services
The Arts and Recreation Services Division includes units mainly engaged in the preservation and exhibition of objects and sites of historical, cultural or educational interest; the production of original artistic works and/or participation in live performances, events, or exhibits intended for public viewing; and the operation of facilities or the provision of services that enable patrons to participate in sporting or recreational activities, or to pursue amusement interests.
S Other Services The Other Services Division includes a broad range of personal services; religious, civic, professional and other interest group services; selected repair and maintenance activities; and private households employing staff. Units in this division are mainly engaged in providing a range of personal care services, such as hair, beauty and diet and weight management services; providing death care services; promoting or administering religious events or activities; or promoting and defending the interests of their members.
Source: VAGO adapted from ANZSIC.

Victorian Auditor‐General’s Report State Purchase Contracts 123
Appendix G Goods and services spend by ANZSIC subdivision, group and class categories
Figures G1 to G3 provide a breakdown of goods and services spend by the seven
department by ANZSIC subdivision, group and class categories for 2016–17.
Figure G1 Goods and services spend of more than $5 million by ANZSIC subdivision
categories, 2016–17
Subdivision categories $ million
Water Supply, Sewerage and Drainage Services 638.0
Professional, Scientific and Technical Services 410.0
Administrative Services 210.6
Computer System Design and Related Services 197.7
Public Order, Safety and Regulatory Services 160.9
Property Operators and Real Estate Services 159.2
Machinery and Equipment Wholesaling 139.5
Public Administration 127.7
Road Transport 71.7
Internet Service Providers, Web Search Portals and Data Processing Services 51.0
Tertiary Education 46.0
Building Construction 37.8
Basic Chemical and Chemical Product Manufacturing 37.6
Electricity Supply 34.4
Construction Services 27.7
Other Goods Wholesaling 25.7
Finance 25.4
Insurance and Superannuation Funds 23.1
Other Store‐Based Retailing 22.6
Medical and Other Health Care Services 20.7
Social Assistance Services 20.6
Personal and Other Services 20.2
Auxiliary Finance and Insurance Services 17.8
Agriculture, Forestry and Fishing Support Services 15.7
Rental and Hiring Services (except Real Estate) 15.7
Postal and Courier Pick‐up and Delivery Services 15.6
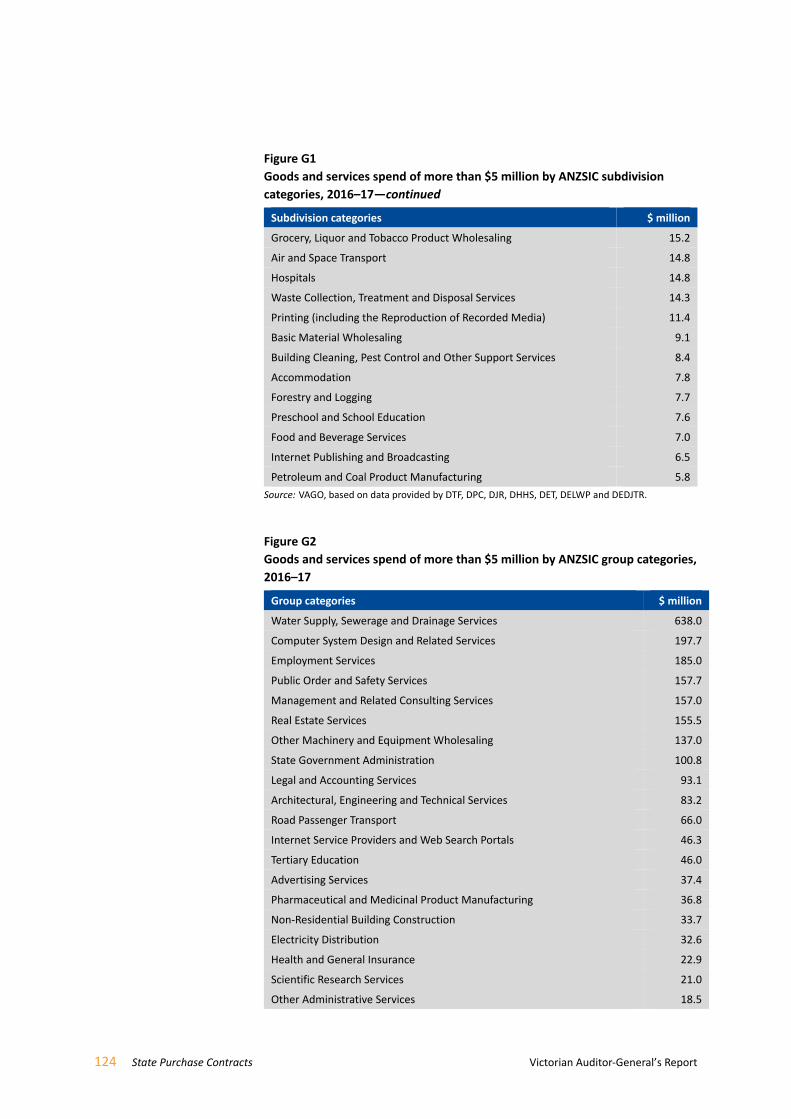
124 State Purchase Contracts Victorian Auditor‐General’s Report
Figure G1
Goods and services spend of more than $5 million by ANZSIC subdivision
categories, 2016–17—continued
Subdivision categories $ million
Grocery, Liquor and Tobacco Product Wholesaling 15.2
Air and Space Transport 14.8
Hospitals 14.8
Waste Collection, Treatment and Disposal Services 14.3
Printing (including the Reproduction of Recorded Media) 11.4
Basic Material Wholesaling 9.1
Building Cleaning, Pest Control and Other Support Services 8.4
Accommodation 7.8
Forestry and Logging 7.7
Preschool and School Education 7.6
Food and Beverage Services 7.0
Internet Publishing and Broadcasting 6.5
Petroleum and Coal Product Manufacturing 5.8
Source: VAGO, based on data provided by DTF, DPC, DJR, DHHS, DET, DELWP and DEDJTR.
Figure G2 Goods and services spend of more than $5 million by ANZSIC group categories,
2016–17
Group categories $ million
Water Supply, Sewerage and Drainage Services 638.0
Computer System Design and Related Services 197.7
Employment Services 185.0
Public Order and Safety Services 157.7
Management and Related Consulting Services 157.0
Real Estate Services 155.5
Other Machinery and Equipment Wholesaling 137.0
State Government Administration 100.8
Legal and Accounting Services 93.1
Architectural, Engineering and Technical Services 83.2
Road Passenger Transport 66.0
Internet Service Providers and Web Search Portals 46.3
Tertiary Education 46.0
Advertising Services 37.4
Pharmaceutical and Medicinal Product Manufacturing 36.8
Non‐Residential Building Construction 33.7
Electricity Distribution 32.6
Health and General Insurance 22.9
Scientific Research Services 21.0
Other Administrative Services 18.5

Victorian Auditor‐General’s Report State Purchase Contracts 125
Figure G2
Goods and services spend of more than $5 million by ANZSIC group categories,
2016–17—continued
Group categories $ million
Financial Asset Investing 17.4
Other Social Assistance Services 16.6
Auxiliary Finance and Investment Services 16.3
Civic, Professional and Other Interest Group Services 16.0
Building Installation Services 15.6
Postal and Courier Pick‐up and Delivery Services 15.6
Grocery, Liquor and Tobacco Product Wholesaling 15.2
Agriculture and Fishing Support Services 14.9
Air and Space Transport 14.8
Hospitals 14.8
Electrical and Electronic Goods Retailing 14.7
Justice 14.5
Market Research and Statistical Services 13.4
Waste Collection Services 13.1
Pharmaceutical and Toiletry Goods Wholesaling 13.1
Motor Vehicle and Transport Equipment Rental and Hiring 11.4
Printing and Printing Support Services 11.3
Furniture, Floor Covering and Other Goods Wholesaling 10.8
Medical Services 9.6
Other Professional, Scientific and Technical Services 7.8
Building Cleaning, Pest Control and Gardening Services 7.8
Accommodation 7.8
Forestry and Logging 7.7
School Education 7.4
Travel Agency and Tour Arrangement Services 7.0
Land Development and Site Preparation Services 6.6
Internet Publishing and Broadcasting 6.5
Allied Health Services 6.2
Local Government Administration 6.0
Petroleum and Coal Product Manufacturing 5.8
Road Freight Transport 5.8
Depository Financial Intermediation 5.7
Cafes, Restaurants and Takeaway Food Services 5.6
Mineral, Metal and Chemical Wholesaling 5.0
Source: VAGO, based on data provided by DTF, DPC, DJR, DHHS, DET, DELWP and DEDJTR.

126 State Purchase Contracts Victorian Auditor‐General’s Report
Figure G3 Goods and services spend of more than $5 million by ANZSIC class categories,
2016–17
Class categories $ million
Water Supply 634.8
Computer System Design and Related Services 197.7
Employment Placement and Recruitment Services 161.6
Real Estate Services 155.5
Correctional and Detention Services 145.6
Management Advice and Related Consulting Services 127.2
Computer and Computer Peripheral Wholesaling 109.4
State Government Administration 100.8
Engineering Design and Engineering Consulting Services 65.4
Legal Services 54.5
Internet Service Providers and Web Search Portals 46.3
Advertising Services 37.4
Accounting Services 37.1
Human Pharmaceutical and Medicinal Product Manufacturing 36.8
Urban Bus Transport (Including Tramway) 36.7
Non‐Residential Building Construction 33.7
Electricity Distribution 32.6
Corporate Head Office Management Services 29.8
Interurban and Rural Bus Transport 29.0
Labour Supply Services 23.4
Higher Education 23.4
Technical and Vocational Education and Training 22.6
General Insurance 21.9
Scientific Research Services 21.0
Financial Asset Investing 17.4
Other Social Assistance Services 16.6
Other Agriculture and Fishing Support Services 14.8
Air and Space Transport 14.8
Postal Services 14.7
Justice 14.5
Other Auxiliary Finance and Investment Services 14.4
Hospitals (Except Psychiatric Hospitals) 14.1
Market Research and Statistical Services 13.1
Pharmaceutical and Toiletry Goods Wholesaling 13.1
Solid Waste Collection Services 12.7
Printing 11.1
Other Motor Vehicle and Transport Equipment Rental and Hiring 10.8
Other Interest Group Services 10.7
Other Electrical and Electronic Goods Wholesaling 10.6

Victorian Auditor‐General’s Report State Purchase Contracts 127
Figure G3
Goods and services spend of more than $5 million by ANZSIC class categories,
2016–17—continued
Class categories $ million
Electrical Services 9.7
Computer and Computer Peripheral Retailing 9.7
Professional and Scientific Goods Wholesaling 8.9
Specialist Medical Services 8.8
General Line Grocery Wholesaling 8.8
Office Administrative Services 8.2
Other Machinery and Equipment Wholesaling 7.9
Accommodation 7.8
Paper Product Wholesaling 7.6
Logging 7.4
Combined Primary and Secondary Education 7.1
Other Professional, Scientific and Technical Services 7.0
Travel Agency and Tour Arrangement Services 7.0
Other Administrative Services 6.6
Internet Publishing and Broadcasting 6.5
Site Preparation Services 6.2
Local Government Administration 6.0
Other Allied Health Services 5.9
Road Freight Transport 5.8
Architectural Services 5.7
Other Specialised Design Services 5.7
Banking 5.7
Petroleum Refining and Petroleum Fuel Manufacturing 5.6
Building and Other Industrial Cleaning Services 5.3
Source: VAGO, based on data provided by DTF, DPC, DJR, DHHS, DET, DELWP and DEDJTR.


Victorian Auditor‐General’s Report State Purchase Contracts 129
Appendix H Spend and benefits
Figures H1 and H2 show spend and benefits for 2012–13 to 2016–17 reported
by lead agencies DTF and DPC across all SPCs they lead.
Figure H1 DTF spend and benefits, 2012–13 to 2016–17
Note: Percentages may vary due to rounding.
Source: VAGO, based on DTF data.
Figure H2 DPC spend and benefits, 2012–13 to 2016–17
Note: Percentages may vary due to rounding.
Source: VAGO, based on DPC data.
$979
$1 144
$787 $823
$987
$40 $72 $56 $72 $60
4.08% 6.33%7.09%
8.71%
6.04%
0%
2%
4%
6%
8%
10%
12%
14%
0
200
400
600
800
1 000
1 200
1 400
2012–13 2013–14 2014–15 2015–16 2016–17
$ (million)
Expenditure Benefit Per cent
$309$294
$249
$307
$375
$152
$119 $122 $133
$182
49.2%
40.6%
48.9%
43.5%
48.7%
0%
10%
20%
30%
40%
50%
60%
70%
80%
0
50
100
150
200
250
300
350
400
2012–13 2013–14 2014–15 2015–16 2016–17
$ (million)
Expenditure Benefit Per cent


Auditor‐General’s reports tabled during 2017–18
Report title Date tabled
Local Government Insurance Risks (2018–19:1) July 2018
Managing the Municipal and Industrial Landfill Levy (2018–19:2) July 2018
School Councils in Government Schools (2018–19:3) July 2018
Managing Rehabilitation Services in Youth Detention (2018–19:4) August 2018
Police Management of Property and Exhibits (2018–19:5) September 2018
Crime Data (2018–19:6) September 2018
Follow up of Oversight and Accountability of Committees of Management
(2018–19:7)
September 2018
Delivering Local Government Services (2018–19:8) September 2018
Security and Privacy of Surveillance Technologies in Public Places
(2018–19:9)
September 2018
Managing the Environmental Impacts of Domestic Wastewater
(2018–19:10)
September 2018
Contract Management Capability in DHHS: Service Agreements
(2018–19:11)
September 2018
All reports are available for download in PDF and HTML format on our website
www.audit.vic.gov.au
Victorian Auditor‐General’s Office
Level 31, 35 Collins Street
Melbourne Vic 3000
AUSTRALIA
Phone +61 3 8601 7000
Email [email protected]