state rcra subtitle c core hazardous waste - astswmo
TRANSCRIPT

State RCRA Subtitle C Core Hazardous Waste
Management Program Implementation Costs
Final Report
January 2007


Acknowledgements
This document is a product of the collective work from 2001 to 2007 of the ASTSWMO Hazardous Waste Subcommittee and its comprising Task Forces, and especially that of the
Corrective Action and Permitting Task Force, the Enforcement and Compliance Assurance Task Force, and the Program Operations Task Force. Profound appreciation is
expressed to all of the Subcommittee and Task Force members who gave their time and expertise to this effort, without which this report would not have been possible.

Page 1 of 90
Table of Contents
I. Executive Summary .................................................................................. 2
II. Project Background................................................................................... 6 III. Data Collection, Presentation, Calculation Methodology
and Underlying Assumptions............................................................... 10 IV. Representativeness of Pilot State Programs and National
Scalability of Pilot Data ....................................................................... 14 V. Pilot State Results ..................................................................................... 18
VI. Summary, Conclusions, and Recommendations....................................... 26
Appendix I - Identification of Core Program Elements............................ 34 Appendix II - Process Methodology......................................................... 68 Appendix III - Pilot State Results ............................................................. 80

State RCRA Subtitle C Core Program Implementation Costs Final Report - January 2007
Page 2 of 90
I. Executive Summary At the direction of the ASTSWMO Board of Directors, the ASTSWMO Hazardous Waste Subcommittee has evaluated the RCRA Subtitle C Program (hereafter referred to as “RCRA C” or “RCRA” in this report) administered by States to determine the nature and costs of implementing a complete and adequate Program. As a part of this effort, the Subcommittee and its Task Forces have identified the major components of the RCRA C Core Program, established a consistent methodology for collecting program implementation cost information, and collected detailed cost information from ten States as a pilot study to estimate the national cost of implementing the RCRA C Core Program. The RCRA C Core Program consists of permitting, remediation (closure, corrective action), compliance, enforcement, and program development activities. Through the pilot study, it was determined that the total program need for implementing the RCRA C Core Program in the ten pilot States is approximately $51,000,000 annually, and the current national program need for the fifty States is estimated to be approximately $255,000,000 annually. However, it is also noted that, due to the increasing emphasis on timely completion of remediation and other activities at the majority of Government Performance and Results Act (GPRA) facilities, it is anticipated that this estimated cost may in fact be lower than the actual cost of the RCRA C Core Program. For example, the permitting focus has historically been on issuance and reissuance of permits as related to meeting the GPRA goals for permitting and “approved controls in place.” Based on this cost estimation project, it is now abundantly clear that State program costs to modify and maintain hazardous waste permits comprise a significant portion of State RCRA C Core budgets. These costs will continue to be significant long after the number of permitted facilities has plateaued. These program elements are significant in that they have not historically been discussed or specifically funded as part of the State/EPA planning and negotiation process in many States. As a second example, this cost estimation project clearly highlights the need for ongoing consideration of State oversight costs for long-term stewardship at remediation facilities. The current remediation focus is on remedy decisions and construction completion related to meeting the mid-term GPRA goals for corrective action. While there may be some facilities that are able to exit the corrective action universe once remedy construction is complete, there will be a large number of facilities that will continue to operate remedies for years if not decades before corrective action can be considered complete. This must be considered in the context of future long-term funding for State RCRA C Core programs. As a third example, since the genesis of the original GPRA Environmental Indicator (EI) evaluations, several additional RCRA C performance measures have been developed by EPA in coordination with the States, and others are under development/consideration. Similar to EIs, State resources necessary to address/document these new performance measures are expected to be significant. The costs associated with these new activities were not estimated as part of this evaluation as the performance measures were not developed well enough at the time of

State RCRA Subtitle C Core Program Implementation Costs Final Report - January 2007
Page 3 of 90
estimation to come up with associated costs. Based on States’ experiences with the EI evaluations, it is certainly plausible that the additional costs associated with the new performance measures alone could add another 2-3% to the overall cost of State RCRA C Core programs. These potential costs should be kept in mind as future State resource and funding needs are evaluated. As a fourth example, the pilot State results show that a significant portion of the inspection and enforcement budgets are expended conducting inspections and enforcement at Small Quantity Generator (SQG) and Conditionally Exempt Small Quantity Generator (CESQG) facilities, which greatly outnumber Large Quantity Generator (LQG) and Treatment, Storage and Disposal (TSD) facilities. However, these facilities have historically been funded at a fraction of the cost of LQG and TSD facilities, which likely accounts for a large portion of the funding gap in these program areas. The actual costs of inspection and enforcement at these smaller facilities should be kept in mind as future State resource and funding needs are evaluated. Using a required 25% State match for federal grants, it would appear that States should be contributing approximately $64,000,000 toward this estimated annual program cost, and the federal grants should account for approximately $191,000,000 for an adequate and effective program. However, this is not the case. A separate data collection project by the Hazardous Waste Subcommittee shows that, for FY06, States estimated their hazardous waste program costs (including both federal and non-federal sources of funding) to be approximately $189,000,000. Compared against the enacted federal RCRA C State/Tribal Assistance Grant (STAG) funding level of approximately $101,000,000, this indicates that States are currently contributing approximately $87,000,000 toward the core hazardous waste program in their efforts to ensure program effectiveness. Clearly, additional resources are needed to fully fund the RCRA C program. However, the proposed FY07 RCRA C STAG appropriation (approximately $101,000,000) will again fall far short of the needed level. Overall, EPA currently provides only about 40% of the total funds necessary for States to run complete and adequate RCRA C programs. Many States do not have significant State matching funds for their RCRA C programs. For a number of years, State RCRA C Core Grants have been either stagnant or decreasing. The grants have not kept pace with inflation, increases in worker salaries, increases in health insurance costs or increasing workloads associated with State authorization of additional program elements, regulations, and tasks required by EPA. This has required States to look to other sources for funding. Some States have been fortunate and have been able to supplement their program funding through permitting fees, cost recovery/ reimbursement for permitting and remediation oversight, disposal and generator fees, and through other means. Some States receive State general revenue funds. Other States are not as fortunate and have to rely almost entirely on the RCRA C Core Grant. A few years ago, when the economy had a down turn, those States relying on State general revenue funding had to suffer program cuts. Given the steep learning curve and substantial workload in the RCRA C permitting and remediation programs, these cuts in staffing create long term issues related to overall program efficiency and effectiveness.

State RCRA Subtitle C Core Program Implementation Costs Final Report - January 2007
Page 4 of 90
These data point to two fundamental conclusions: The professionals who are responsible for day-to-day implementation believe that the
currently available federal and State resources provide only about 74% of what is needed to run an effective and adequate RCRA C Core Program. This doesn’t consider important new initiatives such as Sustainability and the Resource Conservation Challenge.
The shortfall in federal funding to run effective and adequate RCRA C Core Programs is
approximately $90 million. States are already providing 46% of the program’s currently available resources; and 34% of what State managers believe is needed. If additional federal resources are not forthcoming, EPA should work with State officials to redefine the expectations for State programs. There needs to be funding necessary to protect public health and the environment and fulfill statutory requirements. All requirements that do not meet those criteria should be eliminated unless adequate funding is provided to pay for them.
If States are to continue to meet the increasingly challenging national goals for the RCRA C Core Program set by EPA and the Office of Management and Budget (OMB), and to satisfactorily meet the reasonable expectations of the public that these programs will be implemented in a manner which ensures continued protection of human health and the environment, these conclusions must be addressed. To do nothing will only exacerbate the current funding gap and further erode the national capacity to prevent harmful releases of hazardous constituents to the environment, as well as the capacity to clean up those releases which have occurred in the past.

Page 5 of 90

State RCRA Subtitle C Core Program Implementation Costs Final Report - January 2007
Page 6 of 90
II. Project Background In 2001, the ASTSWMO Board of Directors, as part of the 2001 ASTSWMO Strategic Plan, asked the Hazardous Waste Subcommittee to prepare an issue paper on funding for State and territorial RCRA C programs. The purpose was to document the actual costs of implementing a RCRA C Core Program by the States to enable better understanding and communication of resource and funding requirements necessary to maintain an effective RCRA C Core Program. From the 1990’s through 2001, it had been observed that the work needed to implement the RCRA C program was expanding as funding was leveling off or, in more recent years, going down. It was generally understood that the States’ level of effort (FTE) needed to implement the RCRA C program exceeded the RCRA C grant funding. As work began on the issue paper, it became obvious that the Subcommittee would first have to identify the components which comprise the RCRA C Core Program to be able to quantify costs and to draw comparable data from different States. In 2002, the ASTSWMO Board of Directors directed the Hazardous Waste Subcommittee to determine the “core” set of program components associated with the RCRA C Program and to develop a methodology for States to use to calculate the real costs associated with administering State RCRA C programs. To accomplish this goal, the Hazardous Waste Subcommittee tasked the Corrective Action and Permitting (CAP) Task Force to determine the “core” set of program elements and methodology associated with RCRA C permitting and remediation (corrective action and closure); and the Hazardous Waste Enforcement and Compliance Assurance (ECA) Task Force to determine the “core” set of program elements and methodology associated with RCRA C inspections and enforcement. Four reports and associated cost estimation spreadsheets were developed by the CAP and ECA Task Forces. These reports and spreadsheets were submitted to the ASTSWMO Board of Directors in 2004: State Cost Analysis Methodology for Permitting, State Cost Analysis Methodology for Remediation (Closure and Corrective Action), State Cost Analysis Methodology for RCRA Inspections, and State Cost Analysis Methodology for RCRA Enforcement. These reports identified: 1) the core program elements for permitting, closure, corrective action, compliance and enforcement activities; and 2) data collection requirements for unit personnel costs, unit activity time requirements, unit overhead costs and number of activities per year. Upon review of these reports, the Board requested that the Subcommittee add program development activities to the core program model. (See definition below.) This work was assigned to the Program Operations (PO) Task Force, and core program elements and methodology for this program area were developed and presented in the 2004 report: State Cost Analysis Methodology for Program Development. Each program area model was tested and validated by the responsible Task Force. Beta testing and model development were completed in late 2004.
State RCRA Subtitle C Core Program Implementation Costs Final Report - January 2007
Page 7 of 90
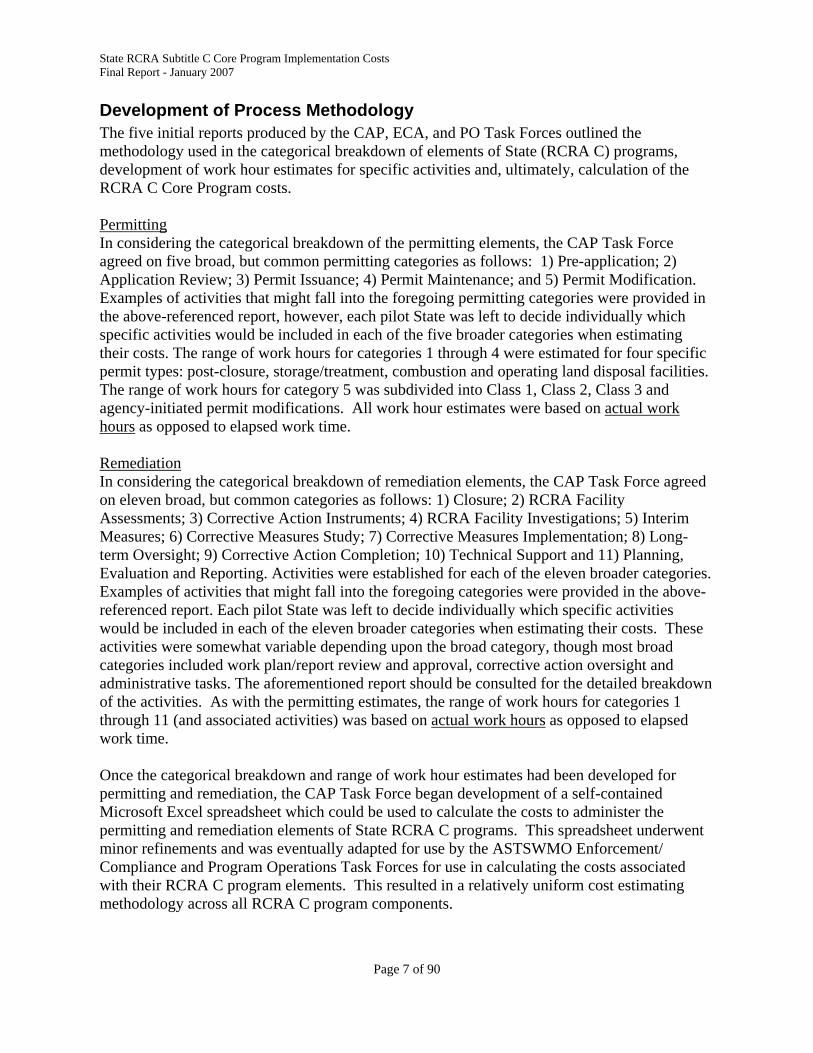
Development of Process Methodology The five initial reports produced by the CAP, ECA, and PO Task Forces outlined the methodology used in the categorical breakdown of elements of State (RCRA C) programs, development of work hour estimates for specific activities and, ultimately, calculation of the RCRA C Core Program costs. Permitting In considering the categorical breakdown of the permitting elements, the CAP Task Force agreed on five broad, but common permitting categories as follows: 1) Pre-application; 2) Application Review; 3) Permit Issuance; 4) Permit Maintenance; and 5) Permit Modification. Examples of activities that might fall into the foregoing permitting categories were provided in the above-referenced report, however, each pilot State was left to decide individually which specific activities would be included in each of the five broader categories when estimating their costs. The range of work hours for categories 1 through 4 were estimated for four specific permit types: post-closure, storage/treatment, combustion and operating land disposal facilities. The range of work hours for category 5 was subdivided into Class 1, Class 2, Class 3 and agency-initiated permit modifications. All work hour estimates were based on actual work hours as opposed to elapsed work time. Remediation In considering the categorical breakdown of remediation elements, the CAP Task Force agreed on eleven broad, but common categories as follows: 1) Closure; 2) RCRA Facility Assessments; 3) Corrective Action Instruments; 4) RCRA Facility Investigations; 5) Interim Measures; 6) Corrective Measures Study; 7) Corrective Measures Implementation; 8) Long-term Oversight; 9) Corrective Action Completion; 10) Technical Support and 11) Planning, Evaluation and Reporting. Activities were established for each of the eleven broader categories. Examples of activities that might fall into the foregoing categories were provided in the above-referenced report. Each pilot State was left to decide individually which specific activities would be included in each of the eleven broader categories when estimating their costs. These activities were somewhat variable depending upon the broad category, though most broad categories included work plan/report review and approval, corrective action oversight and administrative tasks. The aforementioned report should be consulted for the detailed breakdown of the activities. As with the permitting estimates, the range of work hours for categories 1 through 11 (and associated activities) was based on actual work hours as opposed to elapsed work time. Once the categorical breakdown and range of work hour estimates had been developed for permitting and remediation, the CAP Task Force began development of a self-contained Microsoft Excel spreadsheet which could be used to calculate the costs to administer the permitting and remediation elements of State RCRA C programs. This spreadsheet underwent minor refinements and was eventually adapted for use by the ASTSWMO Enforcement/Compliance and Program Operations Task Forces for use in calculating the costs associated with their RCRA C program elements. This resulted in a relatively uniform cost estimating methodology across all RCRA C program components.

State RCRA Subtitle C Core Program Implementation Costs Final Report - January 2007
Page 8 of 90
Enforcement and Compliance Using a similar process to those described above for the CAP Task Force, the ECA Task Force analyzed the RCRA C compliance and enforcement processes to determine the core program elements. The reports resulting from this review outlined a standard methodology for the collection of costs for inspection and enforcement using the following categories: Conditionally Exempt Small Quantity Generators (CESQGs), Small Quantity Generators (SQGs), Large Quantity Generators (LQGs), Treatment, Storage, and Disposal Facilities (TSDs), Complaints, EPA Lead Facilities, and Transporters. The activities reviewed to determine the costs associated with the inspection and enforcement elements for each category are given below:
1) RCRA Inspections -- file review; on-site safety/sampling plans; securing field equipment; coordinating with other agencies; travel time to and from inspection site; conducting facility entrance/exit interviews; conducting on-site inspections; reviewing company records; conducting sampling; reviewing applicable regulations; inspection report preparation; finalizing and distributing inspection reports; completing data input; and enforcement referrals.
2) RCRA Enforcement -- case evaluation/determination; case referral; case development;
case negotiation; case resolution; case support and follow-up. Program Development Similarly, the PO Task Force analyzed the balance of the RCRA C program not specifically included under remediation (closure, corrective action), permitting, inspections, or enforcement, and identified the core program elements related to program development. The report resulting from this review outlined a standard methodology for the collection of costs related to program development, which included: 1) Grant/Workplan Activities; 2) Regulatory Analysis of Federal Hazardous Waste Regulations; 3) State Legislative Activities; 4) Rulemaking; 5) Outreach/ Guidance/Policy Development; 6) Development of Revised Authorization Applications; 7) RCRA Hazardous Waste Data Management; and 8) Innovative Projects.
Ten-State Pilot Study In late 2004, the ASTSWMO Board of Directors requested that a pilot study take place wherein the methodology developed in 2004 would be used to collect data on actual costs of implementing a complete and adequate State RCRA C Core Program. Beginning in early 2005, ten States volunteered to perform the analysis: Alabama, Colorado, Florida, Georgia, Idaho, Illinois, Maryland, Missouri, New York, and Rhode Island. The pilot States were asked to focus on what funding is needed to run what the State considered to be a complete and adequate RCRA C Core Program, not what is currently provided by the State budget and/or the EPA grant. The overarching objective was to simply determine the total cost to run the State RCRA C Core Program. The estimated costs are State program costs only and do not consider those elements of the RCRA C Core Programs that continue to be administered by EPA.

State RCRA Subtitle C Core Program Implementation Costs Final Report - January 2007
Page 9 of 90
The compilation of the data by the pilot States was completed in March 2006. The pilot States requested that they not be individually identified; hence, the States are randomly identified as States 1-10 throughout this analysis. The information collected provides a basis for RCRA C Core Program cost discussions.

State RCRA Subtitle C Core Program Implementation Costs Final Report - January 2007
Page 10 of 90
III. Data Collection, Presentation, Calculation Methodology and Underlying Assumptions
Permitting and Corrective Action The ten pilot States took various approaches to data collection and presentation for RCRA C permitting and remediation. Some of these approaches were quite detailed while others were not. For example, some States circulated the categorical activity and subactivity information to project managers and asked those managers to estimate the range of working hours required to do certain activities across the universe of their assigned sites. This typically included consideration of simple versus complex sites across the range of the National Corrective Action Prioritization System (NCAPS) priorities (high, medium and low). The individual project manager results across the various categories/subactivities were then compiled to generate an overall range of working hours (low to high) for each activity in that State. These hours were then plugged into the cost estimating spreadsheet that automatically calculated an arithmetic average working hours figure. The exact process followed in each State to generate the work hour estimates is not described herein and in some cases, was not provided by the State. States providing the estimates have indicated that the estimates are technically defensible, have an adequate basis of support, and greater detail regarding the data collection process can be provided, if necessary. Approaches to collection of employee salary information and use of State-specific multipliers in the cost calculation also varied from State to State. Some States established a range of hourly rates based on the salaries of the lowest and highest paid individuals performing work in each of the subject categories divided by the number of work hours in a calendar year. Weighted average hourly rates were then calculated by averaging the salaries of all individuals performing work in each of the subject categories. Some States then used a State-specific multiplier to account for overhead, fringe, clerical, administrative, legal/supervisory support, etc. in the estimation of costs. Other States had established hourly rates that already considered direct and indirect costs. In these cases, the established hourly rate was used directly for cost estimation without the benefit of a multiplier. As with the work hour estimates, the exact process followed in each State to generate the salary rates and multipliers is not described herein and is, in some cases, not fully known. States providing the salary and multiplier information have indicated that the information is accurate, has an adequate basis of support, and greater detail regarding the calculation of hourly rates and multipliers can be provided, if necessary. In terms of the final permitting and remediation costs, some States provided detailed estimates for all categories and subactivities while others chose to present their estimates in the aggregate. Nine of ten States provided detailed (subactivity) estimates for permitting while one State chose to simply provide a gross estimate for permitting as a whole. On the remediation side, four States provided detailed (subactivity) estimates, five provided total (categorical) estimates and one simply provided a gross estimate for remediation as a whole. Eight of ten States provided low, average and high estimates for permitting and remediation. Two States provided only average estimates for permitting and remediation.

State RCRA Subtitle C Core Program Implementation Costs Final Report - January 2007
Page 11 of 90
Inspections and Enforcement The overall methodology for inspection and enforcement data collection is the same as described above for permitting and remediation. In evaluating the submitted data, two States were contacted for data clarification. State 1 had two different columns for annual number of activities. The “annual number of activities” for State 1 was combined and averaged. State 2 did not supply the “annual number of activities,” rather it provided a dollar amount for inspections, compliance assistance and enforcement. The dollar amount for compliance assistance included inspections, training for generators, other training, and approximately ¾ of a full time employee to provide assistance over the phone. State 2 was contacted and provided the information for “annual number of activities” for both inspections and enforcement actions. For this report, the total amount from inspections and compliance assistance was combined and weighted equally for TSDFs, LQGs, SQGs, CESQGs, and complaints. There were no EPA lead inspections. For enforcement, the total dollar amount was weighted equally for all but transporters and EPA lead inspections for which no enforcement actions were taken. Some States added activity categories in an effort to more accurately reflect a comprehensive program (e.g., 5-year frequency for each SQG and LQG, complaint investigations on the inspection table, and hazardous waste transporter licensing and manifest review on the enforcement table). These States were contacted to provide additional clarification of those activities in order to appropriately include them within the standard activities identified in the process methodology. Several States used an adjustment factor when computing the “Gross Annual Cost (avg.)” rather than just an arithmetic average between the “Gross Annual Cost (high)” and “Gross Annual Cost (low)”. One reason given was that the average was still high when compared to the State’s current budget. Several States provided one cost rather than a high, low, and average. Based on the information provided, an arithmetic average was calculated and then compared to the “Gross Annual Cost (avg.).” The difference between the arithmetic average and the “Gross Annual Cost (avg.)” was approximately $600,000 for inspections and $50,000 for enforcement. This equates to an approximate 9% difference between the arithmetic average and the “Gross Annual Cost (avg.)” with the arithmetic average being the higher. In this report, the “Gross Annual Cost (avg.)” was used. The Task Force believed that the “Gross Annual Cost (avg.)” addressed the States’ concern about over-estimating the costs. For complaints and EPA lead facilities, there are State costs only associated with the inspections. For EPA lead inspections, the enforcement would have been taken by the State and there was not a separate category for “enforcement actions as a result of an EPA lead inspection.” For complaints, the States tracked time spent on a complaint inspection but any enforcement action was covered by the generator category of the “complaint” facility.

State RCRA Subtitle C Core Program Implementation Costs Final Report - January 2007
Page 12 of 90
Program Development Data were provided by ten States on eight different data sets comprising the Program Development activities. These data sets were: Grant Work Plan Activities, Regulatory Analysis of Federal Hazardous Waste Regulations, State Legislative Activities, Rulemaking, Outreach, Guidance and Policy Development, Development of Revised Authorization Applications, RCRA Hazardous Waste Data Management, and Innovative Projects. In addition, each of these data sets was comprised of individual activities that the States undertake in association with the data sets. Seven of the ten States chose not to calculate costs for these individual activities, but rather determined costs for the data set as a whole. Several States used an adjustment factor when computing the “Gross Annual Cost (avg.)” rather than just an arithmetic average between the “Gross Annual Cost (high)” and “Gross Annual Cost (low)”. States were instructed to assemble their analyses using baseline funding from EPA as the “low” range of costs and the level of funding that they have needed to provide “above and beyond” EPA’s baseline as the “high” range value. Some of the States did not utilize this strategy, but provided only one average cost for the entire data set rather than a high, low, and average cost. Based on the information provided, an arithmetic average was calculated and then compared to the “Gross Annual Cost (avg.).” The difference between the arithmetic average and the “Gross Annual Cost (avg.)” was remarkably small, a total of approximately $6,000. This equates to less than a one percent difference between the arithmetic average and the “Gross Annual Cost (avg.)”. For the purposes of this report, Gross Annual Cost (average) is used. Many of the data sets in Program Development are not based on hard numbers and are much less specific than, for example, inspections and enforcement, where there are a definite number of inspections conducted and enforcement actions taken. In Program Development, we are trying to put a cost on items such as the amount of time it takes to develop a work plan or comment on a proposed rule. These activities do not lend themselves to critical fiscal analysis. It is very difficult for States to estimate the amount of time spent on these activities both by their own staff and other staff that may be located outside of the State environmental agency, such as in the Attorney General’s Office.
Summary The specific method a given State used to determine its RCRA C Core Program cost varied to some degree, but this was expected, since the data collection methodology by design allowed this flexibility. Based on the development work by the Task Forces, it was recognized during the development process that time and financial accounting systems, program organization, and program management vary from State to State. Therefore, the objective was to design a data collection process that was flexible enough to embrace this variability, yet obtain the needed data for the various program costs in a manner that could be reasonably analyzed and from which programmatic conclusions could be derived. The Hazardous Waste Subcommittee believes this objective has been accomplished, and that the results of this pilot study report do attest to the state of the overall funding situation related to the RCRA C Hazardous Waste Program.

Page 13 of 90

State RCRA Subtitle C Core Program Implementation Costs Final Report - January 2007
Page 14 of 90
IV. Representativeness of Pilot State Programs and National Scalability of Pilot Data
A number of the pilot States’ RCRA C Core Program components were evaluated on a national level to determine whether the pilot State data could be used to develop a national estimate of the amount of funds needed to implement the RCRA C Core Program. Ten States from eight EPA Regions participated in the pilot study. EPA Regions 6 and 9 were not represented and Region 4 was represented by three States. The components evaluated to assess the scalability and representative nature of the ten-State pilot data are:
1. GPRA Baseline Universes (i.e., corrective action and permitting), 2. The number of facilities per universe (i.e., TSD, LQG, SQG, CESQG), 3. Compliance/enforcement activities (i.e., inspections, enforcements (all), orders,
penalties), and 4. State population and land area.
The GPRA universe information for corrective action and permitting was obtained from the Office of Solid Waste, Headquarters, U.S. EPA. Facility universe and State compliance/ enforcement activity information was collected directly from RCRAInfo or indirectly through RCRA C databases such as Region 1’s RCRA Rep and Region 6’s penalty reports which are populated from RCRAInfo. The population and the land area of the pilot States was collected from the U.S. Census Bureau, 2000 census. TABLE 1 summarizes how the program components contributed by the pilot States, as a group, compare on a national level. State-specific information pertaining to each of the program components is given in TABLES 2 to 4.

State RCRA Subtitle C Core Program Implementation Costs Final Report - January 2007
Page 15 of 90
TABLE 1 – Pilot State Representativeness
Program Component
Percentage (%) of national program com-ponent universe contributed to pilot States
GPRA Baseline Universes
2005 Corrective Action Baseline 22
2008 Corrective Action Baseline 21
2020 Corrective Action Baseline (draft) 21
2006 Permitting Baseline 22
Facility Type Universes
TSD 19
LQG 33
SQG 32
CESQG 21
Compliance/Enforcement Activities
Inspections 25
Enforcement (All) 26
FY05 Orders 30
Penalties - Number 36
Penalties - Amount 17
Miscellaneous
Population 26
Land area 15
Number of States 20

State RCRA Subtitle C Core Program Implementation Costs Final Report - January 2007
Page 16 of 90
TABLE 2 - Facility Type Universes/Miscellaneous Metrics
TABLE 3 - GPRA Baseline Universes
State code
% of National Popula-
tion
% of U.S. Land Area
TSD LQG SQG CESQG
1 72 277 1098 2930 1.5 1.4
2 29 115 857 3521 1.5 2.9
3 80 410 15681 7 5.4 1.5
4 66 372 2067 2071 2.8 1.6
5 11 31 105 1015 0.4 2.3
6 122 4216 15352 8834 4.2 1.6
7 32 518 4903 4570 1.8 0.3
8 63 460 2581 1812 1.9 2.0
9 84 5465 10431 8771 6.5 1.3
10 2 101 2978 196 0.4 0.03
Totals 561 11965 56053 33727 26.4 14.93
Number of Facilities
State Code
2005 CA 2006 Permitting 2008 CA 2020 CA
(draft)
1 40 79 36 86
2 31 26 33 47
3 46 93 56 108
4 65 75 69 86
5 5 12 6 12
6 56 110 67 215
7 26 28 23 43
8 36 53 40 65
9 65 84 72 181
10 4 4 5 5
Totals 374 564 407 848
Number of Facilities in Universe

State RCRA Subtitle C Core Program Implementation Costs Final Report - January 2007
Page 17 of 90
TABLE 4 - Compliance/Enforcement Activities
If one assumes that each of these representativeness measures carries equal weight, this would indicate that the ten pilot States represent approximately 24% of the national program. However, given that the pilot State data indicates that more than one-half of the cost of implementing the core program is in the areas of permitting and corrective action, only about one-third is in the areas of inspections and enforcement, and several of the elements of program development are somewhat independent of the size of the program universe (e.g., authorizations, rulemaking, regulatory analysis, grant/workplan activities), it would appear more reasonable to expect that the pilot States represent 20-22% of the national program costs. For the purposes of this analysis, a representativeness figure of 20% is used.
State Code
CEI Inspections Enforcements
(All) Orders Number
of Penalties
Amount of Penalties
1 314 205 7 5 $301,000
2 277 140 25 0 $0
3 1208 979 160 164 $1,129,592
4 506 248 24 19 $143,447
5 163 61 7 4 $71,884
6 288 291 19 15 $600,645
7 107 22 5 1 $7,500
8 396 171 18 11 $340,168
9 769 403 68 39 $616,107
10 79 81 22 7 $20,470
Totals 4107 2601 355 265 $3,230,813
FY 2005 Activities

State RCRA Subtitle C Core Program Implementation Costs Final Report - January 2007
Page 18 of 90
The overall results of the ten pilot States show that in order to run a complete and adequate RCRA C Core Program, it would cost a total of approximately $51,000,000 in the ten pilot States. Since the pilot States were fairly diverse in terms of their location/demographics and thought to be representative of all 50 States, it could be extrapolated that, based on the current RCRA C Core Program workload, it would cost approximately $255,000,000 annually for all 50 States to have an effective RCRA C Core Program. However, this does not include the U.S. Territories and the percentage of their budget from the core RCRA C grant. Based upon the data collected, the overall program cost could be as much as $285,000,000 annually.
Permitting and Corrective Action The cumulative cost for the ten pilot State permitting programs was approximately $12,622,704. The cumulative cost for remediation was approximately $ 14,212,327 (Figure 1). The overall results from the ten pilot States indicate that to run a complete and adequate State RCRA C permitting and remediation program, it would cost roughly $26,875,031 annually in those ten States. The ten pilot States appear to be a fair representation of the RCRA C permit-ting and remediation programs across the country based on their geographical distribution, population, land area, program diversity and the fact that the RCRA C facilities in these States represent just over one-fifth (20%+) of those facilities listed on the national GPRA permitting and corrective action baselines. Extrapolation of costs across the fifty States from the ten State pilot data suggests that the national cost of running complete and adequate State RCRA C per-mitting and remediation programs would be roughly $134,375,155 annually.
V. Pilot State Results
Figure 1 - Ten State Pilot - Permitting and Remediation Program Costs
$12,622,70447% $14,212,327
53%
Remediation Permitting

State RCRA Subtitle C Core Program Implementation Costs Final Report - January 2007
Page 19 of 90
When compared to the overall RCRA C Core Program estimates for the ten pilot States, the cost for the permitting and remediation programs is estimated at approximately 53% of the total. This represents 25% of the overall RCRA C Core Program estimates for permitting and 28% for remediation (Figure 2).
The permitting data from the ten pilot States shows that permitting-related costs are split equally between those activities related to permit issuance/reissuance and those activities that occur once the permit is issued/reissued (Figure 3). This is significant in that State-EPA planning and budget negotiation activities often only consider the workload and costs associated with permit issuance/reissuance. This can result in significant underestimation of the resource needs for State permitting programs. This situation is further complicated by the issue of permit modifications. Unless the modifications are initiated by the State agency, States have little to no control over the class, timing, frequency and number of permit modifications that are submitted by facilities for State processing and approval. The permit modification percentage relative to both the overall permitting costs (32% of total) and the overall cost of State RCRA C Core Programs (Figure 4) is highly significant. In terms of overall State RCRA C Core Program costs, permit modifications represent the single most costly activity that States perform.
Figure 2 - Overall RCRA Core Program Costs
REMEDIATION28%
PERMITTING25%
INSPECTIONS22%
ENFORCEMENT13%
PROGRAM DEVELOPMENT
12%

State RCRA Subtitle C Core Program Implementation Costs Final Report - January 2007
Page 20 of 90
Similar to permit modifications, the cost of permit maintenance relative to both the overall permitting costs (18% of total) and the overall cost of State RCRA C Core Programs (Figure 4) is significant. The relative breakdown of permit maintenance costs for specific facilities is outlined below in Figure 5. As with permit modifications, State-EPA planning and budget
negotiation activities often fail to fully consider the workload and costs associated with permit maintenance. This can result in significant underestimation of the resource needs for State permitting programs. The remediation data from the ten pilot States shows that remediation-related costs are spread over a number of activities as depicted in Figure 6. The subdivision of expenses is essentially self-explanatory on the figure. The percentage breakdowns for the pilot States are expected to be reasonably representative of the nation as a whole. Based on States’ experiences to date and the maturity of many State RCRA C corrective action programs, it is likely that the assessment, investigation and final remedy evaluation components of remediation will be on a slow but steady decline, though it may be a few years before this decline begins to show up at the national level. Closure and interim measures activities are expected to ebb and flow in the near to mid term, but will eventually decline as facilities go through closure and put final remedies in place. Corrective measures implementation and long-term oversight of facilities will be on
Figure 3 - Permitting Program Costs
Pre-application Activities
4%Application Review
25%
Permit Issuance21%
Permit Maintenance18%
Permit Modifications32%

State RCRA Subtitle C Core Program Implementation Costs Final Report - January 2007
Page 21 of 90
Figure 5 - Annual Permit Maintenance Costs
$0.00
$2,000.00
$4,000.00
$6,000.00
$8,000.00
$10,000.00
$12,000.00
$14,000.00
$16,000.00
$18,000.00
$20,000.00
Post-closure Storage/treatment Combustion Operating LandDisposal
Figure 4 - Relative Programmatic CostsCl
osur
e
RCRA
Fac
ility A
sses
smen
ts
Corre
ctive
Acti
on In
stru
men
ts
RCRA
Fac
ility I
nves
tigat
ion
Inte
rim M
easu
res
Corre
ctive
Mea
sure
s St
udy
Corre
ctive
Mea
sure
s Im
plem
enta
tion
Long
-Ter
m O
vers
ight
Corre
ctive
Acti
on C
ompl
etion
Tech
nica
l Sup
port
Plan
ning
, Eva
luatio
n &
Repo
rting
Pre-
appl
icatio
n Ac
tivitie
s
Appl
icatio
n Re
view
Perm
it Iss
uanc
e
Perm
it M
aint
enan
ce
Perm
it M
odific
atio
ns
CESQ
G In
spec
tions
SQG
Insp
ectio
ns
LQG
Insp
ectio
ns
TSDF
Insp
ectio
ns
Com
plain
t Ins
pecti
ons
EPA
Lead
Insp
ectio
ns
Tran
spor
ter I
nspe
ction
s
CESQ
G E
nfor
cem
ent
SQG
Enfo
rcem
ent
LQG
Enfo
rcem
ent
TSDF
Enf
orce
men
t
Tran
spor
ter E
nfor
cem
ent
Gra
nt/W
orkp
lan
Activ
it ies
Reg.
Ana
lysis
of F
ed. H
W R
egs.
Stat
e Le
gisla
tive
Activ
ities
Rule
mak
ing
Out
reac
h/G
uida
nce/
Polic
y De
v.
Dev.
Rev
ised
Auth
oriza
tion
Apps
.
RCRA
HW
Dat
a M
anag
emen
t
Inno
vativ
e Pr
ojec
ts

State RCRA Subtitle C Core Program Implementation Costs Final Report - January 2007
Page 22 of 90
the increase over the long-term as final remedies are selected and implemented and States put in place long-term stewardship plans for such sites. This programmatic evolution will require continued long-term funding to ensure that remedies are optimized, institutional and engineering controls are maintained, and remedial goals are met. Of further significance, relative to State RCRA C permitting and corrective action budgets, is the recent proliferation of performance standards development, driven chiefly by the federal Government Performance and Results Act (GPRA) of 1993. The GPRA mandated that EPA establish performance standards to show progress in remediating and protecting human health and the environment at RCRA C facilities. Many States’ first experiences with these performance standards were the Environmental Indicator (EI) evaluations. Based on the information collected during the 10 State pilot, the resources necessary to prepare EI evaluations were estimated to comprise roughly 1% of the overall cost of State RCRA C Core Programs. This is only a rough approximation across the range of pilot States. The EI preparation cost as a percentage of the overall RCRA C budget in individual States may have been considerably higher (or lower) depending upon the level of effort expended in those States to complete the EI evaluations. Since the genesis of the EI evaluations, several additional RCRA C performance measures have been developed by EPA in coordination with the States, and others are under development/consideration. These new performance measures relate to issuing remedy decisions (CA400), remedy construction [both completion of physical remedy construction (CA550) and how efficiently that construction is completed (OMB efficiency measure)] and land revitalization. Compounding the State concerns related to these measures is the fact that the universe of sites to which these measures may be applied continues to grow as the number of RCRA C facilities on the corrective action GPRA baseline list continues to grow. Similar to the EIs, State resources necessary to address/document these new performance
Figure 6 - Remediation Program Costs
Closure5% Corrective Action
Instruments 2%
RCRA Facility Investigation
26%
Interim Measures16%
Corrective Measures Study13%
Corrective Measures Implementation
13%
Long-Term O versight7%
Corrective Action Completion
1%
Technical Support5%
Planning, Evaluation & Reporting
8%RCRA Facility Assessments
4%
State RCRA Subtitle C Core Program Implementation Costs Final Report - January 2007
Page 23 of 90
measures are expected to be significant. The costs associated with these new activities were not estimated as part of this evaluation as the performance measures were not developed well enough at the time of estimation to come up with associated costs. Based on States’ experiences with the EI evaluations, it is certainly plausible that the additional costs associated with the new performance measures could add another 2-3% to the overall cost of State RCRA C Core Programs. These potential costs should be kept in mind as future State resource and funding needs are evaluated.
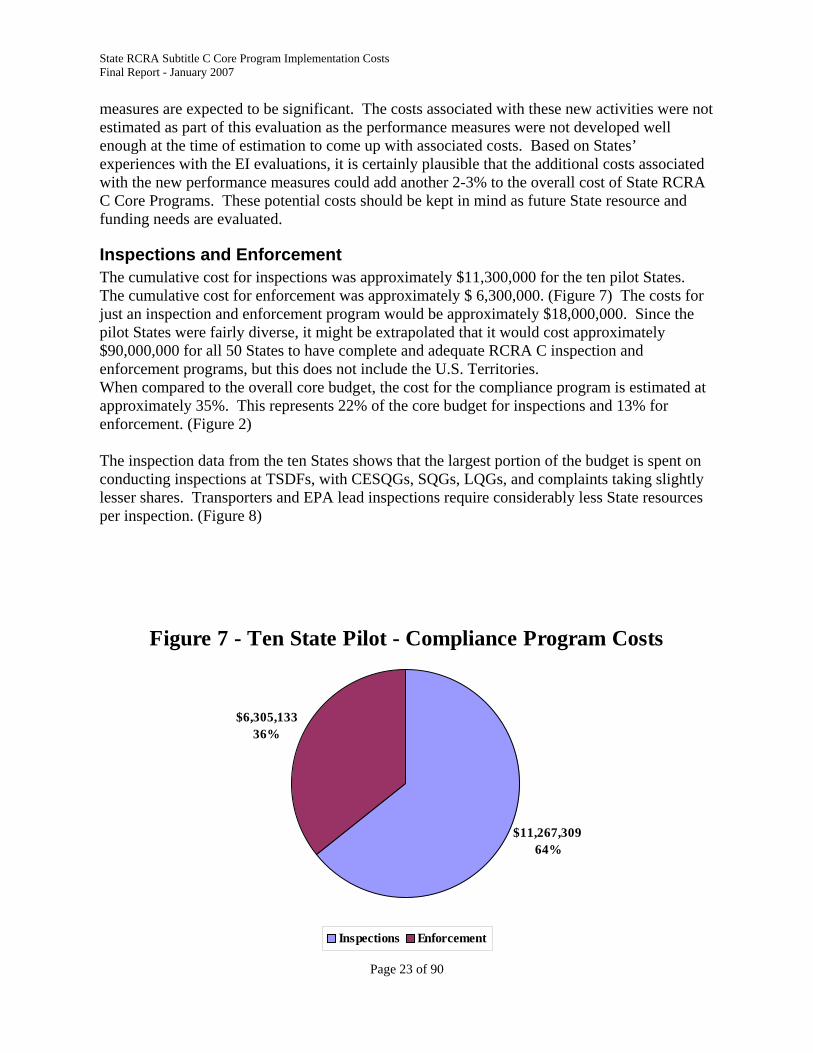
Inspections and Enforcement The cumulative cost for inspections was approximately $11,300,000 for the ten pilot States. The cumulative cost for enforcement was approximately $ 6,300,000. (Figure 7) The costs for just an inspection and enforcement program would be approximately $18,000,000. Since the pilot States were fairly diverse, it might be extrapolated that it would cost approximately $90,000,000 for all 50 States to have complete and adequate RCRA C inspection and enforcement programs, but this does not include the U.S. Territories. When compared to the overall core budget, the cost for the compliance program is estimated at approximately 35%. This represents 22% of the core budget for inspections and 13% for enforcement. (Figure 2) The inspection data from the ten States shows that the largest portion of the budget is spent on conducting inspections at TSDFs, with CESQGs, SQGs, LQGs, and complaints taking slightly lesser shares. Transporters and EPA lead inspections require considerably less State resources per inspection. (Figure 8)
Figure 7 - Ten State Pilot - Compliance Program Costs
$6,305,13336%
$11,267,309 64%
Inspections Enforcement

State RCRA Subtitle C Core Program Implementation Costs Final Report - January 2007
Page 24 of 90
The enforcement data from the ten States shows that the largest portion of the budget is spent on conducting enforcement at SQGs, followed closely by LQGs, then TSDFs, CESQGs and transporters. (Figure 9) When comparing just the inspection and enforcement program, EPA provides, on average, approximately 45% of the ten pilot States’ budget. When extrapolating for all 50 States, EPA provides approximately 37% of the estimated $90,000,000 annually needed to run a complete and adequate RCRA C inspection and enforcement program.
Figure 8 - Inspection Program Costs
0%
5%
10%
15%
20%
25%
30%
CESQ G SQ G LQ G TSDF Complaint EPA Lead Transporter
Figure 9 - Enforcement Program Costs
0%
5%
10%
15%
20%
25%
30%
CESQ G SQ G LQ G TSDF Transporter

State RCRA Subtitle C Core Program Implementation Costs Final Report - January 2007
Page 25 of 90
Program Development The overall results of the ten States surveyed show that it would cost a total of approximately $6,000,000 annually to run a complete and adequate Program Development portion of a RCRA C hazardous waste program . Since the pilot States were fairly diverse, it might be extrapolated that it would cost approximately $30,000,000 annually for all 50 States to adequately fund the Program Development portion of the RCRA C program. The data from the ten States show that the overwhelming majority (55%) of the Program Development budget is spent on RCRA Hazardous Waste Data Management. (Figure 10) Rulemaking is the second most costly activity in the Program Development arena, at less than a third of the amount spent on RCRA Hazardous Waste Data Management. In fact, RCRA Hazardous Waste Data Management tied with permit application review as the second most costly function of implementing a State RCRA program. (Figure 4) EPA puts a premium on data management activities, as they are the source of all information in the RCRA C universe. Information on RCRA C programmatic activities being conducted in the States is essential to EPA’s accountability efforts. Considering the importance to EPA of these endeavors, it is clear that EPA funding for these critical activities does not match the resources being expended by the States to conduct them. EPA needs to recognize the importance of RCRA Data Management and other Program Development activities and fund them appropriately.
Figure 10 - Program Development Costs
RCRA HW Data Management
55%
Innovative Projects8%
Development of Revised
Authorization Applications
5%
Outreach/Guidance/Policy Development
4%
Rulemaking15%
Regulatory Analysis of Federal HW
Regulations4% State Legislative
Activities2%
Grant/Workplan Activities
7%

State RCRA Subtitle C Core Program Implementation Costs Final Report - January 2007
Page 26 of 90
VI. Summary, Conclusions, and Recommendations
Permitting and Corrective Action The estimates for permitting and corrective action included in this report are for complete and adequate State programs. The low and high estimates are generally indicative of the range of facility types (simple versus complex) and the corresponding level of activity associated with the tasks performed at those types of facilities. In any given year, a State’s “average” cost can be expected to go up or down within the range depending upon the types of facilities being worked on and the corresponding nature and number of tasks performed. It is also expected that State permitting and corrective action program costs for more “robust” State programs would tend towards the upper (high) end of the estimation range, and that such programs may necessarily require more direct State funding to remain “robust” absent additional federal funding from EPA. This cost estimation project clearly highlights the need for ongoing consideration of long-term funding of the State program costs related to permit modifications and maintenance. Historically, the permitting focus has been on issuance and reissuance of permits as related to meeting the GPRA goals for permitting and “approved controls in place.” Based on this cost estimation project, it is now abundantly clear that State program costs to modify and maintain hazardous waste permits comprise a significant portion of State RCRA C Core budgets. As long as the universe of permitted RCRA C facilities continues to grow, so will the State costs associated with permit modifications and maintenance. These costs will continue to be significant long after the number of permitted facilities has plateaued. These program elements are significant in that they have not historically been discussed or specifically funded as part of the State/EPA planning and negotiation process in many States. Systematic failure to address these program elements in any comprehensive fashion is likely rooted in the fact that States have little to no control over the nature and timing of most facility-initiated permit modifications. States are only able to deal with the reality that permit modifications will be submitted by facilities and, once received, will have to be prioritized for action. Similar to funding for permit modifications and maintenance, this cost estimation project clearly highlights the need for ongoing consideration of State oversight costs for long-term stewardship at remediation facilities. The current remediation focus is on remedy decisions and construction completion related to meeting the mid-term GPRA goals for corrective action. The universe of facilities to which these goals apply continues to grow as the GPRA baseline continues its evolutionary growth from 2005 to 2008 to 2020. As long as the universe of RCRA C facilities operating final remedies continues to grow, so will the State costs associated with long-term stewardship at such facilities. Based on the current number of facilities with final remedies in place, it seems clear that we have not yet reached the point beyond which the number of annual remedy decisions will begin to decrease. This point is likely a few years down the road. Of course there will be a natural transition of program resources and overall focus when moving from active investigation, evaluation of remedial alternatives and construction of final remedies to long-term oversight and optimization of remedies. The message here is that future funding of State programs must consider this evolution. Similar to

Page 27 of 90
the GPRA goals for Environmental Indicators, the GPRA remedy decision and construction completion goals are simply mileposts along the way to the ultimate objective of facility-wide corrective action completion. The need for State RCRA C funding for corrective action does not magically disappear once a final remedy is selected and implemented. While there may be some facilities that are able to exit the corrective action universe once remedy construction is complete, there will be a large number of facilities that will continue to operate remedies for years, if not decades, before corrective action can be considered complete. This must be considered in the context of future long-term funding for State RCRA C Core programs. Since the genesis of the EI evaluations, several additional RCRA C performance measures have been developed by EPA in coordination with the States, and others are under development/ consideration. These new performance measures relate to issuing remedy decisions (CA400), remedy construction [both completion of physical remedy construction (CA550) and how efficiently that construction is completed (OMB efficiency measure)] and land revitalization. The universe of facilities to which these measures may be applied expands as the number of RCRA C facilities on the corrective action GPRA baseline list continues to grow. Similar to the EIs, State resources necessary to address/document these new performance measures are expected to be significant. The costs associated with these new activities was not estimated as part of this evaluation as the performance measures were not developed well enough at the time of estimation to come up with associated costs. Based on States’ experiences with the EI evaluations, it is certainly plausible that the additional costs associated with the new performance measures could add another 2-3% to the overall cost of State RCRA C Core programs. These potential costs should be kept in mind as future State resource and funding needs are evaluated. Based on the pilot results, the cost of running complete and adequate RCRA C permitting and remediation programs in the ten pilot States is approximately $27,000,000 annually. Extrapolated across all fifty States, the cost would be approximately $135,000,000 annually for just the State RCRA C permitting and remediation portion of the RCRA C Core program. Accounting for the 25% State match, EPA’s entire FY06 enacted HW STAG for all 50 States is just what is needed to have a complete and adequate 50-State RCRA C permitting and remediation program without even considering funding of the inspection, enforcement and program development portions of the RCRA C Core Program.
Inspections and Enforcement Based on the results of the pilot States, the cost of running a RCRA C inspection and enforcement program is approximately $18,000,000. If extrapolated for all 50 States, it would cost a total of $90,000,000 for just the RCRA C inspection and enforcement portions of the core program. EPA’s entire FY06 enacted HW STAG for all 50 States was just over $100,000,000. This would mean that approximately 90% of the total grant would be needed to have just a complete and adequate RCRA C inspection and enforcement program. That would leave only 10% for the funding of the permitting, remediation and program development portions of the RCRA C Core Program. The pilot State results show that a significant portion of the inspection and enforcement budgets are expended conducting inspections and enforcement at SQG and CESQG facilities, which

State RCRA Subtitle C Core Program Implementation Costs Final Report - January 2007
Page 28 of 90
greatly outnumber LQG and TSD facilities. However, these facilities have historically been funded at a fraction of the cost of LQG and TSD facilities, which likely accounts for a large portion of the funding gap in these program areas. The actual costs of inspection and enforcement at these smaller facilities should be kept in mind as future State resource and funding needs are evaluated.
Program Development It is estimated that Program Development activities account for approximately 12% of the total State RCRA C program costs. However, the Program Development portion of the RCRA C Core Project is much different than the other program areas in the project. Many of the data sets in Program Development are not based on hard numbers and are much less specific than, for example, inspections and enforcement, where there are a definite number of inspections conducted and enforcement actions taken. In Program Development, the RCRA C Core Project seeks to put a cost on items such as the amount of time it takes to develop a work plan or comment on a proposed rule. These activities do not lend themselves to critical fiscal analysis. It is very difficult for States to estimate the amount of time spent on these activities both by their own staff and other staff that may be located outside of the State environmental agency, such as in the Attorney General’s Office. Additionally, there is anecdotal evidence to suggest that States tend to cut the Program Development activities first before cutting other services, as fiscal resources from both State and federal sources shrink. Therefore, the Hazardous Waste Subcommittee concludes that the estimates obtained from the ten States in the survey are probably lower than the actual average Gross Annual Cost of these activities to the States.
Overall Overall, the data from the 10 pilot States reflects an estimated overall program need in those
Figure 11 - Extrapolated Core Program Cost
$0
$50,000,000
$100,000,000
$150,000,000
$200,000,000
$250,000,000
$300,000,000
10 State Pilot Data 50 State Estimation

State RCRA Subtitle C Core Program Implementation Costs Final Report - January 2007
Page 29 of 90
States of approximately $51,000,000. Using our estimate that these States account for 20% of the program costs of the 50 States, this would indicate an overall national program need of approximately $255,000,000. (Figure 11). Figure 12 shows that, using a required 25% State match for federal grants, States should be contributing approximately $64,000,000 toward this annual program cost, and the federal grants should account for approximately $191,000,000 for an adequate and effective program. However, as can further be seen from Figure 12, this is not the case. Data from a separate data collection project by the Hazardous Waste Subcommittee shows that, for FY06, States estimated their hazardous waste program costs (including both federal and non-federal sources of funding) to be approximately $189,000,000. Compared against the enacted federal RCRA C STAG funding level of approximately $101,000,000, this indicates that States are currently contributing approximately $87,000,000 toward the hazardous waste program in their efforts to ensure program effectiveness. Clearly, additional federal funds are needed to fully fund the RCRA C program. However, as can again be seen from Figure 12, the proposed FY07 RCRA C STAG appropriation (approximately $101,000,000) is expected to fall far short of the needed level. The total RCRA C grant received by the ten pilot States in FY05 was $24,522,543. Based on
this, EPA is providing, on average, 48% of the necessary budget to run a complete and adequate RCRA C Core Program, when compared to $51,000,000 annually estimated by the ten pilot States. These ten States received approximately 25% of the total $100,000,000 annual HW STAG grant from EPA, so for all 50 States, EPA is providing approximately 39% of the
Figure 12 - Core Program Funding Status
$0
$50,000,000
$100,000,000
$150,000,000
$200,000,000
$250,000,000
$300,000,000
50 State Estimated ProgramCost
FY06 Enacted HW STAG FY07 Proposed HW STAG
State MatchFederal Funds
State RCRA Subtitle C Core Program Implementation Costs Final Report - January 2007
Page 30 of 90
estimated $255,000,000 annually needed to run a complete and adequate RCRA C Core Program. For a number of years, State RCRA C Core Grants have been either stagnant or decreasing. The grants have not kept pace with inflation, increases in worker salaries, increases in health insurance costs or increasing workloads associated with State authorization of additional program elements, regulations, and tasks required by EPA. This has required States to look to other sources for funding. Some States have been fortunate and have been able to supplement their program funding through permitting fees, cost recovery/reimbursement for permitting and remediation oversight, disposal and generator fees, and through other means. Some States receive State general revenue funds. Other States are not as fortunate and have to rely almost entirely on the RCRA C Core Grant. A few years ago, when the economy had a down turn, those States relying on State general revenue funding had to suffer program cuts. Given the steep learning curve and substantial workload in the RCRA C permitting and remediation programs, these cuts in staffing create long term issues related to overall program efficiency and effectiveness. It is also worth noting that some States have found, through the recent exercise directed at determining State costs for purposes of calculating the RCRA C “efficiency measure,” that the overall average costs developed for the RCRA C Core Project may be on the low side. During this data collection, additional costs were identified in some instances that may not have been completely captured by the original core program estimates due, in part, to the way the costs for the RCRA C Core project were categorized. Another element bearing on this situation is the difficulty experienced by some States in accurately culling RCRA C Core Program costs out of the larger, overarching funds associated with Performance Partnership Grants in States that have Performance Partnership Agreements with EPA.
Utilization of State vs. Federal Resources It should be noted that (in general) an environmental program run by a State government agency (such as the RCRA C permitting, remediation, inspection and enforcement programs) is more economical than if the same program were run by EPA itself. Most of the nation’s primary environmental statutes provide for the federal programs to be delegated or authorized to the States, and most of them have been, placing environmental expertise and protection close at hand. In fact, the States currently administer about 90% of the workload for programs EPA has delegated to them. Two other factors that make State programs a bargain are: 1. The States are required to match most federal grants with a 5%-50% amount. In 2005,
States provided a 36% match to federal funds. (President’s 2007 EPA Budget Proposal). In the case of the RCRA C program, States are required to provide a 25% match. Based on our analysis, States are currently actually providing 46% of the overall program funding.
2. State employees on average cost about a third less than federal employees. (The
Environmental Council of the States (ECOS), 2005 “State Pay Comparison to EPA Headquarters, 2005”).
For example, averaged out, an EPA inspector earns approximately $70,000 per year. Not only

State RCRA Subtitle C Core Program Implementation Costs Final Report - January 2007
Page 31 of 90
is this average salary higher than what most State inspectors are paid, the number of hours per inspection are typically higher for EPA than the State. EPA staff must do more pre-inspection preparation, travel to and from their regional offices to the facility location and incur additional travel costs, hotel costs, meals, etc. which would result in a more expensive inspection program. Because of staff limitations, EPA has also begun using contractors to perform inspections. This would also increase the cost of the inspection program because the contractor, as well as EPA oversight staff, would have to be paid. In addition, statutory authorities for most inspection/ enforcement activities remain with the States and the quality and quantity of contractor inspections cannot be assured. Similar cost savings are likewise attributable to State implementation of the other component areas of the RCRA C Core Program. As ECOS has noted in its proposal to Congress for EPA’s 2007 State and Tribal Assistance Grants Budget (February 2006), “...a federal dollar spent in Washington, D.C., buys $1 worth of environmental protection, but when spent in a State, it buys $1.80 worth of environmental protection.”
Major Conclusions and Recommendations This study represents the first comprehensive analysis, by the people who run the programs, of what it takes thus far in the 21st Century to run an effective and adequate RCRA C Core Program. The results are not surprising, since we have long suspected that the distribution of costs to run the program (see Figure 2) do not match directly with the apportionment of funding provided to the five program areas. This evaluation has provided affirmation that several areas not typically considered in grant workplans and funding negotiations consume a significant amount of resources (e.g., permit modifications, permit maintenance activities, data management), and that remediation is, and will be, the most costly program area to implement. We have also suspected that we have more to do than the resources provided allow us to do. Now we know how big the gap is and where the greatest needs exist. Unfortunately, the gap is even larger than this analysis identifies. Many of the areas that both EPA and State senior managers have identified as important future directions, like the Resource Conservation Challenge and Sustainability, are not currently considered part of the Core Program. These Conclusions and Recommendations identify the challenge before us.
- Permit maintenance and permit modification costs constitute approximately 13% of the overall RCRA C Core Program costs incurred by States, yet these program elements have historically been considered negligible in State-EPA planning and budget negotiations. Given the nature and importance of these elements of the permitting program, they must be appropriately considered in future workload planning and budget discussions.
- The remediation program area constitutes the largest overall cost (28%) of the RCRA C
Core Program. Although it is expected that the distribution of costs among the various elements comprising this program area will shift over the coming years from primarily investigation oversight to corrective measures and long-term oversight, the overall costs of this important program area are not expected to decline at the national level for the foreseeable future due to the costs associated with long-term stewardship of these sites.

State RCRA Subtitle C Core Program Implementation Costs Final Report - January 2007
Page 32 of 90
- The emphasis on and proliferation of performance standards and efficiency measures in
the RCRA C Core Program, driven chiefly by the GPRA, will continue to consume significant State resources. Documentation of EIs related to the 2005 CA GPRA goals alone comprised roughly 1% of the overall cost of State RCRA C Core Programs. As new measures are developed and implemented, it is anticipated that these costs could rise to comprise as much as 3% to 4% of the overall cost of the State programs.
- Historically, grant workload and budget negotiations have focused predominantly on
TSDF and LQG inspections, due primarily to the statutory requirement to inspect TSDFs every two years and the EPA Enforcement Response Policy (ERP) requirement to inspect 20% of LQGs each year. However, as shown through this study, these program elements account for only about 41% of the cost of the inspection program, and 49% of the cost of the enforcement program. Clearly, future workload and budget negotiations must consider the substantial costs and environmental benefits associated with inspections and enforcement related to other facilities (CESQG, SQG, Transporters, Complaints, etc.).
- Data management was identified as the second most costly function of implementing a
State RCRA C Core Program. Clearly, timely and accurate information on RCRA C programmatic activities is essential to EPA and States’ program reporting and accountability efforts. The overall importance of RCRA C data management must be recognized and funded appropriately.
- The results of this study indicate that the annual national funding requirement for States
to implement a complete and adequate RCRA C Core Program, based on existing law and national program policy and guidance, is approximately $255,000,000. Of this amount, approximately $64,000,000 should be contributed by States and $191,000,000 by federal grants (based on a 25% State match for federal grants). States are currently contributing approximately $87,000,000 (136% of their minimum share), while federal grants account for approximately $101,000,000 (53% of their share) of the funding needed to implement a complete and adequate program.
Clearly, as documented throughout this report, additional federal funds are needed to fully fund the State RCRA C programs if these programs are to be implemented in the manner as required by existing law and national program policy and guidance. To this end, EPA and the States should work closely with OMB and the Congress in upcoming budget cycles to find additional funding for the program. Alternatively, if adequate funding cannot be secured, States and EPA must work together to identify and implement significant areas of disinvestments from the federally required programs (which will likely result in correspondingly lesser environmental protection).

Page 33 of 90

State RCRA Subtitle C Core Program Implementation Costs Final Report - January 2007
Page 34 of 90 Appendix I
Appendix I – Identification of Core Program Elements
This appendix provides the reports that developed background for the process methodology used to determine and break down the elements of State RCRA programs. The elements were determined to be: 1) Permitting, 2) Remediation, 3) Inspections, 4) Enforcement, and 5) Program Development. Each of the elements is described in annexes to this appendix.

Page 35 of 90

State RCRA Subtitle C Core Program Implementation Costs Final Report - January 2007
Page 36 of 90 Appendix I
Annex 1
Permitting
RCRA Core Project State Cost Analysis Methodology for Permitting
Prepared by the ASTSWMO Corrective Action and Permitting Task Force for the
ASTSWMO Board of Directors April 27, 2004
The ASTSWMO Corrective Action and Permitting Task Force was assigned the task of determining the “core” set of program elements associated with RCRA permitting and developing a methodology which can be used by States to calculate the real costs associated with administering State RCRA permitting programs. The resulting evaluation and cost calculation methodology can be used to determine the shortfall between the amounts of funding needed to support State RCRA permitting programs versus the amount of funding currently available to run those programs. Ultimately, States could use the amounts generated by the cost calculation methodology to seek additional funding from State legislatures and/or EPA in situations where the cost of administering current programs outweighs currently available funds. This permitting cost information may also be useful for other program estimating or planning purposes. This report outlines the specific tasks evaluated along with a discussion of how the members arrived at the approach developed and advocated by the group.
Permitting Activity Categories The Task Force began the project by identifying the activities associated with permitting of hazardous waste facilities. In order to minimize the number of categories and to allow each State the opportunity to incorporate specific State needs into a category, the Task Force agreed on five broad, but common permitting functions, as follows: 1) pre-application activities; 2) application review activities; 3) permit issuance activities; 4) permit maintenance activities; and 5) permit modification activities. Each State decided individually which activities would be included in each of these broader categories. A representative sampling of the activities in each category includes, but was not necessarily limited to the following:

State RCRA Subtitle C Core Program Implementation Costs Final Report - January 2007
Page 37 of 90 Appendix I
1) Pre-application Activities: Sending out permit renewal letters, phone calls/meetings to discuss permit applications, information research and providing information/forms to applicant, public notices of intent to permit, internal coordination, and development of permit timelines and schedules.
2) Application Review Activities: Application completeness check, technical review and
preparation of comments including trial burn plans and risk assessments, public participation, internal coordination and coordination of review with other agencies, habitual violator review, meetings, site visits and phone calls.
3) Permit Issuance Activities: Preparing draft permits and related correspondence, public
participation activities (public notices, availability sessions, hearings, establishing information repositories) for the draft permit, responding to comments on the draft permit, preparing the final permit and related correspondence, permit appeal activities, meetings, phone calls, and site visits.
4) Permit Maintenance Activities: Addressing questions posed by agency management,
responding to citizen/media calls, compliance inquiries, facility management planning, data management, responding to internal inquiries, file review requests, permit billing (cost-recovery) activities, review of routine facility reports (e.g., non-corrective action progress/ monitoring reports), meetings, phone calls and site visits.
5) Permit Modification Activities: Technical reviews, drafting of modifications, public
participation, response to public comments, finalization of modifications, dealing with permit modification appeals, modification tracking and other procedural items.
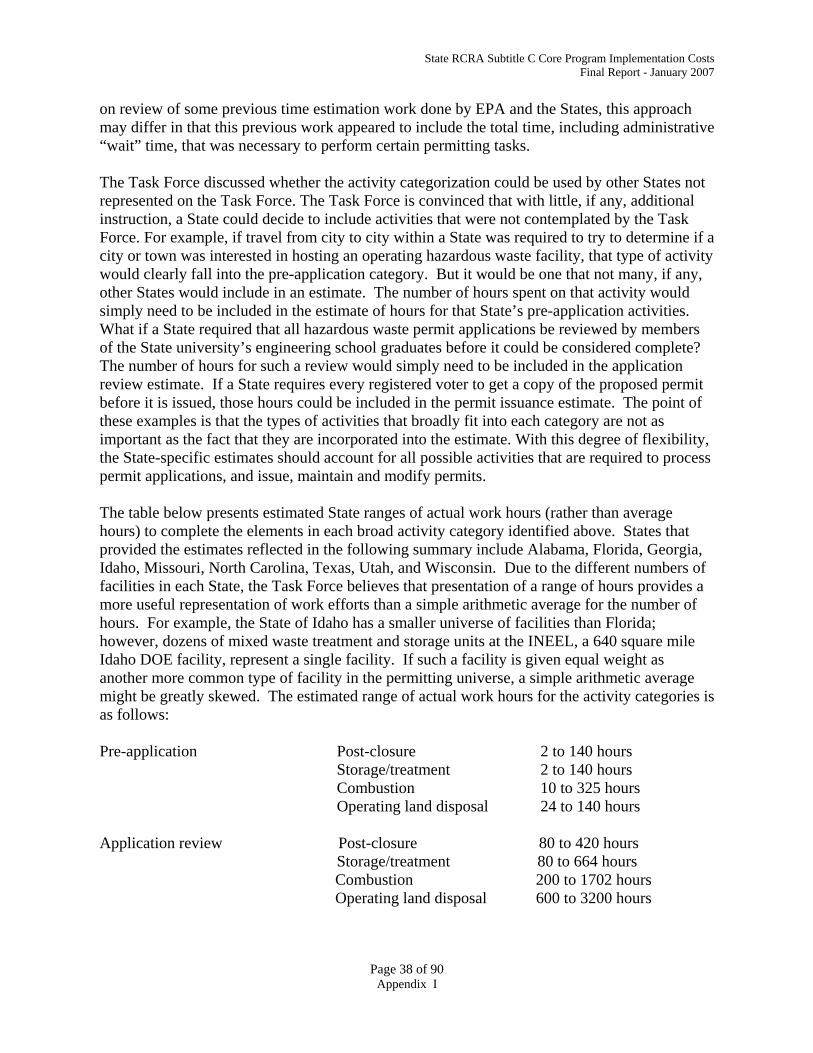
Estimation of Work Hours The Task Force then estimated a range of work hours for four of the five categories above for post-closure, storage/treatment, combustion and operating land disposal facilities. The Task Force agreed that the estimated range of work hours required to issue and maintain a simple storage permit would be quite different than the estimated range of work hours required to issue and maintain a more complex permit for post-closure, land disposal or combustion. Similar logic was applied to the permit modification category, which was subdivided into Class 1, Class 2, Class 3 and agency-initiated modifications. No activities broadly classified as corrective action were included in any of the activities or estimates. Further, any closure activities that might occur during the term of a permit were not included. Finally, these categories allowed each Task Force member to incorporate into the work hours estimate any unique requirements a State may have that fit well into that category, but may not be a step in the process that other States require. It is extremely important to note that the Task Force’s work hour estimates are actual work hours as opposed to elapsed work time. Administrative waiting time such as that associated with internal agency concurrence/ review and public participation were not included in the estimates, as no actual work was going on during those periods, so theoretically no funds were being expended on permitting. Based
State RCRA Subtitle C Core Program Implementation Costs Final Report - January 2007
Page 38 of 90 Appendix I
on review of some previous time estimation work done by EPA and the States, this approach may differ in that this previous work appeared to include the total time, including administrative “wait” time, that was necessary to perform certain permitting tasks. The Task Force discussed whether the activity categorization could be used by other States not represented on the Task Force. The Task Force is convinced that with little, if any, additional instruction, a State could decide to include activities that were not contemplated by the Task Force. For example, if travel from city to city within a State was required to try to determine if a city or town was interested in hosting an operating hazardous waste facility, that type of activity would clearly fall into the pre-application category. But it would be one that not many, if any, other States would include in an estimate. The number of hours spent on that activity would simply need to be included in the estimate of hours for that State’s pre-application activities. What if a State required that all hazardous waste permit applications be reviewed by members of the State university’s engineering school graduates before it could be considered complete? The number of hours for such a review would simply need to be included in the application review estimate. If a State requires every registered voter to get a copy of the proposed permit before it is issued, those hours could be included in the permit issuance estimate. The point of these examples is that the types of activities that broadly fit into each category are not as important as the fact that they are incorporated into the estimate. With this degree of flexibility, the State-specific estimates should account for all possible activities that are required to process permit applications, and issue, maintain and modify permits. The table below presents estimated State ranges of actual work hours (rather than average hours) to complete the elements in each broad activity category identified above. States that provided the estimates reflected in the following summary include Alabama, Florida, Georgia, Idaho, Missouri, North Carolina, Texas, Utah, and Wisconsin. Due to the different numbers of facilities in each State, the Task Force believes that presentation of a range of hours provides a more useful representation of work efforts than a simple arithmetic average for the number of hours. For example, the State of Idaho has a smaller universe of facilities than Florida; however, dozens of mixed waste treatment and storage units at the INEEL, a 640 square mile Idaho DOE facility, represent a single facility. If such a facility is given equal weight as another more common type of facility in the permitting universe, a simple arithmetic average might be greatly skewed. The estimated range of actual work hours for the activity categories is as follows: Pre-application Post-closure 2 to 140 hours Storage/treatment 2 to 140 hours Combustion 10 to 325 hours Operating land disposal 24 to 140 hours Application review Post-closure 80 to 420 hours Storage/treatment 80 to 664 hours Combustion 200 to 1702 hours Operating land disposal 600 to 3200 hours

State RCRA Subtitle C Core Program Implementation Costs Final Report - January 2007
Page 39 of 90 Appendix I
Permit Issuance Post-closure 40 to 450 hours Storage/treatment 60 to 775 hours Combustion 80 to 1800 hours Operating land disposal 296 to 560 hours Permit Maintenance Post-closure 10 to 360 hours Storage/treatment 10 to 200 hours Combustion 10 to 2000 hours Operating land disposal 50 to 2000 hours Permit Modification Class 1 (all facilities) 2 to 100 hours Class 2 (all facilities) 40 to 340 hours Class 3 (all facilities) 21 to 1850 hours Agency initiated (all facilities) 60 to 725 hours
Cost Analysis Methodology Following permitting activity categorization and estimation of actual work hours to perform permitting activities, the Task Force began work towards the ultimate objective of the project, which was development of the cost-estimating methodology for permitting. This methodology is incorporated into a self-contained, Microsoft Excel spreadsheet that has been dubbed “SCAMP” (State Cost Analysis Methodology for Permitting). Once the spreadsheet is opened, the SCAMP instructions are largely self-explanatory in the column legend. Example spreadsheets for Missouri and Idaho are included as attachments to this project report. The elements and use of the SCAMP spreadsheet are summarized below. Column A is the place to list the State name. Column B lists the activity categories developed by the Task Force. Column C lists the facility types as categorized by the Task Force. Columns D and F are for user input and represent the low and high number of actual work hours, respectively, for each activity category and facility type. During methodology development, there was considerable discussion concerning use of average hours for cost estimation. Currently, the SCAMP spreadsheet automatically calculates an arithmetic average of the high and low hours in Column E. However, the Task Force recognized that use of a “weighted” average would be more representative and should be used whenever possible (i.e., one or two facilities representing the low or high end of the range should not be allowed to grossly skew the arithmetic average used for cost calculation purposes). The adjustment factor presented in Column J was incorporated for use in adjusting (upward or downward) the arithmetic average hours calculated in Column E. Alternatively, weighted average hours could simply be input into the spreadsheet and the adjustment factor left at unity (1.00). Columns G, H, and I are for user input and represent the low, weighted-average and high hourly pay rates, respectively, for staff performing actual permitting work. For salaried employees, the low and high numbers are simply the employee’s annual salary divided by the number of work hours in a calendar year. The weighted average is user-inputted (not calculated by the SCAMP spreadsheet) and represents an average of the salary for all staff performing actual permitting

State RCRA Subtitle C Core Program Implementation Costs Final Report - January 2007
Page 40 of 90 Appendix I
work. Columns K, L and M are calculated by the spreadsheet and represent the low, average and high cost of each activity, respectively, based on the information contained in Columns D through J. Column N is a user-inputted State multiplier. This multiplier is designed to be State-specific and to capture overarching costs not included in the hourly salary rates. The multiplier may include, but not be limited to: overhead, fringe, clerical, administrative, legal and supervisory support. For States that operate on a flat hourly rate for permitting which already incorporates the items covered by the multiplier, the flat rate could be used as the weighted average salary in Column H and the multiplier simply held to unity (1.00). Column O is the user-inputted number of activities performed annually in each category. This number can be estimated based on past performance, future plans, best professional judgment or a combination thereof. Columns P, Q and R are calculated by the spreadsheet and represent the low, average and high gross annual costs of each activity, respectively, based on the information contained in Columns K through O. At the bottom of columns P, Q and R, the spreadsheet automatically calculates the low, average and high gross annual cost of the State’s RCRA permitting program as a whole. These figures represent gross annual permitting cost estimates only. Any permitting-related cost recovery or fees that might be available to offset the overall cost of State permitting programs is not addressed in this analysis. In closing, the Task Force would like to express its appreciation to the ASTSWMO Board for its patience during development of the concepts and recommendations contained herein. Provided that States carefully consider and develop State-specific inputs to the SCAMP spreadsheet, the cost estimating methodology can provide reasonable and technically defensible permitting cost estimates which can be used for a variety of purposes. The cost estimating methodology is flexible enough to be adapted to virtually any State permitting program and, if embraced by the Board, could also serve as a model for cost estimating in other RCRA program areas that are being considered. The Task Force would welcome any additional peer review of its findings and recommendations by States not represented on the Task Force. If you have any questions concerning the Task Force’s work or want to discuss this project further, please feel free to contact Task Force chair Richard Nussbaum at 573-751-3553.

Page 41 of 90

State RCRA Subtitle C Core Program Implementation Costs Final Report - January 2007
Page 42 of 90 Appendix I
ANNEX 2
REMEDIATION
RCRA Core Project State Cost Analysis Methodology for Remediation
(Closure & Corrective Action)
Prepared by the ASTSWMO Corrective Action and Permitting Task Force
for the ASTSWMO Board of Directors
April 27, 2004 The ASTSWMO Corrective Action and Permitting Task Force (Task Force) was assigned the task of determining the “core” set of program elements associated with RCRA remediation (closure and corrective action) and developing a methodology which can be used by States to calculate the real costs associated with administering these areas of State RCRA programs. The resulting evaluation and cost calculation methodology can be used to determine the cost of State RCRA remediation programs including identification of any shortfalls between the amount of funding needed to support State programs versus the amount of funding currently available to run those programs. Ultimately, States could use the amounts generated by the cost calculation methodology to seek additional funding from State legislatures and/or EPA in situations where the cost of administering current programs outweighs currently available funds. This cost information may also be useful for other program estimating or planning purposes. This report outlines the remediation-related elements evaluated by the Task Force along with a discussion of how the members arrived at the approach recommended by the group.
Remediation Activity Categories The Task Force began this project by identifying the activities associated with closure and corrective action at hazardous waste facilities. In order to minimize the number of categories and to allow each State the opportunity to incorporate State-specific needs into a category, the Task Force agreed on ten broad, but common activity categories as follows: 1) Closure; 2) RCRA Facility Assessments; 3) Corrective Action Instruments; 4) RCRA Facility Investigations; 5) Interim Measures; 6) Corrective Measures Study; 7) Corrective Measures Implementation; 8) Long-term Oversight; 9) Corrective Action Completion; and 10) Technical Support. Inclusion of an eleventh category (Planning, Evaluation and Reporting) was also

State RCRA Subtitle C Core Program Implementation Costs Final Report - January 2007
Page 43 of 90 Appendix I
discussed. There were differing opinions as to whether this category was necessary. Some Task Force members thought that this category was not necessary or that the tasks in this category were already adequately covered by the other categories. Others believed that it would be beneficial to retain this category as the tasks there under were not adequately covered by the ten agreed-upon categories. The Task Force did not reach final consensus on this issue, however, in the interest of moving this project forward, the Task Force decided to retain the eleventh category so that States could use it if desired. The foregoing categories were used to be generally consistent with EPA’s nomenclature. All States do not necessarily use the exact same terminology or corrective action process as EPA; thus, when estimating costs, each State should determine the applicable category via the subactivities and tasks included in each of the broader categories. A representative sampling of the subactivities/tasks in each category includes, but is not limited to, the following: Closure: Work plan and report review and approval, oversight inspections, and administrative tasks such as phone calls/meetings to discuss closure issues, internal coordination, development of closure timelines/schedules, and release of closure financial assurance. RCRA Facility Assessment: Review of facility files/records, visual site inspection, sampling/ analysis including development/coordination of sampling plans; report preparation; internal and external coordination, meetings and phone calls. Corrective Action Instruments: The time required to put in place a governing instrument for the corrective action process. The cost when permits are used as the regulatory instrument for corrective action is already covered by the Task Force’s previously prepared permitting cost estimates. The costs associated with Orders or other agreements as the corrective action instrument would include tasks such as file review, preparing and negotiating draft and final orders/agreements, establishing information repositories, internal and external coordination, meetings, phone calls and site visits. RCRA Facility Investigations: Work plan and report review and approval, corrective action oversight and sampling inspections, internal and external coordination and response to inquiries, file review, review of routine facility reports (e.g., CA progress and monitoring reports), meetings, phone calls and site visits. Interim Measures: Work plan and report review and approval, corrective action oversight and sampling inspections, internal and external coordination and response to inquiries, file review, public participation activities (for significant interim measures), meetings, phone calls and site visits. Corrective Measures Study: Work plan and report review and approval, corrective action oversight and sampling inspections, internal and external coordination and response to inquiries, file review, review of routine facility reports (e.g., CA progress and monitoring reports), Statement of Basis (SB) preparation, public participation activities including response to comments (RTC) on the SB, meetings, phone calls and site visits.

State RCRA Subtitle C Core Program Implementation Costs Final Report - January 2007
Page 44 of 90 Appendix I
Corrective Measures Implementation: Work plan and report review and approval, corrective action oversight and sampling inspections, internal and external coordination and response to inquiries, file review, review of routine facility reports (e.g., CA progress and monitoring reports), meetings, phone calls and site visits. Long-Term Oversight: Review/approval of facility reports (e.g., CA progress, groundwater monitoring and remedy “effectiveness” reports), corrective action oversight and sampling inspections including monitoring of institutional and engineering controls, CA financial assurance reviews, internal and external coordination and response to inquiries, file review, meetings, phone calls and site visits. Corrective Action Completion: Administrative record review, internal and external coordination and response to inquiries, public participation activities including RTC on NFA/CA complete determination, meetings, phone calls and site visits. Technical Support: Technical/regulatory review and coordination of activities to ensure that substantive corrective action requirements are met at facilities that are subject to corrective action but that have been “deferred” to another program. Planning, Evaluation and Reporting. This group of activities might include environmental indicator evaluations, stabilization evaluations, NCAPS site priority ranking or re-ranking, PPA/PPG/Facility Management Plan development and negotiation, project progress reporting to EPA and department management, internal and external coordination and response to inquiries, RCRAInfo data entry, rulemaking and program authorization activities, and cost-recovery accounting and billing. Some States included the cost associated with these activities in the above ten categories, but other States preferred to leave this as a separate category. The cost estimation spreadsheet developed as part of this project accommodates either preference.
Estimation of Work Hours The Task Force estimated a range of work hours for the above activity categories and associated activity subdivisions. The Task Force agreed that the estimated range of work hours required to complete the noted activities would vary substantially based on the size and complexity of each facility, as well as the number of units to be remediated at each facility. In general, the higher the NCAPS ranking of a facility, the more resource-intensive the activities associated with remediation. No activities broadly classified as permitting (e.g., permit issuance as the corrective action instrument, permit modifications to implement final remedies) are included in any of the activities or estimates as these permit-related activities/estimates were addressed by the Task Force as part of the previous core project to estimate costs associated with RCRA permitting. The remediation activity categories are broad enough to allow each State to incorporate into the work hours estimate any unique State requirements that fit into that category. It is extremely important to note that the Task Force’s work hour estimates are actual work hours as opposed to elapsed work time. Administrative waiting time such as that associated with internal agency

State RCRA Subtitle C Core Program Implementation Costs Final Report - January 2007
Page 45 of 90 Appendix I
concurrence/review and public participation were not included in the estimates, as no actual work was going on during those periods, so theoretically no funds were being expended on remediation. Based on review of some previous time estimation work done by EPA and the States, this approach may differ in that some of the previous work estimates appeared to include the total time, including administrative “wait” time that was necessary to perform certain tasks. The Task Force thinks that the activity categorizations recommended in this report can easily be used by other States not represented on the Task Force. The Task Force believes that with little, if any, additional instruction, a State could include activities in a category that were not specifically identified by the Task Force. For example, the activity of travel from city to city within a State to try to determine if a city or town was interested in a proposed final remedy at a hazardous waste facility could fall into the Corrective Measures Study activity category, but perhaps only a few States would want to count that time. The number of hours spent on that activity would simply need to be included in the estimate of hours for that State’s activity. As another example, what if a State required that all proposed final remedies were reviewed by members of the State’s hazardous waste commission before they were public noticed? Or, what if a State requires that every landowner adjacent to a facility receive a copy of the proposed final remedy (Statement of Basis) before or when it is issued? Again, those hours could be included in the appropriate activity category for that State. The point of these examples is that the types of activities that broadly fit into each category are not as important as the fact that they are incorporated into the estimate. With the degree of flexibility advocated in this report (as reflected in the associated cost estimation spreadsheet), the framework for State-specific remediation cost estimates developed by the Task Force should be sufficient to account for all possible activities that are required to operate and maintain State remediation programs. The table below presents estimated ranges of actual work hours (rather than average hours) to complete the elements in each broad activity category identified above. States that provided the estimates reflected in the following summary include Alabama, California, Florida, Georgia, Idaho, Missouri, North Carolina and Utah. Due to the different numbers of facilities in each State, the Task Force thinks that presentation of a range of hours provides a more useful representation of work efforts than a simple arithmetic average for the number of hours. Some States have a relatively small universe of remediation facilities when compared with others; however, the scope and complexity of remediation at some of the larger facilities may represent a workload equal to that of several smaller, less-complex facilities. If all facilities are given equal weight, use of a simple arithmetic average to represent workloads would be greatly skewed. The estimated range of actual work hours for the ten agreed-upon activity categories is as follows:
Closure 20 to 2160 hours RCRA Facility Assessments 80 to 5520 hours Corrective Action Instruments 50 to 3840 hours RCRA Facility Investigations 50 to 4680 hours

State RCRA Subtitle C Core Program Implementation Costs Final Report - January 2007
Page 46 of 90 Appendix I
Interim Measures 32 to 4800 hours Corrective Measures Study 40 to 4296 hours Corrective Measures Implementation 32 to 2232 hours Long-Term Oversight 40 to 2400 hours Corrective Action Completion 40 to 842 hours Technical Support 20 to 2088 hours
The foregoing estimates represent a large range of hours for the noted activity categories and are a reflection of the variable nature, size and complexity of sites in the RCRA closure/corrective action universe. Some States chose to focus on providing estimates of the total range of hours associated with each activity category while others decided to break the estimates down in accordance with the activity subdivisions listed in the cost estimating spreadsheet accompanying this report. The spreadsheet should be consulted for further information on these subdivisions. The narrative category descriptions above capture the essence of most of these subdivisions. These subdivisions have been retained for use in the spreadsheet in addition to allowing for calculation of costs based on “total” estimates for a category. A summary of the estimated range of work hours for the activity subdivisions is not included here as each State that provided subdivided estimates did so in a slightly different manner. As such, preparation of a meaningful tabulated summary of the subdivided category estimates was not possible. However, the example spreadsheet for Missouri provided as part of this report breaks down the costs by subcategory, illustrating how such an approach might be used. It is important to note that if a subcategory approach is used, it will be especially important to define the estimation basis for each subcategory (e.g., per plan, report, closure or instrument; per facility action, each; or annually-additive).
Cost Analysis Methodology Following activity categorization and estimation of actual work hours to perform remediation activities, the Task Force used a cost-estimating methodology similar to that developed as part of the previous permit cost estimating core project. This methodology is incorporated into a self-contained, Microsoft Excel spreadsheet. Once opened, the spreadsheet instructions are largely self-explanatory in the column legend. Example spreadsheets for Missouri and State 2 are included as attachments to this report. The elements and use of the spreadsheet are summarized below. Column A is the place to list the State name. Column B lists the activity categories developed by the Task Force. Column C1 lists any activity subdivisions as categorized by individual States. Column C2 lists the user-defined estimation basis for the subdivisions listed in Column C1. Columns D and F are for user input and represent the low and high number of actual work hours, respectively, for each activity category and subdivision. A “total” option is available for

State RCRA Subtitle C Core Program Implementation Costs Final Report - January 2007
Page 47 of 90 Appendix I
each activity category in the event that subdivision of the category is not desired. During previous development of the cost estimating methodology for permitting, there was considerable discussion concerning use of average hours for cost estimation. Currently, the remediation cost-estimating spreadsheet automatically calculates an arithmetic average of the high and low hours in Column E. This could be somewhat problematic if only total costs are estimated for each category (as opposed to using the category subdivisions) and the range of estimated hours is large. The Task Force recognizes that use of a “weighted” average may be more representative and the ability to use such an approach should be retained (i.e., one or two facilities representing the low or high end of the range should not be allowed to grossly skew the arithmetic average used for cost estimation purposes). Hence, the adjustment factor presented in Column J was incorporated for use in adjusting (upward or downward) the arithmetic average hours calculated in Column E, as appropriate. Alternatively, weighted average hours could simply be input into the spreadsheet and the adjustment factor left at unity (1.00). Columns G, H, and I are for user input and represent the low, weighted-average and high hourly pay rates, respectively, for staff performing actual remediation work. For salaried employees, the low and high numbers are simply the employee’s annual salary divided by the number of work hours in a calendar year. The weighted average is user-inputted (not calculated by the spreadsheet) and represents an average of the salary for all staff performing closure and corrective action (remediation) work. Columns K, L and M are calculated by the spreadsheet and represent the low, average and high cost of each activity, respectively, based on the information contained in Columns D through J. Column N is a user-inputted State multiplier. This multiplier is designed to be State-specific and to capture overarching costs not included in the hourly salary rates. The multiplier may include, but not be limited to: overhead, fringe, clerical, administrative, legal and supervisory support. For States that operate on a flat hourly rate, which already incorporates the items covered by the multiplier, the flat rate could be used as the weighted average salary in Column H and the multiplier simply held to unity (1.00). Column O is the user-inputted number of activities performed annually in each category. This number can be estimated based on past performance, future plans, best professional judgment or a combination thereof. If a range of aggregate annual hours (across all facilities) is used to estimate costs, the corresponding number of annual activities represented in Column O should be held to unity (1.00). Columns P, Q and R are calculated by the spreadsheet and represent the low, average and high gross annual costs of each activity, respectively, based on the information contained in Columns K through O. At the bottom of columns P, Q and R, the spreadsheet automatically calculates the low, average and high gross annual cost of the State’s closure and corrective action (remediation) programs as a whole. These figures represent gross annual cost estimates only. Any remediation-related cost recovery or fees that might be available to offset the overall cost of State program operation are not addressed in this analysis. The Task Force would like to express its appreciation to the ASTSWMO Board for its interest in development of the concepts and recommendations contained herein. Provided that States carefully consider and develop State-specific inputs to the spreadsheet, the cost estimating

State RCRA Subtitle C Core Program Implementation Costs Final Report - January 2007
Page 48 of 90 Appendix I
methodology can provide reasonable and technically defensible cost estimates, which can be used for a variety of purposes. The cost estimating methodology is flexible enough to be adapted to virtually any State program and, as evidenced by the Board’s endorsement of the cost-estimating methodology for permitting previously developed by the Task Force, can serve as a model for cost estimating in other RCRA program areas that are being considered. The Task Force would welcome any additional peer review of its work by States not represented on the Task Force. If you have any questions concerning the Task Force’s work or want to discuss this project further, please feel free to contact Task Force chair Richard Nussbaum at 573-751-3553.

Page 49 of 90

State RCRA Subtitle C Core Program Implementation Costs Final Report - January 2007
Page 50 of 90 Appendix I
ANNEX 3
INSPECTIONS
RCRA Core Project State Cost Analysis Methodology for RCRA Inspections
Prepared by the ASTSWMO Hazardous Waste Enforcement and Compliance Assurance Task Force
for the ASTSWMO Board of Directors
April 27, 2004
The ASTSWMO Board of Directors assigned the Hazardous Waste Enforcement and Compliance Assurance Task Force (Task Force) with the task of determining the “core” set of program elements associated with RCRA inspections and to develop a methodology for States to use to calculate the real costs associated with administering State RCRA inspection programs. The workload analysis document and the cost calculation methodology would be available for States to determine the difference between the amount of funding needed and the current amount of funding available to support a State RCRA inspection program. The calculated costs could be used by States to support efforts for increased funding with State legislatures and/or EPA in those situations where the current funding is inadequate. The information could also be useful for planning purposes. This document is a report to the Board of the approach and efforts by the Task Force to complete the assigned task.
Inspection Activity Categories The Task Force began the project by identifying the broad categories of hazardous waste inspections that are performed by RCRA programs, in part based on the types of facilities that are subject to RCRA inspections and in part based on the genesis of the inspections. In order to minimize the number of categories and to allow each State the opportunity to incorporate specific State needs into a category, the Task Force agreed on seven common activity categories as follows: 1) Conditionally Exempt Small Quantity Generators (CESQGs); 2) Small Quantity Generators (SQGs); 3) Large Quantity Generators (LQGs); 4) Treatment, Storage, and Disposal Facilities (TSDFs); 5) Complaints; 6) EPA Lead; and 7) Transporters.

State RCRA Subtitle C Core Program Implementation Costs Final Report - January 2007
Page 51 of 90 Appendix I
The foregoing categories were used to be generally consistent with EPA’s nomenclature. All States do not necessarily use the exact same terminology or inspection process as EPA; thus, when estimating costs, each State should determine the applicable categories for its program, especially in cases where a State may have additional classifications for hazardous waste generators. Inspection Activity Subdivisions The Task Force next identified the various types of inspections/investigations that would generally be performed at the above facilities. The inspection activity subdivisions include: Compliance Evaluation Inspection (CEI), Compliance Monitoring Inspection (CME), Operation and Maintenance (O&M), Compliance Scheduled Inspection (CSE), Partial Evaluation Inspection (PEI), Combustion facility, Closure/Post Closure facility, Multiple units, Compliance Assistance Visits (CAVs), and Technical Assistance Visits (TAVs). All States do not necessarily use the exact same terminology or inspection process; thus, when estimating costs, each State should determine the applicable subdivisions for its RCRA program and adjust the subdivisions within each category accordingly. Please note that these subdivisions are also subject to change based on the RCRAInfo Handler Monitoring and Assistance Program Area Analysis (HMA/PAA) recommendations. Inspection Process The Task Force also identified the various steps needed to complete a typical investigation/ inspection, including off- and on-site activities and file/records reviews and report preparations. The steps identified include, but are not limited to, the following:
1. Conduct file review (including financial assurance review and permit review) 2. Develop on-site safety plan/sampling plan 3. Secure field equipment 4. Coordinate with other agencies, if applicable 5. Travel time to and from inspection site 6. Conduct facility entrance/exit interviews 7. Conduct on-site inspection (including photographic documentation) 8. Review company records 9. Conduct sampling 10. Review applicable regulations 11. Write up inspection report 12. Finalize and distribute inspection report 13. Complete data input 14. Refer for enforcement, if applicable
One or multiple steps may fit into the identified activity subdivisions and are listed here to assist State programs in determining which steps may be applicable for inclusion in their program-specific subdivision. For example, an EPA Lead inspection will typically include steps 4, 5, 6, 7, 8, and 9 but may or may not include step 12. By identifying the steps in each

State RCRA Subtitle C Core Program Implementation Costs Final Report - January 2007
Page 52 of 90 Appendix I
category and/or subdivision, States can determine which costs to include in the spreadsheet. These steps can also be enumerated for each category subdivision within the spreadsheet if a State has the applicable data.
Estimation of Work Hours The Task Force estimated the work hours for the above activity categories conducted in the member’s State. An appeal to State members with an interest in this project to provide information also resulted in those States’ input into the process. The Task Force agreed that the estimated work hours required to complete the noted activities would vary substantially based on the size and complexity of each facility. In general, TSDFs and LQGs are the more resource-intensive inspections. The activity categories allow each Task Force member to incorporate into the work hours estimate any unique requirements a State may have that fit well into that category, but may not be a step in the process that other States require. It is extremely important to note that the Task Force’s work hour estimates are actual work hours as opposed to elapsed work time. Administrative waiting time such as that associated with internal agency concurrence/review and public participation were not included in the estimates, as no actual work was going on during those periods, so theoretically no funds were being expended. Based on review of some previous time estimation work done by EPA and the States, this approach may differ in that this previous work appeared to include the total time, including administrative “wait” time that was necessary to perform certain tasks. It is also important to note that on-site inspectors for commercial facilities were not included consistently by the representative States. Also, the numbers used from the previous study were based on the current funding and may not represent how States would conduct an adequately funded program. Many States have streamlined programs and inspection schedules affecting the ability to conduct follow-up inspections and/or have resulted in resource-driven reduced inspection schedules. For example, in many instances, the larger industries have the resources needed to hire adequate staff to ensure environmental compliance. These entities have, for the most part, recognized that it is more economically feasible to be in compliance. Many States would like to increase the number of inspections at SQGs and CESQGs. However, many States have been adding a significant amount of resources to support grant funding and accomplish EPA set goals and initiatives, resulting in an inability to focus on the regulated entities creating more significant environmental problems. The table below presents estimated average actual work hours to complete the elements in each broad activity category identified above.
CESQG 8.25 hours/year/inspection SQG 13.2 hours/year/inspection LQG 18 hours/year/inspection

State RCRA Subtitle C Core Program Implementation Costs Final Report - January 2007
Page 53 of 90 Appendix I
TSDF 48.75 hours/year/inspection Complaint 8.7 hours/year/inspection EPA Lead 26.25 hours/year/inspection Transporter 8 hours/year/inspection
The Task Force discussed if the activity categorization could be used by other States not represented on the Task Force. The Task Force is convinced that with little, if any, additional instruction, a State could decide to include activities that were not contemplated by the Task Force. Again, those hours could be included in the appropriate activity category for that State. The types of activities that broadly fit into each category are not as important as the fact that they are incorporated into the estimate. With this degree of flexibility, State-specific estimates should account for all possible activities that are required to operate and maintain their inspection programs.
Cost Analysis Methodology Following activity categorization and estimation of actual work hours to perform inspection activities, the Task Force used the same cost-estimating methodology developed for the permitting cost project. This methodology is incorporated into a self-contained, Microsoft Excel spreadsheet. Once opened, the spreadsheet instructions are largely self-explanatory in the column legend. Example spreadsheets for Missouri and Utah are included as attachments to this project report. The elements and use of the spreadsheet are summarized below. Column A is the place to list the State name. Column B lists the activity categories developed by the Task Force. Column C lists any activity subdivisions as categorized by individual States. Columns D and F are for user input and represent the low and high number of actual work hours, respectively, for each activity category and subdivision. A “total” option is available for each activity category in the event that subdivision of the category is not desired or available. During methodology development, there was considerable discussion concerning use of average hours for cost estimation. Currently, the spreadsheet automatically calculates an arithmetic average of the high and low hours in Column E. However, the Task Force recognized that use of a “weighted” average would be more representative and should be used whenever possible (i.e., one or two facilities representing the low or high end of the range should not be allowed to grossly skew the arithmetic average used for cost calculation purposes). The adjustment factor presented in Column J was incorporated for use in adjusting (upward or downward) the arithmetic average hours calculated in Column E. Alternatively, some States may wish to directly input weighted average hours into the spreadsheet in Column E and leave the adjustment factor at unity (1.00). Columns G, H, and I are for user input and represent the low, weighted-average and high hourly
State RCRA Subtitle C Core Program Implementation Costs Final Report - January 2007
Page 54 of 90 Appendix I
pay rates, respectively, for staff performing actual inspections work. For salaried employees, the low and high numbers are simply the employee’s annual salary divided by the number of work hours in a calendar year. The weighted average is user-inputted (not calculated by the spreadsheet) and represents an average of the salary for all staff performing inspection activities. This calculation can be accomplished by adding the salaries of all inspection staff and dividing by the number of inspectors performing the tasks. This will eliminate the salary skew that would occur from a primarily senior or primarily novice inspection staff where the majority of salaries are clumped to one end of the spectrum or the other. Columns K, L and M are calculated by the spreadsheet and represent the low, average and high cost of each activity, respectively, based on the information contained in Columns D through J. Note that Column J does not impact the low or high cost, only the average cost. Column N is a user-inputted State multiplier. This multiplier is designed to be State-specific and to capture overarching costs not included in the hourly salary rates. The multiplier may include, but not be limited to, any support costs such as: overhead, fringe, clerical, administrative, legal and supervisory support. As an example, if a State inspection program had in its grant that 20% of the grant monies funded indirect costs, a State may choose to input a 1.2 in Column H to capture these indirect costs of the inspection program. For States that operate on a flat hourly rate that already incorporates the items covered by the multiplier, the flat rate could be used as the weighted average salary in Column H and the multiplier simply held to unity (1.00). Column O is the user-inputted number of activities performed annually in each category. This number can be estimated based on past performance, future plans, best professional judgment or a combination thereof. If a range of aggregate annual hours (across all facilities) is used to estimate costs, the corresponding number of annual activities represented in Column O should be held to unity (1.00). However, if the hours reported on the spreadsheet are per inspection, the total number of inspections would be entered in Column O. This will hopefully allow each State to input data in the format they currently have available. It should also be noted that inspection activities may not occur or be completed on a neat annual basis. Partial inspections can be recorded on the spreadsheet in any fraction the State chooses to use. Columns P, Q and R are calculated by the spreadsheet and represent the low, average and high gross annual costs of each activity, respectively, based on the information contained in Columns K through O. At the bottom of Columns P, Q and R, the spreadsheet automatically calculates the low, average and high gross annual cost of the State’s inspection program as a whole. These figures represent gross annual cost estimates only. Any inspection or other fees that might be available to offset the overall cost of State program operation are not addressed in this analysis. The Task Force would like to express its appreciation to the ASTSWMO Board for its interest in development of the concepts and recommendations contained herein. The Task Force would also like to thank the ASTSWMO Corrective Action and Permitting Task Force for allowing us to build on their ideas to create a cost estimate for inspections that can easily be combined with the cost estimates they have generated for permitting and corrective action. If you have any

State RCRA Subtitle C Core Program Implementation Costs Final Report - January 2007
Page 55 of 90 Appendix I
questions concerning the Task Force’s work or want to discuss this project further, please feel free to contact Task Force chair Cheryl Coleman at 803-896-4000.
State RCRA Subtitle C Core Program Implementation Costs Final Report - January 2007
Page 56 of 90 Appendix I
ANNEX 4
ENFORCEMENT
RCRA Core Project
State Cost Analysis Methodology for RCRA Enforcement
Prepared by the ASTSWMO Hazardous Waste Enforcement and Compliance Assurance Task Force
for the ASTSWMO Board of Directors
April 27, 2004
The ASTSWMO Board of Directors assigned the Hazardous Waste Enforcement and Compliance Assurance Task Force (Task Force) with the task of determining the “core” set of program elements associated with RCRA enforcement and to develop a methodology for States to use to calculate the real costs associated with administering State RCRA enforcement programs. The workload analysis document and the cost calculation methodology would be available for States to determine the difference between the amount of funding needed and the current amount of funding available to support a State RCRA enforcement program. The calculated costs could be used by States to support efforts for increased funding with State legislatures and/or EPA in those situations where the current funding is inadequate. The information could also be useful for planning purposes. This document is a report to the Board of the approach and efforts by the Task Force to complete the assigned task.
Enforcement Activity Categories The Task Force began the project by identifying the broad categories of hazardous waste enforcement activities that are performed by RCRA programs, based on the types of facilities that are subject to RCRA enforcement. The Task Force also wanted to utilize the same categories that were developed for the State Cost Analysis Methodology for RCRA Inspections to keep data collection consistent. In order to minimize the number of categories and to allow each State the opportunity to incorporate specific State needs into a category, the Task Force agreed on five common activity categories as follows: 1) Conditionally Exempt Small Quantity Generators (CESQGs); 2) Small Quantity Generators (SQGs); 3) Large Quantity Generators (LQGs); 4) Treatment, Storage, and Disposal Facilities (TSDFs); and 5) Transporters. Please note that there were two additional categories in the State Cost Analysis Methodology for

State RCRA Subtitle C Core Program Implementation Costs Final Report - January 2007
Page 57 of 90 Appendix I
RCRA Inspections: EPA Lead and Complaint. The Task Force expects that both EPA Lead and Complaint inspections would be rolled into one of the above-listed categories once enforcement actions are pursued. The foregoing categories were used to be generally consistent with EPA’s nomenclature. All States do not necessarily use the exact same terminology or enforcement process; thus, when estimating costs, each State should determine the applicable categories for its program especially in the case where a State may have additional classifications for hazardous waste generators.
Enforcement Activity Subdivisions The Task Force next identified the various types of enforcement activities that would generally be performed at the above facilities. A representative sampling of the enforcement subdivisions in each category includes, but is not limited to, the following: 1) Case Evaluation/Determination: Review of information collected during inspection and
determination of violations. This step would generally include a determination of whether an enforcement action will proceed or whether the facility is in substantial compliance. If an enforcement action is selected, this subdivision may also include the determination of whether formal or informal enforcement is warranted.
2) Case Referral: Transmittal of the violations to the State enforcement program, Attorney General’s Office, or other State-specific entity. This subdivision could occur at a different point in time depending on the enforcement program.
3) Case Development: Review of referral and supporting evidence, gathering of additional evidence to support violations if necessary, selection and implementation of enforcement tool (Consent Order, Unilateral Order, etc.), management review of enforcement documentation, and written transmittal of enforcement documentation to the facility.
4) Case Negotiation: Meetings with facilities, consideration of settlement offers, counterproposals, and possibly presentation before a trier of fact.
5) Case Resolution: Finalization of enforcement document, review of facility’s compliance with enforcement document, and collection of penalties.
6) Case Support: This subdivision will primarily be used to document any time and/or resource assistance given by the State enforcement program to outside parties such as the Attorney General’s office, EPA Criminal Investigation Division, etc.
These activity subdivisions are based on the general flow of enforcement activities. Again, all States do not necessarily use the exact same terminology or enforcement process; thus, when estimating costs, each State should determine the applicable subdivisions for its RCRA program and adjust the subdivisions within each category accordingly. It is not necessarily as important to include the specific tasks in the subdivisions outlined above but rather to make sure that all enforcement tasks are captured in one of the subdivisions. States should tailor these subdivisions to match their individual enforcement programs/processes to aid them in collecting representative data.

State RCRA Subtitle C Core Program Implementation Costs Final Report - January 2007
Page 58 of 90 Appendix I
Estimation of Work Hours The Task Force estimated a range of work hours for the above activity categories conducted in the member’s State. The Task Force agreed that the estimated work hours required to complete the noted activities would vary substantially based on the size and complexity of each enforcement activity. The complexity of the enforcement activity will not necessarily correlate to the size of the facility. Since many TSDFs and LQGs have found it to be more economical to maintain compliance by hiring a dedicated environmental staff, smaller facilities that are ignorant of the regulations often absorb a great deal of enforcement time and resources. The activity categories allow each Task Force member to incorporate into the work hours estimate any unique requirements a State may have that fit well into that category, but may not be a step in the process that other States require. It is extremely important to note that the Task Force’s work hour estimates are actual work hours as opposed to elapsed work time. Administrative waiting time such as that associated with internal agency concurrence/review and public participation were not included in the estimates, as no actual work was going on during those periods, so theoretically no funds were being expended. The table below presents estimated ranges of actual work hours (however, the spreadsheet calculates average hours in Column E) to complete the elements in each broad activity category identified above. States that provided the estimates reflected in the following summary include Missouri and Utah. Due to the different numbers of facilities in each State, the Task Force believes that presentation of a range of hours provides a more useful representation of work efforts than a simple arithmetic average for the number of hours. If all enforcement actions were given equal weight, use of a simple arithmetic average to represent workload would be greatly skewed. The estimated range of actual work hours for the activity categories is as follows:
CESQG 100-300 hours/year/enforcement SQG 200-300 hours/year/enforcement LQG 200-300 hours/year/enforcement TSDF 210-1500 hours/year/enforcement Transporter 200-300hours/year/enforcement
The Task Force discussed if other States not represented on the Task Force could use the activity categorization. The Task Force is convinced that with little, if any, additional instruction, a State could decide to include activities that were not contemplated by the Task Force. Again, those hours could be included in the appropriate activity category for that State. The types of activities that broadly fit into each category are not as important as the fact that they are incorporated into the estimate. With this degree of flexibility, State-specific estimates should account for all possible activities that are required to operate and maintain their inspection programs.

State RCRA Subtitle C Core Program Implementation Costs Final Report - January 2007
Page 59 of 90 Appendix I
Cost Analysis Methodology Following activity categorization and estimation of actual work hours to perform enforcement activities, the Task Force used the same cost-estimating methodology developed for the permitting cost project and utilized for the inspections cost project. This methodology is incorporated into a self-contained, Microsoft Excel spreadsheet. Once opened, the spreadsheet instructions are largely self-explanatory in the column legend. Example spreadsheets for Utah and Missouri are included as attachments to this project report. The elements and use of the spreadsheet are summarized below. Column A is the place to list the State name. Column B lists the activity categories developed by the Task Force. Column C lists any activity subdivisions as categorized by individual States. Columns D and F are for user input and represent the low and high number of actual work hours, respectively, for each activity category and subdivision. A “total” option is available for each activity category in the event that subdivision of the category is not desired or available. During methodology development, there was considerable discussion concerning use of average hours for cost estimation. Currently, the spreadsheet automatically calculates an arithmetic average of the high and low hours in Column E. However, the Task Force recognized that use of a “weighted” average would be more representative and should be used whenever possible (i.e., one or two facilities representing the low or high end of the range should not be allowed to grossly skew the arithmetic average used for cost calculation purposes). The adjustment factor presented in Column J was incorporated for use in adjusting (upward or downward) the arithmetic average hours calculated in Column E. Alternatively, some States may wish to directly input weighted average hours into the spreadsheet in Column E and leave the adjustment factor at unity (1.00). Columns G, H, and I are for user input and represent the low, weighted-average and high hourly pay rates, respectively, for staff performing actual enforcement work. For salaried employees, the low and high numbers are simply the employee’s annual salary divided by the number of work hours in a calendar year. The weighted average is user-inputted (not calculated by the spreadsheet) and represents an average of the salary for all staff performing enforcement activities. This calculation can be accomplished by adding the salaries of all enforcement staff and dividing by the number of employees performing the tasks. This will eliminate the salary skew that would occur from a primarily senior or primarily novice enforcement staff where the majority of salaries are clumped to one end of the spectrum or the other. Columns K, L and M are calculated by the spreadsheet and represent the low, average and high cost of each activity, respectively, based on the information contained in Columns D through J. Note that Column J does not impact the low or high cost, only the average cost. Column N is a user-inputted State multiplier. This multiplier is designed to be State-specific and to capture overarching costs not included in the hourly salary rates. The multiplier may include, but not be limited to, any support costs such as: overhead, fringe, clerical, administrative, legal and supervisory support. As an example, if a State enforcement program had in its grant that 20% of the grant monies funded indirect costs, a State may choose to input

State RCRA Subtitle C Core Program Implementation Costs Final Report - January 2007
Page 60 of 90 Appendix I
a 1.2 in Column H to capture these indirect costs. For States that operate on a flat hourly rate that already incorporates the items covered by the multiplier, the flat rate could be used as the weighted average salary in Column H and the multiplier simply held to unity (1.00). It should be noted that due to the varying nature of State enforcement programs, legal costs might be a direct cost rather than an indirect cost. Column O is the user-inputted number of activities performed annually in each category. This number can be estimated based on past performance, future plans, best professional judgment or a combination thereof. If a range of aggregate annual hours (across all facilities) is used to estimate costs, the corresponding number of annual activities represented in Column O should be held to unity (1.00). However, if the hours reported on the spreadsheet were per enforcement activity, the total number of activities would be entered in Column O. This will hopefully allow each State to input data in the format they currently have available. It should also be noted that enforcement activities might not be completed during a single year. Partial enforcement activities can be recorded on the spreadsheet in any fraction the State chooses to use. Columns P, Q and R are calculated by the spreadsheet and represent the low, average and high gross annual costs of each activity, respectively, based on the information contained in Columns K through O. At the bottom of columns P, Q and R, the spreadsheet automatically calculates the low, average and high gross annual cost of the State’s enforcement program as a whole. These figures represent gross annual cost estimates only. Any enforcement penalties or other fees that might be available to offset the overall cost of State program operation are not addressed in this analysis. The Task Force would like to express its appreciation to the ASTSWMO Board for its interest in development of the concepts and recommendations contained herein. The Task Force would also like to thank the ASTSWMO Corrective Action and Permitting Task Force for allowing us to build on their ideas to create a cost estimate for enforcement that can easily be combined with the cost estimates they have generated for permitting and corrective action and the cost estimates this Task Force has generated for inspections. If you have any questions concerning the Task Force’s work or want to discuss this project further, please feel free to contact Task Force chair Cheryl Coleman at 803-896-4000.

Page 61 of 90

State RCRA Subtitle C Core Program Implementation Costs Final Report - January 2007
Page 62 of 90 Appendix I
ANNEX 5
PROGRAM DEVELOPMENT
RCRA Core Project Pilot
State Cost Analysis Methodology for Program Development
Prepared by the ASTSWMO Program Operations Task Force
for the ASTSWMO Board of Directors
July 6, 2005 The ASTSWMO Program Operations Task Force was assigned the task of determining the “core” set of program elements associated with RCRA Program development for potential use by States to calculate the real costs associated with developing and maintaining State RCRA programs. This report outlines the specific tasks evaluated along with a discussion of how the members arrived at the approach developed and advocated by the group.
Activity Categories The Task Force began the project by identifying the activities associated with program development. It was quickly apparent that unlike permitting, enforcement and other more mainstream programmatic activities, program management functions vary widely from State to State. The program management activities conducted by a State are directly related to the resources available from State and federal funds and they are dependent upon whether or not the State creates its own rules or incorporates by reference. It seems that as funds diminish, program management activities tend to be among the first activities cut and/or consolidated. This does not indicate a lack of value of these activities but rather that these activities do not produce hard outputs and do not easily lend themselves to “bean counting” goals. In States that incorporate by reference, there is no need for a number of these activities to be undertaken or the workload is minimal. Acknowledging this disparity, the Task Force agreed on a number of functions common to program management, although not all States conduct all of the following activities: 1) Grant/Annual Work Plan Activities; 2) Regulatory Analysis of Federal HW Rules; 3) State Legislative Activities; 4) State Rulemaking; 5) State Outreach/Guidance/Policy Development/ Implementation Activities; 6) State Authorization Application Activities; 7) RCRA HW Data Management Activities; 8) Innovative Projects, and 9) Health and Safety Training. A representative sampling of the activities in each category includes, but is not necessarily limited

State RCRA Subtitle C Core Program Implementation Costs Final Report - January 2007
Page 63 of 90 Appendix I
to the following: Grant/Annual Work Plan Activities: Includes Grant/Work Plan development, negotiations with EPA, quarterly meetings with EPA, quarterly, semi-annual and annual report development, and program reviews. Regulatory Analysis of Federal HW Rules: Analysis of proposed federal rules, development of State comments on proposals and consideration of proposals for State rules. State Legislative Activities: Presentation of statutory initiatives, analysis of impacts to State hazardous waste program, and identification of needed State rule changes State Rulemaking: Includes development of State rules (incorporation by reference), development of State rules (as stand alone), and Attorney General’s (AG’s) review or other legal certification (where applicable.) State Outreach/Guidance/Policy Development/Implementation Activities: Includes public notices, public meetings/hearings, presentations to State environmental boards, development of guidance, development of policies, development of outreach and training materials, compliance assistance activities, training sessions, and ongoing rule interpretation. State Authorization Application Activities: Includes development of the modified program description, negotiations with EPA, development of revised memorandum of understanding (where applicable), development of AG’s Statement, and review/approval by the AG. RCRA HW Data Management Activities: Includes RCRAInfo, review of Biennial report changes and updates, printing of revised biennial report forms for public use, outreach to public, processing of biennial report data for EPA and State annual hazardous waste reports. Innovative Projects: Includes development and implementation of new State hazardous waste initiatives (electronic waste, mercury switches, pollution prevention, etc.) Health and Safety Training: Includes training and recertification, personal protection and medical monitoring. (It is important that the States capture this workload; however, many States show this in Compliance or Permitting). Estimation of Work Hours The Task Force estimated the range of work hours for the above activity categories and associated activity subdivisions. The Task Force agreed that the estimated range of work hours required to complete the activities would vary substantially based on the number of staff available for the activity and the degree to which each activity was pursued. In States with limited resources, many activities may be handled by one or two staff and only the bare minimum of each activity would be accomplished, while in other States with more resources, a more thorough undertaking of each activity might be pursued.

State RCRA Subtitle C Core Program Implementation Costs Final Report - January 2007
Page 64 of 90 Appendix I
Additionally, States that incorporate by reference may not need to undertake some of the activity categories or subdivisions, while most States that have to promulgate equivalent State rules and maintain authorization might need to address all of the activity categories and subdivisions. There will always be a level of effort required of these State (irrespective of the size of the hazardous waste handler universe) to update rules and authorization packages to maintain authorization. The table below presents estimated ranges of actual work hours to complete the elements in each broad activity category identified above. States that provided the estimates reflected in the summary are Idaho, Colorado and New York. While this is an admittedly limited sample, the Task Force believes that these States are representative of the relative range of resources which are available to States to execute the Program Development portion of the RCRA program. Grant/Annual Work Plan Activities 0 to 4740 hours Regulatory Analysis of Federal HW Rules 0 to 820 hours State Legislative Activities 0 to 820 hours State Rulemaking 0 to 7400 hours State Outreach/Guidance/Policy Development/ Implementation/Activities 0 to 7475 hours State Authorization Application Activities 0 to 2480 hours RCRA HW Data Management Activities 0 to 24,640 hours Innovative Projects 0 to 2580 hours Health and Safety Training 0 to 2680 hours
Cost Analysis Methodology Following activity categorization and estimation of actual work hours to perform program development activities, the Task Force used a different cost estimation methodology than that used by the Permitting and Corrective Action project. Due to the limited funding from EPA and the States’ need to supplement this funding as discussed above, for this preliminary look at the categories, States put together their analyses using baseline funding from EPA as the “low” range of costs and used the level of funding that they have needed to provide “above and beyond” EPA’s baseline as the “high” range value. This methodology is incorporated into the attached self-contained Microsoft Excel spreadsheet. Once opened, the spreadsheet instructions are largely self-explanatory in the column legend. Example spreadsheets for Idaho, Colorado and New York are included as attachments to this report. The elements and use of the spreadsheet are summarized below.

State RCRA Subtitle C Core Program Implementation Costs Final Report - January 2007
Page 65 of 90 Appendix I
Column A is the place to list the State name. Column B lists the activity categories developed by the Task Force. Column C1 lists any activity subdivisions as categorized by individual States. Column C2 lists the user-defined estimation basis for the subdivisions listed in Column C1. Columns D, E and F are for user input and represent the low and high number of actual or estimated work hours, respectively, for each activity category and subdivision. A “total” option is available for each activity category in the event that subdivision of the category is not desired. Columns G, H, and I are for user input and represent the low, weighted-average and high hourly pay rates, respectively, for staff performing actual program development work. For salaried employees, the low and high numbers are simply the employee’s annual salary divided by the number of work hours in a calendar year. Neither Colorado, Idaho, nor New York used weighted averages. Columns K, L and M are calculated by the spreadsheet and represent the low, average and high cost of each activity, respectively, based on the information contained in Columns D through J. Column N is a user-inputted State multiplier. In this column, New York used a multiplier of 1.00 due to the use of fully loaded labor costs in columns G, H, and I. Colorado and Idaho did not used weighted average hours or weighted pay rates in columns D, E, F, G, H, or I. Instead, they used a State multiplier greater than 1.00 in this column. Column O is the user-inputted number of activities performed annually in each category. This number can be estimated based on past performance, future plans, best professional judgment or a combination thereof. If a range of aggregate annual hours (across all facilities) is used to estimate costs, the corresponding number of annual activities represented in Column O should be held to unity (1.00). Columns P, Q and R are calculated by the spreadsheet and represent the low, average and high gross annual costs of each activity, respectively, based on the information contained in Columns K through O. At the bottom of columns P, Q and R, the spreadsheet automatically calculates the low, average and high gross annual cost of the State’s program development activities. These figures represent gross annual cost estimates only. The Task Force would like to express its appreciation to the ASTSWMO Board for its interest in development of the concepts and recommendations contained herein. Provided that States carefully consider and develop State-specific inputs to the spreadsheet, the cost estimating methodology can provide reasonable and technically defensible cost estimates which can be used for a variety of purposes. The cost estimating methodology is flexible enough to be adapted to virtually any State program, and can serve as a model for cost estimating in other RCRA program areas that are being considered. The Task Force would welcome any additional peer review of its work by States not represented on the Task Force.

State RCRA Subtitle C Core Program Implementation Costs Final Report - January 2007
Page 66 of 90 Appendix I
If you have any questions concerning the Task Force’s work or want to discuss this project further, please feel free to contact Task Force chair Bob Haggerty, New York State DEC at 518-402-8712 or Task Force member John Brueck, Idaho DEQ at 208-373-0458.

Page 67 of 90

State RCRA Subtitle C Core Program Implementation Costs Final Report - January 2007
Page 68 of 90 Appendix II
Appendix II – Process Methodology
This appendix provides the process methodology used by means of the spreadsheets and other information related to the collection of program cost information by the ASTSWMO Hazard-ous Waste Subcommittee as a part of the RCRA Core Project data collection. By using the information and column legends on the spreadsheets, you should be able to do similar studies for your State’s program. You will need to contact the ASTSWMO Hazardous Waste Sub-committee through the ASTSWMO staff to obtain the working Excel spreadsheets. The intent of this appendix is to provide interested parties sufficient information to determine the scope of effort that might be needed to do this study in your own State.

Page 69 of 90

State RCRA Subtitle C Core Program Implementation Costs Final Report - January 2007
Page 70 of 90 Appendix II

State RCRA Subtitle C Core Program Implementation Costs Final Report - January 2007
Page 71 of 90 Appendix II
Col
umn
Lege
nd
(A) -
You
r Sta
te
(B) -
Cor
rect
ive
Act
ion
& P
erm
ittin
g Ta
sk F
orce
- e
stab
lishe
d ac
tivity
cat
egor
ies
(C
1) -
Perm
ittin
g an
d C
orre
ctiv
e A
ctio
n Ta
sk F
orce
- e
stab
lishe
d ca
tego
ry s
ubdi
visi
ons
(C2)
- Es
timat
ion
basi
s - t
o be
def
ined
by
user
. (D
) - L
owes
t est
imat
e of
act
ual w
orki
ng h
ours
nec
essa
ry to
per
form
act
ivity
(E
) - A
vera
ge e
stim
ate
of a
ctua
l wor
king
hou
rs n
eces
sary
to p
erfo
rm a
ctiv
ity.
Not
e: S
prea
dshe
et c
alcu
late
s ar
ithm
etic
ave
rage
whi
ch
may
or m
ay n
ot b
e ap
prop
riate
in s
tate
-spe
cific
circ
umst
ance
s as
the
low
and
hig
h es
timat
es m
ay re
pres
ent e
stim
ate
"ext
rem
es."
It is
ant
icip
ated
that
dev
elop
men
t of a
"w
eigh
ted"
ave
rage
(e.g
., th
e av
erag
e of
indi
vidu
al s
taff
time
estim
ates
for a
par
ticul
ar s
tate
) fo
r use
in c
ost-e
stim
atin
g w
ill li
kely
pro
duce
a b
ette
r est
imat
e.
If t
his
is d
one
the
arith
met
ic e
stim
ate
can
sim
ply
be a
djus
ted
upw
ard
or d
ownw
ard
by a
pply
ing
the
appr
opria
te a
djus
tmen
t fac
tor
in C
olum
n J
of th
e sp
read
shee
t.
(F
) - H
ighe
st e
stim
ate
of a
ctua
l wor
king
hou
rs n
eces
sary
to p
erfo
rm a
ctiv
ity
(G) -
Low
est s
tate
-spe
cific
hou
rly ra
te (s
alar
y co
nver
ted
to h
ourly
rate
by
divi
ding
ann
ual s
alar
y by
sta
ndar
d nu
mbe
r of a
nnua
l wor
king
ho
urs)
for s
taff
perf
orm
ing
activ
ities
. (H
) - W
eigh
ted
aver
age
stat
e-sp
ecifi
c ho
urly
rate
(sal
ary
conv
erte
d to
hou
rly ra
te b
y di
vidi
ng e
ach
pers
on's
ann
ual s
alar
y by
sta
ndar
d nu
mbe
r of a
nnua
l wor
king
hou
rs fo
r eac
h st
aff p
erso
n pe
rfor
min
g ac
tiviti
es) t
hen
sum
min
g th
e
ho
urly
rate
s an
d di
vidi
ng b
y th
e nu
mbe
r of e
mpl
oyee
s. N
ote:
the
wor
k sh
eet d
oes
not p
erfo
rm th
is c
alcu
latio
n, it
mus
t be
done
ex
tern
ally
then
ent
ered
into
the
wor
k sh
eet.
(I) -
Hig
hest
sta
te-s
peci
fic h
ourly
rate
(sal
ary
conv
erte
d to
hou
rly ra
te b
y di
vidi
ng a
nnua
l sal
ary
by s
tand
ard
num
ber o
f ann
ual w
orki
ng
hour
s) fo
r sta
ff pe
rfor
min
g ac
tiviti
es.
(J) -
Adj
ustm
ent f
acto
r (if
nece
ssar
y, u
sed
as s
tate
-spe
cific
adj
ustm
ent t
o ar
ithm
etic
ave
rage
hou
rs c
alcu
late
d in
Col
umn
E to
acc
ount
fo
r wei
ghtin
g (I.
e., a
rithm
etic
ave
rage
hou
r fig
ure
is d
eter
min
ed to
be
too
high
or t
oo lo
w).
A
s an
alte
rnat
ive,
spr
eads
heet
cou
ld b
e m
odifi
ed to
sho
w w
eigh
ted
aver
age
hour
s (a
s op
pose
d to
arit
hmet
ic a
vera
ge) a
nd e
limin
ate
the
need
for a
n ad
just
men
t fac
tor c
olum
n or
the
adju
stm
ent d
efau
lt co
uld
sim
ply
be le
ft at
1.0
0 if
wei
ghte
d ho
urs
are
used
. (K
) - A
ctiv
ity c
ost l
ow =
low
est
imat
ed h
ours
tim
es lo
w ra
te
(L
) - A
ctiv
ity c
ost a
vera
ge =
ave
rage
est
imat
ed h
ours
tim
es w
eigh
ted
aver
age
rate
(M
)- A
ctiv
ity c
ost h
igh
= hi
gh e
stim
ated
hou
rs ti
mes
hig
h ra
te
(N) -
Sta
te-s
peci
fic c
ost m
ultip
lier i
nclu
ding
, but
not
lim
ited
to: o
verh
ead;
frin
ge; c
leric
al, a
dmin
istr
ativ
e, le
gal a
nd s
uper
viso
ry s
uppo
rt,
etc.
Not
e: If
sta
tes
oper
ate
on a
flat
hou
rly ra
te
w
hich
alre
ady
inco
rpor
ates
the
item
s co
vere
d by
this
mul
tiplie
r, th
at ra
te w
ould
pro
babl
y be
use
d as
an
aver
age
and
the
mul
tiplie
r w
ould
sim
ply
be h
eld
to 1
.00.
(O
) - N
umbe
r of a
ctiv
ities
per
form
ed a
nnua
lly in
eac
h ca
tego
ry.
Set t
o un
ity (1
.00)
if e
stim
ated
rang
e of
hou
rs is
ann
ual a
ggre
gate
for
that
act
ivity
.
(P) -
Low
gro
ss a
nnua
l cos
t = A
ctiv
ity c
ost l
ow (C
olum
n K
) tim
es #
of a
nnua
l act
iviti
es (C
olum
n O
) (Q
) - A
vera
ge g
ross
ann
ual c
ost =
Act
ivity
cos
t ave
rage
(Col
umn
L) ti
mes
# o
f ann
ual a
ctiv
ities
(Col
umn
O) (
incl
udes
any
adj
ustm
ent
fact
or a
pplie
d in
Col
umn
J)
(R
) - H
igh
gros
s an
nual
cos
t = A
ctiv
ity c
ost h
igh
(Col
umn
M) t
imes
# o
f ann
ual a
ctiv
ities
(Col
umn
O)

State RCRA Subtitle C Core Program Implementation Costs Final Report - January 2007
Page 72 of 90 Appendix II

State RCRA Subtitle C Core Program Implementation Costs Final Report - January 2007
Page 73 of 90 Appendix II
Col
umn
Lege
nd
(A) -
You
r Sta
te
(B) -
Per
mitt
ing
and
Cor
rect
ive
Act
ion
Task
For
ce -
est
ablis
hed
activ
ity c
ateg
orie
s
(C) -
Per
mitt
ing
and
Cor
rect
ive
Act
ion
Task
For
ce -
est
ablis
hed
faci
lity
type
s (D
) - L
owes
t est
imat
e of
act
ual w
orki
ng h
ours
nec
essa
ry to
per
form
act
ivity
(E
) - A
vera
ge e
stim
ate
of a
ctua
l wor
king
hou
rs n
eces
sary
to p
erfo
rm a
ctiv
ity.
Not
e: S
prea
dshe
et c
alcu
late
s ar
ithm
etic
ave
rage
w
hich
may
or m
ay n
ot b
e ap
prop
riate
in s
tate
-spe
cific
circ
umst
ance
s as
the
low
and
hig
h es
timat
es m
ay re
pres
ent e
stim
ate
"ext
rem
es."
It is
ant
icip
ated
that
dev
elop
men
t of a
"w
eigh
ted"
ave
rage
(e.g
., th
e av
erag
e of
indi
vidu
al s
taff
time
estim
ates
for a
par
ticul
ar
stat
e) fo
r use
in c
ost-e
stim
atin
g w
ill li
kely
pro
duce
a b
ette
r est
imat
e.
If t
his
is d
one
the
arith
met
ic e
stim
ate
can
sim
ply
be a
djus
ted
upw
ard
or d
ownw
ard
by a
pply
ing
the
appr
opria
te a
djus
tmen
t fac
-to
r in
Col
umn
J of
the
spre
adsh
eet.
(F) -
Hig
hest
est
imat
e of
act
ual w
orki
ng h
ours
nec
essa
ry to
per
form
act
ivity
(G
) - L
owes
t sta
te-s
peci
fic h
ourly
rate
(sal
ary
conv
erte
d to
hou
rly ra
te b
y di
vidi
ng a
nnua
l sal
ary
by s
tand
ard
num
ber o
f ann
ual
wor
king
hou
rs) f
or s
taff
perf
orm
ing
activ
ities
. (H
) - W
eigh
ted
aver
age
stat
e-sp
ecifi
c ho
urly
rate
(sal
ary
conv
erte
d to
hou
rly ra
te b
y di
vidi
ng e
ach
pers
on's
ann
ual s
alar
y by
sta
n-da
rd n
umbe
r of a
nnua
l wor
king
hou
rs fo
r eac
h st
aff p
erso
n pe
rfor
min
g ac
tiviti
es) t
hen
sum
min
g th
e
ho
urly
rate
s an
d di
vidi
ng b
y th
e nu
mbe
r of e
mpl
oyee
s. N
ote:
the
wor
k sh
eet d
oes
not p
erfo
rm th
is c
alcu
latio
n, it
mus
t be
done
ext
erna
lly th
en e
nter
ed in
to th
e w
ork
shee
t. (I)
- H
ighe
st s
tate
-spe
cific
hou
rly ra
te (s
alar
y co
nver
ted
to h
ourly
rate
by
divi
ding
ann
ual s
alar
y by
sta
ndar
d nu
mbe
r of a
nnua
l wor
k-in
g ho
urs)
for s
taff
perf
orm
ing
activ
ities
. (J
) - A
djus
tmen
t fac
tor (
if ne
cess
ary,
use
d as
sta
te-s
peci
fic a
djus
tmen
t to
arith
met
ic a
vera
ge h
ours
cal
cula
ted
in C
olum
n E
to a
c-co
unt f
or w
eigh
ting
(I.e.
, arit
hmet
ic a
vera
ge h
our f
igur
e is
det
erm
ined
to b
e to
o hi
gh o
r too
low
).
As
an a
ltern
ativ
e, s
prea
dshe
et c
ould
be
mod
ified
to s
how
wei
ghte
d av
erag
e ho
urs
(as
oppo
sed
to a
rithm
etic
ave
rage
) and
elim
i-na
te th
e ne
ed fo
r an
adju
stm
ent f
acto
r col
umn
or th
e ad
just
men
t def
ault
coul
d si
mpl
y be
left
at 1
.00
if w
eigh
ted
hour
s ar
e us
ed.
(K) -
Act
ivity
cos
t low
= lo
w e
stim
ated
hou
rs ti
mes
low
rate
(L) -
Act
ivity
cos
t ave
rage
= a
vera
ge e
stim
ated
hou
rs ti
mes
wei
ghte
d av
erag
e ra
te
(M)-
Act
ivity
cos
t hig
h =
high
est
imat
ed h
ours
tim
es h
igh
rate
(N
) - S
tate
-spe
cific
cos
t mul
tiplie
r inc
ludi
ng, b
ut n
ot li
mite
d to
: ove
rhea
d; fr
inge
; cle
rical
, adm
inis
trat
ive,
lega
l and
sup
ervi
sory
sup
-po
rt, e
tc.
Not
e: If
sta
tes
oper
ate
on a
flat
hou
rly ra
te
w
hich
alre
ady
inco
rpor
ates
the
item
s co
vere
d by
this
mul
tiplie
r, th
at ra
te w
ould
pro
babl
y be
use
d as
an
aver
age
and
the
mul
ti-pl
ier w
ould
sim
ply
be h
eld
to 1
.00.
(O
) - N
umbe
r of a
ctiv
ities
per
form
ed a
nnua
lly in
eac
h ca
tego
ry
(P) -
Low
gro
ss a
nnua
l cos
t = A
ctiv
ity c
ost l
ow (C
olum
n K
) tim
es #
of a
nnua
l act
iviti
es (C
olum
n O
) (Q
) - A
vera
ge g
ross
ann
ual c
ost =
Act
ivity
cos
t ave
rage
(Col
umn
L) ti
mes
# o
f ann
ual a
ctiv
ities
(Col
umn
O) (
incl
udes
any
adj
ust-
men
t fac
tor a
pplie
d in
Col
umn
J)
(R
) - H
igh
gros
s an
nual
cos
t = A
ctiv
ity c
ost h
igh
(Col
umn
M) t
imes
# o
f ann
ual a
ctiv
ities
(Col
umn
O)

State RCRA Subtitle C Core Program Implementation Costs Final Report - January 2007
Page 74 of 90 Appendix II

State RCRA Subtitle C Core Program Implementation Costs Final Report - January 2007
Page 75 of 90 Appendix II
Col
umn
Lege
nd
(A) -
You
r Sta
te
(B) -
HW
Enf
orce
men
t & C
ompl
ianc
e A
ssur
ance
Tas
k Fo
rce
- es
tabl
ishe
d ac
tivity
cat
egor
ies
(C
) - H
W E
nfor
cem
ent &
Com
plia
nce
Ass
uran
ce T
ask
Forc
e -
esta
blis
hed
cate
gory
sub
divi
sion
s (D
) - L
owes
t est
imat
e of
act
ual w
orki
ng h
ours
nec
essa
ry to
per
form
act
ivity
(E
) - A
vera
ge e
stim
ate
of a
ctua
l wor
king
hou
rs n
eces
sary
to p
erfo
rm a
ctiv
ity.
Not
e: S
prea
dshe
et c
alcu
late
s ar
ithm
etic
ave
rage
whi
ch m
ay o
r may
not
be
app
ropr
iate
in s
tate
-spe
cific
circ
umst
ance
s as
the
low
and
hig
h es
timat
es m
ay re
pres
ent e
stim
ate
"ext
rem
es."
It is
ant
icip
ated
that
dev
elop
men
t of a
"w
eigh
ted"
ave
rage
(e.g
., th
e av
erag
e of
indi
vidu
al s
taff
time
estim
ates
for a
par
ticul
ar s
tate
) for
use
in
cost
-est
imat
ing
will
like
ly p
rodu
ce a
bet
ter e
stim
ate.
I
f thi
s is
don
e th
e ar
ithm
etic
est
imat
e ca
n si
mpl
y be
adj
uste
d up
war
d or
dow
nwar
d by
app
lyin
g th
e ap
prop
riate
adj
ustm
ent f
acto
r in
Col
umn
J of
th
e sp
read
shee
t.
(F
) - H
ighe
st e
stim
ate
of a
ctua
l wor
king
hou
rs n
eces
sary
to p
erfo
rm a
ctiv
ity
(G) -
Low
est s
tate
-spe
cific
hou
rly ra
te (s
alar
y co
nver
ted
to h
ourly
rate
by
divi
ding
ann
ual s
alar
y by
sta
ndar
d nu
mbe
r of a
nnua
l wor
king
hou
rs) f
or s
taff
perf
orm
ing
activ
ities
. (H
) - W
eigh
ted
aver
age
stat
e-sp
ecifi
c ho
urly
rate
(sal
ary
conv
erte
d to
hou
rly ra
te b
y di
vidi
ng e
ach
pers
on's
ann
ual s
alar
y by
sta
ndar
d nu
mbe
r of a
n-nu
al w
orki
ng h
ours
for e
ach
staf
f per
son
perf
orm
ing
activ
ities
) the
n su
mm
ing
the
hour
ly ra
tes
and
divi
ding
by
the
num
ber o
f em
ploy
ees.
Not
e: th
e w
ork
shee
t doe
s no
t per
form
this
cal
cula
tion,
it m
ust b
e do
ne e
xter
nally
then
en
tere
d in
to th
e w
ork
shee
t. (I)
- H
ighe
st s
tate
-spe
cific
hou
rly ra
te (s
alar
y co
nver
ted
to h
ourly
rate
by
divi
ding
ann
ual s
alar
y by
sta
ndar
d nu
mbe
r of a
nnua
l wor
king
hou
rs) f
or s
taff
perf
orm
ing
activ
ities
. (J
) - A
djus
tmen
t fac
tor,
if ne
cess
ary,
use
d as
sta
te-s
peci
fic a
djus
tmen
t to
arith
met
ic a
vera
ge h
ours
cal
cula
ted
in C
olum
n E
to a
ccou
nt fo
r wei
ghtin
g (i.
e., a
rithm
etic
ave
rage
hou
r fig
ure
is d
eter
min
ed to
be
too
high
or t
oo lo
w).
A
s an
alte
rnat
ive,
spr
eads
heet
cou
ld b
e m
odifi
ed to
sho
w w
eigh
ted
aver
age
hour
s (a
s op
pose
d to
arit
hmet
ic a
vera
ge) a
nd e
limin
ate
the
need
for
an a
djus
tmen
t fac
tor c
olum
n or
the
adju
stm
ent d
efau
lt co
uld
sim
ply
be le
ft at
1.0
0 if
wei
ghte
d ho
urs
are
used
. (K
) - A
ctiv
ity c
ost l
ow =
low
est
imat
ed h
ours
tim
es lo
w ra
te
(L
) - A
ctiv
ity c
ost a
vera
ge =
ave
rage
est
imat
ed h
ours
tim
es w
eigh
ted
aver
age
rate
(M
)- A
ctiv
ity c
ost h
igh
= hi
gh e
stim
ated
hou
rs ti
mes
hig
h ra
te
(N) -
Sta
te-s
peci
fic c
ost m
ultip
lier i
nclu
ding
, but
not
lim
ited
to, s
uppo
rt fu
nctio
ns s
uch
as: o
verh
ead;
frin
ge; c
leric
al, a
dmin
istr
ativ
e, le
gal a
nd s
uper
vi-
sory
sup
port
, etc
. N
ote:
If s
tate
s op
erat
e on
a fl
at h
ourly
rate
whi
ch a
lread
y in
corp
orat
es th
e ite
ms
cove
red
by th
is m
ultip
lier,
that
rate
wou
ld p
roba
bly
be u
sed
as a
n av
erag
e an
d th
e m
ultip
lier w
ould
sim
ply
be h
eld
to 1
.00.
(O) -
Num
ber o
f act
iviti
es p
erfo
rmed
ann
ually
in e
ach
cate
gory
. Se
t to
unity
(1.0
0) if
est
imat
ed ra
nge
of h
ours
is a
nnua
l agg
rega
te fo
r tha
t act
ivity
.
(P) -
Low
gro
ss a
nnua
l cos
t = A
ctiv
ity c
ost l
ow (C
olum
n K
) tim
es #
of a
nnua
l act
iviti
es (C
olum
n O
) (Q
) - A
vera
ge g
ross
ann
ual c
ost =
Act
ivity
cos
t ave
rage
(Col
umn
L) ti
mes
# o
f ann
ual a
ctiv
ities
(Col
umn
O) (
incl
udes
any
adj
ustm
ent f
acto
r app
lied
in
Col
umn
J)
(R
) - H
igh
gros
s an
nual
cos
t = A
ctiv
ity c
ost h
igh
(Col
umn
M) t
imes
# o
f ann
ual a
ctiv
ities
(Col
umn
O)

State RCRA Subtitle C Core Program Implementation Costs Final Report - January 2007
Page 76 of 90 Appendix II

State RCRA Subtitle C Core Program Implementation Costs Final Report - January 2007
Page 77 of 90 Appendix II
Col
umn
Lege
nd
(A) -
You
r Sta
te
(B) -
HW
Enf
orce
men
t & C
ompl
ianc
e A
ssur
ance
Tas
k Fo
rce
- es
tabl
ishe
d ac
tivity
cat
egor
ies
(C) -
HW
Enf
orce
men
t & C
ompl
ianc
e A
ssur
ance
Tas
k Fo
rce
- es
tabl
ishe
d ca
tego
ry s
ubdi
visi
ons
(D) -
Low
est e
stim
ate
of a
ctua
l wor
king
hou
rs n
eces
sary
to p
erfo
rm a
ctiv
ity
(E) -
Ave
rage
est
imat
e of
act
ual w
orki
ng h
ours
nec
essa
ry to
per
form
act
ivity
. N
ote:
Spr
eads
heet
cal
cula
tes
arith
met
ic a
vera
ge w
hich
may
or m
ay n
ot
be a
ppro
pria
te in
sta
te-s
peci
fic c
ircum
stan
ces
as th
e lo
w a
nd h
igh
estim
ates
may
repr
esen
t est
imat
e "e
xtre
mes
."
It
is a
ntic
ipat
ed th
at d
evel
opm
ent o
f a "
wei
ghte
d" a
vera
ge (e
.g.,
the
aver
age
of in
divi
dual
sta
ff tim
e es
timat
es fo
r a p
artic
ular
sta
te) f
or u
se in
co
st-e
stim
atin
g w
ill li
kely
pro
duce
a b
ette
r est
imat
e.
If t
his
is d
one
the
arith
met
ic e
stim
ate
can
sim
ply
be a
djus
ted
upw
ard
or d
ownw
ard
by a
pply
ing
the
appr
opria
te a
djus
tmen
t fac
tor i
n C
olum
n J
of
the
spre
adsh
eet.
(F) -
Hig
hest
est
imat
e of
act
ual w
orki
ng h
ours
nec
essa
ry to
per
form
act
ivity
(G
) - L
owes
t sta
te-s
peci
fic h
ourly
rate
(sal
ary
conv
erte
d to
hou
rly ra
te b
y di
vidi
ng a
nnua
l sal
ary
by s
tand
ard
num
ber o
f ann
ual w
orki
ng h
ours
) for
sta
ff pe
rfor
min
g ac
tiviti
es.
(H) -
Wei
ghte
d av
erag
e st
ate-
spec
ific
hour
ly ra
te (s
alar
y co
nver
ted
to h
ourly
rate
by
divi
ding
eac
h pe
rson
's a
nnua
l sal
ary
by s
tand
ard
num
ber o
f an-
nual
wor
king
hou
rs fo
r eac
h st
aff p
erso
n pe
rfor
min
g ac
tiviti
es) t
hen
sum
min
g th
e
ho
urly
rate
s an
d di
vidi
ng b
y th
e nu
mbe
r of e
mpl
oyee
s. N
ote:
the
wor
k sh
eet d
oes
not p
erfo
rm th
is c
alcu
latio
n, it
mus
t be
done
ext
erna
lly th
en
ente
red
into
the
wor
k sh
eet.
(I) -
Hig
hest
sta
te-s
peci
fic h
ourly
rate
(sal
ary
conv
erte
d to
hou
rly ra
te b
y di
vidi
ng a
nnua
l sal
ary
by s
tand
ard
num
ber o
f ann
ual w
orki
ng h
ours
) for
sta
ff pe
rfor
min
g ac
tiviti
es.
(J) -
Adj
ustm
ent f
acto
r, if
nece
ssar
y, u
sed
as s
tate
-spe
cific
adj
ustm
ent t
o ar
ithm
etic
ave
rage
hou
rs c
alcu
late
d in
Col
umn
E to
acc
ount
for w
eigh
ting
(i.e.
, arit
hmet
ic a
vera
ge h
our f
igur
e is
det
erm
ined
to b
e to
o hi
gh o
r too
low
).
As
an a
ltern
ativ
e, s
prea
dshe
et c
ould
be
mod
ified
to s
how
wei
ghte
d av
erag
e ho
urs
(as
oppo
sed
to a
rithm
etic
ave
rage
) and
elim
inat
e th
e ne
ed fo
r an
adj
ustm
ent f
acto
r col
umn
or th
e ad
just
men
t def
ault
coul
d si
mpl
y be
left
at 1
.00
if w
eigh
ted
hour
s ar
e us
ed.
(K) -
Act
ivity
cos
t low
= lo
w e
stim
ated
hou
rs ti
mes
low
rate
(L) -
Act
ivity
cos
t ave
rage
= a
vera
ge e
stim
ated
hou
rs ti
mes
wei
ghte
d av
erag
e ra
te
(M)-
Act
ivity
cos
t hig
h =
high
est
imat
ed h
ours
tim
es h
igh
rate
(N
) - S
tate
-spe
cific
cos
t mul
tiplie
r inc
ludi
ng, b
ut n
ot li
mite
d to
, sup
port
func
tions
suc
h as
: ove
rhea
d; fr
inge
; cle
rical
, adm
inis
trat
ive,
lega
l and
sup
ervi
-so
ry s
uppo
rt, e
tc.
Not
e: If
sta
tes
oper
ate
on a
flat
hou
rly ra
te
w
hich
alre
ady
inco
rpor
ates
the
item
s co
vere
d by
this
mul
tiplie
r, th
at ra
te w
ould
pro
babl
y be
use
d as
an
aver
age
and
the
mul
tiplie
r wou
ld s
impl
y be
hel
d to
1.0
0.
(O) -
Num
ber o
f act
iviti
es p
erfo
rmed
ann
ually
in e
ach
cate
gory
. Se
t to
unity
(1.0
0) if
est
imat
ed ra
nge
of h
ours
is a
nnua
l agg
rega
te fo
r tha
t act
ivity
.
(P) -
Low
gro
ss a
nnua
l cos
t = A
ctiv
ity c
ost l
ow (C
olum
n K
) tim
es #
of a
nnua
l act
iviti
es (C
olum
n O
) (Q
) - A
vera
ge g
ross
ann
ual c
ost =
Act
ivity
cos
t ave
rage
(Col
umn
L) ti
mes
# o
f ann
ual a
ctiv
ities
(Col
umn
O) (
incl
udes
any
adj
ustm
ent f
acto
r app
lied
in
Col
umn
J)
(R) -
Hig
h gr
oss
annu
al c
ost =
Act
ivity
cos
t hig
h (C
olum
n M
) tim
es #
of a
nnua
l act
iviti
es (C
olum
n O
)

State RCRA Subtitle C Core Program Implementation Costs Final Report - January 2007
Page 78 of 90 Appendix II

State RCRA Subtitle C Core Program Implementation Costs Final Report - January 2007
Page 79 of 90 Appendix II
Col
umn
Lege
nd
(A) -
You
r Sta
te
(B) -
Pro
gram
Ope
ratio
ns T
ask
Forc
e - e
stab
lishe
d ca
tego
ries
(C1)
- Pr
ogra
m O
pera
tions
Tas
k Fo
rce
- est
ablis
hed
subc
ateg
orie
s
(C2)
- Es
timat
ion
basi
s - t
o be
def
ined
by
user
.
(D) -
Low
est e
stim
ate
of a
ctua
l wor
king
hou
rs n
eces
sary
to p
erfo
rm a
ctiv
ity
(E) -
Ave
rage
est
imat
e of
act
ual w
orki
ng h
ours
nec
essa
ry to
per
form
act
ivity
. N
ote:
Spr
eads
heet
cal
cula
tes
arith
met
ic a
vera
ge w
hich
may
or m
ay n
ot
be a
ppro
pria
te in
sta
te-s
peci
fic c
ircum
stan
ces
as th
e lo
w a
nd h
igh
estim
ates
my
repr
esen
t est
imat
e "e
xtre
mes
."
It
is a
ntic
ipat
ed th
at d
evel
opm
ent o
f a "
wei
ghte
d" a
vera
ge (e
.g.,
the
aver
age
of in
divi
dual
sta
ff tim
e es
timat
es fo
r a p
artic
ular
sta
te) f
or u
se in
co
st-e
stim
atin
g w
ill li
kely
pro
duce
a b
ette
r est
imat
e.
If t
his
is d
one
the
arith
met
ic e
stim
ate
can
sim
ply
be a
djus
ted
upw
ard
or d
ownw
ard
by a
pply
ing
the
appr
opria
te a
djus
tmen
t fac
tor i
n C
olum
n J
of
the
spre
adsh
eet.
(F) -
Hig
hest
est
imat
e of
act
ual w
orki
ng h
ours
nec
essa
ry to
per
form
act
ivity
(G
) - L
owes
t sta
te-s
peci
fic h
ourly
rate
(sal
ary
conv
erte
d to
hou
rly ra
te b
y di
vidi
ng a
nnua
l sal
ary
by s
tand
ard
num
ber o
f ann
ual w
orki
ng h
ours
) for
sta
ff pe
rfor
min
g ac
tiviti
es.
(H) -
Wei
ghte
d av
erag
e st
ate-
spec
ific
hour
ly ra
te (s
alar
y co
nver
ted
to h
ourly
rate
by
divi
ding
eac
h pe
rson
's a
nnua
l sal
ary
by s
tand
ard
num
ber o
f an-
nual
wor
king
hou
rs fo
r eac
h st
aff p
erso
n pe
rfor
min
g ac
tiviti
es) t
hen
sum
min
g th
e
ho
urly
rate
s an
d di
vidi
ng b
y th
e nu
mbe
r of e
mpl
oyee
s. N
ote:
the
wor
k sh
eet d
oes
not p
erfo
rm th
is c
alcu
latio
n, it
mus
t be
done
ext
erna
lly th
en
ente
red
into
the
wor
k sh
eet.
(I) -
Hig
hest
sta
te-s
peci
fic h
ourly
rate
(sal
ary
conv
erte
d to
hou
rly ra
te b
y di
vidi
ng a
nnua
l sal
ary
by s
tand
ard
num
ber o
f ann
ual w
orki
ng h
ours
) for
sta
ff pe
rfor
min
g ac
tiviti
es.
(J) -
Adj
ustm
ent f
acto
r (if
nece
ssar
y, u
sed
as s
tate
-spe
cific
adj
ustm
ent t
o ar
ithm
etic
ave
rage
hou
rs c
alcu
late
d in
Col
umn
E to
acc
ount
for w
eigh
ting
(I.e.
, arit
hmet
ic a
vera
ge h
our f
igur
e is
det
erm
ined
to b
e to
o hi
gh o
r too
low
).
As
an a
ltern
ativ
e, s
prea
dshe
et c
ould
be
mod
ified
to s
how
wei
ghte
d av
erag
e ho
urs
(as
oppo
sed
to a
rithm
etic
ave
rage
) and
elim
inat
e th
e ne
ed fo
r an
adj
ustm
ent f
acto
r col
umn
or th
e ad
just
men
t def
ault
coul
d si
mpl
y be
left
at 1
.00
if w
eigh
ted
hour
s ar
e us
ed.
(K) -
Act
ivity
cos
t low
= lo
w e
stim
ated
hou
rs ti
mes
low
rate
(L) -
Act
ivity
cos
t ave
rage
= a
vera
ge e
stim
ated
hou
rs ti
mes
wei
ghte
d av
erag
e ra
te
(M)-
Act
ivity
cos
t hig
h =
high
est
imat
ed h
ours
tim
es h
igh
rate
(N
) - S
tate
-spe
cific
cos
t mul
tiplie
r inc
ludi
ng, b
ut n
ot li
mite
d to
: ove
rhea
d; fr
inge
; cle
rical
, adm
inis
trat
ive,
lega
l and
sup
ervi
sory
sup
port
, etc
. N
ote:
If
stat
es o
pera
te o
n a
flat h
ourly
rate
whi
ch a
lread
y in
corp
orat
es th
e ite
ms
cove
red
by th
is m
ultip
lier,
that
rate
wou
ld p
roba
bly
be u
sed
as a
n av
erag
e an
d th
e m
ultip
lier w
ould
sim
ply
be h
eld
to 1
.00.
(O) -
Num
ber o
f act
iviti
es p
erfo
rmed
ann
ually
in e
ach
cate
gory
. Se
t to
unity
(1.0
0) if
est
imat
ed ra
nge
of h
ours
is a
nnua
l agg
rega
te fo
r tha
t act
ivity
.
(P) -
Low
gro
ss a
nnua
l cos
t = A
ctiv
ity c
ost l
ow (C
olum
n K
) tim
es #
of a
nnua
l act
iviti
es (C
olum
n O
) (Q
) - A
vera
ge g
ross
ann
ual c
ost =
Act
ivity
cos
t ave
rage
(Col
umn
L) ti
mes
# o
f ann
ual a
ctiv
ities
(Col
umn
O) (
incl
udes
any
adj
ustm
ent f
acto
r app
lied
in
Col
umn
J)
(R) -
Hig
h gr
oss
annu
al c
ost =
Act
ivity
cos
t hig
h (C
olum
n M
) tim
es #
of a
nnua
l act
iviti
es (C
olum
n O
)

State RCRA Subtitle C Core Program Implementation Costs Final Report - January 2007
Page 80 of 90 Appendix III
Appendix III – Pilot State Results This appendix provides the summary results of all ten pilot States participating in the study. (Note: The identity of individual State data is protected and cannot be provided without the expressed permission of the affected States.)

Page 81 of 90

State RCRA Subtitle C Core Program Implementation Costs Final Report - January 2007
Page 82 of 90 Appendix III
Remediation Cost Data for 10 Pilot States
Activity Category Activity Subdivision6 Annual # Gross Annual Of Activity Cost (avg.) Closure Work Plan Review & Approval 25 $225,493 Report Review & Approval 32 $160,660 Oversight Inspections 28 $44,456 Administrative Tasks 22 $32,562 Total (use only if no breakdown desired) 14 $138,187 RCRA Facility Assessments File/Records Review 9 $23,033 Visual Site Inspection 9 $14,185 Sampling and Analysis 6 $44,475 Report Preparation 9 $75,485 Administrative Tasks 7 $2,310 Total (use only if no breakdown desired) 14 $286,965 Corrective Action Instruments Permits (covered in previous work) 4 $3,073 Consent/Unilateral Orders 9 $51,710 Voluntary Agreements 13 $52,076 Total (use only if no breakdown desired) 13 $188,151 RCRA Facility Investigation Work Plan Review & Approval 27 $331,244 Report Review & Approval 29 $354,830 Oversight Inspections 33 $77,215 Administrative Tasks 20 $58,104 Total (use only if no breakdown desired) 29 $2,200,600 Interim Measures Work Plan Review & Approval 30 $130,398 Report Review & Approval 12 $61,900 Oversight Inspections 17 $39,104 Administrative Tasks 13 $34,200 Total (use only if no breakdown desired) 30 $1,674,031 6The “Total (use only if no breakdown desired)” value used in this column is not a summation of the individual subdivisions reported for an activity category. It is instead an alternative method of reporting category costs in lieu of providing costs by subdivision. Therefore, “Annual # of Activity” and “Gross Annual Cost (avg)” amounts for subdivisions within a category do not sum to the category “Total” amounts.

State RCRA Subtitle C Core Program Implementation Costs Final Report - January 2007
Page 83 of 90 Appendix III
Activity Category Activity Subdivision6 Annual # Gross Annual Of Activity Cost (avg.) Corrective Measures Study Work Plan Review & Approval 10 $95,881 Report Review & Approval 15 $186,296 Oversight Inspections 12 $30,148 Statement of Basis/Resp. to Comments 13 $32,442 Administrative Tasks 12 $26,865 Total (use only if no breakdown desired) 18 $1,266,748 Corrective Measures Implementation Work Plan Review & Approval 17 $139,500 Report Review & Approval 19 $158,555 Oversight Inspections 27 $44,083 Administrative Tasks 21 $33,936 Total (use only if no breakdown desired) 35 $1,174,387 Long-Term Oversight Report Review & Approval 141 $261,004 Inspections 33 $43,878 Administrative Tasks 101 $30,455 Total (use only if no breakdown desired) 93 $559,963 Corrective Action Completion Administrative Record Review 9 $8,003 Public Notice/RTC 7 $1,440 Total (use only if no breakdown desired) 20 $146,489 Technical Support Federal Facilities 5 $196,226 Superfund 5 $95,437 Other 7 $62,208 Total (use only if no breakdown desired) 26 $275,323 Planning, Evaluation & Reporting Environmental Indicator Evaluations 58 $398,154 Stabilization Evaluations 9 $52,924 PPA/PPG/Fac. Mgmt Planning 0 $0 Reporting to EPA 8 $30,393 RCRAInfo Data Entry 110 $52,099 Rulemaking and Authorization 1 $111,600 Cost-Recovery Activities 1 $3,073 Total (use only if no breakdown desired) 16 $351,595 Remediation (not otherwise specified) Total (no activity breakdown provided by one state) $2,038,774 Total Remediation Cost for Ten Pilot States $14,212,327

State RCRA Subtitle C Core Program Implementation Costs Final Report - January 2007
Page 84 of 90 Appendix III
Permitting Cost Data for 10 Pilot States
Activity Category Activity Subdivision Annual #
of Activity Gross Annual
Cost (avg.) Pre-application Activities Post-Closure 101 $198,763 Storage/Treatment 140 $170,106 Combustion 31 $82,854 Operating Land Disposal 9 $31,209 Application Review Post-Closure 41 $906,550 Storage/Treatment 46 $1,244,880 Combustion 9 $328,764 Operating Land Disposal 7 $643,699 Permit Issuance Post-Closure 38 $858,053 Storage/Treatment 50 $1,342,324 Combustion 8 $115,843 Operating Land Disposal 8 $318,798 Permit Maintenance Post-Closure 220 $1,056,433 Storage/Treatment 260 $808,701 Combustion 19 $162,459 Operating Land Disposal 9 $165,346 Permit Modifications Class I 142 $1,759,298 Class I with prior 51 $133,639 Class II 29 $233,791 Class III 37 $1,907,505 Agency-initiated 2 $49,096 Permitting (not otherwise specified)
Total (no activity breakdown provided by one state)
$144,594
Total Permitting Cost for Ten Pilot States $12,662,704

State RCRA Subtitle C Core Program Implementation Costs Final Report - January 2007
Page 85 of 90 Appendix III
Inspections Cost Data for 10 Pilot States
Activity Category Activity Subdivision7 Annual #
of Activity Gross Annual
Cost (avg.) CESQG CEI 874 $1,085,482 CSE 5 $5,220 CAV 136 $116,552 TAV 0 $0 Total (use only if no breakdown desired) 338 $627,061 SQG CEI 804 $1,092,679 CSE 5 $4,568 PEI 2533 $73,207 CAV 100 $35,786 TAV 0 $0 Total (use only if no breakdown desired) 577 $1,266,989 LQG CEI 403 $819,185 CSE 0 $0 PEI 467 $13,497 Multiple Units 0 $0 CAV 15 $10,234 TAV 0 $0 Total (use only if no breakdown desired) 568 $1,076,523 TSDF CEI 187 $598,335 CME 9 $87,598 O&M 19 $144,080 CSE 1 $1,906 Combustion Facility 4 $22,380 Closure/Post Closure Facility 22 $90,603 Multiple Units 2 $15,986 Total (use only if no breakdown desired) 230 $1,801,007 Complaint CEI 215 $379,848 CAV 0 $0
7The “Total (use only if no breakdown desired)” value used in this column is not a summation of the individual subdivisions reported for an activity category. It is instead an alternative method of reporting category costs in lieu of providing costs by subdivision. Therefore, “Annual # of Activity” and “Gross Annual Cost (avg)” amounts for subdivisions within a category do not sum to the category “Total” amounts.

State RCRA Subtitle C Core Program Implementation Costs Final Report - January 2007
Page 86 of 90 Appendix III
Total (use only if no breakdown desired) 1051 $1,553,213 EPA Lead CEI 39 $73,175 CSE 0 $0 Total (use only if no breakdown desired) 17 $55,428 Transporter CEI 43 $78,604 CSE 241 $57,789 Total (use only if no breakdown desired) 60 $80,375 Total Inspections Cost for Ten Pilot States $11,267,309
Activity Category Activity Subdivision7 Annual #
of Activity Gross Annual
Cost (avg.)

State RCRA Subtitle C Core Program Implementation Costs Final Report - January 2007
Page 87 of 90 Appendix III
Enforcement Cost Data for 10 Pilot States
Activity Category Activity Subdivision8 Annual #
of Activity Gross Annual
Cost (avg.) CESQG Case Evaluation/Determination 345 $132,825 Case Referral 30 $19,800 Case Development 345 $294,113 Case Negotiation 345 $170,775 Case Resolution 58 $51,333 Case Monitoring 61 $83,875 Case Support 25 $61,875 Total (use only if no breakdown desired) 76 $434,131 SQG Case Evaluation/Determination 142 $54,670 Case Referral 11 $7,040 Case Development 142 $121,055 Case Negotiation 142 $70,290 Case Resolution 42 $37,253 Case Monitoring 44 $60,500 Case Support 13 $31,350 Total (use only if no breakdown desired) 220 $1,381,352 LQG Case Evaluation/Determination 58 $27,115 Case Referral 5 $3,300 Case Development 58 $68,585 Case Negotiation 58 $38,280 Case Resolution 24 $25,428 Case Monitoring 26 $35,292 Case Support 3 $9,167 Total (use only if no breakdown desired) 192 $1,517,357 TSDF Case Evaluation/Determination 44 $20,726 Case Referral 2 $1,320 Case Development 44 $52,030 Case Negotiation 44 $29,040 Case Resolution 14 $14,978
8The “Total (use only if no breakdown desired)” value used in this column is not a summation of the individual subdivisions reported for an activity category. It is instead an alternative method of reporting category costs in lieu of providing costs by subdivision. Therefore, “Annual # of Activity” and “Gross Annual Cost (avg)” amounts for subdivisions within a category do not sum to the category “Total” amounts.

State RCRA Subtitle C Core Program Implementation Costs Final Report - January 2007
Page 88 of 90 Appendix III
Case Monitoring 16 $22,000 Case Support 2 $5,500 Total (use only if no breakdown desired) 101 $1,229,825 Transporter Case Evaluation/Determination 22 $8,598 Case Referral 4 $2,640 Case Development 22 $23,595 Case Negotiation 22 $10,890 Case Resolution 10 $8,507 Case Monitoring 12 $16,500 Case Support 3 $7,333 Total (use only if no breakdown desired) 17 $114,889 Total Enforcement Cost for Ten Pilot States $6,305,132
Activity Category Activity Subdivision8
Annual # of Activity
Gross Annual Cost (avg.)

State RCRA Subtitle C Core Program Implementation Costs Final Report - January 2007
Page 89 of 90 Appendix III
Program Development Cost Data for 10 Pilot States
Activity Category Activity Subdivision9 Annual #
of Activity Gross Annual
Cost (avg.) Grant/Workplan Activities Grant/Workplan Development 3 $24,933 Quarterly Meetings with EPA 14 $25,807 Quarterly Report Development 8 $10,140 Program Reviews 4 $33,080 Total (use only if no breakdown desired) 5 $320,856 Reg. Analysis of Fed. HW Regs. Development of Comments-Proposed Rule 15 $92,993 Proposals for State Rules to be Drafted 2 $25,831 Total (use only if no breakdown desired) 12 $137,000 State Legislative Activities Presentation of Statutory Initiatives 1 $328 Presentation of New Rule Proposals 1 $152 Presentation of HW Rule Updates 1 $126 Total (use only if no breakdown desired) 9 $108,279 Rulemaking Dev. of State Rules-Incorp. By Ref. States 2 $18,599 Dev. of Individual State Rules 0 $0 Review by Deputy Attorney General 0 $0 Total (use only if no breakdown desired) 8 $839,251 Outreach/Guidance/Policy Dev. Public Notices 4 $17,266 Public Meetings/Public Hearings 6 $28,582 Presentation to State Env. Boards 3 $13,508 Dev. Guidance/Policies/Fact Sheets/Trng 4 $21,170 Total (use only if no breakdown desired) 7 $173,577 Dev. Revised Authorization Apps. Dev. Modified Program Description 2 $4,465 (40 CFR 271.21) Dev. Memorandum of Agreement 2 $10,389 Dev. of AG's Statement 2 $3,605 Review by Deputy Attorney General 2 $2,861 Total (use only if no breakdown desired) 7 $297,911
9The “Total (use only if no breakdown desired)” value used in this column is not a summation of the individual subdivisions reported for an activity category. It is instead an alternative method of reporting category costs in lieu of providing costs by subdivision. Therefore, “Annual # of Activity” and “Gross Annual Cost (avg)” amounts for subdivisions within a category do not sum to the category “Total” amounts.

State RCRA Subtitle C Core Program Implementation Costs Final Report - January 2007
Page 90 of 90 Appendix III
RCRA HW Data Management RCRAInfo 5 $485,598 Biennial Reports 5 $450,511 State Annual HW Reports 4 $121,819 Total (use only if no breakdown desired) 4 $2,077,230 Innovative Projects Dev. of New State HW Initiatives 2 $19,642 Implementation of New State HW Initiatives 2 $35,581 Total (use only if no breakdown desired) 4 $424,231 Total Program Development Costs for Ten Pilot States $5,825,320
Activity Category Activity Subdivision9 Annual #
of Activity Gross Annual
Cost (avg.)
