state regulatory issues – analysis & trends
TRANSCRIPT

21 M
ay 2
017
VICE PRESIDENTRUSSELL A. FEINGOLD
STATE REGULATORY ISSUES – ANALYSIS & TRENDSAMERICAN GAS ASSOCIATION FINANCIAL FORUMMAY 21-23, 2017 - ORLANDO, FLORIDA
• Recent activities by utilities and regulators
• Observed rate case and financial results
• Regulatory highlights in the power industry
• Expectations for the future
TODAY’S DISCUSSION
2

RECENT ACTIVITIES BY UTILITIES AND REGULATORS
3

THE CURRENT STATE REGULATORY LANDSCAPE…
4
• Streamlining of the regulatory process for both gas and electric utilities continues in a number of states.
• There has been an increase in the number of “limited issue rider” regulatory proceedings (i.e., infrastructure cost recovery, rate stabilization, multi-year cases).
• Over 60 electric and gas utility rate cases are pending in 30 states.
• Authorized returns on equity for both gas and electric utilities continue to trend slightly downward.
• In a number of states, regulators continue to be very focused on electric utility issues (e.g., value of distributed energy resources, net metering issues, smart grid/AMI deployment, grid modernization).

• There is a recognition by all parties that the regulatory process has become much more complex than in the pasto Maintaining the proper level of regulatory scrutiny and
accountability has led over time to a lengthening of the regulatory process – with financial implications for the utility and its customers.
• Ability of the regulator, utility, and its stakeholders to operate
within the regulatory process to address and resolve the
utility’s various ratemaking and regulatory issues in an efficient
and cost-effective manner o Can be thought of as a “modernizing” of the existing ratemaking
process in order to lower costs to consumers and to ensure the financing and construction of the gas utility’s necessary infrastructure investments.
“STREAMLINING” THE REGULATORY PROCESS
5

• Approval of ratemaking trackers that address particular cost elements that cannot be adequately recognized and reflected in rates through the traditional rate case process
• Approval of rate of return stabilization mechanisms or formula rates
• Approval of step adjustments through multi-year rate plans
• Adoption of future test years and more balanced rate base and expense adjustments in rate cases
• The streamlining of the ratemaking and regulatory processes through the fostering of rate case settlements and other Alternate Dispute Resolution (ADR) processes
“STREAMLINING” THE REGULATORY PROCESS – HOW IS IT BEING DONE?
6
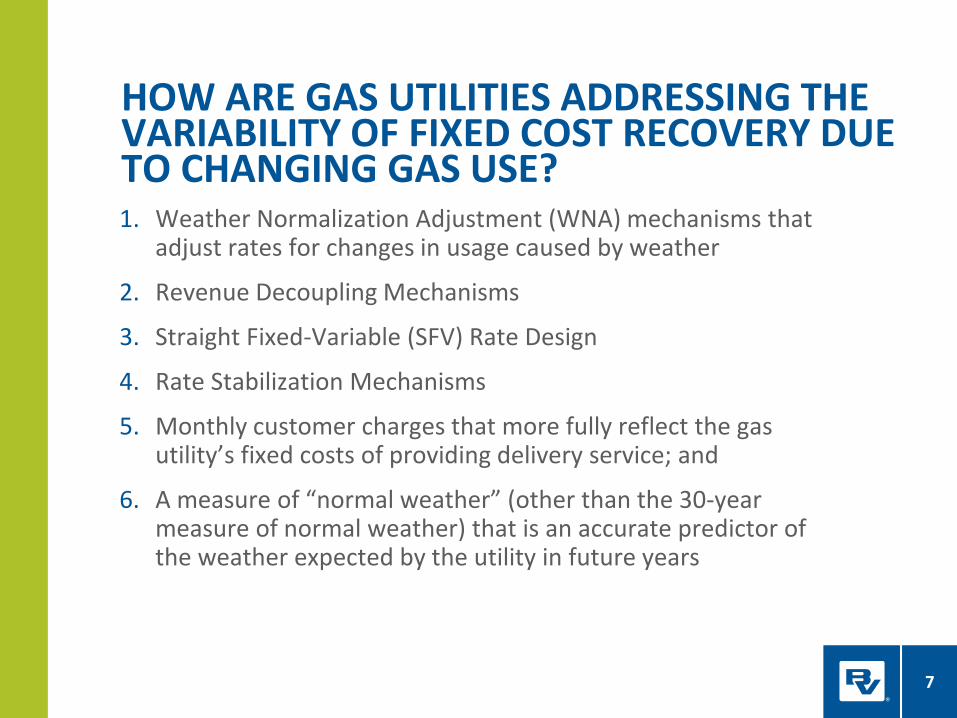
1. Weather Normalization Adjustment (WNA) mechanisms that adjust rates for changes in usage caused by weather
2. Revenue Decoupling Mechanisms
3. Straight Fixed-Variable (SFV) Rate Design
4. Rate Stabilization Mechanisms
5. Monthly customer charges that more fully reflect the gas utility’s fixed costs of providing delivery service; and
6. A measure of “normal weather” (other than the 30-year measure of normal weather) that is an accurate predictor of the weather expected by the utility in future years
HOW ARE GAS UTILITIES ADDRESSING THE VARIABILITY OF FIXED COST RECOVERY DUE TO CHANGING GAS USE?
7

WEATHER NORMALIZATION MECHANISMS
8Source: American Gas Association
(As of December 2016)

REVENUE DECOUPLING MECHANISMS
9Source: American Gas Association
(As of December 2016)

FLAT MONTHLY FEE RATE DESIGN (SFV)
10Source: American Gas Association
(As of December 2016)

INFRASTRUCTURE COST RECOVERY MECHANISMS
11Source: American Gas Association
(As of December 2016)

BAD DEBT RECOVERY MECHANISMS
12Source: American Gas Association
(As of December 2016)

PENSION AND OPEB COST RECOVERY
13Source: American Gas Association
(As of December 2016)
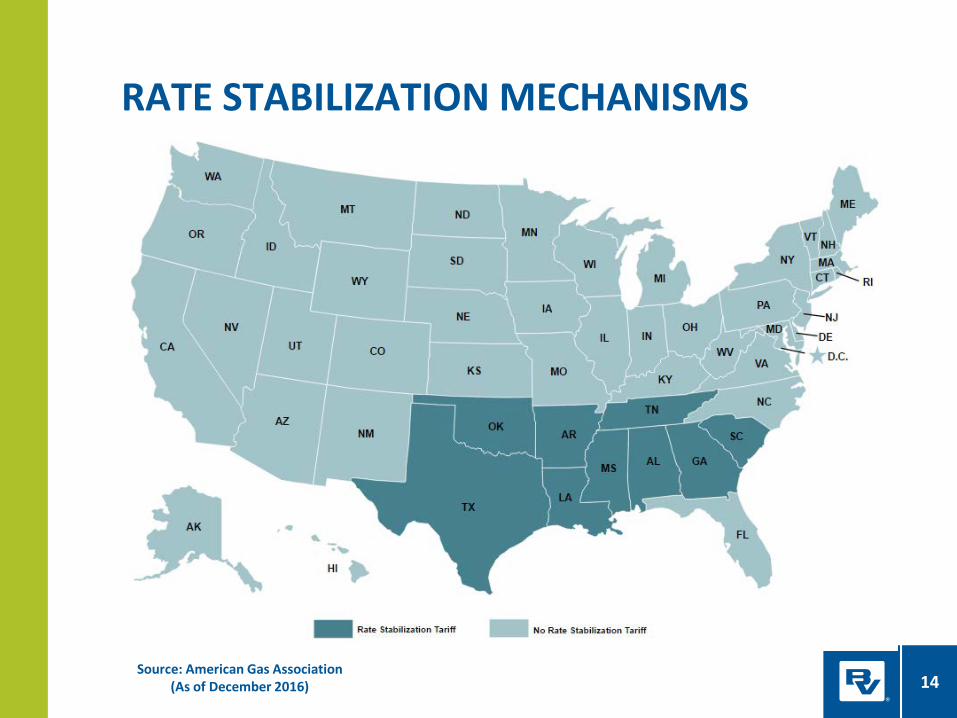
RATE STABILIZATION MECHANISMS
14Source: American Gas Association
(As of December 2016)

• The Georgia Rate Adjustment Mechanism (GRAM)• Approved in February 2017 – annual earnings review and base
revenue adjustment process• The GRAM establishes an ROE range of 10.55% to 10.95%, with a
target of 10.75% (± 20 basis point band)
ATLANTA GAS LIGHT’S ALTERNATIVE RATE PLAN
15
10.95%
10.55%
No Rate Adjustment
Rate Decrease
Rate Increase
• Annual rate adjustments made on a prospective basis
• Revenue True-Ups (RTU): compare actual base revenues to previous base revenue projections
• Established contents of annual filing • Quarterly financial filings

THE STRUCTURE OF MULTI-YEAR RATE PLANS(1)
16(1) As of January 2017
2-Step Rate Plan (18 states)
3-Step Rate Plan (4 states)
Over 3-Step Rate Plan (1 state)

NATURAL GAS ENERGY EFFICIENCY PROGRAMS
17Source: American Gas Association
(As of December 2016)
OBSERVED RATE CASE AND FINANCIAL RESULTS
18
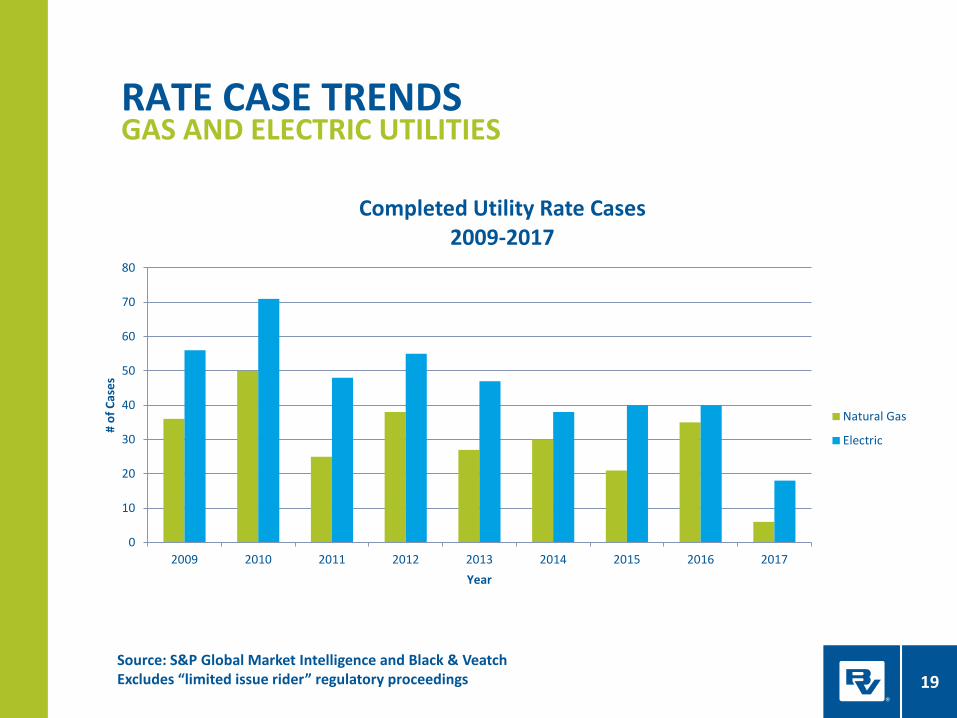
RATE CASE TRENDSGAS AND ELECTRIC UTILITIES
19Source: S&P Global Market Intelligence and Black & VeatchExcludes “limited issue rider” regulatory proceedings
0
10
20
30
40
50
60
70
80
2009 2010 2011 2012 2013 2014 2015 2016 2017
# of
Cas
es
Year
Completed Utility Rate Cases2009-2017
Natural Gas
Electric

RATE CASE TRENDSGAS AND ELECTRIC UTILITIES
20
0
5
10
15
20
25
2014 2015 2016 2017
# of
Cas
es
Year of Original Filing
Pending Rate Cases
Natural Gas
Electric
Source: S&P Global Market Intelligence and Black & VeatchExcludes “limited issue rider” regulatory proceedings

RATE CASE TRENDSGAS AND ELECTRIC UTILITIES
21
0
5
10
15
20
25
30
2015 2016 2017
# of
Cas
es
Filed Rate Cases(January - April)
Natural Gas
Electric
Source: S&P Global Market Intelligence and Black & VeatchExcludes “limited issue rider” regulatory proceedings
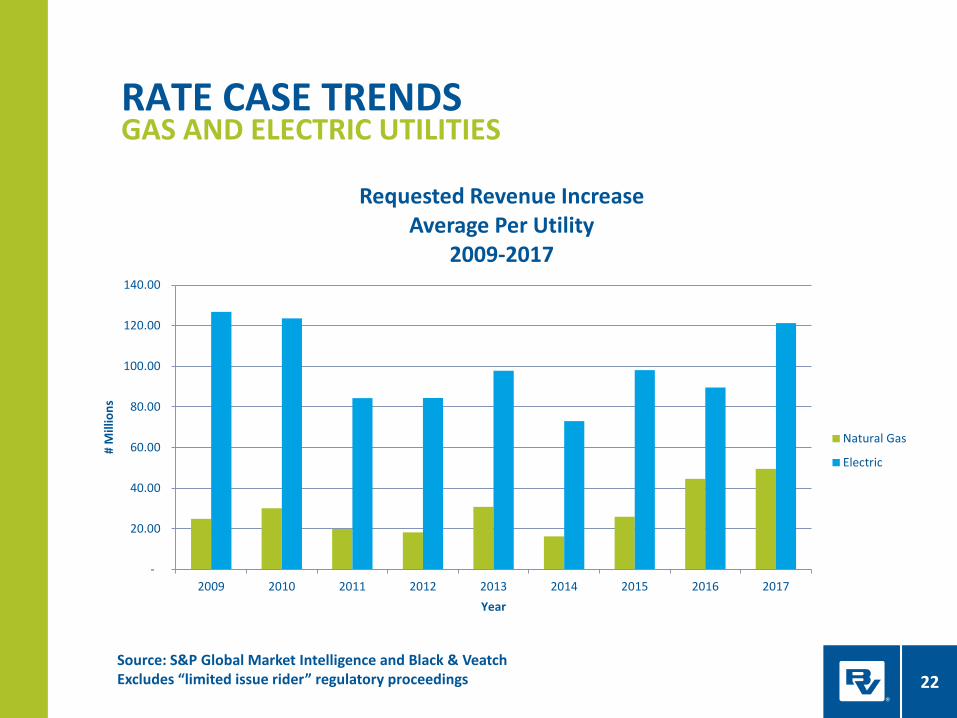
RATE CASE TRENDSGAS AND ELECTRIC UTILITIES
22
-
20.00
40.00
60.00
80.00
100.00
120.00
140.00
2009 2010 2011 2012 2013 2014 2015 2016 2017
# M
illio
ns
Year
Requested Revenue IncreaseAverage Per Utility
2009-2017
Natural Gas
Electric
Source: S&P Global Market Intelligence and Black & VeatchExcludes “limited issue rider” regulatory proceedings

RATE CASE TRENDSGAS AND ELECTRIC UTILITIES
23Source: S&P Global Market Intelligence and Black & VeatchExcludes “limited issue rider” regulatory proceedings
0%
10%
20%
30%
40%
50%
60%
70%
2009 2010 2011 2012 2013 2014 2015 2016 2017
Perc
ent
Year
Authorized Percentage of Requested Revenue IncreaseAverage Per Utility
2009-2017
Natural Gas
Electric

RATE CASE TRENDSGAS UTILITIES
24
8.00%
8.50%
9.00%
9.50%
10.00%
10.50%
11.00%
11.50%
12.00%
2009 2010 2011 2012 2013 2014 2015 2016 2017Year
Return on Equity - Gas Utilities2009-2017
Requested ROE
Authorized ROE
Source: S&P Global Market Intelligence and Black & VeatchExcludes “limited issue rider” regulatory proceedings

RATE CASE TRENDSELECTRIC UTILITIES
25
8.00%
8.50%
9.00%
9.50%
10.00%
10.50%
11.00%
11.50%
2009 2010 2011 2012 2013 2014 2015 2016 2017Year
Return on Equity - Electric Utilities2009-2017
Requested ROE
Authorized ROE
Source: S&P Global Market Intelligence and Black & VeatchExcludes “limited issue rider” regulatory proceedings
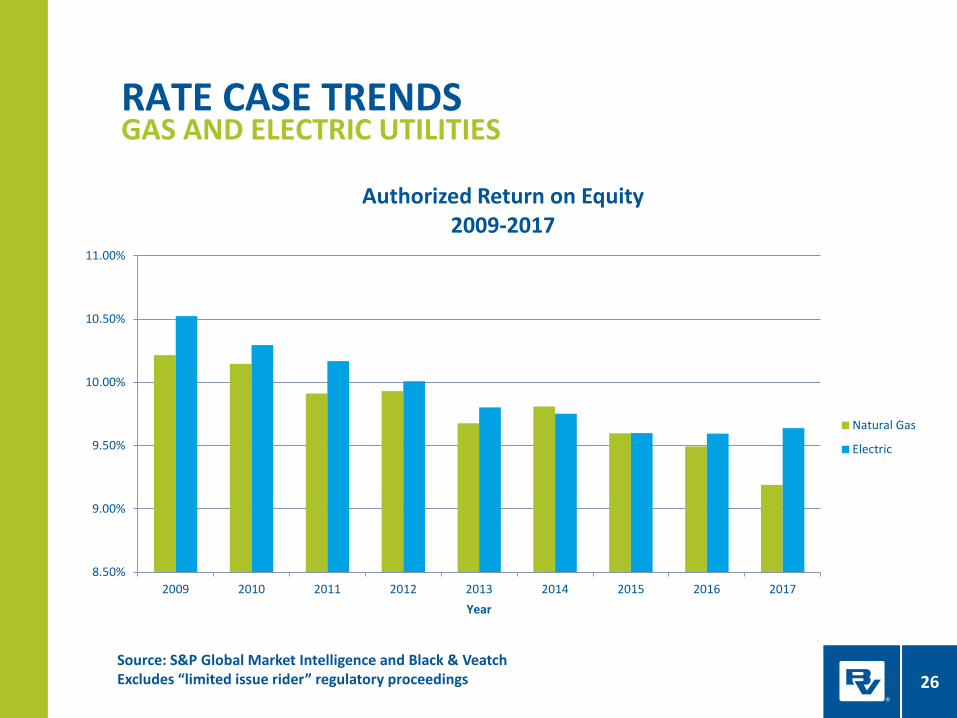
RATE CASE TRENDSGAS AND ELECTRIC UTILITIES
26
8.50%
9.00%
9.50%
10.00%
10.50%
11.00%
2009 2010 2011 2012 2013 2014 2015 2016 2017Year
Authorized Return on Equity2009-2017
Natural Gas
Electric
Source: S&P Global Market Intelligence and Black & VeatchExcludes “limited issue rider” regulatory proceedings

RATE CASE TRENDSGAS AND ELECTRIC UTILITIES
27
Requested Return on EquityJanuary – April 2017
Electric Utility Gas Utility
Month Low ROE High ROE Low ROE High ROE
April 8.40% 10.57% 9.50% 10.90%
March 10.10% 10.50% 10.70% 10.70%
February 9.75% 10.50% N/A N/A
January 9.80% 10.50% 9.70% 11.20%
Source: S&P Global Market Intelligence and Black & VeatchExcludes “limited issue rider” regulatory proceedings
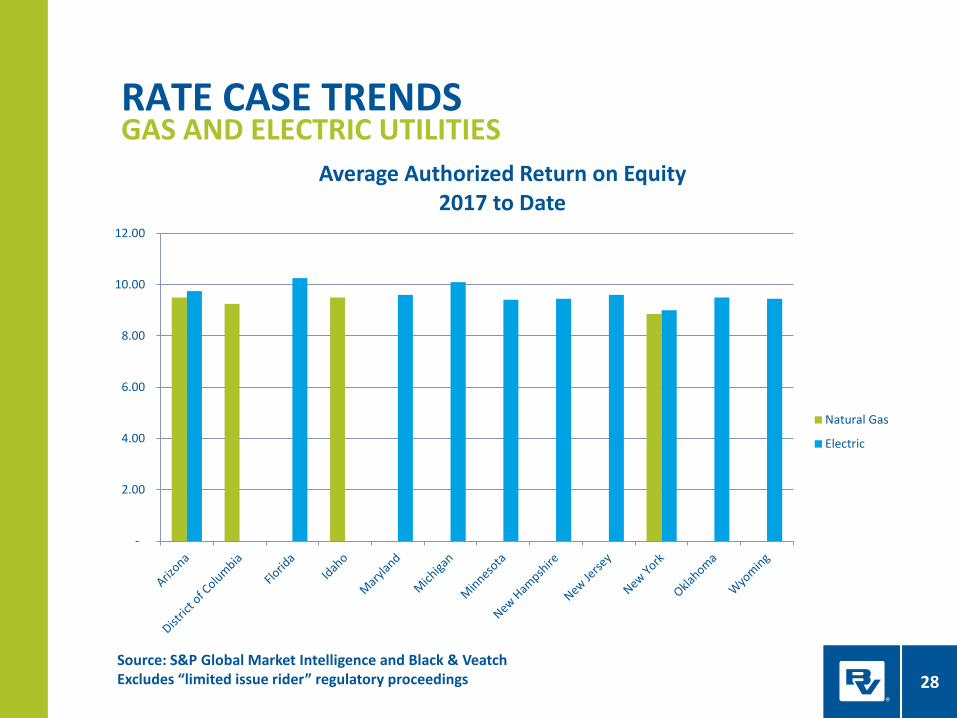
RATE CASE TRENDSGAS AND ELECTRIC UTILITIES
28
-
2.00
4.00
6.00
8.00
10.00
12.00
Average Authorized Return on Equity2017 to Date
Natural Gas
Electric
Source: S&P Global Market Intelligence and Black & VeatchExcludes “limited issue rider” regulatory proceedings
RATE CASE TRENDSGAS AND ELECTRIC UTILITIES
29
-
2.00
4.00
6.00
8.00
10.00
12.00
2009 2010 2011 2012 2013 2014 2015 2016 2017
Mon
ths
Year
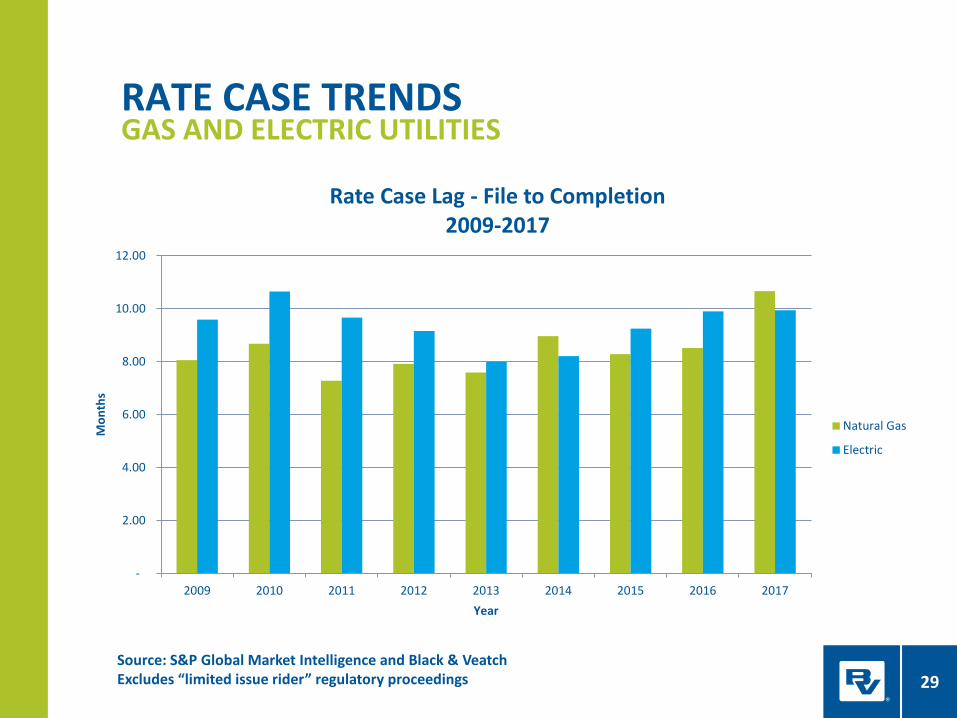
Rate Case Lag - File to Completion2009-2017
Natural Gas
Electric
Source: S&P Global Market Intelligence and Black & VeatchExcludes “limited issue rider” regulatory proceedings
RATE CASE TRENDSGAS AND ELECTRIC UTILITIES
30
0%
10%
20%
30%
40%
50%
60%
70%
80%
2009 2010 2011 2012 2013 2014 2015 2016 2017
Perc
enta
ge
Year
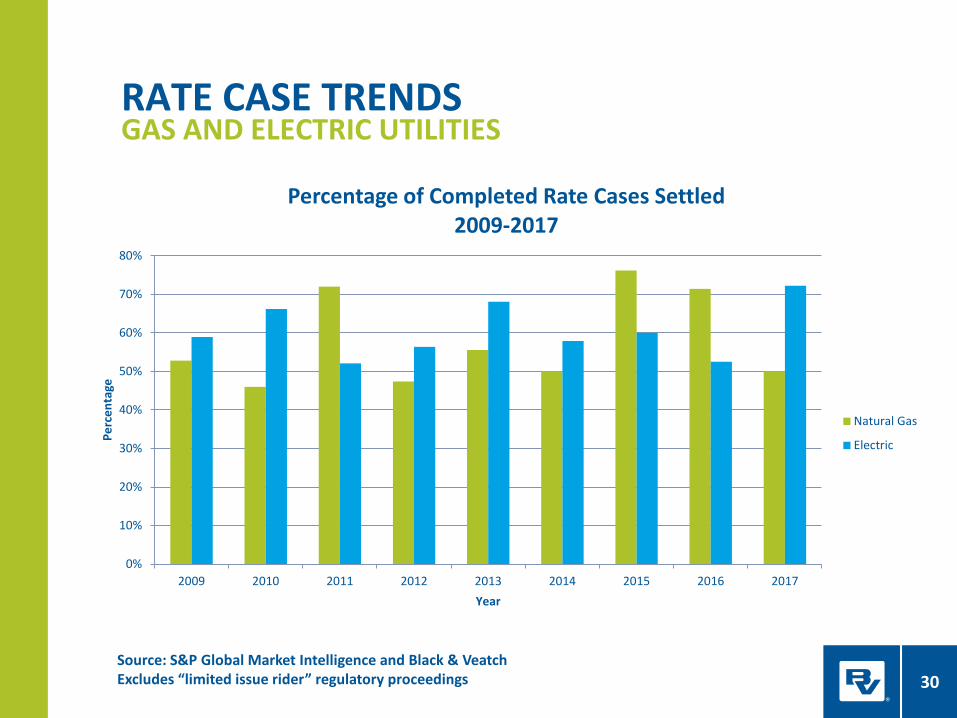
Percentage of Completed Rate Cases Settled2009-2017
Natural Gas
Electric
Source: S&P Global Market Intelligence and Black & VeatchExcludes “limited issue rider” regulatory proceedings
ELECTRIC UTILITY REGULATORY ISSUES
31
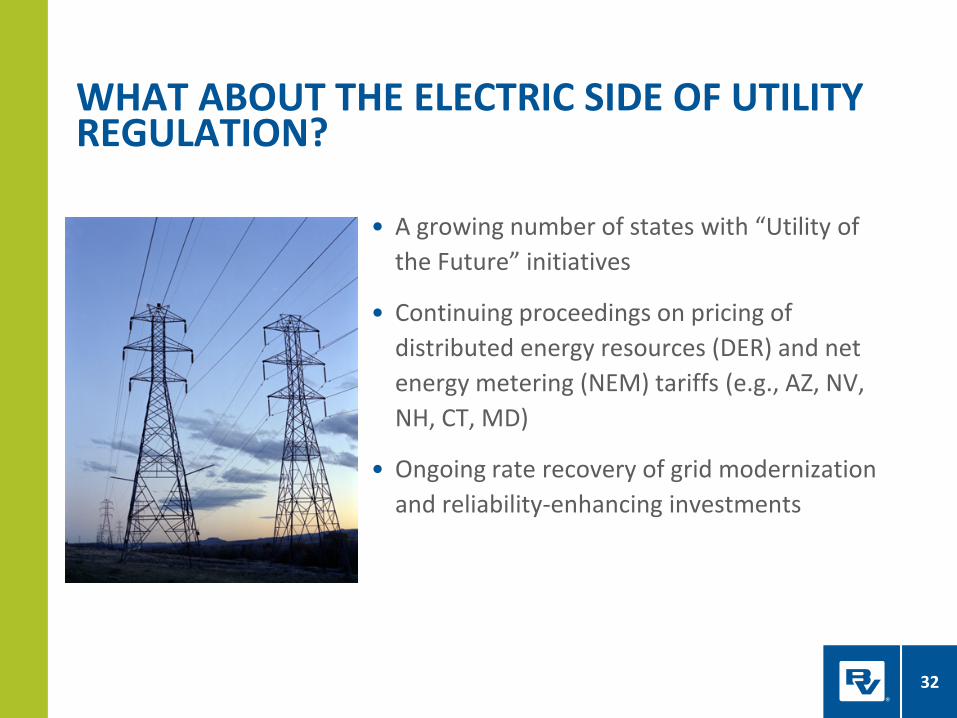
• A growing number of states with “Utility of the Future” initiatives
• Continuing proceedings on pricing of distributed energy resources (DER) and net energy metering (NEM) tariffs (e.g., AZ, NV, NH, CT, MD)
• Ongoing rate recovery of grid modernization and reliability-enhancing investments
WHAT ABOUT THE ELECTRIC SIDE OF UTILITY REGULATION?
32
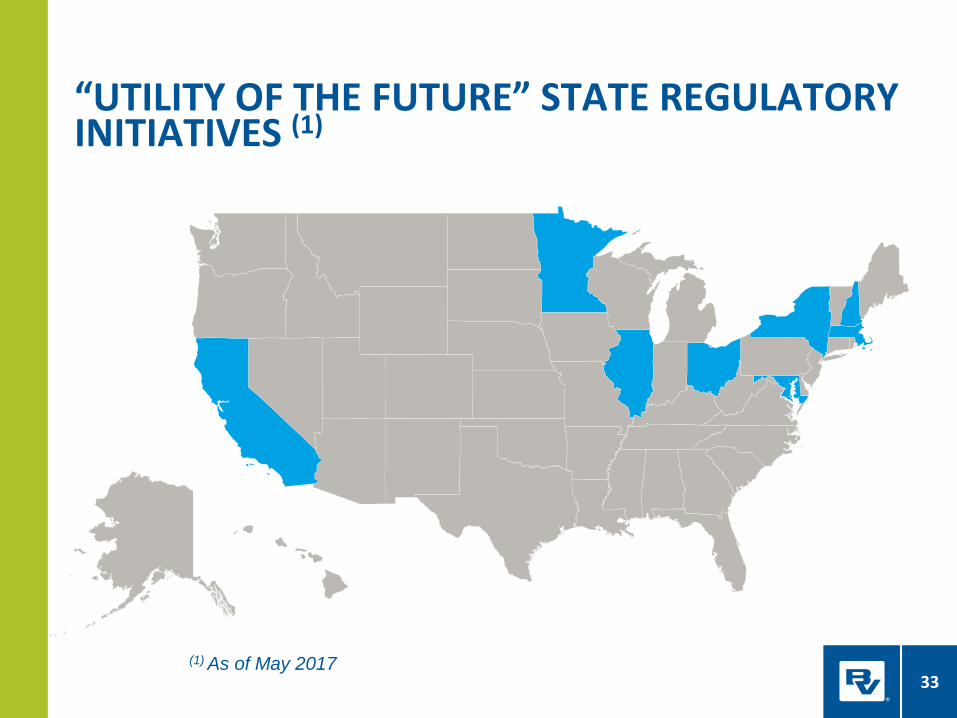
“UTILITY OF THE FUTURE” STATE REGULATORY INITIATIVES (1)
33(1) As of May 2017

HOW MANY WAYS CAN WE CHARACTERIZE THE FUTURE OF ELECTRIC UTILITIES?
34
New York – Reforming the Energy Vision (NY-REV)
California - The Business Model for the Electric Utility of the Future
Illinois - NextGrid
Minnesota – e21 Initiative
Ohio - PowerForward
New Hampshire – Investigation into Grid Modernization
Massachusetts -Electric Grid Modernization Stakeholder Working Group
Maryland - Utility 2.0 Investigation and Grid Resiliency Task Force

SOME COMMON THEMES IN THESE TYPES OF PROCEEDINGS
35
• Technological innovations driving change in the power industry (non-wires alternatives, demonstration projects)• Smart grid (AMI, distribution automation)• Micro-grids, EVs• Smart inverters• Behind-the-meter and utility scale distributed energy resources (DER)• Energy storage
• Market redesign• Grid optimization, integration of DER, distribution resource planning
• Rethinking the utility business model
• Regulatory reform• Incentivizing behavior through outcome-based rather than cost of
service regulation• Net energy metering• Time-of-use rates

EXPECTATIONS FOR THE FUTURE
36

37
THE EXPECTED FUTURE TRENDS IN UTILITY REGULATORY AND RATEMAKING ACTIVITIES• Regulatory lag and earnings attrition will
continue to be addressed through greater adoption of :• Future test years
• Step-rate adjustments
• Rate cases with multi-test periods
• Higher standards for investment justification will be pushed by utility stakeholders in an attempt to moderate future rate increases. • Fully developed business cases
• Cost-benefit analyses
• Outcome-based utility performance will take on an increasingly important role in rate cases as regulators shift their emphasis from cost of service regulation and growth in earnings through increases in rate base.

38
THE EXPECTED FUTURE TRENDS (CONT.)
• Performance-Based Regulation (PBR) will likely be adopted by regulators over time as a greater number of performance metrics are incorporated into the ratemaking process.
• The manner in which regulators address the transformational changes occurring in the electric utility market (e.g., NY-REV) will influence how gas utilities are treated for ratemaking purposes.
