state review framework - us epa
TRANSCRIPT

State Review Framework
Mississippi Department of Environmental Quality
Round 2 Report for Federal Fiscal Year 2010

Table of Contents
I. Executive Summary
II. Background Information on State Program and Review Process
III. Status of Outstanding Recommendations from Previous Reviews
IV. Findings and Recommendations
V. Element 13
VI. Appendices
A. Status of Recommendations from Previous Reviews B. Official Data Pull C. PDA Transmittal Letter D. PDA Analysis Chart E. PDA Worksheet F. File Selection G. File Review Analysis H. Correspondence

I. EXECUTIVE SUMMARY Major Issues The State Review Framework (SRF) Round 2 review of the Mississippi Department of Environmental Quality (MDEQ) identified two major issues: • The timeliness of data entry in federal data bases for Clean Air Act (CAA) and Resource Conservation and Recovery Act (RCRA) programs • The timeliness of taking enforcement actions for CAA High Priority Violators (HPVs) and Clean Water Act (CWA) Significant Non-Compliers (SNCs) and non-SNCs in accordance with EPA policy and federal and state Enforcement Management Systems (EMS) Summary of Programs Reviewed I. Clean Air Act Program Areas meeting SRF program requirements or with minor issues for state attention include: • All Minimum Data Requirements (MDRs) were entered into Air Facility System (AFS). • MDR data, with only minor exceptions, was entered into AFS accurately. • MDEQ met its enforcement and compliance commitments outlined in the Compliance Monitoring Strategy (CMS) and Air Planning Agreement. • MDEQ met its annual inspection and compliance evaluation commitments • Compliance monitoring reports (CMRs) properly documented observations, were completed timely and included an accurate description of observations. • Compliance determinations were accurately made but not always promptly reported in AFS. • HPVs were accurately identified. • Enforcement actions included corrective actions that return facilities to compliance in a specific time frame. • Penalty calculations consider and include gravity and economic benefit calculations. • With a few exceptions, MDEQ documented the rationale for any difference between the initial and final penalty
. The problems which necessitate state improvement and require recommendations and actions include: • The timeliness of data entry for enforcement, compliance monitoring, and HPV-related MDRs fell short of the national goal. This was identified as an issue in Round 1. • MDEQ takes appropriate enforcement action in accordance with EPA policy to address HPVs through the issuance of formal enforcement actions. However, almost half of these actions took longer than 270 days to address. This was identified as an issue in Round 1.

II. Clean Water Act/National Pollutant Discharge Elimination System Program (NPDES) Areas meeting SRF program requirements or with minor issues for state attention include: • MDEQ enters the MDRs in the National data system and the data is considered complete. • Data is reported accurately and is maintained. • Data is entered timely. • Compliance and enforcement grant commitments were met. • Inspection grant commitments were met. • The majority of MDEQ’s inspection reports were of good quality and provided documentation to determine compliance. • Compliance determinations were accurately made and single event violations (SEVs) were reported. • MDEQ documented the difference between initial and final penalties in enforcement cases, and maintained documentation that the final penalty was collected. • SNC violations were correctly identified. • Enforcement actions include complying and corrective action to return facilities to compliance The problems which necessitate state improvement and require recommendations and actions include: • MDEQ should take timely enforcement action for SNCs and non-SNCs in accordance with the NPDES Enforcement Management System (EMS) and the State’s EMS. • MDEQ documents the gravity component of their penalty calculations, however, inclusion and documentation of economic benefit in the penalty calculations occurs much less often. III. Resource Conservation and Recovery Act Program Areas meeting SRF program requirements or with minor issues for state attention include: • MDEQ enters MDRs into RCRA Info • The majority of the data is accurately entered and maintained by MDEQ in RCRAInfo. • Enforcement and inspection commitments were met. • Core inspections/evaluations were met. • The majority of inspection reports were of good quality and provided documentation to determine compliance. • Inspection reports included correct compliance determinations and were promptly entered in RCRAInfo.

• SNCS are correctly identified. • Enforcement actions include corrective action to return facilities to compliance. • Timely and appropriate enforcement actions for SNCs are taken. • MDEQ generally documents penalty calculations to include gravity and economic benefit. • MDEQ documents difference between initial and final penalties. The problems which necessitate state improvement and require recommendations and actions include: • MDEQ should implement procedures to ensure that SNC codes are entered timely into RCRA Info.

II. BACKGROUND INFORMATION ON STATE PROGRAM AND REVIEW PROCESS
The State Review Framework (SRF) is a program designed to ensure EPA conducts oversight of state and EPA direct implementation compliance and enforcement programs in a nationally consistent and efficient manner. Reviews look at 12 program elements covering data (completeness, timeliness, and quality); inspections (coverage and quality); identification of violations; enforcement actions (appropriateness and timeliness); and penalties (calculation, assessment, and collection). Reviews are conducted in three phases: analyzing information from the national data systems; reviewing a limited set of state files; and development of findings and recommendations. Considerable consultation is built into the process to ensure EPA and the state understand the causes of issues, and to seek agreement on identifying the actions needed to address problems. The reports generated by the reviews are designed to capture the information and agreements developed during the review process in order to facilitate program improvements. The reports are designed to provide factual information and do not make determinations of program adequacy. EPA also uses the information in the reports to draw a “national picture” of enforcement and compliance, and to identify any issues that require a national response. Reports are not used to compare or rank state programs. A. GENERAL PROGRAM OVERVIEW The information contained in this section, including agency structure, resources, data reporting systems, and accomplishments and priorities, was provided by MDEQ and was not verified by EPA for the SRF Report. Agency Structure The environmental regulatory authority in Mississippi is the Mississippi Commission on Environmental Quality (Commission). The Commission is a diverse group of seven local business members and community members appointed by the Governor. The Commission is empowered to formulate environmental policy, to promulgate and enforce rules and regulations, receive funding, conduct studies for using the State's resources, and discharge duties, responsibilities and powers as necessary. The Commission is also empowered to serve as “judge and jury” in enforcement actions/hearings. The Commission convenes on the fourth Thursday of each month. MDEQ serves as staff of the Commission. MDEQ is led by a Governor-appointed Executive Director, and the Commission has delegated many of its statutory powers and duties to the Executive Director. Within MDEQ, and under the direction of the Executive Director, are four Offices: Administrative Services, Geology, Land and Water, and Pollution Control. Each Office has a director appointed by the MDEQ Executive Director who reports thereto. The MDEQ Executive Director also serves as the Natural Resource Trustee for Mississippi

Compliance/Enforcement Program Structure With respect to those compliance and enforcement matters evaluated through the SRF, all activities fall within the purview of the Office of Pollution Control. Most of the functions evaluated under the Federal Fiscal Year (FFY)10 SRF metrics fall within the responsibility of the Office of Pollution Control’s Environmental Compliance & Enforcement Division (ECED). Compliance and enforcement efforts are also supported by MDEQ’s Legal Division (an extension of the Mississippi Attorney General’s Office). Roles and Responsibilities and Resources ECED is a multimedia program that focuses on Air, Water, Hazardous Waste, and Solid Waste compliance and enforcement matters. ECED is led by a Division Chief who reports to the Director for the Office of Pollution Control. ECED is comprised of thirteen Branches: Timber & Wood Products; Chemical; Metal & Metal Manufacturing; Energy & Transportation; Solid Waste & Mining, Service & Miscellaneous Industries; Construction & Building Materials; Agriculture; Municipal & Private Facilities; enSite & Management Support; Technical Support; Underground Storage Tanks; and Data Administration. The managers for the aforementioned branches are referred to as Branch Chiefs. ECED is comprised of fifty-four full time employees (FTEs). Forty-two FTEs can be considered multimedia inspectors. One contractor is also used for multimedia inspections. Three of ECED’s FTEs and three contractors are responsible for managing data entry and data flow to the federal databases, a responsibility only recently added to ECED. All MDEQ employees must meet the necessary qualifications outlined by the State’s Personnel Board. The Executive Director provides the Division Chief/Branch Chiefs with hiring authority for ECED. Currently, ECED is fully staffed. In addition to ECED, the Field Services Division (FSD) resides in the Office of Pollution Control. Certain compliance activities are completed by FSD in support of ECED’s responsibilities. FSD is comprised of three Regional Offices (RO) and a Laboratory. The Regional Offices are located in Oxford (North), Pearl (Central), and Biloxi (South). Each RO’s territory is comprised of approximately one-third of the state. The Laboratory is located in the center of the state, adjacent to the Central RO in Pearl. Most of the analytical sampling and testing required by MDEQ as part of work plan commitments is conducted by FSD. FSD is responsible for the majority of the assigned solid waste inspections, pretreatment compliance monitoring inspections, air synthetic minor operating inspections, and NPDES reconnaissance inspections. FSD also investigates most environmental complaints filed with MDEQ. FSD coordinates with ECED staff on inspection findings and on additional follow up and/or enforcement. FSD has approximately 29 FTE inspectors (11 North RO, 10 Central RO, 8 South RO). Finally, compliance and enforcement efforts are also supported by MDEQ’s Legal Division. The Legal Division consists of General Counsel and four senior staff attorneys. One of the four senior staff attorneys is appointed to ECED to manage the enforcement case load. Additional legal assistance is provided on judicial matters and other special circumstances as needed.

Communication and coordination inside MDEQ ECED’s staff engineers and scientists gather information from their respective facilities/cases and report their findings to the Branch Chief (first line supervisor). The Branch Chief will, in most instances, decide on the next course of action based on the EPA-approved, MDEQ inspection manual and EMS. For more complex issues, the Branch Chief will take recommendations up the chain of command to the ECED Chief. In enforcement cases where the Commission conducts an evidentiary hearing and makes a ruling, the Chairman of the Commission signs the orders. The Commission has delegated to the Executive Director of MDEQ the authority to execute all orders involving a negotiated and agreed-upon resolution (including agreed penalties). The Commission has also delegated to the Executive Director the authority to issue certain unilateral (or “ex parte”) orders as necessary to prohibit, control or abate pollution activities. Such orders do not involve the assessment of penalties. The Executive Director of MDEQ meets with the Director of the Office of Pollution Control on a routine basis as needed. The Director of the Office of Pollution Control meets with the ECED Chief weekly. The ECED Chief has a standing monthly meeting with each Branch Chief to review respective multimedia work projects (scheduled/completed compliance activities, open enforcement cases, personnel issues, etc.). ECED usually holds a division-wide meeting semi-annually. Communication and coordination outside MDEQ MDEQ shares great working relationships with other state agencies that are “environmental” in nature. Specifically, MDEQ works routinely with agencies such as the Mississippi Department of Wildlife, Fisheries, and Parks; Department of Marine Resources; Department of Health; Mississippi Oil and Gas Board; and the Mississippi Emergency Management Agency (MEMA), as well as others. MDEQ’s Emergency Response Division (ER) coordinates routinely with MEMA on environmental emergencies that occur almost daily. ER is under the supervision of the Office of Pollution Control Director. Staff within ER, consisting of six FTEs, routinely coordinates emergencies with MEMA, the Federal Emergency Management Agency (FEMA), and EPA response staff. MDEQ Funding MDEQ’s programs are supported by federal funds, fees, and state appropriations. While MDEQ has seen dramatic cuts in state appropriations, MDEQ continues to meet EPA’s work plan commitments. Assuming federal and state appropriations remain at or above FFY11 and State Fiscal Year 11 levels, MDEQ compliance and enforcement programs will be adequately funded

to meet the necessary FFY12 compliance and enforcement requirements for air, water, hazardous waste and solid waste. Staffing/Training Employee Recruitment and Retention MDEQ participates in career fairs at colleges and universities throughout Mississippi and on a limited basis, in colleges in adjacent states. MDEQ also attends recruitment fairs at historically black colleges and universities both in state and out of state. As a result of recommendations made during the previous SRF review, ECED has revamped its training program, ensuring all staff members receive core training in the various media programs. The ECED training manual provides a list of core training that is required of all staff and the time in which it should be completed. Much of the training ECED staff receives is provided by nationally recognized organizations such as the Air Pollution Training Institute, EPA, the Southeastern States Air Resource Managers Metro 4, the Association of State and Territorial Solid Waste Management Officials, etc. ECED has also received an EPA State and Tribal Assistance Grant (STAG) to fund enhanced ECED staff training. The STAG expires in March 2013. Many of the training programs offered are available to FSD staff, Environmental Permits Division (EPD) staff, and even other states in the southeast as availability allows. ECED continues to schedule training classes, with several having been confirmed for FFY12. Furthermore, as is the case with any organization, on-the-job training is a part of employee development at MDEQ. Senior staff, usually the Branch Chief, provide ECED staff with mentoring and coaching. Some employees are provided with in-house training by other staff. Out of forty-two multimedia inspectors, approximately 60% have 10 years or more of experience, thus providing a valuable on-the-job training resource for younger, less experienced staff. Because approximately 40% of ECED’s multimedia inspectors have 5 years or less of experience, training remains a priority for ECED. MDEQ offers a variety of non-technical training opportunities to new employees. One example is MDEQ’s mentoring program where new employees are assigned an advocate from within MDEQ to assist the new employee in adjusting to public service. MDEQ has also established “Onboard Day” for new employees. This is a very “hands on” orientation class designed to expose the new employee to all programs delegated to MDEQ. Finally for more senior staff, MDEQ offers the Accelerated Training for Leadership and Succession (ATLAS) program for professional development and to offset impacts to the agency from attrition. Data Reporting Systems/Architecture MDEQ utilizes enSite (commonly referred as TEMPO in other states) for data management. Every known facility in the state with an environmental interest to MDEQ can be found in enSite, and each facility is referred to as an Agency Interest (AI). Much of the permitting, compliance, and enforcement data maintained by MDEQ related to each facility is maintained in

enSite.1
The software tracks each task involved with permitting, compliance, and enforcement activities and allows staff to easily manage workloads. Most permits are generated in enSite and all inspection reports and enforcement actions are originated in the system.
ECED’s Data Administration Branch is responsible for all data entry into the federal databases (PCS, AFS, RCRAinfo). The Data Administration Branch, new to ECED, consists of three full time employees and three contractors. Much of EPD’s and ECED’s data flows directly from enSite into the federal databases. However, due to certain software limitations, ECED continues some level of manual data entry into the federal databases. B. MAJOR STATE PRIORITIES AND ACCOMPLISHMENTS Priorities ECED continues to place emphasis on construction storm water compliance efforts, specifically with regard to the Ross Barnett Reservoir in central Mississippi. This reservoir is the state’s largest surface water source for drinking water and has been adversely impacted by sediment-laden storm water. Storm water pollution prevention is a priority to MDEQ’s Executive Director and to the Commission. ECED has no other alternative compliance monitoring targeting approaches at this time. However, other groups within MDEQ have focused attention on nutrient management. Special Initiatives
• MDEQ utilizes an Electronic Discharge Monitoring Report (eDMR) program. This program allows facilities to securely submit electronic DMR data. Currently, approximately 18% of all DMRs are submitted to MDEQ through this program. MDEQ is now focused on increasing the use of eDMRs and will begin working towards a goal of 100% eDMRs. • The Voluntary Underground Storage Tank (UST) Compliance Assistance Program provides for owner testing and checking of their tanks. MDEQ analyzes data and provides a compliance summary, notifies an owner when the next cycle of testing needs to be performed, and provides a 12 month calendar of upcoming testing requirements to owners of five or more facilities. • MDEQ’s enHance Program promotes responsible environmental stewardship, and enhanced environmental compliance, by recognizing businesses that not only maintain compliance, but go above and beyond environmental compliance as good environmental stewards. ECED participates in the enHance Program each year by assisting EPD staff in evaluations of applicants requesting to be recognized by the program. ECED staff members accompany EPD staff on facility tours of each applicant to aid in compliance certifications. • ECED also provides staff to help support large-scale emergency response efforts. Mississippi has been faced with a number of severe natural and man-made disasters over the
1 While enSite does contain public information, the data and documents stored in enSite do not constitute the Agency’s official facility file for a particular facility. As of the writing of this report, MDEQ continues to maintain “paper files” for each facility. However, MDEQ is in the process of exploring the possibility of converting to electronic file management and storage.

past two years. Mississippi has been impacted by three severe tornado outbreaks and ECED has deployed staff in each event to help with clean-up and proper waste management. Likewise, the Mississippi River experienced record flooding during the summer of 2011, requiring ECED manpower to help coordinate flood evacuations, preparations and subsequent environmental clean-up. Finally, the BP Oil Spill impacted all coastal states in Region 4. Mississippi was no exception. ECED staff, from the initial event to today, has played a major role in oil spill response. During SFY10 and SFY11, ECED has provided over eleven FTE equivalents to disaster response. • MDEQ’s community engagement activities, including outreach in “environmental justice” communities, are managed through the Office of Community Engagement. In those instances where a citizen complaint or a violation occurs in an “environmental justice” community, ECED staff coordinates efforts with the Office of Community Engagement, and participates in both inspections and community outreach activities such as public meetings, to ensure that affected citizens are adequately informed of the agency’s activities.
C. PROCESS FOR SRF REVIEW The Round 2 review of the Mississippi Department of Environmental Quality was initiated on March 18, 2011, by letter from Mary Wilkes, Region 4 Regional Counsel and Director of the Office of Environmental Accountability, to Trudy Fisher, Executive Director of MDEQ. This letter included the Official Data Set (ODS) for Clean Air Act, Clean Water Act and the Resource Conservation and Recovery Act activities for Federal Fiscal Year (FY) 2010. On May 20, 2011, the Preliminary Data Analysis (PDA) and File Selections for all three media were sent to the State. The onsite file reviews for each media took place during June and July 2011 at the MDEQ offices in Jackson, Mississippi. The State and EPA Region 4 Contacts for the Review are: MDEQ EPA Region 4 SRF Coordinators for all media
Chris Sanders, Chief of the Environmental Compliance and Enforcement Division, MDEQ Chris Wells, Senior Attorney, MDEQ
Becky Hendrix, SRF Coordinator Steve Hitte, OEA Section Chief
CAA See above
Mark Fite, OEA Technical Authority Kevin Taylor, Air, Pesticides and Toxics Management Division
CWA See above Ronald Mikulak, OEA Technical Authority Stacey Bouma, Clean Water Enforcement Branch
RCRA See above Nancy McKee, OEA Technical Authority Shannon Maher, OEA Brooke York, RCRA Enforcement Branch

III. STATUS OF RECOMMENDATIONS FROM PREVIOUS REVIEWS
The Round 1 SRF review of MDEQ’s compliance and enforcement programs, finalized July 2, 2007, identified 28 recommendations for improvements in several program areas. MDEQ responded to the report by identifying action items and processes to address the recommendations. While many recommendations were scheduled to be addressed in a short timeframe, most by January 1, 2008, the proposed timeframe to implement other recommendations was longer. A Memorandum of Understanding (MOU) was developed and executed by MDEQ and EPA Region 4 on April 23, 2008, that identified timelines and milestones for accomplishing the long-term SRF recommendations, and ensured timely and thorough implementation of the recommendations. Concurrently, MDEQ developed a Process Improvement Plan which included revisions of business processes and incorporated those processes as Standard Operating Procedures (SOPs). These efforts, which are continuing, have resulted in improvements in MDEQ’s compliance and enforcement programs and the completion of the recommendations identified in the Round 1 review. Round 2 review showed that a few of the action items outlined in the MOU and revised SOPs that while implemented, continue to require attention from the state. (A complete list of recommendations and actions from Round 1 are contained in Appendix A.)
IV. FINDINGS Findings represent Region 4’s conclusions regarding the issue identified. Findings are based on the initial findings identified during the data or file review, as well as from follow-up conversations or additional information collected to determine the severity and root causes of the issue. There are four types of findings:
Finding Description
Good Practices
This describes activities, processes, or policies that the SRF data metrics and/or the file reviews show are being implemented exceptionally well and which the state is expected to maintain at a high level of performance. Additionally, the report may single out specific innovative and noteworthy activities, processes, or policies that have the potential to be replicated by other states and can be highlighted as a practice for other states to emulate. No further action is required by either EPA or the state.
Meets SRF Program Requirements This indicates that no issues were identified under this element.

Areas for State* Attention *Or, EPA Region’s attention where program is directly implemented.
This describes activities, processes, or policies that the SRF data metrics and/or file reviews show are being implemented with minor deficiencies. The state needs to pay attention to these issues in order to strengthen performance, but they are not significant enough to require the region to identify and track state actions to correct. This can describe a situation where a state is implementing either EPA or state policy in a manner that requires self-correction to resolve concerns identified during the review. These are single or infrequent instances that do not constitute a pattern of deficiencies or a significant problem. These are minor issues that the state should self correct without additional EPA oversight. However, the state is expected to improve and maintain a high level of performance.
Areas for State * Improvement – Recommendations Required *Or, EPA Region’s attention where program is directly implemented.
This describes activities, processes, or policies that the metrics and/or the file reviews show are being implemented by the state that have significant problems that need to be addressed and that require follow-up EPA oversight. This can describe a situation where a state is implementing either EPA or state policy in a manner requiring EPA attention. For example, these would be areas where the metrics indicate that the state is not meeting its commitments, there is a pattern of incorrect implementation in updating compliance data in the data systems, there are incomplete or incorrect inspection reports, and/or there is ineffective enforcement response. These would be significant issues and not merely random occurrences. Recommendations are required for these problems, and they must have well-defined timelines and milestones for completion. Recommendations will be monitored in the SRF Tracker.

Clean Air Act Program
CAA Element 1 — Data Completeness: Degree to which the Minimum Data Requirements are complete.
1-1 This finding is a(n)
Meets SRF Program Requirements Area for State Attention Area for State Improvement – Recommendations Required Good Practice
Finding MDEQ has ensured that all minimum data requirements (MDRs) were entered into the AFS.
Explanation Element 1 of the SRF is designed to evaluate the degree to which the State enters MDRs into the national data system. In the Preliminary Data Analysis (PDA), MDEQ met the national goal of 100% for all Data Metrics. Therefore, this element meets SRF Program requirements.
Metric(s) and Quantitative Value(s)
Data Metric Goal State 1c4 - % NSPS Facilities with subprogram 100% 100% designation: 1c5 -% NESHAP facilities with subprogram 100% 100% designation 1c6 - % MACT facilities with subprogram 100% 100% designation 1h1 - HPV Day Zero (DZ) Pathway Discovery date: 100% 100% Percent DZs reported after 10/1/05 with discovery 1h2 - HPV DZ Pathway Violating Pollutants: 100% 100% Percent DZs reported after 10/1/05 1h3 - Percent DZs reported after 10/1/05 100% 100% with HPV Violation Type Code 1k - Major Sources Missing CMS Policy Applicability 0 0
State Response None
Recommendation(s) No action is needed.

CAA Element 2 — Data Accuracy: Degree to which data reported in the national system is accurately entered and maintained.
2-1 This finding is a(n)
Meets SRF Program Requirements Area for State Attention Area for State Improvement – Recommendations Required Good Practice
Finding In general, MDEQ accurately enters all MDR data into AFS, with only minor exceptions.
Explanation Data Metric 2a compares the number of HPVs identified in AFS during the review year to the number of major sources listed in AFS as “in violation” or “meeting compliance schedule.” All HPVs are to be assigned a Compliance Status code that represents the source as either in violation or meeting a schedule until all penalties are paid and all injunctive relief is completed. Because HPV facilities are only a subset of violating facilities, this metric provides a strong indication of whether Compliance Status is being accurately reported. Typically, a State may find two, three, or more violators for every HPV, so the ratio of HPVs to all violating sources should be at or below 50%. That is why the national goal for this metric is set at ≤ 50%. MDEQ’s value of 50% meets the national goal. Data Metric 2b1 measures the percentage of stack tests without a results code reported into AFS. MDEQ’s value of 0% meets the national goal. Based on File Review Metric 2c, 19 of the 26 files reviewed (73%) documented all MDRs being reported accurately into AFS. The remaining seven files had one or more discrepancies identified. Three files had minor discrepancies such as an incorrect Standard Industrial Classification (SIC) code or city. More significantly, one file indicated the potential applicability of the MACT and NSPS air programs, but these were not reflected in AFS. Finally, five files showed either an incorrect compliance status or an inconsistency between the compliance status and HPV status. This issue was also identified in the Round 1 review, and it appears that these inconsistencies relate to untimely entry of HPV and compliance information. It is expected that the corrections made under Element 3 to improve the timeliness of data entry will also address this concern. In addition, considering the large number of MDR data elements the State must enter and maintain in AFS, this small number of inaccuracies represents a minor deficiency. These issues can be self

corrected without additional EPA oversight. Therefore, this element is designated as an area for State attention.
Metric(s) and Quantitative Value(s)
Data Metric National Goal State 2a - # of HPVs / # of Noncompliance sources ≤ 50% 50% 2b1- % Stack Tests without Pass/Fail result 0% 0% 2b2 - Number of Stack Test Failures - 6 File Review Metric State 2c - % files with all MDR data accurate in AFS - 73%
State Response
The main area of concern raised appears to be the issue of compliance status and HPV status accuracy. MDEQ thinks it is significant to note that, unlike in Round 1, no failures to update compliance status or inaccurate compliance status were noted. The “inconsistencies” mentioned above, as noted by EPA, are really issues of data entry timeliness (rather than accuracy), which is addressed in CAA Element 3. Consequently, MDEQ respectfully disagrees with EPA on this metric classification and believes that the finding should be modified to “Meets SRF Program Requirements.”
Recommendation(s) No formal recommendations are being tracked for this element.
CAA Element 3 — Timeliness of Data Entry: Degree to which the Minimum Data Requirements are timely.
3-1 This finding is a(n)
Meets SRF Program Requirements Area for State Attention Area for State Improvement – Recommendations Required Good Practice
Finding The timeliness of data entry for enforcement, compliance monitoring,
and HPV related MDRs fell short of the national goal.
Explanation MDEQ’s performance in FY2010 for timely entry of enforcement, compliance monitoring, and HPV related MDRs fell short of the national goal of 100%. Therefore, this is designated as an area for State Improvement. Additional discussion and a recommendation are provided below. With respect to HPV data entry (Data Metric 3a), none of the 22 HPVs were entered within 60 days. Timeframes for entry ranged from 86 to 726 days. This issue was also identified as a concern

during the Round 1 review. The MOU developed to address Round 1 issues indicated that program staff would receive additional training on HPV identification, and data management staff would participate in monthly HPV calls to improve the timeliness of HPV reporting. The MOU established a goal that HPVs would be entered into AFS within 10 working days of receiving the information on new HPVs. However, MDEQ advises that they do not enter a day zero until they are certain of the violation type. Therefore, they often do not make the HPV determination until they have reviewed the company’s response to the NOV. The day zero is then entered retroactively, which results in the late HPV reporting measured by Data Metric 3a. Data Metric 3b1 indicates that just under half of the compliance monitoring MDRs (48%, or 413 of 867) were entered within 60 days. Of the 52% that were entered late, most were stack test reviews (315) and Title V Annual Compliance Certification (ACC) reviews (117). A few late entries (21) were full compliance evaluations (FCEs). The State advises that they do not enter the stack test date and result until after the test report has been reviewed. This practice results in a significant number of late entries for stack tests. However, upcoming changes to the reporting requirements for stack tests may alleviate some of this problem, since the State will have up to 120 days to enter the stack test date and result into AFS under the new Information Collection Request (ICR). Data Metric 3b2 indicates that 56.2% of the enforcement related MDRs (45 of 80) were entered within 60 days. Of the 35 late entries, most of them (80%) were NOVs, and the rest were formal enforcement actions. MDEQ advises that NOVs are not entered into AFS until the appropriate day zero is created.
Metric(s) and Quantitative Value(s)
National National Data Metric Goal Average State 3a - % HPVs entered in ≤ 60 days 100% 34.7% 0% 3b1 - % Compliance Monitoring MDRs entered in ≤ 60 days 100% 59.0% 47.6% 3b2 - % Enforcement MDRs entered in ≤ 60 days 100% 70.3% 56.2%
State Response
Based on Round 1 review, in-house HPV Training was conducted 12/4/2007, followed by Region IV led training on April 30-May 1, 2008. Data management staff participates in the monthly Air Enforcement Calls. All MDEQ AFS data entry responsibilities now reside within the Environmental Compliance and Enforcement Division. The organizational change occurred in FFY11. Data entry is being closely

monitored for accuracy and timeliness and MDEQ anticipates better internal coordination and a much higher level of data accountability. These organizational changes have improved timeliness and accuracy of data in the national system. In fact, the FY12 data shows HPV Day Zero timeliness has increased to 66.7% (excluding three sites where MDEQ & EPA have had protracted, coordinated enforcement) and Enforcement MDR timeliness has increased to 100%, both of which exceed the national average for that period. We expect continued improvements in timeliness as a result of this change. MDEQ’s business process for entering enforcement MDRs into AFS is based on making an accurate HPV/non-HPV determination before beginning the data entry. MDEQ enters data into AFS via EPA’s Universal Interface and linking of enforcement actions to a Day Zero is least complicated when the Day Zero already exists. Therefore, NOVs are entered at the time the Day Zero is entered. Changing a HPV Day Zero action to a non-HPV Day Zero, and vice versa, is a very complicated process requiring assistance from EPA Region IV staff and potentially EPA Headquarters staff. Therefore, we take the time, which often involves reviewing a source’s response to our NOV, to make sure we have the correct HPV determination to ensure our data entry is as accurate as possible to avoid having to change a Day Zero. MDEQ believes the data entry occurs shortly after a HPV determination is made. It should be noted that MDEQ reports all violations, including non-MDR violations, which are not subject to timeliness standards (and, therefore, are not necessarily treated with the same priority). However, the SRF data metrics do not appear to exclude the non-MDR violations. We request EPA amend its comments to acknowledge this. Finally, in consideration of the progress MDEQ achieved to date towards meeting the national goals, based on the changes already implemented, we request that EPA’s recommendations be amended by removing the first sentence – the requirement to submit and implement revised procedures.
Recommendation(s) By September 30, 2012, MDEQ should evaluate how their current business process contributes to late data entry, including late entry of day zero actions, and make adjustments as needed to ensure timely reporting of MDRs into AFS. Region 4 EPA’s Air and EPCRA Enforcement Branch (AEEB) will monitor the improvement of MDEQ’s timeliness of MDR reporting through periodic data reviews conducted by EPA. If by March 31, 2013, these periodic reviews indicate progress toward meeting the national goal, the recommendation will be considered completed.


CAA Element 4 — Completion of Commitments: Degree to which all enforcement/compliance commitments in relevant agreements are met and any products or projects are completed.
4-1 This finding is a(n)
Meets SRF Program Requirements Area for State Attention Area for State Improvement – Recommendations Required Good Practice
Finding MDEQ met its enforcement and compliance commitments outlined in
the Compliance Monitoring Strategy (CMS) and Air Planning Agreement.
Explanation MDEQ follows a traditional CMS plan and completed 100% of all planned evaluations for FY2010 (208 of 208 FCEs) in their current CMS plan. In addition MDEQ met all of its enforcement and compliance commitments (100%) under the FY2010 Air Planning Agreement with EPA Region 4. Therefore, this element meets SRF program requirements.
Metric(s) and Quantitative Value(s)
File Review State 4a - Planned evaluations completed for 100% year of review pursuant to CMS plan 4b – Planned commitments completed 100%
State Response None
Recommendation(s) No action is needed.
CAA Element 5 — Inspection Coverage: Degree to which state completed the universe of planned inspections/compliance evaluations.
5-1 This finding is a(n) Meets SRF Program Requirements Area for State Attention Area for State Improvement – Recommendations Required Good Practice
Finding MDEQ met its annual inspection and compliance evaluation
commitments

Explanation Based on the Data Metrics 5a1 and 5b1, MDEQ completed FCEs at 98.9% of its Major and 83.5% of its SM80 sources during the relevant CMS timeframe. Since FY2010 is the 4th year of the CMS cycle, MDEQ’s value of 83.5% for Data Metric 5b1 exceeds the national goal of 80%. In addition, based on Data Metric 5g, MDEQ reviewed 100% of their Title V annual compliance certifications. Therefore, the State met all SRF program requirements for this element
Metric(s) and Quantitative Value(s)
National National Data Metrics Goal Average State 5a1 - FCE coverage Majors (last completed CMS cycle) 100% 89.2% 98.9% 5a2 - FCE coverage All Majors (last 2 FY) 100% 84.4% 96.5% 5b1 - FCE coverage SM80 (current CMS cycle) 20-100% 92.0% 83.5% 5b2 - FCE coverage CMS SM80 (last 5 FY) 100% 92.4% 91.2% 5c - FCE/PCE coverage All SMs (last 5 FY) NA 79.2% 92.9% 5d - FCE/PCE coverage other minors (5 FY) NA 28.8% 8.0% 5e - Sources with unknown compliance status NA - 0 5g - Review of Self Certifications completed 100% 94.3% 100%
State Response None
Recommendation(s) No action is needed.
CAA Element 6 — Quality of Inspection or Compliance Evaluation Reports: Degree to which inspection or compliance evaluation reports properly document observations, are completed in a timely manner, and include accurate description of observations.
6-1 This finding is a(n)
Meets SRF Program Requirements Area for State Attention Area for State Improvement – Recommendations Required Good Practice
Finding Compliance monitoring reports (CMRs) properly documented
observations, were completed in a timely manner, and included an accurate description of observations.

Explanation File Review Metric 6b evaluates whether all applicable elements of an FCE have been addressed. Based on the file review, 100% of the files reviewed (18 of 18) had documentation in the files to show that they contained all of the elements of the FCE, per the CMS. For File Review Metric 6c, 100% of the files reviewed (18 of 18) contained all of the CMR requirements listed in the CMS, providing sufficient documentation to determine compliance at the facility. Therefore, the State met all SRF program requirements for this element.
Metric(s) and Quantitative Value(s)
File Review Metric State 6a - Number of FCEs reviewed 18 6b - % FCEs that meet definition 100% 6c - % CMRs sufficient for compliance determination 100%
State Response None
Recommendation(s) No action is needed.
CAA Element 7 — Identification of Alleged Violations: Degree to which compliance determinations are accurately made and promptly reported in the national database based upon compliance monitoring report observations and other compliance monitoring information.
7-1 This finding is a(n) Meets SRF Program Requirements Area for State Attention Area for State Improvement – Recommendations Required Good Practice
Finding The file review indicated that the State is making accurate compliance determinations based on inspection reports and other compliance monitoring information. However, the appropriate Compliance Status is not always reported timely into AFS.
Explanation File Metric 7a indicates that all of the CMRs reviewed (100%) led to an accurate compliance determination. With respect to File Review Metric 7b, half of the files reviewed with non-HPV violations (3 of 6) had the Compliance Status reported accurately and timely into AFS. Two sources have the appropriate Compliance Status in AFS, but it is not timely. A third source involved a late submittal of the annual compliance certification by a Title V source which was no longer operating, but the State never changed the Compliance Status to reflect the violation. MDEQ

advises that Compliance Status has to be reported into AFS manually, which may have contributed to the delays in reporting. However, a recent organizational change in which the data management staff moved into the Environmental Compliance and Enforcement Division is expected to provide for better coordination of and accountability for data management, thereby improving the timeliness and accuracy of data in the national system. Data Metrics 7c1 and 7c2 are designed to measure the compliance status reporting of the State program. Both metrics exceeded the national goal. The instances of late Compliance Status reporting are infrequent and do not constitute a pattern of deficiencies or a significant problem. Since these are minor issues that the State will correct without additional EPA oversight, this is designated as an area for State attention.
Metric(s) and Quantitative Value(s)
File Review Metrics State 7a - % CMRs leading to accurate compliance determination 100% 7b - % non-HPVs with timely compliance determination in AFS 50% National National Data Metrics Goal Average State 7c1 - % facilities in noncompliance with FCE, stack test, or enforcement (1 FY) >11.2% 22.3% 17.9% 7c2 - % facilities with failed stack test and have noncompliance status (1 FY) >22.0% 44.0% 25%
State Response All MDEQ AFS data entry responsibilities now reside within the Environmental Compliance and Enforcement Division. The organizational change occurred in FFY11. Data entry is being closely monitored for accuracy and timeliness and MDEQ anticipates better internal coordination and a much higher level of data accountability. These organizational changes will improve timeliness and accuracy of data in the national system.
Recommendation(s) No formal recommendations are being tracked for this element.
CAA Element 8 — Identification of SNC and HPV: Degree to which the state accurately identifies significant noncompliance/high priority violations and enters information into the national system in a timely manner.
8-1 This finding is a(n) Meets SRF Program Requirements Area for State Attention Area for State Improvement – Recommendations Required

Good Practice
Finding High Priority Violations (HPVs) are accurately identified.
Explanation MDEQ exceeded the national goal for all of the data metrics in this element. Files were also reviewed to further verify the accuracy of HPV identification. File Metric 8f indicated that MDEQ accurately identified HPVs and entered the information into AFS for all 16 HPVs (100%). Therefore, this element meets SRF requirements.
Metric(s) and Quantitative Value(s)
Data Metrics National Goal State 8a - HPV discovery rate - Majors sources >3.2% 3.9% 8b - HPV discovery rate - SM sources >0.2% 3.3% 8c - % formal actions with prior HPV - >33.9% 90.9% Majors (1 yr) 8e - % sources with failed stack test >20.3% 50% actions that received HPV listing - Majors and Synthetic Minors File Review Metrics State 8f - % accurate HPV det0erminations 100%
State Response None
Recommendation(s) No action is needed.
CAA Element 9 — Enforcement Actions Promote Return to Compliance: Degree to which enforcement actions include required corrective action (i.e., injunctive relief or other complying actions) that will return facilities to compliance in a specific time frame.
9-1 This finding is a(n)
Meets SRF Program Requirements Area for State Attention Area for State Improvement – Recommendations Required Good Practice
Finding Enforcement actions include corrective actions that return facilities to
compliance in a specific time frame, or facilities are brought back into compliance prior to issuance of a final enforcement order.
Explanation All enforcement action files reviewed (11 of 11) returned the source to compliance. For enforcement actions that were penalty only actions, the files documented the actions taken by the facility to return to compliance prior to issuance of the order.
Metric(s) and File Review State

Quantitative Value(s)
9a – number of enforcement actions reviewed 11 9b - % enforcement actions returning source to compliance 100%
State Response None
Recommendation(s) No action is needed.
CAA Element 10 — Timely and Appropriate Action: Degree to which state takes timely and appropriate enforcement actions in accordance with policy relating to specific media.
10-1 This finding is a(n)
Meets SRF Program Requirements Area for State Attention Area for State Improvement – Recommendations Required Good Practice
Finding MDEQ takes appropriate enforcement action in accordance with EPA policy to address HPVs through the issuance of formal enforcement actions. However, almost half of these actions took longer than 270 days to address.
Explanation Based on the file review, the State took appropriate enforcement action to resolve 100% of its HPVs through a formal enforcement action (File Review Metric 10c). However, although File Review Metric 10b indicates that 89% of the HPV files reviewed (8 of 9) were addressed in less than 270 days, the PDA revealed that, in general, MDEQ is not addressing HPVs in a timely manner. Data Metric 10a shows that in the last two years, 46.5% of MDEQ’s HPV actions (20 of 43) have taken longer than 270 days to address, which is higher than the national average of 36.4%. About 70% of the late actions (14 of 20) have taken a year or more to address, with timeframes ranging from 404 days to 1247 days. This issue was also identified as a concern during the Round 1 review. Therefore, this is designated as an area for State improvement. MDEQ advises that a significant number of their enforcement actions are multi-media, and their business practice is to address all violations, regardless of media, under one enforcement action. This additional complexity in the enforcement approach may result in a

particular media’s HPV timeline goal being exceeded.
Metric(s) and Quantitative Value(s)
Data Metrics National Average State 10a - % HPVs not timely (2 FY) 36.4% 46.5% File Review Metrics State 10b - % timely HPV enforcement actions 89% 10c - % HPVs appropriately addressed 100%
State Response MDEQ began a process improvement initiative following Round 1 SRF. As part of that process improvement, MDEQ submitted and received approval from EPA regarding revised policies and procedures governing, among other things, timeliness of enforcement. All EPA recommendations precipitated by SRF Round 1 have been implemented by MDEQ. Staff were trained on these new business processes and full implementation began around the beginning of FFY10. Also as part of the process improvement initiative, MDEQ developed management tools designed to assist ECED management and staff in monitoring and tracking enforcement actions. MDEQ continues to emphasize the importance of timely enforcement and strives to initiate and resolve enforcement in accordance with the timelines agreed upon. No further revision of previously-approved standard operating procedures is warranted at this time. It should be noted also that the revised MDEQ enforcement policies recognize and specifically mention that complex and other otherwise difficult cases may exceed the designated timeline. MDEQ would point out that a portion of the cases that did not meet the 270 day requirement included such difficult cases. Furthermore, MDEQ has repeatedly advised EPA that a significant number of our enforcement actions include multi-media violations, and that our business practice is to address all violations, regardless of media, under one enforcement action. MDEQ’s enforcement approach may result in a particular media’s timeline goal being exceeded. While MDEQ recognizes this potential situation, MDEQ has no intention to change its business practice to specifically address this EPA recommendation. MDEQ will, however, continue to monitor each enforcement case and improve enforcement management to yield more timely enforcement resolution.

Recommendation(s) By September 30, 2012, MDEQ should evaluate how their current business process may contribute to untimely HPV addressing actions and make adjustments as needed to improve the timeliness of these actions. . The timeliness of HPV addressing actions will be monitored by AEEB through the existing monthly oversight calls between MDEQ and EPA and through a formal consultation on or around day 150. If by March 31, 2013, these periodic reviews indicate progress toward meeting the national goal, the recommendation will be considered concluded.
CAA Element 11 — Penalty Calculation Method: Degree to which state documents in its files that initial penalty calculation includes both gravity and economic benefit calculations, appropriately using the BEN model or other method that produces results consistent with national policy.
11-1 This finding is a(n)
Meets SRF Program Requirements Area for State Attention Area for State Improvement – Recommendations Required Good Practice
Finding MDEQ’s penalty documentation includes both gravity and economic benefit calculations. In addition, MDEQ policy requires the use of an appropriate methodology such as the BEN model to calculate economic benefit.
Explanation The penalties reviewed during the file review were well documented using a detailed penalty worksheet, which relies on and closely tracks EPA’s CAA penalty policy. All of the penalties reviewed included a gravity portion, and based on File Review Metric 11a, 90% of the files reviewed by EPA (9 of 10) provided sufficient documentation of the appropriate economic benefit component of the penalty. However, the initial penalty calculation in one file indicated that economic benefit was “N/A”. This violation involved exceedance of a Volatile Organic Compound (VOC) emission limit for a period of two years. This type of violation could very likely involve delayed or avoided costs, and the penalty documentation should have provided a more thorough analysis. The remaining nine files documented consideration of economic benefit. However, since the economic benefit was determined to be de minimis in all of these files, Region 4 reviewed an additional penalty worksheet which included economic benefit to further evaluate MDEQ’s economic benefit calculation procedures. Based on this analysis, the region was able to verify that MDEQ’s procedures provide results consistent with national policy. In response to concerns raised during the Round 1 SRF review, MDEQ developed a Clean Air Act Penalty Policy (3/12/09) which

lays out procedures for calculation and documentation of penalties, including both gravity and economic benefit. This policy requires the use of an appropriate methodology such as the BEN model for calculating economic benefit. It also establishes thresholds for determining whether an economic benefit can be considered de minimis, and these thresholds are consistent with those established in EPA guidance. Therefore, this element meets SRF program requirements.
Metric(s) and Quantitative Value(s)
File Review State 11a - % penalty calculations that consider 90% & include gravity and economic benefit
State Response None
Recommendation(s) No action needed.
CAA Element 12 — Final Penalty Assessment and Collection: Degree to which differences between initial and final penalty are documented in the file along with a demonstration in the file that the final penalty was collected.
12-1 This finding is a(n)
Meets SRF Program Requirements Area for State Attention Area for State Improvement – Recommendations Required Good Practice
Finding With a few exceptions, MDEQ documented the rationale for any difference between the initial and final penalty. In addition, the State assessed penalties for all HPV actions and maintained documentation that the final penalty was collected.
Explanation Data Metric 12b measures the percentage of HPV enforcement actions that included a penalty as part of the settlement. Data Metric 12b indicates that 92.3% of HPV actions (12 of 13) had a penalty assessed. In addition, File Metric 12d indicates that 100% of the penalty actions reviewed (10 of 10) documented collection of the assessed penalty. However, based on the file review, File Review Metric 12c indicates that 80% of the penalty actions reviewed (8 of 10) provided documentation of the rationale for the difference between the initial

penalty assessed and the final penalty paid. One action had no change between the initial and final penalty. Seven other actions documented the rationale for the difference in either the penalty worksheet or a “final penalty rationale” memorandum. For the two actions with no documentation of this rationale, MDEQ advises that they relied on a provision of their Penalty Policy which states that “the calculated penalty may be reduced by up to 30% by the Branch Manager and up to 50% by the Division Chief.” However, EPA notes that MDEQ’s CAA Penalty Policy also provides that a “final penalty rationale document must be created for each enforcement case.” Since seven of the nine files reviewed with a difference in initial and final penalty included such documentation, MDEQ appears to be generally implementing their policy. Only minor adjustments are needed to achieve full compliance. These are infrequent instances that do not constitute a pattern of deficiencies or a significant problem Therefore, this is designated as an area for State attention.
Metric(s) and Quantitative Value(s)
Data Metrics National Goal State 12a - Actions with penalties NA 24 12b - % HPV actions with penalty ≥ 80% 92.3% File Review Metrics State 12c - % actions documenting difference between initial & final penalties 80% 12d - % files that document collection of penalty 100%
State Response MDEQ respectfully disagrees with EPA on this metric classification and believes that the finding should be modified to “Meets SRF Program Requirements.” Penalties were appropriately calculated and documented and the penalty reduction was within the parameters authorized by the approved EMS. MDEQ acknowledges that the CAA Penalty Policy also provides that a “final penalty rationale document must be created for each enforcement case.” However, this was an isolated incident (limited to one ECED Branch), and upon discovering the misunderstanding at the staff level, the matter was immediately addressed. Resolution was nothing more than a one sentence memorandum stating that the penalty reduction was granted within the Branch Manager’s discretion, as clearly provided for in the policy. MDEQ further asserts that the metric requiring justification of a penalty reduction is irrelevant to the overall purpose of penalty assessment. Penalty assessment is to act as a deterrent for future non-compliance, and in each of these cases, the penalty amount was appropriately calculated, suitable in amount, and was not questioned by EPA. MDEQ believes that this metric should be met where the final assessed penalty falls within the negotiation authority

specifically reserved in the penalty policy. To do otherwise constitutes unnecessary micro-management by EPA of MDEQ’s application of its own policies and procedures.
Recommendation(s) No formal recommendations are being tracked for this element.

Clean Water Act Program
CWA Element 1 — Data Completeness: Degree to which the Minimum Data Requirements are complete.
1-1 This finding is a(n)
Meets SRF Program Requirements Area for State Attention Area for State Improvement – Recommendations Required Good Practice
Finding The Mississippi Department of Environmental Quality (MDEQ) does a good job in entering the Minimum Data Requirements in the National data system and the data is considered complete.
Explanation CWA Element 1 is supported by SRF Data Metrics 1a through 1g, and measures the completeness of the data in the Permit Compliance System (PCS). Three of the Element 1 Data Metrics have National Performance Goals: Data Metric 1b1: % of National Pollutant Discharge Elimination System (NPDES) major facilities with individual permits that have permit limits in PCS. The National Performance Goal for this metric is >95%; Data Metric 1b2: % of outfalls for which Discharge Monitoring Report (DMR) data is entered in the National database. The National Performance Goal for this metric is >95%; and Data Metric 1b3: % of NPDES major facilities with individual permits that have DMR data in PCS. The National Performance Goal for this metric is >95%. MDEQ exceeded the National Performance Goals for Data Metrics 1b1, 1b2 and 1b3. MDEQ provided reasons for why three data metrics had differences between PCS and their system. These reasons do not impact the completeness of data in PCS. MDEQ meets the SRF requirements for this element.
Metric(s) and Quantitative Value(s)
National Data Metrics Goal State 1b1: Facilities with permit limits >95% 97.9% 1b2: DMR Entry Rate >95% 98.5%

CWA Element 2 — Data Accuracy: Degree to which data reported in the national system is accurately entered and maintained.
2-1 This finding is a(n)
Meets SRF Program Requirements Area for State Attention Area for State Improvement – Recommendations Required Good Practice
Finding The majority of the data is accurately entered and maintained by
MDEQ. However, there are minor data inaccuracies that have been identified which can be resolved by the State.
Explanation CWA Element 2, which measures the accuracy of data the State has entered in PCS, is supported by Data Metric 2a and File Metric 2b. A facility record is considered accurate when data points in PCS are the same as the information found in the facility files. Data Metric 2a addresses the percent of enforcement actions linked to violations for major facilities. EPA has set a National Goal of greater than or equal to 80 percent for this Data Metric. 100 percent of MDEQ’s enforcement actions taken during FY 10 at major facilities were linked to violations. File Metric 2b addresses the percent of files reviewed where data is accurately reflected in the National data system. Specifically, 31 files were reviewed to examine the accuracy of data between the information in the State’s facility file and PCS. The PCS Quality Assurance Guidance Manual establishes a goal of 95 percent accuracy rate for data accuracy. Of the 31 facilities randomly selected for this review, 26 (84 percent) documented that the selected data points were reported accurately into PCS. The file review noted five facilities (two major facilities and three non-major facilities) with missing or inaccurate data between the files and PCS:
1. A facility was noted as inactive in PCS, but there is no record of its status in the file;
2. An inspection was coded in PCS as a Compliance Sampling Inspection and should have been represented as a Compliance Monitoring Inspection;
1b3: DMR with permit limits >95% 100 %
State Response
None
Recommendation(s) No further action is needed.

3. Long-term Compliance Schedule violations are noted in PCS for a facility, but it is not noted in PCS as a SNC, nor are the Compliance Schedule violations noted in the file;
4. DMRs were submitted for Quarters 10, 11 and 12 for a facility; but PCS reported it as “NA” with no non-compliance noted. It was reported as a Reportable Violation the previous nine quarters; and
5. Inspection reports in one facility file were not recorded in PCS.
Most of the data inaccuracies are minor in nature and do not represent a systemic issue that requires further oversight by EPA. This is an area for State attention which can be resolved by the State.
Metric(s) and Quantitative Value(s)
Data Metric National Goal State 2a: Actions linked to violation 80% 100% major facilities File Review Metric State 2b: Files reviewed where data - 84% is accurately reflected in the data system
State Response All MDEQ PCS data entry responsibilities now reside within the Environmental Compliance and Enforcement Division. The organizational change occurred in FFY11. Data entry is being closely monitored for accuracy and timeliness and MDEQ anticipates better internal coordination and a much higher level of data accountability. Monthly comparison of data between MDEQ’s internal database and PCS is conducted to ensure all data has been accurately reported. These organizational changes will improve timeliness and accuracy of data in the national system.
Recommendation(s) No formal recommendation is being tracked for this element.
CWA Element 3 -- Timeliness of Data Entry: Degree to which the Minimum Data Requirements are timely.
3-1 This finding is a(n)
Meets SRF Program Requirements Area for State Attention Area for State Improvement – Recommendations Required Good Practice

Finding The State’s data entry of the Minimum Data Requirements was
timely.
Explanation CWA Element 3 addresses the timely entry of data into PCS. The PCS Quality Assurance Manual notes that “(T)imeliness refers to the “punctuality” of information in the data base – as measured by the length of time between the actual event (or receipt of information about the event) and its appearance in the data base. PCS targets for timeliness vary by the type of data being entered into the system.” The longest timeframe specified in the Manual is ten days. Twenty-eight of thirty-one (90%) of the required frozen data elements from the Official Data Set (ODS) were timely. Of the three data elements that were not timely, the difference in the reported numbers is not appreciable and does not indicate a systemic issue. Thus, MDEQ meets SRF program requirements for this Element.
Metric(s) and Quantitative Value(s)
Data Metrics Frozen Production 1b2: Major individual permits: 99.8% 98.5% DMR entry rate based on MRs expected (Forms/Forms) 1b3: Major individual permits: 99.9% 98.5% DMR entry rate based on DMRs expected (Permits/Permits) 1c2: Non-major individual permits: 99.7% 98.2% DMR entry rate based on DMRs expected (Forms/Forms) 1c3: Non-major individual permits: 99.7% 98.2% DMR entry rate based on DMRs expected (Permits/Permits)
State Response None
Recommendation(s) No further action is needed.

CWA Element 4 — Completion of Commitments: Degree to which all enforcement/compliance commitments in relevant agreements are met and any products or projects are completed.
4-1 This finding is a(n)
Meets SRF Program Requirements Area for State Attention Area for State Improvement – Recommendations Required Good Practice
Finding For FY2010, MDEQ met or exceeded most of the compliance and
enforcement commitments from their CWA §106 Grant Work Plan.
Explanation
The compliance and enforcement aspects of MDEQ’s FY 2010 CWA §106 Grant Work Plan describes planned inspection requirements; data management requirements; reporting/enforcement requirements; pretreatment facilities requirements; and policy, strategy and management requirements for the fiscal year. MDEQ’s FY 2010 Grant Work Plan contained 26 compliance and enforcement tasks/commitments. Twenty-five (96%) of the Grant Work Plan tasks were met. The State did not meet the Work Plan’s inspection commitments related to Compliance Monitoring Inspections (CMIs) of Significant Industrial Users (SIUs). The work plan commitment required 100% of the State’s SIUs to be inspected. They completed 83% of their CMIs for SIUs. To address the CMI shortfall, MDEQ coordinated among divisions to develop new processes and flow charts that are now being implemented. Since the one noted concern is being addressed by the State, this is an area that meets SRF Program requirements.
Metric(s) and Quantitative Value(s)
Metric 4a – Planned inspections completed/committed: Majors: 51/43 (119%); Minors: 216/217 (99%); SSOs: 97/15 (647%); SIUs/CEIs: 200/198 (101%); SIUs/CMIs: 165/198 (83%); General Permitted Minors: 110/44 (250%); MS4 Phase II: 9/7 (129%); Industrial Stormwater: 236/93 (254%); Construction Stormwater: 355/214 (166%); CAFOs: 25/25 (100%); and AFOs: 25/25 (100%) 4b – Planned commitments complete: 96% (25/26)

State Response None
Recommendation(s) No further action is needed.
CWA Element 5 — Inspection Coverage: Degree to which state completed the universe of planned inspections/compliance evaluations.
5-1 This finding is a(n)
Meets SRF Program Requirements Area for State Attention Area for State Improvement – Recommendations Required Good Practice
Finding MDEQ met or exceeded the inspection commitments required by
EPA’s CMS and as outlined by the State’s FY 2010 CWA §106 Work Plan.
Explanation Element 5 measures the degree of the State’s core inspection coverage. The Agency’s Compliance Monitoring Strategy (CMS) set a goal of 100% inspections of major permittees every two fiscal years; and an inspection frequency of at least once in each five (5) year permit term for “traditional” minor permittees. The State submits a detailed inspection plan that lays out the inspection framework for the coming year. In the State’s FY 2010 CWA §106 Work Plan, MDEQ committed to inspect 50% of their NPDES majors and 20% of their NPDES minor facilities. Additionally, the State committed to inspect 44 minors with General Permits. Per the review of the data metrics (shown below) and the end-of-year Work Plan, the State met or exceeded their FY 2010 core inspection commitments. As a result of this level of performance, the State meets SRF Program requirements.
Metric(s) and Quantitative Value(s)
Grant Work Plan Data Metrics Completed/Commitment 5a: Inspection Coverage - Majors 51/43 = 119% of the Work Plan Commitment (Note: The ODS shows 96 majors, while the FY 2010 106 Work Plan shows 86 majors. For the purposes of this Data Metric, the Work Plan will be used.)

5b1: Inspection Coverage - Non-major 217/216 = 101% of the Work Plan individual permits Commitment (Note: The ODS shows 1,384 non-majors, while the FY 2010 106 Work Plan shows 1,085 non-majors. For the purposes of this Data Metric, the Work Plan will be used.) Grant Work Plan Data Metrics Completed/Commitment 5b2: Inspection Coverage - non-major 110/44 = 250% of the Work Plan general permits Commitment
State Response None
Recommendation(s) No further action is needed.
CWA Element 6 — Quality of Inspection or Compliance Evaluation Reports -- Degree to which inspection or compliance evaluation reports properly document observations, are completed in a timely manner, and include accurate description of observations.
6-1 This finding is a(n)
Meets SRF Program Requirements Area for State Attention Area for State Improvement – Recommendations Required Good Practice
Finding The majority of the State’s CWA inspection reports were of good quality, timely and provided documentation to appropriately determine compliance. The inspection reports were, however, found to be incomplete because the State did not include the time of the inspection and phone numbers; information that is required by the State’s Compliance Inspection Manual to be included in inspection reports.
Explanation Element 6 is supported by SRF File Metrics 6a (number of inspection reports reviewed), 6b (inspection report completeness), 6c (if a compliance determination could be drawn from documentation found in the inspection files), and 6d (timeliness of the inspection reports). Thirty-two inspection reports for twenty different facilities were

reviewed for Element 6 (File Metric 6a). File Metric 6b assesses the completeness of inspection reports. Completeness is based on the CWA Plain Language Guide (PLG) and the State’s Compliance Inspection Manual. Of the inspection reports reviewed, none were considered to be complete. Elements most commonly missing from the inspection reports were the time of the inspection and the phone numbers of the facility’s representatives, both requirements of the State’s Compliance Inspection Manual. Additionally, it is noted that the Section III of the State’s Compliance One Stop Integrated Information Management System called enSite (electronic Environmental Site information System) using the form contained in Attachment B of the manual. The form in Attachment B, however, does not specifically require the time of the on-site inspection or the phone numbers of the facility’s representatives. Therefore, there are inconsistencies within the State’s Compliance Inspection Manual concerning these missing report elements and these inconsistencies should be addressed. Additionally, there was one report that was undated, unsigned and did not indicate if photos or other materials were attached; and another report had no signatures on the file copies. Therefore, while the majority of inspection reports were well written and complete except for inspection times and phone numbers, this is an area for State attention, and MDEQ can examine current procedures to consistently complete inspection reports. File Metric 6c addresses whether the inspection report provided sufficient information to determine the compliance status of the facility. Of the 32 inspection reports reviewed, all had adequate documentation to determine compliance. File Metric 6d measures the timely completion of inspection reports. Section III of the MDEQ Compliance Inspection Manual establishes the following criteria: The report must be finalized and transmitted to the facility within 45 days of the inspection, if no violations were found. Generally, if violations are found, a Notice of Violation must be transmitted to the facility within 50 days of completion of the inspection. If additional information (i.e. beyond that obtained during the inspection) is needed to make a compliance determination – For example, the results of laboratory analysis of samples taken during the inspection – the inspection report must be finalized as soon as practicable after the additional information is received. Of the 32 inspection reports reviewed, 29 reports (91%) were completed within 45 days or within 50 days if a violation was found.

For the three reports that were not timely, the timeframes ranged from 75 days to 330 days. While the majority of inspection reports were completed in a timely manner, the few that were late are not indicative of significant problems. This is an area for State attention.
Metric(s) and Quantitative Value(s)
File Review Metrics State Performance 6a: # of inspection reports reviewed 32 6b: % of inspection reports that are complete 0% (Note: The missing elements in the inspection reports were phone numbers and the time of inspection.) 6c: % of inspection reports with sufficient documentation 100% 6d: % of inspection reports that are timely 91%
State Response MDEQ respectfully disagrees with EPA on this metric classification and believes that the finding should be modified to “Meets SRF Program Requirements.” MDEQ disagrees with EPA that the approved Compliance Inspection Manual requires the time of the inspection. In fact, the guidance states that reports “should” include, but does not categorically require, the date and time of the inspection. Further evidence that the time of inspection is not required is the fact that the required inspection report form generated by enSite does not include a place for “time of inspection.” While the inspection report form and the policy narrative are arguably inconsistent, generally the time of the inspection is irrelevant. Furthermore, nothing in MDEQ’s inspection manual or inspection report form requires the facility telephone number to be included in a report. The facility contact information is maintained in the enSite database and is readily available at anytime to all MDEQ staff. MDEQ, frankly, considers disingenuous EPA statements that none of the inspection reports reviewed were complete based solely on “time of inspection” and “facility phone numbers”, particularly when 100% of them were suitable to make an adequate compliance determination. In response to EPA’s findings during the SRF, MDEQ will remove reference to “time of inspection” from our inspection manual.
Recommendation(s) No formal recommendation is being tracked for this element.
CWA Element 7 — Identification of Alleged Violations: Degree to which compliance determinations are accurately made and promptly reported in the national database based

upon compliance monitoring report observations and other compliance monitoring information.
7-1 This finding is a(n)
Meets SRF Program Requirement Area for State Attention Area for State Improvement – Recommendations Required Good Practice
Finding Compliance determinations were accurately made and single event violations were reported.
Explanation Data Metrics 7a1 and 7a2 track Single Event Violations (SEVs) for active majors and non-majors, respectively, which are reported in PCS. SEVs are one-time or long-term violations discovered by the State, typically during inspections and not through automated reviews of Discharge Monitoring Reports. In FY 2010, the State entered 3 SEVs for majors and 2 SEVs for non-majors. This level of SEV identification is greater than or equal to SEV data entry over the last few years. Since the State has maintained a level of SEV data entry, no action is needed. Data Metrics 7b and 7c address the percent of facilities with unresolved compliance schedule violations at the end FY 2010, and the percent of facilities with unresolved permit schedule violations at the end of the FY 2010, respectively. For Data Metric 7b, MDEQ data show 5 of 60 facilities (8.3%) with unresolved compliance schedule violations. This percentage is below the National Average of 22.6%. For Data Metric 7c, the State had originally shown 1 of 1 facility (100%) with unresolved permit violations at the end of the Fiscal Year, but corrected this data point to now show no facilities with unresolved permit schedule violations - the National Average for this Data Metric is 21.9%. No further action is needed. Data Metric 7d addresses the percent of major facilities with DMR violations in PCS. For MDEQ, 47 of 96 major facilities (49%) have DMR violations reported in PCS. Data Metric 7d is slightly below the National Average of 52.8%. Since the rate of DMR-identified violations in PCS, supported by the File Review, is in line with the National Average, there are no concerns with the State’s reporting of DMR violations in PCS. File Review Metric 7e addresses the percent of inspection reports reviewed that led to an accurate compliance determination. Since accurate compliance determinations were made for each cited violation (100%), no further action is needed.
Metric(s) and Data Metrics State

Quantitative Value(s)
7a1: # SEVs at active majors 3 7a2: # SEVs at non-majors 2 7b: % facilities with unresolved compliance schedule violations 8.3% 7c: % facilities with unresolved permit schedule violations 0% 7d: Major facilities with DMR violations 49% File metric State 7e: % inspection reports reviewed that led to an accurate compliance (32 of 32) determination 100%
State Response None
Recommendation(s) No further action is needed.
CWA Element 8 — Identification of SNC and HPV: Degree to which the state accurately identifies significant noncompliance/high priority violations and enters information into the national system in a timely manner.
8-1 This finding is a(n)
Meets SRF Program Requirements Area for State Attention Area for State Improvement – Recommendations Required Good Practice
Finding MDEQ correctly identified SNC violation determinations in all files reviewed.

Explanation Element 8 addresses the accurate identification of SNCs and the timely entry of SEVs that are SNCs into PCS. In addressing the accurate identification of SNCs, Data Metric 8a1, focuses on active major facilities in SNC during the reporting year. In FY 2010, the State listed 11 facilities in SNC. Data Metric 8a2 focuses on the percent of active major facilities in SNC during the reporting year. The State reported 11.5% (11/96) in FY 2010 - the National Average is 24.6%. To verify the accuracy of SNC data in PCS, 7 SNC facilities were evaluated during the SRF File Review process to determine if the SNC designations were supported by the files. Of the facilities reviewed, all 7 (100%) had information in the files that matched the information in the data system. Since the rate of MDEQ’s SNC identification rate in PCS, supported by the File Review, is less than the National Average, there are no concerns with the State’s SNC identification rate in PCS. File Metric 8b addresses SEVs that are accurately identified as SNC or non-SNC, and File Metric 8b addresses the timely reporting of SEVs that are SNCs into PCS. For File Metric 8b, of the 4 files reviewed in which a SEV was noted, all were properly identified as a non-SNC. Of these four, two were minors and two were majors. For File Metric 8c, since all 4 SEVs were properly identified as non-SNCs, the timely entry of SEVs that are SNCs into PCS could not be evaluated. The State meets the SRF Program requirements for this element.
Metric(s) and Quantitative Value(s)
Data Metric National Average State 8a1: Number of major facilities in SNC NA 11 8a2: % active major facilities in SNC 24.6%. 11.5% File Metric State 8b: % SEVs that are accurately reported as SNCs or non-SNCs (8/8) 100% 8c: % SEVs that are SNCs timely reported in PCS NA
State Response None

Recommendation(s) No further action is needed.
CWA Element 9 — Enforcement Actions Promote Return to Compliance: Degree to which enforcement actions include required corrective action (i.e., injunctive relief or other complying actions) that will return facilities to compliance in a specific time frame.
9-1 This finding is a(n)
Meets SRF Program Requirements Area for State Attention Area for State Improvement – Recommendations Required Good Practice
Finding The State’s enforcement actions, as a whole, include complying or
corrective action that will return facilities to compliance.
Explanation Element 9 addresses the degree to which State enforcement actions include required corrective action that will return facilities to compliance in a specific time frame. File Metric 9a establishes the universe of formal/informal enforcement responses reviewed in calculating percentages in File Metrics 9b and 9c. Files selected for EPA’s File Review for Element 9 included 8 major facilities (4 SNCs and 5 non-SNCs - one facility was counted as both a SNC and non-SNC) and 13 minor facilities (3 SNCs and 10 non-SNCs) covering 49 formal and informal enforcement actions. File Metric 9b is the percentage of enforcement responses reviewed that have returned or will return a SNC to compliance. The CWA Plain Language Guide notes that this File Metric pertains only to major facilities, (as these facilities are the only ones for which national criteria for SNC violations have been established). Of the four major SNC facilities, all enforcement responses reviewed contained requirements that have returned or will return the source to compliance. One major SNC did not include an enforcement response and was, therefore, not included as part of the review for this File Metric. File Metric 9c is the percentage of enforcement responses reviewed that have returned or will return a non-SNC to compliance. Of the enforcement actions in the 40 non-SNC files reviewed, all have returned or will return the source to compliance. Since all 49 enforcement actions reviewed have returned or will return a

source to compliance, the State meets the SRF Program requirements.
Metric(s) and Quantitative Value(s)
File Metric State 9a: # of Enforcement Actions Reviewed for all sources 49 9b: % of Enforcement Responses for major SNCs that have or will return SNC to compliance (3/3) 100% 9c: % of Enforcement Responses have or will return non-SNC majors and minors to compliance (40/40) 100%
State Response None
Recommendation(s) No further action is needed.
CWA Element 10 — Timely and Appropriate Action: Degree to which state takes timely and appropriate enforcement actions in accordance with policy relating to specific media.
10-1 This finding is a(n)
Meets SRF Program Requirements Area for State Attention Area for State Improvement – Recommendations Required Good Practice
Finding The State needs to show improvement in taking timely enforcement
action for SNCs and non-SNCs in accordance with the NPDES Enforcement Management System (EMS) and the State’s EMS.
Explanation
Element 10 addresses the degree to which the State takes timely and appropriate enforcement actions. The 1989 National EMS and the May 29, 2008, memo Clarification of NPDES EMS Guidance on Timely and Appropriate Response to Significant Noncompliance, and the December 1, 2009 White Paper on the Basis for Identification and Reporting of CWA/NPDES SNC Violation defines what a timely and

appropriate enforcement response is for SNC violations at major facilities. These documents state that “(A)dministering agencies are expected to take a formal enforcement action before the violations appear on the second Quarterly Non-Compliance Report (QNCR), generally within 60 days of the first QNCR.” Additionally, the State’s EMS notes that formal enforcement actions should generally be concluded within 180 days of the date of discovery of the violation. Data Metric 10a is a goal metric that identifies the percentage of facilities in which enforcement actions that were taken to address SNC violations by major facilities were not timely. The State’s Data Metric 10a shows 7.4% (7 of 95) major facilities without timely action. The National Goal for this Data Metric is less than 2%. Therefore, the State’s performance does not meet the National Goal and requires improvement. (Note: The ODS shows 95 major facilities for this Data Metric instead of 96 because one facility in the universe is regulated by EPA, not the State.) File Metric 10b addresses the percentage of reviewed enforcement responses that have been taken to address major SNCs in a timely manner and is used to assess the accuracy of Data Metric 10a. Of the major SNCs reviewed, none (0 of 2) of the enforcement responses were timely. This finding supports Data Metric 10a in that the National Goal of less than 2% is not being met and further highlights the need for State improvement in the timeliness of enforcement responses for major SNCs. File Metric 10c assesses whether the enforcement action taken for a SNC is appropriate, meaning was a formal enforcement action taken or the source returned to compliance by no later than the time the same SNC violation appears on the second official QNCR. The State is also required by the National EMS to have a written record to justify informal enforcement actions. Of the major SNC files reviewed, two contained formal enforcement actions that were taken in FY2010 (the year of review). Two additional SNC files revealed that 7 informal enforcement actions were taken in FY2010 that were then followed by formal enforcement actions in FY2011. No further action is needed for this File Metric. File Metric 10d assesses whether the enforcement action taken for “violations at minor permittees, and non-SNC violations at major permittees” is appropriate. The State had taken a total of 40 actions at 18 non-SNC major and minor facilities in which they had taken 11 formal enforcement actions and 29 informal enforcement actions. 100% (40 of 40) of enforcement responses reviewed appropriately addressed non-SNCs. No further action is needed for this File Metric.

File Metric 10e examines the timeliness of enforcement for non-SNCs. The State’s March 2009 EMS addresses timeframes for responding to non-SNCs, as follows: “Issue NOV to the AI (Agency Interest) within 60 days of the date of discovery.” Of the 42 non-SNC enforcement responses examined during the File Review, 32 (76%) of the enforcement actions were considered to be timely. (Note: 42 enforcement responses were evaluated for timeliness instead of 40 because 2 enforcement responses were taken after the year of review and were determined not to be timely although the enforcement response was not reviewed for appropriateness.) This rate of timeliness for this File Metric highlights the need for State improvement in the timeliness of enforcement responses for non-SNC facilities.
Metric(s) and Quantitative Value(s)
Data Metric National Goal State 10a: Major facilities without timely action <2% 7.4% File Metric State 10b: % timely SNC enforcement responses (0 of 2) 0% 10c: % of enforcement responses that appropriately address SNC violations (2 of 2) 100% 10d: % of enforcement responses that appropriately address non-SNC violations (40 of 40) 100% 10e: % timely non-SNC enforcement responses (32 of 42) 76%
State Response MDEQ began a process improvement initiative following Round 1 SRF. All EPA recommendations precipitated by SRF Round 1 have been implemented by MDEQ. Staff were trained on these new business processes and full implementation began around the beginning of FFY10. MDEQ continues to monitor and track enforcement actions and strives to initiate and resolve enforcement in accordance with the timelines agreed upon. However, MDEQ’s revised policies and procedures recognize and specifically mention that complex and other otherwise difficult cases may exceed the designated timelines. MDEQ suggests that some portion of the cases that did not meet the timeline requirement included such difficult cases. Furthermore, MDEQ has repeatedly advised EPA that a significant number of the state’s enforcement actions include multi-media violations, and that MDEQ business practice is to address all violations, regardless of media, under one enforcement action. MDEQ’s enforcement approach may result in a particular media’s timeline goal being exceeded. While MDEQ recognizes this potential

situation, MDEQ has no intention to change its business practice to specifically address this EPA recommendation. MDEQ will, however, continue to monitor each enforcement case and improve enforcement management to yield more timely enforcement resolution.
Recommendation(s) The State should take steps to ensure that timely enforcement is used to address SNCs and non-SNCs as established by the NPDES EMS and the State’s EMS. The EPA Region 4 Clean Water Enforcement Branch (CWEB) will evaluate the enforcement responses being taken by the State against SNCs through the quarterly Pacesetter calls and/or other routine calls with a progress report to be prepared after the last FY2012 Pacesetter call. If, by March 31, 2013, the State is consistently issuing timely enforcement responses, this issue will be considered resolved.
CWA Element 11 — Penalty Calculation Method: Degree to which state documents in its files that initial penalty calculation includes both gravity and economic benefit calculations, appropriately using the BEN model or other method that produces results consistent with national policy.
11-1 This finding is a(n)
Meets SRF Program Requirements Area for State Attention Area for State Improvement – Recommendations Required Good Practice
Finding MDEQ documents initial penalty calculations that include gravity,
however, inclusion and documentation of economic benefit in the penalty calculations occurs much less often.
Explanation Element 11 addresses whether penalty calculations consider and include a gravity portion and, where appropriate, economic benefit. For File Metric 11a, there were ten initial penalty calculations evaluated as part of the File Review. The penalty calculations reviewed during the file review were well documented using a penalty worksheet. All ten files incorporated a penalty calculation and/or narrative that included a gravity component, however, one facility’s penalty calculation was confusing in that there were three penalty calculations provided that were all different. It was unclear which calculation was the one to be used. As to economic benefit, only three of ten (30%) files reviewed provided sufficient documentation of the appropriate economic benefit component of the penalty. The remaining files did not provide sufficient information to demonstrate

that economic benefit had been considered. As noted in EPA’s Policy, Oversight of State and Local Penalty Assessments: Revisions to the Policy Framework for State/EPA Enforcement Agreements, from Steven A. Herman, Assistant Administrator, June 23, 1993, one is not to settle for less than the amount of economic benefit of noncompliance, where it is possible to calculate it, unless (1) the benefit component is a de minimis amount, (2) a violator demonstrates an inability to pay, (3) there is a compelling public concern, or (4) there are litigation-related reasons for such settlement. Additionally, the State’s March 2009 EMS outlines the State’s Clean Water Act Penalty Policy which includes a penalty calculation methodology that incorporates both gravity and economic benefit components. In the case of economic benefit, the policy states that “an economic benefit amount is generally considered de minimis if, considering all of the facts and circumstances of the case, the amount would not justify the commitment of resources that would be necessary to calculate and/or collect it.” The State needs to better document its rationale for how economic benefit is considered and, if determined to be nonexistent or de minimis, the rationale for that decision should be documented in the penalty calculation. This is an area for State improvement.
Metric(s) and Quantitative Value(s)
File Metric State 11a: % of penalty calculations reviewed that consider and include where appropriate gravity and economic benefit (3 of 10) 30%
State Response MDEQ respectfully disagrees with EPA on this metric classification and believes that the finding should be modified to “Area for State Attention.” As MDEQ recalls the on-site review by EPA, EPA was initially pleased with the documentation and consideration of economic benefit by MDEQ staff. Only after reviewing a particular penalty calculation which happened to contain more specific documentation of economic benefit considerations than others, did EPA determine that MDEQ may be deficient in its consideration of economic benefit. Consideration and/or documentation of economic benefit was an issue identified in the Round 1 SRF. Staff were trained on the new business processes and full implementation began around the beginning of FFY10. Following the on-site SRF, MDEQ managers were advised of EPA’s concerns and we have already implemented actions to better document economic benefit considerations.

Recommendation(s) The State should better demonstrate implementation of EPA’s Policy and the State’s EMS in documenting its rationale for considering economic benefit in penalty calculations. The EPA Region 4 CWEB will evaluate the State’s penalty calculations through the quarterly Pacesetter calls and/or other routine calls with a progress report to be prepared after the last FY2012 Pacesetter call. If, by March 31, 2013, the State is consistently including and documenting economic benefit in its penalty calculations, this issue will be considered resolved.
CWA Element 12 — Final Penalty Assessment and Collection: Degree to which differences between initial and final penalty are documented in the file along with a demonstration in the file that the final penalty was collected.
12-1 This finding is a(n)
Meets SRF Program Requirements Area for State Attention Area for State Improvement – Recommendations Required Good Practice
Finding MDEQ documented the difference between initial and final penalties
in enforcement cases, and maintained documentation that the final penalty was collected.
Explanation File Metric 12a addresses the percent of penalties reviewed that document the difference and rationale between the initial and final assessed penalty. In reviewing 10 penalty cases, the State provided the rationale and documentation for the difference between the initial and final assessed penalty in 3 instances, did not provide the rationale or documentation in 1 case, and in 6 cases there was no difference between the initial and final assessed penalty. Therefore, the State documented the difference between the initial and final assessed penalty in 9 of 10 files (90%). File Metric 12b addresses the percent of enforcement actions with penalties that document the collection of the penalty. The State had documentation that 10 of 10 (100%) of the enforcement actions with penalties documented collection of the penalty. No further action is needed for this File Metric.
Metric(s) and Quantitative Value(s)
File Metric State 12a: % of formal enforcement actions that document the difference and rationale between initial and final assessed penalty (9 of 10) 90% 12b: % of final enforcement actions that document collection of final penalty (10 of 10) 100%

Resource Conservation and Recovery Act Program
State Response MDEQ believes that EPA’s findings in the CWA Element 12 substantiate MDEQ’s assertions that EPA’s findings in CAA Element 12 were isolated and the results of a misunderstanding within one ECED Branch.
Recommendation(s) No further action is needed.
RCRA Element 1 — Data Completeness: Degree to which the Minimum Data Requirements are complete.
1-1 This finding is a(n)
Meets SRF Program Requirements Area for State Attention Area for State Improvement – Recommendations Required Good Practice
Finding MDEQ has entered the Minimum Data Requirements into RCRAInfo
for regulated universes, compliance monitoring and enforcement information.
Explanation Element 1 is supported by SRF Data Metrics 1a through 1g, and measures the completeness of the data in RCRAInfo. EPA provided the SRF data metrics to MDEQ for comment on March 18, 2011. In their response, MDEQ did not identify any discrepancies in the data, therefore the RCRAInfo data is considered complete.
Metric(s) and Quantitative Value(s)
Data Metrics Frozen State Data 1a1 - # of operating TSDs in RCRAInfo 7 1a2 - # of active LQGs in RCRAInfo 146 1a3 - # of active SQGs in RCRAInfo 391 1a5 - # of LQGs per latest official biennial report 122 1b1 - # of inspections 95 1c1 - # of sites with violations 22 1d2 - Informal Actions: number of actions 11 1e1 - SNC: number of sites with new SNC 4 1e2 - SNC: number of sites in SNC 13 1f2 - Formal action: number taken 9
1g - Total amount of final penalties $77,860
State Response None

Recommendation(s) No further action is needed.
RCRA Element 2 — Data Accuracy: Degree to which data reported in the national system is accurately entered and maintained.
2-1 This finding is a(n)
Meets SRF Program Requirements Area for State Attention Area for State Improvement – Recommendations Required Good Practice
Finding In general, MDEQ accurately enters all MDR data into RCRAInfo with
only minor exceptions.
Explanation RCRA Element 2 is supported by data metrics 2a, 2b, and file review metric 2c and measures the accuracy of data in RCRAInfo. Data Metrics 2a1 and 2a2 measure the closeness of the Significant Non-Complier (SNC) determination to date of the formal action. These metrics are used as an indicator of enforcement cases where the SNC entry was withheld until the enforcement action was taken. Mississippi had nine formal actions in FY2010 and all actions were taken after the SNC determination. Therefore, delayed SNC entry into RCRAInfo is not a concern. Data Metric 2b measures RCRA secondary violators (non-SNCs) that have violations not-returned-to-compliance within 240 days. According to the RCRA Enforcement Response Policy (ERP), all secondary violators should be returned to compliance within 240 days. If the violations are open for more than the 240 day time period, the enforcement action should be elevated to SNC status and addressed through formal enforcement. For data metric 2b, Mississippi did not have any facilities identified as Secondary Violators (SVs) greater than 240 days in FY2010. File Review Metric 2c measures the percentage of files where corresponding data was reported accurately in RCRAInfo. A file is considered inaccurate if information in the inspection report, enforcement action, or civil and administrative enforcement response is missing or reported inaccurately in RCRAInfo. For data metric 2c, 20 files were reviewed. Of the 20 files reviewed, 15 (75%) had complete and accurate data reported in RCRAInfo. The following data

inaccuracies were identified in the remaining five files:
• In three files, there was a one-day difference between the day of the inspection reported in the file and the date reported in RCRAInfo.
• In the fourth file, the facility had changed generator status and it was not updated in RCRAInfo.
• In the fifth file, there were violations in the inspection report that were not entered into RCRAInfo.
This Metric found that MDEQ is entering the majority of data into RCRAInfo accurately; however, some data does not reflect what is in the file. These data inaccuracies are infrequent instances that do not constitute a significant problem.
Metric(s) and Quantitative Value(s)
Data Metrics State 2a1 - # of sites SNC determinations made on day of formal action 0 2a2 - # of sites SNC determinations made within one week of formal action 0 2b – # of sites in violation greater than 240 days 0 File Review Metric State 2c – % files with accurate data elements in RCRAInfo 75%
State Response All MDEQ RCRAInfo data entry responsibilities now reside within the Environmental Compliance and Enforcement Division. The organizational change occurred in FFY11. Data entry is being closely monitored for accuracy and timeliness and MDEQ anticipates better internal coordination and a much higher level of data accountability. These organizational changes will improve timeliness and accuracy of data in the national system. MDEQ is currently conducting monthly comparisons between MDEQ’s internal database and RCRAInfo to ensure accuracy of data. New standard operating procedures are in place to ensure all SNC violations are appropriately linked to the addressing enforcement action. In FY11 all SNC were linked appropriately.
Recommendation(s)
No formal recommendation is being tracked for this element.
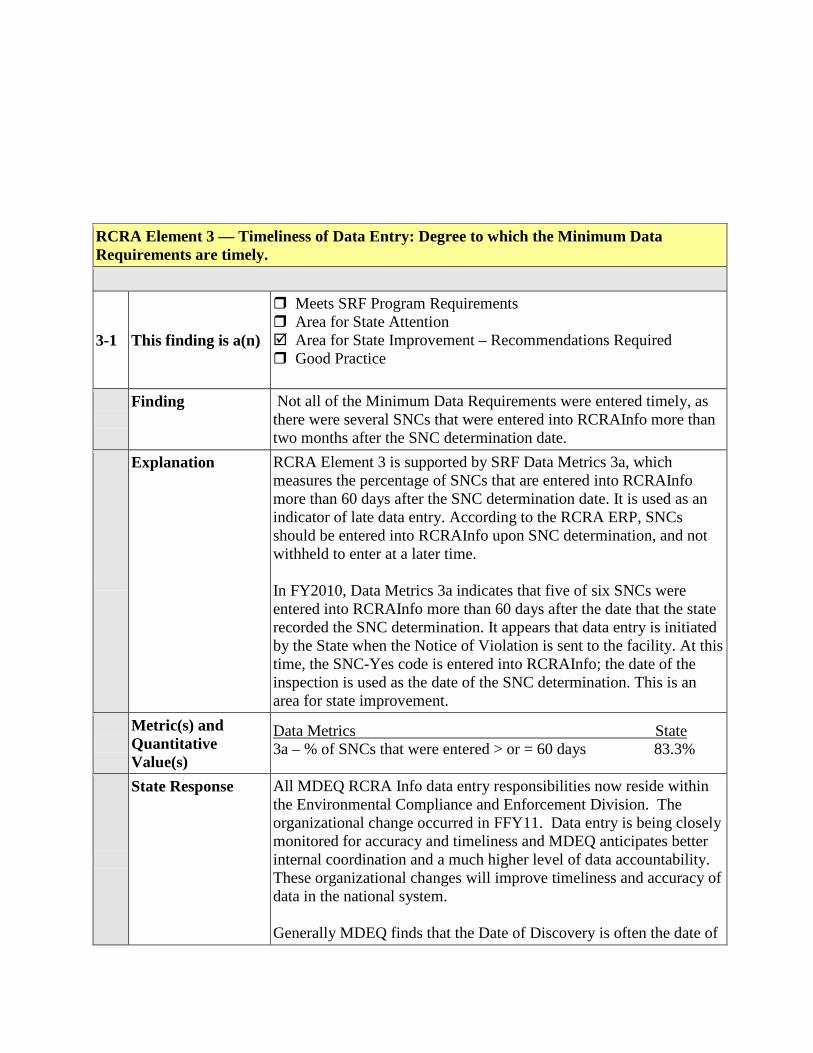
RCRA Element 3 — Timeliness of Data Entry: Degree to which the Minimum Data Requirements are timely.
3-1 This finding is a(n)
Meets SRF Program Requirements Area for State Attention Area for State Improvement – Recommendations Required Good Practice
Finding Not all of the Minimum Data Requirements were entered timely, as
there were several SNCs that were entered into RCRAInfo more than two months after the SNC determination date.
Explanation RCRA Element 3 is supported by SRF Data Metrics 3a, which measures the percentage of SNCs that are entered into RCRAInfo more than 60 days after the SNC determination date. It is used as an indicator of late data entry. According to the RCRA ERP, SNCs should be entered into RCRAInfo upon SNC determination, and not withheld to enter at a later time. In FY2010, Data Metrics 3a indicates that five of six SNCs were entered into RCRAInfo more than 60 days after the date that the state recorded the SNC determination. It appears that data entry is initiated by the State when the Notice of Violation is sent to the facility. At this time, the SNC-Yes code is entered into RCRAInfo; the date of the inspection is used as the date of the SNC determination. This is an area for state improvement.
Metric(s) and Quantitative Value(s)
Data Metrics State 3a – % of SNCs that were entered > or = 60 days 83.3%
State Response All MDEQ RCRA Info data entry responsibilities now reside within the Environmental Compliance and Enforcement Division. The organizational change occurred in FFY11. Data entry is being closely monitored for accuracy and timeliness and MDEQ anticipates better internal coordination and a much higher level of data accountability. These organizational changes will improve timeliness and accuracy of data in the national system. Generally MDEQ finds that the Date of Discovery is often the date of

the inspection. MDEQ’s business practice has been to input SNC determination information into RCRAInfo upon sending a Notice of Violation (NOV) to the responsible party. The time required to draft accurate and quality inspection reports and have such reports reviewed and approved by first level management, and the time required to draft the NOV, sometimes exceeds 60 days. Thus, using the date of the inspection as the Date of Discovery results in the SNC designation exceeding the SNC data entry requirement. MDEQ plans to implement small modifications to its processes that will aid in complying with the SNC data entry requirement.
Recommendation(s) By September 30, 2012, MDEQ should submit and implement procedures for entering SNC codes into RCRAInfo within the 60 day time period. If by March 31, 2013, EPA observes a pattern of timely data entry, this issue will be considered resolved.
RCRA Element 4 — Completion of Commitments: Degree to which all enforcement/compliance commitments in relevant agreements are met and any products or projects are completed.
4-1 This finding is a(n)
Meets SRF Program Requirements Area for State Attention Area for State Improvement – Recommendations Required Good Practice
Finding The MDEQ Environmental Compliance and Enforcement Division
met its FY 2010 enforcement and inspection commitments.
Explanation The FY 2010 MDEQ RCRA grant work plan includes specific commitments for compliance monitoring activities, including inspections, financial record reviews, and the review of groundwater monitoring reports. Based on the FY 2011 annual reports completed by MDEQ and the EPA RCRA Program, MDEQ met all of its FY 2010 grant commitments.
Metric(s) and Quantitative Value(s)
File Metric State 4a – Planned inspections complete 100% 4b – Planned commitments complete 100%

RCRA Element 5 — Inspection Coverage: Degree to which state completed the universe of planned inspections/compliance evaluations.
5-1 This finding is a(n)
Meets SRF Program Requirements Area for State Attention Area for State Improvement – Recommendations Required Good Practice
Finding Mississippi completed core inspection coverage for Treatment,
Storage, and Disposal facilities (two-year coverage) and Large Quantity Generators (one-year and five-year coverage).
Explanation Element 5 is supported by Data Metrics 5a, 5b, and 5c. The EPA Office of Compliance and Enforcement (OECA), National Program Managers (NPM) Guidance provides the core program inspection coverage for Treatment, Storage, and Disposal facilities (TSDs) and Large Quantity Generators (LQGs). MDEQ met the two-year TSD requirement (Metric 5a) by completing inspections at 100% of the TSD universe over a two year period. The OECA NPM Guidance also provides that 20% of the LQG universe be inspected annually and, every five years, 100% of LQG universe be inspected. For the one-year LQG inspection coverage, Data Metric 5b showed that MDEQ exceeded the annual requirement by inspecting 32% of the universe (39 of 122 facilities). Furthermore, for the five-year LQG inspection coverage, between FY2006-FY2010, Data Metric 5c shows that 95.9% (117 of 122) LQGs received an inspection. This meets SRF program requirements.
Metric(s) and Quantitative Value(s)
Data Metrics National Goal State 5a - TSD inspection coverage (2 years) 100% 100% 5b - LQG inspection coverage (1 year) 20% 32.0% (39 of 122) 5c - LQG inspection coverage (5 years) 100% 95.9% (117 of 122)
State Response None
Recommendation(s) No further action is needed.

State Response None
Recommendation(s) No further action is needed
RCRA Element 6 — Quality of Inspection or Compliance Evaluation Reports: Degree to which inspection or compliance evaluation reports properly document observations, are completed in a timely manner, and include accurate description of observations.
6-1 This finding is a(n)
Meets SRF Program Requirements Area for State Attention Area for State Improvement – Recommendations Required Good Practice
Finding The majority of the MDEQ RCRA inspection reports were of good quality, were found complete, and provided documentation to appropriately determine compliance. However, the State is not timely in the completion of their inspection reports.
Explanation Element 6 is supported by SRF file review metrics 6a, 6b, and 6c. Twenty inspection reports were reviewed under Metric 6a. File Metric 6b assesses the completeness of inspection reports and whether they provide sufficient documentation to determine compliance at the facility. Of the inspection reports reviewed, 85% (17 of 20) were complete and had sufficient documentation to determine compliance at the facility. Examples of missing information in the three incomplete reports were: identification of facility type and inconsistent documentation of issues identified. This does not indicate problems with inspection report completeness and MDEQ should strive to have all inspection reports complete. File Review Metric 6c measures the timely completion of inspection reports. The MDEQ RCRA Compliance Inspection Manual (dated March 2009) establishes the following criteria: The report must be finalized and transmitted to the facility within 45 days of the inspection, if no violations were found. Generally, if violations are

found, a Notice of Violation (NOV) must be transmitted to the facility within 50 days of completion of the inspection. If additional information (i.e., beyond that obtained during the inspection) is needed to make a compliance determination – for example, the results of laboratory analysis of samples taken during the inspection – the inspection report must be finalized as soon as practicable after the additional information is received. Out of the 20 inspection reports reviewed, four of nine reports that cited no violations were completed within 45 days of the inspection and six of 11 reports that were followed by a NOV were completed within 50 days of the inspection. As such, 45% of the reports that did not cite violations were within the 45 day timeframe, and 35% of the reports that were followed by a NOV were within the 50 day timeframe. On average, it took 53 days to complete an inspection report that did not cite violations and 49 days to complete an inspection report that was followed by a NOV. Moreover, the range of days it took for inspection reports to be completed, is as follows: inspection reports that did not cite violations were completed between 25 days and 98 days; and, inspection reports that were followed by a NOV were completed between 2 days and 103 days. This is an area for State attention, and MDEQ can examine current procedures to identify efficiencies in the completion of inspection report.
Metric(s) and Quantitative Value(s)
File Review Metrics State 6a - # of inspection reports reviewed 20 6b - % of inspection reports that are complete 85% 6c - % of inspection reports that are timely: -Inspection reports that did not cite violations: 45% -Inspection reports that were followed by a NOV: 35%
State Response MDEQ began a process improvement initiative following Round 1 SRF. All EPA recommendations precipitated by SRF Round 1 have been implemented by MDEQ. Staff were trained on these new business processes and full implementation began around the beginning of FFY10. MDEQ continues to monitor and track staff activities and attempts to complete all activities within the applicable timelines. Timeliness is, however, secondary to quality work but remains an area of continued attention.

Recommendation(s) No formal recommendation is being tracked for this element.

RCRA Element 7 — Identification of Alleged Violations: Degree to which compliance determinations are accurately made and promptly reported in the national database based upon compliance monitoring report observations and other compliance monitoring information.
7-1 This finding is a(n)
Meets SRF Program Requirements Area for State Attention Area for State Improvement – Recommendations Required Good Practice
Finding The majority of the Mississippi inspection reports reviewed included
correct compliance determinations, and the inspection findings were promptly entered into RCRAInfo.
Explanation File Metric 7a assesses whether accurate compliance determinations were made based on inspection reports. Of the inspection reports reviewed, 90% (18 of 20) had accurate compliance determinations (i.e., proper identification of SNCs or SVs and/or source confirmed to be in compliance). There was one inspection where potential violations were missing from the report and another inspection where the facility was inspected as a RCRA SQG when the facility was listed as an LQG in RCRAInfo. Neither facility was identified as an SV. In File Review Metric 7b, the files were also reviewed to assess if violations were determined within 150 days and entered into RCRAInfo. There were twelve facility inspections where violations were found. With the exception of the two facilities referenced above, all facilities were issued a Notice of Violation within 150 days after the inspection and the information was entered into RCRAInfo by day 150. Since these issues are primarily isolated, non-systemic occurrences that do not represent a pattern, this is designated as an area for State attention.
Metric(s) and Quantitative Value(s)
File Review Metrics State 7a - % of inspection reports reviewed that led to accurate compliance determinations 90% 7b - % of violation determinations in the files that are reported within 150 days 83%
State Response The two referenced facilities were discussed in detail during the EPA SRF review. MDEQ disagreed at that time, and continues to disagree, with the reviewer’s compliance determinations regarding the two referenced facilities. With the exclusion of the two referenced sites, MDEQ respectfully disagrees with EPA on this metric classification and believes that, because of the difference of opinion regarding the two facilities noted above, the finding should be modified to “Meets

SRF Program Requirements.”
Recommendation(s) No formal recommendation is being tracked for this element.
RCRA Element 8 — Identification of SNC and HPV: Degree to which the state accurately identifies significant noncompliance/high priority violations and enters information into the national system in a timely manner.
8-1 This finding is a(n)
Meets SRF Program Requirements Area for State Attention Area for State Improvement – Recommendations Required Good Practice
Finding Mississippi correctly identified SNC violation determinations in all
files reviewed.
Explanation Data Metric 8a identifies the percent of the facilities that received a state SNC designation in FY 2010. Mississippi’s SNC identification rate is 4.3 % (4 of the 93 inspections conducted were identified as SNCs). The state’s SNC identification rate is above the national average of 2.6 %. Data Metric 8b measures the number of SNCs determinations that were made within 150 days of the first day of inspection, which is the requirement in the RCRA ERP. In FY2010, MDEQ identified and entered 100% (4 of 4) of their SNCs into RCRAInfo in a timely manner. The national goal is 100%. File Metric 8d measures the percentage of violations in the files that were accurately determined to be a SNC. It serves as a verification measure for data metric 8a. There were 20 inspection reports reviewed, and 100% of the SNCs (10 of 10) were correctly identified by the State.
Metric(s) and Quantitative Value(s)
Data Metrics State 8a - SNC identification rate 4.3% 8b - % of SNC determinations made 100% within 150 days

File Review Metric 8d - % of violations in files reviewed that were accurately determined to be SNC 100% (10 of 10)
State Response None
Recommendation(s) No further action is needed.
RCRA Element 9 — Enforcement Actions Promote Return to Compliance: Degree to which enforcement actions include required corrective action (i.e., injunctive relief or other complying actions) that will return facilities to compliance in a specific time frame.
9-1 This finding is a(n)
Meets SRF Program Requirements Area for State Attention Area for State Improvement – Recommendations Required Good Practice
Finding In the files reviewed, 100% of the enforcement responses included
corrective action to return the facilities to compliance.
Explanation Under File Review Metric 9a, EPA reviewed a total of eleven enforcement responses, including ten SNCs and one SV. File Review Metric 9b is the percentage of the SNC enforcement responses reviewed that returned or will return the facility to compliance. From a review of the files, all ten SNCs had documentation in the files showing the facility had returned to compliance or that the enforcement action required them to return to compliance within a specified timeframe. File Review Metric 9c is the percentage of SV enforcement responses reviewed that returned or will return the facility to compliance. In the one SV file reviewed, the correct documentation in the file showed that the facility returned to compliance or that the enforcement action required them to return to compliance in a specified timeframe.
Metric(s) and Quantitative Value(s)
File Review Metrics State 9a - # of enforcement responses reviewed 10 SNCs 1 SVs 9b - % of enforcement responses that returned SNCs to compliance 100% (10 of 10 )

9c - % of enforcement responses that returned SVs to compliance 100% (1 of 1)
State Response None
Recommendation(s) No further action is needed.
RCRA Element 10 — Timely and Appropriate Action: Degree to which state takes timely and appropriate enforcement actions in accordance with policy relating to specific media.
10-1 This finding is a(n)
Meets SRF Program Requirements Area for State Attention Area for State Improvement – Recommendations Required Good Practice
Finding Mississippi takes appropriate and timely enforcement actions for
SNCs. However, these actions are not reflected correctly because they are not linked in RCRAInfo
Explanation Element 10 is supported by Data Metrics 10a, and File Review Metrics 10c and 10d. Data Metric 10a is used to determine if MDEQ conducted formal enforcement actions within 360 days, as required by the ERP. It shows only 25% (1 of 4) having formal enforcement action taken within 360 days. The national goal is 80% so it appears that MDEQ is not meeting this goal. A file review was conducted to verify the metric data. The three enforcement actions carried as not meeting the timeliness criteria were examined and the results showed that the enforcement actions were timely. Upon further investigation, it was determined that the discrepancy deals with a common issue where SNCs need to be linked in RCRAInfo to final enforcement actions. When this link is not made, it will appear as if SNCs have not been resolved through enforcement, and therefore response times have been exceeded. Since the issue is data related vs. the state not following the SNC timeliness criteria, the state meets the SRF program requirements but

this is an area for state attention due to the data linkage issue. Data issues are addressed under the recommendation in Element 2. File Review Metric 10c measures the combined percentage of enforcement responses reviewed that are taken in a timely manner (for both SV and SNC facilities). There is no specific goal for the combined metric. Eleven of 11 facilities, or 100%, of the enforcement actions reviewed were addressed within the ERP timeframes, as outlined below: • SV timeliness: There was one informal enforcement response
reviewed, and it was taken in a timely manner (i.e., within 240 days).
• SNC timeliness: There were ten SNC enforcement responses reviewed where final formal enforcement was taken. All ten enforcement responses, or 100%, were taken within the 360-day timeframe. However, these actions were not accurately captured in the RCRAInfo database, data was not linked properly.
This supports the previous conclusion that MDEQ is addressing SNCs in a timely manner.
Metric(s) and Quantitative Value(s)
Data Metric National Goal State 10a - % timely SNC actions 80% 25% (1 of 4) File Review Metrics State 10c - % of enforcement actions SV 100% (1 of 1) taken in a timely manner SNC 100% (10 of 10) Combined 100% (11 of 11) 10d - % of enforcement actions that are appropriate to the violations 100% (11 of 11)
State Response EPA’s finding above states: “Mississippi takes appropriate and timely enforcement actions for SNCs. However, these actions are not reflected correctly because they are not linked in RCRAInfo (See Element 2).” RCRA Element 10 is for “Timely and Appropriate Action: Degree to which state takes timely and appropriate enforcement actions in accordance with policy relating to specific media.” The metric is not a review of data management although MDEQ is receiving a rating of “Area for State Attention” for data issues. MDEQ appreciates EPA’s recognition that the problem occurred with data management and not enforcement timeliness, and respectfully disagrees with EPA on this metric classification and believes that, based on the intent of the metric stated and EPA comments in that regard, the finding should be modified to “Meets SRF Program Requirements.”

All MDEQ RCRAInfo data entry responsibilities now reside within the Environmental Compliance and Enforcement Division. The organizational change occurred in FFY11. Data entry is being closely monitored for accuracy and timeliness and MDEQ anticipates better internal coordination and a much higher level of data accountability. These organizational changes will improve timeliness and accuracy of data in the national system. New standard operating procedures are in place to ensure all SNC violations are appropriately linked to the addressing enforcement action.
Recommendation(s) No formal recommendation is being tracked for this element.
RCRA Element 11 — Penalty Calculation Method: Degree to which state documents in its files that initial penalty calculation includes both gravity and economic benefit calculations, appropriately using the BEN model or other method that produces results consistent with national policy.
11-1 This finding is a(n)
Meets SRF Program Requirements Area for State Attention Area for State Improvement – Recommendations Required Good Practice
Finding In general, Mississippi documents initial penalty calculations that
include both gravity and economic benefit, with a few exceptions.
Explanation Element 11 determines whether penalty calculations consider and include a gravity portion and, where appropriate, economic benefit. For file metric 11a, there were ten initial penalty calculations evaluated as part of the file review. All ten files incorporated a penalty calculation and/or narrative that included a gravity component. For economic benefit, 70% (7 of 10) of the files provided sufficient documentation of the appropriate economic benefit considerations. The other three penalties stated that economic benefit was “not applicable” for the case. The State explained that for RCRA, there is often little or no economic benefit related to the violations so the factor is “not applicable.” It was recommended that even if economic benefit is determined to be nonexistent or de minimis (e.g., labeling violations, inspection records, etc.), the rationale for that decision

should be included in the penalty calculation. The State has agreed to these steps. The Region will follow up at the end of FY 2012 to ensure that economic benefit is being documented in all cases, even if it is de minimis.
Metric(s) and Quantitative Value(s)
File Review Metric State___ 11a - % of penalty calculations reviewed that consider 70% and include where appropriate gravity and economic benefit consistent with national policy.
State Response MDEQ maintains that for RCRA, there is often little or no economic benefit related to the many of the violations observed and therefore economic benefit is “not applicable.” However, immediately following the on-site SRF, MDEQ began documenting that rational in the penalty calculations. MDEQ will continue to emphasize to staff the need, consistent with the applicable EMS, to adequately document economic benefit considerations.
Recommendation(s) No formal recommendation is being tracked for this element.
RCRA Element 12 — Final Penalty Assessment and Collection: Degree to which differences between initial and final penalty are documented in the file along with a demonstration in the file that the final penalty was collected.
12-1 This finding is a(n)
Meets SRF Program Requirements Area for State Attention Area for State Improvement – Recommendations Required Good Practice
Finding Mississippi documented the difference between initial and final
penalties in enforcement cases, and maintained documentation that the final penalty was collected.
Explanation It is important that documentation of any differences and rationale between initial and final penalty calculations are maintained to determine if appropriate penalties have been recovered for the violations cited in the enforcement actions. A downward adjustment of the penalty in the final enforcement action may be appropriate due to new information provided in settlement negotiations, or a facility’s inability to pay a penalty. In file review metric 12a, 100% (9 of 9) enforcement cases had, where applicable, the needed documentation

to support a downward adjustment of the calculated penalty. Mississippi maintains records of all penalty collections through a central database, as reported in file metric 12b. Of the nine enforcement orders reviewed as part of the SRF, 100% had documentation that penalties were collected or were on a schedule for collection.
Metric(s) and Quantitative Value(s)
File Review Metrics State 12a - % of formal enforcement actions that 100% document the difference and rationale between initial and final assessed penalty 12b - % of final formal actions that document the 100% collection of the final penalty
State Response MDEQ believes that EPA’s findings in the RCRA Element 12 substantiate MDEQ’s assertions that EPA’s findings in CAA Element 12 were isolated and the results of a misunderstanding within one ECED Branch. Two of the three media reviewed show that MDEQ meets SRF program requirements for this Element.
Recommendation(s) No further action is needed.

V. ELEMENT 13 SUBMISSION
No submission by the MDEQ

APPENDIX A: STATUS OF RECOMMENDATIONS FROM PREVIOUS REVIEWS During the first SRF review of MDEQ’s compliance and enforcement programs, Region 4 and MDEQ identified a number of actions to be taken to address issues found during the review. The table below shows the status of progress toward completing those actions.
Status Due Date Media Element Finding Explanation Completion Verification
Completed 10/9/2007 CAA Insp Universe 243 FCEs were performed out of 293 (83%) CMS identified major sources for FY 2004-2005. Though this surpasses the national average of 78.4%, it is below the 100% commitment in MDEQ’s CMS plan
MDEQ should: Propose a plan that will ensure the implementation and fulfillment of your biennial CMS Schedule commitments. Recognizing the dynamic nature of source changes (i.e., sources close, change categories, etc.), ensure that the CMS flags in AFS are updated so CMS accuracy is maintained.
MDEQ developed a Process Improvement Plan which includes revisions of business processes and incorporates those processes as Standard Operating Procedures (SOPs). These efforts, which are continuing, have resulted in improvements in MDEQ’s compliance and enforcement programs and, for the most part, the completion of the recommendations identified in the Round 1 review.
Completed 10/9/2007 CAA Violations ID'ed Appropriately
33 source files showed 13 having complete documentation of all FCE/CMR elements. 20 source files had one or more elements not documented.
MDEQ should develop and implement a plan that will ensure that all elements of a CMR and FCE are consistently completed and documented for all source files.
MDEQ submitted revised SOP for documenting CAA FCE procedures to EPA on December 7, 2007.
Completed 10/9/2007 CAA Violations ID'ed Timely Based on the 20 inspection reports found in the files reviewed (note 13 of the files reviewed were missing their inspection reports), 14 were written within 150 days of the inspection (6 under 60 days) and 6 greater than 150 days.
MDEQ should propose and implement a plan for ensuring timely issuance of inspection reports. The process should consider the timely and appropriate aspects of EPA’s December 22, 1998 HPV policy.
MDEQ developed a Process Improvement Plan which includes revisions of business processes and incorporates those processes as Standard Operating Procedures (SOPs). These efforts, which are continuing, have resulted in improvements in MDEQ’s compliance and enforcement programs and, for the most part, the completion of the recommendations identified in the Round 1 review.
Completed 10/9/2007 CAA SNC Accuracy The low HPV discovery rate is a significant deficiency in MDEQ’s air enforcement program. According to the data
MDEQ should examine their present practices of identifying HPVs including timely identification to EPA and propose and implement a plan that will ensure
MDEQ developed a Process Improvement Plan which includes revisions of business processes and incorporates those processes as Standard Operating Procedures (SOPs). These efforts, which are continuing, have resulted in

metrics, MDEQ’s HPV discovery rate was 4.2% with the national average at 10.1%.
conformance with the processing requirements of the HPV policy.
improvements in MDEQ’s compliance and enforcement programs and, for the most part, the completion of the recommendations identified in the Round 1 review.
Completed 10/9/2007 CAA Timely & Appropriate Actions
MDEQ’s processing time for enforcement cases is significantly over the EPA guideline for timeliness. 71%, 12 of MDEQ’s 17 HPVs, remained unaddressed past 270 days, with the average timeframe for MDEQ resolving a violation being approximately 520 days.
MDEQ should examine their present practices of identifying HPVs and institute a plan that will ensure conformance with the processing requirements, entry into the national AFS data system, and reporting HPVs to EPA in a timely manner.
MDEQ developed a Process Improvement Plan which includes revisions of business processes and incorporates those processes as Standard Operating Procedures (SOPs). These efforts, which are continuing, have resulted in improvements in MDEQ’s compliance and enforcement programs and, for the most part, the completion of the recommendations identified in the Round 1 review.
Completed 10/9/2007 CAA Penalties Collected Of the 13 situations where EPA asked for the worksheet, only five penalty worksheets were shared. Upon examination, it could not be determined how MDEQ applies the economic benefit component as it was determined to be not applicable in the five penalty worksheets reviewed.
MDEQ should develop and implement a plan to ensure that their penalty worksheet is consistently used and placed in the appropriate source file. MDEQ should also include in the monthly state/region enforcement call a discussion on penalties assessed and how economic benefit and gravity components were addressed.
MDEQ developed a Process Improvement Plan which includes revisions of business processes and incorporates those processes as Standard Operating Procedures (SOPs). These efforts, which are continuing, have resulted in improvements in MDEQ’s compliance and enforcement programs and, for the most part, the completion of the recommendations identified in the Round 1 review.
Completed 10/9/2007 CAA Data Timely MDEQ’s data shows 6 of 8 (75%) HPVs are entered more than 60 days following the date of discovery. This is higher than the national average of 56.4%.
MDEQ should examine why their HPV data entry practice routinely takes greater than 60 days after designation and develop and implement a plan that will ensure conformance with the HPV data entry requirements of AFS.
MDEQ developed a Process Improvement Plan which includes revisions of business processes and incorporates those processes as Standard Operating Procedures (SOPs). These efforts, which are continuing, have resulted in improvements in MDEQ’s compliance and enforcement programs and, for the most part, the completion of the recommendations identified in the Round 1 review.
Completed 10/9/2007 CAA Data Accurate The data metrics show that in FY 2005 there were only 9 of 16 (56%) HPV sources being carried in AFS as in non vv
MDEQ should examine why their HPV sources are not carried in AFS as in non compliance and institute a plan that will ensure the accuracy of AFS compliance
MDEQ developed a Process Improvement Plan which includes revisions of business processes and incorporates those processes as Standard Operating Procedures (SOPs). These efforts, which are continuing, have resulted in

compliance, i.e., 7 HPV sources are carried in AFS as something other than non compliance. The goal should be for 100% of all HPV sources to be coded in AFS as in noncompliance (national average of accurate coding is 97.4%)
status for HPV sources. improvements in MDEQ’s compliance and enforcement programs and, for the most part, the completion of the recommendations identified in the Round 1 review.
Completed 10/9/2007 CAA Data Complete Discrepancies with the CMS identifier and elsewhere throughout the findings in this report indicate that MDEQ’s database could be improved.
MDEQ should examine the overall integrity of the data in AFS and develop and implement a plan to rectify any found timeliness, accuracy and completeness issues.
MDEQ developed a Process Improvement Plan which includes revisions of business processes and incorporates those processes as Standard Operating Procedures (SOPs). These efforts, which are continuing, have resulted in improvements in MDEQ’s compliance and enforcement programs and, for the most part, the completion of the recommendations identified in the Round 1 review.
Completed 10/9/2007 CWA Violations ID'ed Appropriately
The sampling conducted during a CMI generally did not address the full list of parameters in the permit and there was seldom any evaluation of the self monitoring program. Issues discovered during the CMI were addressed in the cover letter or the NOV but the inspection report was generally very limited in specific observations. As such, the CMI does not qualify for either a CSI or CEI designation or credit towards the annual inspection commitments.
MDEQ should ensure that permitted facilities receive at least one CEI/CSI during a five year permit cycle to determine compliance with applicable permit requirements. MDEQ should assess the value of CMIs both in terms of the number of such inspections conducted versus the number of CEI or CSI performed and the specific insight yielded by the CMI concerning facility operation and compliance with its permit requirements. MDEQ should utilize all enforcement response options to address noncompliance/deficiencies noted during inspection, which includes the use of formal enforcement actions.
MDEQ developed a Process Improvement Plan which includes revisions of business processes and incorporates those processes as Standard Operating Procedures (SOPs). These efforts, which are continuing, have resulted in improvements in MDEQ’s compliance and enforcement programs and, for the most part, the completion of the recommendations identified in the Round 1 review.
Completed 10/9/2007 CWA Violations ID'ed Timely 94% of the inspection reports reviewed (30/32) were timely
Skills in recognizing the gravity of violation(s) or observation(s) needs
MDEQ developed a Process Improvement Plan which includes revisions of business processes and incorporates those

completed and issued to the permittee. There were some cases where the inspection report(s) was missing from the file(s). In one instance, an inspection report was not issued for over a year from the date of inspection. In one case, the inspector noted issues in the inspection report which if cross-checked against the NPDES permit requirements would render the permittee in noncompliance with its permit. The inspection report was void of any citation of this discrepancy.
improvement as it impacts staff recommendations to management and the enforcement response regarding pursuit of corrective action(s).Identifying and citing violation(s) observed during an inspection should be emphasized in inspector training.
processes as Standard Operating Procedures (SOPs). These efforts, which are continuing, have resulted in improvements in MDEQ’s compliance and enforcement programs and, for the most part, the completion of the recommendations identified in the Round 1 review.
Completed 10/9/2007 CWA SNC Accuracy MDEQ is required to maintain a DMR and parameter data entry rate at or above 95% by the PCS policy statement and the annual CWA section 106 work plan commitment. For FY2005, MDEQ data entry rate averaged 93.5%, exceeding the national average by 4%, however, still 1.5% below the national goal. MDEQ should consistently enter violations arising from major compliance monitoring at major facilities, including single event violations (SEVs) at majors.
MDEQ should evaluate its DMR handling process to determine the reason why the DMR and parameter data entry rate at or above 95% has not been achieved. Once the cause has been determined, MDEQ should either modify the process or implement existing processes to assure that this goal is achieved and maintained.
MDEQ developed a Process Improvement Plan which includes revisions of business processes and incorporates those processes as Standard Operating Procedures (SOPs). These efforts, which are continuing, have resulted in improvements in MDEQ’s compliance and enforcement programs and, for the most part, the completion of the recommendations identified in the Round 1 review.
Completed 10/9/2007 CWA Return to Compliance The majority of enforcement actions taken by MDEQ were NOVs. This generally has proven to be
MDEQ should revise the existing EMS, dated 1991, to update Attachment C under the Enforcement Section such that a more streamlined
MDEQ developed a Process Improvement Plan which includes revisions of business processes and incorporates those processes as Standard Operating Procedures (SOPs). These efforts, which

adequate in returning the facility back to compliance. In some cases where the NOV(s) proved to be inadequate in returning the facility back into compliance, MDEQ chose to issue additional NOVs instead of escalating enforcement by pursuing appropriate administrative actions such as a CO or a UO or pursuing a civil judicial action.
approach to formal enforcement for violation category II, IV, V, and VI is established. If the facility is in SNC, the escalation to a formal enforcement action with or without prior NOV actions should be considered as the enforcement response.
are continuing, have resulted in improvements in MDEQ’s compliance and enforcement programs and, for the most part, the completion of the recommendations identified in the Round 1 review.
Completed 10/9/2007 CWA Timely & Appropriate Actions
The SNC rate, the enforcement process and escalation as described in the EMS, and the number and/or percent of facilities without timely action as reported in the CWA State Review Framework Metrics Data Pull is indicative of significant need to improve formal enforcement response time against permittees in SNC status and the need for EMS revision.
Timely formal enforcement action should be pursued when informal enforcement has not been successful in returning a facility back to compliance and/or when pursuing a formal enforcement action directly is determined to be more appropriate.
MDEQ developed a Process Improvement Plan which includes revisions of business processes and incorporates those processes as Standard Operating Procedures (SOPs). These efforts, which are continuing, have resulted in improvements in MDEQ’s compliance and enforcement programs and, for the most part, the completion of the recommendations identified in the Round 1 review.
Completed 10/9/2007 CWA Penalty Calculations The EMS contains a section on economic benefit and penalty assessment which includes gravity. The MDEQ was requested to provide at least two examples of economic benefit and penalty assessment calculations for review since no formal enforcement actions were contained or taken in FY 2005 in the selected facility
For all penalties assessed, consideration for economic benefit or potential economic benefit should always be performed and documented. If such an assessment is not feasible, a notation in the file should be made to that effect along with any explanation.
MDEQ developed a Process Improvement Plan which includes revisions of business processes and incorporates those processes as Standard Operating Procedures (SOPs). These efforts, which are continuing, have resulted in improvements in MDEQ’s compliance and enforcement programs and, for the most part, the completion of the recommendations identified in the Round 1 review.

files.
Completed 10/9/2007 CWA Penalties Collected Since there were no formal or informal enforcement action with penalties or stipulated penalties documented within the 30 facilities’ files that were reviewed, the extent to which the MDEQ pursues collection of penalties assessed could not be determined.
The MDEQ should ensure penalty assessment and collection information is properly and timely encoded into PCS as required pursuant to the CWA§106 work plan requirement. Proper documentation of penalties collected (payment acknowledgement letter, copy of payment checks, etc.) should also be retained in the facility files.
MDEQ submitted PCS SOP to EPA Region 4
Completed 10/9/2007 CWA Data Timely The Section 106 work plan contains requirements and commitments for MDEQ to enter all inspection and enforcement actions for majors and minors. Currently, there is no automatic interface between MDEQ's internal tracking systems and PCS. All data are entered directly into both PCS and the state database.
The MDEQ should institute procedures that assure that all information that should be entered into PCS is routed to data entry staff for timely entry.
MDEQ submitted PCS SOP to EPA Region 4.
Completed 10/9/2007 CWA Data Accurate Improvement in the accuracy of the inspection type coding is needed when coding a CMI. Given that the sampling conducted during the CMI in many cases did account for all of the parameters in a given permit, the CMI should be coded and credited as RI only.
The MDEQ should ensure that appropriate inspection type codes are used in PCS for CMIs. The inspection codes for CEIs or CSIs are not appropriate coding for CMIs in PCS.
MDEQ submitted PCS SOP to EPA Region 4.
Completed 10/9/2007 CWA Data Complete Two enforcement actions were documented in the file but not entered into PCS, and three
MDEQ should evaluate its DMR handling process to determine the reason why the DMR and parameter data entry rate at or above 95%
MDEQ developed a Process Improvement Plan which includes revisions of business processes and incorporates those processes as Standard Operating Procedures (SOPs). These efforts, which

inspections and/or enforcement actions were noted in PCS but not found in the facility files. For FY2005, the data entry rate averaged 93.5%, which was 4% above the national average, but 1.5% below the national goal.
has not been achieved. Once the cause has been determined, the MDEQ should either modify the process or implement existing processes to assure that this goal is achieved and maintained.
are continuing, have resulted in improvements in MDEQ’s compliance and enforcement programs and, for the most part, the completion of the recommendations identified in the Round 1 review.
Completed 10/9/2007 RCRA Insp Universe There is one federally-owned TSD located in Mississippi, and in FY2005 the facility received a compliance inspection as required by federal statute. However, RCRAInfo indicates that during the five-year timeframe from FY2001-2005, the facility was only inspected twice, which does not meet the statutory requirements. From FY2003-FY2005 only 14 facilities (56% of universe) received a CEM and/or OAM evaluation. This is far below the requirements that 100% of LDF universe should receive a groundwater monitoring evaluation at least once every three years. MDEQ inspected only 74% of the LQG universe which is below the recommended inspection coverage.
It is recommended that MDEQ reevaluate their inspection targeting to ensure that, at a minimum, the inspections required by statute and the applicable OECA NPM guidance are conducted. If MDEQ cannot meet the inspection requirements, they should consult EPA Region 4 RCRA Enforcement and Compliance Branch to discuss options for the required inspections.
MDEQ developed a Process Improvement Plan which includes revisions of business processes and incorporates those processes as Standard Operating Procedures (SOPs). These efforts, which are continuing, have resulted in improvements in MDEQ’s compliance and enforcement programs and, for the most part, the completion of the recommendations identified in the Round 1 review.
Completed 10/9/2007 RCRA Violations ID'ed Appropriately
Of the 23 inspection files reviewed, 55% of the reports were found to contain either minimal or no
EPA Region 4 recommends that MDEQ establish a consistent protocol for thoroughly documenting RCRA compliance
MDEQ developed a Process Improvement Plan which includes revisions of business processes and incorporates those processes as Standard Operating Procedures (SOPs). These efforts, which

information regarding facility operations and hazardous waste management activities observed during the time of the inspection. None of the inspection reports contained photographs or inspection checklists.
inspections, using the Revised RCRA Inspection Manual (November 1998) as guidance in this process. This protocol should be submitted to EPA R4 for review and comment prior to implementation. MDEQ should forward copies of the requested inspection reports to EPA Region 4.
are continuing, have resulted in improvements in MDEQ’s compliance and enforcement programs and, for the most part, the completion of the recommendations identified in the Round 1 review.
Completed 10/9/2007 RCRA Violations ID'ed Timely In the Memorandum between MDEQ and EPA (dated January 21, 1994), MDEQ should finalize all inspection reports within 45 days of the inspection. Of the inspection files reviewed, MDEQ RCRA Inspectors complete the inspection report on average 49 days from the date of the inspection. One inspection took over 17 months to complete.
Inspections reports appear to be completed in a timely manner (with the exception of the cited report), close to the negotiated timeframe in the MDEQ/EPA RCRA MOA. EPA recommends that MDEQ monitor all inspection reports to ensure timely completion.
MDEQ developed a Process Improvement Plan which includes revisions of business processes and incorporates those processes as Standard Operating Procedures (SOPs). These efforts, which are continuing, have resulted in improvements in MDEQ’s compliance and enforcement programs and, for the most part, the completion of the recommendations identified in the Round 1 review.
Completed 10/9/2007 RCRA SNC Accuracy During FY2005, MDEQ did not identify any SNC facilities. In the FY2005 RCRA Annual Evaluation Report (dated June 7, 2006) MDEQ indicated the reason for the lack of SNC identification as “The state targets inspections at facilities that will count toward grant commitments, rather than targeting potential noncompliance."
EPA Region 4 is concerned that MDEQ suggests it is not addressing noncompliance in their state using their current inspection targeting. The strategic goal of all compliance and enforcement programs is to improve compliance among regulated facilities through compliance assurance activities and enforcement. MDEQ should work with EPA Region 4 RCRA program in developing grant commitments to ensure compliance monitoring activities are being targeted in areas of potential noncompliance.
MDEQ developed a Process Improvement Plan which includes revisions of business processes and incorporates those processes as Standard Operating Procedures (SOPs). These efforts, which are continuing, have resulted in improvements in MDEQ’s compliance and enforcement programs and, for the most part, the completion of the recommendations identified in the Round 1 review.
Completed 10/9/2007 RCRA Return to Compliance MDEQ signed a It is recommended that MDEQ developed a Process Improvement

consent order with one facility +/- 450 days after the joint MDEQ/EPA inspection, which exceeds the ERP limit for timely enforcement response. The consent order did not include all the violations identified by MDEQ and/or EPA during the inspection. The Order did not include any RCRA injunctive relief. There was no documented/verified return to compliance in the files.
MDEQ review proposed enforcement actions during the bi-monthly conference calls with the EPA Region 4 RCRA enforcement program to review appropriate injunctive relief for return to compliance. MDEQ should also implement quality assurance procedures to ensure that all appropriate data is entered into RCRAInfo.
Plan which includes revisions of business processes and incorporates those processes as Standard Operating Procedures (SOPs). These efforts, which are continuing, have resulted in improvements in MDEQ’s compliance and enforcement programs and, for the most part, the completion of the recommendations identified in the Round 1 review.
Completed 10/9/2007 RCRA Timely & Appropriate Actions
In FY2005, the MDEQ RCRA program concluded two consent orders with SNC facilities, while negotiating a third order which concluded in FY2006. Of the three consent orders, two actions or 66% of the cases exceeded the 360 day time line for entering into a final order.
EPA recommends that MDEQ closely review and follow the RCRA Enforcement Response Policy to determine the appropriate response to violations at RCRA facilities. Enforcement case timelines should be reviewed during the bi-monthly conference calls with EPA Region 4 RCRA enforcement program.
MDEQ developed a Process Improvement Plan which includes revisions of business processes and incorporates those processes as Standard Operating Procedures (SOPs). These efforts, which are continuing, have resulted in improvements in MDEQ’s compliance and enforcement programs and, for the most part, the completion of the recommendations identified in the Round 1 review.
Completed 10/9/2007 RCRA Penalty Calculations It is MDEQ’s policy not to include penalty calculations in the enforcement files. MDEQ maintains that the gravity of the violations and economic benefit are considered in the penalty calculation, however no documentation of this is maintained in the file.
In order to maintain consistency in enforcement proceedings and penalty calculations, MDEQ should consider options and develop and implement a plan to document the calculations in the enforcement files.
MDEQ developed a Process Improvement Plan which includes revisions of business processes and incorporates those processes as Standard Operating Procedures (SOPs). These efforts, which are continuing, have resulted in improvements in MDEQ’s compliance and enforcement programs and, for the most part, the completion of the recommendations identified in the Round 1 review.
Completed 10/9/2007 RCRA Penalties Collected It is MDEQ’s policy not to include penalty
In order to maintain consistency in enforcement
MDEQ developed a Process Improvement Plan which includes revisions of business

calculations in the enforcement files. The final penalties were reflected in RCRAInfo, but the penalty calculations were not formally documented in the files.
proceedings and penalty calculations, MDEQ should consider options and develop and implement a plan to maintain both initial and final penalty documentation, including economic benefit and gravity-based calc
processes and incorporates those processes as Standard Operating Procedures (SOPs). These efforts, which are continuing, have resulted in improvements in MDEQ’s compliance and enforcement programs and, for the most part, the completion of the recommendations identified in the Round 1 review.
Completed 10/9/2007 RCRA Grant Commitments In the FY2005/FY2006 RCRA Review, the report found that MDEQ met enforcement and compliance grant work plan inspection commitments for FY2005.
While MDEQ did met the FY2005 grant commitments, some key national statutory/guidance requirements were not met. It is recommended that MDEQ work with EPA Region 4 during the development of the fiscal year grant work plan to ensure the statutory inspections and OECA guidance requirements are included in the grant commitments.
MDEQ developed a Process Improvement Plan which includes revisions of business processes and incorporates those processes as Standard Operating Procedures (SOPs). These efforts, which are continuing, have resulted in improvements in MDEQ’s compliance and enforcement programs and, for the most part, the completion of the recommendations identified in the Round 1 review.

APPENDIX B: OFFICIAL DATA PULL
CLEAN AIR ACT OFFICIAL DATA SET
Metric Metric Description
Metric Type Agency Nat'l Goal
Nat'l Average
MDEQ Count Universe Not Counted
State Discrepancy (Yes/No)
State Correction
State Data Source
Discrepancy Explanation
A01A1S Title V Universe: AFS Operating Majors (Current)
Data Quality State 279 NA NA NA
A01A2S Title V Universe: AFS Operating Majors with Air Program Code = V (Current)
Data Quality State 277 NA NA NA

A01B1S Source Count: Synthetic Minors (Current)
Data Quality State 274 NA NA NA
A01B2S Source Count: NESHAP Minors (Current)
Data Quality State 3 NA NA NA
A01B3S Source Count: Active Minor facilities or otherwise FedRep, not including NESHAP Part 61 (Current)
Informational Only
State 44 NA NA NA
A01C1S CAA Subprogram Designations: NSPS (Current)
Data Quality State 254 NA NA NA
A01C2S CAA Subprogram Designations: NESHAP (Current)
Data Quality State 34 NA NA NA
A01C3S CAA Subprogram Designations: MACT (Current)
Data Quality State 190 NA NA NA
A01C4S CAA Subpart Designations: Percent NSPS facilities with FCEs conducted after 10/1/2005
Data Quality State 100% 87.7% 100.0% 246 246 0
A01C5S CAA Subpart Designations: Percent NESHAP facilities with FCEs conducted after 10/1/2005
Data Quality State 100% 48.5% 100.0% 20 20 0
A01C6S CAA Subpart Designations: Percent MACT facilities with FCEs conducted
Data Quality State 100% 94.4% 99.4% 159 160 1

after 10/1/2005
A01D1S Compliance Monitoring: Sources with FCEs (1 FY)
Data Quality State 204 NA NA NA
A01D2S Compliance Monitoring: Number of FCEs (1 FY)
Data Quality State 208 NA NA NA
A01D3S Compliance Monitoring: Number of PCEs (1 FY)
Informational Only
State 50 NA NA NA
A01E0S Historical Non-Compliance Counts (1 FY)
Data Quality State 56 NA NA NA
A01F1S Informal Enforcement Actions: Number Issued (1 FY)
Data Quality State 59 NA NA NA
A01F2S Informal Enforcement Actions: Number of Sources (1 FY)
Data Quality State 57 NA NA NA
A01G1S HPV: Number of New Pathways (1 FY)
Data Quality State 22 NA NA NA
A01G2S HPV: Number of New Sources (1 FY)
Data Quality State 20 NA NA NA
A01H1S HPV Day Zero Pathway Discovery date: Percent DZs with discovery
Data Quality State 100% 59.7% 100.0% 22 22 0

A01H2S HPV Day Zero Pathway Violating Pollutants: Percent DZs
Data Quality State 100% 91.3% 100.0% 22 22 0
A01H3S HPV Day Zero Pathway Violation Type Code(s): Percent DZs with HPV Violation Type Code(s)
Data Quality State 100% 91.2% 100.0% 22 22 0
A01I1S Formal Action: Number Issued (1 FY)
Data Quality State 24 NA NA NA
A01I2S Formal Action: Number of Sources (1 FY)
Data Quality State 23 NA NA NA
A01J0S Assessed Penalties: Total Dollar Amount (1 FY)
Data Quality State $162,512
NA NA NA
A01K0S Major Sources Missing CMS Policy Applicability (Current)
Review Indicator
State 0 0 NA NA NA
A02A0S Number of HPVs/Number of NC Sources (1 FY)
Data Quality State <= 50% 45.5% 50.0% 15 30 15
A02B1S Stack Test Results at Federally-Reportable Sources - % Without Pass/Fail Results (1 FY)
Goal State 0% 1.3% 0.0% 0 357 357
A02B2S Stack Test Results at Federally-
Data Quality State 6 NA NA NA

Reportable Sources - Number of Failures (1 FY)
A03A0S Percent HPVs Entered <= 60 Days After Designation, Timely Entry (1 FY)
Goal State 100% 34.7% 0.0% 0 22 22
A03B1S Percent Compliance Monitoring related MDR actions reported <= 60 Days After Designation, Timely Entry (1 FY)
Goal State 100% 59.0% 47.6% 413 867 454
A03B2S Percent Enforcement related MDR actions reported <= 60 Days After Designation, Timely Entry (1 FY)
Goal State 100% 70.3% 56.2% 45 80 35
A05A1S CMS Major Full Compliance Evaluation (FCE) Coverage (2 FY CMS Cycle)
Goal State 100% 89.2% 98.9% 263 266 3
A05A2S CAA Major Full Compliance Evaluation (FCE) Coverage(most recent 2 FY)
Review Indicator
State 100% 84.4% 96.5% 277 287 10
A05B1S CAA Synthetic Minor 80% Sources (SM-80) FCE Coverage (5
Review Indicator
State 20% - 100%
92.0% 83.5% 207 248 41
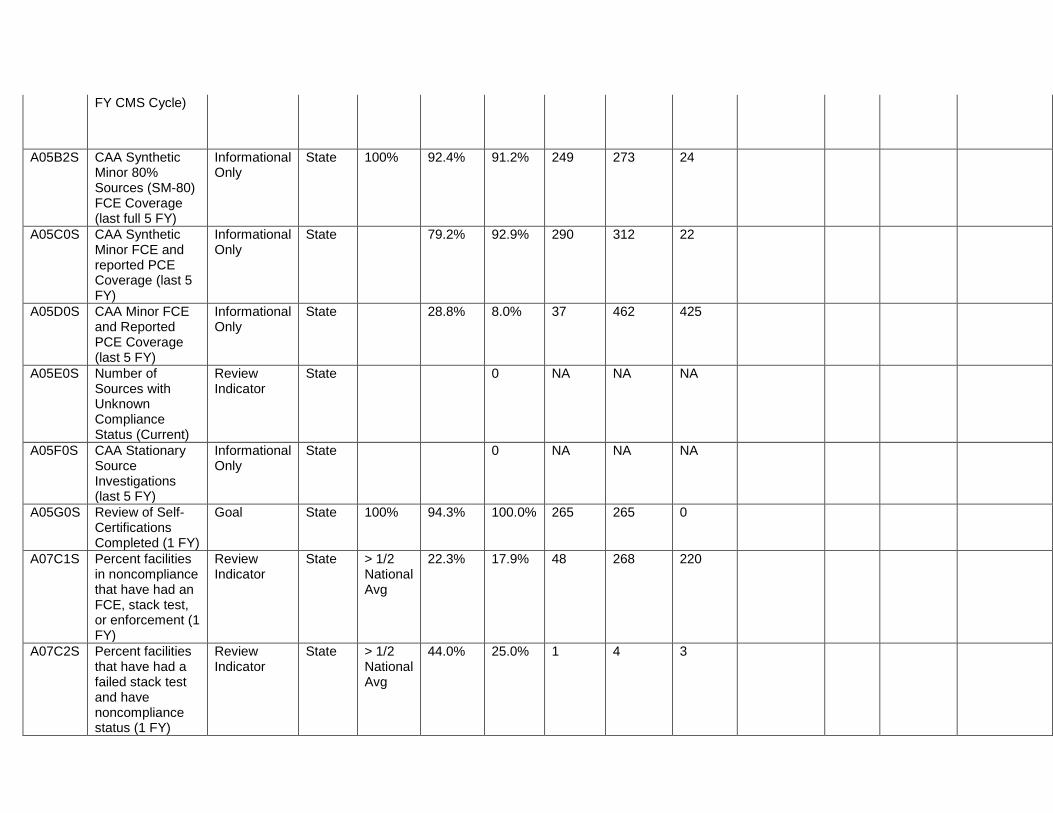
FY CMS Cycle)
A05B2S CAA Synthetic Minor 80% Sources (SM-80) FCE Coverage (last full 5 FY)
Informational Only
State 100% 92.4% 91.2% 249 273 24
A05C0S CAA Synthetic Minor FCE and reported PCE Coverage (last 5 FY)
Informational Only
State 79.2% 92.9% 290 312 22
A05D0S CAA Minor FCE and Reported PCE Coverage (last 5 FY)
Informational Only
State 28.8% 8.0% 37 462 425
A05E0S Number of Sources with Unknown Compliance Status (Current)
Review Indicator
State 0 NA NA NA
A05F0S CAA Stationary Source Investigations (last 5 FY)
Informational Only
State 0 NA NA NA
A05G0S Review of Self-Certifications Completed (1 FY)
Goal State 100% 94.3% 100.0% 265 265 0
A07C1S Percent facilities in noncompliance that have had an FCE, stack test, or enforcement (1 FY)
Review Indicator
State > 1/2 National Avg
22.3% 17.9% 48 268 220
A07C2S Percent facilities that have had a failed stack test and have noncompliance status (1 FY)
Review Indicator
State > 1/2 National Avg
44.0% 25.0% 1 4 3

A08A0S High Priority Violation Discovery Rate - Per Major Source (1 FY)
Review Indicator
State > 1/2 National Avg
6.4% 3.9% 11 279 268
A08B0S High Priority Violation Discovery Rate - Per Synthetic Minor Source (1 FY)
Review Indicator
State > 1/2 National Avg
0.4% 3.3% 9 274 265
A08C0S Percent Formal Actions With Prior HPV - Majors (1 FY)
Review Indicator
State > 1/2 National Avg
67.8% 90.9% 10 11 1
A08D0S Percent Informal Enforcement Actions Without Prior HPV - Majors (1 FY)
Review Indicator
State < 1/2 National Avg
49.8% 65.5% 19 29 10
A08E0S Percentage of Sources with Failed Stack Test Actions that received HPV listing - Majors and Synthetic Minors (2 FY)
Review Indicator
State > 1/2 National Avg
40.5% 50.0% 5 10 5
A10A0S Percent HPVs not meeting timeliness goals (2 FY)
Review Indicator
State 36.4% 46.5% 20 43 23
A12A0S No Activity Indicator - Actions with Penalties (1 FY)
Review Indicator
State 24 NA NA NA
A12B0S Percent Actions at HPVs With Penalty (1 FY)
Review Indicator
State >= 80% 89.0% 92.3% 12 13 1

CLEAN WATER ACT OFFICIAL DATA SET
Metric Metric Description Metric Type Agency Nat'l Goal
Nat'l Average MDEQ Count Unive
rse Not Counted State
Discrepancy (Yes/No)
State Correction
State Data
Source
Discrepancy Explanation
W01A1C Active facility universe: NPDES major individual permits (Current)
Data Quality Combined 96 NA NA NA
W01A2C Active facility universe: NPDES major general permits (Current)
Data Quality Combined 0 NA NA NA
W01A3C Active facility universe: NPDES non-major individual permits (Current)
Data Quality Combined 1,384 NA NA NA
W01A4C Active facility universe: NPDES non-major general permits (Current)
Data Quality Combined 1,698 NA NA NA
W01B1C Major individual permits: correctly coded limits (Current)
Goal Combined >=; 95%
91.9% 97.9% 94 96 2
C01B2C Major individual permits: DMR entry rate based on MRs expected (Forms/Forms) (1 Qtr)
Goal Combined >=; 95%
92.6% 98.5% 448 455 7

C01B3C Major individual permits: DMR entry rate based on DMRs expected (Permits/Permits) (1 Qtr)
Goal Combined >=; 95%
96.0% 100.0% 94 94 0
W01B4C Major individual permits: manual RNC/SNC override rate (1 FY)
Data Quality Combined 0.0% 0 11 11
W01C1C Non-major individual permits: correctly coded limits (Current)
Informational Only
Combined 86.6% 1,199 1,384 185
C01C2C Non-major individual permits: DMR entry rate based on DMRs expected (Forms/Forms) (1 Qtr)
Informational Only
Combined 98.5% 969 984 15
C01C3C Non-major individual permits: DMR entry rate based on DMRs expected (Permits/Permits) (1 Qtr)
Informational Only
Combined 98.2% 331 337 6
W01D1C Violations at non-majors: noncompliance rate (1 FY)
Informational Only
Combined 39.4% 545 1,384 839
C01D2C Violations at non-majors: noncompliance rate in the annual noncompliance report (ANCR)(1 CY)
Informational Only
Combined 0 / 0 0 0 0
W01D3C Violations at non-majors: DMR non-
Informational Only
Combined 219 NA NA NA

receipt (3 FY)
W01E1S Informal actions: number of major facilities (1 FY)
Data Quality State 44 NA NA NA
W01E2S Informal actions: number of actions at major facilities (1 FY)
Data Quality State 107 NA NA NA
W01E3S Informal actions: number of non-major facilities (1 FY)
Data Quality State 510 NA NA NA
W01E4S Informal actions: number of actions at non-major facilities (1 FY)
Data Quality State 627 NA NA NA
W01F1S Formal actions: number of major facilities (1 FY)
Data Quality State 12 NA NA NA
W01F2S Formal actions: number of actions at major facilities (1 FY)
Data Quality State 12 NA NA NA
W01F3S Formal actions: number of non-major facilities (1 FY)
Data Quality State 66 NA NA NA
W01F4S Formal actions: number of actions at non-major facilities (1 FY)
Data Quality State 66 NA NA NA
W01G1S Penalties: total number of penalties (1 FY)
Data Quality State 36 NA NA NA
W01G2S Penalties: total penalties (1 FY)
Data Quality State $536,804
NA NA NA
W01G3S Penalties: total collected pursuant to civil judicial actions (3 FY)
Data Quality State $0 NA NA NA

W01G4S Penalties: total collected pursuant to administrative actions (3 FY)
Informational Only
State $1,578,904
NA NA NA
W01G5S No activity indicator - total number of penalties (1 FY)
Data Quality State $536,804
NA NA NA
W02A0S Actions linked to violations: major facilities (1 FY)
Data Quality State >=; 80%
100.0% 12 12 0
W05A0S Inspection coverage: NPDES majors (1 FY)
Goal State 100% 60.7% 61.5% 59 96 37
W05B1S Inspection coverage: NPDES non-major individual permits (1 FY)
Goal State 9.5% 132 1,384 1,252
W05B2S Inspection coverage: NPDES non-major general permits (1 FY)
Goal State 5.9% 101 1,698 1,597
W05C0S Inspection coverage: NPDES other (not 5a or 5b) (1 FY)
Informational Only
State 0.8% 4 483 479
W07A1C Single-event violations at majors (1 FY)
Review Indicator
Combined 3 NA NA NA
W07A2C Single-event violations at non-majors (1 FY)
Informational Only
Combined 2 NA NA NA
W07B0C Facilities with unresolved compliance schedule violations (at end of FY)
Data Quality Combined 22.6% 8.3% 5 60 55

W07C0C Facilities with unresolved permit schedule violations (at end of FY)
Data Quality Combined 21.9% 100.0% 1 1 0
W07D0C Percentage major facilities with DMR violations (1 FY)
Data Quality Combined 52.8% 49.0% 47 96 49
W08A1C Major facilities in SNC (1 FY)
Review Indicator
Combined 11 NA NA NA
W08A2C SNC rate: percent majors in SNC (1 FY)
Review Indicator
Combined 24.6% 11.5% 11 96 85
W10A0C Major facilities without timely action (1 FY)
Goal Combined < 2% 18.3% 8.3% 8 96 88

RESOURCE CONSERVATION AND RECOVERY ACT OFFICIAL DATA SET
Metric Metric Description Metric Type Agency Nat'l Goal
Nat'l Average MDEQ Count Universe Not
Counted
State Discrepancy
(Yes/No)
State Correction
State Data
Source
Discrepancy Explanation
R01A1S Number of operating TSDFs in RCRAInfo
Data Quality State 7 NA NA NA
R01A2S Number of active LQGs in RCRAInfo
Data Quality State 146 NA NA NA
R01A3S Number of active SQGs in RCRAInfo
Data Quality State 391 NA NA NA
R01A4S Number of all other active sites in RCRAInfo
Data Quality State 2,279 NA NA NA
R01A5S Number of LQGs per latest official biennial report
Data Quality State 122 NA NA NA
R01B1S Compliance monitoring: number of inspections (1 FY)
Data Quality State 95 NA NA NA
R01B2S Compliance monitoring: sites inspected (1 FY)
Data Quality State 93 NA NA NA
R01C1S Number of sites with violations determined at any time (1 FY)
Data Quality State 22 NA NA NA
R01C2S Number of sites with violations determined during the FY
Data Quality State 11 NA NA NA

R01D1S Informal action: number of sites (1 FY)
Data Quality State 11 NA NA NA
R01D2S Informal action: number of actions (1 FY)
Data Quality State 11 NA NA NA
R01E1S SNC: number of sites with new SNC (1 FY)
Data Quality State 4 NA NA NA
R01E2S SNC: number of sites in SNC (1 FY)
Data Quality State 13 NA NA NA
R01F1S Formal action: number of sites (1 FY)
Data Quality State 9 NA NA NA
R01F2S Formal action: number taken (1 FY)
Data Quality State 9 NA NA NA
R01G0S Total amount of final penalties (1 FY)
Data Quality State $77,860 NA NA NA
R02A1S Number of sites SNC-determined on day of formal action (1 FY)
Data Quality State 0 NA NA NA
R02A2S Number of sites SNC-determined within one week of formal action (1 FY)
Data Quality State 0 NA NA NA
R02B0S Number of sites in violation for greater than 240 days
Data Quality State 0 NA NA NA
R03A0S Percent SNCs entered ≥ 60 days after designation (1 FY)
Review Indicator
State 83.3% 5 6 1

R05A0S Inspection coverage for operating TSDFs (2 FYs)
Goal State 100% 87.4% 100.0% 7 7 0
R05B0S Inspection coverage for LQGs (1 FY)
Goal State 20% 24.1% 32.0% 39 122 83
R05C0S Inspection coverage for LQGs (5 FYs)
Goal State 100% 61.7% 95.9% 117 122 5
R05D0S Inspection coverage for active SQGs (5 FYs)
Informational Only
State 34.0% 133 391 258
R05E1S Inspections at active CESQGs (5 FYs)
Informational Only
State 252 NA NA NA
R05E2S Inspections at active transporters (5 FYs)
Informational Only
State 6 NA NA NA
R05E3S Inspections at non-notifiers (5 FYs)
Informational Only
State 1 NA NA NA
R05E4S Inspections at active sites other than those listed in 5a-d and 5e1-5e3 (5 FYs)
Informational Only
State 11 NA NA NA
R07C0S Violation identification rate at sites with inspections (1 FY)
Review Indicator
State 11.8% 11 93 82
R08A0S SNC identification rate at sites with inspections (1 FY)
Review Indicator
State 1/2 National
Avg
2.6% 4.3% 4 93 89
R08B0S Percent of SNC determinations made within 150 days (1 FY)
Goal State 100% 83.2% 100.0% 4 4 0

R08C0S Percent of formal actions taken that received a prior SNC listing (1 FY)
Review Indicator
State 1/2 National
Avg
62.3% 100.0% 9 9 0
R10A0S Percent of SNCs with formal action/referral taken within 360 days (1 FY)
Review Indicator
State 80% 46.5% 25.0% 1 4 3
R10B0S No activity indicator - number of formal actions (1 FY)
Review Indicator
State 9 NA NA NA
R12A0S No activity indicator - penalties (1 FY)
Review Indicator
State $77,860 NA NA NA
R12B0S Percent of final formal actions with penalty (1 FY)
Review Indicator
State 1/2 National
Avg
80.6% 100.0% 7 7 0

APPENDIX C: PDA TRANSMITTAL LETTER
Appendices C, D, and E provide the results of the Preliminary Data Analysis (PDA). The Preliminary Data Analysis forms the initial structure for the SRF report, and helps ensure that the data metrics are adequately analyzed prior to the on-site review. This is a critical component of the SRF process because it allows the reviewers to be prepared and knowledgeable about potential problem areas before the on-site review. In addition, it gives the region focus during the file reviews and/or basis for requesting supplemental files based on potential concerns raised by the data metric results. This section, Appendix C, contains the letter transmitting the results of the Preliminary Data Analysis to the state. This letter identifies areas that the data review suggests the need for further examination and discussion during the review process.
May 20, 2011 Ms. Trudy D. Fisher Executive Director Mississippi Department of Environmental Quality P.O. Box 2261 Jackson, Mississippi 39225-2261
Dear Ms. Fisher: On March 18, 2011, the Environmental Protection Agency (EPA) Region 4 notified the Mississippi Department of Environmental Quality (MDEQ) of its intention to begin the State Review Framework (SRF) evaluation via an opening letter. As the next step in the process, the region has analyzed the SRF data sent with the opening letter against established goals and commitments, incorporating any data corrections or discrepancies provided by MDEQ.
This follow-up letter includes (1) EPA’s preliminary analysis of the state SRF data metrics results, (2) the official preliminary data analysis (PDA) worksheets, and (3) the files that have been selected for the SRF file reviews. The file reviews have been coordinated between MDEQ and EPA to take place during June 13-17, 2011, for the CWA and RCRA programs, and July 25-29, 2011, for the CAA program. All reviews will take place at MDEQ’s offices in Jackson, Mississippi. We are providing this information to you in advance so that your staff will have adequate time to compile the files that we will review and can begin pulling together any supplemental information that you think may be of assistance during the review. After reviewing the enclosed information, if there are additional circumstances that the region should consider during the review, please have your staff provide that information to Becky Hendrix, the Region 4 SRF coordinator, prior to the on-site file review. Becky Hendrix can be reached at (404) 562-8342. Please note that the enclosed preliminary analyses are largely based only on the FY2010 data metrics results that were “frozen” in March 2011. Any corrections or updates to the data in the national data systems since that time may not be reflected in the preliminary analyses. Final SRF findings may be

significantly different based upon the revised and/or updated FY2010 data, the results of the file review, and ongoing discussions with your staff.
Please also note that all information and material used in this review may be subject to federal and/or state disclosure laws. While EPA intends to use this information only for discussions with MDEQ, it may be necessary to release information in response to a properly submitted information request.
At this time I would also like to bring to your attention the opportunity for MDEQ to highlight any priorities and accomplishments that you would like to have included in the SRF Report. EPA is also requesting specific information on your resources, staffing, and the current data systems used by your state for the SRF Report. An outline of this information is included in Enclosure 10 of this letter. EPA is requesting this information be sent electronically to Becky Hendrix at [email protected] by August 19, 2011.
We look forward to working with you and your staff in this effort. Should you require additional information, or wish to discuss this matter in greater detail, please feel free to contact Scott Gordon, the Associate Director of the Office of Environmental Accountability, at (404) 562-9741.
Sincerely, Mary J. Wilkes Regional Counsel and Director Office of Environmental Accountability
Enclosure 1 – CAA Preliminary Data Analysis Enclosure 2 – CAA Preliminary Data Analysis Worksheet Enclosure 3 – CAA Table of Selected Files and selection logic Enclosure 4 – CWA Preliminary Data Analysis Enclosure 5 – CWA Preliminary Data Analysis Worksheet Enclosure 6 – CWA Table of Selected Files and selection logic Enclosure 7 – RCRA Preliminary Data Analysis Enclosure 8 – RCRA Preliminary Data Analysis Worksheet Enclosure 9 – RCRA Table of Selected Files and selection logic Enclosure 10 – Background Information for SRF Report

APPPENDIX D: PRELIMINARY DATA ANALYSIS CHART
This section provides the results of the Preliminary Data Analysis (PDA). The Preliminary Data Analysis forms the initial structure for the SRF report and helps ensure that the data metrics are adequately analyzed prior to the on-site review. This is a critical component of the SRF process because it allows the reviewers to be prepared and knowledgeable about potential problem areas before initiating the on-site portion of the review. In addition, it gives the region focus during the file reviews and/or basis for requesting supplemental files based on potential concerns raised by the data metrics results. The PDA reviews each data metric and evaluates state performance against the national goal or average, if appropriate. The PDA chart in this section of the SRF report only includes metrics where potential concerns or areas of exemplary performance are identified. (The full PDA worksheet in Appendix E contains every metric: positive, neutral, or negative.) Initial Findings indicate the observed results. Initial Findings are preliminary observations. They are used as a basis for further investigation that takes place during the file review and through dialogue with the state. Final Findings are developed only after evaluating them against the file review results where appropriate, and dialogue with the state have occurred. Through this process, Initial Findings may be confirmed, modified, or determined not to be supported. Findings are presented in Section IV of this report. Clean Air Act
Original Data Pulled from Online Tracking Information System (OTIS) EPA Preliminary Analysis Metric Metric
Description Metric Type
Agency National Goal
National Average
MDEQ Initial Findings
A03A0S Percent HPVs Entered <= 60 Days After Designation, Timely Entry (1 FY)
Goal State 100% 34.7% 0.0% State process for determining HPVs appears to result in late reporting. Discuss HPV management process with state
A10A0S Percent HPVs not meeting timeliness goals (2 FY)
Review Indicator
State 36.4% 46.5% Discuss multimedia enforcement process with state during file review. Supplemental files selected.
A03B2S Percent Enforcement related MDR actions reported <= 60 Days After Designation, Timely Entry (1 FY)
Goal State 100% 70.3% 56.2% Discuss data management processes and issues with State during onsite visit. Supplemental files selected.
A03B1S Percent Compliance Monitoring related MDR actions reported <= 60 Days After Designation, Timely Entry (1 FY)
Goal State 100% 59.0% 47.6% Discuss data management processes and issues with State during onsite visit. Supplemental files selected.

Clean Water Act Original Data Pulled from Online Tracking Information System (OTIS) EPA Preliminary Analysis
Metric Metric Description
Metric Type
Agency National Goal
National Average
MDEQ Initial Findings
W05A0S Inspection coverage: NPDES majors (1 FY)
Goal State 100% 60.7% 61.5% State metric falls below 70% - further discussion with the state is needed to determine if additional minors are being inspected in lieu of majors.
W05B1S Inspection coverage: NPDES non-major individual permits (1 FY)
Goal State 9.5% State metric falls below 20%, so further discussion with state needed. Additional clarification is needed on the state's discrepancy explanation (i.e., the new inspection coverage rate).
W05B2S Inspection coverage: NPDES non-major general permits (1 FY)
Goal State 5.9% State metric falls below 20%, so further discussion with state needed. Additional clarification is needed on the state's discrepancy explanation (i.e., the new inspection coverage rate).
W07A1C Single-event violations at majors (1 FY)
Review Indicator
Combined 3 Although there is no National goal, the SEV rate is low (3 of 96). Supplemental CEI files will be reviewed to see if SEVs are being reported into PCS.
W07A2C Single-event violations at non-majors (1 FY)
Informational Only
Combined 2 Although there is no national goal, the SEV rate is low (2 of 1384). Supplemental CEI files will be reviewed to see if SEVs are being reported into PCS.
W10A0C Major facilities without timely action (1 FY)
Goal Combined <2% 18.3% 8.3% State correction accepted. While the State metric is below the national average, it does not meet the national goal.
Resource Conservation and Recovery Act

Original Data Pulled from Online Tracking Information System (OTIS) EPA Preliminary Analysis Metric Metric
Description Metric Type
Agency National Goal
National Average
MDEQ Initial Findings
R03A0S Percent SNCs entered > 60 days after designation (1 FY)
Review Indicator
State 83.3% Five of the six SNCs identified in FY2010 had delayed entry into RCRAInfo. The SNC identification and data entry procedures will be discussed with MDEQ during file review.

APPENDIX E: PDA WORKSHEET (with State and EPA Comments)
Clean Air Act PDA Worksheet
Metric Metric Description Metric Type Agency Nat'l
Goal Nat'l
Average MDEQ Count Universe Not Counted
State Discrepancy
(Yes/No)
State Correction
State Data Source
Discrepancy Explanation
Initial Findings
A01A1S Title V Universe: AFS Operating Majors (Current)
Data Quality State 279 NA NA NA No No comment - OK
A01A2S Title V Universe: AFS Operating Majors with Air Program Code = V (Current)
Data Quality State 277 NA NA NA No No comment - OK
A01B1S Source Count: Synthetic Minors (Current)
Data Quality State 274 NA NA NA No No comment - OK
A01B2S Source Count: NESHAP Minors (Current)
Data Quality State 3 NA NA NA No No comment - OK
A01B3S Source Count: Active Minor facilities or otherwise FedRep, not including NESHAP Part 61 (Current)
Informational Only
State 44 NA NA NA No No comment - OK
A01C1S CAA Subprogram Designations: NSPS (Current)
Data Quality State 254 NA NA NA No No comment - OK
A01C2S CAA Subprogram Designations: NESHAP (Current)
Data Quality State 34 NA NA NA No No comment - OK
A01C3S CAA Subprogram Designations: MACT (Current)
Data Quality State 190 NA NA NA No No comment - OK

A01C4S CAA Subpart Designations: Percent NSPS facilities with FCEs conducted after 10/1/2005
Data Quality State 100% 87.7% 100.0%
246 246 0 No No comment - OK
A01C5S CAA Subpart Designations: Percent NESHAP facilities with FCEs conducted after 10/1/2005
Data Quality State 100% 48.5% 100.0%
20 20 0 No No comment - OK
A01C6S CAA Subpart Designations: Percent MACT facilities with FCEs conducted after 10/1/2005
Data Quality State 100% 94.4% 99.4% 159 160 1 YES 100% A list of erroneous MACT air programs in AFS were sent to EPA-Region 4 for deletion. One of the MACT air programs on the list did not get deleted. Therefore, a subsequent email was sent to EPA-Region 4 requesting the MACT be deleted, which would bring the Not Counted to 0.
State correction accepted.
A01D1S Compliance Monitoring: Sources with FCEs (1 FY)
Data Quality State 204 NA NA NA No No comment - OK
A01D2S Compliance Monitoring: Number of FCEs (1 FY)
Data Quality State 208 NA NA NA No No comment - OK
A01D3S Compliance Monitoring: Number of PCEs (1 FY)
Informational Only
State 50 NA NA NA No No comment - OK

A01E0S Historical Non-Compliance Counts (1 FY)
Data Quality State 56 NA NA NA No No comment - OK
A01F1S Informal Enforcement Actions: Number Issued (1 FY)
Data Quality State 59 NA NA NA No No comment - OK
A01F2S Informal Enforcement Actions: Number of Sources (1 FY)
Data Quality State 57 NA NA NA No No comment - OK
A01G1S HPV: Number of New Pathways (1 FY)
Data Quality State 22 NA NA NA No No comment - OK
A01G2S HPV: Number of New Sources (1 FY)
Data Quality State 20 NA NA NA No No comment - OK
A01H1S HPV Day Zero Pathway Discovery date: Percent DZs with discovery
Data Quality State 100% 59.7% 100.0%
22 22 0 No No comment - OK
A01H2S HPV Day Zero Pathway Violating Pollutants: Percent DZs
Data Quality State 100% 91.3% 100.0%
22 22 0 No No comment - OK
A01H3S HPV Day Zero Pathway Violation Type Code(s): Percent DZs with HPV Violation Type Code(s)
Data Quality State 100% 91.2% 100.0%
22 22 0 No No comment - OK
A01I1S Formal Action: Number Issued (1 FY)
Data Quality State 24 NA NA NA No No comment - OK
A01I2S Formal Action: Number of Sources (1 FY)
Data Quality State 23 NA NA NA No No comment - OK
A01J0S Assessed Penalties: Total Dollar Amount (1 FY)
Data Quality State $162,512
NA NA NA No No comment - OK

A01K0S Major Sources Missing CMS Policy Applicability (Current)
Review Indicator
State 0 0 NA NA NA No No comment - OK
A02A0S Number of HPVs/Number of NC Sources (1 FY)
Data Quality State <= 50% 45.5% 50.0% 15 30 15 No No comment - OK
A02B1S Stack Test Results at Federally-Reportable Sources - % Without Pass/Fail Results (1 FY)
Goal State 0% 1.3% 0.0% 0 357 357 No No comment - OK
A02B2S Stack Test Results at Federally-Reportable Sources - Number of Failures (1 FY)
Data Quality State 6 NA NA NA No No comment - OK
A03A0S Percent HPVs Entered <= 60 Days After Designation, Timely Entry (1 FY)
Goal State 100% 34.7% 0.0% 0 22 22 Caveat This metric evaluates the timely entry of HPVs in AFS by determining how long it takes to enter the Day Zero date in AFS. Because of the difficulty in AFS changing a HPV day zero to a non-HPV day zero, and vice versa, MDEQ does not enter a day zero until certain of the violation type. Therefore, we often do not make the determination until we've reviewed the company's response to our
State process for determining HPVs appears to result in late reporting. Discuss HPV management process with state during file review. Supplemental files selected.

NOV. This means our actual determination of HPV status is after the day zero. Consequently, we cannot guarantee day zero's are entered within 60 days; however, we do believe that the majority of day zero's are entered into AFS within 60 days of our determination of HPV/non-HPV.

A03B1S Percent Compliance Monitoring related MDR actions reported <= 60 Days After Designation, Timely Entry (1 FY)
Goal State 100% 59.0% 47.6% 413 867 454 Caveat This metric evaluates the timely entry of actions such as a Stack Tests, ACCs or FCEs in AFS. For a Stack Test, the data entry is measured from the date the stack test was conducted. Permits typically allow a company 45 to 60 days to submit a stack test report. Our data entry on the report does not occur until our review of the report has been completed. This process creates the potential for the 60 day entry time to be exceeded. Of the 454 Not Counted universe, 319 actions were associated with Stack Tests (70%.). There are 89 ACC/FCE (20%) actions that MDEQ identified as simple upload issues from the Universal Interface. If the upload issues had been addressed in a timely manner, the Not Counted universe would
Discuss data management processes and issues with State during onsite visit. Supplemental files selected.

have been 10%. MDEQ has identified the AFS upload issues and has taken measures to ensure the timely transfer of Minimum Data Requirements to AFS.

A03B2S Percent Enforcement related MDR actions reported <= 60 Days After Designation, Timely Entry (1 FY)
Goal State 100% 70.3% 56.2% 45 80 35 YES Because of the difficulty in AFS changing a HPV day zero to a non-HPV day zero, and vice versa, MDEQ does not enter a day zero until certain of the violation type. Therefore, we often do not make the determination until we've reviewed the company's response to our NOV. This means our actual determination of HPV status is after the day zero. Consequently, we cannot guarantee day zero's are entered within 60 days. Likewise, NOV's and most discovery activities are not entered into AFS until the appropriate day zero is created to facilitate linking of these actions to the day zero. We believe the data entry for the enforcement minimum data requirements other than NOVs and discovery activities
Discuss data management processes and issues with State during onsite visit. Supplemental files selected.

in AFS are generally timely.
A05A1S CMS Major Full Compliance Evaluation (FCE) Coverage (2 FY CMS Cycle)
Goal State 100% 89.2% 98.9% 263 266 3 No No comment - OK

A05A2S CAA Major Full Compliance Evaluation (FCE) Coverage(most recent 2 FY)
Review Indicator
State 100% 84.4% 96.5% 277 287 10 YES This metric indicates whether the state has successfully met its commitment for FCE coverage at majors for the last completed 2 fiscal years. The results are expressed in a percent (numerator=facilities with FCEs, denominator=facilities in the Major universe at the time of the data pull). The universe for this metric is dynamic and the Not Counted list includes facilities that have been recently added to the AFS Major universe but does not yet require a FCE.
A05B1S CAA Synthetic Minor 80% Sources (SM-80) FCE Coverage (5 FY CMS Cycle)
Review Indicator
State 20% - 100%
92.0% 83.5% 207 248 41 No No comment - OK Since FY2010 is the 4th year of the CMS cycle, the state value of 83.5% exceeds the national goal of 80%.

A05B2S CAA Synthetic Minor 80% Sources (SM-80) FCE Coverage (last full 5 FY)
Informational Only
State 100% 92.4% 91.2% 249 273 24 YES This metric indicates whether the state has successfully met its commitment for FCE coverage at Synthetic Minors for the last completed 5 fiscal years. The results are expressed in a percent (numerator=facilities with FCEs, denominator=facilities in the Synthetic Minor universe at the time of the data pull). The universe for this metric is dynamic and the Not Counted list includes facilities that have been recently added to the AFS Synthetic Minor universe but does not yet require a FCE.
A05C0S CAA Synthetic Minor FCE and reported PCE Coverage (last 5 FY)
Informational Only
State 79.2% 92.9% 290 312 22 No No comment - OK
A05D0S CAA Minor FCE and Reported PCE Coverage (last 5 FY)
Informational Only
State 28.8% 8.0% 37 462 425 No No comment - OK
A05E0S Number of Sources with Unknown Compliance Status
Review Indicator
State 0 NA NA NA No No comment - OK

(Current)
A05F0S CAA Stationary Source Investigations (last 5 FY)
Informational Only
State 0 NA NA NA No No comment - OK
A05G0S Review of Self-Certifications Completed (1 FY)
Goal State 100% 94.3% 100.0%
265 265 0 No No comment - OK
A07C1S Percent facilities in noncompliance that have had an FCE, stack test, or enforcement (1 FY)
Review Indicator
State > 1/2 National
Avg
22.3% 17.9% 48 268 220 No No comment - OK
A07C2S Percent facilities that have had a failed stack test and have noncompliance status (1 FY)
Review Indicator
State > 1/2 National
Avg
44.0% 25.0% 1 4 3 No No comment - OK
A08A0S High Priority Violation Discovery Rate - Per Major Source (1 FY)
Review Indicator
State > 1/2 National
Avg
6.4% 3.9% 11 279 268 No No comment - OK
A08B0S High Priority Violation Discovery Rate - Per Synthetic Minor Source (1 FY)
Review Indicator
State > 1/2 National
Avg
0.4% 3.3% 9 274 265 No No comment - OK
A08C0S Percent Formal Actions With Prior HPV - Majors (1 FY)
Review Indicator
State > 1/2 National
Avg
67.8% 90.9% 10 11 1 No No comment - OK
A08D0S Percent Informal Enforcement Actions Without Prior HPV - Majors (1 FY)
Review Indicator
State < 1/2 National
Avg
49.8% 65.5% 19 29 10 No No comment - OK

A08E0S Percentage of Sources with Failed Stack Test Actions that received HPV listing - Majors and Synthetic Minors (2 FY)
Review Indicator
State > 1/2 National
Avg
40.5% 50.0% 5 10 5 No No comment - OK
A10A0S Percent HPVs not meeting timeliness goals (2 FY)
Review Indicator
State 36.4% 46.5% 20 43 23 Caveat This data metric evaluates only the Air HPV enforcement timeline goals and does not account for more than one media being evaluated. A significant number of MDEQ’s enforcement actions are multi-media and our business practice is to address all violations, regardless of media, under one enforcement action. Due to the complexity of having multimedia violations included in one enforcement action and each media having their respective timeline(s), a particular media's timeline goal may be exceeded in resolving the enforcement.
Discuss multimedia enforcement process with state during file review. Supplemental files selected.

A12A0S No Activity Indicator - Actions with Penalties (1 FY)
Review Indicator
State 24 NA NA NA No No comment - OK
A12B0S Percent Actions at HPVs With Penalty (1 FY)
Review Indicator
State >= 80% 89.0% 92.3% 12 13 1 No No comment - OK
Clean Water Act PDA Worksheet
Metric Metric Description Metric Type Agency Nat'l
Goal Nat'l
Average MDEQ Count Universe Not Counted
State Discrepancy
(Yes/No)
Discrepancy Explanation Initial Findings
W01A1C Active facility universe: NPDES major individual permits (Current)
Data Quality Combined 96 NA NA NA No No Comment
W01A2C Active facility universe: NPDES major general permits (Current)
Data Quality Combined 0 NA NA NA No No Comment
W01A3C Active facility universe: NPDES non-major individual permits (Current)
Data Quality Combined 1,384 NA NA NA No No Comment

W01A4C Active facility universe: NPDES non-major general permits (Current)
Data Quality Combined 1,698 NA NA NA No No Comment
W01B1C Major individual permits: correctly coded limits (Current)
Goal Combined >=; 95%
91.9% 97.9% 94 96 2 Caveat The 2 Not Counted sites are due to permit start date and the limit start date not being the same. The 2 sites have permit start dates mid month, and limit start dates the 1st day of the month. These discrepancies have no impact on the functionality of PCS.
State metric exceeds national goal.
C01B2C Major individual permits: DMR entry rate based on MRs expected (Forms/Forms) (1 Qtr)
Goal Combined >=; 95%
92.6% 98.5% 448 455 7 YES The Not Counted universe is 1 as of 3/31/2011, Choctaw Pearl River WWTP, MS0053503 a Federal Facility.
State data correction accepted; State metric exceeds national goal.
C01B3C Major individual permits: DMR entry rate based on DMRs expected (Permits/Permits) (1 Qtr)
Goal Combined >=; 95%
96.0% 100.0% 94 94 0 No No Comment State metric exceeds national goal.
W01B4C Major individual permits: manual RNC/SNC override rate (1 FY)
Data Quality Combined 0.0% 0 11 11 No No Comment

W01C1C Non-major individual permits: correctly coded limits (Current)
Informational Only
Combined 86.6% 1,199 1,384 185 Caveat 106 of the Not Counted sites are due to permit start date and the limit start date not being the same. These sites have permit start dates mid month, and limit start dates the 1st day of the month. These discrepancies have no impact on the functionality of PCS. 46 of the Not Counted sites have No Discharge NPDES permits which have no limits associated with the permit. 33 of the Not Counted sites have Application Letter Received only, and a permit with limits has not been issued as of the data pull.
Additional clarification is needed on the state's discrepancy explanation (i.e., permit start dates vs. limit start dates).
C01C2C Non-major individual permits: DMR entry rate based on DMRs expected (Forms/Forms) (1 Qtr)
Informational Only
Combined 98.5% 969 984 15 No No Comment

C01C3C Non-major individual permits: DMR entry rate based on DMRs expected (Permits/Permits) (1 Qtr)
Informational Only
Combined 98.2% 331 337 6 No No Comment
W01D1C Violations at non-majors: noncompliance rate (1 FY)
Informational Only
Combined 39.4% 545 1,384 839 No No Comment
C01D2C Violations at non-majors: noncompliance rate in the annual noncompliance report (ANCR)(1 CY)
Informational Only
Combined 0 / 0 0 0 0 No No Comment
W01D3C Violations at non-majors: DMR non-receipt (3 FY)
Informational Only
Combined 219 NA NA NA No No Comment
W01E1S Informal actions: number of major facilities (1 FY)
Data Quality State 44 NA NA NA No No Comment
W01E2S Informal actions: number of actions at major facilities (1 FY)
Data Quality State 107 NA NA NA No No Comment
W01E3S Informal actions: number of non-major facilities (1 FY)
Data Quality State 510 NA NA NA No No Comment
W01E4S Informal actions: number of actions at non-major facilities (1 FY)
Data Quality State 627 NA NA NA No No Comment

W01F1S Formal actions: number of major facilities (1 FY)
Data Quality State 12 NA NA NA No No Comment
W01F2S Formal actions: number of actions at major facilities (1 FY)
Data Quality State 12 NA NA NA No No Comment
W01F3S Formal actions: number of non-major facilities (1 FY)
Data Quality State 66 NA NA NA No No Comment
W01F4S Formal actions: number of actions at non-major facilities (1 FY)
Data Quality State 66 NA NA NA No No Comment
W01G1S Penalties: total number of penalties (1 FY)
Data Quality State 36 NA NA NA No No Comment
W01G2S Penalties: total penalties (1 FY)
Data Quality State $536,804 NA NA NA No No Comment
W01G3S Penalties: total collected pursuant to civil judicial actions (3 FY)
Data Quality State $0 NA NA NA No No Comment
W01G4S Penalties: total collected pursuant to administrative actions (3 FY)
Informational Only
State $1,578,904 NA NA NA No No Comment
W01G5S No activity indicator - total number of penalties (1 FY)
Data Quality State $536,804 NA NA NA No No Comment
W02A0S Actions linked to violations: major facilities (1 FY)
Data Quality State >=; 80%
100.0% 12 12 0 No No Comment

W05A0S Inspection coverage: NPDES majors (1 FY)
Goal State 100% 60.7% 61.5% 59 96 37 No No Comment State metric falls below 70% - further discussion with the state is needed to determine if additional minors are being inspected in lieu of majors.
W05B1S Inspection coverage: NPDES non-major individual permits (1 FY)
Goal State 9.5% 132 1,384 1,252 Caveat This data represents the Non-Major NPDES facilities that had an inspection completed for FY10. The SRF/OTIS logic does not include inspections that were performed at Non-Major NPDES facilities that are now Inactive (14 evaluations for FY10). Based on the number of facilities that have had inspections for FY10, the inspection coverage should be 146/1383, or 10.6%.
State metric falls below 20%, so further discussion with state needed. Additional clarification is needed on the state's discrepancy explanation (i.e., the new inspection coverage rate).

W05B2S Inspection coverage: NPDES non-major general permits (1 FY)
Goal State 5.9% 101 1,698 1,597 Caveat This data represents the Non-Major general permit facilities that had an inspection completed for FY10.The SRF/OTIS logic does not include inspections that were performed at Non-Major general permit facilities that are now Inactive (41 evaluations for FY10). Based on the number of facilities that have had inspections for FY10, the inspection coverage should be 144/1684, or 8.6%.
State metric falls below 20%, so further discussion with state needed. Additional clarification is needed on the state's discrepancy explanation (i.e., the new inspection coverage rate).
W05C0S Inspection coverage: NPDES other (not 5a or 5b) (1 FY)
Informational Only
State 0.8% 4 483 479 No No Comment Need clarification on why the state metric is below 1% and additional clarification is needed from the state with regard to commitments from the state's 106 work plan.

W07A1C Single-event violations at majors (1 FY)
Review Indicator
Combined 3 NA NA NA No No Comment Although there is no National goal, the SEV rate is low (3 of 96). Supplemental CEI files will be reviewed to see if SEVs are being reported into PCS.
W07A2C Single-event violations at non-majors (1 FY)
Informational Only
Combined 2 NA NA NA No No Comment Although there is no national goal, the SEV rate is low (2 of 1384). Supplemental CEI files will be reviewed to see if SEVs are being reported into PCS.
W07B0C Facilities with unresolved compliance schedule violations (at end of FY)
Data Quality Combined 22.6% 8.3% 5 60 55 No No Comment State value is below national average
W07C0C Facilities with unresolved permit schedule violations (at end of FY)
Data Quality Combined 21.9% 100.0% 1 1 0 YES This metric is now 0. The facility listed in the counted universe was due to a data entry error after MDEQ's final review but before the data pull. This error has been corrected.
State correction tentatively accepted.
W07D0C Percentage major facilities with DMR violations (1 FY)
Data Quality Combined 52.8% 49.0% 47 96 49 No No Comment State value is below national average

W08A1C Major facilities in SNC (1 FY)
Review Indicator
Combined 11 NA NA NA No No Comment
W08A2C SNC rate: percent majors in SNC (1 FY)
Review Indicator
Combined 24.6% 11.5% 11 96 85 No No Comment State value is below national average.
W10A0C Major facilities without timely action (1 FY)
Goal Combined < 2% 18.3% 8.3% 8 96 88 Caveat The universe that EPA is using for this metric includes one facility that is regulated by EPA, Choctaw Pearl River WWTP, MS0053503. Therefore, the major facilities without timely actions should be 7/95, or 7.4%.
State correction accepted. While the State metric is below the national average, it does not meet the national goal.

Resource Conservation and Recovery Act PDA Worksheet
Metric Metric Description Metric Type Agency Nat'l
Goal Nat'l
Average MDEQ Count Universe Not Counted
State Discrepancy
(Yes/No) Discrepancy Explanation Initial Findings
R01A1S Number of operating TSDFs in RCRAInfo
Data Quality State 7 NA NA NA No No Comment
R01A2S Number of active LQGs in RCRAInfo
Data Quality State 146 NA NA NA No No Comment
R01A3S Number of active SQGs in RCRAInfo
Data Quality State 391 NA NA NA No No Comment
R01A4S Number of all other active sites in RCRAInfo
Data Quality State 2,279 NA NA NA No No Comment
R01A5S Number of LQGs per latest official biennial report
Data Quality State 122 NA NA NA No No Comment
R01B1S Compliance monitoring: number of inspections (1 FY)
Data Quality State 95 NA NA NA No No Comment
R01B2S Compliance monitoring: sites inspected (1 FY)
Data Quality State 93 NA NA NA No No Comment
R01C1S Number of sites with violations determined at any time (1 FY)
Data Quality State 22 NA NA NA No No Comment
R01C2S Number of sites with violations determined during the FY
Data Quality State 11 NA NA NA No No Comment

R01D1S Informal action: number of sites (1 FY)
Data Quality State 11 NA NA NA No No Comment
R01D2S Informal action: number of actions (1 FY)
Data Quality State 11 NA NA NA No No Comment
R01E1S SNC: number of sites with new SNC (1 FY)
Data Quality State 4 NA NA NA No No Comment
R01E2S SNC: number of sites in SNC (1 FY)
Data Quality State 13 NA NA NA No No Comment
R01F1S Formal action: number of sites (1 FY)
Data Quality State 9 NA NA NA No No Comment
R01F2S Formal action: number taken (1 FY)
Data Quality State 9 NA NA NA No No Comment
R01G0S Total amount of final penalties (1 FY)
Data Quality State $77,860 NA NA NA No No Comment
R02A1S Number of sites SNC-determined on day of formal action (1 FY)
Data Quality State 0 NA NA NA No No Comment
R02A2S Number of sites SNC-determined within one week of formal action (1 FY)
Data Quality State 0 NA NA NA No No Comment
R02B0S Number of sites in violation for greater than 240 days
Data Quality State 0 NA NA NA No No Comment

R03A0S Percent SNCs entered > 60 days after designation (1 FY)
Review Indicator
State 83.3% 5 6 1 No No Comment Five of the six SNCs identified in FY2010 had delayed entry into RCRAInfo. The SNC identification and data entry procedures will be discussed with MDEQ during file review.
R05A0S Inspection coverage for operating TSDFs (2 FYs)
Goal State 100% 87.4% 100.0% 7 7 0 No No Comment
R05B0S Inspection coverage for LQGs (1 FY)
Goal State 20% 24.1% 32.0% 39 122 83 Caveat The universe that EPA uses is the number of LQGs that filed a report for the Biennial Reporting System reporting cycle 2009. Mississippi’s LQG universe has changed significantly since March 1, 2010, and EPA's universe number does not accurately reflect the State’s LQG universe as of September 30, 2010. There were 145 active LQGs on February 17, 2011. Metric R01A2S is a more accurate representation of Mississippi’s LQG universe for FY10, and should be the universe to measure inspection coverage (Metric R05B0S & R05C0S) for LQGs.The SRF counted universe for FY 2010 LQG inspection coverage is 39. The State performed a total of 52 LQG inspections during FY 2010. The discrepancy is due to a change in generator status at 13 facilities who are no longer LQGs. Due to that change in the generator status, the inspections conducted at the facilities are not being counted in this data pull, but they should be counted. Based on the number of facilities that have LQG inspections for FY 2010, the inspection coverage should be 52/145, or
State caveat accepted. The SRF protocols recognize that the BRS and RCRAInfo LQG universes are not necessarily synchronized, which can lead to differences in the reported percentage of LQG inspection coverage.

35.9%.
R05C0S Inspection coverage for LQGs (5 FYs)
Goal State 100% 61.7% 95.9% 117 122 5 Caveat The universe that EPA uses is the number of LQGs that filed a report for the Biennial Reporting System reporting cycle 2009. Mississippi’s LQG universe has changed significantly since March 1, 2010, and EPA's universe number does not accurately reflect the State’s LQG universe as of September 30, 2010. There are 145 active LQGs on February 17, 2011. Metric R01A2S is a more accurate representation of Mississippi’s LQG universe for FY10, and should be the universe to measure inspection coverage (Metric R05B0S & R05C0S) for the LQGs. The SRF counted universe for FY 2006-2010 LQG inspections coverage is 117. The State performed a total of 133 inspections at LQGs for FY 2006-2010. This discrepancy is due to a change in generator status at facilities that are no longer LQGs. Due to that change in the generator status, the inspections conducted at those facilities are not being counted in this data pull, but they should be counted. Based on the number of facilities that have LQG inspections for FY 2006-2010, the inspection coverage should be 133/145, or 92.4%.
State caveat accepted. The SRF protocols recognize that the BRS and RCRAInfo LQG universes are not necessarily synchronized, which can lead to differences in the reported percentage of LQG inspection coverage.

R05D0S Inspection coverage for active SQGs (5 FYs)
Informational Only
State 34.0% 133 391 258 Caveat The SRF counted universe for FY 2006-2010 SQG inspections coverage is 133. The State performed a total of 254 SQG inspections at SQGs for FY 2006-2010. The discrepancy is due to a change in generator status at facilities that had inspections during this period. Due to that change in the generator status, the inspections conducted at the facilities are not being counted in this data pull, but they should be counted. Based on the number of facilities that have SQG inspections for FY 2006-2010, the inspection coverage should be 254/389, or 65.3%.
This metric counts the number of SQGs inspected, rather than the number of SQG inspections. A recent RCRAInfo report indicated that for FY2006-2010, there were 128 SQGs that received a CEI, and 179 CEIs conducted at SQGs. This caveat can be discussed with MDEQ during the file review, but it is not an area of concern.
R05E1S Inspections at active CESQGs (5 FYs)
Informational Only
State 252 NA NA NA No No Comment
R05E2S Inspections at active transporters (5 FYs)
Informational Only
State 6 NA NA NA No No Comment
R05E3S Inspections at non-notifiers (5 FYs)
Informational Only
State 1 NA NA NA No No Comment
R05E4S Inspections at active sites other than those listed in 5a-d and 5e1-5e3 (5 FYs)
Informational Only
State 11 NA NA NA No No Comment
R07C0S Violation identification rate at sites with inspections (1 FY)
Review Indicator
State 11.8% 11 93 82 No No Comment

R08A0S SNC identification rate at sites with inspections (1 FY)
Review Indicator
State 1/2 National
Avg
2.6% 4.3% 4 93 89 No No Comment
R10A0S Percent of SNCs with formal action/referral taken within 360 days (1 FY)
Review Indicator
State 80% 46.5% 25.0% 1 4 3 Yes RCRAInfo Version 3 requires that the addressing action be linked to the SNC. MDEQ staff was unaware of this change, but is now working to link the formal action and date to the 3 Not Counted SNCs. Prior to Version 3, an Order and a Return To Compliance date were linked to the violations which resolved the SNC in RCRAInfo. The 3 Not Counted sites all have Orders and a Return To Compliance date which resolved the violations within the 360 day timeframe. Therefore, once the link to the SNC is made, the Not Counted will be 0.
State correction accepted. As stated by MDEQ, all of the enforcement actions were resolved within 360 days, and this has been verified by a data check in RCRAInfo. Once the linkage of SNCs and formal actions takes place, the correct enforcement response times will be reflected in the data system reports.
R10B0S No activity indicator - number of formal actions (1 FY)
Review Indicator
State 9 NA NA NA No No Comment
R12A0S No activity indicator - penalties (1 FY)
Review Indicator
State $77,860 NA NA NA No No Comment
R12B0S Percent of final formal actions with penalty (1 FY)
Review Indicator
State 1/2 National
Avg
80.6% 100.0% 7 7 0 No No Comment

APPENDIX F: FILE SELECTION Files to be reviewed are selected according to a standard protocol (available here: http://www.epa-otis.gov/srf/docs/fileselectionprotocol_10.pdf) and using a web-based file selection tool (available here: http://www.epa-otis.gov/cgi-bin/test/srf/srf_fileselection.cgi). The protocol and tool are designed to provide consistency and transparency in the process. Based on the description of the file selection process in section A below, states should be able to recreate the results in the table in section B. Section A. File Selection Process
Clean Air Act File Selection Logic & Table of Selected Files for Review
Using the EPA OTIS File Selection Tool, 26 files were selected for the file review scheduled for July 25-29, 2011. As specified in the SRF File Selection Protocol, since the Mississippi universe includes fewer than 300 sources, 15 to 30 files must be reviewed. The fiscal year of review is FY2010. Representative Files The file review will focus on Major and Synthetic Minor 80% (SM80) sources with compliance and enforcement activities occurring during the review period (FY2010). Therefore, the targeted number of files to review was determined to be about 25 files. Since some supplemental files will need to be selected, the initial breakdown for representative files will be about 10 files each for both enforcement and compliance monitoring. This leaves about five files available for supplemental review. Enforcement files: In order to identify files with enforcement related activity, the facility list was sorted to identify those facilities which had a formal enforcement action during the review period (FY2010). Although there were 23 sources with a formal enforcement action in FY2010, only 19 of those were Major or SM80 sources. To randomly select the target number of files, one of every two facilities was selected, which yielded ten “representative” files. Compliance files: Just over 200 sources had full compliance evaluations (FCEs) during FY2010, so in order to identify approximately ten files, every 20th file was selected. This process led to the selection of an additional ten “representative” files. Supplemental Files Metric 3a & 10a: The PDA identified the timeliness of data entry for HPV-related minimum data requirements (MDRs) as a concern (Metric 3a). In addition, Data Metric 10a indicated that nearly half of the HPVs identified during the most recent 2 fiscal years were not meeting timeliness goals. Therefore, to evaluate these issues, two supplemental files were selected from among the FY2010 universe of HPV sources (Weyerhaeuser Co., Columbus Pulp & Paper; & Caledonia Energy Partners). Metric 3b1: The PDA indicated a potential concern with the timeliness of reporting of MDRs for compliance monitoring activities. The highest percentage of late compliance monitoring activities

were stack tests (69%), and the second highest occurrence was Title 5 annual certification reviews (26%). Therefore two supplemental files (Mississippi Phosphates & Signal International, West Bank Yard) will be reviewed to evaluate this concern. Metric 3b2: The PDA also indicated a potential concern with the timeliness of reporting of MDRs for enforcement related activities. The highest percentage of late enforcement MDRs (80%) were notices of violation (NOVs), followed by consent orders (20%). Therefore, two supplemental files (CITGO Petroleum, Vicksburg & Anderson Tully Lumber) were selected to evaluate this concern.

CLEAN AIR ACT FILE SELECTION
Facility Name AFS ID City FCE PCE Violation Stack Test
Failure
Title V Deviation
HPV Informal Action
Formal Action
Penalty Universe Select
ANDERSON TULLY LUMBER CO, WALTERSVILLE
2814900004 VICKSBURG 0 0 2 0 0 0 0 1 13,650 MAJR Supplemental
BATESVILLE MANUFACTURING INC, BATESVILLE
2810700021 BATESVILLE 1 0 4 0 0 1 1 1 7,352 MAJR Representative
CALEDONIA ENERGY PARTNERS, CALEDONIA COM
2808700063 CALEDONIA 0 0 0 1 0 1 1 0 0 SM80 Supplemental
CANTON MUNICIPAL UTILITIES 2808900070 CANTON 1 0 0 0 0 0 0 0 0 MAJR Representative
CITGO PETROLEUM CORP, VICKSBURG TERMINAL
2814900063 VICKSBURG 0 1 2 0 0 0 1 0 0 SM80 Supplemental
DENBURY ONSHORE LLC, HEIDELBERG CENTRAL
2806100074 HEIDELBERG 1 0 0 0 0 0 0 0 0 SM80 Representative
DICKERSON & BOWEN, BROOKHAVEN ASPHALT #5
2808500019 BROOKHAVEN 1 0 0 0 0 0 0 0 0 SM80 Representative
FAIRBANKS SCALES, INC 2807500078 MERIDIAN 0 1 1 0 0 0 1 1 12,000 SM80 Representative
FRED NETTERVILLE LUMBER COMPANY
2815700006 WOODVILLE 1 0 4 0 0 0 0 1 5,000 MAJR Representative
GEORGIA PACIFIC WOOD PRODUCTS,COLUMBIA
2809100008 COLUMBIA 1 0 0 0 0 0 0 0 0 MAJR Representative
HANKINS, INC. 2813900005 RIPLEY 0 1 1 0 0 1 1 1 3,750 MAJR Representative
HARTSON KENNEDY CABINET TOP COMPANY INC
2804700007 GULFPORT 1 0 0 0 0 0 1 0 0 MAJR Representative

HOLCIM (US), INC. 2808700025 ARTESIA 0 1 2 0 0 1 0 1 0 MAJR Representative
KOPPERS, INC. 2804300012 TIE PLANT 1 0 0 0 0 0 0 0 0 MAJR Representative
MARS FOOD US, LLC 2815100113 GREENVILLE 1 0 6 0 0 0 0 1 30,000 MAJR Representative
MISSISSIPPI PHOSPHATES CORPORATION
2805900044 PASCAGOULA 1 0 0 2 1 0 0 0 0 MAJR Supplemental
MUELLER COPPER TUBE COMPANY
2805700012 FULTON 0 1 1 0 0 1 1 1 2,813 MAJR Representative
ROGERS GROUP INC, SARDIS ASPHALT
2810700087 SARDIS 1 0 0 0 0 0 0 0 0 SM80 Representative
SAMSON RESOURCES CO, CORRINE FLD COMPR
2809500043 ABERDEEN 1 0 3 0 0 1 0 1 18,750 SM80 Representative
SIGNAL INTERNATIONAL LLC, WEST BANK YARD
2805900014 PASCAGOULA 1 0 0 0 2 0 0 0 0 MAJR Supplemental
STRUCTURAL STEEL SERVICES INC, PLANT 3
2807500037 MERIDIAN 1 0 0 0 0 0 0 0 0 MAJR Representative
TELLUS OPERATING GRP, BAXTERVILLE COMPR
2807300030 LUMBERTON 1 0 3 0 0 1 0 1 21,750 SM80 Representative
TVA CALEDONIA COMBINED CYCLE PLANT
2808700053 CALEDONIA 1 0 0 0 0 0 0 0 0 MAJR Representative
UTILITY OPTIMIZATION GROUP LLC
2805900049 MOSS POINT 0 0 3 0 0 0 0 1 4,100 SM80 Representative
VITRO AMERICA 2804300001 GRENADA 1 0 0 0 0 0 0 0 0 MAJR Representative
WEYERHAEUSER CO, COLUMBUS PULP & PAPER
2808700044 COLUMBUS 1 0 9 1 0 2 2 0 0 MAJR Supplemental

Clean Water Act File Selection Logic & Table of Selected Files for Review
Using the OTIS File Selection Tool, 34 files were selected for the SRF file review scheduled for the week of June 13-17, 2011. As specified in the SRF File Selection Protocol, between 25 and 40 files are to be selected for a state with a universe greater than 700 facilities. Since Mississippi’s CWA universe is greater than 700, a total of 34 files were selected for review (26 representative files and eight supplemental files). Representative Files There are 96 major individual permits, 1,384 non-major individual permits and 1,698 non-major general permits in the Mississippi universe of facilities. The 26 files selected for review are based on the following percentages: 32% are majors, 52% are non-major individual permits, and 16% are non-major general permits. For the major facilities, the Mississippi universe was sorted based on inspections, Single Event Violations (SEVs), significant noncompliance, violations, informal/formal actions and penalties. Majors were then randomly selected for file reviews. For non-major facilities, the permit type was included to introduce an additional element of variety to facilities selected for review. Non-majors included for review, therefore, include standard, storm water, unpermitted, general and pretreatment facilities. Supplemental Files The PDA noted that although there is no national goal for SEVs at majors (Metric W07A1C) or non-majors (Metric W07A2C), the rate of SEVs reported and tracked appears low (i.e., three of 96 majors and two of 1,384 non-majors). Therefore, to evaluate these metrics further, a total of eight supplemental files (three majors and five non-majors) were selected for review. For the non-majors, a variety of permit types (general, storm water, pretreatment and standard) were selected.

CLEAN WATER ACT FILE SELECTION
Facility Name Program ID City Permit Type
Insp. Violation SEV SNC Informal Action
Formal Action
Penalty Universe Select
BAY SPRINGS INDUSTRIAL
PARK
MS0034860 BAY SPRINGS 0 0 4 0 2 0 0 0 Minor Representative
BFI WASTE SYSTEMS OF MS LLC - BIG RIVER
LANDFILL
MSS051853 LELAND S 0 2 0 0 0 0 0 Minor Representative
CANEBRAKE UTILITIES ASSN
INC BELLEGRASS LAGOON AND
SPRAY FI
MSU060035 HATTIESBURG U 1 0 0 0 1 1 600 Minor Representative
CHEVRON TEXACO
PRODUCTS CO
MS0001481 PASCAGOULA 0 2 2 0 0 0 1 26,235 Major Representative
CLARKSDALE POTW
MS0020311 CLARKSDALE 0 1 0 0 0 0 0 0 Major Supplemental
COMO POTW MS0030104 COMO 0 0 10 0 0 3 0 0 Minor Representative
CONSOLIDATED CATFISH CO LLC
MS0039659 ISOLA 0 0 4 0 0 2 1 24,000 Minor Representative
CROSSTEX ENERGY
SERVICES LP
MSG130079 PRENTISS G 1 0 0 0 1 0 0 Minor Representative

DAIRY PRODUCTION
SYSTEMS MISSISSIPPI LLC
MSG210001 EDWARDS G 2 0 0 0 0 0 0 Minor Supplemental
DDB CONSTRUCTION COMPANY INC BALLARD PIT
AND MADISON SOUTH
MSS060330 CLINTON S 0 3 0 0 0 0 0 Minor Supplemental
EAST JASPER SCHOOL DISTRICT
WILLIAM J BERRRY
ELEMENTARY
MS0029289 HEIDELBERG 0 0 3 0 0 1 1 1,860 Minor Representative
FOREST POTW MS0020362 FOREST 0 1 6 0 2 5 0 0 Major Representative
GULF COAST LAUNDRY SERVICES
MSP091520 GULFPORT P 0 3 0 0 2 0 0 Minor Representative
HATTIESBURG - SOUTH LAGOON
MS0020303 HATTIESBURG 0 2 6 0 0 2 0 0 Major Representative
HEARTLAND CATFISH
COMPANY INC
MS0051098 ITTA BENA 0 0 12 0 4 2 1 6,250 Minor Representative
HOME DECOR INNOVATIONS
MSP090372 TUPELO P 0 18 0 4 1 0 0 Minor Representative
JACKSON POTW - SAVANNA
STREET
MS0024295 JACKSON 0 4 10 2 0 7 1 120,000 Major Representative
KUHLMAN ELECTRIC
CORPORATION
MSP091969 CRYSTAL SPRINGS
P 0 2 0 0 1 1 12,500 Minor Representative
LEFLORE CNTY BOARD OF
SUPERVISORS LEFLORE COUNTY
MSP091115 SIDON P 0 4 0 0 0 0 0 Minor Supplemental

MUNICIPAL S
LELAND POTW MS0020761 LELAND 0 0 2 0 0 0 1 0 Minor Representative
LUVATA GRENADA LLC COMMERCIAL
COIL PLANT
MSP090730 GRENADA P 0 4 0 0 0 0 0 Minor Representative
MARSHALL DURBIN
POULTRY CO INC
MSP090547 HATTIESBURG P 0 17 0 4 1 0 0 Minor Representative
MERIDIAN POTW MS0020117 MERIDIAN 0 0 27 1 3 2 1 8,125 Major Representative
MISSISSIPPI POWER
COMPANY PLANT JACK
WATSON
MS0002925 GULFPORT 0 1 0 0 0 0 0 0 Major Supplemental
MMC MATERIALS GREENVILLE
PLANT
MSG110132 GREENVILLE G 1 0 0 0 1 1 0 Minor Representative
MMC MATERIALS INDIANOLA
30505
MSG110037 INDIANOLA G 1 1 0 0 1 1 0 Minor Representative
MORTON POTW MS0036234 MORTON 0 1 1 0 0 1 0 0 Major Representative
PHILADELPHIA POTW
MS0021156 PHILADELPHIA 0 1 0 0 0 0 0 0 Major Supplemental
SENATOBIA POTW
MS0021431 SENATOBIA 0 0 8 0 4 0 0 0 Major Representative
SPENCER MEATS MS0037605 MOOREVILLE 0 0 4 1 0 0 1 0 Minor Representative
TRUE TEMPER SPORTS/EMHART
MS0003158 AMORY 0 1 8 2 1 0 1 0 Major Representative

TYSON FOODS CARTHAGE
PROCESSING PLANT
MS0026140 CARTHAGE 0 0 1 0 0 1 1 50,000 Minor Representative
WESTERN ROCK PRODUCTS INC
MS0054020 LUMBERTON 0 1 0 0 0 0 0 0 Minor Supplemental
WINONA POTW MS0021024 WINONA 0 1 4 0 0 3 1 2,500 Major Representative

Resource Conservation and Recovery Act File Selection Logic & Table of Selected Files for Review
Using the EPA OTIS File Selection Tool, 20 files were selected for the SRF onsite file review scheduled for June 13-17, 2011. As specified in the SRF File Selection Protocol, the number of files is based upon the compliance and enforcement activities for the fiscal year. The Mississippi RCRA universe consisted of 99 compliance and enforcement activities in the year of review (FY2010). Since the universe includes less than 300 facilities in the RCRA universe, the suggested range of files to be reviewed is between 15 to 30 files. The SRF File Selection Protocol also establishes that half of the files should be from compliance monitoring activity, and the other half should include some form of enforcement activity. Representative Files Enforcement files: In order to identify representative files with enforcement related activity, the facility list was sorted to identify those facilities which had a formal enforcement action during the review period. The file selection protocol indicated there were seven facilities with a final formal enforcement action. All seven facilities were selected, along with four facilities with informal enforcement actions. Compliance files: The remaining nine files were selected randomly from the inspections conducted in FY2010. A cross-section of RCRA facility types were selected from TSDs, LQGs, SQGs, CEGs, and “Other” facilities. Supplemental Files The SRF File Selection Protocol also provides that supplemental files may be selected to further evaluate potential areas of concern. There were no additional RCRA files selected as supplemental files.

RESOURCE CONSERVATION AND RECOVERY ACT FILE SELECTION
Facility RCRA ID City Evaluation Violation SNC Informal Action
Formal Action Penalty Universe Select
BONNER ANALYTICAL TESTING FORM MSR000101493 HATTIESBURG 1 3 1 1 0 0 SQG Representative
E.I. DU PONT DE NEMOURS AND CO MSD096046792 PASS
CHRISTIAN 1 0 0 0 0 0 TSD(TSF) Representative
ERGON REFINING, INC. MSD098595317 VICKSBURG 1 0 0 0 0 0 LQG Representative
GEORGIA GULF CHEMICALS & VINYLS,
LLC MSD007031230 ABERDEEN 1 0 0 0 0 0 LQG Representative
LAKELAND AUTO MALL DODGE MSR000005082 JACKSON 1 0 0 0 0 0 SQG Representative
NORTH AMERICAN PRECISION CAST MSR000004457 COLUMBUS 1 3 1 1 0 0 SQG Representative
ODOM INDUSTRIES INC MSR000005025 PACHUTA 1 8 1 1 0 0 LQG Representative
PECO FOODS, INC MSD985976430 SEBASTOPOL 1 0 0 0 0 0 OTH Representative
REICHHOLD, INC. MSD001661719 GULFPORT 1 0 0 0 0 0 TSD(LDF) Representative
TENNESSEE GAS PIPELINE STATION 546 MSD083744029 COLUMBUS 1 0 0 0 0 0 CES Representative
TRI STATE POLE AND PILING INC MSD981920200 LUCEDALE 1 2 0 1 0 0 LQG Representative
US NAVY-SPECIAL BOAT UNIT 22 MSR000004929
STENNIS SPACE
CENTER 1 0 0 0 0 0 SQG Representative
WATER WAY INC MSR000005090 IUKA 1 0 0 0 0 0 LQG Representative
CAVENHAM FOREST INDUSTRIES, INC. MSD057226961 GULFPORT 0 0 0 1 1 44,000 TSD(LDF) Representative
HEADRICK SIGN COMPANY MSD982120677 LAUREL 1 1 0 1 1 5,000 LQG Representative

HOWARD INDUSTRIES, INC. MSD043417476 LAUREL 0 0 0 0 1 1,760 LQG Representative
HOWARD INDUSTRIES, INC. ELLISVILLE MSR000102962 ELLISVILLE 0 0 0 0 1 1,100 LQG Representative
HOWARD INDUSTRIES, INC., SANDERSVILLE MSR000005710 LAUREL 0 0 0 0 1 5,500 LQG Representative
SMITH'S MACHINE & WELDING CO., INC. MSR000102541 BROOKHAVEN 1 5 1 1 1 8,500 SQG Representative
THOMAS WOOD PRESERVING, INC. MSD033311812 ELLIOTT 0 0 0 0 1 12,000 CES Representative

APPENDIX G: FILE REVIEW ANALYSIS This section presents the initial observations of the region regarding program performance against file metrics. Initial findings are developed by the region at the conclusion of the file review process. The initial finding is a statement of fact about the observed performance, and should indicated whether the performance indicates a practice to be highlighted or a potential issue, along with some explanation about the nature of good practice or the potential issue. The File Review Metrics Analysis Form in the report only includes metrics where potential concerns or areas of exemplary performance are identified. Initial findings indicate the observed results. They are preliminary observations and are used as a basis for further investigation. These findings are developed only after evaluating them against the PDA results where appropriate, and talking to the state. Through this process, initial findings may be confirmed, modified, or determined not to be supported. Findings are presented in Section IV of this report. The quantitative metrics developed from the file reviews are initial indicators of performance based on available information and are used by the reviewers to identify areas for further investigation. Because of the limited sample size, statistical comparisons among programs or across states cannot be made.

CLEAN AIR ACT FILE REVIEW ANALYSIS Name of State: Mississippi Review Period: FY 2010
CAA Metric #
CAA File Review Metric Description:
Metric Value Evaluation Initial Findings
Metric 2c % of files reviewed where MDR data are accurately reflected in AFS. 73% Minor Issue
During the file review, 19 of the 26 files reviewed (73%) documented all MDRs being reported accurately into AFS. The remaining seven files had one or more discrepancies identified. Three files had minor discrepancies such as an incorrect Standard Industrial Classification (SIC) code or city. More significantly, five files showed either an incorrect compliance status or an inconsistency between the compliance status and HPV status. Finally, one file indicated the potential applicability of the MACT and NSPS air programs, but these were not reflected in AFS. Considering the large number of MDR data elements the State must enter and maintain in AFS, this small number of inaccuracies represents a minor deficiency.
Metric 4a
Confirm whether all commitments pursuant to a traditional CMS plan (FCE every 2 yrs at Title V majors; 3 yrs at mega-sites; 5 yrs at SM80s) or an alternative CMS plan were completed. Did the state/local agency complete all planned evaluations negotiated in a CMS plan? Yes or no? If a state/local agency implemented CMS by following a traditional CMS plan, details concerning evaluation coverage are to be discussed pursuant to the metrics under Element 5. If a state/local agency had negotiated and received approval for conducting its compliance monitoring program pursuant to an alternative plan, details concerning the alternative plan and the S/L agency's implementation (including evaluation coverage) are to be discussed under this Metric.
100% Appears Acceptable MDEQ follows a traditional Compliance Monitoring Strategy (CMS) plan and completed 100% of all planned evaluations for FY2010 (208 of 208 FCEs) in their current CMS plan.
Metric 4b
Delineate the air compliance and enforcement commitments for the FY under review. This should include commitments in PPAs, PPGs, grant agreements, MOAs, or other relevant agreements. The compliance and enforcement commitments should be delineated.
100% Appears Acceptable See attached table for Metric 4b.
Metric 6a # of files reviewed with FCEs. 18
Metric 6b % of FCEs that meet the definition of an FCE per the CMS policy. 100% Appears Acceptable All 18 files reviewed had documentation in the files to show that they contained all of
the elements of the FCE, per the CMS.
Metric 6c % of CMRs or facility files reviewed that provide sufficient documentation to determine compliance at the facility.
100% Appears Acceptable All 18 CMRs reviewed contained all of the CMR requirements listed in the CMS and they contained sufficient documentation to determine compliance at the facility.
Metric 7a % of CMRs or facility files reviewed that led to accurate compliance determinations. 100% Appears Acceptable All 18 CMRs reviewed led to an accurate compliance determination.

Metric 7b % of non-HPVs reviewed where the compliance determination was timely reported to AFS.
50% Potential Concern 3 of the 6 files reviewed with non-HPV violations were reported timely into AFS.
Metric 8f % of violations in files reviewed that were accurately determined to be HPV. 100% Appears Acceptable All 16 files reviewed accurately determined HPVs.
Metric 9a # of formal enforcement responses reviewed. 11
Metric 9b
% of formal enforcement responses that include required corrective action (i.e., injunctive relief or other complying actions) that will return the facility to compliance in a specified time frame.
100% Appears Acceptable All 11 files reviewed documented injunctive relief or complying actions. Most enforcement actions were penalty only actions, but the files documented that the facility had returned to compliance prior to issuance of the order.
Metric 10b % of formal enforcement responses for HPVs reviewed that are addressed in a timely manner (i.e., within 270 days).
89% Minor Issue 8 of the 9 HPVs reviewed were addressed in a timely manner.
Metric 10c % of enforcement responses for HPVs appropriately addressed. 100% Appears Acceptable All 9 HPVs were appropriately addressed with a formal enforcement response.
Metric 11a % of reviewed penalty calculations that consider and include where appropriate gravity and economic benefit.
90% Appears Acceptable 9 of the 10 files with a penalty action provided documentation of appropriate gravity and economic benefit components of the penalty.
Metric 12c % of penalties reviewed that document the difference and rationale between the initial and final assessed penalty.
80% Potential Concern
8 of the 10 files reviewed which had a penalty action provided documentation of the difference between the initial and final penalty. For the actions with no documentation of this rationale, MDEQ advises that they relied on a provision of their Penalty Policy which states that “the calculated penalty may be reduced by up to 30% by the Branch Manager and up to 50% by the Division Chief.”
Metric 12d % of files that document collection of penalty. 100% Appears Acceptable All 12 files reviewed documented collection of the penalty.
Evaluation Criteria
Minor Issues/Appears Acceptable -- No EPA recommendation required.
Potential Concern -- Not a significant issue. Issues that the state may be able to correct without specific recommendation. May require additional analysis.
Significant Issue -- File review shows a pattern that indicates a significant problem. Will require an EPA Recommendation.

CLEAN WATER ACT FILE REVIEW ANALYSIS
CWA
Metric
#
CWA File Review Metric Metric Value Assessment Initial Findings and Conclusions
Metric
2b
% of files reviewed where data is accurately reflected in the national data system.
84% Minor Issues 26 of 31 files have accurate data entered; 5 with inaccuracies include: 1. Inactive in PCS; but no record of its status in file; 2. Long-term Compliance Schedule violations are still noted in PCS system; 3. Qtrs 10, 11 and 12 have no DMRs, but PCS reports it as NA with no non-compliance. It was reported as a Reportable Violation the previous 9 quarters; 4. An inspection was coded in PCS as a Compliance Sampling Inspection and should have been represented as a Compliance Monitoring Inspection; and 5. Inspection reports in one facility file were not recorded in PCS.
Metric
4a
% of planned inspections completed. Summarize using the Inspection Commitment Summary Table in the CWA PLG.
83-647% (See Initial Findings and Conclusions)
Minor Issues Planned inspections completed/committed: Majors: 51/43 (119%); Minors: 216/217 (99%); SSOs: 97/15 (647%); SIUs/CEIs: 200/198 (101%); SIUs/CMIs: 165/198 (83%); General Permitted Minors: 110/44 (250%); MS4 Phase II: 9/7 (129%); Industrial Storm water: 236/93 (254%); Construction Storm water: 355/214 (166%); CAFOs: 25/25 (100%); and AFOs: 25/25 (100%)
Metric
4b
Other Commitments. Delineate the commitments for the FY under review and describe what was accomplished. This should include commitments in PPAs, PPGs, grant agreements, MOAs, or other relevant agreements. The commitments should be broken out and identified.
96% Appears Acceptable Planned commitments complete: 96% (25/26)
Metric
6a
# of inspection reports reviewed. 32 NA NA

Metric
6b
% of inspection reports reviewed that are complete.
0% Potential Concern None of the 32 inspection reports were "complete". The missing information is related to time of inspection and phone numbers, as required by the State's Compliance Inspection Manual. Additionally, one recon report was undated and unsigned and contained no indication of photos or attachments.
Metric
6c
% of inspection reports reviewed that provide sufficient documentation to lead to an accurate compliance determination.
100% Appears Acceptable All 32 inspection reports had adequate documentation; one file had insufficient documentation because the inspection report was not in the facility file. This report was not included in this finding since the report was not reviewed.
Metric
6d
% of inspection reports reviewed that are timely.
91% Minor Issues Of the 32 inspection reports reviewed, 29 were found to be timely (i.e., completed within 45 days or 50 days if a violation was found). For those inspection reports that were not completed in a timely manner, the time needed to complete inspection reports ranged from 75 to 330 days.
Metric
7e
% of inspection reports or facility files reviewed that led to accurate compliance determinations.
100% Appears Acceptable 32 of 32 inspection reports led to a compliance determination.
Metric
8b
% of single event violation(s) that are accurately identified as SNC or Non-SNC.
100% Appears Acceptable 8 of 8 facilities were accurately identified as non-SNCs.
Metric
8c
% of single event violation(s) identified as SNC that are reported timely.
NA NA There no were SEVs identified as a SNC.
Metric
9a
# of enforcement files reviewed 49 NA 49 enforcement responses for 8 major and 13 minor facilities were reviewed.
Metric
9b
% of enforcement responses that have returned or will return a source in SNC to compliance.
100% Appears Acceptable 3 of 3 enforcement responses have or will return a SNC to compliance.
Metric
9c
% of enforcement responses that have returned or will returned a source with non-SNC violations to compliance.
100% Appears Acceptable 40 of 40 enforcement responses have or will return a non-SNC to compliance.
Metric
10b
% of enforcement responses reviewed that address SNC that are taken in a taken in a timely manner.
0% Significant Issue 0 of 2 (0%) of major SNCs were addressed in a timely manner.
Metric
10c
% of enforcement responses reviewed that address SNC that are appropriate to the violations.
100% Appears Acceptable 2 of 2 facilities had enforcement responses that were appropriate for SNCs (2 others were addressed by formal enforcement actions in FY 11 and were, therefore, not

included in these findings).
Metric
10d
% of enforcement responses reviewed that appropriately address non-SNC violations.
100% Appears Acceptable 40 of 40 enforcement responses were appropriate for non-SNCs.
Metric
10e
% enforcement responses for non-SNC violations where a response was taken in a timely manner.
76% Significant Issue 32 of 42 enforcement responses were timely. Of the 10 that were not timely: • It took 7 years to determine non-compliance for one facility; • The NOV was issued 4 months after discovery; but Region 4’s interest in the case may have delayed the NOV; • No enforcement response was taken; • The AO was issued over 180 days due to a Supplemental Environmental Project; • NOVs were issued over 60 days from the inspection; • An AO was issued in 270 days – exceeding the 180 day deadline for formal actions; • The AO was issued 11 months from the inspection; • The AO was issued over 180 days from the inspection; •• The NOV was issued over 60 days from the inspection and the AO was issued in 240 days.
Metric
11a
% of penalty calculations that consider and include where appropriate gravity and economic benefit.
30% Significant Issue Of the 10 penalty calculations reviewed, all 10 considered gravity, but 3 of 10 penalty calculations considered and documented the rationale for economic benefit.
Metric
12a
% of penalties reviewed that document the difference and rationale between the initial and final assessed penalty.
90% Minor Issues Of the 10 penalties reviewed, the difference between the initial and final assessed penalty was documented in 4 of 5 instances; in 1 case no rationale or documentation was provided; and in 5 instances, there was no difference between the initial and final assessed penalty.
Metric
12b
% of enforcement actions with penalties that document collection of penalty.
100% Appears Acceptable 10 of 10 final enforcement actions documented the collection of the final penalty.
Findings Criteria
Minor Issues/Appears Acceptable -- No EPA recommendation required.
Potential Concern -- Not a significant issue. Issues that the state may be able to correct without specific recommendation. May require additional analysis.
Significant Issue -- File review shows a pattern that indicates a significant problem. Will require an EPA Recommendation.

RESOURCE CONSERVATION AND RECOVERY ACT FILE REVIEW ANALYSIS
Name of State: Mississippi Review Period: FY 2010
RCRA Metric # RCRA File Review Metric Description: Metric Value Evaluation Initial Findings
1 Metric 2c % of files reviewed where mandatory data are accurately reflected in the national data system. 75% Minor Issue
Of the 20 files reviewed, 15 (75%) had complete and accurate data reported in RCRAInfo. The following data inaccuracies were identified in the remaining five files: 1) In three files, there was a one-day difference between the day of the inspection reported in the file and the date reported in RCRAInfo; 2) In the fourth file, the facility had changed generator status and it was not updated in RCRAInfo; and, 3) In the fifth file, there were violations in the inspection report that were not entered into RCRAInfo. Since most of the data inaccuracies are minor in nature, this is an area for state attention.
2 Metric 4a Planned inspections completed 100% Appears Acceptable
The FY 2010 MDEQ RCRA grant work plan includes specific commitments, including inspections, financial record reviews, and the review of groundwater monitoring reports. MDEQ completed all inspection commitments for FY 2010 that were outlined in the MDEQ RCRA grant work plan.
3 Metric 4b Planned commitments completed 100% Appears Acceptable
The FY 2010 MDEQ RCRA grant work plan includes specific commitments, including inspections, financial record reviews, and the review of groundwater monitoring reports. MDEQ completed all inspection commitments for FY 2010 that were outlined in the MDEQ RCRA grant work plan.
4 Metric 6a # of inspection reports reviewed. 20 See Metric 6b and 6c, which had minor issues.
5 Metric 6b % of inspection reports reviewed that are complete and provide sufficient documentation to determine compliance at the facility. 85% Minor Issue
Of the inspection reports reviewed, 85% (17 of 20) were complete and had sufficient documentation to determine compliance at the facility. Examples of missing information in the three incomplete reports were: identification of facility type and inconsistent documentation of issues identified. Since this missing information is minor in nature, this is an area for state attention.
6 Metric 6c Inspections reports completed within a determined time frame. 50% Minor Issue Average 55 days: w/ violations average 49 days; w/o violations average 53 days. This is an area for state attention.

7 Metric 7a % of accurate compliance determinations based on inspection reports. 90% Appears Acceptable
Of the inspection reports reviewed, 90% (18 of 20) had accurate compliance determinations. There was one inspection where violations were missing from the report and another inspection where the facility was inspected as a RCRA SQG when the facility was actually a LQG. Neither facility was correctly identified as a SV.
8 Metric 7b % of violation determinations in the files reviewed that are reported timely to the national database (within 150 days). 90% Appears
Acceptable
There were 12 facility inspections where violations were found. With the exception of the two facilities referenced above, all the facilities were issued a Notice of Violation within 150 days after the inspection and the information was entered into RCRAInfo by day 150.
9 Metric 8d % of violations in files reviewed that were accurately determined to be SNC (or SV). 100% Appears Acceptable
There were 20 inspection reports reviewed and 100% of the SNCs (10 out of 10) were correctly identified by the State.
10 Metric 9a # of enforcement responses reviewed. 11 EPA reviewed a total of 11 enforcement responses, including 10 SNCs and one SV.
11 Metric 9b % of enforcement responses that have returned or will return a source in SNC to compliance. 100% Appears
Acceptable
From a review of the files, all ten SNCs had documentation in the fields showing the facility had returned to compliance or that the enforcement action required them to return to compliance in a specified timeframe.
12 Metric 9c % of enforcement responses that have returned or will return Secondary Violators (SV's) to compliance. 100% Appears
Acceptable
In the one SV file reviewed, the correct documentation in the file showed that the facility returned to compliance or that the enforcement action required them to return to compliance in a specified timeframe.
13 Metric 10c % of enforcement responses reviewed that are taken in a timely manner. 100% Appears Acceptable
(10a had minor issue) Eleven out of 11 facilities of the enforcement actions reviewed were addressed within the ERP timeframes.
14 Metric 10d % of enforcement responses reviewed that are appropriate to the violations. 100% Appears Acceptable
(10a had minor issue) Eleven out of 11 facilities of the enforcement actions reviewed were addressed within the ERP timeframes.
15 Metric 11a % of reviewed penalty calculations that consider and include where appropriate gravity and economic benefit. 70% Minor Issue
All ten files incorporated a penalty calculation and/or narrative that included a gravity component. For economic benefit, 70% (7 of 10) of the files provided sufficient documentation of the appropriate economic benefit considerations. The other three penalties stated that economic benefit was "not applicable" for the case. The State explained that for RCRA, there is often little or no economic benefit related to the violations so the factor is "not applicable." It was recommended that even if economic benefit is determined to be nonexistent or de minimis the rationale for that decision should be included in the penalty calculation. This is an area for state attention.
16 Metric 12a % of penalties reviewed that document the difference and rationale between the initial and final assessed penalty. 100% Appears
Acceptable
Nine out of nine of enforcement orders had, where applicable, the needed documentation to support a downward adjustment of calculated penalty.

17 Metric 12b % of files that document collection of penalty. 100% Appears Acceptable
Of the nine enforcement orders reviewed, 100% had documentation that penalties were collected or were on a schedule for collection.
Findings Criteria No or only minor issue. Finding or recommendation may not be required in the final report. Potential area of concern. State is expected to make corrections on their own. Finding may be required, but EPA recommendation may not be required. Significant issues. Finding(s) and EPA recommendation(s) required.

APPENDIX H: CORRESPONDENCE


