state trends in alcohol problems - national … · state trends in alcohol problems 1979–92 ......
TRANSCRIPT

U.S. Alcohol EpidemiologicData Reference ManualVolume 5, First Edition
STATE TRENDS INALCOHOL PROBLEMS
1979–92
September 1996
National Institutes of Health
National Institute on Alcohol Abuse and Alcoholism6000 Executive Boulevard
Rockville, MD 20892

- ii -
This publication was developed under Contract No. N01–AA–5–1001 to CSR, Incorporated, forthe Alcohol Epidemiologic Data System (AEDS) of the National Institute on Alcohol Abuse andAlcoholism (NIAAA). Principal authors of this manual were Frederick S. Stinson and ThomasM. Nephew of CSR, Incorporated. Mary C. Dufour contributed substantively to theconceptualization of this manual and reviewed the narrative portion.
NIH Publication No. 96-4174Printed September 1996
All material appearing in this manual is in thepublic domain and may be reproduced or copiedwithout permission from the Institute. Citation ofthe source is appreciated.

- iii -
Table of Contents
1. Introduction ......................................................................................................................... 11.1 Purposes and Scope....................................................................................................... 11.2 Alcohol-Related Mortality ............................................................................................ 21.3 Specific Alcohol-Related Mortality .............................................................................. 51.4 Data Sources and Calculations ...................................................................................... 6
1.4.1 Mortality Data ......................................................................................................... 61.4.2 Population Data ....................................................................................................... 71.4.3 Mortality Rates ........................................................................................................ 7
2. Data Tables.......................................................................................................................... 9
3. References ....................................................................................................................... 190
- iv -
List of Tables
1. Number of deaths and unadjusted and age-adjusted death rates per 100,000 population fordifferent categories of alcohol-related mortality by state: United States, 1979–92
United States ............................................................................................................... 10Alabama ...................................................................................................................... 13Alaska.......................................................................................................................... 16Arizona........................................................................................................................ 19Arkansas ...................................................................................................................... 22California..................................................................................................................... 25Colorado ...................................................................................................................... 28Connecticut.................................................................................................................. 31Delaware...................................................................................................................... 34District of Columbia.................................................................................................... 37Florida ......................................................................................................................... 40Georgia ........................................................................................................................ 43Hawaii ......................................................................................................................... 46Idaho............................................................................................................................ 49Illinois.......................................................................................................................... 52Indiana ......................................................................................................................... 55Iowa............................................................................................................................. 58Kansas ......................................................................................................................... 61Kentucky ..................................................................................................................... 64Louisiana ..................................................................................................................... 67Maine........................................................................................................................... 70Maryland ..................................................................................................................... 73Massachusetts.............................................................................................................. 76Michigan...................................................................................................................... 79Minnesota .................................................................................................................... 82Mississippi................................................................................................................... 85Missouri....................................................................................................................... 88Montana....................................................................................................................... 91Nebraska...................................................................................................................... 94Nevada......................................................................................................................... 97New Hampshire......................................................................................................... 100New Jersey ................................................................................................................ 103New Mexico .............................................................................................................. 106New York .................................................................................................................. 109North Carolina........................................................................................................... 112North Dakota ............................................................................................................. 115Ohio........................................................................................................................... 118Oklahoma .................................................................................................................. 121Oregon....................................................................................................................... 124Pennsylvania.............................................................................................................. 127

- v -
Rhode Island.............................................................................................................. 130South Carolina........................................................................................................... 133South Dakota ............................................................................................................. 136Tennessee .................................................................................................................. 139Texas ......................................................................................................................... 142Utah ........................................................................................................................... 145Vermont..................................................................................................................... 148Virginia...................................................................................................................... 151Washington................................................................................................................ 154West Virginia ............................................................................................................ 157Wisconsin.................................................................................................................. 160Wyoming................................................................................................................... 163
2. Age-specific number of deaths and age-specific and age-adjusted death rates per 100,000population for selected alcohol-related causes of death: United States, 1979–92
All cirrhosis (ICD-9 571,572.3) ................................................................................ 166Alcoholic liver cirrhosis (ICD-9 571.0-571.3) .......................................................... 169Other specified liver cirrhosis without mention of alcohol (ICD-9 571.4, 571.6, 571.8, 572.3) ................................................................. 172Unspecified liver cirrhosis without mention of alcohol (ICD-9 571.5, 571.9) ......... 175Nondependent abuse of alcohol (ICD-9 305.0)......................................................... 178Alcohol dependence syndrome (ICD-9 303)............................................................. 181Accidental poisoning by alcohol (ICD-9 E860) ........................................................ 184Alcoholic psychoses (ICD-9 291) ............................................................................. 187

- 1 -
1. Introduction
This document provides the most current available data on alcohol-related mortality forindividual States and the United States as a whole. It is the first uniform source of State-leveltrends in overall alcohol-related mortality, and is the first to employ the alcohol attributablefraction (AAF) method described in Stinson and Proudfit (1994) at the State level to calculatesuch mortality figures. In addition, this document provides national trends in mortality rates fromseveral specific alcohol-related causes of death, including cirrhosis, alcohol-related psychoses,and alcohol poisoning.
This data reference manual was compiled and published by the Alcohol Epidemiologic DataSystem (AEDS) of the National Institute on Alcohol Abuse and Alcoholism (NIAAA) as part ofa series of AEDS data reference manuals. Several of these earlier manuals have focused oncounty-level data on alcohol-related mortality (NIAAA, 1981; Colliver, 1985; Caces et al., 1991;Stinson and Proudfit, 1994), but none have reported on overall alcohol-related mortalitymeasures at the State level.
1.1 Purposes and Scope
The primary purposes of this manual are as follows: (1) to provide information that can be usefulto Federal and State agencies in allocating resources for alcohol treatment and prevention and(2) to make State-level alcohol problem data available for research efforts. The following areexamples of the potential use of the data presented in this manual:
• Determining the prevalence of alcohol-related problems in a State compared to other Statesor to the entire country. Such information is valuable in establishing appropriate overallprogram resource levels and in making differential resource allocations among States oramong alcohol-related public health concerns.
• Identifying patterns of abuse by studying demographic and ecological patterns that appear to
correlate with the magnitude of alcohol problems. • Assessing needs for alcohol programs to determine the types of programs that are most
needed (e.g., programs focused on health issues for prevention of alcohol-related diseases orprograms focused on situational problems, such as injuries, that are brought on by the abuseof alcohol) and identifying the States with the greatest needs (particularly unmet needs).
• Research modeling, using multivariate statistical methods that link alcohol-related mortality
levels (as a problem indicator) with ecological variables, to generate hypotheses for furtherresearch or to project future alcohol program needs based on anticipated demographicchanges.

- 2 -
Measures of alcohol problems include:
• Health effects, such as morbidity or mortality; • Accidents and injuries, especially from motor vehicle crashes; • Social effects, such as family dissolution, violence, and alcohol-related crime; and • Interference with occupational functioning, including absenteeism and diminished job
performance.
For the purposes of this manual, assessment of alcohol problems is based on alcohol-relatedmortality. The death registration system in the United States provides one of the few nationaldatabases that is not based on a sample; mortality data include information on every death thatoccurs in the country. As a result, all States are represented equally in the available data. Inaddition, death certificates are uniformly coded throughout the United States, with an importantexception: not all States provide data on the Hispanic origin of the decedent, preventing the useof this demographic variable in this manual. Although the mortality data system codes race, thisreference manual provides data separately only for black and white decedents because annualestimates of the population by State, age, and sex were not available to calculate rates separatelyfor American Indian or Asian/Pacific Islander decedents.
Two kinds of alcohol-related mortality indicators are presented in this document. The first areestimates of the total number of deaths attributable to alcohol, based on informed medicalestimates of the proportions of deaths from each of various different causes that are attributableto alcohol. These indicators are found in the first four columns of Table 1. The second kind ofindicator are tallies of underlying causes of death that strongly imply or explicitly mentionalcohol consumption (chronic or not) as the underlying cause of death. One such indicator—allchronic liver disease and cirrhosis—is included in Table 1 as a comparison, and in Table 2 as thefirst of nine specific alcohol-related mortality causes. A discussion of each of these kinds ofindicators follows.
1.2 Alcohol-Related Mortality
The research literature includes several evolving attempts to assess the overall contribution ofalcohol abuse to mortality (Ravenholt, 1984; Rice et al., 1990; Parker et al., 1987; McDonnelland Maynard, 1985; Caces et al., 1991; Stinson and DeBakey, 1992; Stinson et al., 1993; Stinsonand Proudfit, 1994). These estimates are based on reviews of the medical literature that attemptto assess the contribution of alcohol to various causes of death. The findings in this datareference manual are based on the newest estimates of alcohol's contribution to mortality forspecific causes of death (Schultz et al., 1990); this definition is based on the most comprehensivereview of findings from the medical literature currently available.
The definition of alcohol-related mortality introduced by Schultz and colleagues (1990) includesdeaths from a greater number of underlying causes than were considered in NIAAA’s earlier data

- 3 -
reference manuals. This definition was adopted again for this manual to reflect the most currentknowledge and to provide estimates that more accurately indicate the total impact of alcoholabuse on mortality. It is based on the ninth revision of the International Classification of Diseasesreporting system (ICD-9) for classifying causes of death. Data in this report begin in 1979, thefirst year of the ICD-9 reporting system in the United States.
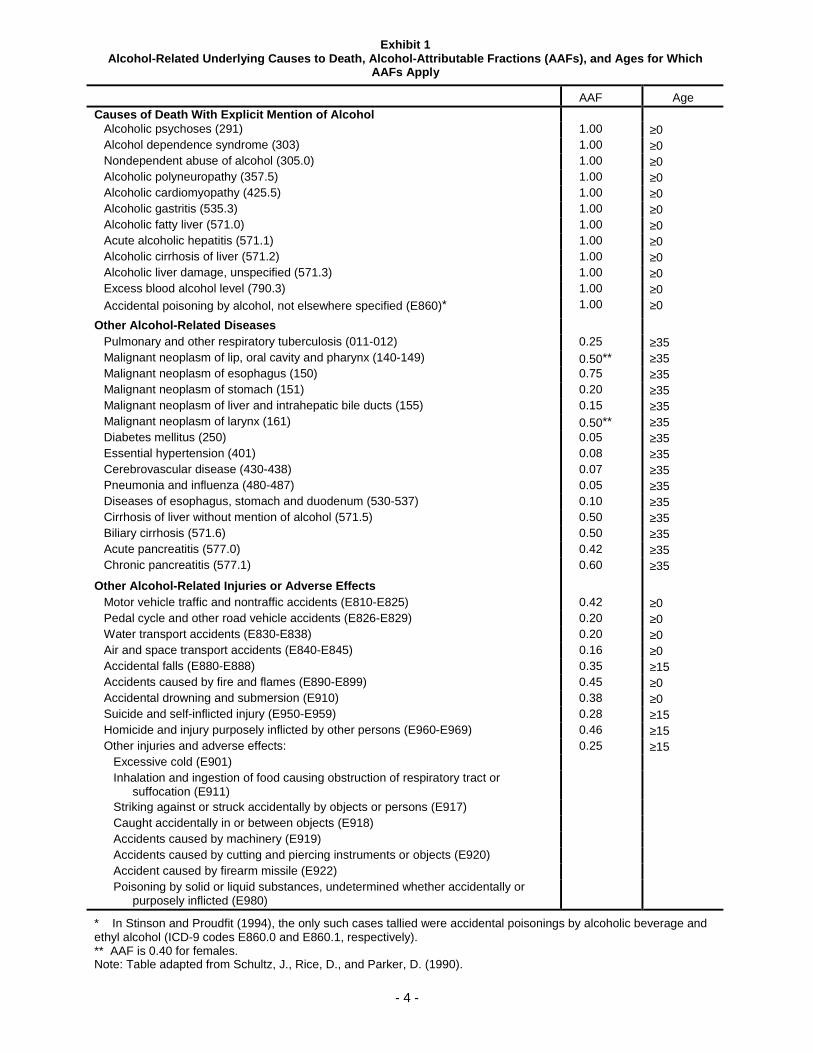
Exhibit 1 on the following page shows three categories of causes for deaths related to alcoholconsumption. For each cause of death, the exhibit includes an alcohol attributable fraction(AAF), a number representing the proportion of deaths for each cause that medical researchindicates can be attributed to excessive consumption of alcohol. Also shown in this exhibit is aspecification of the age of decedents whose deaths are considered to be related to alcohol. Thethree categories are described below:
• Causes of death with explicit mention of alcohol.—All causes of death in this category(including deaths from diseases and from injuries or adverse effects) mention alcohol andhave an AAF of 1.0. In other words, all deaths in this category are counted as alcohol-relateddeaths. As in Stinson and Proudfit (1994), this is the major modification of the definitionused by Schultz and colleagues (1990), which did not count deaths for causes with explicitmention of alcohol among decedents below the age of 15 years. This decision overlooked asmall number of alcohol poisoning deaths in young children. In this report, all deaths withAAFs of 1.0 were counted regardless of the age of the decedent. The definition also has beenextended by including all instances of accidental poisoning by any alcoholic substance, notjust alcoholic beverages or ethyl alcohol products.
• Other alcohol-related diseases.—Diseases in this category are counted only if the decedent is
at least 35 years old, because diseases related to alcohol only manifest themselves after somelifetime history of excessive alcohol consumption.
• Other alcohol-related injuries or adverse effects.—There are two age tests in this category.
Causes of death counted for all ages are generally those in which the decedent need not havebeen drinking (e.g., motor vehicle accidents or deaths from fire or flames). Other causes ofdeath (e.g., accidental falls or suicide) are counted only for decedents age 15 or older.
There are some limitations in the use of mortality as an indicator of alcohol problems. Althoughthe proportion of alcohol involvement in some causes of death may be high, the likelihood ofdying from one of these causes due to abuse of alcohol is small. Because alcohol abuse does notalways result in death, mortality rates do not necessarily reflect the prevalence of problemdrinking. In addition, variation in reporting practices regarding cause of death—particularlydeaths from socially disapproved medical conditions, such as those resulting from alcoholabuse—may introduce a bias toward underestimating the true incidence of alcohol-relatedmortality. Nevertheless, there is a legal requirement that each death be certified and reported to anational data system with reasonable consistency in data elements, definitions, and formats. Thisfact ensures a completeness and basic level of uniformity in mortality data that is not achieved inother statistical series providing State-level data relevant to alcohol problems.
- 4 -
Exhibit 1Alcohol-Related Underlying Causes to Death, Alcohol-Attributable Fractions (AAFs), and Ages for Which
AAFs Apply
AAF AgeCauses of Death With Explicit Mention of Alcohol
Alcoholic psychoses (291) 1.00 ≥0Alcohol dependence syndrome (303) 1.00 ≥0Nondependent abuse of alcohol (305.0) 1.00 ≥0Alcoholic polyneuropathy (357.5) 1.00 ≥0Alcoholic cardiomyopathy (425.5) 1.00 ≥0Alcoholic gastritis (535.3) 1.00 ≥0Alcoholic fatty liver (571.0) 1.00 ≥0Acute alcoholic hepatitis (571.1) 1.00 ≥0Alcoholic cirrhosis of liver (571.2) 1.00 ≥0Alcoholic liver damage, unspecified (571.3) 1.00 ≥0Excess blood alcohol level (790.3) 1.00 ≥0Accidental poisoning by alcohol, not elsewhere specified (E860)* 1.00 ≥0
Other Alcohol-Related DiseasesPulmonary and other respiratory tuberculosis (011-012) 0.25 ≥35Malignant neoplasm of lip, oral cavity and pharynx (140-149) 0.50** ≥35Malignant neoplasm of esophagus (150) 0.75 ≥35Malignant neoplasm of stomach (151) 0.20 ≥35Malignant neoplasm of liver and intrahepatic bile ducts (155) 0.15 ≥35Malignant neoplasm of larynx (161) 0.50** ≥35Diabetes mellitus (250) 0.05 ≥35Essential hypertension (401) 0.08 ≥35Cerebrovascular disease (430-438) 0.07 ≥35Pneumonia and influenza (480-487) 0.05 ≥35Diseases of esophagus, stomach and duodenum (530-537) 0.10 ≥35Cirrhosis of liver without mention of alcohol (571.5) 0.50 ≥35Biliary cirrhosis (571.6) 0.50 ≥35Acute pancreatitis (577.0) 0.42 ≥35Chronic pancreatitis (577.1) 0.60 ≥35
Other Alcohol-Related Injuries or Adverse EffectsMotor vehicle traffic and nontraffic accidents (E810-E825) 0.42 ≥0Pedal cycle and other road vehicle accidents (E826-E829) 0.20 ≥0Water transport accidents (E830-E838) 0.20 ≥0Air and space transport accidents (E840-E845) 0.16 ≥0Accidental falls (E880-E888) 0.35 ≥15Accidents caused by fire and flames (E890-E899) 0.45 ≥0Accidental drowning and submersion (E910) 0.38 ≥0Suicide and self-inflicted injury (E950-E959) 0.28 ≥15Homicide and injury purposely inflicted by other persons (E960-E969) 0.46 ≥15Other injuries and adverse effects: 0.25 ≥15
Excessive cold (E901)Inhalation and ingestion of food causing obstruction of respiratory tract or
suffocation (E911)Striking against or struck accidentally by objects or persons (E917)Caught accidentally in or between objects (E918)Accidents caused by machinery (E919)Accidents caused by cutting and piercing instruments or objects (E920)Accident caused by firearm missile (E922)Poisoning by solid or liquid substances, undetermined whether accidentally or
purposely inflicted (E980)
* In Stinson and Proudfit (1994), the only such cases tallied were accidental poisonings by alcoholic beverage andethyl alcohol (ICD-9 codes E860.0 and E860.1, respectively).** AAF is 0.40 for females.Note: Table adapted from Schultz, J., Rice, D., and Parker, D. (1990).

- 5 -
The data reported in this manual are population-based mortality rates. Variability in number ofdeaths from a given cause may be due in large part to the population size for the area. One wouldexpect more deaths in States with larger populations and fewer deaths in States with smallerpopulations. The procedure of counting all deaths from a given cause group, dividing it by thepopulation, and multiplying the result by a standardizing factor such as 100,000 yields an easilyinterpretable statistic that eliminates the “noise” created by variations in population size. Thisallows comparison of death rates between States, whether large or small.
In States such as Alaska with small populations or relatively few deaths for the three deathcategories, year-to-year variations can be considerable. This can be further confounded by thesporadic occurrence of a rare event, such as death by alcohol poisoning in a sparsely populatedState. For this reason, such State data should be interpreted cautiously.
1.3 Specific Alcohol-Related Mortality
This document also provides measures of several specific alcohol-related causes of death,including cirrhosis, nondependent alcohol abuse, alcohol dependence syndrome, accidentalpoisoning, and alcoholic psychoses. These measures provide planners and researchers withmeasures of alcohol-related mortality related to very heavy and/or prolonged use of alcohol. Theyare also less subject to revision than measures in the “other alcohol-related diseases” or “otheralcohol-related injuries or adverse effects” categories, for which AAFs between 0 and 1 areassigned based on the best current medical evidence.
The measures of cirrhosis mortality reported separately in this document include some causes ofdeath not included as a component of overall alcohol-related mortality measures described above.Exhibit 2 shows the underlying causes of deaths for the three kinds of cirrhosis mortalitymeasured in this document: alcoholic liver cirrhosis, other specified liver cirrhosis withoutmention of alcohol, and unspecified liver cirrhosis without mention of alcohol. These threecause-of-death groups were the only ones distinguished under the older ICDA-8 reporting systemand are used in this manual to provide consistency with other NIAAA reports on cirrhosismortality (Grant, 1985; Dufour et al., 1993; Debakey et al., 1996).
While all causes of death comprising alcoholic liver cirrhosis are counted as explicit alcohol-related mortality, both of the “liver cirrhosis without mention of alcohol” categories includecauses of death ignored in the alcohol-related mortality measures described above: (1) Chronichepatitis, other chronic nonalcoholic liver disease, and portal hypertension are counted as“specified liver cirrhosis without mention of alcohol” and (2) unspecified chronic liver diseasewithout mention of alcohol (ICD-9 code 571.9) is added as a cause of death to the category thatshares its name.

- 6 -
1.4 Data Sources and Calculations
Data presented in this manual include population-based mortality rates (both unadjusted and age-adjusted) at the national and State levels for all alcohol-related mortality and for the threesubclassifications of alcohol deaths described above. Details of data sources and calculations aredescribed below.
1.4.1 Mortality Data
The National Center for Health Statistics (NCHS) is the source of mortality data. In all cases, thedata for a given State represent deaths of residents of that State. Persons who die from analcohol-related disease or injury may have died in a State other than that in which they resided,but the place of death does not necessarily reflect the place in which a decedent’s history ofalcohol abuse occurred. For this reason, place of residence and not place of death is the mostappropriate manner of locating alcohol-related mortality for the identification of geographic areasin need of programs to address alcohol abuse. Deaths of nonresidents of the United States areexcluded.
Based on the combination of all contributory causes listed on the death certificate, NCHS assignsa single underlying cause for each death. The underlying cause of death is defined as “the diseaseor injury which initiated the train of morbid events leading directly or indirectly to death or thecircumstances of the accident or violence which produced the fatal injury” (NCHS, 1982, p. 4).Deaths were counted as alcohol related by applying the AAF proportions shown in Exhibit 1 tothe causes of death and age groups also listed in the exhibit. For example, 75 percent of deaths
Exhibit 2
Crosswalk of ICD-9 Codes to ICDA-8 Codes for Liver Cirrhosis Mortality
ICD-9 ICDA-8
571.0 Alcoholic fatty liver 571.0 Alcoholic liver cirrhosis571.1 Acute alcoholic hepatitis571.2 Alcoholic cirrhosis of the liver571.3 Alcoholic liver damage, unspecified
571.4 Chronic hepatitis* 571.8 Other specified liver cirrhosis without571.6 Biliary cirrhosis mention of alcohol571.8 Other chronic nonalcoholic liver disease*572.3 Portal hypertension*
571.5 Cirrhosis of the liver without mention of alcohol 571.9 Unspecified liver cirrhosis without mention571.9 Unspecified chronic liver disease without mention
of alcohol*of alcohol
* Not included as a cause of death for total alcohol-related mortality measures (see Exhibit 1).Source: Adapted from Colliver et al. (1984).

- 7 -
from malignant neoplasms of the esophagus among decedents at least 35 years old wereconsidered to be alcohol related.
1.4.2 Population Data
The population figures used in the calculation of mortality rates include individuals from all agegroups. The 1979 data are from special intercensal estimates developed by the Bureau of theCensus for the National Cancer Institute. The 1981 to 1989 population data are from recentlyreleased revised intercensal estimates, while the 1991 to 1992 population data are frompreliminary intercensal estimates developed by the same agencies. The 1980 and 1990 populationdata come from the census figures for those years.
1.4.3 Mortality Rates
This manual presents two different types of mortality rates, as described below:
• Unadjusted (or crude) rates.—These rates are calculated by dividing the number of deaths bythe size of the population in the group under study. For example, the number of U.S. deathsfrom causes with explicit mention of alcohol in 1990 was 19,672. When this number isdivided by the U.S. population in 1990 (249,399,347), the result is a rate that equals0.000079 deaths for each person in Census Bureau estimates of the U.S. population. Numberswith so many zeros between the decimal point and the significant digits are difficult tounderstand. For this reason, mortality rates usually are expressed as rates per 100,000population and calculated by multiplying the rate by 100,000. This makes the example rate(7.9 deaths per 100,000 population) a number that is easier to comprehend and compare withother rates.
Unadjusted rates show the true mortality experience for the group under study and areappropriate for assessing the actual incidence of mortality in any population under study. Forthis reason, unadjusted rates are provided for use in decisions about allocation of resources toaddress alcohol problems. However, unadjusted death rates should be interpreted withcaution, particularly when comparing places with varying population age distributions.Therefore, this manual also provides age-adjusted death rates.
• Age-adjusted rates.—In addition to variation in the size of State populations, wide variabilityin age distributions exists within these populations. For instance, the State of Arizona has alarge proportion of elderly people compared to other States with larger proportions ofrelatively young workers and their families. In general, elderly persons are more likely to diethan young persons. Therefore, one would observe a larger number of deaths occurring inplaces with relatively more elderly people than in places with relatively more young people,even if the two places were of similar population size. For comparing groups with differingage structures and population sizes, age-adjusted mortality rates are necessary. The observedmortality patterns within an area are standardized, using the population distribution acrossage groups found in a reference (standard) population. Following convention, the agedistribution of the U.S. population in 1940 is used as the standard for this manual. Thus, in

- 8 -
comparing two States that differ in age structure, the age-adjusted mortality rate provides apicture of what the States’ respective rates would have been had the age distributions of theirpopulations been the same as that of the United States in 1940.
Age-adjusted rates eliminate the confounding effect of different age distributions on mortalityrates. For this reason, age-adjusted rates are the preferred indicators of mortality experiencefor research in which the influences of factors other than age are of interest. In general,mortality rates for an area with a population that is older than the standard population becomelower with age adjustment, while the opposite is true for areas with a younger population.Because the recent U.S. population tends to be older than the 1940 U.S. population, themajority of States in this manual have lower age-adjusted rates than their respectiveunadjusted rates. Age-adjusted rates are shown in both Table 1 and Table 2.
Calculations of age-adjusted mortality rates are sensitive to the particular aggregation of ageclasses in the 1940 U.S. census used as a standard for comparison. For this manual, thestandard population used for calculating age-adjusted rates was aggregated as follows:
Age group Number0 to 14 years 250,416
15 to 24 years 181,67725 to 34 years 162,06635 to 44 years 139,23745 to 54 years 117,81155 to 64 years 80,29465 to 74 years 48,42675 to 84 years 17,303
85+ years 2,770All ages 1,000,000
This aggregation distinguishes those older than age 14 and those older than age 34 from youngerpersons, allowing the calculation of age-adjusted death rates for mortality defined to be age-dependent at these years, such as the alcohol-related disease and injury mortality rates defined inExhibit 1. The 10-year intervals employed here are the same as those used by many other workerscited above, including Savage et al. (1994) and Caces et al. (1991).
The same aggregation was used for all age-adjusted mortality rate calculations reported in thisdocument.
- 9 -
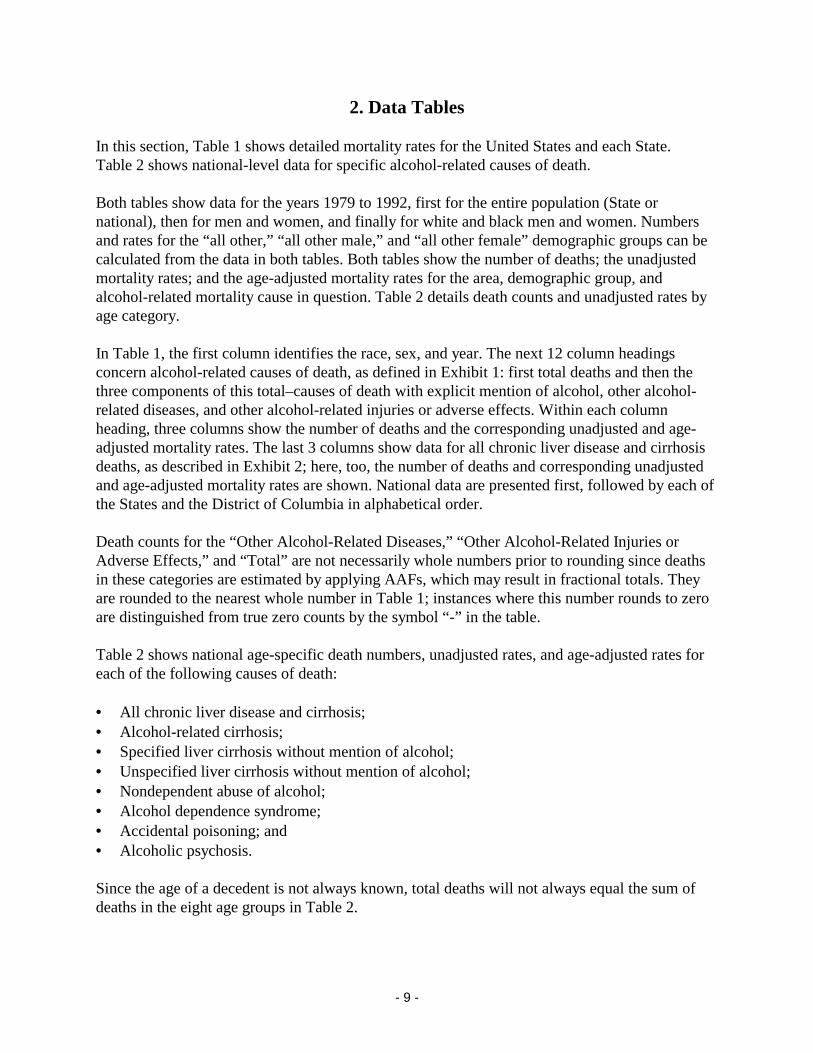
2. Data Tables
In this section, Table 1 shows detailed mortality rates for the United States and each State.Table 2 shows national-level data for specific alcohol-related causes of death.
Both tables show data for the years 1979 to 1992, first for the entire population (State ornational), then for men and women, and finally for white and black men and women. Numbersand rates for the “all other,” “all other male,” and “all other female” demographic groups can becalculated from the data in both tables. Both tables show the number of deaths; the unadjustedmortality rates; and the age-adjusted mortality rates for the area, demographic group, andalcohol-related mortality cause in question. Table 2 details death counts and unadjusted rates byage category.
In Table 1, the first column identifies the race, sex, and year. The next 12 column headingsconcern alcohol-related causes of death, as defined in Exhibit 1: first total deaths and then thethree components of this total–causes of death with explicit mention of alcohol, other alcohol-related diseases, and other alcohol-related injuries or adverse effects. Within each columnheading, three columns show the number of deaths and the corresponding unadjusted and age-adjusted mortality rates. The last 3 columns show data for all chronic liver disease and cirrhosisdeaths, as described in Exhibit 2; here, too, the number of deaths and corresponding unadjustedand age-adjusted mortality rates are shown. National data are presented first, followed by each ofthe States and the District of Columbia in alphabetical order.
Death counts for the “Other Alcohol-Related Diseases,” “Other Alcohol-Related Injuries orAdverse Effects,” and “Total” are not necessarily whole numbers prior to rounding since deathsin these categories are estimated by applying AAFs, which may result in fractional totals. Theyare rounded to the nearest whole number in Table 1; instances where this number rounds to zeroare distinguished from true zero counts by the symbol “-” in the table.
Table 2 shows national age-specific death numbers, unadjusted rates, and age-adjusted rates foreach of the following causes of death:
• All chronic liver disease and cirrhosis;• Alcohol-related cirrhosis;• Specified liver cirrhosis without mention of alcohol;• Unspecified liver cirrhosis without mention of alcohol;• Nondependent abuse of alcohol;• Alcohol dependence syndrome;• Accidental poisoning; and• Alcoholic psychosis.
Since the age of a decedent is not always known, total deaths will not always equal the sum ofdeaths in the eight age groups in Table 2.

Table 1. Number of deaths and unadjusted and age-adjusted death rates per 100,000 population for different categories of alcohol-related mortality byState: United States, 1979–92.
United States
Race, sex,and year
All Alcohol-Related Causes of DeathAll Chronic Liver Disease and
CirrhosisTotal Causes of Death with ExplicitMention of Alcohol
Other Alcohol-Related Diseases Other Alcohol-Related Injuries orAdverse Effects
Number Unadj.Rate
Age-Adj.Rate Number Unadj.
RateAge-Adj.
Rate Number Unadj.Rate
Age-Adj.Rate Number Unadj.
RateAge-Adj.
Rate Number Unadj.Rate
Age-Adj.Rate
All races, both sexes1992 .......................... 107,440 42.1 33.6 19,505 7.6 6.8 42,070 16.5 10.0 45,866 18.0 16.8 25,407 10.0 8.11991 .......................... 108,838 43.2 34.7 19,141 7.6 6.8 41,998 16.7 10.2 47,699 18.9 17.8 25,562 10.1 8.31990 .......................... 109,751 44.0 35.5 19,672 7.9 7.2 41,738 16.7 10.3 48,342 19.4 18.1 25,920 10.4 8.61989 .......................... 109,398 44.3 35.8 19,731 8.0 7.3 41,680 16.9 10.5 47,986 19.4 18.1 26,823 10.9 9.11988 .......................... 108,705 44.5 36.0 18,805 7.7 7.1 41,426 16.9 10.6 48,474 19.8 18.4 26,572 10.9 9.21987 .......................... 105,891 43.7 35.6 17,746 7.3 6.8 40,521 16.7 10.6 47,624 19.7 18.2 26,351 10.9 9.21986 .......................... 105,792 44.1 36.0 17,367 7.2 6.7 40,524 16.9 10.8 47,901 19.9 18.6 26,310 11.0 9.3
1985 .......................... 104,236 43.8 35.9 17,680 7.4 6.9 40,456 17.0 10.9 46,099 19.4 18.0 26,927 11.3 9.71984 .......................... 103,945 44.1 36.3 17,528 7.4 6.9 40,329 17.1 11.2 46,088 19.5 18.2 27,468 11.6 10.11983 .......................... 103,247 44.2 36.6 17,323 7.4 7.0 40,134 17.2 11.4 45,789 19.6 18.2 27,414 11.7 10.31982 .......................... 104,702 45.2 37.8 17,455 7.5 7.1 39,864 17.2 11.5 47,384 20.5 19.2 27,838 12.0 10.61981 .......................... 109,918 47.9 40.5 18,553 8.1 7.7 40,743 17.8 12.0 50,622 22.1 20.7 29,451 12.8 11.51980 .......................... 112,933 49.7 42.3 19,681 8.7 8.3 41,142 18.1 12.3 52,111 22.9 21.6 30,730 13.5 12.21979 .......................... 110,660 49.3 42.2 18,870 8.4 8.1 40,186 17.9 12.4 51,604 23.0 21.7 29,851 13.3 12.1
All races, male1992 .......................... 71,727 57.6 50.9 14,873 11.9 11.0 23,842 19.2 14.2 33,012 26.5 25.6 16,572 13.3 11.71991 .......................... 72,506 59.0 52.4 14,397 11.7 10.8 23,716 19.3 14.5 34,392 28.0 27.0 16,342 13.3 11.81990 .......................... 73,275 60.3 53.6 14,779 12.2 11.4 23,580 19.4 14.7 34,915 28.7 27.6 16,695 13.7 12.31989 .......................... 72,708 60.5 53.8 14,902 12.4 11.6 23,519 19.6 14.9 34,288 28.5 27.2 17,397 14.5 13.01988 .......................... 72,349 60.8 54.1 14,156 11.9 11.2 23,511 19.7 15.2 34,681 29.1 27.7 17,297 14.5 13.21987 .......................... 70,507 59.8 53.4 13,401 11.4 10.8 23,013 19.5 15.1 34,093 28.9 27.5 17,147 14.5 13.31986 .......................... 70,520 60.3 54.1 12,943 11.1 10.6 22,953 19.6 15.3 34,625 29.6 28.2 16,886 14.4 13.2
1985 .......................... 69,239 59.8 53.7 13,168 11.4 10.9 22,978 19.9 15.6 33,093 28.6 27.2 17,345 15.0 13.81984 .......................... 69,075 60.2 54.3 12,933 11.3 10.9 23,031 20.1 15.9 33,111 28.9 27.5 17,662 15.4 14.31983 .......................... 68,849 60.6 54.8 12,753 11.2 10.9 23,035 20.3 16.1 33,061 29.1 27.8 17,628 15.5 14.51982 .......................... 70,171 62.3 56.8 12,844 11.4 11.1 22,886 20.3 16.3 34,441 30.6 29.4 18,004 16.0 15.01981 .......................... 73,869 66.2 60.8 13,516 12.1 11.9 23,426 21.0 17.0 36,927 33.1 31.9 18,978 17.0 16.11980 .......................... 76,079 68.9 63.6 14,374 13.0 12.9 23,604 21.4 17.4 38,101 34.5 33.3 19,866 18.0 17.21979 .......................... 74,551 68.3 63.3 13,719 12.6 12.5 23,298 21.3 17.5 37,534 34.4 33.3 19,455 17.8 17.1
All races, female1992 .......................... 35,713 27.3 17.8 4,632 3.5 3.1 18,228 14.0 6.5 12,854 9.8 8.3 8,835 6.8 4.91991 .......................... 36,332 28.1 18.6 4,744 3.7 3.2 18,282 14.2 6.7 13,307 10.3 8.8 9,220 7.1 5.21990 .......................... 36,477 28.5 19.0 4,893 3.8 3.4 18,158 14.2 6.7 13,426 10.5 8.9 9,225 7.2 5.31989 .......................... 36,689 29.0 19.5 4,829 3.8 3.4 18,162 14.4 6.8 13,699 10.8 9.3 9,426 7.4 5.61988 .......................... 36,357 29.0 19.6 4,649 3.7 3.3 17,915 14.3 6.9 13,793 11.0 9.4 9,275 7.4 5.61987 .......................... 35,384 28.5 19.5 4,345 3.5 3.2 17,508 14.1 6.9 13,531 10.9 9.4 9,204 7.4 5.71986 .......................... 35,271 28.6 19.7 4,424 3.6 3.2 17,571 14.3 7.2 13,276 10.8 9.3 9,424 7.6 6.0
- 10 -

Table 1. Number of deaths and unadjusted and age-adjusted death rates per 100,000 population for different categories of alcohol-related mortality byState: United States, 1979–92.
United States
Race, sex,and year
All Alcohol-Related Causes of DeathAll Chronic Liver Disease and
CirrhosisTotal Causes of Death with ExplicitMention of Alcohol
Other Alcohol-Related Diseases Other Alcohol-Related Injuries orAdverse Effects
Number Unadj.Rate
Age-Adj.Rate Number Unadj.
RateAge-Adj.
Rate Number Unadj.Rate
Age-Adj.Rate Number Unadj.
RateAge-Adj.
Rate Number Unadj.Rate
Age-Adj.Rate
All races, female
1985 .......................... 34,997 28.6 19.8 4,512 3.7 3.4 17,478 14.3 7.2 13,007 10.6 9.1 9,582 7.8 6.21984 .......................... 34,870 28.8 20.1 4,595 3.8 3.5 17,298 14.3 7.4 12,976 10.7 9.2 9,806 8.1 6.41983 .......................... 34,397 28.6 20.2 4,570 3.8 3.5 17,099 14.2 7.5 12,728 10.6 9.1 9,786 8.1 6.61982 .......................... 34,531 29.0 20.7 4,611 3.9 3.6 16,978 14.3 7.7 12,942 10.9 9.5 9,834 8.3 6.71981 .......................... 36,049 30.6 22.2 5,037 4.3 4.0 17,317 14.7 8.0 13,694 11.6 10.1 10,473 8.9 7.41980 .......................... 36,854 31.5 23.1 5,307 4.5 4.3 17,537 15.0 8.3 14,010 12.0 10.5 10,864 9.3 7.91979 .......................... 36,109 31.3 23.2 5,151 4.5 4.3 16,888 14.6 8.2 14,070 12.2 10.7 10,396 9.0 7.8
White, male1992 .......................... 56,104 53.7 45.1 11,662 11.2 9.8 19,741 18.9 12.9 24,701 23.7 22.3 13,978 13.4 11.11991 .......................... 56,494 54.6 46.2 11,231 10.9 9.6 19,600 19.0 13.1 25,663 24.8 23.5 13,850 13.4 11.21990 .......................... 57,126 55.8 47.4 11,289 11.0 9.8 19,447 19.0 13.2 26,390 25.8 24.3 13,950 13.6 11.51989 .......................... 56,720 55.9 47.5 11,264 11.1 9.9 19,313 19.0 13.4 26,143 25.7 24.2 14,492 14.3 12.21988 .......................... 56,779 56.3 48.1 10,643 10.6 9.5 19,372 19.2 13.7 26,765 26.6 25.0 14,471 14.4 12.31987 .......................... 55,903 55.9 47.9 10,128 10.1 9.2 19,086 19.1 13.7 26,688 26.7 25.0 14,259 14.2 12.31986 .......................... 55,994 56.3 48.6 9,832 9.9 9.0 18,934 19.1 13.8 27,228 27.4 25.8 14,174 14.3 12.4
1985 .......................... 55,256 56.0 48.3 9,885 10.0 9.2 19,020 19.3 14.1 26,351 26.7 25.1 14,402 14.6 12.81984 .......................... 55,455 56.6 49.1 9,938 10.1 9.3 18,991 19.4 14.3 26,527 27.1 25.5 14,874 15.2 13.31983 .......................... 55,308 56.8 49.5 9,819 10.1 9.3 19,106 19.6 14.6 26,383 27.1 25.6 14,910 15.3 13.61982 .......................... 56,394 58.4 51.3 9,995 10.3 9.6 19,022 19.7 14.8 27,377 28.3 26.9 15,323 15.9 14.21981 .......................... 59,217 61.8 54.6 10,374 10.8 10.1 19,469 20.3 15.4 29,374 30.6 29.1 15,946 16.6 14.91980 .......................... 60,779 63.9 56.8 10,885 11.4 10.8 19,575 20.6 15.7 30,319 31.9 30.3 16,492 17.3 15.71979 .......................... 59,813 63.3 56.6 10,465 11.1 10.5 19,391 20.5 15.9 29,957 31.7 30.2 16,178 17.1 15.6
Black, male1992 .......................... 13,748 92.1 100.6 2,789 18.7 22.3 3,586 24.0 27.8 7,373 49.4 50.5 2,197 14.7 17.41991 .......................... 14,237 97.2 105.8 2,803 19.1 22.9 3,654 24.9 29.0 7,780 53.1 53.9 2,148 14.7 17.61990 .......................... 14,347 99.2 108.5 3,156 21.8 26.3 3,639 25.2 29.3 7,551 52.2 52.9 2,400 16.6 20.01989 .......................... 14,258 100.0 109.9 3,249 22.8 27.6 3,760 26.4 30.8 7,249 50.8 51.5 2,524 17.7 21.21988 .......................... 13,926 99.1 108.9 3,150 22.4 27.3 3,739 26.6 31.0 7,037 50.1 50.6 2,485 17.7 21.41987 .......................... 13,115 94.6 104.3 3,013 21.7 26.5 3,539 25.5 29.7 6,563 47.3 48.1 2,584 18.6 22.61986 .......................... 13,068 95.5 105.5 2,851 20.8 25.4 3,667 26.8 31.2 6,550 47.9 48.8 2,416 17.6 21.4
1985 .......................... 12,598 93.3 104.6 3,020 22.4 27.6 3,602 26.7 31.2 5,975 44.2 45.8 2,636 19.5 24.01984 .......................... 12,277 92.1 103.6 2,697 20.2 25.2 3,704 27.8 32.5 5,875 44.1 45.8 2,468 18.5 22.91983 .......................... 12,225 92.8 104.9 2,654 20.2 25.2 3,619 27.5 32.3 5,952 45.2 47.4 2,440 18.5 23.21982 .......................... 12,503 96.2 109.0 2,561 19.7 25.0 3,567 27.4 32.2 6,375 49.0 51.8 2,420 18.6 23.51981 .......................... 13,376 104.3 119.2 2,844 22.2 28.4 3,666 28.6 33.7 6,866 53.5 57.1 2,746 21.4 27.3
- 11 -

Table 1. Number of deaths and unadjusted and age-adjusted death rates per 100,000 population for different categories of alcohol-related mortality byState: United States, 1979–92.
United States
Race, sex,and year
All Alcohol-Related Causes of DeathAll Chronic Liver Disease and
CirrhosisTotal Causes of Death with ExplicitMention of Alcohol
Other Alcohol-Related Diseases Other Alcohol-Related Injuries orAdverse Effects
Number Unadj.Rate
Age-Adj.Rate Number Unadj.
RateAge-Adj.
Rate Number Unadj.Rate
Age-Adj.Rate Number Unadj.
RateAge-Adj.
Rate Number Unadj.Rate
Age-Adj.Rate
Black, male1980 .......................... 13,941 110.2 126.5 3,151 24.9 32.0 3,737 29.5 34.7 7,053 55.7 59.8 3,031 24.0 30.51979 .......................... 13,453 109.2 126.1 2,935 23.8 30.6 3,642 29.6 34.7 6,876 55.8 60.8 2,964 24.1 30.8
White, female1992 .......................... 29,470 27.1 16.3 3,437 3.2 2.6 15,603 14.4 5.9 10,430 9.6 7.8 7,427 6.8 4.61991 .......................... 30,001 27.8 17.1 3,521 3.3 2.7 15,645 14.5 6.1 10,836 10.1 8.3 7,646 7.1 4.81990 .......................... 30,073 28.2 17.4 3,553 3.3 2.8 15,547 14.6 6.1 10,974 10.3 8.5 7,621 7.1 4.91989 .......................... 30,329 28.6 17.9 3,508 3.3 2.8 15,598 14.7 6.3 11,223 10.6 8.8 7,835 7.4 5.11988 .......................... 30,129 28.6 18.0 3,344 3.2 2.7 15,439 14.7 6.3 11,347 10.8 9.0 7,600 7.2 5.11987 .......................... 29,481 28.2 18.0 3,179 3.0 2.6 15,075 14.4 6.4 11,227 10.7 9.0 7,642 7.3 5.21986 .......................... 29,505 28.4 18.3 3,322 3.2 2.7 15,151 14.6 6.6 11,032 10.6 8.9 7,869 7.6 5.5
1985 .......................... 29,247 28.3 18.3 3,282 3.2 2.8 15,076 14.6 6.7 10,889 10.5 8.8 7,922 7.7 5.61984 .......................... 29,285 28.5 18.7 3,384 3.3 2.9 14,956 14.6 6.8 10,945 10.7 9.0 8,169 8.0 5.91983 .......................... 28,860 28.3 18.6 3,417 3.3 2.9 14,783 14.5 6.9 10,660 10.4 8.8 8,146 8.0 6.01982 .......................... 29,058 28.6 19.2 3,463 3.4 3.0 14,714 14.5 7.1 10,881 10.7 9.1 8,210 8.1 6.21981 .......................... 30,269 30.0 20.5 3,742 3.7 3.3 14,971 14.9 7.4 11,556 11.5 9.8 8,648 8.6 6.71980 .......................... 30,845 30.8 21.2 3,871 3.9 3.5 15,167 15.2 7.6 11,808 11.8 10.1 8,876 8.9 7.11979 .......................... 30,337 30.6 21.4 3,811 3.8 3.5 14,681 14.8 7.7 11,845 11.9 10.2 8,574 8.6 7.0
Black, female1992 .......................... 5,306 32.0 29.1 1,004 6.1 6.3 2,289 13.8 11.1 2,013 12.2 11.7 1,140 6.9 6.91991 .......................... 5,468 33.6 30.6 1,065 6.5 6.8 2,327 14.3 11.6 2,076 12.7 12.2 1,336 8.2 8.31990 .......................... 5,542 34.4 31.6 1,161 7.2 7.7 2,319 14.4 11.8 2,062 12.8 12.2 1,363 8.5 8.71989 .......................... 5,519 34.7 32.0 1,133 7.1 7.7 2,296 14.5 11.8 2,090 13.2 12.5 1,337 8.4 8.81988 .......................... 5,424 34.6 32.1 1,128 7.2 7.8 2,216 14.1 11.7 2,079 13.3 12.7 1,431 9.1 9.51987 .......................... 5,184 33.5 31.4 1,024 6.6 7.3 2,198 14.2 12.0 1,962 12.7 12.2 1,345 8.7 9.21986 .......................... 5,077 33.3 31.3 988 6.5 7.1 2,192 14.4 12.2 1,897 12.4 12.0 1,347 8.8 9.5
1985 .......................... 5,061 33.6 31.8 1,083 7.2 8.0 2,179 14.5 12.4 1,798 11.9 11.5 1,446 9.6 10.21984 .......................... 4,946 33.2 31.8 1,064 7.2 7.9 2,140 14.4 12.6 1,742 11.7 11.3 1,446 9.7 10.51983 .......................... 4,948 33.7 32.7 1,032 7.0 8.0 2,127 14.5 12.9 1,788 12.2 11.8 1,460 9.9 10.91982 .......................... 4,880 33.6 32.9 1,027 7.1 8.1 2,078 14.3 12.9 1,774 12.2 11.9 1,441 9.9 11.01981 .......................... 5,150 36.0 35.8 1,138 8.0 9.3 2,173 15.2 13.9 1,839 12.9 12.6 1,616 11.3 12.71980 .......................... 5,385 38.1 38.4 1,279 9.1 10.6 2,203 15.6 14.4 1,903 13.5 13.4 1,776 12.6 14.31979 .......................... 5,196 37.8 38.0 1,177 8.6 10.1 2,064 15.0 13.8 1,955 14.2 14.1 1,619 11.8 13.5
- 12 -

Table 1. Number of deaths and unadjusted and age-adjusted death rates per 100,000 population for different categories of alcohol-related mortality byState: United States, 1979–92.
Alabama
Race, sex,and year
All Alcohol-Related Causes of DeathAll Chronic Liver Disease and
CirrhosisTotal Causes of Death with ExplicitMention of Alcohol
Other Alcohol-Related Diseases Other Alcohol-Related Injuries orAdverse Effects
Number Unadj.Rate
Age-Adj.Rate Number Unadj.
RateAge-Adj.
Rate Number Unadj.Rate
Age-Adj.Rate Number Unadj.
RateAge-Adj.
Rate Number Unadj.Rate
Age-Adj.Rate
All races, both sexes1992 .......................... 1,997 48.3 39.4 262 6.3 5.8 696 16.8 10.1 1,039 25.1 23.6 383 9.3 7.51991 .......................... 2,079 50.8 41.7 239 5.8 5.3 718 17.6 10.5 1,122 27.4 25.8 373 9.1 7.41990 .......................... 2,212 54.6 44.9 318 7.9 7.2 757 18.7 11.5 1,137 28.1 26.2 434 10.7 8.61989 .......................... 2,036 50.5 41.1 276 6.8 6.2 714 17.7 10.9 1,046 25.9 23.9 366 9.1 7.61988 .......................... 2,093 52.0 42.8 284 7.1 6.5 748 18.6 11.7 1,061 26.4 24.5 406 10.1 8.51987 .......................... 2,018 50.3 41.9 265 6.6 6.2 722 18.0 11.4 1,031 25.7 24.2 382 9.5 8.21986 .......................... 2,037 51.0 42.6 251 6.3 5.9 719 18.0 11.6 1,066 26.7 25.1 360 9.0 7.8
1985 .......................... 1,980 49.8 41.5 280 7.0 6.6 743 18.7 12.2 957 24.1 22.7 389 9.8 8.31984 .......................... 1,936 49.0 41.1 236 6.0 5.7 739 18.7 12.5 961 24.3 22.9 382 9.7 8.41983 .......................... 1,909 48.5 41.2 257 6.5 6.2 692 17.6 11.8 961 24.4 23.1 356 9.0 8.01982 .......................... 1,926 49.1 42.0 229 5.8 5.8 713 18.2 12.4 984 25.1 23.9 361 9.2 8.31981 .......................... 2,062 52.6 45.5 253 6.5 6.3 744 19.0 13.0 1,065 27.2 26.2 397 10.1 8.81980 .......................... 2,037 52.2 45.9 226 5.8 5.8 707 18.1 12.8 1,103 28.3 27.4 359 9.2 8.51979 .......................... 2,055 53.1 46.8 250 6.5 6.5 719 18.6 13.3 1,085 28.1 27.1 366 9.5 8.8
All races, male1992 .......................... 1,339 67.5 60.4 201 10.1 9.5 384 19.3 14.3 754 38.0 36.6 248 12.5 11.01991 .......................... 1,375 70.1 63.2 178 9.1 8.6 397 20.2 15.1 800 40.8 39.5 236 12.0 10.81990 .......................... 1,465 75.5 68.1 234 12.1 11.5 409 21.1 15.9 822 42.4 40.7 253 13.0 11.71989 .......................... 1,370 70.9 63.5 211 10.9 10.3 405 21.0 16.0 753 39.0 37.1 234 12.1 11.11988 .......................... 1,404 72.8 65.5 218 11.3 10.8 431 22.3 17.3 755 39.1 37.4 273 14.1 12.91987 .......................... 1,351 70.2 63.8 203 10.5 10.3 409 21.2 16.5 740 38.4 37.0 268 13.9 13.01986 .......................... 1,380 72.1 65.8 195 10.2 9.9 412 21.5 16.9 773 40.4 39.0 235 12.3 11.6
1985 .......................... 1,333 70.0 64.1 219 11.5 11.2 416 21.8 17.3 698 36.7 35.6 244 12.8 11.91984 .......................... 1,280 67.5 62.0 185 9.8 9.6 412 21.7 17.5 683 36.0 34.9 238 12.5 11.71983 .......................... 1,273 67.4 62.6 192 10.2 10.0 379 20.1 16.4 702 37.1 36.2 217 11.5 11.11982 .......................... 1,318 70.0 65.7 179 9.5 9.8 399 21.2 17.4 741 39.3 38.5 228 12.1 11.81981 .......................... 1,396 74.2 70.1 187 9.9 10.0 420 22.3 18.4 789 41.9 41.7 256 13.6 12.71980 .......................... 1,393 74.4 71.2 164 8.8 9.0 401 21.4 18.1 829 44.2 44.1 235 12.5 12.41979 .......................... 1,404 75.5 72.3 187 10.1 10.3 401 21.6 18.5 815 43.9 43.5 227 12.2 12.1
All races, female1992 .......................... 658 30.6 20.7 61 2.8 2.5 313 14.5 6.7 285 13.2 11.5 135 6.3 4.51991 .......................... 704 33.1 22.5 61 2.9 2.5 322 15.1 6.9 322 15.1 13.1 137 6.4 4.41990 .......................... 747 35.4 24.4 84 4.0 3.5 348 16.5 8.0 315 14.9 12.9 181 8.6 6.01989 .......................... 666 31.8 21.4 65 3.1 2.7 309 14.7 6.9 292 13.9 11.8 132 6.3 4.51988 .......................... 688 32.9 22.8 66 3.2 2.8 316 15.1 7.4 306 14.6 12.6 133 6.4 4.71987 .......................... 667 31.9 22.6 62 3.0 2.7 313 15.0 7.4 292 14.0 12.5 114 5.5 4.01986 .......................... 656 31.6 22.2 56 2.7 2.3 307 14.8 7.4 293 14.1 12.4 125 6.0 4.5
- 13 -

Table 1. Number of deaths and unadjusted and age-adjusted death rates per 100,000 population for different categories of alcohol-related mortality byState: United States, 1979–92.
Alabama
Race, sex,and year
All Alcohol-Related Causes of DeathAll Chronic Liver Disease and
CirrhosisTotal Causes of Death with ExplicitMention of Alcohol
Other Alcohol-Related Diseases Other Alcohol-Related Injuries orAdverse Effects
Number Unadj.Rate
Age-Adj.Rate Number Unadj.
RateAge-Adj.
Rate Number Unadj.Rate
Age-Adj.Rate Number Unadj.
RateAge-Adj.
Rate Number Unadj.Rate
Age-Adj.Rate
All races, female
1985 .......................... 647 31.3 21.7 61 3.0 2.8 327 15.8 8.1 258 12.5 10.8 145 7.0 5.21984 .......................... 656 31.9 22.8 51 2.5 2.3 327 15.9 8.6 278 13.5 11.8 144 7.0 5.61983 .......................... 637 31.1 22.3 65 3.2 3.0 313 15.3 8.2 259 12.7 11.1 139 6.8 5.31982 .......................... 608 29.8 21.1 50 2.4 2.3 315 15.4 8.4 243 11.9 10.4 133 6.5 5.31981 .......................... 666 32.7 23.8 66 3.2 3.1 324 15.9 8.7 275 13.5 12.0 141 6.9 5.51980 .......................... 643 31.8 23.6 62 3.1 3.0 307 15.1 8.6 275 13.6 12.0 124 6.1 5.21979 .......................... 651 32.4 24.4 63 3.1 3.2 318 15.8 9.1 270 13.4 12.1 139 6.9 6.0
White, male1992 .......................... 861 58.2 48.9 125 8.4 7.2 259 17.5 11.6 478 32.3 30.1 178 12.0 9.51991 .......................... 905 61.8 52.4 120 8.2 7.1 278 19.0 12.9 507 34.6 32.4 186 12.7 10.31990 .......................... 954 65.8 56.0 140 9.6 8.4 273 18.8 12.7 542 37.3 34.9 186 12.8 10.41989 .......................... 889 61.5 52.1 120 8.3 7.2 275 19.0 13.2 494 34.2 31.7 174 12.0 10.01988 .......................... 888 61.5 52.4 126 8.7 7.5 285 19.8 14.1 477 33.0 30.8 207 14.3 12.01987 .......................... 907 62.9 54.4 124 8.6 7.6 285 19.7 14.1 498 34.5 32.6 206 14.3 12.11986 .......................... 949 66.1 57.7 129 9.0 8.1 289 20.2 14.8 531 37.0 34.8 190 13.2 11.6
1985 .......................... 874 61.2 53.3 131 9.2 8.2 281 19.7 14.5 462 32.4 30.6 186 13.0 11.21984 .......................... 860 60.5 53.3 121 8.5 7.8 270 19.0 14.2 469 33.0 31.3 180 12.7 11.01983 .......................... 851 60.2 53.6 118 8.3 7.6 255 18.1 13.8 478 33.8 32.3 174 12.3 11.01982 .......................... 883 62.6 56.1 122 8.7 8.1 268 19.0 14.6 493 35.0 33.3 182 12.9 11.71981 .......................... 901 63.9 57.4 113 8.0 7.4 285 20.2 15.7 503 35.7 34.3 204 14.5 12.61980 .......................... 921 65.7 60.2 103 7.3 7.0 263 18.8 14.9 555 39.6 38.3 182 13.0 11.81979 .......................... 931 66.7 61.1 120 8.6 8.0 277 19.9 16.1 534 38.3 36.9 180 12.9 11.9
Black, male1992 .......................... 474 98.1 104.7 75 15.5 19.2 125 25.8 26.8 275 56.8 58.7 68 14.1 16.61991 .......................... 467 98.1 104.7 58 12.2 15.4 118 24.7 25.3 291 61.2 64.1 50 10.5 12.91990 .......................... 505 107.3 117.2 93 19.7 25.3 136 28.9 30.8 276 58.7 61.1 67 14.2 17.71989 .......................... 479 102.1 109.3 91 19.4 23.5 129 27.6 28.6 259 55.2 57.2 59 12.6 15.61988 .......................... 513 109.5 117.2 91 19.4 24.5 145 30.9 31.7 277 59.1 61.0 65 13.9 17.21987 .......................... 443 94.8 102.8 79 16.9 22.0 124 26.5 27.2 240 51.4 53.6 62 13.3 17.11986 .......................... 429 92.2 99.3 66 14.2 17.4 123 26.4 26.2 240 51.6 55.8 45 9.7 11.3
1985 .......................... 458 98.5 108.7 87 18.7 23.2 135 29.0 30.0 236 50.8 55.5 57 12.3 15.21984 .......................... 419 90.4 99.4 64 13.8 17.9 142 30.6 31.5 213 46.0 49.9 58 12.5 15.41983 .......................... 420 90.6 100.0 74 16.0 20.2 124 26.7 27.7 222 47.9 52.1 43 9.3 12.01982 .......................... 434 93.7 106.0 57 12.3 17.2 130 28.2 29.2 247 53.2 59.6 46 9.9 12.71981 .......................... 494 106.6 121.3 74 16.0 21.0 135 29.1 29.8 285 61.5 70.5 52 11.2 13.6
- 14 -
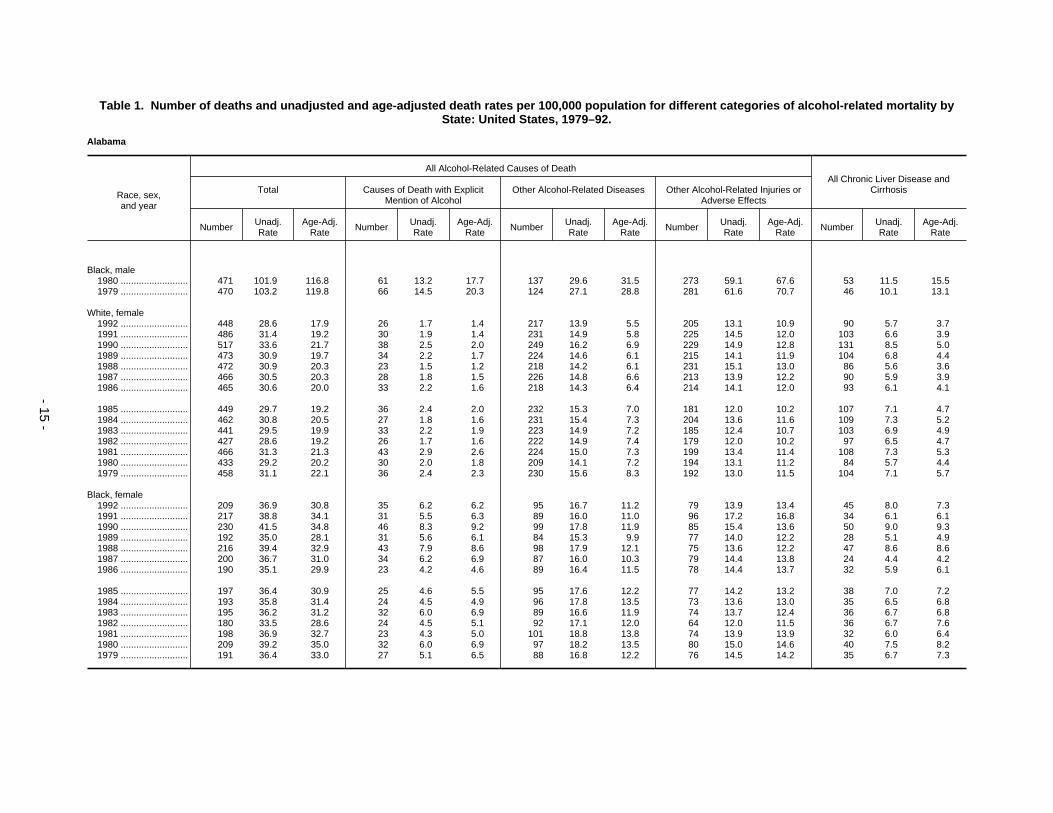
Table 1. Number of deaths and unadjusted and age-adjusted death rates per 100,000 population for different categories of alcohol-related mortality byState: United States, 1979–92.
Alabama
Race, sex,and year
All Alcohol-Related Causes of DeathAll Chronic Liver Disease and
CirrhosisTotal Causes of Death with ExplicitMention of Alcohol
Other Alcohol-Related Diseases Other Alcohol-Related Injuries orAdverse Effects
Number Unadj.Rate
Age-Adj.Rate Number Unadj.
RateAge-Adj.
Rate Number Unadj.Rate
Age-Adj.Rate Number Unadj.
RateAge-Adj.
Rate Number Unadj.Rate
Age-Adj.Rate
Black, male1980 .......................... 471 101.9 116.8 61 13.2 17.7 137 29.6 31.5 273 59.1 67.6 53 11.5 15.51979 .......................... 470 103.2 119.8 66 14.5 20.3 124 27.1 28.8 281 61.6 70.7 46 10.1 13.1
White, female1992 .......................... 448 28.6 17.9 26 1.7 1.4 217 13.9 5.5 205 13.1 10.9 90 5.7 3.71991 .......................... 486 31.4 19.2 30 1.9 1.4 231 14.9 5.8 225 14.5 12.0 103 6.6 3.91990 .......................... 517 33.6 21.7 38 2.5 2.0 249 16.2 6.9 229 14.9 12.8 131 8.5 5.01989 .......................... 473 30.9 19.7 34 2.2 1.7 224 14.6 6.1 215 14.1 11.9 104 6.8 4.41988 .......................... 472 30.9 20.3 23 1.5 1.2 218 14.2 6.1 231 15.1 13.0 86 5.6 3.61987 .......................... 466 30.5 20.3 28 1.8 1.5 226 14.8 6.6 213 13.9 12.2 90 5.9 3.91986 .......................... 465 30.6 20.0 33 2.2 1.6 218 14.3 6.4 214 14.1 12.0 93 6.1 4.1
1985 .......................... 449 29.7 19.2 36 2.4 2.0 232 15.3 7.0 181 12.0 10.2 107 7.1 4.71984 .......................... 462 30.8 20.5 27 1.8 1.6 231 15.4 7.3 204 13.6 11.6 109 7.3 5.21983 .......................... 441 29.5 19.9 33 2.2 1.9 223 14.9 7.2 185 12.4 10.7 103 6.9 4.91982 .......................... 427 28.6 19.2 26 1.7 1.6 222 14.9 7.4 179 12.0 10.2 97 6.5 4.71981 .......................... 466 31.3 21.3 43 2.9 2.6 224 15.0 7.3 199 13.4 11.4 108 7.3 5.31980 .......................... 433 29.2 20.2 30 2.0 1.8 209 14.1 7.2 194 13.1 11.2 84 5.7 4.41979 .......................... 458 31.1 22.1 36 2.4 2.3 230 15.6 8.3 192 13.0 11.5 104 7.1 5.7
Black, female1992 .......................... 209 36.9 30.8 35 6.2 6.2 95 16.7 11.2 79 13.9 13.4 45 8.0 7.31991 .......................... 217 38.8 34.1 31 5.5 6.3 89 16.0 11.0 96 17.2 16.8 34 6.1 6.11990 .......................... 230 41.5 34.8 46 8.3 9.2 99 17.8 11.9 85 15.4 13.6 50 9.0 9.31989 .......................... 192 35.0 28.1 31 5.6 6.1 84 15.3 9.9 77 14.0 12.2 28 5.1 4.91988 .......................... 216 39.4 32.9 43 7.9 8.6 98 17.9 12.1 75 13.6 12.2 47 8.6 8.61987 .......................... 200 36.7 31.0 34 6.2 6.9 87 16.0 10.3 79 14.4 13.8 24 4.4 4.21986 .......................... 190 35.1 29.9 23 4.2 4.6 89 16.4 11.5 78 14.4 13.7 32 5.9 6.1
1985 .......................... 197 36.4 30.9 25 4.6 5.5 95 17.6 12.2 77 14.2 13.2 38 7.0 7.21984 .......................... 193 35.8 31.4 24 4.5 4.9 96 17.8 13.5 73 13.6 13.0 35 6.5 6.81983 .......................... 195 36.2 31.2 32 6.0 6.9 89 16.6 11.9 74 13.7 12.4 36 6.7 6.81982 .......................... 180 33.5 28.6 24 4.5 5.1 92 17.1 12.0 64 12.0 11.5 36 6.7 7.61981 .......................... 198 36.9 32.7 23 4.3 5.0 101 18.8 13.8 74 13.9 13.9 32 6.0 6.41980 .......................... 209 39.2 35.0 32 6.0 6.9 97 18.2 13.5 80 15.0 14.6 40 7.5 8.21979 .......................... 191 36.4 33.0 27 5.1 6.5 88 16.8 12.2 76 14.5 14.2 35 6.7 7.3
- 15 -
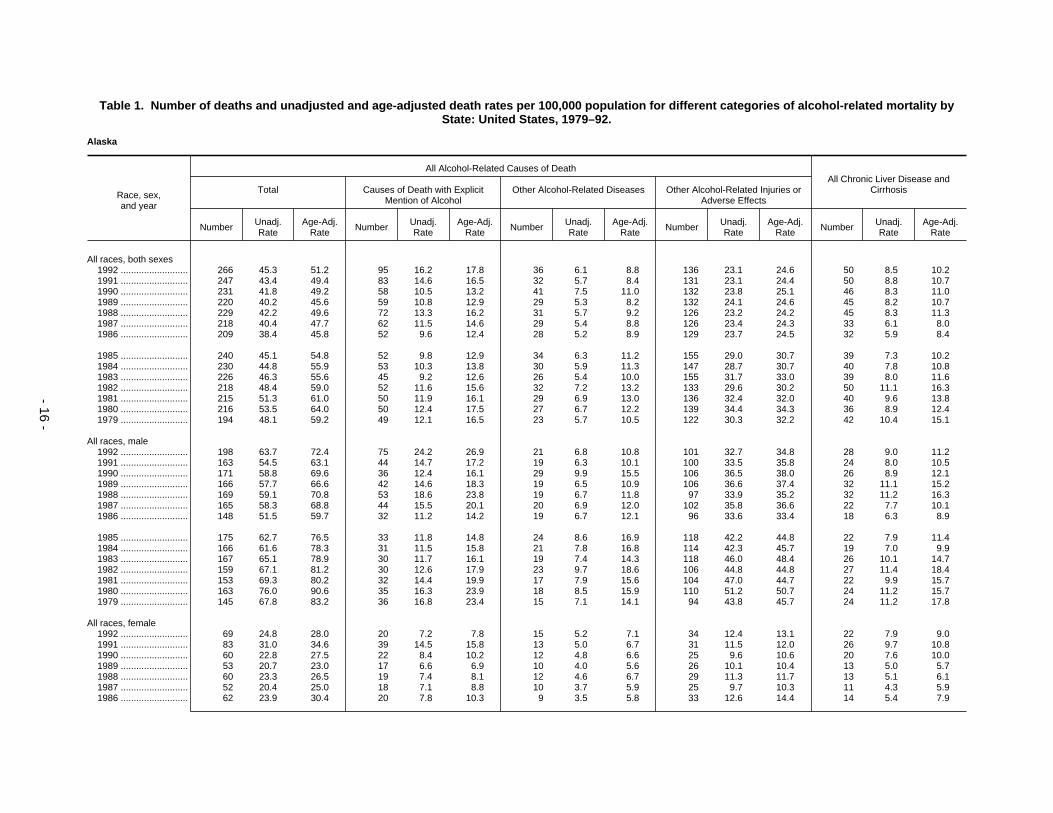
Table 1. Number of deaths and unadjusted and age-adjusted death rates per 100,000 population for different categories of alcohol-related mortality byState: United States, 1979–92.
Alaska
Race, sex,and year
All Alcohol-Related Causes of DeathAll Chronic Liver Disease and
CirrhosisTotal Causes of Death with ExplicitMention of Alcohol
Other Alcohol-Related Diseases Other Alcohol-Related Injuries orAdverse Effects
Number Unadj.Rate
Age-Adj.Rate Number Unadj.
RateAge-Adj.
Rate Number Unadj.Rate
Age-Adj.Rate Number Unadj.
RateAge-Adj.
Rate Number Unadj.Rate
Age-Adj.Rate
All races, both sexes1992 .......................... 266 45.3 51.2 95 16.2 17.8 36 6.1 8.8 136 23.1 24.6 50 8.5 10.21991 .......................... 247 43.4 49.4 83 14.6 16.5 32 5.7 8.4 131 23.1 24.4 50 8.8 10.71990 .......................... 231 41.8 49.2 58 10.5 13.2 41 7.5 11.0 132 23.8 25.1 46 8.3 11.01989 .......................... 220 40.2 45.6 59 10.8 12.9 29 5.3 8.2 132 24.1 24.6 45 8.2 10.71988 .......................... 229 42.2 49.6 72 13.3 16.2 31 5.7 9.2 126 23.2 24.2 45 8.3 11.31987 .......................... 218 40.4 47.7 62 11.5 14.6 29 5.4 8.8 126 23.4 24.3 33 6.1 8.01986 .......................... 209 38.4 45.8 52 9.6 12.4 28 5.2 8.9 129 23.7 24.5 32 5.9 8.4
1985 .......................... 240 45.1 54.8 52 9.8 12.9 34 6.3 11.2 155 29.0 30.7 39 7.3 10.21984 .......................... 230 44.8 55.9 53 10.3 13.8 30 5.9 11.3 147 28.7 30.7 40 7.8 10.81983 .......................... 226 46.3 55.6 45 9.2 12.6 26 5.4 10.0 155 31.7 33.0 39 8.0 11.61982 .......................... 218 48.4 59.0 52 11.6 15.6 32 7.2 13.2 133 29.6 30.2 50 11.1 16.31981 .......................... 215 51.3 61.0 50 11.9 16.1 29 6.9 13.0 136 32.4 32.0 40 9.6 13.81980 .......................... 216 53.5 64.0 50 12.4 17.5 27 6.7 12.2 139 34.4 34.3 36 8.9 12.41979 .......................... 194 48.1 59.2 49 12.1 16.5 23 5.7 10.5 122 30.3 32.2 42 10.4 15.1
All races, male1992 .......................... 198 63.7 72.4 75 24.2 26.9 21 6.8 10.8 101 32.7 34.8 28 9.0 11.21991 .......................... 163 54.5 63.1 44 14.7 17.2 19 6.3 10.1 100 33.5 35.8 24 8.0 10.51990 .......................... 171 58.8 69.6 36 12.4 16.1 29 9.9 15.5 106 36.5 38.0 26 8.9 12.11989 .......................... 166 57.7 66.6 42 14.6 18.3 19 6.5 10.9 106 36.6 37.4 32 11.1 15.21988 .......................... 169 59.1 70.8 53 18.6 23.8 19 6.7 11.8 97 33.9 35.2 32 11.2 16.31987 .......................... 165 58.3 68.8 44 15.5 20.1 20 6.9 12.0 102 35.8 36.6 22 7.7 10.11986 .......................... 148 51.5 59.7 32 11.2 14.2 19 6.7 12.1 96 33.6 33.4 18 6.3 8.9
1985 .......................... 175 62.7 76.5 33 11.8 14.8 24 8.6 16.9 118 42.2 44.8 22 7.9 11.41984 .......................... 166 61.6 78.3 31 11.5 15.8 21 7.8 16.8 114 42.3 45.7 19 7.0 9.91983 .......................... 167 65.1 78.9 30 11.7 16.1 19 7.4 14.3 118 46.0 48.4 26 10.1 14.71982 .......................... 159 67.1 81.2 30 12.6 17.9 23 9.7 18.6 106 44.8 44.8 27 11.4 18.41981 .......................... 153 69.3 80.2 32 14.4 19.9 17 7.9 15.6 104 47.0 44.7 22 9.9 15.71980 .......................... 163 76.0 90.6 35 16.3 23.9 18 8.5 15.9 110 51.2 50.7 24 11.2 15.71979 .......................... 145 67.8 83.2 36 16.8 23.4 15 7.1 14.1 94 43.8 45.7 24 11.2 17.8
All races, female1992 .......................... 69 24.8 28.0 20 7.2 7.8 15 5.2 7.1 34 12.4 13.1 22 7.9 9.01991 .......................... 83 31.0 34.6 39 14.5 15.8 13 5.0 6.7 31 11.5 12.0 26 9.7 10.81990 .......................... 60 22.8 27.5 22 8.4 10.2 12 4.8 6.6 25 9.6 10.6 20 7.6 10.01989 .......................... 53 20.7 23.0 17 6.6 6.9 10 4.0 5.6 26 10.1 10.4 13 5.0 5.71988 .......................... 60 23.3 26.5 19 7.4 8.1 12 4.6 6.7 29 11.3 11.7 13 5.1 6.11987 .......................... 52 20.4 25.0 18 7.1 8.8 10 3.7 5.9 25 9.7 10.3 11 4.3 5.91986 .......................... 62 23.9 30.4 20 7.8 10.3 9 3.5 5.8 33 12.6 14.4 14 5.4 7.9
- 16 -

Table 1. Number of deaths and unadjusted and age-adjusted death rates per 100,000 population for different categories of alcohol-related mortality byState: United States, 1979–92.
Alaska
Race, sex,and year
All Alcohol-Related Causes of DeathAll Chronic Liver Disease and
CirrhosisTotal Causes of Death with ExplicitMention of Alcohol
Other Alcohol-Related Diseases Other Alcohol-Related Injuries orAdverse Effects
Number Unadj.Rate
Age-Adj.Rate Number Unadj.
RateAge-Adj.
Rate Number Unadj.Rate
Age-Adj.Rate Number Unadj.
RateAge-Adj.
Rate Number Unadj.Rate
Age-Adj.Rate
All races, female
1985 .......................... 65 25.7 31.5 19 7.5 10.4 9 3.7 5.9 36 14.4 15.3 17 6.7 9.11984 .......................... 64 26.2 32.2 22 9.0 11.5 9 3.7 6.3 33 13.5 14.4 21 8.6 11.71983 .......................... 59 25.5 29.5 15 6.5 8.6 7 3.2 5.5 37 15.8 15.4 13 5.6 8.21982 .......................... 58 27.5 35.1 22 10.4 13.6 9 4.4 8.1 27 12.6 13.4 23 10.8 14.81981 .......................... 61 31.2 39.7 18 9.1 12.0 12 5.9 10.5 32 16.1 17.3 18 9.1 11.61980 .......................... 54 28.1 34.4 15 7.9 10.4 9 4.7 8.3 30 15.6 15.6 12 6.3 8.71979 .......................... 49 26.0 32.1 13 6.9 8.8 8 4.0 6.8 29 15.2 16.5 18 9.5 12.2
White, male1992 .......................... 124 51.7 57.2 50 20.8 21.9 12 4.9 7.8 63 26.0 27.6 22 9.2 10.51991 .......................... 96 41.3 48.9 24 10.3 12.9 11 4.6 7.6 61 26.3 28.4 17 7.3 9.51990 .......................... 107 47.4 57.1 21 9.3 12.6 20 9.0 14.1 66 29.1 30.4 18 8.0 10.31989 .......................... 104 46.7 54.5 25 11.2 15.1 13 5.9 10.0 66 29.5 29.5 24 10.7 14.81988 .......................... 109 48.9 58.9 34 15.3 20.1 13 6.1 11.1 61 27.5 27.7 25 11.2 16.01987 .......................... 106 47.7 55.9 26 11.7 15.2 15 6.5 11.1 65 29.4 29.5 18 8.1 10.31986 .......................... 99 43.9 51.6 20 8.9 12.1 15 6.6 11.6 64 28.5 27.9 15 6.7 9.8
1985 .......................... 109 49.4 60.8 16 7.2 9.8 17 7.7 15.1 76 34.5 36.0 19 8.6 12.81984 .......................... 117 54.6 70.0 23 10.8 14.9 15 7.0 16.2 79 36.8 38.8 14 6.6 9.01983 .......................... 117 57.7 71.7 21 10.3 13.7 15 7.4 15.5 81 40.0 42.5 22 10.8 15.51982 .......................... 100 53.3 65.4 17 9.1 13.1 14 7.3 14.8 69 36.9 37.5 21 11.2 18.81981 .......................... 99 56.3 66.2 18 10.3 15.2 12 6.6 12.7 69 39.4 38.2 17 9.7 15.71980 .......................... 96 56.7 71.0 17 10.0 15.9 12 7.0 15.2 67 39.6 39.9 16 9.4 14.21979 .......................... 87 51.0 67.1 16 9.4 16.2 11 6.7 14.2 59 34.9 36.7 19 11.2 19.7
Black, male1992 .......................... 4 29.6 40.0 0 0.0 0.0 1 7.6 19.6 3 22.0 20.4 0 0.0 0.01991 .......................... 3 24.0 19.9 0 0.0 0.0 - 0.4 0.8 3 23.6 19.0 0 0.0 0.01990 .......................... 2 16.0 18.6 0 0.0 0.0 - 3.3 9.5 2 12.8 9.1 0 0.0 0.01989 .......................... 3 20.5 19.8 0 0.0 0.0 - 1.6 4.1 2 18.9 15.6 0 0.0 0.01988 .......................... 5 40.2 60.5 1 8.3 24.1 - 3.6 11.7 3 28.3 24.7 1 8.3 24.11987 .......................... 3 26.0 32.9 1 8.5 8.8 - 2.6 12.5 2 14.9 11.6 0 0.0 0.01986 .......................... 4 33.2 61.9 1 8.5 23.7 1 4.4 20.5 2 20.2 17.7 0 0.0 0.0
1985 .......................... 3 30.2 48.8 0 0.0 0.0 - 1.5 6.0 3 28.7 42.7 0 0.0 0.01984 .......................... 5 50.5 118.2 1 9.4 20.2 1 12.8 70.2 3 28.3 27.8 1 9.4 41.41983 .......................... 4 41.0 72.1 0 0.0 0.0 1 8.5 24.6 3 32.6 47.5 1 10.0 12.11982 .......................... 2 26.8 37.2 0 0.0 0.0 - 2.4 5.2 2 24.4 32.0 0 0.0 0.0
- 17 -

Table 1. Number of deaths and unadjusted and age-adjusted death rates per 100,000 population for different categories of alcohol-related mortality byState: United States, 1979–92.
Alaska
Race, sex,and year
All Alcohol-Related Causes of DeathAll Chronic Liver Disease and
CirrhosisTotal Causes of Death with ExplicitMention of Alcohol
Other Alcohol-Related Diseases Other Alcohol-Related Injuries orAdverse Effects
Number Unadj.Rate
Age-Adj.Rate Number Unadj.
RateAge-Adj.
Rate Number Unadj.Rate
Age-Adj.Rate Number Unadj.
RateAge-Adj.
Rate Number Unadj.Rate
Age-Adj.Rate
Black, male1981 .......................... 3 39.8 91.8 1 12.0 49.9 1 9.0 29.3 2 18.7 12.6 1 12.0 49.91980 .......................... 5 66.3 98.9 0 0.0 0.0 1 17.7 61.6 4 48.6 37.3 1 12.7 26.41979 .......................... 4 54.1 96.9 2 25.8 43.6 1 8.9 30.2 2 19.4 23.0 0 0.0 0.0
White, female1992 .......................... 40 19.1 22.4 10 4.8 5.3 9 4.3 5.8 21 10.1 11.2 13 6.2 7.61991 .......................... 51 24.8 27.7 23 11.3 12.1 8 3.9 5.2 20 9.7 10.4 17 8.3 9.21990 .......................... 31 15.6 20.3 7 3.5 5.1 9 4.6 6.3 15 7.5 8.9 9 4.6 6.51989 .......................... 32 16.2 18.0 9 4.6 4.9 6 3.0 4.2 17 8.6 8.9 8 4.1 5.01988 .......................... 33 17.1 20.4 6 3.1 3.8 9 4.7 6.7 18 9.3 9.9 7 3.6 4.61987 .......................... 27 13.9 16.9 5 2.6 3.8 7 3.3 5.1 16 8.0 8.0 4 2.0 3.21986 .......................... 38 19.1 25.2 10 5.0 7.7 6 3.1 5.4 22 10.9 12.2 11 5.5 8.7
1985 .......................... 36 18.5 22.9 7 3.6 5.5 6 3.2 4.9 23 11.7 12.6 9 4.6 6.81984 .......................... 36 18.9 24.6 9 4.8 7.2 6 2.9 5.2 21 11.2 12.2 12 6.4 9.51983 .......................... 35 19.7 23.4 8 4.5 6.9 4 2.2 4.1 23 13.1 12.4 11 6.1 9.71982 .......................... 34 20.6 26.7 10 6.1 8.2 6 3.5 6.7 18 11.0 11.8 11 6.7 9.41981 .......................... 39 25.7 33.9 9 5.9 8.2 7 4.5 8.5 23 15.4 17.1 10 6.5 9.31980 .......................... 28 19.1 25.7 7 4.7 7.1 6 4.3 8.3 15 10.0 10.2 7 4.7 7.21979 .......................... 24 16.2 20.1 4 2.7 3.0 4 2.4 4.4 16 11.1 12.6 6 4.1 5.3
Black, female1992 .......................... - 3.8 10.3 0 0.0 0.0 - 3.8 10.3 0 0.0 0.0 0 0.0 0.01991 .......................... 2 19.9 33.3 2 19.4 31.9 - 0.5 1.4 0 0.0 0.0 1 9.7 25.41990 .......................... 3 26.8 47.2 1 9.7 25.7 - 1.2 3.1 2 15.9 18.4 1 9.7 25.71989 .......................... 1 11.3 26.1 0 0.0 0.0 1 9.3 23.9 - 2.0 2.2 0 0.0 0.01988 .......................... - 0.5 1.4 0 0.0 0.0 - 0.5 1.4 0 0.0 0.0 0 0.0 0.01987 .......................... 2 19.6 49.2 0 0.0 0.0 1 10.1 30.2 1 9.5 19.0 0 0.0 0.01986 .......................... 2 16.6 20.1 0 0.0 0.0 - 2.5 8.1 1 14.1 12.0 0 0.0 0.0
1985 .......................... 1 15.5 16.3 0 0.0 0.0 - 1.5 5.6 1 14.0 10.7 0 0.0 0.01984 .......................... - 4.1 8.4 0 0.0 0.0 - 1.7 7.0 - 2.3 1.5 0 0.0 0.01983 .......................... 2 19.0 18.6 0 0.0 0.0 - 2.1 5.7 1 16.9 12.9 0 0.0 0.01982 .......................... 2 30.3 73.9 1 13.9 28.2 1 10.0 32.8 - 6.4 13.0 2 27.8 76.61981 .......................... 1 17.2 30.0 0 0.0 0.0 - 6.3 22.1 1 10.9 7.9 0 0.0 0.01980 .......................... 1 16.1 46.7 0 0.0 0.0 - 1.1 4.2 1 14.9 42.5 0 0.0 0.01979 .......................... 1 10.0 38.7 0 0.0 0.0 - 2.5 9.7 - 7.5 29.1 0 0.0 0.0
- The AAF methodology used to estimate alcohol-related mortality can result in fractional estimates less than 0.5 but greater than 0.
- 18 -

Table 1. Number of deaths and unadjusted and age-adjusted death rates per 100,000 population for different categories of alcohol-related mortality byState: United States, 1979–92.
Arizona
Race, sex,and year
All Alcohol-Related Causes of DeathAll Chronic Liver Disease and
CirrhosisTotal Causes of Death with ExplicitMention of Alcohol
Other Alcohol-Related Diseases Other Alcohol-Related Injuries orAdverse Effects
Number Unadj.Rate
Age-Adj.Rate Number Unadj.
RateAge-Adj.
Rate Number Unadj.Rate
Age-Adj.Rate Number Unadj.
RateAge-Adj.
Rate Number Unadj.Rate
Age-Adj.Rate
All races, both sexes1992 .......................... 1,792 46.8 38.7 391 10.2 9.6 596 15.5 9.4 806 21.0 19.8 457 11.9 10.11991 .......................... 1,774 47.3 39.8 397 10.6 9.9 560 14.9 9.1 817 21.8 20.7 476 12.7 11.01990 .......................... 1,745 47.4 40.2 368 10.0 9.4 540 14.7 9.1 837 22.7 21.6 435 11.8 10.01989 .......................... 1,681 46.4 39.2 343 9.5 8.9 518 14.3 9.0 820 22.6 21.4 442 12.2 10.31988 .......................... 1,732 49.0 41.9 371 10.5 9.9 508 14.4 9.3 853 24.1 22.7 451 12.8 10.91987 .......................... 1,654 48.1 41.4 306 8.9 8.3 492 14.3 9.4 856 24.9 23.7 374 10.9 9.61986 .......................... 1,622 49.0 42.6 294 8.9 8.6 470 14.2 9.5 858 25.9 24.5 375 11.3 10.3
1985 .......................... 1,536 48.2 41.9 331 10.4 10.1 449 14.1 9.3 756 23.7 22.5 410 12.9 11.21984 .......................... 1,528 49.8 43.1 316 10.3 10.1 457 14.9 9.9 754 24.6 23.0 404 13.2 11.81983 .......................... 1,379 46.5 40.2 296 10.0 9.7 413 13.9 9.4 670 22.6 21.1 361 12.2 10.81982 .......................... 1,428 49.4 43.2 326 11.3 10.7 407 14.1 9.6 696 24.1 22.9 381 13.2 11.91981 .......................... 1,478 52.6 47.2 317 11.3 11.4 403 14.3 10.1 758 27.0 25.7 361 12.8 12.21980 .......................... 1,496 54.7 49.0 309 11.3 11.3 412 15.0 10.8 775 28.3 26.9 393 14.4 13.41979 .......................... 1,502 56.9 51.6 325 12.3 12.4 356 13.5 9.6 821 31.1 29.6 374 14.2 13.6
All races, male1992 .......................... 1,222 64.6 57.4 291 15.4 14.8 345 18.2 12.9 586 31.0 29.8 290 15.3 13.71991 .......................... 1,184 64.0 57.7 285 15.4 14.8 317 17.1 12.3 583 31.5 30.6 300 16.2 14.81990 .......................... 1,194 65.7 59.5 273 15.0 14.4 312 17.2 12.4 609 33.5 32.7 262 14.4 12.91989 .......................... 1,151 64.3 58.4 255 14.2 13.8 296 16.5 12.3 600 33.5 32.3 284 15.9 14.41988 .......................... 1,182 67.7 61.5 276 15.8 15.3 296 17.0 12.8 610 34.9 33.3 294 16.8 15.21987 .......................... 1,119 65.9 59.5 217 12.8 12.2 290 17.1 12.8 612 36.1 34.5 231 13.6 12.51986 .......................... 1,113 68.2 62.3 227 13.9 13.6 274 16.8 12.7 612 37.5 35.9 239 14.6 14.0
1985 .......................... 1,031 65.7 60.5 228 14.5 14.6 258 16.4 12.5 545 34.8 33.4 258 16.4 15.31984 .......................... 1,043 69.0 63.0 223 14.7 14.9 265 17.5 13.3 555 36.7 34.8 240 15.9 15.21983 .......................... 939 64.2 58.7 209 14.3 14.2 241 16.5 12.6 489 33.4 31.9 220 15.0 14.11982 .......................... 966 67.9 62.3 230 16.2 15.7 242 17.0 13.2 494 34.7 33.4 240 16.9 15.91981 .......................... 1,024 74.0 70.1 234 16.9 17.5 239 17.3 13.9 551 39.8 38.7 238 17.2 16.91980 .......................... 1,019 75.6 71.2 220 16.3 16.7 236 17.5 14.1 563 41.8 40.4 228 16.9 16.61979 .......................... 1,030 79.2 75.0 232 17.9 18.2 202 15.5 12.5 596 45.8 44.3 236 18.2 18.1
All races, female1992 .......................... 570 29.4 21.0 100 5.2 4.7 251 12.9 6.4 219 11.3 9.9 167 8.6 6.81991 .......................... 589 31.1 22.7 112 5.9 5.4 243 12.8 6.4 234 12.4 10.9 176 9.3 7.51990 .......................... 551 29.6 21.8 95 5.1 4.7 228 12.3 6.4 228 12.2 10.7 173 9.3 7.31989 .......................... 530 28.9 20.9 88 4.8 4.3 222 12.1 6.1 220 12.0 10.6 158 8.6 6.51988 .......................... 550 30.7 23.5 95 5.3 4.9 212 11.8 6.3 243 13.6 12.3 157 8.8 7.01987 .......................... 535 30.8 24.2 89 5.1 4.9 202 11.6 6.4 244 14.0 12.9 143 8.2 7.01986 .......................... 509 30.4 24.1 67 4.0 4.0 196 11.7 6.9 246 14.7 13.2 136 8.1 7.0
- 19 -

Table 1. Number of deaths and unadjusted and age-adjusted death rates per 100,000 population for different categories of alcohol-related mortality byState: United States, 1979–92.
Arizona
Race, sex,and year
All Alcohol-Related Causes of DeathAll Chronic Liver Disease and
CirrhosisTotal Causes of Death with ExplicitMention of Alcohol
Other Alcohol-Related Diseases Other Alcohol-Related Injuries orAdverse Effects
Number Unadj.Rate
Age-Adj.Rate Number Unadj.
RateAge-Adj.
Rate Number Unadj.Rate
Age-Adj.Rate Number Unadj.
RateAge-Adj.
Rate Number Unadj.Rate
Age-Adj.Rate
All races, female
1985 .......................... 505 31.3 24.3 103 6.4 5.9 192 11.9 6.7 210 13.0 11.7 152 9.4 7.41984 .......................... 485 31.2 24.3 93 6.0 5.7 192 12.4 7.2 200 12.8 11.4 164 10.5 8.71983 .......................... 440 29.2 22.8 87 5.8 5.5 172 11.4 6.7 181 12.1 10.7 141 9.4 7.71982 .......................... 462 31.5 25.4 96 6.5 6.3 164 11.2 6.5 202 13.7 12.6 141 9.6 8.31981 .......................... 454 31.8 25.7 83 5.8 5.8 164 11.5 6.8 207 14.5 13.1 123 8.6 8.01980 .......................... 477 34.3 28.0 89 6.4 6.4 176 12.6 8.0 212 15.3 13.6 165 11.9 10.61979 .......................... 472 35.3 29.3 93 6.9 7.0 155 11.5 7.2 225 16.8 15.1 138 10.3 9.5
White, male1992 .......................... 997 59.1 49.9 203 12.0 11.0 317 18.8 12.3 477 28.3 26.6 238 14.1 11.81991 .......................... 992 60.1 51.9 222 13.5 12.3 296 17.9 12.1 474 28.8 27.4 249 15.1 13.01990 .......................... 992 61.1 53.0 204 12.6 11.3 290 17.9 12.2 497 30.6 29.6 218 13.4 11.21989 .......................... 956 59.7 51.9 192 12.0 10.9 272 17.0 11.9 492 30.7 29.1 232 14.5 12.41988 .......................... 966 61.7 53.8 194 12.4 11.3 272 17.4 12.4 500 31.9 30.1 250 16.0 13.41987 .......................... 941 61.8 53.8 174 11.4 10.5 273 17.9 12.6 494 32.5 30.6 203 13.3 11.61986 .......................... 910 62.0 54.6 161 11.0 10.3 247 16.8 11.9 502 34.2 32.4 196 13.4 12.1
1985 .......................... 877 62.1 55.4 184 13.0 12.8 237 16.8 12.1 456 32.3 30.6 222 15.7 14.11984 .......................... 876 64.3 56.4 158 11.6 11.1 250 18.3 13.1 468 34.4 32.1 202 14.8 13.51983 .......................... 781 59.2 52.0 152 11.5 10.8 226 17.1 12.4 403 30.6 28.7 189 14.3 12.71982 .......................... 812 63.3 55.8 177 13.8 12.6 227 17.7 13.1 408 31.8 30.1 203 15.8 14.11981 .......................... 859 68.7 62.7 181 14.5 14.2 218 17.4 13.2 460 36.8 35.3 206 16.5 15.21980 .......................... 841 69.0 62.7 162 13.3 12.8 212 17.4 13.3 466 38.3 36.6 182 14.9 13.71979 .......................... 828 70.2 64.1 170 14.4 13.9 186 15.8 12.1 472 40.0 38.1 191 16.2 15.3
Black, male1992 .......................... 46 71.3 82.2 12 18.5 22.2 10 14.8 22.0 25 38.0 37.9 7 10.8 14.71991 .......................... 34 55.2 60.4 5 8.0 10.6 7 11.0 14.5 23 36.2 35.4 7 11.2 15.81990 .......................... 42 69.6 82.3 9 15.0 22.1 7 11.6 16.4 26 43.0 43.7 9 15.0 22.11989 .......................... 39 66.2 77.6 6 10.2 14.4 10 16.5 23.5 23 39.5 39.7 10 17.0 22.71988 .......................... 44 76.8 92.9 6 10.6 14.8 14 23.9 34.5 24 42.4 43.6 6 10.6 14.01987 .......................... 34 61.4 71.6 8 14.6 16.8 6 10.5 15.3 20 36.3 39.6 4 7.3 9.91986 .......................... 44 85.1 98.5 11 21.1 26.4 13 24.3 34.2 21 39.6 37.9 6 11.5 16.5
1985 .......................... 26 51.8 60.8 3 6.0 9.0 7 13.5 19.2 16 32.2 32.5 4 8.1 11.41984 .......................... 32 68.5 85.7 10 21.2 31.7 5 9.6 13.1 18 37.7 40.9 4 8.5 12.61983 .......................... 34 76.1 90.5 7 15.5 21.8 6 14.2 19.7 21 46.4 48.9 4 8.8 13.11982 .......................... 37 85.2 107.9 13 29.9 42.8 6 13.4 17.4 18 41.9 47.7 10 23.0 32.01981 .......................... 32 76.1 94.7 4 9.6 12.9 8 19.7 27.7 20 46.8 54.1 3 7.2 10.1
- 20 -

Table 1. Number of deaths and unadjusted and age-adjusted death rates per 100,000 population for different categories of alcohol-related mortality byState: United States, 1979–92.
Arizona
Race, sex,and year
All Alcohol-Related Causes of DeathAll Chronic Liver Disease and
CirrhosisTotal Causes of Death with ExplicitMention of Alcohol
Other Alcohol-Related Diseases Other Alcohol-Related Injuries orAdverse Effects
Number Unadj.Rate
Age-Adj.Rate Number Unadj.
RateAge-Adj.
Rate Number Unadj.Rate
Age-Adj.Rate Number Unadj.
RateAge-Adj.
Rate Number Unadj.Rate
Age-Adj.Rate
Black, male1980 .......................... 38 94.4 111.8 5 12.5 18.7 9 23.2 31.1 24 58.7 62.0 2 5.0 7.51979 .......................... 42 110.6 123.5 7 18.6 20.7 5 13.7 17.4 29 78.3 85.3 3 8.0 11.1
White, female1992 .......................... 484 28.0 18.7 69 4.0 3.5 228 13.2 5.9 187 10.8 9.2 131 7.6 5.61991 .......................... 498 29.4 19.9 73 4.3 3.7 225 13.3 6.2 200 11.8 10.1 134 7.9 5.81990 .......................... 476 28.6 19.6 71 4.3 3.8 212 12.7 6.1 193 11.6 9.7 140 8.4 6.11989 .......................... 453 27.6 18.6 58 3.5 2.9 206 12.5 5.9 189 11.5 9.8 125 7.6 5.31988 .......................... 471 29.3 21.0 68 4.2 3.7 198 12.3 6.1 205 12.7 11.3 130 8.1 5.91987 .......................... 464 29.7 22.0 68 4.3 3.9 188 12.0 6.2 208 13.3 12.0 122 7.8 6.11986 .......................... 440 29.2 21.8 52 3.4 3.3 181 12.0 6.6 207 13.7 12.0 118 7.8 6.4
1985 .......................... 437 30.1 21.9 77 5.3 4.6 179 12.3 6.4 181 12.5 10.9 132 9.1 6.61984 .......................... 418 29.8 21.5 66 4.7 4.1 178 12.7 6.8 174 12.4 10.7 131 9.3 6.81983 .......................... 378 27.9 20.5 61 4.5 4.0 161 11.8 6.6 157 11.5 9.9 122 9.0 7.11982 .......................... 400 30.2 22.8 71 5.4 4.7 157 11.8 6.5 172 13.0 11.6 118 8.9 7.01981 .......................... 403 31.2 24.0 71 5.5 5.2 151 11.7 6.5 180 14.0 12.3 107 8.3 7.11980 .......................... 405 32.2 24.6 61 4.9 4.3 160 12.8 7.5 184 14.6 12.7 128 10.2 8.41979 .......................... 402 33.0 25.8 63 5.2 4.9 145 12.0 7.0 193 15.9 14.0 113 9.3 7.9
Black, female1992 .......................... 16 26.1 24.4 3 5.0 4.8 8 13.5 12.6 5 7.6 6.9 3 5.0 5.21991 .......................... 14 23.9 21.9 2 3.5 2.4 6 9.9 8.0 6 10.5 11.5 1 1.7 0.71990 .......................... 14 25.1 25.5 1 1.8 2.9 4 7.7 7.1 9 15.7 15.5 3 5.4 7.51989 .......................... 15 27.5 26.4 2 3.7 3.7 5 8.7 7.5 8 15.2 15.2 1 1.8 2.11988 .......................... 14 27.2 26.2 0 0.0 0.0 5 8.7 8.4 10 18.6 17.8 1 1.9 1.91987 .......................... 14 27.7 30.9 1 2.0 3.1 6 12.6 14.7 7 13.1 13.1 3 6.0 8.41986 .......................... 13 26.7 29.3 2 4.2 6.0 4 8.1 8.0 7 14.5 15.2 3 6.3 8.4
1985 .......................... 14 31.2 33.2 3 6.5 6.9 6 12.3 14.0 6 12.3 12.4 5 10.9 14.21984 .......................... 10 22.3 24.5 1 2.3 3.1 5 11.0 12.1 4 8.9 9.3 3 6.9 9.01983 .......................... 12 28.2 27.4 2 4.8 5.2 4 10.1 9.4 6 13.3 12.8 1 2.4 1.81982 .......................... 9 21.4 19.8 0 0.0 0.0 3 6.9 6.0 6 14.4 13.7 1 2.5 3.31981 .......................... 9 23.4 23.0 0 0.0 0.0 4 10.6 10.6 5 12.8 12.4 0 0.0 0.01980 .......................... 16 42.2 46.0 4 10.8 13.9 6 15.6 16.9 6 15.8 15.2 6 16.1 18.81979 .......................... 20 56.6 61.8 7 20.0 25.3 4 10.2 11.5 9 26.4 25.1 6 17.1 23.3
- 21 -
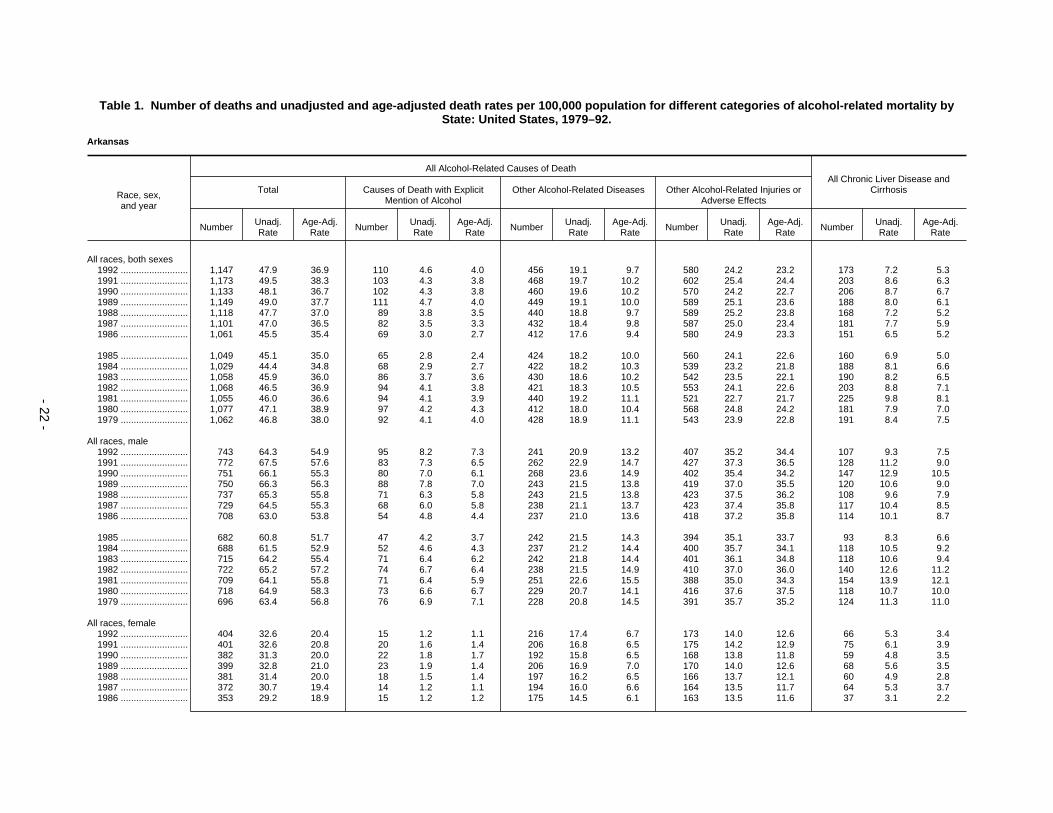
Table 1. Number of deaths and unadjusted and age-adjusted death rates per 100,000 population for different categories of alcohol-related mortality byState: United States, 1979–92.
Arkansas
Race, sex,and year
All Alcohol-Related Causes of DeathAll Chronic Liver Disease and
CirrhosisTotal Causes of Death with ExplicitMention of Alcohol
Other Alcohol-Related Diseases Other Alcohol-Related Injuries orAdverse Effects
Number Unadj.Rate
Age-Adj.Rate Number Unadj.
RateAge-Adj.
Rate Number Unadj.Rate
Age-Adj.Rate Number Unadj.
RateAge-Adj.
Rate Number Unadj.Rate
Age-Adj.Rate
All races, both sexes1992 .......................... 1,147 47.9 36.9 110 4.6 4.0 456 19.1 9.7 580 24.2 23.2 173 7.2 5.31991 .......................... 1,173 49.5 38.3 103 4.3 3.8 468 19.7 10.2 602 25.4 24.4 203 8.6 6.31990 .......................... 1,133 48.1 36.7 102 4.3 3.8 460 19.6 10.2 570 24.2 22.7 206 8.7 6.71989 .......................... 1,149 49.0 37.7 111 4.7 4.0 449 19.1 10.0 589 25.1 23.6 188 8.0 6.11988 .......................... 1,118 47.7 37.0 89 3.8 3.5 440 18.8 9.7 589 25.2 23.8 168 7.2 5.21987 .......................... 1,101 47.0 36.5 82 3.5 3.3 432 18.4 9.8 587 25.0 23.4 181 7.7 5.91986 .......................... 1,061 45.5 35.4 69 3.0 2.7 412 17.6 9.4 580 24.9 23.3 151 6.5 5.2
1985 .......................... 1,049 45.1 35.0 65 2.8 2.4 424 18.2 10.0 560 24.1 22.6 160 6.9 5.01984 .......................... 1,029 44.4 34.8 68 2.9 2.7 422 18.2 10.3 539 23.2 21.8 188 8.1 6.61983 .......................... 1,058 45.9 36.0 86 3.7 3.6 430 18.6 10.2 542 23.5 22.1 190 8.2 6.51982 .......................... 1,068 46.5 36.9 94 4.1 3.8 421 18.3 10.5 553 24.1 22.6 203 8.8 7.11981 .......................... 1,055 46.0 36.6 94 4.1 3.9 440 19.2 11.1 521 22.7 21.7 225 9.8 8.11980 .......................... 1,077 47.1 38.9 97 4.2 4.3 412 18.0 10.4 568 24.8 24.2 181 7.9 7.01979 .......................... 1,062 46.8 38.0 92 4.1 4.0 428 18.9 11.1 543 23.9 22.8 191 8.4 7.5
All races, male1992 .......................... 743 64.3 54.9 95 8.2 7.3 241 20.9 13.2 407 35.2 34.4 107 9.3 7.51991 .......................... 772 67.5 57.6 83 7.3 6.5 262 22.9 14.7 427 37.3 36.5 128 11.2 9.01990 .......................... 751 66.1 55.3 80 7.0 6.1 268 23.6 14.9 402 35.4 34.2 147 12.9 10.51989 .......................... 750 66.3 56.3 88 7.8 7.0 243 21.5 13.8 419 37.0 35.5 120 10.6 9.01988 .......................... 737 65.3 55.8 71 6.3 5.8 243 21.5 13.8 423 37.5 36.2 108 9.6 7.91987 .......................... 729 64.5 55.3 68 6.0 5.8 238 21.1 13.7 423 37.4 35.8 117 10.4 8.51986 .......................... 708 63.0 53.8 54 4.8 4.4 237 21.0 13.6 418 37.2 35.8 114 10.1 8.7
1985 .......................... 682 60.8 51.7 47 4.2 3.7 242 21.5 14.3 394 35.1 33.7 93 8.3 6.61984 .......................... 688 61.5 52.9 52 4.6 4.3 237 21.2 14.4 400 35.7 34.1 118 10.5 9.21983 .......................... 715 64.2 55.4 71 6.4 6.2 242 21.8 14.4 401 36.1 34.8 118 10.6 9.41982 .......................... 722 65.2 57.2 74 6.7 6.4 238 21.5 14.9 410 37.0 36.0 140 12.6 11.21981 .......................... 709 64.1 55.8 71 6.4 5.9 251 22.6 15.5 388 35.0 34.3 154 13.9 12.11980 .......................... 718 64.9 58.3 73 6.6 6.7 229 20.7 14.1 416 37.6 37.5 118 10.7 10.01979 .......................... 696 63.4 56.8 76 6.9 7.1 228 20.8 14.5 391 35.7 35.2 124 11.3 11.0
All races, female1992 .......................... 404 32.6 20.4 15 1.2 1.1 216 17.4 6.7 173 14.0 12.6 66 5.3 3.41991 .......................... 401 32.6 20.8 20 1.6 1.4 206 16.8 6.5 175 14.2 12.9 75 6.1 3.91990 .......................... 382 31.3 20.0 22 1.8 1.7 192 15.8 6.5 168 13.8 11.8 59 4.8 3.51989 .......................... 399 32.8 21.0 23 1.9 1.4 206 16.9 7.0 170 14.0 12.6 68 5.6 3.51988 .......................... 381 31.4 20.0 18 1.5 1.4 197 16.2 6.5 166 13.7 12.1 60 4.9 2.81987 .......................... 372 30.7 19.4 14 1.2 1.1 194 16.0 6.6 164 13.5 11.7 64 5.3 3.71986 .......................... 353 29.2 18.9 15 1.2 1.2 175 14.5 6.1 163 13.5 11.6 37 3.1 2.2
- 22 -

Table 1. Number of deaths and unadjusted and age-adjusted death rates per 100,000 population for different categories of alcohol-related mortality byState: United States, 1979–92.
Arkansas
Race, sex,and year
All Alcohol-Related Causes of DeathAll Chronic Liver Disease and
CirrhosisTotal Causes of Death with ExplicitMention of Alcohol
Other Alcohol-Related Diseases Other Alcohol-Related Injuries orAdverse Effects
Number Unadj.Rate
Age-Adj.Rate Number Unadj.
RateAge-Adj.
Rate Number Unadj.Rate
Age-Adj.Rate Number Unadj.
RateAge-Adj.
Rate Number Unadj.Rate
Age-Adj.Rate
All races, female
1985 .......................... 367 30.4 20.2 18 1.5 1.4 182 15.1 6.5 167 13.8 12.3 67 5.6 3.81984 .......................... 341 28.4 18.7 16 1.3 1.3 186 15.5 6.8 139 11.6 10.5 70 5.8 4.31983 .......................... 344 28.8 18.4 15 1.3 1.3 187 15.7 6.8 141 11.8 10.2 72 6.0 3.91982 .......................... 346 29.1 18.4 20 1.7 1.4 182 15.3 6.9 144 12.1 10.1 63 5.3 3.61981 .......................... 345 29.1 19.5 23 1.9 2.1 189 15.9 7.5 133 11.2 9.9 71 6.0 4.81980 .......................... 359 30.4 21.2 24 2.0 2.1 184 15.5 7.3 152 12.8 11.8 63 5.3 4.41979 .......................... 367 31.3 20.9 16 1.4 1.3 199 17.0 8.3 151 12.9 11.2 67 5.7 4.3
White, male1992 .......................... 559 57.8 47.0 73 7.6 6.5 192 19.8 11.5 294 30.4 29.0 93 9.6 7.31991 .......................... 599 62.6 50.7 66 6.9 5.8 215 22.4 13.3 318 33.2 31.6 114 11.9 8.81990 .......................... 578 60.9 48.7 61 6.4 5.3 212 22.4 13.1 305 32.1 30.2 126 13.3 10.01989 .......................... 581 61.5 50.0 76 8.0 6.7 195 20.7 12.5 310 32.8 30.8 108 11.4 9.01988 .......................... 578 61.2 50.3 57 6.0 5.3 194 20.6 12.2 326 34.6 32.8 94 10.0 7.71987 .......................... 576 61.0 50.2 48 5.1 4.5 194 20.6 12.4 334 35.4 33.3 104 11.0 8.51986 .......................... 552 58.8 48.6 45 4.8 4.2 182 19.4 11.8 325 34.6 32.6 97 10.3 8.4
1985 .......................... 539 57.5 46.9 34 3.6 3.0 191 20.4 12.6 314 33.5 31.3 82 8.8 6.51984 .......................... 545 58.3 48.6 44 4.7 4.2 189 20.2 13.0 312 33.4 31.4 114 12.2 9.91983 .......................... 572 61.6 51.4 59 6.4 5.8 201 21.7 13.6 312 33.6 32.0 100 10.8 8.81982 .......................... 564 61.1 52.0 63 6.8 6.2 187 20.3 13.4 314 34.0 32.5 122 13.2 11.11981 .......................... 556 60.2 50.5 59 6.4 5.5 205 22.2 14.6 292 31.7 30.4 137 14.8 12.11980 .......................... 549 59.4 51.9 56 6.1 5.9 180 19.5 12.6 312 33.9 33.4 101 10.9 9.71979 .......................... 538 58.6 50.8 56 6.1 5.8 185 20.2 13.6 297 32.4 31.3 105 11.5 10.4
Black, male1992 .......................... 182 103.6 110.1 22 12.6 14.8 49 27.8 29.1 111 63.3 66.2 14 8.0 9.91991 .......................... 169 97.2 104.9 17 9.8 13.3 45 26.1 26.8 107 61.3 64.8 13 7.5 10.21990 .......................... 168 96.4 104.7 18 10.3 12.5 55 31.5 31.3 95 54.5 60.9 20 11.5 14.81989 .......................... 166 95.3 99.7 11 6.3 8.4 48 27.3 25.4 107 61.6 65.8 11 6.3 8.11988 .......................... 156 89.7 97.1 13 7.5 9.5 48 27.5 27.5 95 54.7 60.1 14 8.0 11.11987 .......................... 151 86.6 97.0 20 11.5 16.4 43 24.8 23.9 88 50.3 56.7 13 7.5 8.81986 .......................... 154 88.4 92.6 9 5.2 5.8 54 31.1 27.9 91 52.1 58.8 16 9.2 10.9
1985 .......................... 143 81.7 90.9 13 7.4 8.7 50 28.8 29.4 80 45.4 52.8 11 6.3 7.21984 .......................... 142 81.0 84.8 8 4.6 6.0 47 27.0 26.3 87 49.4 52.5 3 1.7 2.61983 .......................... 141 80.5 86.7 12 6.9 8.9 41 23.4 21.9 88 50.3 55.8 18 10.3 14.41982 .......................... 156 89.2 95.6 11 6.3 8.7 51 29.2 27.4 94 53.7 59.5 18 10.3 12.81981 .......................... 152 86.7 95.5 12 6.9 9.7 45 25.9 23.5 94 53.9 62.3 17 9.7 12.5
- 23 -
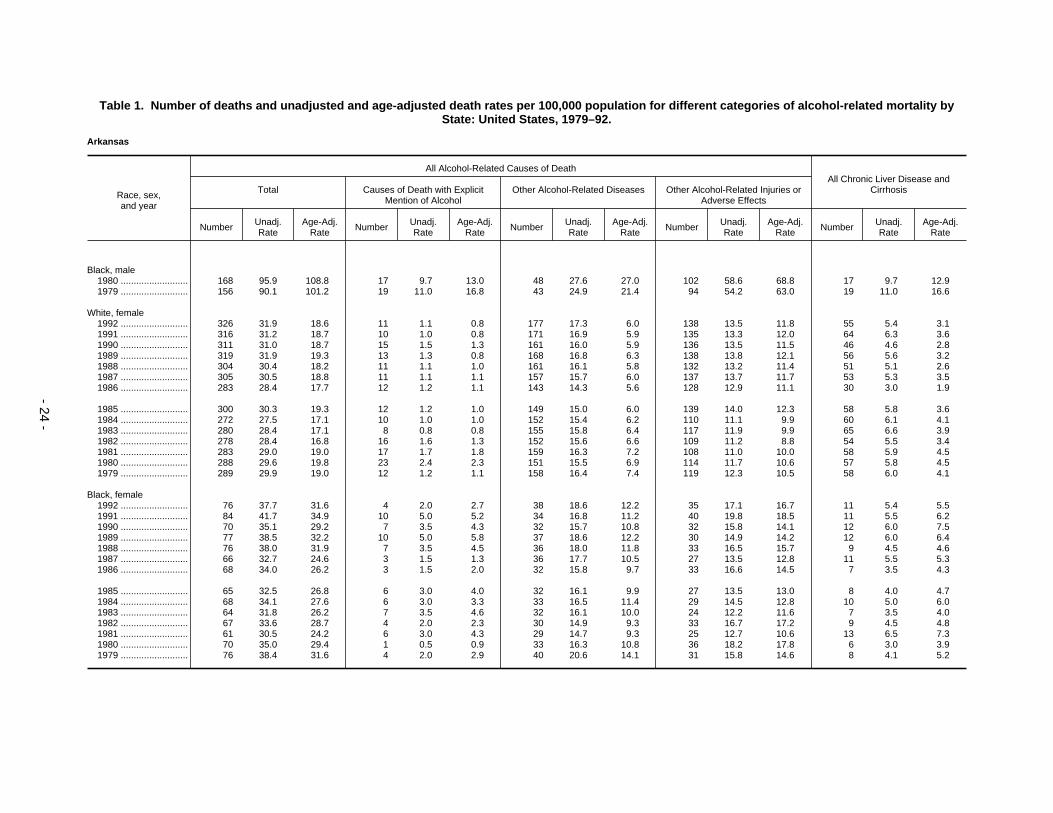
Table 1. Number of deaths and unadjusted and age-adjusted death rates per 100,000 population for different categories of alcohol-related mortality byState: United States, 1979–92.
Arkansas
Race, sex,and year
All Alcohol-Related Causes of DeathAll Chronic Liver Disease and
CirrhosisTotal Causes of Death with ExplicitMention of Alcohol
Other Alcohol-Related Diseases Other Alcohol-Related Injuries orAdverse Effects
Number Unadj.Rate
Age-Adj.Rate Number Unadj.
RateAge-Adj.
Rate Number Unadj.Rate
Age-Adj.Rate Number Unadj.
RateAge-Adj.
Rate Number Unadj.Rate
Age-Adj.Rate
Black, male1980 .......................... 168 95.9 108.8 17 9.7 13.0 48 27.6 27.0 102 58.6 68.8 17 9.7 12.91979 .......................... 156 90.1 101.2 19 11.0 16.8 43 24.9 21.4 94 54.2 63.0 19 11.0 16.6
White, female1992 .......................... 326 31.9 18.6 11 1.1 0.8 177 17.3 6.0 138 13.5 11.8 55 5.4 3.11991 .......................... 316 31.2 18.7 10 1.0 0.8 171 16.9 5.9 135 13.3 12.0 64 6.3 3.61990 .......................... 311 31.0 18.7 15 1.5 1.3 161 16.0 5.9 136 13.5 11.5 46 4.6 2.81989 .......................... 319 31.9 19.3 13 1.3 0.8 168 16.8 6.3 138 13.8 12.1 56 5.6 3.21988 .......................... 304 30.4 18.2 11 1.1 1.0 161 16.1 5.8 132 13.2 11.4 51 5.1 2.61987 .......................... 305 30.5 18.8 11 1.1 1.1 157 15.7 6.0 137 13.7 11.7 53 5.3 3.51986 .......................... 283 28.4 17.7 12 1.2 1.1 143 14.3 5.6 128 12.9 11.1 30 3.0 1.9
1985 .......................... 300 30.3 19.3 12 1.2 1.0 149 15.0 6.0 139 14.0 12.3 58 5.8 3.61984 .......................... 272 27.5 17.1 10 1.0 1.0 152 15.4 6.2 110 11.1 9.9 60 6.1 4.11983 .......................... 280 28.4 17.1 8 0.8 0.8 155 15.8 6.4 117 11.9 9.9 65 6.6 3.91982 .......................... 278 28.4 16.8 16 1.6 1.3 152 15.6 6.6 109 11.2 8.8 54 5.5 3.41981 .......................... 283 29.0 19.0 17 1.7 1.8 159 16.3 7.2 108 11.0 10.0 58 5.9 4.51980 .......................... 288 29.6 19.8 23 2.4 2.3 151 15.5 6.9 114 11.7 10.6 57 5.8 4.51979 .......................... 289 29.9 19.0 12 1.2 1.1 158 16.4 7.4 119 12.3 10.5 58 6.0 4.1
Black, female1992 .......................... 76 37.7 31.6 4 2.0 2.7 38 18.6 12.2 35 17.1 16.7 11 5.4 5.51991 .......................... 84 41.7 34.9 10 5.0 5.2 34 16.8 11.2 40 19.8 18.5 11 5.5 6.21990 .......................... 70 35.1 29.2 7 3.5 4.3 32 15.7 10.8 32 15.8 14.1 12 6.0 7.51989 .......................... 77 38.5 32.2 10 5.0 5.8 37 18.6 12.2 30 14.9 14.2 12 6.0 6.41988 .......................... 76 38.0 31.9 7 3.5 4.5 36 18.0 11.8 33 16.5 15.7 9 4.5 4.61987 .......................... 66 32.7 24.6 3 1.5 1.3 36 17.7 10.5 27 13.5 12.8 11 5.5 5.31986 .......................... 68 34.0 26.2 3 1.5 2.0 32 15.8 9.7 33 16.6 14.5 7 3.5 4.3
1985 .......................... 65 32.5 26.8 6 3.0 4.0 32 16.1 9.9 27 13.5 13.0 8 4.0 4.71984 .......................... 68 34.1 27.6 6 3.0 3.3 33 16.5 11.4 29 14.5 12.8 10 5.0 6.01983 .......................... 64 31.8 26.2 7 3.5 4.6 32 16.1 10.0 24 12.2 11.6 7 3.5 4.01982 .......................... 67 33.6 28.7 4 2.0 2.3 30 14.9 9.3 33 16.7 17.2 9 4.5 4.81981 .......................... 61 30.5 24.2 6 3.0 4.3 29 14.7 9.3 25 12.7 10.6 13 6.5 7.31980 .......................... 70 35.0 29.4 1 0.5 0.9 33 16.3 10.8 36 18.2 17.8 6 3.0 3.91979 .......................... 76 38.4 31.6 4 2.0 2.9 40 20.6 14.1 31 15.8 14.6 8 4.1 5.2
- 24 -

Table 1. Number of deaths and unadjusted and age-adjusted death rates per 100,000 population for different categories of alcohol-related mortality byState: United States, 1979–92.
California
Race, sex,and year
All Alcohol-Related Causes of DeathAll Chronic Liver Disease and
CirrhosisTotal Causes of Death with ExplicitMention of Alcohol
Other Alcohol-Related Diseases Other Alcohol-Related Injuries orAdverse Effects
Number Unadj.Rate
Age-Adj.Rate Number Unadj.
RateAge-Adj.
Rate Number Unadj.Rate
Age-Adj.Rate Number Unadj.
RateAge-Adj.
Rate Number Unadj.Rate
Age-Adj.Rate
All races, both sexes1992 .......................... 13,096 42.4 37.3 3,291 10.7 10.2 4,311 14.0 9.7 5,494 17.8 17.4 3,764 12.2 11.31991 .......................... 13,133 43.2 38.2 3,141 10.3 10.0 4,299 14.1 10.0 5,693 18.7 18.2 3,742 12.3 11.51990 .......................... 13,194 44.1 38.7 3,221 10.8 10.4 4,220 14.1 9.8 5,753 19.2 18.4 3,903 13.1 12.21989 .......................... 13,133 44.9 39.1 3,230 11.1 10.7 4,305 14.7 10.3 5,597 19.2 18.1 4,004 13.7 12.81988 .......................... 13,136 46.1 40.0 3,204 11.3 10.9 4,381 15.4 10.8 5,550 19.5 18.3 4,177 14.7 13.81987 .......................... 12,782 46.0 40.0 3,021 10.9 10.6 4,159 15.0 10.5 5,602 20.2 18.9 3,926 14.1 13.31986 .......................... 12,710 46.9 40.8 2,921 10.8 10.5 4,101 15.1 10.7 5,688 21.0 19.7 3,992 14.7 13.7
1985 .......................... 12,264 46.4 40.1 2,710 10.2 9.9 4,150 15.7 11.1 5,404 20.4 19.1 3,952 14.9 13.91984 .......................... 12,423 48.1 41.8 3,016 11.7 11.3 3,980 15.4 10.9 5,427 21.0 19.7 4,132 16.0 14.91983 .......................... 11,983 47.3 41.2 2,945 11.6 11.2 3,880 15.3 10.9 5,158 20.3 19.0 3,982 15.7 14.71982 .......................... 12,243 49.3 43.0 3,010 12.1 11.7 3,876 15.6 11.1 5,357 21.6 20.2 4,142 16.7 15.51981 .......................... 12,659 52.1 45.7 3,016 12.4 12.0 3,927 16.2 11.6 5,716 23.5 22.1 4,208 17.3 16.21980 .......................... 13,080 55.0 48.3 3,133 13.2 12.7 3,950 16.6 11.9 5,997 25.2 23.7 4,437 18.6 17.51979 .......................... 12,690 54.6 48.3 3,047 13.1 12.7 3,818 16.4 11.9 5,826 25.1 23.7 4,194 18.0 17.0
All races, male1992 .......................... 9,019 58.3 55.8 2,480 16.0 16.0 2,420 15.6 13.4 4,119 26.6 26.3 2,534 16.4 16.21991 .......................... 8,963 58.9 56.4 2,285 15.0 15.2 2,381 15.6 13.5 4,297 28.2 27.7 2,433 16.0 16.01990 .......................... 9,026 60.3 57.3 2,394 16.0 16.1 2,307 15.4 13.4 4,325 28.9 27.8 2,628 17.6 17.51989 .......................... 8,926 61.1 57.7 2,406 16.5 16.5 2,353 16.1 13.9 4,168 28.5 27.2 2,689 18.4 18.31988 .......................... 8,932 62.8 59.2 2,379 16.7 16.9 2,434 17.1 14.8 4,119 29.0 27.5 2,795 19.7 19.71987 .......................... 8,721 62.9 59.3 2,287 16.5 16.7 2,310 16.7 14.3 4,125 29.8 28.2 2,668 19.3 19.21986 .......................... 8,617 63.8 60.0 2,112 15.6 15.8 2,249 16.7 14.4 4,255 31.5 29.8 2,591 19.2 19.1
1985 .......................... 8,159 62.1 58.3 1,975 15.0 15.1 2,257 17.2 14.9 3,927 29.9 28.3 2,557 19.4 19.41984 .......................... 8,305 64.7 60.9 2,162 16.9 16.9 2,187 17.0 14.7 3,955 30.8 29.2 2,716 21.2 21.01983 .......................... 8,068 64.2 60.4 2,111 16.8 16.8 2,157 17.2 14.9 3,800 30.2 28.7 2,631 20.9 20.71982 .......................... 8,166 66.5 62.6 2,129 17.3 17.3 2,131 17.4 15.0 3,905 31.8 30.2 2,666 21.7 21.51981 .......................... 8,535 71.2 66.9 2,119 17.7 17.7 2,202 18.4 15.9 4,214 35.1 33.3 2,739 22.8 22.61980 .......................... 8,825 75.2 70.8 2,209 18.8 18.9 2,171 18.5 15.9 4,444 37.9 36.0 2,884 24.6 24.21979 .......................... 8,585 74.9 70.9 2,174 19.0 19.1 2,130 18.6 16.1 4,281 37.4 35.7 2,747 24.0 23.8
All races, female1992 .......................... 4,077 26.4 19.5 811 5.3 4.8 1,891 12.3 6.6 1,375 8.9 8.0 1,230 8.0 6.71991 .......................... 4,170 27.5 20.6 856 5.6 5.2 1,919 12.6 7.0 1,396 9.2 8.4 1,309 8.6 7.21990 .......................... 4,167 27.9 20.7 827 5.5 5.1 1,913 12.8 6.9 1,427 9.6 8.6 1,275 8.5 7.21989 .......................... 4,206 28.8 21.3 824 5.6 5.2 1,953 13.4 7.3 1,429 9.8 8.8 1,315 9.0 7.71988 .......................... 4,204 29.5 21.8 825 5.8 5.4 1,948 13.7 7.5 1,431 10.0 9.0 1,382 9.7 8.31987 .......................... 4,061 29.2 21.7 734 5.3 4.9 1,849 13.3 7.3 1,478 10.6 9.5 1,258 9.0 7.81986 .......................... 4,093 30.1 22.6 809 5.9 5.5 1,851 13.6 7.7 1,433 10.5 9.4 1,401 10.3 8.8
- 25 -

Table 1. Number of deaths and unadjusted and age-adjusted death rates per 100,000 population for different categories of alcohol-related mortality byState: United States, 1979–92.
California
Race, sex,and year
All Alcohol-Related Causes of DeathAll Chronic Liver Disease and
CirrhosisTotal Causes of Death with ExplicitMention of Alcohol
Other Alcohol-Related Diseases Other Alcohol-Related Injuries orAdverse Effects
Number Unadj.Rate
Age-Adj.Rate Number Unadj.
RateAge-Adj.
Rate Number Unadj.Rate
Age-Adj.Rate Number Unadj.
RateAge-Adj.
Rate Number Unadj.Rate
Age-Adj.Rate
All races, female
1985 .......................... 4,105 30.9 23.0 735 5.5 5.2 1,893 14.2 8.0 1,477 11.1 9.8 1,395 10.5 8.91984 .......................... 4,119 31.6 24.0 854 6.6 6.1 1,793 13.8 7.8 1,472 11.3 10.1 1,416 10.9 9.41983 .......................... 3,915 30.6 23.2 834 6.5 6.1 1,723 13.5 7.7 1,358 10.6 9.4 1,351 10.6 9.31982 .......................... 4,078 32.5 24.8 881 7.0 6.5 1,745 13.9 8.0 1,452 11.6 10.3 1,476 11.8 10.21981 .......................... 4,124 33.6 26.0 897 7.3 6.9 1,725 14.0 8.1 1,502 12.2 11.1 1,469 12.0 10.51980 .......................... 4,256 35.3 27.3 924 7.7 7.1 1,779 14.7 8.6 1,553 12.9 11.5 1,553 12.9 11.41979 .......................... 4,105 34.8 27.3 873 7.4 6.9 1,688 14.3 8.5 1,544 13.1 11.9 1,447 12.3 10.9
White, male1992 .......................... 7,498 59.8 55.8 2,198 17.5 17.1 2,016 16.1 13.0 3,284 26.2 25.8 2,248 17.9 17.21991 .......................... 7,420 59.9 55.9 2,034 16.4 16.2 1,985 16.0 13.0 3,400 27.5 26.7 2,153 17.4 16.81990 .......................... 7,487 61.2 56.7 2,100 17.2 16.8 1,918 15.7 12.8 3,470 28.4 27.2 2,322 19.0 18.31989 .......................... 7,428 61.9 56.9 2,083 17.4 16.9 1,974 16.5 13.4 3,372 28.1 26.6 2,371 19.8 19.11988 .......................... 7,510 64.1 58.8 2,089 17.8 17.5 2,068 17.6 14.4 3,354 28.6 26.9 2,481 21.2 20.51987 .......................... 7,284 63.5 58.1 1,977 17.2 17.0 1,964 17.1 13.8 3,343 29.1 27.4 2,344 20.4 19.71986 .......................... 7,189 64.0 58.6 1,810 16.1 15.8 1,908 17.0 13.8 3,471 30.9 29.0 2,278 20.3 19.5
1985 .......................... 6,871 62.6 57.1 1,675 15.2 14.9 1,934 17.6 14.4 3,262 29.7 27.9 2,231 20.3 19.51984 .......................... 7,079 65.8 60.3 1,897 17.6 17.1 1,871 17.4 14.2 3,311 30.8 29.0 2,401 22.3 21.41983 .......................... 6,896 65.1 59.6 1,867 17.6 17.1 1,854 17.5 14.3 3,175 30.0 28.2 2,368 22.3 21.31982 .......................... 6,974 67.1 61.4 1,840 17.7 17.1 1,856 17.8 14.6 3,278 31.5 29.8 2,391 23.0 22.01981 .......................... 7,266 71.1 65.2 1,842 18.0 17.5 1,897 18.6 15.2 3,527 34.5 32.5 2,445 23.9 22.81980 .......................... 7,508 74.7 68.7 1,898 18.9 18.4 1,879 18.7 15.2 3,732 37.1 35.1 2,542 25.3 24.11979 .......................... 7,379 74.6 69.0 1,895 19.1 18.7 1,841 18.6 15.3 3,643 36.8 34.9 2,435 24.6 23.7
Black, male1992 .......................... 1,008 85.5 93.6 209 17.7 21.7 210 17.8 22.3 589 49.9 49.6 182 15.4 19.11991 .......................... 1,058 91.1 99.7 192 16.5 20.7 216 18.6 23.8 649 55.9 55.2 180 15.5 19.71990 .......................... 1,057 92.6 101.3 238 20.9 25.8 204 17.9 22.7 615 53.9 52.8 216 18.9 23.41989 .......................... 1,042 93.5 101.5 247 22.2 27.0 206 18.4 23.4 590 52.9 51.1 208 18.7 22.91988 .......................... 1,003 92.5 101.2 238 21.9 27.3 208 19.2 24.1 557 51.4 49.8 215 19.8 24.61987 .......................... 1,048 99.0 108.2 263 24.9 30.7 201 19.0 23.9 584 55.2 53.6 241 22.8 28.21986 .......................... 1,054 102.2 111.8 264 25.6 31.9 214 20.7 25.9 577 55.9 54.1 235 22.8 28.4
1985 .......................... 950 94.4 104.7 255 25.3 31.2 203 20.2 25.5 491 48.8 48.0 249 24.7 30.71984 .......................... 921 93.5 103.4 225 22.8 28.4 198 20.1 25.3 497 50.5 49.6 238 24.2 30.11983 .......................... 892 92.3 103.1 209 21.6 26.8 203 21.0 26.8 480 49.7 49.5 210 21.7 27.11982 .......................... 951 100.6 112.7 258 27.3 34.2 185 19.6 25.0 508 53.7 53.5 220 23.3 29.41981 .......................... 1,026 111.0 123.1 240 26.0 32.2 217 23.5 30.0 568 61.5 60.9 241 26.1 32.2
- 26 -

Table 1. Number of deaths and unadjusted and age-adjusted death rates per 100,000 population for different categories of alcohol-related mortality byState: United States, 1979–92.
California
Race, sex,and year
All Alcohol-Related Causes of DeathAll Chronic Liver Disease and
CirrhosisTotal Causes of Death with ExplicitMention of Alcohol
Other Alcohol-Related Diseases Other Alcohol-Related Injuries orAdverse Effects
Number Unadj.Rate
Age-Adj.Rate Number Unadj.
RateAge-Adj.
Rate Number Unadj.Rate
Age-Adj.Rate Number Unadj.
RateAge-Adj.
Rate Number Unadj.Rate
Age-Adj.Rate
Black, male1980 .......................... 1,073 118.2 132.1 269 29.6 37.0 210 23.2 29.7 594 65.4 65.4 274 30.2 37.61979 .......................... 988 113.9 128.1 247 28.5 35.5 205 23.6 30.1 536 61.8 62.5 253 29.2 36.9
White, female1992 .......................... 3,443 27.8 19.4 713 5.7 5.1 1,622 13.1 6.4 1,109 8.9 7.9 1,067 8.6 7.11991 .......................... 3,535 28.8 20.6 752 6.1 5.5 1,659 13.5 6.8 1,124 9.2 8.2 1,160 9.5 7.71990 .......................... 3,566 29.4 20.8 720 5.9 5.4 1,671 13.8 6.7 1,175 9.7 8.7 1,129 9.3 7.61989 .......................... 3,601 30.3 21.2 703 5.9 5.3 1,721 14.5 7.2 1,177 9.9 8.7 1,153 9.7 7.91988 .......................... 3,598 30.8 21.6 708 6.1 5.5 1,719 14.7 7.3 1,171 10.0 8.8 1,208 10.4 8.51987 .......................... 3,476 30.3 21.4 632 5.5 5.0 1,628 14.2 7.1 1,216 10.6 9.3 1,100 9.6 8.01986 .......................... 3,546 31.5 22.5 698 6.2 5.6 1,648 14.6 7.6 1,200 10.7 9.3 1,239 11.0 9.1
1985 .......................... 3,551 32.1 22.7 630 5.7 5.2 1,685 15.2 7.8 1,236 11.2 9.7 1,228 11.1 9.11984 .......................... 3,593 33.0 23.9 731 6.7 6.1 1,594 14.7 7.6 1,267 11.6 10.2 1,247 11.5 9.51983 .......................... 3,445 32.0 23.2 724 6.7 6.1 1,551 14.4 7.6 1,170 10.9 9.4 1,212 11.3 9.51982 .......................... 3,598 34.0 24.7 772 7.3 6.5 1,576 14.9 7.9 1,249 11.8 10.3 1,324 12.5 10.31981 .......................... 3,628 34.7 25.7 786 7.5 6.8 1,555 14.9 7.9 1,287 12.3 11.0 1,309 12.5 10.61980 .......................... 3,785 36.7 27.2 817 7.9 7.1 1,604 15.6 8.4 1,364 13.2 11.7 1,398 13.6 11.61979 .......................... 3,646 35.9 27.0 762 7.5 6.8 1,539 15.1 8.3 1,345 13.2 11.9 1,296 12.7 10.9
Black, female1992 .......................... 379 31.8 30.3 79 6.6 7.0 144 12.0 10.5 156 13.1 12.8 92 7.7 8.01991 .......................... 391 33.3 32.0 88 7.5 7.7 145 12.3 11.2 158 13.5 13.1 103 8.8 8.81990 .......................... 380 32.9 31.2 89 7.7 7.9 144 12.5 11.1 147 12.7 12.1 101 8.7 8.61989 .......................... 386 34.1 33.1 96 8.5 9.3 137 12.1 10.7 152 13.5 13.1 106 9.4 10.21988 .......................... 387 35.1 33.8 92 8.3 8.9 136 12.3 11.0 159 14.4 13.9 111 10.0 10.51987 .......................... 399 37.0 36.2 92 8.5 9.3 143 13.3 12.3 164 15.2 14.6 112 10.4 11.21986 .......................... 361 34.2 33.6 97 9.2 10.2 123 11.7 10.5 140 13.3 12.9 110 10.4 11.5
1985 .......................... 368 35.7 35.2 86 8.3 9.3 133 12.8 12.0 150 14.5 13.9 120 11.6 12.81984 .......................... 367 36.1 36.5 103 10.2 11.4 128 12.7 12.1 135 13.3 13.0 130 12.8 14.11983 .......................... 329 32.9 33.6 96 9.6 11.1 113 11.3 10.9 119 12.0 11.7 110 11.0 12.61982 .......................... 352 35.9 37.3 96 9.8 11.5 114 11.6 11.4 142 14.4 14.4 124 12.7 14.71981 .......................... 373 38.8 40.1 99 10.3 11.9 122 12.7 12.6 153 15.9 15.6 127 13.2 14.91980 .......................... 363 38.3 39.7 96 10.1 11.7 128 13.5 13.7 139 14.7 14.3 130 13.7 15.71979 .......................... 353 38.9 40.3 98 10.8 12.4 111 12.3 12.3 144 15.8 15.7 123 13.6 15.5
- 27 -

Table 1. Number of deaths and unadjusted and age-adjusted death rates per 100,000 population for different categories of alcohol-related mortality byState: United States, 1979–92.
Colorado
Race, sex,and year
All Alcohol-Related Causes of DeathAll Chronic Liver Disease and
CirrhosisTotal Causes of Death with ExplicitMention of Alcohol
Other Alcohol-Related Diseases Other Alcohol-Related Injuries orAdverse Effects
Number Unadj.Rate
Age-Adj.Rate Number Unadj.
RateAge-Adj.
Rate Number Unadj.Rate
Age-Adj.Rate Number Unadj.
RateAge-Adj.
Rate Number Unadj.Rate
Age-Adj.Rate
All races, both sexes1992 .......................... 1,376 39.7 33.9 390 11.3 10.2 380 11.0 7.2 606 17.5 16.5 310 8.9 7.81991 .......................... 1,389 41.2 35.6 387 11.5 10.7 394 11.7 7.9 608 18.0 16.9 322 9.6 8.61990 .......................... 1,295 39.2 33.5 345 10.4 9.6 380 11.5 7.9 570 17.2 16.0 296 9.0 8.01989 .......................... 1,289 39.4 34.0 355 10.8 10.3 370 11.3 7.7 565 17.2 16.0 328 10.0 9.11988 .......................... 1,250 38.3 33.4 294 9.0 8.5 357 10.9 7.7 599 18.4 17.2 277 8.5 7.81987 .......................... 1,235 37.9 33.1 250 7.7 7.4 361 11.1 7.9 625 19.2 17.8 260 8.0 7.41986 .......................... 1,253 38.7 34.7 231 7.1 7.1 376 11.6 8.8 646 20.0 18.8 310 9.6 9.0
1985 .......................... 1,217 37.9 33.8 218 6.8 6.9 372 11.6 8.7 627 19.6 18.2 279 8.7 8.51984 .......................... 1,155 36.4 32.9 209 6.6 6.7 340 10.7 8.2 607 19.1 18.1 299 9.4 9.11983 .......................... 1,176 37.5 34.0 186 5.9 6.0 344 11.0 8.7 646 20.6 19.3 289 9.2 9.11982 .......................... 1,200 39.2 35.8 215 7.0 7.3 342 11.2 9.0 643 21.0 19.6 291 9.5 9.61981 .......................... 1,245 41.8 38.5 209 7.0 7.4 335 11.3 9.1 701 23.5 22.0 268 9.0 9.31980 .......................... 1,216 41.8 38.5 210 7.2 7.7 348 12.0 9.7 658 22.6 21.1 286 9.8 10.31979 .......................... 1,163 40.8 37.9 197 6.9 7.4 331 11.6 9.5 635 22.3 21.1 285 10.0 10.3
All races, male1992 .......................... 919 53.5 49.8 292 17.0 16.0 202 11.8 9.8 425 24.7 24.1 203 11.8 11.01991 .......................... 918 55.0 52.0 276 16.5 16.1 210 12.6 10.7 433 25.9 25.3 209 12.5 11.91990 .......................... 858 52.4 49.0 249 15.2 14.5 206 12.6 10.8 402 24.6 23.7 194 11.9 11.21989 .......................... 852 52.5 49.5 262 16.1 16.1 203 12.5 10.6 387 23.8 22.8 224 13.8 13.41988 .......................... 803 49.6 47.0 209 12.9 12.6 187 11.5 10.2 408 25.2 24.2 177 10.9 10.61987 .......................... 806 49.8 47.7 177 10.9 11.1 193 11.9 10.7 436 27.0 25.9 168 10.4 10.31986 .......................... 816 50.8 49.3 163 10.1 10.4 196 12.2 11.4 457 28.5 27.5 197 12.3 12.2
1985 .......................... 809 50.8 49.2 158 9.9 10.4 206 12.9 12.2 445 28.0 26.6 181 11.4 11.71984 .......................... 746 47.5 46.1 131 8.3 8.5 179 11.4 10.7 436 27.8 26.9 171 10.9 11.01983 .......................... 781 50.2 49.0 138 8.9 9.3 184 11.8 11.5 459 29.5 28.2 190 12.2 12.81982 .......................... 815 53.6 52.5 147 9.7 10.3 198 13.0 12.7 470 30.9 29.5 190 12.5 13.31981 .......................... 815 55.1 54.1 148 10.0 10.9 171 11.6 11.4 496 33.5 31.7 154 10.4 11.31980 .......................... 796 55.1 54.6 146 10.1 11.0 192 13.3 13.1 458 31.7 30.5 163 11.3 12.31979 .......................... 788 55.7 55.1 136 9.6 10.4 187 13.2 13.1 465 32.9 31.6 176 12.4 13.6
All races, female1992 .......................... 456 26.1 19.0 98 5.6 4.8 178 10.2 5.2 181 10.3 9.1 107 6.1 4.81991 .......................... 470 27.7 20.1 111 6.5 5.7 184 10.8 5.5 175 10.3 8.8 113 6.6 5.41990 .......................... 437 26.2 19.1 96 5.8 5.2 173 10.4 5.5 167 10.0 8.5 102 6.1 5.01989 .......................... 438 26.5 20.0 93 5.6 5.1 167 10.1 5.3 178 10.8 9.5 104 6.3 5.21988 .......................... 447 27.2 20.8 85 5.2 4.8 170 10.3 5.7 191 11.6 10.3 100 6.1 5.31987 .......................... 429 26.1 19.9 73 4.4 4.2 168 10.2 5.6 189 11.5 10.1 92 5.6 4.91986 .......................... 437 26.8 20.9 68 4.2 4.0 180 11.0 6.6 189 11.6 10.3 113 6.9 6.1
- 28 -
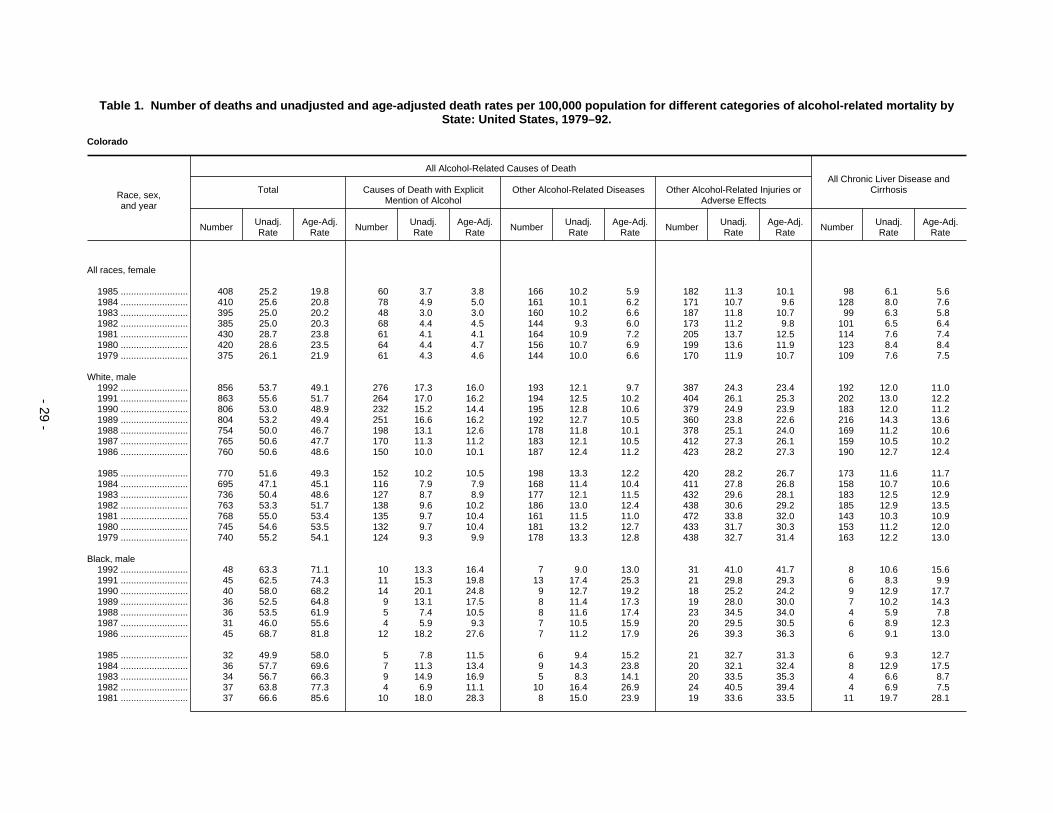
Table 1. Number of deaths and unadjusted and age-adjusted death rates per 100,000 population for different categories of alcohol-related mortality byState: United States, 1979–92.
Colorado
Race, sex,and year
All Alcohol-Related Causes of DeathAll Chronic Liver Disease and
CirrhosisTotal Causes of Death with ExplicitMention of Alcohol
Other Alcohol-Related Diseases Other Alcohol-Related Injuries orAdverse Effects
Number Unadj.Rate
Age-Adj.Rate Number Unadj.
RateAge-Adj.
Rate Number Unadj.Rate
Age-Adj.Rate Number Unadj.
RateAge-Adj.
Rate Number Unadj.Rate
Age-Adj.Rate
All races, female
1985 .......................... 408 25.2 19.8 60 3.7 3.8 166 10.2 5.9 182 11.3 10.1 98 6.1 5.61984 .......................... 410 25.6 20.8 78 4.9 5.0 161 10.1 6.2 171 10.7 9.6 128 8.0 7.61983 .......................... 395 25.0 20.2 48 3.0 3.0 160 10.2 6.6 187 11.8 10.7 99 6.3 5.81982 .......................... 385 25.0 20.3 68 4.4 4.5 144 9.3 6.0 173 11.2 9.8 101 6.5 6.41981 .......................... 430 28.7 23.8 61 4.1 4.1 164 10.9 7.2 205 13.7 12.5 114 7.6 7.41980 .......................... 420 28.6 23.5 64 4.4 4.7 156 10.7 6.9 199 13.6 11.9 123 8.4 8.41979 .......................... 375 26.1 21.9 61 4.3 4.6 144 10.0 6.6 170 11.9 10.7 109 7.6 7.5
White, male1992 .......................... 856 53.7 49.1 276 17.3 16.0 193 12.1 9.7 387 24.3 23.4 192 12.0 11.01991 .......................... 863 55.6 51.7 264 17.0 16.2 194 12.5 10.2 404 26.1 25.3 202 13.0 12.21990 .......................... 806 53.0 48.9 232 15.2 14.4 195 12.8 10.6 379 24.9 23.9 183 12.0 11.21989 .......................... 804 53.2 49.4 251 16.6 16.2 192 12.7 10.5 360 23.8 22.6 216 14.3 13.61988 .......................... 754 50.0 46.7 198 13.1 12.6 178 11.8 10.1 378 25.1 24.0 169 11.2 10.61987 .......................... 765 50.6 47.7 170 11.3 11.2 183 12.1 10.5 412 27.3 26.1 159 10.5 10.21986 .......................... 760 50.6 48.6 150 10.0 10.1 187 12.4 11.2 423 28.2 27.3 190 12.7 12.4
1985 .......................... 770 51.6 49.3 152 10.2 10.5 198 13.3 12.2 420 28.2 26.7 173 11.6 11.71984 .......................... 695 47.1 45.1 116 7.9 7.9 168 11.4 10.4 411 27.8 26.8 158 10.7 10.61983 .......................... 736 50.4 48.6 127 8.7 8.9 177 12.1 11.5 432 29.6 28.1 183 12.5 12.91982 .......................... 763 53.3 51.7 138 9.6 10.2 186 13.0 12.4 438 30.6 29.2 185 12.9 13.51981 .......................... 768 55.0 53.4 135 9.7 10.4 161 11.5 11.0 472 33.8 32.0 143 10.3 10.91980 .......................... 745 54.6 53.5 132 9.7 10.4 181 13.2 12.7 433 31.7 30.3 153 11.2 12.01979 .......................... 740 55.2 54.1 124 9.3 9.9 178 13.3 12.8 438 32.7 31.4 163 12.2 13.0
Black, male1992 .......................... 48 63.3 71.1 10 13.3 16.4 7 9.0 13.0 31 41.0 41.7 8 10.6 15.61991 .......................... 45 62.5 74.3 11 15.3 19.8 13 17.4 25.3 21 29.8 29.3 6 8.3 9.91990 .......................... 40 58.0 68.2 14 20.1 24.8 9 12.7 19.2 18 25.2 24.2 9 12.9 17.71989 .......................... 36 52.5 64.8 9 13.1 17.5 8 11.4 17.3 19 28.0 30.0 7 10.2 14.31988 .......................... 36 53.5 61.9 5 7.4 10.5 8 11.6 17.4 23 34.5 34.0 4 5.9 7.81987 .......................... 31 46.0 55.6 4 5.9 9.3 7 10.5 15.9 20 29.5 30.5 6 8.9 12.31986 .......................... 45 68.7 81.8 12 18.2 27.6 7 11.2 17.9 26 39.3 36.3 6 9.1 13.0
1985 .......................... 32 49.9 58.0 5 7.8 11.5 6 9.4 15.2 21 32.7 31.3 6 9.3 12.71984 .......................... 36 57.7 69.6 7 11.3 13.4 9 14.3 23.8 20 32.1 32.4 8 12.9 17.51983 .......................... 34 56.7 66.3 9 14.9 16.9 5 8.3 14.1 20 33.5 35.3 4 6.6 8.71982 .......................... 37 63.8 77.3 4 6.9 11.1 10 16.4 26.9 24 40.5 39.4 4 6.9 7.51981 .......................... 37 66.6 85.6 10 18.0 28.3 8 15.0 23.9 19 33.6 33.5 11 19.7 28.1
- 29 -

Table 1. Number of deaths and unadjusted and age-adjusted death rates per 100,000 population for different categories of alcohol-related mortality byState: United States, 1979–92.
Colorado
Race, sex,and year
All Alcohol-Related Causes of DeathAll Chronic Liver Disease and
CirrhosisTotal Causes of Death with ExplicitMention of Alcohol
Other Alcohol-Related Diseases Other Alcohol-Related Injuries orAdverse Effects
Number Unadj.Rate
Age-Adj.Rate Number Unadj.
RateAge-Adj.
Rate Number Unadj.Rate
Age-Adj.Rate Number Unadj.
RateAge-Adj.
Rate Number Unadj.Rate
Age-Adj.Rate
Black, male1980 .......................... 41 76.8 109.7 12 22.5 39.3 9 17.3 29.1 20 37.0 41.3 7 13.1 20.61979 .......................... 35 68.1 80.5 7 13.7 18.7 8 15.4 25.0 20 39.0 36.7 10 19.6 26.2
White, female1992 .......................... 422 26.0 18.4 83 5.1 4.2 170 10.5 5.1 169 10.4 9.1 98 6.0 4.61991 .......................... 440 27.8 19.8 103 6.5 5.6 173 10.9 5.3 165 10.4 8.9 104 6.6 5.21990 .......................... 407 26.2 18.6 84 5.4 4.8 166 10.7 5.4 157 10.1 8.4 96 6.2 5.01989 .......................... 410 26.6 19.7 82 5.3 4.8 160 10.4 5.3 168 10.9 9.6 93 6.0 4.91988 .......................... 417 27.2 20.3 76 5.0 4.5 163 10.6 5.7 177 11.6 10.2 94 6.1 5.21987 .......................... 402 26.2 19.4 65 4.2 3.9 160 10.4 5.5 177 11.5 10.0 85 5.5 4.61986 .......................... 406 26.6 20.3 59 3.9 3.6 169 11.1 6.4 178 11.6 10.2 105 6.9 6.0
1985 .......................... 381 25.1 19.3 55 3.6 3.7 157 10.3 5.7 169 11.2 9.9 92 6.1 5.51984 .......................... 385 25.6 20.5 68 4.5 4.6 154 10.3 6.1 163 10.8 9.7 116 7.7 7.21983 .......................... 377 25.3 20.1 46 3.1 3.0 153 10.3 6.4 177 11.9 10.7 96 6.5 5.81982 .......................... 367 25.3 20.2 62 4.3 4.3 140 9.6 6.0 166 11.4 9.9 95 6.5 6.31981 .......................... 403 28.5 23.1 55 3.9 3.8 156 11.0 7.0 192 13.6 12.3 100 7.1 6.61980 .......................... 395 28.5 23.0 58 4.2 4.4 149 10.8 6.8 187 13.5 11.7 110 7.9 7.81979 .......................... 353 26.0 21.3 53 3.9 4.1 139 10.3 6.6 161 11.8 10.6 100 7.4 7.1
Black, female1992 .......................... 18 25.5 26.3 7 9.8 10.7 6 8.0 7.9 6 7.7 7.6 2 2.8 3.01991 .......................... 22 31.7 32.1 7 10.2 10.9 9 12.8 12.4 6 8.7 8.8 8 11.7 12.31990 .......................... 24 36.2 37.3 11 16.5 17.2 6 9.1 9.2 7 10.5 10.8 5 7.5 8.91989 .......................... 17 25.4 26.5 7 10.7 13.0 4 6.1 5.7 6 8.6 7.8 6 9.2 11.01988 .......................... 20 30.7 32.8 5 7.7 9.8 6 8.5 8.6 9 14.4 14.5 4 6.2 8.01987 .......................... 17 27.3 30.0 3 4.7 6.3 7 11.0 12.1 7 11.6 11.6 3 4.7 6.31986 .......................... 18 28.7 30.0 4 6.4 7.2 6 10.2 11.3 8 12.1 11.5 3 4.8 6.6
1985 .......................... 17 27.1 27.9 3 4.9 4.8 6 9.5 10.3 8 12.7 12.9 0 0.0 0.01984 .......................... 14 23.1 26.4 5 8.4 10.8 4 6.7 7.5 5 7.9 8.1 6 10.1 13.61983 .......................... 12 20.3 22.3 1 1.7 1.4 5 9.1 11.0 6 9.5 9.9 1 1.7 2.41982 .......................... 11 19.7 22.8 3 5.4 6.5 3 5.1 6.0 5 9.2 10.3 3 5.4 5.41981 .......................... 15 28.3 30.8 3 5.7 7.7 5 10.1 11.3 7 12.6 11.8 7 13.2 16.61980 .......................... 16 31.5 34.1 3 5.9 6.7 5 9.7 11.7 8 16.0 15.7 6 11.8 16.21979 .......................... 18 36.5 43.5 6 12.5 17.1 4 7.5 8.6 8 16.5 17.7 7 14.6 19.2
- 30 -
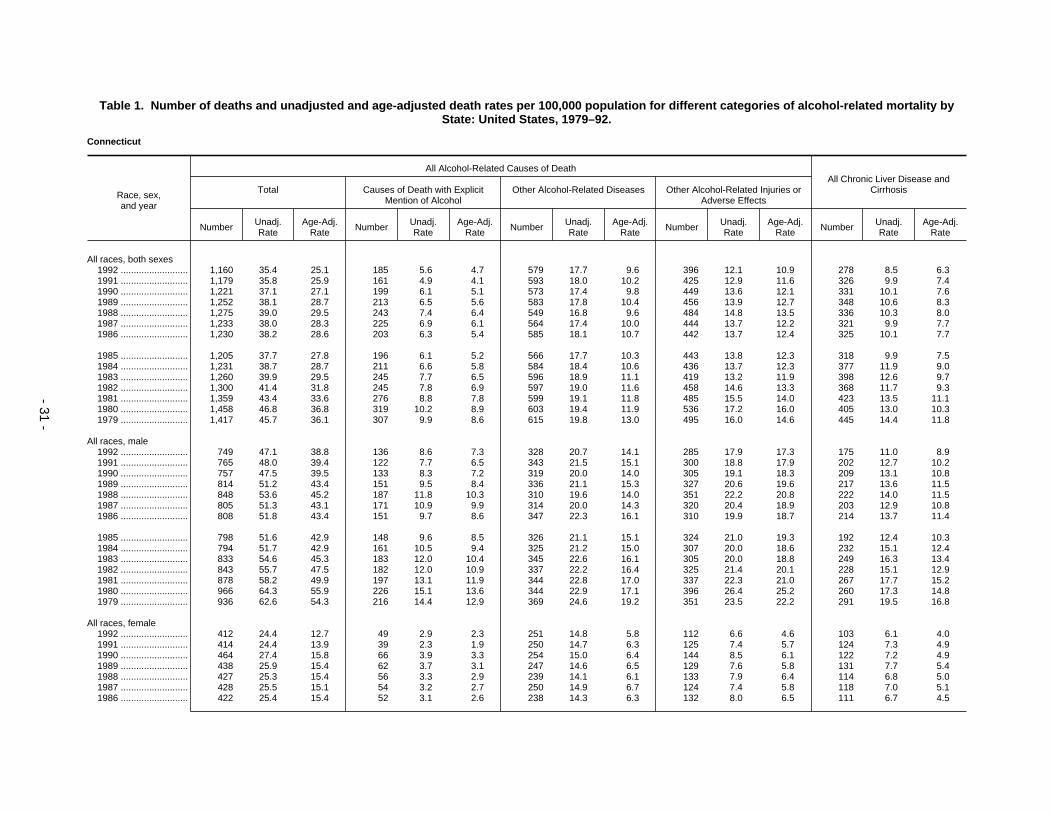
Table 1. Number of deaths and unadjusted and age-adjusted death rates per 100,000 population for different categories of alcohol-related mortality byState: United States, 1979–92.
Connecticut
Race, sex,and year
All Alcohol-Related Causes of DeathAll Chronic Liver Disease and
CirrhosisTotal Causes of Death with ExplicitMention of Alcohol
Other Alcohol-Related Diseases Other Alcohol-Related Injuries orAdverse Effects
Number Unadj.Rate
Age-Adj.Rate Number Unadj.
RateAge-Adj.
Rate Number Unadj.Rate
Age-Adj.Rate Number Unadj.
RateAge-Adj.
Rate Number Unadj.Rate
Age-Adj.Rate
All races, both sexes1992 .......................... 1,160 35.4 25.1 185 5.6 4.7 579 17.7 9.6 396 12.1 10.9 278 8.5 6.31991 .......................... 1,179 35.8 25.9 161 4.9 4.1 593 18.0 10.2 425 12.9 11.6 326 9.9 7.41990 .......................... 1,221 37.1 27.1 199 6.1 5.1 573 17.4 9.8 449 13.6 12.1 331 10.1 7.61989 .......................... 1,252 38.1 28.7 213 6.5 5.6 583 17.8 10.4 456 13.9 12.7 348 10.6 8.31988 .......................... 1,275 39.0 29.5 243 7.4 6.4 549 16.8 9.6 484 14.8 13.5 336 10.3 8.01987 .......................... 1,233 38.0 28.3 225 6.9 6.1 564 17.4 10.0 444 13.7 12.2 321 9.9 7.71986 .......................... 1,230 38.2 28.6 203 6.3 5.4 585 18.1 10.7 442 13.7 12.4 325 10.1 7.7
1985 .......................... 1,205 37.7 27.8 196 6.1 5.2 566 17.7 10.3 443 13.8 12.3 318 9.9 7.51984 .......................... 1,231 38.7 28.7 211 6.6 5.8 584 18.4 10.6 436 13.7 12.3 377 11.9 9.01983 .......................... 1,260 39.9 29.5 245 7.7 6.5 596 18.9 11.1 419 13.2 11.9 398 12.6 9.71982 .......................... 1,300 41.4 31.8 245 7.8 6.9 597 19.0 11.6 458 14.6 13.3 368 11.7 9.31981 .......................... 1,359 43.4 33.6 276 8.8 7.8 599 19.1 11.8 485 15.5 14.0 423 13.5 11.11980 .......................... 1,458 46.8 36.8 319 10.2 8.9 603 19.4 11.9 536 17.2 16.0 405 13.0 10.31979 .......................... 1,417 45.7 36.1 307 9.9 8.6 615 19.8 13.0 495 16.0 14.6 445 14.4 11.8
All races, male1992 .......................... 749 47.1 38.8 136 8.6 7.3 328 20.7 14.1 285 17.9 17.3 175 11.0 8.91991 .......................... 765 48.0 39.4 122 7.7 6.5 343 21.5 15.1 300 18.8 17.9 202 12.7 10.21990 .......................... 757 47.5 39.5 133 8.3 7.2 319 20.0 14.0 305 19.1 18.3 209 13.1 10.81989 .......................... 814 51.2 43.4 151 9.5 8.4 336 21.1 15.3 327 20.6 19.6 217 13.6 11.51988 .......................... 848 53.6 45.2 187 11.8 10.3 310 19.6 14.0 351 22.2 20.8 222 14.0 11.51987 .......................... 805 51.3 43.1 171 10.9 9.9 314 20.0 14.3 320 20.4 18.9 203 12.9 10.81986 .......................... 808 51.8 43.4 151 9.7 8.6 347 22.3 16.1 310 19.9 18.7 214 13.7 11.4
1985 .......................... 798 51.6 42.9 148 9.6 8.5 326 21.1 15.1 324 21.0 19.3 192 12.4 10.31984 .......................... 794 51.7 42.9 161 10.5 9.4 325 21.2 15.0 307 20.0 18.6 232 15.1 12.41983 .......................... 833 54.6 45.3 183 12.0 10.4 345 22.6 16.1 305 20.0 18.8 249 16.3 13.41982 .......................... 843 55.7 47.5 182 12.0 10.9 337 22.2 16.4 325 21.4 20.1 228 15.1 12.91981 .......................... 878 58.2 49.9 197 13.1 11.9 344 22.8 17.0 337 22.3 21.0 267 17.7 15.21980 .......................... 966 64.3 55.9 226 15.1 13.6 344 22.9 17.1 396 26.4 25.2 260 17.3 14.81979 .......................... 936 62.6 54.3 216 14.4 12.9 369 24.6 19.2 351 23.5 22.2 291 19.5 16.8
All races, female1992 .......................... 412 24.4 12.7 49 2.9 2.3 251 14.8 5.8 112 6.6 4.6 103 6.1 4.01991 .......................... 414 24.4 13.9 39 2.3 1.9 250 14.7 6.3 125 7.4 5.7 124 7.3 4.91990 .......................... 464 27.4 15.8 66 3.9 3.3 254 15.0 6.4 144 8.5 6.1 122 7.2 4.91989 .......................... 438 25.9 15.4 62 3.7 3.1 247 14.6 6.5 129 7.6 5.8 131 7.7 5.41988 .......................... 427 25.3 15.4 56 3.3 2.9 239 14.1 6.1 133 7.9 6.4 114 6.8 5.01987 .......................... 428 25.5 15.1 54 3.2 2.7 250 14.9 6.7 124 7.4 5.8 118 7.0 5.11986 .......................... 422 25.4 15.4 52 3.1 2.6 238 14.3 6.3 132 8.0 6.5 111 6.7 4.5
- 31 -

Table 1. Number of deaths and unadjusted and age-adjusted death rates per 100,000 population for different categories of alcohol-related mortality byState: United States, 1979–92.
Connecticut
Race, sex,and year
All Alcohol-Related Causes of DeathAll Chronic Liver Disease and
CirrhosisTotal Causes of Death with ExplicitMention of Alcohol
Other Alcohol-Related Diseases Other Alcohol-Related Injuries orAdverse Effects
Number Unadj.Rate
Age-Adj.Rate Number Unadj.
RateAge-Adj.
Rate Number Unadj.Rate
Age-Adj.Rate Number Unadj.
RateAge-Adj.
Rate Number Unadj.Rate
Age-Adj.Rate
All races, female
1985 .......................... 407 24.6 14.5 48 2.9 2.4 240 14.5 6.5 119 7.2 5.6 126 7.6 5.21984 .......................... 437 26.6 16.4 50 3.0 2.7 258 15.7 7.3 129 7.8 6.4 145 8.8 6.21983 .......................... 427 26.1 15.7 62 3.8 3.1 252 15.4 7.3 114 6.9 5.4 149 9.1 6.51982 .......................... 457 28.1 18.1 63 3.9 3.3 260 16.0 7.9 133 8.2 6.9 140 8.6 6.21981 .......................... 481 29.7 19.5 79 4.9 4.3 254 15.7 7.9 148 9.1 7.3 156 9.6 7.61980 .......................... 492 30.5 20.0 93 5.8 4.8 259 16.1 7.9 140 8.7 7.3 145 9.0 6.61979 .......................... 481 30.0 20.2 91 5.7 4.8 247 15.4 8.1 143 8.9 7.3 154 9.6 7.6
White, male1992 .......................... 645 45.5 35.3 119 8.4 6.9 295 20.8 13.2 231 16.3 15.2 160 11.3 8.71991 .......................... 666 46.7 36.5 106 7.4 6.1 311 21.8 14.2 249 17.4 16.2 187 13.1 10.11990 .......................... 660 46.2 36.8 112 7.8 6.5 289 20.2 13.2 259 18.1 17.1 191 13.4 10.41989 .......................... 705 49.3 40.1 131 9.2 7.9 304 21.2 14.4 270 18.9 17.8 199 13.9 11.31988 .......................... 723 50.6 40.8 149 10.4 8.5 280 19.6 13.1 294 20.6 19.1 198 13.9 10.81987 .......................... 694 48.9 39.2 140 9.9 8.5 282 19.9 13.2 272 19.2 17.5 187 13.2 10.51986 .......................... 708 50.1 40.3 124 8.8 7.5 317 22.4 15.2 267 18.9 17.6 196 13.9 11.0
1985 .......................... 709 50.4 40.2 125 8.9 7.4 300 21.3 14.3 284 20.2 18.4 177 12.6 9.91984 .......................... 704 50.3 40.3 136 9.7 8.4 293 20.9 13.8 275 19.7 18.1 219 15.6 12.31983 .......................... 747 53.5 42.7 155 11.1 9.1 324 23.2 15.8 268 19.2 17.8 230 16.5 12.91982 .......................... 747 53.8 44.2 149 10.7 9.4 309 22.3 15.5 288 20.8 19.3 204 14.7 12.01981 .......................... 767 55.3 45.5 159 11.5 9.8 309 22.3 15.6 299 21.5 20.0 235 16.9 13.91980 .......................... 855 61.8 51.8 182 13.2 11.3 319 23.0 16.3 354 25.6 24.2 237 17.1 14.01979 .......................... 852 61.6 51.8 192 13.9 11.9 339 24.5 18.1 321 23.2 21.8 272 19.7 16.3
Black, male1992 .......................... 100 72.5 83.2 17 12.4 15.5 31 22.5 29.3 52 37.6 38.4 15 10.9 12.81991 .......................... 92 67.5 77.9 15 11.0 14.6 28 20.6 27.7 49 35.9 35.5 13 9.5 12.61990 .......................... 92 68.5 80.4 21 15.6 19.7 29 21.3 29.1 42 31.6 31.6 18 13.4 16.81989 .......................... 102 77.6 89.4 18 13.6 17.4 31 23.8 32.7 53 40.1 39.3 17 12.9 16.81988 .......................... 120 93.3 107.4 38 29.5 37.1 29 22.5 31.0 53 41.4 39.4 23 17.9 22.41987 .......................... 109 87.1 103.2 31 24.8 32.5 31 24.8 33.7 47 37.5 37.0 14 11.2 13.91986 .......................... 96 78.8 95.1 27 22.2 28.3 30 24.4 33.4 39 32.2 33.3 18 14.8 18.8
1985 .......................... 87 73.7 85.6 23 19.4 24.6 26 22.0 29.9 38 32.3 31.1 15 12.7 15.81984 .......................... 85 74.0 90.8 24 20.8 26.7 32 27.5 37.7 30 25.7 26.4 12 10.4 13.41983 .......................... 83 74.1 86.8 28 24.8 31.2 20 17.3 24.1 36 31.9 31.5 19 16.9 20.61982 .......................... 93 85.0 105.2 32 29.2 37.6 27 24.3 33.8 34 31.5 33.8 22 20.1 26.11981 .......................... 109 101.4 126.9 37 34.5 44.9 34 32.1 44.3 37 34.8 37.8 30 28.0 35.7
- 32 -

Table 1. Number of deaths and unadjusted and age-adjusted death rates per 100,000 population for different categories of alcohol-related mortality byState: United States, 1979–92.
Connecticut
Race, sex,and year
All Alcohol-Related Causes of DeathAll Chronic Liver Disease and
CirrhosisTotal Causes of Death with ExplicitMention of Alcohol
Other Alcohol-Related Diseases Other Alcohol-Related Injuries orAdverse Effects
Number Unadj.Rate
Age-Adj.Rate Number Unadj.
RateAge-Adj.
Rate Number Unadj.Rate
Age-Adj.Rate Number Unadj.
RateAge-Adj.
Rate Number Unadj.Rate
Age-Adj.Rate
Black, male1980 .......................... 109 104.7 132.0 44 42.1 56.9 25 23.7 33.6 41 38.9 41.5 22 21.0 29.01979 .......................... 83 82.5 105.0 24 23.8 31.5 29 28.9 40.1 30 29.8 33.3 19 18.8 24.4
White, female1992 .......................... 378 25.1 12.2 44 2.9 2.3 233 15.5 5.5 101 6.7 4.4 96 6.4 4.01991 .......................... 380 25.1 13.4 35 2.3 1.9 235 15.5 6.1 110 7.3 5.4 116 7.7 4.91990 .......................... 423 27.9 15.0 53 3.5 2.8 240 15.8 6.3 130 8.6 5.9 112 7.4 4.71989 .......................... 403 26.5 14.8 55 3.6 2.9 233 15.3 6.3 114 7.5 5.6 124 8.2 5.31988 .......................... 390 25.7 14.5 44 2.9 2.4 227 14.9 6.0 119 7.9 6.1 105 6.9 4.81987 .......................... 401 26.5 15.1 50 3.3 2.7 235 15.5 6.5 116 7.6 5.9 111 7.3 5.11986 .......................... 385 25.6 14.5 44 2.9 2.3 221 14.7 5.9 120 8.0 6.3 101 6.7 4.2
1985 .......................... 378 25.1 14.0 41 2.7 2.1 227 15.1 6.4 109 7.3 5.5 116 7.7 5.01984 .......................... 400 26.7 15.6 37 2.5 2.1 246 16.4 7.2 117 7.8 6.3 134 9.0 6.01983 .......................... 394 26.4 14.9 54 3.6 2.8 237 15.9 7.0 103 6.9 5.2 139 9.3 6.31982 .......................... 420 28.3 17.3 53 3.6 2.8 242 16.3 7.5 125 8.4 7.0 128 8.6 5.91981 .......................... 437 29.4 18.1 63 4.2 3.5 239 16.1 7.5 134 9.0 7.0 141 9.5 7.21980 .......................... 445 30.1 18.4 74 5.0 3.8 244 16.5 7.6 127 8.6 7.0 131 8.8 6.11979 .......................... 445 30.1 19.4 78 5.3 4.3 232 15.7 7.7 135 9.1 7.3 143 9.7 7.4
Black, female1992 .......................... 32 21.3 20.6 5 3.3 3.4 18 11.7 11.2 10 6.3 6.0 7 4.6 4.61991 .......................... 31 20.6 20.0 4 2.7 2.7 14 9.2 8.9 13 8.8 8.3 7 4.7 4.91990 .......................... 40 26.7 26.3 13 8.8 9.6 14 9.4 8.3 13 8.5 8.4 10 6.8 7.11989 .......................... 33 22.5 22.1 7 4.8 4.8 13 8.9 8.9 13 8.7 8.4 7 4.8 5.01988 .......................... 35 24.5 25.4 12 8.4 9.4 12 8.3 8.4 11 7.8 7.6 9 6.3 7.11987 .......................... 24 17.3 17.2 3 2.2 2.3 13 9.4 9.6 8 5.6 5.3 6 4.3 4.71986 .......................... 36 26.6 27.7 8 5.9 6.7 16 11.7 12.4 12 9.0 8.6 8 5.9 7.1
1985 .......................... 28 21.2 21.5 7 5.3 5.6 12 9.3 9.4 9 6.6 6.4 9 6.8 6.71984 .......................... 36 28.3 30.3 13 10.1 11.4 12 9.4 10.0 11 8.8 9.0 11 8.5 9.51983 .......................... 31 24.9 26.8 8 6.3 7.5 13 10.6 11.7 10 7.9 7.7 10 7.9 9.31982 .......................... 36 29.1 31.8 10 8.1 9.0 18 14.4 16.2 8 6.6 6.7 12 9.8 11.21981 .......................... 43 35.6 40.4 15 12.5 14.7 15 12.1 14.2 13 11.0 11.5 14 11.6 13.61980 .......................... 46 39.0 45.2 19 16.1 19.7 14 12.3 14.9 12 10.6 10.6 14 11.9 14.61979 .......................... 35 31.1 35.3 13 11.4 13.5 14 12.7 14.7 8 7.0 7.2 11 9.7 11.5
- 33 -

Table 1. Number of deaths and unadjusted and age-adjusted death rates per 100,000 population for different categories of alcohol-related mortality byState: United States, 1979–92.
Delaware
Race, sex,and year
All Alcohol-Related Causes of DeathAll Chronic Liver Disease and
CirrhosisTotal Causes of Death with ExplicitMention of Alcohol
Other Alcohol-Related Diseases Other Alcohol-Related Injuries orAdverse Effects
Number Unadj.Rate
Age-Adj.Rate Number Unadj.
RateAge-Adj.
Rate Number Unadj.Rate
Age-Adj.Rate Number Unadj.
RateAge-Adj.
Rate Number Unadj.Rate
Age-Adj.Rate
All races, both sexes1992 .......................... 291 42.1 33.2 47 6.8 6.0 125 18.2 11.8 118 17.1 15.4 70 10.1 8.11991 .......................... 279 41.0 32.3 50 7.3 6.6 118 17.4 11.3 110 16.2 14.3 69 10.1 8.51990 .......................... 295 44.1 35.2 54 8.1 7.1 121 18.1 11.7 120 17.9 16.4 73 10.9 9.31989 .......................... 303 46.0 37.7 62 9.4 8.9 125 18.9 12.6 116 17.7 16.2 72 10.9 9.41988 .......................... 289 44.6 37.0 48 7.4 6.8 110 16.9 11.7 131 20.2 18.5 64 9.9 8.71987 .......................... 293 45.9 38.0 49 7.7 7.2 115 18.0 12.2 129 20.2 18.7 73 11.5 9.31986 .......................... 293 46.6 38.2 54 8.6 7.7 117 18.6 12.7 122 19.4 17.7 87 13.9 11.7
1985 .......................... 254 41.1 34.1 35 5.7 5.4 122 19.8 13.7 97 15.7 15.1 65 10.5 8.81984 .......................... 260 42.5 36.5 45 7.4 7.1 108 17.6 13.3 107 17.5 16.2 84 13.7 12.31983 .......................... 257 42.5 35.9 47 7.8 7.3 109 18.0 13.1 101 16.7 15.5 80 13.2 11.91982 .......................... 262 43.7 37.4 47 7.8 7.5 102 17.0 12.4 113 18.9 17.5 63 10.5 9.61981 .......................... 254 42.7 36.5 42 7.0 6.5 102 17.2 12.8 110 18.5 17.2 63 10.6 9.61980 .......................... 311 52.3 46.0 70 11.8 11.1 116 19.6 14.9 125 21.0 19.9 90 15.1 13.91979 .......................... 285 47.6 42.1 57 9.5 8.9 113 18.8 14.6 115 19.3 18.7 89 14.9 13.6
All races, male1992 .......................... 188 56.0 48.5 40 11.9 10.9 72 21.5 16.5 76 22.6 21.1 57 17.0 14.31991 .......................... 193 58.3 50.8 40 12.1 11.1 73 22.1 17.2 80 24.1 22.5 50 15.1 13.51990 .......................... 192 59.0 51.4 38 11.7 10.8 76 23.3 18.0 78 24.0 22.6 46 14.2 13.01989 .......................... 203 63.6 56.7 51 16.0 15.0 73 22.8 18.1 79 24.9 23.5 50 15.7 14.11988 .......................... 190 60.7 53.8 35 11.2 10.4 70 22.2 17.9 86 27.3 25.6 44 14.0 12.71987 .......................... 194 62.8 55.6 35 11.3 10.6 72 23.2 18.7 87 28.3 26.3 55 17.8 15.51986 .......................... 194 63.8 56.8 38 12.5 11.2 66 21.9 17.7 89 29.4 28.0 50 16.5 14.6
1985 .......................... 170 56.8 51.0 23 7.7 7.2 74 24.9 20.2 72 24.2 23.6 37 12.4 11.31984 .......................... 174 59.0 54.1 34 11.5 11.3 69 23.4 19.8 71 24.1 23.0 58 19.6 18.01983 .......................... 175 59.8 54.5 39 13.3 12.7 65 22.1 18.6 71 24.3 23.1 53 18.1 16.81982 .......................... 182 63.0 57.9 36 12.5 12.2 67 23.1 19.6 79 27.5 26.1 45 15.6 14.41981 .......................... 176 61.4 56.4 35 12.2 11.7 65 22.6 19.4 76 26.6 25.4 41 14.3 13.51980 .......................... 216 75.3 69.8 53 18.5 17.6 73 25.4 22.1 90 31.4 30.1 55 19.2 18.31979 .......................... 191 66.0 62.5 39 13.5 12.7 69 24.0 21.7 82 28.5 28.2 53 18.3 17.3
All races, female1992 .......................... 103 29.0 19.5 7 2.0 1.5 53 15.1 7.9 43 12.0 10.0 13 3.7 2.61991 .......................... 86 24.6 15.7 10 2.9 2.6 45 12.9 6.4 31 8.8 6.6 19 5.4 4.11990 .......................... 104 30.0 21.0 16 4.6 3.7 45 13.1 6.7 42 12.3 10.6 27 7.8 5.71989 .......................... 100 29.5 20.6 11 3.2 3.2 52 15.3 8.1 37 10.9 9.3 22 6.5 5.11988 .......................... 98 29.4 22.1 13 3.9 3.6 40 11.9 6.6 45 13.6 12.0 20 6.0 5.01987 .......................... 99 30.1 22.8 14 4.3 4.1 43 13.2 6.8 42 12.6 11.8 18 5.5 4.01986 .......................... 99 30.5 21.9 16 4.9 4.8 51 15.6 8.8 32 10.0 8.2 37 11.4 9.3
- 34 -
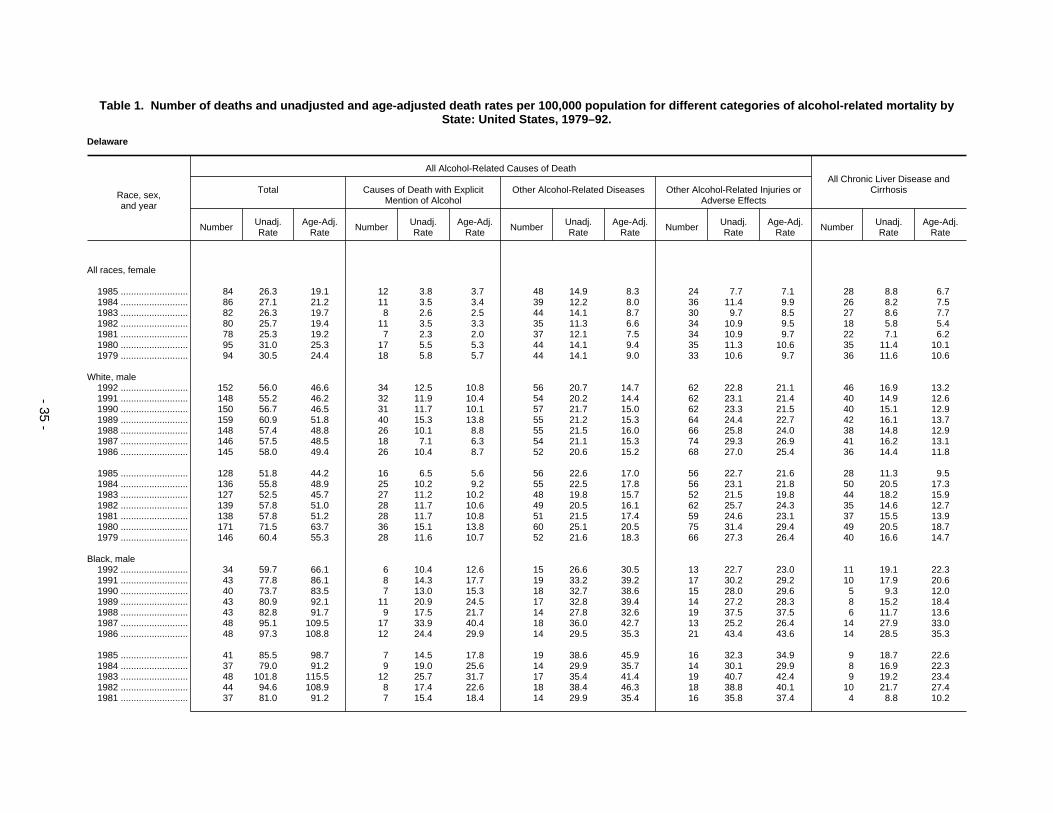
Table 1. Number of deaths and unadjusted and age-adjusted death rates per 100,000 population for different categories of alcohol-related mortality byState: United States, 1979–92.
Delaware
Race, sex,and year
All Alcohol-Related Causes of DeathAll Chronic Liver Disease and
CirrhosisTotal Causes of Death with ExplicitMention of Alcohol
Other Alcohol-Related Diseases Other Alcohol-Related Injuries orAdverse Effects
Number Unadj.Rate
Age-Adj.Rate Number Unadj.
RateAge-Adj.
Rate Number Unadj.Rate
Age-Adj.Rate Number Unadj.
RateAge-Adj.
Rate Number Unadj.Rate
Age-Adj.Rate
All races, female
1985 .......................... 84 26.3 19.1 12 3.8 3.7 48 14.9 8.3 24 7.7 7.1 28 8.8 6.71984 .......................... 86 27.1 21.2 11 3.5 3.4 39 12.2 8.0 36 11.4 9.9 26 8.2 7.51983 .......................... 82 26.3 19.7 8 2.6 2.5 44 14.1 8.7 30 9.7 8.5 27 8.6 7.71982 .......................... 80 25.7 19.4 11 3.5 3.3 35 11.3 6.6 34 10.9 9.5 18 5.8 5.41981 .......................... 78 25.3 19.2 7 2.3 2.0 37 12.1 7.5 34 10.9 9.7 22 7.1 6.21980 .......................... 95 31.0 25.3 17 5.5 5.3 44 14.1 9.4 35 11.3 10.6 35 11.4 10.11979 .......................... 94 30.5 24.4 18 5.8 5.7 44 14.1 9.0 33 10.6 9.7 36 11.6 10.6
White, male1992 .......................... 152 56.0 46.6 34 12.5 10.8 56 20.7 14.7 62 22.8 21.1 46 16.9 13.21991 .......................... 148 55.2 46.2 32 11.9 10.4 54 20.2 14.4 62 23.1 21.4 40 14.9 12.61990 .......................... 150 56.7 46.5 31 11.7 10.1 57 21.7 15.0 62 23.3 21.5 40 15.1 12.91989 .......................... 159 60.9 51.8 40 15.3 13.8 55 21.2 15.3 64 24.4 22.7 42 16.1 13.71988 .......................... 148 57.4 48.8 26 10.1 8.8 55 21.5 16.0 66 25.8 24.0 38 14.8 12.91987 .......................... 146 57.5 48.5 18 7.1 6.3 54 21.1 15.3 74 29.3 26.9 41 16.2 13.11986 .......................... 145 58.0 49.4 26 10.4 8.7 52 20.6 15.2 68 27.0 25.4 36 14.4 11.8
1985 .......................... 128 51.8 44.2 16 6.5 5.6 56 22.6 17.0 56 22.7 21.6 28 11.3 9.51984 .......................... 136 55.8 48.9 25 10.2 9.2 55 22.5 17.8 56 23.1 21.8 50 20.5 17.31983 .......................... 127 52.5 45.7 27 11.2 10.2 48 19.8 15.7 52 21.5 19.8 44 18.2 15.91982 .......................... 139 57.8 51.0 28 11.7 10.6 49 20.5 16.1 62 25.7 24.3 35 14.6 12.71981 .......................... 138 57.8 51.2 28 11.7 10.8 51 21.5 17.4 59 24.6 23.1 37 15.5 13.91980 .......................... 171 71.5 63.7 36 15.1 13.8 60 25.1 20.5 75 31.4 29.4 49 20.5 18.71979 .......................... 146 60.4 55.3 28 11.6 10.7 52 21.6 18.3 66 27.3 26.4 40 16.6 14.7
Black, male1992 .......................... 34 59.7 66.1 6 10.4 12.6 15 26.6 30.5 13 22.7 23.0 11 19.1 22.31991 .......................... 43 77.8 86.1 8 14.3 17.7 19 33.2 39.2 17 30.2 29.2 10 17.9 20.61990 .......................... 40 73.7 83.5 7 13.0 15.3 18 32.7 38.6 15 28.0 29.6 5 9.3 12.01989 .......................... 43 80.9 92.1 11 20.9 24.5 17 32.8 39.4 14 27.2 28.3 8 15.2 18.41988 .......................... 43 82.8 91.7 9 17.5 21.7 14 27.8 32.6 19 37.5 37.5 6 11.7 13.61987 .......................... 48 95.1 109.5 17 33.9 40.4 18 36.0 42.7 13 25.2 26.4 14 27.9 33.01986 .......................... 48 97.3 108.8 12 24.4 29.9 14 29.5 35.3 21 43.4 43.6 14 28.5 35.3
1985 .......................... 41 85.5 98.7 7 14.5 17.8 19 38.6 45.9 16 32.3 34.9 9 18.7 22.61984 .......................... 37 79.0 91.2 9 19.0 25.6 14 29.9 35.7 14 30.1 29.9 8 16.9 22.31983 .......................... 48 101.8 115.5 12 25.7 31.7 17 35.4 41.4 19 40.7 42.4 9 19.2 23.41982 .......................... 44 94.6 108.9 8 17.4 22.6 18 38.4 46.3 18 38.8 40.1 10 21.7 27.41981 .......................... 37 81.0 91.2 7 15.4 18.4 14 29.9 35.4 16 35.8 37.4 4 8.8 10.2
- 35 -

Table 1. Number of deaths and unadjusted and age-adjusted death rates per 100,000 population for different categories of alcohol-related mortality byState: United States, 1979–92.
Delaware
Race, sex,and year
All Alcohol-Related Causes of DeathAll Chronic Liver Disease and
CirrhosisTotal Causes of Death with ExplicitMention of Alcohol
Other Alcohol-Related Diseases Other Alcohol-Related Injuries orAdverse Effects
Number Unadj.Rate
Age-Adj.Rate Number Unadj.
RateAge-Adj.
Rate Number Unadj.Rate
Age-Adj.Rate Number Unadj.
RateAge-Adj.
Rate Number Unadj.Rate
Age-Adj.Rate
Black, male1980 .......................... 45 99.8 116.6 17 37.5 43.7 13 28.6 34.8 15 33.6 38.0 6 13.2 15.81979 .......................... 45 99.5 113.1 11 24.5 27.3 17 38.0 46.8 17 36.9 39.0 13 29.0 36.0
White, female1992 .......................... 84 29.4 18.2 5 1.8 1.2 42 14.7 6.5 37 13.0 10.6 11 3.9 2.41991 .......................... 69 24.5 14.3 8 2.8 2.5 36 12.6 5.5 26 9.1 6.3 16 5.7 3.81990 .......................... 88 31.4 20.7 13 4.7 3.4 40 14.2 6.6 35 12.5 10.8 23 8.3 5.31989 .......................... 81 29.6 19.3 6 2.2 1.9 43 15.6 7.5 32 11.8 9.9 19 6.9 4.81988 .......................... 79 29.2 20.7 11 4.1 3.5 32 11.7 5.6 37 13.5 11.5 18 6.6 5.01987 .......................... 76 28.2 20.5 9 3.4 3.4 33 12.5 5.7 33 12.4 11.4 13 4.9 3.21986 .......................... 76 28.7 18.8 11 4.2 3.9 39 14.6 7.2 26 10.0 7.7 31 11.7 8.9
1985 .......................... 66 25.4 17.4 9 3.4 3.4 38 14.7 7.3 19 7.3 6.7 23 8.8 6.01984 .......................... 62 23.9 17.0 7 2.7 2.4 27 10.5 5.8 28 10.7 8.8 19 7.3 6.01983 .......................... 62 24.2 16.7 4 1.6 1.3 35 13.5 7.7 24 9.2 7.7 19 7.4 6.21982 .......................... 60 23.5 16.3 6 2.4 2.1 28 11.1 5.8 26 10.0 8.4 12 4.7 4.01981 .......................... 66 26.0 18.7 7 2.8 2.3 32 12.5 7.1 27 10.8 9.3 20 7.9 6.51980 .......................... 80 31.6 24.5 14 5.5 4.9 36 14.3 8.6 30 11.7 11.0 31 12.2 10.31979 .......................... 68 26.6 19.0 9 3.5 3.1 36 14.2 8.2 23 8.9 7.7 26 10.1 8.3
Black, female1992 .......................... 19 29.5 27.6 2 3.1 2.8 11 17.5 16.4 6 8.9 8.4 2 3.1 2.81991 .......................... 16 26.1 23.6 2 3.2 3.0 9 14.6 12.1 5 8.3 8.5 3 4.8 5.11990 .......................... 16 26.2 24.5 3 5.0 6.0 5 9.1 7.7 7 12.1 10.7 4 6.7 8.31989 .......................... 19 31.6 30.7 5 8.5 10.1 9 15.2 13.1 5 7.9 7.6 3 5.1 6.61988 .......................... 18 30.9 30.7 2 3.5 4.2 8 13.4 12.9 8 13.9 13.6 2 3.5 4.81987 .......................... 22 39.5 36.4 5 8.9 9.5 10 17.4 15.1 7 13.1 11.9 5 8.9 9.51986 .......................... 23 41.6 41.8 5 9.1 10.2 12 21.8 20.9 6 10.8 10.6 6 10.9 12.0
1985 .......................... 17 31.6 30.2 3 5.6 5.2 8 15.7 14.4 6 10.3 10.6 5 9.3 9.41984 .......................... 24 44.6 47.2 4 7.5 9.2 11 21.5 22.6 8 15.5 15.3 7 13.1 16.81983 .......................... 20 38.4 38.3 4 7.6 9.5 9 17.9 17.0 7 12.9 11.8 8 15.2 17.91982 .......................... 20 37.6 37.7 5 9.6 11.3 6 12.2 11.3 8 15.8 15.0 6 11.6 14.71981 .......................... 12 23.6 22.5 0 0.0 0.0 6 11.1 11.1 6 12.5 11.4 2 3.9 4.61980 .......................... 15 29.6 32.4 3 5.9 8.1 7 13.8 14.9 5 9.9 9.4 4 7.8 9.51979 .......................... 26 51.8 57.2 9 17.8 21.6 7 14.2 14.7 10 19.8 20.9 10 19.8 24.7
- 36 -

Table 1. Number of deaths and unadjusted and age-adjusted death rates per 100,000 population for different categories of alcohol-related mortality byState: United States, 1979–92.
District of Columbia
Race, sex,and year
All Alcohol-Related Causes of DeathAll Chronic Liver Disease and
CirrhosisTotal Causes of Death with ExplicitMention of Alcohol
Other Alcohol-Related Diseases Other Alcohol-Related Injuries orAdverse Effects
Number Unadj.Rate
Age-Adj.Rate Number Unadj.
RateAge-Adj.
Rate Number Unadj.Rate
Age-Adj.Rate Number Unadj.
RateAge-Adj.
Rate Number Unadj.Rate
Age-Adj.Rate
All races, both sexes1992 .......................... 507 86.7 75.0 109 18.6 16.7 170 29.0 20.4 228 39.0 37.9 155 26.5 23.71991 .......................... 518 87.1 75.2 91 15.3 13.2 175 29.4 21.3 252 42.4 40.6 155 26.1 22.21990 .......................... 545 90.2 77.4 122 20.2 18.6 178 29.5 21.4 244 40.4 37.3 193 32.0 28.31989 .......................... 586 93.9 78.9 142 22.8 20.4 207 33.1 23.9 237 38.0 34.5 216 34.6 30.61988 .......................... 582 92.3 78.7 168 26.6 24.0 194 30.8 23.5 220 34.9 31.2 214 33.9 30.61987 .......................... 528 82.9 70.9 164 25.7 23.9 195 30.6 23.2 169 26.6 23.8 245 38.5 35.31986 .......................... 489 76.5 65.7 146 22.9 21.5 197 30.9 24.1 146 22.8 20.1 205 32.1 29.9
1985 .......................... 470 74.0 61.9 120 18.9 17.1 211 33.2 25.5 139 21.9 19.4 161 25.4 22.31984 .......................... 486 76.8 67.2 114 18.0 17.8 204 32.3 25.1 168 26.6 24.4 165 26.1 24.81983 .......................... 465 73.6 62.2 81 12.8 11.8 215 33.9 26.9 170 26.8 23.6 193 30.5 28.41982 .......................... 468 73.7 63.4 77 12.1 12.0 209 32.9 26.0 182 28.7 25.4 204 32.2 30.91981 .......................... 514 80.7 70.3 106 16.6 15.6 225 35.4 28.5 183 28.7 26.2 249 39.1 36.71980 .......................... 507 79.5 68.0 110 17.3 16.5 233 36.6 28.5 163 25.6 23.0 244 38.3 35.81979 .......................... 516 78.7 69.0 120 18.3 18.0 219 33.4 26.6 177 27.0 24.4 255 38.9 36.6
All races, male1992 .......................... 385 140.7 130.0 80 29.2 26.6 111 40.4 33.5 194 71.0 69.9 115 42.0 38.81991 .......................... 376 135.3 125.4 66 23.8 21.2 108 39.0 33.4 201 72.5 70.8 93 33.5 30.31990 .......................... 395 140.3 128.1 83 29.5 27.9 113 40.1 33.9 199 70.8 66.3 129 45.8 42.41989 .......................... 435 149.6 134.7 109 37.5 34.2 127 43.5 37.3 200 68.6 63.2 151 51.9 47.41988 .......................... 427 145.5 131.6 122 41.5 38.6 131 44.7 39.5 174 59.3 53.5 139 47.3 44.51987 .......................... 376 127.0 116.0 124 41.8 39.7 122 41.2 36.3 130 43.9 40.0 167 56.3 53.81986 .......................... 344 115.9 107.0 109 36.7 35.9 127 42.8 38.6 108 36.3 32.4 142 47.9 46.5
1985 .......................... 331 112.6 102.4 87 29.6 27.6 133 45.3 40.4 111 37.7 34.4 102 34.7 32.31984 .......................... 339 115.5 107.5 85 29.0 29.5 130 44.4 39.1 124 42.2 38.9 104 35.5 36.01983 .......................... 322 110.1 100.8 49 16.7 16.0 145 49.5 44.9 128 43.9 39.9 129 44.1 43.11982 .......................... 326 111.1 103.0 53 18.0 18.5 134 45.7 41.2 139 47.3 43.3 135 45.9 45.71981 .......................... 358 121.4 113.3 71 24.1 23.1 146 49.4 45.4 142 48.0 44.8 163 55.2 55.11980 .......................... 347 117.6 109.0 76 25.8 25.6 148 50.3 44.5 122 41.5 39.0 141 47.8 46.51979 .......................... 358 118.1 110.4 84 27.7 27.6 145 47.8 42.9 129 42.6 40.0 178 58.7 56.8
All races, female1992 .......................... 122 39.3 27.6 29 9.3 8.4 59 19.0 10.3 34 11.0 8.9 40 12.8 11.21991 .......................... 142 44.8 32.0 25 7.9 6.8 66 21.0 11.9 51 16.0 13.3 62 19.6 15.41990 .......................... 149 46.3 34.1 39 12.1 10.9 66 20.4 12.0 45 13.9 11.2 64 19.9 16.91989 .......................... 151 45.2 31.8 33 9.9 9.1 80 24.0 13.8 38 11.3 8.8 65 19.5 17.01988 .......................... 155 46.0 35.0 46 13.7 12.1 63 18.7 11.1 46 13.6 11.7 75 22.3 18.91987 .......................... 152 44.5 33.5 40 11.8 10.9 73 21.3 13.3 39 11.5 9.4 78 22.9 20.31986 .......................... 145 42.4 31.7 37 10.8 9.5 70 20.5 13.0 38 11.1 9.2 63 18.4 16.3
- 37 -

Table 1. Number of deaths and unadjusted and age-adjusted death rates per 100,000 population for different categories of alcohol-related mortality byState: United States, 1979–92.
District of Columbia
Race, sex,and year
All Alcohol-Related Causes of DeathAll Chronic Liver Disease and
CirrhosisTotal Causes of Death with ExplicitMention of Alcohol
Other Alcohol-Related Diseases Other Alcohol-Related Injuries orAdverse Effects
Number Unadj.Rate
Age-Adj.Rate Number Unadj.
RateAge-Adj.
Rate Number Unadj.Rate
Age-Adj.Rate Number Unadj.
RateAge-Adj.
Rate Number Unadj.Rate
Age-Adj.Rate
All races, female
1985 .......................... 138 40.7 28.9 33 9.7 8.6 77 22.7 14.0 28 8.3 6.3 59 17.3 14.31984 .......................... 148 43.4 34.0 29 8.5 7.9 74 21.8 14.4 44 13.1 11.7 61 17.9 15.41983 .......................... 143 42.2 30.8 32 9.4 8.2 70 20.6 13.1 41 12.2 9.5 64 18.8 16.11982 .......................... 141 41.5 31.1 24 7.1 6.6 75 21.9 14.6 43 12.5 9.9 69 20.3 19.01981 .......................... 156 45.6 34.7 35 10.2 9.4 80 23.3 15.4 41 12.1 9.9 86 25.2 21.31980 .......................... 160 46.7 35.0 34 9.9 9.1 85 24.8 16.6 41 12.0 9.3 103 30.1 27.11979 .......................... 157 44.7 35.6 36 10.2 10.1 74 20.9 14.6 48 13.5 10.8 77 21.9 20.4
White, male1992 .......................... 43 47.2 37.3 10 11.0 8.3 14 15.5 12.1 19 20.6 17.0 10 11.0 8.71991 .......................... 36 39.2 32.2 6 6.5 6.2 15 16.6 12.0 15 16.1 14.0 9 9.8 10.01990 .......................... 50 54.1 41.4 12 12.9 10.7 18 19.6 13.8 20 21.6 16.9 16 17.2 14.51989 .......................... 36 38.1 30.7 7 7.3 5.8 13 14.0 10.1 16 16.9 14.8 15 15.7 13.21988 .......................... 48 49.9 40.3 12 12.6 11.4 16 16.7 13.1 20 20.7 15.9 14 14.7 14.21987 .......................... 55 57.5 46.5 16 16.8 14.8 25 26.5 20.4 14 14.2 11.3 26 27.2 24.41986 .......................... 53 56.0 44.9 16 16.9 15.3 21 22.7 17.4 15 16.3 12.2 29 30.7 28.4
1985 .......................... 44 48.0 37.5 8 8.7 7.5 22 23.8 18.7 14 15.5 11.3 15 16.3 14.11984 .......................... 51 55.8 47.4 14 15.5 14.5 19 20.6 14.1 18 19.7 18.7 21 23.2 22.31983 .......................... 40 45.3 34.9 5 5.6 5.1 22 24.5 18.1 13 15.2 11.8 14 15.8 13.21982 .......................... 61 69.9 56.2 15 17.2 16.0 23 26.2 18.5 23 26.6 21.7 27 30.9 30.51981 .......................... 51 59.1 45.6 7 8.1 6.2 23 26.4 19.1 21 24.5 20.3 24 27.9 22.91980 .......................... 60 71.9 53.7 10 11.9 11.3 28 33.9 22.5 22 26.1 19.9 21 25.0 22.51979 .......................... 60 68.9 50.3 14 16.2 15.0 27 31.7 19.5 18 20.9 15.8 26 30.1 25.4
Black, male1992 .......................... 341 195.3 189.1 70 40.1 37.1 96 55.1 45.6 175 100.2 106.4 105 60.1 56.61991 .......................... 339 189.6 184.8 60 33.6 30.0 93 52.1 45.6 186 103.9 109.3 84 47.0 42.81990 .......................... 343 188.1 181.4 71 38.9 37.9 94 51.3 44.1 179 97.9 99.5 113 61.9 57.91989 .......................... 396 208.9 195.8 100 52.8 49.4 113 59.8 51.7 182 96.3 94.8 135 71.3 66.11988 .......................... 376 195.5 183.5 110 57.2 54.0 114 59.5 53.3 152 78.9 76.2 124 64.4 61.91987 .......................... 320 163.5 155.7 108 55.3 53.9 97 49.5 45.1 115 58.7 56.6 141 72.1 71.11986 .......................... 289 146.6 141.1 93 47.2 47.7 105 53.3 49.3 91 46.1 44.1 113 57.4 57.2
1985 .......................... 284 144.4 136.3 78 39.6 37.7 110 56.1 51.3 96 48.7 47.3 87 44.2 42.01984 .......................... 287 144.9 140.6 71 35.9 37.8 110 55.8 51.3 105 53.3 51.4 83 41.9 43.61983 .......................... 280 140.7 134.9 44 22.1 21.8 122 61.3 58.1 114 57.4 54.9 115 57.7 58.41982 .......................... 263 130.3 127.7 38 18.8 20.2 111 54.7 52.0 115 56.8 55.5 108 53.4 54.61981 .......................... 305 149.0 146.9 64 31.2 31.6 122 59.6 58.0 119 58.2 57.3 139 67.8 71.4
- 38 -

Table 1. Number of deaths and unadjusted and age-adjusted death rates per 100,000 population for different categories of alcohol-related mortality byState: United States, 1979–92.
District of Columbia
Race, sex,and year
All Alcohol-Related Causes of DeathAll Chronic Liver Disease and
CirrhosisTotal Causes of Death with ExplicitMention of Alcohol
Other Alcohol-Related Diseases Other Alcohol-Related Injuries orAdverse Effects
Number Unadj.Rate
Age-Adj.Rate Number Unadj.
RateAge-Adj.
Rate Number Unadj.Rate
Age-Adj.Rate Number Unadj.
RateAge-Adj.
Rate Number Unadj.Rate
Age-Adj.Rate
Black, male1980 .......................... 284 137.2 135.3 66 31.9 32.8 119 57.4 54.4 99 48.0 48.1 119 57.5 58.31979 .......................... 298 140.1 141.3 70 32.9 34.6 117 55.2 54.0 111 52.0 52.7 152 71.4 72.8
White, female1992 .......................... 21 22.8 9.1 1 1.1 1.1 13 14.1 4.7 7 7.6 3.2 4 4.3 3.61991 .......................... 29 30.8 14.2 3 3.2 1.9 16 17.3 5.7 10 10.3 6.7 12 12.7 5.81990 .......................... 25 26.2 14.3 3 3.1 3.2 16 16.1 6.4 7 6.9 4.6 9 9.3 7.91989 .......................... 33 33.3 16.9 2 2.0 1.5 21 21.2 9.1 10 10.1 6.2 8 8.0 5.61988 .......................... 34 33.8 18.5 9 8.9 6.4 15 15.1 5.6 10 9.8 6.4 12 11.9 10.61987 .......................... 37 36.8 21.6 8 7.9 7.3 19 19.0 8.3 10 10.0 5.9 17 16.7 15.41986 .......................... 37 36.6 21.2 9 8.9 8.0 17 17.2 6.7 11 10.5 6.5 12 11.8 11.4
1985 .......................... 36 36.0 18.9 8 8.0 6.5 21 20.5 9.3 8 7.5 3.1 12 11.9 7.31984 .......................... 34 33.8 18.6 9 9.0 8.2 15 15.5 5.2 9 9.2 5.3 12 12.1 9.71983 .......................... 39 39.6 18.2 4 4.1 2.5 23 23.7 8.2 12 11.9 7.5 16 16.2 11.21982 .......................... 39 40.0 23.6 5 5.1 5.0 20 20.9 8.9 14 13.9 9.7 15 15.4 12.41981 .......................... 43 44.7 21.3 6 6.2 4.0 24 24.8 10.2 13 13.7 7.2 15 15.5 11.41980 .......................... 43 45.3 17.9 6 6.3 3.4 24 24.8 8.2 14 14.2 6.2 14 14.7 7.01979 .......................... 46 47.0 24.0 6 6.1 4.3 23 23.1 8.7 18 17.8 11.0 15 15.2 11.0
Black, female1992 .......................... 101 48.1 37.0 28 13.4 12.0 46 21.8 12.6 27 13.0 12.4 36 17.2 15.01991 .......................... 113 52.6 41.5 22 10.3 9.3 50 23.3 14.4 41 19.1 17.7 50 23.4 20.11990 .......................... 123 56.6 44.4 36 16.5 15.0 49 22.7 14.2 38 17.4 15.2 55 25.2 21.51989 .......................... 117 51.6 39.0 31 13.7 12.8 59 25.9 15.9 27 12.0 10.3 57 25.2 22.51988 .......................... 119 52.0 43.0 37 16.1 15.1 46 20.3 13.2 36 15.6 14.6 63 27.5 23.81987 .......................... 114 49.0 39.8 32 13.8 12.7 53 22.9 15.6 29 12.4 11.5 61 26.3 23.21986 .......................... 106 45.4 36.7 28 12.0 10.6 52 22.4 15.7 26 11.1 10.4 51 21.8 19.2
1985 .......................... 101 43.1 33.3 24 10.3 9.3 57 24.2 16.4 20 8.7 7.7 47 20.1 17.51984 .......................... 114 48.3 40.9 20 8.5 7.9 59 24.9 18.6 35 14.9 14.4 49 20.9 18.31983 .......................... 103 43.7 35.8 28 11.9 10.7 46 19.7 14.8 29 12.2 10.3 48 20.3 18.51982 .......................... 102 42.8 34.8 19 8.0 7.5 54 22.8 17.0 29 12.1 10.3 54 22.7 21.91981 .......................... 112 46.6 40.0 29 12.1 11.6 56 23.2 17.7 27 11.3 10.7 71 29.5 25.91980 .......................... 115 47.5 41.2 27 11.1 11.1 61 25.2 19.9 27 11.1 10.2 88 36.3 34.71979 .......................... 111 44.5 40.6 30 12.0 12.6 51 20.4 17.0 30 12.0 11.0 62 24.9 24.5
- 39 -

Table 1. Number of deaths and unadjusted and age-adjusted death rates per 100,000 population for different categories of alcohol-related mortality byState: United States, 1979–92.
Florida
Race, sex,and year
All Alcohol-Related Causes of DeathAll Chronic Liver Disease and
CirrhosisTotal Causes of Death with ExplicitMention of Alcohol
Other Alcohol-Related Diseases Other Alcohol-Related Injuries orAdverse Effects
Number Unadj.Rate
Age-Adj.Rate Number Unadj.
RateAge-Adj.
Rate Number Unadj.Rate
Age-Adj.Rate Number Unadj.
RateAge-Adj.
Rate Number Unadj.Rate
Age-Adj.Rate
All races, both sexes1992 .......................... 6,678 49.5 35.4 1,188 8.8 7.1 2,780 20.6 10.0 2,709 20.1 18.4 1,759 13.0 8.51991 .......................... 6,650 50.1 36.5 1,112 8.4 6.8 2,756 20.8 10.2 2,781 21.0 19.5 1,785 13.4 9.21990 .......................... 6,921 53.2 39.4 1,192 9.2 7.6 2,733 21.0 10.3 2,996 23.0 21.5 1,701 13.1 8.81989 .......................... 6,821 54.0 39.8 1,075 8.5 6.9 2,712 21.5 10.7 3,033 24.0 22.3 1,789 14.2 9.61988 .......................... 6,830 55.5 41.9 1,077 8.8 7.3 2,618 21.3 10.6 3,135 25.5 24.0 1,695 13.8 9.51987 .......................... 6,447 53.7 39.9 1,013 8.4 7.0 2,546 21.2 10.6 2,888 24.1 22.3 1,667 13.9 9.71986 .......................... 6,258 53.6 39.9 936 8.0 6.5 2,526 21.6 11.0 2,797 24.0 22.4 1,683 14.4 10.0
1985 .......................... 6,278 55.3 41.2 946 8.3 6.9 2,541 22.4 11.4 2,791 24.6 22.9 1,714 15.1 10.61984 .......................... 6,097 55.2 41.5 882 8.0 6.5 2,468 22.4 11.6 2,747 24.9 23.4 1,643 14.9 10.21983 .......................... 6,033 56.1 42.1 957 8.9 7.4 2,443 22.7 11.9 2,634 24.5 22.8 1,673 15.6 11.31982 .......................... 6,180 59.0 45.2 1,038 9.9 8.2 2,400 22.9 12.0 2,742 26.2 25.0 1,805 17.2 12.31981 .......................... 6,413 62.9 48.7 1,019 10.0 8.3 2,445 24.0 12.7 2,949 28.9 27.8 1,800 17.7 12.91980 .......................... 6,253 63.5 50.0 1,040 10.6 9.0 2,372 24.1 12.8 2,841 28.9 28.2 1,805 18.3 13.81979 .......................... 5,696 60.1 46.9 956 10.1 8.7 2,215 23.4 12.7 2,524 26.7 25.5 1,722 18.2 13.9
All races, male1992 .......................... 4,398 67.3 52.5 850 13.0 10.8 1,648 25.2 14.4 1,900 29.1 27.4 1,121 17.2 12.21991 .......................... 4,429 68.9 54.6 782 12.2 10.2 1,637 25.5 14.7 2,010 31.3 29.7 1,094 17.0 12.61990 .......................... 4,638 73.6 59.0 856 13.6 11.5 1,629 25.8 15.0 2,153 34.2 32.5 1,041 16.5 12.01989 .......................... 4,503 73.7 58.9 724 11.8 9.9 1,593 26.1 15.1 2,187 35.8 33.8 1,070 17.5 12.81988 .......................... 4,601 77.4 62.9 779 13.1 11.3 1,579 26.6 15.5 2,244 37.7 36.2 1,094 18.4 13.71987 .......................... 4,306 74.4 59.3 754 13.0 11.0 1,498 25.9 15.1 2,054 35.5 33.2 1,066 18.4 13.71986 .......................... 4,141 73.6 58.9 657 11.7 9.7 1,480 26.3 15.5 2,004 35.6 33.7 1,033 18.4 13.6
1985 .......................... 4,141 75.8 60.7 650 11.9 10.0 1,486 27.2 15.9 2,005 36.7 34.8 1,032 18.9 14.11984 .......................... 4,055 76.4 61.5 621 11.7 9.9 1,478 27.8 16.5 1,955 36.8 35.2 1,023 19.3 13.91983 .......................... 3,981 77.0 61.9 661 12.8 10.8 1,444 27.9 16.7 1,876 36.3 34.5 1,000 19.3 14.71982 .......................... 4,144 82.4 67.4 717 14.3 12.1 1,410 28.0 16.6 2,017 40.1 38.7 1,104 22.0 16.61981 .......................... 4,286 87.6 72.2 704 14.4 12.1 1,444 29.5 17.6 2,138 43.7 42.6 1,095 22.4 17.01980 .......................... 4,179 88.5 73.5 711 15.1 12.8 1,410 29.9 17.8 2,058 43.6 42.9 1,094 23.2 18.01979 .......................... 3,732 82.0 68.3 647 14.2 12.5 1,299 28.5 17.5 1,786 39.2 38.3 1,042 22.9 18.4
All races, female1992 .......................... 2,280 32.8 19.7 338 4.9 3.7 1,133 16.3 6.2 809 11.6 9.7 638 9.2 5.31991 .......................... 2,221 32.4 19.9 330 4.8 3.8 1,119 16.3 6.4 772 11.3 9.6 691 10.1 6.31990 .......................... 2,284 34.0 21.3 336 5.0 4.0 1,104 16.4 6.4 844 12.6 10.9 660 9.8 5.91989 .......................... 2,318 35.5 22.2 351 5.4 4.2 1,120 17.2 6.9 847 13.0 11.0 719 11.0 6.91988 .......................... 2,229 35.0 22.6 298 4.7 3.8 1,040 16.3 6.6 891 14.0 12.2 601 9.4 5.91987 .......................... 2,141 34.5 22.0 259 4.2 3.4 1,048 16.9 6.9 834 13.4 11.7 601 9.7 6.11986 .......................... 2,117 35.0 22.5 279 4.6 3.7 1,045 17.3 7.2 793 13.1 11.5 650 10.8 7.0
- 40 -

Table 1. Number of deaths and unadjusted and age-adjusted death rates per 100,000 population for different categories of alcohol-related mortality byState: United States, 1979–92.
Florida
Race, sex,and year
All Alcohol-Related Causes of DeathAll Chronic Liver Disease and
CirrhosisTotal Causes of Death with ExplicitMention of Alcohol
Other Alcohol-Related Diseases Other Alcohol-Related Injuries orAdverse Effects
Number Unadj.Rate
Age-Adj.Rate Number Unadj.
RateAge-Adj.
Rate Number Unadj.Rate
Age-Adj.Rate Number Unadj.
RateAge-Adj.
Rate Number Unadj.Rate
Age-Adj.Rate
All races, female
1985 .......................... 2,137 36.3 23.5 296 5.0 4.2 1,054 17.9 7.7 787 13.4 11.5 682 11.6 7.51984 .......................... 2,042 35.6 23.3 261 4.6 3.7 990 17.3 7.5 791 13.8 12.1 620 10.8 7.11983 .......................... 2,052 36.8 24.2 296 5.3 4.5 999 17.9 8.0 757 13.6 11.7 673 12.1 8.41982 .......................... 2,036 37.4 25.1 321 5.9 4.9 990 18.2 8.2 725 13.3 12.0 701 12.9 8.61981 .......................... 2,127 40.1 27.4 315 5.9 5.0 1,001 18.9 8.7 811 15.3 13.7 705 13.3 9.41980 .......................... 2,075 40.5 28.7 329 6.4 5.7 962 18.8 8.6 784 15.3 14.3 711 13.9 10.31979 .......................... 1,964 39.9 27.4 309 6.3 5.4 916 18.6 8.7 738 15.0 13.4 680 13.8 10.1
White, male1992 .......................... 3,639 66.0 47.7 697 12.6 9.8 1,446 26.2 13.4 1,496 27.1 24.6 1,019 18.5 12.21991 .......................... 3,636 66.7 49.2 662 12.2 9.7 1,430 26.2 13.5 1,544 28.3 25.9 994 18.2 12.51990 .......................... 3,741 69.8 51.8 712 13.3 10.6 1,399 26.1 13.3 1,630 30.4 27.9 964 18.0 12.21989 .......................... 3,615 69.5 51.6 593 11.4 8.9 1,354 26.0 13.3 1,668 32.1 29.4 976 18.8 12.71988 .......................... 3,690 72.9 55.4 617 12.2 9.9 1,366 27.0 14.1 1,707 33.7 31.4 989 19.5 13.51987 .......................... 3,495 70.8 52.9 611 12.4 9.9 1,297 26.3 13.8 1,587 32.1 29.3 965 19.5 13.61986 .......................... 3,377 70.3 52.8 535 11.1 8.7 1,272 26.5 13.8 1,570 32.7 30.3 938 19.5 13.5
1985 .......................... 3,400 72.8 55.0 510 10.9 8.6 1,274 27.3 14.3 1,615 34.6 32.2 927 19.9 13.81984 .......................... 3,319 73.2 55.7 487 10.7 8.5 1,255 27.7 14.6 1,577 34.8 32.6 928 20.5 13.71983 .......................... 3,247 73.5 55.6 518 11.7 9.2 1,230 27.9 14.7 1,499 34.0 31.7 891 20.2 14.11982 .......................... 3,385 78.8 60.8 581 13.5 10.7 1,210 28.2 14.9 1,594 37.1 35.3 977 22.7 15.71981 .......................... 3,492 83.5 65.1 551 13.2 10.3 1,232 29.5 15.6 1,709 40.9 39.2 971 23.2 16.21980 .......................... 3,346 82.9 64.7 552 13.7 10.7 1,193 29.5 15.7 1,601 39.6 38.3 965 23.9 17.21979 .......................... 2,999 76.9 60.0 501 12.8 10.4 1,092 28.0 15.2 1,406 36.1 34.3 900 23.1 17.0
Black, male1992 .......................... 741 81.5 93.8 151 16.6 20.9 197 21.6 26.5 393 43.3 46.4 99 10.9 13.51991 .......................... 764 87.0 98.9 117 13.3 17.0 202 23.0 28.4 445 50.7 53.5 99 11.3 14.61990 .......................... 873 102.5 116.5 141 16.6 21.4 223 26.2 32.9 509 59.8 62.2 69 8.1 10.31989 .......................... 860 104.5 118.8 127 15.4 19.7 234 28.5 35.7 499 60.6 63.4 91 11.1 13.91988 .......................... 893 111.8 125.3 162 20.3 25.7 209 26.1 32.1 522 65.3 67.5 104 13.0 16.51987 .......................... 787 101.4 114.1 140 18.0 23.0 197 25.4 30.8 450 57.9 60.3 97 12.5 15.61986 .......................... 750 99.4 112.9 122 16.2 20.4 206 27.3 33.8 422 55.9 58.7 93 12.3 15.3
1985 .......................... 725 98.7 112.3 138 18.8 23.7 209 28.4 34.7 378 51.5 53.9 100 13.6 17.21984 .......................... 724 101.1 116.5 132 18.4 23.5 221 30.8 37.6 371 51.9 55.5 91 12.7 15.71983 .......................... 722 103.1 120.3 141 20.1 26.0 212 30.3 37.5 369 52.7 56.8 104 14.9 19.31982 .......................... 746 109.0 125.6 136 19.9 25.4 196 28.7 35.3 413 60.4 64.9 123 18.0 23.21981 .......................... 787 117.8 138.0 153 22.9 29.5 211 31.6 38.8 423 63.3 69.7 123 18.4 24.4
- 41 -

Table 1. Number of deaths and unadjusted and age-adjusted death rates per 100,000 population for different categories of alcohol-related mortality byState: United States, 1979–92.
Florida
Race, sex,and year
All Alcohol-Related Causes of DeathAll Chronic Liver Disease and
CirrhosisTotal Causes of Death with ExplicitMention of Alcohol
Other Alcohol-Related Diseases Other Alcohol-Related Injuries orAdverse Effects
Number Unadj.Rate
Age-Adj.Rate Number Unadj.
RateAge-Adj.
Rate Number Unadj.Rate
Age-Adj.Rate Number Unadj.
RateAge-Adj.
Rate Number Unadj.Rate
Age-Adj.Rate
Black, male1980 .......................... 820 127.1 149.6 158 24.5 31.9 214 33.1 40.6 448 69.5 77.1 128 19.8 25.81979 .......................... 726 117.9 139.6 145 23.5 31.1 206 33.4 40.8 375 60.9 67.7 142 23.1 30.3
White, female1992 .......................... 1,950 33.4 18.4 288 4.9 3.6 991 17.0 5.6 671 11.5 9.2 566 9.7 5.21991 .......................... 1,911 33.1 18.5 286 5.0 3.7 983 17.0 5.7 642 11.1 9.1 621 10.8 6.21990 .......................... 1,932 34.0 19.5 255 4.5 3.3 975 17.2 5.9 702 12.4 10.3 579 10.2 5.51989 .......................... 1,980 35.8 20.6 280 5.1 3.6 985 17.8 6.3 714 12.9 10.7 634 11.5 6.41988 .......................... 1,878 34.8 20.8 225 4.2 3.1 915 17.0 6.1 739 13.7 11.6 530 9.8 5.61987 .......................... 1,823 34.6 20.3 203 3.9 2.9 920 17.5 6.2 700 13.3 11.2 534 10.1 5.81986 .......................... 1,810 35.3 20.7 214 4.2 3.0 935 18.2 6.8 661 12.9 10.8 582 11.3 6.6
1985 .......................... 1,828 36.5 22.0 240 4.8 3.8 922 18.4 7.0 667 13.3 11.2 586 11.7 6.91984 .......................... 1,752 36.0 21.8 208 4.3 3.1 865 17.8 6.7 679 13.9 12.0 538 11.0 6.51983 .......................... 1,758 37.0 22.5 237 5.0 3.8 874 18.4 7.3 648 13.6 11.4 585 12.3 7.71982 .......................... 1,714 37.0 22.8 241 5.2 3.9 866 18.7 7.4 607 13.1 11.6 598 12.9 7.81981 .......................... 1,811 40.2 25.3 241 5.3 4.0 886 19.6 8.0 684 15.2 13.2 624 13.8 8.91980 .......................... 1,725 39.6 25.8 230 5.3 4.2 841 19.3 7.8 654 15.0 13.8 582 13.3 8.81979 .......................... 1,652 39.3 24.9 231 5.5 4.2 803 19.1 7.8 618 14.7 12.8 575 13.7 9.1
Black, female1992 .......................... 318 32.1 31.3 49 4.9 5.4 138 13.9 12.7 131 13.2 13.2 69 7.0 7.11991 .......................... 301 31.3 31.2 44 4.6 5.2 133 13.8 13.1 124 12.9 12.9 69 7.2 8.01990 .......................... 339 36.3 36.2 79 8.5 9.8 126 13.5 12.3 134 14.3 14.1 79 8.5 9.41989 .......................... 327 36.2 36.7 68 7.5 9.0 132 14.6 14.0 126 14.0 13.7 79 8.8 10.21988 .......................... 338 38.5 38.1 71 8.1 9.2 122 13.9 12.7 145 16.5 16.2 66 7.5 8.31987 .......................... 311 36.4 37.0 55 6.4 7.5 126 14.7 14.2 130 15.2 15.2 64 7.5 8.51986 .......................... 298 35.9 35.8 64 7.7 9.0 108 13.0 11.6 126 15.2 15.1 64 7.7 8.8
1985 .......................... 298 36.8 36.8 56 6.9 7.7 131 16.2 15.6 111 13.7 13.5 96 11.9 13.01984 .......................... 284 35.9 36.5 53 6.7 7.6 123 15.5 15.4 108 13.7 13.5 82 10.4 12.01983 .......................... 286 37.0 38.7 58 7.5 9.0 124 16.1 16.1 104 13.5 13.6 86 11.1 12.81982 .......................... 314 41.5 43.3 80 10.6 12.6 122 16.2 16.1 112 14.8 14.6 103 13.6 15.41981 .......................... 311 42.1 44.5 73 9.9 12.1 114 15.4 15.7 124 16.8 16.7 81 11.0 13.01980 .......................... 343 48.1 52.0 98 13.7 16.8 120 16.8 17.1 125 17.5 18.1 126 17.7 21.41979 .......................... 309 45.4 48.6 78 11.5 13.9 112 16.5 16.8 118 17.4 17.9 105 15.4 18.4
- 42 -

Table 1. Number of deaths and unadjusted and age-adjusted death rates per 100,000 population for different categories of alcohol-related mortality byState: United States, 1979–92.
Georgia
Race, sex,and year
All Alcohol-Related Causes of DeathAll Chronic Liver Disease and
CirrhosisTotal Causes of Death with ExplicitMention of Alcohol
Other Alcohol-Related Diseases Other Alcohol-Related Injuries orAdverse Effects
Number Unadj.Rate
Age-Adj.Rate Number Unadj.
RateAge-Adj.
Rate Number Unadj.Rate
Age-Adj.Rate Number Unadj.
RateAge-Adj.
Rate Number Unadj.Rate
Age-Adj.Rate
All races, both sexes1992 .......................... 2,993 44.2 38.9 566 8.4 8.0 1,018 15.0 11.2 1,410 20.8 19.7 571 8.4 7.61991 .......................... 3,109 46.9 41.3 519 7.8 7.5 1,050 15.8 11.9 1,540 23.2 22.0 578 8.7 7.81990 .......................... 3,175 48.8 43.5 584 9.0 8.7 1,020 15.7 11.9 1,571 24.1 22.9 562 8.6 7.71989 .......................... 3,245 50.6 45.5 556 8.7 8.5 1,045 16.3 12.5 1,644 25.6 24.4 640 10.0 9.31988 .......................... 3,208 50.8 45.5 545 8.6 8.6 1,026 16.2 12.4 1,637 25.9 24.5 585 9.3 8.61987 .......................... 3,101 49.9 44.8 526 8.5 8.4 1,006 16.2 12.4 1,568 25.3 24.0 564 9.1 8.41986 .......................... 3,033 49.8 44.7 514 8.4 8.4 1,012 16.6 12.9 1,507 24.8 23.5 571 9.4 8.8
1985 .......................... 3,000 50.3 45.4 558 9.4 9.4 1,001 16.8 13.1 1,441 24.2 22.9 608 10.2 9.81984 .......................... 2,929 50.2 45.6 526 9.0 9.1 999 17.1 13.5 1,404 24.1 22.9 626 10.7 10.41983 .......................... 2,780 48.5 44.2 471 8.2 8.4 969 16.9 13.4 1,340 23.4 22.4 580 10.1 10.01982 .......................... 2,781 49.2 45.1 405 7.2 7.4 953 16.9 13.5 1,424 25.2 24.2 592 10.5 10.31981 .......................... 2,975 53.4 49.6 492 8.8 9.4 965 17.3 14.0 1,518 27.3 26.3 586 10.5 10.51980 .......................... 3,000 54.7 51.3 506 9.2 9.7 941 17.2 14.1 1,552 28.3 27.5 648 11.8 12.01979 .......................... 2,966 55.0 51.9 480 8.9 9.4 911 16.9 13.9 1,575 29.2 28.5 580 10.8 11.0
All races, male1992 .......................... 1,978 60.1 57.9 417 12.7 12.5 566 17.2 15.8 996 30.2 29.6 365 11.1 10.81991 .......................... 2,083 64.7 62.4 381 11.8 11.7 599 18.6 17.2 1,104 34.3 33.5 336 10.4 10.21990 .......................... 2,124 67.2 65.1 434 13.7 13.8 572 18.1 16.9 1,117 35.4 34.4 345 10.9 10.71989 .......................... 2,154 69.3 67.6 393 12.6 12.9 595 19.1 18.1 1,166 37.5 36.6 387 12.4 12.61988 .......................... 2,149 70.2 68.3 406 13.3 13.5 591 19.3 18.3 1,152 37.6 36.5 373 12.2 12.21987 .......................... 2,056 68.3 66.6 361 12.0 12.3 581 19.3 18.3 1,113 37.0 36.0 335 11.1 11.31986 .......................... 2,023 68.6 66.9 382 13.0 13.3 560 19.0 18.1 1,081 36.7 35.6 350 11.9 12.0
1985 .......................... 1,992 69.0 68.1 416 14.4 15.0 562 19.5 18.7 1,013 35.1 34.4 397 13.8 14.11984 .......................... 1,947 69.0 68.2 379 13.4 14.1 562 19.9 19.2 1,006 35.6 34.9 387 13.7 14.21983 .......................... 1,830 66.0 65.6 346 12.5 13.2 544 19.6 19.1 940 33.9 33.3 371 13.4 14.11982 .......................... 1,854 67.9 67.6 284 10.4 11.1 544 19.9 19.3 1,026 37.6 37.2 360 13.2 13.91981 .......................... 1,992 74.0 74.5 336 12.5 13.6 549 20.4 20.0 1,107 41.1 40.8 339 12.6 13.41980 .......................... 2,016 76.1 76.8 348 13.1 14.2 524 19.8 19.6 1,144 43.1 43.0 405 15.3 16.31979 .......................... 2,022 77.6 78.8 337 12.9 14.0 515 19.8 19.7 1,170 44.9 45.0 362 13.9 14.9
All races, female1992 .......................... 1,015 29.2 22.1 149 4.3 4.0 452 13.0 7.6 414 11.9 10.5 206 5.9 4.81991 .......................... 1,026 30.1 22.6 138 4.0 3.7 451 13.2 7.6 436 12.8 11.2 242 7.1 5.71990 .......................... 1,051 31.4 24.5 150 4.5 4.3 448 13.4 8.0 453 13.5 12.2 217 6.5 5.21989 .......................... 1,091 33.1 26.0 163 4.9 4.6 450 13.6 8.2 478 14.5 13.2 253 7.7 6.51988 .......................... 1,059 32.5 25.7 139 4.3 4.3 435 13.4 7.8 485 14.9 13.6 212 6.5 5.51987 .......................... 1,045 32.7 25.6 165 5.2 5.0 425 13.3 7.9 455 14.2 12.8 229 7.2 6.01986 .......................... 1,010 32.2 25.3 132 4.2 4.2 452 14.4 8.8 426 13.6 12.3 221 7.0 6.2
- 43 -

Table 1. Number of deaths and unadjusted and age-adjusted death rates per 100,000 population for different categories of alcohol-related mortality byState: United States, 1979–92.
Georgia
Race, sex,and year
All Alcohol-Related Causes of DeathAll Chronic Liver Disease and
CirrhosisTotal Causes of Death with ExplicitMention of Alcohol
Other Alcohol-Related Diseases Other Alcohol-Related Injuries orAdverse Effects
Number Unadj.Rate
Age-Adj.Rate Number Unadj.
RateAge-Adj.
Rate Number Unadj.Rate
Age-Adj.Rate Number Unadj.
RateAge-Adj.
Rate Number Unadj.Rate
Age-Adj.Rate
All races, female
1985 .......................... 1,009 32.8 25.6 142 4.6 4.5 439 14.3 8.7 428 13.9 12.4 211 6.9 6.11984 .......................... 982 32.6 25.8 147 4.9 4.9 436 14.5 9.1 398 13.2 11.9 239 7.9 7.01983 .......................... 949 32.1 25.3 125 4.2 4.2 425 14.4 8.9 400 13.5 12.2 209 7.1 6.41982 .......................... 927 31.8 25.7 121 4.1 4.2 409 14.0 9.1 397 13.6 12.4 232 8.0 7.31981 .......................... 983 34.1 27.8 156 5.4 5.6 415 14.4 9.3 411 14.3 13.0 247 8.6 7.91980 .......................... 984 34.7 29.1 158 5.6 5.9 417 14.7 9.9 409 14.4 13.3 243 8.6 8.41979 .......................... 944 33.9 28.1 143 5.1 5.4 396 14.2 9.4 405 14.5 13.3 218 7.8 7.8
White, male1992 .......................... 1,219 51.3 46.0 236 9.9 9.0 382 16.0 13.1 601 25.3 23.9 280 11.8 10.41991 .......................... 1,246 53.4 48.3 193 8.3 7.6 378 16.2 13.3 675 28.9 27.5 255 10.9 9.81990 .......................... 1,314 57.3 52.1 225 9.8 9.0 370 16.1 13.4 719 31.4 29.7 251 10.9 9.81989 .......................... 1,313 58.1 53.3 202 8.9 8.4 385 17.0 14.4 726 32.1 30.6 284 12.6 11.51988 .......................... 1,335 59.9 55.0 238 10.7 10.1 382 17.1 14.5 715 32.1 30.5 285 12.8 11.71987 .......................... 1,312 59.9 54.9 209 9.5 8.9 387 17.7 15.0 716 32.7 31.0 265 12.1 11.11986 .......................... 1,283 59.8 55.2 201 9.4 8.8 371 17.3 14.8 712 33.1 31.6 270 12.6 11.6
1985 .......................... 1,271 60.5 56.1 236 11.2 10.7 369 17.6 15.2 666 31.7 30.2 284 13.5 12.81984 .......................... 1,256 61.0 56.9 217 10.5 10.1 369 17.9 15.6 670 32.6 31.1 286 13.9 13.21983 .......................... 1,185 58.7 55.2 192 9.5 9.3 355 17.6 15.5 638 31.6 30.4 282 14.0 13.51982 .......................... 1,205 60.4 57.0 159 8.0 7.8 357 17.9 16.0 689 34.5 33.3 272 13.6 13.21981 .......................... 1,255 63.7 60.6 174 8.8 8.8 356 18.1 16.2 724 36.8 35.6 245 12.4 12.21980 .......................... 1,309 67.3 64.5 205 10.5 10.4 334 17.2 15.6 770 39.6 38.5 289 14.9 14.51979 .......................... 1,297 67.5 65.1 201 10.5 10.4 330 17.2 15.8 766 39.9 38.8 265 13.8 13.6
Black, male1992 .......................... 747 86.7 101.4 181 21.0 27.2 181 21.0 27.3 385 44.7 46.9 84 9.7 12.61991 .......................... 829 98.8 116.1 188 22.4 28.8 219 26.1 34.5 422 50.3 52.8 80 9.5 12.01990 .......................... 797 97.1 115.3 209 25.4 33.7 200 24.4 31.8 388 47.2 49.8 93 11.3 14.41989 .......................... 830 102.7 121.9 189 23.4 31.6 209 25.8 34.2 432 53.5 56.1 101 12.5 16.81988 .......................... 807 101.5 119.5 168 21.1 27.7 209 26.2 34.8 430 54.1 57.1 88 11.1 14.61987 .......................... 736 94.2 111.0 151 19.3 25.6 193 24.7 32.5 392 50.2 52.9 69 8.8 11.91986 .......................... 735 95.6 113.4 181 23.6 31.2 189 24.6 32.0 365 47.5 50.2 80 10.4 13.7
1985 .......................... 714 94.6 115.3 180 23.8 32.2 192 25.5 33.6 342 45.3 49.5 113 15.0 19.91984 .......................... 686 92.8 112.8 162 21.9 30.0 192 25.9 33.7 333 45.0 49.0 100 13.5 18.31983 .......................... 640 88.0 106.2 154 21.2 28.5 188 25.8 33.6 298 41.0 44.2 89 12.2 17.01982 .......................... 646 90.3 109.5 125 17.5 24.2 186 25.9 33.1 336 46.9 52.3 87 12.2 16.21981 .......................... 736 104.7 129.3 162 23.0 32.8 193 27.4 35.8 381 54.2 60.7 94 13.4 18.2
- 44 -
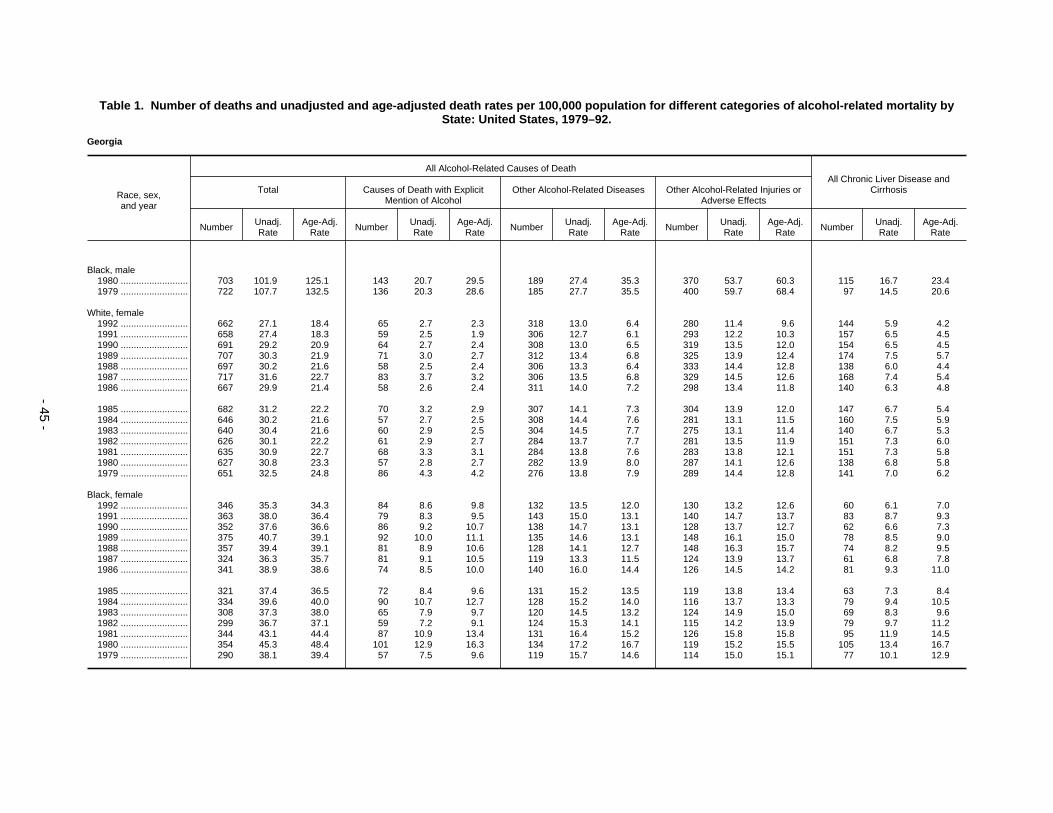
Table 1. Number of deaths and unadjusted and age-adjusted death rates per 100,000 population for different categories of alcohol-related mortality byState: United States, 1979–92.
Georgia
Race, sex,and year
All Alcohol-Related Causes of DeathAll Chronic Liver Disease and
CirrhosisTotal Causes of Death with ExplicitMention of Alcohol
Other Alcohol-Related Diseases Other Alcohol-Related Injuries orAdverse Effects
Number Unadj.Rate
Age-Adj.Rate Number Unadj.
RateAge-Adj.
Rate Number Unadj.Rate
Age-Adj.Rate Number Unadj.
RateAge-Adj.
Rate Number Unadj.Rate
Age-Adj.Rate
Black, male1980 .......................... 703 101.9 125.1 143 20.7 29.5 189 27.4 35.3 370 53.7 60.3 115 16.7 23.41979 .......................... 722 107.7 132.5 136 20.3 28.6 185 27.7 35.5 400 59.7 68.4 97 14.5 20.6
White, female1992 .......................... 662 27.1 18.4 65 2.7 2.3 318 13.0 6.4 280 11.4 9.6 144 5.9 4.21991 .......................... 658 27.4 18.3 59 2.5 1.9 306 12.7 6.1 293 12.2 10.3 157 6.5 4.51990 .......................... 691 29.2 20.9 64 2.7 2.4 308 13.0 6.5 319 13.5 12.0 154 6.5 4.51989 .......................... 707 30.3 21.9 71 3.0 2.7 312 13.4 6.8 325 13.9 12.4 174 7.5 5.71988 .......................... 697 30.2 21.6 58 2.5 2.4 306 13.3 6.4 333 14.4 12.8 138 6.0 4.41987 .......................... 717 31.6 22.7 83 3.7 3.2 306 13.5 6.8 329 14.5 12.6 168 7.4 5.41986 .......................... 667 29.9 21.4 58 2.6 2.4 311 14.0 7.2 298 13.4 11.8 140 6.3 4.8
1985 .......................... 682 31.2 22.2 70 3.2 2.9 307 14.1 7.3 304 13.9 12.0 147 6.7 5.41984 .......................... 646 30.2 21.6 57 2.7 2.5 308 14.4 7.6 281 13.1 11.5 160 7.5 5.91983 .......................... 640 30.4 21.6 60 2.9 2.5 304 14.5 7.7 275 13.1 11.4 140 6.7 5.31982 .......................... 626 30.1 22.2 61 2.9 2.7 284 13.7 7.7 281 13.5 11.9 151 7.3 6.01981 .......................... 635 30.9 22.7 68 3.3 3.1 284 13.8 7.6 283 13.8 12.1 151 7.3 5.81980 .......................... 627 30.8 23.3 57 2.8 2.7 282 13.9 8.0 287 14.1 12.6 138 6.8 5.81979 .......................... 651 32.5 24.8 86 4.3 4.2 276 13.8 7.9 289 14.4 12.8 141 7.0 6.2
Black, female1992 .......................... 346 35.3 34.3 84 8.6 9.8 132 13.5 12.0 130 13.2 12.6 60 6.1 7.01991 .......................... 363 38.0 36.4 79 8.3 9.5 143 15.0 13.1 140 14.7 13.7 83 8.7 9.31990 .......................... 352 37.6 36.6 86 9.2 10.7 138 14.7 13.1 128 13.7 12.7 62 6.6 7.31989 .......................... 375 40.7 39.1 92 10.0 11.1 135 14.6 13.1 148 16.1 15.0 78 8.5 9.01988 .......................... 357 39.4 39.1 81 8.9 10.6 128 14.1 12.7 148 16.3 15.7 74 8.2 9.51987 .......................... 324 36.3 35.7 81 9.1 10.5 119 13.3 11.5 124 13.9 13.7 61 6.8 7.81986 .......................... 341 38.9 38.6 74 8.5 10.0 140 16.0 14.4 126 14.5 14.2 81 9.3 11.0
1985 .......................... 321 37.4 36.5 72 8.4 9.6 131 15.2 13.5 119 13.8 13.4 63 7.3 8.41984 .......................... 334 39.6 40.0 90 10.7 12.7 128 15.2 14.0 116 13.7 13.3 79 9.4 10.51983 .......................... 308 37.3 38.0 65 7.9 9.7 120 14.5 13.2 124 14.9 15.0 69 8.3 9.61982 .......................... 299 36.7 37.1 59 7.2 9.1 124 15.3 14.1 115 14.2 13.9 79 9.7 11.21981 .......................... 344 43.1 44.4 87 10.9 13.4 131 16.4 15.2 126 15.8 15.8 95 11.9 14.51980 .......................... 354 45.3 48.4 101 12.9 16.3 134 17.2 16.7 119 15.2 15.5 105 13.4 16.71979 .......................... 290 38.1 39.4 57 7.5 9.6 119 15.7 14.6 114 15.0 15.1 77 10.1 12.9
- 45 -

Table 1. Number of deaths and unadjusted and age-adjusted death rates per 100,000 population for different categories of alcohol-related mortality byState: United States, 1979–92.
Hawaii
Race, sex,and year
All Alcohol-Related Causes of DeathAll Chronic Liver Disease and
CirrhosisTotal Causes of Death with ExplicitMention of Alcohol
Other Alcohol-Related Diseases Other Alcohol-Related Injuries orAdverse Effects
Number Unadj.Rate
Age-Adj.Rate Number Unadj.
RateAge-Adj.
Rate Number Unadj.Rate
Age-Adj.Rate Number Unadj.
RateAge-Adj.
Rate Number Unadj.Rate
Age-Adj.Rate
All races, both sexes1992 .......................... 363 31.4 24.8 36 3.1 2.8 181 15.7 10.5 146 12.6 11.5 73 6.3 5.01991 .......................... 344 30.3 24.4 49 4.3 4.0 153 13.5 8.7 142 12.5 11.7 68 6.0 5.01990 .......................... 378 34.0 27.7 43 3.9 3.4 175 15.7 10.6 161 14.5 13.6 75 6.7 5.51989 .......................... 342 31.2 25.2 38 3.5 3.1 158 14.5 9.6 145 13.3 12.5 68 6.2 5.01988 .......................... 344 31.8 26.2 39 3.6 3.1 167 15.4 11.1 138 12.8 12.0 80 7.4 6.41987 .......................... 332 31.1 25.8 38 3.6 3.2 151 14.1 10.1 143 13.4 12.4 82 7.7 6.61986 .......................... 312 29.7 25.3 34 3.2 3.1 141 13.4 10.1 137 13.1 12.2 69 6.6 5.8
1985 .......................... 314 30.2 26.0 36 3.5 3.3 145 14.0 10.8 133 12.8 11.9 76 7.3 6.91984 .......................... 302 29.4 25.4 22 2.1 2.0 147 14.3 11.2 133 13.0 12.1 66 6.4 5.81983 .......................... 310 30.6 26.9 30 3.0 2.8 131 12.9 10.2 149 14.8 13.8 60 5.9 5.41982 .......................... 317 31.9 28.6 36 3.6 3.5 138 13.9 11.4 143 14.4 13.7 63 6.3 5.71981 .......................... 322 32.9 30.3 36 3.7 3.7 135 13.8 11.9 151 15.4 14.7 68 7.0 6.81980 .......................... 343 35.7 33.0 26 2.7 2.7 137 14.2 12.4 180 18.8 17.8 84 8.7 8.51979 .......................... 341 35.9 33.7 30 3.2 3.3 118 12.4 10.9 194 20.4 19.5 77 8.1 8.0
All races, male1992 .......................... 247 42.1 35.7 27 4.6 4.2 116 19.8 14.6 104 17.7 16.8 54 9.2 7.61991 .......................... 247 42.8 36.4 44 7.6 7.1 95 16.5 11.9 107 18.6 17.4 52 9.0 8.01990 .......................... 262 46.2 40.3 32 5.7 5.4 107 18.9 14.2 122 21.6 20.6 46 8.1 7.51989 .......................... 235 42.2 36.1 28 5.0 4.6 100 17.8 13.3 108 19.4 18.2 47 8.4 7.31988 .......................... 240 43.6 38.0 31 5.6 5.1 110 20.0 15.9 99 18.0 16.9 57 10.4 9.51987 .......................... 237 43.5 37.9 35 6.4 6.0 95 17.5 13.7 107 19.6 18.1 56 10.3 9.41986 .......................... 205 38.1 34.2 26 4.8 4.7 84 15.6 13.0 95 17.6 16.6 39 7.3 6.9
1985 .......................... 218 41.0 37.0 30 5.7 5.5 95 17.9 15.1 93 17.4 16.4 57 10.7 10.51984 .......................... 217 41.3 37.7 20 3.8 3.8 98 18.7 16.0 99 18.8 17.8 52 9.9 9.61983 .......................... 217 41.9 38.5 17 3.3 3.3 87 16.9 14.6 113 21.8 20.6 40 7.7 7.41982 .......................... 226 44.5 41.2 25 4.9 4.7 94 18.5 16.2 107 21.1 20.3 42 8.3 7.91981 .......................... 231 46.1 43.9 29 5.8 5.9 88 17.7 16.4 114 22.7 21.6 49 9.8 9.91980 .......................... 235 47.6 45.5 19 3.9 3.9 87 17.6 16.5 129 26.1 25.0 55 11.2 11.41979 .......................... 242 49.6 47.7 23 4.7 5.0 77 15.7 15.0 142 29.2 27.7 52 10.7 10.9
All races, female1992 .......................... 116 20.4 14.0 9 1.6 1.3 65 11.5 6.8 42 7.4 5.9 19 3.3 2.51991 .......................... 98 17.5 12.4 5 0.9 0.9 58 10.4 5.8 35 6.2 5.6 16 2.9 2.01990 .......................... 117 21.4 15.1 11 2.0 1.5 68 12.4 7.3 38 7.0 6.3 29 5.3 3.61989 .......................... 106 19.8 14.3 10 1.9 1.7 59 10.9 6.2 37 7.0 6.4 21 3.9 2.81988 .......................... 103 19.5 14.6 8 1.5 1.2 56 10.7 6.7 39 7.4 6.7 23 4.3 3.51987 .......................... 95 18.2 13.7 3 0.6 0.5 56 10.6 6.8 36 7.0 6.4 26 5.0 4.01986 .......................... 108 21.0 16.5 8 1.6 1.6 57 11.1 7.4 43 8.3 7.5 30 5.8 4.7
- 46 -

Table 1. Number of deaths and unadjusted and age-adjusted death rates per 100,000 population for different categories of alcohol-related mortality byState: United States, 1979–92.
Hawaii
Race, sex,and year
All Alcohol-Related Causes of DeathAll Chronic Liver Disease and
CirrhosisTotal Causes of Death with ExplicitMention of Alcohol
Other Alcohol-Related Diseases Other Alcohol-Related Injuries orAdverse Effects
Number Unadj.Rate
Age-Adj.Rate Number Unadj.
RateAge-Adj.
Rate Number Unadj.Rate
Age-Adj.Rate Number Unadj.
RateAge-Adj.
Rate Number Unadj.Rate
Age-Adj.Rate
All races, female
1985 .......................... 97 19.0 14.8 6 1.2 1.1 50 9.9 6.7 40 7.9 7.0 19 3.7 3.41984 .......................... 86 17.0 13.0 2 0.4 0.3 49 9.8 6.6 34 6.8 6.1 14 2.8 2.11983 .......................... 93 18.8 15.1 13 2.6 2.4 43 8.7 6.1 37 7.4 6.6 20 4.0 3.41982 .......................... 91 18.8 15.9 11 2.3 2.2 45 9.2 6.7 36 7.3 6.9 21 4.3 3.51981 .......................... 91 19.0 16.4 7 1.5 1.6 47 9.8 7.4 37 7.8 7.4 19 4.0 3.71980 .......................... 108 23.1 20.2 7 1.5 1.5 50 10.6 8.4 52 11.0 10.2 29 6.2 5.71979 .......................... 99 21.5 19.2 7 1.5 1.5 41 8.9 7.0 51 11.1 10.6 25 5.4 5.2
White, male1992 .......................... 83 39.8 36.9 16 7.7 7.1 30 14.6 13.4 36 17.4 16.4 18 8.7 8.51991 .......................... 95 46.5 42.5 24 11.7 10.9 27 12.9 11.8 45 21.8 19.9 26 12.7 12.11990 .......................... 84 41.4 40.5 19 9.4 10.1 22 11.1 10.6 42 20.9 19.9 21 10.4 10.81989 .......................... 80 39.2 37.7 15 7.4 7.6 26 12.8 12.4 39 19.0 17.7 21 10.4 11.01988 .......................... 78 38.4 37.5 15 7.4 7.6 32 15.9 16.0 30 15.0 14.0 23 11.4 11.61987 .......................... 92 45.4 45.5 18 8.9 9.9 29 14.4 14.8 45 22.1 20.8 26 12.9 14.31986 .......................... 76 38.2 38.5 17 8.5 9.0 25 12.7 13.4 34 17.0 16.1 26 13.0 14.0
1985 .......................... 77 38.7 39.8 17 8.6 9.5 27 13.7 14.6 33 16.5 15.7 28 14.1 16.71984 .......................... 86 43.4 44.5 14 7.1 7.7 30 15.1 16.8 42 21.2 20.0 27 13.7 15.51983 .......................... 82 42.3 43.1 10 5.1 6.3 20 10.4 11.9 52 26.8 24.9 19 9.8 11.61982 .......................... 87 45.6 47.6 15 7.9 8.6 29 15.1 17.3 43 22.6 21.7 22 11.5 12.51981 .......................... 92 48.6 53.1 19 10.0 12.7 28 14.8 17.9 45 23.7 22.5 27 14.3 17.21980 .......................... 79 42.4 45.8 8 4.3 5.8 22 11.7 14.6 49 26.4 25.5 26 13.9 18.01979 .......................... 105 55.9 59.8 16 8.5 10.5 24 12.8 16.8 65 34.5 32.6 26 13.9 18.6
Black, male1992 .......................... 2 13.7 18.3 0 0.0 0.0 1 4.9 11.2 2 8.8 7.1 1 5.7 5.01991 .......................... 7 43.3 63.9 2 11.9 24.5 - 1.7 6.4 5 29.8 33.0 1 5.9 5.71990 .......................... 4 21.3 61.2 0 0.0 0.0 2 11.8 54.8 2 9.5 6.4 0 0.0 0.01989 .......................... 4 21.5 72.2 0 0.0 0.0 1 6.5 33.7 3 15.1 38.6 0 0.0 0.01988 .......................... 8 46.9 96.1 1 6.1 33.2 2 12.2 41.8 5 28.6 21.1 3 18.4 63.91987 .......................... 3 17.2 49.4 1 6.3 35.9 - 0.9 4.7 2 10.0 8.8 1 6.3 35.91986 .......................... 4 23.1 24.7 0 0.0 0.0 1 5.0 9.7 3 18.2 15.0 0 0.0 0.0
1985 .......................... 4 24.5 21.2 0 0.0 0.0 - 1.4 5.8 3 23.1 15.4 1 6.7 3.81984 .......................... 4 24.6 75.1 1 6.9 30.5 1 8.1 39.4 1 9.6 5.1 0 0.0 0.01983 .......................... 2 15.3 15.7 0 0.0 0.0 - 2.0 8.5 2 13.3 7.2 0 0.0 0.01982 .......................... 3 23.4 19.1 0 0.0 0.0 - 0.9 7.4 3 22.5 11.7 0 0.0 0.0
- 47 -

Table 1. Number of deaths and unadjusted and age-adjusted death rates per 100,000 population for different categories of alcohol-related mortality byState: United States, 1979–92.
Hawaii
Race, sex,and year
All Alcohol-Related Causes of DeathAll Chronic Liver Disease and
CirrhosisTotal Causes of Death with ExplicitMention of Alcohol
Other Alcohol-Related Diseases Other Alcohol-Related Injuries orAdverse Effects
Number Unadj.Rate
Age-Adj.Rate Number Unadj.
RateAge-Adj.
Rate Number Unadj.Rate
Age-Adj.Rate Number Unadj.
RateAge-Adj.
Rate Number Unadj.Rate
Age-Adj.Rate
Black, male1981 .......................... 3 26.1 28.9 0 0.0 0.0 - 2.0 16.2 3 24.1 12.6 0 0.0 0.01980 .......................... 3 21.8 47.0 1 8.1 35.8 - 1.2 5.4 2 12.4 5.8 1 8.1 35.81979 .......................... 3 25.6 20.4 0 0.0 0.0 - 2.3 9.3 3 23.2 11.1 0 0.0 0.0
White, female1992 .......................... 35 19.5 14.8 5 2.8 2.5 18 10.0 6.8 12 6.7 5.5 10 5.6 4.51991 .......................... 29 16.4 12.6 5 2.8 3.2 15 8.5 5.0 9 5.1 4.4 7 3.9 2.71990 .......................... 35 19.9 15.0 8 4.6 3.7 17 10.0 6.5 9 5.4 4.8 9 5.1 4.01989 .......................... 35 20.1 15.8 6 3.4 3.4 18 10.1 6.6 11 6.5 5.8 12 6.8 5.71988 .......................... 37 21.1 17.8 5 2.9 2.6 14 8.3 6.2 17 10.0 9.0 11 6.3 6.31987 .......................... 30 17.1 14.2 3 1.7 1.8 13 7.7 5.2 13 7.7 7.2 6 3.4 3.61986 .......................... 40 23.1 20.4 7 4.0 4.8 17 9.8 7.5 16 9.2 8.2 16 9.3 9.5
1985 .......................... 27 15.9 13.0 3 1.7 1.8 11 6.3 4.1 13 7.8 7.1 4 2.3 2.21984 .......................... 30 17.3 14.3 2 1.2 0.9 16 9.5 7.1 11 6.7 6.2 7 4.1 3.81983 .......................... 37 22.0 20.0 10 5.9 6.4 11 6.8 5.2 16 9.3 8.4 12 7.1 7.31982 .......................... 35 21.0 21.1 8 4.8 6.1 14 8.7 7.7 13 7.5 7.4 11 6.6 6.91981 .......................... 31 18.9 18.2 4 2.4 3.1 13 8.2 7.0 14 8.3 8.1 11 6.7 7.31980 .......................... 46 28.1 27.2 5 3.1 3.5 19 11.9 11.3 21 13.1 12.4 17 10.5 11.61979 .......................... 35 21.8 22.1 6 3.7 4.7 12 7.4 6.9 17 10.7 10.5 16 9.9 11.6
Black, female1992 .......................... - 0.6 0.8 0 0.0 0.0 - 0.6 0.8 0 0.0 0.0 0 0.0 0.01991 .......................... - 4.5 7.0 0 0.0 0.0 - 0.6 3.4 - 3.9 3.6 0 0.0 0.01990 .......................... - 0.5 2.4 0 0.0 0.0 - 0.5 2.4 0 0.0 0.0 0 0.0 0.01989 .......................... 1 12.4 30.2 0 0.0 0.0 - 4.2 5.2 1 8.2 25.0 0 0.0 0.01988 .......................... 1 9.6 9.4 0 0.0 0.0 - 1.0 2.8 1 8.6 6.7 0 0.0 0.01987 .......................... 1 8.5 39.2 0 0.0 0.0 1 8.5 39.2 0 0.0 0.0 0 0.0 0.01986 .......................... 1 13.5 49.4 0 0.0 0.0 1 8.9 42.3 - 4.6 7.1 0 0.0 0.0
1985 .......................... 1 7.8 24.3 0 0.0 0.0 - 4.6 21.6 - 3.2 2.6 0 0.0 0.01984 .......................... - 4.9 8.8 0 0.0 0.0 - 1.5 6.1 - 3.4 2.7 0 0.0 0.01983 .......................... 1 9.5 10.6 0 0.0 0.0 - 1.3 4.8 1 8.2 5.8 0 0.0 0.01982 .......................... 1 7.5 21.5 0 0.0 0.0 - 3.6 18.5 - 4.0 2.9 0 0.0 0.01981 .......................... - 1.1 5.3 0 0.0 0.0 - 1.1 5.3 0 0.0 0.0 0 0.0 0.01980 .......................... - 1.2 5.5 0 0.0 0.0 - 1.2 5.5 0 0.0 0.0 0 0.0 0.01979 .......................... - 2.2 11.3 0 0.0 0.0 - 2.2 11.3 0 0.0 0.0 0 0.0 0.0
- The AAF methodology used to estimate alcohol-related mortality can result in fractional estimates less than 0.5 but greater than 0.
- 48 -
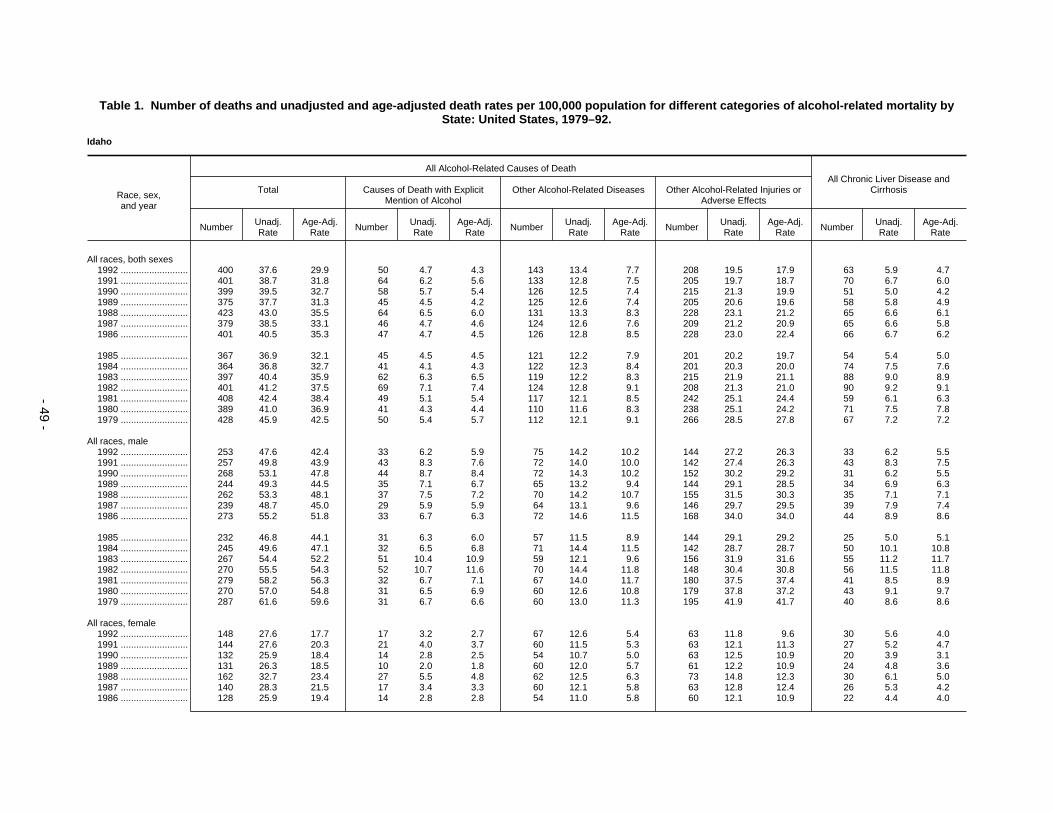
Table 1. Number of deaths and unadjusted and age-adjusted death rates per 100,000 population for different categories of alcohol-related mortality byState: United States, 1979–92.
Idaho
Race, sex,and year
All Alcohol-Related Causes of DeathAll Chronic Liver Disease and
CirrhosisTotal Causes of Death with ExplicitMention of Alcohol
Other Alcohol-Related Diseases Other Alcohol-Related Injuries orAdverse Effects
Number Unadj.Rate
Age-Adj.Rate Number Unadj.
RateAge-Adj.
Rate Number Unadj.Rate
Age-Adj.Rate Number Unadj.
RateAge-Adj.
Rate Number Unadj.Rate
Age-Adj.Rate
All races, both sexes1992 .......................... 400 37.6 29.9 50 4.7 4.3 143 13.4 7.7 208 19.5 17.9 63 5.9 4.71991 .......................... 401 38.7 31.8 64 6.2 5.6 133 12.8 7.5 205 19.7 18.7 70 6.7 6.01990 .......................... 399 39.5 32.7 58 5.7 5.4 126 12.5 7.4 215 21.3 19.9 51 5.0 4.21989 .......................... 375 37.7 31.3 45 4.5 4.2 125 12.6 7.4 205 20.6 19.6 58 5.8 4.91988 .......................... 423 43.0 35.5 64 6.5 6.0 131 13.3 8.3 228 23.1 21.2 65 6.6 6.11987 .......................... 379 38.5 33.1 46 4.7 4.6 124 12.6 7.6 209 21.2 20.9 65 6.6 5.81986 .......................... 401 40.5 35.3 47 4.7 4.5 126 12.8 8.5 228 23.0 22.4 66 6.7 6.2
1985 .......................... 367 36.9 32.1 45 4.5 4.5 121 12.2 7.9 201 20.2 19.7 54 5.4 5.01984 .......................... 364 36.8 32.7 41 4.1 4.3 122 12.3 8.4 201 20.3 20.0 74 7.5 7.61983 .......................... 397 40.4 35.9 62 6.3 6.5 119 12.2 8.3 215 21.9 21.1 88 9.0 8.91982 .......................... 401 41.2 37.5 69 7.1 7.4 124 12.8 9.1 208 21.3 21.0 90 9.2 9.11981 .......................... 408 42.4 38.4 49 5.1 5.4 117 12.1 8.5 242 25.1 24.4 59 6.1 6.31980 .......................... 389 41.0 36.9 41 4.3 4.4 110 11.6 8.3 238 25.1 24.2 71 7.5 7.81979 .......................... 428 45.9 42.5 50 5.4 5.7 112 12.1 9.1 266 28.5 27.8 67 7.2 7.2
All races, male1992 .......................... 253 47.6 42.4 33 6.2 5.9 75 14.2 10.2 144 27.2 26.3 33 6.2 5.51991 .......................... 257 49.8 43.9 43 8.3 7.6 72 14.0 10.0 142 27.4 26.3 43 8.3 7.51990 .......................... 268 53.1 47.8 44 8.7 8.4 72 14.3 10.2 152 30.2 29.2 31 6.2 5.51989 .......................... 244 49.3 44.5 35 7.1 6.7 65 13.2 9.4 144 29.1 28.5 34 6.9 6.31988 .......................... 262 53.3 48.1 37 7.5 7.2 70 14.2 10.7 155 31.5 30.3 35 7.1 7.11987 .......................... 239 48.7 45.0 29 5.9 5.9 64 13.1 9.6 146 29.7 29.5 39 7.9 7.41986 .......................... 273 55.2 51.8 33 6.7 6.3 72 14.6 11.5 168 34.0 34.0 44 8.9 8.6
1985 .......................... 232 46.8 44.1 31 6.3 6.0 57 11.5 8.9 144 29.1 29.2 25 5.0 5.11984 .......................... 245 49.6 47.1 32 6.5 6.8 71 14.4 11.5 142 28.7 28.7 50 10.1 10.81983 .......................... 267 54.4 52.2 51 10.4 10.9 59 12.1 9.6 156 31.9 31.6 55 11.2 11.71982 .......................... 270 55.5 54.3 52 10.7 11.6 70 14.4 11.8 148 30.4 30.8 56 11.5 11.81981 .......................... 279 58.2 56.3 32 6.7 7.1 67 14.0 11.7 180 37.5 37.4 41 8.5 8.91980 .......................... 270 57.0 54.8 31 6.5 6.9 60 12.6 10.8 179 37.8 37.2 43 9.1 9.71979 .......................... 287 61.6 59.6 31 6.7 6.6 60 13.0 11.3 195 41.9 41.7 40 8.6 8.6
All races, female1992 .......................... 148 27.6 17.7 17 3.2 2.7 67 12.6 5.4 63 11.8 9.6 30 5.6 4.01991 .......................... 144 27.6 20.3 21 4.0 3.7 60 11.5 5.3 63 12.1 11.3 27 5.2 4.71990 .......................... 132 25.9 18.4 14 2.8 2.5 54 10.7 5.0 63 12.5 10.9 20 3.9 3.11989 .......................... 131 26.3 18.5 10 2.0 1.8 60 12.0 5.7 61 12.2 10.9 24 4.8 3.61988 .......................... 162 32.7 23.4 27 5.5 4.8 62 12.5 6.3 73 14.8 12.3 30 6.1 5.01987 .......................... 140 28.3 21.5 17 3.4 3.3 60 12.1 5.8 63 12.8 12.4 26 5.3 4.21986 .......................... 128 25.9 19.4 14 2.8 2.8 54 11.0 5.8 60 12.1 10.9 22 4.4 4.0
- 49 -

Table 1. Number of deaths and unadjusted and age-adjusted death rates per 100,000 population for different categories of alcohol-related mortality byState: United States, 1979–92.
Idaho
Race, sex,and year
All Alcohol-Related Causes of DeathAll Chronic Liver Disease and
CirrhosisTotal Causes of Death with ExplicitMention of Alcohol
Other Alcohol-Related Diseases Other Alcohol-Related Injuries orAdverse Effects
Number Unadj.Rate
Age-Adj.Rate Number Unadj.
RateAge-Adj.
Rate Number Unadj.Rate
Age-Adj.Rate Number Unadj.
RateAge-Adj.
Rate Number Unadj.Rate
Age-Adj.Rate
All races, female
1985 .......................... 135 27.1 20.4 14 2.8 3.1 64 12.9 7.0 57 11.4 10.2 29 5.8 4.81984 .......................... 119 24.1 19.0 9 1.8 1.7 51 10.3 5.8 59 11.9 11.5 24 4.8 4.41983 .......................... 130 26.5 20.2 11 2.2 2.2 60 12.2 7.1 59 12.0 10.8 33 6.7 6.11982 .......................... 131 26.9 21.3 17 3.5 3.4 54 11.1 6.7 60 12.3 11.2 34 7.0 6.51981 .......................... 128 26.6 21.0 17 3.5 3.9 50 10.3 5.6 62 12.8 11.5 18 3.7 3.91980 .......................... 119 25.1 19.6 10 2.1 2.1 50 10.5 6.1 60 12.5 11.4 28 5.9 6.01979 .......................... 141 30.2 25.8 19 4.1 4.9 52 11.1 7.0 70 15.0 13.9 27 5.8 6.0
White, male1992 .......................... 245 47.4 42.0 30 5.8 5.4 74 14.4 10.2 141 27.3 26.4 32 6.2 5.31991 .......................... 247 49.3 43.1 39 7.8 7.0 71 14.1 9.9 137 27.3 26.2 41 8.2 7.31990 .......................... 261 53.3 47.6 43 8.8 8.3 71 14.4 10.2 147 30.1 29.1 31 6.3 5.61989 .......................... 232 48.3 43.2 29 6.0 5.5 64 13.3 9.3 139 29.0 28.4 30 6.2 5.51988 .......................... 249 52.2 46.7 33 6.9 6.4 68 14.2 10.4 149 31.2 29.8 33 6.9 6.81987 .......................... 231 48.3 44.4 28 5.9 5.8 64 13.3 9.7 139 29.2 28.9 39 8.2 7.61986 .......................... 264 54.9 51.0 31 6.4 5.9 71 14.7 11.4 162 33.8 33.7 41 8.5 8.1
1985 .......................... 222 46.0 43.0 28 5.8 5.4 55 11.4 8.7 139 28.8 28.9 23 4.8 4.71984 .......................... 230 47.6 44.8 25 5.2 5.4 71 14.7 11.6 134 27.8 27.8 43 8.9 9.51983 .......................... 253 52.9 50.2 43 9.0 9.1 59 12.3 9.7 151 31.6 31.3 49 10.2 10.31982 .......................... 256 53.9 52.4 48 10.1 10.9 67 14.2 11.5 140 29.6 29.9 51 10.8 10.81981 .......................... 268 57.2 55.1 27 5.8 6.1 66 14.0 11.6 176 37.4 37.3 38 8.1 8.21980 .......................... 259 55.9 53.3 26 5.6 5.7 58 12.5 10.5 175 37.7 37.1 37 8.0 8.21979 .......................... 278 61.0 58.9 30 6.6 6.5 60 13.1 11.2 189 41.3 41.1 39 8.5 8.5
Black, male1992 .......................... 1 56.9 130.1 0 0.0 0.0 1 31.8 63.6 1 25.0 66.5 0 0.0 0.01991 .......................... 1 51.5 120.5 0 0.0 0.0 1 33.0 105.9 - 18.5 14.6 1 44.0 167.31990 .......................... 1 36.1 28.4 0 0.0 0.0 0 0.0 0.0 1 36.1 28.4 0 0.0 0.01989 .......................... - 24.1 51.5 0 0.0 0.0 - 24.1 51.5 0 0.0 0.0 1 48.3 102.91988 .......................... 1 49.8 83.1 0 0.0 0.0 - 6.0 11.3 1 43.8 71.8 0 0.0 0.01987 .......................... - 3.5 3.7 0 0.0 0.0 - 3.5 3.7 0 0.0 0.0 0 0.0 0.01986 .......................... - 25.5 26.8 0 0.0 0.0 - 6.1 13.2 - 19.4 13.6 0 0.0 0.0
1985 .......................... 2 89.8 177.0 0 0.0 0.0 1 32.0 70.1 1 57.8 106.9 0 0.0 0.01984 .......................... 2 107.9 201.9 1 54.0 130.9 - 6.5 11.5 1 47.5 59.4 1 54.0 130.91983 .......................... 1 49.2 45.4 0 0.0 0.0 - 5.5 9.6 1 43.7 35.8 0 0.0 0.01982 .......................... - 2.8 7.1 0 0.0 0.0 - 2.8 7.1 0 0.0 0.0 0 0.0 0.0
- 50 -
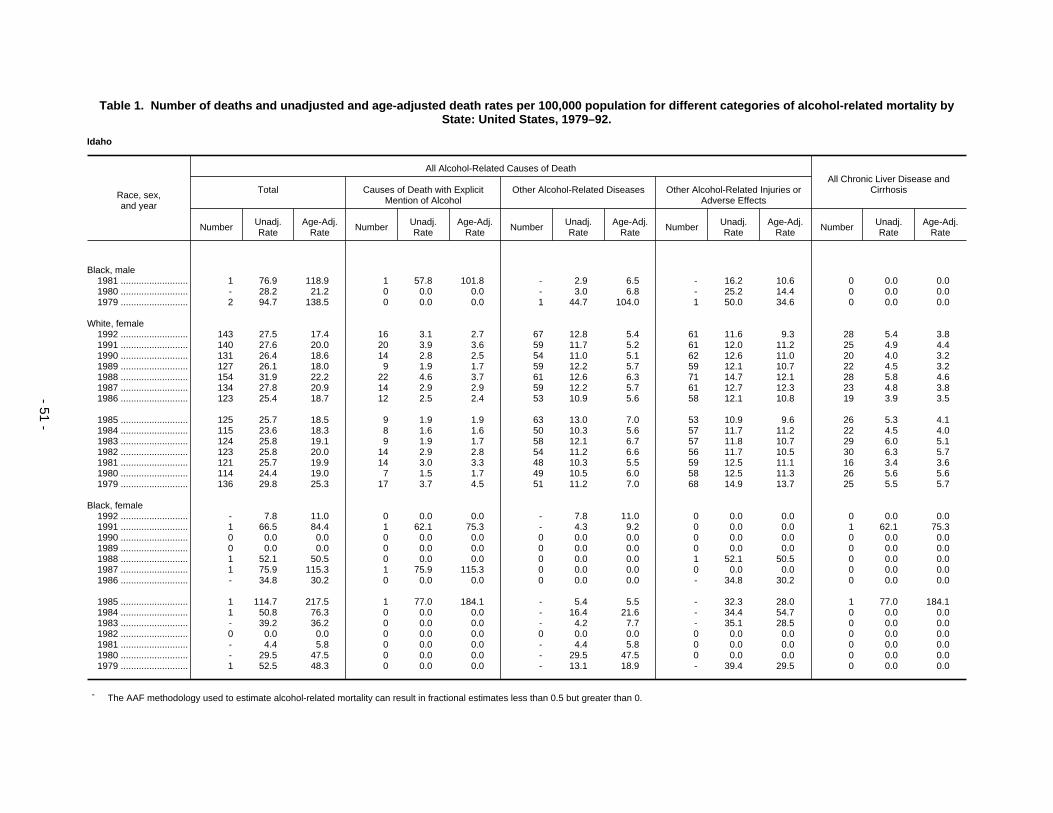
Table 1. Number of deaths and unadjusted and age-adjusted death rates per 100,000 population for different categories of alcohol-related mortality byState: United States, 1979–92.
Idaho
Race, sex,and year
All Alcohol-Related Causes of DeathAll Chronic Liver Disease and
CirrhosisTotal Causes of Death with ExplicitMention of Alcohol
Other Alcohol-Related Diseases Other Alcohol-Related Injuries orAdverse Effects
Number Unadj.Rate
Age-Adj.Rate Number Unadj.
RateAge-Adj.
Rate Number Unadj.Rate
Age-Adj.Rate Number Unadj.
RateAge-Adj.
Rate Number Unadj.Rate
Age-Adj.Rate
Black, male1981 .......................... 1 76.9 118.9 1 57.8 101.8 - 2.9 6.5 - 16.2 10.6 0 0.0 0.01980 .......................... - 28.2 21.2 0 0.0 0.0 - 3.0 6.8 - 25.2 14.4 0 0.0 0.01979 .......................... 2 94.7 138.5 0 0.0 0.0 1 44.7 104.0 1 50.0 34.6 0 0.0 0.0
White, female1992 .......................... 143 27.5 17.4 16 3.1 2.7 67 12.8 5.4 61 11.6 9.3 28 5.4 3.81991 .......................... 140 27.6 20.0 20 3.9 3.6 59 11.7 5.2 61 12.0 11.2 25 4.9 4.41990 .......................... 131 26.4 18.6 14 2.8 2.5 54 11.0 5.1 62 12.6 11.0 20 4.0 3.21989 .......................... 127 26.1 18.0 9 1.9 1.7 59 12.2 5.7 59 12.1 10.7 22 4.5 3.21988 .......................... 154 31.9 22.2 22 4.6 3.7 61 12.6 6.3 71 14.7 12.1 28 5.8 4.61987 .......................... 134 27.8 20.9 14 2.9 2.9 59 12.2 5.7 61 12.7 12.3 23 4.8 3.81986 .......................... 123 25.4 18.7 12 2.5 2.4 53 10.9 5.6 58 12.1 10.8 19 3.9 3.5
1985 .......................... 125 25.7 18.5 9 1.9 1.9 63 13.0 7.0 53 10.9 9.6 26 5.3 4.11984 .......................... 115 23.6 18.3 8 1.6 1.6 50 10.3 5.6 57 11.7 11.2 22 4.5 4.01983 .......................... 124 25.8 19.1 9 1.9 1.7 58 12.1 6.7 57 11.8 10.7 29 6.0 5.11982 .......................... 123 25.8 20.0 14 2.9 2.8 54 11.2 6.6 56 11.7 10.5 30 6.3 5.71981 .......................... 121 25.7 19.9 14 3.0 3.3 48 10.3 5.5 59 12.5 11.1 16 3.4 3.61980 .......................... 114 24.4 19.0 7 1.5 1.7 49 10.5 6.0 58 12.5 11.3 26 5.6 5.61979 .......................... 136 29.8 25.3 17 3.7 4.5 51 11.2 7.0 68 14.9 13.7 25 5.5 5.7
Black, female1992 .......................... - 7.8 11.0 0 0.0 0.0 - 7.8 11.0 0 0.0 0.0 0 0.0 0.01991 .......................... 1 66.5 84.4 1 62.1 75.3 - 4.3 9.2 0 0.0 0.0 1 62.1 75.31990 .......................... 0 0.0 0.0 0 0.0 0.0 0 0.0 0.0 0 0.0 0.0 0 0.0 0.01989 .......................... 0 0.0 0.0 0 0.0 0.0 0 0.0 0.0 0 0.0 0.0 0 0.0 0.01988 .......................... 1 52.1 50.5 0 0.0 0.0 0 0.0 0.0 1 52.1 50.5 0 0.0 0.01987 .......................... 1 75.9 115.3 1 75.9 115.3 0 0.0 0.0 0 0.0 0.0 0 0.0 0.01986 .......................... - 34.8 30.2 0 0.0 0.0 0 0.0 0.0 - 34.8 30.2 0 0.0 0.0
1985 .......................... 1 114.7 217.5 1 77.0 184.1 - 5.4 5.5 - 32.3 28.0 1 77.0 184.11984 .......................... 1 50.8 76.3 0 0.0 0.0 - 16.4 21.6 - 34.4 54.7 0 0.0 0.01983 .......................... - 39.2 36.2 0 0.0 0.0 - 4.2 7.7 - 35.1 28.5 0 0.0 0.01982 .......................... 0 0.0 0.0 0 0.0 0.0 0 0.0 0.0 0 0.0 0.0 0 0.0 0.01981 .......................... - 4.4 5.8 0 0.0 0.0 - 4.4 5.8 0 0.0 0.0 0 0.0 0.01980 .......................... - 29.5 47.5 0 0.0 0.0 - 29.5 47.5 0 0.0 0.0 0 0.0 0.01979 .......................... 1 52.5 48.3 0 0.0 0.0 - 13.1 18.9 - 39.4 29.5 0 0.0 0.0
- The AAF methodology used to estimate alcohol-related mortality can result in fractional estimates less than 0.5 but greater than 0.
- 51 -

Table 1. Number of deaths and unadjusted and age-adjusted death rates per 100,000 population for different categories of alcohol-related mortality byState: United States, 1979–92.
Illinois
Race, sex,and year
All Alcohol-Related Causes of DeathAll Chronic Liver Disease and
CirrhosisTotal Causes of Death with ExplicitMention of Alcohol
Other Alcohol-Related Diseases Other Alcohol-Related Injuries orAdverse Effects
Number Unadj.Rate
Age-Adj.Rate Number Unadj.
RateAge-Adj.
Rate Number Unadj.Rate
Age-Adj.Rate Number Unadj.
RateAge-Adj.
Rate Number Unadj.Rate
Age-Adj.Rate
All races, both sexes1992 .......................... 4,854 41.8 33.7 865 7.4 6.8 2,077 17.9 11.0 1,912 16.5 15.9 1,250 10.8 8.81991 .......................... 5,120 44.4 36.2 878 7.6 7.1 2,155 18.7 11.8 2,087 18.1 17.3 1,329 11.5 9.81990 .......................... 5,196 45.4 37.1 1,000 8.7 8.2 2,115 18.5 11.7 2,081 18.2 17.2 1,352 11.8 10.01989 .......................... 4,981 43.7 35.6 865 7.6 7.2 2,110 18.5 11.7 2,006 17.6 16.6 1,339 11.7 9.91988 .......................... 5,042 44.3 36.4 840 7.4 7.0 2,058 18.1 11.7 2,143 18.8 17.7 1,262 11.1 9.51987 .......................... 4,813 42.2 34.5 739 6.5 6.2 2,114 18.6 12.3 1,960 17.2 16.1 1,331 11.7 10.11986 .......................... 4,838 42.5 34.7 744 6.5 6.2 2,071 18.2 11.9 2,023 17.8 16.5 1,341 11.8 10.2
1985 .......................... 4,606 40.4 33.0 661 5.8 5.5 1,993 17.5 11.6 1,952 17.1 16.0 1,270 11.1 9.81984 .......................... 4,667 40.9 33.7 620 5.4 5.2 2,071 18.1 12.2 1,976 17.3 16.3 1,434 12.6 11.01983 .......................... 4,731 41.5 34.5 605 5.3 5.1 2,128 18.7 12.9 1,998 17.5 16.5 1,373 12.0 10.81982 .......................... 4,724 41.4 34.7 623 5.5 5.4 2,127 18.6 12.9 1,974 17.3 16.4 1,434 12.6 11.21981 .......................... 5,215 45.6 38.9 710 6.2 6.1 2,224 19.4 13.8 2,281 19.9 18.9 1,558 13.6 12.51980 .......................... 5,298 46.3 39.7 695 6.1 6.1 2,241 19.6 14.0 2,362 20.7 19.6 1,613 14.1 12.91979 .......................... 5,347 46.8 40.3 660 5.8 5.8 2,284 20.0 14.5 2,403 21.0 20.1 1,613 14.1 13.1
All races, male1992 .......................... 3,288 58.2 52.1 689 12.2 11.4 1,179 20.9 15.9 1,420 25.1 24.8 823 14.6 12.91991 .......................... 3,450 61.6 55.4 665 11.9 11.3 1,244 22.2 17.2 1,541 27.5 26.9 869 15.5 14.11990 .......................... 3,495 62.8 56.7 794 14.3 13.6 1,210 21.8 17.0 1,490 26.8 26.1 893 16.1 14.61989 .......................... 3,348 60.4 54.4 678 12.2 11.8 1,199 21.6 17.0 1,471 26.5 25.6 880 15.9 14.51988 .......................... 3,388 61.3 55.4 653 11.8 11.5 1,204 21.8 17.3 1,531 27.7 26.7 820 14.8 13.71987 .......................... 3,169 57.3 51.8 543 9.8 9.6 1,210 21.9 17.6 1,416 25.6 24.6 819 14.8 13.81986 .......................... 3,250 58.8 53.2 574 10.4 10.1 1,190 21.5 17.3 1,486 26.9 25.8 840 15.2 14.2
1985 .......................... 3,026 54.7 49.4 502 9.1 8.8 1,140 20.6 16.6 1,384 25.0 24.0 814 14.7 13.81984 .......................... 3,079 55.6 50.5 459 8.3 8.1 1,199 21.7 17.7 1,421 25.7 24.7 925 16.7 15.61983 .......................... 3,180 57.5 52.6 457 8.3 8.1 1,261 22.8 19.0 1,463 26.5 25.5 909 16.4 15.71982 .......................... 3,190 57.6 53.1 494 8.9 9.0 1,241 22.4 18.7 1,455 26.3 25.5 937 16.9 16.21981 .......................... 3,539 63.8 59.3 524 9.4 9.6 1,320 23.8 20.1 1,695 30.6 29.7 1,008 18.2 17.61980 .......................... 3,641 65.7 61.2 519 9.4 9.6 1,360 24.5 20.8 1,762 31.8 30.9 1,101 19.9 19.21979 .......................... 3,627 65.5 61.2 489 8.8 8.9 1,359 24.6 21.0 1,779 32.1 31.3 1,058 19.1 18.6
All races, female1992 .......................... 1,567 26.3 16.9 176 3.0 2.6 898 15.1 7.2 493 8.3 7.1 427 7.2 5.21991 .......................... 1,670 28.2 18.6 213 3.6 3.2 911 15.4 7.4 546 9.2 8.0 460 7.8 6.01990 .......................... 1,702 28.9 19.2 206 3.5 3.2 904 15.4 7.4 591 10.0 8.6 459 7.8 5.91989 .......................... 1,633 27.8 18.5 187 3.2 3.0 911 15.5 7.5 535 9.1 8.0 459 7.8 5.91988 .......................... 1,653 28.2 19.2 187 3.2 3.0 854 14.6 7.1 613 10.5 9.1 442 7.5 5.81987 .......................... 1,644 28.0 19.1 196 3.3 3.1 904 15.4 8.0 544 9.3 8.0 512 8.7 6.91986 .......................... 1,588 27.1 18.0 170 2.9 2.7 881 15.0 7.6 537 9.2 7.7 501 8.5 6.6
- 52 -

Table 1. Number of deaths and unadjusted and age-adjusted death rates per 100,000 population for different categories of alcohol-related mortality byState: United States, 1979–92.
Illinois
Race, sex,and year
All Alcohol-Related Causes of DeathAll Chronic Liver Disease and
CirrhosisTotal Causes of Death with ExplicitMention of Alcohol
Other Alcohol-Related Diseases Other Alcohol-Related Injuries orAdverse Effects
Number Unadj.Rate
Age-Adj.Rate Number Unadj.
RateAge-Adj.
Rate Number Unadj.Rate
Age-Adj.Rate Number Unadj.
RateAge-Adj.
Rate Number Unadj.Rate
Age-Adj.Rate
All races, female
1985 .......................... 1,580 26.9 18.5 159 2.7 2.5 853 14.5 7.6 568 9.7 8.4 456 7.8 6.21984 .......................... 1,588 27.0 18.8 161 2.7 2.7 872 14.8 7.9 555 9.4 8.2 509 8.7 7.11983 .......................... 1,551 26.4 18.5 148 2.5 2.4 868 14.8 8.1 535 9.1 8.0 464 7.9 6.61982 .......................... 1,534 26.1 18.2 129 2.2 2.1 886 15.0 8.4 519 8.8 7.7 497 8.4 6.91981 .......................... 1,676 28.4 20.6 186 3.2 3.1 904 15.3 8.8 586 9.9 8.7 550 9.3 8.01980 .......................... 1,657 28.1 20.4 176 3.0 2.9 881 15.0 8.6 600 10.2 9.0 512 8.7 7.41979 .......................... 1,720 29.2 21.6 171 2.9 2.9 925 15.7 9.2 624 10.6 9.5 555 9.4 8.3
White, male1992 .......................... 2,317 49.7 41.4 495 10.6 9.4 932 20.0 13.9 889 19.1 18.0 642 13.8 11.51991 .......................... 2,413 52.1 43.9 451 9.7 8.9 965 20.8 14.6 998 21.5 20.4 665 14.4 12.31990 .......................... 2,459 53.4 45.3 511 11.1 10.1 948 20.6 14.7 999 21.7 20.6 672 14.6 12.51989 .......................... 2,400 52.2 44.3 415 9.0 8.3 963 21.0 15.0 1,022 22.2 21.0 655 14.3 12.11988 .......................... 2,487 54.1 46.3 447 9.7 8.9 950 20.7 14.9 1,090 23.7 22.4 647 14.1 12.31987 .......................... 2,340 50.9 43.4 359 7.8 7.2 965 21.0 15.3 1,016 22.1 20.8 618 13.4 11.61986 .......................... 2,422 52.6 45.1 411 8.9 8.3 947 20.6 15.1 1,064 23.1 21.7 660 14.3 12.5
1985 .......................... 2,276 49.3 42.1 364 7.9 7.2 903 19.6 14.4 1,009 21.8 20.5 619 13.4 11.81984 .......................... 2,331 50.4 43.3 351 7.6 7.1 955 20.6 15.4 1,025 22.2 20.9 744 16.1 14.11983 .......................... 2,403 51.9 44.8 345 7.5 6.9 1,002 21.6 16.5 1,056 22.8 21.4 727 15.7 14.11982 .......................... 2,413 52.0 45.3 363 7.8 7.4 996 21.4 16.4 1,054 22.7 21.6 745 16.0 14.31981 .......................... 2,682 57.5 50.8 382 8.2 7.9 1,059 22.7 17.5 1,241 26.6 25.4 794 17.0 15.41980 .......................... 2,736 58.7 51.9 366 7.8 7.6 1,085 23.3 18.1 1,284 27.5 26.2 871 18.7 16.91979 .......................... 2,783 59.5 52.8 355 7.6 7.2 1,096 23.4 18.5 1,332 28.5 27.1 837 17.9 16.4
Black, male1992 .......................... 939 114.7 124.4 189 23.1 27.0 233 28.4 32.3 518 63.2 65.1 175 21.4 24.61991 .......................... 1,003 124.2 135.1 210 26.0 30.1 265 32.8 37.9 528 65.3 67.1 199 24.6 28.31990 .......................... 1,006 125.7 138.1 281 35.1 41.0 247 30.9 35.9 478 59.7 61.2 214 26.8 30.91989 .......................... 921 115.7 128.0 261 32.8 38.9 225 28.2 32.8 436 54.7 56.3 216 27.1 31.91988 .......................... 879 110.9 124.0 205 25.9 31.3 246 31.1 37.1 427 53.9 55.7 171 21.6 25.71987 .......................... 812 102.6 115.1 183 23.1 27.6 239 30.2 36.2 390 49.3 51.3 194 24.5 29.51986 .......................... 813 102.9 115.7 163 20.6 25.1 236 29.8 35.7 414 52.5 54.8 175 22.2 27.1
1985 .......................... 730 92.5 105.0 137 17.4 21.2 230 29.1 35.0 363 46.0 48.8 190 24.1 29.41984 .......................... 730 92.4 105.2 105 13.3 16.4 237 30.0 36.6 388 49.1 52.2 174 22.0 27.21983 .......................... 759 96.5 111.6 111 14.1 17.7 252 32.0 39.9 396 50.4 54.0 179 22.8 28.71982 .......................... 761 96.7 112.2 128 16.3 21.0 240 30.4 38.2 393 50.0 53.0 189 24.0 30.51981 .......................... 840 107.0 125.3 140 17.8 23.0 253 32.2 41.0 447 57.0 61.3 209 26.6 34.4
- 53 -

Table 1. Number of deaths and unadjusted and age-adjusted death rates per 100,000 population for different categories of alcohol-related mortality byState: United States, 1979–92.
Illinois
Race, sex,and year
All Alcohol-Related Causes of DeathAll Chronic Liver Disease and
CirrhosisTotal Causes of Death with ExplicitMention of Alcohol
Other Alcohol-Related Diseases Other Alcohol-Related Injuries orAdverse Effects
Number Unadj.Rate
Age-Adj.Rate Number Unadj.
RateAge-Adj.
Rate Number Unadj.Rate
Age-Adj.Rate Number Unadj.
RateAge-Adj.
Rate Number Unadj.Rate
Age-Adj.Rate
Black, male1980 .......................... 892 113.4 133.4 150 19.1 24.8 271 34.4 43.6 471 59.9 65.0 226 28.8 37.11979 .......................... 826 107.3 126.9 131 17.0 22.1 258 33.5 42.2 437 56.8 62.7 216 28.1 35.7
White, female1992 .......................... 1,248 25.7 14.6 126 2.6 2.2 752 15.5 6.3 370 7.6 6.1 341 7.0 4.61991 .......................... 1,289 26.6 15.7 120 2.5 2.1 750 15.5 6.4 419 8.7 7.2 322 6.7 4.61990 .......................... 1,328 27.6 16.3 132 2.7 2.4 751 15.6 6.5 445 9.2 7.4 340 7.1 4.81989 .......................... 1,277 26.6 15.8 113 2.3 2.1 755 15.7 6.5 409 8.5 7.2 349 7.3 5.01988 .......................... 1,324 27.5 17.0 124 2.6 2.3 716 14.9 6.3 484 10.1 8.4 341 7.1 5.01987 .......................... 1,335 27.7 17.1 148 3.1 2.7 757 15.7 7.1 430 8.9 7.3 407 8.4 6.11986 .......................... 1,287 26.6 16.1 123 2.5 2.3 742 15.4 6.8 422 8.7 7.0 398 8.2 5.9
1985 .......................... 1,297 26.8 16.7 116 2.4 2.0 720 14.9 6.9 460 9.5 7.9 363 7.5 5.51984 .......................... 1,318 27.1 17.3 121 2.5 2.4 749 15.4 7.2 448 9.2 7.7 405 8.3 6.31983 .......................... 1,249 25.7 16.2 101 2.1 1.9 732 15.0 7.1 416 8.5 7.2 357 7.3 5.71982 .......................... 1,272 26.1 16.6 98 2.0 1.8 758 15.5 7.6 416 8.5 7.1 407 8.3 6.31981 .......................... 1,366 27.9 18.4 134 2.7 2.5 761 15.5 7.8 472 9.6 8.1 440 9.0 7.11980 .......................... 1,353 27.6 18.3 132 2.7 2.5 740 15.1 7.6 481 9.8 8.2 407 8.3 6.61979 .......................... 1,412 28.7 19.5 127 2.6 2.4 789 16.0 8.4 496 10.1 8.7 445 9.0 7.5
Black, female1992 .......................... 298 32.0 30.0 47 5.1 5.3 137 14.8 12.5 114 12.2 12.1 80 8.6 8.91991 .......................... 365 39.8 37.3 91 9.9 10.0 156 17.0 14.7 118 12.9 12.6 134 14.6 14.71990 .......................... 357 39.2 36.8 72 7.9 8.1 149 16.4 14.1 136 14.9 14.6 114 12.5 12.51989 .......................... 342 37.8 35.8 74 8.2 8.5 151 16.7 14.9 117 12.9 12.4 107 11.8 11.91988 .......................... 316 35.1 33.4 62 6.9 7.3 134 14.9 13.2 120 13.4 12.9 98 10.9 10.91987 .......................... 299 33.2 32.3 48 5.3 5.8 141 15.7 14.4 109 12.2 12.0 102 11.3 12.01986 .......................... 295 32.8 31.4 47 5.2 5.6 135 15.1 13.7 112 12.5 12.1 103 11.5 11.9
1985 .......................... 274 30.6 30.2 42 4.7 5.2 128 14.3 13.4 104 11.6 11.5 88 9.8 10.61984 .......................... 258 28.7 28.6 39 4.3 4.8 119 13.2 12.8 101 11.2 11.1 101 11.2 12.31983 .......................... 293 32.7 33.3 47 5.2 6.0 132 14.7 14.8 115 12.8 12.6 103 11.5 12.61982 .......................... 251 28.0 28.7 31 3.5 3.9 123 13.7 13.9 97 10.8 11.0 87 9.7 10.91981 .......................... 296 33.1 34.8 48 5.4 6.2 138 15.4 16.3 110 12.3 12.3 104 11.6 13.31980 .......................... 295 32.9 34.7 42 4.7 5.5 138 15.4 16.3 115 12.8 13.0 101 11.3 12.71979 .......................... 300 34.2 35.9 44 5.0 5.9 132 15.0 15.9 124 14.1 14.1 109 12.4 14.2
- 54 -

Table 1. Number of deaths and unadjusted and age-adjusted death rates per 100,000 population for different categories of alcohol-related mortality byState: United States, 1979–92.
Indiana
Race, sex,and year
All Alcohol-Related Causes of DeathAll Chronic Liver Disease and
CirrhosisTotal Causes of Death with ExplicitMention of Alcohol
Other Alcohol-Related Diseases Other Alcohol-Related Injuries orAdverse Effects
Number Unadj.Rate
Age-Adj.Rate Number Unadj.
RateAge-Adj.
Rate Number Unadj.Rate
Age-Adj.Rate Number Unadj.
RateAge-Adj.
Rate Number Unadj.Rate
Age-Adj.Rate
All races, both sexes1992 .......................... 2,180 38.5 29.4 305 5.4 4.7 910 16.1 9.2 964 17.0 15.6 456 8.1 6.21991 .......................... 2,244 40.0 31.3 315 5.6 5.1 926 16.5 9.6 1,002 17.9 16.6 427 7.6 6.11990 .......................... 2,230 40.1 31.4 282 5.1 4.6 929 16.7 10.0 1,019 18.3 16.9 417 7.5 6.01989 .......................... 2,156 39.0 30.1 279 5.1 4.5 915 16.6 9.7 961 17.4 16.0 422 7.6 6.11988 .......................... 2,254 41.0 32.0 275 5.0 4.5 963 17.5 10.7 1,016 18.5 16.9 463 8.4 6.81987 .......................... 2,162 39.5 31.1 250 4.6 4.2 903 16.5 10.2 1,009 18.4 16.8 454 8.3 6.81986 .......................... 2,107 38.6 30.9 233 4.3 3.9 906 16.6 10.4 967 17.7 16.6 429 7.9 6.5
1985 .......................... 2,170 39.7 31.9 282 5.2 4.8 900 16.5 10.4 987 18.1 16.7 502 9.2 7.81984 .......................... 2,087 38.2 30.8 249 4.6 4.3 887 16.3 10.3 951 17.4 16.2 422 7.7 6.51983 .......................... 2,170 39.8 32.2 236 4.3 4.1 958 17.6 11.5 977 17.9 16.6 493 9.0 7.81982 .......................... 2,123 38.8 31.7 237 4.3 4.1 889 16.3 10.7 996 18.2 16.8 463 8.5 7.41981 .......................... 2,294 41.9 34.8 235 4.3 4.1 952 17.4 11.8 1,107 20.2 18.9 536 9.8 8.51980 .......................... 2,342 42.6 35.8 264 4.8 4.7 969 17.6 12.2 1,109 20.2 19.0 571 10.4 9.51979 .......................... 2,431 44.4 37.7 262 4.8 4.7 971 17.7 12.4 1,198 21.9 20.6 540 9.9 9.1
All races, male1992 .......................... 1,439 52.4 45.1 244 8.9 7.9 510 18.6 13.4 685 24.9 23.8 315 11.5 9.61991 .......................... 1,456 53.5 46.9 246 9.0 8.4 506 18.6 13.6 704 25.9 24.9 270 9.9 8.71990 .......................... 1,445 53.6 47.0 221 8.2 7.6 528 19.6 14.7 696 25.8 24.7 267 9.9 8.61989 .......................... 1,356 50.6 44.0 215 8.0 7.4 501 18.7 13.8 639 23.9 22.8 262 9.8 8.61988 .......................... 1,452 54.6 47.9 218 8.2 7.6 544 20.4 15.5 691 25.9 24.8 301 11.3 9.91987 .......................... 1,396 52.6 46.6 193 7.3 7.0 507 19.1 14.7 696 26.2 24.9 292 11.0 9.71986 .......................... 1,387 52.4 46.8 183 6.9 6.5 512 19.4 15.1 691 26.2 25.1 287 10.9 9.8
1985 .......................... 1,406 53.1 47.5 219 8.3 7.9 505 19.1 14.9 682 25.8 24.7 314 11.9 10.81984 .......................... 1,365 51.6 46.2 197 7.4 7.1 497 18.8 14.7 670 25.3 24.3 273 10.3 9.41983 .......................... 1,413 53.5 48.4 186 7.0 6.8 546 20.7 16.7 681 25.8 24.8 328 12.4 11.41982 .......................... 1,360 51.3 46.7 179 6.7 6.6 494 18.6 15.1 688 25.9 25.0 294 11.1 10.41981 .......................... 1,492 56.1 51.5 180 6.8 6.6 531 20.0 16.4 781 29.4 28.5 315 11.8 11.01980 .......................... 1,561 58.5 54.5 203 7.6 7.7 546 20.5 17.2 813 30.5 29.7 370 13.9 13.51979 .......................... 1,614 60.7 56.8 203 7.6 7.7 552 20.8 17.6 859 32.3 31.5 376 14.1 13.9
All races, female1992 .......................... 741 25.5 15.4 61 2.1 1.8 401 13.8 5.9 279 9.6 7.7 141 4.8 3.11991 .......................... 787 27.3 17.3 69 2.4 2.1 420 14.5 6.5 298 10.3 8.8 157 5.4 3.91990 .......................... 784 27.4 17.6 61 2.1 1.9 400 14.0 6.3 323 11.3 9.4 150 5.2 3.91989 .......................... 800 28.1 18.0 64 2.2 2.0 414 14.6 6.5 322 11.3 9.5 160 5.6 3.81988 .......................... 802 28.3 18.1 57 2.0 1.7 420 14.8 6.9 325 11.5 9.4 162 5.7 4.11987 .......................... 766 27.1 17.4 57 2.0 1.7 396 14.0 6.6 313 11.1 9.1 162 5.7 4.21986 .......................... 720 25.6 16.7 50 1.8 1.6 394 14.0 6.7 276 9.8 8.4 142 5.1 3.6
- 55 -

Table 1. Number of deaths and unadjusted and age-adjusted death rates per 100,000 population for different categories of alcohol-related mortality byState: United States, 1979–92.
Indiana
Race, sex,and year
All Alcohol-Related Causes of DeathAll Chronic Liver Disease and
CirrhosisTotal Causes of Death with ExplicitMention of Alcohol
Other Alcohol-Related Diseases Other Alcohol-Related Injuries orAdverse Effects
Number Unadj.Rate
Age-Adj.Rate Number Unadj.
RateAge-Adj.
Rate Number Unadj.Rate
Age-Adj.Rate Number Unadj.
RateAge-Adj.
Rate Number Unadj.Rate
Age-Adj.Rate
All races, female
1985 .......................... 764 27.2 18.1 63 2.2 2.1 396 14.1 6.9 306 10.9 9.1 188 6.7 5.21984 .......................... 722 25.7 17.2 52 1.8 1.8 390 13.9 6.9 281 10.0 8.5 149 5.3 4.11983 .......................... 757 27.0 18.0 50 1.8 1.6 411 14.6 7.4 296 10.5 9.0 165 5.9 4.61982 .......................... 762 27.1 18.3 58 2.1 1.9 396 14.1 7.2 309 11.0 9.2 169 6.0 4.81981 .......................... 802 28.4 20.0 55 2.0 1.9 421 14.9 8.2 326 11.6 9.9 221 7.8 6.41980 .......................... 780 27.6 19.1 61 2.2 2.0 423 15.0 8.2 296 10.5 8.9 201 7.1 5.91979 .......................... 817 29.0 20.6 59 2.1 2.1 419 14.9 8.2 338 12.0 10.3 164 5.8 4.9
White, male1992 .......................... 1,234 49.2 41.2 207 8.3 7.2 452 18.0 12.4 575 22.9 21.6 281 11.2 9.21991 .......................... 1,242 49.9 42.7 199 8.0 7.3 446 18.0 12.6 596 24.0 22.8 240 9.7 8.21990 .......................... 1,263 51.3 43.9 186 7.5 6.8 473 19.2 13.9 604 24.5 23.2 234 9.5 8.01989 .......................... 1,202 49.0 41.8 178 7.3 6.5 456 18.6 13.3 567 23.1 22.0 234 9.5 8.21988 .......................... 1,266 51.9 44.6 176 7.2 6.5 485 19.9 14.5 605 24.8 23.5 263 10.8 9.11987 .......................... 1,222 50.2 43.5 160 6.6 6.1 447 18.4 13.6 615 25.3 23.8 257 10.6 9.01986 .......................... 1,218 50.2 43.9 140 5.8 5.3 464 19.1 14.4 614 25.3 24.1 260 10.7 9.4
1985 .......................... 1,220 50.2 44.0 169 7.0 6.5 455 18.7 14.2 596 24.5 23.3 280 11.5 10.11984 .......................... 1,188 48.8 42.8 160 6.6 6.2 447 18.4 13.9 581 23.9 22.7 244 10.0 8.91983 .......................... 1,257 51.7 45.9 167 6.9 6.5 490 20.2 15.9 600 24.7 23.6 309 12.7 11.51982 .......................... 1,175 48.1 42.9 151 6.2 5.9 443 18.2 14.3 581 23.8 22.7 271 11.1 10.21981 .......................... 1,309 53.5 48.1 159 6.5 6.2 469 19.2 15.3 680 27.8 26.7 290 11.8 10.71980 .......................... 1,350 55.0 50.1 170 6.9 6.8 490 20.0 16.2 691 28.1 27.1 327 13.3 12.61979 .......................... 1,424 58.0 53.4 172 7.0 7.0 499 20.3 16.7 753 30.7 29.7 332 13.5 13.0
Black, male1992 .......................... 200 94.5 99.4 37 17.5 19.2 57 26.8 28.2 106 50.2 52.0 34 16.1 17.41991 .......................... 212 102.2 107.8 47 22.6 25.3 60 28.8 30.6 106 50.8 51.9 30 14.4 17.11990 .......................... 178 87.0 93.2 35 17.1 19.9 54 26.2 27.8 90 43.7 45.5 33 16.1 18.61989 .......................... 151 74.5 79.3 37 18.3 21.4 44 21.8 22.5 70 34.4 35.4 27 13.4 15.71988 .......................... 182 91.5 99.5 42 21.1 24.7 57 28.8 31.5 83 41.6 43.3 38 19.1 22.31987 .......................... 172 87.1 94.1 33 16.7 20.6 60 30.4 32.4 79 40.0 41.1 35 17.7 20.81986 .......................... 166 84.5 91.1 43 21.9 25.2 47 24.1 26.4 75 38.5 39.5 27 13.8 16.0
1985 .......................... 183 93.4 103.0 50 25.5 30.4 48 24.6 27.1 85 43.3 45.6 34 17.3 20.91984 .......................... 175 89.4 99.3 37 18.9 22.6 50 25.7 28.5 88 44.9 48.2 29 14.8 17.61983 .......................... 155 79.4 88.3 19 9.7 12.4 56 28.7 31.7 80 40.9 44.2 19 9.7 11.71982 .......................... 184 94.0 104.3 28 14.3 18.0 50 25.7 29.3 106 54.0 56.9 23 11.7 14.31981 .......................... 182 92.6 103.1 20 10.2 13.2 61 31.1 35.4 101 51.3 54.5 24 12.2 15.7
- 56 -

Table 1. Number of deaths and unadjusted and age-adjusted death rates per 100,000 population for different categories of alcohol-related mortality byState: United States, 1979–92.
Indiana
Race, sex,and year
All Alcohol-Related Causes of DeathAll Chronic Liver Disease and
CirrhosisTotal Causes of Death with ExplicitMention of Alcohol
Other Alcohol-Related Diseases Other Alcohol-Related Injuries orAdverse Effects
Number Unadj.Rate
Age-Adj.Rate Number Unadj.
RateAge-Adj.
Rate Number Unadj.Rate
Age-Adj.Rate Number Unadj.
RateAge-Adj.
Rate Number Unadj.Rate
Age-Adj.Rate
Black, male1980 .......................... 210 106.6 121.0 33 16.8 21.9 56 28.3 33.6 121 61.5 65.5 43 21.9 27.81979 .......................... 189 97.9 110.6 31 16.0 19.6 53 27.7 32.6 105 54.2 58.4 44 22.8 28.4
White, female1992 .......................... 665 25.1 14.5 49 1.9 1.5 366 13.8 5.6 250 9.5 7.4 130 4.9 3.01991 .......................... 709 27.0 16.5 54 2.1 1.8 385 14.7 6.2 270 10.3 8.5 135 5.1 3.51990 .......................... 708 27.2 16.8 49 1.9 1.6 365 14.0 5.9 294 11.3 9.2 133 5.1 3.61989 .......................... 720 27.8 17.1 45 1.7 1.4 380 14.6 6.1 295 11.4 9.5 141 5.4 3.41988 .......................... 719 27.8 17.1 44 1.7 1.5 379 14.7 6.4 295 11.4 9.2 147 5.7 3.91987 .......................... 697 27.0 16.8 47 1.8 1.5 366 14.2 6.3 283 11.0 9.0 145 5.6 4.01986 .......................... 647 25.2 15.7 41 1.6 1.4 358 13.9 6.2 248 9.7 8.1 123 4.8 3.2
1985 .......................... 690 26.8 17.1 57 2.2 2.0 357 13.9 6.3 277 10.8 8.8 165 6.4 4.91984 .......................... 652 25.3 16.3 44 1.7 1.6 358 13.9 6.6 250 9.7 8.1 136 5.3 4.01983 .......................... 690 26.9 17.3 41 1.6 1.4 379 14.8 7.0 270 10.5 8.8 142 5.5 4.11982 .......................... 707 27.4 17.9 54 2.1 1.9 368 14.3 7.0 285 11.0 9.1 159 6.2 4.81981 .......................... 736 28.5 19.3 46 1.8 1.7 391 15.1 7.8 299 11.6 9.8 204 7.9 6.21980 .......................... 702 27.1 17.9 56 2.2 2.0 385 14.8 7.5 262 10.1 8.4 178 6.9 5.51979 .......................... 739 28.6 19.5 45 1.7 1.7 389 15.1 7.9 304 11.8 10.0 150 5.8 4.7
Black, female1992 .......................... 74 31.4 28.6 12 5.1 5.8 35 14.7 11.4 28 11.6 11.4 11 4.6 5.21991 .......................... 75 32.2 28.3 15 6.4 6.4 34 14.5 10.8 26 11.3 11.0 21 9.0 8.71990 .......................... 73 31.6 28.6 12 5.2 5.5 34 14.7 11.5 27 11.8 11.6 16 6.9 7.11989 .......................... 78 34.3 31.0 19 8.4 9.2 33 14.7 11.3 26 11.3 10.5 18 7.9 8.31988 .......................... 81 36.4 32.0 13 5.8 5.5 40 17.9 14.4 28 12.6 12.1 15 6.7 6.31987 .......................... 67 30.3 26.4 10 4.5 4.2 28 12.9 10.1 29 12.9 12.1 17 7.7 7.61986 .......................... 71 32.3 30.0 9 4.1 4.7 36 16.4 14.0 26 11.8 11.3 19 8.7 9.2
1985 .......................... 71 32.1 30.3 5 2.3 2.5 38 17.2 15.2 28 12.7 12.5 21 9.6 9.61984 .......................... 70 32.0 30.0 8 3.7 4.3 32 14.5 12.2 30 13.8 13.5 13 5.9 6.61983 .......................... 64 29.2 27.3 8 3.7 4.1 31 14.0 12.2 25 11.5 11.0 19 8.7 9.61982 .......................... 54 24.6 23.8 4 1.8 2.1 27 12.5 11.4 22 10.3 10.3 10 4.6 4.81981 .......................... 64 29.4 29.9 9 4.1 4.9 30 13.7 13.4 25 11.6 11.7 17 7.8 9.21980 .......................... 75 34.3 35.1 5 2.3 2.8 38 17.4 17.8 32 14.7 14.5 23 10.5 12.11979 .......................... 78 36.3 36.6 14 6.5 8.1 30 13.9 13.3 34 15.9 15.2 14 6.5 7.6
- 57 -

Table 1. Number of deaths and unadjusted and age-adjusted death rates per 100,000 population for different categories of alcohol-related mortality byState: United States, 1979–92.
Iowa
Race, sex,and year
All Alcohol-Related Causes of DeathAll Chronic Liver Disease and
CirrhosisTotal Causes of Death with ExplicitMention of Alcohol
Other Alcohol-Related Diseases Other Alcohol-Related Injuries orAdverse Effects
Number Unadj.Rate
Age-Adj.Rate Number Unadj.
RateAge-Adj.
Rate Number Unadj.Rate
Age-Adj.Rate Number Unadj.
RateAge-Adj.
Rate Number Unadj.Rate
Age-Adj.Rate
All races, both sexes1992 .......................... 1,050 37.5 24.7 128 4.6 3.8 492 17.6 8.0 430 15.3 12.9 174 6.2 4.11991 .......................... 1,090 39.1 25.5 116 4.2 3.3 494 17.7 7.8 480 17.2 14.3 172 6.2 4.11990 .......................... 1,059 38.1 25.6 138 5.0 4.0 476 17.1 7.8 445 16.0 13.8 188 6.8 4.81989 .......................... 1,134 40.9 27.8 154 5.6 4.7 502 18.1 8.3 478 17.2 14.8 209 7.5 5.51988 .......................... 1,096 39.6 26.7 118 4.3 3.7 500 18.1 8.2 479 17.3 14.8 193 7.0 5.21987 .......................... 1,075 38.8 26.7 132 4.8 4.0 474 17.1 8.1 468 16.9 14.6 207 7.5 5.51986 .......................... 1,052 37.7 26.3 118 4.2 3.7 487 17.4 8.5 447 16.0 14.1 189 6.8 5.2
1985 .......................... 1,114 39.4 27.3 128 4.5 3.9 517 18.3 9.0 469 16.6 14.5 220 7.8 5.91984 .......................... 1,089 38.1 26.9 124 4.3 3.9 520 18.2 9.3 445 15.6 13.8 211 7.4 6.01983 .......................... 1,116 38.9 27.4 154 5.4 4.5 494 17.2 8.7 468 16.3 14.2 224 7.8 6.01982 .......................... 1,107 38.3 27.4 129 4.5 4.1 505 17.5 9.0 472 16.3 14.3 231 8.0 6.31981 .......................... 1,180 40.6 29.5 120 4.1 3.8 527 18.1 9.4 533 18.3 16.3 225 7.7 6.21980 .......................... 1,209 41.5 30.4 121 4.2 3.8 532 18.2 9.7 556 19.1 16.9 234 8.0 6.51979 .......................... 1,222 41.9 30.8 126 4.3 3.8 530 18.2 9.8 566 19.4 17.2 236 8.1 6.6
All races, male1992 .......................... 664 48.8 37.3 99 7.3 6.0 282 20.7 12.4 283 20.8 18.9 116 8.5 6.21991 .......................... 678 50.1 38.5 98 7.2 5.9 269 19.9 11.7 311 23.0 20.8 109 8.1 6.31990 .......................... 675 50.1 39.4 111 8.2 6.9 253 18.8 11.2 311 23.1 21.3 121 9.0 7.01989 .......................... 708 52.7 41.9 118 8.8 7.7 265 19.7 11.9 325 24.2 22.3 133 9.9 7.91988 .......................... 695 51.9 40.7 98 7.3 6.3 269 20.1 12.2 328 24.4 22.1 124 9.3 7.41987 .......................... 686 51.2 40.7 109 8.1 7.1 258 19.3 12.0 319 23.8 21.7 139 10.4 8.81986 .......................... 650 48.1 38.6 89 6.6 5.8 255 18.8 12.0 306 22.6 20.9 120 8.9 7.4
1985 .......................... 702 51.2 40.8 100 7.3 6.4 277 20.2 12.5 325 23.7 21.9 133 9.7 8.01984 .......................... 686 49.5 40.5 99 7.1 6.5 282 20.3 13.3 306 22.0 20.6 138 10.0 8.51983 .......................... 704 50.5 40.6 121 8.7 7.5 266 19.1 12.4 317 22.7 20.7 147 10.6 8.71982 .......................... 715 51.0 41.7 105 7.5 6.9 281 20.0 13.2 329 23.4 21.6 157 11.2 9.61981 .......................... 748 52.9 43.9 96 6.8 6.4 283 20.1 13.2 369 26.1 24.4 134 9.5 8.31980 .......................... 782 55.2 46.1 102 7.2 6.7 296 20.9 13.8 385 27.1 25.6 162 11.4 9.91979 .......................... 802 56.5 47.0 101 7.1 6.5 299 21.1 14.3 401 28.3 26.2 160 11.3 9.9
All races, female1992 .......................... 386 26.7 13.3 29 2.0 1.8 210 14.6 4.4 146 10.2 7.2 58 4.0 2.31991 .......................... 412 28.6 14.0 18 1.3 1.0 225 15.6 4.7 169 11.7 8.2 63 4.4 2.01990 .......................... 384 26.8 13.1 27 1.9 1.3 223 15.5 5.1 135 9.4 6.7 67 4.7 2.91989 .......................... 427 29.9 15.2 36 2.5 2.0 238 16.6 5.5 153 10.7 7.7 76 5.3 3.41988 .......................... 402 28.1 14.3 20 1.4 1.4 231 16.1 5.0 151 10.6 7.9 69 4.8 3.31987 .......................... 389 27.2 14.1 23 1.6 1.2 216 15.1 5.0 149 10.5 7.9 68 4.8 2.41986 .......................... 402 28.0 15.1 29 2.0 1.9 232 16.1 5.7 141 9.8 7.6 69 4.8 3.4
- 58 -

Table 1. Number of deaths and unadjusted and age-adjusted death rates per 100,000 population for different categories of alcohol-related mortality byState: United States, 1979–92.
Iowa
Race, sex,and year
All Alcohol-Related Causes of DeathAll Chronic Liver Disease and
CirrhosisTotal Causes of Death with ExplicitMention of Alcohol
Other Alcohol-Related Diseases Other Alcohol-Related Injuries orAdverse Effects
Number Unadj.Rate
Age-Adj.Rate Number Unadj.
RateAge-Adj.
Rate Number Unadj.Rate
Age-Adj.Rate Number Unadj.
RateAge-Adj.
Rate Number Unadj.Rate
Age-Adj.Rate
All races, female
1985 .......................... 413 28.3 15.4 28 1.9 1.7 240 16.5 6.3 144 9.9 7.5 87 6.0 4.01984 .......................... 403 27.4 14.7 25 1.7 1.5 238 16.2 6.1 140 9.5 7.1 73 5.0 3.71983 .......................... 413 27.9 15.7 33 2.2 1.9 228 15.4 5.7 152 10.3 8.0 77 5.2 3.71982 .......................... 392 26.4 14.7 24 1.6 1.5 224 15.1 5.8 144 9.7 7.4 74 5.0 3.31981 .......................... 432 28.9 16.6 24 1.6 1.6 244 16.3 6.3 164 11.0 8.6 91 6.1 4.41980 .......................... 426 28.4 16.2 19 1.3 1.2 236 15.8 6.6 171 11.4 8.5 72 4.8 3.61979 .......................... 420 28.0 16.3 25 1.7 1.5 231 15.4 6.1 164 11.0 8.7 76 5.1 3.6
White, male1992 .......................... 649 49.3 37.2 99 7.5 6.1 277 21.0 12.3 273 20.8 18.8 115 8.7 6.31991 .......................... 654 49.9 37.6 96 7.3 5.9 262 20.0 11.5 296 22.6 20.2 107 8.2 6.31990 .......................... 651 49.9 38.6 106 8.1 6.6 246 18.9 10.9 299 22.9 21.1 117 9.0 6.81989 .......................... 690 53.0 41.5 114 8.8 7.5 261 20.1 11.8 315 24.2 22.2 130 10.0 7.81988 .......................... 680 52.2 40.5 95 7.3 6.2 265 20.3 12.1 320 24.6 22.3 123 9.4 7.41987 .......................... 669 51.4 40.4 104 8.0 6.8 254 19.5 11.9 311 23.9 21.7 134 10.3 8.61986 .......................... 632 48.0 38.2 84 6.4 5.5 248 18.9 11.8 300 22.8 21.0 116 8.8 7.2
1985 .......................... 686 51.3 40.5 99 7.4 6.4 271 20.3 12.3 316 23.6 21.8 128 9.6 7.71984 .......................... 673 49.8 40.3 97 7.2 6.5 279 20.7 13.3 297 21.9 20.5 136 10.1 8.51983 .......................... 685 50.4 40.1 116 8.5 7.3 263 19.3 12.4 306 22.5 20.4 142 10.4 8.51982 .......................... 699 51.1 41.4 103 7.5 6.9 277 20.2 13.1 319 23.3 21.4 156 11.4 9.71981 .......................... 728 52.7 43.3 94 6.8 6.3 279 20.2 13.1 355 25.7 23.9 131 9.5 8.11980 .......................... 761 54.9 45.3 97 7.0 6.4 292 21.1 13.7 372 26.8 25.2 159 11.5 9.71979 .......................... 781 56.2 46.4 98 7.1 6.4 294 21.2 14.1 389 28.0 25.9 157 11.3 9.8
Black, male1992 .......................... 11 42.9 49.7 0 0.0 0.0 5 18.1 25.4 6 24.8 24.3 1 3.8 6.11991 .......................... 18 72.4 88.1 1 4.0 4.2 6 23.5 32.5 11 44.9 51.4 1 4.0 6.01990 .......................... 21 87.1 109.7 5 20.5 30.9 7 27.9 39.8 9 38.6 39.1 4 16.4 23.91989 .......................... 14 59.4 65.3 3 12.6 13.6 3 14.0 19.1 8 32.7 32.5 3 12.6 14.61988 .......................... 12 52.7 66.0 2 8.7 12.5 4 18.0 26.5 6 26.1 27.0 0 0.0 0.01987 .......................... 11 50.2 65.3 4 17.7 24.3 3 14.0 17.7 4 18.6 23.4 3 13.3 17.91986 .......................... 13 57.2 73.8 3 13.4 18.9 6 26.3 36.4 4 17.4 18.6 2 8.9 12.4
1985 .......................... 12 56.0 68.5 1 4.5 6.6 5 23.4 32.9 6 28.2 29.0 5 22.4 37.01984 .......................... 12 55.3 71.2 2 9.1 14.0 2 9.0 11.6 8 37.2 45.6 1 4.5 6.41983 .......................... 17 79.6 101.7 5 22.9 34.5 3 13.9 19.9 9 42.8 47.2 5 22.9 35.11982 .......................... 12 56.7 69.5 1 4.6 6.9 3 16.1 22.6 8 35.9 40.0 1 4.6 6.61981 .......................... 14 65.0 74.5 1 4.7 6.6 3 13.6 18.7 10 46.7 49.2 2 9.4 14.4
- 59 -
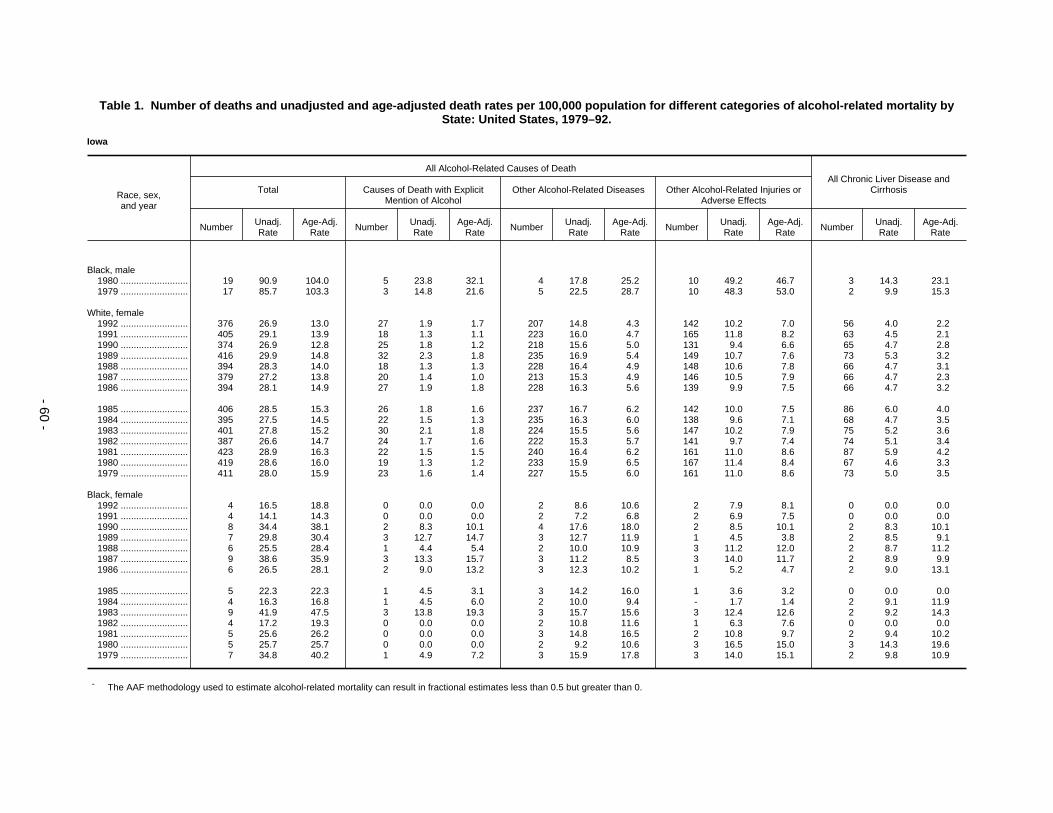
Table 1. Number of deaths and unadjusted and age-adjusted death rates per 100,000 population for different categories of alcohol-related mortality byState: United States, 1979–92.
Iowa
Race, sex,and year
All Alcohol-Related Causes of DeathAll Chronic Liver Disease and
CirrhosisTotal Causes of Death with ExplicitMention of Alcohol
Other Alcohol-Related Diseases Other Alcohol-Related Injuries orAdverse Effects
Number Unadj.Rate
Age-Adj.Rate Number Unadj.
RateAge-Adj.
Rate Number Unadj.Rate
Age-Adj.Rate Number Unadj.
RateAge-Adj.
Rate Number Unadj.Rate
Age-Adj.Rate
Black, male1980 .......................... 19 90.9 104.0 5 23.8 32.1 4 17.8 25.2 10 49.2 46.7 3 14.3 23.11979 .......................... 17 85.7 103.3 3 14.8 21.6 5 22.5 28.7 10 48.3 53.0 2 9.9 15.3
White, female1992 .......................... 376 26.9 13.0 27 1.9 1.7 207 14.8 4.3 142 10.2 7.0 56 4.0 2.21991 .......................... 405 29.1 13.9 18 1.3 1.1 223 16.0 4.7 165 11.8 8.2 63 4.5 2.11990 .......................... 374 26.9 12.8 25 1.8 1.2 218 15.6 5.0 131 9.4 6.6 65 4.7 2.81989 .......................... 416 29.9 14.8 32 2.3 1.8 235 16.9 5.4 149 10.7 7.6 73 5.3 3.21988 .......................... 394 28.3 14.0 18 1.3 1.3 228 16.4 4.9 148 10.6 7.8 66 4.7 3.11987 .......................... 379 27.2 13.8 20 1.4 1.0 213 15.3 4.9 146 10.5 7.9 66 4.7 2.31986 .......................... 394 28.1 14.9 27 1.9 1.8 228 16.3 5.6 139 9.9 7.5 66 4.7 3.2
1985 .......................... 406 28.5 15.3 26 1.8 1.6 237 16.7 6.2 142 10.0 7.5 86 6.0 4.01984 .......................... 395 27.5 14.5 22 1.5 1.3 235 16.3 6.0 138 9.6 7.1 68 4.7 3.51983 .......................... 401 27.8 15.2 30 2.1 1.8 224 15.5 5.6 147 10.2 7.9 75 5.2 3.61982 .......................... 387 26.6 14.7 24 1.7 1.6 222 15.3 5.7 141 9.7 7.4 74 5.1 3.41981 .......................... 423 28.9 16.3 22 1.5 1.5 240 16.4 6.2 161 11.0 8.6 87 5.9 4.21980 .......................... 419 28.6 16.0 19 1.3 1.2 233 15.9 6.5 167 11.4 8.4 67 4.6 3.31979 .......................... 411 28.0 15.9 23 1.6 1.4 227 15.5 6.0 161 11.0 8.6 73 5.0 3.5
Black, female1992 .......................... 4 16.5 18.8 0 0.0 0.0 2 8.6 10.6 2 7.9 8.1 0 0.0 0.01991 .......................... 4 14.1 14.3 0 0.0 0.0 2 7.2 6.8 2 6.9 7.5 0 0.0 0.01990 .......................... 8 34.4 38.1 2 8.3 10.1 4 17.6 18.0 2 8.5 10.1 2 8.3 10.11989 .......................... 7 29.8 30.4 3 12.7 14.7 3 12.7 11.9 1 4.5 3.8 2 8.5 9.11988 .......................... 6 25.5 28.4 1 4.4 5.4 2 10.0 10.9 3 11.2 12.0 2 8.7 11.21987 .......................... 9 38.6 35.9 3 13.3 15.7 3 11.2 8.5 3 14.0 11.7 2 8.9 9.91986 .......................... 6 26.5 28.1 2 9.0 13.2 3 12.3 10.2 1 5.2 4.7 2 9.0 13.1
1985 .......................... 5 22.3 22.3 1 4.5 3.1 3 14.2 16.0 1 3.6 3.2 0 0.0 0.01984 .......................... 4 16.3 16.8 1 4.5 6.0 2 10.0 9.4 - 1.7 1.4 2 9.1 11.91983 .......................... 9 41.9 47.5 3 13.8 19.3 3 15.7 15.6 3 12.4 12.6 2 9.2 14.31982 .......................... 4 17.2 19.3 0 0.0 0.0 2 10.8 11.6 1 6.3 7.6 0 0.0 0.01981 .......................... 5 25.6 26.2 0 0.0 0.0 3 14.8 16.5 2 10.8 9.7 2 9.4 10.21980 .......................... 5 25.7 25.7 0 0.0 0.0 2 9.2 10.6 3 16.5 15.0 3 14.3 19.61979 .......................... 7 34.8 40.2 1 4.9 7.2 3 15.9 17.8 3 14.0 15.1 2 9.8 10.9
- The AAF methodology used to estimate alcohol-related mortality can result in fractional estimates less than 0.5 but greater than 0.
- 60 -
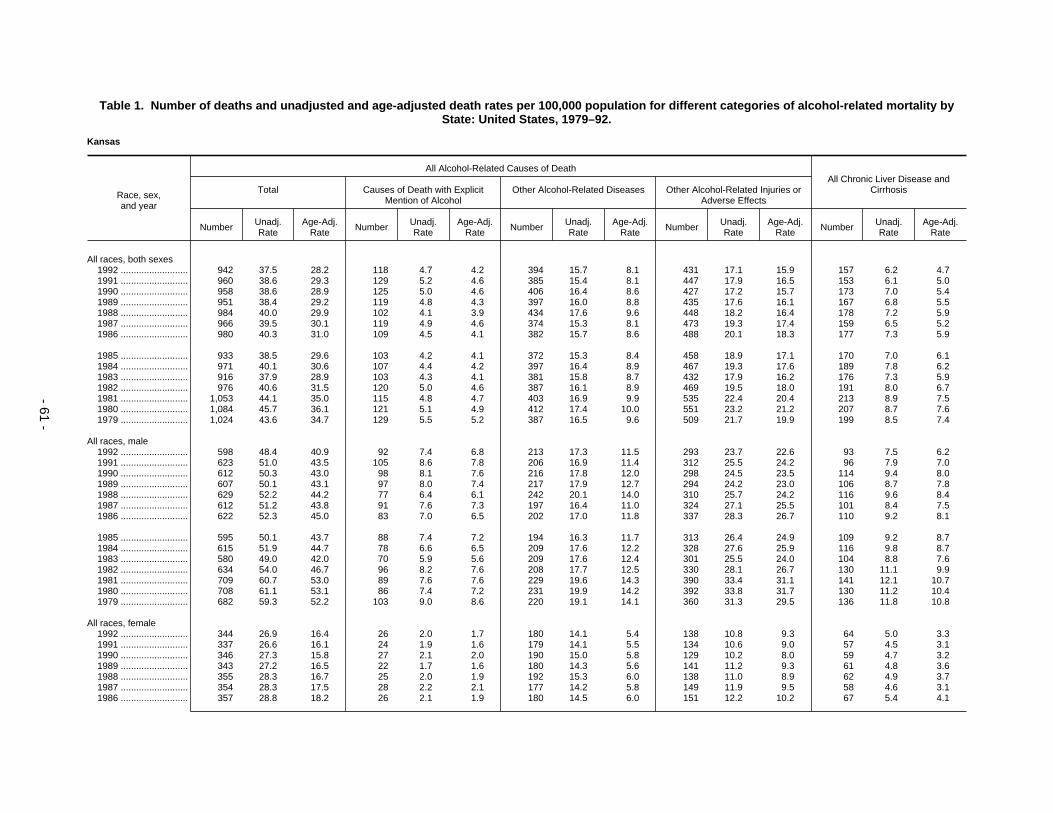
Table 1. Number of deaths and unadjusted and age-adjusted death rates per 100,000 population for different categories of alcohol-related mortality byState: United States, 1979–92.
Kansas
Race, sex,and year
All Alcohol-Related Causes of DeathAll Chronic Liver Disease and
CirrhosisTotal Causes of Death with ExplicitMention of Alcohol
Other Alcohol-Related Diseases Other Alcohol-Related Injuries orAdverse Effects
Number Unadj.Rate
Age-Adj.Rate Number Unadj.
RateAge-Adj.
Rate Number Unadj.Rate
Age-Adj.Rate Number Unadj.
RateAge-Adj.
Rate Number Unadj.Rate
Age-Adj.Rate
All races, both sexes1992 .......................... 942 37.5 28.2 118 4.7 4.2 394 15.7 8.1 431 17.1 15.9 157 6.2 4.71991 .......................... 960 38.6 29.3 129 5.2 4.6 385 15.4 8.1 447 17.9 16.5 153 6.1 5.01990 .......................... 958 38.6 28.9 125 5.0 4.6 406 16.4 8.6 427 17.2 15.7 173 7.0 5.41989 .......................... 951 38.4 29.2 119 4.8 4.3 397 16.0 8.8 435 17.6 16.1 167 6.8 5.51988 .......................... 984 40.0 29.9 102 4.1 3.9 434 17.6 9.6 448 18.2 16.4 178 7.2 5.91987 .......................... 966 39.5 30.1 119 4.9 4.6 374 15.3 8.1 473 19.3 17.4 159 6.5 5.21986 .......................... 980 40.3 31.0 109 4.5 4.1 382 15.7 8.6 488 20.1 18.3 177 7.3 5.9
1985 .......................... 933 38.5 29.6 103 4.2 4.1 372 15.3 8.4 458 18.9 17.1 170 7.0 6.11984 .......................... 971 40.1 30.6 107 4.4 4.2 397 16.4 8.9 467 19.3 17.6 189 7.8 6.21983 .......................... 916 37.9 28.9 103 4.3 4.1 381 15.8 8.7 432 17.9 16.2 176 7.3 5.91982 .......................... 976 40.6 31.5 120 5.0 4.6 387 16.1 8.9 469 19.5 18.0 191 8.0 6.71981 .......................... 1,053 44.1 35.0 115 4.8 4.7 403 16.9 9.9 535 22.4 20.4 213 8.9 7.51980 .......................... 1,084 45.7 36.1 121 5.1 4.9 412 17.4 10.0 551 23.2 21.2 207 8.7 7.61979 .......................... 1,024 43.6 34.7 129 5.5 5.2 387 16.5 9.6 509 21.7 19.9 199 8.5 7.4
All races, male1992 .......................... 598 48.4 40.9 92 7.4 6.8 213 17.3 11.5 293 23.7 22.6 93 7.5 6.21991 .......................... 623 51.0 43.5 105 8.6 7.8 206 16.9 11.4 312 25.5 24.2 96 7.9 7.01990 .......................... 612 50.3 43.0 98 8.1 7.6 216 17.8 12.0 298 24.5 23.5 114 9.4 8.01989 .......................... 607 50.1 43.1 97 8.0 7.4 217 17.9 12.7 294 24.2 23.0 106 8.7 7.81988 .......................... 629 52.2 44.2 77 6.4 6.1 242 20.1 14.0 310 25.7 24.2 116 9.6 8.41987 .......................... 612 51.2 43.8 91 7.6 7.3 197 16.4 11.0 324 27.1 25.5 101 8.4 7.51986 .......................... 622 52.3 45.0 83 7.0 6.5 202 17.0 11.8 337 28.3 26.7 110 9.2 8.1
1985 .......................... 595 50.1 43.7 88 7.4 7.2 194 16.3 11.7 313 26.4 24.9 109 9.2 8.71984 .......................... 615 51.9 44.7 78 6.6 6.5 209 17.6 12.2 328 27.6 25.9 116 9.8 8.71983 .......................... 580 49.0 42.0 70 5.9 5.6 209 17.6 12.4 301 25.5 24.0 104 8.8 7.61982 .......................... 634 54.0 46.7 96 8.2 7.6 208 17.7 12.5 330 28.1 26.7 130 11.1 9.91981 .......................... 709 60.7 53.0 89 7.6 7.6 229 19.6 14.3 390 33.4 31.1 141 12.1 10.71980 .......................... 708 61.1 53.1 86 7.4 7.2 231 19.9 14.2 392 33.8 31.7 130 11.2 10.41979 .......................... 682 59.3 52.2 103 9.0 8.6 220 19.1 14.1 360 31.3 29.5 136 11.8 10.8
All races, female1992 .......................... 344 26.9 16.4 26 2.0 1.7 180 14.1 5.4 138 10.8 9.3 64 5.0 3.31991 .......................... 337 26.6 16.1 24 1.9 1.6 179 14.1 5.5 134 10.6 9.0 57 4.5 3.11990 .......................... 346 27.3 15.8 27 2.1 2.0 190 15.0 5.8 129 10.2 8.0 59 4.7 3.21989 .......................... 343 27.2 16.5 22 1.7 1.6 180 14.3 5.6 141 11.2 9.3 61 4.8 3.61988 .......................... 355 28.3 16.7 25 2.0 1.9 192 15.3 6.0 138 11.0 8.9 62 4.9 3.71987 .......................... 354 28.3 17.5 28 2.2 2.1 177 14.2 5.8 149 11.9 9.5 58 4.6 3.11986 .......................... 357 28.8 18.2 26 2.1 1.9 180 14.5 6.0 151 12.2 10.2 67 5.4 4.1
- 61 -

Table 1. Number of deaths and unadjusted and age-adjusted death rates per 100,000 population for different categories of alcohol-related mortality byState: United States, 1979–92.
Kansas
Race, sex,and year
All Alcohol-Related Causes of DeathAll Chronic Liver Disease and
CirrhosisTotal Causes of Death with ExplicitMention of Alcohol
Other Alcohol-Related Diseases Other Alcohol-Related Injuries orAdverse Effects
Number Unadj.Rate
Age-Adj.Rate Number Unadj.
RateAge-Adj.
Rate Number Unadj.Rate
Age-Adj.Rate Number Unadj.
RateAge-Adj.
Rate Number Unadj.Rate
Age-Adj.Rate
All races, female
1985 .......................... 338 27.3 16.5 15 1.2 1.3 178 14.4 5.8 145 11.7 9.5 61 4.9 3.71984 .......................... 356 28.8 17.8 29 2.3 2.0 188 15.1 6.3 140 11.3 9.4 73 5.9 3.91983 .......................... 336 27.3 17.0 33 2.7 2.7 172 14.0 5.7 131 10.6 8.7 72 5.8 4.41982 .......................... 342 27.9 17.5 24 2.0 1.9 179 14.6 6.1 139 11.4 9.4 61 5.0 4.01981 .......................... 344 28.3 18.2 26 2.1 2.0 174 14.3 6.3 144 11.9 9.9 72 5.9 4.71980 .......................... 376 31.0 20.4 35 2.9 2.8 182 15.0 6.6 159 13.1 11.0 77 6.4 5.21979 .......................... 342 28.5 18.5 26 2.2 2.1 167 13.9 5.9 149 12.4 10.5 63 5.3 4.3
White, male1992 .......................... 534 47.3 38.7 80 7.1 6.2 200 17.7 11.2 254 22.5 21.2 81 7.2 5.61991 .......................... 554 49.4 41.1 89 7.9 7.1 192 17.2 11.0 273 24.3 22.9 87 7.8 6.71990 .......................... 553 49.5 41.2 86 7.7 7.0 206 18.4 11.9 261 23.4 22.3 108 9.7 8.01989 .......................... 543 48.8 40.8 91 8.2 7.3 194 17.4 11.7 258 23.2 21.8 100 9.0 7.71988 .......................... 573 51.7 43.1 69 6.2 5.8 222 20.1 13.4 282 25.4 23.8 107 9.6 8.21987 .......................... 559 50.7 42.5 83 7.5 7.0 183 16.6 10.6 293 26.6 25.0 94 8.5 7.41986 .......................... 567 51.6 43.3 76 6.9 6.2 190 17.3 11.6 300 27.3 25.6 104 9.5 7.9
1985 .......................... 544 49.5 42.4 86 7.8 7.4 175 16.0 10.8 282 25.7 24.1 104 9.5 8.71984 .......................... 566 51.6 43.5 70 6.4 6.2 197 17.9 11.9 299 27.3 25.4 110 10.0 8.61983 .......................... 537 49.0 41.1 65 5.9 5.4 194 17.7 11.9 278 25.4 23.8 99 9.0 7.51982 .......................... 589 54.1 45.8 91 8.3 7.5 197 18.1 12.1 301 27.6 26.1 126 11.6 10.01981 .......................... 646 59.5 51.1 83 7.7 7.5 213 19.6 13.7 350 32.2 29.8 134 12.4 10.61980 .......................... 639 59.2 50.5 75 6.9 6.5 214 19.8 13.7 350 32.5 30.3 117 10.8 9.71979 .......................... 627 58.5 50.3 94 8.8 8.1 206 19.2 13.7 327 30.5 28.5 130 12.1 10.8
Black, male1992 .......................... 56 74.3 84.2 10 13.2 19.2 11 14.4 17.3 35 46.7 47.7 9 11.9 16.11991 .......................... 60 83.1 88.6 15 20.7 23.8 12 16.0 19.8 34 46.5 45.0 8 11.0 13.51990 .......................... 50 68.3 74.2 9 12.4 15.6 9 11.7 14.7 32 44.2 43.9 5 6.9 8.21989 .......................... 54 75.4 90.5 5 7.0 8.9 21 28.7 37.8 29 39.7 43.8 5 7.0 9.41988 .......................... 51 71.4 78.7 8 11.2 15.2 17 24.5 28.2 25 35.7 35.2 9 12.6 18.11987 .......................... 45 64.6 71.0 7 10.0 13.6 13 17.9 22.2 26 36.8 35.2 7 10.0 12.01986 .......................... 49 70.2 79.2 7 10.1 14.9 11 16.5 20.2 30 43.5 44.1 6 8.7 12.1
1985 .......................... 47 68.5 79.2 2 2.9 3.8 17 25.1 32.5 28 40.5 42.9 4 5.8 9.41984 .......................... 42 61.6 70.8 7 10.4 14.9 11 16.7 20.3 23 34.5 35.6 4 5.9 8.71983 .......................... 39 58.6 69.8 4 6.0 8.3 14 21.4 27.3 21 31.2 34.1 4 6.0 9.31982 .......................... 40 60.0 70.4 5 7.6 10.5 10 15.2 19.8 25 37.2 40.2 4 6.0 7.91981 .......................... 58 88.1 97.9 6 9.2 12.5 15 23.4 30.0 36 55.5 55.5 7 10.7 15.3
- 62 -

Table 1. Number of deaths and unadjusted and age-adjusted death rates per 100,000 population for different categories of alcohol-related mortality byState: United States, 1979–92.
Kansas
Race, sex,and year
All Alcohol-Related Causes of DeathAll Chronic Liver Disease and
CirrhosisTotal Causes of Death with ExplicitMention of Alcohol
Other Alcohol-Related Diseases Other Alcohol-Related Injuries orAdverse Effects
Number Unadj.Rate
Age-Adj.Rate Number Unadj.
RateAge-Adj.
Rate Number Unadj.Rate
Age-Adj.Rate Number Unadj.
RateAge-Adj.
Rate Number Unadj.Rate
Age-Adj.Rate
Black, male1980 .......................... 63 98.5 115.1 11 17.2 25.5 16 25.4 30.8 36 55.9 58.8 13 20.3 29.51979 .......................... 51 83.5 99.9 8 13.0 17.9 13 20.8 26.6 31 49.6 55.4 6 9.7 13.3
White, female1992 .......................... 318 27.1 15.7 23 2.0 1.6 169 14.4 5.1 126 10.7 9.1 60 5.1 3.21991 .......................... 312 26.7 15.7 18 1.5 1.4 169 14.5 5.3 125 10.7 9.0 50 4.3 2.81990 .......................... 320 27.5 15.2 25 2.1 2.0 179 15.4 5.7 115 9.9 7.5 56 4.8 3.21989 .......................... 319 27.5 16.0 19 1.6 1.5 171 14.7 5.4 129 11.1 9.1 56 4.8 3.31988 .......................... 329 28.4 16.3 23 2.0 1.8 178 15.4 5.7 128 11.0 8.8 55 4.7 3.51987 .......................... 333 28.9 17.4 26 2.3 2.1 164 14.2 5.4 143 12.4 9.9 51 4.4 2.91986 .......................... 336 29.2 17.9 24 2.1 1.9 171 14.9 5.8 141 12.3 10.1 61 5.3 3.8
1985 .......................... 322 28.0 16.5 14 1.2 1.3 171 14.8 5.6 138 12.0 9.6 60 5.2 3.81984 .......................... 336 29.2 17.5 26 2.3 1.9 179 15.5 6.1 131 11.4 9.4 67 5.8 3.71983 .......................... 313 27.3 16.6 29 2.5 2.5 162 14.2 5.5 122 10.6 8.6 65 5.7 4.01982 .......................... 322 28.3 17.2 21 1.8 1.8 169 14.8 5.9 132 11.6 9.5 54 4.7 3.81981 .......................... 321 28.3 17.7 23 2.0 1.9 164 14.5 6.1 134 11.8 9.6 63 5.6 4.31980 .......................... 351 31.1 19.9 33 2.9 2.8 170 15.1 6.3 147 13.1 10.7 71 6.3 5.11979 .......................... 322 28.8 18.1 24 2.1 2.0 161 14.3 5.9 138 12.3 10.2 61 5.4 4.4
Black, female1992 .......................... 20 27.1 26.1 2 2.7 2.6 9 11.8 10.5 9 12.6 13.0 3 4.0 3.41991 .......................... 21 28.9 24.7 6 8.3 7.8 8 11.2 8.3 7 9.5 8.6 5 6.9 6.71990 .......................... 22 30.0 25.6 2 2.8 3.3 9 13.0 9.5 10 14.2 12.8 3 4.2 4.41989 .......................... 21 29.8 28.9 3 4.2 5.7 7 10.5 8.8 11 15.2 14.5 4 5.6 7.51988 .......................... 23 32.3 27.1 1 1.4 2.2 13 18.1 13.8 9 12.8 11.2 6 8.5 8.71987 .......................... 17 24.9 21.7 1 1.4 1.2 12 16.9 15.0 5 6.6 5.4 5 7.2 6.01986 .......................... 17 24.1 23.2 2 2.9 4.0 8 12.0 9.7 6 9.2 9.5 5 7.3 8.7
1985 .......................... 13 19.8 19.5 1 1.5 1.8 8 11.2 10.3 5 7.1 7.4 1 1.5 1.81984 .......................... 19 28.0 26.7 3 4.5 5.2 8 12.3 10.7 8 11.3 10.7 5 7.5 7.51983 .......................... 21 31.2 29.9 4 6.0 7.9 9 14.0 11.8 7 11.2 10.3 6 9.0 11.61982 .......................... 17 26.3 25.2 2 3.0 4.0 9 13.5 11.5 6 9.8 9.7 6 9.1 10.21981 .......................... 20 30.7 29.3 1 1.5 1.6 9 14.4 12.7 10 14.7 15.0 8 12.4 13.61980 .......................... 21 32.6 30.0 2 3.1 3.3 9 14.7 11.5 9 14.7 15.2 3 4.7 5.21979 .......................... 17 27.7 27.5 2 3.2 4.8 6 10.2 8.1 9 14.2 14.6 2 3.2 4.3
- 63 -
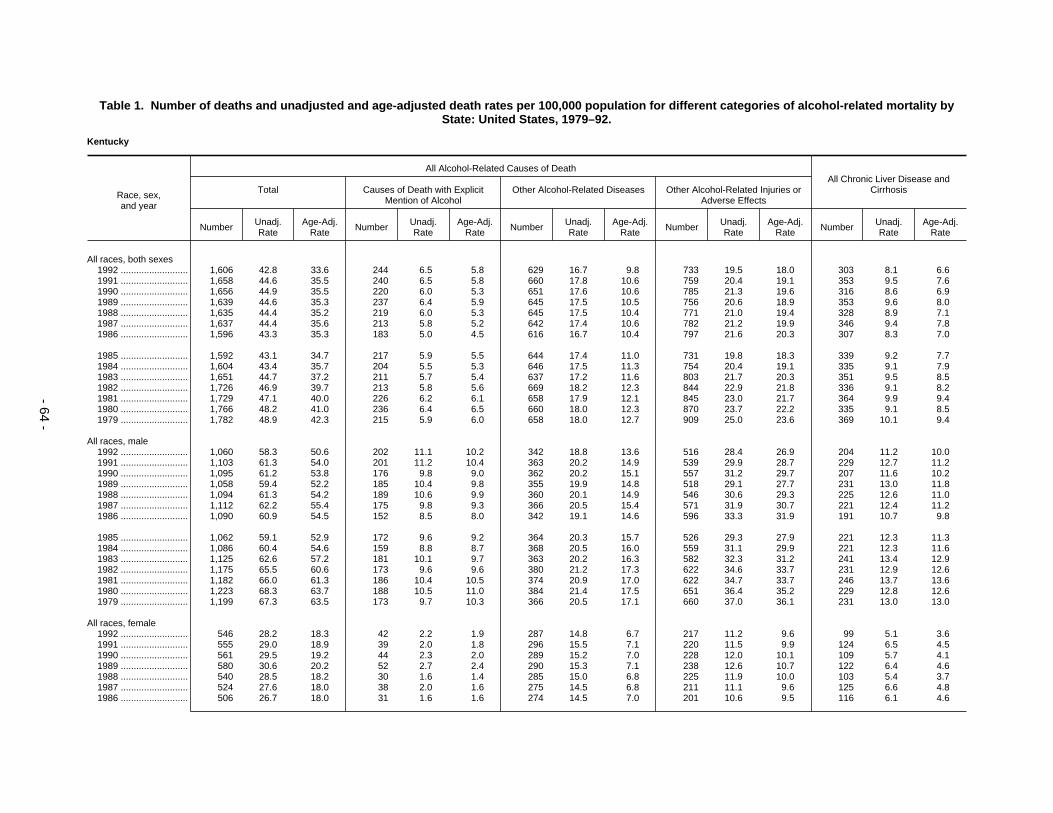
Table 1. Number of deaths and unadjusted and age-adjusted death rates per 100,000 population for different categories of alcohol-related mortality byState: United States, 1979–92.
Kentucky
Race, sex,and year
All Alcohol-Related Causes of DeathAll Chronic Liver Disease and
CirrhosisTotal Causes of Death with ExplicitMention of Alcohol
Other Alcohol-Related Diseases Other Alcohol-Related Injuries orAdverse Effects
Number Unadj.Rate
Age-Adj.Rate Number Unadj.
RateAge-Adj.
Rate Number Unadj.Rate
Age-Adj.Rate Number Unadj.
RateAge-Adj.
Rate Number Unadj.Rate
Age-Adj.Rate
All races, both sexes1992 .......................... 1,606 42.8 33.6 244 6.5 5.8 629 16.7 9.8 733 19.5 18.0 303 8.1 6.61991 .......................... 1,658 44.6 35.5 240 6.5 5.8 660 17.8 10.6 759 20.4 19.1 353 9.5 7.61990 .......................... 1,656 44.9 35.5 220 6.0 5.3 651 17.6 10.6 785 21.3 19.6 316 8.6 6.91989 .......................... 1,639 44.6 35.3 237 6.4 5.9 645 17.5 10.5 756 20.6 18.9 353 9.6 8.01988 .......................... 1,635 44.4 35.2 219 6.0 5.3 645 17.5 10.4 771 21.0 19.4 328 8.9 7.11987 .......................... 1,637 44.4 35.6 213 5.8 5.2 642 17.4 10.6 782 21.2 19.9 346 9.4 7.81986 .......................... 1,596 43.3 35.3 183 5.0 4.5 616 16.7 10.4 797 21.6 20.3 307 8.3 7.0
1985 .......................... 1,592 43.1 34.7 217 5.9 5.5 644 17.4 11.0 731 19.8 18.3 339 9.2 7.71984 .......................... 1,604 43.4 35.7 204 5.5 5.3 646 17.5 11.3 754 20.4 19.1 335 9.1 7.91983 .......................... 1,651 44.7 37.2 211 5.7 5.4 637 17.2 11.6 803 21.7 20.3 351 9.5 8.51982 .......................... 1,726 46.9 39.7 213 5.8 5.6 669 18.2 12.3 844 22.9 21.8 336 9.1 8.21981 .......................... 1,729 47.1 40.0 226 6.2 6.1 658 17.9 12.1 845 23.0 21.7 364 9.9 9.41980 .......................... 1,766 48.2 41.0 236 6.4 6.5 660 18.0 12.3 870 23.7 22.2 335 9.1 8.51979 .......................... 1,782 48.9 42.3 215 5.9 6.0 658 18.0 12.7 909 25.0 23.6 369 10.1 9.4
All races, male1992 .......................... 1,060 58.3 50.6 202 11.1 10.2 342 18.8 13.6 516 28.4 26.9 204 11.2 10.01991 .......................... 1,103 61.3 54.0 201 11.2 10.4 363 20.2 14.9 539 29.9 28.7 229 12.7 11.21990 .......................... 1,095 61.2 53.8 176 9.8 9.0 362 20.2 15.1 557 31.2 29.7 207 11.6 10.21989 .......................... 1,058 59.4 52.2 185 10.4 9.8 355 19.9 14.8 518 29.1 27.7 231 13.0 11.81988 .......................... 1,094 61.3 54.2 189 10.6 9.9 360 20.1 14.9 546 30.6 29.3 225 12.6 11.01987 .......................... 1,112 62.2 55.4 175 9.8 9.3 366 20.5 15.4 571 31.9 30.7 221 12.4 11.21986 .......................... 1,090 60.9 54.5 152 8.5 8.0 342 19.1 14.6 596 33.3 31.9 191 10.7 9.8
1985 .......................... 1,062 59.1 52.9 172 9.6 9.2 364 20.3 15.7 526 29.3 27.9 221 12.3 11.31984 .......................... 1,086 60.4 54.6 159 8.8 8.7 368 20.5 16.0 559 31.1 29.9 221 12.3 11.61983 .......................... 1,125 62.6 57.2 181 10.1 9.7 363 20.2 16.3 582 32.3 31.2 241 13.4 12.91982 .......................... 1,175 65.5 60.6 173 9.6 9.6 380 21.2 17.3 622 34.6 33.7 231 12.9 12.61981 .......................... 1,182 66.0 61.3 186 10.4 10.5 374 20.9 17.0 622 34.7 33.7 246 13.7 13.61980 .......................... 1,223 68.3 63.7 188 10.5 11.0 384 21.4 17.5 651 36.4 35.2 229 12.8 12.61979 .......................... 1,199 67.3 63.5 173 9.7 10.3 366 20.5 17.1 660 37.0 36.1 231 13.0 13.0
All races, female1992 .......................... 546 28.2 18.3 42 2.2 1.9 287 14.8 6.7 217 11.2 9.6 99 5.1 3.61991 .......................... 555 29.0 18.9 39 2.0 1.8 296 15.5 7.1 220 11.5 9.9 124 6.5 4.51990 .......................... 561 29.5 19.2 44 2.3 2.0 289 15.2 7.0 228 12.0 10.1 109 5.7 4.11989 .......................... 580 30.6 20.2 52 2.7 2.4 290 15.3 7.1 238 12.6 10.7 122 6.4 4.61988 .......................... 540 28.5 18.2 30 1.6 1.4 285 15.0 6.8 225 11.9 10.0 103 5.4 3.71987 .......................... 524 27.6 18.0 38 2.0 1.6 275 14.5 6.8 211 11.1 9.6 125 6.6 4.81986 .......................... 506 26.7 18.0 31 1.6 1.6 274 14.5 7.0 201 10.6 9.5 116 6.1 4.6
- 64 -

Table 1. Number of deaths and unadjusted and age-adjusted death rates per 100,000 population for different categories of alcohol-related mortality byState: United States, 1979–92.
Kentucky
Race, sex,and year
All Alcohol-Related Causes of DeathAll Chronic Liver Disease and
CirrhosisTotal Causes of Death with ExplicitMention of Alcohol
Other Alcohol-Related Diseases Other Alcohol-Related Injuries orAdverse Effects
Number Unadj.Rate
Age-Adj.Rate Number Unadj.
RateAge-Adj.
Rate Number Unadj.Rate
Age-Adj.Rate Number Unadj.
RateAge-Adj.
Rate Number Unadj.Rate
Age-Adj.Rate
All races, female
1985 .......................... 530 27.9 18.7 45 2.4 2.3 280 14.7 7.2 205 10.8 9.3 118 6.2 4.61984 .......................... 518 27.3 18.8 45 2.4 2.3 278 14.6 7.6 195 10.3 8.9 114 6.0 4.81983 .......................... 525 27.7 19.2 30 1.6 1.6 274 14.5 7.7 221 11.7 10.0 110 5.8 4.71982 .......................... 551 29.2 20.8 40 2.1 2.1 289 15.3 8.3 222 11.8 10.4 105 5.6 4.41981 .......................... 547 29.1 20.8 40 2.1 2.3 283 15.1 8.2 223 11.9 10.4 118 6.3 5.71980 .......................... 543 29.0 20.3 48 2.6 2.5 276 14.7 8.0 219 11.7 9.7 106 5.7 4.81979 .......................... 583 31.3 22.9 42 2.3 2.1 292 15.7 9.0 249 13.4 11.8 138 7.4 6.3
White, male1992 .......................... 973 57.9 49.6 184 11.0 9.8 318 18.9 13.3 471 28.1 26.4 198 11.8 10.31991 .......................... 991 59.6 51.9 176 10.6 9.6 328 19.7 14.2 487 29.3 28.1 210 12.6 10.71990 .......................... 1,003 60.7 52.8 150 9.1 8.2 330 20.0 14.5 522 31.6 30.1 195 11.8 10.11989 .......................... 959 58.3 50.5 162 9.8 9.1 321 19.5 14.0 477 29.0 27.4 214 13.0 11.61988 .......................... 990 60.1 52.6 169 10.3 9.4 319 19.4 14.0 502 30.5 29.1 208 12.6 10.81987 .......................... 1,012 61.3 54.0 155 9.4 8.8 328 19.9 14.5 529 32.0 30.7 201 12.2 10.81986 .......................... 993 60.0 53.1 142 8.6 7.9 307 18.5 13.8 544 32.9 31.4 182 11.0 9.9
1985 .......................... 949 57.1 50.4 146 8.8 8.2 324 19.5 14.7 479 28.8 27.4 207 12.5 11.11984 .......................... 969 58.3 52.2 134 8.1 7.7 322 19.4 14.8 513 30.8 29.6 206 12.4 11.51983 .......................... 1,008 60.6 54.9 159 9.6 9.1 320 19.2 15.2 530 31.8 30.6 227 13.6 13.01982 .......................... 1,049 63.1 57.9 149 9.0 8.8 333 20.0 16.0 567 34.1 33.1 215 12.9 12.51981 .......................... 1,071 64.6 59.5 158 9.5 9.5 330 19.9 15.9 583 35.2 34.1 219 13.2 12.71980 .......................... 1,090 65.7 60.7 160 9.7 9.9 336 20.3 16.2 594 35.8 34.6 218 13.2 12.81979 .......................... 1,071 64.9 60.6 153 9.3 9.7 321 19.5 15.8 597 36.2 35.1 216 13.1 12.9
Black, male1992 .......................... 86 67.1 69.7 18 14.1 16.9 24 18.5 18.8 44 34.4 34.0 6 4.7 5.51991 .......................... 111 88.4 94.6 25 19.9 25.1 35 27.8 28.5 51 40.7 40.9 17 13.6 18.41990 .......................... 92 72.8 77.8 26 20.7 24.1 31 24.6 25.4 35 27.5 28.3 12 9.5 11.01989 .......................... 98 78.5 84.2 23 18.4 21.5 34 27.5 29.4 41 32.6 33.2 17 13.6 16.91988 .......................... 101 80.7 82.4 19 15.2 16.9 40 31.9 31.7 42 33.6 33.8 15 12.0 12.71987 .......................... 99 79.5 84.7 20 16.0 19.6 38 30.4 30.6 41 33.1 34.5 20 16.0 19.01986 .......................... 94 75.3 81.2 10 8.0 10.5 34 27.3 28.8 50 40.1 41.8 8 6.4 8.5
1985 .......................... 112 89.3 98.7 26 20.7 25.8 40 31.7 33.8 46 36.9 39.0 14 11.1 14.21984 .......................... 114 90.9 97.2 24 19.1 23.9 45 36.2 36.9 45 35.6 36.3 15 11.9 14.51983 .......................... 116 91.9 100.4 22 17.4 20.6 42 33.5 36.2 52 41.0 43.6 13 10.3 12.01982 .......................... 126 99.8 111.0 24 19.0 23.3 47 37.4 39.9 55 43.4 47.8 16 12.7 15.31981 .......................... 111 88.5 97.2 28 22.3 27.9 44 35.1 36.8 39 31.1 32.5 27 21.5 29.3
- 65 -

Table 1. Number of deaths and unadjusted and age-adjusted death rates per 100,000 population for different categories of alcohol-related mortality byState: United States, 1979–92.
Kentucky
Race, sex,and year
All Alcohol-Related Causes of DeathAll Chronic Liver Disease and
CirrhosisTotal Causes of Death with ExplicitMention of Alcohol
Other Alcohol-Related Diseases Other Alcohol-Related Injuries orAdverse Effects
Number Unadj.Rate
Age-Adj.Rate Number Unadj.
RateAge-Adj.
Rate Number Unadj.Rate
Age-Adj.Rate Number Unadj.
RateAge-Adj.
Rate Number Unadj.Rate
Age-Adj.Rate
Black, male1980 .......................... 133 105.0 117.7 28 22.2 30.9 48 37.9 39.3 57 44.9 47.6 11 8.7 10.71979 .......................... 126 101.5 114.1 20 16.1 20.8 44 35.2 38.0 62 50.3 55.2 15 12.1 13.4
White, female1992 .......................... 494 27.7 17.5 34 1.9 1.7 259 14.5 6.2 201 11.3 9.6 90 5.1 3.51991 .......................... 506 28.7 18.2 33 1.9 1.6 269 15.2 6.6 205 11.6 9.9 113 6.4 4.31990 .......................... 509 29.1 18.5 36 2.1 1.7 259 14.8 6.5 215 12.3 10.3 99 5.7 3.91989 .......................... 524 30.0 19.4 38 2.2 2.0 268 15.3 6.9 218 12.5 10.6 108 6.2 4.31988 .......................... 496 28.4 17.8 26 1.5 1.2 261 14.9 6.5 209 12.0 10.0 92 5.3 3.41987 .......................... 484 27.6 17.6 31 1.8 1.3 256 14.6 6.5 197 11.3 9.7 117 6.7 4.71986 .......................... 460 26.3 17.6 26 1.5 1.4 248 14.2 6.6 186 10.6 9.5 109 6.2 4.6
1985 .......................... 485 27.7 18.2 36 2.1 1.9 257 14.7 6.9 192 10.9 9.4 112 6.4 4.61984 .......................... 474 27.1 18.3 39 2.2 2.0 254 14.5 7.2 182 10.4 9.0 102 5.8 4.51983 .......................... 469 26.8 18.1 25 1.4 1.4 244 14.0 7.1 199 11.4 9.7 100 5.7 4.51982 .......................... 496 28.4 19.7 29 1.7 1.6 260 14.9 7.7 207 11.9 10.4 93 5.3 4.01981 .......................... 496 28.5 20.0 32 1.8 1.9 253 14.6 7.5 211 12.1 10.6 101 5.8 5.11980 .......................... 498 28.7 19.8 43 2.5 2.4 251 14.5 7.7 204 11.8 9.8 98 5.7 4.71979 .......................... 534 31.0 22.3 36 2.1 1.9 267 15.5 8.6 232 13.4 11.8 126 7.3 6.1
Black, female1992 .......................... 51 36.3 30.7 8 5.7 5.7 28 19.6 14.5 16 11.1 10.5 9 6.4 5.91991 .......................... 47 33.8 28.8 6 4.3 4.6 27 19.7 15.0 13 9.7 9.3 11 7.9 8.91990 .......................... 50 35.9 31.7 8 5.8 6.5 30 21.7 16.7 12 8.5 8.6 10 7.2 6.81989 .......................... 54 39.0 31.8 13 9.5 8.6 22 16.0 10.7 19 13.6 12.5 13 9.5 8.21988 .......................... 44 31.9 24.6 4 2.9 3.4 23 17.2 10.9 16 11.8 10.4 11 8.1 8.81987 .......................... 40 29.5 25.1 7 5.1 4.8 20 14.5 10.6 13 9.9 9.7 8 5.9 6.41986 .......................... 45 33.1 25.5 5 3.7 3.2 26 19.1 12.9 14 10.3 9.4 7 5.2 5.1
1985 .......................... 44 32.7 27.9 9 6.6 8.1 22 16.5 11.0 13 9.5 8.8 6 4.4 5.21984 .......................... 42 31.4 26.6 6 4.4 5.4 24 17.6 12.9 13 9.3 8.3 12 8.9 9.31983 .......................... 55 41.0 35.6 5 3.7 5.0 30 22.1 17.5 21 15.2 13.2 10 7.4 8.81982 .......................... 53 39.6 37.2 11 8.2 9.8 28 20.5 16.8 15 10.9 10.7 10 7.4 8.01981 .......................... 50 37.6 34.3 8 6.0 7.3 30 22.7 18.0 12 9.0 8.9 17 12.7 15.61980 .......................... 44 33.1 28.2 5 3.7 4.4 25 18.6 13.4 14 10.8 10.3 8 6.0 5.91979 .......................... 48 36.5 31.5 6 4.6 4.4 25 19.1 15.1 17 12.8 12.0 12 9.1 10.1
- 66 -

Table 1. Number of deaths and unadjusted and age-adjusted death rates per 100,000 population for different categories of alcohol-related mortality byState: United States, 1979–92.
Louisiana
Race, sex,and year
All Alcohol-Related Causes of DeathAll Chronic Liver Disease and
CirrhosisTotal Causes of Death with ExplicitMention of Alcohol
Other Alcohol-Related Diseases Other Alcohol-Related Injuries orAdverse Effects
Number Unadj.Rate
Age-Adj.Rate Number Unadj.
RateAge-Adj.
Rate Number Unadj.Rate
Age-Adj.Rate Number Unadj.
RateAge-Adj.
Rate Number Unadj.Rate
Age-Adj.Rate
All races, both sexes1992 .......................... 2,026 47.3 41.6 245 5.7 5.4 719 16.8 11.7 1,062 24.8 24.5 351 8.2 7.21991 .......................... 2,056 48.5 42.7 231 5.4 5.3 739 17.4 12.3 1,087 25.6 25.2 356 8.4 7.41990 .......................... 2,088 49.5 44.2 253 6.0 5.9 728 17.3 12.2 1,107 26.3 26.0 363 8.6 7.71989 .......................... 2,024 47.6 42.2 232 5.5 5.4 739 17.4 12.7 1,053 24.8 24.2 373 8.8 8.01988 .......................... 1,932 45.1 40.0 192 4.5 4.4 708 16.5 12.2 1,033 24.1 23.4 330 7.7 7.21987 .......................... 1,862 42.9 38.4 192 4.4 4.5 707 16.3 12.3 963 22.2 21.6 349 8.0 7.51986 .......................... 1,989 45.1 40.9 189 4.3 4.3 716 16.2 12.6 1,084 24.6 24.0 382 8.7 8.2
1985 .......................... 1,995 45.3 41.4 212 4.8 5.0 738 16.7 13.2 1,045 23.7 23.1 389 8.8 8.51984 .......................... 1,986 45.1 41.3 196 4.5 4.6 730 16.6 13.2 1,061 24.1 23.5 399 9.1 8.81983 .......................... 2,045 46.5 43.1 193 4.4 4.7 726 16.5 13.3 1,125 25.6 25.1 424 9.6 9.41982 .......................... 2,068 47.5 44.4 168 3.9 4.2 699 16.1 13.1 1,201 27.6 27.1 368 8.5 8.41981 .......................... 2,184 51.0 47.3 191 4.5 4.7 743 17.3 14.0 1,250 29.2 28.5 447 10.4 10.31980 .......................... 2,199 52.1 48.9 202 4.8 5.2 748 17.7 14.6 1,249 29.6 29.1 476 11.3 11.21979 .......................... 2,154 52.0 49.3 200 4.8 5.3 719 17.4 14.5 1,235 29.8 29.5 389 9.4 9.6
All races, male1992 .......................... 1,420 68.9 65.9 190 9.2 9.0 423 20.5 17.4 807 39.2 39.5 228 11.1 10.71991 .......................... 1,436 70.2 67.3 185 9.0 9.1 430 21.1 17.8 821 40.1 40.3 226 11.1 10.51990 .......................... 1,425 70.2 68.0 188 9.3 9.5 416 20.5 17.5 821 40.4 40.9 224 11.0 10.61989 .......................... 1,402 68.4 65.8 185 9.0 9.2 445 21.7 18.9 771 37.7 37.6 258 12.6 12.41988 .......................... 1,320 63.8 61.6 141 6.8 7.0 414 20.0 17.9 765 37.0 36.7 211 10.2 10.21987 .......................... 1,275 60.9 59.2 142 6.8 7.1 430 20.5 18.8 703 33.5 33.3 243 11.6 11.61986 .......................... 1,395 65.6 64.1 141 6.6 6.9 434 20.4 18.9 820 38.6 38.3 235 11.1 11.3
1985 .......................... 1,387 65.1 64.2 168 7.9 8.4 443 20.8 19.6 776 36.4 36.2 256 12.0 12.51984 .......................... 1,373 64.5 63.7 154 7.2 7.7 426 20.0 19.0 793 37.2 37.1 253 11.9 12.31983 .......................... 1,416 66.6 66.3 141 6.6 7.4 430 20.2 19.3 845 39.7 39.6 279 13.1 14.01982 .......................... 1,434 68.0 67.9 122 5.8 6.4 405 19.2 18.6 908 43.0 42.9 231 10.9 11.61981 .......................... 1,524 73.3 72.8 134 6.4 7.2 433 20.8 19.9 957 46.1 45.7 278 13.4 14.31980 .......................... 1,547 75.5 75.8 166 8.1 9.1 433 21.1 20.5 948 46.3 46.2 306 14.9 15.91979 .......................... 1,535 76.4 76.9 143 7.1 7.9 442 22.0 21.4 950 47.3 47.6 249 12.4 13.5
All races, female1992 .......................... 606 27.3 19.8 55 2.5 2.2 295 13.3 7.2 255 11.5 10.4 123 5.5 4.21991 .......................... 620 28.2 20.8 46 2.1 2.0 308 14.0 7.9 266 12.1 11.0 130 5.9 4.91990 .......................... 663 30.3 22.8 65 3.0 2.8 312 14.2 8.1 286 13.1 11.9 139 6.4 5.21989 .......................... 622 28.2 21.5 47 2.1 2.1 294 13.3 7.7 281 12.8 11.7 115 5.2 4.31988 .......................... 613 27.6 20.9 51 2.3 2.1 294 13.2 7.6 268 12.0 11.2 119 5.4 4.61987 .......................... 587 26.1 20.1 50 2.2 2.3 277 12.3 7.1 260 11.6 10.7 106 4.7 4.21986 .......................... 594 26.0 20.3 48 2.1 2.0 282 12.4 7.6 264 11.6 10.7 147 6.4 5.5
- 67 -

Table 1. Number of deaths and unadjusted and age-adjusted death rates per 100,000 population for different categories of alcohol-related mortality byState: United States, 1979–92.
Louisiana
Race, sex,and year
All Alcohol-Related Causes of DeathAll Chronic Liver Disease and
CirrhosisTotal Causes of Death with ExplicitMention of Alcohol
Other Alcohol-Related Diseases Other Alcohol-Related Injuries orAdverse Effects
Number Unadj.Rate
Age-Adj.Rate Number Unadj.
RateAge-Adj.
Rate Number Unadj.Rate
Age-Adj.Rate Number Unadj.
RateAge-Adj.
Rate Number Unadj.Rate
Age-Adj.Rate
All races, female
1985 .......................... 608 26.7 21.1 44 1.9 1.9 295 13.0 8.2 269 11.8 11.0 133 5.8 5.11984 .......................... 613 27.0 21.3 42 1.8 1.9 303 13.4 8.5 268 11.8 10.9 146 6.4 5.71983 .......................... 629 27.7 22.4 52 2.3 2.2 296 13.0 8.5 281 12.4 11.7 145 6.4 5.51982 .......................... 633 28.3 23.1 46 2.1 2.2 294 13.1 8.7 293 13.1 12.2 137 6.1 5.71981 .......................... 661 30.0 24.2 57 2.6 2.6 310 14.1 9.4 294 13.3 12.2 169 7.7 6.81980 .......................... 652 30.0 24.5 36 1.7 1.7 315 14.5 9.8 301 13.8 13.0 170 7.8 7.21979 .......................... 619 29.1 24.4 57 2.7 3.0 277 13.0 8.9 285 13.4 12.5 140 6.6 6.3
White, male1992 .......................... 781 55.5 48.7 100 7.1 6.3 269 19.1 14.0 413 29.4 28.4 142 10.1 8.51991 .......................... 798 56.9 50.3 101 7.2 6.5 281 20.1 15.0 416 29.7 28.8 158 11.3 9.41990 .......................... 799 57.3 51.7 100 7.2 6.8 258 18.5 14.0 441 31.6 31.0 154 11.0 9.51989 .......................... 804 57.0 50.7 113 8.0 7.4 276 19.6 15.1 415 29.4 28.2 186 13.2 11.51988 .......................... 792 55.5 50.4 74 5.2 4.9 256 17.9 14.2 462 32.3 31.2 151 10.6 9.51987 .......................... 754 51.9 47.4 76 5.2 5.0 276 19.0 15.7 402 27.7 26.7 182 12.5 11.21986 .......................... 838 56.6 52.6 88 5.9 5.8 262 17.7 14.8 488 33.0 32.0 172 11.6 10.9
1985 .......................... 861 57.9 54.2 91 6.1 6.0 282 19.0 16.4 488 32.8 31.9 172 11.6 10.91984 .......................... 853 57.3 53.8 89 6.0 5.7 264 17.7 15.5 499 33.5 32.6 182 12.2 11.61983 .......................... 849 56.9 53.8 66 4.4 4.5 276 18.5 16.3 507 34.0 33.0 202 13.5 13.11982 .......................... 865 58.3 55.6 69 4.7 4.7 251 16.9 15.2 545 36.7 35.7 176 11.9 11.61981 .......................... 940 64.2 60.8 79 5.4 5.5 280 19.2 17.2 581 39.7 38.2 203 13.9 13.61980 .......................... 969 67.0 64.0 94 6.5 6.6 279 19.3 17.6 596 41.2 39.8 221 15.3 14.91979 .......................... 915 64.2 61.7 75 5.3 5.3 275 19.3 17.7 565 39.7 38.7 177 12.4 12.3
Black, male1992 .......................... 631 101.4 112.8 88 14.1 17.7 153 24.6 29.2 390 62.7 65.9 85 13.7 17.81991 .......................... 632 103.2 114.1 83 13.6 17.5 148 24.2 27.9 400 65.4 68.7 67 10.9 13.71990 .......................... 613 101.1 113.0 86 14.2 18.2 154 25.4 29.2 373 61.5 65.6 67 11.0 13.91989 .......................... 588 96.5 109.0 72 11.8 15.4 166 27.2 31.9 350 57.5 61.8 71 11.7 15.11988 .......................... 519 85.0 94.7 66 10.8 13.6 157 25.7 30.5 297 48.5 50.6 60 9.8 12.81987 .......................... 512 83.3 94.8 66 10.7 14.3 153 24.9 29.4 293 47.6 51.1 61 9.9 13.11986 .......................... 543 87.6 97.3 52 8.4 10.4 169 27.3 32.5 322 51.9 54.5 61 9.8 12.4
1985 .......................... 517 83.5 95.3 77 12.4 16.7 158 25.6 30.2 281 45.4 48.3 83 13.4 17.91984 .......................... 513 83.3 95.4 64 10.4 13.9 160 26.0 30.8 289 46.9 50.7 69 11.2 14.71983 .......................... 557 90.9 105.2 73 11.9 16.7 154 25.1 30.0 330 53.9 58.5 76 12.4 17.21982 .......................... 561 92.7 106.8 53 8.8 12.3 153 25.3 30.3 355 58.7 64.2 55 9.1 12.01981 .......................... 578 97.4 111.7 55 9.3 13.3 151 25.4 29.3 372 62.7 69.1 75 12.6 17.6
- 68 -

Table 1. Number of deaths and unadjusted and age-adjusted death rates per 100,000 population for different categories of alcohol-related mortality byState: United States, 1979–92.
Louisiana
Race, sex,and year
All Alcohol-Related Causes of DeathAll Chronic Liver Disease and
CirrhosisTotal Causes of Death with ExplicitMention of Alcohol
Other Alcohol-Related Diseases Other Alcohol-Related Injuries orAdverse Effects
Number Unadj.Rate
Age-Adj.Rate Number Unadj.
RateAge-Adj.
Rate Number Unadj.Rate
Age-Adj.Rate Number Unadj.
RateAge-Adj.
Rate Number Unadj.Rate
Age-Adj.Rate
Black, male1980 .......................... 572 98.2 115.2 72 12.3 17.6 153 26.2 30.5 348 59.7 67.0 84 14.4 20.01979 .......................... 616 108.8 127.2 68 12.0 16.9 165 29.2 33.8 383 67.6 76.5 72 12.7 18.5
White, female1992 .......................... 405 27.4 17.8 38 2.6 2.1 203 13.8 6.2 164 11.1 9.5 96 6.5 4.31991 .......................... 412 28.1 18.7 30 2.0 1.8 209 14.2 6.6 174 11.8 10.3 90 6.1 4.31990 .......................... 440 30.1 20.6 39 2.7 2.3 209 14.3 6.8 192 13.2 11.4 99 6.8 4.91989 .......................... 394 26.7 18.6 28 1.9 1.8 189 12.8 6.2 177 12.0 10.6 86 5.8 4.31988 .......................... 409 27.3 18.8 33 2.2 1.9 195 13.1 6.3 180 12.1 10.7 86 5.8 4.31987 .......................... 380 25.0 17.8 22 1.4 1.4 184 12.1 6.1 175 11.5 10.3 70 4.6 3.51986 .......................... 388 25.1 18.0 23 1.5 1.3 186 12.1 6.3 179 11.6 10.4 102 6.6 4.8
1985 .......................... 414 26.7 19.7 31 2.0 1.9 198 12.8 6.9 185 11.9 10.9 100 6.5 5.01984 .......................... 407 26.3 19.4 28 1.8 1.8 198 12.8 7.2 181 11.7 10.5 112 7.2 5.91983 .......................... 413 26.7 20.3 31 2.0 1.8 196 12.6 7.3 186 12.0 11.2 105 6.8 5.31982 .......................... 438 28.5 22.2 34 2.2 2.3 202 13.2 7.8 202 13.2 12.1 104 6.8 5.81981 .......................... 445 29.4 22.2 36 2.4 2.1 208 13.7 8.2 202 13.3 11.9 123 8.1 6.61980 .......................... 438 29.3 22.5 26 1.7 1.8 205 13.7 8.1 207 13.8 12.6 128 8.6 7.21979 .......................... 403 27.4 21.5 28 1.9 1.9 181 12.3 7.5 194 13.2 12.1 100 6.8 5.9
Black, female1992 .......................... 198 27.8 24.9 17 2.4 2.4 91 12.8 10.2 89 12.6 12.3 26 3.7 3.81991 .......................... 204 29.2 26.2 16 2.3 2.3 98 14.0 11.4 91 13.0 12.5 40 5.7 6.61990 .......................... 219 31.5 28.8 26 3.7 4.1 101 14.5 11.8 92 13.2 12.9 38 5.5 5.71989 .......................... 224 32.1 29.3 19 2.7 3.1 103 14.8 12.1 102 14.6 14.2 29 4.2 4.41988 .......................... 200 28.6 26.2 17 2.4 2.8 98 14.0 11.3 85 12.1 12.0 32 4.6 5.21987 .......................... 202 28.8 26.2 27 3.8 4.4 92 13.0 10.2 84 11.9 11.6 33 4.7 5.41986 .......................... 204 28.8 26.8 25 3.5 4.0 95 13.4 11.5 84 11.8 11.3 45 6.4 7.3
1985 .......................... 193 27.4 25.4 13 1.8 2.2 96 13.7 11.9 84 11.9 11.3 33 4.7 5.21984 .......................... 204 29.2 26.7 13 1.9 2.2 105 15.0 12.6 86 12.3 12.0 33 4.7 5.11983 .......................... 213 30.6 28.1 21 3.0 3.3 99 14.2 12.0 93 13.3 12.8 38 5.5 5.61982 .......................... 194 28.3 26.1 12 1.7 2.0 92 13.4 11.6 90 13.1 12.4 33 4.8 5.61981 .......................... 213 31.7 30.0 21 3.1 3.9 102 15.1 13.1 91 13.5 13.1 45 6.7 7.41980 .......................... 213 32.2 30.4 10 1.5 1.7 110 16.7 14.6 93 14.0 14.1 42 6.4 7.21979 .......................... 214 33.3 32.8 29 4.5 6.2 95 14.7 12.7 90 14.0 13.9 38 5.9 7.0
- 69 -

Table 1. Number of deaths and unadjusted and age-adjusted death rates per 100,000 population for different categories of alcohol-related mortality byState: United States, 1979–92.
Maine
Race, sex,and year
All Alcohol-Related Causes of DeathAll Chronic Liver Disease and
CirrhosisTotal Causes of Death with ExplicitMention of Alcohol
Other Alcohol-Related Diseases Other Alcohol-Related Injuries orAdverse Effects
Number Unadj.Rate
Age-Adj.Rate Number Unadj.
RateAge-Adj.
Rate Number Unadj.Rate
Age-Adj.Rate Number Unadj.
RateAge-Adj.
Rate Number Unadj.Rate
Age-Adj.Rate
All races, both sexes1992 .......................... 513 41.5 29.4 85 6.9 5.7 237 19.2 10.2 191 15.5 13.5 129 10.4 7.51991 .......................... 498 40.3 29.0 82 6.6 5.2 229 18.5 10.3 187 15.1 13.6 136 11.0 7.41990 .......................... 497 40.4 29.8 96 7.8 6.4 210 17.1 9.4 191 15.5 14.1 109 8.9 6.31989 .......................... 516 42.3 31.1 92 7.5 6.3 223 18.3 10.1 201 16.5 14.7 128 10.5 7.61988 .......................... 533 44.3 33.1 107 8.9 7.0 211 17.5 9.8 216 17.9 16.3 127 10.5 8.01987 .......................... 511 43.1 32.1 94 7.9 6.9 225 19.0 10.8 192 16.2 14.4 131 11.1 8.61986 .......................... 481 41.1 30.3 85 7.3 6.1 221 18.9 10.8 176 15.0 13.5 117 10.0 7.7
1985 .......................... 512 44.1 33.2 89 7.7 6.8 225 19.4 11.1 198 17.1 15.3 137 11.8 8.91984 .......................... 501 43.3 32.7 76 6.6 5.8 224 19.3 11.2 201 17.4 15.7 144 12.5 9.81983 .......................... 512 44.8 34.9 86 7.5 6.9 224 19.5 11.6 203 17.7 16.4 141 12.3 9.61982 .......................... 492 43.3 33.4 91 8.0 7.2 216 19.0 11.4 185 16.3 14.8 166 14.6 11.61981 .......................... 516 45.6 35.4 104 9.2 8.3 213 18.8 10.9 199 17.6 16.2 159 14.0 11.11980 .......................... 542 48.0 38.0 105 9.3 8.8 215 19.1 11.3 221 19.6 17.9 146 12.9 10.91979 .......................... 556 49.5 40.3 105 9.3 8.5 216 19.2 12.2 235 20.9 19.6 161 14.3 11.9
All races, male1992 .......................... 335 55.6 44.7 63 10.5 8.9 141 23.4 15.8 131 21.8 20.1 89 14.8 11.81991 .......................... 316 52.5 43.1 60 10.0 8.3 128 21.2 14.8 128 21.3 20.1 80 13.3 10.41990 .......................... 318 53.0 44.4 71 11.8 10.4 114 19.1 13.2 132 22.0 20.8 69 11.5 9.11989 .......................... 336 56.6 46.9 68 11.4 9.9 128 21.6 15.1 140 23.6 22.0 82 13.8 11.21988 .......................... 345 58.9 49.5 78 13.3 11.1 116 19.9 14.2 151 25.7 24.2 79 13.5 10.81987 .......................... 336 58.3 49.0 74 12.8 11.5 126 21.9 15.6 136 23.6 21.9 86 14.9 13.01986 .......................... 303 53.3 44.7 59 10.4 8.9 121 21.2 15.5 123 21.7 20.3 73 12.8 10.5
1985 .......................... 341 60.4 50.9 66 11.7 10.8 132 23.4 16.6 143 25.3 23.4 90 15.9 13.01984 .......................... 319 56.8 48.4 53 9.4 8.8 127 22.6 16.4 139 24.8 23.3 93 16.6 14.21983 .......................... 339 61.0 52.9 61 11.0 10.3 130 23.4 17.2 148 26.6 25.3 98 17.6 15.11982 .......................... 308 55.8 48.0 66 12.0 11.0 118 21.3 15.7 124 22.5 21.3 96 17.4 15.01981 .......................... 339 61.6 53.3 82 14.9 14.1 121 21.9 15.9 136 24.7 23.4 107 19.4 16.41980 .......................... 360 65.8 57.9 78 14.2 14.3 126 22.9 16.8 157 28.6 26.8 98 17.9 16.31979 .......................... 368 67.4 60.4 73 13.4 12.9 124 22.7 17.6 171 31.3 29.9 102 18.7 16.9
All races, female1992 .......................... 178 28.1 15.8 22 3.5 2.9 96 15.2 5.6 60 9.4 7.3 40 6.3 3.81991 .......................... 182 28.7 16.6 22 3.5 2.5 101 15.9 6.6 59 9.3 7.4 56 8.8 4.81990 .......................... 180 28.4 16.8 25 4.0 2.7 96 15.2 6.3 59 9.3 7.8 40 6.3 3.81989 .......................... 179 28.6 17.1 24 3.8 3.2 95 15.1 6.2 61 9.7 7.7 46 7.3 4.51988 .......................... 188 30.4 18.5 29 4.7 3.6 94 15.2 6.2 65 10.5 8.7 48 7.8 5.61987 .......................... 175 28.7 17.0 20 3.3 2.8 99 16.3 6.9 56 9.2 7.2 45 7.4 4.61986 .......................... 179 29.7 17.6 26 4.3 3.7 100 16.6 6.9 53 8.7 7.0 44 7.3 5.3
- 70 -

Table 1. Number of deaths and unadjusted and age-adjusted death rates per 100,000 population for different categories of alcohol-related mortality byState: United States, 1979–92.
Maine
Race, sex,and year
All Alcohol-Related Causes of DeathAll Chronic Liver Disease and
CirrhosisTotal Causes of Death with ExplicitMention of Alcohol
Other Alcohol-Related Diseases Other Alcohol-Related Injuries orAdverse Effects
Number Unadj.Rate
Age-Adj.Rate Number Unadj.
RateAge-Adj.
Rate Number Unadj.Rate
Age-Adj.Rate Number Unadj.
RateAge-Adj.
Rate Number Unadj.Rate
Age-Adj.Rate
All races, female
1985 .......................... 171 28.6 17.6 23 3.8 3.1 93 15.5 6.8 56 9.3 7.7 47 7.9 5.41984 .......................... 182 30.6 18.6 23 3.9 3.1 97 16.3 6.9 62 10.4 8.5 51 8.6 6.01983 .......................... 173 29.4 18.8 25 4.2 3.7 93 15.9 7.2 55 9.3 7.9 43 7.3 4.91982 .......................... 184 31.5 20.5 25 4.3 3.8 99 16.8 8.0 61 10.4 8.8 70 12.0 8.61981 .......................... 177 30.5 19.6 22 3.8 3.1 92 15.8 7.0 63 10.9 9.4 52 8.9 6.71980 .......................... 181 31.2 20.3 27 4.7 3.8 90 15.4 7.0 65 11.1 9.5 48 8.3 6.11979 .......................... 188 32.5 22.3 32 5.5 4.7 92 15.9 7.8 64 11.1 9.8 59 10.2 7.5
White, male1992 .......................... 332 56.0 44.8 61 10.3 8.7 140 23.6 15.8 131 22.1 20.3 87 14.7 11.61991 .......................... 314 52.9 43.1 60 10.1 8.3 128 21.6 14.9 126 21.2 20.0 80 13.5 10.51990 .......................... 312 52.9 44.0 69 11.7 10.1 114 19.3 13.2 129 21.8 20.6 69 11.7 9.21989 .......................... 333 56.9 46.9 66 11.3 9.6 128 21.9 15.1 139 23.7 22.2 82 14.0 11.31988 .......................... 342 59.2 49.5 76 13.2 10.8 116 20.1 14.3 150 25.9 24.4 78 13.5 10.71987 .......................... 333 58.6 49.1 73 12.9 11.5 125 22.0 15.6 135 23.7 22.1 86 15.1 13.11986 .......................... 299 53.3 44.4 57 10.2 8.6 120 21.5 15.6 121 21.6 20.2 71 12.7 10.2
1985 .......................... 337 60.5 50.7 64 11.5 10.6 132 23.6 16.6 141 25.4 23.5 89 16.0 12.91984 .......................... 317 57.1 48.5 52 9.4 8.7 127 22.9 16.4 138 24.9 23.4 92 16.6 14.21983 .......................... 337 61.4 53.0 60 10.9 10.2 130 23.6 17.2 148 26.9 25.6 97 17.7 15.01982 .......................... 307 56.2 48.1 66 12.1 11.1 118 21.6 15.7 123 22.6 21.3 96 17.6 15.11981 .......................... 338 62.0 53.5 82 15.1 14.1 120 22.1 15.8 135 24.8 23.5 106 19.5 16.31980 .......................... 357 65.8 57.8 77 14.2 14.1 124 22.9 16.8 156 28.7 26.9 98 18.1 16.41979 .......................... 364 67.2 59.9 73 13.5 12.9 123 22.8 17.4 167 30.9 29.5 101 18.7 16.7
Black, male1992 .......................... 2 50.7 57.7 1 32.3 26.4 1 18.4 31.4 0 0.0 0.0 1 32.3 26.41991 .......................... 1 23.2 33.1 0 0.0 0.0 - 1.5 3.2 1 21.6 29.9 0 0.0 0.01990 .......................... 1 46.1 92.0 1 31.8 78.0 - 2.2 5.0 - 12.1 9.0 0 0.0 0.01989 .......................... 1 32.0 45.2 0 0.0 0.0 0 0.0 0.0 1 32.0 45.2 0 0.0 0.01988 .......................... - 1.7 3.6 0 0.0 0.0 - 1.7 3.6 0 0.0 0.0 0 0.0 0.01987 .......................... 0 0.0 0.0 0 0.0 0.0 0 0.0 0.0 0 0.0 0.0 0 0.0 0.01986 .......................... 2 62.3 119.6 1 37.3 78.0 - 9.3 24.7 - 15.7 16.9 1 37.3 78.0
1985 .......................... 0 0.0 0.0 0 0.0 0.0 0 0.0 0.0 0 0.0 0.0 0 0.0 0.01984 .......................... - 11.5 7.3 0 0.0 0.0 0 0.0 0.0 - 11.5 7.3 0 0.0 0.01983 .......................... 1 62.9 66.8 1 43.1 52.5 0 0.0 0.0 - 19.8 14.3 0 0.0 0.01982 .......................... 0 0.0 0.0 0 0.0 0.0 0 0.0 0.0 0 0.0 0.0 0 0.0 0.0
- 71 -

Table 1. Number of deaths and unadjusted and age-adjusted death rates per 100,000 population for different categories of alcohol-related mortality byState: United States, 1979–92.
Maine
Race, sex,and year
All Alcohol-Related Causes of DeathAll Chronic Liver Disease and
CirrhosisTotal Causes of Death with ExplicitMention of Alcohol
Other Alcohol-Related Diseases Other Alcohol-Related Injuries orAdverse Effects
Number Unadj.Rate
Age-Adj.Rate Number Unadj.
RateAge-Adj.
Rate Number Unadj.Rate
Age-Adj.Rate Number Unadj.
RateAge-Adj.
Rate Number Unadj.Rate
Age-Adj.Rate
Black, male1981 .......................... 0 0.0 0.0 0 0.0 0.0 0 0.0 0.0 0 0.0 0.0 0 0.0 0.01980 .......................... - 22.1 27.2 0 0.0 0.0 - 7.7 16.2 - 14.4 11.0 0 0.0 0.01979 .......................... 1 70.9 77.2 0 0.0 0.0 - 13.2 29.1 1 57.6 48.1 0 0.0 0.0
White, female1992 .......................... 177 28.3 15.9 22 3.5 2.9 96 15.3 5.6 59 9.5 7.3 39 6.2 3.71991 .......................... 180 28.8 16.5 22 3.5 2.5 100 16.0 6.5 58 9.3 7.4 56 9.0 4.81990 .......................... 179 28.7 16.8 25 4.0 2.7 95 15.3 6.3 58 9.4 7.9 40 6.4 3.91989 .......................... 177 28.7 16.9 23 3.7 3.0 94 15.2 6.1 60 9.7 7.8 46 7.4 4.61988 .......................... 187 30.7 18.6 29 4.8 3.6 94 15.4 6.2 65 10.6 8.8 48 7.9 5.61987 .......................... 173 28.8 16.8 20 3.3 2.9 99 16.5 7.0 54 9.0 7.0 45 7.5 4.61986 .......................... 177 29.9 17.5 26 4.4 3.7 100 16.8 6.9 52 8.7 6.9 44 7.4 5.3
1985 .......................... 170 28.8 17.5 23 3.9 3.2 92 15.5 6.7 55 9.4 7.7 46 7.8 5.31984 .......................... 179 30.5 18.4 23 3.9 3.2 96 16.4 6.9 60 10.2 8.3 51 8.7 6.01983 .......................... 171 29.4 18.7 24 4.1 3.6 93 15.9 7.1 54 9.3 7.9 42 7.2 4.81982 .......................... 184 31.8 20.6 25 4.3 3.8 98 17.0 8.0 61 10.5 8.8 70 12.1 8.61981 .......................... 176 30.5 19.4 22 3.8 3.2 91 15.8 6.9 62 10.8 9.4 51 8.8 6.61980 .......................... 180 31.2 20.2 27 4.7 3.9 89 15.5 7.0 63 11.0 9.4 48 8.4 6.21979 .......................... 186 32.5 22.2 31 5.4 4.6 91 15.9 7.7 64 11.1 9.8 58 10.1 7.4
Black, female1992 .......................... - 5.6 6.7 0 0.0 0.0 - 5.6 6.7 0 0.0 0.0 0 0.0 0.01991 .......................... - 2.3 1.0 0 0.0 0.0 - 2.3 1.0 0 0.0 0.0 0 0.0 0.01990 .......................... - 20.4 14.3 0 0.0 0.0 0 0.0 0.0 - 20.4 14.3 0 0.0 0.01989 .......................... - 10.0 7.0 0 0.0 0.0 0 0.0 0.0 - 10.0 7.0 0 0.0 0.01988 .......................... - 2.6 1.0 0 0.0 0.0 - 2.6 1.0 0 0.0 0.0 0 0.0 0.01987 .......................... - 23.0 19.8 0 0.0 0.0 0 0.0 0.0 - 23.0 19.8 0 0.0 0.01986 .......................... - 2.9 5.2 0 0.0 0.0 - 2.9 5.2 0 0.0 0.0 0 0.0 0.0
1985 .......................... - 16.2 29.1 0 0.0 0.0 - 16.2 29.1 0 0.0 0.0 0 0.0 0.01984 .......................... - 24.9 42.1 0 0.0 0.0 - 24.9 42.1 0 0.0 0.0 0 0.0 0.01983 .......................... - 3.3 2.9 0 0.0 0.0 - 3.3 2.9 0 0.0 0.0 0 0.0 0.01982 .......................... - 5.0 2.4 0 0.0 0.0 - 5.0 2.4 0 0.0 0.0 0 0.0 0.01981 .......................... - 5.2 11.8 0 0.0 0.0 - 5.2 11.8 0 0.0 0.0 0 0.0 0.01980 .......................... 1 70.7 60.2 0 0.0 0.0 - 5.6 3.8 1 65.1 56.4 0 0.0 0.01979 .......................... - 41.1 32.8 0 0.0 0.0 - 4.1 6.8 - 37.0 26.0 0 0.0 0.0
- The AAF methodology used to estimate alcohol-related mortality can result in fractional estimates less than 0.5 but greater than 0.
- 72 -

Table 1. Number of deaths and unadjusted and age-adjusted death rates per 100,000 population for different categories of alcohol-related mortality byState: United States, 1979–92.
Maryland
Race, sex,and year
All Alcohol-Related Causes of DeathAll Chronic Liver Disease and
CirrhosisTotal Causes of Death with ExplicitMention of Alcohol
Other Alcohol-Related Diseases Other Alcohol-Related Injuries orAdverse Effects
Number Unadj.Rate
Age-Adj.Rate Number Unadj.
RateAge-Adj.
Rate Number Unadj.Rate
Age-Adj.Rate Number Unadj.
RateAge-Adj.
Rate Number Unadj.Rate
Age-Adj.Rate
All races, both sexes1992 .......................... 1,915 39.0 32.5 282 5.7 5.0 777 15.8 10.9 856 17.4 16.6 410 8.3 6.81991 .......................... 1,914 39.3 33.2 321 6.6 5.8 774 15.9 11.1 819 16.8 16.3 436 9.0 7.71990 .......................... 1,958 40.8 34.5 317 6.6 6.0 771 16.1 11.3 870 18.1 17.1 408 8.5 7.31989 .......................... 2,110 44.6 37.7 396 8.4 7.6 796 16.8 11.9 918 19.4 18.2 476 10.1 8.81988 .......................... 2,001 43.0 36.2 339 7.3 6.6 762 16.4 11.5 901 19.3 18.0 458 9.8 8.41987 .......................... 2,051 44.9 37.9 392 8.6 7.9 754 16.5 11.8 905 19.8 18.2 494 10.8 9.41986 .......................... 1,894 42.2 35.5 311 6.9 6.3 747 16.6 12.0 836 18.6 17.2 397 8.8 7.6
1985 .......................... 1,845 41.8 35.5 319 7.2 6.6 735 16.7 12.3 790 17.9 16.5 428 9.7 8.51984 .......................... 1,799 41.2 34.8 313 7.2 6.6 746 17.1 12.7 740 16.9 15.6 482 11.0 9.81983 .......................... 1,811 42.0 35.8 284 6.6 6.1 770 17.8 13.4 757 17.6 16.3 468 10.9 9.61982 .......................... 1,776 41.5 35.9 269 6.3 5.9 731 17.1 13.0 776 18.1 17.0 415 9.7 8.61981 .......................... 1,848 43.4 38.0 306 7.2 6.9 724 17.0 13.2 818 19.2 17.9 442 10.4 9.41980 .......................... 1,902 45.0 39.6 346 8.2 7.8 703 16.6 13.1 853 20.2 18.8 498 11.8 10.71979 .......................... 1,817 43.0 38.3 282 6.7 6.4 733 17.4 14.1 802 19.0 17.8 514 12.2 11.3
All races, male1992 .......................... 1,284 53.8 49.1 195 8.2 7.4 459 19.2 15.7 631 26.4 26.0 253 10.6 9.31991 .......................... 1,298 55.0 50.9 240 10.2 9.2 458 19.4 16.3 601 25.4 25.3 279 11.8 10.81990 .......................... 1,349 58.0 53.6 229 9.8 9.2 462 19.9 16.9 658 28.3 27.5 277 11.9 10.81989 .......................... 1,436 62.7 57.6 305 13.3 12.4 473 20.6 17.5 658 28.7 27.6 324 14.1 13.01988 .......................... 1,374 60.8 55.8 262 11.6 10.8 444 19.7 16.8 668 29.6 28.2 294 13.0 11.91987 .......................... 1,398 63.2 57.8 303 13.7 12.9 446 20.2 17.3 649 29.3 27.6 322 14.5 13.51986 .......................... 1,284 59.1 54.2 233 10.7 10.0 445 20.5 17.6 606 27.9 26.5 254 11.7 10.5
1985 .......................... 1,245 58.2 53.8 245 11.5 10.8 439 20.5 17.9 561 26.3 25.0 273 12.8 12.01984 .......................... 1,224 57.9 53.2 238 11.3 10.6 457 21.6 18.9 529 25.0 23.7 317 15.0 14.01983 .......................... 1,237 59.2 54.9 226 10.8 10.4 467 22.4 19.8 544 26.0 24.8 297 14.2 13.31982 .......................... 1,188 57.3 53.7 191 9.2 9.0 445 21.5 19.1 552 26.6 25.6 259 12.5 11.81981 .......................... 1,274 61.8 58.5 236 11.4 11.3 436 21.1 19.2 603 29.2 28.0 280 13.6 13.01980 .......................... 1,315 64.3 60.6 245 12.0 11.6 435 21.3 19.4 635 31.0 29.7 332 16.2 15.41979 .......................... 1,244 60.8 58.2 200 9.8 9.7 462 22.6 21.1 581 28.4 27.5 334 16.3 16.0
All races, female1992 .......................... 631 25.0 17.6 87 3.4 2.9 319 12.6 7.1 225 8.9 7.6 157 6.2 4.61991 .......................... 615 24.6 17.2 81 3.2 2.7 316 12.6 6.9 218 8.7 7.6 157 6.3 4.91990 .......................... 609 24.6 17.2 88 3.6 3.1 309 12.5 6.8 212 8.6 7.3 131 5.3 4.21989 .......................... 674 27.7 19.9 91 3.7 3.3 323 13.3 7.4 260 10.7 9.2 152 6.2 5.11988 .......................... 627 26.1 18.6 77 3.2 2.9 318 13.2 7.3 232 9.7 8.3 164 6.8 5.31987 .......................... 652 27.7 20.2 89 3.8 3.4 307 13.1 7.5 256 10.9 9.4 172 7.3 5.81986 .......................... 609 26.3 18.9 78 3.4 3.0 302 13.0 7.4 230 9.9 8.4 143 6.2 5.2
- 73 -
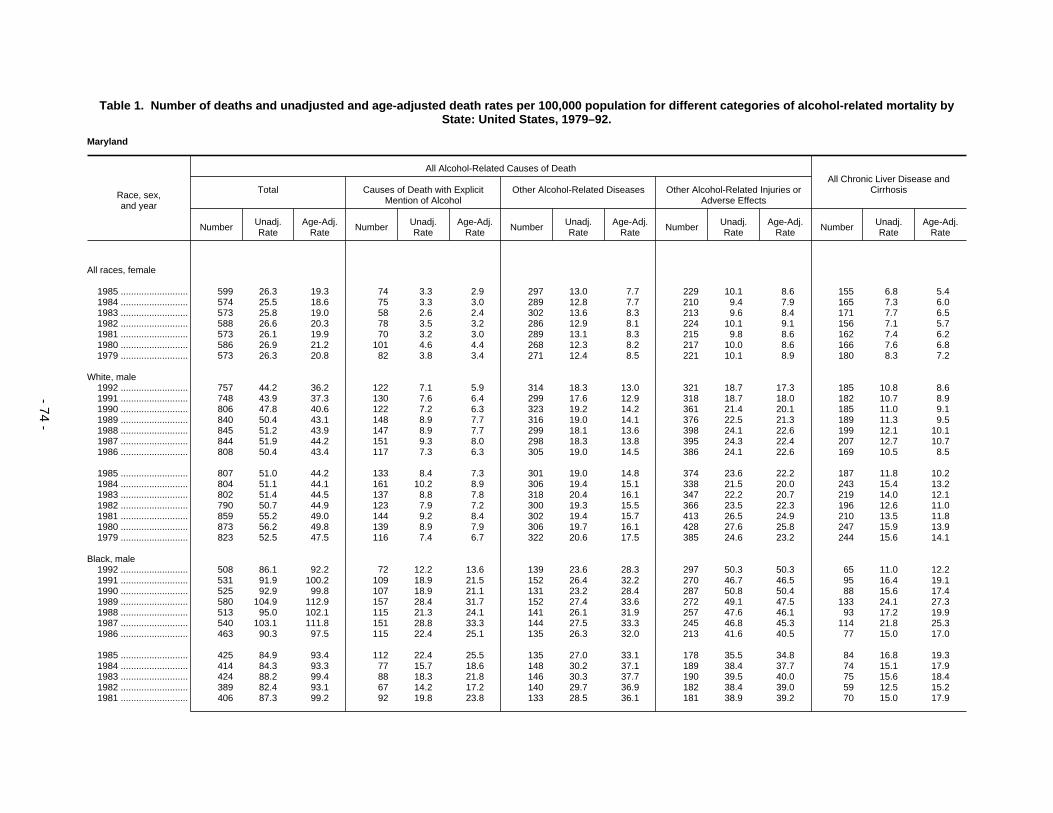
Table 1. Number of deaths and unadjusted and age-adjusted death rates per 100,000 population for different categories of alcohol-related mortality byState: United States, 1979–92.
Maryland
Race, sex,and year
All Alcohol-Related Causes of DeathAll Chronic Liver Disease and
CirrhosisTotal Causes of Death with ExplicitMention of Alcohol
Other Alcohol-Related Diseases Other Alcohol-Related Injuries orAdverse Effects
Number Unadj.Rate
Age-Adj.Rate Number Unadj.
RateAge-Adj.
Rate Number Unadj.Rate
Age-Adj.Rate Number Unadj.
RateAge-Adj.
Rate Number Unadj.Rate
Age-Adj.Rate
All races, female
1985 .......................... 599 26.3 19.3 74 3.3 2.9 297 13.0 7.7 229 10.1 8.6 155 6.8 5.41984 .......................... 574 25.5 18.6 75 3.3 3.0 289 12.8 7.7 210 9.4 7.9 165 7.3 6.01983 .......................... 573 25.8 19.0 58 2.6 2.4 302 13.6 8.3 213 9.6 8.4 171 7.7 6.51982 .......................... 588 26.6 20.3 78 3.5 3.2 286 12.9 8.1 224 10.1 9.1 156 7.1 5.71981 .......................... 573 26.1 19.9 70 3.2 3.0 289 13.1 8.3 215 9.8 8.6 162 7.4 6.21980 .......................... 586 26.9 21.2 101 4.6 4.4 268 12.3 8.2 217 10.0 8.6 166 7.6 6.81979 .......................... 573 26.3 20.8 82 3.8 3.4 271 12.4 8.5 221 10.1 8.9 180 8.3 7.2
White, male1992 .......................... 757 44.2 36.2 122 7.1 5.9 314 18.3 13.0 321 18.7 17.3 185 10.8 8.61991 .......................... 748 43.9 37.3 130 7.6 6.4 299 17.6 12.9 318 18.7 18.0 182 10.7 8.91990 .......................... 806 47.8 40.6 122 7.2 6.3 323 19.2 14.2 361 21.4 20.1 185 11.0 9.11989 .......................... 840 50.4 43.1 148 8.9 7.7 316 19.0 14.1 376 22.5 21.3 189 11.3 9.51988 .......................... 845 51.2 43.9 147 8.9 7.7 299 18.1 13.6 398 24.1 22.6 199 12.1 10.11987 .......................... 844 51.9 44.2 151 9.3 8.0 298 18.3 13.8 395 24.3 22.4 207 12.7 10.71986 .......................... 808 50.4 43.4 117 7.3 6.3 305 19.0 14.5 386 24.1 22.6 169 10.5 8.5
1985 .......................... 807 51.0 44.2 133 8.4 7.3 301 19.0 14.8 374 23.6 22.2 187 11.8 10.21984 .......................... 804 51.1 44.1 161 10.2 8.9 306 19.4 15.1 338 21.5 20.0 243 15.4 13.21983 .......................... 802 51.4 44.5 137 8.8 7.8 318 20.4 16.1 347 22.2 20.7 219 14.0 12.11982 .......................... 790 50.7 44.9 123 7.9 7.2 300 19.3 15.5 366 23.5 22.3 196 12.6 11.01981 .......................... 859 55.2 49.0 144 9.2 8.4 302 19.4 15.7 413 26.5 24.9 210 13.5 11.81980 .......................... 873 56.2 49.8 139 8.9 7.9 306 19.7 16.1 428 27.6 25.8 247 15.9 13.91979 .......................... 823 52.5 47.5 116 7.4 6.7 322 20.6 17.5 385 24.6 23.2 244 15.6 14.1
Black, male1992 .......................... 508 86.1 92.2 72 12.2 13.6 139 23.6 28.3 297 50.3 50.3 65 11.0 12.21991 .......................... 531 91.9 100.2 109 18.9 21.5 152 26.4 32.2 270 46.7 46.5 95 16.4 19.11990 .......................... 525 92.9 99.8 107 18.9 21.1 131 23.2 28.4 287 50.8 50.4 88 15.6 17.41989 .......................... 580 104.9 112.9 157 28.4 31.7 152 27.4 33.6 272 49.1 47.5 133 24.1 27.31988 .......................... 513 95.0 102.1 115 21.3 24.1 141 26.1 31.9 257 47.6 46.1 93 17.2 19.91987 .......................... 540 103.1 111.8 151 28.8 33.3 144 27.5 33.3 245 46.8 45.3 114 21.8 25.31986 .......................... 463 90.3 97.5 115 22.4 25.1 135 26.3 32.0 213 41.6 40.5 77 15.0 17.0
1985 .......................... 425 84.9 93.4 112 22.4 25.5 135 27.0 33.1 178 35.5 34.8 84 16.8 19.31984 .......................... 414 84.3 93.3 77 15.7 18.6 148 30.2 37.1 189 38.4 37.7 74 15.1 17.91983 .......................... 424 88.2 99.4 88 18.3 21.8 146 30.3 37.7 190 39.5 40.0 75 15.6 18.41982 .......................... 389 82.4 93.1 67 14.2 17.2 140 29.7 36.9 182 38.4 39.0 59 12.5 15.21981 .......................... 406 87.3 99.2 92 19.8 23.8 133 28.5 36.1 181 38.9 39.2 70 15.0 17.9
- 74 -

Table 1. Number of deaths and unadjusted and age-adjusted death rates per 100,000 population for different categories of alcohol-related mortality byState: United States, 1979–92.
Maryland
Race, sex,and year
All Alcohol-Related Causes of DeathAll Chronic Liver Disease and
CirrhosisTotal Causes of Death with ExplicitMention of Alcohol
Other Alcohol-Related Diseases Other Alcohol-Related Injuries orAdverse Effects
Number Unadj.Rate
Age-Adj.Rate Number Unadj.
RateAge-Adj.
Rate Number Unadj.Rate
Age-Adj.Rate Number Unadj.
RateAge-Adj.
Rate Number Unadj.Rate
Age-Adj.Rate
Black, male1980 .......................... 434 95.0 107.9 105 23.0 27.5 128 28.0 36.0 201 44.0 44.4 83 18.2 21.91979 .......................... 416 93.5 108.8 84 18.9 23.2 139 31.1 39.7 194 43.5 45.9 88 19.8 24.7
White, female1992 .......................... 441 24.7 15.3 54 3.0 2.4 230 12.9 6.0 156 8.8 6.9 117 6.6 4.31991 .......................... 423 23.9 14.3 39 2.2 1.7 236 13.3 5.9 148 8.3 6.6 101 5.7 4.01990 .......................... 425 24.2 14.6 54 3.1 2.4 228 13.0 5.8 143 8.1 6.4 92 5.2 3.71989 .......................... 450 25.9 16.2 46 2.6 2.1 233 13.4 6.1 171 9.8 8.0 90 5.2 3.71988 .......................... 445 25.8 16.0 37 2.1 1.8 245 14.2 6.5 163 9.5 7.7 111 6.4 4.31987 .......................... 466 27.4 17.7 42 2.5 2.0 239 14.0 6.7 185 10.9 8.9 115 6.8 4.61986 .......................... 438 26.1 16.5 47 2.8 2.2 226 13.5 6.3 165 9.8 8.0 96 5.7 4.2
1985 .......................... 436 26.3 17.2 44 2.7 2.2 224 13.5 6.6 168 10.2 8.4 113 6.8 4.71984 .......................... 417 25.3 16.2 44 2.7 2.1 218 13.3 6.5 155 9.4 7.5 114 6.9 5.01983 .......................... 427 26.1 17.1 45 2.7 2.3 228 13.9 7.0 154 9.4 7.8 115 7.0 5.31982 .......................... 420 25.7 17.3 50 3.1 2.4 210 12.8 6.6 160 9.8 8.3 111 6.8 4.81981 .......................... 431 26.3 18.2 50 3.1 2.6 220 13.4 7.2 161 9.9 8.4 115 7.0 5.41980 .......................... 429 26.3 18.5 58 3.6 3.1 206 12.6 7.1 165 10.1 8.4 119 7.3 5.81979 .......................... 421 25.6 18.1 50 3.0 2.5 205 12.4 7.2 166 10.1 8.4 134 8.1 6.3
Black, female1992 .......................... 182 27.6 26.0 33 5.0 5.0 85 13.0 11.8 63 9.6 9.1 40 6.1 5.81991 .......................... 180 27.8 26.5 41 6.3 6.1 77 11.8 10.9 62 9.6 9.5 52 8.0 7.91990 .......................... 176 27.7 26.4 33 5.2 5.3 76 12.0 11.1 67 10.5 9.9 38 6.0 6.01989 .......................... 217 34.9 33.7 45 7.3 7.8 87 14.0 13.2 85 13.6 12.7 61 9.8 10.21988 .......................... 174 28.7 27.8 40 6.6 7.0 69 11.4 10.7 65 10.7 10.1 50 8.3 8.41987 .......................... 182 31.1 30.0 47 8.0 8.3 67 11.5 10.8 68 11.6 10.9 57 9.7 10.11986 .......................... 164 28.6 27.8 30 5.2 5.4 74 12.9 12.6 60 10.5 9.8 45 7.9 8.4
1985 .......................... 157 28.1 27.7 30 5.4 5.8 70 12.5 12.5 57 10.2 9.5 40 7.2 7.71984 .......................... 153 27.8 28.5 31 5.7 6.3 69 12.6 12.7 53 9.6 9.4 51 9.3 10.01983 .......................... 142 26.5 26.8 13 2.4 2.7 72 13.5 13.9 57 10.6 10.2 55 10.3 10.81982 .......................... 164 31.1 32.2 28 5.3 5.8 74 14.0 14.6 62 11.8 11.7 44 8.3 9.61981 .......................... 137 26.5 27.3 20 3.9 4.4 68 13.0 13.7 50 9.6 9.1 46 8.9 9.91980 .......................... 153 30.2 32.8 43 8.5 10.1 62 12.2 13.4 48 9.5 9.3 47 9.3 10.61979 .......................... 150 30.3 32.8 32 6.5 7.6 65 13.1 14.5 53 10.7 10.7 46 9.3 10.7
- 75 -
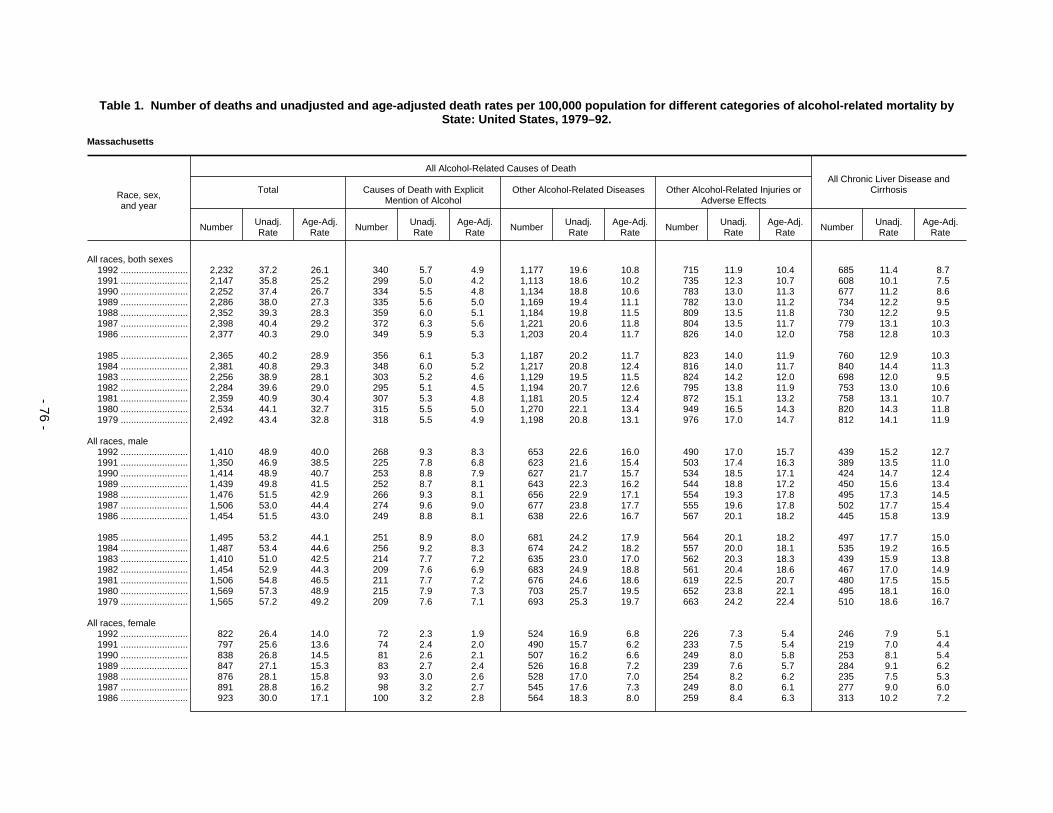
Table 1. Number of deaths and unadjusted and age-adjusted death rates per 100,000 population for different categories of alcohol-related mortality byState: United States, 1979–92.
Massachusetts
Race, sex,and year
All Alcohol-Related Causes of DeathAll Chronic Liver Disease and
CirrhosisTotal Causes of Death with ExplicitMention of Alcohol
Other Alcohol-Related Diseases Other Alcohol-Related Injuries orAdverse Effects
Number Unadj.Rate
Age-Adj.Rate Number Unadj.
RateAge-Adj.
Rate Number Unadj.Rate
Age-Adj.Rate Number Unadj.
RateAge-Adj.
Rate Number Unadj.Rate
Age-Adj.Rate
All races, both sexes1992 .......................... 2,232 37.2 26.1 340 5.7 4.9 1,177 19.6 10.8 715 11.9 10.4 685 11.4 8.71991 .......................... 2,147 35.8 25.2 299 5.0 4.2 1,113 18.6 10.2 735 12.3 10.7 608 10.1 7.51990 .......................... 2,252 37.4 26.7 334 5.5 4.8 1,134 18.8 10.6 783 13.0 11.3 677 11.2 8.61989 .......................... 2,286 38.0 27.3 335 5.6 5.0 1,169 19.4 11.1 782 13.0 11.2 734 12.2 9.51988 .......................... 2,352 39.3 28.3 359 6.0 5.1 1,184 19.8 11.5 809 13.5 11.8 730 12.2 9.51987 .......................... 2,398 40.4 29.2 372 6.3 5.6 1,221 20.6 11.8 804 13.5 11.7 779 13.1 10.31986 .......................... 2,377 40.3 29.0 349 5.9 5.3 1,203 20.4 11.7 826 14.0 12.0 758 12.8 10.3
1985 .......................... 2,365 40.2 28.9 356 6.1 5.3 1,187 20.2 11.7 823 14.0 11.9 760 12.9 10.31984 .......................... 2,381 40.8 29.3 348 6.0 5.2 1,217 20.8 12.4 816 14.0 11.7 840 14.4 11.31983 .......................... 2,256 38.9 28.1 303 5.2 4.6 1,129 19.5 11.5 824 14.2 12.0 698 12.0 9.51982 .......................... 2,284 39.6 29.0 295 5.1 4.5 1,194 20.7 12.6 795 13.8 11.9 753 13.0 10.61981 .......................... 2,359 40.9 30.4 307 5.3 4.8 1,181 20.5 12.4 872 15.1 13.2 758 13.1 10.71980 .......................... 2,534 44.1 32.7 315 5.5 5.0 1,270 22.1 13.4 949 16.5 14.3 820 14.3 11.81979 .......................... 2,492 43.4 32.8 318 5.5 4.9 1,198 20.8 13.1 976 17.0 14.7 812 14.1 11.9
All races, male1992 .......................... 1,410 48.9 40.0 268 9.3 8.3 653 22.6 16.0 490 17.0 15.7 439 15.2 12.71991 .......................... 1,350 46.9 38.5 225 7.8 6.8 623 21.6 15.4 503 17.4 16.3 389 13.5 11.01990 .......................... 1,414 48.9 40.7 253 8.8 7.9 627 21.7 15.7 534 18.5 17.1 424 14.7 12.41989 .......................... 1,439 49.8 41.5 252 8.7 8.1 643 22.3 16.2 544 18.8 17.2 450 15.6 13.41988 .......................... 1,476 51.5 42.9 266 9.3 8.1 656 22.9 17.1 554 19.3 17.8 495 17.3 14.51987 .......................... 1,506 53.0 44.4 274 9.6 9.0 677 23.8 17.7 555 19.6 17.8 502 17.7 15.41986 .......................... 1,454 51.5 43.0 249 8.8 8.1 638 22.6 16.7 567 20.1 18.2 445 15.8 13.9
1985 .......................... 1,495 53.2 44.1 251 8.9 8.0 681 24.2 17.9 564 20.1 18.2 497 17.7 15.01984 .......................... 1,487 53.4 44.6 256 9.2 8.3 674 24.2 18.2 557 20.0 18.1 535 19.2 16.51983 .......................... 1,410 51.0 42.5 214 7.7 7.2 635 23.0 17.0 562 20.3 18.3 439 15.9 13.81982 .......................... 1,454 52.9 44.3 209 7.6 6.9 683 24.9 18.8 561 20.4 18.6 467 17.0 14.91981 .......................... 1,506 54.8 46.5 211 7.7 7.2 676 24.6 18.6 619 22.5 20.7 480 17.5 15.51980 .......................... 1,569 57.3 48.9 215 7.9 7.3 703 25.7 19.5 652 23.8 22.1 495 18.1 16.01979 .......................... 1,565 57.2 49.2 209 7.6 7.1 693 25.3 19.7 663 24.2 22.4 510 18.6 16.7
All races, female1992 .......................... 822 26.4 14.0 72 2.3 1.9 524 16.9 6.8 226 7.3 5.4 246 7.9 5.11991 .......................... 797 25.6 13.6 74 2.4 2.0 490 15.7 6.2 233 7.5 5.4 219 7.0 4.41990 .......................... 838 26.8 14.5 81 2.6 2.1 507 16.2 6.6 249 8.0 5.8 253 8.1 5.41989 .......................... 847 27.1 15.3 83 2.7 2.4 526 16.8 7.2 239 7.6 5.7 284 9.1 6.21988 .......................... 876 28.1 15.8 93 3.0 2.6 528 17.0 7.0 254 8.2 6.2 235 7.5 5.31987 .......................... 891 28.8 16.2 98 3.2 2.7 545 17.6 7.3 249 8.0 6.1 277 9.0 6.01986 .......................... 923 30.0 17.1 100 3.2 2.8 564 18.3 8.0 259 8.4 6.3 313 10.2 7.2
- 76 -

Table 1. Number of deaths and unadjusted and age-adjusted death rates per 100,000 population for different categories of alcohol-related mortality byState: United States, 1979–92.
Massachusetts
Race, sex,and year
All Alcohol-Related Causes of DeathAll Chronic Liver Disease and
CirrhosisTotal Causes of Death with ExplicitMention of Alcohol
Other Alcohol-Related Diseases Other Alcohol-Related Injuries orAdverse Effects
Number Unadj.Rate
Age-Adj.Rate Number Unadj.
RateAge-Adj.
Rate Number Unadj.Rate
Age-Adj.Rate Number Unadj.
RateAge-Adj.
Rate Number Unadj.Rate
Age-Adj.Rate
All races, female
1985 .......................... 870 28.3 16.1 105 3.4 3.0 506 16.5 7.0 259 8.4 6.1 263 8.6 6.41984 .......................... 894 29.3 16.3 92 3.0 2.6 543 17.8 7.9 260 8.5 5.8 305 10.0 7.01983 .......................... 846 27.9 16.2 89 2.9 2.5 495 16.3 7.3 262 8.6 6.4 259 8.5 6.01982 .......................... 830 27.5 16.1 86 2.8 2.5 510 16.9 7.9 234 7.7 5.8 286 9.5 7.01981 .......................... 853 28.2 16.9 96 3.2 2.7 505 16.7 7.8 253 8.4 6.4 278 9.2 6.81980 .......................... 965 32.0 19.0 100 3.3 3.0 567 18.8 8.8 297 9.9 7.2 325 10.8 8.41979 .......................... 927 30.8 18.9 109 3.6 3.2 505 16.8 8.2 313 10.4 7.5 302 10.0 8.0
White, male1992 .......................... 1,315 50.0 39.3 261 9.9 8.6 619 23.5 15.8 435 16.6 14.9 423 16.1 13.01991 .......................... 1,227 46.5 36.6 210 8.0 6.7 592 22.4 15.2 425 16.1 14.7 367 13.9 11.01990 .......................... 1,294 48.8 39.1 240 9.0 8.0 598 22.6 15.6 456 17.2 15.5 409 15.4 12.61989 .......................... 1,324 49.9 40.1 229 8.6 7.7 610 23.0 15.9 485 18.3 16.4 431 16.2 13.51988 .......................... 1,359 51.4 41.5 249 9.4 8.0 621 23.5 16.7 489 18.5 16.8 478 18.1 14.71987 .......................... 1,400 53.2 43.3 255 9.7 8.8 638 24.3 17.1 507 19.3 17.4 477 18.1 15.31986 .......................... 1,352 51.6 41.9 233 8.9 8.0 606 23.1 16.3 514 19.6 17.6 417 15.9 13.6
1985 .......................... 1,400 53.5 43.2 236 9.0 8.0 651 24.9 17.6 513 19.6 17.6 480 18.3 15.11984 .......................... 1,390 53.4 43.4 233 8.9 7.8 642 24.6 17.8 516 19.8 17.9 507 19.5 16.11983 .......................... 1,326 51.2 41.6 202 7.8 7.1 604 23.3 16.6 520 20.1 17.9 424 16.4 13.81982 .......................... 1,369 52.9 43.4 202 7.8 6.9 651 25.2 18.4 516 20.0 18.0 453 17.5 15.01981 .......................... 1,415 54.6 45.3 199 7.7 7.0 648 25.0 18.3 568 21.9 20.0 456 17.6 15.21980 .......................... 1,477 57.0 47.8 203 7.8 7.2 667 25.8 19.0 607 23.4 21.6 467 18.0 15.61979 .......................... 1,485 57.1 48.2 196 7.5 6.8 664 25.6 19.3 624 24.0 22.1 495 19.1 16.7
Black, male1992 .......................... 80 48.3 57.2 6 3.6 5.2 26 15.6 22.4 48 29.1 29.6 14 8.4 11.11991 .......................... 102 63.1 71.3 11 6.8 8.6 26 15.9 23.0 65 40.5 39.8 15 9.3 12.01990 .......................... 104 65.6 72.9 12 7.6 8.4 24 15.3 22.7 67 42.6 41.8 14 8.8 12.31989 .......................... 100 64.5 76.5 23 14.8 20.0 26 16.5 24.2 52 33.2 32.3 19 12.2 15.81988 .......................... 106 70.6 79.9 17 11.3 13.3 31 20.8 30.0 58 38.5 36.6 16 10.6 13.91987 .......................... 91 62.2 74.8 17 11.6 14.8 31 21.4 30.9 43 29.1 29.0 20 13.7 18.21986 .......................... 93 65.8 77.4 16 11.3 14.7 29 20.3 28.7 48 34.1 34.0 26 18.3 24.4
1985 .......................... 85 61.7 70.7 15 10.9 12.8 26 18.8 26.4 44 32.0 31.5 16 11.6 15.51984 .......................... 88 66.2 82.0 22 16.6 22.1 30 22.4 32.9 36 27.2 27.0 27 20.4 28.41983 .......................... 75 58.5 70.1 11 8.6 11.8 27 21.4 29.7 37 28.5 28.5 13 10.1 13.61982 .......................... 76 61.4 73.1 7 5.7 6.9 28 22.7 32.1 41 33.0 34.1 13 10.6 14.91981 .......................... 84 70.5 82.0 11 9.2 12.2 24 19.7 27.1 50 41.6 42.7 23 19.2 26.1
- 77 -
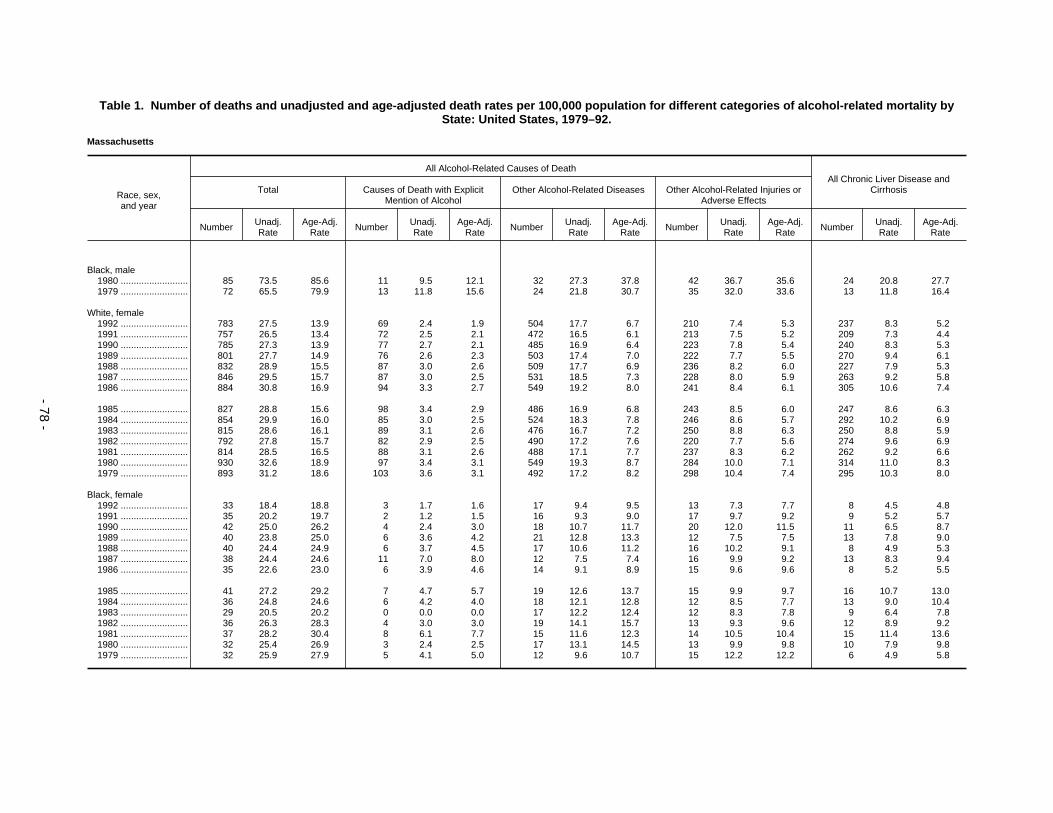
Table 1. Number of deaths and unadjusted and age-adjusted death rates per 100,000 population for different categories of alcohol-related mortality byState: United States, 1979–92.
Massachusetts
Race, sex,and year
All Alcohol-Related Causes of DeathAll Chronic Liver Disease and
CirrhosisTotal Causes of Death with ExplicitMention of Alcohol
Other Alcohol-Related Diseases Other Alcohol-Related Injuries orAdverse Effects
Number Unadj.Rate
Age-Adj.Rate Number Unadj.
RateAge-Adj.
Rate Number Unadj.Rate
Age-Adj.Rate Number Unadj.
RateAge-Adj.
Rate Number Unadj.Rate
Age-Adj.Rate
Black, male1980 .......................... 85 73.5 85.6 11 9.5 12.1 32 27.3 37.8 42 36.7 35.6 24 20.8 27.71979 .......................... 72 65.5 79.9 13 11.8 15.6 24 21.8 30.7 35 32.0 33.6 13 11.8 16.4
White, female1992 .......................... 783 27.5 13.9 69 2.4 1.9 504 17.7 6.7 210 7.4 5.3 237 8.3 5.21991 .......................... 757 26.5 13.4 72 2.5 2.1 472 16.5 6.1 213 7.5 5.2 209 7.3 4.41990 .......................... 785 27.3 13.9 77 2.7 2.1 485 16.9 6.4 223 7.8 5.4 240 8.3 5.31989 .......................... 801 27.7 14.9 76 2.6 2.3 503 17.4 7.0 222 7.7 5.5 270 9.4 6.11988 .......................... 832 28.9 15.5 87 3.0 2.6 509 17.7 6.9 236 8.2 6.0 227 7.9 5.31987 .......................... 846 29.5 15.7 87 3.0 2.5 531 18.5 7.3 228 8.0 5.9 263 9.2 5.81986 .......................... 884 30.8 16.9 94 3.3 2.7 549 19.2 8.0 241 8.4 6.1 305 10.6 7.4
1985 .......................... 827 28.8 15.6 98 3.4 2.9 486 16.9 6.8 243 8.5 6.0 247 8.6 6.31984 .......................... 854 29.9 16.0 85 3.0 2.5 524 18.3 7.8 246 8.6 5.7 292 10.2 6.91983 .......................... 815 28.6 16.1 89 3.1 2.6 476 16.7 7.2 250 8.8 6.3 250 8.8 5.91982 .......................... 792 27.8 15.7 82 2.9 2.5 490 17.2 7.6 220 7.7 5.6 274 9.6 6.91981 .......................... 814 28.5 16.5 88 3.1 2.6 488 17.1 7.7 237 8.3 6.2 262 9.2 6.61980 .......................... 930 32.6 18.9 97 3.4 3.1 549 19.3 8.7 284 10.0 7.1 314 11.0 8.31979 .......................... 893 31.2 18.6 103 3.6 3.1 492 17.2 8.2 298 10.4 7.4 295 10.3 8.0
Black, female1992 .......................... 33 18.4 18.8 3 1.7 1.6 17 9.4 9.5 13 7.3 7.7 8 4.5 4.81991 .......................... 35 20.2 19.7 2 1.2 1.5 16 9.3 9.0 17 9.7 9.2 9 5.2 5.71990 .......................... 42 25.0 26.2 4 2.4 3.0 18 10.7 11.7 20 12.0 11.5 11 6.5 8.71989 .......................... 40 23.8 25.0 6 3.6 4.2 21 12.8 13.3 12 7.5 7.5 13 7.8 9.01988 .......................... 40 24.4 24.9 6 3.7 4.5 17 10.6 11.2 16 10.2 9.1 8 4.9 5.31987 .......................... 38 24.4 24.6 11 7.0 8.0 12 7.5 7.4 16 9.9 9.2 13 8.3 9.41986 .......................... 35 22.6 23.0 6 3.9 4.6 14 9.1 8.9 15 9.6 9.6 8 5.2 5.5
1985 .......................... 41 27.2 29.2 7 4.7 5.7 19 12.6 13.7 15 9.9 9.7 16 10.7 13.01984 .......................... 36 24.8 24.6 6 4.2 4.0 18 12.1 12.8 12 8.5 7.7 13 9.0 10.41983 .......................... 29 20.5 20.2 0 0.0 0.0 17 12.2 12.4 12 8.3 7.8 9 6.4 7.81982 .......................... 36 26.3 28.3 4 3.0 3.0 19 14.1 15.7 13 9.3 9.6 12 8.9 9.21981 .......................... 37 28.2 30.4 8 6.1 7.7 15 11.6 12.3 14 10.5 10.4 15 11.4 13.61980 .......................... 32 25.4 26.9 3 2.4 2.5 17 13.1 14.5 13 9.9 9.8 10 7.9 9.81979 .......................... 32 25.9 27.9 5 4.1 5.0 12 9.6 10.7 15 12.2 12.2 6 4.9 5.8
- 78 -

Table 1. Number of deaths and unadjusted and age-adjusted death rates per 100,000 population for different categories of alcohol-related mortality byState: United States, 1979–92.
Michigan
Race, sex,and year
All Alcohol-Related Causes of DeathAll Chronic Liver Disease and
CirrhosisTotal Causes of Death with ExplicitMention of Alcohol
Other Alcohol-Related Diseases Other Alcohol-Related Injuries orAdverse Effects
Number Unadj.Rate
Age-Adj.Rate Number Unadj.
RateAge-Adj.
Rate Number Unadj.Rate
Age-Adj.Rate Number Unadj.
RateAge-Adj.
Rate Number Unadj.Rate
Age-Adj.Rate
All races, both sexes1992 .......................... 3,974 42.1 34.1 695 7.4 6.6 1,567 16.6 10.4 1,712 18.1 17.1 959 10.2 8.51991 .......................... 4,146 44.2 36.1 793 8.5 7.6 1,550 16.5 10.5 1,803 19.2 18.1 1,067 11.4 9.51990 .......................... 4,216 45.3 37.4 813 8.7 8.0 1,587 17.0 11.1 1,816 19.5 18.3 1,129 12.1 10.31989 .......................... 4,248 45.9 38.1 861 9.3 8.5 1,543 16.7 10.8 1,844 19.9 18.8 1,176 12.7 10.81988 .......................... 4,107 44.6 37.1 719 7.8 7.2 1,547 16.8 11.1 1,841 20.0 18.8 1,087 11.8 10.31987 .......................... 4,044 44.0 37.2 686 7.5 7.0 1,507 16.4 11.1 1,852 20.2 19.1 1,103 12.0 10.41986 .......................... 4,127 45.2 37.9 699 7.7 7.1 1,567 17.2 11.7 1,862 20.4 19.2 1,127 12.3 10.8
1985 .......................... 4,186 46.1 39.2 792 8.7 8.3 1,546 17.0 11.6 1,848 20.4 19.2 1,268 14.0 12.41984 .......................... 4,012 44.3 37.6 712 7.9 7.5 1,543 17.0 11.8 1,757 19.4 18.2 1,205 13.3 12.01983 .......................... 3,971 43.9 37.7 701 7.7 7.5 1,571 17.4 12.4 1,699 18.8 17.7 1,261 13.9 12.71982 .......................... 3,970 43.6 37.7 657 7.2 7.0 1,578 17.3 12.6 1,735 19.0 18.1 1,251 13.7 12.61981 .......................... 4,007 43.5 38.0 551 6.0 5.9 1,611 17.5 12.9 1,845 20.0 19.1 1,260 13.7 12.81980 .......................... 4,213 45.5 40.3 661 7.1 7.1 1,608 17.4 13.1 1,944 21.0 20.1 1,374 14.8 14.21979 .......................... 4,181 45.2 40.4 623 6.7 6.7 1,569 17.0 13.1 1,988 21.5 20.5 1,376 14.9 14.3
All races, male1992 .......................... 2,641 57.6 51.2 515 11.2 10.2 901 19.6 14.9 1,225 26.7 26.1 629 13.7 12.11991 .......................... 2,755 60.5 54.1 601 13.2 12.0 884 19.4 14.9 1,270 27.9 27.2 711 15.6 13.81990 .......................... 2,805 62.0 56.0 598 13.2 12.4 904 20.0 15.6 1,302 28.8 28.0 716 15.8 14.41989 .......................... 2,810 62.6 56.7 645 14.4 13.5 868 19.3 15.2 1,297 28.9 28.0 786 17.5 15.81988 .......................... 2,767 61.8 56.0 545 12.2 11.5 902 20.2 16.1 1,320 29.5 28.4 721 16.1 14.91987 .......................... 2,707 60.7 55.3 519 11.6 11.1 863 19.3 15.6 1,325 29.7 28.7 738 16.5 15.21986 .......................... 2,800 63.2 57.5 541 12.2 11.5 920 20.7 16.9 1,339 30.2 29.0 768 17.3 16.0
1985 .......................... 2,840 64.4 59.2 616 14.0 13.5 885 20.1 16.3 1,339 30.4 29.4 832 18.9 17.71984 .......................... 2,662 60.5 55.6 499 11.3 11.1 900 20.5 16.8 1,263 28.7 27.7 778 17.7 16.81983 .......................... 2,708 61.5 57.4 536 12.2 12.2 929 21.1 17.8 1,243 28.2 27.4 857 19.5 18.91982 .......................... 2,650 59.7 55.8 487 11.0 10.9 924 20.8 17.8 1,238 27.9 27.2 816 18.4 17.81981 .......................... 2,686 59.9 56.3 398 8.9 9.0 957 21.3 18.3 1,331 29.7 29.0 826 18.4 18.11980 .......................... 2,814 62.4 59.3 487 10.8 11.0 949 21.0 18.5 1,378 30.5 29.9 907 20.1 20.01979 .......................... 2,826 62.6 60.1 471 10.4 10.6 948 21.0 18.8 1,406 31.2 30.6 955 21.2 21.3
All races, female1992 .......................... 1,332 27.5 18.6 180 3.7 3.3 666 13.7 6.7 486 10.0 8.6 330 6.8 5.21991 .......................... 1,392 28.9 20.0 192 4.0 3.6 666 13.8 7.0 533 11.1 9.4 356 7.4 5.81990 .......................... 1,411 29.5 20.6 215 4.5 4.1 683 14.3 7.3 513 10.7 9.2 413 8.6 6.71989 .......................... 1,437 30.2 21.3 216 4.5 4.1 674 14.2 7.2 547 11.5 10.0 390 8.2 6.31988 .......................... 1,340 28.2 20.2 174 3.7 3.3 645 13.6 7.1 521 11.0 9.8 366 7.7 6.21987 .......................... 1,337 28.3 20.8 167 3.5 3.3 644 13.6 7.4 527 11.1 10.1 365 7.7 6.31986 .......................... 1,327 28.3 20.4 158 3.4 3.2 647 13.8 7.4 522 11.1 9.8 359 7.6 6.2
- 79 -
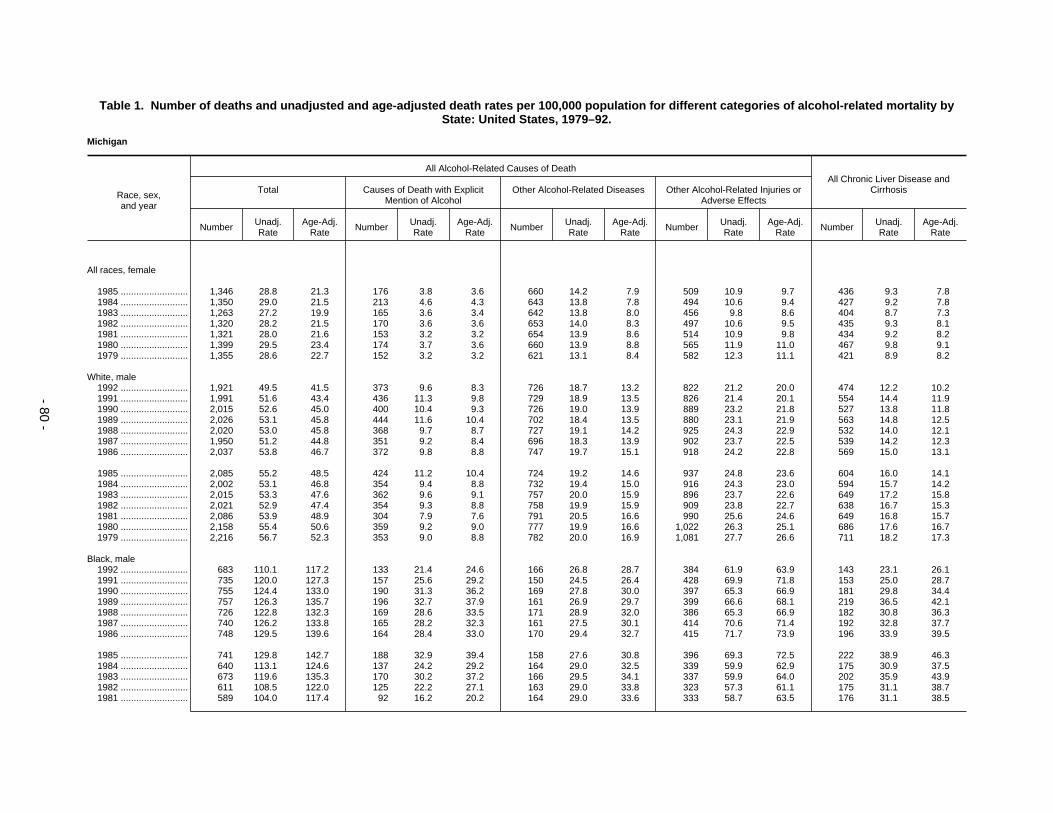
Table 1. Number of deaths and unadjusted and age-adjusted death rates per 100,000 population for different categories of alcohol-related mortality byState: United States, 1979–92.
Michigan
Race, sex,and year
All Alcohol-Related Causes of DeathAll Chronic Liver Disease and
CirrhosisTotal Causes of Death with ExplicitMention of Alcohol
Other Alcohol-Related Diseases Other Alcohol-Related Injuries orAdverse Effects
Number Unadj.Rate
Age-Adj.Rate Number Unadj.
RateAge-Adj.
Rate Number Unadj.Rate
Age-Adj.Rate Number Unadj.
RateAge-Adj.
Rate Number Unadj.Rate
Age-Adj.Rate
All races, female
1985 .......................... 1,346 28.8 21.3 176 3.8 3.6 660 14.2 7.9 509 10.9 9.7 436 9.3 7.81984 .......................... 1,350 29.0 21.5 213 4.6 4.3 643 13.8 7.8 494 10.6 9.4 427 9.2 7.81983 .......................... 1,263 27.2 19.9 165 3.6 3.4 642 13.8 8.0 456 9.8 8.6 404 8.7 7.31982 .......................... 1,320 28.2 21.5 170 3.6 3.6 653 14.0 8.3 497 10.6 9.5 435 9.3 8.11981 .......................... 1,321 28.0 21.6 153 3.2 3.2 654 13.9 8.6 514 10.9 9.8 434 9.2 8.21980 .......................... 1,399 29.5 23.4 174 3.7 3.6 660 13.9 8.8 565 11.9 11.0 467 9.8 9.11979 .......................... 1,355 28.6 22.7 152 3.2 3.2 621 13.1 8.4 582 12.3 11.1 421 8.9 8.2
White, male1992 .......................... 1,921 49.5 41.5 373 9.6 8.3 726 18.7 13.2 822 21.2 20.0 474 12.2 10.21991 .......................... 1,991 51.6 43.4 436 11.3 9.8 729 18.9 13.5 826 21.4 20.1 554 14.4 11.91990 .......................... 2,015 52.6 45.0 400 10.4 9.3 726 19.0 13.9 889 23.2 21.8 527 13.8 11.81989 .......................... 2,026 53.1 45.8 444 11.6 10.4 702 18.4 13.5 880 23.1 21.9 563 14.8 12.51988 .......................... 2,020 53.0 45.8 368 9.7 8.7 727 19.1 14.2 925 24.3 22.9 532 14.0 12.11987 .......................... 1,950 51.2 44.8 351 9.2 8.4 696 18.3 13.9 902 23.7 22.5 539 14.2 12.31986 .......................... 2,037 53.8 46.7 372 9.8 8.8 747 19.7 15.1 918 24.2 22.8 569 15.0 13.1
1985 .......................... 2,085 55.2 48.5 424 11.2 10.4 724 19.2 14.6 937 24.8 23.6 604 16.0 14.11984 .......................... 2,002 53.1 46.8 354 9.4 8.8 732 19.4 15.0 916 24.3 23.0 594 15.7 14.21983 .......................... 2,015 53.3 47.6 362 9.6 9.1 757 20.0 15.9 896 23.7 22.6 649 17.2 15.81982 .......................... 2,021 52.9 47.4 354 9.3 8.8 758 19.9 15.9 909 23.8 22.7 638 16.7 15.31981 .......................... 2,086 53.9 48.9 304 7.9 7.6 791 20.5 16.6 990 25.6 24.6 649 16.8 15.71980 .......................... 2,158 55.4 50.6 359 9.2 9.0 777 19.9 16.6 1,022 26.3 25.1 686 17.6 16.71979 .......................... 2,216 56.7 52.3 353 9.0 8.8 782 20.0 16.9 1,081 27.7 26.6 711 18.2 17.3
Black, male1992 .......................... 683 110.1 117.2 133 21.4 24.6 166 26.8 28.7 384 61.9 63.9 143 23.1 26.11991 .......................... 735 120.0 127.3 157 25.6 29.2 150 24.5 26.4 428 69.9 71.8 153 25.0 28.71990 .......................... 755 124.4 133.0 190 31.3 36.2 169 27.8 30.0 397 65.3 66.9 181 29.8 34.41989 .......................... 757 126.3 135.7 196 32.7 37.9 161 26.9 29.7 399 66.6 68.1 219 36.5 42.11988 .......................... 726 122.8 132.3 169 28.6 33.5 171 28.9 32.0 386 65.3 66.9 182 30.8 36.31987 .......................... 740 126.2 133.8 165 28.2 32.3 161 27.5 30.1 414 70.6 71.4 192 32.8 37.71986 .......................... 748 129.5 139.6 164 28.4 33.0 170 29.4 32.7 415 71.7 73.9 196 33.9 39.5
1985 .......................... 741 129.8 142.7 188 32.9 39.4 158 27.6 30.8 396 69.3 72.5 222 38.9 46.31984 .......................... 640 113.1 124.6 137 24.2 29.2 164 29.0 32.5 339 59.9 62.9 175 30.9 37.51983 .......................... 673 119.6 135.3 170 30.2 37.2 166 29.5 34.1 337 59.9 64.0 202 35.9 43.91982 .......................... 611 108.5 122.0 125 22.2 27.1 163 29.0 33.8 323 57.3 61.1 175 31.1 38.71981 .......................... 589 104.0 117.4 92 16.2 20.2 164 29.0 33.6 333 58.7 63.5 176 31.1 38.5
- 80 -
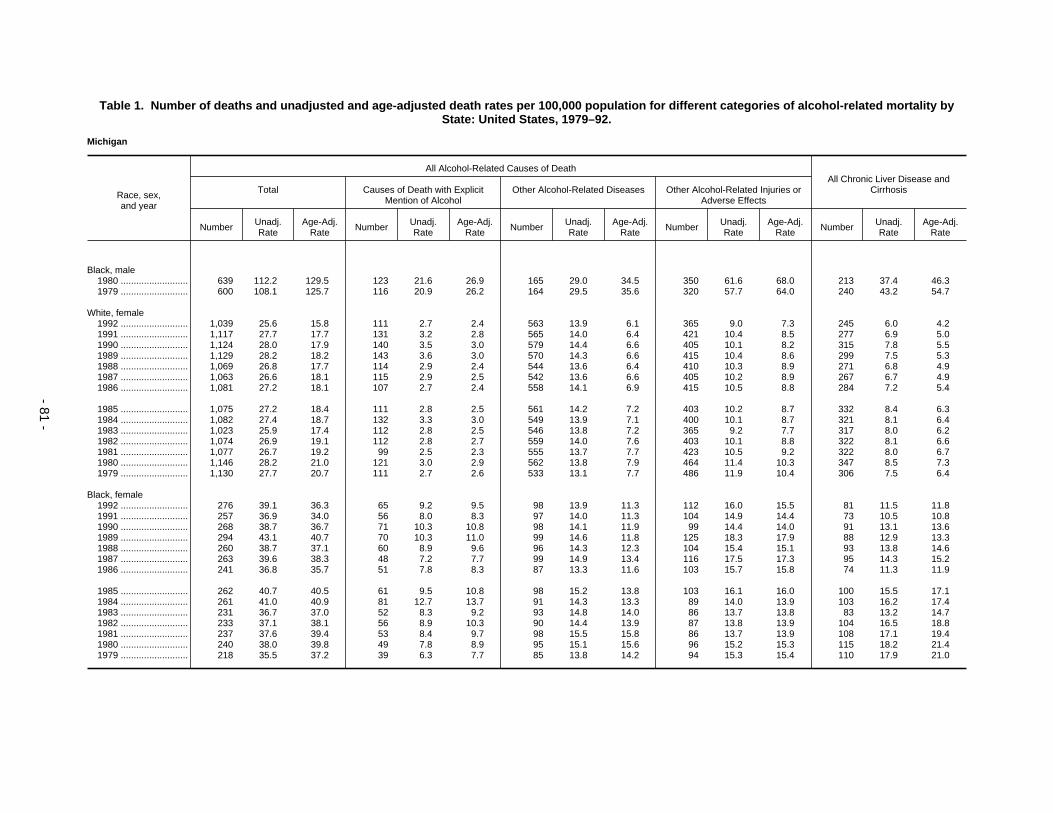
Table 1. Number of deaths and unadjusted and age-adjusted death rates per 100,000 population for different categories of alcohol-related mortality byState: United States, 1979–92.
Michigan
Race, sex,and year
All Alcohol-Related Causes of DeathAll Chronic Liver Disease and
CirrhosisTotal Causes of Death with ExplicitMention of Alcohol
Other Alcohol-Related Diseases Other Alcohol-Related Injuries orAdverse Effects
Number Unadj.Rate
Age-Adj.Rate Number Unadj.
RateAge-Adj.
Rate Number Unadj.Rate
Age-Adj.Rate Number Unadj.
RateAge-Adj.
Rate Number Unadj.Rate
Age-Adj.Rate
Black, male1980 .......................... 639 112.2 129.5 123 21.6 26.9 165 29.0 34.5 350 61.6 68.0 213 37.4 46.31979 .......................... 600 108.1 125.7 116 20.9 26.2 164 29.5 35.6 320 57.7 64.0 240 43.2 54.7
White, female1992 .......................... 1,039 25.6 15.8 111 2.7 2.4 563 13.9 6.1 365 9.0 7.3 245 6.0 4.21991 .......................... 1,117 27.7 17.7 131 3.2 2.8 565 14.0 6.4 421 10.4 8.5 277 6.9 5.01990 .......................... 1,124 28.0 17.9 140 3.5 3.0 579 14.4 6.6 405 10.1 8.2 315 7.8 5.51989 .......................... 1,129 28.2 18.2 143 3.6 3.0 570 14.3 6.6 415 10.4 8.6 299 7.5 5.31988 .......................... 1,069 26.8 17.7 114 2.9 2.4 544 13.6 6.4 410 10.3 8.9 271 6.8 4.91987 .......................... 1,063 26.6 18.1 115 2.9 2.5 542 13.6 6.6 405 10.2 8.9 267 6.7 4.91986 .......................... 1,081 27.2 18.1 107 2.7 2.4 558 14.1 6.9 415 10.5 8.8 284 7.2 5.4
1985 .......................... 1,075 27.2 18.4 111 2.8 2.5 561 14.2 7.2 403 10.2 8.7 332 8.4 6.31984 .......................... 1,082 27.4 18.7 132 3.3 3.0 549 13.9 7.1 400 10.1 8.7 321 8.1 6.41983 .......................... 1,023 25.9 17.4 112 2.8 2.5 546 13.8 7.2 365 9.2 7.7 317 8.0 6.21982 .......................... 1,074 26.9 19.1 112 2.8 2.7 559 14.0 7.6 403 10.1 8.8 322 8.1 6.61981 .......................... 1,077 26.7 19.2 99 2.5 2.3 555 13.7 7.7 423 10.5 9.2 322 8.0 6.71980 .......................... 1,146 28.2 21.0 121 3.0 2.9 562 13.8 7.9 464 11.4 10.3 347 8.5 7.31979 .......................... 1,130 27.7 20.7 111 2.7 2.6 533 13.1 7.7 486 11.9 10.4 306 7.5 6.4
Black, female1992 .......................... 276 39.1 36.3 65 9.2 9.5 98 13.9 11.3 112 16.0 15.5 81 11.5 11.81991 .......................... 257 36.9 34.0 56 8.0 8.3 97 14.0 11.3 104 14.9 14.4 73 10.5 10.81990 .......................... 268 38.7 36.7 71 10.3 10.8 98 14.1 11.9 99 14.4 14.0 91 13.1 13.61989 .......................... 294 43.1 40.7 70 10.3 11.0 99 14.6 11.8 125 18.3 17.9 88 12.9 13.31988 .......................... 260 38.7 37.1 60 8.9 9.6 96 14.3 12.3 104 15.4 15.1 93 13.8 14.61987 .......................... 263 39.6 38.3 48 7.2 7.7 99 14.9 13.4 116 17.5 17.3 95 14.3 15.21986 .......................... 241 36.8 35.7 51 7.8 8.3 87 13.3 11.6 103 15.7 15.8 74 11.3 11.9
1985 .......................... 262 40.7 40.5 61 9.5 10.8 98 15.2 13.8 103 16.1 16.0 100 15.5 17.11984 .......................... 261 41.0 40.9 81 12.7 13.7 91 14.3 13.3 89 14.0 13.9 103 16.2 17.41983 .......................... 231 36.7 37.0 52 8.3 9.2 93 14.8 14.0 86 13.7 13.8 83 13.2 14.71982 .......................... 233 37.1 38.1 56 8.9 10.3 90 14.4 13.9 87 13.8 13.9 104 16.5 18.81981 .......................... 237 37.6 39.4 53 8.4 9.7 98 15.5 15.8 86 13.7 13.9 108 17.1 19.41980 .......................... 240 38.0 39.8 49 7.8 8.9 95 15.1 15.6 96 15.2 15.3 115 18.2 21.41979 .......................... 218 35.5 37.2 39 6.3 7.7 85 13.8 14.2 94 15.3 15.4 110 17.9 21.0
- 81 -

Table 1. Number of deaths and unadjusted and age-adjusted death rates per 100,000 population for different categories of alcohol-related mortality byState: United States, 1979–92.
Minnesota
Race, sex,and year
All Alcohol-Related Causes of DeathAll Chronic Liver Disease and
CirrhosisTotal Causes of Death with ExplicitMention of Alcohol
Other Alcohol-Related Diseases Other Alcohol-Related Injuries orAdverse Effects
Number Unadj.Rate
Age-Adj.Rate Number Unadj.
RateAge-Adj.
Rate Number Unadj.Rate
Age-Adj.Rate Number Unadj.
RateAge-Adj.
Rate Number Unadj.Rate
Age-Adj.Rate
All races, both sexes1992 .......................... 1,618 36.2 26.8 294 6.6 6.0 664 14.9 8.1 660 14.8 12.7 313 7.0 5.81991 .......................... 1,616 36.5 26.8 292 6.6 5.9 674 15.2 8.2 650 14.7 12.7 295 6.7 5.41990 .......................... 1,612 36.8 27.4 291 6.6 6.0 656 15.0 8.0 665 15.2 13.5 296 6.7 5.41989 .......................... 1,580 36.4 27.0 261 6.0 5.4 646 14.9 8.0 673 15.5 13.6 309 7.1 5.71988 .......................... 1,548 36.0 27.0 240 5.6 5.0 660 15.4 8.4 648 15.1 13.6 297 6.9 5.81987 .......................... 1,491 35.2 25.8 256 6.0 5.4 605 14.3 7.5 630 14.9 12.9 314 7.4 6.11986 .......................... 1,560 37.1 27.6 235 5.6 5.1 676 16.1 8.9 649 15.4 13.7 306 7.3 6.0
1985 .......................... 1,592 38.1 28.3 288 6.9 6.3 683 16.3 8.9 622 14.9 13.1 334 8.0 6.81984 .......................... 1,550 37.3 28.3 255 6.1 5.9 675 16.2 9.4 621 14.9 13.0 379 9.1 8.01983 .......................... 1,474 35.6 26.4 232 5.6 5.2 634 15.3 8.5 608 14.7 12.7 337 8.1 7.11982 .......................... 1,498 36.3 27.6 218 5.3 4.9 656 15.9 9.3 625 15.1 13.5 335 8.1 7.11981 .......................... 1,628 39.6 30.7 251 6.1 5.8 658 16.0 9.3 719 17.5 15.6 378 9.2 8.11980 .......................... 1,644 40.2 31.6 231 5.7 5.5 649 15.9 9.4 764 18.7 16.7 338 8.3 7.41979 .......................... 1,608 39.8 31.3 206 5.1 4.9 630 15.6 9.3 773 19.1 17.0 322 8.0 7.2
All races, male1992 .......................... 986 44.9 38.1 205 9.3 8.5 354 16.1 11.4 427 19.5 18.2 193 8.8 7.71991 .......................... 1,010 46.5 39.3 207 9.5 8.8 362 16.7 11.5 441 20.3 18.9 175 8.1 6.91990 .......................... 1,012 47.0 40.1 215 10.0 9.2 343 15.9 11.0 454 21.1 19.9 180 8.4 7.31989 .......................... 988 46.5 39.3 188 8.8 8.1 351 16.5 11.5 449 21.1 19.7 183 8.6 7.51988 .......................... 959 45.5 38.9 181 8.6 8.0 345 16.4 11.5 432 20.5 19.5 179 8.5 7.61987 .......................... 926 44.6 37.1 196 9.5 8.6 318 15.3 10.4 411 19.8 18.1 192 9.3 8.01986 .......................... 977 47.5 40.0 165 8.0 7.3 367 17.8 12.5 445 21.6 20.1 182 8.8 7.8
1985 .......................... 1,009 49.3 41.9 219 10.7 10.1 367 17.9 12.6 423 20.7 19.2 213 10.4 9.61984 .......................... 992 48.7 41.6 182 8.9 8.7 378 18.6 13.5 432 21.2 19.5 231 11.4 10.51983 .......................... 922 45.5 38.3 165 8.1 7.7 348 17.2 12.1 408 20.1 18.5 199 9.8 9.11982 .......................... 971 48.0 41.2 173 8.6 8.2 366 18.1 13.2 432 21.4 19.8 232 11.5 10.61981 .......................... 1,059 52.6 45.8 186 9.2 8.9 371 18.4 13.5 502 24.9 23.4 242 12.0 11.41980 .......................... 1,061 53.0 46.3 173 8.6 8.5 361 18.0 13.2 527 26.3 24.6 221 11.0 10.51979 .......................... 1,040 52.5 45.6 145 7.3 7.1 351 17.7 13.0 544 27.5 25.4 212 10.7 10.1
All races, female1992 .......................... 631 27.8 16.4 89 3.9 3.7 310 13.6 5.2 233 10.2 7.4 120 5.3 4.11991 .......................... 606 26.9 15.3 85 3.8 3.3 312 13.8 5.4 209 9.3 6.7 120 5.3 4.11990 .......................... 601 26.9 15.9 76 3.4 3.1 313 14.0 5.5 212 9.5 7.2 116 5.2 3.81989 .......................... 592 26.7 15.8 73 3.3 2.9 295 13.3 5.1 224 10.1 7.8 126 5.7 4.21988 .......................... 589 26.9 16.2 59 2.7 2.4 314 14.3 6.0 216 9.9 7.9 118 5.4 4.31987 .......................... 566 26.2 15.6 60 2.8 2.5 287 13.3 5.2 218 10.1 7.9 122 5.6 4.41986 .......................... 583 27.2 16.6 70 3.3 3.1 309 14.4 6.0 204 9.5 7.5 124 5.8 4.4
- 82 -
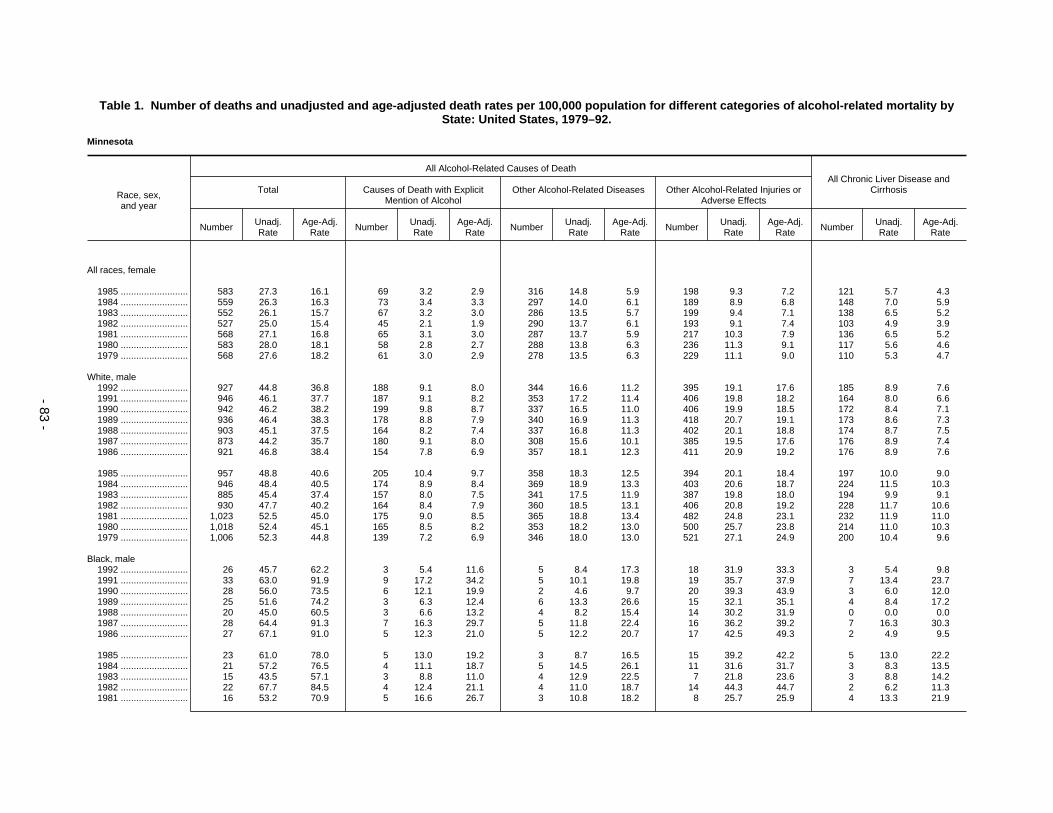
Table 1. Number of deaths and unadjusted and age-adjusted death rates per 100,000 population for different categories of alcohol-related mortality byState: United States, 1979–92.
Minnesota
Race, sex,and year
All Alcohol-Related Causes of DeathAll Chronic Liver Disease and
CirrhosisTotal Causes of Death with ExplicitMention of Alcohol
Other Alcohol-Related Diseases Other Alcohol-Related Injuries orAdverse Effects
Number Unadj.Rate
Age-Adj.Rate Number Unadj.
RateAge-Adj.
Rate Number Unadj.Rate
Age-Adj.Rate Number Unadj.
RateAge-Adj.
Rate Number Unadj.Rate
Age-Adj.Rate
All races, female
1985 .......................... 583 27.3 16.1 69 3.2 2.9 316 14.8 5.9 198 9.3 7.2 121 5.7 4.31984 .......................... 559 26.3 16.3 73 3.4 3.3 297 14.0 6.1 189 8.9 6.8 148 7.0 5.91983 .......................... 552 26.1 15.7 67 3.2 3.0 286 13.5 5.7 199 9.4 7.1 138 6.5 5.21982 .......................... 527 25.0 15.4 45 2.1 1.9 290 13.7 6.1 193 9.1 7.4 103 4.9 3.91981 .......................... 568 27.1 16.8 65 3.1 3.0 287 13.7 5.9 217 10.3 7.9 136 6.5 5.21980 .......................... 583 28.0 18.1 58 2.8 2.7 288 13.8 6.3 236 11.3 9.1 117 5.6 4.61979 .......................... 568 27.6 18.2 61 3.0 2.9 278 13.5 6.3 229 11.1 9.0 110 5.3 4.7
White, male1992 .......................... 927 44.8 36.8 188 9.1 8.0 344 16.6 11.2 395 19.1 17.6 185 8.9 7.61991 .......................... 946 46.1 37.7 187 9.1 8.2 353 17.2 11.4 406 19.8 18.2 164 8.0 6.61990 .......................... 942 46.2 38.2 199 9.8 8.7 337 16.5 11.0 406 19.9 18.5 172 8.4 7.11989 .......................... 936 46.4 38.3 178 8.8 7.9 340 16.9 11.3 418 20.7 19.1 173 8.6 7.31988 .......................... 903 45.1 37.5 164 8.2 7.4 337 16.8 11.3 402 20.1 18.8 174 8.7 7.51987 .......................... 873 44.2 35.7 180 9.1 8.0 308 15.6 10.1 385 19.5 17.6 176 8.9 7.41986 .......................... 921 46.8 38.4 154 7.8 6.9 357 18.1 12.3 411 20.9 19.2 176 8.9 7.6
1985 .......................... 957 48.8 40.6 205 10.4 9.7 358 18.3 12.5 394 20.1 18.4 197 10.0 9.01984 .......................... 946 48.4 40.5 174 8.9 8.4 369 18.9 13.3 403 20.6 18.7 224 11.5 10.31983 .......................... 885 45.4 37.4 157 8.0 7.5 341 17.5 11.9 387 19.8 18.0 194 9.9 9.11982 .......................... 930 47.7 40.2 164 8.4 7.9 360 18.5 13.1 406 20.8 19.2 228 11.7 10.61981 .......................... 1,023 52.5 45.0 175 9.0 8.5 365 18.8 13.4 482 24.8 23.1 232 11.9 11.01980 .......................... 1,018 52.4 45.1 165 8.5 8.2 353 18.2 13.0 500 25.7 23.8 214 11.0 10.31979 .......................... 1,006 52.3 44.8 139 7.2 6.9 346 18.0 13.0 521 27.1 24.9 200 10.4 9.6
Black, male1992 .......................... 26 45.7 62.2 3 5.4 11.6 5 8.4 17.3 18 31.9 33.3 3 5.4 9.81991 .......................... 33 63.0 91.9 9 17.2 34.2 5 10.1 19.8 19 35.7 37.9 7 13.4 23.71990 .......................... 28 56.0 73.5 6 12.1 19.9 2 4.6 9.7 20 39.3 43.9 3 6.0 12.01989 .......................... 25 51.6 74.2 3 6.3 12.4 6 13.3 26.6 15 32.1 35.1 4 8.4 17.21988 .......................... 20 45.0 60.5 3 6.6 13.2 4 8.2 15.4 14 30.2 31.9 0 0.0 0.01987 .......................... 28 64.4 91.3 7 16.3 29.7 5 11.8 22.4 16 36.2 39.2 7 16.3 30.31986 .......................... 27 67.1 91.0 5 12.3 21.0 5 12.2 20.7 17 42.5 49.3 2 4.9 9.5
1985 .......................... 23 61.0 78.0 5 13.0 19.2 3 8.7 16.5 15 39.2 42.2 5 13.0 22.21984 .......................... 21 57.2 76.5 4 11.1 18.7 5 14.5 26.1 11 31.6 31.7 3 8.3 13.51983 .......................... 15 43.5 57.1 3 8.8 11.0 4 12.9 22.5 7 21.8 23.6 3 8.8 14.21982 .......................... 22 67.7 84.5 4 12.4 21.1 4 11.0 18.7 14 44.3 44.7 2 6.2 11.31981 .......................... 16 53.2 70.9 5 16.6 26.7 3 10.8 18.2 8 25.7 25.9 4 13.3 21.9
- 83 -

Table 1. Number of deaths and unadjusted and age-adjusted death rates per 100,000 population for different categories of alcohol-related mortality byState: United States, 1979–92.
Minnesota
Race, sex,and year
All Alcohol-Related Causes of DeathAll Chronic Liver Disease and
CirrhosisTotal Causes of Death with ExplicitMention of Alcohol
Other Alcohol-Related Diseases Other Alcohol-Related Injuries orAdverse Effects
Number Unadj.Rate
Age-Adj.Rate Number Unadj.
RateAge-Adj.
Rate Number Unadj.Rate
Age-Adj.Rate Number Unadj.
RateAge-Adj.
Rate Number Unadj.Rate
Age-Adj.Rate
Black, male1980 .......................... 19 69.0 89.1 5 17.9 27.2 4 13.5 22.1 10 37.6 39.8 2 7.2 9.61979 .......................... 15 56.5 65.6 2 7.7 9.1 3 10.3 15.9 10 38.6 40.6 6 23.1 34.7
White, female1992 .......................... 590 27.5 15.0 75 3.5 3.2 304 14.1 5.1 211 9.8 6.7 108 5.0 3.61991 .......................... 585 27.4 15.0 78 3.7 3.1 307 14.4 5.3 201 9.4 6.6 113 5.3 3.91990 .......................... 577 27.2 15.4 69 3.3 2.9 307 14.5 5.5 200 9.4 7.0 110 5.2 3.61989 .......................... 561 26.6 15.1 59 2.8 2.4 290 13.8 5.0 212 10.1 7.6 111 5.3 3.61988 .......................... 566 27.1 15.7 52 2.5 2.1 306 14.7 5.8 208 10.0 7.8 111 5.3 4.11987 .......................... 539 26.1 14.9 53 2.6 2.3 281 13.6 5.0 205 9.9 7.5 114 5.5 4.11986 .......................... 559 27.2 16.0 64 3.1 2.8 305 14.8 5.9 190 9.3 7.2 116 5.6 4.1
1985 .......................... 569 27.8 15.9 66 3.2 2.8 311 15.2 5.9 192 9.4 7.2 119 5.8 4.31984 .......................... 541 26.5 15.9 69 3.4 3.2 293 14.3 6.1 179 8.8 6.6 143 7.0 5.81983 .......................... 535 26.3 15.3 64 3.1 2.9 280 13.7 5.5 191 9.4 6.9 133 6.5 5.01982 .......................... 509 25.0 14.9 42 2.1 1.8 284 13.9 6.0 183 9.0 7.2 99 4.9 3.81981 .......................... 548 27.0 16.3 57 2.8 2.6 282 13.9 5.8 210 10.3 7.8 127 6.3 4.81980 .......................... 565 27.9 17.6 55 2.7 2.6 282 14.0 6.2 227 11.2 8.8 111 5.5 4.31979 .......................... 548 27.4 17.6 52 2.6 2.4 274 13.7 6.2 222 11.1 8.9 103 5.1 4.4
Black, female1992 .......................... 12 23.8 34.5 2 3.9 8.0 3 5.5 9.1 8 14.5 17.5 2 3.9 6.01991 .......................... 7 14.1 18.0 1 2.1 4.1 2 4.7 7.2 4 7.3 6.7 1 2.1 4.11990 .......................... 7 15.2 18.8 0 0.0 0.0 3 6.5 9.4 4 8.8 9.4 0 0.0 0.01989 .......................... 8 17.2 19.4 1 2.2 1.8 2 3.4 4.3 5 11.6 13.4 2 4.5 6.01988 .......................... 13 29.7 39.6 3 7.0 10.5 5 11.8 17.6 5 10.8 11.5 3 7.0 10.51987 .......................... 8 21.0 26.1 0 0.0 0.0 3 8.7 11.9 5 12.4 14.2 0 0.0 0.01986 .......................... 8 21.0 24.0 1 2.6 4.7 3 6.7 7.5 4 11.7 11.8 1 2.6 4.7
1985 .......................... 6 15.5 19.7 0 0.0 0.0 3 8.5 12.6 3 6.9 7.1 0 0.0 0.01984 .......................... 8 24.2 30.6 1 2.9 5.1 2 7.2 10.7 5 14.1 14.8 3 8.7 15.21983 .......................... 8 25.5 35.8 3 9.2 13.8 3 9.3 12.9 2 7.0 9.1 3 9.2 12.01982 .......................... 8 25.4 34.1 2 6.5 11.2 3 9.4 13.5 3 9.5 9.4 2 6.5 11.21981 .......................... 7 23.3 25.7 1 3.5 5.1 3 11.2 13.4 2 8.6 7.2 2 7.0 12.01980 .......................... 8 30.2 34.4 1 3.7 5.8 4 13.6 17.7 3 12.8 11.0 2 7.5 11.21979 .......................... 8 33.6 43.1 2 8.0 12.5 3 11.6 15.3 4 14.0 15.3 1 4.0 6.4
- 84 -

Table 1. Number of deaths and unadjusted and age-adjusted death rates per 100,000 population for different categories of alcohol-related mortality byState: United States, 1979–92.
Mississippi
Race, sex,and year
All Alcohol-Related Causes of DeathAll Chronic Liver Disease and
CirrhosisTotal Causes of Death with ExplicitMention of Alcohol
Other Alcohol-Related Diseases Other Alcohol-Related Injuries orAdverse Effects
Number Unadj.Rate
Age-Adj.Rate Number Unadj.
RateAge-Adj.
Rate Number Unadj.Rate
Age-Adj.Rate Number Unadj.
RateAge-Adj.
Rate Number Unadj.Rate
Age-Adj.Rate
All races, both sexes1992 .......................... 1,419 54.2 46.7 168 6.4 6.3 456 17.4 11.2 795 30.4 29.2 226 8.6 7.51991 .......................... 1,355 52.3 44.7 149 5.7 5.5 447 17.2 11.1 760 29.3 28.1 196 7.6 6.51990 .......................... 1,377 53.5 45.7 168 6.5 6.4 468 18.2 11.6 741 28.8 27.7 212 8.2 7.11989 .......................... 1,320 51.3 43.5 156 6.1 5.9 448 17.4 11.3 716 27.8 26.2 224 8.7 7.51988 .......................... 1,277 49.5 41.9 136 5.3 5.2 451 17.5 11.4 690 26.7 25.3 212 8.2 7.31987 .......................... 1,308 50.5 43.5 152 5.9 5.9 443 17.1 11.3 714 27.6 26.3 203 7.8 7.11986 .......................... 1,298 50.1 43.8 139 5.4 5.5 443 17.1 11.5 716 27.6 26.8 238 9.2 8.3
1985 .......................... 1,249 48.2 42.2 156 6.0 6.3 419 16.2 10.8 674 26.0 25.1 217 8.4 7.71984 .......................... 1,249 48.5 42.2 135 5.2 5.3 444 17.2 11.6 670 26.0 25.2 202 7.8 7.21983 .......................... 1,235 48.1 42.4 131 5.1 5.3 431 16.8 11.7 672 26.2 25.4 220 8.6 7.81982 .......................... 1,258 49.2 43.8 104 4.1 4.3 425 16.6 11.5 728 28.5 28.1 182 7.1 6.61981 .......................... 1,290 50.8 45.7 128 5.0 5.4 431 17.0 12.0 731 28.8 28.3 218 8.6 8.31980 .......................... 1,317 52.2 46.9 135 5.3 5.5 442 17.5 12.4 740 29.3 29.0 199 7.9 7.71979 .......................... 1,331 53.1 48.5 140 5.6 6.0 435 17.3 12.5 756 30.2 29.9 196 7.8 7.7
All races, male1992 .......................... 953 76.2 71.2 130 10.4 10.3 263 21.0 16.8 560 44.8 44.1 137 11.0 10.41991 .......................... 934 75.3 70.3 128 10.3 10.2 258 20.8 16.6 548 44.2 43.6 126 10.2 9.81990 .......................... 945 76.7 71.9 140 11.4 11.5 270 21.9 17.3 535 43.5 43.1 139 11.3 10.71989 .......................... 906 73.5 68.1 123 10.0 10.0 257 20.9 16.7 526 42.6 41.3 146 11.8 11.31988 .......................... 846 68.4 63.7 101 8.2 8.3 252 20.4 16.2 493 39.8 39.2 128 10.4 10.11987 .......................... 882 71.0 66.5 126 10.1 10.5 255 20.5 16.5 501 40.3 39.5 134 10.8 10.81986 .......................... 862 69.2 65.9 105 8.4 9.0 246 19.7 16.0 511 41.1 40.8 139 11.2 10.9
1985 .......................... 848 68.3 65.5 120 9.7 10.5 235 18.9 15.4 494 39.7 39.6 136 10.9 11.21984 .......................... 842 68.0 64.6 104 8.4 8.8 254 20.5 16.7 485 39.1 39.1 126 10.2 10.01983 .......................... 835 67.7 64.9 101 8.2 8.8 247 20.0 16.7 488 39.5 39.4 145 11.7 11.31982 .......................... 853 69.4 67.0 82 6.7 7.3 244 19.8 16.4 527 42.9 43.3 117 9.5 9.61981 .......................... 891 72.9 71.1 98 8.0 8.8 242 19.8 16.7 551 45.1 45.6 133 10.9 11.51980 .......................... 905 74.4 72.6 102 8.4 9.0 258 21.2 18.0 545 44.8 45.5 127 10.4 10.91979 .......................... 921 76.3 75.8 111 9.2 10.2 242 20.0 17.5 568 47.0 48.1 125 10.3 11.2
All races, female1992 .......................... 465 34.1 25.1 38 2.8 2.7 193 14.1 6.8 235 17.2 15.5 89 6.5 4.91991 .......................... 422 31.2 22.3 21 1.6 1.5 189 14.0 6.7 212 15.7 14.1 70 5.2 3.61990 .......................... 432 32.2 22.8 28 2.1 2.0 199 14.8 7.2 206 15.3 13.7 73 5.4 4.01989 .......................... 414 30.8 22.1 33 2.5 2.4 190 14.2 7.1 190 14.2 12.6 78 5.8 4.21988 .......................... 431 32.1 22.8 35 2.6 2.4 199 14.8 7.7 197 14.7 12.7 84 6.3 4.91987 .......................... 427 31.7 23.4 26 1.9 1.9 188 13.9 7.2 213 15.8 14.3 69 5.1 4.01986 .......................... 436 32.3 24.3 34 2.5 2.5 197 14.6 7.9 205 15.2 14.0 99 7.3 6.1
- 85 -

Table 1. Number of deaths and unadjusted and age-adjusted death rates per 100,000 population for different categories of alcohol-related mortality byState: United States, 1979–92.
Mississippi
Race, sex,and year
All Alcohol-Related Causes of DeathAll Chronic Liver Disease and
CirrhosisTotal Causes of Death with ExplicitMention of Alcohol
Other Alcohol-Related Diseases Other Alcohol-Related Injuries orAdverse Effects
Number Unadj.Rate
Age-Adj.Rate Number Unadj.
RateAge-Adj.
Rate Number Unadj.Rate
Age-Adj.Rate Number Unadj.
RateAge-Adj.
Rate Number Unadj.Rate
Age-Adj.Rate
All races, female
1985 .......................... 400 29.7 21.7 36 2.7 2.7 184 13.7 7.2 180 13.4 11.8 81 6.0 4.81984 .......................... 407 30.4 22.7 31 2.3 2.4 190 14.2 7.7 186 13.9 12.6 76 5.7 5.01983 .......................... 400 30.0 22.6 30 2.3 2.4 185 13.9 7.6 185 13.9 12.6 75 5.6 5.01982 .......................... 404 30.5 23.5 22 1.7 1.6 181 13.7 7.7 201 15.1 14.2 65 4.9 4.11981 .......................... 399 30.3 23.1 30 2.3 2.5 189 14.3 8.2 180 13.7 12.4 85 6.5 5.61980 .......................... 413 31.5 24.1 33 2.5 2.5 185 14.1 7.9 195 14.9 13.7 72 5.5 5.01979 .......................... 410 31.5 24.0 29 2.2 2.3 192 14.8 8.4 188 14.5 13.2 71 5.5 4.7
White, male1992 .......................... 544 67.3 57.1 79 9.8 8.4 155 19.2 12.9 309 38.3 35.8 100 12.4 10.01991 .......................... 508 63.4 54.1 75 9.4 7.9 147 18.3 12.5 287 35.8 33.7 94 11.7 9.91990 .......................... 523 65.6 56.4 74 9.3 8.1 161 20.2 13.6 288 36.1 34.7 94 11.8 9.61989 .......................... 517 64.7 54.8 71 8.9 7.6 154 19.3 13.3 292 36.6 33.9 105 13.1 10.81988 .......................... 485 60.4 51.9 65 8.1 7.3 141 17.6 11.9 278 34.7 32.8 92 11.5 9.61987 .......................... 525 65.1 56.6 84 10.4 9.6 163 20.1 14.4 279 34.6 32.6 107 13.3 11.71986 .......................... 522 64.4 57.4 74 9.1 8.5 149 18.4 13.3 299 36.9 35.6 105 13.0 10.8
1985 .......................... 500 62.0 54.7 68 8.4 8.1 150 18.6 13.6 282 34.9 33.1 103 12.8 11.21984 .......................... 506 62.9 55.1 62 7.7 6.8 160 19.9 14.7 284 35.3 33.6 93 11.6 9.81983 .......................... 494 61.5 55.3 60 7.5 7.1 147 18.3 13.9 287 35.7 34.3 106 13.2 11.31982 .......................... 517 64.6 57.9 56 7.0 6.6 153 19.1 14.4 309 38.5 36.9 97 12.1 10.81981 .......................... 535 67.2 61.5 64 8.0 7.7 151 19.0 14.8 320 40.2 39.0 101 12.7 11.81980 .......................... 510 64.3 58.5 64 8.1 7.8 149 18.8 14.6 296 37.4 36.1 95 12.0 11.11979 .......................... 541 68.5 63.2 73 9.2 8.8 152 19.3 15.7 316 40.0 38.8 104 13.2 12.5
Black, male1992 .......................... 402 93.1 104.6 48 11.1 14.4 107 24.7 29.1 247 57.2 61.1 34 7.9 10.11991 .......................... 416 97.4 108.4 49 11.5 15.1 110 25.7 28.6 257 60.1 64.7 29 6.8 8.61990 .......................... 416 98.0 111.5 65 15.3 21.0 107 25.3 28.9 243 57.4 61.6 45 10.6 14.11989 .......................... 382 90.2 102.7 50 11.8 16.7 102 24.2 27.2 230 54.3 58.8 39 9.2 12.41988 .......................... 357 84.2 95.8 36 8.5 11.4 109 25.8 29.3 212 49.9 55.0 35 8.3 11.61987 .......................... 347 81.5 89.7 40 9.4 12.3 88 20.6 21.3 219 51.5 56.1 21 4.9 6.61986 .......................... 333 78.1 86.8 29 6.8 9.6 96 22.6 24.0 208 48.7 53.2 31 7.3 10.5
1985 .......................... 342 80.2 93.1 51 11.9 17.5 83 19.5 20.9 208 48.7 54.8 32 7.5 11.41984 .......................... 328 77.0 89.7 40 9.4 15.0 93 21.9 23.0 195 45.7 51.7 32 7.5 10.91983 .......................... 338 79.9 93.0 41 9.7 14.0 99 23.4 25.2 198 46.8 53.8 39 9.2 12.21982 .......................... 329 77.9 91.3 26 6.2 9.6 91 21.5 22.2 212 50.2 59.4 20 4.7 6.81981 .......................... 351 83.9 98.1 33 7.9 11.8 91 21.7 22.7 227 54.3 63.6 31 7.4 10.7
- 86 -
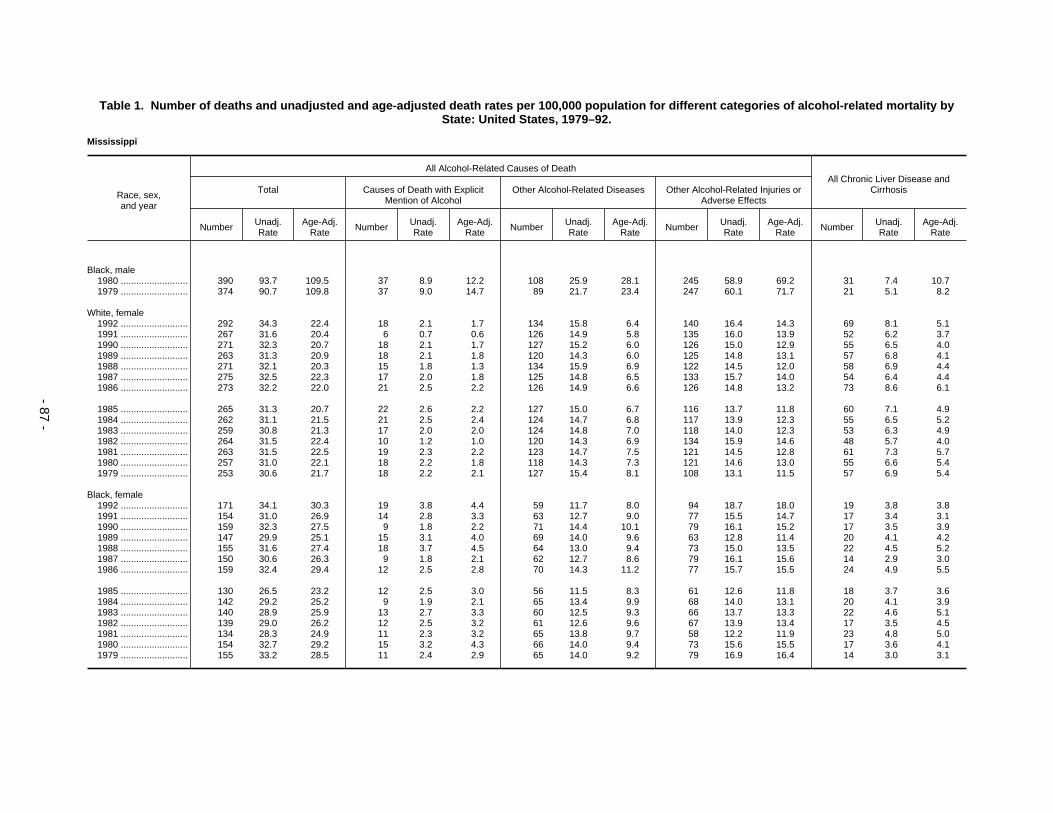
Table 1. Number of deaths and unadjusted and age-adjusted death rates per 100,000 population for different categories of alcohol-related mortality byState: United States, 1979–92.
Mississippi
Race, sex,and year
All Alcohol-Related Causes of DeathAll Chronic Liver Disease and
CirrhosisTotal Causes of Death with ExplicitMention of Alcohol
Other Alcohol-Related Diseases Other Alcohol-Related Injuries orAdverse Effects
Number Unadj.Rate
Age-Adj.Rate Number Unadj.
RateAge-Adj.
Rate Number Unadj.Rate
Age-Adj.Rate Number Unadj.
RateAge-Adj.
Rate Number Unadj.Rate
Age-Adj.Rate
Black, male1980 .......................... 390 93.7 109.5 37 8.9 12.2 108 25.9 28.1 245 58.9 69.2 31 7.4 10.71979 .......................... 374 90.7 109.8 37 9.0 14.7 89 21.7 23.4 247 60.1 71.7 21 5.1 8.2
White, female1992 .......................... 292 34.3 22.4 18 2.1 1.7 134 15.8 6.4 140 16.4 14.3 69 8.1 5.11991 .......................... 267 31.6 20.4 6 0.7 0.6 126 14.9 5.8 135 16.0 13.9 52 6.2 3.71990 .......................... 271 32.3 20.7 18 2.1 1.7 127 15.2 6.0 126 15.0 12.9 55 6.5 4.01989 .......................... 263 31.3 20.9 18 2.1 1.8 120 14.3 6.0 125 14.8 13.1 57 6.8 4.11988 .......................... 271 32.1 20.3 15 1.8 1.3 134 15.9 6.9 122 14.5 12.0 58 6.9 4.41987 .......................... 275 32.5 22.3 17 2.0 1.8 125 14.8 6.5 133 15.7 14.0 54 6.4 4.41986 .......................... 273 32.2 22.0 21 2.5 2.2 126 14.9 6.6 126 14.8 13.2 73 8.6 6.1
1985 .......................... 265 31.3 20.7 22 2.6 2.2 127 15.0 6.7 116 13.7 11.8 60 7.1 4.91984 .......................... 262 31.1 21.5 21 2.5 2.4 124 14.7 6.8 117 13.9 12.3 55 6.5 5.21983 .......................... 259 30.8 21.3 17 2.0 2.0 124 14.8 7.0 118 14.0 12.3 53 6.3 4.91982 .......................... 264 31.5 22.4 10 1.2 1.0 120 14.3 6.9 134 15.9 14.6 48 5.7 4.01981 .......................... 263 31.5 22.5 19 2.3 2.2 123 14.7 7.5 121 14.5 12.8 61 7.3 5.71980 .......................... 257 31.0 22.1 18 2.2 1.8 118 14.3 7.3 121 14.6 13.0 55 6.6 5.41979 .......................... 253 30.6 21.7 18 2.2 2.1 127 15.4 8.1 108 13.1 11.5 57 6.9 5.4
Black, female1992 .......................... 171 34.1 30.3 19 3.8 4.4 59 11.7 8.0 94 18.7 18.0 19 3.8 3.81991 .......................... 154 31.0 26.9 14 2.8 3.3 63 12.7 9.0 77 15.5 14.7 17 3.4 3.11990 .......................... 159 32.3 27.5 9 1.8 2.2 71 14.4 10.1 79 16.1 15.2 17 3.5 3.91989 .......................... 147 29.9 25.1 15 3.1 4.0 69 14.0 9.6 63 12.8 11.4 20 4.1 4.21988 .......................... 155 31.6 27.4 18 3.7 4.5 64 13.0 9.4 73 15.0 13.5 22 4.5 5.21987 .......................... 150 30.6 26.3 9 1.8 2.1 62 12.7 8.6 79 16.1 15.6 14 2.9 3.01986 .......................... 159 32.4 29.4 12 2.5 2.8 70 14.3 11.2 77 15.7 15.5 24 4.9 5.5
1985 .......................... 130 26.5 23.2 12 2.5 3.0 56 11.5 8.3 61 12.6 11.8 18 3.7 3.61984 .......................... 142 29.2 25.2 9 1.9 2.1 65 13.4 9.9 68 14.0 13.1 20 4.1 3.91983 .......................... 140 28.9 25.9 13 2.7 3.3 60 12.5 9.3 66 13.7 13.3 22 4.6 5.11982 .......................... 139 29.0 26.2 12 2.5 3.2 61 12.6 9.6 67 13.9 13.4 17 3.5 4.51981 .......................... 134 28.3 24.9 11 2.3 3.2 65 13.8 9.7 58 12.2 11.9 23 4.8 5.01980 .......................... 154 32.7 29.2 15 3.2 4.3 66 14.0 9.4 73 15.6 15.5 17 3.6 4.11979 .......................... 155 33.2 28.5 11 2.4 2.9 65 14.0 9.2 79 16.9 16.4 14 3.0 3.1
- 87 -

Table 1. Number of deaths and unadjusted and age-adjusted death rates per 100,000 population for different categories of alcohol-related mortality byState: United States, 1979–92.
Missouri
Race, sex,and year
All Alcohol-Related Causes of DeathAll Chronic Liver Disease and
CirrhosisTotal Causes of Death with ExplicitMention of Alcohol
Other Alcohol-Related Diseases Other Alcohol-Related Injuries orAdverse Effects
Number Unadj.Rate
Age-Adj.Rate Number Unadj.
RateAge-Adj.
Rate Number Unadj.Rate
Age-Adj.Rate Number Unadj.
RateAge-Adj.
Rate Number Unadj.Rate
Age-Adj.Rate
All races, both sexes1992 .......................... 2,309 44.5 34.5 318 6.1 5.5 913 17.6 9.5 1,078 20.8 19.5 386 7.4 5.81991 .......................... 2,358 45.7 35.4 313 6.1 5.4 927 18.0 9.8 1,118 21.7 20.3 439 8.5 6.41990 .......................... 2,334 45.5 35.0 343 6.7 5.9 891 17.4 9.3 1,100 21.5 19.7 424 8.3 6.41989 .......................... 2,252 44.2 33.9 330 6.5 5.6 874 17.2 9.1 1,048 20.6 19.2 420 8.2 6.21988 .......................... 2,178 42.9 32.8 260 5.1 4.6 844 16.6 8.8 1,074 21.1 19.4 376 7.4 5.91987 .......................... 2,242 44.3 34.2 283 5.6 5.0 859 17.0 9.3 1,099 21.7 19.9 415 8.2 6.51986 .......................... 2,290 45.6 35.3 256 5.1 4.6 881 17.5 9.6 1,153 23.0 21.1 398 7.9 6.2
1985 .......................... 2,130 42.6 32.5 237 4.7 4.4 881 17.6 9.8 1,012 20.2 18.3 396 7.9 6.31984 .......................... 2,152 43.3 33.2 256 5.1 4.6 880 17.7 10.0 1,016 20.4 18.6 401 8.1 6.41983 .......................... 2,188 44.3 34.1 227 4.6 4.3 933 18.9 10.9 1,028 20.8 18.9 426 8.6 6.91982 .......................... 2,184 44.3 34.6 253 5.1 4.8 886 18.0 10.5 1,045 21.2 19.3 476 9.7 7.91981 .......................... 2,305 46.7 36.7 241 4.9 4.7 922 18.7 11.0 1,142 23.2 21.1 468 9.5 7.91980 .......................... 2,447 49.7 40.2 292 5.9 5.8 925 18.8 11.1 1,231 25.0 23.3 489 9.9 8.51979 .......................... 2,394 49.0 39.4 272 5.6 5.3 912 18.6 11.1 1,211 24.8 23.0 498 10.2 8.4
All races, male1992 .......................... 1,506 60.1 52.4 254 10.1 9.3 500 20.0 13.6 752 30.0 29.5 252 10.1 8.51991 .......................... 1,570 63.2 54.7 242 9.7 8.9 522 21.0 14.3 806 32.4 31.6 267 10.7 8.81990 .......................... 1,519 61.5 53.0 257 10.4 9.4 485 19.6 13.4 777 31.4 30.2 257 10.4 8.81989 .......................... 1,474 60.1 51.6 264 10.8 9.6 476 19.4 13.0 734 29.9 28.9 267 10.9 9.11988 .......................... 1,427 58.4 50.1 204 8.3 7.7 463 19.0 12.8 760 31.1 29.6 239 9.8 8.51987 .......................... 1,453 59.7 51.3 222 9.1 8.5 465 19.1 13.0 766 31.5 29.8 255 10.5 9.01986 .......................... 1,486 61.5 52.7 185 7.7 7.1 477 19.7 13.4 825 34.1 32.2 230 9.5 8.1
1985 .......................... 1,379 57.3 49.2 186 7.7 7.3 478 19.9 13.9 715 29.7 28.0 243 10.1 8.71984 .......................... 1,397 58.4 50.0 198 8.3 7.7 487 20.3 14.2 712 29.8 28.1 263 11.0 9.51983 .......................... 1,426 60.0 51.7 176 7.4 7.2 520 21.9 15.5 730 30.7 29.1 259 10.9 9.51982 .......................... 1,443 60.9 52.9 197 8.3 7.9 504 21.3 15.2 742 31.3 29.7 305 12.9 11.41981 .......................... 1,506 63.4 55.5 181 7.6 7.4 513 21.6 15.5 811 34.2 32.5 295 12.4 11.31980 .......................... 1,612 68.0 60.3 207 8.7 8.5 518 21.9 15.8 887 37.5 35.9 316 13.3 12.01979 .......................... 1,584 67.3 59.6 197 8.4 8.3 514 21.8 15.8 872 37.1 35.5 302 12.8 11.5
All races, female1992 .......................... 802 29.9 18.1 64 2.4 2.2 412 15.4 6.1 326 12.1 9.8 134 5.0 3.51991 .......................... 788 29.5 18.0 71 2.7 2.3 405 15.2 6.2 311 11.7 9.5 172 6.4 4.21990 .......................... 815 30.7 18.7 86 3.2 2.8 406 15.3 6.1 324 12.2 9.9 167 6.3 4.21989 .......................... 778 29.4 18.1 66 2.5 2.1 398 15.1 6.0 314 11.9 9.9 153 5.8 3.71988 .......................... 751 28.5 17.3 56 2.1 1.9 381 14.4 5.8 315 11.9 9.7 137 5.2 3.61987 .......................... 789 30.1 18.9 61 2.3 1.9 394 15.0 6.4 333 12.7 10.5 160 6.1 4.31986 .......................... 804 30.8 19.8 71 2.7 2.5 404 15.5 6.6 328 12.6 10.7 168 6.4 4.7
- 88 -
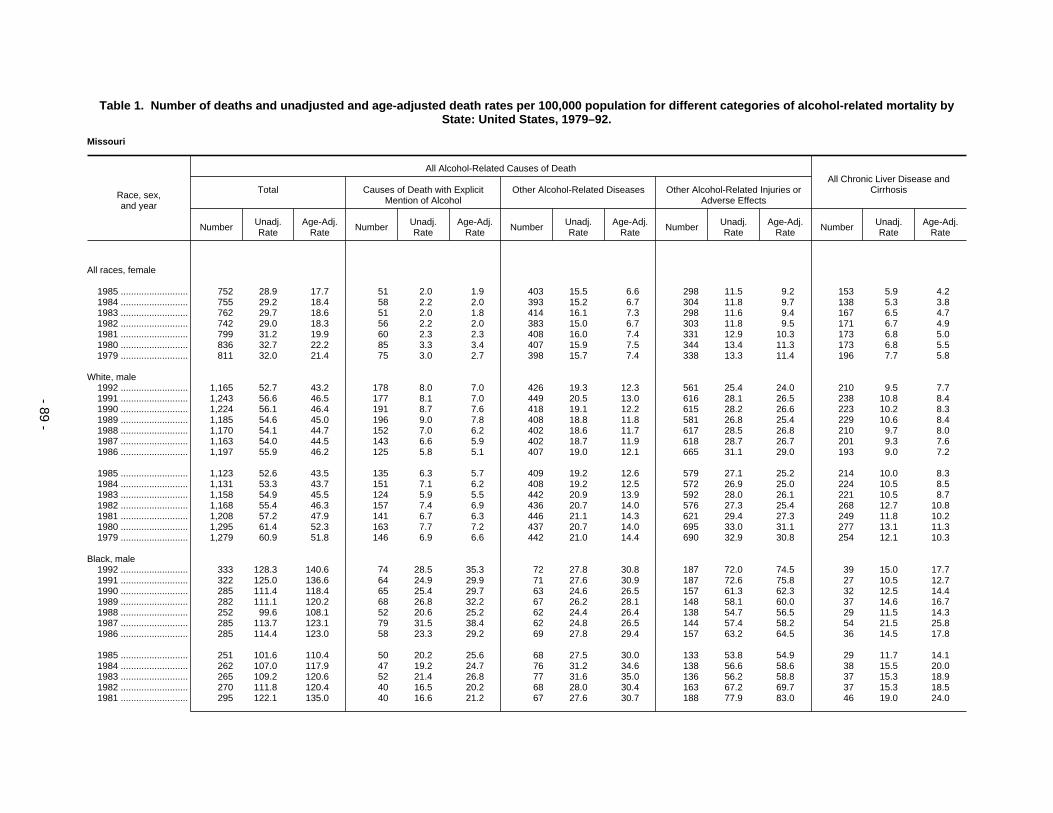
Table 1. Number of deaths and unadjusted and age-adjusted death rates per 100,000 population for different categories of alcohol-related mortality byState: United States, 1979–92.
Missouri
Race, sex,and year
All Alcohol-Related Causes of DeathAll Chronic Liver Disease and
CirrhosisTotal Causes of Death with ExplicitMention of Alcohol
Other Alcohol-Related Diseases Other Alcohol-Related Injuries orAdverse Effects
Number Unadj.Rate
Age-Adj.Rate Number Unadj.
RateAge-Adj.
Rate Number Unadj.Rate
Age-Adj.Rate Number Unadj.
RateAge-Adj.
Rate Number Unadj.Rate
Age-Adj.Rate
All races, female
1985 .......................... 752 28.9 17.7 51 2.0 1.9 403 15.5 6.6 298 11.5 9.2 153 5.9 4.21984 .......................... 755 29.2 18.4 58 2.2 2.0 393 15.2 6.7 304 11.8 9.7 138 5.3 3.81983 .......................... 762 29.7 18.6 51 2.0 1.8 414 16.1 7.3 298 11.6 9.4 167 6.5 4.71982 .......................... 742 29.0 18.3 56 2.2 2.0 383 15.0 6.7 303 11.8 9.5 171 6.7 4.91981 .......................... 799 31.2 19.9 60 2.3 2.3 408 16.0 7.4 331 12.9 10.3 173 6.8 5.01980 .......................... 836 32.7 22.2 85 3.3 3.4 407 15.9 7.5 344 13.4 11.3 173 6.8 5.51979 .......................... 811 32.0 21.4 75 3.0 2.7 398 15.7 7.4 338 13.3 11.4 196 7.7 5.8
White, male1992 .......................... 1,165 52.7 43.2 178 8.0 7.0 426 19.3 12.3 561 25.4 24.0 210 9.5 7.71991 .......................... 1,243 56.6 46.5 177 8.1 7.0 449 20.5 13.0 616 28.1 26.5 238 10.8 8.41990 .......................... 1,224 56.1 46.4 191 8.7 7.6 418 19.1 12.2 615 28.2 26.6 223 10.2 8.31989 .......................... 1,185 54.6 45.0 196 9.0 7.8 408 18.8 11.8 581 26.8 25.4 229 10.6 8.41988 .......................... 1,170 54.1 44.7 152 7.0 6.2 402 18.6 11.7 617 28.5 26.8 210 9.7 8.01987 .......................... 1,163 54.0 44.5 143 6.6 5.9 402 18.7 11.9 618 28.7 26.7 201 9.3 7.61986 .......................... 1,197 55.9 46.2 125 5.8 5.1 407 19.0 12.1 665 31.1 29.0 193 9.0 7.2
1985 .......................... 1,123 52.6 43.5 135 6.3 5.7 409 19.2 12.6 579 27.1 25.2 214 10.0 8.31984 .......................... 1,131 53.3 43.7 151 7.1 6.2 408 19.2 12.5 572 26.9 25.0 224 10.5 8.51983 .......................... 1,158 54.9 45.5 124 5.9 5.5 442 20.9 13.9 592 28.0 26.1 221 10.5 8.71982 .......................... 1,168 55.4 46.3 157 7.4 6.9 436 20.7 14.0 576 27.3 25.4 268 12.7 10.81981 .......................... 1,208 57.2 47.9 141 6.7 6.3 446 21.1 14.3 621 29.4 27.3 249 11.8 10.21980 .......................... 1,295 61.4 52.3 163 7.7 7.2 437 20.7 14.0 695 33.0 31.1 277 13.1 11.31979 .......................... 1,279 60.9 51.8 146 6.9 6.6 442 21.0 14.4 690 32.9 30.8 254 12.1 10.3
Black, male1992 .......................... 333 128.3 140.6 74 28.5 35.3 72 27.8 30.8 187 72.0 74.5 39 15.0 17.71991 .......................... 322 125.0 136.6 64 24.9 29.9 71 27.6 30.9 187 72.6 75.8 27 10.5 12.71990 .......................... 285 111.4 118.4 65 25.4 29.7 63 24.6 26.5 157 61.3 62.3 32 12.5 14.41989 .......................... 282 111.1 120.2 68 26.8 32.2 67 26.2 28.1 148 58.1 60.0 37 14.6 16.71988 .......................... 252 99.6 108.1 52 20.6 25.2 62 24.4 26.4 138 54.7 56.5 29 11.5 14.31987 .......................... 285 113.7 123.1 79 31.5 38.4 62 24.8 26.5 144 57.4 58.2 54 21.5 25.81986 .......................... 285 114.4 123.0 58 23.3 29.2 69 27.8 29.4 157 63.2 64.5 36 14.5 17.8
1985 .......................... 251 101.6 110.4 50 20.2 25.6 68 27.5 30.0 133 53.8 54.9 29 11.7 14.11984 .......................... 262 107.0 117.9 47 19.2 24.7 76 31.2 34.6 138 56.6 58.6 38 15.5 20.01983 .......................... 265 109.2 120.6 52 21.4 26.8 77 31.6 35.0 136 56.2 58.8 37 15.3 18.91982 .......................... 270 111.8 120.4 40 16.5 20.2 68 28.0 30.4 163 67.2 69.7 37 15.3 18.51981 .......................... 295 122.1 135.0 40 16.6 21.2 67 27.6 30.7 188 77.9 83.0 46 19.0 24.0
- 89 -

Table 1. Number of deaths and unadjusted and age-adjusted death rates per 100,000 population for different categories of alcohol-related mortality byState: United States, 1979–92.
Missouri
Race, sex,and year
All Alcohol-Related Causes of DeathAll Chronic Liver Disease and
CirrhosisTotal Causes of Death with ExplicitMention of Alcohol
Other Alcohol-Related Diseases Other Alcohol-Related Injuries orAdverse Effects
Number Unadj.Rate
Age-Adj.Rate Number Unadj.
RateAge-Adj.
Rate Number Unadj.Rate
Age-Adj.Rate Number Unadj.
RateAge-Adj.
Rate Number Unadj.Rate
Age-Adj.Rate
Black, male1980 .......................... 312 129.4 143.5 44 18.3 23.8 80 33.0 37.2 188 78.2 82.6 38 15.8 20.51979 .......................... 304 129.3 144.3 51 21.7 27.7 72 30.5 33.2 181 77.1 83.3 48 20.4 26.1
White, female1992 .......................... 693 29.5 16.8 46 2.0 1.8 367 15.6 5.6 280 11.9 9.4 115 4.9 3.21991 .......................... 676 28.9 16.4 57 2.4 1.9 352 15.0 5.4 267 11.4 9.0 148 6.3 3.81990 .......................... 690 29.6 16.8 61 2.6 2.1 349 15.0 5.3 279 12.0 9.4 133 5.7 3.51989 .......................... 672 29.0 16.7 50 2.2 1.7 351 15.1 5.4 271 11.7 9.6 134 5.8 3.41988 .......................... 655 28.3 16.3 42 1.8 1.5 342 14.8 5.4 271 11.7 9.3 118 5.1 3.31987 .......................... 686 29.7 17.7 47 2.0 1.6 348 15.1 5.8 291 12.6 10.3 137 5.9 3.91986 .......................... 698 30.4 18.4 51 2.2 1.9 361 15.8 6.1 286 12.5 10.4 144 6.3 4.2
1985 .......................... 661 28.9 16.7 38 1.7 1.6 360 15.7 6.1 263 11.5 9.0 133 5.8 4.01984 .......................... 658 28.9 17.2 40 1.8 1.4 349 15.3 6.2 268 11.8 9.5 116 5.1 3.51983 .......................... 655 28.9 17.0 38 1.7 1.5 358 15.8 6.4 259 11.4 9.1 141 6.2 4.21982 .......................... 653 28.9 17.3 44 1.9 1.8 343 15.2 6.3 266 11.8 9.1 141 6.2 4.41981 .......................... 707 31.2 18.8 44 1.9 1.8 367 16.2 6.9 296 13.1 10.1 147 6.5 4.41980 .......................... 725 32.1 20.5 65 2.9 2.8 359 15.9 6.8 301 13.3 10.9 146 6.5 5.01979 .......................... 696 30.9 19.6 51 2.3 2.0 354 15.8 6.8 291 12.9 10.8 157 7.0 4.9
Black, female1992 .......................... 105 35.2 30.5 17 5.7 5.9 43 14.6 10.7 44 14.9 13.9 18 6.0 5.21991 .......................... 108 36.4 32.7 14 4.7 5.6 52 17.5 13.6 42 14.1 13.5 23 7.8 8.01990 .......................... 117 39.6 34.9 23 7.8 8.0 54 18.4 14.4 40 13.4 12.5 30 10.2 10.01989 .......................... 101 34.5 29.9 16 5.5 5.9 45 15.5 11.9 40 13.6 12.1 19 6.5 6.41988 .......................... 94 32.5 27.8 14 4.8 5.0 39 13.2 9.5 42 14.4 13.4 19 6.5 6.41987 .......................... 101 35.0 31.4 14 4.9 5.0 46 15.8 12.9 41 14.4 13.5 23 8.0 7.81986 .......................... 104 36.3 33.4 20 7.0 7.8 42 14.7 11.8 42 14.6 13.7 24 8.4 9.2
1985 .......................... 88 31.1 27.4 13 4.6 5.2 42 14.8 11.4 33 11.7 10.8 19 6.7 6.61984 .......................... 96 34.1 31.2 17 6.1 6.9 44 15.6 12.2 35 12.5 12.0 21 7.5 7.41983 .......................... 106 38.1 34.7 13 4.7 4.9 55 19.6 17.3 38 13.8 12.5 25 9.0 9.51982 .......................... 87 31.6 28.2 12 4.4 4.5 39 14.3 11.4 36 12.9 12.3 30 10.9 10.41981 .......................... 90 32.6 30.7 16 5.8 6.9 41 14.9 12.8 33 11.9 11.0 25 9.1 10.21980 .......................... 109 39.7 38.5 20 7.3 9.1 47 17.1 14.8 42 15.2 14.5 26 9.5 10.51979 .......................... 112 41.9 39.2 24 9.0 9.8 42 15.8 13.3 46 17.1 16.0 39 14.6 15.3
- 90 -

Table 1. Number of deaths and unadjusted and age-adjusted death rates per 100,000 population for different categories of alcohol-related mortality byState: United States, 1979–92.
Montana
Race, sex,and year
All Alcohol-Related Causes of DeathAll Chronic Liver Disease and
CirrhosisTotal Causes of Death with ExplicitMention of Alcohol
Other Alcohol-Related Diseases Other Alcohol-Related Injuries orAdverse Effects
Number Unadj.Rate
Age-Adj.Rate Number Unadj.
RateAge-Adj.
Rate Number Unadj.Rate
Age-Adj.Rate Number Unadj.
RateAge-Adj.
Rate Number Unadj.Rate
Age-Adj.Rate
All races, both sexes1992 .......................... 398 48.4 38.1 74 9.0 7.6 143 17.4 9.6 181 22.0 20.8 73 8.9 6.91991 .......................... 367 45.5 36.0 57 7.1 6.3 126 15.7 8.6 184 22.8 21.0 73 9.0 7.01990 .......................... 387 48.4 38.7 69 8.6 7.7 131 16.4 8.6 187 23.4 22.4 85 10.6 8.41989 .......................... 349 43.6 34.7 61 7.6 6.3 122 15.2 8.8 166 20.8 19.5 74 9.3 7.51988 .......................... 365 45.6 37.7 79 9.9 9.0 113 14.1 8.0 173 21.6 20.7 87 10.9 9.31987 .......................... 391 48.6 40.8 66 8.2 7.5 129 16.0 9.8 196 24.4 23.5 83 10.3 8.81986 .......................... 389 47.8 39.9 71 8.7 7.6 119 14.6 8.6 200 24.5 23.8 78 9.6 8.0
1985 .......................... 387 47.1 39.8 70 8.5 7.9 127 15.4 9.8 191 23.2 22.2 86 10.5 9.51984 .......................... 380 46.3 39.9 69 8.4 8.1 114 13.8 8.5 198 24.1 23.4 84 10.2 8.71983 .......................... 423 52.0 44.3 78 9.6 8.9 120 14.8 9.6 225 27.6 25.8 94 11.5 10.21982 .......................... 396 49.3 43.2 86 10.7 10.3 114 14.2 9.5 196 24.4 23.3 89 11.1 10.51981 .......................... 471 59.2 52.6 100 12.6 12.1 126 15.9 10.6 244 30.7 29.9 111 14.0 13.21980 .......................... 447 56.7 49.9 87 11.0 10.9 125 15.9 10.9 235 29.8 28.1 101 12.8 12.31979 .......................... 424 53.7 47.2 66 8.4 9.0 112 14.2 9.3 246 31.1 28.9 64 8.1 8.1
All races, male1992 .......................... 258 63.3 53.5 45 11.0 9.2 84 20.6 13.5 130 31.8 30.8 41 10.1 8.11991 .......................... 241 60.2 52.2 42 10.5 9.5 67 16.7 10.9 132 33.0 31.8 44 11.0 8.81990 .......................... 248 62.7 54.0 49 12.4 11.1 70 17.8 11.2 129 32.5 31.7 49 12.4 10.51989 .......................... 224 56.4 48.8 39 9.8 8.4 65 16.4 11.6 120 30.2 28.8 41 10.3 8.61988 .......................... 240 60.5 54.0 58 14.6 13.4 58 14.7 10.1 123 31.1 30.5 50 12.6 11.31987 .......................... 262 65.6 58.7 48 12.0 11.3 77 19.4 13.9 136 34.2 33.5 50 12.5 10.91986 .......................... 263 65.2 58.4 52 12.9 11.6 66 16.3 11.5 145 36.0 35.3 49 12.1 10.6
1985 .......................... 256 62.6 57.1 41 10.0 9.0 71 17.3 13.2 144 35.3 34.9 49 12.0 10.91984 .......................... 264 64.8 59.3 54 13.2 12.8 65 15.9 11.5 146 35.7 35.0 50 12.3 11.61983 .......................... 283 70.0 63.5 55 13.6 12.4 66 16.4 12.6 162 40.0 38.5 59 14.6 13.01982 .......................... 269 67.2 62.0 65 16.2 15.6 61 15.2 11.6 143 35.8 34.8 49 12.2 11.71981 .......................... 317 80.0 74.8 69 17.4 16.5 67 17.0 13.3 181 45.6 45.0 61 15.4 14.71980 .......................... 301 76.4 70.2 58 14.7 14.6 73 18.6 14.3 170 43.1 41.2 59 15.0 14.11979 .......................... 280 71.1 66.1 43 10.9 11.6 64 16.3 12.5 173 43.9 42.1 39 9.9 9.9
All races, female1992 .......................... 140 33.7 23.6 29 7.0 6.2 59 14.3 6.2 52 12.5 11.1 32 7.7 5.81991 .......................... 126 31.0 20.3 15 3.7 3.3 60 14.6 6.7 52 12.7 10.3 29 7.1 5.31990 .......................... 139 34.4 24.2 20 5.0 4.5 61 15.0 6.3 58 14.5 13.4 36 8.9 6.41989 .......................... 125 31.0 21.1 22 5.5 4.5 57 14.1 6.2 46 11.5 10.5 33 8.2 6.51988 .......................... 125 31.0 22.0 21 5.2 4.8 54 13.5 6.2 50 12.3 11.0 37 9.2 7.41987 .......................... 129 31.9 23.7 18 4.4 3.9 52 12.7 6.1 60 14.7 13.7 33 8.1 6.71986 .......................... 126 30.7 22.3 19 4.6 3.9 53 12.9 6.0 54 13.2 12.4 29 7.1 5.6
- 91 -

Table 1. Number of deaths and unadjusted and age-adjusted death rates per 100,000 population for different categories of alcohol-related mortality byState: United States, 1979–92.
Montana
Race, sex,and year
All Alcohol-Related Causes of DeathAll Chronic Liver Disease and
CirrhosisTotal Causes of Death with ExplicitMention of Alcohol
Other Alcohol-Related Diseases Other Alcohol-Related Injuries orAdverse Effects
Number Unadj.Rate
Age-Adj.Rate Number Unadj.
RateAge-Adj.
Rate Number Unadj.Rate
Age-Adj.Rate Number Unadj.
RateAge-Adj.
Rate Number Unadj.Rate
Age-Adj.Rate
All races, female
1985 .......................... 132 31.8 23.3 29 7.0 7.1 56 13.5 6.6 47 11.3 9.6 37 8.9 8.21984 .......................... 116 28.1 21.4 15 3.6 3.7 49 11.9 5.9 52 12.6 11.9 34 8.2 6.01983 .......................... 140 34.2 25.9 23 5.6 5.6 54 13.2 7.0 63 15.4 13.3 35 8.6 7.51982 .......................... 127 31.5 24.9 21 5.2 5.3 53 13.1 7.8 53 13.2 11.8 40 9.9 9.41981 .......................... 153 38.4 31.0 31 7.8 8.2 59 14.8 8.2 63 15.9 14.6 50 12.5 11.81980 .......................... 146 37.0 30.4 29 7.3 7.4 52 13.2 8.0 65 16.5 15.0 42 10.6 10.81979 .......................... 143 36.3 28.8 23 5.8 6.5 48 12.1 6.6 73 18.4 15.8 25 6.3 6.4
White, male1992 .......................... 235 61.9 50.5 37 9.7 7.8 82 21.5 13.5 116 30.6 29.2 35 9.2 7.01991 .......................... 213 57.2 48.0 35 9.4 8.1 64 17.1 10.7 115 30.8 29.2 38 10.2 7.81990 .......................... 213 57.9 47.8 35 9.5 8.0 67 18.1 10.8 112 30.2 28.9 38 10.3 8.21989 .......................... 199 53.8 44.9 31 8.4 6.9 62 16.9 11.4 106 28.6 26.5 33 8.9 7.01988 .......................... 199 53.9 46.0 40 10.8 9.2 56 15.2 10.0 103 27.8 26.7 39 10.5 8.71987 .......................... 234 62.7 54.0 43 11.5 10.4 75 20.0 13.8 116 31.1 29.9 46 12.3 10.41986 .......................... 234 61.9 53.4 46 12.2 10.4 64 16.8 11.3 125 32.9 31.6 46 12.2 10.2
1985 .......................... 228 59.4 52.1 29 7.6 6.0 69 17.9 13.1 130 33.9 33.0 39 10.2 8.51984 .......................... 229 59.6 52.9 39 10.2 9.3 61 15.9 11.1 129 33.5 32.5 39 10.2 9.01983 .......................... 236 62.0 54.4 36 9.4 8.2 62 16.3 11.9 138 36.3 34.3 45 11.8 10.01982 .......................... 231 61.1 54.4 49 13.0 11.7 58 15.4 11.2 124 32.8 31.4 41 10.9 9.71981 .......................... 267 71.2 64.9 52 13.9 12.6 65 17.3 13.2 150 40.0 39.0 46 12.3 11.31980 .......................... 259 69.5 61.9 44 11.8 11.1 70 18.8 13.9 145 38.9 36.9 47 12.6 11.31979 .......................... 243 65.0 58.6 32 8.6 8.6 63 16.7 12.4 148 39.7 37.6 30 8.0 7.3
Black, male1992 .......................... 0 0.0 0.0 0 0.0 0.0 0 0.0 0.0 0 0.0 0.0 0 0.0 0.01991 .......................... - 4.6 11.3 0 0.0 0.0 - 4.6 11.3 0 0.0 0.0 0 0.0 0.01990 .......................... 2 109.9 162.0 0 0.0 0.0 - 10.4 23.4 1 99.5 138.6 0 0.0 0.01989 .......................... 0 0.0 0.0 0 0.0 0.0 0 0.0 0.0 0 0.0 0.0 0 0.0 0.01988 .......................... 1 63.2 78.9 0 0.0 0.0 - 10.6 13.9 1 52.5 65.1 0 0.0 0.01987 .......................... - 20.3 14.8 0 0.0 0.0 0 0.0 0.0 - 20.3 14.8 0 0.0 0.01986 .......................... 1 67.5 107.0 0 0.0 0.0 1 39.9 88.2 - 27.6 18.9 1 72.6 157.1
1985 .......................... 0 0.0 0.0 0 0.0 0.0 0 0.0 0.0 0 0.0 0.0 0 0.0 0.01984 .......................... - 20.8 30.5 0 0.0 0.0 - 5.4 19.4 - 15.4 11.1 0 0.0 0.01983 .......................... 1 79.1 186.3 1 79.1 186.3 0 0.0 0.0 0 0.0 0.0 0 0.0 0.01982 .......................... 1 111.5 139.5 1 82.6 113.2 - 5.8 9.3 - 23.1 17.0 1 82.6 113.2
- 92 -

Table 1. Number of deaths and unadjusted and age-adjusted death rates per 100,000 population for different categories of alcohol-related mortality byState: United States, 1979–92.
Montana
Race, sex,and year
All Alcohol-Related Causes of DeathAll Chronic Liver Disease and
CirrhosisTotal Causes of Death with ExplicitMention of Alcohol
Other Alcohol-Related Diseases Other Alcohol-Related Injuries orAdverse Effects
Number Unadj.Rate
Age-Adj.Rate Number Unadj.
RateAge-Adj.
Rate Number Unadj.Rate
Age-Adj.Rate Number Unadj.
RateAge-Adj.
Rate Number Unadj.Rate
Age-Adj.Rate
Black, male1981 .......................... 1 122.2 199.1 0 0.0 0.0 1 63.2 92.7 1 59.0 106.4 0 0.0 0.01980 .......................... - 30.3 42.3 0 0.0 0.0 - 6.1 8.7 - 24.3 33.6 0 0.0 0.01979 .......................... 3 283.8 443.9 1 84.0 203.1 0 0.0 0.0 2 199.8 240.8 0 0.0 0.0
White, female1992 .......................... 126 32.7 21.5 23 6.0 5.1 57 14.7 6.0 46 12.0 10.3 29 7.5 5.31991 .......................... 111 29.2 17.7 8 2.1 1.6 56 14.8 6.3 47 12.4 9.8 21 5.5 3.51990 .......................... 116 30.8 19.6 13 3.5 2.9 56 14.8 5.8 47 12.6 10.9 24 6.4 3.91989 .......................... 105 27.8 16.8 9 2.4 1.3 55 14.6 6.1 41 10.9 9.4 18 4.8 3.01988 .......................... 107 28.4 18.6 15 4.0 3.5 52 13.7 5.9 41 10.8 9.2 31 8.2 6.21987 .......................... 113 29.7 20.6 10 2.6 2.0 50 13.1 6.0 53 14.0 12.6 24 6.3 4.61986 .......................... 112 29.2 19.6 14 3.6 2.7 51 13.3 5.8 47 12.3 11.1 23 6.0 4.3
1985 .......................... 119 30.7 21.2 22 5.7 5.5 54 13.9 6.5 43 11.1 9.1 31 8.0 7.11984 .......................... 99 25.5 18.1 8 2.1 2.0 47 12.0 5.6 45 11.5 10.5 28 7.2 4.81983 .......................... 123 31.9 22.6 16 4.2 3.8 52 13.4 6.7 55 14.4 12.1 26 6.8 5.21982 .......................... 110 28.8 21.2 13 3.4 3.2 49 12.9 7.2 47 12.5 10.9 30 7.9 7.01981 .......................... 121 32.0 23.3 11 2.9 2.8 56 14.8 7.6 54 14.3 12.9 29 7.7 6.11980 .......................... 128 34.1 26.6 20 5.4 5.1 50 13.3 7.7 58 15.4 13.8 33 8.8 8.51979 .......................... 120 32.0 23.4 10 2.7 2.7 45 11.9 5.9 65 17.5 14.7 18 4.8 4.6
Black, female1992 .......................... - 6.6 2.2 0 0.0 0.0 - 6.6 2.2 0 0.0 0.0 0 0.0 0.01991 .......................... - 48.8 39.3 0 0.0 0.0 - 48.8 39.3 0 0.0 0.0 1 97.6 78.71990 .......................... - 46.0 13.9 0 0.0 0.0 0 0.0 0.0 - 46.0 13.9 0 0.0 0.01989 .......................... 0 0.0 0.0 0 0.0 0.0 0 0.0 0.0 0 0.0 0.0 0 0.0 0.01988 .......................... - 5.4 1.5 0 0.0 0.0 - 5.4 1.5 0 0.0 0.0 0 0.0 0.01987 .......................... 0 0.0 0.0 0 0.0 0.0 0 0.0 0.0 0 0.0 0.0 0 0.0 0.01986 .......................... - 7.9 13.7 0 0.0 0.0 - 7.9 13.7 0 0.0 0.0 0 0.0 0.0
1985 .......................... 0 0.0 0.0 0 0.0 0.0 0 0.0 0.0 0 0.0 0.0 0 0.0 0.01984 .......................... - 15.1 27.7 0 0.0 0.0 - 15.1 27.7 0 0.0 0.0 0 0.0 0.01983 .......................... 0 0.0 0.0 0 0.0 0.0 0 0.0 0.0 0 0.0 0.0 0 0.0 0.01982 .......................... - 9.8 9.7 0 0.0 0.0 - 9.8 9.7 0 0.0 0.0 0 0.0 0.01981 .......................... - 10.2 20.6 0 0.0 0.0 - 10.2 20.6 0 0.0 0.0 0 0.0 0.01980 .......................... 0 0.0 0.0 0 0.0 0.0 0 0.0 0.0 0 0.0 0.0 0 0.0 0.01979 .......................... - 70.0 119.0 0 0.0 0.0 - 70.0 119.0 0 0.0 0.0 0 0.0 0.0
- The AAF methodology used to estimate alcohol-related mortality can result in fractional estimates less than 0.5 but greater than 0.
- 93 -

Table 1. Number of deaths and unadjusted and age-adjusted death rates per 100,000 population for different categories of alcohol-related mortality byState: United States, 1979–92.
Nebraska
Race, sex,and year
All Alcohol-Related Causes of DeathAll Chronic Liver Disease and
CirrhosisTotal Causes of Death with ExplicitMention of Alcohol
Other Alcohol-Related Diseases Other Alcohol-Related Injuries orAdverse Effects
Number Unadj.Rate
Age-Adj.Rate Number Unadj.
RateAge-Adj.
Rate Number Unadj.Rate
Age-Adj.Rate Number Unadj.
RateAge-Adj.
Rate Number Unadj.Rate
Age-Adj.Rate
All races, both sexes1992 .......................... 588 36.7 26.9 100 6.2 5.6 240 15.0 7.5 248 15.5 13.8 100 6.2 5.21991 .......................... 617 38.8 28.0 91 5.7 5.0 253 15.9 7.7 273 17.2 15.3 105 6.6 5.21990 .......................... 588 37.2 27.0 71 4.5 4.2 260 16.4 8.2 257 16.3 14.7 94 5.9 5.01989 .......................... 616 39.1 28.5 101 6.4 5.5 257 16.3 8.1 258 16.4 14.8 113 7.2 5.61988 .......................... 606 38.6 27.7 93 5.9 5.3 254 16.1 7.7 259 16.5 14.7 102 6.5 5.21987 .......................... 573 36.6 26.5 66 4.2 3.5 239 15.3 7.6 268 17.1 15.4 88 5.6 4.21986 .......................... 627 39.8 29.9 88 5.6 5.0 257 16.3 8.5 281 17.9 16.4 119 7.6 6.3
1985 .......................... 594 37.5 27.5 92 5.8 5.6 253 16.0 8.3 249 15.7 13.7 120 7.6 6.51984 .......................... 611 38.5 27.8 97 6.1 5.4 253 15.9 8.1 261 16.4 14.3 117 7.4 6.31983 .......................... 598 37.8 27.5 95 6.0 5.5 263 16.6 8.5 240 15.2 13.5 121 7.6 6.61982 .......................... 622 39.3 29.0 93 5.9 5.7 269 17.0 9.1 260 16.4 14.2 124 7.8 7.01981 .......................... 668 42.3 32.0 98 6.2 5.7 251 15.9 8.4 318 20.2 17.9 128 8.1 6.81980 .......................... 700 44.5 34.5 105 6.7 6.3 263 16.7 9.2 331 21.1 19.0 128 8.1 7.21979 .......................... 678 43.3 33.2 95 6.1 5.8 269 17.2 9.4 314 20.1 18.0 126 8.1 7.3
All races, male1992 .......................... 363 46.5 38.1 75 9.6 8.4 129 16.5 10.7 159 20.4 19.0 69 8.8 7.81991 .......................... 379 48.8 40.3 60 7.7 6.8 133 17.2 11.0 185 23.9 22.5 61 7.9 6.51990 .......................... 370 48.0 39.7 52 6.7 6.3 143 18.6 11.9 174 22.6 21.4 64 8.3 7.41989 .......................... 381 49.6 40.8 73 9.5 8.1 139 18.1 11.8 169 22.0 20.9 72 9.4 7.81988 .......................... 388 50.6 41.9 65 8.5 7.8 137 17.9 11.5 186 24.3 22.7 67 8.8 7.51987 .......................... 366 47.9 39.5 55 7.2 6.3 130 17.0 11.0 181 23.7 22.2 50 6.6 5.61986 .......................... 399 52.0 43.7 64 8.3 7.5 142 18.5 12.1 193 25.2 24.1 77 10.0 8.7
1985 .......................... 378 48.9 41.0 71 9.2 9.1 131 16.9 11.1 176 22.8 20.8 78 10.1 9.11984 .......................... 393 50.8 41.7 78 10.1 9.0 136 17.6 11.5 179 23.1 21.2 74 9.6 8.41983 .......................... 388 50.2 42.1 73 9.5 8.9 141 18.3 11.9 173 22.5 21.4 80 10.4 9.41982 .......................... 388 50.4 42.3 68 8.8 8.6 146 18.9 12.8 175 22.7 20.9 77 10.0 9.31981 .......................... 435 56.6 48.0 69 9.0 8.3 137 17.8 12.1 229 29.8 27.5 85 11.0 9.71980 .......................... 447 58.3 50.8 84 10.9 10.6 137 17.9 12.3 226 29.5 27.9 83 10.8 10.31979 .......................... 447 58.5 49.8 74 9.7 9.4 149 19.6 13.1 223 29.2 27.3 85 11.1 10.3
All races, female1992 .......................... 224 27.4 16.8 25 3.1 3.0 111 13.5 4.8 89 10.8 8.9 31 3.8 2.91991 .......................... 238 29.2 16.8 31 3.8 3.4 119 14.6 5.0 88 10.8 8.4 44 5.4 4.01990 .......................... 218 27.0 15.5 19 2.3 2.3 116 14.4 5.1 83 10.3 8.1 30 3.7 2.71989 .......................... 235 29.2 17.5 28 3.5 3.3 119 14.7 5.1 89 11.0 9.1 41 5.1 3.61988 .......................... 218 27.1 14.7 28 3.5 3.1 116 14.5 4.7 74 9.1 6.9 35 4.3 3.11987 .......................... 207 25.8 14.8 11 1.4 1.0 109 13.6 4.9 87 10.9 8.8 38 4.7 2.91986 .......................... 228 28.2 17.5 24 3.0 2.8 115 14.3 5.7 89 11.0 8.9 42 5.2 4.2
- 94 -
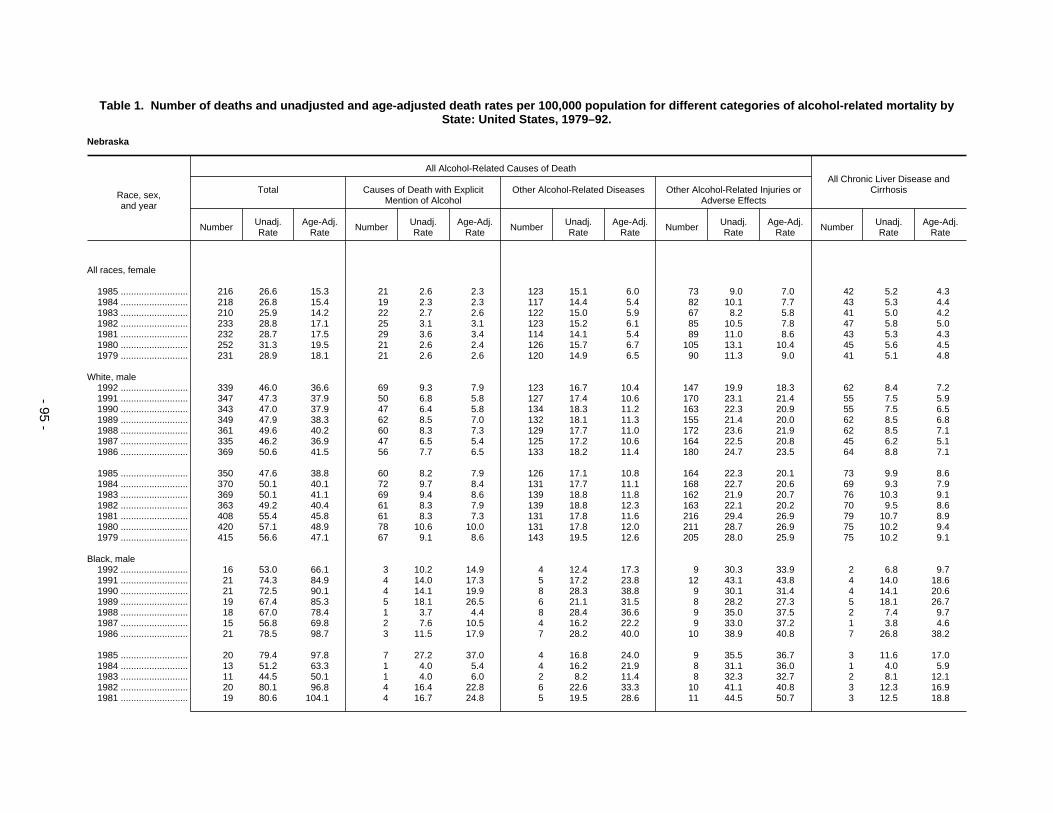
Table 1. Number of deaths and unadjusted and age-adjusted death rates per 100,000 population for different categories of alcohol-related mortality byState: United States, 1979–92.
Nebraska
Race, sex,and year
All Alcohol-Related Causes of DeathAll Chronic Liver Disease and
CirrhosisTotal Causes of Death with ExplicitMention of Alcohol
Other Alcohol-Related Diseases Other Alcohol-Related Injuries orAdverse Effects
Number Unadj.Rate
Age-Adj.Rate Number Unadj.
RateAge-Adj.
Rate Number Unadj.Rate
Age-Adj.Rate Number Unadj.
RateAge-Adj.
Rate Number Unadj.Rate
Age-Adj.Rate
All races, female
1985 .......................... 216 26.6 15.3 21 2.6 2.3 123 15.1 6.0 73 9.0 7.0 42 5.2 4.31984 .......................... 218 26.8 15.4 19 2.3 2.3 117 14.4 5.4 82 10.1 7.7 43 5.3 4.41983 .......................... 210 25.9 14.2 22 2.7 2.6 122 15.0 5.9 67 8.2 5.8 41 5.0 4.21982 .......................... 233 28.8 17.1 25 3.1 3.1 123 15.2 6.1 85 10.5 7.8 47 5.8 5.01981 .......................... 232 28.7 17.5 29 3.6 3.4 114 14.1 5.4 89 11.0 8.6 43 5.3 4.31980 .......................... 252 31.3 19.5 21 2.6 2.4 126 15.7 6.7 105 13.1 10.4 45 5.6 4.51979 .......................... 231 28.9 18.1 21 2.6 2.6 120 14.9 6.5 90 11.3 9.0 41 5.1 4.8
White, male1992 .......................... 339 46.0 36.6 69 9.3 7.9 123 16.7 10.4 147 19.9 18.3 62 8.4 7.21991 .......................... 347 47.3 37.9 50 6.8 5.8 127 17.4 10.6 170 23.1 21.4 55 7.5 5.91990 .......................... 343 47.0 37.9 47 6.4 5.8 134 18.3 11.2 163 22.3 20.9 55 7.5 6.51989 .......................... 349 47.9 38.3 62 8.5 7.0 132 18.1 11.3 155 21.4 20.0 62 8.5 6.81988 .......................... 361 49.6 40.2 60 8.3 7.3 129 17.7 11.0 172 23.6 21.9 62 8.5 7.11987 .......................... 335 46.2 36.9 47 6.5 5.4 125 17.2 10.6 164 22.5 20.8 45 6.2 5.11986 .......................... 369 50.6 41.5 56 7.7 6.5 133 18.2 11.4 180 24.7 23.5 64 8.8 7.1
1985 .......................... 350 47.6 38.8 60 8.2 7.9 126 17.1 10.8 164 22.3 20.1 73 9.9 8.61984 .......................... 370 50.1 40.1 72 9.7 8.4 131 17.7 11.1 168 22.7 20.6 69 9.3 7.91983 .......................... 369 50.1 41.1 69 9.4 8.6 139 18.8 11.8 162 21.9 20.7 76 10.3 9.11982 .......................... 363 49.2 40.4 61 8.3 7.9 139 18.8 12.3 163 22.1 20.2 70 9.5 8.61981 .......................... 408 55.4 45.8 61 8.3 7.3 131 17.8 11.6 216 29.4 26.9 79 10.7 8.91980 .......................... 420 57.1 48.9 78 10.6 10.0 131 17.8 12.0 211 28.7 26.9 75 10.2 9.41979 .......................... 415 56.6 47.1 67 9.1 8.6 143 19.5 12.6 205 28.0 25.9 75 10.2 9.1
Black, male1992 .......................... 16 53.0 66.1 3 10.2 14.9 4 12.4 17.3 9 30.3 33.9 2 6.8 9.71991 .......................... 21 74.3 84.9 4 14.0 17.3 5 17.2 23.8 12 43.1 43.8 4 14.0 18.61990 .......................... 21 72.5 90.1 4 14.1 19.9 8 28.3 38.8 9 30.1 31.4 4 14.1 20.61989 .......................... 19 67.4 85.3 5 18.1 26.5 6 21.1 31.5 8 28.2 27.3 5 18.1 26.71988 .......................... 18 67.0 78.4 1 3.7 4.4 8 28.4 36.6 9 35.0 37.5 2 7.4 9.71987 .......................... 15 56.8 69.8 2 7.6 10.5 4 16.2 22.2 9 33.0 37.2 1 3.8 4.61986 .......................... 21 78.5 98.7 3 11.5 17.9 7 28.2 40.0 10 38.9 40.8 7 26.8 38.2
1985 .......................... 20 79.4 97.8 7 27.2 37.0 4 16.8 24.0 9 35.5 36.7 3 11.6 17.01984 .......................... 13 51.2 63.3 1 4.0 5.4 4 16.2 21.9 8 31.1 36.0 1 4.0 5.91983 .......................... 11 44.5 50.1 1 4.0 6.0 2 8.2 11.4 8 32.3 32.7 2 8.1 12.11982 .......................... 20 80.1 96.8 4 16.4 22.8 6 22.6 33.3 10 41.1 40.8 3 12.3 16.91981 .......................... 19 80.6 104.1 4 16.7 24.8 5 19.5 28.6 11 44.5 50.7 3 12.5 18.8
- 95 -

Table 1. Number of deaths and unadjusted and age-adjusted death rates per 100,000 population for different categories of alcohol-related mortality byState: United States, 1979–92.
Nebraska
Race, sex,and year
All Alcohol-Related Causes of DeathAll Chronic Liver Disease and
CirrhosisTotal Causes of Death with ExplicitMention of Alcohol
Other Alcohol-Related Diseases Other Alcohol-Related Injuries orAdverse Effects
Number Unadj.Rate
Age-Adj.Rate Number Unadj.
RateAge-Adj.
Rate Number Unadj.Rate
Age-Adj.Rate Number Unadj.
RateAge-Adj.
Rate Number Unadj.Rate
Age-Adj.Rate
Black, male1980 .......................... 17 71.0 84.2 2 8.5 13.1 5 21.0 26.0 10 41.6 45.1 4 16.9 24.11979 .......................... 23 99.8 118.1 4 17.3 22.1 6 24.5 33.2 13 58.0 62.7 6 26.0 35.2
White, female1992 .......................... 205 26.5 15.2 15 1.9 1.9 106 13.7 4.6 84 10.8 8.7 22 2.8 2.01991 .......................... 223 28.9 15.8 24 3.1 2.6 115 14.9 4.8 84 10.9 8.4 37 4.8 3.31990 .......................... 201 26.2 14.1 10 1.3 1.2 114 14.8 5.0 78 10.1 7.9 24 3.1 1.91989 .......................... 217 28.4 16.0 19 2.5 2.2 115 15.0 5.0 83 10.9 8.9 33 4.3 2.61988 .......................... 207 27.1 14.2 25 3.3 2.8 112 14.7 4.5 70 9.2 6.8 31 4.1 2.71987 .......................... 195 25.5 14.0 9 1.2 0.8 104 13.7 4.6 81 10.6 8.5 33 4.3 2.31986 .......................... 217 28.2 16.8 22 2.9 2.6 112 14.5 5.6 83 10.8 8.6 39 5.1 3.9
1985 .......................... 204 26.3 14.4 14 1.8 1.5 119 15.4 5.8 70 9.1 7.1 35 4.5 3.61984 .......................... 208 26.8 15.0 16 2.1 2.0 114 14.7 5.3 78 10.1 7.6 38 4.9 3.91983 .......................... 199 25.7 13.6 20 2.6 2.4 118 15.2 5.7 62 7.9 5.5 39 5.0 4.11982 .......................... 213 27.4 15.2 17 2.2 2.3 119 15.4 5.9 77 9.9 7.1 38 4.9 4.11981 .......................... 218 28.1 16.5 25 3.2 3.0 107 13.9 5.0 85 11.0 8.5 36 4.7 3.61980 .......................... 242 31.4 18.8 18 2.3 2.0 123 16.0 6.7 100 13.0 10.2 42 5.4 4.21979 .......................... 216 28.1 16.7 15 2.0 1.9 115 15.0 6.2 86 11.2 8.7 34 4.4 3.9
Black, female1992 .......................... 11 36.0 40.9 4 13.0 18.0 4 13.3 13.8 3 9.6 9.0 5 16.3 20.81991 .......................... 8 28.0 30.3 2 6.6 9.3 3 8.8 9.5 4 12.6 11.6 2 6.6 9.31990 .......................... 8 27.5 28.7 1 3.4 4.4 2 7.3 8.0 5 16.8 16.3 2 6.7 9.51989 .......................... 8 26.9 28.0 1 3.4 5.2 3 11.1 10.8 4 12.4 12.0 1 3.4 5.21988 .......................... 5 17.7 18.2 1 3.5 4.6 3 11.0 10.6 1 3.2 3.0 1 3.5 4.61987 .......................... 7 23.4 23.6 0 0.0 0.0 3 11.3 12.0 3 12.1 11.6 2 7.2 9.71986 .......................... 7 26.3 25.4 0 0.0 0.0 3 10.0 10.6 4 16.2 14.8 0 0.0 0.0
1985 .......................... 7 27.5 32.6 4 14.7 19.5 2 8.7 9.5 1 4.1 3.7 3 11.0 14.61984 .......................... 7 25.2 26.2 1 3.7 5.0 3 10.5 11.4 3 11.0 9.8 4 14.9 21.01983 .......................... 8 29.3 29.6 1 3.8 4.4 4 14.1 15.7 3 11.4 9.5 1 3.8 4.41982 .......................... 17 64.7 73.0 5 19.3 25.0 4 16.2 18.4 8 29.3 29.5 6 23.2 30.21981 .......................... 8 31.4 32.0 0 0.0 0.0 5 19.8 20.9 3 11.6 11.0 2 7.9 11.01980 .......................... 5 21.8 22.2 0 0.0 0.0 2 9.8 10.3 3 12.0 11.8 0 0.0 0.01979 .......................... 9 36.8 43.6 2 8.1 10.7 5 18.6 22.3 2 10.0 10.5 2 8.1 11.3
- 96 -

Table 1. Number of deaths and unadjusted and age-adjusted death rates per 100,000 population for different categories of alcohol-related mortality byState: United States, 1979–92.
Nevada
Race, sex,and year
All Alcohol-Related Causes of DeathAll Chronic Liver Disease and
CirrhosisTotal Causes of Death with ExplicitMention of Alcohol
Other Alcohol-Related Diseases Other Alcohol-Related Injuries orAdverse Effects
Number Unadj.Rate
Age-Adj.Rate Number Unadj.
RateAge-Adj.
Rate Number Unadj.Rate
Age-Adj.Rate Number Unadj.
RateAge-Adj.
Rate Number Unadj.Rate
Age-Adj.Rate
All races, both sexes1992 .......................... 636 47.6 41.2 156 11.7 10.0 187 14.0 10.0 293 21.9 21.1 177 13.2 10.91991 .......................... 662 51.4 45.1 172 13.4 11.5 171 13.3 9.5 319 24.8 24.0 172 13.4 11.21990 .......................... 654 53.7 47.2 183 15.0 13.2 166 13.6 9.8 305 25.0 24.2 170 13.9 11.81989 .......................... 604 53.1 46.7 161 14.2 12.5 164 14.5 10.8 279 24.5 23.5 154 13.5 11.61988 .......................... 553 51.4 45.2 146 13.6 11.7 142 13.2 10.0 265 24.7 23.6 181 16.8 14.51987 .......................... 546 53.4 47.1 165 16.1 14.6 140 13.7 10.3 241 23.6 22.2 176 17.2 15.21986 .......................... 541 55.2 49.1 152 15.5 13.9 148 15.1 11.8 241 24.6 23.4 171 17.4 15.1
1985 .......................... 482 50.7 45.3 122 12.8 11.6 132 13.8 10.8 228 24.0 22.9 125 13.1 11.71984 .......................... 470 50.9 45.7 107 11.6 10.2 131 14.2 11.3 232 25.1 24.1 140 15.1 13.41983 .......................... 483 53.5 49.1 114 12.6 11.9 131 14.5 12.1 238 26.4 25.2 158 17.5 16.31982 .......................... 508 57.6 53.8 108 12.3 11.7 118 13.4 11.2 282 32.0 30.8 135 15.3 14.61981 .......................... 531 62.7 58.7 136 16.0 15.4 116 13.7 11.8 279 32.9 31.6 157 18.5 17.41980 .......................... 555 68.6 64.8 143 17.6 16.9 117 14.4 12.5 296 36.5 35.3 181 22.3 21.31979 .......................... 539 70.4 66.4 162 21.2 20.1 105 13.7 11.8 272 35.5 34.5 183 23.9 22.3
All races, male1992 .......................... 452 66.4 59.6 117 17.2 14.9 111 16.3 13.0 224 32.9 31.7 119 17.5 14.91991 .......................... 455 69.4 63.3 123 18.8 16.4 101 15.4 12.4 231 35.2 34.5 104 15.9 14.01990 .......................... 456 73.5 67.1 130 20.9 18.8 99 16.0 12.8 227 36.5 35.5 110 17.7 15.51989 .......................... 428 73.8 67.2 123 21.2 19.1 99 17.1 14.2 205 35.4 33.9 108 18.6 16.81988 .......................... 385 70.5 63.7 105 19.2 16.6 86 15.8 13.2 194 35.5 34.0 121 22.1 19.41987 .......................... 371 71.3 64.9 116 22.3 20.4 82 15.7 13.0 173 33.2 31.5 110 21.1 19.11986 .......................... 367 73.6 67.5 98 19.7 18.0 93 18.7 15.9 176 35.3 33.6 108 21.7 19.2
1985 .......................... 334 69.2 63.8 89 18.4 16.6 79 16.3 14.1 167 34.5 33.1 84 17.4 15.91984 .......................... 311 66.1 61.4 72 15.3 13.8 73 15.6 13.7 165 35.2 33.9 81 17.3 15.71983 .......................... 330 71.9 67.8 81 17.7 16.7 79 17.2 15.6 170 37.0 35.5 97 21.2 20.11982 .......................... 351 78.5 74.9 71 15.9 15.1 68 15.1 13.8 213 47.5 46.0 85 19.0 17.81981 .......................... 366 85.3 81.5 93 21.6 20.8 69 16.1 15.0 204 47.5 45.8 91 21.2 20.11980 .......................... 367 89.4 86.0 98 23.9 22.9 70 17.2 16.3 198 48.4 46.9 112 27.3 26.41979 .......................... 364 94.1 90.2 107 27.6 26.3 64 16.5 15.4 193 49.9 48.5 120 31.0 29.4
All races, female1992 .......................... 184 28.1 22.6 39 5.9 5.2 76 11.5 7.1 70 10.6 10.3 58 8.8 6.91991 .......................... 208 32.8 26.6 49 7.8 6.7 70 11.1 6.8 89 14.0 13.1 68 10.8 8.21990 .......................... 198 33.1 27.0 53 8.9 7.5 67 11.2 7.1 78 13.1 12.4 60 10.0 8.21989 .......................... 177 31.7 25.8 38 6.8 5.6 65 11.7 7.4 73 13.1 12.8 46 8.2 6.11988 .......................... 168 31.8 26.9 41 7.8 6.9 55 10.5 6.9 71 13.5 13.0 60 11.4 9.61987 .......................... 176 34.9 29.2 49 9.7 8.8 58 11.6 7.7 68 13.6 12.7 66 13.1 11.21986 .......................... 174 36.1 30.5 54 11.2 9.7 55 11.4 7.9 65 13.5 12.9 63 13.1 11.1
- 97 -

Table 1. Number of deaths and unadjusted and age-adjusted death rates per 100,000 population for different categories of alcohol-related mortality byState: United States, 1979–92.
Nevada
Race, sex,and year
All Alcohol-Related Causes of DeathAll Chronic Liver Disease and
CirrhosisTotal Causes of Death with ExplicitMention of Alcohol
Other Alcohol-Related Diseases Other Alcohol-Related Injuries orAdverse Effects
Number Unadj.Rate
Age-Adj.Rate Number Unadj.
RateAge-Adj.
Rate Number Unadj.Rate
Age-Adj.Rate Number Unadj.
RateAge-Adj.
Rate Number Unadj.Rate
Age-Adj.Rate
All races, female
1985 .......................... 148 31.6 26.9 33 7.1 6.6 53 11.4 7.8 62 13.2 12.5 41 8.8 7.61984 .......................... 160 35.1 30.2 35 7.7 6.7 58 12.7 9.3 67 14.8 14.2 59 13.0 10.91983 .......................... 153 34.5 30.4 33 7.4 7.1 52 11.7 8.7 68 15.3 14.6 61 13.7 12.51982 .......................... 156 36.0 32.3 37 8.5 8.3 50 11.6 8.8 69 15.9 15.2 50 11.5 11.21981 .......................... 165 39.4 35.9 43 10.3 9.9 47 11.2 8.9 75 18.0 17.1 66 15.8 15.01980 .......................... 189 47.1 43.6 45 11.2 10.9 46 11.6 9.1 97 24.3 23.5 69 17.2 16.31979 .......................... 174 46.1 42.6 55 14.6 14.0 41 10.8 8.5 79 20.8 20.0 63 16.7 15.4
White, male1992 .......................... 402 67.1 57.9 109 18.2 15.2 105 17.6 13.3 188 31.3 29.4 114 19.0 15.51991 .......................... 404 69.7 61.4 113 19.5 16.4 92 16.0 12.1 198 34.2 32.9 94 16.2 13.81990 .......................... 396 72.0 63.8 117 21.3 18.4 89 16.1 12.2 190 34.6 33.2 99 18.0 15.01989 .......................... 373 72.4 63.5 113 21.9 19.0 90 17.5 13.7 170 33.0 30.7 97 18.8 16.41988 .......................... 336 69.0 60.5 91 18.7 15.5 77 15.9 12.6 167 34.4 32.4 110 22.6 19.01987 .......................... 335 72.2 63.8 105 22.6 20.0 77 16.6 13.0 153 32.9 30.8 105 22.6 19.71986 .......................... 329 73.9 65.9 92 20.7 18.2 83 18.6 15.0 154 34.6 32.7 102 22.9 19.4
1985 .......................... 302 69.8 62.7 82 19.0 16.4 71 16.5 13.6 148 34.3 32.7 79 18.3 16.01984 .......................... 280 66.5 60.1 64 15.2 13.1 68 16.1 13.5 148 35.2 33.6 75 17.8 15.61983 .......................... 289 70.4 64.7 71 17.3 15.8 75 18.3 15.8 143 34.8 33.1 86 20.9 19.11982 .......................... 307 76.5 71.3 63 15.7 14.3 61 15.1 13.1 184 45.7 43.9 76 18.9 17.01981 .......................... 323 83.6 78.2 81 20.9 19.5 60 15.5 13.7 182 47.1 45.0 82 21.2 19.41980 .......................... 322 86.9 81.8 87 23.5 21.6 64 17.2 15.5 171 46.2 44.7 95 25.7 23.81979 .......................... 318 90.8 85.2 94 26.8 24.5 57 16.3 14.6 167 47.6 46.1 110 31.4 28.7
Black, male1992 .......................... 34 72.9 79.8 3 6.4 9.0 4 7.9 11.2 28 58.7 59.6 3 6.4 8.91991 .......................... 35 77.5 86.3 6 13.4 15.7 6 13.7 19.1 23 50.4 51.5 7 15.6 19.61990 .......................... 43 103.8 120.1 9 21.7 28.1 9 20.6 31.3 25 61.5 60.7 6 14.5 18.81989 .......................... 37 96.3 101.6 4 10.5 12.2 6 16.9 24.5 26 68.9 64.9 6 15.8 20.41988 .......................... 35 99.8 119.0 9 25.3 33.0 7 19.7 29.3 19 54.8 56.6 6 16.9 23.11987 .......................... 20 59.2 74.4 5 14.9 21.4 4 10.6 16.6 11 33.8 36.4 1 3.0 4.81986 .......................... 22 69.3 81.6 1 3.1 4.8 6 19.7 30.4 15 46.5 46.5 2 6.3 9.3
1985 .......................... 20 64.3 78.0 4 12.9 17.1 5 17.3 26.5 11 34.1 34.4 2 6.5 9.81984 .......................... 19 61.8 75.6 4 13.3 14.3 3 11.6 19.6 11 36.9 41.7 1 3.3 3.91983 .......................... 24 82.0 94.4 3 10.2 13.9 3 10.0 16.1 18 61.8 64.4 6 20.4 29.61982 .......................... 27 94.0 114.0 2 7.0 10.1 6 19.4 32.4 19 67.6 71.5 4 14.0 22.61981 .......................... 25 90.1 118.5 5 18.3 27.3 6 20.7 33.5 14 51.1 57.7 3 11.0 14.3
- 98 -

Table 1. Number of deaths and unadjusted and age-adjusted death rates per 100,000 population for different categories of alcohol-related mortality byState: United States, 1979–92.
Nevada
Race, sex,and year
All Alcohol-Related Causes of DeathAll Chronic Liver Disease and
CirrhosisTotal Causes of Death with ExplicitMention of Alcohol
Other Alcohol-Related Diseases Other Alcohol-Related Injuries orAdverse Effects
Number Unadj.Rate
Age-Adj.Rate Number Unadj.
RateAge-Adj.
Rate Number Unadj.Rate
Age-Adj.Rate Number Unadj.
RateAge-Adj.
Rate Number Unadj.Rate
Age-Adj.Rate
Black, male1980 .......................... 26 98.3 110.4 5 19.3 26.0 3 12.2 19.7 17 66.8 64.6 7 27.0 39.71979 .......................... 23 93.8 124.9 3 12.4 17.4 5 19.7 35.8 15 61.6 71.7 2 8.3 12.3
White, female1992 .......................... 161 28.1 21.5 35 6.1 5.2 69 12.0 6.9 57 10.0 9.4 50 8.7 6.51991 .......................... 188 33.9 26.5 45 8.1 6.8 64 11.5 6.5 79 14.3 13.2 65 11.7 8.51990 .......................... 175 33.3 26.0 47 8.9 7.4 62 11.8 6.9 66 12.6 11.7 52 9.9 7.71989 .......................... 158 32.2 25.3 37 7.5 6.0 60 12.2 7.3 61 12.5 11.9 44 8.9 6.41988 .......................... 148 31.8 26.2 33 7.1 6.2 51 11.0 6.9 64 13.7 13.1 50 10.7 8.81987 .......................... 162 36.3 29.7 45 10.1 9.0 53 11.9 7.3 64 14.3 13.4 63 14.1 11.71986 .......................... 157 36.8 30.2 51 11.9 10.0 49 11.5 7.5 57 13.4 12.8 60 14.0 11.5
1985 .......................... 132 31.7 26.1 28 6.7 6.2 49 11.7 7.5 55 13.3 12.3 35 8.4 7.01984 .......................... 145 35.8 29.6 31 7.7 6.3 54 13.4 9.3 60 14.8 14.0 54 13.3 10.51983 .......................... 138 34.8 29.6 28 7.1 6.4 49 12.5 8.8 60 15.3 14.4 55 13.9 11.91982 .......................... 142 36.7 32.0 34 8.8 8.3 48 12.3 8.9 61 15.6 14.8 46 11.9 11.21981 .......................... 151 40.5 35.8 38 10.2 9.4 44 11.9 9.0 69 18.5 17.4 59 15.8 14.31980 .......................... 166 46.3 41.9 41 11.4 10.8 40 11.3 8.2 85 23.6 22.9 59 16.5 14.91979 .......................... 155 45.7 41.0 48 14.1 13.0 38 11.2 8.4 69 20.4 19.6 56 16.5 14.4
Black, female1992 .......................... 11 24.7 25.8 0 0.0 0.0 4 9.8 11.0 7 15.0 14.8 3 6.6 7.41991 .......................... 13 30.9 34.7 3 7.0 8.3 5 10.5 12.4 6 13.4 14.1 3 7.0 8.61990 .......................... 14 34.2 38.4 2 5.0 5.9 4 8.9 11.4 8 20.3 21.1 5 12.5 16.11989 .......................... 10 26.3 27.0 0 0.0 0.0 3 9.1 9.6 6 17.2 17.5 1 2.7 2.71988 .......................... 10 29.6 31.5 5 14.6 15.4 2 5.2 6.3 3 9.8 9.8 4 11.6 13.11987 .......................... 7 23.0 26.1 1 3.1 2.4 3 10.1 14.0 3 9.9 9.7 0 0.0 0.01986 .......................... 8 25.3 31.4 0 0.0 0.0 5 14.8 20.1 3 10.5 11.2 1 3.2 4.6
1985 .......................... 11 35.4 41.6 2 6.7 9.5 3 10.9 14.6 5 17.9 17.4 3 10.0 13.21984 .......................... 5 17.8 20.7 0 0.0 0.0 2 7.1 10.2 3 10.7 10.5 1 3.4 5.11983 .......................... 6 21.8 24.3 1 3.5 4.1 2 6.2 8.4 3 12.1 11.7 3 10.5 12.41982 .......................... 8 29.1 36.6 1 3.6 5.6 2 7.4 11.0 5 18.2 20.0 2 7.2 9.81981 .......................... 4 14.9 16.7 0 0.0 0.0 1 2.9 4.4 3 12.0 12.2 1 3.7 4.51980 .......................... 10 39.7 50.0 0 0.0 0.0 5 19.0 30.2 5 20.7 19.8 4 15.5 21.81979 .......................... 7 27.6 28.9 0 0.0 0.0 2 6.8 11.1 5 20.8 17.8 0 0.0 0.0
- 99 -

Table 1. Number of deaths and unadjusted and age-adjusted death rates per 100,000 population for different categories of alcohol-related mortality byState: United States, 1979–92.
New Hampshire
Race, sex,and year
All Alcohol-Related Causes of DeathAll Chronic Liver Disease and
CirrhosisTotal Causes of Death with ExplicitMention of Alcohol
Other Alcohol-Related Diseases Other Alcohol-Related Injuries orAdverse Effects
Number Unadj.Rate
Age-Adj.Rate Number Unadj.
RateAge-Adj.
Rate Number Unadj.Rate
Age-Adj.Rate Number Unadj.
RateAge-Adj.
Rate Number Unadj.Rate
Age-Adj.Rate
All races, both sexes1992 .......................... 394 35.3 26.3 78 7.0 6.1 187 16.8 10.4 129 11.6 9.8 96 8.6 6.81991 .......................... 394 35.6 27.9 73 6.6 5.9 174 15.7 9.7 147 13.3 12.3 94 8.5 6.91990 .......................... 403 36.2 28.3 72 6.5 6.1 173 15.5 9.6 158 14.2 12.6 110 9.9 7.81989 .......................... 422 38.2 30.8 79 7.2 6.3 174 15.8 10.3 169 15.3 14.3 118 10.7 8.81988 .......................... 389 36.0 28.9 66 6.1 5.8 173 16.0 10.2 150 13.9 12.8 122 11.3 9.81987 .......................... 401 38.0 30.3 59 5.6 5.1 173 16.4 10.6 169 16.0 14.5 84 8.0 7.01986 .......................... 386 37.6 30.0 70 6.8 6.3 162 15.8 10.0 153 15.0 13.6 102 10.0 8.6
1985 .......................... 384 38.5 29.9 60 6.0 5.4 164 16.5 10.0 160 16.0 14.5 90 9.0 7.71984 .......................... 370 37.9 30.5 62 6.3 6.0 155 15.9 10.3 153 15.6 14.2 117 12.0 10.51983 .......................... 385 40.1 32.6 56 5.8 5.6 176 18.4 12.4 153 15.9 14.6 110 11.5 10.11982 .......................... 342 36.0 29.0 40 4.2 3.6 153 16.1 10.6 149 15.7 14.8 100 10.6 8.71981 .......................... 379 40.4 32.0 51 5.4 5.2 171 18.3 11.6 156 16.7 15.1 106 11.3 9.61980 .......................... 378 40.8 33.3 81 8.8 8.2 154 16.7 11.0 143 15.4 14.2 122 13.2 11.61979 .......................... 391 42.8 35.6 62 6.8 6.6 174 19.1 13.6 155 17.0 15.4 116 12.7 11.7
All races, male1992 .......................... 255 46.7 39.7 56 10.3 9.3 107 19.5 15.3 92 16.9 15.1 56 10.3 8.91991 .......................... 252 46.5 40.8 55 10.1 9.2 95 17.6 13.4 102 18.8 18.3 61 11.3 9.91990 .......................... 262 48.1 42.7 57 10.5 9.8 95 17.5 13.9 110 20.2 19.0 73 13.4 11.51989 .......................... 267 49.2 44.2 54 10.0 9.3 102 18.9 15.2 110 20.3 19.7 68 12.6 11.41988 .......................... 238 44.9 40.3 44 8.3 7.9 98 18.5 14.9 96 18.2 17.5 82 15.5 14.21987 .......................... 253 49.0 43.8 39 7.6 7.1 103 20.0 16.1 111 21.5 20.6 58 11.2 10.31986 .......................... 247 49.4 44.3 52 10.4 10.0 85 17.0 13.7 110 22.0 20.6 66 13.2 12.1
1985 .......................... 243 50.0 44.4 44 9.0 8.7 92 18.8 14.6 108 22.1 21.1 62 12.7 11.81984 .......................... 239 50.1 44.6 46 9.6 9.3 89 18.6 14.7 104 21.9 20.6 76 15.9 14.71983 .......................... 253 54.2 48.9 45 9.6 9.3 104 22.2 18.3 105 22.4 21.3 77 16.5 15.31982 .......................... 224 48.6 43.5 29 6.3 5.6 88 19.0 15.5 107 23.3 22.3 68 14.7 13.21981 .......................... 242 53.0 47.0 33 7.2 7.1 100 22.0 17.1 108 23.8 22.8 70 15.3 13.91980 .......................... 241 53.5 48.2 54 12.0 11.4 82 18.2 14.7 105 23.2 22.1 66 14.6 13.51979 .......................... 255 57.4 52.6 41 9.2 9.0 104 23.4 20.1 110 24.8 23.5 63 14.2 13.4
All races, female1992 .......................... 139 24.4 14.3 22 3.9 3.2 80 14.1 6.3 36 6.4 4.9 40 7.0 4.91991 .......................... 142 25.2 16.4 18 3.2 3.0 79 14.0 6.8 45 8.0 6.6 33 5.8 4.11990 .......................... 141 24.8 15.3 15 2.6 2.7 78 13.7 6.1 48 8.5 6.5 37 6.5 4.61989 .......................... 155 27.6 18.7 25 4.4 3.5 72 12.8 6.2 58 10.4 9.0 50 8.9 6.51988 .......................... 151 27.3 18.9 22 4.0 4.1 75 13.7 6.5 54 9.7 8.4 40 7.2 6.01987 .......................... 148 27.5 18.4 20 3.7 3.5 70 13.0 6.2 58 10.8 8.7 26 4.8 4.11986 .......................... 138 26.4 17.1 18 3.4 3.0 77 14.7 7.1 43 8.3 6.9 36 6.9 5.5
- 100 -
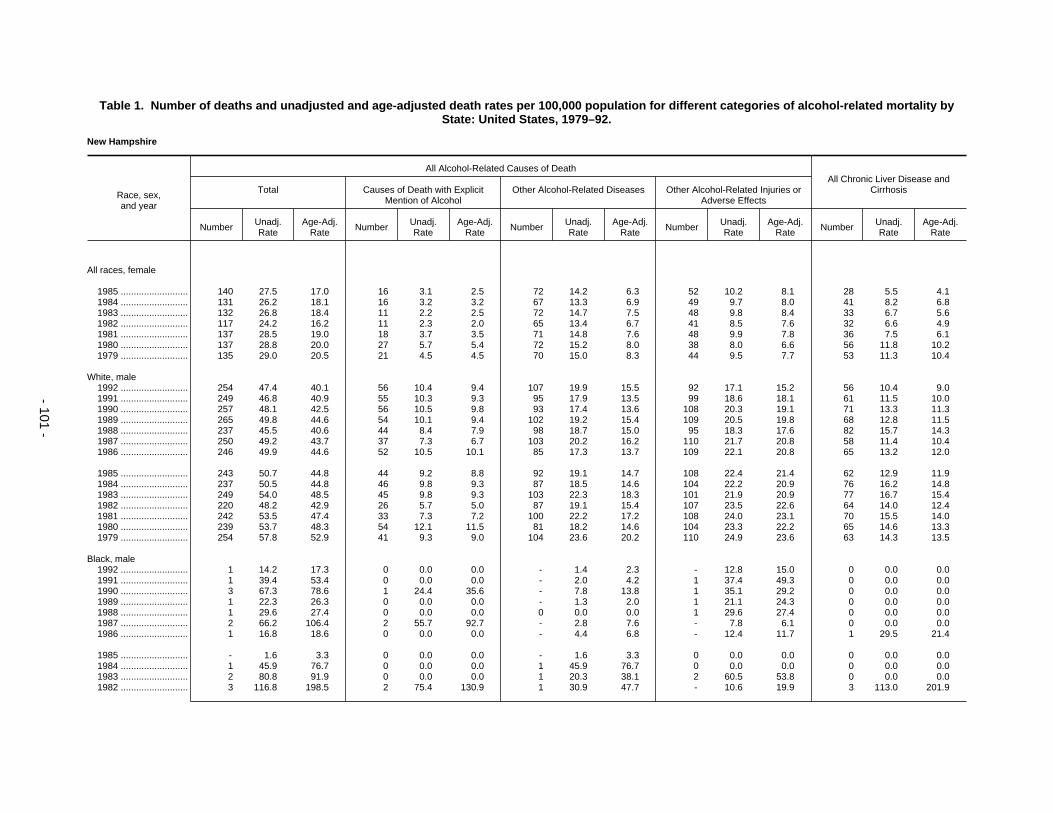
Table 1. Number of deaths and unadjusted and age-adjusted death rates per 100,000 population for different categories of alcohol-related mortality byState: United States, 1979–92.
New Hampshire
Race, sex,and year
All Alcohol-Related Causes of DeathAll Chronic Liver Disease and
CirrhosisTotal Causes of Death with ExplicitMention of Alcohol
Other Alcohol-Related Diseases Other Alcohol-Related Injuries orAdverse Effects
Number Unadj.Rate
Age-Adj.Rate Number Unadj.
RateAge-Adj.
Rate Number Unadj.Rate
Age-Adj.Rate Number Unadj.
RateAge-Adj.
Rate Number Unadj.Rate
Age-Adj.Rate
All races, female
1985 .......................... 140 27.5 17.0 16 3.1 2.5 72 14.2 6.3 52 10.2 8.1 28 5.5 4.11984 .......................... 131 26.2 18.1 16 3.2 3.2 67 13.3 6.9 49 9.7 8.0 41 8.2 6.81983 .......................... 132 26.8 18.4 11 2.2 2.5 72 14.7 7.5 48 9.8 8.4 33 6.7 5.61982 .......................... 117 24.2 16.2 11 2.3 2.0 65 13.4 6.7 41 8.5 7.6 32 6.6 4.91981 .......................... 137 28.5 19.0 18 3.7 3.5 71 14.8 7.6 48 9.9 7.8 36 7.5 6.11980 .......................... 137 28.8 20.0 27 5.7 5.4 72 15.2 8.0 38 8.0 6.6 56 11.8 10.21979 .......................... 135 29.0 20.5 21 4.5 4.5 70 15.0 8.3 44 9.5 7.7 53 11.3 10.4
White, male1992 .......................... 254 47.4 40.1 56 10.4 9.4 107 19.9 15.5 92 17.1 15.2 56 10.4 9.01991 .......................... 249 46.8 40.9 55 10.3 9.3 95 17.9 13.5 99 18.6 18.1 61 11.5 10.01990 .......................... 257 48.1 42.5 56 10.5 9.8 93 17.4 13.6 108 20.3 19.1 71 13.3 11.31989 .......................... 265 49.8 44.6 54 10.1 9.4 102 19.2 15.4 109 20.5 19.8 68 12.8 11.51988 .......................... 237 45.5 40.6 44 8.4 7.9 98 18.7 15.0 95 18.3 17.6 82 15.7 14.31987 .......................... 250 49.2 43.7 37 7.3 6.7 103 20.2 16.2 110 21.7 20.8 58 11.4 10.41986 .......................... 246 49.9 44.6 52 10.5 10.1 85 17.3 13.7 109 22.1 20.8 65 13.2 12.0
1985 .......................... 243 50.7 44.8 44 9.2 8.8 92 19.1 14.7 108 22.4 21.4 62 12.9 11.91984 .......................... 237 50.5 44.8 46 9.8 9.3 87 18.5 14.6 104 22.2 20.9 76 16.2 14.81983 .......................... 249 54.0 48.5 45 9.8 9.3 103 22.3 18.3 101 21.9 20.9 77 16.7 15.41982 .......................... 220 48.2 42.9 26 5.7 5.0 87 19.1 15.4 107 23.5 22.6 64 14.0 12.41981 .......................... 242 53.5 47.4 33 7.3 7.2 100 22.2 17.2 108 24.0 23.1 70 15.5 14.01980 .......................... 239 53.7 48.3 54 12.1 11.5 81 18.2 14.6 104 23.3 22.2 65 14.6 13.31979 .......................... 254 57.8 52.9 41 9.3 9.0 104 23.6 20.2 110 24.9 23.6 63 14.3 13.5
Black, male1992 .......................... 1 14.2 17.3 0 0.0 0.0 - 1.4 2.3 - 12.8 15.0 0 0.0 0.01991 .......................... 1 39.4 53.4 0 0.0 0.0 - 2.0 4.2 1 37.4 49.3 0 0.0 0.01990 .......................... 3 67.3 78.6 1 24.4 35.6 - 7.8 13.8 1 35.1 29.2 0 0.0 0.01989 .......................... 1 22.3 26.3 0 0.0 0.0 - 1.3 2.0 1 21.1 24.3 0 0.0 0.01988 .......................... 1 29.6 27.4 0 0.0 0.0 0 0.0 0.0 1 29.6 27.4 0 0.0 0.01987 .......................... 2 66.2 106.4 2 55.7 92.7 - 2.8 7.6 - 7.8 6.1 0 0.0 0.01986 .......................... 1 16.8 18.6 0 0.0 0.0 - 4.4 6.8 - 12.4 11.7 1 29.5 21.4
1985 .......................... - 1.6 3.3 0 0.0 0.0 - 1.6 3.3 0 0.0 0.0 0 0.0 0.01984 .......................... 1 45.9 76.7 0 0.0 0.0 1 45.9 76.7 0 0.0 0.0 0 0.0 0.01983 .......................... 2 80.8 91.9 0 0.0 0.0 1 20.3 38.1 2 60.5 53.8 0 0.0 0.01982 .......................... 3 116.8 198.5 2 75.4 130.9 1 30.9 47.7 - 10.6 19.9 3 113.0 201.9
- 101 -

Table 1. Number of deaths and unadjusted and age-adjusted death rates per 100,000 population for different categories of alcohol-related mortality byState: United States, 1979–92.
New Hampshire
Race, sex,and year
All Alcohol-Related Causes of DeathAll Chronic Liver Disease and
CirrhosisTotal Causes of Death with ExplicitMention of Alcohol
Other Alcohol-Related Diseases Other Alcohol-Related Injuries orAdverse Effects
Number Unadj.Rate
Age-Adj.Rate Number Unadj.
RateAge-Adj.
Rate Number Unadj.Rate
Age-Adj.Rate Number Unadj.
RateAge-Adj.
Rate Number Unadj.Rate
Age-Adj.Rate
Black, male1981 .......................... 0 0.0 0.0 0 0.0 0.0 0 0.0 0.0 0 0.0 0.0 0 0.0 0.01980 .......................... 1 41.6 81.5 0 0.0 0.0 1 33.0 73.0 - 8.6 8.6 1 42.9 83.61979 .......................... 1 30.4 25.9 0 0.0 0.0 - 2.2 5.9 1 28.2 20.0 0 0.0 0.0
White, female1992 .......................... 138 24.6 14.3 22 3.9 3.2 80 14.3 6.3 36 6.4 4.8 40 7.1 5.01991 .......................... 141 25.3 16.3 18 3.2 3.0 79 14.2 6.9 44 7.9 6.4 33 5.9 4.11990 .......................... 141 25.2 15.4 15 2.7 2.8 77 13.9 6.1 48 8.7 6.6 37 6.6 4.61989 .......................... 155 27.9 18.9 25 4.5 3.5 72 12.9 6.3 58 10.5 9.0 50 9.0 6.51988 .......................... 151 27.7 19.1 22 4.0 4.1 75 13.8 6.5 54 9.9 8.5 40 7.4 6.01987 .......................... 148 27.9 18.6 20 3.8 3.5 70 13.2 6.3 58 10.9 8.8 25 4.7 4.01986 .......................... 137 26.5 17.0 17 3.3 2.9 76 14.8 7.1 43 8.4 7.0 34 6.6 5.2
1985 .......................... 139 27.6 16.9 16 3.2 2.5 72 14.4 6.4 51 10.1 8.0 28 5.6 4.11984 .......................... 131 26.5 18.2 16 3.2 3.2 67 13.5 6.9 49 9.8 8.1 41 8.3 6.91983 .......................... 129 26.5 18.0 11 2.3 2.5 71 14.7 7.5 46 9.6 8.0 33 6.8 5.61982 .......................... 117 24.4 16.3 11 2.3 2.0 65 13.5 6.7 41 8.6 7.6 32 6.7 5.01981 .......................... 137 28.8 19.1 18 3.8 3.6 71 15.0 7.7 48 10.0 7.9 36 7.6 6.11980 .......................... 137 29.1 20.1 27 5.7 5.4 72 15.3 8.0 38 8.0 6.7 56 11.9 10.21979 .......................... 135 29.2 20.6 21 4.5 4.5 70 15.1 8.3 44 9.6 7.7 53 11.4 10.5
Black, female1992 .......................... 0 0.0 0.0 0 0.0 0.0 0 0.0 0.0 0 0.0 0.0 0 0.0 0.01991 .......................... 1 31.7 26.8 0 0.0 0.0 0 0.0 0.0 1 31.7 26.8 0 0.0 0.01990 .......................... - 6.1 8.4 0 0.0 0.0 - 6.1 8.4 0 0.0 0.0 0 0.0 0.01989 .......................... - 1.6 0.7 0 0.0 0.0 - 1.6 0.7 0 0.0 0.0 0 0.0 0.01988 .......................... - 4.0 3.6 0 0.0 0.0 - 4.0 3.6 0 0.0 0.0 0 0.0 0.01987 .......................... 0 0.0 0.0 0 0.0 0.0 0 0.0 0.0 0 0.0 0.0 0 0.0 0.01986 .......................... 1 39.7 74.6 1 37.8 71.1 - 1.9 3.6 0 0.0 0.0 1 37.8 71.1
1985 .......................... - 4.0 6.7 0 0.0 0.0 - 4.0 6.7 0 0.0 0.0 0 0.0 0.01984 .......................... - 2.2 4.2 0 0.0 0.0 - 2.2 4.2 0 0.0 0.0 0 0.0 0.01983 .......................... 2 79.4 92.8 0 0.0 0.0 - 18.5 34.6 1 60.9 58.3 0 0.0 0.01982 .......................... - 14.3 20.9 0 0.0 0.0 - 14.3 20.9 0 0.0 0.0 0 0.0 0.01981 .......................... 0 0.0 0.0 0 0.0 0.0 0 0.0 0.0 0 0.0 0.0 0 0.0 0.01980 .......................... - 4.0 5.5 0 0.0 0.0 - 4.0 5.5 0 0.0 0.0 0 0.0 0.01979 .......................... - 4.2 9.2 0 0.0 0.0 - 4.2 9.2 0 0.0 0.0 0 0.0 0.0
- The AAF methodology used to estimate alcohol-related mortality can result in fractional estimates less than 0.5 but greater than 0.
- 102 -
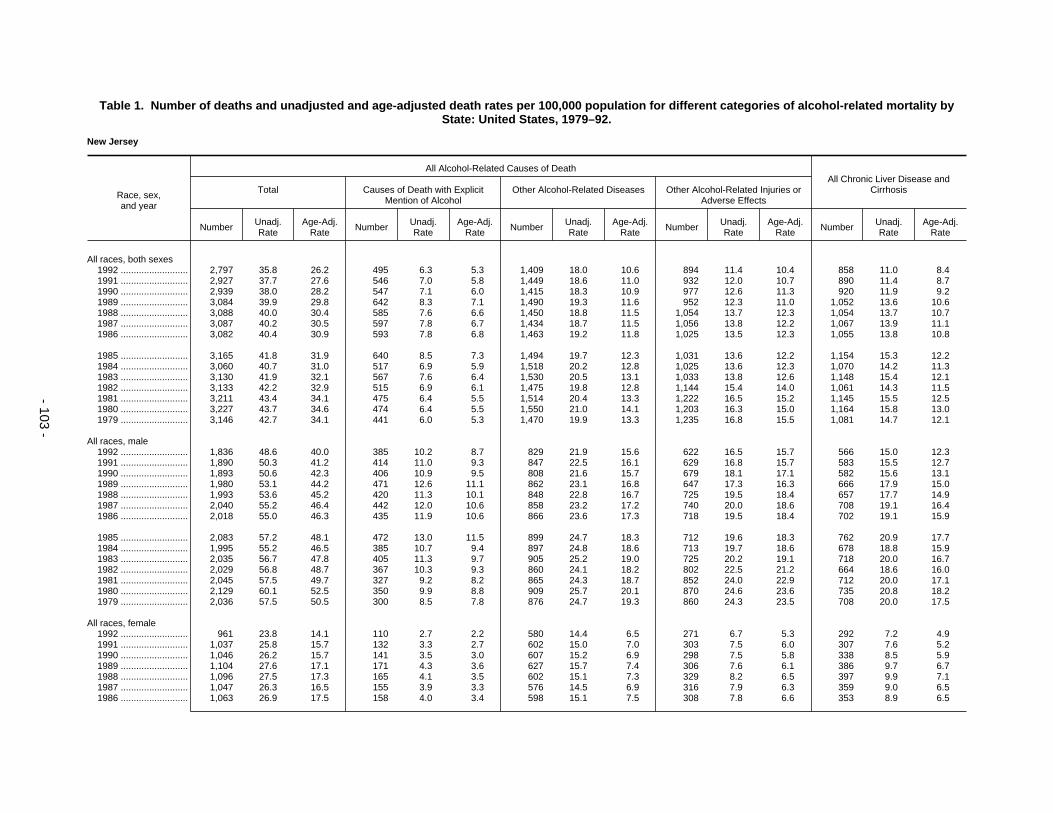
Table 1. Number of deaths and unadjusted and age-adjusted death rates per 100,000 population for different categories of alcohol-related mortality byState: United States, 1979–92.
New Jersey
Race, sex,and year
All Alcohol-Related Causes of DeathAll Chronic Liver Disease and
CirrhosisTotal Causes of Death with ExplicitMention of Alcohol
Other Alcohol-Related Diseases Other Alcohol-Related Injuries orAdverse Effects
Number Unadj.Rate
Age-Adj.Rate Number Unadj.
RateAge-Adj.
Rate Number Unadj.Rate
Age-Adj.Rate Number Unadj.
RateAge-Adj.
Rate Number Unadj.Rate
Age-Adj.Rate
All races, both sexes1992 .......................... 2,797 35.8 26.2 495 6.3 5.3 1,409 18.0 10.6 894 11.4 10.4 858 11.0 8.41991 .......................... 2,927 37.7 27.6 546 7.0 5.8 1,449 18.6 11.0 932 12.0 10.7 890 11.4 8.71990 .......................... 2,939 38.0 28.2 547 7.1 6.0 1,415 18.3 10.9 977 12.6 11.3 920 11.9 9.21989 .......................... 3,084 39.9 29.8 642 8.3 7.1 1,490 19.3 11.6 952 12.3 11.0 1,052 13.6 10.61988 .......................... 3,088 40.0 30.4 585 7.6 6.6 1,450 18.8 11.5 1,054 13.7 12.3 1,054 13.7 10.71987 .......................... 3,087 40.2 30.5 597 7.8 6.7 1,434 18.7 11.5 1,056 13.8 12.2 1,067 13.9 11.11986 .......................... 3,082 40.4 30.9 593 7.8 6.8 1,463 19.2 11.8 1,025 13.5 12.3 1,055 13.8 10.8
1985 .......................... 3,165 41.8 31.9 640 8.5 7.3 1,494 19.7 12.3 1,031 13.6 12.2 1,154 15.3 12.21984 .......................... 3,060 40.7 31.0 517 6.9 5.9 1,518 20.2 12.8 1,025 13.6 12.3 1,070 14.2 11.31983 .......................... 3,130 41.9 32.1 567 7.6 6.4 1,530 20.5 13.1 1,033 13.8 12.6 1,148 15.4 12.11982 .......................... 3,133 42.2 32.9 515 6.9 6.1 1,475 19.8 12.8 1,144 15.4 14.0 1,061 14.3 11.51981 .......................... 3,211 43.4 34.1 475 6.4 5.5 1,514 20.4 13.3 1,222 16.5 15.2 1,145 15.5 12.51980 .......................... 3,227 43.7 34.6 474 6.4 5.5 1,550 21.0 14.1 1,203 16.3 15.0 1,164 15.8 13.01979 .......................... 3,146 42.7 34.1 441 6.0 5.3 1,470 19.9 13.3 1,235 16.8 15.5 1,081 14.7 12.1
All races, male1992 .......................... 1,836 48.6 40.0 385 10.2 8.7 829 21.9 15.6 622 16.5 15.7 566 15.0 12.31991 .......................... 1,890 50.3 41.2 414 11.0 9.3 847 22.5 16.1 629 16.8 15.7 583 15.5 12.71990 .......................... 1,893 50.6 42.3 406 10.9 9.5 808 21.6 15.7 679 18.1 17.1 582 15.6 13.11989 .......................... 1,980 53.1 44.2 471 12.6 11.1 862 23.1 16.8 647 17.3 16.3 666 17.9 15.01988 .......................... 1,993 53.6 45.2 420 11.3 10.1 848 22.8 16.7 725 19.5 18.4 657 17.7 14.91987 .......................... 2,040 55.2 46.4 442 12.0 10.6 858 23.2 17.2 740 20.0 18.6 708 19.1 16.41986 .......................... 2,018 55.0 46.3 435 11.9 10.6 866 23.6 17.3 718 19.5 18.4 702 19.1 15.9
1985 .......................... 2,083 57.2 48.1 472 13.0 11.5 899 24.7 18.3 712 19.6 18.3 762 20.9 17.71984 .......................... 1,995 55.2 46.5 385 10.7 9.4 897 24.8 18.6 713 19.7 18.6 678 18.8 15.91983 .......................... 2,035 56.7 47.8 405 11.3 9.7 905 25.2 19.0 725 20.2 19.1 718 20.0 16.71982 .......................... 2,029 56.8 48.7 367 10.3 9.3 860 24.1 18.2 802 22.5 21.2 664 18.6 16.01981 .......................... 2,045 57.5 49.7 327 9.2 8.2 865 24.3 18.7 852 24.0 22.9 712 20.0 17.11980 .......................... 2,129 60.1 52.5 350 9.9 8.8 909 25.7 20.1 870 24.6 23.6 735 20.8 18.21979 .......................... 2,036 57.5 50.5 300 8.5 7.8 876 24.7 19.3 860 24.3 23.5 708 20.0 17.5
All races, female1992 .......................... 961 23.8 14.1 110 2.7 2.2 580 14.4 6.5 271 6.7 5.3 292 7.2 4.91991 .......................... 1,037 25.8 15.7 132 3.3 2.7 602 15.0 7.0 303 7.5 6.0 307 7.6 5.21990 .......................... 1,046 26.2 15.7 141 3.5 3.0 607 15.2 6.9 298 7.5 5.8 338 8.5 5.91989 .......................... 1,104 27.6 17.1 171 4.3 3.6 627 15.7 7.4 306 7.6 6.1 386 9.7 6.71988 .......................... 1,096 27.5 17.3 165 4.1 3.5 602 15.1 7.3 329 8.2 6.5 397 9.9 7.11987 .......................... 1,047 26.3 16.5 155 3.9 3.3 576 14.5 6.9 316 7.9 6.3 359 9.0 6.51986 .......................... 1,063 26.9 17.5 158 4.0 3.4 598 15.1 7.5 308 7.8 6.6 353 8.9 6.5
- 103 -
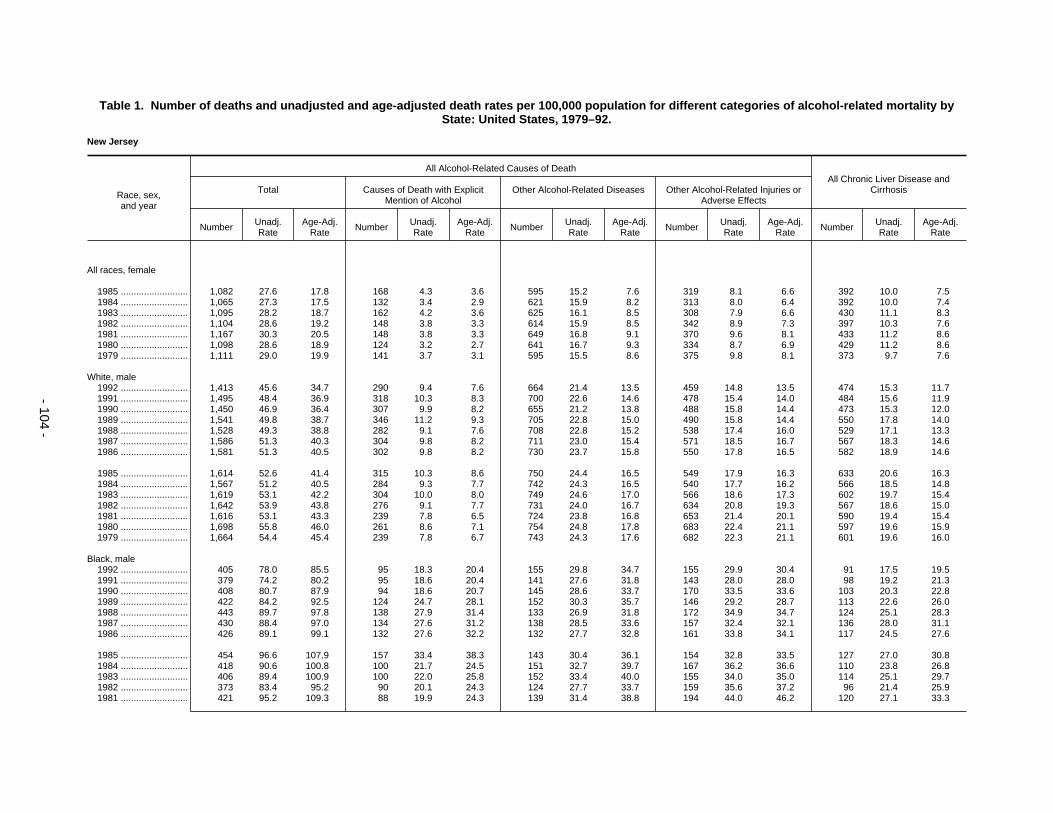
Table 1. Number of deaths and unadjusted and age-adjusted death rates per 100,000 population for different categories of alcohol-related mortality byState: United States, 1979–92.
New Jersey
Race, sex,and year
All Alcohol-Related Causes of DeathAll Chronic Liver Disease and
CirrhosisTotal Causes of Death with ExplicitMention of Alcohol
Other Alcohol-Related Diseases Other Alcohol-Related Injuries orAdverse Effects
Number Unadj.Rate
Age-Adj.Rate Number Unadj.
RateAge-Adj.
Rate Number Unadj.Rate
Age-Adj.Rate Number Unadj.
RateAge-Adj.
Rate Number Unadj.Rate
Age-Adj.Rate
All races, female
1985 .......................... 1,082 27.6 17.8 168 4.3 3.6 595 15.2 7.6 319 8.1 6.6 392 10.0 7.51984 .......................... 1,065 27.3 17.5 132 3.4 2.9 621 15.9 8.2 313 8.0 6.4 392 10.0 7.41983 .......................... 1,095 28.2 18.7 162 4.2 3.6 625 16.1 8.5 308 7.9 6.6 430 11.1 8.31982 .......................... 1,104 28.6 19.2 148 3.8 3.3 614 15.9 8.5 342 8.9 7.3 397 10.3 7.61981 .......................... 1,167 30.3 20.5 148 3.8 3.3 649 16.8 9.1 370 9.6 8.1 433 11.2 8.61980 .......................... 1,098 28.6 18.9 124 3.2 2.7 641 16.7 9.3 334 8.7 6.9 429 11.2 8.61979 .......................... 1,111 29.0 19.9 141 3.7 3.1 595 15.5 8.6 375 9.8 8.1 373 9.7 7.6
White, male1992 .......................... 1,413 45.6 34.7 290 9.4 7.6 664 21.4 13.5 459 14.8 13.5 474 15.3 11.71991 .......................... 1,495 48.4 36.9 318 10.3 8.3 700 22.6 14.6 478 15.4 14.0 484 15.6 11.91990 .......................... 1,450 46.9 36.4 307 9.9 8.2 655 21.2 13.8 488 15.8 14.4 473 15.3 12.01989 .......................... 1,541 49.8 38.7 346 11.2 9.3 705 22.8 15.0 490 15.8 14.4 550 17.8 14.01988 .......................... 1,528 49.3 38.8 282 9.1 7.6 708 22.8 15.2 538 17.4 16.0 529 17.1 13.31987 .......................... 1,586 51.3 40.3 304 9.8 8.2 711 23.0 15.4 571 18.5 16.7 567 18.3 14.61986 .......................... 1,581 51.3 40.5 302 9.8 8.2 730 23.7 15.8 550 17.8 16.5 582 18.9 14.6
1985 .......................... 1,614 52.6 41.4 315 10.3 8.6 750 24.4 16.5 549 17.9 16.3 633 20.6 16.31984 .......................... 1,567 51.2 40.5 284 9.3 7.7 742 24.3 16.5 540 17.7 16.2 566 18.5 14.81983 .......................... 1,619 53.1 42.2 304 10.0 8.0 749 24.6 17.0 566 18.6 17.3 602 19.7 15.41982 .......................... 1,642 53.9 43.8 276 9.1 7.7 731 24.0 16.7 634 20.8 19.3 567 18.6 15.01981 .......................... 1,616 53.1 43.3 239 7.8 6.5 724 23.8 16.8 653 21.4 20.1 590 19.4 15.41980 .......................... 1,698 55.8 46.0 261 8.6 7.1 754 24.8 17.8 683 22.4 21.1 597 19.6 15.91979 .......................... 1,664 54.4 45.4 239 7.8 6.7 743 24.3 17.6 682 22.3 21.1 601 19.6 16.0
Black, male1992 .......................... 405 78.0 85.5 95 18.3 20.4 155 29.8 34.7 155 29.9 30.4 91 17.5 19.51991 .......................... 379 74.2 80.2 95 18.6 20.4 141 27.6 31.8 143 28.0 28.0 98 19.2 21.31990 .......................... 408 80.7 87.9 94 18.6 20.7 145 28.6 33.7 170 33.5 33.6 103 20.3 22.81989 .......................... 422 84.2 92.5 124 24.7 28.1 152 30.3 35.7 146 29.2 28.7 113 22.6 26.01988 .......................... 443 89.7 97.8 138 27.9 31.4 133 26.9 31.8 172 34.9 34.7 124 25.1 28.31987 .......................... 430 88.4 97.0 134 27.6 31.2 138 28.5 33.6 157 32.4 32.1 136 28.0 31.11986 .......................... 426 89.1 99.1 132 27.6 32.2 132 27.7 32.8 161 33.8 34.1 117 24.5 27.6
1985 .......................... 454 96.6 107.9 157 33.4 38.3 143 30.4 36.1 154 32.8 33.5 127 27.0 30.81984 .......................... 418 90.6 100.8 100 21.7 24.5 151 32.7 39.7 167 36.2 36.6 110 23.8 26.81983 .......................... 406 89.4 100.9 100 22.0 25.8 152 33.4 40.0 155 34.0 35.0 114 25.1 29.71982 .......................... 373 83.4 95.2 90 20.1 24.3 124 27.7 33.7 159 35.6 37.2 96 21.4 25.91981 .......................... 421 95.2 109.3 88 19.9 24.3 139 31.4 38.8 194 44.0 46.2 120 27.1 33.3
- 104 -

Table 1. Number of deaths and unadjusted and age-adjusted death rates per 100,000 population for different categories of alcohol-related mortality byState: United States, 1979–92.
New Jersey
Race, sex,and year
All Alcohol-Related Causes of DeathAll Chronic Liver Disease and
CirrhosisTotal Causes of Death with ExplicitMention of Alcohol
Other Alcohol-Related Diseases Other Alcohol-Related Injuries orAdverse Effects
Number Unadj.Rate
Age-Adj.Rate Number Unadj.
RateAge-Adj.
Rate Number Unadj.Rate
Age-Adj.Rate Number Unadj.
RateAge-Adj.
Rate Number Unadj.Rate
Age-Adj.Rate
Black, male1980 .......................... 417 95.4 110.2 86 19.7 23.8 151 34.7 42.9 179 41.0 43.5 132 30.2 36.61979 .......................... 363 85.0 98.1 61 14.3 17.5 128 29.9 37.2 174 40.8 43.4 106 24.8 30.4
White, female1992 .......................... 801 24.3 12.9 84 2.6 1.9 501 15.2 6.1 216 6.6 4.9 258 7.8 5.01991 .......................... 853 25.9 14.1 95 2.9 2.2 516 15.7 6.4 242 7.4 5.5 253 7.7 4.71990 .......................... 855 26.0 14.0 95 2.9 2.4 526 16.0 6.5 234 7.1 5.1 274 8.3 5.21989 .......................... 917 27.8 15.5 123 3.7 2.9 546 16.6 6.9 248 7.5 5.7 319 9.7 6.11988 .......................... 907 27.4 15.4 115 3.5 2.8 526 15.9 6.7 266 8.0 6.0 331 10.0 6.51987 .......................... 867 26.2 14.6 105 3.2 2.4 501 15.2 6.4 260 7.9 5.8 298 9.0 5.91986 .......................... 871 26.4 15.4 107 3.2 2.6 519 15.7 6.9 245 7.4 5.9 286 8.7 5.7
1985 .......................... 878 26.7 15.4 114 3.5 2.7 519 15.8 7.0 245 7.4 5.7 320 9.7 6.61984 .......................... 884 26.9 15.5 88 2.7 2.1 532 16.2 7.4 264 8.0 6.1 324 9.9 6.61983 .......................... 918 28.0 16.8 117 3.6 2.8 542 16.5 7.8 259 7.9 6.3 356 10.9 7.31982 .......................... 930 28.4 17.5 108 3.3 2.8 536 16.4 7.8 286 8.7 6.9 332 10.1 7.01981 .......................... 1,002 30.6 18.9 121 3.7 2.9 570 17.4 8.3 312 9.5 7.6 363 11.1 7.71980 .......................... 944 28.8 17.3 101 3.1 2.4 565 17.2 8.6 278 8.5 6.4 362 11.1 7.81979 .......................... 957 29.1 18.5 116 3.5 2.7 523 15.9 8.0 318 9.7 7.8 317 9.6 6.9
Black, female1992 .......................... 151 26.3 23.8 26 4.5 4.4 75 12.9 10.9 51 8.8 8.5 33 5.7 5.41991 .......................... 173 30.6 28.1 37 6.5 6.4 82 14.5 12.5 54 9.6 9.2 54 9.5 9.31990 .......................... 175 31.1 28.5 45 8.0 8.2 75 13.4 11.2 54 9.7 9.1 64 11.4 11.11989 .......................... 181 32.4 30.3 48 8.6 8.9 78 14.1 12.2 54 9.8 9.3 65 11.7 11.51988 .......................... 177 32.2 30.5 50 9.1 9.3 72 13.0 11.6 56 10.1 9.6 62 11.2 11.41987 .......................... 171 31.5 30.1 50 9.2 9.6 71 13.0 11.6 51 9.3 9.0 60 11.0 11.51986 .......................... 182 33.9 33.0 50 9.3 9.6 75 14.0 13.3 57 10.6 10.2 64 11.9 12.3
1985 .......................... 196 37.1 35.8 54 10.2 10.5 74 14.0 12.9 68 12.9 12.4 70 13.2 13.81984 .......................... 176 33.6 33.2 44 8.4 8.9 86 16.4 15.8 46 8.8 8.6 67 12.8 13.51983 .......................... 172 33.3 33.8 45 8.7 9.6 80 15.5 15.2 47 9.1 9.0 73 14.1 15.41982 .......................... 166 32.6 33.0 40 7.8 8.3 74 14.5 14.8 52 10.2 10.0 64 12.6 13.01981 .......................... 159 31.4 32.2 27 5.3 5.8 77 15.2 15.6 55 10.9 10.9 68 13.5 14.61980 .......................... 152 30.4 31.5 23 4.6 5.2 76 15.2 15.7 53 10.6 10.6 67 13.4 15.01979 .......................... 150 30.8 31.7 25 5.1 5.7 70 14.2 15.0 56 11.4 11.0 54 11.0 12.4
- 105 -

Table 1. Number of deaths and unadjusted and age-adjusted death rates per 100,000 population for different categories of alcohol-related mortality byState: United States, 1979–92.
New Mexico
Race, sex,and year
All Alcohol-Related Causes of DeathAll Chronic Liver Disease and
CirrhosisTotal Causes of Death with ExplicitMention of Alcohol
Other Alcohol-Related Diseases Other Alcohol-Related Injuries orAdverse Effects
Number Unadj.Rate
Age-Adj.Rate Number Unadj.
RateAge-Adj.
Rate Number Unadj.Rate
Age-Adj.Rate Number Unadj.
RateAge-Adj.
Rate Number Unadj.Rate
Age-Adj.Rate
All races, both sexes1992 .......................... 859 54.3 48.1 259 16.4 15.3 212 13.4 9.2 387 24.5 23.6 229 14.5 13.01991 .......................... 839 54.2 48.7 225 14.5 13.9 207 13.4 9.3 407 26.3 25.5 220 14.2 13.11990 .......................... 847 55.7 51.3 254 16.7 16.5 206 13.6 9.6 387 25.4 25.1 233 15.3 14.21989 .......................... 835 55.5 51.1 233 15.5 15.1 194 12.9 9.0 409 27.2 27.0 208 13.8 12.81988 .......................... 819 54.9 50.3 192 12.9 12.7 186 12.5 8.9 441 29.6 28.7 194 13.0 12.31987 .......................... 816 55.2 51.3 199 13.5 13.4 185 12.5 9.3 432 29.2 28.7 208 14.1 13.51986 .......................... 832 56.9 53.0 189 12.9 13.1 195 13.3 10.1 448 30.6 29.7 219 15.0 14.6
1985 .......................... 802 55.8 52.4 216 15.0 15.4 171 11.9 9.1 415 28.8 27.9 201 14.0 13.91984 .......................... 767 54.2 50.8 185 13.1 13.3 176 12.4 9.7 406 28.7 27.8 177 12.5 12.51983 .......................... 718 51.5 49.0 165 11.8 12.4 169 12.1 9.6 384 27.5 27.0 190 13.6 13.91982 .......................... 796 58.4 56.4 186 13.6 14.6 185 13.6 11.1 425 31.1 30.7 182 13.3 13.31981 .......................... 754 56.6 55.3 221 16.6 17.7 164 12.3 10.3 369 27.7 27.3 181 13.6 14.01980 .......................... 890 68.0 67.0 255 19.5 21.0 175 13.4 11.1 460 35.2 34.9 176 13.4 13.91979 .......................... 874 68.3 67.3 235 18.4 19.9 172 13.4 11.4 468 36.5 36.0 181 14.1 14.9
All races, male1992 .......................... 598 76.7 71.8 193 24.8 23.8 120 15.4 12.0 285 36.6 36.0 146 18.7 17.81991 .......................... 584 76.7 73.4 164 21.5 21.4 117 15.4 12.4 303 39.8 39.6 139 18.2 17.71990 .......................... 598 79.9 77.2 195 26.1 26.1 122 16.3 13.3 280 37.5 37.7 165 22.1 21.21989 .......................... 585 79.0 76.3 178 24.1 23.7 104 14.1 11.6 302 40.8 41.0 141 19.1 18.61988 .......................... 574 78.2 75.4 143 19.5 19.5 105 14.4 11.9 326 44.4 44.0 128 17.4 17.31987 .......................... 570 78.2 76.2 146 20.1 20.3 102 14.0 12.0 322 44.2 43.9 124 17.0 17.01986 .......................... 604 83.9 82.2 152 21.1 21.9 120 16.6 14.5 333 46.2 45.7 157 21.8 22.3
1985 .......................... 570 80.5 79.1 164 23.1 24.2 101 14.3 12.6 305 43.1 42.3 140 19.8 20.21984 .......................... 552 79.0 78.3 144 20.6 21.5 100 14.3 13.0 308 44.1 43.8 131 18.8 19.51983 .......................... 518 75.4 75.3 130 18.9 20.3 94 13.7 12.4 294 42.8 42.5 136 19.8 20.91982 .......................... 574 85.4 86.7 152 22.6 24.7 104 15.5 14.5 318 47.3 47.4 120 17.9 18.71981 .......................... 547 83.3 85.4 178 27.1 29.9 92 14.0 13.4 277 42.2 42.1 129 19.7 21.31980 .......................... 661 102.4 104.4 200 31.0 34.2 102 15.8 14.7 359 55.6 55.5 113 17.5 19.31979 .......................... 645 102.1 104.4 190 30.1 33.4 101 16.0 15.3 354 56.1 55.7 123 19.5 21.5
All races, female1992 .......................... 261 32.5 25.9 66 8.2 7.4 93 11.5 6.9 102 12.7 11.7 83 10.3 8.41991 .......................... 254 32.4 25.3 61 7.8 6.9 89 11.3 6.6 104 13.3 11.7 81 10.3 8.91990 .......................... 249 32.3 26.9 59 7.6 7.5 84 10.9 6.5 106 13.8 12.9 68 8.8 7.81989 .......................... 251 32.8 27.5 55 7.2 7.1 89 11.7 6.9 106 13.9 13.6 67 8.8 7.51988 .......................... 245 32.4 26.6 49 6.5 6.4 80 10.6 6.3 116 15.3 13.9 66 8.7 7.81987 .......................... 246 32.8 27.8 53 7.1 7.0 84 11.1 7.0 110 14.6 13.8 84 11.2 10.21986 .......................... 227 30.6 25.6 37 5.0 4.9 75 10.2 6.4 115 15.5 14.2 62 8.4 7.4
- 106 -

Table 1. Number of deaths and unadjusted and age-adjusted death rates per 100,000 population for different categories of alcohol-related mortality byState: United States, 1979–92.
New Mexico
Race, sex,and year
All Alcohol-Related Causes of DeathAll Chronic Liver Disease and
CirrhosisTotal Causes of Death with ExplicitMention of Alcohol
Other Alcohol-Related Diseases Other Alcohol-Related Injuries orAdverse Effects
Number Unadj.Rate
Age-Adj.Rate Number Unadj.
RateAge-Adj.
Rate Number Unadj.Rate
Age-Adj.Rate Number Unadj.
RateAge-Adj.
Rate Number Unadj.Rate
Age-Adj.Rate
All races, female
1985 .......................... 232 31.7 27.3 52 7.1 7.2 70 9.6 6.2 110 15.0 14.0 61 8.4 8.01984 .......................... 216 30.0 24.9 41 5.7 5.7 76 10.5 6.9 99 13.7 12.4 46 6.4 6.21983 .......................... 200 28.3 24.2 35 4.9 5.1 75 10.6 7.1 90 12.7 12.0 54 7.6 7.41982 .......................... 222 32.1 28.0 34 4.9 5.3 81 11.7 8.2 107 15.5 14.5 62 9.0 8.41981 .......................... 207 30.6 27.0 43 6.4 6.4 72 10.6 7.7 93 13.7 13.0 52 7.7 7.41980 .......................... 230 34.6 31.8 55 8.3 8.8 73 11.0 8.0 102 15.4 15.0 63 9.5 8.91979 .......................... 229 35.3 32.2 45 6.9 7.3 71 10.9 7.9 114 17.5 16.9 58 8.9 8.7
White, male1992 .......................... 471 68.9 61.6 143 21.0 19.1 110 16.1 11.7 218 31.9 30.7 119 17.4 15.81991 .......................... 461 69.0 63.5 116 17.3 16.6 108 16.1 12.2 237 35.5 34.7 121 18.1 16.81990 .......................... 477 72.6 67.5 143 21.7 20.9 113 17.2 13.3 221 33.6 33.3 136 20.7 19.01989 .......................... 475 72.9 68.2 134 20.6 19.3 95 14.6 11.3 246 37.8 37.6 114 17.5 16.11988 .......................... 460 71.0 66.4 108 16.7 16.0 91 14.1 11.0 261 40.3 39.4 112 17.3 16.41987 .......................... 465 72.3 68.4 110 17.1 16.7 93 14.4 11.7 262 40.8 40.0 103 16.0 15.21986 .......................... 499 78.2 74.2 119 18.7 18.6 109 17.1 14.1 270 42.4 41.5 131 20.5 20.0
1985 .......................... 479 76.3 72.9 139 22.1 22.4 94 14.9 12.4 247 39.3 38.1 123 19.6 19.31984 .......................... 435 70.2 67.2 102 16.4 16.4 93 14.9 12.8 241 38.8 38.0 110 17.7 17.51983 .......................... 418 68.4 66.2 94 15.4 15.7 85 13.8 11.9 240 39.2 38.6 109 17.8 17.91982 .......................... 490 81.9 81.1 121 20.2 21.6 98 16.4 14.6 271 45.4 44.9 106 17.7 17.81981 .......................... 462 79.0 78.6 145 24.8 26.2 86 14.7 13.4 231 39.5 39.0 114 19.5 20.11980 .......................... 543 94.2 93.5 151 26.2 28.1 94 16.3 14.5 298 51.6 50.9 94 16.3 17.21979 .......................... 518 91.5 91.2 141 24.9 26.7 94 16.6 15.2 283 50.0 49.3 101 17.8 18.8
Black, male1992 .......................... 19 102.0 111.0 3 16.0 19.7 3 16.8 24.4 13 69.2 66.8 3 16.0 22.41991 .......................... 14 82.2 100.5 4 22.9 34.7 3 15.6 20.7 8 43.6 45.0 2 11.5 17.41990 .......................... 16 93.7 107.4 6 36.1 49.6 2 11.3 14.3 8 46.2 43.5 2 12.0 17.11989 .......................... 9 56.1 66.5 2 12.2 17.9 2 10.7 13.7 5 33.2 34.8 1 6.1 9.01988 .......................... 11 70.0 82.8 1 6.2 9.9 5 32.9 46.0 5 30.8 26.9 2 12.5 19.11987 .......................... 7 43.1 47.8 0 0.0 0.0 2 14.4 18.1 5 28.7 29.7 0 0.0 0.01986 .......................... 10 66.8 78.8 2 12.9 17.6 3 20.6 29.1 5 33.3 32.0 2 12.9 17.6
1985 .......................... 11 72.0 86.5 1 6.6 9.7 3 17.2 25.0 7 48.1 51.9 2 13.2 19.11984 .......................... 11 75.7 101.9 4 27.1 38.6 3 17.1 24.9 5 31.4 38.4 4 27.1 39.31983 .......................... 9 63.2 78.3 2 13.9 21.0 3 17.5 25.0 5 31.8 32.3 2 13.9 20.21982 .......................... 8 60.4 75.0 3 21.7 29.0 1 9.8 13.7 4 29.0 32.3 2 14.4 21.01981 .......................... 11 83.2 103.2 2 15.0 21.7 1 11.1 15.9 8 57.1 65.6 0 0.0 0.0
- 107 -

Table 1. Number of deaths and unadjusted and age-adjusted death rates per 100,000 population for different categories of alcohol-related mortality byState: United States, 1979–92.
New Mexico
Race, sex,and year
All Alcohol-Related Causes of DeathAll Chronic Liver Disease and
CirrhosisTotal Causes of Death with ExplicitMention of Alcohol
Other Alcohol-Related Diseases Other Alcohol-Related Injuries orAdverse Effects
Number Unadj.Rate
Age-Adj.Rate Number Unadj.
RateAge-Adj.
Rate Number Unadj.Rate
Age-Adj.Rate Number Unadj.
RateAge-Adj.
Rate Number Unadj.Rate
Age-Adj.Rate
Black, male1980 .......................... 15 117.8 144.6 6 46.5 62.7 2 12.1 17.2 8 59.1 64.7 5 38.8 50.51979 .......................... 11 86.7 111.7 5 40.1 55.9 2 14.4 20.3 4 32.2 35.5 0 0.0 0.0
White, female1992 .......................... 215 30.6 22.7 43 6.1 5.1 87 12.4 6.9 85 12.1 10.7 69 9.8 7.31991 .......................... 211 30.7 22.6 41 6.0 5.0 83 12.1 6.6 87 12.7 11.0 64 9.3 7.61990 .......................... 200 29.5 23.2 35 5.2 4.7 75 11.1 6.0 90 13.3 12.4 52 7.7 6.51989 .......................... 206 30.7 24.4 44 6.6 6.2 81 12.1 6.6 81 12.1 11.6 54 8.0 6.41988 .......................... 198 29.8 22.8 30 4.5 4.2 73 10.9 6.0 96 14.3 12.6 50 7.5 6.21987 .......................... 202 30.5 24.8 34 5.1 4.9 76 11.4 6.7 92 13.9 13.2 69 10.4 8.91986 .......................... 192 29.4 23.4 28 4.3 4.0 71 10.8 6.4 93 14.2 13.0 52 7.9 6.7
1985 .......................... 194 30.0 24.5 37 5.7 5.6 64 9.8 5.9 93 14.4 13.0 47 7.3 6.61984 .......................... 179 28.2 22.2 29 4.6 4.3 70 11.0 6.7 80 12.6 11.1 37 5.8 5.31983 .......................... 177 28.3 23.1 29 4.6 4.6 71 11.3 7.2 77 12.3 11.3 47 7.5 6.81982 .......................... 191 31.1 25.9 26 4.2 4.3 75 12.2 8.1 90 14.7 13.5 57 9.3 8.21981 .......................... 174 29.0 24.1 31 5.2 4.8 65 10.9 7.3 78 13.0 12.1 42 7.0 6.21980 .......................... 185 31.3 27.1 35 5.9 5.9 70 11.8 8.1 81 13.6 13.0 53 9.0 7.91979 .......................... 189 32.5 28.3 32 5.5 5.6 65 11.1 7.6 92 15.8 15.1 47 8.1 7.6
Black, female1992 .......................... 8 44.1 54.3 6 35.0 46.0 1 4.8 3.8 1 4.3 4.5 5 29.2 36.71991 .......................... 3 16.9 13.5 1 6.3 6.2 1 6.0 4.6 1 4.6 2.7 1 6.3 6.21990 .......................... 6 41.2 45.1 1 6.6 10.8 2 15.0 16.3 3 19.5 18.0 2 13.3 17.81989 .......................... 4 24.0 20.7 0 0.0 0.0 2 11.0 10.6 2 13.0 10.1 0 0.0 0.01988 .......................... 5 31.8 35.0 0 0.0 0.0 1 8.8 7.8 3 22.9 27.2 0 0.0 0.01987 .......................... 4 29.6 28.5 1 7.0 8.3 2 13.6 10.0 1 9.1 10.2 1 7.0 8.31986 .......................... 3 23.6 22.5 0 0.0 0.0 1 7.8 8.2 2 15.8 14.4 0 0.0 0.0
1985 .......................... 3 20.5 18.1 0 0.0 0.0 2 11.3 9.9 1 9.2 8.2 1 7.3 7.51984 .......................... 2 17.9 18.3 1 7.4 9.3 1 10.4 8.9 0 0.0 0.0 1 7.4 9.31983 .......................... 2 13.8 12.2 0 0.0 0.0 1 8.1 7.2 1 5.6 5.1 0 0.0 0.01982 .......................... 2 14.3 13.4 1 7.9 7.7 1 6.4 5.7 0 0.0 0.0 1 7.9 7.71981 .......................... 5 37.8 40.4 1 8.2 11.2 1 9.8 11.3 2 19.8 18.0 1 8.2 10.61980 .......................... 4 31.3 30.5 1 8.5 8.8 1 4.7 5.1 2 18.1 16.6 1 8.5 8.81979 .......................... 4 34.9 44.9 2 17.5 24.8 2 13.4 14.1 - 4.0 6.1 2 17.5 20.4
- The AAF methodology used to estimate alcohol-related mortality can result in fractional estimates less than 0.5 but greater than 0.
- 108 -

Table 1. Number of deaths and unadjusted and age-adjusted death rates per 100,000 population for different categories of alcohol-related mortality byState: United States, 1979–92.
New York
Race, sex,and year
All Alcohol-Related Causes of DeathAll Chronic Liver Disease and
CirrhosisTotal Causes of Death with ExplicitMention of Alcohol
Other Alcohol-Related Diseases Other Alcohol-Related Injuries orAdverse Effects
Number Unadj.Rate
Age-Adj.Rate Number Unadj.
RateAge-Adj.
Rate Number Unadj.Rate
Age-Adj.Rate Number Unadj.
RateAge-Adj.
Rate Number Unadj.Rate
Age-Adj.Rate
All races, both sexes1992 .......................... 7,780 43.0 33.9 1,811 10.0 8.7 3,086 17.0 10.2 2,883 15.9 15.0 2,001 11.0 8.71991 .......................... 7,900 43.8 34.7 1,721 9.5 8.3 3,104 17.2 10.4 3,075 17.0 16.1 1,941 10.8 8.51990 .......................... 8,017 44.5 35.2 1,692 9.4 8.2 3,185 17.7 10.7 3,140 17.4 16.3 2,078 11.5 9.21989 .......................... 8,005 44.5 35.0 1,654 9.2 8.2 3,245 18.0 11.1 3,106 17.3 15.8 2,167 12.1 9.81988 .......................... 8,355 46.6 36.6 1,852 10.3 9.3 3,398 18.9 11.6 3,105 17.3 15.7 2,569 14.3 12.01987 .......................... 8,071 45.2 35.5 1,743 9.8 8.8 3,297 18.4 11.3 3,031 17.0 15.4 2,672 15.0 12.51986 .......................... 8,092 45.4 35.5 1,821 10.2 9.1 3,369 18.9 11.7 2,901 16.3 14.7 2,714 15.2 12.7
1985 .......................... 8,159 45.9 36.2 2,099 11.8 10.9 3,343 18.8 11.7 2,717 15.3 13.7 3,030 17.0 14.61984 .......................... 8,222 46.3 36.6 2,115 11.9 10.7 3,307 18.6 11.6 2,800 15.8 14.3 3,024 17.0 14.61983 .......................... 8,392 47.4 37.8 2,157 12.2 11.1 3,330 18.8 11.8 2,905 16.4 14.9 3,010 17.0 14.61982 .......................... 8,483 48.2 38.8 2,195 12.5 11.4 3,302 18.8 11.7 2,987 17.0 15.6 3,118 17.7 15.31981 .......................... 9,151 52.1 42.4 2,414 13.7 12.7 3,477 19.8 12.6 3,260 18.6 17.1 3,339 19.0 16.61980 .......................... 9,615 54.7 44.6 2,675 15.2 14.0 3,547 20.2 12.7 3,393 19.3 17.9 3,590 20.4 17.91979 .......................... 9,330 52.9 43.5 2,595 14.7 13.6 3,509 19.9 12.8 3,226 18.3 17.1 3,552 20.1 17.6
All races, male1992 .......................... 5,309 61.0 53.5 1,391 16.0 14.4 1,769 20.3 14.9 2,149 24.7 24.1 1,326 15.2 13.11991 .......................... 5,335 61.6 54.2 1,293 14.9 13.5 1,764 20.4 15.1 2,278 26.3 25.6 1,268 14.6 12.61990 .......................... 5,434 62.9 55.1 1,275 14.8 13.4 1,823 21.1 15.7 2,336 27.1 26.0 1,373 15.9 13.81989 .......................... 5,368 62.3 54.5 1,251 14.5 13.3 1,849 21.5 16.3 2,268 26.3 24.9 1,441 16.7 14.81988 .......................... 5,648 65.8 57.4 1,429 16.6 15.5 1,971 23.0 17.3 2,248 26.2 24.7 1,762 20.5 18.51987 .......................... 5,406 63.3 55.1 1,348 15.8 14.7 1,883 22.1 16.5 2,175 25.5 23.9 1,834 21.5 19.21986 .......................... 5,387 63.3 54.8 1,376 16.2 14.9 1,954 23.0 17.2 2,057 24.2 22.7 1,845 21.7 19.3
1985 .......................... 5,358 63.2 55.2 1,513 17.8 16.9 1,911 22.5 17.0 1,934 22.8 21.4 2,007 23.7 21.61984 .......................... 5,440 64.4 56.2 1,566 18.5 17.2 1,874 22.2 16.7 2,000 23.7 22.3 2,000 23.7 21.51983 .......................... 5,583 66.3 58.2 1,553 18.4 17.4 1,926 22.9 17.2 2,104 25.0 23.6 1,980 23.5 21.41982 .......................... 5,697 68.1 60.1 1,603 19.2 18.1 1,908 22.8 17.1 2,185 26.1 24.8 2,083 24.9 22.91981 .......................... 6,155 73.7 65.7 1,772 21.2 20.2 2,013 24.1 18.3 2,369 28.4 27.2 2,278 27.3 25.21980 .......................... 6,412 76.8 68.4 1,910 22.9 21.7 2,021 24.2 18.2 2,482 29.7 28.6 2,382 28.5 26.31979 .......................... 6,260 74.7 66.9 1,882 22.5 21.4 2,030 24.2 18.5 2,348 28.0 27.1 2,396 28.6 26.3
All races, female1992 .......................... 2,471 26.3 16.5 420 4.5 3.7 1,317 14.0 6.5 734 7.8 6.3 675 7.2 5.01991 .......................... 2,565 27.3 17.4 428 4.6 3.7 1,340 14.3 6.6 797 8.5 7.0 673 7.2 4.91990 .......................... 2,583 27.6 17.5 417 4.5 3.7 1,362 14.5 6.7 805 8.6 7.1 705 7.5 5.31989 .......................... 2,638 28.2 17.8 403 4.3 3.6 1,397 14.9 6.9 838 8.9 7.3 726 7.7 5.51988 .......................... 2,707 28.9 18.4 423 4.5 4.0 1,427 15.2 7.2 857 9.2 7.2 807 8.6 6.41987 .......................... 2,665 28.6 18.3 395 4.2 3.7 1,414 15.2 7.2 856 9.2 7.4 838 9.0 6.71986 .......................... 2,705 29.0 18.8 445 4.8 4.2 1,416 15.2 7.4 844 9.1 7.3 869 9.3 7.1
- 109 -

Table 1. Number of deaths and unadjusted and age-adjusted death rates per 100,000 population for different categories of alcohol-related mortality byState: United States, 1979–92.
New York
Race, sex,and year
All Alcohol-Related Causes of DeathAll Chronic Liver Disease and
CirrhosisTotal Causes of Death with ExplicitMention of Alcohol
Other Alcohol-Related Diseases Other Alcohol-Related Injuries orAdverse Effects
Number Unadj.Rate
Age-Adj.Rate Number Unadj.
RateAge-Adj.
Rate Number Unadj.Rate
Age-Adj.Rate Number Unadj.
RateAge-Adj.
Rate Number Unadj.Rate
Age-Adj.Rate
All races, female
1985 .......................... 2,801 30.1 19.9 586 6.3 5.6 1,432 15.4 7.6 783 8.4 6.7 1,023 11.0 8.61984 .......................... 2,782 29.9 19.7 549 5.9 5.1 1,433 15.4 7.7 800 8.6 6.9 1,024 11.0 8.71983 .......................... 2,809 30.3 20.3 604 6.5 5.8 1,403 15.1 7.6 802 8.6 6.9 1,030 11.1 8.91982 .......................... 2,787 30.2 20.4 592 6.4 5.6 1,393 15.1 7.7 801 8.7 7.1 1,035 11.2 8.91981 .......................... 2,996 32.5 22.4 642 7.0 6.3 1,464 15.9 8.1 890 9.7 7.9 1,061 11.5 9.31980 .......................... 3,203 34.7 24.1 765 8.3 7.5 1,527 16.6 8.5 911 9.9 8.1 1,208 13.1 10.71979 .......................... 3,070 33.2 23.3 713 7.7 6.9 1,479 16.0 8.5 878 9.5 7.9 1,156 12.5 10.3
White, male1992 .......................... 3,875 56.7 46.3 978 14.3 12.3 1,421 20.8 13.5 1,476 21.6 20.5 1,061 15.5 12.51991 .......................... 3,800 55.6 45.6 891 13.0 11.2 1,394 20.4 13.5 1,514 22.2 20.9 1,018 14.9 12.01990 .......................... 3,957 58.0 47.5 894 13.1 11.3 1,447 21.2 14.0 1,616 23.7 22.2 1,086 15.9 12.81989 .......................... 3,878 56.7 46.4 873 12.8 11.1 1,459 21.3 14.4 1,546 22.6 20.8 1,171 17.1 14.21988 .......................... 4,047 59.0 47.8 962 14.0 12.3 1,557 22.7 15.1 1,528 22.3 20.4 1,338 19.5 16.31987 .......................... 3,985 58.0 47.2 927 13.5 11.8 1,509 22.0 14.7 1,549 22.6 20.7 1,379 20.1 16.71986 .......................... 4,014 58.2 47.3 920 13.4 11.6 1,556 22.6 15.2 1,538 22.3 20.6 1,375 20.0 16.5
1985 .......................... 3,984 57.6 47.1 997 14.4 12.9 1,542 22.3 15.1 1,445 20.9 19.2 1,474 21.3 18.11984 .......................... 4,038 58.3 47.8 1,017 14.7 12.9 1,500 21.6 14.7 1,522 22.0 20.3 1,446 20.9 17.71983 .......................... 4,177 60.1 49.4 1,022 14.7 13.0 1,565 22.5 15.3 1,590 22.9 21.1 1,469 21.1 17.91982 .......................... 4,244 61.1 50.5 1,075 15.5 13.7 1,546 22.3 15.1 1,623 23.4 21.7 1,539 22.2 18.91981 .......................... 4,560 65.4 54.8 1,145 16.4 14.7 1,650 23.6 16.3 1,765 25.3 23.8 1,650 23.6 20.31980 .......................... 4,758 67.8 56.7 1,243 17.7 15.7 1,656 23.6 16.2 1,858 26.5 24.9 1,728 24.6 21.11979 .......................... 4,660 65.6 55.5 1,220 17.2 15.4 1,663 23.4 16.4 1,777 25.0 23.6 1,758 24.8 21.3
Black, male1992 .......................... 1,323 92.2 100.0 394 27.5 31.5 309 21.5 25.2 620 43.2 43.4 241 16.8 19.21991 .......................... 1,444 101.6 109.8 391 27.5 31.6 337 23.7 28.0 716 50.4 50.2 237 16.7 19.31990 .......................... 1,380 97.1 105.0 368 25.9 30.2 338 23.8 28.2 674 47.4 46.6 268 18.9 21.91989 .......................... 1,401 100.0 108.3 370 26.4 30.6 355 25.3 30.2 677 48.3 47.5 255 18.2 20.91988 .......................... 1,518 110.5 120.0 455 33.1 38.2 379 27.6 33.0 684 49.8 48.8 405 29.5 33.91987 .......................... 1,348 100.4 109.2 416 31.0 35.5 341 25.4 30.2 591 44.0 43.5 441 32.9 37.31986 .......................... 1,298 98.9 109.1 449 34.2 39.3 369 28.1 33.5 480 36.6 36.3 455 34.7 39.5
1985 .......................... 1,305 101.7 113.4 505 39.3 45.5 337 26.3 31.4 463 36.1 36.4 508 39.6 45.51984 .......................... 1,329 105.9 118.1 532 42.4 48.8 346 27.6 32.9 451 35.9 36.4 531 42.3 48.41983 .......................... 1,339 109.3 122.4 521 42.5 49.7 336 27.5 32.9 482 39.3 39.8 496 40.5 46.91982 .......................... 1,393 116.9 130.9 522 43.8 51.2 342 28.7 34.4 529 44.4 45.4 535 44.9 52.11981 .......................... 1,527 131.0 147.9 615 52.7 62.0 338 29.0 35.0 574 49.2 50.9 608 52.1 61.2
- 110 -

Table 1. Number of deaths and unadjusted and age-adjusted death rates per 100,000 population for different categories of alcohol-related mortality byState: United States, 1979–92.
New York
Race, sex,and year
All Alcohol-Related Causes of DeathAll Chronic Liver Disease and
CirrhosisTotal Causes of Death with ExplicitMention of Alcohol
Other Alcohol-Related Diseases Other Alcohol-Related Injuries orAdverse Effects
Number Unadj.Rate
Age-Adj.Rate Number Unadj.
RateAge-Adj.
Rate Number Unadj.Rate
Age-Adj.Rate Number Unadj.
RateAge-Adj.
Rate Number Unadj.Rate
Age-Adj.Rate
Black, male1980 .......................... 1,575 137.8 155.7 653 57.1 66.9 339 29.7 35.8 583 51.0 53.1 636 55.6 65.11979 .......................... 1,527 137.6 156.7 644 58.0 68.4 342 30.8 36.9 541 48.8 51.5 612 55.2 64.7
White, female1992 .......................... 1,923 26.2 14.6 268 3.7 2.9 1,092 14.9 5.9 564 7.7 5.8 544 7.4 4.71991 .......................... 1,975 26.9 15.1 260 3.5 2.8 1,108 15.1 5.9 607 8.3 6.4 516 7.0 4.31990 .......................... 2,026 27.6 15.6 278 3.8 3.0 1,127 15.4 6.0 621 8.5 6.6 561 7.6 4.81989 .......................... 2,110 28.6 16.2 283 3.8 3.1 1,175 15.9 6.3 651 8.8 6.8 595 8.1 5.31988 .......................... 2,141 28.9 16.3 254 3.4 2.8 1,202 16.2 6.5 685 9.2 6.9 586 7.9 5.31987 .......................... 2,141 28.8 16.5 248 3.3 2.7 1,199 16.1 6.6 694 9.3 7.2 635 8.5 5.71986 .......................... 2,180 29.2 17.0 294 3.9 3.2 1,194 16.0 6.7 693 9.3 7.1 654 8.7 6.1
1985 .......................... 2,229 29.7 17.6 367 4.9 4.1 1,215 16.2 6.9 647 8.6 6.5 761 10.1 7.21984 .......................... 2,243 29.7 17.6 347 4.6 3.7 1,222 16.2 7.1 673 8.9 6.8 771 10.2 7.31983 .......................... 2,235 29.5 17.6 385 5.1 4.2 1,196 15.8 6.9 654 8.6 6.5 778 10.3 7.41982 .......................... 2,218 29.2 17.6 366 4.8 3.9 1,198 15.8 7.0 655 8.6 6.7 781 10.3 7.41981 .......................... 2,374 31.1 19.1 389 5.1 4.2 1,248 16.4 7.3 737 9.7 7.5 761 10.0 7.21980 .......................... 2,551 33.3 20.8 475 6.2 5.2 1,322 17.2 7.9 754 9.8 7.7 897 11.7 8.71979 .......................... 2,462 31.8 20.0 448 5.8 4.7 1,283 16.5 7.7 731 9.4 7.6 869 11.2 8.4
Black, female1992 .......................... 500 30.3 27.2 148 9.0 8.6 204 12.3 10.1 149 9.0 8.5 120 7.3 6.91991 .......................... 549 33.4 30.3 165 10.0 9.5 216 13.2 10.8 168 10.2 9.9 147 9.0 8.41990 .......................... 518 31.5 28.7 139 8.4 8.3 215 13.1 10.9 164 10.0 9.5 142 8.6 8.31989 .......................... 489 30.1 27.5 118 7.3 7.2 205 12.6 10.6 166 10.2 9.7 127 7.8 7.51988 .......................... 535 33.4 30.9 165 10.3 10.2 212 13.3 11.3 158 9.9 9.3 214 13.4 12.91987 .......................... 494 31.5 29.2 144 9.2 9.2 201 12.8 11.0 149 9.5 9.0 195 12.4 12.21986 .......................... 498 32.4 30.2 151 9.8 9.8 209 13.6 11.9 138 9.0 8.5 208 13.5 13.3
1985 .......................... 543 36.0 34.3 217 14.4 14.6 204 13.5 11.9 122 8.1 7.7 255 16.9 16.81984 .......................... 515 34.8 33.3 198 13.4 13.6 198 13.4 12.1 119 8.0 7.6 246 16.6 16.71983 .......................... 545 37.6 36.5 215 14.8 15.2 196 13.5 12.5 134 9.2 8.8 244 16.8 17.21982 .......................... 546 38.6 37.8 226 16.0 16.5 182 12.9 11.9 137 9.7 9.4 246 17.4 17.71981 .......................... 600 43.2 43.0 251 18.1 18.9 206 14.8 14.0 143 10.3 10.1 296 21.3 22.11980 .......................... 632 46.4 46.1 289 21.2 22.1 199 14.6 13.7 144 10.6 10.3 310 22.8 23.41979 .......................... 590 44.5 44.7 261 19.7 20.7 190 14.3 13.6 139 10.5 10.4 279 21.1 22.0
- 111 -

Table 1. Number of deaths and unadjusted and age-adjusted death rates per 100,000 population for different categories of alcohol-related mortality byState: United States, 1979–92.
North Carolina
Race, sex,and year
All Alcohol-Related Causes of DeathAll Chronic Liver Disease and
CirrhosisTotal Causes of Death with ExplicitMention of Alcohol
Other Alcohol-Related Diseases Other Alcohol-Related Injuries orAdverse Effects
Number Unadj.Rate
Age-Adj.Rate Number Unadj.
RateAge-Adj.
Rate Number Unadj.Rate
Age-Adj.Rate Number Unadj.
RateAge-Adj.
Rate Number Unadj.Rate
Age-Adj.Rate
All races, both sexes1992 .......................... 3,366 49.2 39.8 777 11.4 10.1 1,163 17.0 10.5 1,426 20.9 19.3 733 10.7 8.71991 .......................... 3,368 49.9 40.8 724 10.7 9.6 1,142 16.9 10.6 1,501 22.2 20.6 662 9.8 8.11990 .......................... 3,373 50.7 41.7 752 11.3 10.3 1,130 17.0 10.7 1,490 22.4 20.7 726 10.9 9.11989 .......................... 3,514 53.5 44.6 827 12.6 11.7 1,150 17.5 11.3 1,536 23.4 21.7 760 11.6 9.81988 .......................... 3,430 52.9 43.9 819 12.6 11.7 1,139 17.6 11.3 1,472 22.7 20.9 702 10.8 9.31987 .......................... 3,198 49.9 42.4 689 10.8 10.2 1,071 16.7 11.2 1,438 22.4 20.9 683 10.7 9.21986 .......................... 3,242 51.3 43.5 683 10.8 10.2 1,066 16.9 11.2 1,493 23.6 22.1 634 10.0 8.9
1985 .......................... 3,082 49.3 42.2 661 10.6 10.1 1,014 16.2 11.0 1,407 22.5 21.0 572 9.1 8.11984 .......................... 3,033 49.2 42.4 674 10.9 10.6 1,013 16.4 11.3 1,346 21.8 20.5 591 9.6 8.71983 .......................... 2,931 48.2 41.6 641 10.5 10.2 990 16.3 11.4 1,300 21.4 20.0 562 9.2 8.51982 .......................... 3,040 50.5 44.5 698 11.6 11.4 985 16.4 11.9 1,357 22.5 21.3 614 10.2 9.41981 .......................... 3,215 54.0 48.1 763 12.8 12.7 1,006 16.9 12.3 1,446 24.3 23.1 655 11.0 10.31980 .......................... 3,386 57.4 51.9 897 15.2 15.3 1,001 17.0 12.5 1,488 25.2 24.1 717 12.2 11.51979 .......................... 3,288 56.7 52.2 846 14.6 14.9 981 16.9 13.0 1,460 25.2 24.3 713 12.3 12.0
All races, male1992 .......................... 2,307 69.5 61.9 620 18.7 17.1 655 19.7 15.3 1,032 31.1 29.5 482 14.5 12.71991 .......................... 2,278 69.6 62.6 551 16.8 15.7 634 19.4 15.2 1,093 33.4 31.7 415 12.7 11.51990 .......................... 2,298 71.2 64.4 592 18.3 17.3 628 19.4 15.4 1,078 33.4 31.6 472 14.6 13.41989 .......................... 2,371 74.5 67.9 649 20.4 19.5 635 20.0 16.0 1,087 34.2 32.4 491 15.4 14.11988 .......................... 2,305 73.4 66.8 626 19.9 19.1 633 20.1 16.4 1,046 33.3 31.4 438 13.9 12.91987 .......................... 2,178 70.2 64.7 537 17.3 16.8 597 19.2 16.0 1,044 33.6 31.9 428 13.8 12.91986 .......................... 2,215 72.3 66.6 513 16.7 16.3 609 19.9 16.4 1,093 35.7 33.9 409 13.3 12.7
1985 .......................... 2,090 68.8 64.0 502 16.5 16.4 574 18.9 15.9 1,014 33.4 31.7 354 11.7 11.21984 .......................... 2,086 69.7 65.5 501 16.8 16.8 591 19.8 16.8 994 33.2 31.8 384 12.8 12.61983 .......................... 1,999 67.8 63.7 475 16.1 16.0 575 19.5 16.8 949 32.2 30.9 359 12.2 11.91982 .......................... 2,086 71.5 68.3 513 17.6 17.9 573 19.6 17.3 1,000 34.3 33.1 395 13.5 13.41981 .......................... 2,222 76.9 74.1 566 19.6 20.1 584 20.2 17.9 1,072 37.1 36.0 429 14.8 14.81980 .......................... 2,369 82.8 80.5 683 23.9 24.7 585 20.4 18.2 1,101 38.5 37.5 473 16.5 16.71979 .......................... 2,324 82.5 81.5 658 23.4 24.6 575 20.4 18.7 1,091 38.7 38.2 485 17.2 17.8
All races, female1992 .......................... 1,059 30.1 20.0 157 4.5 3.9 508 14.4 6.6 394 11.2 9.5 251 7.1 5.21991 .......................... 1,090 31.4 21.3 173 5.0 4.2 508 14.6 6.9 409 11.8 10.1 247 7.1 5.11990 .......................... 1,075 31.4 21.3 160 4.7 4.1 503 14.7 7.0 412 12.0 10.2 254 7.4 5.31989 .......................... 1,142 33.8 23.7 178 5.3 4.7 515 15.2 7.5 449 13.3 11.5 269 8.0 6.01988 .......................... 1,125 33.7 23.7 193 5.8 5.2 506 15.2 7.3 426 12.8 11.1 264 7.9 6.11987 .......................... 1,019 30.9 22.4 152 4.6 4.4 474 14.4 7.5 393 11.9 10.5 255 7.7 6.01986 .......................... 1,027 31.5 23.0 170 5.2 4.8 457 14.0 7.2 400 12.3 11.0 225 6.9 5.7
- 112 -

Table 1. Number of deaths and unadjusted and age-adjusted death rates per 100,000 population for different categories of alcohol-related mortality byState: United States, 1979–92.
North Carolina
Race, sex,and year
All Alcohol-Related Causes of DeathAll Chronic Liver Disease and
CirrhosisTotal Causes of Death with ExplicitMention of Alcohol
Other Alcohol-Related Diseases Other Alcohol-Related Injuries orAdverse Effects
Number Unadj.Rate
Age-Adj.Rate Number Unadj.
RateAge-Adj.
Rate Number Unadj.Rate
Age-Adj.Rate Number Unadj.
RateAge-Adj.
Rate Number Unadj.Rate
Age-Adj.Rate
All races, female
1985 .......................... 992 30.8 22.8 159 4.9 4.6 441 13.7 7.3 393 12.2 10.9 218 6.8 5.41984 .......................... 947 29.8 22.1 173 5.5 5.1 422 13.3 7.1 352 11.1 9.9 207 6.5 5.31983 .......................... 932 29.8 22.2 166 5.3 5.2 415 13.3 7.2 351 11.2 9.8 203 6.5 5.51982 .......................... 955 30.8 23.5 185 6.0 5.6 413 13.3 7.6 357 11.5 10.2 219 7.1 5.91981 .......................... 993 32.4 25.3 197 6.4 6.4 422 13.8 8.0 374 12.2 11.0 226 7.4 6.61980 .......................... 1,017 33.5 26.7 214 7.1 7.0 416 13.7 8.1 386 12.7 11.6 244 8.0 7.01979 .......................... 964 32.3 26.1 188 6.3 6.4 406 13.6 8.4 370 12.4 11.3 228 7.6 7.0
White, male1992 .......................... 1,484 58.4 48.8 374 14.7 12.6 452 17.8 12.4 658 25.9 23.8 356 14.0 11.41991 .......................... 1,509 60.2 51.1 343 13.7 12.1 447 17.8 12.6 720 28.7 26.4 300 12.0 10.11990 .......................... 1,508 60.9 52.1 345 13.9 12.3 446 18.0 13.0 717 29.0 26.8 331 13.4 11.31989 .......................... 1,497 61.3 52.9 356 14.6 12.9 424 17.4 12.5 717 29.3 27.4 345 14.1 11.81988 .......................... 1,475 61.1 52.4 333 13.8 12.2 440 18.2 13.4 702 29.1 26.8 313 13.0 11.11987 .......................... 1,435 60.1 52.7 301 12.6 11.4 412 17.3 13.1 722 30.3 28.2 309 13.0 11.11986 .......................... 1,434 60.8 53.5 289 12.3 11.1 401 17.0 12.9 743 31.5 29.5 298 12.6 11.0
1985 .......................... 1,350 57.9 51.3 264 11.3 10.6 386 16.6 12.7 699 30.0 28.0 246 10.5 9.41984 .......................... 1,374 59.9 53.6 284 12.4 11.6 396 17.3 13.5 694 30.2 28.4 284 12.4 11.31983 .......................... 1,342 59.3 53.1 292 12.9 12.0 392 17.3 13.9 658 29.1 27.2 284 12.6 11.51982 .......................... 1,380 61.7 56.0 320 14.3 13.6 378 16.9 13.7 682 30.5 28.8 301 13.5 12.51981 .......................... 1,445 65.2 59.4 324 14.6 13.8 389 17.6 14.3 732 33.1 31.3 318 14.4 13.21980 .......................... 1,542 70.3 64.7 396 18.1 17.3 395 18.0 14.9 751 34.3 32.6 341 15.5 14.51979 .......................... 1,507 69.6 65.3 390 18.0 17.6 386 17.8 15.2 731 33.8 32.4 344 15.9 15.3
Black, male1992 .......................... 784 110.7 119.7 236 33.3 38.6 196 27.6 30.6 352 49.7 50.5 118 16.7 18.81991 .......................... 732 104.8 112.5 205 29.4 34.0 181 26.0 28.3 346 49.5 50.3 110 15.8 18.51990 .......................... 761 110.8 119.8 243 35.4 41.2 178 25.8 28.3 341 49.6 50.2 139 20.2 24.11989 .......................... 837 123.8 137.1 283 41.8 50.5 206 30.5 34.1 348 51.4 52.5 141 20.8 24.91988 .......................... 794 118.9 132.6 286 42.8 51.7 187 28.0 31.5 321 48.1 49.4 123 18.4 22.01987 .......................... 715 108.1 121.0 233 35.2 43.4 181 27.4 30.7 301 45.5 46.9 114 17.2 21.11986 .......................... 746 114.1 126.0 220 33.6 40.9 202 31.0 34.1 324 49.5 51.0 103 15.7 19.4
1985 .......................... 708 108.8 122.5 233 35.8 44.3 185 28.4 32.1 290 44.6 46.0 105 16.2 20.01984 .......................... 682 105.9 120.4 212 32.9 42.1 191 29.6 32.9 279 43.4 45.4 98 15.2 19.11983 .......................... 631 99.0 113.0 179 28.1 35.5 179 28.1 31.4 273 42.8 46.1 71 11.1 13.91982 .......................... 673 106.2 122.8 183 28.9 37.3 190 29.9 34.9 300 47.4 50.6 86 13.6 17.21981 .......................... 739 117.3 140.2 234 37.1 49.3 191 30.3 35.2 314 49.8 55.6 108 17.1 22.5
- 113 -

Table 1. Number of deaths and unadjusted and age-adjusted death rates per 100,000 population for different categories of alcohol-related mortality byState: United States, 1979–92.
North Carolina
Race, sex,and year
All Alcohol-Related Causes of DeathAll Chronic Liver Disease and
CirrhosisTotal Causes of Death with ExplicitMention of Alcohol
Other Alcohol-Related Diseases Other Alcohol-Related Injuries orAdverse Effects
Number Unadj.Rate
Age-Adj.Rate Number Unadj.
RateAge-Adj.
Rate Number Unadj.Rate
Age-Adj.Rate Number Unadj.
RateAge-Adj.
Rate Number Unadj.Rate
Age-Adj.Rate
Black, male1980 .......................... 794 126.6 152.2 281 44.8 60.0 187 29.8 34.7 326 52.0 57.5 128 20.4 27.11979 .......................... 790 129.3 156.9 266 43.5 58.7 185 30.3 35.6 338 55.4 62.6 139 22.8 30.5
White, female1992 .......................... 730 27.6 16.4 69 2.6 2.1 382 14.5 5.7 279 10.6 8.6 169 6.4 4.11991 .......................... 766 29.4 18.1 89 3.4 2.7 375 14.4 5.8 302 11.6 9.6 168 6.4 4.11990 .......................... 763 29.6 18.2 70 2.7 2.2 385 14.9 6.2 308 12.0 9.8 178 6.9 4.31989 .......................... 814 31.9 20.3 90 3.5 2.8 390 15.3 6.6 333 13.1 11.0 195 7.7 5.01988 .......................... 784 31.1 19.6 93 3.7 3.0 379 15.0 6.3 312 12.4 10.3 163 6.5 4.31987 .......................... 712 28.6 18.8 74 3.0 2.6 347 13.9 6.1 290 11.6 10.0 169 6.8 4.51986 .......................... 746 30.3 20.5 99 4.0 3.5 344 14.0 6.3 303 12.3 10.7 155 6.3 4.6
1985 .......................... 678 27.9 18.7 67 2.8 2.3 328 13.5 6.4 283 11.6 10.0 146 6.0 4.31984 .......................... 661 27.6 18.7 86 3.6 3.1 315 13.1 6.2 260 10.9 9.5 148 6.2 4.61983 .......................... 648 27.4 18.6 81 3.4 3.1 305 12.9 6.1 262 11.1 9.4 138 5.8 4.51982 .......................... 668 28.5 19.9 104 4.4 3.8 305 13.0 6.6 259 11.1 9.5 152 6.5 4.91981 .......................... 677 29.2 20.8 91 3.9 3.6 312 13.4 6.8 274 11.8 10.4 151 6.5 5.21980 .......................... 697 30.4 21.9 93 4.1 3.5 307 13.4 6.9 296 12.9 11.4 152 6.6 5.11979 .......................... 665 29.4 21.7 98 4.3 4.0 300 13.2 7.3 267 11.8 10.4 142 6.3 5.3
Black, female1992 .......................... 309 38.4 33.6 84 10.5 11.1 121 15.1 10.5 104 12.9 12.0 76 9.5 9.41991 .......................... 308 38.8 33.7 80 10.1 10.3 128 16.2 11.6 99 12.5 11.7 75 9.5 9.11990 .......................... 296 37.9 33.7 86 11.0 11.6 114 14.6 10.4 96 12.2 11.6 74 9.5 9.41989 .......................... 312 40.7 37.0 85 11.1 12.4 121 15.8 11.7 106 13.8 12.9 71 9.2 9.61988 .......................... 323 42.7 38.9 95 12.6 13.7 123 16.2 11.8 105 13.9 13.3 96 12.7 13.31987 .......................... 294 39.4 36.7 74 9.9 11.3 123 16.5 13.2 97 13.0 12.2 79 10.6 11.21986 .......................... 265 35.9 32.6 68 9.2 10.0 108 14.7 11.1 88 12.0 11.5 68 9.2 10.0
1985 .......................... 302 41.5 38.7 89 12.2 13.4 111 15.2 11.4 103 14.1 13.8 71 9.7 9.71984 .......................... 276 38.3 36.0 87 12.1 13.5 103 14.4 11.2 85 11.8 11.4 58 8.1 8.41983 .......................... 275 38.6 37.1 84 11.8 13.7 107 15.0 12.1 84 11.8 11.3 64 9.0 9.91982 .......................... 272 38.5 37.0 78 11.0 12.8 104 14.7 12.0 90 12.7 12.2 66 9.3 10.11981 .......................... 307 43.9 43.8 105 15.0 17.8 108 15.4 12.9 94 13.5 13.1 74 10.6 12.41980 .......................... 304 43.9 45.6 119 17.2 21.0 104 15.0 12.8 81 11.7 11.8 89 12.8 14.81979 .......................... 288 42.5 43.9 89 13.1 16.7 104 15.4 13.3 95 14.0 13.9 85 12.6 14.7
- 114 -

Table 1. Number of deaths and unadjusted and age-adjusted death rates per 100,000 population for different categories of alcohol-related mortality byState: United States, 1979–92.
North Dakota
Race, sex,and year
All Alcohol-Related Causes of DeathAll Chronic Liver Disease and
CirrhosisTotal Causes of Death with ExplicitMention of Alcohol
Other Alcohol-Related Diseases Other Alcohol-Related Injuries orAdverse Effects
Number Unadj.Rate
Age-Adj.Rate Number Unadj.
RateAge-Adj.
Rate Number Unadj.Rate
Age-Adj.Rate Number Unadj.
RateAge-Adj.
Rate Number Unadj.Rate
Age-Adj.Rate
All races, both sexes1992 .......................... 237 37.4 25.4 40 6.3 5.8 103 16.2 7.1 94 14.9 12.4 54 8.5 6.21991 .......................... 247 39.0 27.9 55 8.7 8.1 103 16.3 7.2 89 14.1 12.6 56 8.8 6.81990 .......................... 252 39.5 29.3 49 7.7 7.6 104 16.3 7.9 99 15.5 13.8 52 8.2 6.31989 .......................... 251 38.8 28.6 57 8.8 8.1 102 15.9 7.9 91 14.1 12.6 58 9.0 7.51988 .......................... 259 39.5 30.1 63 9.6 8.9 92 14.1 7.1 104 15.9 14.1 58 8.9 7.91987 .......................... 252 38.2 29.3 46 7.0 6.2 106 16.0 8.6 100 15.2 14.4 47 7.1 5.61986 .......................... 226 33.7 26.3 42 6.3 6.1 89 13.3 7.0 94 14.1 13.2 48 7.2 6.6
1985 .......................... 244 36.1 28.7 58 8.6 8.8 89 13.2 7.0 97 14.4 12.8 49 7.2 6.61984 .......................... 270 39.6 31.3 61 9.0 8.4 95 13.9 7.6 114 16.7 15.3 48 7.1 6.11983 .......................... 266 39.3 29.5 55 8.1 7.2 103 15.2 8.0 108 16.0 14.3 57 8.4 6.71982 .......................... 275 41.2 33.3 48 7.2 7.4 98 14.7 8.1 129 19.3 17.8 51 7.6 7.21981 .......................... 291 44.1 36.2 56 8.5 8.5 93 14.1 8.3 142 21.5 19.5 59 8.9 8.41980 .......................... 314 48.0 38.8 78 11.9 12.0 100 15.3 8.7 136 20.8 18.1 81 12.4 11.71979 .......................... 289 44.3 35.8 68 10.4 10.2 99 15.2 9.0 122 18.7 16.6 61 9.4 9.2
All races, male1992 .......................... 152 48.2 37.8 33 10.4 9.6 53 16.9 9.6 66 20.9 18.6 37 11.7 9.81991 .......................... 163 51.8 42.5 48 15.2 14.2 51 16.2 9.5 64 20.4 18.8 41 13.0 11.31990 .......................... 169 53.2 44.9 43 13.5 13.6 58 18.3 11.1 68 21.3 20.1 34 10.7 9.71989 .......................... 168 52.0 42.5 43 13.3 12.2 57 17.8 10.8 67 20.9 19.4 33 10.2 9.11988 .......................... 169 51.8 43.2 50 15.3 13.7 46 14.0 8.8 73 22.5 20.7 35 10.7 9.81987 .......................... 179 54.0 46.0 35 10.6 9.8 65 19.5 13.2 79 23.9 23.1 27 8.2 6.81986 .......................... 150 44.8 38.5 32 9.6 9.4 50 15.0 9.7 68 20.2 19.5 29 8.7 8.1
1985 .......................... 165 48.6 42.7 41 12.1 12.9 50 14.9 10.1 73 21.6 19.8 33 9.7 9.61984 .......................... 185 54.1 46.7 52 15.2 14.5 53 15.6 10.3 80 23.3 21.9 34 10.0 9.71983 .......................... 176 51.9 42.4 37 10.9 9.3 58 17.1 11.0 81 23.9 22.1 34 10.0 8.31982 .......................... 184 54.9 48.9 32 9.5 10.2 53 15.8 10.8 99 29.6 28.0 26 7.7 8.11981 .......................... 199 59.9 52.8 39 11.8 11.5 55 16.6 12.0 105 31.6 29.2 40 12.1 11.71980 .......................... 206 62.5 54.5 57 17.3 17.3 52 15.7 10.5 97 29.5 26.7 52 15.8 15.51979 .......................... 198 60.3 52.9 52 15.8 15.6 54 16.3 11.2 92 28.2 26.1 37 11.3 11.3
All races, female1992 .......................... 85 26.7 13.5 7 2.2 2.1 50 15.6 5.1 28 8.9 6.3 17 5.3 2.71991 .......................... 84 26.4 13.9 7 2.2 2.2 52 16.4 5.2 25 7.8 6.5 15 4.7 2.51990 .......................... 83 25.8 14.1 6 1.9 1.7 46 14.3 5.1 31 9.7 7.4 18 5.6 3.01989 .......................... 83 25.7 15.5 14 4.3 4.4 45 13.9 5.4 24 7.5 5.7 25 7.7 5.91988 .......................... 90 27.3 17.7 13 4.0 4.6 46 14.1 5.6 31 9.3 7.4 23 7.0 6.31987 .......................... 74 22.3 13.2 11 3.3 2.9 41 12.5 4.6 21 6.5 5.7 20 6.1 4.41986 .......................... 76 22.6 14.6 10 3.0 3.0 39 11.6 4.8 27 8.0 6.8 19 5.7 5.2
- 115 -
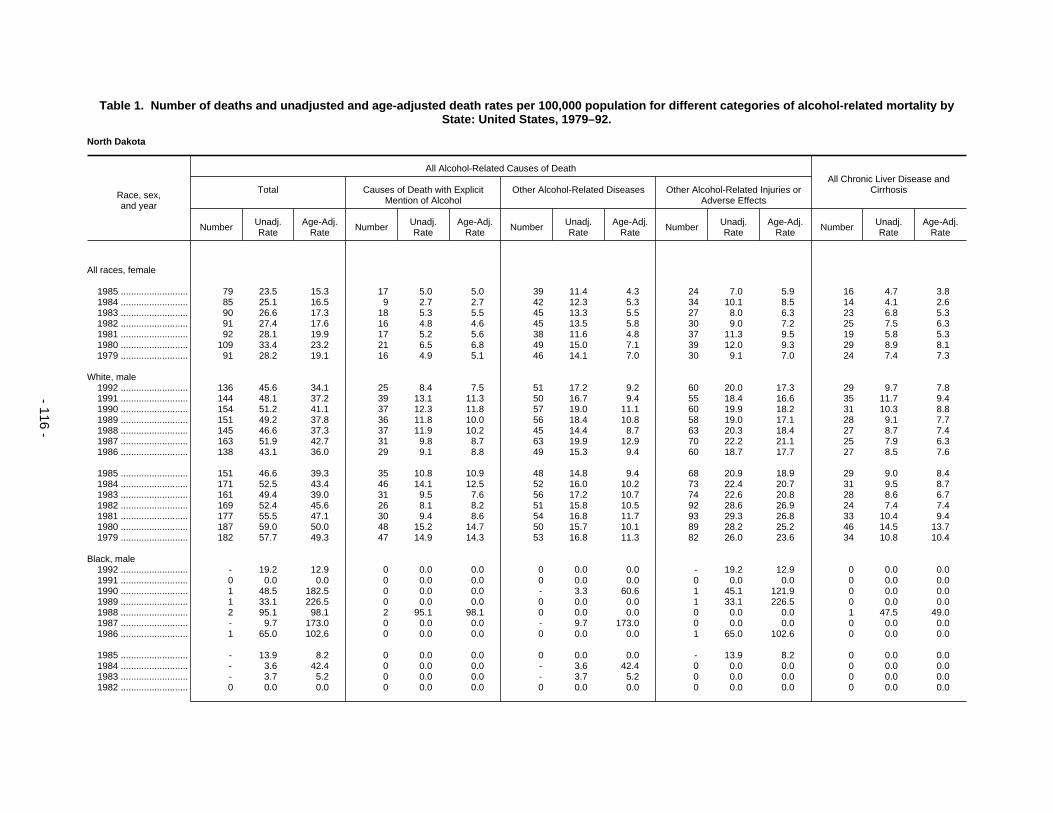
Table 1. Number of deaths and unadjusted and age-adjusted death rates per 100,000 population for different categories of alcohol-related mortality byState: United States, 1979–92.
North Dakota
Race, sex,and year
All Alcohol-Related Causes of DeathAll Chronic Liver Disease and
CirrhosisTotal Causes of Death with ExplicitMention of Alcohol
Other Alcohol-Related Diseases Other Alcohol-Related Injuries orAdverse Effects
Number Unadj.Rate
Age-Adj.Rate Number Unadj.
RateAge-Adj.
Rate Number Unadj.Rate
Age-Adj.Rate Number Unadj.
RateAge-Adj.
Rate Number Unadj.Rate
Age-Adj.Rate
All races, female
1985 .......................... 79 23.5 15.3 17 5.0 5.0 39 11.4 4.3 24 7.0 5.9 16 4.7 3.81984 .......................... 85 25.1 16.5 9 2.7 2.7 42 12.3 5.3 34 10.1 8.5 14 4.1 2.61983 .......................... 90 26.6 17.3 18 5.3 5.5 45 13.3 5.5 27 8.0 6.3 23 6.8 5.31982 .......................... 91 27.4 17.6 16 4.8 4.6 45 13.5 5.8 30 9.0 7.2 25 7.5 6.31981 .......................... 92 28.1 19.9 17 5.2 5.6 38 11.6 4.8 37 11.3 9.5 19 5.8 5.31980 .......................... 109 33.4 23.2 21 6.5 6.8 49 15.0 7.1 39 12.0 9.3 29 8.9 8.11979 .......................... 91 28.2 19.1 16 4.9 5.1 46 14.1 7.0 30 9.1 7.0 24 7.4 7.3
White, male1992 .......................... 136 45.6 34.1 25 8.4 7.5 51 17.2 9.2 60 20.0 17.3 29 9.7 7.81991 .......................... 144 48.1 37.2 39 13.1 11.3 50 16.7 9.4 55 18.4 16.6 35 11.7 9.41990 .......................... 154 51.2 41.1 37 12.3 11.8 57 19.0 11.1 60 19.9 18.2 31 10.3 8.81989 .......................... 151 49.2 37.8 36 11.8 10.0 56 18.4 10.8 58 19.0 17.1 28 9.1 7.71988 .......................... 145 46.6 37.3 37 11.9 10.2 45 14.4 8.7 63 20.3 18.4 27 8.7 7.41987 .......................... 163 51.9 42.7 31 9.8 8.7 63 19.9 12.9 70 22.2 21.1 25 7.9 6.31986 .......................... 138 43.1 36.0 29 9.1 8.8 49 15.3 9.4 60 18.7 17.7 27 8.5 7.6
1985 .......................... 151 46.6 39.3 35 10.8 10.9 48 14.8 9.4 68 20.9 18.9 29 9.0 8.41984 .......................... 171 52.5 43.4 46 14.1 12.5 52 16.0 10.2 73 22.4 20.7 31 9.5 8.71983 .......................... 161 49.4 39.0 31 9.5 7.6 56 17.2 10.7 74 22.6 20.8 28 8.6 6.71982 .......................... 169 52.4 45.6 26 8.1 8.2 51 15.8 10.5 92 28.6 26.9 24 7.4 7.41981 .......................... 177 55.5 47.1 30 9.4 8.6 54 16.8 11.7 93 29.3 26.8 33 10.4 9.41980 .......................... 187 59.0 50.0 48 15.2 14.7 50 15.7 10.1 89 28.2 25.2 46 14.5 13.71979 .......................... 182 57.7 49.3 47 14.9 14.3 53 16.8 11.3 82 26.0 23.6 34 10.8 10.4
Black, male1992 .......................... - 19.2 12.9 0 0.0 0.0 0 0.0 0.0 - 19.2 12.9 0 0.0 0.01991 .......................... 0 0.0 0.0 0 0.0 0.0 0 0.0 0.0 0 0.0 0.0 0 0.0 0.01990 .......................... 1 48.5 182.5 0 0.0 0.0 - 3.3 60.6 1 45.1 121.9 0 0.0 0.01989 .......................... 1 33.1 226.5 0 0.0 0.0 0 0.0 0.0 1 33.1 226.5 0 0.0 0.01988 .......................... 2 95.1 98.1 2 95.1 98.1 0 0.0 0.0 0 0.0 0.0 1 47.5 49.01987 .......................... - 9.7 173.0 0 0.0 0.0 - 9.7 173.0 0 0.0 0.0 0 0.0 0.01986 .......................... 1 65.0 102.6 0 0.0 0.0 0 0.0 0.0 1 65.0 102.6 0 0.0 0.0
1985 .......................... - 13.9 8.2 0 0.0 0.0 0 0.0 0.0 - 13.9 8.2 0 0.0 0.01984 .......................... - 3.6 42.4 0 0.0 0.0 - 3.6 42.4 0 0.0 0.0 0 0.0 0.01983 .......................... - 3.7 5.2 0 0.0 0.0 - 3.7 5.2 0 0.0 0.0 0 0.0 0.01982 .......................... 0 0.0 0.0 0 0.0 0.0 0 0.0 0.0 0 0.0 0.0 0 0.0 0.0
- 116 -
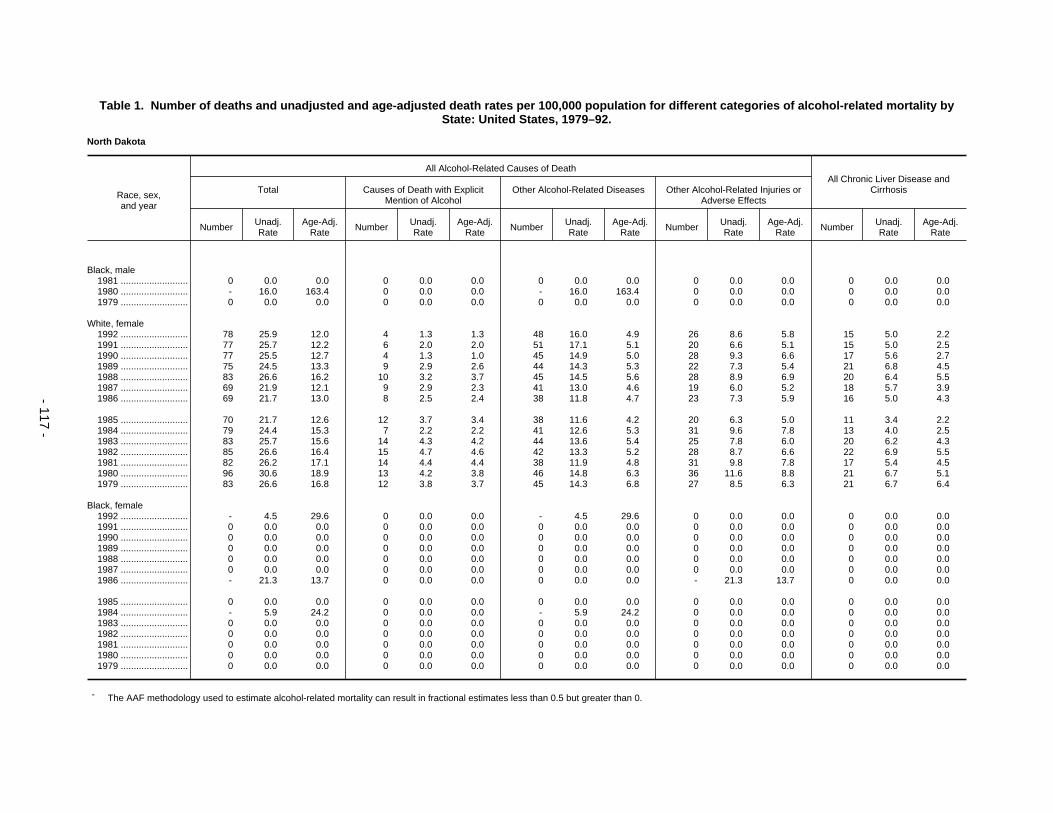
Table 1. Number of deaths and unadjusted and age-adjusted death rates per 100,000 population for different categories of alcohol-related mortality byState: United States, 1979–92.
North Dakota
Race, sex,and year
All Alcohol-Related Causes of DeathAll Chronic Liver Disease and
CirrhosisTotal Causes of Death with ExplicitMention of Alcohol
Other Alcohol-Related Diseases Other Alcohol-Related Injuries orAdverse Effects
Number Unadj.Rate
Age-Adj.Rate Number Unadj.
RateAge-Adj.
Rate Number Unadj.Rate
Age-Adj.Rate Number Unadj.
RateAge-Adj.
Rate Number Unadj.Rate
Age-Adj.Rate
Black, male1981 .......................... 0 0.0 0.0 0 0.0 0.0 0 0.0 0.0 0 0.0 0.0 0 0.0 0.01980 .......................... - 16.0 163.4 0 0.0 0.0 - 16.0 163.4 0 0.0 0.0 0 0.0 0.01979 .......................... 0 0.0 0.0 0 0.0 0.0 0 0.0 0.0 0 0.0 0.0 0 0.0 0.0
White, female1992 .......................... 78 25.9 12.0 4 1.3 1.3 48 16.0 4.9 26 8.6 5.8 15 5.0 2.21991 .......................... 77 25.7 12.2 6 2.0 2.0 51 17.1 5.1 20 6.6 5.1 15 5.0 2.51990 .......................... 77 25.5 12.7 4 1.3 1.0 45 14.9 5.0 28 9.3 6.6 17 5.6 2.71989 .......................... 75 24.5 13.3 9 2.9 2.6 44 14.3 5.3 22 7.3 5.4 21 6.8 4.51988 .......................... 83 26.6 16.2 10 3.2 3.7 45 14.5 5.6 28 8.9 6.9 20 6.4 5.51987 .......................... 69 21.9 12.1 9 2.9 2.3 41 13.0 4.6 19 6.0 5.2 18 5.7 3.91986 .......................... 69 21.7 13.0 8 2.5 2.4 38 11.8 4.7 23 7.3 5.9 16 5.0 4.3
1985 .......................... 70 21.7 12.6 12 3.7 3.4 38 11.6 4.2 20 6.3 5.0 11 3.4 2.21984 .......................... 79 24.4 15.3 7 2.2 2.2 41 12.6 5.3 31 9.6 7.8 13 4.0 2.51983 .......................... 83 25.7 15.6 14 4.3 4.2 44 13.6 5.4 25 7.8 6.0 20 6.2 4.31982 .......................... 85 26.6 16.4 15 4.7 4.6 42 13.3 5.2 28 8.7 6.6 22 6.9 5.51981 .......................... 82 26.2 17.1 14 4.4 4.4 38 11.9 4.8 31 9.8 7.8 17 5.4 4.51980 .......................... 96 30.6 18.9 13 4.2 3.8 46 14.8 6.3 36 11.6 8.8 21 6.7 5.11979 .......................... 83 26.6 16.8 12 3.8 3.7 45 14.3 6.8 27 8.5 6.3 21 6.7 6.4
Black, female1992 .......................... - 4.5 29.6 0 0.0 0.0 - 4.5 29.6 0 0.0 0.0 0 0.0 0.01991 .......................... 0 0.0 0.0 0 0.0 0.0 0 0.0 0.0 0 0.0 0.0 0 0.0 0.01990 .......................... 0 0.0 0.0 0 0.0 0.0 0 0.0 0.0 0 0.0 0.0 0 0.0 0.01989 .......................... 0 0.0 0.0 0 0.0 0.0 0 0.0 0.0 0 0.0 0.0 0 0.0 0.01988 .......................... 0 0.0 0.0 0 0.0 0.0 0 0.0 0.0 0 0.0 0.0 0 0.0 0.01987 .......................... 0 0.0 0.0 0 0.0 0.0 0 0.0 0.0 0 0.0 0.0 0 0.0 0.01986 .......................... - 21.3 13.7 0 0.0 0.0 0 0.0 0.0 - 21.3 13.7 0 0.0 0.0
1985 .......................... 0 0.0 0.0 0 0.0 0.0 0 0.0 0.0 0 0.0 0.0 0 0.0 0.01984 .......................... - 5.9 24.2 0 0.0 0.0 - 5.9 24.2 0 0.0 0.0 0 0.0 0.01983 .......................... 0 0.0 0.0 0 0.0 0.0 0 0.0 0.0 0 0.0 0.0 0 0.0 0.01982 .......................... 0 0.0 0.0 0 0.0 0.0 0 0.0 0.0 0 0.0 0.0 0 0.0 0.01981 .......................... 0 0.0 0.0 0 0.0 0.0 0 0.0 0.0 0 0.0 0.0 0 0.0 0.01980 .......................... 0 0.0 0.0 0 0.0 0.0 0 0.0 0.0 0 0.0 0.0 0 0.0 0.01979 .......................... 0 0.0 0.0 0 0.0 0.0 0 0.0 0.0 0 0.0 0.0 0 0.0 0.0
- The AAF methodology used to estimate alcohol-related mortality can result in fractional estimates less than 0.5 but greater than 0.
- 117 -

Table 1. Number of deaths and unadjusted and age-adjusted death rates per 100,000 population for different categories of alcohol-related mortality byState: United States, 1979–92.
Ohio
Race, sex,and year
All Alcohol-Related Causes of DeathAll Chronic Liver Disease and
CirrhosisTotal Causes of Death with ExplicitMention of Alcohol
Other Alcohol-Related Diseases Other Alcohol-Related Injuries orAdverse Effects
Number Unadj.Rate
Age-Adj.Rate Number Unadj.
RateAge-Adj.
Rate Number Unadj.Rate
Age-Adj.Rate Number Unadj.
RateAge-Adj.
Rate Number Unadj.Rate
Age-Adj.Rate
All races, both sexes1992 .......................... 4,030 36.6 27.1 565 5.1 4.3 1,835 16.6 9.6 1,630 14.8 13.3 897 8.1 6.21991 .......................... 4,209 38.5 29.1 590 5.4 4.6 1,859 17.0 9.9 1,760 16.1 14.6 937 8.6 6.51990 .......................... 4,190 38.6 29.4 620 5.7 4.9 1,828 16.8 9.9 1,742 16.0 14.6 992 9.1 7.11989 .......................... 4,159 38.4 29.4 611 5.6 5.0 1,820 16.8 9.9 1,728 16.0 14.6 962 8.9 6.91988 .......................... 4,149 38.4 29.7 547 5.1 4.5 1,876 17.4 10.6 1,725 16.0 14.7 972 9.0 7.31987 .......................... 4,041 37.6 29.2 483 4.5 3.9 1,850 17.2 10.5 1,708 15.9 14.7 999 9.3 7.41986 .......................... 3,960 36.9 28.5 482 4.5 4.0 1,836 17.1 10.5 1,641 15.3 14.0 1,013 9.4 7.5
1985 .......................... 4,039 37.6 29.2 470 4.4 3.9 1,902 17.7 11.1 1,668 15.5 14.2 981 9.1 7.41984 .......................... 4,136 38.5 30.4 556 5.2 4.7 1,908 17.8 11.4 1,672 15.6 14.3 1,058 9.9 8.01983 .......................... 4,090 38.1 30.3 524 4.9 4.4 1,874 17.4 11.4 1,692 15.8 14.5 1,043 9.7 8.11982 .......................... 4,223 39.3 31.6 523 4.9 4.5 1,927 17.9 12.0 1,773 16.5 15.2 1,109 10.3 8.71981 .......................... 4,439 41.1 33.7 558 5.2 4.8 1,968 18.2 12.3 1,913 17.7 16.6 1,224 11.3 9.81980 .......................... 4,769 44.1 36.9 667 6.2 6.0 2,015 18.6 12.8 2,088 19.3 18.2 1,301 12.0 10.71979 .......................... 4,809 44.5 37.5 593 5.5 5.3 1,985 18.4 12.9 2,231 20.7 19.4 1,263 11.7 10.5
All races, male1992 .......................... 2,589 48.7 41.1 454 8.5 7.4 1,032 19.4 13.8 1,103 20.7 19.8 593 11.2 9.21991 .......................... 2,700 51.2 43.6 458 8.7 7.8 1,043 19.8 14.2 1,199 22.7 21.7 585 11.1 9.31990 .......................... 2,668 51.0 43.7 455 8.7 7.7 1,017 19.4 14.1 1,195 22.8 21.9 634 12.1 10.11989 .......................... 2,647 50.7 43.6 457 8.8 7.9 1,020 19.5 14.3 1,170 22.4 21.4 604 11.6 9.71988 .......................... 2,646 50.9 43.9 421 8.1 7.3 1,060 20.4 15.2 1,165 22.4 21.4 644 12.4 10.61987 .......................... 2,601 50.2 43.4 363 7.0 6.4 1,060 20.4 15.3 1,178 22.7 21.7 639 12.3 10.61986 .......................... 2,562 49.5 42.8 366 7.1 6.4 1,033 20.0 15.0 1,163 22.5 21.4 660 12.8 11.0
1985 .......................... 2,626 50.7 44.1 361 7.0 6.4 1,100 21.2 16.2 1,165 22.5 21.4 654 12.6 11.01984 .......................... 2,679 51.7 45.5 415 8.0 7.5 1,095 21.2 16.5 1,169 22.6 21.5 664 12.8 11.31983 .......................... 2,637 50.9 45.1 384 7.4 7.0 1,082 20.9 16.5 1,171 22.6 21.7 672 13.0 11.71982 .......................... 2,763 53.2 47.5 375 7.2 6.8 1,132 21.8 17.5 1,256 24.2 23.2 688 13.3 12.01981 .......................... 2,883 55.3 50.0 394 7.6 7.2 1,132 21.7 17.6 1,357 26.1 25.2 761 14.6 13.41980 .......................... 3,122 59.8 54.9 481 9.2 9.1 1,154 22.1 18.1 1,487 28.5 27.7 819 15.7 14.71979 .......................... 3,184 61.0 56.2 451 8.6 8.5 1,161 22.2 18.5 1,572 30.1 29.2 833 16.0 15.1
All races, female1992 .......................... 1,441 25.3 14.8 111 1.9 1.5 802 14.1 6.2 527 9.2 7.1 304 5.3 3.61991 .......................... 1,509 26.6 16.3 132 2.3 1.9 817 14.4 6.5 560 9.9 8.0 352 6.2 4.01990 .......................... 1,522 27.0 16.9 165 2.9 2.5 810 14.4 6.5 547 9.7 7.9 358 6.4 4.51989 .......................... 1,512 26.9 17.1 154 2.7 2.5 800 14.3 6.4 558 9.9 8.2 358 6.4 4.51988 .......................... 1,503 26.9 17.3 126 2.3 2.0 816 14.6 6.9 560 10.0 8.4 328 5.9 4.41987 .......................... 1,440 25.8 16.7 120 2.2 1.8 790 14.2 6.8 530 9.5 8.1 360 6.5 4.61986 .......................... 1,398 25.1 16.1 116 2.1 1.9 803 14.5 7.0 479 8.6 7.2 353 6.4 4.5
- 118 -

Table 1. Number of deaths and unadjusted and age-adjusted death rates per 100,000 population for different categories of alcohol-related mortality byState: United States, 1979–92.
Ohio
Race, sex,and year
All Alcohol-Related Causes of DeathAll Chronic Liver Disease and
CirrhosisTotal Causes of Death with ExplicitMention of Alcohol
Other Alcohol-Related Diseases Other Alcohol-Related Injuries orAdverse Effects
Number Unadj.Rate
Age-Adj.Rate Number Unadj.
RateAge-Adj.
Rate Number Unadj.Rate
Age-Adj.Rate Number Unadj.
RateAge-Adj.
Rate Number Unadj.Rate
Age-Adj.Rate
All races, female
1985 .......................... 1,414 25.4 16.2 109 2.0 1.8 802 14.4 7.0 502 9.0 7.4 327 5.9 4.41984 .......................... 1,457 26.2 17.3 141 2.5 2.2 813 14.6 7.4 503 9.1 7.8 394 7.1 5.21983 .......................... 1,453 26.1 17.4 140 2.5 2.2 792 14.2 7.4 521 9.4 7.8 371 6.7 5.21982 .......................... 1,460 26.2 17.9 148 2.7 2.5 795 14.3 7.6 517 9.3 7.8 421 7.6 5.91981 .......................... 1,556 27.9 19.6 164 2.9 2.7 837 15.0 8.2 556 10.0 8.6 463 8.3 6.71980 .......................... 1,647 29.5 21.0 186 3.3 3.2 861 15.4 8.5 601 10.8 9.3 482 8.6 7.21979 .......................... 1,625 29.1 21.1 142 2.5 2.5 824 14.8 8.5 659 11.8 10.2 430 7.7 6.6
White, male1992 .......................... 2,132 45.4 36.9 356 7.6 6.4 886 18.9 12.8 891 19.0 17.7 494 10.5 8.41991 .......................... 2,239 48.0 39.4 375 8.0 6.9 899 19.3 13.1 965 20.7 19.3 509 10.9 8.81990 .......................... 2,193 47.3 39.2 351 7.6 6.5 879 19.0 13.1 963 20.8 19.6 541 11.7 9.41989 .......................... 2,165 46.8 38.9 343 7.4 6.4 869 18.8 13.1 953 20.6 19.4 526 11.4 9.21988 .......................... 2,188 47.3 39.8 317 6.9 6.0 911 19.7 14.1 960 20.8 19.6 551 11.9 9.91987 .......................... 2,191 47.5 40.1 286 6.2 5.4 903 19.6 14.1 1,002 21.7 20.6 546 11.8 9.81986 .......................... 2,159 46.9 39.4 295 6.4 5.6 887 19.3 13.8 977 21.2 19.9 578 12.5 10.4
1985 .......................... 2,223 48.2 40.7 268 5.8 5.1 957 20.7 15.2 998 21.6 20.3 548 11.9 9.91984 .......................... 2,269 49.1 42.0 329 7.1 6.4 947 20.5 15.4 993 21.5 20.2 586 12.7 10.81983 .......................... 2,216 47.9 41.3 292 6.3 5.7 927 20.0 15.2 997 21.5 20.4 576 12.4 10.71982 .......................... 2,301 49.5 43.0 301 6.5 5.9 965 20.8 16.0 1,034 22.3 21.1 606 13.0 11.51981 .......................... 2,422 51.9 45.7 315 6.8 6.2 989 21.2 16.6 1,118 24.0 22.9 677 14.5 13.01980 .......................... 2,586 55.2 49.4 361 7.7 7.4 983 21.0 16.6 1,242 26.5 25.4 679 14.5 13.11979 .......................... 2,661 56.7 51.1 362 7.7 7.4 1,004 21.4 17.2 1,294 27.6 26.5 714 15.2 14.0
Black, male1992 .......................... 451 80.3 83.4 98 17.4 19.0 145 25.7 25.6 208 37.1 38.9 99 17.6 18.71991 .......................... 450 82.1 85.5 83 15.1 16.8 139 25.3 25.2 228 41.6 43.5 73 13.3 14.81990 .......................... 467 86.1 89.2 104 19.2 21.0 136 25.1 24.9 227 41.8 43.4 93 17.1 18.91989 .......................... 471 87.9 91.8 112 20.9 23.4 147 27.5 27.4 212 39.5 41.1 77 14.4 15.81988 .......................... 449 84.6 87.7 102 19.2 21.1 146 27.6 27.6 201 37.8 38.9 91 17.2 18.61987 .......................... 404 77.1 79.9 77 14.7 16.9 155 29.5 29.6 173 32.9 33.4 93 17.7 20.41986 .......................... 398 76.5 80.0 71 13.7 15.3 144 27.7 28.4 183 35.1 36.3 82 15.8 17.7
1985 .......................... 399 77.1 81.3 93 18.0 20.6 142 27.3 28.0 164 31.7 32.7 106 20.5 23.21984 .......................... 401 78.0 82.7 85 16.5 18.7 146 28.4 29.5 170 33.0 34.5 76 14.8 16.81983 .......................... 412 80.5 86.5 90 17.6 20.4 152 29.8 31.0 169 33.1 35.1 93 18.2 21.11982 .......................... 459 90.0 96.3 74 14.5 16.5 165 32.4 34.1 220 43.1 45.7 81 15.9 18.21981 .......................... 455 89.5 96.4 79 15.5 18.1 140 27.5 28.8 236 46.4 49.4 83 16.3 18.8
- 119 -

Table 1. Number of deaths and unadjusted and age-adjusted death rates per 100,000 population for different categories of alcohol-related mortality byState: United States, 1979–92.
Ohio
Race, sex,and year
All Alcohol-Related Causes of DeathAll Chronic Liver Disease and
CirrhosisTotal Causes of Death with ExplicitMention of Alcohol
Other Alcohol-Related Diseases Other Alcohol-Related Injuries orAdverse Effects
Number Unadj.Rate
Age-Adj.Rate Number Unadj.
RateAge-Adj.
Rate Number Unadj.Rate
Age-Adj.Rate Number Unadj.
RateAge-Adj.
Rate Number Unadj.Rate
Age-Adj.Rate
Black, male1980 .......................... 531 104.9 115.0 120 23.7 28.3 169 33.4 35.3 242 47.8 51.4 140 27.6 32.41979 .......................... 519 104.5 113.3 89 17.9 21.2 156 31.4 33.1 274 55.2 58.9 119 24.0 27.8
White, female1992 .......................... 1,246 24.9 13.7 85 1.7 1.3 703 14.1 5.7 458 9.2 6.8 260 5.2 3.31991 .......................... 1,300 26.1 15.1 97 1.9 1.5 719 14.4 6.0 484 9.7 7.6 304 6.1 3.81990 .......................... 1,292 26.1 15.3 115 2.3 1.9 708 14.3 6.0 469 9.5 7.5 300 6.1 4.01989 .......................... 1,321 26.7 16.1 113 2.3 2.0 717 14.5 6.1 492 9.9 8.0 311 6.3 4.21988 .......................... 1,288 26.1 15.8 84 1.7 1.4 726 14.7 6.5 478 9.7 7.9 259 5.2 3.61987 .......................... 1,240 25.2 15.4 88 1.8 1.4 690 14.0 6.2 462 9.4 7.8 306 6.2 4.11986 .......................... 1,206 24.5 14.8 87 1.8 1.5 701 14.2 6.4 418 8.5 6.9 303 6.2 4.1
1985 .......................... 1,231 25.0 15.1 77 1.6 1.3 706 14.3 6.4 448 9.1 7.4 273 5.5 3.91984 .......................... 1,269 25.7 16.1 102 2.1 1.7 727 14.7 6.9 440 8.9 7.5 338 6.9 4.81983 .......................... 1,263 25.6 16.1 99 2.0 1.6 710 14.4 7.0 455 9.2 7.5 306 6.2 4.61982 .......................... 1,266 25.6 16.5 113 2.3 2.0 708 14.3 7.2 446 9.0 7.4 364 7.4 5.41981 .......................... 1,352 27.2 18.1 125 2.5 2.3 745 15.0 7.7 482 9.7 8.2 400 8.1 6.21980 .......................... 1,437 28.9 19.5 136 2.7 2.5 773 15.5 8.1 529 10.6 9.0 408 8.2 6.51979 .......................... 1,411 28.3 19.6 108 2.2 2.0 733 14.7 8.0 570 11.4 9.6 372 7.5 6.2
Black, female1992 .......................... 188 29.5 24.7 25 3.9 4.0 98 15.3 11.2 66 10.3 9.5 43 6.7 6.21991 .......................... 202 32.3 27.0 35 5.6 5.1 95 15.2 11.2 72 11.5 10.7 47 7.5 6.41990 .......................... 225 36.4 31.6 49 7.9 8.0 101 16.4 12.0 75 12.1 11.6 57 9.2 9.01989 .......................... 182 29.8 26.1 40 6.5 6.8 82 13.3 9.8 61 9.9 9.5 44 7.2 7.01988 .......................... 207 34.3 30.9 40 6.6 7.0 90 14.8 11.5 78 12.8 12.4 68 11.2 11.31987 .......................... 196 32.7 29.2 32 5.4 5.7 98 16.5 13.2 65 10.9 10.3 52 8.7 8.61986 .......................... 189 32.0 28.8 29 4.9 5.3 101 17.0 13.8 60 10.1 9.7 46 7.8 7.7
1985 .......................... 180 30.6 27.5 32 5.4 5.8 95 16.2 13.2 53 9.0 8.5 54 9.2 9.31984 .......................... 183 31.4 28.8 38 6.5 6.7 85 14.5 11.9 61 10.4 10.2 55 9.4 9.01983 .......................... 184 31.7 29.9 41 7.1 7.5 80 13.8 12.0 62 10.8 10.4 65 11.2 11.41982 .......................... 190 33.0 30.9 34 5.9 6.6 87 15.1 12.8 69 12.0 11.5 54 9.4 10.11981 .......................... 200 34.8 33.1 39 6.8 7.3 91 15.8 13.8 70 12.2 12.0 63 11.0 11.51980 .......................... 209 36.6 35.5 50 8.7 9.8 88 15.4 13.5 71 12.5 12.2 74 12.9 14.11979 .......................... 211 37.6 36.1 34 6.1 6.7 88 15.8 13.9 88 15.8 15.5 57 10.2 10.6
- 120 -

Table 1. Number of deaths and unadjusted and age-adjusted death rates per 100,000 population for different categories of alcohol-related mortality byState: United States, 1979–92.
Oklahoma
Race, sex,and year
All Alcohol-Related Causes of DeathAll Chronic Liver Disease and
CirrhosisTotal Causes of Death with ExplicitMention of Alcohol
Other Alcohol-Related Diseases Other Alcohol-Related Injuries orAdverse Effects
Number Unadj.Rate
Age-Adj.Rate Number Unadj.
RateAge-Adj.
Rate Number Unadj.Rate
Age-Adj.Rate Number Unadj.
RateAge-Adj.
Rate Number Unadj.Rate
Age-Adj.Rate
All races, both sexes1992 .......................... 1,353 42.2 32.8 185 5.8 5.0 530 16.5 9.3 638 19.9 18.5 286 8.9 7.01991 .......................... 1,384 43.7 34.2 182 5.7 5.3 536 16.9 9.4 666 21.0 19.6 299 9.4 7.51990 .......................... 1,360 43.2 33.3 169 5.4 4.6 538 17.1 9.3 653 20.7 19.4 249 7.9 5.91989 .......................... 1,327 42.1 33.1 181 5.7 5.1 500 15.9 8.8 645 20.5 19.1 254 8.1 6.61988 .......................... 1,411 44.6 35.1 205 6.5 6.0 528 16.7 9.2 679 21.4 19.9 289 9.1 7.31987 .......................... 1,317 41.0 32.4 137 4.3 3.9 517 16.1 9.2 663 20.7 19.2 236 7.4 6.01986 .......................... 1,456 44.8 36.2 181 5.6 5.1 553 17.0 10.2 722 22.2 20.9 283 8.7 7.4
1985 .......................... 1,428 43.6 35.5 202 6.2 5.7 496 15.2 8.9 730 22.3 20.9 254 7.8 6.51984 .......................... 1,460 44.4 36.4 193 5.9 5.6 501 15.3 9.0 766 23.3 21.7 260 7.9 6.81983 .......................... 1,518 46.1 38.5 214 6.5 6.3 507 15.4 9.3 797 24.2 22.9 275 8.4 7.51982 .......................... 1,735 54.1 45.7 263 8.2 7.9 534 16.6 10.3 938 29.3 27.5 315 9.8 8.61981 .......................... 1,748 56.4 47.5 306 9.9 9.4 549 17.7 10.8 892 28.8 27.3 380 12.3 10.61980 .......................... 1,687 55.5 46.6 306 10.1 9.6 525 17.3 10.4 855 28.1 26.5 318 10.5 9.21979 .......................... 1,641 55.2 46.3 285 9.6 9.4 543 18.3 11.4 813 27.4 25.5 361 12.2 11.1
All races, male1992 .......................... 857 54.9 47.3 140 9.0 7.9 276 17.7 12.3 441 28.2 27.1 164 10.5 9.11991 .......................... 886 57.5 50.2 141 9.1 8.6 286 18.5 12.9 459 29.8 28.7 188 12.2 10.61990 .......................... 863 56.4 48.3 125 8.2 7.2 292 19.0 13.0 447 29.2 28.0 156 10.2 8.21989 .......................... 867 56.5 49.1 139 9.1 8.3 266 17.3 12.1 462 30.1 28.8 157 10.2 8.91988 .......................... 921 59.7 52.2 155 10.0 9.6 284 18.4 12.9 482 31.2 29.7 178 11.5 10.41987 .......................... 854 54.5 47.9 110 7.0 6.7 291 18.6 13.3 453 28.9 27.9 154 9.8 8.81986 .......................... 960 60.5 53.9 141 8.9 8.4 305 19.2 14.3 514 32.4 31.2 174 11.0 10.1
1985 .......................... 937 58.7 52.5 147 9.2 8.7 266 16.7 12.3 524 32.8 31.5 157 9.8 8.81984 .......................... 952 59.4 53.8 149 9.3 9.2 262 16.4 12.2 540 33.7 32.4 156 9.7 9.31983 .......................... 1,012 63.0 57.2 166 10.3 10.2 278 17.3 13.0 567 35.3 34.1 177 11.0 10.41982 .......................... 1,161 74.2 68.0 203 13.0 12.8 292 18.7 14.2 666 42.6 41.0 208 13.3 12.51981 .......................... 1,174 77.7 70.9 236 15.6 15.2 304 20.1 15.1 635 42.0 40.6 254 16.8 15.51980 .......................... 1,142 77.0 70.3 246 16.6 16.1 288 19.4 14.5 608 41.0 39.7 210 14.2 13.21979 .......................... 1,102 76.0 68.8 208 14.3 14.0 299 20.6 15.6 595 41.0 39.2 217 15.0 14.1
All races, female1992 .......................... 496 30.2 19.5 45 2.7 2.5 254 15.5 6.8 197 12.0 10.1 122 7.4 5.11991 .......................... 498 30.6 19.5 41 2.5 2.3 250 15.4 6.5 207 12.7 10.7 111 6.8 4.71990 .......................... 496 30.7 19.8 44 2.7 2.4 246 15.2 6.2 206 12.8 11.2 93 5.8 4.01989 .......................... 460 28.4 18.5 42 2.6 2.3 234 14.5 6.3 183 11.3 9.9 97 6.0 4.71988 .......................... 491 30.2 19.5 50 3.1 2.7 244 15.0 6.3 197 12.1 10.5 111 6.8 4.61987 .......................... 464 28.2 18.3 27 1.6 1.5 226 13.8 5.9 210 12.8 10.9 82 5.0 3.51986 .......................... 496 29.8 20.1 40 2.4 2.2 248 14.9 6.9 208 12.5 11.1 109 6.5 5.0
- 121 -

Table 1. Number of deaths and unadjusted and age-adjusted death rates per 100,000 population for different categories of alcohol-related mortality byState: United States, 1979–92.
Oklahoma
Race, sex,and year
All Alcohol-Related Causes of DeathAll Chronic Liver Disease and
CirrhosisTotal Causes of Death with ExplicitMention of Alcohol
Other Alcohol-Related Diseases Other Alcohol-Related Injuries orAdverse Effects
Number Unadj.Rate
Age-Adj.Rate Number Unadj.
RateAge-Adj.
Rate Number Unadj.Rate
Age-Adj.Rate Number Unadj.
RateAge-Adj.
Rate Number Unadj.Rate
Age-Adj.Rate
All races, female
1985 .......................... 490 29.3 20.1 55 3.3 3.1 230 13.7 6.2 206 12.3 10.7 97 5.8 4.61984 .......................... 509 30.2 20.4 44 2.6 2.4 239 14.2 6.5 226 13.4 11.5 104 6.2 4.41983 .......................... 507 30.1 21.5 48 2.8 2.8 229 13.6 6.5 230 13.6 12.1 98 5.8 5.01982 .......................... 573 34.9 25.3 60 3.7 3.6 242 14.7 7.1 272 16.5 14.5 107 6.5 5.01981 .......................... 573 36.2 26.1 70 4.4 4.3 246 15.5 7.4 258 16.3 14.4 126 7.9 6.51980 .......................... 544 35.0 24.8 60 3.9 3.8 238 15.3 7.2 247 15.9 13.7 108 6.9 5.61979 .......................... 539 35.4 25.7 77 5.1 5.2 244 16.0 8.1 218 14.3 12.4 144 9.5 8.4
White, male1992 .......................... 714 55.1 45.4 115 8.9 7.4 242 18.6 11.9 358 27.6 26.1 140 10.8 8.61991 .......................... 732 57.1 47.7 106 8.3 7.4 248 19.3 12.4 378 29.5 27.9 153 11.9 9.71990 .......................... 720 56.6 46.2 102 8.0 6.7 254 19.9 12.5 365 28.7 27.0 140 11.0 8.31989 .......................... 716 55.9 46.7 109 8.5 7.4 229 17.9 11.4 378 29.5 27.9 130 10.2 8.21988 .......................... 781 60.4 50.7 124 9.6 8.6 246 19.0 12.3 411 31.7 29.7 146 11.3 9.51987 .......................... 708 53.7 45.1 86 6.5 5.8 255 19.3 12.8 367 27.8 26.5 128 9.7 7.91986 .......................... 808 60.1 51.4 115 8.6 7.7 264 19.6 13.4 429 31.9 30.3 146 10.9 9.4
1985 .......................... 781 57.5 49.6 110 8.1 7.2 226 16.6 11.4 446 32.8 31.1 121 8.9 7.41984 .......................... 807 58.9 51.5 119 8.7 8.0 230 16.7 11.7 459 33.5 31.7 132 9.6 8.61983 .......................... 856 62.0 54.4 127 9.2 8.5 249 18.1 12.7 479 34.8 33.1 150 10.9 9.71982 .......................... 974 72.2 64.0 149 11.0 10.3 260 19.3 13.8 565 41.9 39.9 174 12.9 11.61981 .......................... 988 75.6 66.7 191 14.6 13.5 261 19.9 14.0 537 41.1 39.2 212 16.2 14.01980 .......................... 955 74.0 65.5 186 14.4 13.3 254 19.7 14.0 515 39.9 38.2 165 12.8 11.21979 .......................... 904 71.4 62.4 147 11.6 10.7 257 20.3 14.4 501 39.6 37.2 164 13.0 11.4
Black, male1992 .......................... 74 61.3 69.5 14 11.7 14.9 20 16.9 21.2 39 32.7 33.4 11 9.2 12.11991 .......................... 89 76.3 85.3 18 15.5 19.6 23 20.2 23.8 47 40.5 41.9 15 12.9 16.21990 .......................... 90 78.3 84.9 13 11.3 12.9 25 21.8 25.0 52 45.2 46.9 7 6.1 6.31989 .......................... 92 80.6 87.7 15 13.2 16.6 24 20.8 23.4 53 46.6 47.8 9 7.9 9.61988 .......................... 83 73.5 83.5 17 15.0 22.1 26 22.9 25.3 40 35.6 36.2 20 17.6 22.01987 .......................... 88 77.7 89.2 14 12.3 18.4 24 21.2 25.2 50 44.2 45.6 11 9.7 14.21986 .......................... 90 78.6 92.2 12 10.5 13.8 27 24.1 31.2 50 44.0 47.2 14 12.3 16.0
1985 .......................... 95 83.8 96.4 21 18.5 25.7 27 23.8 27.4 47 41.5 43.3 16 14.1 18.11984 .......................... 87 77.5 88.8 12 10.6 15.8 20 17.6 20.1 56 49.2 52.9 4 3.5 4.61983 .......................... 82 73.6 82.9 15 13.4 19.8 18 16.3 18.6 49 43.9 44.5 9 8.0 11.81982 .......................... 106 98.0 115.8 23 21.4 28.8 22 20.3 25.0 61 56.4 62.0 14 13.0 17.51981 .......................... 105 101.4 118.7 16 15.5 22.6 29 28.3 34.0 59 57.6 62.1 18 17.4 25.7
- 122 -

Table 1. Number of deaths and unadjusted and age-adjusted death rates per 100,000 population for different categories of alcohol-related mortality byState: United States, 1979–92.
Oklahoma
Race, sex,and year
All Alcohol-Related Causes of DeathAll Chronic Liver Disease and
CirrhosisTotal Causes of Death with ExplicitMention of Alcohol
Other Alcohol-Related Diseases Other Alcohol-Related Injuries orAdverse Effects
Number Unadj.Rate
Age-Adj.Rate Number Unadj.
RateAge-Adj.
Rate Number Unadj.Rate
Age-Adj.Rate Number Unadj.
RateAge-Adj.
Rate Number Unadj.Rate
Age-Adj.Rate
Black, male1980 .......................... 109 108.7 128.5 29 28.8 41.4 20 19.7 21.8 60 60.1 65.3 20 19.9 28.11979 .......................... 115 119.1 138.1 20 20.7 26.7 29 30.2 32.9 66 68.1 78.5 13 13.5 17.0
White, female1992 .......................... 424 31.2 18.7 31 2.3 2.0 223 16.4 6.4 170 12.5 10.3 96 7.0 4.41991 .......................... 426 31.5 18.8 31 2.3 2.0 221 16.3 6.2 174 12.9 10.6 90 6.7 4.31990 .......................... 430 32.0 19.5 35 2.6 2.1 219 16.3 6.0 176 13.1 11.4 79 5.9 3.71989 .......................... 397 29.4 18.1 33 2.4 2.1 207 15.3 6.0 157 11.6 10.0 81 6.0 4.41988 .......................... 423 31.0 18.8 38 2.8 2.3 215 15.7 6.0 170 12.5 10.5 85 6.2 3.71987 .......................... 401 28.9 17.8 20 1.4 1.3 199 14.3 5.5 182 13.1 11.0 68 4.9 3.21986 .......................... 435 30.8 19.6 29 2.1 1.7 222 15.7 6.7 184 13.0 11.2 84 5.9 4.1
1985 .......................... 422 29.6 19.1 34 2.4 2.2 205 14.4 6.0 183 12.8 11.0 73 5.1 3.81984 .......................... 442 30.8 19.6 30 2.1 1.8 211 14.7 6.1 201 14.0 11.7 82 5.7 3.61983 .......................... 434 30.0 20.2 31 2.1 2.1 205 14.2 6.2 198 13.7 12.0 73 5.0 3.91982 .......................... 499 35.2 24.3 46 3.3 3.1 214 15.1 6.8 238 16.8 14.5 89 6.3 4.51981 .......................... 491 35.8 24.5 52 3.8 3.4 217 15.8 6.9 222 16.2 14.2 97 7.1 5.21980 .......................... 475 35.2 23.5 43 3.2 2.9 214 15.9 7.0 218 16.2 13.6 87 6.4 4.81979 .......................... 458 34.6 23.7 53 4.0 3.9 214 16.1 7.5 191 14.4 12.3 109 8.2 6.7
Black, female1992 .......................... 38 30.3 28.1 3 2.4 2.6 17 13.5 11.7 18 14.4 13.8 9 7.1 6.91991 .......................... 34 28.0 25.1 4 3.3 3.7 14 11.1 8.5 17 13.7 13.0 4 3.3 4.21990 .......................... 36 29.9 26.8 3 2.5 2.6 16 13.5 10.7 17 14.0 13.6 3 2.5 3.41989 .......................... 33 27.6 24.0 3 2.5 2.9 16 13.2 10.0 14 11.8 11.1 3 2.5 3.11988 .......................... 35 29.3 27.5 5 4.2 5.7 16 13.2 10.2 14 11.9 11.5 9 7.6 8.71987 .......................... 37 31.0 28.2 4 3.4 4.4 17 13.9 11.0 16 13.8 12.7 7 5.9 7.01986 .......................... 39 32.4 29.6 6 5.0 5.7 17 14.5 10.6 15 12.9 13.4 11 9.2 10.8
1985 .......................... 42 35.1 35.7 15 12.6 16.3 14 11.7 8.9 13 10.8 10.5 13 10.9 13.81984 .......................... 39 32.6 30.5 9 7.6 9.8 15 12.8 9.0 14 12.2 11.8 8 6.7 7.81983 .......................... 36 30.8 31.2 4 3.4 4.2 15 12.8 11.6 17 14.6 15.4 7 5.9 7.61982 .......................... 37 32.5 30.6 6 5.3 6.4 17 14.7 11.5 14 12.5 12.7 4 3.5 3.51981 .......................... 46 42.1 38.3 4 3.7 4.7 19 17.3 14.0 23 21.1 19.6 8 7.3 9.41980 .......................... 37 35.1 34.3 6 5.6 8.3 15 14.3 11.1 16 15.2 14.9 9 8.5 11.31979 .......................... 48 47.2 44.6 12 11.7 14.9 19 18.6 14.3 17 16.9 15.5 14 13.7 16.1
- 123 -

Table 1. Number of deaths and unadjusted and age-adjusted death rates per 100,000 population for different categories of alcohol-related mortality byState: United States, 1979–92.
Oregon
Race, sex,and year
All Alcohol-Related Causes of DeathAll Chronic Liver Disease and
CirrhosisTotal Causes of Death with ExplicitMention of Alcohol
Other Alcohol-Related Diseases Other Alcohol-Related Injuries orAdverse Effects
Number Unadj.Rate
Age-Adj.Rate Number Unadj.
RateAge-Adj.
Rate Number Unadj.Rate
Age-Adj.Rate Number Unadj.
RateAge-Adj.
Rate Number Unadj.Rate
Age-Adj.Rate
All races, both sexes1992 .......................... 1,295 43.6 32.0 290 9.8 8.1 486 16.4 8.4 519 17.4 15.5 269 9.1 6.81991 .......................... 1,245 42.7 32.2 291 10.0 8.3 446 15.3 7.9 508 17.4 16.0 263 9.0 6.71990 .......................... 1,279 44.7 34.2 323 11.3 9.3 438 15.3 8.0 518 18.1 16.9 268 9.4 7.31989 .......................... 1,340 48.0 36.4 312 11.2 9.1 441 15.8 8.2 587 21.0 19.1 261 9.4 7.21988 .......................... 1,347 49.1 37.6 316 11.5 9.4 424 15.5 8.0 607 22.2 20.2 290 10.6 8.11987 .......................... 1,286 47.6 37.3 276 10.2 8.7 421 15.6 8.4 589 21.8 20.2 256 9.5 7.61986 .......................... 1,316 49.0 38.6 325 12.1 10.2 385 14.3 7.7 606 22.6 20.7 299 11.1 9.2
1985 .......................... 1,270 47.5 37.3 299 11.2 9.6 409 15.3 8.3 562 21.0 19.4 283 10.6 8.61984 .......................... 1,298 48.7 38.9 342 12.8 11.0 397 14.9 8.5 559 21.0 19.4 316 11.9 10.11983 .......................... 1,264 47.7 38.6 332 12.5 11.2 385 14.5 8.2 547 20.6 19.2 297 11.2 9.81982 .......................... 1,186 44.5 35.8 275 10.3 9.0 379 14.2 8.3 532 20.0 18.4 279 10.5 8.91981 .......................... 1,304 48.9 40.5 291 10.9 9.9 416 15.6 9.8 597 22.4 20.8 353 13.2 11.61980 .......................... 1,282 48.5 40.2 279 10.6 9.6 400 15.1 9.3 604 22.8 21.3 343 13.0 11.51979 .......................... 1,308 50.7 42.8 285 11.1 10.5 421 16.3 10.6 602 23.4 21.7 344 13.3 12.1
All races, male1992 .......................... 835 57.1 46.6 210 14.4 12.3 266 18.2 11.6 359 24.5 22.7 174 11.9 9.51991 .......................... 815 56.8 47.4 221 15.4 13.2 242 16.8 10.7 352 24.5 23.5 178 12.4 9.91990 .......................... 851 60.5 51.1 245 17.4 14.8 239 17.0 11.1 366 26.1 25.2 169 12.0 10.01989 .......................... 884 64.5 54.1 241 17.6 15.0 240 17.5 11.4 403 29.4 27.7 184 13.4 10.91988 .......................... 855 63.5 53.9 219 16.3 13.7 217 16.1 10.5 419 31.1 29.6 178 13.2 10.81987 .......................... 850 64.1 55.0 193 14.5 12.6 233 17.5 11.7 424 32.0 30.7 158 11.9 10.01986 .......................... 886 67.1 57.4 242 18.3 15.9 211 16.0 10.6 432 32.8 30.8 209 15.8 13.7
1985 .......................... 845 64.3 54.8 216 16.4 14.1 226 17.2 11.5 403 30.7 29.1 188 14.3 12.01984 .......................... 851 64.9 56.8 241 18.4 16.5 213 16.3 11.4 397 30.3 28.9 202 15.4 13.81983 .......................... 834 63.9 56.1 232 17.8 16.3 211 16.1 11.3 391 30.0 28.6 191 14.6 13.21982 .......................... 774 59.0 51.4 199 15.2 13.5 204 15.5 11.1 371 28.3 26.8 184 14.0 12.51981 .......................... 862 65.6 58.4 206 15.7 14.3 228 17.4 13.1 428 32.6 31.0 230 17.5 16.01980 .......................... 847 65.1 58.4 208 16.0 15.2 213 16.4 12.2 425 32.7 31.0 229 17.6 16.71979 .......................... 878 69.2 62.4 195 15.4 14.8 237 18.6 14.3 446 35.2 33.4 216 17.0 15.9
All races, female1992 .......................... 460 30.5 18.5 80 5.3 4.2 220 14.6 5.8 160 10.6 8.5 95 6.3 4.41991 .......................... 430 29.0 18.1 70 4.7 3.7 204 13.8 5.7 155 10.5 8.6 85 5.7 3.81990 .......................... 428 29.5 18.3 78 5.4 4.2 199 13.7 5.3 152 10.4 8.8 99 6.8 4.81989 .......................... 456 32.1 20.1 71 5.0 3.7 201 14.2 5.6 184 13.0 10.8 77 5.4 3.91988 .......................... 492 35.3 22.3 97 7.0 5.5 207 14.8 5.9 188 13.5 10.9 112 8.0 5.81987 .......................... 436 31.7 20.9 83 6.0 5.2 189 13.7 5.6 164 12.0 10.1 98 7.1 5.41986 .......................... 430 31.5 21.1 83 6.1 4.9 174 12.7 5.2 173 12.7 11.0 90 6.6 5.1
- 124 -

Table 1. Number of deaths and unadjusted and age-adjusted death rates per 100,000 population for different categories of alcohol-related mortality byState: United States, 1979–92.
Oregon
Race, sex,and year
All Alcohol-Related Causes of DeathAll Chronic Liver Disease and
CirrhosisTotal Causes of Death with ExplicitMention of Alcohol
Other Alcohol-Related Diseases Other Alcohol-Related Injuries orAdverse Effects
Number Unadj.Rate
Age-Adj.Rate Number Unadj.
RateAge-Adj.
Rate Number Unadj.Rate
Age-Adj.Rate Number Unadj.
RateAge-Adj.
Rate Number Unadj.Rate
Age-Adj.Rate
All races, female
1985 .......................... 425 31.2 21.4 83 6.1 5.7 183 13.5 5.7 159 11.7 10.1 95 7.0 5.61984 .......................... 447 33.0 22.4 101 7.5 6.1 184 13.6 6.1 162 11.9 10.2 114 8.4 6.71983 .......................... 430 31.9 22.4 100 7.4 6.6 174 12.9 5.7 156 11.6 10.1 106 7.9 6.81982 .......................... 412 30.4 21.4 76 5.6 5.0 175 12.9 6.0 161 11.9 10.4 95 7.0 5.71981 .......................... 442 32.6 23.9 85 6.3 5.9 188 13.9 7.0 169 12.5 11.0 123 9.1 7.51980 .......................... 436 32.5 23.3 71 5.3 4.6 186 13.9 6.8 178 13.3 11.9 114 8.5 6.81979 .......................... 430 32.9 24.4 90 6.9 6.6 184 14.1 7.4 156 11.9 10.3 128 9.8 8.7
White, male1992 .......................... 788 57.3 45.7 197 14.3 12.0 255 18.5 11.4 336 24.4 22.4 166 12.1 9.41991 .......................... 769 56.8 46.4 206 15.2 12.7 234 17.3 10.5 329 24.3 23.2 169 12.5 9.71990 .......................... 811 61.2 50.7 236 17.8 14.7 232 17.5 11.0 343 25.9 24.9 162 12.2 9.81989 .......................... 836 64.5 53.2 225 17.4 14.5 229 17.7 11.0 382 29.5 27.7 172 13.3 10.51988 .......................... 800 62.8 52.3 201 15.8 12.9 210 16.5 10.4 389 30.5 28.9 164 12.9 10.11987 .......................... 813 64.6 54.6 185 14.7 12.5 226 17.9 11.5 402 31.9 30.6 151 12.0 9.91986 .......................... 845 67.4 56.9 230 18.4 15.6 202 16.2 10.4 412 32.9 30.8 200 16.0 13.5
1985 .......................... 800 64.0 53.6 206 16.5 13.9 218 17.5 11.3 375 30.0 28.3 180 14.4 11.81984 .......................... 818 65.4 56.5 226 18.1 15.9 209 16.7 11.5 382 30.6 29.2 192 15.4 13.41983 .......................... 788 63.3 54.7 214 17.2 15.4 205 16.4 11.2 369 29.7 28.1 180 14.4 12.71982 .......................... 734 58.6 50.3 188 15.0 13.1 199 15.9 11.1 347 27.7 26.1 175 14.0 12.21981 .......................... 822 65.4 57.4 194 15.4 13.8 219 17.4 12.8 409 32.5 30.9 216 17.2 15.41980 .......................... 803 64.3 57.1 189 15.1 14.1 206 16.5 12.0 408 32.7 31.0 214 17.1 16.01979 .......................... 829 67.9 60.6 179 14.7 13.9 228 18.7 14.0 422 34.5 32.7 201 16.5 15.2
Black, male1992 .......................... 19 70.9 87.6 4 15.1 23.9 6 22.2 30.0 9 33.6 33.7 3 11.3 17.61991 .......................... 24 93.5 112.4 8 31.3 44.3 4 15.7 21.9 12 46.5 46.2 5 19.5 27.31990 .......................... 21 83.9 95.3 7 28.5 33.8 4 15.5 20.5 10 39.8 41.0 4 16.3 20.41989 .......................... 19 79.7 101.7 3 12.6 19.8 7 30.6 43.0 9 36.5 38.8 5 21.1 30.91988 .......................... 26 115.1 138.2 7 30.4 43.8 5 20.8 26.9 15 63.9 67.6 5 21.7 30.21987 .......................... 17 78.2 91.0 4 18.0 23.7 4 18.5 25.6 9 41.7 41.7 1 4.5 7.21986 .......................... 21 96.7 107.6 9 41.3 43.8 3 13.8 18.0 9 41.6 45.8 7 32.1 36.3
1985 .......................... 22 101.1 121.6 6 28.1 35.6 5 22.2 30.5 11 50.8 55.5 5 23.4 28.91984 .......................... 16 75.7 96.9 6 28.7 41.1 3 12.1 15.9 7 35.0 39.9 4 19.1 26.41983 .......................... 24 115.2 140.8 10 48.7 60.5 5 23.9 32.8 9 42.7 47.4 3 14.6 18.11982 .......................... 18 90.8 99.3 5 24.7 31.9 2 11.5 14.6 11 54.6 52.8 3 14.8 18.71981 .......................... 21 107.5 128.4 7 35.2 48.6 5 26.3 33.7 9 46.0 46.1 9 45.3 60.3
- 125 -

Table 1. Number of deaths and unadjusted and age-adjusted death rates per 100,000 population for different categories of alcohol-related mortality byState: United States, 1979–92.
Oregon
Race, sex,and year
All Alcohol-Related Causes of DeathAll Chronic Liver Disease and
CirrhosisTotal Causes of Death with ExplicitMention of Alcohol
Other Alcohol-Related Diseases Other Alcohol-Related Injuries orAdverse Effects
Number Unadj.Rate
Age-Adj.Rate Number Unadj.
RateAge-Adj.
Rate Number Unadj.Rate
Age-Adj.Rate Number Unadj.
RateAge-Adj.
Rate Number Unadj.Rate
Age-Adj.Rate
Black, male1980 .......................... 20 103.1 130.3 10 51.7 69.3 4 22.3 29.1 6 29.1 31.9 8 41.3 57.01979 .......................... 26 142.1 177.0 8 43.5 59.4 6 33.4 43.0 12 65.1 74.6 12 65.3 86.6
White, female1992 .......................... 436 30.7 17.8 74 5.2 4.0 215 15.1 5.7 148 10.4 8.1 88 6.2 4.11991 .......................... 408 29.1 17.6 63 4.5 3.5 199 14.2 5.7 146 10.4 8.5 79 5.6 3.61990 .......................... 409 29.8 18.1 72 5.2 4.1 194 14.1 5.3 144 10.5 8.7 95 6.9 4.71989 .......................... 438 32.6 19.9 70 5.2 3.8 194 14.4 5.5 174 12.9 10.6 73 5.4 3.81988 .......................... 464 35.1 21.5 87 6.6 5.0 201 15.2 5.8 177 13.4 10.7 102 7.7 5.41987 .......................... 420 32.1 20.7 79 6.1 5.1 184 14.1 5.6 157 12.0 10.1 94 7.2 5.31986 .......................... 408 31.5 20.5 74 5.7 4.5 169 13.0 5.1 165 12.7 10.9 82 6.3 4.8
1985 .......................... 406 31.3 21.0 77 5.9 5.4 180 13.9 5.7 149 11.5 9.9 90 7.0 5.41984 .......................... 428 33.1 21.8 93 7.2 5.7 181 14.0 6.1 154 11.9 10.0 104 8.0 6.11983 .......................... 415 32.2 22.1 95 7.4 6.3 171 13.3 5.7 149 11.6 10.0 102 7.9 6.61982 .......................... 396 30.6 21.0 72 5.6 4.8 172 13.2 5.9 152 11.8 10.3 90 6.9 5.51981 .......................... 420 32.4 23.1 78 6.0 5.5 185 14.3 7.1 157 12.1 10.5 116 8.9 7.21980 .......................... 417 32.4 22.7 65 5.0 4.2 182 14.1 6.7 170 13.2 11.8 108 8.4 6.51979 .......................... 412 32.7 23.8 83 6.6 6.2 180 14.3 7.4 149 11.8 10.2 118 9.4 8.1
Black, female1992 .......................... 10 42.3 40.9 2 8.3 7.8 1 5.5 5.3 7 28.5 27.8 2 8.3 7.81991 .......................... 7 30.6 28.3 2 8.5 6.1 2 10.0 8.2 3 12.1 14.1 1 4.2 4.11990 .......................... 6 28.1 26.4 2 8.8 8.7 2 10.3 9.4 2 9.0 8.3 1 4.4 4.21989 .......................... 8 37.9 38.3 0 0.0 0.0 4 17.8 16.9 4 20.1 21.4 2 9.1 11.51988 .......................... 8 39.7 43.4 3 14.1 19.3 3 14.1 13.0 2 11.6 11.1 3 14.1 19.61987 .......................... 6 28.2 26.4 0 0.0 0.0 3 15.8 13.8 3 12.4 12.6 0 0.0 0.01986 .......................... 8 39.6 44.8 3 14.9 19.7 2 11.8 12.7 3 12.9 12.4 3 14.9 19.7
1985 .......................... 6 30.4 28.5 1 5.0 6.5 1 7.1 6.6 4 18.3 15.5 1 5.0 6.51984 .......................... 7 38.5 37.4 2 10.3 9.5 1 6.4 6.8 4 21.8 21.1 3 15.4 15.91983 .......................... 7 34.2 39.4 2 10.5 15.4 1 5.9 5.4 3 17.8 18.6 1 5.2 8.51982 .......................... 6 34.3 40.1 2 10.6 14.8 2 9.4 11.3 3 14.3 13.9 2 10.6 17.11981 .......................... 7 36.6 43.2 3 16.2 23.3 1 7.3 7.5 2 13.2 12.4 2 10.8 17.01980 .......................... 7 37.6 47.0 3 16.6 23.4 2 8.7 9.6 2 12.3 13.9 3 16.6 21.11979 .......................... 5 28.7 28.7 0 0.0 0.0 1 8.3 8.4 4 20.4 20.3 0 0.0 0.0
- 126 -
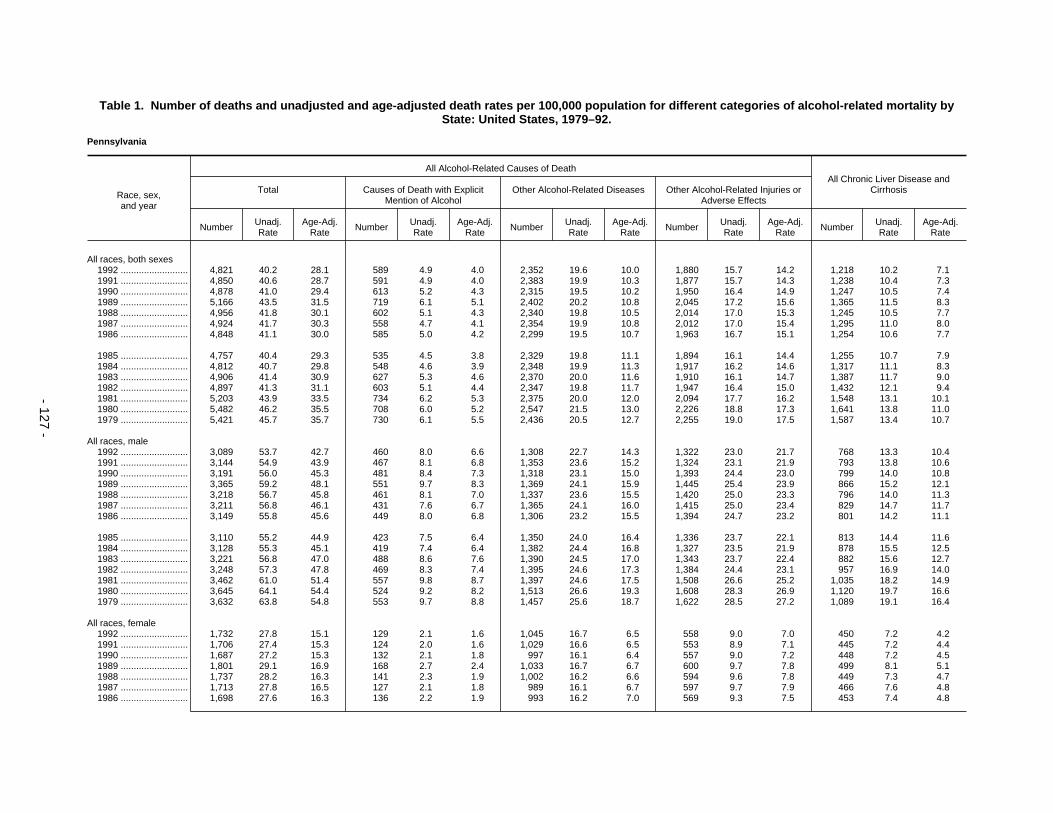
Table 1. Number of deaths and unadjusted and age-adjusted death rates per 100,000 population for different categories of alcohol-related mortality byState: United States, 1979–92.
Pennsylvania
Race, sex,and year
All Alcohol-Related Causes of DeathAll Chronic Liver Disease and
CirrhosisTotal Causes of Death with ExplicitMention of Alcohol
Other Alcohol-Related Diseases Other Alcohol-Related Injuries orAdverse Effects
Number Unadj.Rate
Age-Adj.Rate Number Unadj.
RateAge-Adj.
Rate Number Unadj.Rate
Age-Adj.Rate Number Unadj.
RateAge-Adj.
Rate Number Unadj.Rate
Age-Adj.Rate
All races, both sexes1992 .......................... 4,821 40.2 28.1 589 4.9 4.0 2,352 19.6 10.0 1,880 15.7 14.2 1,218 10.2 7.11991 .......................... 4,850 40.6 28.7 591 4.9 4.0 2,383 19.9 10.3 1,877 15.7 14.3 1,238 10.4 7.31990 .......................... 4,878 41.0 29.4 613 5.2 4.3 2,315 19.5 10.2 1,950 16.4 14.9 1,247 10.5 7.41989 .......................... 5,166 43.5 31.5 719 6.1 5.1 2,402 20.2 10.8 2,045 17.2 15.6 1,365 11.5 8.31988 .......................... 4,956 41.8 30.1 602 5.1 4.3 2,340 19.8 10.5 2,014 17.0 15.3 1,245 10.5 7.71987 .......................... 4,924 41.7 30.3 558 4.7 4.1 2,354 19.9 10.8 2,012 17.0 15.4 1,295 11.0 8.01986 .......................... 4,848 41.1 30.0 585 5.0 4.2 2,299 19.5 10.7 1,963 16.7 15.1 1,254 10.6 7.7
1985 .......................... 4,757 40.4 29.3 535 4.5 3.8 2,329 19.8 11.1 1,894 16.1 14.4 1,255 10.7 7.91984 .......................... 4,812 40.7 29.8 548 4.6 3.9 2,348 19.9 11.3 1,917 16.2 14.6 1,317 11.1 8.31983 .......................... 4,906 41.4 30.9 627 5.3 4.6 2,370 20.0 11.6 1,910 16.1 14.7 1,387 11.7 9.01982 .......................... 4,897 41.3 31.1 603 5.1 4.4 2,347 19.8 11.7 1,947 16.4 15.0 1,432 12.1 9.41981 .......................... 5,203 43.9 33.5 734 6.2 5.3 2,375 20.0 12.0 2,094 17.7 16.2 1,548 13.1 10.11980 .......................... 5,482 46.2 35.5 708 6.0 5.2 2,547 21.5 13.0 2,226 18.8 17.3 1,641 13.8 11.01979 .......................... 5,421 45.7 35.7 730 6.1 5.5 2,436 20.5 12.7 2,255 19.0 17.5 1,587 13.4 10.7
All races, male1992 .......................... 3,089 53.7 42.7 460 8.0 6.6 1,308 22.7 14.3 1,322 23.0 21.7 768 13.3 10.41991 .......................... 3,144 54.9 43.9 467 8.1 6.8 1,353 23.6 15.2 1,324 23.1 21.9 793 13.8 10.61990 .......................... 3,191 56.0 45.3 481 8.4 7.3 1,318 23.1 15.0 1,393 24.4 23.0 799 14.0 10.81989 .......................... 3,365 59.2 48.1 551 9.7 8.3 1,369 24.1 15.9 1,445 25.4 23.9 866 15.2 12.11988 .......................... 3,218 56.7 45.8 461 8.1 7.0 1,337 23.6 15.5 1,420 25.0 23.3 796 14.0 11.31987 .......................... 3,211 56.8 46.1 431 7.6 6.7 1,365 24.1 16.0 1,415 25.0 23.4 829 14.7 11.71986 .......................... 3,149 55.8 45.6 449 8.0 6.8 1,306 23.2 15.5 1,394 24.7 23.2 801 14.2 11.1
1985 .......................... 3,110 55.2 44.9 423 7.5 6.4 1,350 24.0 16.4 1,336 23.7 22.1 813 14.4 11.61984 .......................... 3,128 55.3 45.1 419 7.4 6.4 1,382 24.4 16.8 1,327 23.5 21.9 878 15.5 12.51983 .......................... 3,221 56.8 47.0 488 8.6 7.6 1,390 24.5 17.0 1,343 23.7 22.4 882 15.6 12.71982 .......................... 3,248 57.3 47.8 469 8.3 7.4 1,395 24.6 17.3 1,384 24.4 23.1 957 16.9 14.01981 .......................... 3,462 61.0 51.4 557 9.8 8.7 1,397 24.6 17.5 1,508 26.6 25.2 1,035 18.2 14.91980 .......................... 3,645 64.1 54.4 524 9.2 8.2 1,513 26.6 19.3 1,608 28.3 26.9 1,120 19.7 16.61979 .......................... 3,632 63.8 54.8 553 9.7 8.8 1,457 25.6 18.7 1,622 28.5 27.2 1,089 19.1 16.4
All races, female1992 .......................... 1,732 27.8 15.1 129 2.1 1.6 1,045 16.7 6.5 558 9.0 7.0 450 7.2 4.21991 .......................... 1,706 27.4 15.3 124 2.0 1.6 1,029 16.6 6.5 553 8.9 7.1 445 7.2 4.41990 .......................... 1,687 27.2 15.3 132 2.1 1.8 997 16.1 6.4 557 9.0 7.2 448 7.2 4.51989 .......................... 1,801 29.1 16.9 168 2.7 2.4 1,033 16.7 6.7 600 9.7 7.8 499 8.1 5.11988 .......................... 1,737 28.2 16.3 141 2.3 1.9 1,002 16.2 6.6 594 9.6 7.8 449 7.3 4.71987 .......................... 1,713 27.8 16.5 127 2.1 1.8 989 16.1 6.7 597 9.7 7.9 466 7.6 4.81986 .......................... 1,698 27.6 16.3 136 2.2 1.9 993 16.2 7.0 569 9.3 7.5 453 7.4 4.8
- 127 -

Table 1. Number of deaths and unadjusted and age-adjusted death rates per 100,000 population for different categories of alcohol-related mortality byState: United States, 1979–92.
Pennsylvania
Race, sex,and year
All Alcohol-Related Causes of DeathAll Chronic Liver Disease and
CirrhosisTotal Causes of Death with ExplicitMention of Alcohol
Other Alcohol-Related Diseases Other Alcohol-Related Injuries orAdverse Effects
Number Unadj.Rate
Age-Adj.Rate Number Unadj.
RateAge-Adj.
Rate Number Unadj.Rate
Age-Adj.Rate Number Unadj.
RateAge-Adj.
Rate Number Unadj.Rate
Age-Adj.Rate
All races, female
1985 .......................... 1,648 26.8 15.7 112 1.8 1.5 978 15.9 6.9 557 9.1 7.3 442 7.2 4.81984 .......................... 1,685 27.3 16.5 129 2.1 1.6 966 15.7 7.0 590 9.6 7.9 439 7.1 4.81983 .......................... 1,685 27.3 16.9 139 2.3 2.0 980 15.9 7.3 566 9.2 7.5 505 8.2 5.81982 .......................... 1,649 26.7 16.6 134 2.2 1.8 952 15.4 7.3 563 9.1 7.5 475 7.7 5.51981 .......................... 1,741 28.2 18.1 177 2.9 2.5 978 15.8 7.7 586 9.5 7.9 513 8.3 6.11980 .......................... 1,836 29.7 19.0 184 3.0 2.6 1,034 16.7 8.1 618 10.0 8.3 521 8.4 6.21979 .......................... 1,790 28.9 19.0 177 2.9 2.6 979 15.8 8.0 634 10.2 8.4 498 8.1 5.9
White, male1992 .......................... 2,577 50.0 37.7 384 7.5 5.9 1,145 22.2 13.2 1,047 20.3 18.6 672 13.1 9.71991 .......................... 2,618 51.0 39.1 373 7.3 5.8 1,180 23.0 14.0 1,065 20.7 19.3 700 13.6 10.01990 .......................... 2,622 51.3 39.5 375 7.3 6.0 1,148 22.5 13.7 1,099 21.5 19.8 705 13.8 10.21989 .......................... 2,758 54.1 41.9 429 8.4 6.9 1,176 23.1 14.2 1,153 22.6 20.8 731 14.3 10.71988 .......................... 2,681 52.6 40.9 337 6.6 5.3 1,163 22.8 14.2 1,181 23.2 21.3 672 13.2 10.01987 .......................... 2,720 53.5 41.9 335 6.6 5.5 1,191 23.4 14.8 1,195 23.5 21.7 726 14.3 10.81986 .......................... 2,656 52.3 41.3 352 6.9 5.6 1,132 22.3 14.2 1,171 23.1 21.5 708 13.9 10.4
1985 .......................... 2,628 51.7 40.7 322 6.3 5.2 1,165 22.9 14.9 1,140 22.4 20.7 710 14.0 10.61984 .......................... 2,666 52.2 41.2 339 6.6 5.5 1,202 23.5 15.4 1,126 22.0 20.3 798 15.6 12.01983 .......................... 2,726 53.2 42.5 379 7.4 6.2 1,226 23.9 15.9 1,121 21.9 20.4 771 15.0 11.71982 .......................... 2,737 53.3 43.0 364 7.1 6.0 1,217 23.7 16.0 1,156 22.5 21.0 859 16.7 13.31981 .......................... 2,919 56.7 46.3 445 8.6 7.3 1,212 23.6 16.0 1,262 24.5 23.0 918 17.8 14.01980 .......................... 3,047 59.1 48.5 400 7.8 6.5 1,323 25.6 17.9 1,324 25.7 24.1 989 19.2 15.51979 .......................... 3,063 59.2 49.3 431 8.3 7.2 1,267 24.5 17.2 1,365 26.4 24.8 951 18.4 15.1
Black, male1992 .......................... 498 95.3 98.5 76 14.5 16.2 158 30.3 30.3 264 50.4 52.0 92 17.6 19.51991 .......................... 505 97.9 99.4 92 17.9 19.9 165 32.0 31.6 248 48.0 48.0 90 17.5 18.81990 .......................... 552 107.1 110.7 105 20.4 23.2 165 32.0 32.5 282 54.7 55.1 94 18.2 20.01989 .......................... 585 113.9 117.8 122 23.8 25.9 184 35.8 37.0 279 54.3 55.0 131 25.5 28.41988 .......................... 528 103.4 106.4 124 24.3 27.7 172 33.6 33.1 233 45.6 45.6 124 24.3 26.91987 .......................... 479 94.6 97.3 94 18.6 21.1 170 33.6 33.1 215 42.5 43.1 98 19.4 21.21986 .......................... 482 96.4 98.5 96 19.2 21.7 171 34.1 33.8 215 43.1 43.1 91 18.2 19.6
1985 .......................... 473 95.5 98.4 100 20.2 22.4 183 36.9 36.7 191 38.5 39.4 102 20.6 23.51984 .......................... 451 91.4 94.8 80 16.2 18.6 176 35.7 35.6 195 39.5 40.6 75 15.2 17.71983 .......................... 486 98.7 103.2 108 21.9 24.7 160 32.6 32.7 217 44.2 45.7 110 22.4 25.51982 .......................... 501 102.3 107.1 104 21.2 24.6 176 36.0 35.9 221 45.1 46.7 97 19.8 22.71981 .......................... 536 109.8 115.5 112 22.9 26.4 182 37.3 37.3 242 49.6 51.8 117 24.0 26.7
- 128 -

Table 1. Number of deaths and unadjusted and age-adjusted death rates per 100,000 population for different categories of alcohol-related mortality byState: United States, 1979–92.
Pennsylvania
Race, sex,and year
All Alcohol-Related Causes of DeathAll Chronic Liver Disease and
CirrhosisTotal Causes of Death with ExplicitMention of Alcohol
Other Alcohol-Related Diseases Other Alcohol-Related Injuries orAdverse Effects
Number Unadj.Rate
Age-Adj.Rate Number Unadj.
RateAge-Adj.
Rate Number Unadj.Rate
Age-Adj.Rate Number Unadj.
RateAge-Adj.
Rate Number Unadj.Rate
Age-Adj.Rate
Black, male1980 .......................... 589 121.0 127.8 124 25.5 29.3 188 38.5 38.5 278 57.1 60.0 129 26.5 30.01979 .......................... 562 116.9 125.1 121 25.2 29.2 188 39.1 39.3 253 52.6 56.6 137 28.5 32.8
White, female1992 .......................... 1,498 27.0 13.5 95 1.7 1.3 927 16.7 5.9 476 8.6 6.3 391 7.0 3.81991 .......................... 1,499 27.0 14.1 97 1.7 1.4 919 16.6 5.9 483 8.7 6.8 395 7.1 4.11990 .......................... 1,455 26.3 13.8 98 1.8 1.4 884 16.0 5.8 473 8.6 6.6 381 6.9 3.91989 .......................... 1,536 27.8 15.0 107 1.9 1.7 914 16.6 6.1 515 9.3 7.3 410 7.4 4.31988 .......................... 1,506 27.3 14.8 98 1.8 1.5 894 16.2 6.0 514 9.3 7.3 386 7.0 4.21987 .......................... 1,496 27.2 15.0 86 1.6 1.3 892 16.2 6.3 518 9.4 7.4 406 7.4 4.41986 .......................... 1,487 27.0 15.0 101 1.8 1.4 889 16.1 6.5 497 9.0 7.1 400 7.3 4.3
1985 .......................... 1,451 26.3 14.5 75 1.4 1.0 883 16.0 6.5 493 9.0 7.0 390 7.1 4.41984 .......................... 1,465 26.5 15.1 88 1.6 1.2 859 15.5 6.4 519 9.4 7.6 377 6.8 4.21983 .......................... 1,467 26.4 15.3 96 1.7 1.5 877 15.8 6.8 494 8.9 7.1 421 7.6 4.91982 .......................... 1,443 26.0 15.2 92 1.7 1.3 857 15.4 6.8 494 8.9 7.1 418 7.5 5.01981 .......................... 1,538 27.6 16.8 141 2.5 2.1 882 15.8 7.2 515 9.2 7.5 448 8.0 5.61980 .......................... 1,601 28.7 17.2 128 2.3 1.8 930 16.7 7.5 544 9.7 7.9 444 8.0 5.51979 .......................... 1,564 28.0 17.4 123 2.2 1.9 876 15.7 7.4 565 10.1 8.1 427 7.6 5.2
Black, female1992 .......................... 222 37.3 30.3 34 5.7 4.9 115 19.3 13.6 73 12.3 11.8 59 9.9 8.71991 .......................... 199 33.7 27.8 27 4.6 4.6 108 18.3 12.9 64 10.8 10.3 49 8.3 8.01990 .......................... 220 37.4 30.7 33 5.6 5.7 110 18.6 13.1 78 13.2 11.9 63 10.7 10.11989 .......................... 259 44.0 37.9 61 10.4 10.5 116 19.7 14.1 82 14.0 13.3 88 15.0 14.31988 .......................... 223 38.1 31.9 43 7.3 7.0 105 18.0 12.6 75 12.8 12.3 62 10.6 9.31987 .......................... 210 36.1 31.4 40 6.9 7.1 95 16.4 12.0 75 12.8 12.3 59 10.1 9.51986 .......................... 205 35.6 30.7 35 6.1 6.7 102 17.7 13.2 68 11.8 10.9 53 9.2 9.4
1985 .......................... 193 33.7 28.9 37 6.5 6.5 94 16.4 12.2 62 10.8 10.2 52 9.1 8.61984 .......................... 214 37.5 32.1 41 7.2 6.9 106 18.6 14.5 67 11.7 10.7 61 10.7 10.41983 .......................... 214 37.5 33.8 43 7.5 8.2 102 17.8 14.0 69 12.2 11.6 83 14.6 14.91982 .......................... 205 36.0 32.4 42 7.4 7.6 94 16.6 13.2 68 12.1 11.6 57 10.0 10.51981 .......................... 198 34.9 31.1 36 6.3 6.3 94 16.6 13.3 68 12.0 11.5 64 11.3 11.41980 .......................... 232 41.0 38.3 56 9.9 11.0 104 18.3 15.0 72 12.8 12.3 76 13.4 13.91979 .......................... 221 39.5 36.5 54 9.6 10.3 101 18.1 14.9 66 11.7 11.4 70 12.5 12.9
- 129 -

Table 1. Number of deaths and unadjusted and age-adjusted death rates per 100,000 population for different categories of alcohol-related mortality byState: United States, 1979–92.
Rhode Island
Race, sex,and year
All Alcohol-Related Causes of DeathAll Chronic Liver Disease and
CirrhosisTotal Causes of Death with ExplicitMention of Alcohol
Other Alcohol-Related Diseases Other Alcohol-Related Injuries orAdverse Effects
Number Unadj.Rate
Age-Adj.Rate Number Unadj.
RateAge-Adj.
Rate Number Unadj.Rate
Age-Adj.Rate Number Unadj.
RateAge-Adj.
Rate Number Unadj.Rate
Age-Adj.Rate
All races, both sexes1992 .......................... 380 37.9 25.9 74 7.4 6.2 196 19.6 10.2 110 10.9 9.5 111 11.1 7.81991 .......................... 392 39.1 26.8 87 8.7 7.3 184 18.3 9.5 121 12.1 10.0 119 11.9 8.71990 .......................... 400 39.8 27.7 72 7.2 5.8 193 19.2 10.5 135 13.5 11.4 102 10.2 7.11989 .......................... 427 42.7 30.4 97 9.7 8.0 199 19.8 10.7 131 13.1 11.8 131 13.1 9.81988 .......................... 450 45.1 32.1 96 9.6 8.4 217 21.8 12.1 137 13.7 11.7 130 13.0 9.51987 .......................... 431 43.5 31.3 93 9.4 8.1 188 19.0 10.0 149 15.1 13.2 119 12.0 8.71986 .......................... 404 41.4 29.8 88 9.0 7.8 181 18.5 9.8 136 13.9 12.2 111 11.4 8.3
1985 .......................... 402 41.5 28.4 78 8.0 6.5 199 20.5 11.0 125 12.9 10.9 108 11.1 7.91984 .......................... 433 45.1 31.8 104 10.8 9.4 211 21.9 11.9 118 12.3 10.5 130 13.5 9.81983 .......................... 389 40.7 29.8 80 8.4 7.7 190 19.9 11.2 119 12.4 11.0 122 12.8 10.41982 .......................... 404 42.3 30.9 69 7.2 6.4 196 20.6 11.7 138 14.5 12.8 128 13.4 10.81981 .......................... 430 45.2 32.9 88 9.2 8.0 201 21.1 12.0 141 14.8 12.9 134 14.1 11.01980 .......................... 480 50.6 38.1 111 11.7 10.2 210 22.1 13.0 160 16.8 15.0 153 16.1 13.01979 .......................... 476 49.7 38.6 115 12.0 10.9 210 21.9 13.4 151 15.8 14.4 140 14.6 11.3
All races, male1992 .......................... 241 50.0 39.3 52 10.8 9.6 113 23.6 15.6 75 15.6 14.1 67 13.9 10.91991 .......................... 244 50.6 40.5 60 12.4 11.0 103 21.3 14.5 81 16.8 15.1 72 14.9 11.91990 .......................... 254 52.7 42.6 52 10.8 9.2 108 22.5 16.1 94 19.4 17.4 57 11.8 9.11989 .......................... 289 60.3 49.4 79 16.5 14.0 117 24.4 17.1 93 19.4 18.3 92 19.2 15.81988 .......................... 290 60.8 50.0 72 15.1 13.7 123 25.7 18.4 95 20.0 17.9 79 16.6 13.71987 .......................... 280 59.2 48.8 73 15.4 14.0 104 22.0 15.0 103 21.8 19.9 68 14.4 12.11986 .......................... 253 54.1 44.3 60 12.8 11.2 96 20.6 14.1 97 20.7 19.0 56 12.0 9.9
1985 .......................... 249 53.8 42.4 62 13.4 11.0 106 22.8 15.6 82 17.6 15.8 68 14.7 11.81984 .......................... 282 61.5 48.6 76 16.6 14.3 126 27.6 18.8 80 17.3 15.4 84 18.3 15.01983 .......................... 252 55.4 46.0 62 13.6 12.7 108 23.7 16.5 82 18.1 16.9 82 18.0 15.61982 .......................... 262 57.5 47.6 56 12.3 11.1 112 24.7 17.6 93 20.5 19.0 95 20.9 18.11981 .......................... 277 61.0 49.5 60 13.2 11.5 124 27.3 19.2 93 20.5 18.8 88 19.4 16.21980 .......................... 317 70.0 59.0 83 18.3 16.3 127 28.1 20.7 107 23.6 22.0 111 24.5 21.11979 .......................... 315 68.9 59.3 89 19.5 18.3 126 27.6 20.3 100 21.9 20.8 93 20.4 17.2
All races, female1992 .......................... 139 26.8 14.3 22 4.2 3.3 83 15.9 5.9 34 6.6 5.2 44 8.5 5.21991 .......................... 148 28.4 14.9 27 5.2 4.0 81 15.6 5.7 40 7.6 5.3 47 9.0 6.01990 .......................... 146 28.0 14.7 20 3.8 3.0 84 16.2 5.9 42 8.0 5.8 45 8.6 5.41989 .......................... 138 26.4 14.0 18 3.5 3.0 81 15.6 5.6 38 7.4 5.4 39 7.5 4.71988 .......................... 160 30.7 16.7 24 4.6 3.7 94 18.2 7.1 41 8.0 5.9 51 9.8 5.91987 .......................... 151 29.2 16.1 20 3.9 2.9 84 16.4 6.2 46 9.0 7.0 51 9.9 5.71986 .......................... 151 29.7 17.3 28 5.5 4.9 84 16.5 6.5 39 7.6 5.9 55 10.8 7.1
- 130 -

Table 1. Number of deaths and unadjusted and age-adjusted death rates per 100,000 population for different categories of alcohol-related mortality byState: United States, 1979–92.
Rhode Island
Race, sex,and year
All Alcohol-Related Causes of DeathAll Chronic Liver Disease and
CirrhosisTotal Causes of Death with ExplicitMention of Alcohol
Other Alcohol-Related Diseases Other Alcohol-Related Injuries orAdverse Effects
Number Unadj.Rate
Age-Adj.Rate Number Unadj.
RateAge-Adj.
Rate Number Unadj.Rate
Age-Adj.Rate Number Unadj.
RateAge-Adj.
Rate Number Unadj.Rate
Age-Adj.Rate
All races, female
1985 .......................... 152 30.1 16.6 16 3.2 2.7 93 18.4 7.4 43 8.5 6.4 40 7.9 4.71984 .......................... 151 30.1 18.0 28 5.6 5.3 85 16.8 6.6 39 7.7 6.1 46 9.1 5.41983 .......................... 137 27.3 15.9 18 3.6 3.3 82 16.4 7.3 36 7.3 5.4 40 8.0 6.01982 .......................... 142 28.4 16.9 13 2.6 2.5 84 16.8 7.3 45 9.0 7.0 33 6.6 4.71981 .......................... 153 30.8 19.2 28 5.6 5.1 77 15.5 6.6 48 9.6 7.5 46 9.2 6.81980 .......................... 164 32.9 20.5 28 5.6 5.0 83 16.6 7.0 53 10.7 8.4 42 8.5 6.31979 .......................... 161 32.2 20.9 26 5.2 4.6 84 16.7 8.0 52 10.3 8.4 47 9.4 6.4
White, male1992 .......................... 229 51.3 39.0 50 11.2 9.6 111 24.8 15.7 68 15.3 13.7 65 14.6 11.01991 .......................... 227 50.7 39.0 55 12.3 10.4 99 22.0 14.2 74 16.4 14.4 68 15.2 11.61990 .......................... 231 51.4 40.1 47 10.5 8.6 99 22.1 14.9 85 18.8 16.6 51 11.4 8.41989 .......................... 264 59.0 46.4 70 15.6 12.6 112 25.1 16.9 81 18.2 17.0 85 19.0 14.81988 .......................... 269 60.3 47.9 66 14.8 13.1 116 26.0 17.6 87 19.5 17.2 76 17.0 13.61987 .......................... 264 59.5 47.9 71 16.0 14.2 98 22.0 14.4 95 21.5 19.3 66 14.8 12.11986 .......................... 243 55.2 44.2 58 13.2 11.2 93 21.2 14.1 91 20.8 18.9 55 12.5 9.9
1985 .......................... 237 54.3 41.8 59 13.5 10.9 103 23.7 15.7 75 17.1 15.2 67 15.3 12.01984 .......................... 269 61.9 47.7 71 16.4 13.7 123 28.3 18.7 75 17.3 15.2 83 19.1 15.31983 .......................... 240 55.5 45.1 58 13.4 12.2 106 24.4 16.5 76 17.7 16.4 81 18.7 15.91982 .......................... 247 57.2 46.5 51 11.8 10.4 108 25.0 17.3 88 20.5 18.8 92 21.3 18.01981 .......................... 267 61.6 49.0 58 13.4 11.3 119 27.6 18.9 89 20.6 18.8 83 19.2 15.41980 .......................... 297 68.6 56.6 76 17.6 15.3 120 27.9 19.8 100 23.2 21.4 105 24.3 20.51979 .......................... 293 67.1 56.8 80 18.3 17.0 118 27.1 19.4 95 21.7 20.4 90 20.6 17.1
Black, male1992 .......................... 10 46.3 60.2 2 8.9 16.2 2 11.0 18.2 6 26.3 25.8 2 8.9 14.81991 .......................... 14 63.0 85.0 4 18.2 28.2 3 15.3 25.3 6 29.6 31.4 3 13.7 19.31990 .......................... 20 89.9 116.4 5 23.0 27.7 8 35.6 57.5 7 31.3 31.2 4 18.4 23.71989 .......................... 20 95.7 129.8 7 33.1 55.5 4 18.8 30.1 9 43.8 44.2 5 23.7 40.21988 .......................... 20 97.5 121.0 6 29.5 36.1 6 31.8 49.9 7 36.2 35.0 3 14.7 18.81987 .......................... 14 70.5 96.1 2 10.2 17.0 5 25.1 37.7 7 35.2 41.3 2 10.2 16.91986 .......................... 7 34.7 39.4 0 0.0 0.0 2 9.3 13.4 5 25.4 25.9 0 0.0 0.0
1985 .......................... 11 61.2 79.8 3 16.5 24.7 2 11.8 17.5 6 32.9 37.5 1 5.5 8.21984 .......................... 12 69.1 96.4 5 28.5 43.6 3 17.2 25.3 4 23.5 27.5 1 5.7 9.51983 .......................... 11 67.3 79.1 4 23.6 32.8 2 11.1 12.8 6 32.7 33.5 1 5.9 9.61982 .......................... 12 70.0 93.0 5 30.4 45.3 4 21.9 28.5 3 17.7 19.1 3 18.3 26.81981 .......................... 7 47.1 65.9 1 6.3 9.5 4 24.0 35.3 3 16.8 21.2 3 18.9 27.4
- 131 -

Table 1. Number of deaths and unadjusted and age-adjusted death rates per 100,000 population for different categories of alcohol-related mortality byState: United States, 1979–92.
Rhode Island
Race, sex,and year
All Alcohol-Related Causes of DeathAll Chronic Liver Disease and
CirrhosisTotal Causes of Death with ExplicitMention of Alcohol
Other Alcohol-Related Diseases Other Alcohol-Related Injuries orAdverse Effects
Number Unadj.Rate
Age-Adj.Rate Number Unadj.
RateAge-Adj.
Rate Number Unadj.Rate
Age-Adj.Rate Number Unadj.
RateAge-Adj.
Rate Number Unadj.Rate
Age-Adj.Rate
Black, male1980 .......................... 17 112.8 144.6 6 39.3 53.4 5 36.0 52.4 6 37.5 38.7 5 32.7 48.01979 .......................... 20 133.1 174.8 8 53.5 73.7 7 45.2 64.9 5 34.3 36.2 3 20.1 26.5
White, female1992 .......................... 133 27.4 14.1 21 4.3 3.2 79 16.4 5.6 33 6.8 5.3 43 8.9 5.21991 .......................... 139 28.6 14.1 25 5.1 3.8 79 16.1 5.5 36 7.3 4.8 43 8.8 5.41990 .......................... 134 27.4 13.4 17 3.5 2.6 78 16.0 5.5 38 7.9 5.4 43 8.8 5.21989 .......................... 131 26.8 13.4 16 3.3 2.8 80 16.4 5.6 35 7.2 5.1 35 7.2 4.01988 .......................... 153 31.2 16.4 22 4.5 3.6 90 18.5 6.8 40 8.3 6.0 50 10.2 6.11987 .......................... 145 29.8 15.8 19 3.9 2.9 83 17.0 6.2 43 8.9 6.6 51 10.5 5.91986 .......................... 146 30.2 17.1 27 5.6 5.0 81 16.9 6.2 37 7.8 5.9 53 11.0 6.9
1985 .......................... 144 30.0 15.9 13 2.7 2.4 89 18.5 7.1 42 8.7 6.4 35 7.3 4.21984 .......................... 142 29.7 16.9 23 4.8 4.5 82 17.3 6.5 36 7.6 5.9 42 8.8 5.01983 .......................... 132 27.8 15.8 17 3.6 3.3 81 17.0 7.3 34 7.2 5.2 39 8.2 6.11982 .......................... 136 28.5 16.4 12 2.5 2.4 81 17.1 7.1 43 8.9 6.9 32 6.7 4.71981 .......................... 146 30.7 18.5 27 5.7 5.0 74 15.6 6.3 45 9.5 7.2 45 9.4 6.81980 .......................... 157 33.1 19.8 25 5.3 4.5 82 17.1 7.0 51 10.7 8.2 41 8.6 6.31979 .......................... 158 32.9 21.0 26 5.4 4.7 83 17.2 8.0 49 10.2 8.3 47 9.8 6.6
Black, female1992 .......................... 6 26.7 28.9 1 4.4 5.8 4 15.7 16.4 1 6.5 6.7 1 4.4 4.31991 .......................... 8 37.4 38.4 2 9.0 9.1 2 9.9 11.4 4 18.4 17.9 4 18.1 23.11990 .......................... 12 53.4 55.1 3 13.8 13.7 6 26.3 26.9 3 13.3 14.5 2 9.2 9.81989 .......................... 5 23.1 27.5 2 9.4 12.8 1 6.2 6.6 2 7.4 8.0 3 14.1 20.51988 .......................... 6 31.0 33.6 2 9.7 10.0 4 19.0 21.7 - 2.2 2.0 1 4.9 4.61987 .......................... 5 26.2 25.5 1 5.0 5.9 2 8.5 8.4 3 12.7 11.2 0 0.0 0.01986 .......................... 5 24.3 26.3 0 0.0 0.0 3 15.9 19.2 2 8.5 7.1 1 5.2 8.2
1985 .......................... 8 41.7 47.9 3 16.1 20.9 3 18.6 20.2 1 7.0 6.8 5 26.9 32.11984 .......................... 9 50.4 53.9 5 27.7 32.2 2 9.6 9.6 2 13.2 12.1 4 22.1 23.51983 .......................... 4 22.2 23.4 1 5.7 6.9 1 4.9 5.7 2 11.5 10.8 1 5.7 6.91982 .......................... 6 33.1 38.1 1 5.8 8.5 3 16.2 18.1 2 11.0 11.5 1 5.8 7.01981 .......................... 6 38.4 42.8 1 6.0 8.5 3 17.0 19.5 3 15.5 14.7 1 6.0 8.51980 .......................... 6 36.2 40.7 3 18.6 22.3 1 5.3 5.6 2 12.3 12.8 1 6.2 7.51979 .......................... 3 21.4 18.9 0 0.0 0.0 1 6.6 5.4 2 14.8 13.4 0 0.0 0.0
- The AAF methodology used to estimate alcohol-related mortality can result in fractional estimates less than 0.5 but greater than 0.
- 132 -
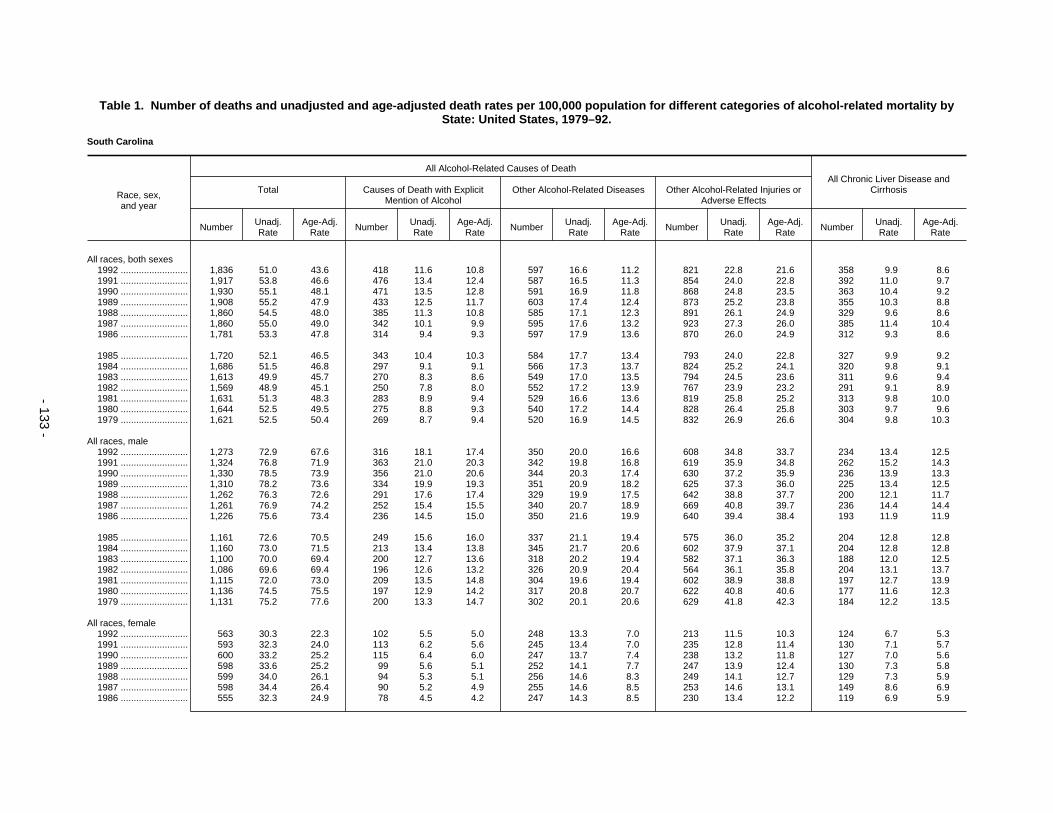
Table 1. Number of deaths and unadjusted and age-adjusted death rates per 100,000 population for different categories of alcohol-related mortality byState: United States, 1979–92.
South Carolina
Race, sex,and year
All Alcohol-Related Causes of DeathAll Chronic Liver Disease and
CirrhosisTotal Causes of Death with ExplicitMention of Alcohol
Other Alcohol-Related Diseases Other Alcohol-Related Injuries orAdverse Effects
Number Unadj.Rate
Age-Adj.Rate Number Unadj.
RateAge-Adj.
Rate Number Unadj.Rate
Age-Adj.Rate Number Unadj.
RateAge-Adj.
Rate Number Unadj.Rate
Age-Adj.Rate
All races, both sexes1992 .......................... 1,836 51.0 43.6 418 11.6 10.8 597 16.6 11.2 821 22.8 21.6 358 9.9 8.61991 .......................... 1,917 53.8 46.6 476 13.4 12.4 587 16.5 11.3 854 24.0 22.8 392 11.0 9.71990 .......................... 1,930 55.1 48.1 471 13.5 12.8 591 16.9 11.8 868 24.8 23.5 363 10.4 9.21989 .......................... 1,908 55.2 47.9 433 12.5 11.7 603 17.4 12.4 873 25.2 23.8 355 10.3 8.81988 .......................... 1,860 54.5 48.0 385 11.3 10.8 585 17.1 12.3 891 26.1 24.9 329 9.6 8.61987 .......................... 1,860 55.0 49.0 342 10.1 9.9 595 17.6 13.2 923 27.3 26.0 385 11.4 10.41986 .......................... 1,781 53.3 47.8 314 9.4 9.3 597 17.9 13.6 870 26.0 24.9 312 9.3 8.6
1985 .......................... 1,720 52.1 46.5 343 10.4 10.3 584 17.7 13.4 793 24.0 22.8 327 9.9 9.21984 .......................... 1,686 51.5 46.8 297 9.1 9.1 566 17.3 13.7 824 25.2 24.1 320 9.8 9.11983 .......................... 1,613 49.9 45.7 270 8.3 8.6 549 17.0 13.5 794 24.5 23.6 311 9.6 9.41982 .......................... 1,569 48.9 45.1 250 7.8 8.0 552 17.2 13.9 767 23.9 23.2 291 9.1 8.91981 .......................... 1,631 51.3 48.3 283 8.9 9.4 529 16.6 13.6 819 25.8 25.2 313 9.8 10.01980 .......................... 1,644 52.5 49.5 275 8.8 9.3 540 17.2 14.4 828 26.4 25.8 303 9.7 9.61979 .......................... 1,621 52.5 50.4 269 8.7 9.4 520 16.9 14.5 832 26.9 26.6 304 9.8 10.3
All races, male1992 .......................... 1,273 72.9 67.6 316 18.1 17.4 350 20.0 16.6 608 34.8 33.7 234 13.4 12.51991 .......................... 1,324 76.8 71.9 363 21.0 20.3 342 19.8 16.8 619 35.9 34.8 262 15.2 14.31990 .......................... 1,330 78.5 73.9 356 21.0 20.6 344 20.3 17.4 630 37.2 35.9 236 13.9 13.31989 .......................... 1,310 78.2 73.6 334 19.9 19.3 351 20.9 18.2 625 37.3 36.0 225 13.4 12.51988 .......................... 1,262 76.3 72.6 291 17.6 17.4 329 19.9 17.5 642 38.8 37.7 200 12.1 11.71987 .......................... 1,261 76.9 74.2 252 15.4 15.5 340 20.7 18.9 669 40.8 39.7 236 14.4 14.41986 .......................... 1,226 75.6 73.4 236 14.5 15.0 350 21.6 19.9 640 39.4 38.4 193 11.9 11.9
1985 .......................... 1,161 72.6 70.5 249 15.6 16.0 337 21.1 19.4 575 36.0 35.2 204 12.8 12.81984 .......................... 1,160 73.0 71.5 213 13.4 13.8 345 21.7 20.6 602 37.9 37.1 204 12.8 12.81983 .......................... 1,100 70.0 69.4 200 12.7 13.6 318 20.2 19.4 582 37.1 36.3 188 12.0 12.51982 .......................... 1,086 69.6 69.4 196 12.6 13.2 326 20.9 20.4 564 36.1 35.8 204 13.1 13.71981 .......................... 1,115 72.0 73.0 209 13.5 14.8 304 19.6 19.4 602 38.9 38.8 197 12.7 13.91980 .......................... 1,136 74.5 75.5 197 12.9 14.2 317 20.8 20.7 622 40.8 40.6 177 11.6 12.31979 .......................... 1,131 75.2 77.6 200 13.3 14.7 302 20.1 20.6 629 41.8 42.3 184 12.2 13.5
All races, female1992 .......................... 563 30.3 22.3 102 5.5 5.0 248 13.3 7.0 213 11.5 10.3 124 6.7 5.31991 .......................... 593 32.3 24.0 113 6.2 5.6 245 13.4 7.0 235 12.8 11.4 130 7.1 5.71990 .......................... 600 33.2 25.2 115 6.4 6.0 247 13.7 7.4 238 13.2 11.8 127 7.0 5.61989 .......................... 598 33.6 25.2 99 5.6 5.1 252 14.1 7.7 247 13.9 12.4 130 7.3 5.81988 .......................... 599 34.0 26.1 94 5.3 5.1 256 14.6 8.3 249 14.1 12.7 129 7.3 5.91987 .......................... 598 34.4 26.4 90 5.2 4.9 255 14.6 8.5 253 14.6 13.1 149 8.6 6.91986 .......................... 555 32.3 24.9 78 4.5 4.2 247 14.3 8.5 230 13.4 12.2 119 6.9 5.9
- 133 -

Table 1. Number of deaths and unadjusted and age-adjusted death rates per 100,000 population for different categories of alcohol-related mortality byState: United States, 1979–92.
South Carolina
Race, sex,and year
All Alcohol-Related Causes of DeathAll Chronic Liver Disease and
CirrhosisTotal Causes of Death with ExplicitMention of Alcohol
Other Alcohol-Related Diseases Other Alcohol-Related Injuries orAdverse Effects
Number Unadj.Rate
Age-Adj.Rate Number Unadj.
RateAge-Adj.
Rate Number Unadj.Rate
Age-Adj.Rate Number Unadj.
RateAge-Adj.
Rate Number Unadj.Rate
Age-Adj.Rate
All races, female
1985 .......................... 558 32.8 25.4 94 5.5 5.3 247 14.5 8.7 217 12.8 11.4 123 7.2 6.21984 .......................... 526 31.3 25.3 84 5.0 5.1 221 13.1 8.2 221 13.2 12.0 116 6.9 6.01983 .......................... 513 30.8 24.8 70 4.2 4.2 231 13.9 9.0 212 12.7 11.6 123 7.4 6.61982 .......................... 483 29.3 23.6 54 3.3 3.3 226 13.7 8.9 203 12.3 11.4 87 5.3 4.61981 .......................... 516 31.7 26.3 74 4.5 4.7 225 13.8 9.2 217 13.3 12.4 116 7.1 6.71980 .......................... 508 31.6 26.6 78 4.8 5.1 223 13.9 9.6 207 12.8 12.0 126 7.8 7.31979 .......................... 490 31.0 26.2 69 4.4 4.6 218 13.8 9.6 203 12.8 12.0 120 7.6 7.4
White, male1992 .......................... 753 61.4 52.8 179 14.6 12.5 200 16.3 11.8 373 30.5 28.5 160 13.1 10.91991 .......................... 781 64.4 56.1 221 18.2 15.8 197 16.3 12.1 362 29.9 28.2 199 16.4 13.91990 .......................... 772 64.8 56.8 179 15.0 13.4 208 17.5 13.1 385 32.3 30.3 154 12.9 11.01989 .......................... 741 62.8 55.1 168 14.3 12.3 198 16.8 12.9 374 31.8 29.9 158 13.4 11.21988 .......................... 716 61.5 55.2 135 11.6 10.4 190 16.3 12.7 391 33.6 32.1 132 11.3 9.91987 .......................... 763 66.0 60.0 134 11.6 10.6 203 17.6 14.5 426 36.8 34.9 176 15.2 13.71986 .......................... 735 64.4 58.8 135 11.8 11.0 203 17.7 14.6 397 34.8 33.1 142 12.4 11.3
1985 .......................... 691 61.5 55.9 130 11.6 10.7 199 17.7 14.8 362 32.2 30.5 149 13.2 12.11984 .......................... 689 61.7 56.9 125 11.2 10.5 186 16.7 14.3 378 33.8 32.1 147 13.2 11.91983 .......................... 660 59.9 55.9 106 9.6 9.4 184 16.7 14.6 370 33.6 32.0 139 12.6 12.21982 .......................... 652 59.6 56.0 114 10.4 10.0 187 17.1 15.3 351 32.1 30.7 158 14.4 13.91981 .......................... 666 61.4 58.8 119 11.0 11.0 178 16.4 14.9 369 34.1 32.8 151 13.9 13.71980 .......................... 676 63.4 60.6 110 10.3 10.2 190 17.8 16.4 376 35.3 33.9 134 12.6 11.91979 .......................... 666 63.0 61.4 111 10.5 10.7 174 16.4 15.6 381 36.1 35.1 134 12.7 12.8
Black, male1992 .......................... 519 103.0 116.9 137 27.2 34.3 148 29.4 34.1 234 46.4 48.5 74 14.7 18.01991 .......................... 540 108.4 122.8 142 28.5 36.3 144 28.9 34.0 254 51.0 52.5 63 12.7 15.61990 .......................... 556 113.8 130.5 177 36.2 45.3 136 27.8 33.0 243 49.8 52.1 82 16.8 21.21989 .......................... 564 116.9 133.8 165 34.2 42.8 151 31.3 36.8 248 51.4 54.2 65 13.5 16.11988 .......................... 542 113.9 130.1 156 32.8 41.0 139 29.1 34.5 247 51.9 54.5 68 14.3 17.71987 .......................... 495 104.8 121.4 117 24.8 31.8 137 29.0 35.0 241 51.1 54.7 60 12.7 16.71986 .......................... 491 104.9 121.3 101 21.6 28.4 148 31.5 38.2 243 51.8 54.6 51 10.9 13.7
1985 .......................... 467 100.9 118.7 119 25.7 33.0 137 29.6 35.6 211 45.6 50.0 54 11.7 15.01984 .......................... 470 101.6 120.1 88 19.0 24.9 158 34.2 42.3 224 48.4 53.0 57 12.3 15.91983 .......................... 439 95.8 114.5 94 20.5 27.8 134 29.1 35.8 212 46.2 51.0 48 10.5 13.61982 .......................... 432 94.6 113.0 82 18.0 23.9 139 30.5 37.6 211 46.2 51.4 46 10.1 13.31981 .......................... 447 98.4 119.3 90 19.8 27.1 126 27.6 34.8 232 51.0 57.3 46 10.1 15.0
- 134 -

Table 1. Number of deaths and unadjusted and age-adjusted death rates per 100,000 population for different categories of alcohol-related mortality byState: United States, 1979–92.
South Carolina
Race, sex,and year
All Alcohol-Related Causes of DeathAll Chronic Liver Disease and
CirrhosisTotal Causes of Death with ExplicitMention of Alcohol
Other Alcohol-Related Diseases Other Alcohol-Related Injuries orAdverse Effects
Number Unadj.Rate
Age-Adj.Rate Number Unadj.
RateAge-Adj.
Rate Number Unadj.Rate
Age-Adj.Rate Number Unadj.
RateAge-Adj.
Rate Number Unadj.Rate
Age-Adj.Rate
Black, male1980 .......................... 458 102.1 123.5 87 19.4 27.8 126 28.0 34.6 245 54.7 61.1 41 9.1 13.21979 .......................... 464 105.7 129.9 89 20.2 27.8 128 29.2 37.2 247 56.2 64.8 50 11.4 16.1
White, female1992 .......................... 351 27.7 18.4 48 3.8 3.2 164 12.9 5.7 139 11.0 9.5 87 6.9 4.71991 .......................... 377 30.1 20.2 54 4.3 3.3 165 13.2 5.9 158 12.6 11.0 81 6.5 4.41990 .......................... 390 31.7 21.9 58 4.7 4.1 166 13.5 6.1 166 13.5 11.7 83 6.7 4.61989 .......................... 368 30.2 20.4 48 3.9 3.2 163 13.4 6.2 156 12.9 11.0 86 7.1 4.81988 .......................... 388 32.3 22.5 57 4.7 4.0 170 14.1 6.9 162 13.5 11.6 95 7.9 5.61987 .......................... 386 32.4 22.8 41 3.4 2.9 169 14.2 6.8 176 14.8 13.1 101 8.5 5.81986 .......................... 364 30.9 22.2 42 3.6 3.0 159 13.5 6.8 163 13.8 12.4 87 7.4 5.6
1985 .......................... 355 30.5 21.5 45 3.9 3.3 156 13.4 6.8 153 13.2 11.4 88 7.6 5.71984 .......................... 334 29.1 21.6 45 3.9 3.6 141 12.3 6.4 148 12.9 11.7 78 6.8 4.91983 .......................... 333 29.3 21.7 44 3.9 3.4 146 12.9 7.0 143 12.6 11.3 87 7.7 6.11982 .......................... 314 28.0 20.7 25 2.2 2.0 144 12.8 7.2 145 12.9 11.4 64 5.7 4.41981 .......................... 327 29.4 22.4 33 3.0 2.8 146 13.1 7.6 148 13.3 12.0 70 6.3 5.21980 .......................... 317 28.9 22.1 42 3.8 3.5 143 13.0 7.8 133 12.1 10.8 81 7.4 5.91979 .......................... 313 28.9 22.2 34 3.1 3.0 144 13.3 8.1 135 12.5 11.2 85 7.8 6.7
Black, female1992 .......................... 209 36.4 32.7 54 9.4 9.9 83 14.5 10.9 72 12.5 11.9 37 6.4 6.91991 .......................... 213 37.5 34.4 58 10.2 11.6 79 13.9 10.4 76 13.3 12.4 48 8.5 8.91990 .......................... 210 37.6 35.1 57 10.2 11.2 81 14.5 11.6 72 12.8 12.4 43 7.7 8.21989 .......................... 227 41.3 38.0 50 9.1 10.4 88 16.0 12.4 89 16.1 15.2 44 8.0 8.71988 .......................... 208 38.4 35.9 36 6.6 7.9 86 16.0 12.7 86 15.8 15.3 33 6.1 6.81987 .......................... 211 39.4 37.4 49 9.1 10.5 86 16.1 13.6 76 14.2 13.3 48 9.0 10.01986 .......................... 191 36.0 33.1 36 6.8 7.2 87 16.4 13.7 68 12.7 12.2 32 6.0 6.2
1985 .......................... 202 38.4 36.7 49 9.3 10.8 90 17.2 14.5 63 11.9 11.4 35 6.7 7.61984 .......................... 192 36.8 36.2 39 7.5 9.3 80 15.4 13.7 73 13.9 13.3 38 7.3 8.71983 .......................... 180 34.8 34.3 26 5.0 6.4 85 16.5 14.8 69 13.3 13.1 35 6.8 7.91982 .......................... 167 32.5 31.8 29 5.7 6.9 81 15.9 13.7 56 11.0 11.2 23 4.5 5.41981 .......................... 188 37.1 37.4 41 8.1 10.0 79 15.6 13.7 68 13.4 13.6 46 9.1 10.91980 .......................... 190 37.9 39.1 36 7.2 9.3 80 15.9 14.6 74 14.8 15.2 44 8.8 11.01979 .......................... 176 35.7 37.4 35 7.1 9.2 73 14.9 13.8 67 13.7 14.4 35 7.1 9.3
- 135 -

Table 1. Number of deaths and unadjusted and age-adjusted death rates per 100,000 population for different categories of alcohol-related mortality byState: United States, 1979–92.
South Dakota
Race, sex,and year
All Alcohol-Related Causes of DeathAll Chronic Liver Disease and
CirrhosisTotal Causes of Death with ExplicitMention of Alcohol
Other Alcohol-Related Diseases Other Alcohol-Related Injuries orAdverse Effects
Number Unadj.Rate
Age-Adj.Rate Number Unadj.
RateAge-Adj.
Rate Number Unadj.Rate
Age-Adj.Rate Number Unadj.
RateAge-Adj.
Rate Number Unadj.Rate
Age-Adj.Rate
All races, both sexes1992 .......................... 324 45.7 34.8 76 10.7 10.4 121 17.0 8.1 127 18.0 16.3 75 10.6 9.71991 .......................... 307 43.8 33.3 66 9.4 9.1 112 15.9 7.4 129 18.4 16.8 59 8.4 6.91990 .......................... 304 43.7 33.3 49 7.0 6.9 114 16.3 7.5 142 20.3 18.9 50 7.2 5.91989 .......................... 321 46.1 36.2 75 10.8 10.4 108 15.5 7.6 138 19.8 18.3 79 11.3 10.01988 .......................... 295 42.3 33.3 51 7.3 6.9 116 16.5 8.6 129 18.5 17.8 52 7.4 6.81987 .......................... 281 40.3 30.4 43 6.2 5.8 106 15.2 7.0 132 19.0 17.5 54 7.8 6.31986 .......................... 299 42.9 33.2 51 7.3 7.0 115 16.5 8.4 133 19.2 17.9 65 9.3 8.2
1985 .......................... 290 41.6 32.3 54 7.7 7.8 102 14.6 6.9 134 19.2 17.6 61 8.7 7.81984 .......................... 300 43.0 33.4 52 7.5 7.5 101 14.5 7.1 147 21.0 18.8 49 7.0 5.91983 .......................... 313 45.2 35.3 45 6.5 6.2 122 17.6 9.5 146 21.1 19.6 72 10.4 8.91982 .......................... 307 44.5 35.8 46 6.7 6.9 108 15.6 8.3 153 22.2 20.6 50 7.2 7.21981 .......................... 329 47.8 39.1 65 9.4 9.8 109 15.8 8.1 156 22.6 21.2 71 10.3 10.11980 .......................... 357 51.7 43.6 58 8.4 9.5 118 17.1 9.4 181 26.3 24.7 78 11.3 11.81979 .......................... 342 49.6 41.5 64 9.3 9.8 107 15.5 8.7 171 24.8 23.0 75 10.9 10.7
All races, male1992 .......................... 217 62.2 51.8 55 15.8 14.6 68 19.4 11.5 94 27.0 25.7 46 13.2 12.61991 .......................... 199 57.6 49.2 53 15.3 14.7 59 17.0 9.8 87 25.2 24.8 39 11.3 9.71990 .......................... 197 57.5 48.7 34 9.9 9.6 63 18.4 11.1 100 29.2 28.1 25 7.3 6.81989 .......................... 205 59.8 51.4 48 14.0 13.6 67 19.6 12.3 90 26.2 25.5 50 14.6 12.91988 .......................... 192 55.9 48.6 38 11.1 10.6 63 18.2 12.0 92 26.7 25.9 30 8.7 8.51987 .......................... 175 51.1 42.7 27 7.9 7.1 52 15.2 9.2 96 28.0 26.4 30 8.8 7.71986 .......................... 187 54.8 45.8 36 10.5 9.5 61 18.0 11.0 90 26.3 25.2 34 9.9 8.7
1985 .......................... 188 54.6 46.3 38 11.1 10.9 57 16.5 9.8 93 27.1 25.6 30 8.7 7.91984 .......................... 195 56.9 49.1 38 11.1 11.3 51 14.9 9.0 106 31.0 28.8 29 8.5 7.91983 .......................... 207 60.7 51.9 35 10.3 9.8 66 19.3 12.6 106 31.1 29.5 44 12.9 11.61982 .......................... 199 58.5 51.1 34 10.0 10.5 56 16.5 10.7 109 31.9 30.0 33 9.7 9.61981 .......................... 220 64.6 56.8 44 13.0 12.9 62 18.2 11.8 114 33.5 32.2 47 13.8 13.51980 .......................... 243 71.2 64.6 44 12.9 14.4 62 18.3 12.0 136 40.0 38.3 40 11.7 12.51979 .......................... 230 67.5 60.2 44 12.9 13.0 59 17.3 11.6 127 37.3 35.6 43 12.6 12.1
All races, female1992 .......................... 107 29.7 18.7 21 5.8 6.4 53 14.7 5.3 33 9.2 7.1 29 8.1 6.71991 .......................... 108 30.3 18.2 13 3.7 3.9 53 14.9 5.6 42 11.8 8.7 20 5.6 4.21990 .......................... 107 30.3 18.9 15 4.2 4.4 51 14.3 4.5 41 11.7 9.9 25 7.1 5.01989 .......................... 116 32.8 21.9 27 7.6 7.3 41 11.6 3.6 48 13.5 11.0 29 8.2 7.21988 .......................... 103 29.1 18.8 13 3.7 3.5 53 14.9 5.6 37 10.5 9.8 22 6.2 5.11987 .......................... 106 29.9 18.9 16 4.5 4.8 54 15.2 5.1 36 10.3 8.9 24 6.8 5.21986 .......................... 111 31.5 21.5 15 4.2 4.6 53 15.0 6.2 43 12.3 10.7 31 8.8 7.9
- 136 -

Table 1. Number of deaths and unadjusted and age-adjusted death rates per 100,000 population for different categories of alcohol-related mortality byState: United States, 1979–92.
South Dakota
Race, sex,and year
All Alcohol-Related Causes of DeathAll Chronic Liver Disease and
CirrhosisTotal Causes of Death with ExplicitMention of Alcohol
Other Alcohol-Related Diseases Other Alcohol-Related Injuries orAdverse Effects
Number Unadj.Rate
Age-Adj.Rate Number Unadj.
RateAge-Adj.
Rate Number Unadj.Rate
Age-Adj.Rate Number Unadj.
RateAge-Adj.
Rate Number Unadj.Rate
Age-Adj.Rate
All races, female
1985 .......................... 103 29.0 19.2 16 4.5 5.0 46 12.9 4.5 41 11.6 9.7 31 8.7 7.81984 .......................... 104 29.4 18.4 14 4.0 3.7 50 14.1 5.6 40 11.4 9.1 20 5.6 3.81983 .......................... 106 30.1 19.8 10 2.8 2.8 56 15.9 7.0 40 11.4 9.9 28 8.0 6.41982 .......................... 108 30.9 21.2 12 3.4 3.5 52 14.7 6.3 45 12.8 11.4 17 4.9 4.91981 .......................... 110 31.4 22.5 21 6.0 7.0 47 13.4 5.0 42 11.9 10.4 24 6.9 7.21980 .......................... 115 32.8 23.4 14 4.0 4.7 55 15.8 7.2 45 12.9 11.4 38 10.9 11.11979 .......................... 112 32.1 23.6 20 5.7 6.8 48 13.8 6.2 44 12.5 10.6 32 9.2 9.5
White, male1992 .......................... 159 49.9 37.3 27 8.5 6.8 64 19.9 11.1 69 21.5 19.5 22 6.9 5.41991 .......................... 154 48.6 37.6 33 10.4 8.6 54 17.0 8.9 67 21.1 20.1 25 7.9 5.81990 .......................... 149 47.3 35.6 16 5.1 3.9 59 18.9 10.6 73 23.3 21.2 14 4.5 3.31989 .......................... 159 50.6 39.7 26 8.3 6.9 62 19.8 11.6 71 22.5 21.2 32 10.2 8.01988 .......................... 148 47.0 38.1 20 6.3 5.9 61 19.2 12.0 68 21.5 20.1 19 6.0 5.41987 .......................... 141 44.7 34.9 14 4.4 3.6 49 15.5 8.8 78 24.7 22.5 20 6.3 5.01986 .......................... 151 47.9 36.9 22 7.0 5.7 59 18.7 10.5 70 22.3 20.7 23 7.3 5.6
1985 .......................... 159 50.0 39.6 32 10.1 9.3 53 16.6 9.2 74 23.3 21.1 27 8.5 7.11984 .......................... 159 50.2 40.2 27 8.5 8.1 48 15.2 8.6 84 26.5 23.5 24 7.6 6.41983 .......................... 169 53.6 43.0 27 8.5 7.8 61 19.2 11.6 82 25.8 23.6 36 11.4 9.31982 .......................... 157 49.9 40.4 19 6.0 5.6 53 16.8 10.3 85 27.1 24.5 22 7.0 6.21981 .......................... 166 52.8 42.4 27 8.6 7.5 57 18.1 10.9 82 26.1 24.0 31 9.8 8.61980 .......................... 193 60.8 51.5 25 7.9 8.0 60 18.9 11.7 108 34.1 31.8 23 7.3 6.61979 .......................... 176 55.8 46.4 23 7.3 6.7 54 17.2 10.7 99 31.3 29.1 31 9.8 8.3
Black, male1992 .......................... 1 23.3 15.9 0 0.0 0.0 - 3.1 2.8 - 20.3 13.0 0 0.0 0.01991 .......................... 0 0.0 0.0 0 0.0 0.0 0 0.0 0.0 0 0.0 0.0 0 0.0 0.01990 .......................... 1 31.6 37.7 0 0.0 0.0 - 3.5 12.0 1 28.1 25.8 0 0.0 0.01989 .......................... - 3.6 9.3 0 0.0 0.0 - 3.6 9.3 0 0.0 0.0 0 0.0 0.01988 .......................... 1 46.6 44.1 0 0.0 0.0 0 0.0 0.0 1 46.6 44.1 0 0.0 0.01987 .......................... 0 0.0 0.0 0 0.0 0.0 0 0.0 0.0 0 0.0 0.0 0 0.0 0.01986 .......................... - 2.7 9.8 0 0.0 0.0 - 2.7 9.8 0 0.0 0.0 0 0.0 0.0
1985 .......................... 0 0.0 0.0 0 0.0 0.0 0 0.0 0.0 0 0.0 0.0 0 0.0 0.01984 .......................... 0 0.0 0.0 0 0.0 0.0 0 0.0 0.0 0 0.0 0.0 0 0.0 0.01983 .......................... 0 0.0 0.0 0 0.0 0.0 0 0.0 0.0 0 0.0 0.0 0 0.0 0.01982 .......................... 1 54.7 133.9 0 0.0 0.0 0 0.0 0.0 1 54.7 133.9 0 0.0 0.0
- 137 -

Table 1. Number of deaths and unadjusted and age-adjusted death rates per 100,000 population for different categories of alcohol-related mortality byState: United States, 1979–92.
South Dakota
Race, sex,and year
All Alcohol-Related Causes of DeathAll Chronic Liver Disease and
CirrhosisTotal Causes of Death with ExplicitMention of Alcohol
Other Alcohol-Related Diseases Other Alcohol-Related Injuries orAdverse Effects
Number Unadj.Rate
Age-Adj.Rate Number Unadj.
RateAge-Adj.
Rate Number Unadj.Rate
Age-Adj.Rate Number Unadj.
RateAge-Adj.
Rate Number Unadj.Rate
Age-Adj.Rate
Black, male1981 .......................... 0 0.0 0.0 0 0.0 0.0 0 0.0 0.0 0 0.0 0.0 0 0.0 0.01980 .......................... - 3.5 12.8 0 0.0 0.0 - 3.5 12.8 0 0.0 0.0 0 0.0 0.01979 .......................... 1 66.9 179.5 0 0.0 0.0 1 37.9 159.2 - 29.0 20.3 1 69.0 302.7
White, female1992 .......................... 82 24.9 12.1 6 1.8 1.7 49 15.0 4.9 26 8.0 5.5 16 4.9 3.21991 .......................... 86 26.4 12.5 3 0.9 0.6 48 14.8 4.7 35 10.7 7.2 10 3.1 1.11990 .......................... 83 25.6 12.6 5 1.5 1.4 46 14.1 3.7 32 9.9 7.6 13 4.0 1.91989 .......................... 88 26.9 14.4 8 2.5 1.8 39 12.0 3.5 40 12.4 9.2 15 4.6 3.31988 .......................... 86 26.4 15.1 6 1.8 1.6 50 15.4 5.1 30 9.2 8.4 14 4.3 2.91987 .......................... 85 25.9 13.6 9 2.8 2.8 50 15.2 4.7 26 7.9 6.1 19 5.8 3.91986 .......................... 87 26.7 14.9 3 0.9 0.7 51 15.5 5.8 34 10.3 8.3 19 5.8 4.1
1985 .......................... 80 24.4 12.9 8 2.4 2.3 42 12.7 3.9 30 9.3 6.7 18 5.5 3.81984 .......................... 87 26.6 14.5 7 2.1 2.0 47 14.2 5.0 34 10.2 7.5 14 4.3 2.41983 .......................... 86 26.3 14.3 3 0.9 0.6 52 16.0 6.3 31 9.4 7.4 17 5.2 3.41982 .......................... 87 26.7 15.0 6 1.8 1.5 47 14.5 5.3 34 10.3 8.2 7 2.2 1.61981 .......................... 81 25.0 14.2 8 2.5 2.7 44 13.5 4.6 29 9.0 7.0 12 3.7 3.61980 .......................... 87 26.8 15.5 2 0.6 0.5 51 15.8 6.3 34 10.4 8.7 19 5.8 4.51979 .......................... 87 26.8 16.0 9 2.8 2.8 45 14.0 5.6 32 10.0 7.5 19 5.9 4.9
Black, female1992 .......................... 0 0.0 0.0 0 0.0 0.0 0 0.0 0.0 0 0.0 0.0 0 0.0 0.01991 .......................... 0 0.0 0.0 0 0.0 0.0 0 0.0 0.0 0 0.0 0.0 0 0.0 0.01990 .......................... 0 0.0 0.0 0 0.0 0.0 0 0.0 0.0 0 0.0 0.0 0 0.0 0.01989 .......................... 0 0.0 0.0 0 0.0 0.0 0 0.0 0.0 0 0.0 0.0 0 0.0 0.01988 .......................... - 34.1 27.0 0 0.0 0.0 0 0.0 0.0 - 34.1 27.0 0 0.0 0.01987 .......................... 0 0.0 0.0 0 0.0 0.0 0 0.0 0.0 0 0.0 0.0 0 0.0 0.01986 .......................... - 17.9 56.1 0 0.0 0.0 - 17.9 56.1 0 0.0 0.0 0 0.0 0.0
1985 .......................... - 6.6 6.5 0 0.0 0.0 - 6.6 6.5 0 0.0 0.0 0 0.0 0.01984 .......................... 0 0.0 0.0 0 0.0 0.0 0 0.0 0.0 0 0.0 0.0 0 0.0 0.01983 .......................... 0 0.0 0.0 0 0.0 0.0 0 0.0 0.0 0 0.0 0.0 0 0.0 0.01982 .......................... 0 0.0 0.0 0 0.0 0.0 0 0.0 0.0 0 0.0 0.0 0 0.0 0.01981 .......................... - 6.2 10.8 0 0.0 0.0 - 6.2 10.8 0 0.0 0.0 0 0.0 0.01980 .......................... 0 0.0 0.0 0 0.0 0.0 0 0.0 0.0 0 0.0 0.0 0 0.0 0.01979 .......................... 0 0.0 0.0 0 0.0 0.0 0 0.0 0.0 0 0.0 0.0 0 0.0 0.0
- The AAF methodology used to estimate alcohol-related mortality can result in fractional estimates less than 0.5 but greater than 0.
- 138 -

Table 1. Number of deaths and unadjusted and age-adjusted death rates per 100,000 population for different categories of alcohol-related mortality byState: United States, 1979–92.
Tennessee
Race, sex,and year
All Alcohol-Related Causes of DeathAll Chronic Liver Disease and
CirrhosisTotal Causes of Death with ExplicitMention of Alcohol
Other Alcohol-Related Diseases Other Alcohol-Related Injuries orAdverse Effects
Number Unadj.Rate
Age-Adj.Rate Number Unadj.
RateAge-Adj.
Rate Number Unadj.Rate
Age-Adj.Rate Number Unadj.
RateAge-Adj.
Rate Number Unadj.Rate
Age-Adj.Rate
All races, both sexes1992 .......................... 2,423 48.2 38.3 377 7.5 6.6 888 17.7 10.3 1,158 23.0 21.4 483 9.6 7.61991 .......................... 2,378 48.0 38.2 374 7.6 6.6 855 17.3 10.1 1,149 23.2 21.5 479 9.7 7.71990 .......................... 2,423 49.5 39.8 368 7.5 6.7 886 18.1 10.8 1,170 23.9 22.3 513 10.5 8.61989 .......................... 2,314 47.7 37.8 334 6.9 6.2 857 17.6 10.5 1,123 23.1 21.2 422 8.7 6.91988 .......................... 2,296 47.6 38.4 255 5.3 4.8 849 17.6 10.6 1,192 24.7 22.9 411 8.5 6.81987 .......................... 2,314 48.4 39.4 305 6.4 5.9 852 17.8 10.9 1,157 24.2 22.5 415 8.7 7.21986 .......................... 2,250 47.5 38.6 239 5.0 4.6 824 17.4 10.8 1,187 25.0 23.2 380 8.0 6.5
1985 .......................... 2,111 44.8 36.5 243 5.2 4.7 804 17.0 10.6 1,065 22.6 21.2 390 8.3 6.91984 .......................... 2,156 46.0 37.8 241 5.1 4.9 825 17.6 11.3 1,090 23.3 21.7 399 8.5 7.21983 .......................... 2,152 46.2 38.1 242 5.2 5.1 842 18.1 11.7 1,068 22.9 21.4 395 8.5 7.21982 .......................... 2,141 46.1 38.6 263 5.7 5.4 814 17.5 11.6 1,064 22.9 21.7 386 8.3 7.21981 .......................... 2,225 48.1 40.6 295 6.4 6.0 821 17.7 11.8 1,109 24.0 22.7 406 8.8 7.71980 .......................... 2,322 50.5 43.3 313 6.8 6.7 845 18.4 12.4 1,164 25.3 24.1 452 9.8 8.81979 .......................... 2,280 50.3 43.4 297 6.6 6.5 811 17.9 12.4 1,172 25.9 24.5 426 9.4 8.5
All races, male1992 .......................... 1,631 67.4 59.2 305 12.6 11.3 493 20.4 14.9 833 34.4 32.9 315 13.0 11.31991 .......................... 1,604 67.2 59.1 302 12.7 11.3 465 19.5 14.3 837 35.1 33.5 310 13.0 11.31990 .......................... 1,628 69.1 61.3 296 12.6 11.5 488 20.7 15.4 845 35.9 34.3 327 13.9 12.51989 .......................... 1,556 66.6 58.6 273 11.7 10.8 477 20.4 15.2 806 34.5 32.6 291 12.4 11.11988 .......................... 1,520 65.4 58.4 199 8.6 8.1 462 19.9 15.2 858 37.0 35.2 254 10.9 9.81987 .......................... 1,551 67.4 60.3 238 10.3 9.8 476 20.7 15.8 837 36.3 34.7 275 11.9 10.81986 .......................... 1,502 65.8 58.9 191 8.4 7.8 455 19.9 15.4 856 37.5 35.7 225 9.9 8.9
1985 .......................... 1,413 62.2 55.7 196 8.6 8.2 443 19.5 14.9 774 34.1 32.7 251 11.0 10.11984 .......................... 1,467 64.9 58.8 203 9.0 8.9 470 20.8 16.4 794 35.1 33.5 261 11.6 10.61983 .......................... 1,433 63.8 57.8 188 8.4 8.4 472 21.0 16.6 773 34.4 32.9 245 10.9 10.21982 .......................... 1,483 66.2 61.0 214 9.5 9.5 469 20.9 16.9 801 35.7 34.7 268 12.0 11.31981 .......................... 1,522 68.2 62.9 232 10.4 10.1 471 21.1 17.0 819 36.7 35.7 262 11.7 11.01980 .......................... 1,602 72.1 67.2 251 11.3 11.5 485 21.8 17.9 866 39.0 37.9 311 14.0 13.51979 .......................... 1,536 70.2 65.7 219 10.0 10.2 463 21.1 17.5 855 39.0 38.0 254 11.6 11.2
All races, female1992 .......................... 792 30.4 19.6 72 2.8 2.3 395 15.2 6.7 325 12.5 10.6 168 6.5 4.21991 .......................... 774 30.2 19.6 72 2.8 2.4 390 15.2 6.9 312 12.2 10.3 169 6.6 4.51990 .......................... 795 31.4 20.7 72 2.8 2.4 398 15.7 7.2 325 12.8 11.1 186 7.3 5.01989 .......................... 758 30.1 19.5 61 2.4 2.1 380 15.1 6.8 317 12.6 10.6 131 5.2 3.21988 .......................... 776 31.0 20.5 56 2.2 2.0 386 15.5 7.0 334 13.4 11.5 157 6.3 4.21987 .......................... 762 30.7 20.8 67 2.7 2.5 376 15.2 7.1 320 12.9 11.2 140 5.6 4.11986 .......................... 748 30.4 20.6 48 2.0 1.8 369 15.0 7.2 331 13.5 11.6 155 6.3 4.4
- 139 -

Table 1. Number of deaths and unadjusted and age-adjusted death rates per 100,000 population for different categories of alcohol-related mortality byState: United States, 1979–92.
Tennessee
Race, sex,and year
All Alcohol-Related Causes of DeathAll Chronic Liver Disease and
CirrhosisTotal Causes of Death with ExplicitMention of Alcohol
Other Alcohol-Related Diseases Other Alcohol-Related Injuries orAdverse Effects
Number Unadj.Rate
Age-Adj.Rate Number Unadj.
RateAge-Adj.
Rate Number Unadj.Rate
Age-Adj.Rate Number Unadj.
RateAge-Adj.
Rate Number Unadj.Rate
Age-Adj.Rate
All races, female
1985 .......................... 699 28.6 19.6 47 1.9 1.7 361 14.8 7.2 291 11.9 10.6 139 5.7 4.01984 .......................... 689 28.4 19.3 38 1.6 1.3 355 14.6 7.3 296 12.2 10.7 138 5.7 4.21983 .......................... 718 29.8 20.6 54 2.2 2.1 370 15.3 7.8 294 12.2 10.7 150 6.2 4.61982 .......................... 658 27.3 18.7 49 2.0 1.8 346 14.4 7.4 263 10.9 9.5 118 4.9 3.61981 .......................... 703 29.3 20.9 63 2.6 2.5 350 14.6 7.8 289 12.1 10.6 144 6.0 5.01980 .......................... 720 30.3 22.0 62 2.6 2.5 360 15.1 8.2 299 12.5 11.3 141 5.9 4.81979 .......................... 744 31.7 23.6 78 3.3 3.2 348 14.9 8.3 317 13.5 12.1 172 7.3 6.1
White, male1992 .......................... 1,249 61.7 51.6 239 11.8 10.1 395 19.5 13.4 614 30.3 28.2 272 13.4 11.01991 .......................... 1,240 62.1 52.2 244 12.2 10.4 370 18.5 12.6 626 31.3 29.3 263 13.2 10.71990 .......................... 1,241 62.9 53.5 225 11.4 9.9 390 19.8 13.7 626 31.8 29.8 264 13.4 11.41989 .......................... 1,228 62.7 53.1 213 10.9 9.6 375 19.1 13.3 640 32.7 30.2 245 12.5 10.51988 .......................... 1,191 61.1 53.0 157 8.1 7.3 370 19.0 13.6 664 34.1 32.0 218 11.2 9.51987 .......................... 1,202 62.1 53.9 173 8.9 8.1 375 19.4 13.9 654 33.8 31.9 237 12.2 10.41986 .......................... 1,171 61.0 53.1 147 7.7 6.9 363 18.9 13.7 661 34.4 32.5 200 10.4 8.9
1985 .......................... 1,108 58.0 50.4 155 8.1 7.3 346 18.1 13.0 607 31.7 30.1 215 11.2 9.81984 .......................... 1,172 61.6 54.1 157 8.3 7.7 373 19.6 14.6 642 33.7 31.8 217 11.4 10.01983 .......................... 1,118 59.1 52.1 149 7.9 7.4 362 19.1 14.4 607 32.1 30.3 207 10.9 9.81982 .......................... 1,164 61.6 55.3 155 8.2 7.7 369 19.6 15.1 640 33.9 32.5 238 12.6 11.41981 .......................... 1,198 63.6 57.0 169 9.0 8.3 368 19.5 15.0 661 35.1 33.7 225 11.9 10.61980 .......................... 1,236 66.0 59.8 185 9.9 9.6 374 20.0 15.6 677 36.2 34.7 261 13.9 12.81979 .......................... 1,185 64.1 58.5 156 8.4 8.2 353 19.1 15.1 676 36.6 35.1 207 11.2 10.3
Black, male1992 .......................... 379 101.4 109.7 66 17.6 21.6 97 25.9 28.6 216 57.9 59.5 43 11.5 14.51991 .......................... 360 98.5 106.2 58 15.9 19.6 95 25.9 28.8 207 56.7 57.7 46 12.6 16.21990 .......................... 381 104.9 114.0 70 19.3 23.6 97 26.8 30.2 213 58.8 60.2 63 17.4 21.41989 .......................... 326 90.6 100.1 60 16.7 20.7 102 28.3 31.0 164 45.7 48.3 46 12.8 15.81988 .......................... 326 91.5 95.8 42 11.8 13.7 92 25.8 28.0 192 54.0 54.1 34 9.6 11.31987 .......................... 345 98.4 106.5 65 18.5 22.8 101 28.7 30.7 180 51.2 53.1 38 10.8 13.91986 .......................... 326 93.9 100.2 44 12.7 14.6 91 26.2 28.9 191 55.0 56.7 25 7.2 8.6
1985 .......................... 301 87.5 95.7 41 11.9 15.2 96 28.0 30.1 164 47.6 50.4 36 10.5 13.41984 .......................... 293 85.6 95.3 45 13.2 18.4 97 28.3 31.1 151 44.1 45.8 44 12.9 16.01983 .......................... 314 92.1 99.7 39 11.4 16.0 110 32.2 33.5 165 48.4 50.2 37 10.9 13.71982 .......................... 317 93.1 103.8 59 17.3 23.2 98 28.9 30.8 160 46.9 49.8 29 8.5 10.51981 .......................... 322 94.9 107.9 63 18.6 24.8 103 30.3 32.0 156 46.0 51.0 37 10.9 13.9
- 140 -

Table 1. Number of deaths and unadjusted and age-adjusted death rates per 100,000 population for different categories of alcohol-related mortality byState: United States, 1979–92.
Tennessee
Race, sex,and year
All Alcohol-Related Causes of DeathAll Chronic Liver Disease and
CirrhosisTotal Causes of Death with ExplicitMention of Alcohol
Other Alcohol-Related Diseases Other Alcohol-Related Injuries orAdverse Effects
Number Unadj.Rate
Age-Adj.Rate Number Unadj.
RateAge-Adj.
Rate Number Unadj.Rate
Age-Adj.Rate Number Unadj.
RateAge-Adj.
Rate Number Unadj.Rate
Age-Adj.Rate
Black, male1980 .......................... 364 107.3 123.1 65 19.2 26.2 111 32.7 35.4 188 55.4 61.5 50 14.8 19.01979 .......................... 349 105.5 120.6 63 19.0 25.4 109 33.0 35.1 177 53.4 60.1 47 14.2 18.0
White, female1992 .......................... 650 30.2 18.5 51 2.4 1.9 325 15.1 6.0 274 12.7 10.5 143 6.7 4.01991 .......................... 641 30.2 18.6 57 2.7 2.2 326 15.4 6.3 258 12.2 10.1 151 7.1 4.51990 .......................... 637 30.4 18.6 42 2.0 1.5 330 15.8 6.5 265 12.6 10.7 152 7.3 4.41989 .......................... 620 29.8 18.6 45 2.2 1.8 310 14.9 6.2 265 12.7 10.6 109 5.2 3.01988 .......................... 644 31.1 19.6 40 1.9 1.6 325 15.7 6.5 280 13.5 11.5 133 6.4 3.91987 .......................... 612 29.8 18.9 39 1.9 1.6 309 15.0 6.4 264 12.9 10.9 116 5.6 3.71986 .......................... 604 29.6 19.0 27 1.3 1.2 302 14.8 6.4 275 13.5 11.4 124 6.1 3.9
1985 .......................... 560 27.6 18.1 34 1.7 1.5 289 14.2 6.3 237 11.7 10.3 112 5.5 3.71984 .......................... 571 28.3 18.7 26 1.3 1.1 289 14.3 6.6 256 12.7 11.1 111 5.5 3.81983 .......................... 589 29.3 19.5 41 2.0 1.9 302 15.1 7.0 246 12.2 10.6 129 6.4 4.31982 .......................... 538 26.9 17.7 36 1.8 1.5 277 13.8 6.5 225 11.2 9.7 94 4.7 3.31981 .......................... 570 28.6 19.5 44 2.2 2.0 283 14.2 7.0 243 12.2 10.6 116 5.8 4.51980 .......................... 597 30.1 21.0 38 1.9 1.8 301 15.2 7.6 258 13.0 11.6 113 5.7 4.51979 .......................... 603 30.8 21.9 52 2.7 2.4 284 14.5 7.5 267 13.6 12.0 131 6.7 5.2
Black, female1992 .......................... 139 32.4 27.6 20 4.6 4.9 70 16.2 11.5 49 11.5 11.3 24 5.6 5.51991 .......................... 132 31.2 26.3 15 3.5 3.7 63 14.9 10.8 54 12.7 11.7 17 4.0 3.81990 .......................... 155 37.1 32.4 30 7.2 7.6 68 16.1 12.2 58 13.8 12.7 34 8.1 8.61989 .......................... 136 32.8 26.5 16 3.9 4.6 70 16.8 10.7 50 12.2 11.2 22 5.3 5.01988 .......................... 130 31.7 26.5 16 3.9 4.4 62 15.0 10.6 53 12.8 11.6 24 5.8 6.21987 .......................... 148 36.5 32.5 28 6.9 8.1 66 16.3 12.1 54 13.3 12.3 23 5.7 5.91986 .......................... 142 35.5 31.2 21 5.3 6.1 67 16.9 12.3 53 13.3 12.8 31 7.8 7.9
1985 .......................... 137 34.7 29.3 13 3.3 3.3 71 18.1 13.5 53 13.3 12.5 27 6.8 6.11984 .......................... 116 29.5 24.0 12 3.1 3.0 65 16.6 11.9 39 9.9 9.1 27 6.9 6.91983 .......................... 127 32.6 28.0 13 3.3 3.7 68 17.3 13.2 47 12.0 11.2 21 5.4 5.81982 .......................... 119 30.6 26.1 13 3.3 3.4 68 17.5 13.4 38 9.7 9.3 24 6.2 5.71981 .......................... 131 33.9 30.8 19 4.9 5.8 68 17.4 13.7 45 11.6 11.3 28 7.2 8.01980 .......................... 123 31.8 29.4 24 6.2 7.4 59 15.2 11.7 40 10.4 10.3 28 7.2 7.61979 .......................... 140 37.0 34.7 26 6.9 8.3 64 16.9 13.8 50 13.2 12.6 41 10.8 11.9
- 141 -

Table 1. Number of deaths and unadjusted and age-adjusted death rates per 100,000 population for different categories of alcohol-related mortality byState: United States, 1979–92.
Texas
Race, sex,and year
All Alcohol-Related Causes of DeathAll Chronic Liver Disease and
CirrhosisTotal Causes of Death with ExplicitMention of Alcohol
Other Alcohol-Related Diseases Other Alcohol-Related Injuries orAdverse Effects
Number Unadj.Rate
Age-Adj.Rate Number Unadj.
RateAge-Adj.
Rate Number Unadj.Rate
Age-Adj.Rate Number Unadj.
RateAge-Adj.
Rate Number Unadj.Rate
Age-Adj.Rate
All races, both sexes1992 .......................... 7,256 41.0 36.4 1,020 5.8 5.7 2,653 15.0 11.1 3,584 20.3 19.6 1,789 10.1 9.31991 .......................... 7,388 42.6 38.0 1,000 5.8 5.7 2,603 15.0 11.2 3,786 21.8 21.1 1,772 10.2 9.51990 .......................... 7,159 42.0 37.3 900 5.3 5.3 2,553 15.0 11.0 3,706 21.7 21.0 1,608 9.4 8.81989 .......................... 6,960 41.4 36.8 923 5.5 5.5 2,388 14.2 10.5 3,649 21.7 20.8 1,642 9.8 9.11988 .......................... 6,579 39.5 35.4 720 4.3 4.4 2,255 13.5 10.2 3,604 21.6 20.8 1,430 8.6 8.11987 .......................... 6,328 38.1 34.2 713 4.3 4.4 2,160 13.0 9.8 3,455 20.8 20.0 1,390 8.4 7.91986 .......................... 6,711 40.5 37.0 713 4.3 4.4 2,138 12.9 10.0 3,860 23.3 22.6 1,380 8.3 8.0
1985 .......................... 6,694 41.1 37.4 693 4.3 4.4 2,147 13.2 10.2 3,854 23.7 22.9 1,363 8.4 8.11984 .......................... 6,733 42.1 38.5 703 4.4 4.6 2,182 13.6 10.7 3,848 24.0 23.2 1,408 8.8 8.61983 .......................... 6,683 42.4 38.8 610 3.9 4.0 2,143 13.6 10.7 3,930 24.9 24.2 1,342 8.5 8.31982 .......................... 6,906 45.0 41.5 650 4.2 4.4 2,113 13.8 10.9 4,143 27.0 26.2 1,342 8.8 8.61981 .......................... 7,041 47.8 44.0 617 4.2 4.4 2,181 14.8 11.6 4,243 28.8 27.9 1,375 9.3 9.21980 .......................... 6,954 48.5 44.6 697 4.9 5.1 2,197 15.3 11.9 4,060 28.3 27.6 1,488 10.4 10.21979 .......................... 6,793 48.9 45.0 672 4.8 5.0 2,150 15.5 12.1 3,971 28.6 27.8 1,433 10.3 10.2
All races, male1992 .......................... 5,008 57.5 55.6 819 9.4 9.6 1,528 17.5 15.7 2,661 30.5 30.2 1,211 13.9 13.81991 .......................... 5,060 59.2 57.3 775 9.1 9.3 1,483 17.4 15.6 2,803 32.8 32.4 1,178 13.8 13.81990 .......................... 4,965 59.1 57.2 701 8.3 8.7 1,465 17.4 15.7 2,799 33.3 32.9 1,054 12.6 12.71989 .......................... 4,775 57.7 55.6 743 9.0 9.2 1,356 16.4 14.8 2,675 32.3 31.6 1,091 13.2 13.31988 .......................... 4,486 54.7 53.0 546 6.7 7.0 1,278 15.6 14.3 2,662 32.4 31.8 907 11.1 11.31987 .......................... 4,340 53.0 51.5 555 6.8 7.2 1,212 14.8 13.6 2,573 31.4 30.7 895 10.9 11.21986 .......................... 4,646 57.0 55.9 567 7.0 7.4 1,194 14.6 13.8 2,884 35.4 34.8 891 10.9 11.4
1985 .......................... 4,679 58.4 57.2 544 6.8 7.2 1,222 15.2 14.4 2,913 36.4 35.7 920 11.5 11.91984 .......................... 4,695 59.6 58.7 546 6.9 7.4 1,257 16.0 15.2 2,892 36.7 36.1 954 12.1 12.71983 .......................... 4,609 59.5 58.3 459 5.9 6.3 1,219 15.7 14.9 2,931 37.8 37.2 879 11.3 11.81982 .......................... 4,879 64.7 63.7 511 6.8 7.3 1,208 16.0 15.2 3,160 41.9 41.3 902 12.0 12.51981 .......................... 4,960 68.4 67.1 482 6.6 7.2 1,243 17.1 16.1 3,235 44.6 43.8 889 12.3 13.01980 .......................... 4,870 69.0 67.8 533 7.6 8.1 1,247 17.7 16.5 3,090 43.8 43.2 959 13.6 14.31979 .......................... 4,713 69.0 67.8 496 7.3 7.8 1,222 17.9 16.6 2,996 43.9 43.4 925 13.5 14.1
All races, female1992 .......................... 2,248 25.1 18.5 201 2.2 2.1 1,124 12.5 7.2 923 10.3 9.2 578 6.4 5.21991 .......................... 2,328 26.4 20.1 225 2.6 2.5 1,120 12.7 7.5 983 11.2 10.1 594 6.7 5.71990 .......................... 2,194 25.4 18.8 199 2.3 2.2 1,088 12.6 7.2 907 10.5 9.4 554 6.4 5.31989 .......................... 2,185 25.6 19.4 180 2.1 2.1 1,031 12.1 7.0 974 11.4 10.3 551 6.5 5.41988 .......................... 2,093 24.7 19.0 174 2.1 2.0 977 11.6 6.8 942 11.1 10.2 523 6.2 5.31987 .......................... 1,988 23.6 18.3 158 1.9 1.9 948 11.2 6.8 882 10.5 9.7 495 5.9 4.91986 .......................... 2,065 24.6 19.4 146 1.7 1.7 944 11.2 7.0 975 11.6 10.7 489 5.8 5.0
- 142 -

Table 1. Number of deaths and unadjusted and age-adjusted death rates per 100,000 population for different categories of alcohol-related mortality byState: United States, 1979–92.
Texas
Race, sex,and year
All Alcohol-Related Causes of DeathAll Chronic Liver Disease and
CirrhosisTotal Causes of Death with ExplicitMention of Alcohol
Other Alcohol-Related Diseases Other Alcohol-Related Injuries orAdverse Effects
Number Unadj.Rate
Age-Adj.Rate Number Unadj.
RateAge-Adj.
Rate Number Unadj.Rate
Age-Adj.Rate Number Unadj.
RateAge-Adj.
Rate Number Unadj.Rate
Age-Adj.Rate
All races, female
1985 .......................... 2,016 24.4 19.0 149 1.8 1.8 925 11.2 6.7 942 11.4 10.5 443 5.4 4.61984 .......................... 2,038 25.1 19.8 157 1.9 2.0 925 11.4 7.0 956 11.8 10.8 454 5.6 5.01983 .......................... 2,074 25.9 20.8 151 1.9 1.9 924 11.6 7.3 999 12.5 11.5 463 5.8 5.21982 .......................... 2,028 26.0 20.7 139 1.8 1.8 905 11.6 7.3 983 12.6 11.6 440 5.6 5.11981 .......................... 2,082 27.8 22.3 135 1.8 1.9 939 12.5 7.9 1,008 13.5 12.5 486 6.5 5.91980 .......................... 2,084 28.6 23.0 164 2.3 2.3 950 13.0 8.3 969 13.3 12.5 529 7.3 6.61979 .......................... 2,080 29.5 23.8 176 2.5 2.5 928 13.1 8.5 976 13.8 12.8 508 7.2 6.8
White, male1992 .......................... 4,084 54.8 51.5 709 9.5 9.4 1,282 17.2 14.5 2,093 28.1 27.5 1,077 14.4 13.81991 .......................... 4,099 56.0 52.8 667 9.1 9.0 1,262 17.2 14.7 2,170 29.6 29.0 1,056 14.4 13.81990 .......................... 4,023 55.9 52.7 604 8.4 8.4 1,229 17.1 14.5 2,190 30.4 29.8 941 13.1 12.71989 .......................... 3,915 55.0 51.9 623 8.8 8.7 1,132 15.9 13.7 2,160 30.4 29.5 964 13.5 13.21988 .......................... 3,720 52.6 50.1 460 6.5 6.6 1,074 15.2 13.3 2,185 30.9 30.2 814 11.5 11.41987 .......................... 3,591 50.9 48.5 457 6.5 6.7 1,024 14.5 12.7 2,111 29.9 29.1 789 11.2 11.11986 .......................... 3,808 54.1 52.1 466 6.6 6.8 990 14.1 12.6 2,352 33.4 32.7 788 11.2 11.2
1985 .......................... 3,891 56.2 54.2 450 6.5 6.7 1,012 14.6 13.2 2,429 35.1 34.3 812 11.7 11.81984 .......................... 3,899 57.2 55.4 438 6.4 6.7 1,045 15.3 14.0 2,416 35.5 34.7 832 12.2 12.41983 .......................... 3,856 57.5 55.5 385 5.7 5.9 1,018 15.2 13.8 2,453 36.6 35.8 787 11.7 11.81982 .......................... 4,042 61.9 60.0 428 6.6 6.8 999 15.3 14.0 2,615 40.0 39.2 802 12.3 12.41981 .......................... 4,083 64.9 62.7 401 6.4 6.7 1,023 16.3 14.7 2,659 42.3 41.3 793 12.6 12.91980 .......................... 4,048 66.0 63.8 457 7.5 7.8 1,047 17.1 15.4 2,543 41.5 40.6 858 14.0 14.21979 .......................... 3,864 64.9 62.7 408 6.9 7.2 1,026 17.2 15.6 2,430 40.8 39.9 824 13.8 14.0
Black, male1992 .......................... 874 84.9 95.4 107 10.4 13.6 233 22.6 28.5 534 51.9 53.2 129 12.5 16.21991 .......................... 914 90.7 99.2 106 10.5 13.5 213 21.1 25.9 595 59.1 59.8 117 11.6 15.21990 .......................... 898 90.6 98.7 96 9.7 12.8 223 22.5 27.2 579 58.5 58.7 106 10.7 14.31989 .......................... 816 84.0 92.6 117 12.0 15.6 214 22.0 26.5 485 50.0 50.5 121 12.5 15.61988 .......................... 735 76.5 84.1 86 8.9 11.3 197 20.5 25.5 452 47.0 47.3 89 9.3 11.31987 .......................... 711 74.3 81.7 95 9.9 12.4 181 18.9 23.0 435 45.4 46.2 99 10.3 12.91986 .......................... 792 82.9 93.0 99 10.4 13.6 198 20.7 25.7 495 51.8 53.7 99 10.4 13.7
1985 .......................... 751 79.8 88.5 94 10.0 12.9 204 21.7 26.1 453 48.2 49.6 103 10.9 13.51984 .......................... 763 82.2 92.9 107 11.5 14.7 206 22.2 27.1 450 48.5 51.1 116 12.5 16.11983 .......................... 718 78.4 87.1 73 8.0 10.2 194 21.2 25.2 451 49.2 51.7 89 9.7 12.81982 .......................... 802 89.8 100.8 80 9.0 11.9 200 22.4 26.8 523 58.5 62.2 93 10.4 13.61981 .......................... 861 100.3 111.9 81 9.4 12.8 216 25.1 29.4 564 65.7 69.7 95 11.1 14.9
- 143 -

Table 1. Number of deaths and unadjusted and age-adjusted death rates per 100,000 population for different categories of alcohol-related mortality byState: United States, 1979–92.
Texas
Race, sex,and year
All Alcohol-Related Causes of DeathAll Chronic Liver Disease and
CirrhosisTotal Causes of Death with ExplicitMention of Alcohol
Other Alcohol-Related Diseases Other Alcohol-Related Injuries orAdverse Effects
Number Unadj.Rate
Age-Adj.Rate Number Unadj.
RateAge-Adj.
Rate Number Unadj.Rate
Age-Adj.Rate Number Unadj.
RateAge-Adj.
Rate Number Unadj.Rate
Age-Adj.Rate
Black, male1980 .......................... 800 95.9 107.0 72 8.6 11.5 197 23.7 27.3 530 63.6 68.2 98 11.7 15.51979 .......................... 835 105.0 117.7 88 11.1 14.3 192 24.1 27.2 555 69.8 76.2 100 12.6 16.3
White, female1992 .......................... 1,904 25.0 17.7 162 2.1 1.9 975 12.8 6.8 767 10.1 8.9 516 6.8 5.21991 .......................... 1,961 26.1 19.1 187 2.5 2.4 963 12.8 7.1 811 10.8 9.7 527 7.0 5.71990 .......................... 1,868 25.3 17.9 163 2.2 2.1 948 12.8 6.9 757 10.3 9.0 491 6.7 5.21989 .......................... 1,858 25.5 18.5 155 2.1 2.0 887 12.2 6.5 816 11.2 10.0 486 6.7 5.31988 .......................... 1,778 24.5 18.2 149 2.1 2.0 843 11.6 6.4 786 10.8 9.8 472 6.5 5.41987 .......................... 1,685 23.3 17.5 128 1.8 1.7 813 11.2 6.3 745 10.3 9.5 437 6.0 4.91986 .......................... 1,762 24.4 18.6 119 1.6 1.6 820 11.4 6.6 824 11.4 10.4 433 6.0 4.9
1985 .......................... 1,736 24.5 18.5 121 1.7 1.7 806 11.4 6.4 808 11.4 10.5 389 5.5 4.51984 .......................... 1,776 25.4 19.5 139 2.0 2.0 810 11.6 6.8 826 11.8 10.7 412 5.9 5.11983 .......................... 1,779 25.9 20.1 122 1.8 1.7 800 11.6 6.9 857 12.5 11.4 403 5.9 5.01982 .......................... 1,741 26.0 20.0 113 1.7 1.6 784 11.7 6.9 844 12.6 11.4 386 5.8 5.01981 .......................... 1,799 27.8 21.7 110 1.7 1.7 813 12.6 7.5 876 13.6 12.5 446 6.9 6.01980 .......................... 1,761 28.0 21.7 130 2.1 2.1 819 13.0 7.8 812 12.9 11.9 461 7.3 6.41979 .......................... 1,767 28.9 22.6 142 2.3 2.3 810 13.2 8.1 814 13.3 12.1 440 7.2 6.5
Black, female1992 .......................... 319 28.8 26.8 36 3.3 3.7 143 12.9 11.0 141 12.7 12.1 57 5.1 5.31991 .......................... 348 32.0 29.7 38 3.5 4.0 151 13.9 11.8 159 14.6 14.0 65 6.0 6.51990 .......................... 306 28.7 26.2 33 3.1 3.4 134 12.6 10.4 139 13.1 12.4 57 5.3 5.71989 .......................... 310 29.7 27.3 23 2.2 2.5 140 13.4 11.4 147 14.1 13.4 62 5.9 6.11988 .......................... 295 28.6 26.6 24 2.3 2.8 127 12.3 10.6 144 13.9 13.2 46 4.5 4.91987 .......................... 284 27.6 25.9 28 2.7 3.1 130 12.7 11.2 126 12.2 11.6 55 5.3 5.81986 .......................... 279 27.1 25.6 26 2.5 2.8 116 11.3 9.9 137 13.3 12.8 51 5.0 5.4
1985 .......................... 268 26.5 24.6 28 2.8 3.1 114 11.3 9.7 126 12.4 11.8 51 5.0 5.61984 .......................... 245 24.6 22.7 17 1.7 2.1 111 11.1 9.4 117 11.7 11.2 38 3.8 4.31983 .......................... 279 28.3 27.1 26 2.6 3.2 120 12.2 10.8 133 13.5 13.1 55 5.6 6.31982 .......................... 277 28.7 27.6 26 2.7 3.1 119 12.3 10.9 132 13.7 13.5 54 5.6 6.21981 .......................... 270 29.2 28.1 24 2.6 3.3 123 13.3 11.5 123 13.3 13.2 38 4.1 4.71980 .......................... 310 34.6 33.8 34 3.8 4.6 129 14.4 12.7 147 16.4 16.6 66 7.3 8.41979 .......................... 306 35.6 34.3 32 3.7 4.5 117 13.6 11.5 157 18.3 18.3 68 7.9 9.3
- 144 -

Table 1. Number of deaths and unadjusted and age-adjusted death rates per 100,000 population for different categories of alcohol-related mortality byState: United States, 1979–92.
Utah
Race, sex,and year
All Alcohol-Related Causes of DeathAll Chronic Liver Disease and
CirrhosisTotal Causes of Death with ExplicitMention of Alcohol
Other Alcohol-Related Diseases Other Alcohol-Related Injuries orAdverse Effects
Number Unadj.Rate
Age-Adj.Rate Number Unadj.
RateAge-Adj.
Rate Number Unadj.Rate
Age-Adj.Rate Number Unadj.
RateAge-Adj.
Rate Number Unadj.Rate
Age-Adj.Rate
All races, both sexes1992 .......................... 527 29.1 27.2 82 4.5 5.1 176 9.7 7.5 269 14.8 14.7 99 5.5 5.41991 .......................... 501 28.4 27.3 74 4.2 4.9 164 9.3 7.5 264 14.9 15.0 86 4.9 5.21990 .......................... 546 31.6 30.3 108 6.2 6.9 158 9.1 7.1 280 16.2 16.2 105 6.1 6.31989 .......................... 528 31.0 30.0 89 5.2 6.1 170 10.0 8.1 269 15.8 15.8 97 5.7 6.11988 .......................... 485 28.7 28.3 60 3.6 4.3 154 9.1 7.5 271 16.0 16.6 81 4.8 5.41987 .......................... 484 28.9 28.8 63 3.8 4.6 145 8.6 7.2 276 16.5 17.1 76 4.5 5.11986 .......................... 503 30.2 30.1 71 4.3 5.1 147 8.9 7.8 284 17.1 17.2 89 5.4 6.0
1985 .......................... 495 30.1 30.3 69 4.2 5.2 145 8.8 7.7 281 17.1 17.3 93 5.7 6.61984 .......................... 493 30.4 30.7 49 3.0 3.7 148 9.1 7.9 296 18.3 19.0 83 5.1 5.61983 .......................... 479 30.0 30.6 58 3.6 4.5 141 8.8 8.0 280 17.6 18.1 102 6.4 7.51982 .......................... 477 30.6 31.4 60 3.9 4.8 142 9.1 8.4 276 17.7 18.1 115 7.4 8.71981 .......................... 490 32.3 34.0 63 4.2 5.1 132 8.7 8.4 295 19.4 20.6 104 6.9 8.41980 .......................... 504 34.2 35.3 60 4.1 5.2 143 9.7 9.2 301 20.4 20.9 100 6.8 8.31979 .......................... 497 35.1 36.3 81 5.7 6.9 130 9.1 8.7 287 20.2 20.7 129 9.1 11.2
All races, male1992 .......................... 327 36.4 37.3 57 6.3 7.4 91 10.2 9.4 179 19.9 20.5 51 5.7 6.01991 .......................... 311 35.5 37.4 48 5.5 6.5 83 9.5 9.5 180 20.5 21.4 46 5.2 6.21990 .......................... 346 40.3 42.4 75 8.7 10.2 79 9.1 8.7 192 22.4 23.5 59 6.9 7.81989 .......................... 337 39.8 42.0 65 7.7 9.2 90 10.6 10.5 182 21.5 22.3 61 7.2 8.41988 .......................... 314 37.5 40.1 46 5.5 6.7 78 9.3 9.4 190 22.6 24.0 50 6.0 7.11987 .......................... 320 38.4 41.8 51 6.1 7.7 77 9.3 9.3 192 23.0 24.8 52 6.2 7.51986 .......................... 334 40.4 43.3 48 5.8 7.1 82 9.9 10.4 204 24.6 25.9 55 6.7 8.0
1985 .......................... 320 39.2 42.4 52 6.4 8.1 73 9.0 9.3 195 23.9 24.9 55 6.7 8.21984 .......................... 321 39.9 43.7 34 4.2 5.4 80 9.9 10.5 207 25.7 27.9 47 5.8 7.21983 .......................... 308 38.8 42.3 36 4.5 5.6 77 9.7 10.6 195 24.6 26.1 62 7.8 9.41982 .......................... 312 40.3 44.3 43 5.6 7.0 74 9.6 10.7 195 25.2 26.7 73 9.4 11.61981 .......................... 330 43.9 49.2 46 6.1 7.7 73 9.7 11.0 211 28.0 30.6 72 9.6 12.31980 .......................... 342 46.8 51.3 46 6.3 8.2 81 11.1 12.4 214 29.3 30.7 62 8.5 10.81979 .......................... 327 46.6 51.2 53 7.5 9.3 72 10.2 11.5 202 28.8 30.4 86 12.2 15.6
All races, female1992 .......................... 200 21.9 17.8 25 2.7 2.9 85 9.3 5.8 90 9.8 9.1 48 5.3 4.91991 .......................... 190 21.4 17.6 26 2.9 3.3 80 9.0 5.6 84 9.4 8.8 40 4.5 4.31990 .......................... 200 23.0 19.1 33 3.8 3.9 80 9.2 5.8 88 10.1 9.3 46 5.3 4.81989 .......................... 191 22.3 19.0 24 2.8 3.2 80 9.3 6.1 87 10.2 9.7 36 4.2 4.01988 .......................... 171 20.1 17.1 14 1.6 2.0 76 8.9 5.8 81 9.5 9.3 31 3.6 3.81987 .......................... 164 19.4 16.6 12 1.4 1.6 68 8.0 5.5 84 10.0 9.5 24 2.8 2.81986 .......................... 169 20.2 17.9 23 2.8 3.3 66 7.8 5.7 81 9.6 9.0 34 4.1 4.2
- 145 -

Table 1. Number of deaths and unadjusted and age-adjusted death rates per 100,000 population for different categories of alcohol-related mortality byState: United States, 1979–92.
Utah
Race, sex,and year
All Alcohol-Related Causes of DeathAll Chronic Liver Disease and
CirrhosisTotal Causes of Death with ExplicitMention of Alcohol
Other Alcohol-Related Diseases Other Alcohol-Related Injuries orAdverse Effects
Number Unadj.Rate
Age-Adj.Rate Number Unadj.
RateAge-Adj.
Rate Number Unadj.Rate
Age-Adj.Rate Number Unadj.
RateAge-Adj.
Rate Number Unadj.Rate
Age-Adj.Rate
All races, female
1985 .......................... 174 21.1 19.0 17 2.1 2.5 72 8.7 6.4 86 10.4 10.0 38 4.6 5.21984 .......................... 172 21.0 18.3 15 1.8 2.1 68 8.3 5.8 89 10.9 10.4 36 4.4 4.11983 .......................... 171 21.4 19.7 22 2.7 3.4 64 8.0 5.8 85 10.6 10.5 40 5.0 6.01982 .......................... 165 21.1 19.2 17 2.2 2.9 67 8.6 6.5 81 10.3 9.9 42 5.4 6.11981 .......................... 160 21.0 19.6 17 2.2 2.7 60 7.8 6.2 84 11.0 10.8 32 4.2 4.81980 .......................... 162 21.8 20.4 14 1.9 2.5 61 8.3 6.6 87 11.7 11.3 38 5.1 6.01979 .......................... 170 23.8 22.4 28 3.9 4.8 58 8.1 6.3 84 11.8 11.3 43 6.0 7.2
White, male1992 .......................... 307 35.7 36.1 49 5.7 6.5 89 10.3 9.4 169 19.7 20.2 47 5.5 5.71991 .......................... 296 35.2 36.8 43 5.1 6.0 81 9.6 9.5 172 20.5 21.3 44 5.2 6.11990 .......................... 324 39.4 41.2 70 8.5 9.8 77 9.3 8.6 178 21.6 22.7 56 6.8 7.61989 .......................... 312 38.4 40.0 57 7.0 8.4 89 10.9 10.6 166 20.4 21.1 59 7.3 8.31988 .......................... 302 37.5 39.8 44 5.5 6.6 77 9.6 9.4 181 22.4 23.7 49 6.1 7.11987 .......................... 302 37.8 40.6 46 5.7 7.2 75 9.3 9.1 182 22.7 24.4 46 5.7 6.81986 .......................... 310 39.1 41.6 40 5.0 6.0 80 10.1 10.4 190 24.0 25.1 51 6.4 7.6
1985 .......................... 296 37.7 40.3 43 5.5 7.0 71 9.0 9.2 182 23.2 24.1 45 5.7 6.91984 .......................... 304 39.2 42.7 32 4.1 5.3 76 9.8 10.2 196 25.2 27.2 43 5.5 6.81983 .......................... 284 37.2 40.1 30 3.9 4.7 74 9.7 10.4 180 23.6 25.0 57 7.5 8.81982 .......................... 293 39.4 42.8 35 4.7 5.8 72 9.7 10.5 186 25.0 26.5 65 8.7 10.51981 .......................... 317 43.7 48.7 45 6.2 7.7 70 9.7 10.7 202 27.8 30.3 68 9.4 11.81980 .......................... 324 45.8 50.1 43 6.1 7.8 80 11.4 12.4 200 28.4 29.9 59 8.4 10.61979 .......................... 311 45.7 50.0 50 7.4 9.0 70 10.4 11.5 190 28.0 29.5 83 12.2 15.4
Black, male1992 .......................... 5 62.5 94.6 2 25.4 56.3 1 11.3 16.5 2 25.9 21.8 1 12.7 25.71991 .......................... 3 41.3 58.7 1 13.4 30.4 - 6.4 10.3 2 21.5 18.0 0 0.0 0.01990 .......................... 4 59.8 92.6 2 28.0 60.5 1 7.1 10.9 2 24.6 21.1 2 28.0 60.51989 .......................... 7 106.3 138.8 2 28.7 46.5 1 10.6 16.5 5 67.0 75.8 2 28.7 46.51988 .......................... 3 39.7 62.2 1 14.6 30.6 - 1.0 2.2 2 24.0 29.4 0 0.0 0.01987 .......................... 2 36.3 44.3 1 14.9 17.8 - 5.4 9.1 1 16.1 17.4 1 14.9 17.81986 .......................... 4 55.9 72.0 1 15.2 31.9 - 2.9 4.5 2 37.8 35.6 0 0.0 0.0
1985 .......................... 2 31.7 47.4 1 15.5 24.4 - 0.8 1.4 1 15.4 21.7 0 0.0 0.01984 .......................... 4 66.3 75.6 0 0.0 0.0 - 1.1 2.4 4 65.2 73.1 0 0.0 0.01983 .......................... 4 73.8 97.6 0 0.0 0.0 1 10.7 21.3 4 63.1 76.2 0 0.0 0.01982 .......................... 4 62.5 83.9 2 33.9 59.7 - 5.9 9.7 1 22.7 14.5 2 33.9 59.7
- 146 -

Table 1. Number of deaths and unadjusted and age-adjusted death rates per 100,000 population for different categories of alcohol-related mortality byState: United States, 1979–92.
Utah
Race, sex,and year
All Alcohol-Related Causes of DeathAll Chronic Liver Disease and
CirrhosisTotal Causes of Death with ExplicitMention of Alcohol
Other Alcohol-Related Diseases Other Alcohol-Related Injuries orAdverse Effects
Number Unadj.Rate
Age-Adj.Rate Number Unadj.
RateAge-Adj.
Rate Number Unadj.Rate
Age-Adj.Rate Number Unadj.
RateAge-Adj.
Rate Number Unadj.Rate
Age-Adj.Rate
Black, male1981 .......................... 2 34.9 53.2 0 0.0 0.0 1 20.2 35.0 1 14.7 18.2 1 17.5 29.41980 .......................... 3 60.7 79.6 0 0.0 0.0 1 12.9 25.4 3 47.9 54.2 1 18.1 38.31979 .......................... 3 48.8 64.7 0 0.0 0.0 1 11.4 20.0 2 37.4 44.7 1 19.1 33.9
White, female1992 .......................... 189 21.7 17.2 23 2.6 2.8 84 9.6 5.8 82 9.5 8.6 46 5.3 4.81991 .......................... 182 21.3 17.3 24 2.8 3.1 78 9.2 5.6 79 9.3 8.6 38 4.5 4.31990 .......................... 190 22.8 18.6 29 3.5 3.6 78 9.4 5.8 83 10.0 9.2 44 5.3 4.71989 .......................... 181 21.9 18.3 21 2.5 2.9 78 9.5 6.1 82 9.9 9.4 35 4.2 4.01988 .......................... 164 20.1 16.9 13 1.6 1.9 74 9.0 5.7 78 9.5 9.2 31 3.8 3.91987 .......................... 158 19.5 16.4 10 1.2 1.3 67 8.2 5.6 81 10.0 9.5 22 2.7 2.61986 .......................... 164 20.3 17.8 23 2.9 3.4 63 7.8 5.5 78 9.7 9.0 31 3.9 4.0
1985 .......................... 164 20.5 18.1 14 1.8 2.2 69 8.7 6.3 81 10.1 9.6 33 4.1 4.61984 .......................... 165 21.0 17.9 12 1.5 1.7 66 8.4 5.7 87 11.0 10.4 33 4.2 3.81983 .......................... 164 21.2 19.3 20 2.6 3.1 62 7.9 5.7 82 10.6 10.5 37 4.8 5.61982 .......................... 158 20.9 18.8 15 2.0 2.6 65 8.6 6.4 78 10.3 9.8 38 5.0 5.71981 .......................... 152 20.7 19.0 15 2.0 2.4 59 7.9 6.2 79 10.7 10.4 32 4.3 4.91980 .......................... 151 21.1 19.3 11 1.5 2.0 60 8.3 6.4 81 11.3 10.8 34 4.7 5.41979 .......................... 158 22.9 20.9 23 3.3 4.0 56 8.1 6.1 79 11.5 10.8 37 5.4 6.1
Black, female1992 .......................... 1 25.0 22.7 0 0.0 0.0 - 2.5 2.5 1 22.5 20.3 0 0.0 0.01991 .......................... 1 16.0 17.3 0 0.0 0.0 - 8.1 10.5 - 7.9 6.8 0 0.0 0.01990 .......................... 2 40.9 43.0 0 0.0 0.0 1 13.4 14.2 1 27.4 28.8 0 0.0 0.01989 .......................... 1 29.4 32.1 0 0.0 0.0 - 8.6 12.4 1 20.8 19.7 0 0.0 0.01988 .......................... 1 24.3 30.0 0 0.0 0.0 1 24.3 30.0 0 0.0 0.0 0 0.0 0.01987 .......................... 1 21.7 19.2 0 0.0 0.0 - 4.0 3.9 1 17.7 15.3 0 0.0 0.01986 .......................... 2 37.2 37.7 0 0.0 0.0 1 12.3 15.7 1 25.0 22.0 0 0.0 0.0
1985 .......................... 1 22.6 26.4 0 0.0 0.0 1 16.4 20.6 - 6.1 5.8 0 0.0 0.01984 .......................... 1 21.6 23.3 0 0.0 0.0 1 13.7 11.7 - 7.9 11.6 0 0.0 0.01983 .......................... 1 33.3 34.9 0 0.0 0.0 1 14.0 18.2 1 19.3 16.7 0 0.0 0.01982 .......................... 1 26.5 30.3 0 0.0 0.0 1 15.6 20.6 - 10.9 9.7 0 0.0 0.01981 .......................... 1 17.3 16.9 0 0.0 0.0 - 7.1 7.4 - 10.2 9.6 0 0.0 0.01980 .......................... 1 17.9 25.4 0 0.0 0.0 0 0.0 0.0 1 17.9 25.4 1 25.2 32.51979 .......................... 1 17.1 26.4 0 0.0 0.0 - 5.1 5.0 - 12.0 21.4 0 0.0 0.0
- The AAF methodology used to estimate alcohol-related mortality can result in fractional estimates less than 0.5 but greater than 0.
- 147 -

Table 1. Number of deaths and unadjusted and age-adjusted death rates per 100,000 population for different categories of alcohol-related mortality byState: United States, 1979–92.
Vermont
Race, sex,and year
All Alcohol-Related Causes of DeathAll Chronic Liver Disease and
CirrhosisTotal Causes of Death with ExplicitMention of Alcohol
Other Alcohol-Related Diseases Other Alcohol-Related Injuries orAdverse Effects
Number Unadj.Rate
Age-Adj.Rate Number Unadj.
RateAge-Adj.
Rate Number Unadj.Rate
Age-Adj.Rate Number Unadj.
RateAge-Adj.
Rate Number Unadj.Rate
Age-Adj.Rate
All races, both sexes1992 .......................... 222 38.9 29.9 37 6.5 5.7 96 16.8 10.2 89 15.6 13.9 53 9.3 7.21991 .......................... 212 37.3 29.1 39 6.9 5.8 83 14.7 8.6 89 15.7 14.7 46 8.1 6.31990 .......................... 229 40.5 31.2 54 9.6 8.2 87 15.3 9.1 88 15.6 13.9 59 10.5 8.91989 .......................... 241 43.2 34.0 45 8.1 7.4 90 16.1 10.1 106 18.9 16.5 53 9.5 8.71988 .......................... 230 41.9 32.8 40 7.3 6.5 87 15.9 9.3 103 18.7 17.0 63 11.5 8.91987 .......................... 229 42.3 34.1 51 9.4 8.7 79 14.7 9.1 98 18.2 16.2 58 10.7 9.61986 .......................... 219 41.0 32.8 37 6.9 6.5 89 16.7 10.2 93 17.4 16.1 55 10.3 8.8
1985 .......................... 217 40.9 32.9 32 6.0 5.7 89 16.9 10.8 95 18.0 16.4 59 11.1 9.01984 .......................... 212 40.3 32.5 41 7.8 7.3 77 14.6 8.9 94 17.9 16.2 55 10.4 9.11983 .......................... 230 43.9 35.6 47 9.0 8.7 85 16.3 10.1 98 18.7 16.8 60 11.5 10.51982 .......................... 237 45.7 36.2 47 9.1 8.0 95 18.3 11.9 96 18.4 16.3 68 13.1 10.91981 .......................... 227 44.1 37.2 54 10.5 10.3 80 15.5 9.9 93 18.1 17.0 71 13.8 12.81980 .......................... 229 44.7 36.2 35 6.8 6.3 84 16.5 11.0 110 21.4 18.9 54 10.5 9.71979 .......................... 233 46.1 38.8 37 7.3 6.8 79 15.6 10.2 117 23.2 21.8 53 10.5 9.0
All races, male1992 .......................... 147 52.6 46.3 25 8.9 8.1 58 20.7 16.0 64 23.0 22.2 31 11.1 9.41991 .......................... 131 47.1 42.0 26 9.3 8.3 42 15.3 11.7 62 22.4 22.0 23 8.3 6.91990 .......................... 149 53.8 46.8 42 15.2 13.7 43 15.6 11.7 63 22.9 21.4 37 13.4 12.21989 .......................... 163 59.6 52.5 38 13.9 12.9 51 18.5 14.7 74 27.1 24.9 36 13.2 12.81988 .......................... 144 53.7 47.3 33 12.3 11.6 45 16.6 12.5 67 24.8 23.1 39 14.5 12.91987 .......................... 143 54.1 47.8 28 10.6 9.7 47 17.7 14.1 68 25.7 24.1 32 12.1 10.91986 .......................... 142 54.5 49.2 29 11.1 11.1 48 18.2 14.2 66 25.2 23.9 32 12.3 12.2
1985 .......................... 141 54.4 49.2 26 10.1 9.8 47 18.2 14.6 68 26.2 24.8 35 13.5 12.41984 .......................... 142 55.2 49.8 32 12.5 12.1 40 15.7 12.4 69 27.0 25.4 38 14.8 14.01983 .......................... 160 62.7 56.7 39 15.3 15.2 49 19.0 14.7 72 28.4 26.8 43 16.9 16.31982 .......................... 148 58.6 52.1 32 12.7 12.0 50 19.6 15.8 67 26.3 24.3 39 15.4 14.21981 .......................... 159 63.2 57.8 40 15.9 15.9 45 17.9 14.0 74 29.4 27.9 48 19.1 19.11980 .......................... 154 61.8 55.6 29 11.6 11.0 48 19.3 16.0 77 30.8 28.7 37 14.8 14.41979 .......................... 146 59.3 54.1 24 9.7 9.6 44 18.0 14.2 78 31.5 30.4 27 11.0 10.5
All races, female1992 .......................... 75 25.7 14.8 12 4.1 3.7 38 13.0 5.2 25 8.6 5.8 22 7.6 5.21991 .......................... 81 27.9 16.9 13 4.5 3.6 41 14.1 5.9 27 9.2 7.4 23 7.9 5.81990 .......................... 80 27.8 17.1 12 4.2 3.2 43 15.1 7.0 25 8.6 6.9 22 7.6 5.71989 .......................... 78 27.4 17.5 7 2.5 2.5 39 13.8 6.3 32 11.1 8.7 17 6.0 4.91988 .......................... 86 30.6 19.7 7 2.5 1.8 43 15.2 6.7 36 12.9 11.3 24 8.5 5.21987 .......................... 86 31.1 21.8 23 8.3 8.0 33 11.8 5.0 30 11.0 8.8 26 9.4 8.51986 .......................... 77 28.1 18.0 8 2.9 2.3 41 15.1 7.0 28 10.1 8.7 23 8.4 5.5
- 148 -

Table 1. Number of deaths and unadjusted and age-adjusted death rates per 100,000 population for different categories of alcohol-related mortality byState: United States, 1979–92.
Vermont
Race, sex,and year
All Alcohol-Related Causes of DeathAll Chronic Liver Disease and
CirrhosisTotal Causes of Death with ExplicitMention of Alcohol
Other Alcohol-Related Diseases Other Alcohol-Related Injuries orAdverse Effects
Number Unadj.Rate
Age-Adj.Rate Number Unadj.
RateAge-Adj.
Rate Number Unadj.Rate
Age-Adj.Rate Number Unadj.
RateAge-Adj.
Rate Number Unadj.Rate
Age-Adj.Rate
All races, female
1985 .......................... 76 28.1 18.1 6 2.2 1.9 42 15.6 7.7 28 10.3 8.5 24 8.8 5.91984 .......................... 70 26.1 16.8 9 3.3 3.0 37 13.6 6.0 25 9.2 7.7 17 6.3 4.71983 .......................... 70 26.1 16.7 8 3.0 2.7 37 13.7 6.6 25 9.4 7.4 17 6.3 5.41982 .......................... 89 33.5 22.2 15 5.6 4.6 45 17.0 8.8 29 10.9 8.8 29 10.9 7.91981 .......................... 68 25.9 19.1 14 5.3 5.4 35 13.2 6.8 20 7.4 6.9 23 8.7 7.21980 .......................... 75 28.5 19.1 6 2.3 2.4 36 13.7 6.9 33 12.5 9.8 17 6.5 5.61979 .......................... 87 33.6 25.4 13 5.0 4.3 35 13.4 7.3 39 15.2 13.8 26 10.0 7.6
White, male1992 .......................... 146 52.8 46.2 25 9.0 8.1 58 20.9 16.1 63 22.8 22.0 31 11.2 9.41991 .......................... 131 47.6 42.4 26 9.5 8.3 42 15.4 11.7 62 22.7 22.3 23 8.4 7.01990 .......................... 146 53.6 46.4 42 15.4 13.8 42 15.4 11.4 62 22.8 21.2 36 13.2 12.01989 .......................... 162 60.2 52.8 38 14.1 13.0 51 18.8 14.7 74 27.3 25.0 36 13.4 12.91988 .......................... 144 54.4 47.7 33 12.4 11.7 45 16.8 12.6 67 25.1 23.4 39 14.7 12.91987 .......................... 141 54.2 47.8 27 10.3 9.4 47 17.9 14.1 68 25.9 24.3 32 12.3 11.01986 .......................... 141 54.8 49.3 29 11.2 11.1 48 18.4 14.3 65 25.1 23.8 32 12.4 12.3
1985 .......................... 140 54.8 49.4 26 10.2 9.8 47 18.3 14.7 67 26.3 24.9 35 13.7 12.51984 .......................... 142 55.7 50.2 32 12.6 12.1 40 15.8 12.5 69 27.3 25.6 38 14.9 14.11983 .......................... 160 63.3 57.1 39 15.4 15.3 49 19.2 14.7 72 28.6 27.1 43 17.0 16.41982 .......................... 147 58.8 52.1 32 12.8 12.0 50 19.8 15.9 66 26.3 24.3 39 15.6 14.31981 .......................... 158 63.4 57.8 40 16.1 15.9 45 18.0 14.1 73 29.3 27.8 48 19.3 19.11980 .......................... 154 62.2 55.9 29 11.7 11.0 48 19.5 16.0 77 31.1 28.9 37 14.9 14.41979 .......................... 146 59.7 54.4 24 9.8 9.6 44 18.1 14.3 78 31.7 30.6 27 11.0 10.6
Black, male1992 .......................... 0 0.0 0.0 0 0.0 0.0 0 0.0 0.0 0 0.0 0.0 0 0.0 0.01991 .......................... - 17.9 80.3 0 0.0 0.0 - 17.9 80.3 0 0.0 0.0 0 0.0 0.01990 .......................... 1 81.3 69.5 0 0.0 0.0 - 44.2 39.8 - 37.1 29.7 1 88.3 79.61989 .......................... - 41.7 33.7 0 0.0 0.0 0 0.0 0.0 - 41.7 33.7 0 0.0 0.01988 .......................... 0 0.0 0.0 0 0.0 0.0 0 0.0 0.0 0 0.0 0.0 0 0.0 0.01987 .......................... 1 100.2 94.7 1 100.2 94.7 0 0.0 0.0 0 0.0 0.0 0 0.0 0.01986 .......................... - 44.0 39.7 0 0.0 0.0 0 0.0 0.0 - 44.0 39.7 0 0.0 0.0
1985 .......................... 0 0.0 0.0 0 0.0 0.0 0 0.0 0.0 0 0.0 0.0 0 0.0 0.01984 .......................... 0 0.0 0.0 0 0.0 0.0 0 0.0 0.0 0 0.0 0.0 0 0.0 0.01983 .......................... 0 0.0 0.0 0 0.0 0.0 0 0.0 0.0 0 0.0 0.0 0 0.0 0.01982 .......................... - 37.0 39.8 0 0.0 0.0 0 0.0 0.0 - 37.0 39.8 0 0.0 0.0
- 149 -
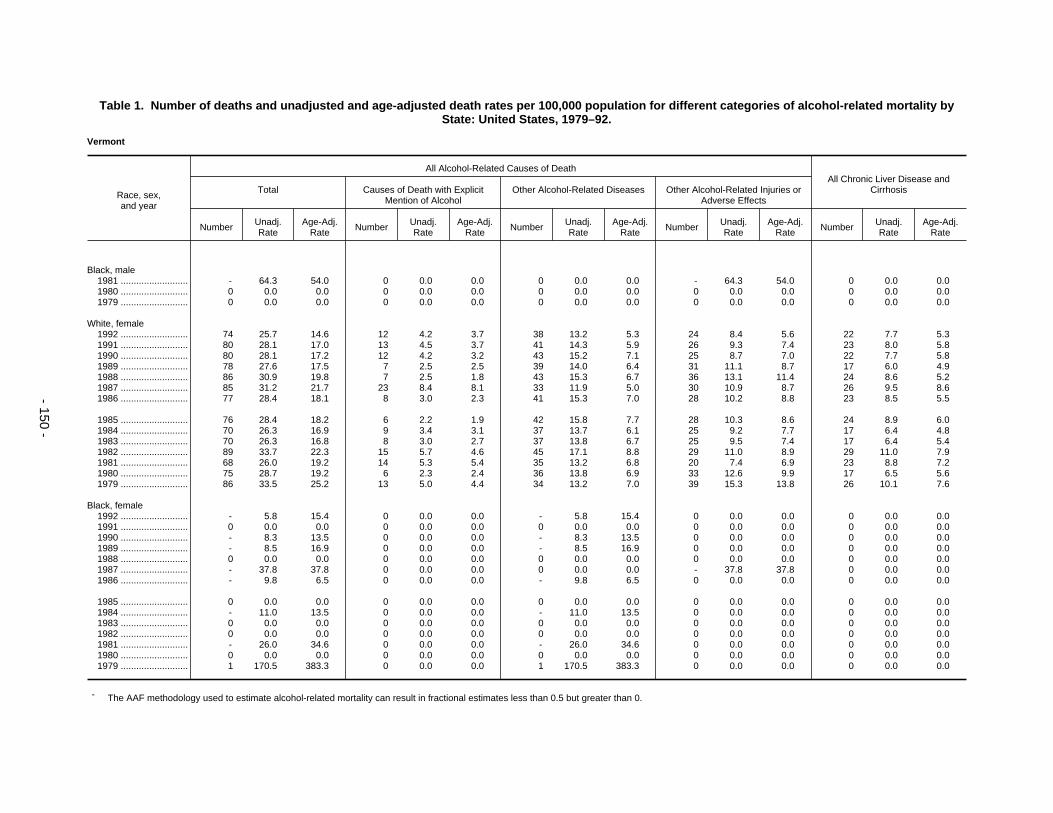
Table 1. Number of deaths and unadjusted and age-adjusted death rates per 100,000 population for different categories of alcohol-related mortality byState: United States, 1979–92.
Vermont
Race, sex,and year
All Alcohol-Related Causes of DeathAll Chronic Liver Disease and
CirrhosisTotal Causes of Death with ExplicitMention of Alcohol
Other Alcohol-Related Diseases Other Alcohol-Related Injuries orAdverse Effects
Number Unadj.Rate
Age-Adj.Rate Number Unadj.
RateAge-Adj.
Rate Number Unadj.Rate
Age-Adj.Rate Number Unadj.
RateAge-Adj.
Rate Number Unadj.Rate
Age-Adj.Rate
Black, male1981 .......................... - 64.3 54.0 0 0.0 0.0 0 0.0 0.0 - 64.3 54.0 0 0.0 0.01980 .......................... 0 0.0 0.0 0 0.0 0.0 0 0.0 0.0 0 0.0 0.0 0 0.0 0.01979 .......................... 0 0.0 0.0 0 0.0 0.0 0 0.0 0.0 0 0.0 0.0 0 0.0 0.0
White, female1992 .......................... 74 25.7 14.6 12 4.2 3.7 38 13.2 5.3 24 8.4 5.6 22 7.7 5.31991 .......................... 80 28.1 17.0 13 4.5 3.7 41 14.3 5.9 26 9.3 7.4 23 8.0 5.81990 .......................... 80 28.1 17.2 12 4.2 3.2 43 15.2 7.1 25 8.7 7.0 22 7.7 5.81989 .......................... 78 27.6 17.5 7 2.5 2.5 39 14.0 6.4 31 11.1 8.7 17 6.0 4.91988 .......................... 86 30.9 19.8 7 2.5 1.8 43 15.3 6.7 36 13.1 11.4 24 8.6 5.21987 .......................... 85 31.2 21.7 23 8.4 8.1 33 11.9 5.0 30 10.9 8.7 26 9.5 8.61986 .......................... 77 28.4 18.1 8 3.0 2.3 41 15.3 7.0 28 10.2 8.8 23 8.5 5.5
1985 .......................... 76 28.4 18.2 6 2.2 1.9 42 15.8 7.7 28 10.3 8.6 24 8.9 6.01984 .......................... 70 26.3 16.9 9 3.4 3.1 37 13.7 6.1 25 9.2 7.7 17 6.4 4.81983 .......................... 70 26.3 16.8 8 3.0 2.7 37 13.8 6.7 25 9.5 7.4 17 6.4 5.41982 .......................... 89 33.7 22.3 15 5.7 4.6 45 17.1 8.8 29 11.0 8.9 29 11.0 7.91981 .......................... 68 26.0 19.2 14 5.3 5.4 35 13.2 6.8 20 7.4 6.9 23 8.8 7.21980 .......................... 75 28.7 19.2 6 2.3 2.4 36 13.8 6.9 33 12.6 9.9 17 6.5 5.61979 .......................... 86 33.5 25.2 13 5.0 4.4 34 13.2 7.0 39 15.3 13.8 26 10.1 7.6
Black, female1992 .......................... - 5.8 15.4 0 0.0 0.0 - 5.8 15.4 0 0.0 0.0 0 0.0 0.01991 .......................... 0 0.0 0.0 0 0.0 0.0 0 0.0 0.0 0 0.0 0.0 0 0.0 0.01990 .......................... - 8.3 13.5 0 0.0 0.0 - 8.3 13.5 0 0.0 0.0 0 0.0 0.01989 .......................... - 8.5 16.9 0 0.0 0.0 - 8.5 16.9 0 0.0 0.0 0 0.0 0.01988 .......................... 0 0.0 0.0 0 0.0 0.0 0 0.0 0.0 0 0.0 0.0 0 0.0 0.01987 .......................... - 37.8 37.8 0 0.0 0.0 0 0.0 0.0 - 37.8 37.8 0 0.0 0.01986 .......................... - 9.8 6.5 0 0.0 0.0 - 9.8 6.5 0 0.0 0.0 0 0.0 0.0
1985 .......................... 0 0.0 0.0 0 0.0 0.0 0 0.0 0.0 0 0.0 0.0 0 0.0 0.01984 .......................... - 11.0 13.5 0 0.0 0.0 - 11.0 13.5 0 0.0 0.0 0 0.0 0.01983 .......................... 0 0.0 0.0 0 0.0 0.0 0 0.0 0.0 0 0.0 0.0 0 0.0 0.01982 .......................... 0 0.0 0.0 0 0.0 0.0 0 0.0 0.0 0 0.0 0.0 0 0.0 0.01981 .......................... - 26.0 34.6 0 0.0 0.0 - 26.0 34.6 0 0.0 0.0 0 0.0 0.01980 .......................... 0 0.0 0.0 0 0.0 0.0 0 0.0 0.0 0 0.0 0.0 0 0.0 0.01979 .......................... 1 170.5 383.3 0 0.0 0.0 1 170.5 383.3 0 0.0 0.0 0 0.0 0.0
- The AAF methodology used to estimate alcohol-related mortality can result in fractional estimates less than 0.5 but greater than 0.
- 150 -
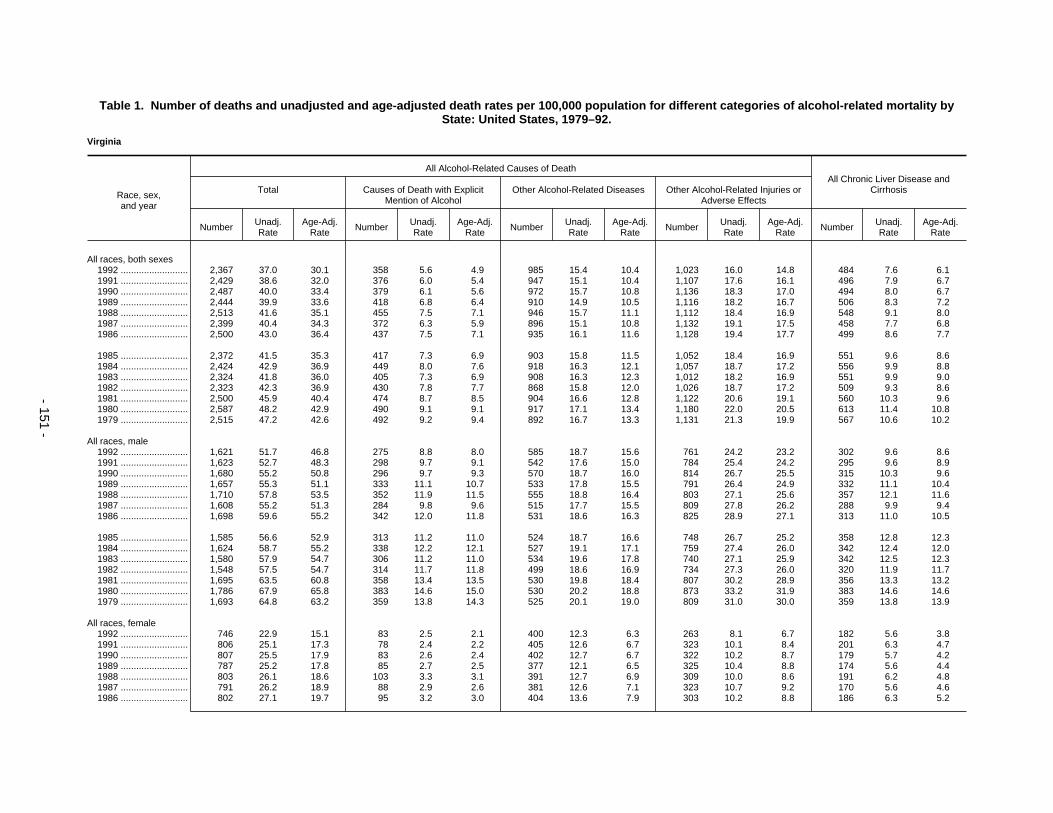
Table 1. Number of deaths and unadjusted and age-adjusted death rates per 100,000 population for different categories of alcohol-related mortality byState: United States, 1979–92.
Virginia
Race, sex,and year
All Alcohol-Related Causes of DeathAll Chronic Liver Disease and
CirrhosisTotal Causes of Death with ExplicitMention of Alcohol
Other Alcohol-Related Diseases Other Alcohol-Related Injuries orAdverse Effects
Number Unadj.Rate
Age-Adj.Rate Number Unadj.
RateAge-Adj.
Rate Number Unadj.Rate
Age-Adj.Rate Number Unadj.
RateAge-Adj.
Rate Number Unadj.Rate
Age-Adj.Rate
All races, both sexes1992 .......................... 2,367 37.0 30.1 358 5.6 4.9 985 15.4 10.4 1,023 16.0 14.8 484 7.6 6.11991 .......................... 2,429 38.6 32.0 376 6.0 5.4 947 15.1 10.4 1,107 17.6 16.1 496 7.9 6.71990 .......................... 2,487 40.0 33.4 379 6.1 5.6 972 15.7 10.8 1,136 18.3 17.0 494 8.0 6.71989 .......................... 2,444 39.9 33.6 418 6.8 6.4 910 14.9 10.5 1,116 18.2 16.7 506 8.3 7.21988 .......................... 2,513 41.6 35.1 455 7.5 7.1 946 15.7 11.1 1,112 18.4 16.9 548 9.1 8.01987 .......................... 2,399 40.4 34.3 372 6.3 5.9 896 15.1 10.8 1,132 19.1 17.5 458 7.7 6.81986 .......................... 2,500 43.0 36.4 437 7.5 7.1 935 16.1 11.6 1,128 19.4 17.7 499 8.6 7.7
1985 .......................... 2,372 41.5 35.3 417 7.3 6.9 903 15.8 11.5 1,052 18.4 16.9 551 9.6 8.61984 .......................... 2,424 42.9 36.9 449 8.0 7.6 918 16.3 12.1 1,057 18.7 17.2 556 9.9 8.81983 .......................... 2,324 41.8 36.0 405 7.3 6.9 908 16.3 12.3 1,012 18.2 16.9 551 9.9 9.01982 .......................... 2,323 42.3 36.9 430 7.8 7.7 868 15.8 12.0 1,026 18.7 17.2 509 9.3 8.61981 .......................... 2,500 45.9 40.4 474 8.7 8.5 904 16.6 12.8 1,122 20.6 19.1 560 10.3 9.61980 .......................... 2,587 48.2 42.9 490 9.1 9.1 917 17.1 13.4 1,180 22.0 20.5 613 11.4 10.81979 .......................... 2,515 47.2 42.6 492 9.2 9.4 892 16.7 13.3 1,131 21.3 19.9 567 10.6 10.2
All races, male1992 .......................... 1,621 51.7 46.8 275 8.8 8.0 585 18.7 15.6 761 24.2 23.2 302 9.6 8.61991 .......................... 1,623 52.7 48.3 298 9.7 9.1 542 17.6 15.0 784 25.4 24.2 295 9.6 8.91990 .......................... 1,680 55.2 50.8 296 9.7 9.3 570 18.7 16.0 814 26.7 25.5 315 10.3 9.61989 .......................... 1,657 55.3 51.1 333 11.1 10.7 533 17.8 15.5 791 26.4 24.9 332 11.1 10.41988 .......................... 1,710 57.8 53.5 352 11.9 11.5 555 18.8 16.4 803 27.1 25.6 357 12.1 11.61987 .......................... 1,608 55.2 51.3 284 9.8 9.6 515 17.7 15.5 809 27.8 26.2 288 9.9 9.41986 .......................... 1,698 59.6 55.2 342 12.0 11.8 531 18.6 16.3 825 28.9 27.1 313 11.0 10.5
1985 .......................... 1,585 56.6 52.9 313 11.2 11.0 524 18.7 16.6 748 26.7 25.2 358 12.8 12.31984 .......................... 1,624 58.7 55.2 338 12.2 12.1 527 19.1 17.1 759 27.4 26.0 342 12.4 12.01983 .......................... 1,580 57.9 54.7 306 11.2 11.0 534 19.6 17.8 740 27.1 25.9 342 12.5 12.31982 .......................... 1,548 57.5 54.7 314 11.7 11.8 499 18.6 16.9 734 27.3 26.0 320 11.9 11.71981 .......................... 1,695 63.5 60.8 358 13.4 13.5 530 19.8 18.4 807 30.2 28.9 356 13.3 13.21980 .......................... 1,786 67.9 65.8 383 14.6 15.0 530 20.2 18.8 873 33.2 31.9 383 14.6 14.61979 .......................... 1,693 64.8 63.2 359 13.8 14.3 525 20.1 19.0 809 31.0 30.0 359 13.8 13.9
All races, female1992 .......................... 746 22.9 15.1 83 2.5 2.1 400 12.3 6.3 263 8.1 6.7 182 5.6 3.81991 .......................... 806 25.1 17.3 78 2.4 2.2 405 12.6 6.7 323 10.1 8.4 201 6.3 4.71990 .......................... 807 25.5 17.9 83 2.6 2.4 402 12.7 6.7 322 10.2 8.7 179 5.7 4.21989 .......................... 787 25.2 17.8 85 2.7 2.5 377 12.1 6.5 325 10.4 8.8 174 5.6 4.41988 .......................... 803 26.1 18.6 103 3.3 3.1 391 12.7 6.9 309 10.0 8.6 191 6.2 4.81987 .......................... 791 26.2 18.9 88 2.9 2.6 381 12.6 7.1 323 10.7 9.2 170 5.6 4.61986 .......................... 802 27.1 19.7 95 3.2 3.0 404 13.6 7.9 303 10.2 8.8 186 6.3 5.2
- 151 -

Table 1. Number of deaths and unadjusted and age-adjusted death rates per 100,000 population for different categories of alcohol-related mortality byState: United States, 1979–92.
Virginia
Race, sex,and year
All Alcohol-Related Causes of DeathAll Chronic Liver Disease and
CirrhosisTotal Causes of Death with ExplicitMention of Alcohol
Other Alcohol-Related Diseases Other Alcohol-Related Injuries orAdverse Effects
Number Unadj.Rate
Age-Adj.Rate Number Unadj.
RateAge-Adj.
Rate Number Unadj.Rate
Age-Adj.Rate Number Unadj.
RateAge-Adj.
Rate Number Unadj.Rate
Age-Adj.Rate
All races, female
1985 .......................... 787 27.0 19.7 104 3.6 3.3 379 13.0 7.4 304 10.4 9.0 193 6.6 5.31984 .......................... 800 27.8 20.4 111 3.9 3.5 391 13.6 8.1 298 10.4 8.8 214 7.4 6.01983 .......................... 744 26.2 19.3 99 3.5 3.2 374 13.2 7.8 271 9.6 8.3 209 7.4 6.11982 .......................... 776 27.7 21.0 116 4.1 3.9 368 13.2 8.1 291 10.4 9.0 189 6.7 5.91981 .......................... 805 29.0 22.2 116 4.2 4.1 375 13.5 8.4 315 11.3 9.7 204 7.4 6.51980 .......................... 800 29.2 22.4 107 3.9 3.8 387 14.1 9.0 306 11.2 9.7 230 8.4 7.41979 .......................... 822 30.3 24.1 133 4.9 4.9 367 13.5 8.8 322 11.9 10.4 208 7.7 7.0
White, male1992 .......................... 1,129 46.0 39.7 192 7.8 6.8 427 17.4 13.5 510 20.8 19.4 240 9.8 8.31991 .......................... 1,102 45.5 40.0 195 8.1 7.3 379 15.7 12.4 528 21.8 20.3 228 9.4 8.31990 .......................... 1,168 48.7 43.1 190 7.9 7.2 414 17.2 13.8 564 23.5 22.2 243 10.1 8.81989 .......................... 1,133 47.9 42.5 213 9.0 8.3 385 16.3 13.2 535 22.6 21.0 257 10.9 9.71988 .......................... 1,190 50.9 45.6 241 10.3 9.5 389 16.6 13.7 560 23.9 22.4 288 12.3 11.31987 .......................... 1,129 49.0 44.1 175 7.6 7.2 368 16.0 13.3 586 25.4 23.7 219 9.5 8.71986 .......................... 1,175 52.0 46.7 220 9.7 9.1 370 16.4 13.5 586 25.9 24.1 250 11.1 10.2
1985 .......................... 1,098 49.4 44.7 208 9.4 8.9 367 16.5 13.9 524 23.6 21.9 293 13.2 12.11984 .......................... 1,152 52.4 47.9 234 10.6 10.2 362 16.4 14.1 556 25.3 23.7 262 11.9 11.11983 .......................... 1,117 51.5 47.1 207 9.5 9.0 382 17.6 15.3 528 24.3 22.8 277 12.8 12.01982 .......................... 1,098 51.2 47.3 205 9.6 9.3 354 16.5 14.4 539 25.1 23.7 259 12.1 11.41981 .......................... 1,202 56.4 52.6 231 10.8 10.5 380 17.8 16.0 591 27.7 26.2 291 13.7 13.11980 .......................... 1,258 59.8 56.3 243 11.6 11.5 379 18.0 16.3 636 30.2 28.6 310 14.7 14.31979 .......................... 1,196 57.0 54.1 231 11.0 11.0 369 17.6 16.1 596 28.4 27.0 298 14.2 13.9
Black, male1992 .......................... 477 81.5 84.8 83 14.2 15.6 152 25.9 27.9 242 41.4 41.4 59 10.1 11.01991 .......................... 508 89.2 94.0 102 17.9 20.0 157 27.6 30.2 249 43.7 43.7 66 11.6 12.81990 .......................... 499 88.9 93.2 106 18.9 22.1 152 27.1 29.2 240 42.8 41.9 70 12.5 14.51989 .......................... 507 91.9 97.7 120 21.8 25.5 143 25.9 28.1 244 44.2 44.1 74 13.4 15.51988 .......................... 510 93.9 98.8 110 20.2 24.1 163 29.9 31.6 238 43.7 43.1 66 12.1 14.01987 .......................... 467 87.4 91.5 109 20.4 23.7 143 26.7 27.9 215 40.3 39.9 68 12.7 14.41986 .......................... 513 98.0 102.8 122 23.3 27.2 158 30.1 31.7 233 44.5 43.9 61 11.7 13.0
1985 .......................... 473 91.8 97.3 105 20.4 23.7 153 29.6 31.0 216 41.9 42.6 64 12.4 14.41984 .......................... 464 90.7 95.4 104 20.3 23.5 162 31.8 33.4 197 38.6 38.5 76 14.9 17.21983 .......................... 456 90.4 96.2 99 19.6 22.8 150 29.7 31.2 207 41.1 42.2 64 12.7 14.81982 .......................... 439 88.2 95.0 108 21.7 26.0 143 28.7 30.2 188 37.8 38.8 60 12.1 13.91981 .......................... 487 98.5 107.1 127 25.7 30.6 148 29.9 31.0 213 43.0 45.5 65 13.1 15.0
- 152 -

Table 1. Number of deaths and unadjusted and age-adjusted death rates per 100,000 population for different categories of alcohol-related mortality byState: United States, 1979–92.
Virginia
Race, sex,and year
All Alcohol-Related Causes of DeathAll Chronic Liver Disease and
CirrhosisTotal Causes of Death with ExplicitMention of Alcohol
Other Alcohol-Related Diseases Other Alcohol-Related Injuries orAdverse Effects
Number Unadj.Rate
Age-Adj.Rate Number Unadj.
RateAge-Adj.
Rate Number Unadj.Rate
Age-Adj.Rate Number Unadj.
RateAge-Adj.
Rate Number Unadj.Rate
Age-Adj.Rate
Black, male1980 .......................... 521 107.1 116.8 139 28.6 34.4 149 30.5 32.1 234 48.0 50.3 72 14.8 17.11979 .......................... 493 102.8 113.7 128 26.7 32.7 155 32.3 34.0 210 43.7 47.0 61 12.7 14.8
White, female1992 .......................... 562 22.3 13.5 58 2.3 1.9 311 12.4 5.6 192 7.7 6.0 147 5.8 3.61991 .......................... 611 24.6 15.6 54 2.2 1.9 312 12.5 5.9 245 9.9 7.8 155 6.2 4.31990 .......................... 597 24.2 15.8 50 2.0 1.8 301 12.2 5.7 246 10.0 8.4 125 5.1 3.51989 .......................... 572 23.5 15.4 42 1.7 1.5 289 11.9 5.8 241 9.9 8.1 131 5.4 3.91988 .......................... 591 24.6 16.1 61 2.5 2.2 301 12.5 6.0 229 9.5 7.9 142 5.9 4.31987 .......................... 602 25.5 17.3 56 2.4 2.1 294 12.4 6.2 252 10.6 9.0 133 5.6 4.21986 .......................... 603 26.0 17.7 60 2.6 2.2 306 13.2 6.9 237 10.2 8.6 142 6.1 4.6
1985 .......................... 590 25.8 17.6 56 2.4 2.1 294 12.8 6.6 241 10.5 8.9 141 6.2 4.61984 .......................... 615 27.2 18.7 78 3.4 2.9 306 13.6 7.4 230 10.2 8.4 174 7.7 5.81983 .......................... 556 24.9 17.3 60 2.7 2.3 285 12.8 6.9 211 9.4 8.1 163 7.3 5.71982 .......................... 588 26.6 18.9 75 3.4 3.0 282 12.7 7.1 232 10.5 8.8 143 6.5 5.21981 .......................... 610 27.8 20.1 75 3.4 3.2 282 12.8 7.1 254 11.6 9.7 150 6.8 5.71980 .......................... 590 27.2 19.5 63 2.9 2.6 287 13.2 7.7 240 11.0 9.2 168 7.7 6.31979 .......................... 620 28.7 21.4 87 4.0 3.9 277 12.8 7.5 256 11.9 10.0 155 7.2 6.3
Black, female1992 .......................... 176 27.7 23.4 25 3.9 3.6 85 13.3 10.0 66 10.4 9.8 34 5.3 5.11991 .......................... 186 29.9 26.0 24 3.9 4.2 90 14.4 10.9 72 11.6 11.0 45 7.2 7.21990 .......................... 202 33.1 28.5 33 5.4 5.7 98 16.0 11.9 72 11.7 10.8 52 8.5 7.81989 .......................... 206 34.2 29.8 43 7.2 7.5 84 14.0 10.2 79 13.1 12.0 41 6.8 7.11988 .......................... 205 34.6 30.8 42 7.1 7.6 88 14.9 11.4 75 12.6 11.8 48 8.1 7.51987 .......................... 183 31.5 27.9 32 5.5 5.7 85 14.6 11.5 66 11.3 10.7 37 6.4 6.61986 .......................... 191 33.6 30.4 35 6.2 7.2 95 16.6 13.0 61 10.8 10.2 42 7.4 8.2
1985 .......................... 190 33.9 30.9 47 8.4 9.0 83 14.9 11.8 60 10.7 10.2 51 9.1 9.41984 .......................... 179 32.3 29.1 33 6.0 6.5 83 14.9 11.9 64 11.5 10.8 38 6.9 6.91983 .......................... 183 33.4 29.5 39 7.1 7.4 87 15.9 12.5 57 10.4 9.6 45 8.2 8.21982 .......................... 180 33.3 31.5 41 7.6 8.6 84 15.7 13.2 54 10.1 9.7 46 8.5 9.31981 .......................... 190 35.5 32.8 41 7.7 8.6 92 17.2 14.5 57 10.6 9.7 54 10.1 10.71980 .......................... 206 39.1 36.9 44 8.4 9.4 98 18.6 15.6 64 12.1 11.8 61 11.6 12.91979 .......................... 200 38.5 37.6 46 8.9 10.4 89 17.2 15.0 64 12.4 12.2 53 10.2 11.1
- 153 -

Table 1. Number of deaths and unadjusted and age-adjusted death rates per 100,000 population for different categories of alcohol-related mortality byState: United States, 1979–92.
Washington
Race, sex,and year
All Alcohol-Related Causes of DeathAll Chronic Liver Disease and
CirrhosisTotal Causes of Death with ExplicitMention of Alcohol
Other Alcohol-Related Diseases Other Alcohol-Related Injuries orAdverse Effects
Number Unadj.Rate
Age-Adj.Rate Number Unadj.
RateAge-Adj.
Rate Number Unadj.Rate
Age-Adj.Rate Number Unadj.
RateAge-Adj.
Rate Number Unadj.Rate
Age-Adj.Rate
All races, both sexes1992 .......................... 1,914 37.2 29.7 373 7.3 6.5 716 13.9 8.5 825 16.0 14.7 458 8.9 7.51991 .......................... 1,870 37.3 29.7 323 6.4 5.6 742 14.8 9.1 805 16.1 15.0 410 8.2 6.81990 .......................... 1,938 39.5 31.9 333 6.8 5.9 721 14.7 9.1 884 18.0 16.9 416 8.5 7.11989 .......................... 1,880 39.6 31.7 318 6.7 6.0 724 15.2 9.5 838 17.7 16.3 459 9.7 8.31988 .......................... 1,852 39.9 32.3 320 6.9 6.2 669 14.4 8.8 863 18.6 17.2 455 9.8 8.41987 .......................... 1,815 40.0 32.8 298 6.6 5.9 663 14.6 9.4 854 18.8 17.4 409 9.0 7.71986 .......................... 1,728 38.8 31.6 283 6.4 5.8 642 14.4 9.2 803 18.0 16.6 417 9.4 8.2
1985 .......................... 1,753 39.8 32.5 291 6.6 6.0 670 15.2 9.8 792 18.0 16.7 444 10.1 8.81984 .......................... 1,732 39.9 32.8 313 7.2 6.5 642 14.8 9.7 777 17.9 16.6 441 10.2 9.01983 .......................... 1,750 40.7 33.8 321 7.5 6.9 650 15.1 10.1 779 18.1 16.9 454 10.6 9.21982 .......................... 1,753 41.0 34.3 321 7.5 7.0 629 14.7 9.8 803 18.8 17.4 467 10.9 9.81981 .......................... 1,906 45.0 38.4 395 9.3 8.8 631 14.9 10.3 879 20.8 19.3 484 11.4 10.51980 .......................... 1,952 47.0 40.4 387 9.3 9.0 634 15.3 10.5 931 22.4 20.9 485 11.7 10.91979 .......................... 1,887 47.0 40.2 350 8.7 8.4 625 15.6 10.6 911 22.7 21.2 473 11.8 10.8
All races, male1992 .......................... 1,243 48.7 42.7 270 10.6 9.7 393 15.4 11.4 580 22.7 21.7 295 11.6 10.11991 .......................... 1,215 48.9 43.0 234 9.4 8.4 411 16.5 12.4 571 22.9 22.1 270 10.9 9.71990 .......................... 1,279 52.6 46.6 229 9.4 8.7 409 16.8 12.7 640 26.4 25.3 265 10.9 9.71989 .......................... 1,201 51.0 44.9 229 9.7 8.9 397 16.9 12.8 575 24.4 23.1 285 12.1 11.01988 .......................... 1,199 52.1 46.0 225 9.8 9.0 350 15.2 11.4 624 27.1 25.6 282 12.2 11.01987 .......................... 1,169 52.0 46.7 217 9.6 8.9 350 15.6 12.2 603 26.8 25.6 254 11.3 10.21986 .......................... 1,093 49.5 44.1 186 8.4 7.9 352 15.9 12.4 555 25.1 23.8 255 11.5 10.7
1985 .......................... 1,137 52.1 46.4 217 9.9 9.3 365 16.7 13.0 555 25.4 24.2 282 12.9 11.71984 .......................... 1,105 51.2 46.3 214 9.9 9.3 352 16.3 13.0 539 25.0 24.0 268 12.4 11.51983 .......................... 1,145 53.6 48.4 224 10.5 10.0 362 16.9 13.5 560 26.2 24.9 262 12.3 11.11982 .......................... 1,123 52.9 48.0 224 10.5 10.2 341 16.0 13.0 558 26.3 24.9 288 13.6 12.71981 .......................... 1,225 58.2 53.8 263 12.5 12.1 342 16.2 13.6 620 29.5 28.1 287 13.6 13.21980 .......................... 1,277 61.9 57.2 275 13.3 13.0 343 16.6 13.7 659 31.9 30.5 302 14.6 14.11979 .......................... 1,252 62.8 57.6 255 12.8 12.5 347 17.4 14.2 650 32.6 31.0 298 15.0 14.2
All races, female1992 .......................... 671 25.9 17.6 103 4.0 3.7 323 12.5 6.0 245 9.5 7.9 163 6.3 5.11991 .......................... 655 25.9 17.3 89 3.5 3.0 331 13.1 6.3 235 9.3 7.9 140 5.5 4.21990 .......................... 659 26.7 17.9 104 4.2 3.4 312 12.6 6.0 243 9.8 8.5 151 6.1 4.71989 .......................... 679 28.4 19.5 89 3.7 3.2 326 13.6 6.7 264 11.0 9.6 174 7.3 5.81988 .......................... 653 27.9 19.3 95 4.1 3.6 318 13.6 6.7 239 10.2 8.9 173 7.4 6.21987 .......................... 645 28.3 19.5 81 3.5 3.2 313 13.7 6.9 251 11.0 9.4 155 6.8 5.41986 .......................... 635 28.3 19.8 97 4.3 3.9 290 12.9 6.4 248 11.1 9.5 162 7.2 5.8
- 154 -

Table 1. Number of deaths and unadjusted and age-adjusted death rates per 100,000 population for different categories of alcohol-related mortality byState: United States, 1979–92.
Washington
Race, sex,and year
All Alcohol-Related Causes of DeathAll Chronic Liver Disease and
CirrhosisTotal Causes of Death with ExplicitMention of Alcohol
Other Alcohol-Related Diseases Other Alcohol-Related Injuries orAdverse Effects
Number Unadj.Rate
Age-Adj.Rate Number Unadj.
RateAge-Adj.
Rate Number Unadj.Rate
Age-Adj.Rate Number Unadj.
RateAge-Adj.
Rate Number Unadj.Rate
Age-Adj.Rate
All races, female
1985 .......................... 616 27.8 19.5 74 3.3 3.1 305 13.8 7.2 237 10.7 9.3 162 7.3 6.21984 .......................... 627 28.7 20.1 99 4.5 3.9 290 13.3 6.9 238 10.9 9.2 173 7.9 6.61983 .......................... 605 28.0 20.2 97 4.5 4.1 289 13.3 7.3 219 10.1 8.8 192 8.9 7.71982 .......................... 630 29.2 21.4 97 4.5 4.2 288 13.4 7.2 245 11.4 10.1 179 8.3 7.21981 .......................... 681 32.0 23.9 132 6.2 5.8 289 13.6 7.4 259 12.2 10.7 197 9.2 8.01980 .......................... 674 32.2 24.6 112 5.4 5.3 291 13.9 7.9 271 13.0 11.4 183 8.8 7.91979 .......................... 635 31.4 23.9 95 4.7 4.6 279 13.8 7.7 261 12.9 11.6 175 8.7 7.8
White, male1992 .......................... 1,120 48.6 41.3 244 10.6 9.4 369 16.0 11.2 507 22.0 20.7 277 12.0 10.11991 .......................... 1,095 48.7 41.5 211 9.4 8.1 380 16.9 12.1 504 22.4 21.3 245 10.9 9.31990 .......................... 1,161 52.7 45.4 209 9.5 8.4 385 17.5 12.4 568 25.8 24.5 235 10.7 9.11989 .......................... 1,078 50.4 43.1 192 9.0 7.9 373 17.5 12.6 513 24.0 22.6 255 11.9 10.41988 .......................... 1,088 51.9 44.6 208 9.9 8.7 333 15.9 11.3 547 26.1 24.5 260 12.4 10.61987 .......................... 1,071 52.1 45.9 201 9.8 8.8 323 15.7 11.7 547 26.6 25.4 236 11.5 10.11986 .......................... 1,001 49.5 43.2 170 8.4 7.6 330 16.3 12.2 501 24.8 23.4 230 11.4 10.2
1985 .......................... 1,040 51.8 45.1 205 10.2 9.2 340 16.9 12.6 495 24.7 23.3 258 12.9 11.31984 .......................... 1,003 50.5 44.5 190 9.6 8.6 331 16.7 12.7 482 24.2 23.1 245 12.3 11.01983 .......................... 1,051 53.3 47.1 204 10.3 9.6 339 17.2 13.1 508 25.8 24.5 244 12.4 10.81982 .......................... 1,023 52.1 46.2 195 9.9 9.3 325 16.6 12.9 503 25.6 24.1 261 13.3 12.01981 .......................... 1,114 57.1 51.8 237 12.1 11.5 321 16.4 13.3 557 28.5 27.0 258 13.2 12.41980 .......................... 1,172 61.0 55.4 245 12.8 12.1 322 16.8 13.3 604 31.5 30.0 278 14.5 13.61979 .......................... 1,143 61.4 55.3 228 12.3 11.6 327 17.6 13.8 588 31.6 29.8 270 14.5 13.3
Black, male1992 .......................... 50 56.5 65.9 9 10.3 14.5 9 10.4 16.1 31 35.8 35.3 6 6.8 10.01991 .......................... 52 61.3 72.9 5 5.9 7.8 14 16.1 25.2 33 39.3 39.9 5 5.9 6.81990 .......................... 53 64.9 72.0 6 7.3 9.0 11 13.3 20.3 36 44.3 42.7 9 11.0 14.01989 .......................... 50 63.8 77.0 8 10.2 15.2 12 15.8 23.7 30 37.7 38.0 12 15.3 21.51988 .......................... 40 52.3 58.6 4 5.3 8.5 7 9.4 14.2 29 37.7 35.9 7 9.2 15.01987 .......................... 52 72.1 88.3 11 15.2 20.3 15 20.8 32.3 26 36.2 35.8 12 16.5 22.81986 .......................... 40 57.4 68.9 5 7.1 11.3 10 13.8 21.0 26 36.5 36.6 10 14.3 20.2
1985 .......................... 40 58.3 67.9 4 5.9 8.7 11 15.5 23.9 25 37.0 35.4 9 13.2 18.01984 .......................... 43 64.8 81.6 11 16.7 24.4 12 18.8 29.3 19 29.3 27.9 14 21.2 31.51983 .......................... 39 60.4 75.9 8 12.5 16.6 11 17.8 27.6 19 30.2 31.7 4 6.2 8.91982 .......................... 39 62.0 70.1 8 12.7 18.3 5 8.6 13.2 25 40.6 38.6 9 14.3 19.61981 .......................... 49 80.3 99.3 8 13.1 19.2 9 15.5 24.1 31 51.7 56.1 5 8.2 12.0
- 155 -

Table 1. Number of deaths and unadjusted and age-adjusted death rates per 100,000 population for different categories of alcohol-related mortality byState: United States, 1979–92.
Washington
Race, sex,and year
All Alcohol-Related Causes of DeathAll Chronic Liver Disease and
CirrhosisTotal Causes of Death with ExplicitMention of Alcohol
Other Alcohol-Related Diseases Other Alcohol-Related Injuries orAdverse Effects
Number Unadj.Rate
Age-Adj.Rate Number Unadj.
RateAge-Adj.
Rate Number Unadj.Rate
Age-Adj.Rate Number Unadj.
RateAge-Adj.
Rate Number Unadj.Rate
Age-Adj.Rate
Black, male1980 .......................... 50 86.0 107.1 13 22.3 29.7 12 20.0 31.1 26 43.7 46.3 11 18.9 25.41979 .......................... 48 87.8 107.3 11 20.2 27.9 9 16.2 23.9 28 51.4 55.5 13 23.8 32.0
White, female1992 .......................... 612 26.2 16.7 86 3.7 3.2 305 13.1 5.8 221 9.5 7.7 147 6.3 4.91991 .......................... 592 25.9 16.3 72 3.1 2.6 313 13.7 6.2 207 9.1 7.5 120 5.2 3.71990 .......................... 603 26.9 17.2 87 3.9 2.9 297 13.3 5.9 219 9.8 8.4 134 6.0 4.31989 .......................... 625 28.7 18.8 76 3.5 2.9 309 14.2 6.4 240 11.0 9.5 153 7.0 5.31988 .......................... 593 27.8 18.3 80 3.8 3.3 303 14.2 6.6 211 9.9 8.4 156 7.3 5.91987 .......................... 591 28.3 18.6 69 3.3 2.9 294 14.1 6.6 229 10.9 9.1 137 6.6 5.01986 .......................... 590 28.7 19.4 85 4.1 3.6 278 13.5 6.3 227 11.0 9.4 148 7.2 5.6
1985 .......................... 566 27.8 18.7 63 3.1 2.7 286 14.0 6.9 217 10.7 9.1 139 6.8 5.51984 .......................... 583 28.9 19.4 88 4.4 3.6 281 13.9 6.9 214 10.6 8.8 163 8.1 6.51983 .......................... 562 28.1 19.5 87 4.3 3.9 275 13.7 7.1 200 10.0 8.5 175 8.7 7.31982 .......................... 582 29.1 20.5 86 4.3 3.9 275 13.8 7.0 220 11.0 9.6 161 8.1 6.71981 .......................... 622 31.4 22.5 112 5.7 5.1 277 14.0 7.3 232 11.7 10.1 181 9.1 7.71980 .......................... 616 31.6 23.3 93 4.8 4.6 275 14.1 7.6 248 12.7 11.1 159 8.2 7.11979 .......................... 584 30.9 22.6 74 3.9 3.8 270 14.3 7.6 240 12.7 11.2 157 8.3 7.2
Black, female1992 .......................... 19 24.4 25.6 3 3.9 4.5 6 8.3 9.5 9 12.1 11.7 3 3.9 4.81991 .......................... 23 31.9 35.9 8 10.9 14.2 5 7.3 8.5 10 13.6 13.2 7 9.5 12.91990 .......................... 12 17.2 18.6 1 1.4 1.7 5 6.5 8.1 7 9.3 8.8 1 1.4 1.71989 .......................... 13 19.0 21.4 2 2.9 3.2 5 8.0 10.0 6 8.1 8.1 4 5.9 5.61988 .......................... 18 27.2 27.7 1 1.5 2.3 6 8.7 9.1 11 17.0 16.3 3 4.6 6.81987 .......................... 15 24.0 27.8 2 3.2 3.6 7 11.7 14.8 6 9.1 9.4 2 3.2 2.81986 .......................... 17 27.9 27.4 3 5.0 4.9 6 10.1 10.7 8 12.8 11.8 5 8.3 9.2
1985 .......................... 20 34.3 38.1 5 8.6 11.3 7 11.3 12.3 8 14.5 14.5 9 15.4 19.61984 .......................... 12 21.2 22.5 1 1.8 2.2 5 9.3 10.8 6 10.1 9.5 3 5.3 7.71983 .......................... 16 28.5 32.1 1 1.8 2.3 6 11.2 14.8 8 15.4 15.0 3 5.5 7.61982 .......................... 15 28.5 29.1 1 1.9 2.4 5 9.8 12.6 9 16.9 14.2 3 5.6 8.71981 .......................... 18 34.1 36.4 4 7.7 9.2 5 8.8 10.3 9 17.6 16.8 3 5.8 6.61980 .......................... 13 26.4 27.3 2 4.0 4.9 3 6.9 7.8 8 15.5 14.5 2 4.0 4.91979 .......................... 14 29.1 34.6 5 10.8 15.4 4 8.5 10.0 5 9.9 9.1 4 8.6 12.9
- 156 -

Table 1. Number of deaths and unadjusted and age-adjusted death rates per 100,000 population for different categories of alcohol-related mortality byState: United States, 1979–92.
West Virginia
Race, sex,and year
All Alcohol-Related Causes of DeathAll Chronic Liver Disease and
CirrhosisTotal Causes of Death with ExplicitMention of Alcohol
Other Alcohol-Related Diseases Other Alcohol-Related Injuries orAdverse Effects
Number Unadj.Rate
Age-Adj.Rate Number Unadj.
RateAge-Adj.
Rate Number Unadj.Rate
Age-Adj.Rate Number Unadj.
RateAge-Adj.
Rate Number Unadj.Rate
Age-Adj.Rate
All races, both sexes1992 .......................... 878 48.5 36.1 135 7.5 6.2 350 19.3 9.8 393 21.7 20.1 192 10.6 7.31991 .......................... 882 49.0 36.8 132 7.3 6.0 347 19.3 9.9 402 22.4 20.8 169 9.4 6.61990 .......................... 858 47.8 35.7 119 6.6 5.5 350 19.5 10.1 389 21.7 20.1 182 10.2 7.41989 .......................... 894 49.5 37.8 138 7.6 6.4 341 18.9 10.1 415 23.0 21.3 182 10.1 7.31988 .......................... 838 45.8 35.3 105 5.7 4.9 337 18.4 9.9 396 21.7 20.5 166 9.1 7.11987 .......................... 877 47.2 36.9 126 6.8 6.0 333 17.9 9.9 419 22.5 21.0 179 9.6 7.61986 .......................... 863 45.8 35.9 123 6.5 6.0 337 17.9 10.0 403 21.4 19.9 206 10.9 8.6
1985 .......................... 844 44.3 35.0 131 6.9 6.1 329 17.3 10.1 384 20.1 18.8 196 10.3 8.11984 .......................... 841 43.6 34.3 109 5.7 4.9 343 17.8 10.5 389 20.2 18.9 186 9.6 7.71983 .......................... 849 43.6 34.7 116 6.0 5.3 339 17.4 10.6 394 20.2 18.8 200 10.3 8.41982 .......................... 889 45.6 37.1 137 7.0 6.4 338 17.4 10.7 414 21.2 20.1 196 10.1 8.41981 .......................... 918 47.0 38.9 141 7.2 6.6 350 17.9 11.5 428 21.9 20.7 240 12.3 10.61980 .......................... 1,034 52.9 45.0 203 10.4 9.9 339 17.3 11.0 492 25.2 24.1 288 14.7 12.91979 .......................... 990 51.1 43.1 157 8.1 7.8 349 18.0 11.4 484 25.0 23.8 220 11.3 9.9
All races, male1992 .......................... 581 66.7 55.0 115 13.2 11.4 187 21.5 13.2 279 32.0 30.4 122 14.0 10.61991 .......................... 590 68.3 56.9 113 13.1 11.1 190 22.0 14.1 288 33.2 31.8 109 12.6 9.91990 .......................... 574 66.7 55.0 101 11.7 10.1 197 22.8 14.3 277 32.2 30.5 128 14.9 11.71989 .......................... 601 69.2 58.4 121 13.9 12.1 190 21.9 14.4 290 33.4 32.0 116 13.4 10.81988 .......................... 550 62.5 53.2 83 9.4 8.4 184 20.9 13.7 283 32.2 31.1 109 12.4 10.51987 .......................... 601 67.3 58.0 105 11.7 10.6 183 20.5 13.9 313 35.0 33.5 120 13.4 11.51986 .......................... 575 63.4 55.1 101 11.1 10.5 189 20.9 14.4 284 31.4 30.1 136 15.0 13.0
1985 .......................... 578 62.8 54.7 106 11.5 10.6 197 21.4 15.4 275 29.9 28.7 134 14.6 12.81984 .......................... 567 60.9 52.9 96 10.3 9.3 188 20.2 14.3 283 30.5 29.3 119 12.8 11.01983 .......................... 583 62.0 54.2 102 10.9 9.8 196 20.9 15.1 284 30.3 29.3 140 14.9 13.01982 .......................... 622 65.9 58.7 118 12.5 11.8 200 21.2 15.5 304 32.3 31.4 154 16.3 14.41981 .......................... 627 66.2 60.0 122 12.9 12.3 195 20.6 15.7 310 32.7 32.1 163 17.2 16.01980 .......................... 721 76.1 70.2 167 17.6 17.3 190 20.1 15.2 363 38.4 37.7 206 21.8 20.41979 .......................... 668 71.1 64.7 121 12.9 12.7 204 21.7 16.4 343 36.4 35.6 152 16.2 15.3
All races, female1992 .......................... 297 31.6 19.3 20 2.1 1.5 163 17.3 7.2 114 12.2 10.6 70 7.5 4.51991 .......................... 291 31.2 18.8 19 2.0 1.6 157 16.9 6.6 115 12.3 10.7 60 6.4 3.61990 .......................... 283 30.4 18.7 18 1.9 1.5 153 16.5 6.8 112 12.0 10.5 54 5.8 3.71989 .......................... 293 31.2 19.4 17 1.8 1.4 150 16.0 6.8 125 13.4 11.3 66 7.0 4.11988 .......................... 287 30.3 19.3 22 2.3 1.8 152 16.0 6.9 113 11.9 10.6 57 6.0 4.01987 .......................... 276 28.6 17.9 21 2.2 1.9 149 15.5 6.8 105 10.9 9.2 59 6.1 4.21986 .......................... 288 29.5 18.7 22 2.3 1.9 148 15.2 6.5 118 12.1 10.3 70 7.2 4.7
- 157 -

Table 1. Number of deaths and unadjusted and age-adjusted death rates per 100,000 population for different categories of alcohol-related mortality byState: United States, 1979–92.
West Virginia
Race, sex,and year
All Alcohol-Related Causes of DeathAll Chronic Liver Disease and
CirrhosisTotal Causes of Death with ExplicitMention of Alcohol
Other Alcohol-Related Diseases Other Alcohol-Related Injuries orAdverse Effects
Number Unadj.Rate
Age-Adj.Rate Number Unadj.
RateAge-Adj.
Rate Number Unadj.Rate
Age-Adj.Rate Number Unadj.
RateAge-Adj.
Rate Number Unadj.Rate
Age-Adj.Rate
All races, female
1985 .......................... 266 27.0 17.4 25 2.5 2.0 133 13.4 5.9 109 11.0 9.6 62 6.3 4.11984 .......................... 274 27.5 17.7 13 1.3 1.0 156 15.6 7.5 105 10.6 9.3 67 6.7 4.71983 .......................... 266 26.5 17.3 14 1.4 1.3 143 14.2 7.0 109 10.9 9.0 60 6.0 4.41982 .......................... 267 26.6 17.9 19 1.9 1.6 139 13.8 6.8 110 10.9 9.5 42 4.2 3.31981 .......................... 292 28.9 19.7 19 1.9 1.6 155 15.3 8.1 118 11.7 10.0 77 7.6 5.81980 .......................... 313 31.1 22.2 36 3.6 3.4 148 14.7 7.5 129 12.8 11.3 82 8.2 6.51979 .......................... 322 32.2 23.6 36 3.6 3.4 145 14.5 7.4 141 14.1 12.8 68 6.8 5.2
White, male1992 .......................... 555 66.2 54.2 109 13.0 11.1 181 21.6 13.1 265 31.6 30.0 119 14.2 10.71991 .......................... 568 68.1 56.6 107 12.8 10.8 184 22.1 14.1 277 33.2 31.7 104 12.5 9.71990 .......................... 543 65.4 53.8 93 11.2 9.7 187 22.5 14.0 263 31.7 30.1 118 14.2 11.11989 .......................... 573 68.4 57.5 116 13.9 11.8 181 21.6 14.0 276 33.0 31.6 111 13.3 10.51988 .......................... 515 60.7 51.6 75 8.8 7.7 172 20.3 13.3 268 31.6 30.6 102 12.0 10.01987 .......................... 569 66.0 56.6 93 10.8 9.6 175 20.3 13.7 300 34.8 33.3 112 13.0 11.01986 .......................... 543 62.1 53.7 94 10.8 10.0 180 20.6 14.2 269 30.8 29.5 130 14.9 12.7
1985 .......................... 540 60.9 52.9 99 11.2 10.3 180 20.4 14.5 260 29.4 28.1 122 13.8 11.81984 .......................... 539 60.0 51.9 90 10.0 8.9 178 19.8 14.0 271 30.2 29.0 116 12.9 11.01983 .......................... 554 61.2 53.5 100 11.0 9.9 185 20.4 14.7 270 29.8 28.9 135 14.9 12.81982 .......................... 589 64.8 57.7 112 12.3 11.5 187 20.5 15.0 291 32.0 31.2 146 16.1 14.01981 .......................... 593 65.0 58.7 117 12.8 12.1 184 20.2 15.3 291 31.9 31.3 159 17.4 16.11980 .......................... 675 74.0 68.1 153 16.8 16.3 173 18.9 14.3 349 38.3 37.6 187 20.5 19.11979 .......................... 626 69.0 62.7 110 12.1 11.8 191 21.1 16.0 325 35.8 34.9 143 15.8 14.7
Black, male1992 .......................... 25 94.5 90.0 6 22.7 24.8 6 23.2 17.9 13 48.5 47.2 3 11.4 7.81991 .......................... 22 84.7 79.8 6 22.9 23.2 5 20.1 16.3 11 41.7 40.3 5 19.1 17.61990 .......................... 29 109.0 95.9 8 30.3 28.3 10 36.2 25.9 11 42.5 41.7 10 37.9 38.31989 .......................... 28 105.7 103.5 5 18.8 24.6 10 37.0 31.1 13 49.9 47.9 5 18.8 26.81988 .......................... 35 127.5 121.8 8 29.6 37.2 12 46.0 30.5 14 52.0 54.1 7 25.9 33.21987 .......................... 32 115.2 124.8 12 43.3 55.4 8 28.9 25.1 12 42.9 44.3 8 28.9 35.21986 .......................... 32 112.0 115.9 7 24.8 31.2 10 34.0 26.5 15 53.2 58.3 6 21.2 27.5
1985 .......................... 37 130.3 126.8 7 24.4 24.7 16 56.2 50.0 14 49.7 52.1 12 41.8 52.41984 .......................... 28 96.6 100.6 6 20.5 26.7 10 33.2 28.3 13 42.9 45.6 3 10.2 12.81983 .......................... 27 89.5 78.1 2 6.7 9.3 12 38.7 29.4 13 44.2 39.4 5 16.8 25.91982 .......................... 32 107.9 100.6 6 20.0 27.3 13 43.8 31.6 13 44.1 41.7 8 26.6 33.01981 .......................... 33 109.6 116.2 5 16.5 22.0 11 35.2 30.3 18 58.0 64.0 4 13.2 19.6
- 158 -

Table 1. Number of deaths and unadjusted and age-adjusted death rates per 100,000 population for different categories of alcohol-related mortality byState: United States, 1979–92.
West Virginia
Race, sex,and year
All Alcohol-Related Causes of DeathAll Chronic Liver Disease and
CirrhosisTotal Causes of Death with ExplicitMention of Alcohol
Other Alcohol-Related Diseases Other Alcohol-Related Injuries orAdverse Effects
Number Unadj.Rate
Age-Adj.Rate Number Unadj.
RateAge-Adj.
Rate Number Unadj.Rate
Age-Adj.Rate Number Unadj.
RateAge-Adj.
Rate Number Unadj.Rate
Age-Adj.Rate
Black, male1980 .......................... 44 144.3 152.6 13 42.7 56.5 17 56.7 46.5 14 44.9 49.6 18 59.1 62.21979 .......................... 42 138.7 156.0 11 36.3 55.0 13 43.8 31.6 18 58.6 69.4 9 29.7 43.1
White, female1992 .......................... 282 31.3 19.0 19 2.1 1.5 155 17.2 7.1 108 12.0 10.4 68 7.5 4.51991 .......................... 275 30.6 18.5 15 1.7 1.3 149 16.6 6.5 111 12.3 10.7 55 6.1 3.41990 .......................... 273 30.5 18.7 17 1.9 1.4 148 16.5 6.8 108 12.1 10.5 52 5.8 3.61989 .......................... 278 30.8 19.1 16 1.8 1.4 142 15.8 6.6 119 13.2 11.1 63 7.0 4.11988 .......................... 266 29.1 18.4 15 1.6 1.2 143 15.6 6.7 108 11.8 10.5 52 5.7 3.71987 .......................... 264 28.5 17.8 21 2.3 1.9 141 15.2 6.6 102 11.0 9.2 59 6.4 4.41986 .......................... 270 28.8 18.1 19 2.0 1.6 138 14.7 6.2 114 12.1 10.2 66 7.0 4.5
1985 .......................... 249 26.2 16.7 22 2.3 1.7 126 13.3 5.7 101 10.6 9.2 60 6.3 4.01984 .......................... 263 27.4 17.6 13 1.4 1.0 149 15.5 7.4 101 10.6 9.2 65 6.8 4.81983 .......................... 248 25.7 16.5 11 1.1 1.0 138 14.3 7.0 100 10.3 8.5 57 5.9 4.31982 .......................... 256 26.4 17.8 18 1.9 1.6 133 13.7 6.7 105 10.9 9.5 40 4.1 3.21981 .......................... 278 28.7 19.4 19 2.0 1.7 146 15.0 7.8 113 11.7 9.9 74 7.6 5.81980 .......................... 297 30.7 21.9 34 3.5 3.4 139 14.4 7.2 124 12.8 11.3 73 7.5 5.91979 .......................... 296 30.8 22.4 29 3.0 2.9 135 14.0 7.1 132 13.8 12.4 59 6.1 4.6
Black, female1992 .......................... 14 45.6 29.9 1 3.3 1.7 7 22.6 8.6 6 19.7 19.7 2 6.6 3.41991 .......................... 16 52.1 31.3 4 13.4 9.9 8 27.0 10.9 4 11.8 10.5 5 16.7 12.31990 .......................... 10 32.8 21.8 1 3.3 3.6 5 16.8 7.6 4 12.6 10.6 2 6.7 8.71989 .......................... 14 47.5 33.1 1 3.3 1.7 8 26.5 13.2 5 17.7 18.2 3 9.9 6.21988 .......................... 20 65.0 48.9 6 19.4 19.6 9 29.3 14.0 5 16.3 15.3 5 16.2 16.91987 .......................... 11 35.2 22.2 0 0.0 0.0 8 24.5 12.5 3 10.7 9.6 0 0.0 0.01986 .......................... 18 55.0 40.2 3 9.3 11.2 10 31.1 15.4 5 14.6 13.6 4 12.4 11.0
1985 .......................... 17 50.8 41.5 3 9.1 9.2 6 19.7 12.0 7 21.9 20.4 2 6.1 6.81984 .......................... 11 32.5 21.9 0 0.0 0.0 7 20.5 9.3 4 11.9 12.6 2 6.0 3.01983 .......................... 16 46.6 34.8 3 8.8 9.6 5 14.3 8.1 8 23.5 17.1 3 8.8 8.61982 .......................... 11 30.8 21.7 1 2.9 2.3 6 18.1 10.1 3 9.8 9.3 2 5.8 7.21981 .......................... 13 36.8 27.6 0 0.0 0.0 8 24.2 13.9 4 12.5 13.7 2 5.8 3.71980 .......................... 16 45.2 32.1 2 5.8 4.6 9 25.6 15.2 5 13.9 12.3 9 26.0 24.31979 .......................... 26 74.2 59.9 7 20.2 21.0 10 28.9 15.7 9 25.0 23.3 9 26.0 24.2
- 159 -

Table 1. Number of deaths and unadjusted and age-adjusted death rates per 100,000 population for different categories of alcohol-related mortality byState: United States, 1979–92.
Wisconsin
Race, sex,and year
All Alcohol-Related Causes of DeathAll Chronic Liver Disease and
CirrhosisTotal Causes of Death with ExplicitMention of Alcohol
Other Alcohol-Related Diseases Other Alcohol-Related Injuries orAdverse Effects
Number Unadj.Rate
Age-Adj.Rate Number Unadj.
RateAge-Adj.
Rate Number Unadj.Rate
Age-Adj.Rate Number Unadj.
RateAge-Adj.
Rate Number Unadj.Rate
Age-Adj.Rate
All races, both sexes1992 .......................... 1,856 37.2 26.7 294 5.9 5.0 817 16.4 8.5 745 14.9 13.2 368 7.4 5.51991 .......................... 1,926 38.9 28.7 285 5.8 5.0 840 17.0 9.1 800 16.2 14.6 359 7.3 5.61990 .......................... 1,940 39.6 29.5 318 6.5 5.6 819 16.7 9.0 804 16.4 14.9 395 8.1 6.31989 .......................... 1,984 40.8 30.6 357 7.4 6.6 828 17.0 9.3 799 16.5 14.7 418 8.6 6.91988 .......................... 1,917 39.8 29.8 300 6.2 5.5 811 16.8 9.2 806 16.7 15.1 397 8.2 6.61987 .......................... 1,917 40.1 30.3 302 6.3 5.7 809 16.9 9.5 806 16.9 15.1 420 8.8 7.21986 .......................... 1,825 38.4 29.1 284 6.0 5.4 798 16.8 9.5 744 15.6 14.2 376 7.9 6.5
1985 .......................... 1,869 39.4 30.2 334 7.0 6.3 789 16.6 9.7 746 15.7 14.2 432 9.1 7.41984 .......................... 1,829 38.6 29.7 291 6.1 5.6 775 16.4 9.5 763 16.1 14.6 372 7.9 6.61983 .......................... 1,839 38.9 30.0 299 6.3 5.9 789 16.7 9.8 751 15.9 14.2 437 9.3 7.71982 .......................... 1,837 38.8 30.7 289 6.1 5.7 792 16.8 10.3 756 16.0 14.6 416 8.8 7.61981 .......................... 2,024 42.8 34.3 384 8.1 7.6 815 17.2 10.7 825 17.5 16.0 489 10.3 9.11980 .......................... 2,010 42.6 34.3 388 8.2 7.7 795 16.9 10.5 827 17.5 16.1 465 9.9 8.71979 .......................... 1,996 42.8 35.0 338 7.2 6.9 768 16.5 10.5 890 19.1 17.6 446 9.6 8.5
All races, male1992 .......................... 1,174 48.0 39.4 215 8.8 7.7 457 18.7 12.3 502 20.5 19.4 228 9.3 7.61991 .......................... 1,245 51.4 42.9 224 9.2 8.2 465 19.2 12.9 556 23.0 21.8 225 9.3 7.91990 .......................... 1,237 51.6 43.2 224 9.3 8.2 457 19.0 12.9 557 23.2 22.0 241 10.0 8.31989 .......................... 1,279 53.9 45.2 264 11.1 10.1 466 19.6 13.5 550 23.1 21.7 276 11.6 9.91988 .......................... 1,236 52.4 44.1 222 9.4 8.7 447 19.0 12.9 567 24.0 22.6 251 10.6 9.21987 .......................... 1,242 53.2 44.8 218 9.3 8.6 455 19.5 13.6 569 24.4 22.6 266 11.4 9.91986 .......................... 1,182 50.8 43.0 208 8.9 8.3 449 19.3 13.6 525 22.6 21.2 244 10.5 9.1
1985 .......................... 1,236 53.2 45.2 253 10.9 10.0 454 19.5 14.0 529 22.8 21.2 266 11.5 9.91984 .......................... 1,186 51.2 43.4 218 9.4 8.6 444 19.2 13.6 523 22.6 21.2 216 9.3 8.11983 .......................... 1,184 51.3 43.7 219 9.5 9.0 436 18.9 13.4 528 22.9 21.3 257 11.1 9.81982 .......................... 1,222 52.8 45.7 215 9.3 8.9 455 19.7 14.5 552 23.8 22.4 263 11.4 10.31981 .......................... 1,345 58.1 50.8 289 12.5 12.0 477 20.6 15.2 579 25.0 23.6 321 13.9 12.81980 .......................... 1,324 57.3 50.2 295 12.8 12.0 453 19.6 14.6 576 24.9 23.5 293 12.7 11.51979 .......................... 1,346 58.9 51.9 249 10.9 10.5 459 20.1 15.2 638 27.9 26.3 295 12.9 11.8
All races, female1992 .......................... 682 26.8 15.1 79 3.1 2.6 360 14.2 5.4 242 9.5 7.1 140 5.5 3.61991 .......................... 681 27.0 15.7 61 2.4 2.1 376 14.9 5.9 244 9.7 7.7 134 5.3 3.61990 .......................... 703 28.1 17.1 94 3.8 3.2 362 14.5 5.9 247 9.9 8.0 154 6.2 4.61989 .......................... 704 28.4 17.4 93 3.7 3.4 362 14.6 5.9 249 10.1 8.1 142 5.7 4.21988 .......................... 681 27.6 16.7 78 3.2 2.7 364 14.8 6.2 239 9.7 7.9 146 5.9 4.31987 .......................... 675 27.6 17.1 84 3.4 3.1 354 14.5 6.1 237 9.7 7.8 154 6.3 4.81986 .......................... 643 26.5 16.6 76 3.1 2.9 349 14.4 6.2 219 9.0 7.5 132 5.4 4.2
- 160 -
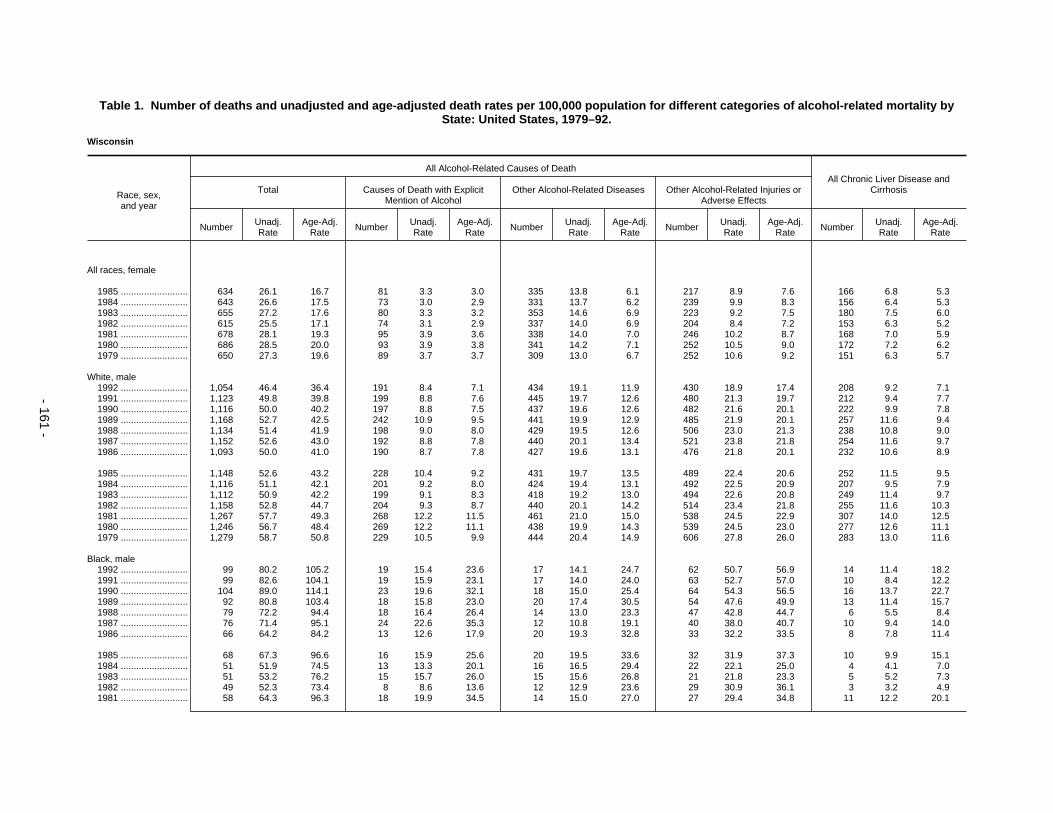
Table 1. Number of deaths and unadjusted and age-adjusted death rates per 100,000 population for different categories of alcohol-related mortality byState: United States, 1979–92.
Wisconsin
Race, sex,and year
All Alcohol-Related Causes of DeathAll Chronic Liver Disease and
CirrhosisTotal Causes of Death with ExplicitMention of Alcohol
Other Alcohol-Related Diseases Other Alcohol-Related Injuries orAdverse Effects
Number Unadj.Rate
Age-Adj.Rate Number Unadj.
RateAge-Adj.
Rate Number Unadj.Rate
Age-Adj.Rate Number Unadj.
RateAge-Adj.
Rate Number Unadj.Rate
Age-Adj.Rate
All races, female
1985 .......................... 634 26.1 16.7 81 3.3 3.0 335 13.8 6.1 217 8.9 7.6 166 6.8 5.31984 .......................... 643 26.6 17.5 73 3.0 2.9 331 13.7 6.2 239 9.9 8.3 156 6.4 5.31983 .......................... 655 27.2 17.6 80 3.3 3.2 353 14.6 6.9 223 9.2 7.5 180 7.5 6.01982 .......................... 615 25.5 17.1 74 3.1 2.9 337 14.0 6.9 204 8.4 7.2 153 6.3 5.21981 .......................... 678 28.1 19.3 95 3.9 3.6 338 14.0 7.0 246 10.2 8.7 168 7.0 5.91980 .......................... 686 28.5 20.0 93 3.9 3.8 341 14.2 7.1 252 10.5 9.0 172 7.2 6.21979 .......................... 650 27.3 19.6 89 3.7 3.7 309 13.0 6.7 252 10.6 9.2 151 6.3 5.7
White, male1992 .......................... 1,054 46.4 36.4 191 8.4 7.1 434 19.1 11.9 430 18.9 17.4 208 9.2 7.11991 .......................... 1,123 49.8 39.8 199 8.8 7.6 445 19.7 12.6 480 21.3 19.7 212 9.4 7.71990 .......................... 1,116 50.0 40.2 197 8.8 7.5 437 19.6 12.6 482 21.6 20.1 222 9.9 7.81989 .......................... 1,168 52.7 42.5 242 10.9 9.5 441 19.9 12.9 485 21.9 20.1 257 11.6 9.41988 .......................... 1,134 51.4 41.9 198 9.0 8.0 429 19.5 12.6 506 23.0 21.3 238 10.8 9.01987 .......................... 1,152 52.6 43.0 192 8.8 7.8 440 20.1 13.4 521 23.8 21.8 254 11.6 9.71986 .......................... 1,093 50.0 41.0 190 8.7 7.8 427 19.6 13.1 476 21.8 20.1 232 10.6 8.9
1985 .......................... 1,148 52.6 43.2 228 10.4 9.2 431 19.7 13.5 489 22.4 20.6 252 11.5 9.51984 .......................... 1,116 51.1 42.1 201 9.2 8.0 424 19.4 13.1 492 22.5 20.9 207 9.5 7.91983 .......................... 1,112 50.9 42.2 199 9.1 8.3 418 19.2 13.0 494 22.6 20.8 249 11.4 9.71982 .......................... 1,158 52.8 44.7 204 9.3 8.7 440 20.1 14.2 514 23.4 21.8 255 11.6 10.31981 .......................... 1,267 57.7 49.3 268 12.2 11.5 461 21.0 15.0 538 24.5 22.9 307 14.0 12.51980 .......................... 1,246 56.7 48.4 269 12.2 11.1 438 19.9 14.3 539 24.5 23.0 277 12.6 11.11979 .......................... 1,279 58.7 50.8 229 10.5 9.9 444 20.4 14.9 606 27.8 26.0 283 13.0 11.6
Black, male1992 .......................... 99 80.2 105.2 19 15.4 23.6 17 14.1 24.7 62 50.7 56.9 14 11.4 18.21991 .......................... 99 82.6 104.1 19 15.9 23.1 17 14.0 24.0 63 52.7 57.0 10 8.4 12.21990 .......................... 104 89.0 114.1 23 19.6 32.1 18 15.0 25.4 64 54.3 56.5 16 13.7 22.71989 .......................... 92 80.8 103.4 18 15.8 23.0 20 17.4 30.5 54 47.6 49.9 13 11.4 15.71988 .......................... 79 72.2 94.4 18 16.4 26.4 14 13.0 23.3 47 42.8 44.7 6 5.5 8.41987 .......................... 76 71.4 95.1 24 22.6 35.3 12 10.8 19.1 40 38.0 40.7 10 9.4 14.01986 .......................... 66 64.2 84.2 13 12.6 17.9 20 19.3 32.8 33 32.2 33.5 8 7.8 11.4
1985 .......................... 68 67.3 96.6 16 15.9 25.6 20 19.5 33.6 32 31.9 37.3 10 9.9 15.11984 .......................... 51 51.9 74.5 13 13.3 20.1 16 16.5 29.4 22 22.1 25.0 4 4.1 7.01983 .......................... 51 53.2 76.2 15 15.7 26.0 15 15.6 26.8 21 21.8 23.3 5 5.2 7.31982 .......................... 49 52.3 73.4 8 8.6 13.6 12 12.9 23.6 29 30.9 36.1 3 3.2 4.91981 .......................... 58 64.3 96.3 18 19.9 34.5 14 15.0 27.0 27 29.4 34.8 11 12.2 20.1
- 161 -
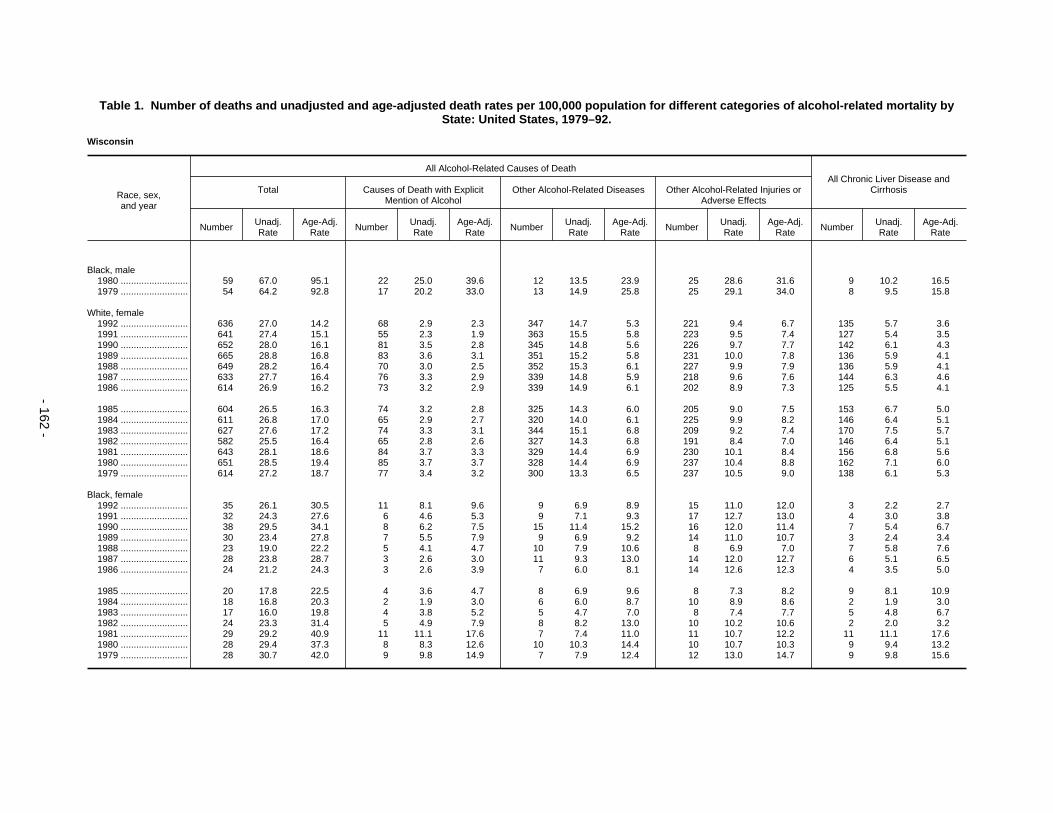
Table 1. Number of deaths and unadjusted and age-adjusted death rates per 100,000 population for different categories of alcohol-related mortality byState: United States, 1979–92.
Wisconsin
Race, sex,and year
All Alcohol-Related Causes of DeathAll Chronic Liver Disease and
CirrhosisTotal Causes of Death with ExplicitMention of Alcohol
Other Alcohol-Related Diseases Other Alcohol-Related Injuries orAdverse Effects
Number Unadj.Rate
Age-Adj.Rate Number Unadj.
RateAge-Adj.
Rate Number Unadj.Rate
Age-Adj.Rate Number Unadj.
RateAge-Adj.
Rate Number Unadj.Rate
Age-Adj.Rate
Black, male1980 .......................... 59 67.0 95.1 22 25.0 39.6 12 13.5 23.9 25 28.6 31.6 9 10.2 16.51979 .......................... 54 64.2 92.8 17 20.2 33.0 13 14.9 25.8 25 29.1 34.0 8 9.5 15.8
White, female1992 .......................... 636 27.0 14.2 68 2.9 2.3 347 14.7 5.3 221 9.4 6.7 135 5.7 3.61991 .......................... 641 27.4 15.1 55 2.3 1.9 363 15.5 5.8 223 9.5 7.4 127 5.4 3.51990 .......................... 652 28.0 16.1 81 3.5 2.8 345 14.8 5.6 226 9.7 7.7 142 6.1 4.31989 .......................... 665 28.8 16.8 83 3.6 3.1 351 15.2 5.8 231 10.0 7.8 136 5.9 4.11988 .......................... 649 28.2 16.4 70 3.0 2.5 352 15.3 6.1 227 9.9 7.9 136 5.9 4.11987 .......................... 633 27.7 16.4 76 3.3 2.9 339 14.8 5.9 218 9.6 7.6 144 6.3 4.61986 .......................... 614 26.9 16.2 73 3.2 2.9 339 14.9 6.1 202 8.9 7.3 125 5.5 4.1
1985 .......................... 604 26.5 16.3 74 3.2 2.8 325 14.3 6.0 205 9.0 7.5 153 6.7 5.01984 .......................... 611 26.8 17.0 65 2.9 2.7 320 14.0 6.1 225 9.9 8.2 146 6.4 5.11983 .......................... 627 27.6 17.2 74 3.3 3.1 344 15.1 6.8 209 9.2 7.4 170 7.5 5.71982 .......................... 582 25.5 16.4 65 2.8 2.6 327 14.3 6.8 191 8.4 7.0 146 6.4 5.11981 .......................... 643 28.1 18.6 84 3.7 3.3 329 14.4 6.9 230 10.1 8.4 156 6.8 5.61980 .......................... 651 28.5 19.4 85 3.7 3.7 328 14.4 6.9 237 10.4 8.8 162 7.1 6.01979 .......................... 614 27.2 18.7 77 3.4 3.2 300 13.3 6.5 237 10.5 9.0 138 6.1 5.3
Black, female1992 .......................... 35 26.1 30.5 11 8.1 9.6 9 6.9 8.9 15 11.0 12.0 3 2.2 2.71991 .......................... 32 24.3 27.6 6 4.6 5.3 9 7.1 9.3 17 12.7 13.0 4 3.0 3.81990 .......................... 38 29.5 34.1 8 6.2 7.5 15 11.4 15.2 16 12.0 11.4 7 5.4 6.71989 .......................... 30 23.4 27.8 7 5.5 7.9 9 6.9 9.2 14 11.0 10.7 3 2.4 3.41988 .......................... 23 19.0 22.2 5 4.1 4.7 10 7.9 10.6 8 6.9 7.0 7 5.8 7.61987 .......................... 28 23.8 28.7 3 2.6 3.0 11 9.3 13.0 14 12.0 12.7 6 5.1 6.51986 .......................... 24 21.2 24.3 3 2.6 3.9 7 6.0 8.1 14 12.6 12.3 4 3.5 5.0
1985 .......................... 20 17.8 22.5 4 3.6 4.7 8 6.9 9.6 8 7.3 8.2 9 8.1 10.91984 .......................... 18 16.8 20.3 2 1.9 3.0 6 6.0 8.7 10 8.9 8.6 2 1.9 3.01983 .......................... 17 16.0 19.8 4 3.8 5.2 5 4.7 7.0 8 7.4 7.7 5 4.8 6.71982 .......................... 24 23.3 31.4 5 4.9 7.9 8 8.2 13.0 10 10.2 10.6 2 2.0 3.21981 .......................... 29 29.2 40.9 11 11.1 17.6 7 7.4 11.0 11 10.7 12.2 11 11.1 17.61980 .......................... 28 29.4 37.3 8 8.3 12.6 10 10.3 14.4 10 10.7 10.3 9 9.4 13.21979 .......................... 28 30.7 42.0 9 9.8 14.9 7 7.9 12.4 12 13.0 14.7 9 9.8 15.6
- 162 -

Table 1. Number of deaths and unadjusted and age-adjusted death rates per 100,000 population for different categories of alcohol-related mortality byState: United States, 1979–92.
Wyoming
Race, sex,and year
All Alcohol-Related Causes of DeathAll Chronic Liver Disease and
CirrhosisTotal Causes of Death with ExplicitMention of Alcohol
Other Alcohol-Related Diseases Other Alcohol-Related Injuries orAdverse Effects
Number Unadj.Rate
Age-Adj.Rate Number Unadj.
RateAge-Adj.
Rate Number Unadj.Rate
Age-Adj.Rate Number Unadj.
RateAge-Adj.
Rate Number Unadj.Rate
Age-Adj.Rate
All races, both sexes1992 .......................... 199 42.8 37.7 35 7.5 7.7 60 12.8 8.6 104 22.4 21.3 41 8.8 8.11991 .......................... 191 41.7 36.8 37 8.1 7.3 60 13.1 9.0 94 20.6 20.5 41 9.0 7.71990 .......................... 194 42.9 37.5 43 9.5 8.8 60 13.2 8.7 91 20.2 19.9 39 8.6 7.81989 .......................... 201 43.8 39.5 44 9.6 9.2 56 12.1 8.6 101 22.1 21.6 39 8.5 7.81988 .......................... 214 46.0 41.8 49 10.5 10.2 61 13.1 9.1 104 22.3 22.5 41 8.8 8.71987 .......................... 174 36.5 33.2 27 5.7 5.8 57 11.8 8.7 91 19.0 18.7 36 7.5 6.81986 .......................... 217 43.7 41.9 43 8.7 8.4 53 10.7 8.6 120 24.3 24.9 39 7.9 7.7
1985 .......................... 209 41.9 40.6 39 7.8 8.1 53 10.7 8.8 117 23.4 23.7 48 9.6 9.81984 .......................... 193 38.1 36.6 19 3.8 4.2 47 9.3 7.6 127 25.1 24.8 27 5.3 5.61983 .......................... 211 41.3 40.0 31 6.1 6.5 46 9.0 7.5 134 26.2 26.0 35 6.9 7.01982 .......................... 244 48.1 47.2 40 7.9 8.7 54 10.7 9.3 149 29.5 29.2 47 9.3 9.81981 .......................... 265 53.9 53.3 47 9.6 10.5 50 10.3 8.7 167 34.1 34.1 45 9.2 9.81980 .......................... 249 52.4 51.1 48 10.1 11.8 56 11.8 10.3 144 30.5 29.1 49 10.3 11.81979 .......................... 239 52.8 51.6 37 8.2 9.3 51 11.2 9.9 151 33.4 32.4 41 9.1 10.5
All races, male1992 .......................... 139 59.5 55.6 27 11.6 11.6 33 14.2 11.3 79 33.7 32.7 28 12.0 11.31991 .......................... 130 56.7 53.2 32 13.9 12.8 34 14.6 12.0 65 28.1 28.3 27 11.8 10.51990 .......................... 127 56.0 52.9 31 13.7 12.9 33 14.7 11.8 63 27.6 28.2 26 11.5 10.51989 .......................... 131 56.9 54.1 28 12.2 11.6 31 13.5 11.6 72 31.2 31.0 23 10.0 9.51988 .......................... 147 62.9 60.7 37 15.8 15.4 34 14.4 11.9 76 32.7 33.4 28 12.0 11.61987 .......................... 113 46.9 46.0 18 7.5 7.8 33 13.7 12.3 62 25.6 25.8 23 9.6 9.71986 .......................... 145 57.9 58.2 29 11.6 11.5 32 12.7 12.1 84 33.7 34.5 26 10.4 10.5
1985 .......................... 151 59.7 60.8 31 12.3 13.1 31 12.2 11.8 89 35.3 35.9 33 13.1 13.91984 .......................... 130 50.6 51.4 11 4.3 5.1 26 10.2 9.8 92 36.1 36.5 15 5.9 6.31983 .......................... 155 59.8 60.7 27 10.4 11.5 27 10.5 10.1 101 38.8 39.1 21 8.1 8.71982 .......................... 172 66.6 68.4 29 11.2 12.4 31 12.2 12.4 111 43.1 43.6 28 10.9 11.51981 .......................... 196 78.2 80.5 36 14.3 16.2 26 10.2 10.1 135 53.6 54.1 30 11.9 13.11980 .......................... 178 73.3 74.8 36 14.8 17.5 31 12.6 13.1 111 45.9 44.2 33 13.6 15.81979 .......................... 168 72.6 73.4 20 8.6 10.3 33 14.5 15.0 114 49.5 48.1 26 11.2 13.4
All races, female1992 .......................... 60 26.0 20.3 8 3.5 3.9 26 11.4 6.3 26 11.1 10.2 13 5.6 5.01991 .......................... 61 26.6 21.5 5 2.2 2.0 26 11.5 6.5 30 13.0 13.0 14 6.1 5.21990 .......................... 67 29.7 22.5 12 5.3 4.9 27 11.8 6.1 29 12.6 11.5 13 5.7 5.31989 .......................... 70 30.6 25.7 16 7.0 7.0 24 10.7 6.0 29 12.9 12.7 16 7.0 6.31988 .......................... 67 29.0 23.8 12 5.2 5.3 28 11.9 6.7 28 11.9 11.8 13 5.6 5.91987 .......................... 62 26.0 21.2 9 3.8 3.9 24 9.9 5.7 29 12.3 11.6 13 5.5 4.11986 .......................... 72 29.2 26.0 14 5.7 5.3 21 8.7 5.6 36 14.8 15.1 13 5.3 5.0
- 163 -

Table 1. Number of deaths and unadjusted and age-adjusted death rates per 100,000 population for different categories of alcohol-related mortality byState: United States, 1979–92.
Wyoming
Race, sex,and year
All Alcohol-Related Causes of DeathAll Chronic Liver Disease and
CirrhosisTotal Causes of Death with ExplicitMention of Alcohol
Other Alcohol-Related Diseases Other Alcohol-Related Injuries orAdverse Effects
Number Unadj.Rate
Age-Adj.Rate Number Unadj.
RateAge-Adj.
Rate Number Unadj.Rate
Age-Adj.Rate Number Unadj.
RateAge-Adj.
Rate Number Unadj.Rate
Age-Adj.Rate
All races, female
1985 .......................... 58 23.7 20.6 8 3.2 3.0 23 9.2 6.3 28 11.3 11.3 15 6.1 5.81984 .......................... 63 25.3 21.9 8 3.2 3.2 21 8.3 5.8 34 13.7 12.9 12 4.8 4.91983 .......................... 56 22.3 19.6 4 1.6 1.7 19 7.4 5.3 33 13.2 12.6 14 5.6 5.51982 .......................... 72 28.9 25.7 11 4.4 5.1 23 9.2 6.4 38 15.4 14.1 19 7.6 8.21981 .......................... 68 28.5 25.3 11 4.6 4.8 25 10.3 7.6 33 13.6 12.9 15 6.2 6.61980 .......................... 70 30.4 27.0 12 5.2 5.9 25 11.0 7.7 33 14.3 13.4 16 6.9 7.81979 .......................... 71 32.1 29.7 17 7.7 8.4 17 7.8 5.2 37 16.6 16.1 15 6.8 7.6
White, male1992 .......................... 126 56.2 51.4 21 9.4 9.2 31 14.0 10.7 74 32.8 31.5 23 10.2 9.41991 .......................... 122 54.9 50.7 31 14.0 12.7 33 14.8 11.8 58 26.1 26.2 27 12.2 10.71990 .......................... 118 54.1 50.6 26 11.9 11.0 33 15.1 11.9 59 27.2 27.7 22 10.1 9.01989 .......................... 124 56.1 52.7 26 11.7 11.0 31 13.8 11.7 68 30.5 30.0 23 10.4 9.71988 .......................... 137 60.7 57.9 31 13.7 13.1 33 14.8 12.1 73 32.2 32.7 23 10.2 9.61987 .......................... 106 45.5 44.1 15 6.5 6.7 33 14.0 12.4 58 25.0 25.1 22 9.5 9.41986 .......................... 137 56.6 56.3 26 10.7 10.4 31 12.9 12.2 80 33.0 33.7 23 9.5 9.4
1985 .......................... 140 57.1 57.9 27 11.0 11.8 30 12.1 11.6 83 34.0 34.5 31 12.7 13.41984 .......................... 121 48.9 49.2 9 3.6 4.3 26 10.3 9.8 87 34.9 35.1 14 5.6 6.01983 .......................... 148 58.8 59.5 25 9.9 11.0 26 10.4 9.9 97 38.5 38.6 21 8.3 8.91982 .......................... 164 65.4 66.8 26 10.4 11.2 31 12.5 12.6 107 42.5 43.0 27 10.8 11.21981 .......................... 184 75.5 77.2 30 12.3 13.9 25 10.4 10.1 129 52.9 53.3 24 9.8 10.71980 .......................... 169 71.6 72.5 33 14.0 16.4 30 12.6 12.9 106 45.0 43.2 31 13.1 15.11979 .......................... 156 69.4 70.1 19 8.4 9.9 32 14.2 14.6 105 46.8 45.5 23 10.2 12.1
Black, male1992 .......................... 2 84.3 105.6 0 0.0 0.0 1 41.9 68.9 1 42.4 36.7 0 0.0 0.01991 .......................... 3 177.4 239.7 1 51.0 81.1 1 40.8 65.4 2 85.6 93.2 0 0.0 0.01990 .......................... 0 0.0 0.0 0 0.0 0.0 0 0.0 0.0 0 0.0 0.0 0 0.0 0.01989 .......................... 1 30.5 32.1 0 0.0 0.0 - 8.4 13.0 - 22.2 19.1 0 0.0 0.01988 .......................... 1 72.1 110.7 1 49.4 92.8 0 0.0 0.0 - 22.7 17.9 1 49.4 92.81987 .......................... 1 37.3 35.5 0 0.0 0.0 - 6.9 12.1 1 30.4 23.4 0 0.0 0.01986 .......................... - 4.9 8.1 0 0.0 0.0 - 4.9 8.1 0 0.0 0.0 0 0.0 0.0
1985 .......................... 2 78.5 90.8 0 0.0 0.0 1 33.8 56.8 1 44.6 33.9 1 49.0 80.31984 .......................... 1 52.8 94.5 1 49.3 90.6 - 3.5 3.9 0 0.0 0.0 1 49.3 90.61983 .......................... 1 31.9 39.4 0 0.0 0.0 - 18.1 29.6 - 13.7 9.8 0 0.0 0.01982 .......................... - 21.1 30.9 0 0.0 0.0 0 0.0 0.0 - 21.1 30.9 0 0.0 0.0
- 164 -

Table 1. Number of deaths and unadjusted and age-adjusted death rates per 100,000 population for different categories of alcohol-related mortality byState: United States, 1979–92.
Wyoming
Race, sex,and year
All Alcohol-Related Causes of DeathAll Chronic Liver Disease and
CirrhosisTotal Causes of Death with ExplicitMention of Alcohol
Other Alcohol-Related Diseases Other Alcohol-Related Injuries orAdverse Effects
Number Unadj.Rate
Age-Adj.Rate Number Unadj.
RateAge-Adj.
Rate Number Unadj.Rate
Age-Adj.Rate Number Unadj.
RateAge-Adj.
Rate Number Unadj.Rate
Age-Adj.Rate
Black, male1981 .......................... 1 51.3 89.9 1 51.3 89.9 0 0.0 0.0 0 0.0 0.0 1 51.3 89.91980 .......................... 3 134.0 224.4 1 52.5 107.1 1 37.3 64.8 1 44.1 52.5 0 0.0 0.01979 .......................... 1 48.2 42.8 0 0.0 0.0 - 3.7 6.4 1 44.4 36.4 0 0.0 0.0
White, female1992 .......................... 57 25.5 19.4 7 3.1 3.5 25 11.1 5.7 25 11.2 10.2 10 4.5 3.61991 .......................... 55 25.1 19.5 3 1.4 1.3 25 11.4 6.1 27 12.4 12.1 11 5.0 4.01990 .......................... 63 29.1 21.6 10 4.6 4.2 26 12.0 6.0 27 12.5 11.3 12 5.5 5.11989 .......................... 61 27.9 22.7 11 5.0 5.0 24 11.0 6.0 26 11.9 11.7 13 5.9 5.31988 .......................... 62 27.8 22.2 10 4.5 4.4 27 11.9 6.5 26 11.4 11.4 12 5.4 5.51987 .......................... 58 25.2 19.9 7 3.1 2.8 23 10.0 5.6 28 12.1 11.5 12 5.2 3.61986 .......................... 67 28.1 24.5 12 5.0 4.3 21 8.8 5.5 34 14.2 14.6 12 5.0 4.5
1985 .......................... 57 23.9 20.6 7 2.9 2.7 22 9.3 6.3 28 11.6 11.6 14 5.8 5.51984 .......................... 57 23.7 20.3 5 2.1 2.0 20 8.4 5.7 32 13.2 12.5 10 4.1 4.21983 .......................... 53 21.8 18.9 4 1.6 1.7 18 7.5 5.3 31 12.6 11.9 14 5.7 5.71982 .......................... 70 28.8 25.2 10 4.1 4.7 22 9.2 6.4 37 15.5 14.1 19 7.9 8.31981 .......................... 64 27.5 24.1 11 4.7 4.9 24 10.2 7.4 29 12.6 11.8 15 6.4 6.71980 .......................... 61 27.2 23.2 8 3.6 3.9 25 11.0 7.5 29 12.7 11.9 14 6.2 6.81979 .......................... 69 32.0 29.5 16 7.5 8.2 17 7.8 5.2 36 16.7 16.1 14 6.5 7.3
Black, female1992 .......................... - 10.6 4.9 0 0.0 0.0 - 10.6 4.9 0 0.0 0.0 0 0.0 0.01991 .......................... - 3.0 2.7 0 0.0 0.0 - 3.0 2.7 0 0.0 0.0 0 0.0 0.01990 .......................... - 11.8 9.7 0 0.0 0.0 - 11.8 9.7 0 0.0 0.0 0 0.0 0.01989 .......................... 0 0.0 0.0 0 0.0 0.0 0 0.0 0.0 0 0.0 0.0 0 0.0 0.01988 .......................... - 3.0 3.4 0 0.0 0.0 - 3.0 3.4 0 0.0 0.0 0 0.0 0.01987 .......................... - 4.2 3.7 0 0.0 0.0 - 4.2 3.7 0 0.0 0.0 0 0.0 0.01986 .......................... 1 85.7 57.6 0 0.0 0.0 - 11.2 10.6 1 74.5 47.0 0 0.0 0.0
1985 .......................... - 11.4 10.7 0 0.0 0.0 - 11.4 10.7 0 0.0 0.0 0 0.0 0.01984 .......................... 1 69.0 62.7 0 0.0 0.0 - 30.5 39.7 1 38.5 23.0 1 61.1 79.41983 .......................... 1 82.6 65.2 0 0.0 0.0 - 8.5 7.4 1 74.1 57.8 0 0.0 0.01982 .......................... - 24.9 25.6 0 0.0 0.0 - 24.9 25.6 0 0.0 0.0 0 0.0 0.01981 .......................... - 28.9 37.8 0 0.0 0.0 - 28.9 37.8 0 0.0 0.0 0 0.0 0.01980 .......................... 1 33.8 30.7 0 0.0 0.0 - 3.3 1.3 - 30.5 29.5 0 0.0 0.01979 .......................... - 4.8 4.2 0 0.0 0.0 - 4.8 4.2 0 0.0 0.0 0 0.0 0.0
- The AAF methodology used to estimate alcohol-related mortality can result in fractional estimates less than 0.5 but greater than 0.
- 165 -

Table 2. Age-specific number of deaths and age-specific and age-adjusted death rates per 100,000 population for selected alcohol-relatedcauses of death: United States, 1979–92.
All cirrhosis (ICD-9 571, 572.3)
Race, sex,and year
Number of deaths, by age group Deaths per 100,000 population, by age group Age-adjusted deathsper 100,000populationAll1 0-24 25-34 35-44 45-54 55-64 65-74 75-84 85+ All1 25-34 35-44 45-54 55-64 65-74 75-84 85+
All races, both sexes1992 .......................... 25,407 70 769 3,619 4,592 5,807 6,300 3,445 799 10.0 1.8 9.1 16.7 27.8 34.1 32.7 24.6 8.11991 .......................... 25,562 66 864 3,596 4,470 6,076 6,258 3,475 739 10.1 2.0 9.1 17.4 28.9 34.3 33.7 23.5 8.31990 .......................... 25,920 76 894 3,623 4,517 6,332 6,311 3,439 713 10.4 2.1 9.6 17.9 30.0 34.9 34.1 23.4 8.61989 .......................... 26,823 91 985 3,618 4,744 6,787 6,520 3,361 708 10.9 2.3 9.9 19.3 32.0 36.5 34.1 23.9 9.11988 .......................... 26,572 87 1,061 3,581 4,801 7,020 6,303 3,116 595 10.9 2.5 10.2 20.0 32.6 35.8 32.4 20.6 9.21987 .......................... 26,351 105 1,147 3,431 4,640 7,112 6,244 3,058 606 10.9 2.7 10.0 20.1 32.7 35.8 32.6 21.5 9.21986 .......................... 26,310 109 1,186 3,207 4,646 7,203 6,494 2,877 580 11.0 2.8 9.7 20.5 32.7 37.9 31.5 21.2 9.3
1985 .......................... 26,927 100 1,250 3,126 4,995 7,586 6,410 2,907 542 11.3 3.0 9.9 22.2 34.3 38.0 32.7 20.3 9.71984 .......................... 27,468 126 1,168 3,084 5,244 7,856 6,609 2,880 494 11.6 2.9 10.1 23.4 35.5 39.7 33.3 19.0 10.11983 .......................... 27,414 121 1,210 2,967 5,461 8,097 6,377 2,693 479 11.7 3.0 10.1 24.4 36.6 38.8 31.9 19.0 10.31982 .......................... 27,838 147 1,204 3,021 5,726 8,194 6,501 2,591 447 12.0 3.1 10.8 25.5 37.2 40.3 31.6 18.3 10.61981 .......................... 29,451 160 1,196 3,247 6,413 8,661 6,772 2,492 501 12.8 3.1 12.3 28.4 39.5 42.6 31.2 21.3 11.51980 .......................... 30,730 180 1,293 3,498 7,077 9,081 6,738 2,389 459 13.5 3.5 13.6 31.1 41.7 43.1 30.7 20.2 12.21979 .......................... 29,851 155 1,229 3,502 7,142 8,810 6,437 2,166 400 13.3 3.4 13.9 31.1 41.1 42.0 28.6 18.4 12.1
All races, male1992 .......................... 16,572 39 504 2,711 3,338 4,000 3,832 1,804 338 13.3 2.4 13.7 24.9 40.4 47.2 45.1 37.2 11.71991 .......................... 16,342 38 546 2,598 3,186 4,147 3,715 1,793 305 13.3 2.5 13.4 25.3 41.8 46.3 46.1 34.8 11.81990 .......................... 16,695 35 560 2,652 3,265 4,281 3,813 1,771 306 13.7 2.6 14.2 26.5 43.0 48.1 46.9 36.0 12.31989 .......................... 17,397 50 675 2,726 3,398 4,539 3,954 1,744 303 14.5 3.1 15.2 28.3 45.4 50.5 47.4 36.5 13.01988 .......................... 17,297 49 713 2,610 3,431 4,725 3,894 1,587 281 14.5 3.3 15.0 29.4 46.7 50.5 44.4 34.7 13.21987 .......................... 17,147 62 765 2,475 3,304 4,836 3,821 1,598 279 14.5 3.6 14.7 29.4 47.3 50.2 45.9 34.9 13.31986 .......................... 16,886 61 797 2,296 3,213 4,745 3,994 1,509 264 14.4 3.8 14.1 29.1 46.0 53.4 44.6 33.9 13.2
1985 .......................... 17,345 62 832 2,217 3,431 5,113 3,943 1,513 225 15.0 4.0 14.2 31.4 49.2 53.7 46.0 29.5 13.81984 .......................... 17,662 76 797 2,184 3,571 5,194 4,084 1,523 227 15.4 3.9 14.6 32.8 50.0 56.5 47.5 30.4 14.31983 .......................... 17,628 55 820 2,069 3,686 5,309 4,028 1,448 206 15.5 4.1 14.4 34.0 51.3 56.5 46.4 28.1 14.51982 .......................... 18,004 80 821 2,102 3,936 5,393 4,095 1,360 211 16.0 4.2 15.3 36.2 52.3 58.5 44.8 29.4 15.01981 .......................... 18,978 84 820 2,222 4,264 5,694 4,265 1,380 244 17.0 4.2 17.2 39.0 55.5 61.9 46.6 34.8 16.11980 .......................... 19,866 101 868 2,339 4,725 6,012 4,276 1,307 225 18.0 4.7 18.5 43.0 59.1 63.0 45.3 32.7 17.21979 .......................... 19,455 90 851 2,371 4,740 5,832 4,164 1,205 193 17.8 4.8 19.2 42.8 58.2 62.7 42.7 28.9 17.1
All races, female1992 .......................... 8,835 31 265 908 1,254 1,807 2,468 1,641 461 6.8 1.2 4.5 8.9 16.4 23.9 25.1 19.7 4.91991 .......................... 9,220 28 318 998 1,284 1,929 2,543 1,682 434 7.1 1.5 5.0 9.7 17.4 24.8 26.2 19.1 5.21990 .......................... 9,225 41 334 971 1,252 2,051 2,498 1,668 407 7.2 1.5 5.1 9.7 18.4 24.6 26.5 18.5 5.31989 .......................... 9,426 41 310 892 1,346 2,248 2,566 1,617 405 7.4 1.4 4.8 10.7 20.0 25.6 26.2 19.0 5.61988 .......................... 9,275 38 348 971 1,370 2,295 2,409 1,529 314 7.4 1.6 5.4 11.2 20.1 24.3 25.3 15.1 5.61987 .......................... 9,204 43 382 956 1,336 2,276 2,423 1,460 327 7.4 1.8 5.5 11.3 19.7 24.7 24.8 16.1 5.71986 .......................... 9,424 48 389 911 1,433 2,458 2,500 1,368 316 7.6 1.8 5.4 12.3 21.1 25.9 23.8 16.1 6.0
1985 .......................... 9,582 38 418 909 1,564 2,473 2,467 1,394 317 7.8 2.0 5.6 13.5 21.0 25.9 24.9 16.6 6.21984 .......................... 9,806 50 371 900 1,673 2,662 2,525 1,357 267 8.1 1.8 5.8 14.5 22.6 26.9 24.9 14.4 6.4
- 166 -

Table 2. Age-specific number of deaths and age-specific and age-adjusted death rates per 100,000 population for selected alcohol-relatedcauses of death: United States, 1979–92.
All cirrhosis (ICD-9 571, 572.3)
Race, sex,and year
Number of deaths, by age group Deaths per 100,000 population, by age group Age-adjusted deathsper 100,000populationAll1 0-24 25-34 35-44 45-54 55-64 65-74 75-84 85+ All1 25-34 35-44 45-54 55-64 65-74 75-84 85+
All races, female1983 .......................... 9,786 66 390 898 1,775 2,788 2,349 1,245 273 8.1 1.9 6.0 15.4 23.7 25.3 23.5 15.3 6.61982 .......................... 9,834 67 383 919 1,790 2,801 2,406 1,231 236 8.3 1.9 6.4 15.5 23.9 26.3 23.8 13.7 6.71981 .......................... 10,473 76 376 1,025 2,149 2,967 2,507 1,112 257 8.9 1.9 7.6 18.4 25.4 27.9 22.1 15.6 7.41980 .......................... 10,864 79 425 1,159 2,352 3,069 2,462 1,082 234 9.3 2.3 8.8 20.0 26.5 27.8 22.1 14.8 7.91979 .......................... 10,396 65 378 1,131 2,402 2,978 2,273 961 207 9.0 2.1 8.8 20.2 26.1 26.2 20.2 13.8 7.8
White, male1992 .......................... 13,978 27 377 2,107 2,654 3,418 3,399 1,675 316 13.4 2.1 12.6 22.8 39.2 46.6 46.0 38.5 11.11991 .......................... 13,850 24 413 1,997 2,536 3,546 3,347 1,692 286 13.4 2.3 12.0 23.3 40.4 46.3 47.8 36.1 11.21990 .......................... 13,950 29 402 1,972 2,528 3,620 3,462 1,644 285 13.6 2.2 12.4 23.7 41.1 48.4 48.0 37.2 11.51989 .......................... 14,492 33 467 1,978 2,680 3,871 3,558 1,623 278 14.3 2.6 12.8 25.6 43.6 50.4 48.7 37.1 12.21988 .......................... 14,471 33 497 1,901 2,682 4,067 3,543 1,473 269 14.4 2.7 12.7 26.4 45.2 50.9 45.4 36.8 12.31987 .......................... 14,259 47 520 1,736 2,546 4,181 3,479 1,487 260 14.2 2.9 11.9 26.0 46.0 50.6 47.1 36.1 12.31986 .......................... 14,174 43 521 1,633 2,543 4,130 3,656 1,396 249 14.3 2.9 11.6 26.5 44.8 54.1 45.6 35.4 12.4
1985 .......................... 14,402 44 554 1,513 2,688 4,403 3,571 1,416 207 14.6 3.1 11.2 28.2 47.4 53.9 47.5 30.1 12.81984 .......................... 14,874 54 522 1,556 2,846 4,535 3,726 1,416 216 15.2 3.0 11.9 29.9 48.8 57.1 48.8 32.0 13.31983 .......................... 14,910 39 548 1,466 2,970 4,632 3,677 1,370 202 15.3 3.2 11.7 31.2 49.9 57.1 48.5 30.5 13.61982 .......................... 15,323 55 539 1,518 3,187 4,754 3,790 1,271 204 15.9 3.2 12.6 33.3 51.3 60.0 46.2 31.4 14.21981 .......................... 15,946 62 527 1,534 3,394 5,002 3,900 1,292 232 16.6 3.2 13.6 35.1 54.2 62.7 48.2 36.4 14.91980 .......................... 16,492 75 520 1,574 3,745 5,236 3,897 1,226 212 17.3 3.2 14.2 38.4 57.1 63.7 46.8 33.8 15.71979 .......................... 16,178 60 518 1,660 3,744 5,082 3,803 1,127 177 17.1 3.3 15.3 38.0 56.2 63.5 44.1 29.1 15.6
Black, male1992 .......................... 2,197 10 97 529 587 504 358 93 18 14.7 3.7 24.3 46.5 56.9 56.0 32.7 26.0 17.41991 .......................... 2,148 13 108 533 569 522 308 79 11 14.7 4.2 25.5 47.4 59.2 49.1 28.2 16.3 17.61990 .......................... 2,400 5 138 603 641 587 305 100 17 16.6 5.3 30.4 54.4 66.8 49.5 36.0 25.5 20.01989 .......................... 2,524 15 176 664 634 585 340 93 14 17.7 6.8 35.3 54.8 66.4 55.8 33.8 21.1 21.21988 .......................... 2,485 15 194 642 654 578 299 92 10 17.7 7.6 35.9 57.8 65.3 49.7 33.9 15.3 21.41987 .......................... 2,584 11 222 684 676 589 289 95 14 18.6 8.9 40.0 61.1 66.4 48.5 35.6 21.8 22.61986 .......................... 2,416 14 249 608 584 548 305 92 12 17.6 10.2 37.3 53.9 61.7 51.7 35.1 19.1 21.4
1985 .......................... 2,636 15 249 648 662 642 326 77 14 19.5 10.4 42.0 61.9 72.3 55.7 30.0 22.6 24.01984 .......................... 2,468 19 242 565 638 595 310 86 10 18.5 10.4 38.4 60.4 67.3 53.3 34.2 16.4 22.91983 .......................... 2,440 15 240 547 649 612 309 63 4 18.5 10.6 39.1 62.1 69.6 53.4 25.6 6.7 23.21982 .......................... 2,420 23 249 535 674 592 269 72 6 18.6 11.4 40.0 65.1 67.9 46.7 29.9 10.4 23.51981 .......................... 2,746 20 264 621 794 628 335 76 6 21.4 12.5 48.7 77.0 72.7 58.6 32.3 10.8 27.31980 .......................... 3,031 25 311 683 889 708 332 65 12 24.0 15.6 54.8 86.6 82.6 58.4 28.3 22.3 30.51979 .......................... 2,964 25 292 648 909 685 329 60 14 24.1 15.7 54.8 89.5 80.8 58.4 26.8 27.1 30.8
White, female1992 .......................... 7,427 23 174 628 958 1,486 2,187 1,542 429 6.8 1.0 3.8 8.0 15.6 23.8 26.0 20.0 4.61991 .......................... 7,646 18 198 646 949 1,616 2,241 1,567 409 7.1 1.1 3.9 8.5 16.9 24.6 26.9 19.6 4.8
- 167 -

Table 2. Age-specific number of deaths and age-specific and age-adjusted death rates per 100,000 population for selected alcohol-relatedcauses of death: United States, 1979–92.
All cirrhosis (ICD-9 571, 572.3)
Race, sex,and year
Number of deaths, by age group Deaths per 100,000 population, by age group Age-adjusted deathsper 100,000populationAll1 0-24 25-34 35-44 45-54 55-64 65-74 75-84 85+ All1 25-34 35-44 45-54 55-64 65-74 75-84 85+
White, female1990 .......................... 7,621 26 203 619 930 1,671 2,245 1,538 387 7.1 1.1 3.9 8.5 17.3 24.8 26.9 19.2 4.91989 .......................... 7,835 23 185 566 1,006 1,857 2,291 1,520 387 7.4 1.0 3.7 9.3 19.0 25.5 27.1 19.7 5.11988 .......................... 7,600 27 207 616 998 1,915 2,142 1,401 294 7.2 1.2 4.1 9.5 19.2 24.2 25.5 15.4 5.11987 .......................... 7,642 24 223 606 988 1,918 2,195 1,374 314 7.3 1.3 4.1 9.8 19.0 25.0 25.6 16.9 5.21986 .......................... 7,869 33 213 593 1,081 2,108 2,253 1,284 303 7.6 1.2 4.2 10.9 20.5 26.0 24.5 16.8 5.5
1985 .......................... 7,922 30 225 574 1,188 2,103 2,217 1,286 299 7.7 1.3 4.2 12.0 20.3 26.0 25.2 17.0 5.61984 .......................... 8,169 32 185 574 1,322 2,245 2,290 1,266 255 8.0 1.1 4.3 13.3 21.5 27.1 25.4 15.0 5.91983 .......................... 8,146 36 204 572 1,378 2,386 2,126 1,179 263 8.0 1.2 4.5 13.9 22.9 25.5 24.3 16.0 6.01982 .......................... 8,210 38 192 593 1,389 2,435 2,183 1,160 220 8.1 1.2 4.8 13.9 23.4 26.6 24.6 13.9 6.21981 .......................... 8,648 50 178 652 1,668 2,554 2,254 1,044 244 8.6 1.1 5.7 16.5 24.6 27.8 22.7 16.0 6.71980 .......................... 8,876 41 204 734 1,812 2,615 2,227 1,017 224 8.9 1.3 6.5 17.7 25.3 27.9 22.7 15.3 7.11979 .......................... 8,574 49 181 727 1,882 2,581 2,058 895 200 8.6 1.2 6.6 18.1 25.3 26.3 20.5 14.4 7.0
Black, female1992 .......................... 1,140 6 66 239 246 255 221 85 22 6.9 2.3 9.5 16.2 22.3 24.3 16.7 13.2 6.91991 .......................... 1,336 8 100 310 285 261 258 91 21 8.2 3.4 12.8 19.7 22.9 28.8 18.2 13.0 8.31990 .......................... 1,363 13 100 317 277 321 212 104 18 8.5 3.4 13.8 19.5 28.3 23.9 21.0 11.4 8.71989 .......................... 1,337 15 101 279 282 333 231 78 17 8.4 3.5 12.7 20.2 29.4 26.4 16.1 11.1 8.81988 .......................... 1,431 8 114 318 313 322 231 106 18 9.1 4.0 15.2 22.9 28.4 26.7 22.4 12.1 9.51987 .......................... 1,345 14 144 316 298 291 198 73 10 8.7 5.1 15.7 22.3 25.7 23.2 15.9 7.0 9.21986 .......................... 1,347 14 153 283 306 311 210 66 4 8.8 5.5 14.7 23.3 27.6 24.9 14.8 2.9 9.5
1985 .......................... 1,446 7 172 290 328 320 221 93 13 9.6 6.3 15.9 25.3 28.5 26.5 21.6 9.8 10.21984 .......................... 1,446 18 168 277 308 374 210 80 10 9.7 6.4 15.8 24.0 33.6 25.5 19.2 7.8 10.51983 .......................... 1,460 22 172 294 345 366 192 60 9 9.9 6.7 17.6 27.1 33.2 23.6 14.9 7.3 10.91982 .......................... 1,441 27 169 292 356 325 200 58 13 9.9 6.8 18.2 28.2 29.8 24.9 14.9 11.0 11.01981 .......................... 1,616 21 171 333 420 380 223 56 12 11.3 7.1 21.7 33.3 35.3 28.1 14.9 10.7 12.71980 .......................... 1,776 36 191 371 487 419 211 54 7 12.6 8.3 24.7 38.7 39.4 27.0 14.8 6.5 14.31979 .......................... 1,619 14 164 356 468 357 200 55 5 11.8 7.6 24.7 37.5 34.1 26.1 15.7 4.9 13.5
1 Includes deaths where age was unknown.
- 168 -

Table 2. Age-specific number of deaths and age-specific and age-adjusted death rates per 100,000 population for selected alcohol-relatedcauses of death: United States, 1979–92.
Alcoholic liver cirrhosis (ICD-9 571.0-571.3)
Race, sex,and year
Number of deaths, by age group Deaths per 100,000 population, by age group Age-adjusted deathsper 100,000populationAll1 0-24 25-34 35-44 45-54 55-64 65-74 75-84 85+ All1 25-34 35-44 45-54 55-64 65-74 75-84 85+
All races, both sexes1992 .......................... 11,868 12 514 2,383 2,819 3,067 2,303 672 96 4.7 1.2 6.0 10.3 14.7 12.5 6.4 3.0 4.11991 .......................... 11,688 13 542 2,378 2,654 3,029 2,245 741 77 4.6 1.3 6.1 10.3 14.4 12.3 7.2 2.4 4.21990 .......................... 11,985 19 580 2,381 2,700 3,198 2,320 701 76 4.8 1.3 6.3 10.7 15.2 12.8 7.0 2.5 4.31989 .......................... 12,308 23 650 2,302 2,862 3,376 2,328 696 65 5.0 1.5 6.3 11.6 15.9 13.0 7.1 2.2 4.51988 .......................... 11,792 17 665 2,163 2,710 3,376 2,169 630 58 4.8 1.5 6.1 11.3 15.7 12.3 6.6 2.0 4.41987 .......................... 11,265 27 665 2,033 2,575 3,282 2,031 582 64 4.6 1.6 5.9 11.1 15.1 11.7 6.2 2.3 4.31986 .......................... 11,060 30 708 1,866 2,482 3,188 2,174 548 58 4.6 1.7 5.7 11.0 14.5 12.7 6.0 2.1 4.3
1985 .......................... 11,288 17 725 1,817 2,598 3,432 2,121 534 38 4.7 1.7 5.7 11.6 15.5 12.6 6.0 1.4 4.41984 .......................... 11,386 25 640 1,791 2,651 3,490 2,168 566 50 4.8 1.6 5.9 11.8 15.8 13.0 6.5 1.9 4.51983 .......................... 11,076 22 653 1,625 2,694 3,444 2,091 509 35 4.7 1.6 5.6 12.1 15.6 12.7 6.0 1.4 4.41982 .......................... 11,293 28 653 1,669 2,830 3,497 2,110 466 36 4.9 1.7 6.0 12.6 15.9 13.1 5.7 1.5 4.61981 .......................... 12,085 35 630 1,772 3,219 3,726 2,166 472 60 5.3 1.6 6.7 14.3 17.0 13.6 5.9 2.6 5.01980 .......................... 12,938 36 694 1,942 3,554 3,923 2,274 453 56 5.7 1.9 7.5 15.6 18.0 14.5 5.8 2.5 5.51979 .......................... 12,547 28 652 1,867 3,520 3,864 2,189 381 42 5.6 1.8 7.4 15.3 18.0 14.3 5.0 1.9 5.4
All races, male1992 .......................... 8,777 8 341 1,792 2,113 2,301 1,694 469 57 7.1 1.6 9.1 15.8 23.2 20.9 11.7 6.3 6.51991 .......................... 8,487 6 350 1,723 1,967 2,258 1,610 520 48 6.9 1.6 8.9 15.6 22.7 20.1 13.4 5.5 6.41990 .......................... 8,676 14 367 1,745 2,011 2,363 1,621 490 56 7.1 1.7 9.3 16.4 23.7 20.4 13.0 6.6 6.71989 .......................... 9,012 15 455 1,731 2,100 2,461 1,693 509 42 7.5 2.1 9.6 17.5 24.6 21.6 13.8 5.1 7.01988 .......................... 8,530 11 442 1,569 1,999 2,423 1,601 440 41 7.2 2.1 9.0 17.1 24.0 20.8 12.3 5.1 6.81987 .......................... 8,221 11 440 1,504 1,897 2,426 1,483 413 41 7.0 2.1 8.9 16.9 23.8 19.5 11.9 5.1 6.61986 .......................... 7,931 22 482 1,353 1,794 2,279 1,573 381 42 6.8 2.3 8.3 16.3 22.1 21.0 11.3 5.4 6.5
1985 .......................... 8,129 11 487 1,316 1,865 2,520 1,501 402 23 7.0 2.3 8.4 17.1 24.3 20.5 12.2 3.0 6.71984 .......................... 8,107 19 448 1,306 1,890 2,484 1,526 394 36 7.1 2.2 8.7 17.4 23.9 21.1 12.3 4.8 6.81983 .......................... 7,828 11 463 1,149 1,899 2,428 1,497 352 27 6.9 2.3 8.0 17.5 23.5 21.0 11.3 3.7 6.71982 .......................... 7,997 21 439 1,196 2,005 2,474 1,510 324 24 7.1 2.2 8.7 18.4 24.0 21.6 10.7 3.3 6.91981 .......................... 8,478 19 442 1,253 2,218 2,598 1,559 346 40 7.6 2.3 9.7 20.3 25.3 22.6 11.7 5.7 7.51980 .......................... 9,088 18 473 1,353 2,469 2,776 1,637 319 39 8.2 2.5 10.7 22.5 27.3 24.1 11.0 5.7 8.11979 .......................... 8,793 22 473 1,289 2,415 2,698 1,589 280 24 8.1 2.6 10.5 21.8 26.9 23.9 9.9 3.6 8.0
All races, female1992 .......................... 3,091 4 173 591 706 766 609 203 39 2.4 0.8 2.9 5.0 7.0 5.9 3.1 1.7 2.01991 .......................... 3,201 7 192 655 687 771 635 221 29 2.5 0.9 3.3 5.2 7.0 6.2 3.4 1.3 2.11990 .......................... 3,309 5 213 636 689 835 699 211 20 2.6 1.0 3.3 5.3 7.5 6.9 3.3 0.9 2.31989 .......................... 3,296 8 195 571 762 915 635 187 23 2.6 0.9 3.1 6.0 8.1 6.3 3.0 1.1 2.31988 .......................... 3,262 6 223 594 711 953 568 190 17 2.6 1.0 3.3 5.8 8.4 5.7 3.1 0.8 2.31987 .......................... 3,044 16 225 529 678 856 548 169 23 2.4 1.0 3.0 5.7 7.4 5.6 2.9 1.1 2.21986 .......................... 3,129 8 226 513 688 909 601 167 16 2.5 1.1 3.1 5.9 7.8 6.2 2.9 0.8 2.3
1985 .......................... 3,159 6 238 501 733 912 620 132 15 2.6 1.1 3.1 6.4 7.8 6.5 2.4 0.8 2.41984 .......................... 3,279 6 192 485 761 1,006 642 172 14 2.7 0.9 3.1 6.6 8.5 6.8 3.2 0.8 2.4
- 169 -

Table 2. Age-specific number of deaths and age-specific and age-adjusted death rates per 100,000 population for selected alcohol-relatedcauses of death: United States, 1979–92.
Alcoholic liver cirrhosis (ICD-9 571.0-571.3)
Race, sex,and year
Number of deaths, by age group Deaths per 100,000 population, by age group Age-adjusted deathsper 100,000populationAll1 0-24 25-34 35-44 45-54 55-64 65-74 75-84 85+ All1 25-34 35-44 45-54 55-64 65-74 75-84 85+
All races, female1983 .......................... 3,248 11 190 476 795 1,016 594 157 8 2.7 0.9 3.2 6.9 8.6 6.4 3.0 0.4 2.51982 .......................... 3,296 7 214 473 825 1,023 600 142 12 2.8 1.1 3.3 7.1 8.7 6.6 2.7 0.7 2.61981 .......................... 3,607 16 188 519 1,001 1,128 607 126 20 3.1 1.0 3.9 8.6 9.7 6.7 2.5 1.2 2.91980 .......................... 3,850 18 221 589 1,085 1,147 637 134 17 3.3 1.2 4.5 9.2 9.9 7.2 2.7 1.1 3.11979 .......................... 3,754 6 179 578 1,105 1,166 600 101 18 3.3 1.0 4.5 9.3 10.2 6.9 2.1 1.2 3.1
White, male1992 .......................... 7,211 6 256 1,381 1,676 1,935 1,474 429 52 6.9 1.4 8.2 14.4 22.2 20.2 11.8 6.3 6.11991 .......................... 6,985 4 268 1,310 1,557 1,907 1,411 482 43 6.8 1.5 7.9 14.3 21.7 19.5 13.6 5.4 6.01990 .......................... 7,001 12 260 1,292 1,517 1,977 1,442 444 51 6.8 1.4 8.1 14.2 22.5 20.2 13.0 6.6 6.11989 .......................... 7,225 9 313 1,226 1,632 2,047 1,492 466 37 7.1 1.7 8.0 15.6 23.1 21.1 14.0 4.9 6.41988 .......................... 6,806 8 306 1,098 1,514 2,031 1,421 388 37 6.8 1.7 7.4 14.9 22.6 20.4 12.0 5.1 6.11987 .......................... 6,540 7 284 1,024 1,442 2,058 1,317 370 35 6.5 1.6 7.0 14.7 22.6 19.1 11.7 4.9 5.91986 .......................... 6,369 17 306 947 1,377 1,936 1,408 336 39 6.4 1.7 6.7 14.3 21.0 20.9 11.0 5.5 5.8
1985 .......................... 6,455 10 306 870 1,417 2,130 1,330 373 16 6.5 1.7 6.4 14.9 22.9 20.1 12.5 2.3 6.01984 .......................... 6,579 15 286 901 1,477 2,136 1,373 357 33 6.7 1.6 6.9 15.5 23.0 21.0 12.3 4.9 6.21983 .......................... 6,421 7 298 798 1,507 2,116 1,344 323 26 6.6 1.7 6.4 15.8 22.8 20.9 11.4 3.9 6.11982 .......................... 6,593 14 288 855 1,597 2,146 1,372 295 23 6.8 1.7 7.1 16.7 23.2 21.7 10.7 3.5 6.41981 .......................... 6,868 12 281 843 1,731 2,248 1,404 310 37 7.2 1.7 7.5 17.9 24.4 22.6 11.6 5.8 6.71980 .......................... 7,285 8 280 890 1,927 2,394 1,461 290 33 7.7 1.7 8.0 19.8 26.1 23.9 11.1 5.3 7.21979 .......................... 7,080 12 278 899 1,878 2,309 1,423 259 19 7.5 1.8 8.3 19.1 25.6 23.8 10.1 3.1 7.1
Black, male1992 .......................... 1,333 1 61 354 367 322 189 34 5 8.9 2.3 16.3 29.1 36.3 29.6 12.0 7.2 10.71991 .......................... 1,299 1 66 362 354 303 173 33 5 8.9 2.5 17.3 29.5 34.4 27.6 11.8 7.4 10.61990 .......................... 1,493 1 92 398 439 355 161 40 4 10.3 3.5 20.1 37.2 40.4 26.1 14.4 6.0 12.51989 .......................... 1,566 6 116 442 412 372 175 37 4 11.0 4.5 23.5 35.6 42.2 28.7 13.5 6.0 13.31988 .......................... 1,527 3 121 422 430 348 153 45 4 10.9 4.7 23.6 38.0 39.3 25.4 16.6 6.1 13.21987 .......................... 1,531 4 140 441 415 334 153 37 4 11.0 5.6 25.8 37.5 37.6 25.7 13.9 6.2 13.51986 .......................... 1,412 4 154 372 376 313 149 39 3 10.3 6.3 22.8 34.7 35.2 25.2 14.9 4.8 12.6
1985 .......................... 1,524 1 160 405 410 361 156 24 6 11.3 6.7 26.2 38.3 40.7 26.7 9.3 9.7 14.01984 .......................... 1,365 2 142 362 363 326 131 33 3 10.2 6.1 24.6 34.4 36.9 22.5 13.1 4.9 12.81983 .......................... 1,253 4 139 314 351 285 135 24 1 9.5 6.2 22.5 33.6 32.4 23.3 9.7 1.7 12.01982 .......................... 1,256 6 127 306 364 303 122 27 1 9.7 5.8 22.9 35.2 34.8 21.2 11.2 1.7 12.31981 .......................... 1,448 6 139 364 450 317 137 32 2 11.3 6.6 28.6 43.7 36.7 24.0 13.6 3.6 14.61980 .......................... 1,601 9 165 403 484 353 155 25 5 12.7 8.3 32.4 47.1 41.2 27.2 10.9 9.3 16.31979 .......................... 1,541 9 160 352 492 355 151 17 5 12.5 8.6 29.8 48.4 41.9 26.8 7.6 9.7 16.1
White, female1992 .......................... 2,382 3 109 405 521 609 520 183 32 2.2 0.6 2.4 4.4 6.4 5.7 3.1 1.5 1.81991 .......................... 2,408 3 126 410 490 636 525 191 25 2.2 0.7 2.5 4.4 6.6 5.8 3.3 1.2 1.9
- 170 -

Table 2. Age-specific number of deaths and age-specific and age-adjusted death rates per 100,000 population for selected alcohol-relatedcauses of death: United States, 1979–92.
Alcoholic liver cirrhosis (ICD-9 571.0-571.3)
Race, sex,and year
Number of deaths, by age group Deaths per 100,000 population, by age group Age-adjusted deathsper 100,000populationAll1 0-24 25-34 35-44 45-54 55-64 65-74 75-84 85+ All1 25-34 35-44 45-54 55-64 65-74 75-84 85+
White, female1990 .......................... 2,481 4 126 393 494 647 615 185 17 2.3 0.7 2.5 4.5 6.7 6.8 3.2 0.8 1.91989 .......................... 2,464 4 114 344 542 724 543 171 22 2.3 0.6 2.2 5.0 7.4 6.1 3.1 1.1 2.01988 .......................... 2,430 5 132 354 498 777 487 164 13 2.3 0.7 2.4 4.7 7.8 5.5 3.0 0.7 2.01987 .......................... 2,312 7 132 330 485 700 487 150 21 2.2 0.7 2.2 4.8 6.9 5.5 2.8 1.1 1.91986 .......................... 2,405 4 120 323 509 759 522 152 15 2.3 0.7 2.3 5.1 7.4 6.0 2.9 0.8 2.0
1985 .......................... 2,366 3 118 302 536 740 536 120 11 2.3 0.7 2.2 5.4 7.1 6.3 2.4 0.6 2.01984 .......................... 2,499 3 77 294 587 809 560 157 12 2.4 0.4 2.2 5.9 7.8 6.6 3.2 0.7 2.11983 .......................... 2,516 3 94 296 605 844 520 146 7 2.5 0.6 2.3 6.1 8.1 6.2 3.0 0.4 2.11982 .......................... 2,566 4 102 292 635 866 528 130 9 2.5 0.6 2.4 6.3 8.3 6.4 2.8 0.6 2.21981 .......................... 2,789 10 79 327 757 940 540 117 17 2.8 0.5 2.8 7.5 9.0 6.7 2.5 1.1 2.51980 .......................... 2,937 6 102 379 794 952 567 118 17 2.9 0.6 3.4 7.8 9.2 7.1 2.6 1.2 2.61979 .......................... 2,887 3 71 357 828 985 531 95 16 2.9 0.5 3.2 8.0 9.7 6.8 2.2 1.2 2.6
Black, female1992 .......................... 584 0 43 155 152 131 80 17 6 3.5 1.5 6.2 10.0 11.4 8.8 3.3 3.6 3.71991 .......................... 678 3 50 211 165 116 100 27 4 4.2 1.7 8.7 11.4 10.2 11.1 5.4 2.5 4.31990 .......................... 709 0 62 217 166 163 74 23 3 4.4 2.1 9.4 11.7 14.4 8.3 4.6 1.9 4.71989 .......................... 688 3 62 189 180 162 76 15 1 4.3 2.1 8.6 12.9 14.3 8.7 3.1 0.7 4.71988 .......................... 711 0 69 208 174 155 77 24 4 4.5 2.4 9.9 12.7 13.7 8.9 5.1 2.7 4.91987 .......................... 645 6 82 182 168 131 56 18 2 4.2 2.9 9.1 12.6 11.6 6.6 3.9 1.4 4.61986 .......................... 646 3 89 171 156 140 74 13 0 4.2 3.2 8.9 11.9 12.4 8.8 2.9 0.0 4.7
1985 .......................... 702 3 103 173 177 150 78 12 4 4.7 3.8 9.5 13.6 13.4 9.4 2.8 3.0 5.11984 .......................... 686 3 101 156 153 183 74 13 2 4.6 3.8 8.9 11.9 16.4 9.0 3.1 1.6 5.11983 .......................... 651 6 87 160 166 157 65 9 1 4.4 3.4 9.6 13.0 14.2 8.0 2.2 0.8 5.01982 .......................... 647 3 94 159 166 143 69 10 3 4.5 3.8 9.9 13.1 13.1 8.6 2.6 2.5 5.11981 .......................... 710 2 94 161 210 171 63 6 3 5.0 3.9 10.5 16.7 15.9 7.9 1.6 2.7 5.81980 .......................... 805 12 99 176 258 183 63 14 0 5.7 4.3 11.7 20.5 17.2 8.1 3.8 0.0 6.71979 .......................... 754 2 84 187 246 163 64 6 2 5.5 3.9 13.0 19.7 15.6 8.4 1.7 2.0 6.5
1 Includes deaths where age was unknown.
- 171 -

Table 2. Age-specific number of deaths and age-specific and age-adjusted death rates per 100,000 population for selected alcohol-relatedcauses of death: United States, 1979–92.
Other specified liver cirrhosis without mention of alcohol (ICD-9 571.4, 571.6, 571.8, 572.3)
Race, sex,and year
Number of deaths, by age group Deaths per 100,000 population, by age group Age-adjusted deathsper 100,000populationAll1 0-24 25-34 35-44 45-54 55-64 65-74 75-84 85+ All1 25-34 35-44 45-54 55-64 65-74 75-84 85+
All races, both sexes1992 .......................... 1,789 30 79 249 245 282 446 357 100 0.7 0.2 0.6 0.9 1.3 2.4 3.4 3.1 0.51991 .......................... 1,821 30 110 227 272 330 440 338 70 0.7 0.3 0.6 1.1 1.6 2.4 3.3 2.2 0.61990 .......................... 1,811 23 119 241 250 327 459 316 73 0.7 0.3 0.6 1.0 1.6 2.5 3.1 2.4 0.61989 .......................... 1,932 32 102 287 294 387 461 293 75 0.8 0.2 0.8 1.2 1.8 2.6 3.0 2.5 0.61988 .......................... 2,067 35 161 316 309 410 473 295 67 0.8 0.4 0.9 1.3 1.9 2.7 3.1 2.3 0.71987 .......................... 2,279 39 186 339 333 470 520 316 76 0.9 0.4 1.0 1.4 2.2 3.0 3.4 2.7 0.81986 .......................... 2,179 45 193 325 303 469 499 276 68 0.9 0.5 1.0 1.3 2.1 2.9 3.0 2.5 0.8
1985 .......................... 2,447 46 221 357 403 543 507 303 64 1.0 0.5 1.1 1.8 2.5 3.0 3.4 2.4 0.91984 .......................... 2,555 54 227 383 431 574 513 313 60 1.1 0.6 1.3 1.9 2.6 3.1 3.6 2.3 0.91983 .......................... 2,495 62 215 357 424 607 496 281 50 1.1 0.5 1.2 1.9 2.7 3.0 3.3 2.0 0.91982 .......................... 2,669 63 226 371 507 645 511 292 53 1.2 0.6 1.3 2.3 2.9 3.2 3.6 2.2 1.01981 .......................... 2,654 76 245 391 537 592 516 233 63 1.2 0.6 1.5 2.4 2.7 3.2 2.9 2.7 1.11980 .......................... 3,000 79 285 452 588 714 558 249 72 1.3 0.8 1.8 2.6 3.3 3.6 3.2 3.2 1.21979 .......................... 2,764 65 244 413 613 633 493 234 65 1.2 0.7 1.6 2.7 3.0 3.2 3.1 3.0 1.1
All races, male1992 .......................... 760 17 38 159 143 130 145 99 28 0.6 0.2 0.8 1.1 1.3 1.8 2.5 3.1 0.51991 .......................... 780 15 65 139 154 150 125 108 20 0.6 0.3 0.7 1.2 1.5 1.6 2.8 2.3 0.61990 .......................... 793 7 72 160 150 135 159 90 17 0.7 0.3 0.9 1.2 1.4 2.0 2.4 2.0 0.61989 .......................... 916 17 63 203 173 171 184 87 18 0.8 0.3 1.1 1.4 1.7 2.4 2.4 2.2 0.71988 .......................... 978 18 103 216 169 203 161 91 16 0.8 0.5 1.2 1.4 2.0 2.1 2.5 2.0 0.71987 .......................... 1,103 29 118 217 203 202 203 108 23 0.9 0.6 1.3 1.8 2.0 2.7 3.1 2.9 0.91986 .......................... 1,030 23 114 208 175 207 186 95 21 0.9 0.5 1.3 1.6 2.0 2.5 2.8 2.7 0.8
1985 .......................... 1,201 28 139 234 219 258 201 96 23 1.0 0.7 1.5 2.0 2.5 2.7 2.9 3.0 1.01984 .......................... 1,245 29 138 246 225 277 197 111 22 1.1 0.7 1.6 2.1 2.7 2.7 3.5 2.9 1.01983 .......................... 1,232 25 135 220 228 297 198 105 21 1.1 0.7 1.5 2.1 2.9 2.8 3.4 2.9 1.01982 .......................... 1,351 33 149 217 288 336 206 103 18 1.2 0.8 1.6 2.6 3.3 2.9 3.4 2.5 1.21981 .......................... 1,371 41 156 232 306 288 228 90 29 1.2 0.8 1.8 2.8 2.8 3.3 3.0 4.1 1.21980 .......................... 1,589 50 189 249 338 385 260 95 20 1.4 1.0 2.0 3.1 3.8 3.8 3.3 2.9 1.41979 .......................... 1,459 34 153 236 345 356 208 105 18 1.3 0.9 1.9 3.1 3.6 3.1 3.7 2.7 1.3
All races, female1992 .......................... 1,029 13 41 90 102 152 301 258 72 0.8 0.2 0.4 0.7 1.4 2.9 3.9 3.1 0.51991 .......................... 1,041 15 45 88 118 180 315 230 50 0.8 0.2 0.4 0.9 1.6 3.1 3.6 2.2 0.61990 .......................... 1,018 16 47 81 100 192 300 226 56 0.8 0.2 0.4 0.8 1.7 3.0 3.6 2.5 0.61989 .......................... 1,016 15 39 84 121 216 277 206 57 0.8 0.2 0.5 1.0 1.9 2.8 3.3 2.7 0.61988 .......................... 1,089 17 58 100 140 207 312 204 51 0.9 0.3 0.6 1.1 1.8 3.1 3.4 2.5 0.61987 .......................... 1,176 10 68 122 130 268 317 208 53 0.9 0.3 0.7 1.1 2.3 3.2 3.5 2.6 0.71986 .......................... 1,149 22 79 117 128 262 313 181 47 0.9 0.4 0.7 1.1 2.2 3.2 3.2 2.4 0.7
1985 .......................... 1,246 18 82 123 184 285 306 207 41 1.0 0.4 0.8 1.6 2.4 3.2 3.7 2.2 0.81984 .......................... 1,310 25 89 137 206 297 316 202 38 1.1 0.4 0.9 1.8 2.5 3.4 3.7 2.1 0.9
- 172 -
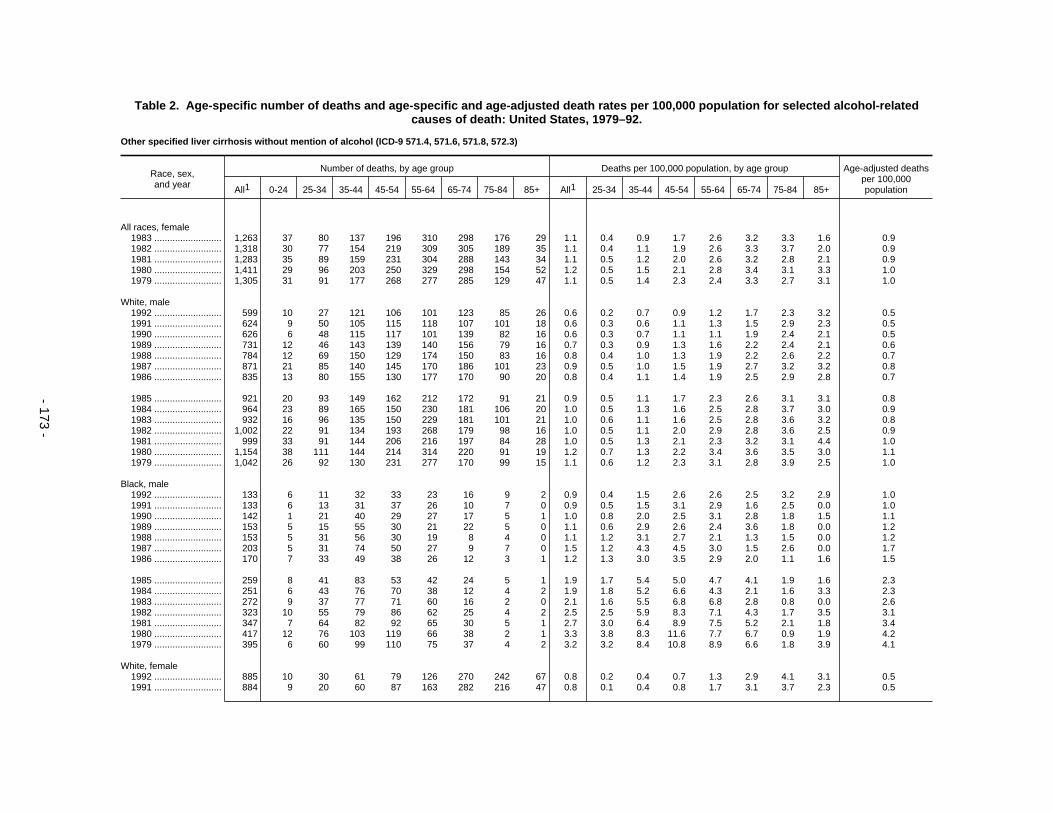
Table 2. Age-specific number of deaths and age-specific and age-adjusted death rates per 100,000 population for selected alcohol-relatedcauses of death: United States, 1979–92.
Other specified liver cirrhosis without mention of alcohol (ICD-9 571.4, 571.6, 571.8, 572.3)
Race, sex,and year
Number of deaths, by age group Deaths per 100,000 population, by age group Age-adjusted deathsper 100,000populationAll1 0-24 25-34 35-44 45-54 55-64 65-74 75-84 85+ All1 25-34 35-44 45-54 55-64 65-74 75-84 85+
All races, female1983 .......................... 1,263 37 80 137 196 310 298 176 29 1.1 0.4 0.9 1.7 2.6 3.2 3.3 1.6 0.91982 .......................... 1,318 30 77 154 219 309 305 189 35 1.1 0.4 1.1 1.9 2.6 3.3 3.7 2.0 0.91981 .......................... 1,283 35 89 159 231 304 288 143 34 1.1 0.5 1.2 2.0 2.6 3.2 2.8 2.1 0.91980 .......................... 1,411 29 96 203 250 329 298 154 52 1.2 0.5 1.5 2.1 2.8 3.4 3.1 3.3 1.01979 .......................... 1,305 31 91 177 268 277 285 129 47 1.1 0.5 1.4 2.3 2.4 3.3 2.7 3.1 1.0
White, male1992 .......................... 599 10 27 121 106 101 123 85 26 0.6 0.2 0.7 0.9 1.2 1.7 2.3 3.2 0.51991 .......................... 624 9 50 105 115 118 107 101 18 0.6 0.3 0.6 1.1 1.3 1.5 2.9 2.3 0.51990 .......................... 626 6 48 115 117 101 139 82 16 0.6 0.3 0.7 1.1 1.1 1.9 2.4 2.1 0.51989 .......................... 731 12 46 143 139 140 156 79 16 0.7 0.3 0.9 1.3 1.6 2.2 2.4 2.1 0.61988 .......................... 784 12 69 150 129 174 150 83 16 0.8 0.4 1.0 1.3 1.9 2.2 2.6 2.2 0.71987 .......................... 871 21 85 140 145 170 186 101 23 0.9 0.5 1.0 1.5 1.9 2.7 3.2 3.2 0.81986 .......................... 835 13 80 155 130 177 170 90 20 0.8 0.4 1.1 1.4 1.9 2.5 2.9 2.8 0.7
1985 .......................... 921 20 93 149 162 212 172 91 21 0.9 0.5 1.1 1.7 2.3 2.6 3.1 3.1 0.81984 .......................... 964 23 89 165 150 230 181 106 20 1.0 0.5 1.3 1.6 2.5 2.8 3.7 3.0 0.91983 .......................... 932 16 96 135 150 229 181 101 21 1.0 0.6 1.1 1.6 2.5 2.8 3.6 3.2 0.81982 .......................... 1,002 22 91 134 193 268 179 98 16 1.0 0.5 1.1 2.0 2.9 2.8 3.6 2.5 0.91981 .......................... 999 33 91 144 206 216 197 84 28 1.0 0.5 1.3 2.1 2.3 3.2 3.1 4.4 1.01980 .......................... 1,154 38 111 144 214 314 220 91 19 1.2 0.7 1.3 2.2 3.4 3.6 3.5 3.0 1.11979 .......................... 1,042 26 92 130 231 277 170 99 15 1.1 0.6 1.2 2.3 3.1 2.8 3.9 2.5 1.0
Black, male1992 .......................... 133 6 11 32 33 23 16 9 2 0.9 0.4 1.5 2.6 2.6 2.5 3.2 2.9 1.01991 .......................... 133 6 13 31 37 26 10 7 0 0.9 0.5 1.5 3.1 2.9 1.6 2.5 0.0 1.01990 .......................... 142 1 21 40 29 27 17 5 1 1.0 0.8 2.0 2.5 3.1 2.8 1.8 1.5 1.11989 .......................... 153 5 15 55 30 21 22 5 0 1.1 0.6 2.9 2.6 2.4 3.6 1.8 0.0 1.21988 .......................... 153 5 31 56 30 19 8 4 0 1.1 1.2 3.1 2.7 2.1 1.3 1.5 0.0 1.21987 .......................... 203 5 31 74 50 27 9 7 0 1.5 1.2 4.3 4.5 3.0 1.5 2.6 0.0 1.71986 .......................... 170 7 33 49 38 26 12 3 1 1.2 1.3 3.0 3.5 2.9 2.0 1.1 1.6 1.5
1985 .......................... 259 8 41 83 53 42 24 5 1 1.9 1.7 5.4 5.0 4.7 4.1 1.9 1.6 2.31984 .......................... 251 6 43 76 70 38 12 4 2 1.9 1.8 5.2 6.6 4.3 2.1 1.6 3.3 2.31983 .......................... 272 9 37 77 71 60 16 2 0 2.1 1.6 5.5 6.8 6.8 2.8 0.8 0.0 2.61982 .......................... 323 10 55 79 86 62 25 4 2 2.5 2.5 5.9 8.3 7.1 4.3 1.7 3.5 3.11981 .......................... 347 7 64 82 92 65 30 5 1 2.7 3.0 6.4 8.9 7.5 5.2 2.1 1.8 3.41980 .......................... 417 12 76 103 119 66 38 2 1 3.3 3.8 8.3 11.6 7.7 6.7 0.9 1.9 4.21979 .......................... 395 6 60 99 110 75 37 4 2 3.2 3.2 8.4 10.8 8.9 6.6 1.8 3.9 4.1
White, female1992 .......................... 885 10 30 61 79 126 270 242 67 0.8 0.2 0.4 0.7 1.3 2.9 4.1 3.1 0.51991 .......................... 884 9 20 60 87 163 282 216 47 0.8 0.1 0.4 0.8 1.7 3.1 3.7 2.3 0.5
- 173 -
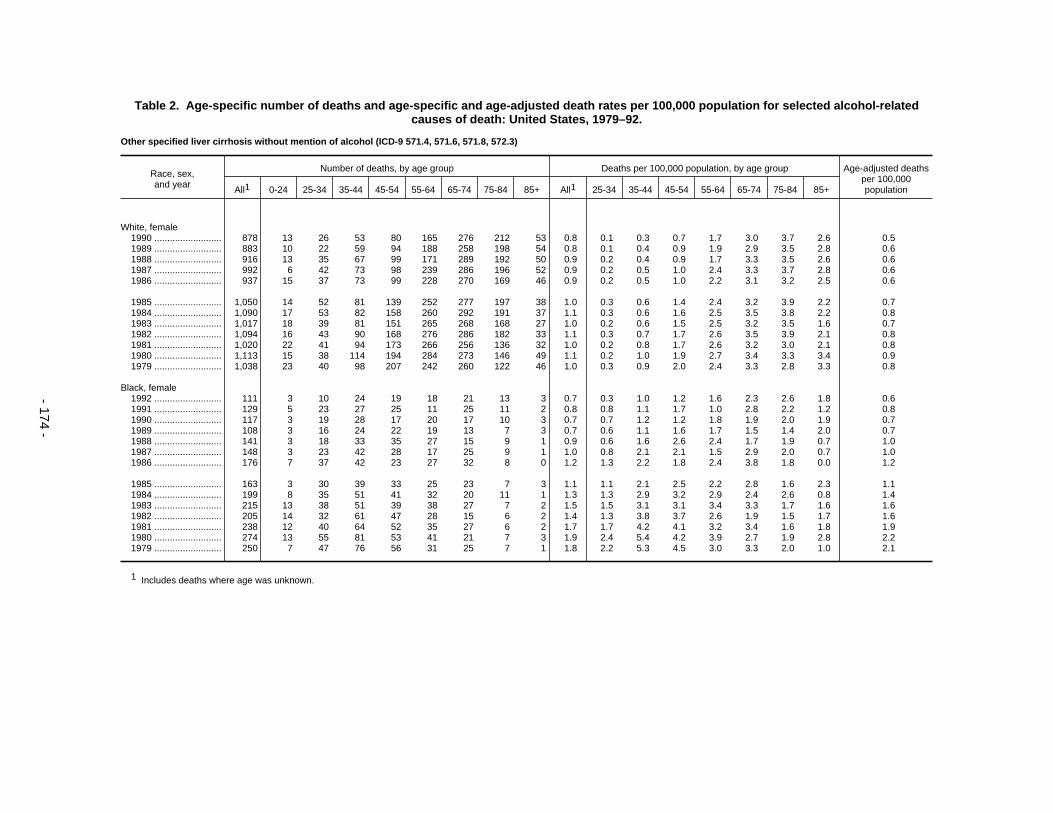
Table 2. Age-specific number of deaths and age-specific and age-adjusted death rates per 100,000 population for selected alcohol-relatedcauses of death: United States, 1979–92.
Other specified liver cirrhosis without mention of alcohol (ICD-9 571.4, 571.6, 571.8, 572.3)
Race, sex,and year
Number of deaths, by age group Deaths per 100,000 population, by age group Age-adjusted deathsper 100,000populationAll1 0-24 25-34 35-44 45-54 55-64 65-74 75-84 85+ All1 25-34 35-44 45-54 55-64 65-74 75-84 85+
White, female1990 .......................... 878 13 26 53 80 165 276 212 53 0.8 0.1 0.3 0.7 1.7 3.0 3.7 2.6 0.51989 .......................... 883 10 22 59 94 188 258 198 54 0.8 0.1 0.4 0.9 1.9 2.9 3.5 2.8 0.61988 .......................... 916 13 35 67 99 171 289 192 50 0.9 0.2 0.4 0.9 1.7 3.3 3.5 2.6 0.61987 .......................... 992 6 42 73 98 239 286 196 52 0.9 0.2 0.5 1.0 2.4 3.3 3.7 2.8 0.61986 .......................... 937 15 37 73 99 228 270 169 46 0.9 0.2 0.5 1.0 2.2 3.1 3.2 2.5 0.6
1985 .......................... 1,050 14 52 81 139 252 277 197 38 1.0 0.3 0.6 1.4 2.4 3.2 3.9 2.2 0.71984 .......................... 1,090 17 53 82 158 260 292 191 37 1.1 0.3 0.6 1.6 2.5 3.5 3.8 2.2 0.81983 .......................... 1,017 18 39 81 151 265 268 168 27 1.0 0.2 0.6 1.5 2.5 3.2 3.5 1.6 0.71982 .......................... 1,094 16 43 90 168 276 286 182 33 1.1 0.3 0.7 1.7 2.6 3.5 3.9 2.1 0.81981 .......................... 1,020 22 41 94 173 266 256 136 32 1.0 0.2 0.8 1.7 2.6 3.2 3.0 2.1 0.81980 .......................... 1,113 15 38 114 194 284 273 146 49 1.1 0.2 1.0 1.9 2.7 3.4 3.3 3.4 0.91979 .......................... 1,038 23 40 98 207 242 260 122 46 1.0 0.3 0.9 2.0 2.4 3.3 2.8 3.3 0.8
Black, female1992 .......................... 111 3 10 24 19 18 21 13 3 0.7 0.3 1.0 1.2 1.6 2.3 2.6 1.8 0.61991 .......................... 129 5 23 27 25 11 25 11 2 0.8 0.8 1.1 1.7 1.0 2.8 2.2 1.2 0.81990 .......................... 117 3 19 28 17 20 17 10 3 0.7 0.7 1.2 1.2 1.8 1.9 2.0 1.9 0.71989 .......................... 108 3 16 24 22 19 13 7 3 0.7 0.6 1.1 1.6 1.7 1.5 1.4 2.0 0.71988 .......................... 141 3 18 33 35 27 15 9 1 0.9 0.6 1.6 2.6 2.4 1.7 1.9 0.7 1.01987 .......................... 148 3 23 42 28 17 25 9 1 1.0 0.8 2.1 2.1 1.5 2.9 2.0 0.7 1.01986 .......................... 176 7 37 42 23 27 32 8 0 1.2 1.3 2.2 1.8 2.4 3.8 1.8 0.0 1.2
1985 .......................... 163 3 30 39 33 25 23 7 3 1.1 1.1 2.1 2.5 2.2 2.8 1.6 2.3 1.11984 .......................... 199 8 35 51 41 32 20 11 1 1.3 1.3 2.9 3.2 2.9 2.4 2.6 0.8 1.41983 .......................... 215 13 38 51 39 38 27 7 2 1.5 1.5 3.1 3.1 3.4 3.3 1.7 1.6 1.61982 .......................... 205 14 32 61 47 28 15 6 2 1.4 1.3 3.8 3.7 2.6 1.9 1.5 1.7 1.61981 .......................... 238 12 40 64 52 35 27 6 2 1.7 1.7 4.2 4.1 3.2 3.4 1.6 1.8 1.91980 .......................... 274 13 55 81 53 41 21 7 3 1.9 2.4 5.4 4.2 3.9 2.7 1.9 2.8 2.21979 .......................... 250 7 47 76 56 31 25 7 1 1.8 2.2 5.3 4.5 3.0 3.3 2.0 1.0 2.1
1 Includes deaths where age was unknown.
- 174 -

Table 2. Age-specific number of deaths and age-specific and age-adjusted death rates per 100,000 population for selected alcohol-relatedcauses of death: United States, 1979–92.
Unspecified liver cirrhosis without mention of alcohol (ICD-9 571.5, 571.9)
Race, sex,and year
Number of deaths, by age group Deaths per 100,000 population, by age group Age-adjusted deathsper 100,000populationAll1 0-24 25-34 35-44 45-54 55-64 65-74 75-84 85+ All1 25-34 35-44 45-54 55-64 65-74 75-84 85+
All races, both sexes1992 .......................... 11,750 28 176 987 1,528 2,458 3,551 2,416 603 4.6 0.4 2.5 5.6 11.8 19.2 22.9 18.5 3.41991 .......................... 12,053 23 212 991 1,544 2,717 3,573 2,396 592 4.8 0.5 2.5 6.0 12.9 19.6 23.2 18.8 3.61990 .......................... 12,124 34 195 1,001 1,567 2,807 3,532 2,422 564 4.9 0.5 2.7 6.2 13.3 19.5 24.0 18.5 3.71989 .......................... 12,583 36 233 1,029 1,588 3,024 3,731 2,372 568 5.1 0.5 2.8 6.4 14.2 20.9 24.1 19.1 3.91988 .......................... 12,713 35 235 1,102 1,782 3,234 3,661 2,191 470 5.2 0.5 3.1 7.4 15.0 20.8 22.8 16.3 4.11987 .......................... 12,807 39 296 1,059 1,732 3,360 3,693 2,160 466 5.3 0.7 3.1 7.5 15.4 21.2 23.0 16.5 4.21986 .......................... 13,071 34 285 1,016 1,861 3,546 3,821 2,053 454 5.4 0.7 3.1 8.2 16.1 22.3 22.5 16.6 4.3
1985 .......................... 13,192 37 304 952 1,994 3,611 3,782 2,070 440 5.5 0.7 3.0 8.9 16.3 22.4 23.3 16.5 4.41984 .......................... 13,527 47 301 910 2,162 3,792 3,928 2,001 384 5.7 0.7 3.0 9.7 17.1 23.6 23.1 14.8 4.71983 .......................... 13,843 37 342 985 2,343 4,046 3,790 1,903 394 5.9 0.9 3.4 10.5 18.3 23.1 22.6 15.6 4.91982 .......................... 13,876 56 325 981 2,389 4,052 3,880 1,833 358 6.0 0.8 3.5 10.7 18.4 24.0 22.3 14.7 5.01981 .......................... 14,712 49 321 1,084 2,657 4,343 4,090 1,787 378 6.4 0.8 4.1 11.8 19.8 25.7 22.4 16.1 5.41980 .......................... 14,792 65 314 1,104 2,935 4,444 3,906 1,687 331 6.5 0.8 4.3 12.9 20.4 25.0 21.7 14.6 5.51979 .......................... 14,540 62 333 1,222 3,009 4,313 3,755 1,551 293 6.5 0.9 4.9 13.1 20.1 24.5 20.4 13.5 5.6
All races, male1992 .......................... 7,035 14 125 760 1,082 1,569 1,993 1,236 253 5.7 0.6 3.8 8.1 15.8 24.5 30.9 27.9 4.71991 .......................... 7,075 17 131 736 1,065 1,739 1,980 1,165 237 5.8 0.6 3.8 8.5 17.5 24.7 29.9 27.0 4.81990 .......................... 7,226 14 121 747 1,104 1,783 2,033 1,191 233 5.9 0.6 4.0 9.0 17.9 25.6 31.5 27.4 5.01989 .......................... 7,469 18 157 792 1,125 1,907 2,077 1,148 243 6.2 0.7 4.4 9.4 19.1 26.5 31.2 29.2 5.31988 .......................... 7,789 20 168 825 1,263 2,099 2,132 1,056 224 6.5 0.8 4.8 10.8 20.8 27.7 29.5 27.6 5.71987 .......................... 7,823 22 207 754 1,204 2,208 2,135 1,077 215 6.6 1.0 4.5 10.7 21.6 28.0 30.9 26.9 5.81986 .......................... 7,925 16 201 735 1,244 2,259 2,235 1,033 201 6.8 1.0 4.5 11.3 21.9 29.9 30.5 25.8 5.9
1985 .......................... 8,015 23 206 667 1,347 2,335 2,241 1,015 179 6.9 1.0 4.3 12.3 22.5 30.5 30.8 23.5 6.11984 .......................... 8,310 28 211 632 1,456 2,433 2,361 1,018 169 7.2 1.0 4.2 13.4 23.4 32.7 31.8 22.6 6.41983 .......................... 8,568 19 222 700 1,559 2,584 2,333 991 158 7.5 1.1 4.9 14.4 25.0 32.7 31.7 21.6 6.81982 .......................... 8,656 26 233 689 1,643 2,583 2,379 933 169 7.7 1.2 5.0 15.1 25.1 34.0 30.7 23.6 6.91981 .......................... 9,129 24 222 737 1,740 2,808 2,478 944 175 8.2 1.1 5.7 15.9 27.4 36.0 31.9 25.0 7.41980 .......................... 9,189 33 206 737 1,918 2,851 2,379 893 166 8.3 1.1 5.8 17.5 28.0 35.1 30.9 24.1 7.61979 .......................... 9,203 34 225 846 1,980 2,778 2,367 820 151 8.4 1.3 6.9 17.9 27.7 35.6 29.1 22.6 7.8
All races, female1992 .......................... 4,715 14 51 227 446 889 1,558 1,180 350 3.6 0.2 1.1 3.2 8.1 15.1 18.0 14.9 2.31991 .......................... 4,978 6 81 255 479 978 1,593 1,231 355 3.9 0.4 1.3 3.6 8.8 15.6 19.2 15.6 2.51990 .......................... 4,898 20 74 254 463 1,024 1,499 1,231 331 3.8 0.3 1.3 3.6 9.2 14.7 19.5 15.0 2.51989 .......................... 5,114 18 76 237 463 1,117 1,654 1,224 325 4.0 0.4 1.3 3.7 9.9 16.5 19.8 15.2 2.71988 .......................... 4,924 15 67 277 519 1,135 1,529 1,135 246 3.9 0.3 1.6 4.2 10.0 15.4 18.8 11.9 2.71987 .......................... 4,984 17 89 305 528 1,152 1,558 1,083 251 4.0 0.4 1.8 4.5 10.0 15.9 18.4 12.4 2.81986 .......................... 5,146 18 84 281 617 1,287 1,586 1,020 253 4.2 0.4 1.7 5.3 11.0 16.4 17.8 12.9 3.0
1985 .......................... 5,177 14 98 285 647 1,276 1,541 1,055 261 4.2 0.5 1.8 5.6 10.9 16.2 18.8 13.7 3.01984 .......................... 5,217 19 90 278 706 1,359 1,567 983 215 4.3 0.4 1.8 6.1 11.5 16.7 18.0 11.6 3.1
- 175 -
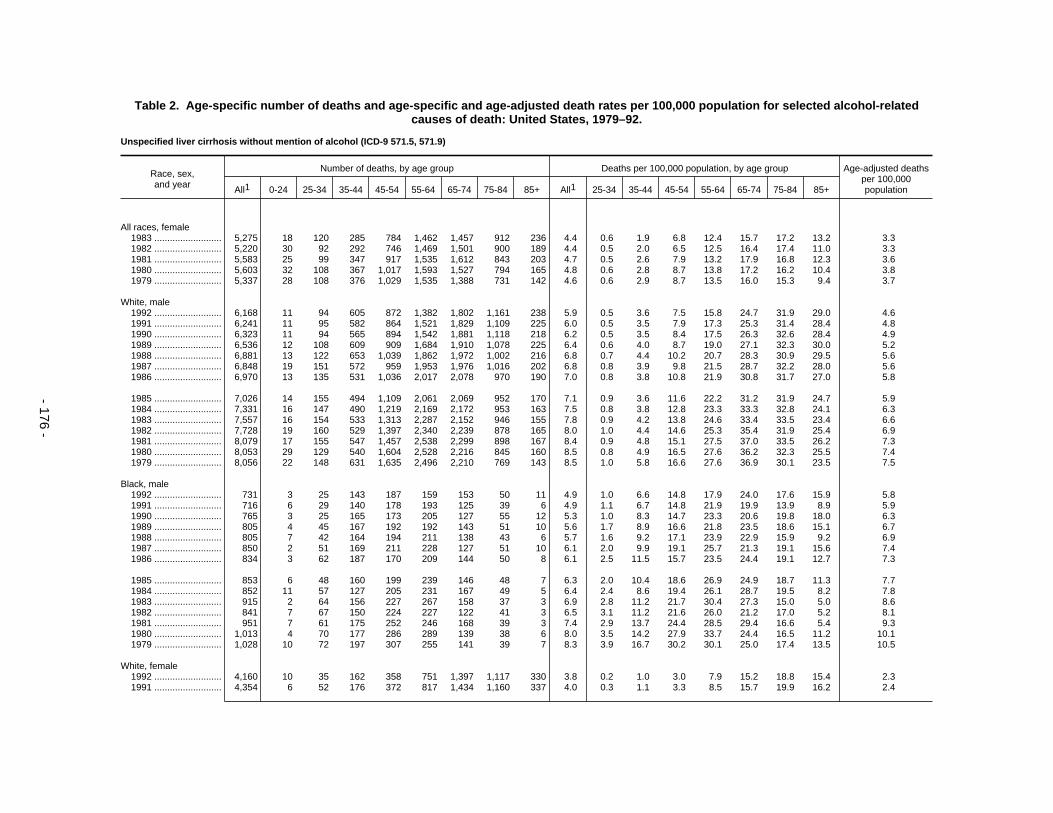
Table 2. Age-specific number of deaths and age-specific and age-adjusted death rates per 100,000 population for selected alcohol-relatedcauses of death: United States, 1979–92.
Unspecified liver cirrhosis without mention of alcohol (ICD-9 571.5, 571.9)
Race, sex,and year
Number of deaths, by age group Deaths per 100,000 population, by age group Age-adjusted deathsper 100,000populationAll1 0-24 25-34 35-44 45-54 55-64 65-74 75-84 85+ All1 25-34 35-44 45-54 55-64 65-74 75-84 85+
All races, female1983 .......................... 5,275 18 120 285 784 1,462 1,457 912 236 4.4 0.6 1.9 6.8 12.4 15.7 17.2 13.2 3.31982 .......................... 5,220 30 92 292 746 1,469 1,501 900 189 4.4 0.5 2.0 6.5 12.5 16.4 17.4 11.0 3.31981 .......................... 5,583 25 99 347 917 1,535 1,612 843 203 4.7 0.5 2.6 7.9 13.2 17.9 16.8 12.3 3.61980 .......................... 5,603 32 108 367 1,017 1,593 1,527 794 165 4.8 0.6 2.8 8.7 13.8 17.2 16.2 10.4 3.81979 .......................... 5,337 28 108 376 1,029 1,535 1,388 731 142 4.6 0.6 2.9 8.7 13.5 16.0 15.3 9.4 3.7
White, male1992 .......................... 6,168 11 94 605 872 1,382 1,802 1,161 238 5.9 0.5 3.6 7.5 15.8 24.7 31.9 29.0 4.61991 .......................... 6,241 11 95 582 864 1,521 1,829 1,109 225 6.0 0.5 3.5 7.9 17.3 25.3 31.4 28.4 4.81990 .......................... 6,323 11 94 565 894 1,542 1,881 1,118 218 6.2 0.5 3.5 8.4 17.5 26.3 32.6 28.4 4.91989 .......................... 6,536 12 108 609 909 1,684 1,910 1,078 225 6.4 0.6 4.0 8.7 19.0 27.1 32.3 30.0 5.21988 .......................... 6,881 13 122 653 1,039 1,862 1,972 1,002 216 6.8 0.7 4.4 10.2 20.7 28.3 30.9 29.5 5.61987 .......................... 6,848 19 151 572 959 1,953 1,976 1,016 202 6.8 0.8 3.9 9.8 21.5 28.7 32.2 28.0 5.61986 .......................... 6,970 13 135 531 1,036 2,017 2,078 970 190 7.0 0.8 3.8 10.8 21.9 30.8 31.7 27.0 5.8
1985 .......................... 7,026 14 155 494 1,109 2,061 2,069 952 170 7.1 0.9 3.6 11.6 22.2 31.2 31.9 24.7 5.91984 .......................... 7,331 16 147 490 1,219 2,169 2,172 953 163 7.5 0.8 3.8 12.8 23.3 33.3 32.8 24.1 6.31983 .......................... 7,557 16 154 533 1,313 2,287 2,152 946 155 7.8 0.9 4.2 13.8 24.6 33.4 33.5 23.4 6.61982 .......................... 7,728 19 160 529 1,397 2,340 2,239 878 165 8.0 1.0 4.4 14.6 25.3 35.4 31.9 25.4 6.91981 .......................... 8,079 17 155 547 1,457 2,538 2,299 898 167 8.4 0.9 4.8 15.1 27.5 37.0 33.5 26.2 7.31980 .......................... 8,053 29 129 540 1,604 2,528 2,216 845 160 8.5 0.8 4.9 16.5 27.6 36.2 32.3 25.5 7.41979 .......................... 8,056 22 148 631 1,635 2,496 2,210 769 143 8.5 1.0 5.8 16.6 27.6 36.9 30.1 23.5 7.5
Black, male1992 .......................... 731 3 25 143 187 159 153 50 11 4.9 1.0 6.6 14.8 17.9 24.0 17.6 15.9 5.81991 .......................... 716 6 29 140 178 193 125 39 6 4.9 1.1 6.7 14.8 21.9 19.9 13.9 8.9 5.91990 .......................... 765 3 25 165 173 205 127 55 12 5.3 1.0 8.3 14.7 23.3 20.6 19.8 18.0 6.31989 .......................... 805 4 45 167 192 192 143 51 10 5.6 1.7 8.9 16.6 21.8 23.5 18.6 15.1 6.71988 .......................... 805 7 42 164 194 211 138 43 6 5.7 1.6 9.2 17.1 23.9 22.9 15.9 9.2 6.91987 .......................... 850 2 51 169 211 228 127 51 10 6.1 2.0 9.9 19.1 25.7 21.3 19.1 15.6 7.41986 .......................... 834 3 62 187 170 209 144 50 8 6.1 2.5 11.5 15.7 23.5 24.4 19.1 12.7 7.3
1985 .......................... 853 6 48 160 199 239 146 48 7 6.3 2.0 10.4 18.6 26.9 24.9 18.7 11.3 7.71984 .......................... 852 11 57 127 205 231 167 49 5 6.4 2.4 8.6 19.4 26.1 28.7 19.5 8.2 7.81983 .......................... 915 2 64 156 227 267 158 37 3 6.9 2.8 11.2 21.7 30.4 27.3 15.0 5.0 8.61982 .......................... 841 7 67 150 224 227 122 41 3 6.5 3.1 11.2 21.6 26.0 21.2 17.0 5.2 8.11981 .......................... 951 7 61 175 252 246 168 39 3 7.4 2.9 13.7 24.4 28.5 29.4 16.6 5.4 9.31980 .......................... 1,013 4 70 177 286 289 139 38 6 8.0 3.5 14.2 27.9 33.7 24.4 16.5 11.2 10.11979 .......................... 1,028 10 72 197 307 255 141 39 7 8.3 3.9 16.7 30.2 30.1 25.0 17.4 13.5 10.5
White, female1992 .......................... 4,160 10 35 162 358 751 1,397 1,117 330 3.8 0.2 1.0 3.0 7.9 15.2 18.8 15.4 2.31991 .......................... 4,354 6 52 176 372 817 1,434 1,160 337 4.0 0.3 1.1 3.3 8.5 15.7 19.9 16.2 2.4
- 176 -

Table 2. Age-specific number of deaths and age-specific and age-adjusted death rates per 100,000 population for selected alcohol-relatedcauses of death: United States, 1979–92.
Unspecified liver cirrhosis without mention of alcohol (ICD-9 571.5, 571.9)
Race, sex,and year
Number of deaths, by age group Deaths per 100,000 population, by age group Age-adjusted deathsper 100,000populationAll1 0-24 25-34 35-44 45-54 55-64 65-74 75-84 85+ All1 25-34 35-44 45-54 55-64 65-74 75-84 85+
White, female1990 .......................... 4,262 9 51 173 356 859 1,354 1,141 317 4.0 0.3 1.1 3.2 8.9 14.9 19.9 15.7 2.41989 .......................... 4,488 9 49 163 370 945 1,490 1,151 311 4.2 0.3 1.1 3.4 9.6 16.6 20.5 15.9 2.61988 .......................... 4,254 9 40 195 401 967 1,366 1,045 231 4.0 0.2 1.3 3.8 9.7 15.4 19.1 12.1 2.61987 .......................... 4,338 11 49 203 405 979 1,422 1,028 241 4.1 0.3 1.4 4.0 9.7 16.2 19.2 12.9 2.61986 .......................... 4,527 14 56 197 473 1,121 1,461 963 242 4.4 0.3 1.4 4.7 10.9 16.9 18.4 13.4 2.9
1985 .......................... 4,506 13 55 191 513 1,111 1,404 969 250 4.4 0.3 1.4 5.2 10.7 16.4 19.0 14.2 2.91984 .......................... 4,580 12 55 198 577 1,176 1,438 918 206 4.5 0.3 1.5 5.8 11.3 17.0 18.4 12.1 3.01983 .......................... 4,613 15 71 195 622 1,277 1,338 865 229 4.5 0.4 1.5 6.3 12.2 16.0 17.8 13.9 3.11982 .......................... 4,550 18 47 211 586 1,293 1,369 848 178 4.5 0.3 1.7 5.9 12.4 16.7 18.0 11.2 3.11981 .......................... 4,839 18 58 231 738 1,348 1,458 791 195 4.8 0.4 2.0 7.3 13.0 18.0 17.2 12.8 3.51980 .......................... 4,826 20 64 241 824 1,379 1,387 753 158 4.8 0.4 2.1 8.0 13.3 17.4 16.8 10.8 3.61979 .......................... 4,649 23 70 272 847 1,354 1,267 678 138 4.7 0.5 2.5 8.2 13.3 16.2 15.5 9.9 3.5
Black, female1992 .......................... 445 3 13 60 75 106 120 55 13 2.7 0.4 2.4 4.9 9.3 13.2 10.8 7.8 2.61991 .......................... 529 0 27 72 95 134 133 53 15 3.2 0.9 3.0 6.6 11.8 14.8 10.6 9.3 3.21990 .......................... 537 10 19 72 94 138 121 71 12 3.3 0.7 3.1 6.6 12.2 13.6 14.3 7.6 3.31989 .......................... 541 9 23 66 80 152 142 56 13 3.4 0.8 3.0 5.7 13.4 16.2 11.5 8.5 3.41988 .......................... 579 5 27 77 104 140 139 73 13 3.7 0.9 3.7 7.6 12.4 16.1 15.4 8.8 3.71987 .......................... 552 5 39 92 102 143 117 46 7 3.6 1.4 4.6 7.6 12.6 13.7 10.0 4.9 3.71986 .......................... 525 4 27 70 127 144 104 45 4 3.4 1.0 3.6 9.7 12.8 12.3 10.1 2.9 3.6
1985 .......................... 581 1 39 78 118 145 120 74 6 3.9 1.4 4.3 9.1 12.9 14.4 17.2 4.5 3.91984 .......................... 561 7 32 70 114 159 116 56 7 3.8 1.2 4.0 8.9 14.3 14.1 13.4 5.4 3.91983 .......................... 594 3 47 83 140 171 100 44 6 4.0 1.8 5.0 11.0 15.5 12.3 10.9 4.9 4.31982 .......................... 589 10 43 72 143 154 116 42 8 4.1 1.7 4.5 11.3 14.1 14.4 10.8 6.8 4.31981 .......................... 668 7 37 108 158 174 133 44 7 4.7 1.5 7.1 12.5 16.2 16.8 11.7 6.2 5.11980 .......................... 697 11 37 114 176 195 127 33 4 4.9 1.6 7.6 14.0 18.3 16.3 9.1 3.7 5.51979 .......................... 615 5 33 93 166 163 111 42 2 4.5 1.5 6.5 13.3 15.6 14.5 12.0 2.0 4.9
1 Includes deaths where age was unknown.
- 177 -
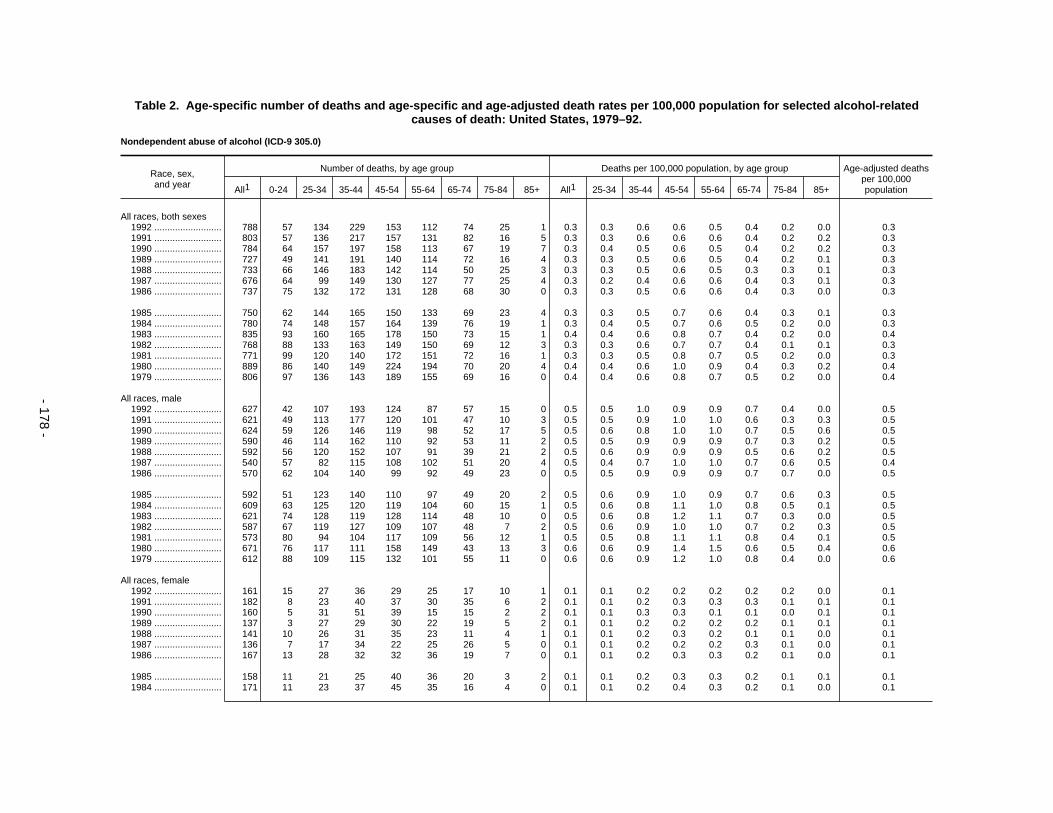
Table 2. Age-specific number of deaths and age-specific and age-adjusted death rates per 100,000 population for selected alcohol-relatedcauses of death: United States, 1979–92.
Nondependent abuse of alcohol (ICD-9 305.0)
Race, sex,and year
Number of deaths, by age group Deaths per 100,000 population, by age group Age-adjusted deathsper 100,000populationAll1 0-24 25-34 35-44 45-54 55-64 65-74 75-84 85+ All1 25-34 35-44 45-54 55-64 65-74 75-84 85+
All races, both sexes1992 .......................... 788 57 134 229 153 112 74 25 1 0.3 0.3 0.6 0.6 0.5 0.4 0.2 0.0 0.31991 .......................... 803 57 136 217 157 131 82 16 5 0.3 0.3 0.6 0.6 0.6 0.4 0.2 0.2 0.31990 .......................... 784 64 157 197 158 113 67 19 7 0.3 0.4 0.5 0.6 0.5 0.4 0.2 0.2 0.31989 .......................... 727 49 141 191 140 114 72 16 4 0.3 0.3 0.5 0.6 0.5 0.4 0.2 0.1 0.31988 .......................... 733 66 146 183 142 114 50 25 3 0.3 0.3 0.5 0.6 0.5 0.3 0.3 0.1 0.31987 .......................... 676 64 99 149 130 127 77 25 4 0.3 0.2 0.4 0.6 0.6 0.4 0.3 0.1 0.31986 .......................... 737 75 132 172 131 128 68 30 0 0.3 0.3 0.5 0.6 0.6 0.4 0.3 0.0 0.3
1985 .......................... 750 62 144 165 150 133 69 23 4 0.3 0.3 0.5 0.7 0.6 0.4 0.3 0.1 0.31984 .......................... 780 74 148 157 164 139 76 19 1 0.3 0.4 0.5 0.7 0.6 0.5 0.2 0.0 0.31983 .......................... 835 93 160 165 178 150 73 15 1 0.4 0.4 0.6 0.8 0.7 0.4 0.2 0.0 0.41982 .......................... 768 88 133 163 149 150 69 12 3 0.3 0.3 0.6 0.7 0.7 0.4 0.1 0.1 0.31981 .......................... 771 99 120 140 172 151 72 16 1 0.3 0.3 0.5 0.8 0.7 0.5 0.2 0.0 0.31980 .......................... 889 86 140 149 224 194 70 20 4 0.4 0.4 0.6 1.0 0.9 0.4 0.3 0.2 0.41979 .......................... 806 97 136 143 189 155 69 16 0 0.4 0.4 0.6 0.8 0.7 0.5 0.2 0.0 0.4
All races, male1992 .......................... 627 42 107 193 124 87 57 15 0 0.5 0.5 1.0 0.9 0.9 0.7 0.4 0.0 0.51991 .......................... 621 49 113 177 120 101 47 10 3 0.5 0.5 0.9 1.0 1.0 0.6 0.3 0.3 0.51990 .......................... 624 59 126 146 119 98 52 17 5 0.5 0.6 0.8 1.0 1.0 0.7 0.5 0.6 0.51989 .......................... 590 46 114 162 110 92 53 11 2 0.5 0.5 0.9 0.9 0.9 0.7 0.3 0.2 0.51988 .......................... 592 56 120 152 107 91 39 21 2 0.5 0.6 0.9 0.9 0.9 0.5 0.6 0.2 0.51987 .......................... 540 57 82 115 108 102 51 20 4 0.5 0.4 0.7 1.0 1.0 0.7 0.6 0.5 0.41986 .......................... 570 62 104 140 99 92 49 23 0 0.5 0.5 0.9 0.9 0.9 0.7 0.7 0.0 0.5
1985 .......................... 592 51 123 140 110 97 49 20 2 0.5 0.6 0.9 1.0 0.9 0.7 0.6 0.3 0.51984 .......................... 609 63 125 120 119 104 60 15 1 0.5 0.6 0.8 1.1 1.0 0.8 0.5 0.1 0.51983 .......................... 621 74 128 119 128 114 48 10 0 0.5 0.6 0.8 1.2 1.1 0.7 0.3 0.0 0.51982 .......................... 587 67 119 127 109 107 48 7 2 0.5 0.6 0.9 1.0 1.0 0.7 0.2 0.3 0.51981 .......................... 573 80 94 104 117 109 56 12 1 0.5 0.5 0.8 1.1 1.1 0.8 0.4 0.1 0.51980 .......................... 671 76 117 111 158 149 43 13 3 0.6 0.6 0.9 1.4 1.5 0.6 0.5 0.4 0.61979 .......................... 612 88 109 115 132 101 55 11 0 0.6 0.6 0.9 1.2 1.0 0.8 0.4 0.0 0.6
All races, female1992 .......................... 161 15 27 36 29 25 17 10 1 0.1 0.1 0.2 0.2 0.2 0.2 0.2 0.0 0.11991 .......................... 182 8 23 40 37 30 35 6 2 0.1 0.1 0.2 0.3 0.3 0.3 0.1 0.1 0.11990 .......................... 160 5 31 51 39 15 15 2 2 0.1 0.1 0.3 0.3 0.1 0.1 0.0 0.1 0.11989 .......................... 137 3 27 29 30 22 19 5 2 0.1 0.1 0.2 0.2 0.2 0.2 0.1 0.1 0.11988 .......................... 141 10 26 31 35 23 11 4 1 0.1 0.1 0.2 0.3 0.2 0.1 0.1 0.0 0.11987 .......................... 136 7 17 34 22 25 26 5 0 0.1 0.1 0.2 0.2 0.2 0.3 0.1 0.0 0.11986 .......................... 167 13 28 32 32 36 19 7 0 0.1 0.1 0.2 0.3 0.3 0.2 0.1 0.0 0.1
1985 .......................... 158 11 21 25 40 36 20 3 2 0.1 0.1 0.2 0.3 0.3 0.2 0.1 0.1 0.11984 .......................... 171 11 23 37 45 35 16 4 0 0.1 0.1 0.2 0.4 0.3 0.2 0.1 0.0 0.1
- 178 -
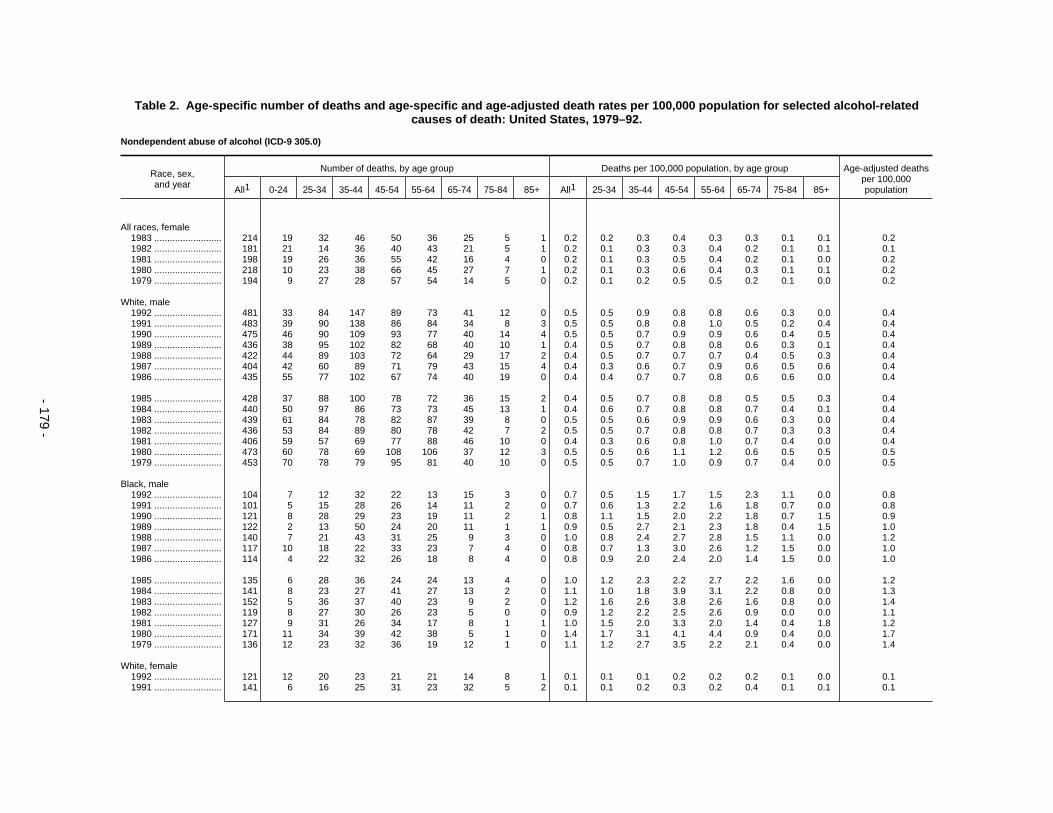
Table 2. Age-specific number of deaths and age-specific and age-adjusted death rates per 100,000 population for selected alcohol-relatedcauses of death: United States, 1979–92.
Nondependent abuse of alcohol (ICD-9 305.0)
Race, sex,and year
Number of deaths, by age group Deaths per 100,000 population, by age group Age-adjusted deathsper 100,000populationAll1 0-24 25-34 35-44 45-54 55-64 65-74 75-84 85+ All1 25-34 35-44 45-54 55-64 65-74 75-84 85+
All races, female1983 .......................... 214 19 32 46 50 36 25 5 1 0.2 0.2 0.3 0.4 0.3 0.3 0.1 0.1 0.21982 .......................... 181 21 14 36 40 43 21 5 1 0.2 0.1 0.3 0.3 0.4 0.2 0.1 0.1 0.11981 .......................... 198 19 26 36 55 42 16 4 0 0.2 0.1 0.3 0.5 0.4 0.2 0.1 0.0 0.21980 .......................... 218 10 23 38 66 45 27 7 1 0.2 0.1 0.3 0.6 0.4 0.3 0.1 0.1 0.21979 .......................... 194 9 27 28 57 54 14 5 0 0.2 0.1 0.2 0.5 0.5 0.2 0.1 0.0 0.2
White, male1992 .......................... 481 33 84 147 89 73 41 12 0 0.5 0.5 0.9 0.8 0.8 0.6 0.3 0.0 0.41991 .......................... 483 39 90 138 86 84 34 8 3 0.5 0.5 0.8 0.8 1.0 0.5 0.2 0.4 0.41990 .......................... 475 46 90 109 93 77 40 14 4 0.5 0.5 0.7 0.9 0.9 0.6 0.4 0.5 0.41989 .......................... 436 38 95 102 82 68 40 10 1 0.4 0.5 0.7 0.8 0.8 0.6 0.3 0.1 0.41988 .......................... 422 44 89 103 72 64 29 17 2 0.4 0.5 0.7 0.7 0.7 0.4 0.5 0.3 0.41987 .......................... 404 42 60 89 71 79 43 15 4 0.4 0.3 0.6 0.7 0.9 0.6 0.5 0.6 0.41986 .......................... 435 55 77 102 67 74 40 19 0 0.4 0.4 0.7 0.7 0.8 0.6 0.6 0.0 0.4
1985 .......................... 428 37 88 100 78 72 36 15 2 0.4 0.5 0.7 0.8 0.8 0.5 0.5 0.3 0.41984 .......................... 440 50 97 86 73 73 45 13 1 0.4 0.6 0.7 0.8 0.8 0.7 0.4 0.1 0.41983 .......................... 439 61 84 78 82 87 39 8 0 0.5 0.5 0.6 0.9 0.9 0.6 0.3 0.0 0.41982 .......................... 436 53 84 89 80 78 42 7 2 0.5 0.5 0.7 0.8 0.8 0.7 0.3 0.3 0.41981 .......................... 406 59 57 69 77 88 46 10 0 0.4 0.3 0.6 0.8 1.0 0.7 0.4 0.0 0.41980 .......................... 473 60 78 69 108 106 37 12 3 0.5 0.5 0.6 1.1 1.2 0.6 0.5 0.5 0.51979 .......................... 453 70 78 79 95 81 40 10 0 0.5 0.5 0.7 1.0 0.9 0.7 0.4 0.0 0.5
Black, male1992 .......................... 104 7 12 32 22 13 15 3 0 0.7 0.5 1.5 1.7 1.5 2.3 1.1 0.0 0.81991 .......................... 101 5 15 28 26 14 11 2 0 0.7 0.6 1.3 2.2 1.6 1.8 0.7 0.0 0.81990 .......................... 121 8 28 29 23 19 11 2 1 0.8 1.1 1.5 2.0 2.2 1.8 0.7 1.5 0.91989 .......................... 122 2 13 50 24 20 11 1 1 0.9 0.5 2.7 2.1 2.3 1.8 0.4 1.5 1.01988 .......................... 140 7 21 43 31 25 9 3 0 1.0 0.8 2.4 2.7 2.8 1.5 1.1 0.0 1.21987 .......................... 117 10 18 22 33 23 7 4 0 0.8 0.7 1.3 3.0 2.6 1.2 1.5 0.0 1.01986 .......................... 114 4 22 32 26 18 8 4 0 0.8 0.9 2.0 2.4 2.0 1.4 1.5 0.0 1.0
1985 .......................... 135 6 28 36 24 24 13 4 0 1.0 1.2 2.3 2.2 2.7 2.2 1.6 0.0 1.21984 .......................... 141 8 23 27 41 27 13 2 0 1.1 1.0 1.8 3.9 3.1 2.2 0.8 0.0 1.31983 .......................... 152 5 36 37 40 23 9 2 0 1.2 1.6 2.6 3.8 2.6 1.6 0.8 0.0 1.41982 .......................... 119 8 27 30 26 23 5 0 0 0.9 1.2 2.2 2.5 2.6 0.9 0.0 0.0 1.11981 .......................... 127 9 31 26 34 17 8 1 1 1.0 1.5 2.0 3.3 2.0 1.4 0.4 1.8 1.21980 .......................... 171 11 34 39 42 38 5 1 0 1.4 1.7 3.1 4.1 4.4 0.9 0.4 0.0 1.71979 .......................... 136 12 23 32 36 19 12 1 0 1.1 1.2 2.7 3.5 2.2 2.1 0.4 0.0 1.4
White, female1992 .......................... 121 12 20 23 21 21 14 8 1 0.1 0.1 0.1 0.2 0.2 0.2 0.1 0.0 0.11991 .......................... 141 6 16 25 31 23 32 5 2 0.1 0.1 0.2 0.3 0.2 0.4 0.1 0.1 0.1
- 179 -
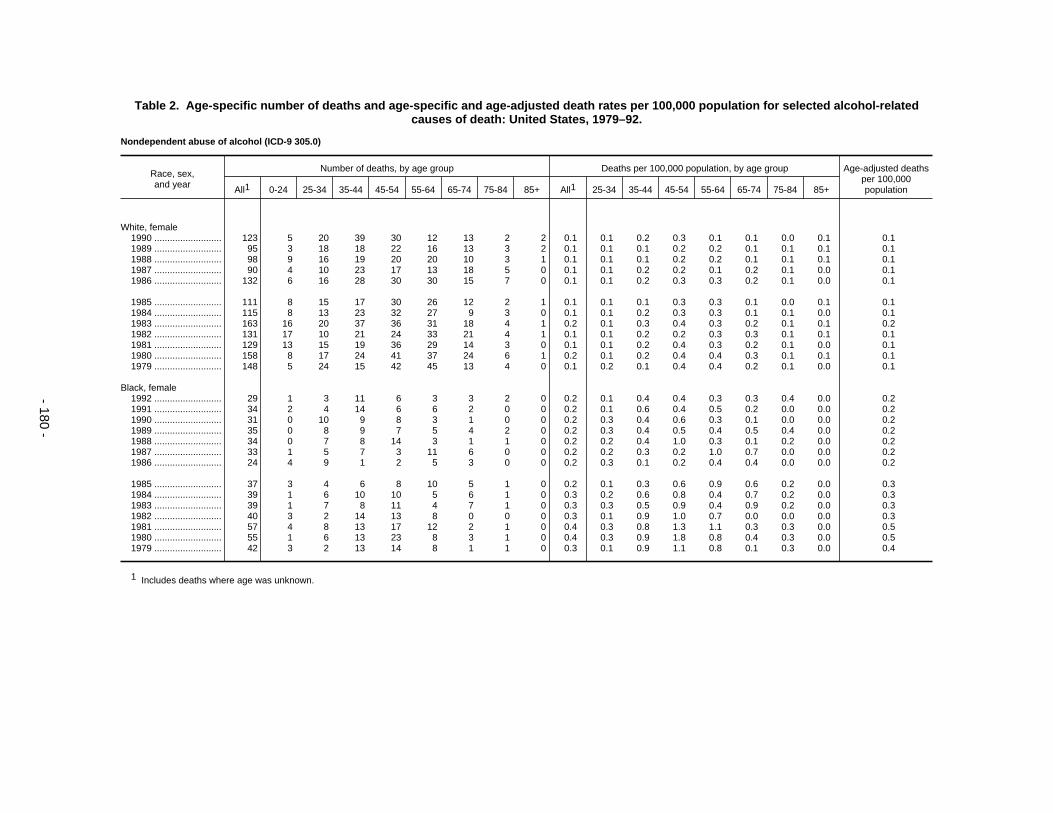
Table 2. Age-specific number of deaths and age-specific and age-adjusted death rates per 100,000 population for selected alcohol-relatedcauses of death: United States, 1979–92.
Nondependent abuse of alcohol (ICD-9 305.0)
Race, sex,and year
Number of deaths, by age group Deaths per 100,000 population, by age group Age-adjusted deathsper 100,000populationAll1 0-24 25-34 35-44 45-54 55-64 65-74 75-84 85+ All1 25-34 35-44 45-54 55-64 65-74 75-84 85+
White, female1990 .......................... 123 5 20 39 30 12 13 2 2 0.1 0.1 0.2 0.3 0.1 0.1 0.0 0.1 0.11989 .......................... 95 3 18 18 22 16 13 3 2 0.1 0.1 0.1 0.2 0.2 0.1 0.1 0.1 0.11988 .......................... 98 9 16 19 20 20 10 3 1 0.1 0.1 0.1 0.2 0.2 0.1 0.1 0.1 0.11987 .......................... 90 4 10 23 17 13 18 5 0 0.1 0.1 0.2 0.2 0.1 0.2 0.1 0.0 0.11986 .......................... 132 6 16 28 30 30 15 7 0 0.1 0.1 0.2 0.3 0.3 0.2 0.1 0.0 0.1
1985 .......................... 111 8 15 17 30 26 12 2 1 0.1 0.1 0.1 0.3 0.3 0.1 0.0 0.1 0.11984 .......................... 115 8 13 23 32 27 9 3 0 0.1 0.1 0.2 0.3 0.3 0.1 0.1 0.0 0.11983 .......................... 163 16 20 37 36 31 18 4 1 0.2 0.1 0.3 0.4 0.3 0.2 0.1 0.1 0.21982 .......................... 131 17 10 21 24 33 21 4 1 0.1 0.1 0.2 0.2 0.3 0.3 0.1 0.1 0.11981 .......................... 129 13 15 19 36 29 14 3 0 0.1 0.1 0.2 0.4 0.3 0.2 0.1 0.0 0.11980 .......................... 158 8 17 24 41 37 24 6 1 0.2 0.1 0.2 0.4 0.4 0.3 0.1 0.1 0.11979 .......................... 148 5 24 15 42 45 13 4 0 0.1 0.2 0.1 0.4 0.4 0.2 0.1 0.0 0.1
Black, female1992 .......................... 29 1 3 11 6 3 3 2 0 0.2 0.1 0.4 0.4 0.3 0.3 0.4 0.0 0.21991 .......................... 34 2 4 14 6 6 2 0 0 0.2 0.1 0.6 0.4 0.5 0.2 0.0 0.0 0.21990 .......................... 31 0 10 9 8 3 1 0 0 0.2 0.3 0.4 0.6 0.3 0.1 0.0 0.0 0.21989 .......................... 35 0 8 9 7 5 4 2 0 0.2 0.3 0.4 0.5 0.4 0.5 0.4 0.0 0.21988 .......................... 34 0 7 8 14 3 1 1 0 0.2 0.2 0.4 1.0 0.3 0.1 0.2 0.0 0.21987 .......................... 33 1 5 7 3 11 6 0 0 0.2 0.2 0.3 0.2 1.0 0.7 0.0 0.0 0.21986 .......................... 24 4 9 1 2 5 3 0 0 0.2 0.3 0.1 0.2 0.4 0.4 0.0 0.0 0.2
1985 .......................... 37 3 4 6 8 10 5 1 0 0.2 0.1 0.3 0.6 0.9 0.6 0.2 0.0 0.31984 .......................... 39 1 6 10 10 5 6 1 0 0.3 0.2 0.6 0.8 0.4 0.7 0.2 0.0 0.31983 .......................... 39 1 7 8 11 4 7 1 0 0.3 0.3 0.5 0.9 0.4 0.9 0.2 0.0 0.31982 .......................... 40 3 2 14 13 8 0 0 0 0.3 0.1 0.9 1.0 0.7 0.0 0.0 0.0 0.31981 .......................... 57 4 8 13 17 12 2 1 0 0.4 0.3 0.8 1.3 1.1 0.3 0.3 0.0 0.51980 .......................... 55 1 6 13 23 8 3 1 0 0.4 0.3 0.9 1.8 0.8 0.4 0.3 0.0 0.51979 .......................... 42 3 2 13 14 8 1 1 0 0.3 0.1 0.9 1.1 0.8 0.1 0.3 0.0 0.4
1 Includes deaths where age was unknown.
- 180 -
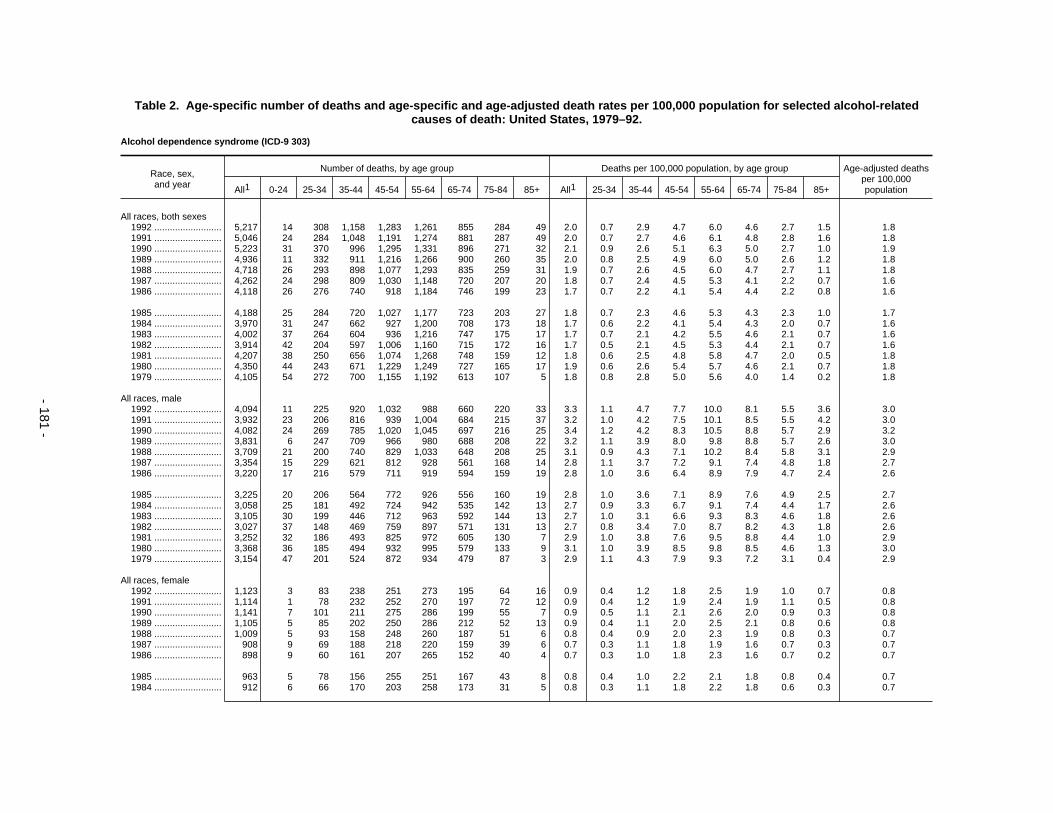
Table 2. Age-specific number of deaths and age-specific and age-adjusted death rates per 100,000 population for selected alcohol-relatedcauses of death: United States, 1979–92.
Alcohol dependence syndrome (ICD-9 303)
Race, sex,and year
Number of deaths, by age group Deaths per 100,000 population, by age group Age-adjusted deathsper 100,000populationAll1 0-24 25-34 35-44 45-54 55-64 65-74 75-84 85+ All1 25-34 35-44 45-54 55-64 65-74 75-84 85+
All races, both sexes1992 .......................... 5,217 14 308 1,158 1,283 1,261 855 284 49 2.0 0.7 2.9 4.7 6.0 4.6 2.7 1.5 1.81991 .......................... 5,046 24 284 1,048 1,191 1,274 881 287 49 2.0 0.7 2.7 4.6 6.1 4.8 2.8 1.6 1.81990 .......................... 5,223 31 370 996 1,295 1,331 896 271 32 2.1 0.9 2.6 5.1 6.3 5.0 2.7 1.0 1.91989 .......................... 4,936 11 332 911 1,216 1,266 900 260 35 2.0 0.8 2.5 4.9 6.0 5.0 2.6 1.2 1.81988 .......................... 4,718 26 293 898 1,077 1,293 835 259 31 1.9 0.7 2.6 4.5 6.0 4.7 2.7 1.1 1.81987 .......................... 4,262 24 298 809 1,030 1,148 720 207 20 1.8 0.7 2.4 4.5 5.3 4.1 2.2 0.7 1.61986 .......................... 4,118 26 276 740 918 1,184 746 199 23 1.7 0.7 2.2 4.1 5.4 4.4 2.2 0.8 1.6
1985 .......................... 4,188 25 284 720 1,027 1,177 723 203 27 1.8 0.7 2.3 4.6 5.3 4.3 2.3 1.0 1.71984 .......................... 3,970 31 247 662 927 1,200 708 173 18 1.7 0.6 2.2 4.1 5.4 4.3 2.0 0.7 1.61983 .......................... 4,002 37 264 604 936 1,216 747 175 17 1.7 0.7 2.1 4.2 5.5 4.6 2.1 0.7 1.61982 .......................... 3,914 42 204 597 1,006 1,160 715 172 16 1.7 0.5 2.1 4.5 5.3 4.4 2.1 0.7 1.61981 .......................... 4,207 38 250 656 1,074 1,268 748 159 12 1.8 0.6 2.5 4.8 5.8 4.7 2.0 0.5 1.81980 .......................... 4,350 44 243 671 1,229 1,249 727 165 17 1.9 0.6 2.6 5.4 5.7 4.6 2.1 0.7 1.81979 .......................... 4,105 54 272 700 1,155 1,192 613 107 5 1.8 0.8 2.8 5.0 5.6 4.0 1.4 0.2 1.8
All races, male1992 .......................... 4,094 11 225 920 1,032 988 660 220 33 3.3 1.1 4.7 7.7 10.0 8.1 5.5 3.6 3.01991 .......................... 3,932 23 206 816 939 1,004 684 215 37 3.2 1.0 4.2 7.5 10.1 8.5 5.5 4.2 3.01990 .......................... 4,082 24 269 785 1,020 1,045 697 216 25 3.4 1.2 4.2 8.3 10.5 8.8 5.7 2.9 3.21989 .......................... 3,831 6 247 709 966 980 688 208 22 3.2 1.1 3.9 8.0 9.8 8.8 5.7 2.6 3.01988 .......................... 3,709 21 200 740 829 1,033 648 208 25 3.1 0.9 4.3 7.1 10.2 8.4 5.8 3.1 2.91987 .......................... 3,354 15 229 621 812 928 561 168 14 2.8 1.1 3.7 7.2 9.1 7.4 4.8 1.8 2.71986 .......................... 3,220 17 216 579 711 919 594 159 19 2.8 1.0 3.6 6.4 8.9 7.9 4.7 2.4 2.6
1985 .......................... 3,225 20 206 564 772 926 556 160 19 2.8 1.0 3.6 7.1 8.9 7.6 4.9 2.5 2.71984 .......................... 3,058 25 181 492 724 942 535 142 13 2.7 0.9 3.3 6.7 9.1 7.4 4.4 1.7 2.61983 .......................... 3,105 30 199 446 712 963 592 144 13 2.7 1.0 3.1 6.6 9.3 8.3 4.6 1.8 2.61982 .......................... 3,027 37 148 469 759 897 571 131 13 2.7 0.8 3.4 7.0 8.7 8.2 4.3 1.8 2.61981 .......................... 3,252 32 186 493 825 972 605 130 7 2.9 1.0 3.8 7.6 9.5 8.8 4.4 1.0 2.91980 .......................... 3,368 36 185 494 932 995 579 133 9 3.1 1.0 3.9 8.5 9.8 8.5 4.6 1.3 3.01979 .......................... 3,154 47 201 524 872 934 479 87 3 2.9 1.1 4.3 7.9 9.3 7.2 3.1 0.4 2.9
All races, female1992 .......................... 1,123 3 83 238 251 273 195 64 16 0.9 0.4 1.2 1.8 2.5 1.9 1.0 0.7 0.81991 .......................... 1,114 1 78 232 252 270 197 72 12 0.9 0.4 1.2 1.9 2.4 1.9 1.1 0.5 0.81990 .......................... 1,141 7 101 211 275 286 199 55 7 0.9 0.5 1.1 2.1 2.6 2.0 0.9 0.3 0.81989 .......................... 1,105 5 85 202 250 286 212 52 13 0.9 0.4 1.1 2.0 2.5 2.1 0.8 0.6 0.81988 .......................... 1,009 5 93 158 248 260 187 51 6 0.8 0.4 0.9 2.0 2.3 1.9 0.8 0.3 0.71987 .......................... 908 9 69 188 218 220 159 39 6 0.7 0.3 1.1 1.8 1.9 1.6 0.7 0.3 0.71986 .......................... 898 9 60 161 207 265 152 40 4 0.7 0.3 1.0 1.8 2.3 1.6 0.7 0.2 0.7
1985 .......................... 963 5 78 156 255 251 167 43 8 0.8 0.4 1.0 2.2 2.1 1.8 0.8 0.4 0.71984 .......................... 912 6 66 170 203 258 173 31 5 0.8 0.3 1.1 1.8 2.2 1.8 0.6 0.3 0.7
- 181 -

Table 2. Age-specific number of deaths and age-specific and age-adjusted death rates per 100,000 population for selected alcohol-relatedcauses of death: United States, 1979–92.
Alcohol dependence syndrome (ICD-9 303)
Race, sex,and year
Number of deaths, by age group Deaths per 100,000 population, by age group Age-adjusted deathsper 100,000populationAll1 0-24 25-34 35-44 45-54 55-64 65-74 75-84 85+ All1 25-34 35-44 45-54 55-64 65-74 75-84 85+
All races, female1983 .......................... 897 7 65 158 224 253 155 31 4 0.7 0.3 1.1 1.9 2.2 1.7 0.6 0.2 0.71982 .......................... 887 5 56 128 247 263 144 41 3 0.7 0.3 0.9 2.1 2.2 1.6 0.8 0.2 0.71981 .......................... 955 6 64 163 249 296 143 29 5 0.8 0.3 1.2 2.1 2.5 1.6 0.6 0.3 0.81980 .......................... 982 8 58 177 297 254 148 32 8 0.8 0.3 1.3 2.5 2.2 1.7 0.7 0.5 0.81979 .......................... 951 7 71 176 283 258 134 20 2 0.8 0.4 1.4 2.4 2.3 1.5 0.4 0.1 0.8
White, male1992 .......................... 2,958 10 167 667 690 708 505 181 26 2.8 0.9 4.0 5.9 8.1 6.9 5.0 3.2 2.51991 .......................... 2,815 20 138 543 644 733 526 177 29 2.7 0.8 3.3 5.9 8.4 7.3 5.0 3.7 2.41990 .......................... 2,845 14 167 491 660 760 551 185 16 2.8 0.9 3.1 6.2 8.6 7.7 5.4 2.1 2.51989 .......................... 2,597 4 144 441 584 703 533 169 16 2.6 0.8 2.9 5.6 7.9 7.6 5.1 2.1 2.31988 .......................... 2,521 13 118 427 500 770 498 171 20 2.5 0.6 2.9 4.9 8.6 7.2 5.3 2.7 2.21987 .......................... 2,302 12 140 371 517 658 457 133 11 2.3 0.8 2.5 5.3 7.2 6.6 4.2 1.5 2.11986 .......................... 2,205 10 111 341 449 672 473 133 13 2.2 0.6 2.4 4.7 7.3 7.0 4.3 1.8 2.0
1985 .......................... 2,206 14 119 319 508 678 423 132 13 2.2 0.7 2.4 5.3 7.3 6.4 4.4 1.9 2.11984 .......................... 2,133 17 109 280 471 689 435 119 10 2.2 0.6 2.1 4.9 7.4 6.7 4.1 1.5 2.01983 .......................... 2,167 22 114 254 455 722 471 115 10 2.2 0.7 2.0 4.8 7.8 7.3 4.1 1.5 2.01982 .......................... 2,124 25 82 251 504 664 481 105 11 2.2 0.5 2.1 5.3 7.2 7.6 3.8 1.7 2.01981 .......................... 2,264 21 103 277 543 727 477 109 6 2.4 0.6 2.4 5.6 7.9 7.7 4.1 0.9 2.21980 .......................... 2,306 20 94 258 607 754 458 105 7 2.4 0.6 2.3 6.2 8.2 7.5 4.0 1.1 2.31979 .......................... 2,158 35 91 272 584 700 396 74 3 2.3 0.6 2.5 5.9 7.7 6.6 2.9 0.5 2.2
Black, male1992 .......................... 1,025 0 43 227 310 259 143 35 7 6.9 1.7 10.4 24.6 29.2 22.4 12.3 10.1 8.31991 .......................... 1,025 2 57 242 279 248 153 36 5 7.0 2.2 11.6 23.2 28.1 24.4 12.8 7.4 8.41990 .......................... 1,142 7 87 270 336 267 138 29 8 7.9 3.4 13.6 28.5 30.4 22.4 10.4 12.0 9.61989 .......................... 1,129 1 88 238 351 263 143 38 5 7.9 3.4 12.6 30.3 29.9 23.5 13.8 7.5 9.71988 .......................... 1,085 7 76 289 302 242 135 30 4 7.7 3.0 16.1 26.7 27.4 22.4 11.1 6.1 9.41987 .......................... 984 3 74 238 278 258 96 32 3 7.1 3.0 13.9 25.1 29.1 16.1 12.0 4.7 8.71986 .......................... 949 7 94 222 248 232 116 22 5 6.9 3.8 13.6 22.9 26.1 19.7 8.4 8.0 8.5
1985 .......................... 953 4 78 230 251 232 126 25 5 7.1 3.3 14.9 23.5 26.1 21.5 9.7 8.1 8.71984 .......................... 853 5 59 194 237 238 95 22 2 6.4 2.5 13.2 22.4 26.9 16.3 8.7 3.3 8.01983 .......................... 866 5 73 179 238 233 105 28 3 6.6 3.2 12.8 22.8 26.5 18.1 11.4 5.0 8.21982 .......................... 820 7 55 198 231 222 83 22 1 6.3 2.5 14.8 22.3 25.5 14.4 9.1 1.7 8.01981 .......................... 904 6 73 194 263 228 118 21 0 7.0 3.5 15.2 25.5 26.4 20.6 8.9 0.0 9.01980 .......................... 967 8 76 221 309 219 106 24 2 7.6 3.8 17.7 30.1 25.5 18.6 10.4 3.7 9.81979 .......................... 892 6 97 228 259 211 76 11 0 7.2 5.2 19.3 25.5 24.9 13.5 4.9 0.0 9.3
White, female1992 .......................... 766 2 50 139 159 192 154 56 14 0.7 0.3 0.8 1.3 2.0 1.7 0.9 0.7 0.61991 .......................... 793 1 46 138 173 201 168 58 8 0.7 0.3 0.8 1.5 2.1 1.8 1.0 0.4 0.6
- 182 -

Table 2. Age-specific number of deaths and age-specific and age-adjusted death rates per 100,000 population for selected alcohol-relatedcauses of death: United States, 1979–92.
Alcohol dependence syndrome (ICD-9 303)
Race, sex,and year
Number of deaths, by age group Deaths per 100,000 population, by age group Age-adjusted deathsper 100,000populationAll1 0-24 25-34 35-44 45-54 55-64 65-74 75-84 85+ All1 25-34 35-44 45-54 55-64 65-74 75-84 85+
White, female1990 .......................... 761 4 55 103 166 220 158 49 6 0.7 0.3 0.6 1.5 2.3 1.7 0.9 0.3 0.61989 .......................... 755 3 46 119 154 205 170 45 13 0.7 0.3 0.8 1.4 2.1 1.9 0.8 0.7 0.61988 .......................... 662 3 42 83 142 190 155 41 5 0.6 0.2 0.6 1.4 1.9 1.7 0.7 0.3 0.51987 .......................... 602 4 30 85 146 165 131 37 4 0.6 0.2 0.6 1.4 1.6 1.5 0.7 0.2 0.51986 .......................... 630 4 33 76 141 207 129 37 3 0.6 0.2 0.5 1.4 2.0 1.5 0.7 0.2 0.5
1985 .......................... 660 1 35 84 162 198 135 38 7 0.6 0.2 0.6 1.6 1.9 1.6 0.7 0.4 0.61984 .......................... 622 1 27 95 137 198 134 25 5 0.6 0.2 0.7 1.4 1.9 1.6 0.5 0.3 0.51983 .......................... 609 4 29 68 153 198 126 28 3 0.6 0.2 0.5 1.5 1.9 1.5 0.6 0.2 0.51982 .......................... 604 2 21 66 162 192 123 36 2 0.6 0.1 0.5 1.6 1.8 1.5 0.8 0.1 0.51981 .......................... 644 4 24 82 156 230 122 22 4 0.6 0.1 0.7 1.5 2.2 1.5 0.5 0.3 0.61980 .......................... 615 1 20 82 174 192 116 26 4 0.6 0.1 0.7 1.7 1.9 1.5 0.6 0.3 0.61979 .......................... 614 5 18 83 179 205 106 16 2 0.6 0.1 0.8 1.7 2.0 1.4 0.4 0.1 0.6
Black, female1992 .......................... 312 1 30 87 82 68 35 7 2 1.9 1.0 3.5 5.4 5.9 3.8 1.4 1.2 2.01991 .......................... 295 0 29 81 74 64 29 14 4 1.8 1.0 3.4 5.1 5.6 3.2 2.8 2.5 1.91990 .......................... 334 1 41 94 93 60 41 4 0 2.1 1.4 4.1 6.5 5.3 4.6 0.8 0.0 2.21989 .......................... 319 1 34 76 85 76 40 7 0 2.0 1.2 3.5 6.1 6.7 4.6 1.4 0.0 2.21988 .......................... 312 2 41 68 98 62 30 10 1 2.0 1.4 3.2 7.2 5.5 3.5 2.1 0.7 2.21987 .......................... 276 5 38 92 65 49 25 1 1 1.8 1.3 4.6 4.9 4.3 2.9 0.2 0.7 2.01986 .......................... 249 4 26 78 60 56 21 3 1 1.6 0.9 4.1 4.6 5.0 2.5 0.7 0.7 1.8
1985 .......................... 266 4 35 66 79 49 27 5 1 1.8 1.3 3.6 6.1 4.4 3.2 1.2 0.8 2.01984 .......................... 259 3 33 66 61 57 34 5 0 1.7 1.2 3.8 4.8 5.1 4.1 1.2 0.0 1.91983 .......................... 263 3 32 81 66 51 27 3 0 1.8 1.2 4.9 5.2 4.6 3.3 0.7 0.0 2.11982 .......................... 263 3 32 58 75 68 21 5 1 1.8 1.3 3.6 5.9 6.2 2.6 1.3 0.8 2.11981 .......................... 279 2 31 71 86 61 21 6 1 1.9 1.3 4.6 6.8 5.7 2.6 1.6 0.9 2.31980 .......................... 328 4 29 82 113 59 31 6 4 2.3 1.3 5.5 9.0 5.5 4.0 1.6 3.7 2.71979 .......................... 293 1 39 82 90 52 26 3 0 2.1 1.8 5.7 7.2 5.0 3.4 0.9 0.0 2.5
1 Includes deaths where age was unknown.
- 183 -

Table 2. Age-specific number of deaths and age-specific and age-adjusted death rates per 100,000 population for selected alcohol-relatedcauses of death: United States, 1979–92.
Accidental poisoning by alcohol (ICD-9 E860)
Race, sex,and year
Number of deaths, by age group Deaths per 100,000 population, by age group Age-adjusted deathsper 100,000populationAll1 0-24 25-34 35-44 45-54 55-64 65-74 75-84 85+ All1 25-34 35-44 45-54 55-64 65-74 75-84 85+
All races, both sexes1992 .......................... 332 24 55 109 77 36 26 4 1 0.1 0.1 0.3 0.3 0.2 0.1 0.0 0.0 0.11991 .......................... 331 24 72 82 75 51 21 6 0 0.1 0.2 0.2 0.3 0.2 0.1 0.1 0.0 0.11990 .......................... 369 35 77 120 63 38 30 6 0 0.1 0.2 0.3 0.3 0.2 0.2 0.1 0.0 0.11989 .......................... 400 20 75 90 97 74 35 6 1 0.2 0.2 0.2 0.4 0.3 0.2 0.1 0.0 0.21988 .......................... 334 24 47 83 81 66 27 5 1 0.1 0.1 0.2 0.3 0.3 0.2 0.1 0.0 0.11987 .......................... 347 22 63 80 83 64 31 2 0 0.1 0.1 0.2 0.4 0.3 0.2 0.0 0.0 0.11986 .......................... 352 19 53 93 82 66 29 7 2 0.1 0.1 0.3 0.4 0.3 0.2 0.1 0.1 0.1
1985 .......................... 305 21 45 73 72 63 26 3 0 0.1 0.1 0.2 0.3 0.3 0.2 0.0 0.0 0.11984 .......................... 346 26 68 61 88 71 31 1 0 0.1 0.2 0.2 0.4 0.3 0.2 0.0 0.0 0.11983 .......................... 341 24 52 71 76 79 32 6 0 0.1 0.1 0.2 0.3 0.4 0.2 0.1 0.0 0.11982 .......................... 412 29 83 87 87 90 32 3 1 0.2 0.2 0.3 0.4 0.4 0.2 0.0 0.0 0.21981 .......................... 384 38 56 76 102 83 25 3 0 0.2 0.1 0.3 0.5 0.4 0.2 0.0 0.0 0.21980 .......................... 385 34 60 66 108 83 31 2 0 0.2 0.2 0.3 0.5 0.4 0.2 0.0 0.0 0.21979 .......................... 416 29 62 83 112 97 27 4 0 0.2 0.2 0.3 0.5 0.5 0.2 0.1 0.0 0.2
All races, male1992 .......................... 266 19 45 87 61 29 22 2 1 0.2 0.2 0.4 0.5 0.3 0.3 0.0 0.1 0.21991 .......................... 267 21 60 66 60 38 17 5 0 0.2 0.3 0.3 0.5 0.4 0.2 0.1 0.0 0.21990 .......................... 287 26 62 96 48 27 24 4 0 0.2 0.3 0.5 0.4 0.3 0.3 0.1 0.0 0.21989 .......................... 305 18 63 73 70 53 23 4 1 0.3 0.3 0.4 0.6 0.5 0.3 0.1 0.1 0.21988 .......................... 268 19 40 66 68 47 25 3 0 0.2 0.2 0.4 0.6 0.5 0.3 0.1 0.0 0.21987 .......................... 282 16 53 72 64 51 22 2 0 0.2 0.2 0.4 0.6 0.5 0.3 0.1 0.0 0.21986 .......................... 280 17 45 75 60 56 20 5 1 0.2 0.2 0.5 0.5 0.5 0.3 0.1 0.1 0.2
1985 .......................... 230 16 35 62 55 44 14 2 0 0.2 0.2 0.4 0.5 0.4 0.2 0.1 0.0 0.21984 .......................... 260 19 58 41 61 56 24 1 0 0.2 0.3 0.3 0.6 0.5 0.3 0.0 0.0 0.21983 .......................... 274 21 46 58 56 65 24 3 0 0.2 0.2 0.4 0.5 0.6 0.3 0.1 0.0 0.21982 .......................... 315 24 68 70 64 63 24 2 0 0.3 0.3 0.5 0.6 0.6 0.3 0.1 0.0 0.31981 .......................... 285 28 51 58 66 61 19 1 0 0.3 0.3 0.4 0.6 0.6 0.3 0.0 0.0 0.31980 .......................... 294 26 52 48 85 58 23 1 0 0.3 0.3 0.4 0.8 0.6 0.3 0.0 0.0 0.31979 .......................... 322 28 53 61 90 62 24 2 0 0.3 0.3 0.5 0.8 0.6 0.4 0.1 0.0 0.3
All races, female1992 .......................... 66 5 10 22 16 7 4 2 0 0.1 0.0 0.1 0.1 0.1 0.0 0.0 0.0 0.01991 .......................... 64 3 12 16 15 13 4 1 0 0.0 0.1 0.1 0.1 0.1 0.0 0.0 0.0 0.01990 .......................... 82 9 15 24 15 11 6 2 0 0.1 0.1 0.1 0.1 0.1 0.1 0.0 0.0 0.11989 .......................... 95 2 12 17 27 21 12 2 0 0.1 0.1 0.1 0.2 0.2 0.1 0.0 0.0 0.11988 .......................... 66 5 7 17 13 19 2 2 1 0.1 0.0 0.1 0.1 0.2 0.0 0.0 0.0 0.11987 .......................... 65 6 10 8 19 13 9 0 0 0.1 0.0 0.0 0.2 0.1 0.1 0.0 0.0 0.11986 .......................... 72 2 8 18 22 10 9 2 1 0.1 0.0 0.1 0.2 0.1 0.1 0.0 0.1 0.1
1985 .......................... 75 5 10 11 17 19 12 1 0 0.1 0.0 0.1 0.1 0.2 0.1 0.0 0.0 0.11984 .......................... 86 7 10 20 27 15 7 0 0 0.1 0.0 0.1 0.2 0.1 0.1 0.0 0.0 0.1
- 184 -

Table 2. Age-specific number of deaths and age-specific and age-adjusted death rates per 100,000 population for selected alcohol-relatedcauses of death: United States, 1979–92.
Accidental poisoning by alcohol (ICD-9 E860)
Race, sex,and year
Number of deaths, by age group Deaths per 100,000 population, by age group Age-adjusted deathsper 100,000populationAll1 0-24 25-34 35-44 45-54 55-64 65-74 75-84 85+ All1 25-34 35-44 45-54 55-64 65-74 75-84 85+
All races, female1983 .......................... 67 3 6 13 20 14 8 3 0 0.1 0.0 0.1 0.2 0.1 0.1 0.1 0.0 0.11982 .......................... 97 5 15 17 23 27 8 1 1 0.1 0.1 0.1 0.2 0.2 0.1 0.0 0.1 0.11981 .......................... 99 10 5 18 36 22 6 2 0 0.1 0.0 0.1 0.3 0.2 0.1 0.0 0.0 0.11980 .......................... 91 8 8 18 23 25 8 1 0 0.1 0.0 0.1 0.2 0.2 0.1 0.0 0.0 0.11979 .......................... 94 1 9 22 22 35 3 2 0 0.1 0.0 0.2 0.2 0.3 0.0 0.0 0.0 0.1
White, male1992 .......................... 215 16 39 73 46 24 15 1 1 0.2 0.2 0.4 0.4 0.3 0.2 0.0 0.1 0.21991 .......................... 196 20 44 45 45 29 11 2 0 0.2 0.2 0.3 0.4 0.3 0.2 0.1 0.0 0.21990 .......................... 222 22 51 68 37 24 16 4 0 0.2 0.3 0.4 0.3 0.3 0.2 0.1 0.0 0.21989 .......................... 220 14 46 57 46 37 17 2 1 0.2 0.3 0.4 0.4 0.4 0.2 0.1 0.1 0.21988 .......................... 176 16 24 42 39 35 18 2 0 0.2 0.1 0.3 0.4 0.4 0.3 0.1 0.0 0.21987 .......................... 198 11 44 45 45 36 13 2 0 0.2 0.2 0.3 0.5 0.4 0.2 0.1 0.0 0.21986 .......................... 183 11 30 44 40 41 13 3 0 0.2 0.2 0.3 0.4 0.4 0.2 0.1 0.0 0.2
1985 .......................... 142 12 23 31 37 29 8 2 0 0.1 0.1 0.2 0.4 0.3 0.1 0.1 0.0 0.11984 .......................... 185 14 44 24 43 39 21 0 0 0.2 0.3 0.2 0.5 0.4 0.3 0.0 0.0 0.21983 .......................... 187 16 30 41 39 41 17 2 0 0.2 0.2 0.3 0.4 0.4 0.3 0.1 0.0 0.21982 .......................... 210 21 43 43 38 44 20 1 0 0.2 0.3 0.4 0.4 0.5 0.3 0.0 0.0 0.21981 .......................... 203 24 38 35 43 43 19 1 0 0.2 0.2 0.3 0.4 0.5 0.3 0.0 0.0 0.21980 .......................... 200 23 35 23 61 39 18 0 0 0.2 0.2 0.2 0.6 0.4 0.3 0.0 0.0 0.21979 .......................... 207 22 28 35 56 46 19 1 0 0.2 0.2 0.3 0.6 0.5 0.3 0.0 0.0 0.2
Black, male1992 .......................... 39 1 5 8 14 4 6 1 0 0.3 0.2 0.4 1.1 0.5 0.9 0.4 0.0 0.31991 .......................... 53 0 10 17 10 8 6 2 0 0.4 0.4 0.8 0.8 0.9 1.0 0.7 0.0 0.41990 .......................... 55 2 9 25 9 3 7 0 0 0.4 0.3 1.3 0.8 0.3 1.1 0.0 0.0 0.41989 .......................... 77 2 16 16 19 16 6 2 0 0.5 0.6 0.8 1.6 1.8 1.0 0.7 0.0 0.61988 .......................... 76 3 14 18 25 10 5 1 0 0.5 0.5 1.0 2.2 1.1 0.8 0.4 0.0 0.61987 .......................... 76 3 8 26 19 12 8 0 0 0.5 0.3 1.5 1.7 1.4 1.3 0.0 0.0 0.71986 .......................... 87 2 14 27 20 14 7 2 1 0.6 0.6 1.7 1.8 1.6 1.2 0.8 1.6 0.8
1985 .......................... 81 2 11 30 17 14 6 0 0 0.6 0.5 1.9 1.6 1.6 1.0 0.0 0.0 0.71984 .......................... 67 2 13 15 17 16 3 1 0 0.5 0.6 1.0 1.6 1.8 0.5 0.4 0.0 0.61983 .......................... 79 3 15 15 15 23 7 1 0 0.6 0.7 1.1 1.4 2.6 1.2 0.4 0.0 0.71982 .......................... 94 3 20 25 25 17 3 1 0 0.7 0.9 1.9 2.4 2.0 0.5 0.4 0.0 0.91981 .......................... 80 3 12 23 23 18 0 0 0 0.6 0.6 1.8 2.2 2.1 0.0 0.0 0.0 0.81980 .......................... 87 2 13 25 22 19 5 1 0 0.7 0.7 2.0 2.1 2.2 0.9 0.4 0.0 0.91979 .......................... 108 5 23 25 31 16 5 1 0 0.9 1.2 2.1 3.1 1.9 0.9 0.4 0.0 1.1
White, female1992 .......................... 45 3 8 16 11 4 2 1 0 0.0 0.0 0.1 0.1 0.0 0.0 0.0 0.0 0.01991 .......................... 49 1 9 14 12 10 2 1 0 0.0 0.1 0.1 0.1 0.1 0.0 0.0 0.0 0.0
- 185 -
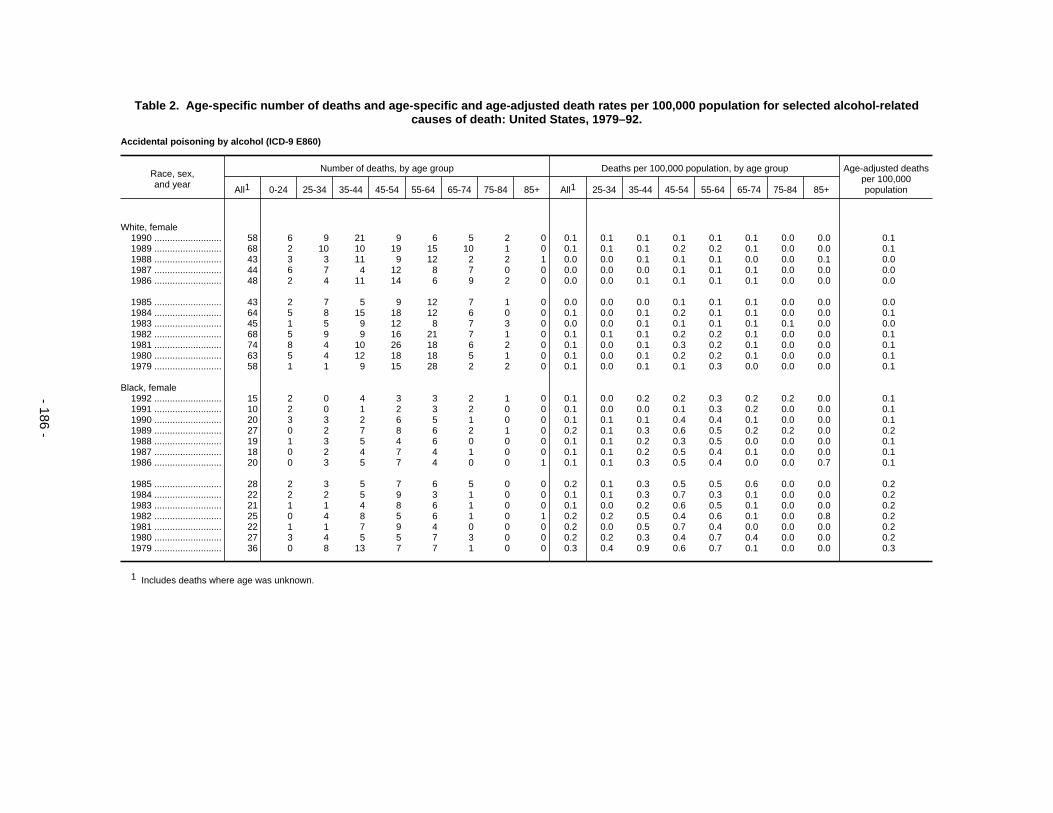
Table 2. Age-specific number of deaths and age-specific and age-adjusted death rates per 100,000 population for selected alcohol-relatedcauses of death: United States, 1979–92.
Accidental poisoning by alcohol (ICD-9 E860)
Race, sex,and year
Number of deaths, by age group Deaths per 100,000 population, by age group Age-adjusted deathsper 100,000populationAll1 0-24 25-34 35-44 45-54 55-64 65-74 75-84 85+ All1 25-34 35-44 45-54 55-64 65-74 75-84 85+
White, female1990 .......................... 58 6 9 21 9 6 5 2 0 0.1 0.1 0.1 0.1 0.1 0.1 0.0 0.0 0.11989 .......................... 68 2 10 10 19 15 10 1 0 0.1 0.1 0.1 0.2 0.2 0.1 0.0 0.0 0.11988 .......................... 43 3 3 11 9 12 2 2 1 0.0 0.0 0.1 0.1 0.1 0.0 0.0 0.1 0.01987 .......................... 44 6 7 4 12 8 7 0 0 0.0 0.0 0.0 0.1 0.1 0.1 0.0 0.0 0.01986 .......................... 48 2 4 11 14 6 9 2 0 0.0 0.0 0.1 0.1 0.1 0.1 0.0 0.0 0.0
1985 .......................... 43 2 7 5 9 12 7 1 0 0.0 0.0 0.0 0.1 0.1 0.1 0.0 0.0 0.01984 .......................... 64 5 8 15 18 12 6 0 0 0.1 0.0 0.1 0.2 0.1 0.1 0.0 0.0 0.11983 .......................... 45 1 5 9 12 8 7 3 0 0.0 0.0 0.1 0.1 0.1 0.1 0.1 0.0 0.01982 .......................... 68 5 9 9 16 21 7 1 0 0.1 0.1 0.1 0.2 0.2 0.1 0.0 0.0 0.11981 .......................... 74 8 4 10 26 18 6 2 0 0.1 0.0 0.1 0.3 0.2 0.1 0.0 0.0 0.11980 .......................... 63 5 4 12 18 18 5 1 0 0.1 0.0 0.1 0.2 0.2 0.1 0.0 0.0 0.11979 .......................... 58 1 1 9 15 28 2 2 0 0.1 0.0 0.1 0.1 0.3 0.0 0.0 0.0 0.1
Black, female1992 .......................... 15 2 0 4 3 3 2 1 0 0.1 0.0 0.2 0.2 0.3 0.2 0.2 0.0 0.11991 .......................... 10 2 0 1 2 3 2 0 0 0.1 0.0 0.0 0.1 0.3 0.2 0.0 0.0 0.11990 .......................... 20 3 3 2 6 5 1 0 0 0.1 0.1 0.1 0.4 0.4 0.1 0.0 0.0 0.11989 .......................... 27 0 2 7 8 6 2 1 0 0.2 0.1 0.3 0.6 0.5 0.2 0.2 0.0 0.21988 .......................... 19 1 3 5 4 6 0 0 0 0.1 0.1 0.2 0.3 0.5 0.0 0.0 0.0 0.11987 .......................... 18 0 2 4 7 4 1 0 0 0.1 0.1 0.2 0.5 0.4 0.1 0.0 0.0 0.11986 .......................... 20 0 3 5 7 4 0 0 1 0.1 0.1 0.3 0.5 0.4 0.0 0.0 0.7 0.1
1985 .......................... 28 2 3 5 7 6 5 0 0 0.2 0.1 0.3 0.5 0.5 0.6 0.0 0.0 0.21984 .......................... 22 2 2 5 9 3 1 0 0 0.1 0.1 0.3 0.7 0.3 0.1 0.0 0.0 0.21983 .......................... 21 1 1 4 8 6 1 0 0 0.1 0.0 0.2 0.6 0.5 0.1 0.0 0.0 0.21982 .......................... 25 0 4 8 5 6 1 0 1 0.2 0.2 0.5 0.4 0.6 0.1 0.0 0.8 0.21981 .......................... 22 1 1 7 9 4 0 0 0 0.2 0.0 0.5 0.7 0.4 0.0 0.0 0.0 0.21980 .......................... 27 3 4 5 5 7 3 0 0 0.2 0.2 0.3 0.4 0.7 0.4 0.0 0.0 0.21979 .......................... 36 0 8 13 7 7 1 0 0 0.3 0.4 0.9 0.6 0.7 0.1 0.0 0.0 0.3
1 Includes deaths where age was unknown.
- 186 -

Table 2. Age-specific number of deaths and age-specific and age-adjusted death rates per 100,000 population for selected alcohol-relatedcauses of death: United States, 1979–92.
Alcoholic psychoses (ICD-9 291)
Race, sex,and year
Number of deaths, by age group Deaths per 100,000 population, by age group Age-adjusted deathsper 100,000populationAll1 0-24 25-34 35-44 45-54 55-64 65-74 75-84 85+ All1 25-34 35-44 45-54 55-64 65-74 75-84 85+
All races, both sexes1992 .......................... 384 0 13 60 57 83 97 61 13 0.2 0.0 0.2 0.2 0.4 0.5 0.6 0.4 0.11991 .......................... 360 0 10 55 52 70 97 64 12 0.1 0.0 0.1 0.2 0.3 0.5 0.6 0.4 0.11990 .......................... 433 1 26 51 71 87 120 57 20 0.2 0.1 0.1 0.3 0.4 0.7 0.6 0.7 0.11989 .......................... 403 0 27 57 64 93 105 45 12 0.2 0.1 0.2 0.3 0.4 0.6 0.5 0.4 0.11988 .......................... 372 3 26 65 63 98 70 39 8 0.2 0.1 0.2 0.3 0.5 0.4 0.4 0.3 0.11987 .......................... 382 1 20 71 72 88 84 39 7 0.2 0.0 0.2 0.3 0.4 0.5 0.4 0.2 0.11986 .......................... 347 1 18 55 64 80 85 35 9 0.1 0.0 0.2 0.3 0.4 0.5 0.4 0.3 0.1
1985 .......................... 368 1 30 67 68 100 66 29 7 0.2 0.1 0.2 0.3 0.5 0.4 0.3 0.3 0.11984 .......................... 350 2 27 60 56 88 81 32 4 0.1 0.1 0.2 0.3 0.4 0.5 0.4 0.2 0.11983 .......................... 346 0 21 47 71 83 95 25 4 0.1 0.1 0.2 0.3 0.4 0.6 0.3 0.2 0.11982 .......................... 389 1 22 47 102 105 74 34 4 0.2 0.1 0.2 0.5 0.5 0.5 0.4 0.2 0.21981 .......................... 453 1 40 59 94 128 95 30 6 0.2 0.1 0.2 0.4 0.6 0.6 0.4 0.3 0.21980 .......................... 454 8 29 79 114 114 85 21 4 0.2 0.1 0.3 0.5 0.5 0.5 0.3 0.2 0.21979 .......................... 412 3 25 62 88 129 72 31 2 0.2 0.1 0.2 0.4 0.6 0.5 0.4 0.1 0.2
All races, male1992 .......................... 321 0 8 50 46 70 82 55 10 0.3 0.0 0.3 0.3 0.7 1.0 1.4 1.1 0.21991 .......................... 307 0 8 47 46 60 82 54 10 0.2 0.0 0.2 0.4 0.6 1.0 1.4 1.1 0.21990 .......................... 359 1 19 37 64 75 103 47 13 0.3 0.1 0.2 0.5 0.8 1.3 1.2 1.5 0.31989 .......................... 342 0 23 48 57 80 90 36 8 0.3 0.1 0.3 0.5 0.8 1.2 1.0 1.0 0.21988 .......................... 318 3 19 55 57 86 60 32 6 0.3 0.1 0.3 0.5 0.9 0.8 0.9 0.7 0.21987 .......................... 302 1 15 57 55 73 68 29 4 0.3 0.1 0.3 0.5 0.7 0.9 0.8 0.5 0.21986 .......................... 298 0 11 48 56 70 77 30 6 0.3 0.1 0.3 0.5 0.7 1.0 0.9 0.8 0.2
1985 .......................... 312 0 23 54 54 91 64 21 5 0.3 0.1 0.3 0.5 0.9 0.9 0.6 0.7 0.21984 .......................... 299 1 18 43 52 80 73 28 4 0.3 0.1 0.3 0.5 0.8 1.0 0.9 0.5 0.21983 .......................... 290 0 14 37 59 71 82 23 4 0.3 0.1 0.3 0.5 0.7 1.2 0.7 0.5 0.21982 .......................... 333 0 18 35 88 89 71 29 3 0.3 0.1 0.3 0.8 0.9 1.0 1.0 0.4 0.31981 .......................... 378 0 27 42 82 109 85 27 6 0.3 0.1 0.3 0.8 1.1 1.2 0.9 0.9 0.31980 .......................... 380 6 20 62 99 98 74 18 3 0.3 0.1 0.5 0.9 1.0 1.1 0.6 0.4 0.31979 .......................... 347 3 21 50 72 112 62 25 2 0.3 0.1 0.4 0.7 1.1 0.9 0.9 0.3 0.3
All races, female1992 .......................... 63 0 5 10 11 13 15 6 3 0.0 0.0 0.0 0.1 0.1 0.1 0.1 0.1 0.01991 .......................... 53 0 2 8 6 10 15 10 2 0.0 0.0 0.0 0.0 0.1 0.1 0.2 0.1 0.01990 .......................... 74 0 7 14 7 12 17 10 7 0.1 0.0 0.1 0.1 0.1 0.2 0.2 0.3 0.01989 .......................... 61 0 4 9 7 13 15 9 4 0.0 0.0 0.0 0.1 0.1 0.1 0.1 0.2 0.01988 .......................... 54 0 7 10 6 12 10 7 2 0.0 0.0 0.1 0.0 0.1 0.1 0.1 0.1 0.01987 .......................... 80 0 5 14 17 15 16 10 3 0.1 0.0 0.1 0.1 0.1 0.2 0.2 0.1 0.11986 .......................... 49 1 7 7 8 10 8 5 3 0.0 0.0 0.0 0.1 0.1 0.1 0.1 0.2 0.0
1985 .......................... 56 1 7 13 14 9 2 8 2 0.0 0.0 0.1 0.1 0.1 0.0 0.1 0.1 0.01984 .......................... 51 1 9 17 4 8 8 4 0 0.0 0.0 0.1 0.0 0.1 0.1 0.1 0.0 0.0
- 187 -

Table 2. Age-specific number of deaths and age-specific and age-adjusted death rates per 100,000 population for selected alcohol-relatedcauses of death: United States, 1979–92.
Alcoholic psychoses (ICD-9 291)
Race, sex,and year
Number of deaths, by age group Deaths per 100,000 population, by age group Age-adjusted deathsper 100,000populationAll1 0-24 25-34 35-44 45-54 55-64 65-74 75-84 85+ All1 25-34 35-44 45-54 55-64 65-74 75-84 85+
All races, female1983 .......................... 56 0 7 10 12 12 13 2 0 0.0 0.0 0.1 0.1 0.1 0.1 0.0 0.0 0.01982 .......................... 56 1 4 12 14 16 3 5 1 0.0 0.0 0.1 0.1 0.1 0.0 0.1 0.1 0.01981 .......................... 75 1 13 17 12 19 10 3 0 0.1 0.1 0.1 0.1 0.2 0.1 0.1 0.0 0.11980 .......................... 74 2 9 17 15 16 11 3 1 0.1 0.0 0.1 0.1 0.1 0.1 0.1 0.1 0.11979 .......................... 65 0 4 12 16 17 10 6 0 0.1 0.0 0.1 0.1 0.1 0.1 0.1 0.0 0.1
White, male1992 .......................... 247 0 6 34 31 51 70 46 9 0.2 0.0 0.2 0.3 0.6 1.0 1.3 1.1 0.21991 .......................... 222 0 4 30 25 44 68 43 8 0.2 0.0 0.2 0.2 0.5 0.9 1.2 1.0 0.21990 .......................... 264 0 7 21 50 53 80 40 13 0.3 0.0 0.1 0.5 0.6 1.1 1.2 1.7 0.21989 .......................... 235 0 15 20 30 56 76 30 8 0.2 0.1 0.1 0.3 0.6 1.1 0.9 1.1 0.21988 .......................... 203 2 8 30 30 53 49 25 6 0.2 0.0 0.2 0.3 0.6 0.7 0.8 0.8 0.21987 .......................... 213 0 11 28 30 55 61 24 4 0.2 0.1 0.2 0.3 0.6 0.9 0.8 0.6 0.21986 .......................... 210 0 4 29 30 52 63 26 6 0.2 0.0 0.2 0.3 0.6 0.9 0.8 0.9 0.2
1985 .......................... 220 0 8 31 32 69 55 20 5 0.2 0.0 0.2 0.3 0.7 0.8 0.7 0.7 0.21984 .......................... 207 1 7 19 32 59 61 25 3 0.2 0.0 0.1 0.3 0.6 0.9 0.9 0.4 0.21983 .......................... 192 0 2 22 35 49 61 20 3 0.2 0.0 0.2 0.4 0.5 0.9 0.7 0.5 0.21982 .......................... 241 0 8 15 58 73 57 27 3 0.2 0.0 0.1 0.6 0.8 0.9 1.0 0.5 0.21981 .......................... 269 0 11 19 54 92 65 24 4 0.3 0.1 0.2 0.6 1.0 1.0 0.9 0.6 0.21980 .......................... 255 2 9 29 62 74 59 17 3 0.3 0.1 0.3 0.6 0.8 1.0 0.6 0.5 0.21979 .......................... 245 1 7 23 54 80 55 23 2 0.3 0.0 0.2 0.5 0.9 0.9 0.9 0.3 0.2
Black, male1992 .......................... 66 0 2 12 14 17 11 9 1 0.4 0.1 0.6 1.1 1.9 1.7 3.2 1.4 0.51991 .......................... 81 0 4 17 20 15 13 10 2 0.6 0.2 0.8 1.7 1.7 2.1 3.6 3.0 0.61990 .......................... 89 0 10 14 13 22 23 7 0 0.6 0.4 0.7 1.1 2.5 3.7 2.5 0.0 0.71989 .......................... 96 0 6 25 26 22 13 4 0 0.7 0.2 1.3 2.2 2.5 2.1 1.5 0.0 0.81988 .......................... 109 0 10 24 25 33 10 7 0 0.8 0.4 1.3 2.2 3.7 1.7 2.6 0.0 0.91987 .......................... 84 0 3 28 23 18 7 5 0 0.6 0.1 1.6 2.1 2.0 1.2 1.9 0.0 0.71986 .......................... 83 0 7 17 25 17 14 3 0 0.6 0.3 1.0 2.3 1.9 2.4 1.1 0.0 0.8
1985 .......................... 89 0 14 23 21 21 9 1 0 0.7 0.6 1.5 2.0 2.4 1.5 0.4 0.0 0.81984 .......................... 80 0 8 20 18 18 12 3 1 0.6 0.3 1.4 1.7 2.0 2.1 1.2 1.6 0.71983 .......................... 90 0 11 13 23 19 20 3 1 0.7 0.5 0.9 2.2 2.2 3.5 1.2 1.7 0.81982 .......................... 85 0 8 19 27 15 14 2 0 0.7 0.4 1.4 2.6 1.7 2.4 0.8 0.0 0.81981 .......................... 105 0 16 21 28 17 19 2 2 0.8 0.8 1.6 2.7 2.0 3.3 0.9 3.6 1.01980 .......................... 121 4 9 33 35 24 15 1 0 1.0 0.5 2.6 3.4 2.8 2.6 0.4 0.0 1.21979 .......................... 96 2 12 24 18 32 6 2 0 0.8 0.6 2.0 1.8 3.8 1.1 0.9 0.0 1.0
White, female1992 .......................... 46 0 3 5 8 11 11 5 3 0.0 0.0 0.0 0.1 0.1 0.1 0.1 0.1 0.01991 .......................... 40 0 0 4 4 7 14 9 2 0.0 0.0 0.0 0.0 0.1 0.2 0.2 0.1 0.0
- 188 -

Table 2. Age-specific number of deaths and age-specific and age-adjusted death rates per 100,000 population for selected alcohol-relatedcauses of death: United States, 1979–92.
Alcoholic psychoses (ICD-9 291)
Race, sex,and year
Number of deaths, by age group Deaths per 100,000 population, by age group Age-adjusted deathsper 100,000populationAll1 0-24 25-34 35-44 45-54 55-64 65-74 75-84 85+ All1 25-34 35-44 45-54 55-64 65-74 75-84 85+
White, female1990 .......................... 48 0 4 7 2 6 16 7 6 0.0 0.0 0.0 0.0 0.1 0.2 0.1 0.3 0.01989 .......................... 41 0 2 4 3 7 13 9 3 0.0 0.0 0.0 0.0 0.1 0.1 0.2 0.2 0.01988 .......................... 37 0 4 6 3 9 7 6 2 0.0 0.0 0.0 0.0 0.1 0.1 0.1 0.1 0.01987 .......................... 61 0 2 5 12 13 16 10 3 0.1 0.0 0.0 0.1 0.1 0.2 0.2 0.2 0.01986 .......................... 29 0 0 2 5 8 6 5 3 0.0 0.0 0.0 0.1 0.1 0.1 0.1 0.2 0.0
1985 .......................... 35 0 3 5 11 6 1 7 2 0.0 0.0 0.0 0.1 0.1 0.0 0.1 0.1 0.01984 .......................... 28 1 4 4 2 6 7 4 0 0.0 0.0 0.0 0.0 0.1 0.1 0.1 0.0 0.01983 .......................... 35 0 0 4 6 10 13 2 0 0.0 0.0 0.0 0.1 0.1 0.2 0.0 0.0 0.01982 .......................... 30 0 0 6 5 11 2 5 1 0.0 0.0 0.0 0.0 0.1 0.0 0.1 0.1 0.01981 .......................... 43 1 3 5 8 14 9 3 0 0.0 0.0 0.0 0.1 0.1 0.1 0.1 0.0 0.01980 .......................... 39 1 0 2 9 13 11 3 0 0.0 0.0 0.0 0.1 0.1 0.1 0.1 0.0 0.01979 .......................... 41 0 1 5 8 14 7 6 0 0.0 0.0 0.0 0.1 0.1 0.1 0.1 0.0 0.0
Black, female1992 .......................... 15 0 1 5 3 2 3 1 0 0.1 0.0 0.2 0.2 0.2 0.3 0.2 0.0 0.11991 .......................... 10 0 0 4 1 3 1 1 0 0.1 0.0 0.2 0.1 0.3 0.1 0.2 0.0 0.11990 .......................... 23 0 3 5 5 5 1 3 1 0.1 0.1 0.2 0.4 0.4 0.1 0.6 0.6 0.11989 .......................... 17 0 1 4 4 6 2 0 0 0.1 0.0 0.2 0.3 0.5 0.2 0.0 0.0 0.11988 .......................... 15 0 2 4 3 3 3 0 0 0.1 0.1 0.2 0.2 0.3 0.3 0.0 0.0 0.11987 .......................... 14 0 2 8 2 2 0 0 0 0.1 0.1 0.4 0.1 0.2 0.0 0.0 0.0 0.11986 .......................... 20 1 7 5 3 2 2 0 0 0.1 0.3 0.3 0.2 0.2 0.2 0.0 0.0 0.1
1985 .......................... 19 1 3 8 2 3 1 1 0 0.1 0.1 0.4 0.2 0.3 0.1 0.2 0.0 0.11984 .......................... 23 0 5 13 2 2 1 0 0 0.2 0.2 0.7 0.2 0.2 0.1 0.0 0.0 0.21983 .......................... 20 0 7 5 6 2 0 0 0 0.1 0.3 0.3 0.5 0.2 0.0 0.0 0.0 0.21982 .......................... 24 1 4 5 8 5 1 0 0 0.2 0.2 0.3 0.6 0.5 0.1 0.0 0.0 0.21981 .......................... 32 0 10 12 4 5 1 0 0 0.2 0.4 0.8 0.3 0.5 0.1 0.0 0.0 0.31980 .......................... 35 1 9 15 6 3 0 0 1 0.2 0.4 1.0 0.5 0.3 0.0 0.0 0.9 0.31979 .......................... 24 0 3 7 8 3 3 0 0 0.2 0.1 0.5 0.6 0.3 0.4 0.0 0.0 0.2
1 Includes deaths where age was unknown.
- 189 -

- 190 -
3. References
Caces, F., Stinson, F., and Elliott, S. 1991. U.S. Alcohol Epidemiologic Data Reference Manual,Volume 3, Third Edition: County Alcohol Problem Indicators, 1979–1985. Washington,DC: National Institute on Alcohol Abuse and Alcoholism.
Colliver, J. D., Van Natta, P., Dufour, M., Bertolucci, D., and Malin, H. “A System To ConvertICD Diagnostic Codes for Alcohol Research.” Morbidity and Mortality Weekly Report33(16):216-22.
Colliver, J.D. 1981. U.S. Alcohol Epidemiologic Data Reference Manual, Section 3: CountyAlcohol Problem Indicators, 1975–1977. Washington, DC: National Institute on AlcoholAbuse and Alcoholism.
Colliver, J. 1985. U.S. Alcohol Epidemiologic Data Reference Manual, Volume 3, SecondEdition: County Alcohol Problem lndicators, 1975-1980. Washington, DC: NationalInstitute on Alcohol Abuse and Alcoholism.
Dufour, M.C., Stinson, F.S., and Caces, M.F. 1993. “Trends in Cirrhosis Morbidity andMortality: United States, 1979-1988.” Seminars in Liver Disease 13(2).
Grant, B.F. 1985. U.S. Alcohol Epidemiologic Data Reference Manual Volume 2: LiverCirrhosis Mortality in the United States. Rockville, MD: U.S. Department of Health andHuman Services, Public Health Service.
McDonnell, R., and Maynard, A. 1985. “Estimation of Life Years Lost From Alcohol-RelatedPremature Death.” Alcohol & Alcoholism 20:435-43.
National Center for Health Statistics (NCHS). 1982. Instructions for Classifying the UnderlyingCause of Death, 1983. Hyattsville, MD: NCHS.
Parker, D., Schultz, J., Gertz, L., Berkelman, R., and Remington, P. 1987. “The Social andEconomic Cost of Alcohol Abuse in Minnesota.” American Journal of Public Health77:982-86.
Ravenholt, R. 1984. “Addiction Mortality in the United States:Tobacco, Alcohol, and OtherSubstances.” Population and Development Review 10:697-724.
Rice, D., Kelman, S., Miller, L., and Denmeyer, S. 1990. The Economic Costs of Alcohol andDrug Abuse and Mental Illnesses: 1985 (DHHS Publication No. ADM 90-1694). SanFrancisco, CA: Institute on Health and Aging, University of California.
Savage, G.E., Calvert, W.S., Rohde, F.C., and Grant, B. 1994. Surveillance Report #33: LiverCirrhosis Mortality in the United States, 1970–91. Rockville, MD: National Institute onAlcohol Abuse and Alcoholism.
Schultz, J., Rice, D., and Parker, D. 1990. “Alcohol-Related Mortality and Years of PotentialLife Lost—United States, 1987.” Morbidity & Mortality Weekly Report 39:173-78.
Stinson, F., and DeBakey, S. 1992. “Alcohol-Related Mortality in the United States, 1979-1988.”British Journal of Addiction 87:777-83.

- 191 -
Stinson, F., Dufour, M., Steffens, R, and DeBakey, S. 1993. “Alcohol-Related Mortality in theUnited States, 1979-1989.” Alcohol Health & Research World 17:251-60.
Stinson, F., and Proudfit, A. 1994. U.S. Alcohol Epidemiologic Data Reference Manual, Volume3, Fourth Edition: County Alcohol Problem Indicators, 1986–1990. Washington, DC:National Institute on Alcohol Abuse and Alcoholism.