statement of financial position · 78 statement of financial position for the year ended 31 march...
TRANSCRIPT

78
STATEMENT OF FINANCIAL POSITION for the year ended 31 March 2010
GROUP COMPANY
31 March 31 March 31 March 31 March
2010 2009 2010 2009
Note R’000 R’000 R’000 R’000
ASSETS
Non-current assets 26 587 912 21 641 041 25 368 290 20 625 428
Property, plant and equipment 6 23 268 429 18 693 939 23 225 425 18 571 959
Investment property 8 2 433 438 2 265 019 1 630 483 1 581 019
Intangible assets 7 110 993 105 594 110 118 105 539
Investment in subsidiaries 9 – – 256 289 250 400
Investment in joint ventures 10 – – –* –*
Investment in associates 11 661 327 459 978 32 250 –
other non-current assets 12 113 725 116 511 113 725 116 511
Current assets 1 303 266 1 957 071 1 219 642 1 778 521
Inventories 13 908 1 424 – 502
trade and other receivables 14 868 361 966 303 869 026 949 990
Cash and cash equivalents 15 433 997 989 344 350 616 828 029
total assets 27 891 178 23 598 112 26 587 932 22 403 949
EQUITY AND LIABILITIES
Equity
share capital 16 500 000 500 000 500 000 500 000
share premium 16 250 000 250 000 250 000 250 000
other reserves 18 (28 513) (22 075) (20 860) (17 930)
treasury share reserve 17 (44 024) (44 024) – –
Retained earnings 8 290 669 7 390 749 7 713 751 6 954 899
Total equity attributable to equity holders 8 968 132 8 074 650 8 442 891 7 686 969
Debentures 19 6 000 6 000 – –
Total equity 8 974 132 8 080 650 8 442 891 7 686 969
Non-current liabilities 15 685 697 9 979 435 14 925 446 9 235 846
Interest-bearing borrowings 22 14 704 336 9 114 726 14 028 653 8 441 084
Retirement benefit obligations 20 105 043 89 280 105 043 89 280
Derivative financial instruments 26 46 945 – 46 945 –
Deferred income 21 79 524 195 79 524 195
Deferred tax liabilities 23 749 849 775 234 665 281 705 287
Current liabilities 3 231 349 5 538 027 3 219 595 5 481 134
trade and other payables 24 1 800 155 2 124 558 1 790 901 2 074 595
Interest-bearing borrowings 22 1 305 692 2 833 601 1 304 193 2 830 211
Provisions 25 66 257 48 216 66 257 48 179
Derivative financial instruments 26 56 381 – 56 381 –
Income tax liability 1 001 20 037 – 16 534
Deferred income 21 1 863 511 615 1 863 511 615
Total liabilities 18 917 046 15 517 462 18 145 041 14 716 980
Total equity and liabilities 27 891 178 23 598 112 26 587 932 22 403 949
* Amount less than R1 000

79
STATEMENT OF COMPREHENSIVE INCOMEfor the year ended 31 March 2010
GROUP COMPANY
2010 2009 2010 2009
Note R’000 R’000 R’000 R’000
Revenue 27 3 530 825 3 166 082 3 378 089 3 007 684
other operating income 28 815 508 23 850 814 902 21 171
employee benefit expenses 30 (674 440) (540 377) (655 087) (521 334)
Depreciation and amortisation expense 6 and 7 (1 077 449) (748 939) (1 072 636) (746 154)
other operating expenses 31 (999 118) (905 145) (944 356) (836 801)
Operating profit 1 595 326 995 471 1 520 912 924 566
Fair value (losses)/gains 29 (62 685) 1 144 (83 155) (31 456)
share of profit of equity accounted associate 11 135 832 16 097 – –
Net finance expense 32 (673 435) (379 401) (604 959) (319 871)
Profit before tax 995 038 633 310 832 798 573 240
Income tax expense 33 (94 252) (189 413) (73 946) (174 158)
Profit for the year 900 786 443 897 758 852 399 082
Other comprehensive income for the year net of tax (7 304) (13 515) (2 930) (5 257)
Actuarial losses on defined benefit post retirement
medical aid liability 20 (4 070) (7 301) (4 070) (7 301)
Foreign currency translation differences (6 075) (11 469) – –
Income tax relating to components of other comprehensive income 2 841 5 255 1 140 2 044
Total comprehensive income for the year 893 482 430 382 755 922 393 825
Profit attributable to:
owners of the parent 900 786 443 897 758 852 399 082
Minority interest – – – –
900 786 443 897 758 852 399 082
Total comprehensive income attributable to:
owners of the parent 893 482 430 382 755 922 393 825
Minority interest – – – –
893 482 430 382 755 922 393 825
Earnings per share
Basic (cents) 182,33 89,85
Diluted (cents) 182,33 89,85
80
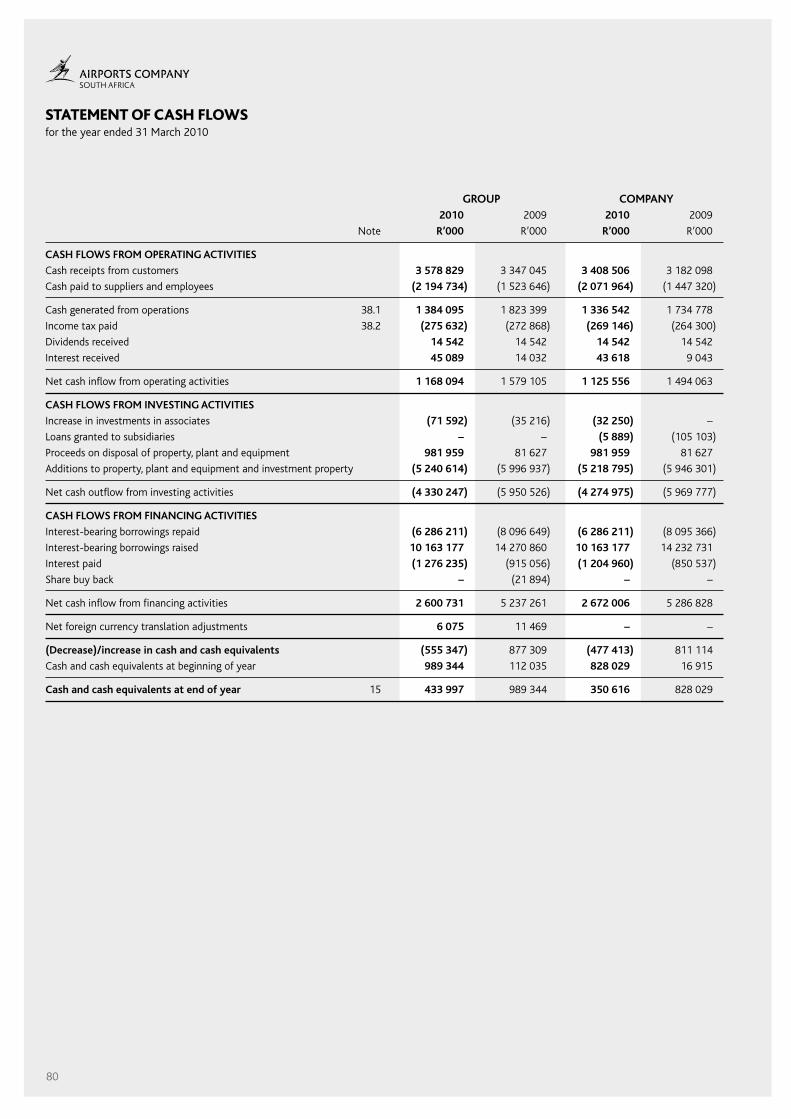
STATEMENT OF CASH FLOWSfor the year ended 31 March 2010
GROUP COMPANY 2010 2009 2010 2009
Note R’000 R’000 R’000 R’000
CASH FLOWS FROM OPERATING ACTIVITIES
Cash receipts from customers 3 578 829 3 347 045 3 408 506 3 182 098
Cash paid to suppliers and employees (2 194 734) (1 523 646) (2 071 964) (1 447 320)
Cash generated from operations 38.1 1 384 095 1 823 399 1 336 542 1 734 778
Income tax paid 38.2 (275 632) (272 868) (269 146) (264 300)
Dividends received 14 542 14 542 14 542 14 542
Interest received 45 089 14 032 43 618 9 043
Net cash inflow from operating activities 1 168 094 1 579 105 1 125 556 1 494 063
CASH FLOWS FROM INVESTING ACTIVITIES
Increase in investments in associates (71 592) (35 216) (32 250) –
Loans granted to subsidiaries – – (5 889) (105 103)
Proceeds on disposal of property, plant and equipment 981 959 81 627 981 959 81 627
Additions to property, plant and equipment and investment property (5 240 614) (5 996 937) (5 218 795) (5 946 301)
Net cash outflow from investing activities (4 330 247) (5 950 526) (4 274 975) (5 969 777)
CASH FLOWS FROM FINANCING ACTIVITIES
Interest-bearing borrowings repaid (6 286 211) (8 096 649) (6 286 211) (8 095 366)
Interest-bearing borrowings raised 10 163 177 14 270 860 10 163 177 14 232 731
Interest paid (1 276 235) (915 056) (1 204 960) (850 537)
share buy back – (21 894) – –
Net cash inflow from financing activities 2 600 731 5 237 261 2 672 006 5 286 828
Net foreign currency translation adjustments 6 075 11 469 – –
(Decrease)/increase in cash and cash equivalents (555 347) 877 309 (477 413) 811 114
Cash and cash equivalents at beginning of year 989 344 112 035 828 029 16 915
Cash and cash equivalents at end of year 15 433 997 989 344 350 616 828 029

81
STATEMENT OF CHANGES IN EQUITYfor the year ended 31 March 2010
GROUP Attributable to equity holders of the parent share share Retained treasury share other Minority capital premium earnings reserve reserve1 total interest Debentures total R’000 R’000 R’000 R’000 R’000 R’000 R’000 R’000 R’000
Balance at 1 April 2008 500 000 250 000 6 970 628 (44 024) (10 442) 7 666 162 – 6 000 7 672 162
Transactions with owners – – – – – – – – –Comprehensive incomeProfit for the year – – 443 897 – – 443 897 – – 443 897
Other comprehensive incomeActuarial losses on defined benefit post retirement medical aid liability – – – – (5 257) (5 257) – – (5 257)Foreign currency translation differences – – – – (8 258) (8 258) – – (8 258)transfer to life fund – – (1 882) – 1 882 – – – –
Total other comprehensive income – – (1 882) – (11 633) (13 515) – – (13 515)
Total comprehensive income – – 442 015 – (11 633) 430 382 – – 430 382
Repurchase of equity interests – – (21 894) – – (21 894) – – (21 894)
Balance at 31 March 2009 500 000 250 000 7 390 749 (44 024) (22 075) 8 074 650 – 6 000 8 080 650 Transactions with owners – – – – – – – – –Comprehensive incomeProfit for the year – – 900 786 – – 900 786 – – 900 786
Total comprehensive income – – 900 786 – – 900 786 – – 900 786
Other comprehensive incomeActuarial losses on defined benefit post retirement medical aid liability – – – – (2 930) (2 930) – – (2 930)Foreign currency translation differences – – – – (4 374) (4 374) – – (4 374)transfer to life fund – – (866) – 866 – – – –
Total other comprehensive income – – (866) – (6 438) (7 304) – – (7 304)
Total comprehensive income – – 899 920 – (6 438) 893 482 – – 893 482
Balance at 31 March 2010 500 000 250 000 8 290 669 (44 024) (28 513) 8 968 132 – 6 000 8 974 132
COMPANYBalance at 1 April 2008 500 000 250 000 6 555 817 – (12 673) 7 293 144 – – 7 293 144 Transactions with owners – – – – – – – – –Comprehensive incomeProfit for the year – – 399 082 – 399 082 – – 399 082
Other comprehensive incomeActuarial losses on defined benefit post retirement medical aid liability – – – – (5 257) (5 257) – – (5 257)
total other comprehensive income – – – – (5 257) (5 257) – – (5 257)
Total comprehensive income – – 399 082 – (5 257) 393 825 – – 393 825
Balance at 31 March 2009 500 000 250 000 6 954 899 – (17 930) 7 686 969 – – 7 686 969 Transactions with owners – – – – – – – –Comprehensive incomeProfit for the year – – 758 852 – – 758 852 – – 758 852
Other comprehensive incomeActuarial losses on defined benefit post retirement medical aid liability net of tax – – – – (2 930) (2 930) – – (2 930)
Total other comprehensive income – – – – (2 930) (2 930) – – (2 930)
Total comprehensive income – – 758 852 – (2 930) 755 922 – – 755 922
Balance at 31 March 2010 500 000 250 000 7 713 751 – (20 860) 8 442 891 – – 8 442 891
Dividend proposed.No dividend has been proposed.1 Other Reservesother reserves comprise:
Life Fundthe transfer to the Life Fund represents amounts to fund future pension payments. the Company acquired 100% shareholding in a cell captive with Guardrisk Life Ltd in september 2003 to fund its obligation arising from 2002 whereby the Company agreed to increase the minimum pension payout to employees. Guardrisk performs a half-yearly review per individual covered to establish the present value of the Company’s obligation on the prescribed valuation basis (as approved by Guardrisk Life statutory Actuaries) in order to assess the Company’s commitment as per the assets and expressed liabilities and ensure sufficient life funds are transferred to the non–distributable reserves.
Defined benefit plan actuarial lossesActuarial losses are recognised directly in equity/other reserves in terms of IAs 19 employee benefits.
Foreign currency translation reserve (FCTR)the foreign currency translation reserve arises on translation of the Group’s interests in foreign entities in to the reporting currency.

82
NOTES TO THE FINANCIAL STATEMENTSfor the year ended 31 March 2010
1 CoRPoRAte INFoRMAtIoN
Airports Company south Africa Limited is a company domiciled
in south Africa. the address of the Company’s registered office
is:the Maples, Riverwoods office Park, 24 Johnson Road, Bedfordview.
the financial statements of the Company for the year ended
31 March 2010 comprise those of the Company and its
subsidiaries (together referred to as the ‘Group’ and individually
as ‘Group entities’) and the Group’s interest in jointly controlled
and associated entities. the Group is primarily involved in the
acquisition, development, provision, maintenance, management
and operation of airports or parts of airports or any facilities
or services that are normally performed at an airport. other
operations in the Group mainly comprise hotel operations.
2 BAsIs oF PRePARAtIoN
the financial statements have been prepared in accordance
with International Financial Reporting standards (IFRs) and its
interpretations issued by the International Accounting standards
Board (IAsB) as well as the requirements of the south African
Companies Act and the requirements of the Public Finance
Management Act (Act 1 of 1999, as amended).
2.1 Basis of measurement
the financial statements have been prepared on the historical
cost basis, except for investment property and certain financial
instruments that are carried at fair value.
2.2 Functional and presentation currency
these financial statements are presented in south African Rand,
which is the Group’s functional currency. All financial information
presented in Rand has been rounded to the nearest thousand.
the accounting policies set out below have been applied consistently
to all periods presented in these financial statements, and have
been applied consistently by Group entities.
3 sUMMARY oF sIGNIFICANt ACCoUNtING PoLICIes
3.1 Basis of consolidation
Subsidiaries
subsidiaries are all entities (including special purpose entities)
over which the Group has the power to govern the financial
and operating policies generally accompanying a shareholding
of more than half of the voting rights. the existence and effect
of potential voting rights that are currently exercisable or
convertible are considered when assessing whether the Group
controls another entity. subsidiaries are fully consolidated from
the date on which control is transferred to the Group. they are no
longer consolidated from the date that control ceases.
the purchase method of accounting is used to account for the
acquisition of subsidiaries by the Group. the cost of an acquisition
is measured as the fair value of the assets given, equity instruments
issued and liabilities incurred or assumed at the date of exchange,
plus costs directly attributable to the acquisition. Identifiable
assets acquired and liabilities and contingent liabilities assumed in
a business combination are measured initially at their fair values
at the acquisition date, irrespective of the extent of any minority
interest. the excess of the cost of acquisition over the fair value
of the Group’s share of the identifiable net assets acquired is
recorded as goodwill. If the cost of acquisition is less than the fair
value of the net assets of the subsidiary acquired, the difference is
recognised directly in the statement of comprehensive income.
the Group’s investments in subsidiaries are carried at cost, net of
accumulated impairment losses.
Associates
Associates are all entities over which the Group has significant
influence but not control, generally accompanying a shareholding
of between 20% and 50% of the voting rights. Investments
in associates are accounted for using the equity method of
accounting and are initially recognised at cost.
the Group’s share of its associates’ post-acquisition profits
or losses is recognised in the statement of comprehensive
income, and its share of post-acquisition movements in reserves
is recognised in reserves. the cumulative post-acquisition
movements are adjusted against the carrying amount of the
investment. When the Group’s share of losses in an associate
equals or exceeds its interest in the associate, including any other
unsecured receivables, the Group does not recognise further
losses, unless it has incurred obligations or made payments on
behalf of the associate.
Unrealised gains on transactions between the Group and its
associates are eliminated to the extent of the Group’s interest
in the associates. Unrealised losses are also eliminated unless
the transaction provides evidence of an impairment of the asset
transferred. Accounting policies of associates have been changed
where necessary to ensure consistency with the policies adopted
by the Group. Dilution gains and losses arising in investments in
associates are recognised in the statement of comprehensive
income.
Jointly controlled entities
A jointly controlled entity is a joint venture that involves the
establishment of a corporation, partnership or other entity in
which each venturer has an interest. the entity operates in the
same way as other entities, except that a contractual arrangement
between the venturers establishes joint control over the economic
activity of the entity.
the Company’s investment in jointly controlled entities is carried
at cost, net of accumulated impairment losses.
the Group has an interest in a joint venture which is a jointly
controlled entity, whereby the venturers have a contractual
arrangement that establishes joint control over the economic
activities of the entity. the Group recognises its interests in
the joint venture using proportionate consolidation. the Group
combines its share of each of the assets, liabilities, income and
83
NOTES TO THE FINANCIAL STATEMENTS (continued)for the year ended 31 March 2010
3 sUMMARY oF sIGNIFICANt ACCoUNtING PoLICIes (continued) 3.1 Basis of consolidation (continued) expenses of the joint venture with similar line items, line by line,
in its consolidated financial statements. Adjustments are made in the Group’s financial statements to eliminate the Group’s share of unrealised gains and losses on transactions between the Group and its jointly controlled entity. Losses on transactions are recognised if the loss provided evidence of a reduction in the net realisable value of current assets or an impairment loss. the joint venture is proportionately consolidated until the date on which the Group ceases to have joint control over the joint venture.
Transactions eliminated on consolidation Intra-group balances and transactions, and any unrealised income
and expenses arising from intra-group transactions, are eliminated in preparing the consolidated financial statements. Unrealised losses are eliminated in the same way as unrealised gains, but only to the extent that there is no evidence of impairment.
Transactions with non-controlling interests the Group applies a policy of treating transactions with non-
controlling interests as transactions with parties external to the Group. Disposals to non-controlling interests result in gains and losses for the Group and are recorded in the statement of comprehensive income. Purchases from non-controlling interests result in goodwill, being the difference between any consideration paid and the relevant share acquired of the carrying value of net assets of the subsidiary.
3.2 Revenue recognition Revenue comprises the fair value of the consideration received
or receivable for the sale of goods and services in the ordinary course of the Group’s activities. Revenue is shown net of value-added tax, returns, rebates and discounts and after eliminating sales within the Group. the Group recognises revenue when the amount of revenue can be reliably measured, it is probable that future economic benefits will flow to the entity and when specific criteria have been met for each of the Group’s activities as described below. the Group bases its estimates on historical results, taking into consideration the type of customer, the type of transaction and the specifics of each arrangement.
Rental income is recognised in profit and loss on a straight-line basis over the term of the lease. Lease incentives are recognised as an integral part of rental income, over the term of the lease.
Revenue of the Group comprises the following:
Aeronautical revenue
Aeronautical revenue consists of the following:
Landing fees
Landing fees are determined by using regulated tariffs for aircraft landings based on the maximum take-off weight of landing aircrafts for each landing.
Passenger service charges
Passenger service charges are determined by using regulated
tariffs for each departing passenger at an airport of departure.
Aircraft parking
Aircraft parking fees are determined on regulated tariffs for each aircraft parked for over four hours based on the maximum take-off weight of aircraft parking per 24-hour period.
Commercial revenue
Commercial revenue consists of the following:
Advertising
Revenue is generated through the rental of advertising space to concessionaires. Rental income is normally based on the higher of a minimum guaranteed rental or a percentage of turnover.
Retail
Revenue is generated through the rental of retail space to concessionaires. Rental income is normally based on the greater of a percentage of turnover or a minimum monthly rental.
Parking
Revenue generated by providing short- and long-term parking facilities is determined on time-based tariffs.
Car hire
Revenue is generated from concession fees and the rental of space and kiosks to car hire companies.
Property rental
Revenue is generated through the rentals of offices, air lounges, aviation fuel depots, warehousing, logistics facilities, hotels and filling stations based on medium- to long-term rental agreements with tenants.
Hotel operations Revenue comprises the invoice value of accommodation and the
sale of food and beverages. Accommodation income is recognised in the financial statements at the date guests are invoiced.
Premiums received
Premiums received comprise the net gains on investments invested in an insurance cell captive.
Other
other revenue mainly consists of the recovery of electricity and water charges and fees charged for the issuing of permits.
3.3 other operating income other income is any income that accrued to the Group from
activities that are not part of the normal operations and is recognised as earned.
3.4 Finance income and expense Finance income comprises interest income on funds invested
and dividend income. Interest income is recognised as it accrues in profit and loss, using the effective interest method. Dividend income is recognised in profit and loss on the date that the
Group’s right to receive payment is established.
Finance expenses comprise interest expense on borrowings. All borrowing costs are recognised in profit and loss using the effective interest method.
84
NOTES TO THE FINANCIAL STATEMENTS (continued)for the year ended 31 March 2010
3 sUMMARY oF sIGNIFICANt ACCoUNtING PoLICIes (continued) 3.5 Leases Payments made under operating leases are recognised in profit
and loss on a straight-line basis over the term of the lease. Lease incentives received are recognised as an integral part of the total lease expense, over the term of the lease.
Minimum lease payments made under finance leases are apportioned between the finance expense and the reduction of the outstanding liability. the finance expense is allocated to each period during the lease term so as to produce a constant periodic rate of interest on the remaining balance of the liability.
Contingent lease payments are accounted for by revising the minimum lease payments over the remaining term of the lease when the contingency no longer exists and the lease adjustment is known.
Leases in terms of which the Group assumes substantially all the risks and rewards of ownership are classified as finance leases. Upon initial recognition the leased assets are measured at an amount equal to the lower of its fair value and the present value of the minimum lease payments. subsequent to initial recognition, the assets are accounted for in accordance with the accounting policy applicable to those assets.
other leases are operating leases not recognised in the Group’s statement of financial position.
3.6 Foreign currency Foreign operations the assets and liabilities of foreign operations, including goodwill
and fair value adjustments arising on acquisition, are translated to Rand at closing rate. the income and expenses of foreign operations, excluding foreign operations in hyperinflationary economies, are translated to Rand at exchange rates at the dates of the transactions.
Foreign currency differences are recognised directly in other comprehensive income. When a foreign operation is disposed of, in part or in full, the relevant amount in the FCtR is transferred to profit and loss.
Foreign exchange gains and losses arising from a monetary item receivable from or payable to a foreign operation, the settlement of which is neither planned nor likely in the foreseeable future, are considered to form part of net investment in a foreign operation and are recognised directly in equity in the FCtR.
Foreign currency transactions and balances transactions in foreign currencies are translated to the respective
functional currencies of Group entities at exchange rates at the dates of the transactions. Monetary assets and liabilities denominated in foreign currencies at the reporting date are translated to the functional currency at the exchange rate at that date. the foreign currency gain or loss on monetary items is the difference between the amortised cost of the functional currency at the beginning of the period, adjusted for effective interest and
payments during the period, and the amortised cost in foreign
currency translated at the exchange rate at the end of the period.
Non-monetary assets and liabilities denominated in foreign
currencies that are measured at fair value are retranslated to the
functional currency at the exchange rate at the date that the
fair value was determined. Foreign currency differences arising on
translation are recognised in profit and loss.
3.7 Borrowing costs
Borrowing costs directly attributable to the acquisition,
construction or production of qualifying assets, which are assets
that necessarily take a substantial period of time to get ready for
their intended use or sale, are added to the cost of those assets,
until such time as the assets are substantially ready for their
intended use or sale. Investment income earned on the temporary
investment of specific borrowings pending their expenditure on
qualifying assets is deducted from the borrowing costs eligible for
capitalisation.
All other borrowing costs are recognised in profit and loss in the
period in which they are incurred.
3.8 employee benefits
Defined contribution plans
A defined contribution plan is a plan under which an entity pays
fixed contributions into a separate entity and will have no legal
or constructive obligation to pay further amounts. obligations for
contributions to defined contribution pension plans and medical
aid schemes are recognised as an employee benefit expense
in profit and loss when they are due. Prepaid contributions are
recognised as an asset to the extent that a cash refund or a
reduction in future payments is available.
Other long-term employee benefits
the Group’s net obligation in respect of post-employment medical
benefits is the amount of future benefit that employees have
earned in return for their services in the current and prior periods.
the benefit is discounted to determine its present value, and the
fair value of any related assets is deducted. the discount rate
is determined by the actuarial assumptions that have maturity
terms approximating the terms of the Group’s obligations. the
calculation is performed using the projected unit credit method.
the Group recognises all actuarial gains and losses arising from
experience adjustments and changes in actuarial assumptions
directly to equity in the statement of other comprehensive
income in the period in which they arise.
Short-term benefits
short-term employee benefit obligations are measured on an
undiscounted basis and are expensed as the related service is
provided.
A liability is recognised for the amount expected to be paid under
short-term cash bonus or incentive scheme plans if the Group has
a present legal or constructive obligation to pay this amount as a
result of past service provided by the employee and the obligation
can be estimated reliably.

85
NOTES TO THE FINANCIAL STATEMENTS (continued)for the year ended 31 March 2010
3 sUMMARY oF sIGNIFICANt ACCoUNtING PoLICIes (continued)
3.9 Income tax
Income tax expense comprises current and deferred tax. Income
tax is recognised in the profit and loss except to the extent that
it relates to items recognised directly in equity, in which case it is
recognised in equity.
Current tax is the expected tax payable on the taxable income for
the year, using tax rates enacted or substantively enacted at the
reporting date, and any adjustment to tax payable in respect of
the previous years.
Deferred tax is recognised using the balance sheet method
by providing for temporary differences between the carrying
amounts of assets and liabilities for financial reporting purposes
and the amounts used for taxation purposes. Deferred tax is not
recognised for the following temporary differences: the initial
recognition of assets and liabilities in a transaction that is not
a business combination and that affects neither accounting
nor taxable profit, and differences relating to investments in
subsidiaries and jointly controlled entities to the extent that is
probable that they will not reverse in the foreseeable future and
the timing of the reversal of the temporary difference is controlled
by the Group. In addition, deferred tax is not recognised for
taxable temporary differences arising on the initial recognition
of goodwill. Deferred tax is measured at the tax rate that is
expected to be applied to the temporary differences when they
reverse, based on laws that have been enacted or substantively
enacted by the reporting date.
Deferred tax assets and liabilities are offset if there is a legally
enforceable right to offset the liabilities and assets, and they
relate to income taxes levied by the same tax authority on the
same taxable entity, or on different tax entities, but they intend
to settle current tax liabilities and assets on a net basis or their
tax assets and liabilities will be realised simultaneously.
A deferred tax asset is recognised to the extent that it is probable
that future taxable profits will be available against which the
temporary differences can be utilised. Deferred tax assets are
reviewed at each reporting date and are reduced to the extent
that it is no longer probable that the related tax benefit will
realise.
Additional income taxes that arise from the distribution of
dividends are recognised at the same time as the liability to pay
the related dividend is recognised.
3.10 Property, plant and equipment
Recognition and measurement
Items of property, plant and equipment are measured at cost less
accumulated depreciation and accumulated impairment losses.
Cost includes expenditure that is directly attributable to the
acquisition of the asset. the cost of self-constructed assets
includes the cost of materials and direct labour, any other costs
directly attributable to bringing the asset to a working condition
for its intended use, and the costs of dismantling and removing
the items and restoring the site on which they are located.
Purchased software that is integral to the functionality of the
related equipment is capitalised as part of that equipment.
Borrowing costs related to the acquisition and construction of
qualifying assets are capitalised during the period of time required
to complete and prepare the property for its intended use, as part
of the cost of the asset.
When parts of an item of property, plant and equipment
(i.e. equipment, motor vehicles, roads, runways and aprons, and
buildings) have different useful lives, they are accounted for
as separate items (major components) of property, plant and
equipment.
Gains and losses on disposal are determined by comparing the
proceeds from disposal with the carrying amount of property,
plant and equipment and are recognised net within ‘other
operating income’ in profit and loss.
Reclassification to investment property
Property that is being constructed for future use as investment
property is accounted for as property, plant and equipment until
construction or development is complete, at which time it is
reclassified as investment property.
Subsequent costs
the cost of replacing part of an item of property, plant and
equipment is recognised in the carrying amount of the item if it
is probable that the future economic benefits embodied within
the part will flow to the Group and its cost can be measured
reliably. the costs of the day-to-day servicing of property, plant
and equipment are recognised in profit and loss as incurred.
Depreciation
Depreciation is recognised in profit and loss on a straight-line basis
to reduce the cost of the assets to their residual values over the
estimated useful lives of each part of an item of property, plant
and equipment. Leased assets are depreciated over the shorter
of the lease term and their useful lives unless it is reasonably
certain that the Group will obtain ownership by the end of the
lease term. Land is not depreciated.
the estimated useful lives for the current and comparative periods
are as follows:
• equipment 3 – 12 years
• Motor vehicles 5 years
• Roads, runways and aprons 20 – 50 years
• Buildings 20 – 30 years
Depreciation methods, useful lives and residual values are
re-assessed at each reporting date.
86
NOTES TO THE FINANCIAL STATEMENTS (continued)for the year ended 31 March 2010
3 sUMMARY oF sIGNIFICANt ACCoUNtING PoLICIes (continued)
3.11 Investment property
Investment property is property which is held either to earn rental
income or for capital appreciation or for both, but not for sale in
the ordinary course of business, use in the production or supply
of goods or services or for administrative purposes. Investment
property is carried at fair value, representing open market value
determined annually by accredited independent valuers. Fair
value is based on active market prices, adjusted, if necessary,
for any difference in the nature, or location or condition of the
specific asset. If the information is not available, the Group uses
alternative valuation methods such as recent prices on less active
markets or discounted cash flow projections. Changes in fair
values are recorded in comprehensive income as part of other
income.
3.12 Intangible assets
Intangible assets comprise: computer software, development
costs of the enterprise Resource Planning system and other
information management systems. these intangible assets are
measured initially at cost and are carried at cost less accumulated
amortisation and accumulated impairment losses.
Subsequent expenditure
subsequent expenditure on capitalised intangible assets is
capitalised only when it increases the future economic benefits
embodied in the specific asset to which it relates. All other
expenditure is expensed as incurred.
Amortisation
Intangible assets are amortised on a straight-line basis over their
estimated useful lives and assessed for impairment whenever
there is an indication that the intangible asset may be impaired.
Intangible assets are amortised from the date they are available
for use. the amortisation period and the amortisation method for
an intangible asset are reviewed at each financial year-end.
the current estimated useful life is three to five years.
3.13 Impairment
Non-financial assets
the carrying amounts of the Group’s non-financial assets, other
than investment property, inventories and deferred tax assets, are
reviewed at each reporting date to determine whether there is an
indication of impairment. If any such indication exists, then the
asset’s recoverable amount is estimated.
the recoverable amount of an asset or cash-generating unit
is the greater of its value in use and its fair value less costs to
sell. In assessing value in use, the estimated future cash flows
are discounted to their present value using a pre-tax discount
rate that reflects current market assessments of the time value
of money and the risks specific to the asset. For the purpose of
impairment testing, assets are grouped together into the smallest
groups of assets that generate cash inflows from continuing use
that are largely independent of the cash inflows of other assets
or groups of assets (the ‘cash-generating unit’). the goodwill
acquired in a business combination, for the purpose of impairment
testing, is allocated to cash-generating units that are expected to
benefit from the synergies of the combination.
An impairment loss is recognised if the carrying amount of an
asset or its cash-generating unit exceeds its recoverable amount.
Impairment losses are recognised in profit and loss. Impairment
losses recognised in respect of cash-generating units are allocated
first to reduce the carrying amount of any goodwill allocated to
the units and then to reduce the carrying amount of the other
assets in the unit (group of units) on a pro rata basis.
Financial assets
A financial asset is assessed at each reporting date to determine
whether there is any objective evidence that it is impaired. A
financial asset is considered to be impaired if objective evidence
indicates that one or more events had a negative effect on the
estimated future cash flows of that asset.
the criteria that the Group uses to determine that there is
objective evidence of an impairment loss include:
• A breach of contract, such as a default or delinquency in
payments
• It becomes probable that the debtor will enter bankruptcy or
other financial reorganisation
• observable data indicating that there is a measurable decrease
in the estimated future cash flows from a portfolio of financial
assets since the initial recognition of those assets.
An impairment loss in respect of a financial asset measured
at amortised cost is calculated as the difference between the
carrying amount and the present value of the estimated future
cash flows, discounted at the original effective interest rate.
Individually significant financial assets are tested for impairment
on an individual basis. the remaining financial assets are assessed
collectively in groups that share similar credit risk characteristics.
All impairment losses are recognised in profit and loss.
An impairment loss is reversed if the reversal can be related
objectively to an event occurring after the impairment loss
was recognised. the reversal is recognised in profit and loss for
financial assets measured at amortised cost.
3.14 Inventories
Inventories are measured at the lower of cost and net realisable
value. the cost of inventories is based on the first-in, first-out
principle, and includes expenditure incurred in acquiring the
inventories, production or conversion costs and other costs
incurred in bringing them to their location and condition.
Net realisable value is the estimated selling price in the ordinary
course of business, less the estimated costs of completion and
selling expenses.

87
NOTES TO THE FINANCIAL STATEMENTS (continued)for the year ended 31 March 2010
3 sUMMARY oF sIGNIFICANt ACCoUNtING PoLICIes (continued)
3.15 Financial instruments
Non-derivative financial instruments
Non-derivative financial instruments comprise investments
in equity and debt securities, trade and other receivables, cash
and cash equivalents, loans and borrowings, and trade and other
payables.
Non-derivative financial instruments are recognised initially at
fair value plus, for instruments not at fair value through profit
and loss, any directly attributable transaction costs. subsequent
to initial recognition, non-derivative financial instruments are
measured as described below.
Accounting for finance income and expense is discussed in
note 3.4.
Held-to-maturity investments
If the Group has a positive intent and ability to hold debt securities
to maturity, then they are classified as held-to-maturity. Held-to-
maturity investments are measured at amortised cost using the
effective interest rate method, less any impairment losses.
Financial assets at fair value through profit and loss
An instrument is classified at fair value through profit and loss
if it is held for trading or is designated as such upon initial
recognition. Financial instruments are designated at fair value
through profit and loss if the Group manages such investments
and makes purchases and sale decisions based on their fair value
in accordance with the Group’s documented risk management
or investment strategy. Upon initial recognition, attributable
transactions costs are recognised in profit and loss when incurred.
Financial instruments at fair value through profit and loss are
measured at fair value, and changes therein are recognised in
profit and loss.
Non-derivative financial instruments
Loans and receivables
Loans and receivables are non-derivative financial assets with
fixed or determinable payments that are not quoted in an active
market. they are included in current assets, except for maturities
greater than 12 months after the end of the reporting period.
these are classified as non-current assets. the Group’s loans and
receivables comprise ‘trade and other receivables’ and cash and
cash equivalents in the balance sheet.
Other
Cash and cash equivalents are measured at amortised cost.
other non-derivative financial instruments are measured at
amortised cost using the effective interest method, less any
impairment losses.
the effective Interest Rate method is a method of calculating
the amortised cost of a financial asset or a financial liability and
of allocating the interest income or interest expense over the
relevant period.
Derivative financial instruments
the Group holds derivative financial instruments to hedge its
foreign currency and interest rate risk exposures. embedded
derivatives are separated from the host contract and accounted
for separately if the economic characteristics and risks of the host
contract and the embedded derivative are not closely related, a
separate instrument with the same terms as the embedded
derivative would meet the definition of a derivative, and the
combined instrument is not measured at fair value through
profit and loss. Changes in the fair value of separable embedded
derivatives are recognised immediately in profit and loss.
Derivatives are recognised initially at fair value; attributable
transaction costs are recognised in profit and loss when incurred.
subsequent to initial recognition, derivatives are measured at fair
value, and changes in fair value are recognised in profit and loss.
Economic hedges
Hedge accounting is not applied to derivative instruments that
economically hedge monetary assets and liabilities denominated
in foreign currencies. Changes in the fair value of such derivatives
are recognised in profit and loss as part of fair value gains
and losses.
3.16 share capital
ordinary shares are classified as equity. Incremental costs directly
attributable to the issue of ordinary shares and share options are
recognised as a deduction from equity, net of any tax effects.
3.17 Provisions
A provision is recognised if, as a result of a past event, the
Group has a present legal or constructive obligation that can be
estimated reliably, and it is probable that an outflow of economic
benefits will be required to settle the obligation. Provisions are
determined by discounting the expected future cash flows at a
pre-tax rate that reflects current market assessments of the time
value of money and the risks specific to the liability.
3.18 Related parties
ACsA’s related parties include entities directly or indirectly owned
by the south African Government.
Key management is defined as being individuals with the
authority and responsibility for planning, directing and controlling
the activities of the entity. the Group regards all individuals from
the level of Group executive up to the Board of Directors as key
management per the definition of the standard.
Close family members of key management personnel are
considered to be those family members who may be expected
to influence, or be influenced by key management individuals in
their dealings with the entity.
other related party transactions are also disclosed in terms of
the requirements of the standard. the objective of the standard
and the financial statements is to provide relevant and reliable
information and therefore materiality is considered in the
disclosure of these transactions.

88
NOTES TO THE FINANCIAL STATEMENTS (continued)for the year ended 31 March 2010
3 sUMMARY oF sIGNIFICANt ACCoUNtING PoLICIes (continued)
3.19 operating segments
operating segments are reported in a manner consistent with
the internal reporting provided to the chief operating decision-
maker. the chief operating decision-maker has been identified as
the executive Committee that makes strategic decisions.
3.20 earnings per share
the Group presents basic and diluted earnings per share (ePs)
data for its ordinary shares. Basic ePs is calculated by dividing
the profit and loss attributable to ordinary shareholders of the
Company by the weighted average number of ordinary shares
outstanding during the period. Diluted ePs is determined by
adjusting the profit and loss attributable to ordinary shareholders
and the weighted average number of ordinary shares outstanding
for the effects of all dilutive potential ordinary shares, which
comprises convertible bonds and share options granted to
employees.
3.21 Non-current assets held for sale
Non-current assets (or disposal groups) are classified as assets
held for sale when their carrying amount is to be recovered
principally through a sale transaction and a sale is considered
highly probable. they are stated at the lower of carrying amount
and fair value, less costs to sell if their carrying amount is to
be recovered principally through a sale transaction rather than
through continuing use.
3.22 Government grants
Government grants are recognised initially as deferred income
at fair value when there is reasonable assurance that they will
be received and the Group will comply with the conditions
associated with the grant. Grants that compensate the Group for
expenses incurred are recognised in profit or loss as other income
on a systematic basis in the same periods in which the expenses
are recognised. Grants that compensate the Group for the cost of
an asset are recognised in profit or loss on a systematic basis over
the useful life of the asset.
3.23 standards early adopted by the Group
IFRs 5 (amendment), ‘Disclosures required in respect of non-
current assets (or disposal groups) classified as held for sale or
discontinued operations’ (effective on or after 1 January 2010).
this amendment clarifies that IFRs 5, ‘Non-current assets held
for sale and discontinued operations’, specifies the disclosures
required in respect of non-current assets (or disposal groups)
classified as held for sale or discontinued operations. It also
clarifies that the general requirements of IAs 1 still apply,
particularly paragraph 15 (to achieve a fair value presentation)
and paragraph 125 (sources of estimation uncertainty) of IAs 1.
3.24 New standards and interpretations not yet adopted
the following standards and amendments to existing standards
have been published and are mandatory for the Group’s
accounting periods beginning on or after the dates as indicated,
but the Group has not early adopted them:
3.24.1 IFRIC 17, ‘Distribution of non-cash assets to owners’ (effective on
or after 1 July 2009).
this interpretation provides guidance on accounting for
arrangements whereby an entity distributes non-cash assets to
shareholders either as a distribution of reserves or as dividends.
IFRs 5 has also been amended to require that assets are
classified as held for distribution only when they are available
for distribution in their present condition and the distribution
is highly probable. the Group and Company will apply IFRIC 17
from 1 April 2010. It is not expected to have a material impact on
the Group or Company’s financial statements.
3.24.2 IFRIC 18, ‘transfer of assets from customers’ (effective for transfers
from 1 July 2009).
this interpretation provides guidance on how to account for
items of property, plant and equipment received from customers,
or cash that is received and used to acquire or construct specific
assets. this interpretation is only applicable to such assets that
are used to connect the customer to a network or provide
ongoing access to a supply of goods or services or both. the
Group and Company will apply IFRIC 18 from 1 April 2010.
It is not expected to have a material impact on the Group or
Company’s financial statements.
3.24.3 IFRs 2 ‘share-based payments’ (amendment), ‘scope of IFRs 2
and IFRs 3 (revised)’ (effective on or after 1 July 2009).
this amendment confirms that in addition to business combinations
as defined by IFRs 3 (revised), ‘Business combinations’, contributions
of a business on formation of a joint venture and common control
transactions are excluded from the scope of IFRs 2, ‘share-based
payments’. the Group and Company will apply the amendment
from 1 April 2010. It is not expected to have a material impact
on the Group or Company’s financial statements.
3.24.4 IAs 1 ‘Presentation of financial statements’ (amendment),
‘Current/non-current classification of convertible instruments’
(effective on or after 1 January 2010).
this amendment clarifies that the potential settlement of a
liability by the issue of equity is not relevant to its classification
as current or non-current. By amending the definition of current
liability, the amendment permits a liability to be classified as non-
current (provided that the entity has an unconditional right to
defer settlement by transfer of cash or other assets for at least 12
months after the accounting period), notwithstanding the fact that
the entity could be required by the counter party to settle in shares
at any time. the Group and Company will apply the amendment
from 1 April 2010. It is not expected to have a material impact on
the Group or Company’s financial statements.

89
NOTES TO THE FINANCIAL STATEMENTS (continued)for the year ended 31 March 2010
3 sUMMARY oF sIGNIFICANt ACCoUNtING PoLICIes (continued)
3.24 New standards and interpretations not yet adopted (continued)
3.24.5 IAs 7 ‘statement of cash flows’ (amendment), ‘Classification
of expenditures on unrecognised assets’ (effective on or after
1 January 2010).
the amendment requires that only expenditures that result in
a recognised asset in the statement of financial position can be
classified as investing activities. the Group and Company will apply
the amendment from 1 April 2010. It is not expected to have a
material impact on the Group or Company’s financial statements.
3.24.6 IAs 17 ‘Leases’ (amendment), ‘Classification of leases of land
and buildings’ (effective on or after 1 January 2010).
the amendment deletes specific guidance regarding
classification of leases of land, so as to eliminate inconsistency
with the general guidance on lease classification. As a result,
leases of land should be classified as either finance or operating,
using the general principles of IAs 17. the Group and Company
will apply the amendment from 1 April 2010. It is not expected
to have a material impact on the Group or Company’s financial
statements.
3.24.7 IAs 36 ‘Impairment of assets’ (amendment), ‘Unit of accounting
for goodwill impairment test’ (effective on or after 1 January 2010).
the amendment clarifies that the largest cash generating unit
(or group of units) to which goodwill should be allocated for
the purposes of impairment testing is an operating segment
as defined by paragraph 5 of IFRs 8, ‘operating segments’
(that is, before the aggregation of segments with similar
economic characteristics permitted by paragraph 12 of IFRs
8). the Group and Company will apply the amendment from
1 April 2010. It is not expected to have a material impact on
the Group or Company’s financial statements.
3.24.8 IAs 38 ‘Intangible assets’ (amendment), ‘Measuring the fair
value of an intangible asset acquired in a business combination’
(effective on or after 1 July 2009).
this amends paragraphs 40 and 41 of IAs 38 to clarify the
description of valuation techniques commonly used by entities
when measuring the fair value of intangible assets acquired in a
business combination that are not traded in active markets. the
Group and Company will apply the amendment from 1 April
2010. It is not expected to have a material impact on the Group
or Company’s financial statements.
3.24.9 IAs 39 ‘Financial instruments: recognition and measurement’
(amendment), ‘treating loan pre-payment penalties as closely
related derivatives’ (effective on or after 1 January 2010).
the amendment clarifies that prepayment options, the exercise
price of which compensates the lender for loss of interest by
reducing the economic loss from reinvestment risk, should be
considered closely related to the host debt contract. the Group
and Company will apply the amendment from 1 April 2010. It
is not expected to have an impact on the Group or Company’s
financial statements.
3.24.10 IAs 39 ‘Financial instruments: recognition and measurement’
(amendment), ‘scope exemption for business combination
contracts’ (effective on or after 1 January 2010).
this is an amendment to the scope exemption in paragraph 2(g)
of IAs 39 to clarify that: (a) it only applies to binding (forward)
contracts between an acquirer and a vendor in a business
combination to buy an acquiree at a future date; (b) the term
of the forward contract should not exceed a reasonable period
normally necessary to obtain any required approvals and to
complete the transaction; and (c) the exemption should not be
applied to option contracts (whether or not currently exercisable)
that on exercise will result in control of an entity, nor by analogy
to investments in associates and similar transactions. the Group
and Company will apply the amendment from 1 April 2010. It
is not expected to have an impact on the Group or Company’s
financial statements.
3.24.11 IAs 39 ‘Financial instruments: recognition and measurement’
(amendment), ‘Cash flow hedge accounting’ (effective 1 January
2010).
the amendment clarifies when to recognise gains or losses on
hedging instruments as a reclassification adjustment in a cash
flow hedge of a forecast transaction that results subsequently
in the recognition of a financial instrument. the amendment
clarifies that gains or losses should be reclassified from equity
to profit or loss in the period in which the hedged forecast cash
flow affects profit or loss. the Group and Company will apply
the amendment from 1 April 2010. It is not expected to have an
impact on the Group or Company’s financial statements.
3.24.12 IAs 39 (amendment), ‘Hedging using internal contracts’ (effective
on or after 1 January 2010).
the amendment clarifies that entities should no longer use
hedge accounting for transactions between segments in their
separate financial statements. the Group and Company will apply
the amendment from 1 April 2010. It is not expected to have an
impact on the Group or Company’s financial statements.
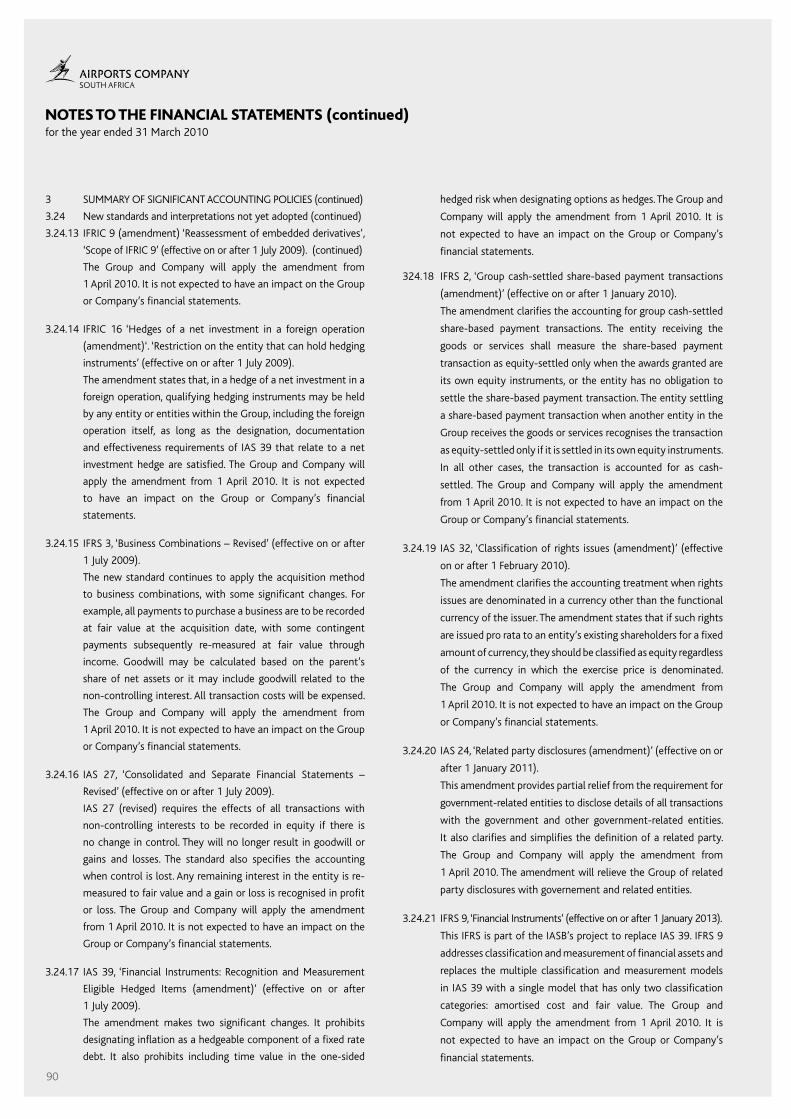
3.24.13 IFRIC 9 (amendment) ‘Reassessment of embedded derivatives’,
‘scope of IFRIC 9’ (effective on or after 1 July 2009).
this is an amendment to the scope paragraph of IFRIC 9 to
clarify that it does not apply to possible reassessment, at the
date of acquisition, to the embedded derivatives in contracts
acquired in a combination between entities or businesses
under common control or the formation of a joint venture.
90
NOTES TO THE FINANCIAL STATEMENTS (continued)for the year ended 31 March 2010
3 sUMMARY oF sIGNIFICANt ACCoUNtING PoLICIes (continued)
3.24 New standards and interpretations not yet adopted (continued)
3.24.13 IFRIC 9 (amendment) ‘Reassessment of embedded derivatives’,
‘scope of IFRIC 9’ (effective on or after 1 July 2009). (continued)
the Group and Company will apply the amendment from
1 April 2010. It is not expected to have an impact on the Group
or Company’s financial statements.
3.24.14 IFRIC 16 ‘Hedges of a net investment in a foreign operation
(amendment)‘. ‘Restriction on the entity that can hold hedging
instruments’ (effective on or after 1 July 2009).
the amendment states that, in a hedge of a net investment in a
foreign operation, qualifying hedging instruments may be held
by any entity or entities within the Group, including the foreign
operation itself, as long as the designation, documentation
and effectiveness requirements of IAs 39 that relate to a net
investment hedge are satisfied. the Group and Company will
apply the amendment from 1 April 2010. It is not expected
to have an impact on the Group or Company’s financial
statements.
3.24.15 IFRs 3, ‘Business Combinations – Revised’ (effective on or after
1 July 2009).
the new standard continues to apply the acquisition method
to business combinations, with some significant changes. For
example, all payments to purchase a business are to be recorded
at fair value at the acquisition date, with some contingent
payments subsequently re-measured at fair value through
income. Goodwill may be calculated based on the parent’s
share of net assets or it may include goodwill related to the
non-controlling interest. All transaction costs will be expensed.
the Group and Company will apply the amendment from
1 April 2010. It is not expected to have an impact on the Group
or Company’s financial statements.
3.24.16 IAs 27, ‘Consolidated and separate Financial statements –
Revised’ (effective on or after 1 July 2009).
IAs 27 (revised) requires the effects of all transactions with
non-controlling interests to be recorded in equity if there is
no change in control. they will no longer result in goodwill or
gains and losses. the standard also specifies the accounting
when control is lost. Any remaining interest in the entity is re-
measured to fair value and a gain or loss is recognised in profit
or loss. the Group and Company will apply the amendment
from 1 April 2010. It is not expected to have an impact on the
Group or Company’s financial statements.
3.24.17 IAs 39, ‘Financial Instruments: Recognition and Measurement
eligible Hedged Items (amendment)’ (effective on or after
1 July 2009).
the amendment makes two significant changes. It prohibits
designating inflation as a hedgeable component of a fixed rate
debt. It also prohibits including time value in the one-sided
hedged risk when designating options as hedges. the Group and
Company will apply the amendment from 1 April 2010. It is
not expected to have an impact on the Group or Company’s
financial statements.
324.18 IFRs 2, ‘Group cash-settled share-based payment transactions
(amendment)’ (effective on or after 1 January 2010).
the amendment clarifies the accounting for group cash-settled
share-based payment transactions. the entity receiving the
goods or services shall measure the share-based payment
transaction as equity-settled only when the awards granted are
its own equity instruments, or the entity has no obligation to
settle the share-based payment transaction. the entity settling
a share-based payment transaction when another entity in the
Group receives the goods or services recognises the transaction
as equity-settled only if it is settled in its own equity instruments.
In all other cases, the transaction is accounted for as cash-
settled. the Group and Company will apply the amendment
from 1 April 2010. It is not expected to have an impact on the
Group or Company’s financial statements.
3.24.19 IAs 32, ‘Classification of rights issues (amendment)’ (effective
on or after 1 February 2010).
the amendment clarifies the accounting treatment when rights
issues are denominated in a currency other than the functional
currency of the issuer. the amendment states that if such rights
are issued pro rata to an entity’s existing shareholders for a fixed
amount of currency, they should be classified as equity regardless
of the currency in which the exercise price is denominated.
the Group and Company will apply the amendment from
1 April 2010. It is not expected to have an impact on the Group
or Company’s financial statements.
3.24.20 IAs 24, ‘Related party disclosures (amendment)’ (effective on or
after 1 January 2011).
this amendment provides partial relief from the requirement for
government-related entities to disclose details of all transactions
with the government and other government-related entities.
It also clarifies and simplifies the definition of a related party.
the Group and Company will apply the amendment from
1 April 2010. the amendment will relieve the Group of related
party disclosures with governement and related entities.
3.24.21 IFRs 9, ‘Financial Instruments’ (effective on or after 1 January 2013).
this IFRs is part of the IAsB’s project to replace IAs 39. IFRs 9
addresses classification and measurement of financial assets and
replaces the multiple classification and measurement models
in IAs 39 with a single model that has only two classification
categories: amortised cost and fair value. the Group and
Company will apply the amendment from 1 April 2010. It is
not expected to have an impact on the Group or Company’s
financial statements.

91
NOTES TO THE FINANCIAL STATEMENTS (continued)for the year ended 31 March 2010
3 sUMMARY oF sIGNIFICANt ACCoUNtING PoLICIes (continued)
3.24 New standards and interpretations not yet adopted (continued)
3.24.22 IFRs 1, ‘Limited exemption from comparative IFRs 7 disclosures
for first-time adopters’ (effective on or after 1 July 2010).
the amendment to IFRs 1 provides first-time adopters with
the same transition provisions as included in the amendment
to IFRs 7. the amendment is effective from for annual periods
beginning on or after 1 July 2010 with early adoption permitted.
the Group and Company will apply the amendment from
1 April 2010. It is not expected to have an impact on the Group
or Company’s financial statements.
3.24.23 IFRIC 19 ‘extinguishing Financial Liabilities with equity Instruments’
(effective on or after 1 July 2010).
this IFRIC clarifies the accounting when an entity renegotiates the
terms of its debt with the result that the liability is extinguished
through the debtor issuing its own equity instruments to
the creditor. A gain or loss is recognised in the statement of
comprehensive income account based on the fair value of the
equity instruments compared to the carrying amount of the
debt. the Group and Company will apply the amendment from
1 April 2010. It is not expected to have an impact on the Group
or Company’s financial statements.
3.24.24 IFRIC 14, ‘Pre-payments of a Minimum Funding Requirement
(amendment)’ (effective on or after 1 January 2011).
this amendment will have a limited impact as it applies only
to companies that are required to make minimum funding
contributions to a defined benefit pension plan. It removes
an unintended consequence of IFRIC 14 related to voluntary
pension prepayments when there is a minimum funding
requirement. the Group and Company will apply the amendment
from 1 April 2010. It is not expected to have an impact on the
Group or Company’s financial statements.
3.24.25 IFRs 5, ‘Non-current Assets Held for sale and Discontinued
operations (amendment)’ (effective on or after 1 January 2010).
the amendment clarifies that all of a subsidiary’s assets and
liabilities are classified as held for sale if a partial disposal sale
plan results in loss of control, and relevant disclosure should
be made for this subsidiary if the definition of a discontinued
operation is met. A consequential amendment to IFRs 1 states
that these amendments are applied prospectively from the date
of transition to IFRss. In addition, a paragraph has been added
to IFRs 5 clarifying that disclosures in other standards do not
apply to assets (or disposal groups) classified as held for sale or
discontinued operations unless other standards require specific
disclosures or require disclosures about the measurement
of assets and liabilities within a disposal group that are not
within the scope of the measurement requirements of IFRs 5.
the Group and Company will apply the amendment from
1 April 2010. It is not expected to have an impact on the Group
or Company’s financial statements.
3.24.26 IFRs 8, ‘operating segments - Disclosure of segment assets
information’ (effective on or after 1 January 2010).
Paragraph 23 of IFRs 8 has been amended to make it clear
that an entity should report a measure of total assets and
total liabilities for each reportable segment, if the amounts
are regularly provided to the chief operating decision-maker.
the Group and Company will apply the amendment from
1 April 2010. It is not expected to have an impact on the Group
or Company’s financial statements.
3.24.27 IAs 18 ‘Revenue - Determining whether an entity is acting as
principal or as agent’ (effective on or after 1 January 2010).
Guidance has been provided to assess whether, in an agency
relationship, an entity is acting as an agent or principal.
the Group and Company will apply the amendment from
1 April 2010. It is not expected to have an impact on the Group
or Company’s financial statements.
3.24.28 IAs 38 ‘Intangible Assets’ (effective on or after 1 July 2009).
IAs 38 has been amended to clarify that when an intangible
asset acquired in a business combination is linked to a contract
or identifiable asset, the intangible asset may be recognised
separately from goodwill, but together with the related item. In
addition, the acquirer may recognise a group of complimentary
intangible assets as a single asset, provided the individual assets
in the Group have similar useful lives. the Group and Company
will apply the amendment from 1 April 2010. It is not expected
to have an impact on the Group or Company’s financial
statements.

92
NOTES TO THE FINANCIAL STATEMENTS (continued)for the year ended 31 March 2010
4 FINANCIAL RIsK MANAGeMeNt
the Group recognises that an effective risk management function
is fundamental to its business. taking international best practice
into account, our comprehensive risk management process involves
identifying, understanding and managing the risks associated
with each of ACsA’s business units. Risk awareness, control and
compliance are embedded in the Group’s day-to-day activities.
the Group Risk Management Unit independently monitors, manages
and reports risk as mandated by the Board of Directors through the
Board Risk Committee, and the treasury and economic Regulation
Committee. the executive Committee (eXCo) and business units
are ultimately responsible for managing risks that arise.
A sound financial risk management framework is in place at Airports
Company south Africa (ACsA), based on a best-practice enterprise
Risk Management Framework, built on rigorous governance
structures. this framework is supported by an experienced team
that manages the exposures across the Group structures and these
are regularly monitored and reported to the respective committees
and ultimately to the Board.
Credit risk
Credit risk is the risk of loss to the Group as a result of the failure
by a customer or counterparty to meet its contractual obligations.
the credit risk that ACsA faces arises mainly from commercial and
aeronautical businesses. these risks are mitigated by the guarantees
held for the exposure over a given period. Credit risks can also arise
from cash and cash equivalents, accounts receivable and derivative
financial instruments. these risks are effectively managed in terms
of the Board approved financial risk management framework
that specifies the investment and counterparty policies. As at
31 March 2010 ACsA had no significant concentration of credit
risk from treasury trading activities.
Trade and other receivables
the Group’s exposure to credit risk is influenced mainly by the
individual characteristics of each customer. the demographics
of the Group’s customer base, including the default rate of the
industry and country in which customers operate, has less of an
influence on credit risk. Approximately 38% (2009: 38%) of the
Group’s aeronautical revenue is attributable to transactions with
a single customer. the main concentration of credit risk is in the
Johannesburg region, which approximate 59% (2009: 70%) of the
trade receivables of the Group.
the treasury and economic Regulation Committee has established
a credit policy under which each new customer is analysed
individually for creditworthiness before the Group’s standard
payment terms and conditions are offered. the Group’s review
includes external ratings, where available, and in some cases
bank references. Credit limits are established for each customer,
which represents the maximum open amount, and these limits
are reviewed on an ongoing basis. Customers that fail to meet the
Group’s benchmark creditworthiness may transact with the Group
only on a prepayment/cash basis.
More than 60% of the Group’s customers have been transacting
with the Group for over 13 years, and losses have occurred
infrequently. In monitoring customer credit risk, customers
are grouped according to their credit characteristics, including
whether they are an individual or a legal entity, whether they
are aeronautical, commercial or retail customers, geographic
location, industry, aging profile, maturity and existence of previous
financial difficulties. trade and other receivables relate mainly to
the Group’s aeronautical and commercial customers. Customers
that are graded as ‘high risk’ are placed on a restricted customer
list, and future transactions are made on prepayment basis with
approval of the treasury and economic Regulation Committee.
Investments
In complying with the treasury Regulations, ACsA’s financial
risk management framework limits the Group to investments in
A short-term rated instruments or AAA rated instruments and
counterparts.
Guarantees
the Group has no formal policy for providing financial guarantees.
Market risk
Market risk is the risk that ACsA’s earnings or capital, or its
ability to meet business objectives, will be adversely affected
by changes in the level or volatility of market rates or prices
such as interest rates, foreign exchange rates and commodity
prices. the main market risk arises from treasury activities and
both aeronautical and non-aeronautical business. the Group
has developed analytical tools that are used to perform various
analyses in order to assess the impact of market risk on business
and to identify mitigants to manage the risk within approved
tolerance levels.
Interest rate risk
ACsA’s interest rate risk arises from its borrowings. Borrowings
issued at variable rates exposes the Company to cash flow risks,
and borrowings issued at fixed rate exposes the Company to fair
value interest rate risk. ACsA’s policy is to maintain a mix of fixed
to floating rate debt within the Board approved parameters.
As at 31 March 2010, ACsA’s fixed to floating rate profile after
hedging, on net debt, was 61% (2009: 51%) fixed.
Tariff risk
Approximately half of the Group revenue is regulated by an
independent economic regulator using a price-cap methodology.
the regulated tariff is linked to the CPI index. A change in CPI
has a positive or a negative impact on the revenue earned by the
Group. However, the Group is allowed to adjust the difference
between actual and forecast CPI in future tariffs. the tariff is
determined every five years with an option to reopen after three
years. the board has approved a regulatory strategy which seeks
to proactively influence the regulatory approach in line with
best practice. In this regard, the Group proactively manages the
economic regulatory risk while balancing the interests of both the
Group and the customers.

93
NOTES TO THE FINANCIAL STATEMENTS (continued)for the year ended 31 March 2010
4 FINANCIAL RIsK MANAGeMeNt (continued)
Foreign exchange risk
ACsA has one overseas investment which give rise to limited
exposure to foreign currency risk arising primarily with respect
to Indian Rupee. All foreign debt instruments are issued in Rands
or where applicable hedged through cross-currency swaps. the
Group also uses foreign exchange contracts to hedge material
expenditure once the project or purchase cash flows are certain.
Liquidity and funding risk
Liquidity risk is the risk of not being able to generate sufficient cash
to honour financial commitments. In ACsA it refers particularly
to the risk of ACsA not being able to advance funds for capital
expenditure, redeem and service loans, finance operational costs
and service unanticipated financial commitments.
the objective of the financial risk management framework is
to ensure continuity of funding and flexibility, ensuring debt
maturities are spread over a range of dates to manage refinancing
risks. the Group has successfully raised all funding required for
the 2010 financial year. Further, the Group mitigates this risk by
maintaining banking facilities with major south African banks
that cover 12 months funding requirements. the Group achieved
further improvement in its funding structure by reducing the
proportion of short-term to 9% (2009: 20%) of the total liability
as at 31 March 2010. the Group is not exposed to excessive
refinancing risk in any one year.
As at 31 March 2010, the Group had committed and un-committed facilities of R7,5 billion (2009: R9 billion).
Committed Un-committed
Facility amount Facility amount Total
expiry date R’000 expiry date R’000 R’000
31 March 2010 2 000 000 31 March 2010 500 000 2 500 000
30 November 2010 3 500 000 31 March 2010 500 000 4 000 000
12 May 2010 1 000 000 – 1 000 000
6 500 000 1 000 000 7 500 000
Utilised facilities (2 500 000) – (2 500 000)
total unutilised 4 000 000 1 000 000 5 000 000
Un-committed facilities represent undrawn lines of credit where the bank has an agreement with the Company to make available an amount
(up to the maximum specified) in loans on demand from the Group. the Group is under no obligation to actually take out a loan at any particular
time. Committed facilities are those lines of credit where the Group and the bank have clearly defined terms and conditions which bind the bank to
lend the Group up to the amounts stated in the agreement.

94
NOTES TO THE FINANCIAL STATEMENTS (continued)for the year ended 31 March 2010
4 FINANCIAL RIsK MANAGeMeNt (continued)
In addition, the table below analyses the Group’s financial liabilities in terms of their maturities. the amounts disclosed are the contractual,
undiscounted cash flows.
GROUP Carrying Contractual 6 months Between Between Between More than
amount cash flows or less 6-12 months 1-2 years 2-5 years 5 years
R’000 R’000 R’000 R’000 R’000 R’000 R’000
2010
secured borrowings 675 682 804 021 34 057 103 244 666 721 – –
Unsecured borrowings 15 334 346 29 256 383 1 736 715 691 908 1 962 046 6 797 157 18 068 557
trade and other payables 1 694 878 1 694 878 1 694 878 – – – –
Derivative financial instruments 103 326 123 279 24 427 24 440 32 812 23 874 17 726
17 808 232 31 878 562 3 490 076 819 592 2 661 580 6 821 031 18 086 283
2009
secured borrowings 699 486 156 242 5 959 30 451 11 246 57 919 56 076
Unsecured borrowings 11 248 840 22 302 477 3 261 081 490 186 980 373 4 651 695 12 919 142
Finance lease liabilities – 5 667 258 5 409 – – –
trade and other payables 2 044 180 2 044 180 2 044 180 – – – –
13 992 506 24 508 566 5 311 47 526 046 991 619 4 709 614 12 975 218
COMPANY Carrying Contractual 6 months Between Between Between More than
amount cash flows or less 6-12 months 1-2 years 2-5 years 5 years
R’000 R’000 R’000 R’000 R’000 R’000 R’000
2010
Unsecured borrowings 15 332 846 29 254 883 1 736 715 690 408 1 962 046 6 797 157 18 068 557
trade and other payables 1 682 238 1 682 238 1 682 238 – – – –
Derivative financial instruments 103 326 123 279 24 427 24 440 32 812 23 874 17 726
17 118 410 31 060 400 3 443 380 714 848 1 994 858 6 821 031 18 086 283
2009
secured borrowings 23 954 20 641 919 19 722 – – –
Unsecured borrowings 11 247 339 21 512 814 3 229 220 459 826 919 652 3 984 974 12 919 142
Finance lease liabilities – 5 667 258 5 409 – – –
trade and other payables 1 996 394 1 996 395 1 996 395 – – – –
13 267 687 23 535 517 5 226 792 484 957 919 652 3 984 974 12 919 142
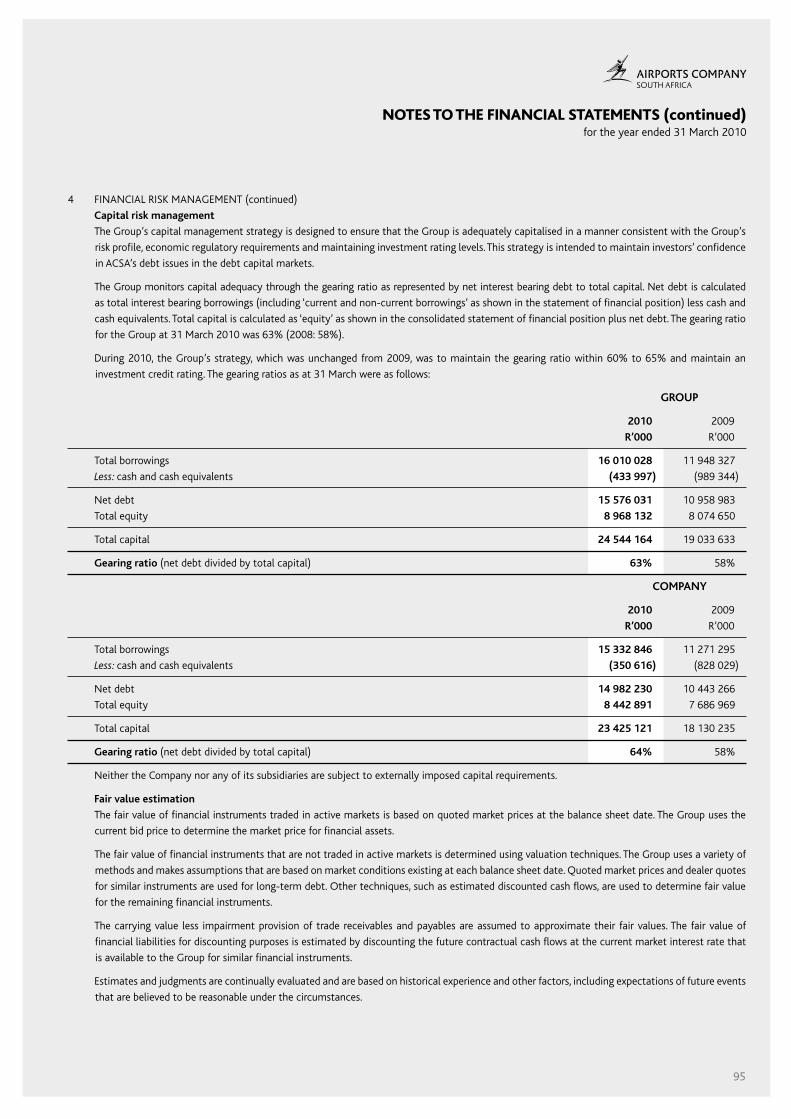
95
NOTES TO THE FINANCIAL STATEMENTS (continued)for the year ended 31 March 2010
4 FINANCIAL RIsK MANAGeMeNt (continued)
Capital risk management
the Group’s capital management strategy is designed to ensure that the Group is adequately capitalised in a manner consistent with the Group’s
risk profile, economic regulatory requirements and maintaining investment rating levels. this strategy is intended to maintain investors’ confidence
in ACsA’s debt issues in the debt capital markets.
the Group monitors capital adequacy through the gearing ratio as represented by net interest bearing debt to total capital. Net debt is calculated
as total interest bearing borrowings (including ‘current and non-current borrowings’ as shown in the statement of financial position) less cash and
cash equivalents. total capital is calculated as ‘equity’ as shown in the consolidated statement of financial position plus net debt. the gearing ratio
for the Group at 31 March 2010 was 63% (2008: 58%).
During 2010, the Group’s strategy, which was unchanged from 2009, was to maintain the gearing ratio within 60% to 65% and maintain an
investment credit rating. the gearing ratios as at 31 March were as follows:
GROUP
2010 2009
R’000 R’000
total borrowings 16 010 028 11 948 327
Less: cash and cash equivalents (433 997) (989 344)
Net debt 15 576 031 10 958 983
total equity 8 968 132 8 074 650
total capital 24 544 164 19 033 633
Gearing ratio (net debt divided by total capital) 63% 58%
COMPANY
2010 2009
R’000 R’000
total borrowings 15 332 846 11 271 295
Less: cash and cash equivalents (350 616) (828 029)
Net debt 14 982 230 10 443 266
total equity 8 442 891 7 686 969
total capital 23 425 121 18 130 235
Gearing ratio (net debt divided by total capital) 64% 58%
Neither the Company nor any of its subsidiaries are subject to externally imposed capital requirements.
Fair value estimation
the fair value of financial instruments traded in active markets is based on quoted market prices at the balance sheet date. the Group uses the
current bid price to determine the market price for financial assets.
the fair value of financial instruments that are not traded in active markets is determined using valuation techniques. the Group uses a variety of
methods and makes assumptions that are based on market conditions existing at each balance sheet date. Quoted market prices and dealer quotes
for similar instruments are used for long-term debt. other techniques, such as estimated discounted cash flows, are used to determine fair value
for the remaining financial instruments.
the carrying value less impairment provision of trade receivables and payables are assumed to approximate their fair values. the fair value of
financial liabilities for discounting purposes is estimated by discounting the future contractual cash flows at the current market interest rate that
is available to the Group for similar financial instruments.
estimates and judgments are continually evaluated and are based on historical experience and other factors, including expectations of future events
that are believed to be reasonable under the circumstances.

96
NOTES TO THE FINANCIAL STATEMENTS (continued)for the year ended 31 March 2010
5 sIGNIFICANt ACCoUNtING estIMAtes AND JUDGMeNts
the Group makes estimates and assumptions concerning the future. the resulting accounting estimates will, by definition, seldom equal the
related actual results. the estimates and assumptions that have a significant risk causing a material adjustment to the carrying amounts of assets
and liabilities within the next financial year are addressed below:
Fair value of financial instruments
the fair value of financial instruments that are not traded in an active market are determined by using valuation techniques. the Group uses its
judgement to select a variety of methods and make assumptions that are mainly based on market conditions existing at each balance sheet date.
the Group has used discounted cash flow analysis for financial assets that are not traded in active markets.
Post retirement medical aid obligation
the present value of the post retirement medical aid obligation depends on a number of factors that are determined on an actuarial basis using
a number of assumptions. the assumptions used in determining the net cost (income) for post retirement medical aid include the discount rate.
Any changes in these assumptions will impact the carrying amount of post retirement medical aid obligations.
the Group determines the appropriate discount rate at the end of each year. this is the interest rate that should be used to determine the
present value of estimated future cash outflows expected to be required to settle the post retirement medical aid obligations. In determining the
appropriate discount rate, the Group considers the interest rates of high-quality government bonds that are denominated in the currency in which
the benefits will be paid, and that have terms to maturity approximating the terms of the related post retirement medical aid obligation.
other key assumptions for post retirement medical aid obligations are based in part on current market conditions. Additional information is disclosed
in note 20.
Were the discount rate used to differ by 1% from management’s estimates, the carrying amount of post retirement medical aid obligations would
be an estimated R19,433 million lower or R25,473 million higher.
Fair value of investment property
the fair value of investment properties is determined on transactions observable in the market. Where there is lack of comparable transactions, a
valuation model is used.
Useful lives and residual values of assets
the Group reassess the useful lives and residual values of property, plant and equipment annually by reference to the age or known condition of
the assets and the Group’s expected use of the related assets.
Accounting for investment in associate
the Group’s 10% shareholding in the Mumbai International Airport (Private) Limited has been accounted for using the equity method as
the Group believes that it has the ability (and power) to participate in the financial and operating policy decisions, which gives the Group
significant influence.

97
NOTES TO THE FINANCIAL STATEMENTS (continued)for the year ended 31 March 2010
GROUP COMPANY
Cost Accumulated Carrying Cost Accumulated Carrying
depreciation amount depreciation amount
R’000 R’000 R’000 R’000 R’000 R’000
6 PRoPeRtY, PLANt AND eQUIPMeNt
2010
Owned assets
Land and buildings
Land 785 984 – 785 984 785 979 – 785 979
Buildings 8 005 116 (1 108 284) 6 896 832 7 998 823 (1 107 999) 6 890 824
Roads, runways and aprons 4 778 421 (980 424) 3 797 997 4 778 421 (980 424) 3 797 997
Vehicles and equipment
equipment 2 793 011 (1 144 662) 1 648 349 2 751 244 (1 139 577) 1 611 667
Vehicles 218 729 (89 272) 129 457 217 220 (88 072) 129 148
Capital work in progress 10 009 810 – 10 009 810 10 009 810 10 009 810
26 591 071 (3 322 642) 23 268 429 26 541 497 (3 316 072) 23 225 425
Leased assets
Vehicles and equipment
equipment 85 970 (85 970) – 85 970 (85 970) –
Vehicles 4 675 (4 675) – 4 675 (4 675) –
90 645 (90 645) – 90 645 (90 645) –
total property, plant and equipment 26 681 716 (3 413 287) 23 268 429 26 632 142 (3 406 717) 23 225 425
2009
Owned assets
Land and buildings
Land 900 435 – 900 435 892 759 – 892 759
Buildings 5 781 603 (802 217) 4 979 386 5 732 570 (796 764) 4 935 806
Roads, runways and aprons 4 242 243 (739 124) 3 503 119 4 242 243 (739 124) 3 503 119
Vehicles and equipment
equipment 1 689 017 (733 546) 955 471 1 641 066 (710 875) 930 191
Vehicles 219 793 (71 415) 148 378 218 285 (70 337) 147 948
Capital work in progress 8 189 260 – 8 189 260 8 144 246 – 8 144 246
21 022 351 (2 346 302) 18 676 049 20 871 169 (2 317 100) 18 554 069
Leased assets
Vehicles and equipment
equipment 85 970 (69 265) 16 705 85 970 (69 265) 16 705
Vehicles 4 675 (3 490) 1 185 4 675 (3 490) 1 185
90 645 (72 755) 17 890 90 645 (72 755) 17 890
total property, plant and equipment 21 112 996 (2 419 057) 18 693 939 20 961 814 (2 389 855) 18 571 959

98
NOTES TO THE FINANCIAL STATEMENTS (continued)for the year ended 31 March 2010
6 PRoPeRtY, PLANt AND eQUIPMeNt (continued)
Leased property, plant and equipment
the carrying amount of the Group’s property, plant and equipment includes an amount of Rnil (2009: R17,9 million) in respect of assets held under
finance leases.
Ownership
Details of the land and buildings are recorded in a register which may be inspected by the members or their duly authorised agents at the
Company’s registered office.
the Company’s land and buildings consist of land, buildings and equipment including air bridges and other related equipment.
Borrowing costs
Borrowing costs included in the cost of qualifying assets during the year arose on the general borrowing pool and are calculated by applying a
capitalisation rate of 9,75% (2009: 11,55%) to expenditure on such assets.
GROUP
Carrying Carrying
amount at amount at
beginning end of
of year Additions transfers Depreciation Disposals year
R’000 R’000 R’000 R’000 R’000 R’000
Movement for the year
2010
Owned assets
Land and buildings
Land 900 435 – (7 671) – (106 780) 785 984
Buildings 4 979 386 3 123 2 254 600 (340 277) – 6 896 832
Roads, runways and aprons 3 503 119 – 536 126 (241 248) – 3 797 997
Vehicles and equipment
equipment 955 470 275 903 844 943 (402 721) (25 246) 1 648 349
Vehicles 148 379 35 737 (156) (22 615) (31 888) 129 457
Capital work in progress 8 189 260 5 533 504 (3 712 954) – – 10 009 810
18 676 049 5 848 267 (85 112) (1 006 861) (163 914) 23 268 429
Leased assets
Vehicles and equipment
equipment 16 705 – – (16 705) – –
Vehicles 1 185 – – (1 185) – –
17 890 – – (17 890) – –
total property, plant and equipment 18 693 939 5 848 267 (85 112) (1 024 751) (163 914) 23 268 429

99
NOTES TO THE FINANCIAL STATEMENTS (continued)for the year ended 31 March 2010
COMPANY
Carrying Carrying
amount at amount at
beginning end of
of year Additions transfers Depreciation Disposals year
R’000 R’000 R’000 R’000 R’000 R’000
6 PRoPeRtY, PLANt AND eQUIPMeNt (continued)
Movement for the year (continued)
2010
Owned assets
Land and buildings
Land 892 759 – – – (106 780) 785 979
Buildings 4 935 806 – 2 294 972 (339 954) – 6 890 824
Roads, runways and aprons 3 503 119 – 536 126 (241 248) – 3 797 997
Vehicles and equipment
equipment 930 191 265 042 836 842 (398 433) (21 975) 1 611 667
Vehicles 147 948 35 582 – (22 494) (31 888) 129 148
Capital work in progress 8 144 246 5 533 504 (3 667 940) – – 10 009 810
18 554 069 5 834 128 – (1 002 129) (160 643) 23 225 425
Leased assets
Vehicles and equipment
equipment 16 705 – – (16 705) – –
Vehicles 1 185 – – (1 185) – –
17 890 – – (17 890) – –
total property, plant and equipment 18 571 959 5 834 128 – (1 020 019) (160 643) 23 225 425
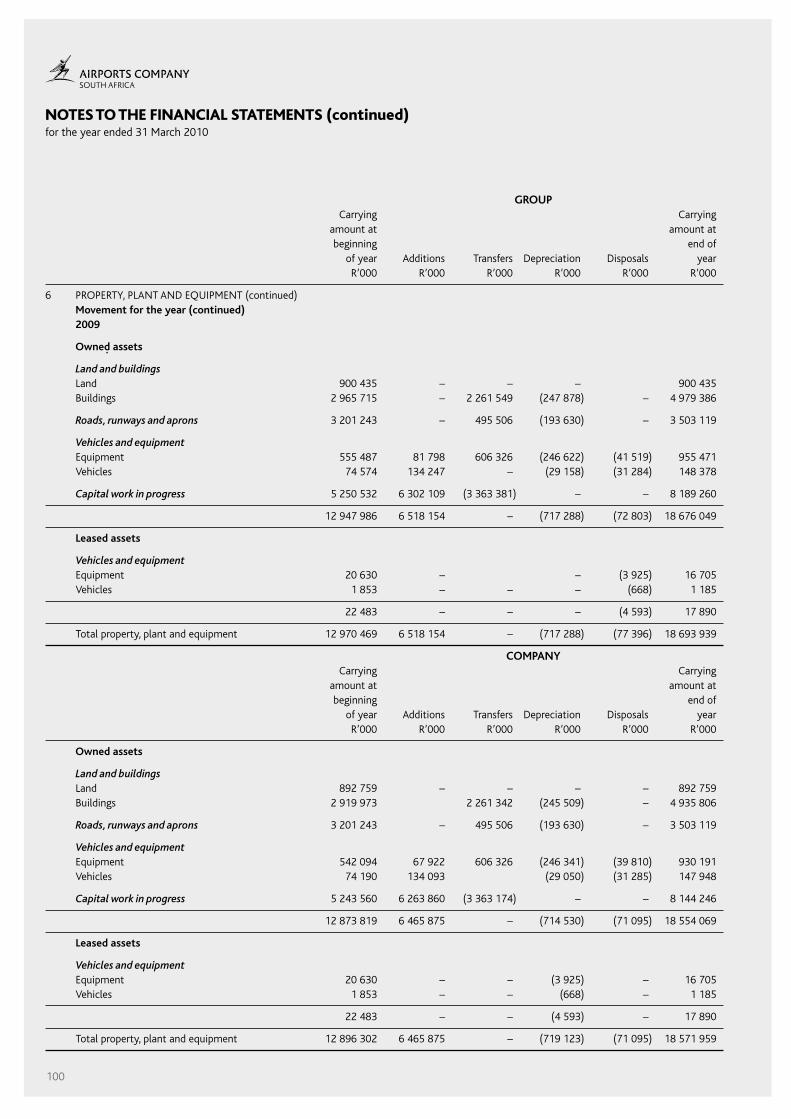
100
NOTES TO THE FINANCIAL STATEMENTS (continued)for the year ended 31 March 2010
GROUP Carrying Carrying amount at amount at beginning end of of year Additions transfers Depreciation Disposals year R’000 R’000 R’000 R’000 R’000 R’000
6 PRoPeRtY, PLANt AND eQUIPMeNt (continued) Movement for the year (continued) 2009
Owned assets
Land and buildings Land 900 435 – – – 900 435 Buildings 2 965 715 – 2 261 549 (247 878) – 4 979 386
Roads, runways and aprons 3 201 243 – 495 506 (193 630) – 3 503 119
Vehicles and equipment equipment 555 487 81 798 606 326 (246 622) (41 519) 955 471 Vehicles 74 574 134 247 – (29 158) (31 284) 148 378
Capital work in progress 5 250 532 6 302 109 (3 363 381) – – 8 189 260
12 947 986 6 518 154 – (717 288) (72 803) 18 676 049
Leased assets
Vehicles and equipment equipment 20 630 – – (3 925) 16 705 Vehicles 1 853 – – – (668) 1 185
22 483 – – – (4 593) 17 890
total property, plant and equipment 12 970 469 6 518 154 – (717 288) (77 396) 18 693 939
COMPANY Carrying Carrying amount at amount at beginning end of of year Additions transfers Depreciation Disposals year R’000 R’000 R’000 R’000 R’000 R’000
Owned assets
Land and buildings Land 892 759 – – – – 892 759 Buildings 2 919 973 2 261 342 (245 509) – 4 935 806
Roads, runways and aprons 3 201 243 – 495 506 (193 630) – 3 503 119
Vehicles and equipment equipment 542 094 67 922 606 326 (246 341) (39 810) 930 191 Vehicles 74 190 134 093 (29 050) (31 285) 147 948
Capital work in progress 5 243 560 6 263 860 (3 363 174) – – 8 144 246
12 873 819 6 465 875 – (714 530) (71 095) 18 554 069
Leased assets
Vehicles and equipment equipment 20 630 – – (3 925) – 16 705 Vehicles 1 853 – – (668) – 1 185
22 483 – – (4 593) – 17 890
total property, plant and equipment 12 896 302 6 465 875 – (719 123) (71 095) 18 571 959

101
NOTES TO THE FINANCIAL STATEMENTS (continued)for the year ended 31 March 2010
GROUP COMPANY
Accumulated Carrying Accumulated Carrying
Cost amortisation amount Cost amortisation amount
R’000 R’000 R’000 R’000 R’000 R’000
7 INtANGIBLe Assets
2010
Computer software 201 831 (90 838) 110 993 200 847 (90 729) 110 118
201 831 (90 838) 110 993 200 847 (90 729) 110 118
2009
Computer software 157 413 (51 819) 105 594 160 650 (55 111) 105 539
157 413 (51 819) 105 594 160 650 (55 111) 105 539
GROUP Carrying Carrying
amount at amount at
beginning Amortisation end of
of year Additions transfers expense Disposals year
R’000 R’000 R’000 R’000 R’000 R’000
Movement for the year
2010
Computer software 105 594 58 260 – (52 698) (163) 110 993
total Intangible assets 105 594 58 260 – (52 698) (163) 110 993
2009
Computer software 24 906 50 699 57 046 (27 057) (27 057) 105 594
Work in progress 57 046 – (57 046) – – –
total Intangible assets 81 952 50 699 – (27 057) (27 057) 105 594
COMPANY Carrying Carrying
amount at amount at
beginning Amortisation end of
of year Additions transfers expense Disposals year
R’000 R’000 R’000 R’000 R’000 R’000
Movement for the year
2010
Computer software 105 539 57 359 – (52 617) (163) 110 118
total Intangible assets 105 539 57 359 – (52 617) (163) 110 118
2009
Computer software 24 906 50 617 57 046 (27 030) – 105 539
Work in progress 57 046 – (57 046) – – –
total Intangible assets 81 952 50 617 – (27 030) – 105 539

102
NOTES TO THE FINANCIAL STATEMENTS (continued)for the year ended 31 March 2010
GROUP COMPANY
2010 2009 2010 2009
R’000 R’000 R’000 R’000
8 INVestMeNt PRoPeRtY
Balance at 1 April 2 265 019 2 263 008 1 581 019 1 611 608
Acquisitions 4 786 867 4 343 –
transfer from property, plant and equipment 105 615 – 7 573 867
Change in fair value 58 018 1 144 37 548 (31 456)
Balance at 31 March 2 433 438 2 265 019 1 630 483 1 581 019
Investment properties are stated at fair value, which has been determined based on valuations performed by accredited independent valuers, as at
31 March 2010 and 31 March 2009. the valuers are industry specialists in valuing these types of investment properties. the fair values of the
properties have been determined on transactions observable in the market. Where there was lack of comparable data, a valuation model in accordance
with that recommended by the International Valuation standards Committee has been applied. the following main inputs have been used.
Investment properties with a fair value of R701 million (2009: R684 million) have been encumbered by secured borrowings.
2010 2009
Market yield of comparable properties (%) 10 – 15 10 – 13
Average escalation of lease rentals (%) 8 – 12 8 – 12
Average duration of lease 3 – 5 years 3 – 5 years
the Company’s investment property consists of land and buildings.
Details of the investment properties are recorded in a register which may be inspected by the members or their duly authorised agents at the
Company’s registered office. Investment property comprises a number of commercial properties that are leased to third parties. No contingent
rents are charged.
GROUP COMPANY
2010 2009 2010 2009
R’000 R’000 R’000 R’000
9 INVestMeNt IN sUBsIDIARIes
shares at cost 225 225
Indebtedness 279 620 273 731
Provision for impairment (23 556) (23 556)
Total interest in subsidiaries 256 289 250 400
Directors valuation 256 289 250 400
Aggregate after tax profits of subsidiary companies 16 735 36 861

103
NOTES TO THE FINANCIAL STATEMENTS (continued)for the year ended 31 March 2010
Principal Country of Issued share Interest Investment
activity incorporation capital held at cost Indebtedness
R’000 R’000
9 INVestMeNt IN sUBsIDIARIes
(continued)
Details of the Company’s subsidiaries at
31 March 2010 are as follows:
2010
Subsidiaries
Guardrisk Life Ltd (cell captive) Insurance south Africa 225 100% 225 –
osI Airport systems (Pty) Ltd Dormant south Africa – 51% – –
Pilanesberg International Airport (Pty) Ltd Airport management south Africa – 100% – 41 246
Precinct 2A (Pty) Ltd Property owning south Africa – 100% – 49 997
JIA Piazza Park (Pty) Ltd Hotel operations south Africa – 100% – 13 921
ACsA Global Ltd Management company Mauritius – 100% – 127 843
225 233 007
the Group’s accounts include the consolidation of the Airport Management share Incentive scheme Company (Pty) Ltd and Lexshell 342 Investment
Holdings (Pty) Ltd. Although the Airport Management share Incentive scheme Company (Pty) Ltd is wholly owned by the Airport Management share
Incentive scheme trust and Lexshell 342 Investment Holdings (Pty) Ltd is wholly owned by the ACsA Kagano trust, in terms of sIC-12 , ‘Consolidation of
special Purpose entities’, the Group consolidates these entities as it is exposed to significant risks that are associated with intercompany loan funding and
the Company receives significant rewards associated with the employment of the beneficiaries. Details of special purpose entities consolidated in terms
of sIC-12 are as follows:
Principal Country of Issued share Interest Investment
activity incorporation capital held at cost Indebtedness
R’000 R’000
Special purposes entities
Lexshell 342 Investment
Holdings (Pty) Ltd employee share option plan south Africa – – – 15 892
Airport Management share Incentive
scheme Company (Pty) Ltd employee share option plan south Africa – – – 30 721
– 46 613
total 225 279 620

104
NOTES TO THE FINANCIAL STATEMENTS (continued)for the year ended 31 March 2010
Principal Country of Issued share Interest Investment activity incorporation capital held at cost Indebtedness R’000 R’000
9 INVestMeNt IN sUBsIDIARIes (continued)
Details of the Company’s subsidiaries at 31 March 2010 are as follows:
2009 Subsidiaries Guardrisk Life Ltd (cell captive) Insurance south Africa 225 100% 225 –
Other osI Airport systems (Pty) Ltd Dormant south Africa – 51% – – Pilanesberg International Airport (Pty) Ltd Airport management south Africa – 100% – 32 474 Precinct 2A (Pty) Ltd Property owing south Africa – 100% – 111 980 JIA Piazza Park (Pty) Ltd Hotel operations south Africa – 100% – – ACsA Global Ltd Management company Mauritius – 100% – 82 924
225 227 378
Special purposes entities Lexshell 342 Investment Holdings (Pty) Ltd employee share option plan south Africa – – – 15 705 Airport Management share Incentive scheme Company (Pty) Ltd employee share option plan south Africa – – – 30 648
46 353
total 225 273 731
GROUP
2010 2009 R’000 R’000
10 INVestMeNt IN JoINt VeNtURes the Group has the following significant interests in joint ventures:
Airport Logistics Property Holdings (Pty) Ltd the Group has a 50% interest in a joint venture, Airport Logistics Property Holdings (Pty) Ltd.
the following amounts represent the Group’s share of the assets, liabilities, revenue and expenses of the joint venture and are included in the consolidated statement of financial position, comprehensive income and cash flow.
Investment property 101 854 89 124 Current assets 14 260 10 478
116 114 99 602
Non-current liabilities 70 202 70 854 Current liabilities 32 649 28 783
102 851 99 637
Net assets 13 263 (35)
Income 15 684 6 029 expenses (3 666) (6 946)
Profit before income tax 12 018 (917) Income tax expense (1 584) –
Profit for the year 10 434 (917)
the Directors estimate the value of the investment in the joint venture to be at least equal to R13,263 million (2009: Rnil).

105
NOTES TO THE FINANCIAL STATEMENTS (continued)for the year ended 31 March 2010
11 INVestMeNt IN AssoCIAtes Investment in Mumbai International Airport Private Limited
the Group has a 10% equity interest in the 30-year concession (with an option for a further 30 years) to modernise the Mumbai International Airport. ACsA is an integral investor in the project as well as being the designated Airport operator. the investment has been accounted for as an associate.
Investment in La Mercy JV Property Investments (Pty) Ltd company
the Group has a 40% stake in the La Mercy JV Property Investments (Pty) Ltd. the Company is a property holding, development and letting company. the investment in the Company has been accounted for as an associate.
GROUP
La Mercy JV Property Mumbai International Investments (Pty) Ltd Airport Private Ltd 2010 2009 2010 2009 R’000 R’000 R’000 R’000
Balance at beginning of year – – 459 978 420 134 Additional equity contribution 32 250 – 33 267 35 216 share of profit 114 173 – 21 659 16 097 Foreign currency translation difference – – – (11 469)
Balance at end of year 146 423 – 514 904 459 978
Total investment 661 327 459 978
COMPANY
2010 2009 R’000 R’000
Balance at beginning of year – – Additional equity contribution 32 250 –
Balance at end of year 32 250 –
GROUP
La Mercy JV Property Mumbai International Investments (Pty) Ltd Airport Private Ltd 2010 2009 2010 2009 R’000 R’000 R’000 R’000
the following amounts represent the Group’s share of the assets, liabilities, revenue and expenses of the associate:
Property, plant and equipment and investment property 164 539 – 901 113 745 117 Current assets 875 – 75 823 117 443
165 414 – 976 935 862 560
Non-current liabilities 18 613 – 345 142 63 453 Loans – – 18 674 276 090 Current liabilities 378 – 107 444 92 050
18 991 – 471 260 431 593
Net assets 146 423 – 505 675 430 967
Income 133 245 – 164 833 183 093 expenses (459) – (131 762) (157 922)
Profit before income tax 132 786 – 33 071 25 171 Income tax expense (18 613) – (11 412) (9 074)
Profit for the year 114 173 – 21 659 16 097
total profit for the Group 135 832 16 097

106
NOTES TO THE FINANCIAL STATEMENTS (continued)for the year ended 31 March 2010
GROUP COMPANY
2010 2009 2010 2009
R’000 R’000 R’000 R’000
11 INVestMeNt IN AssoCIAtes (continued) Guarantees issued ACsA has issued the following guarantees. An equity guarantee issued by ACsA INR75 675 676 (2009: INR275 675 676) 12 434 51 085 12 434 51 085
Airport operator guarantee issued by ACsA Global Ltd INR300 00 00 000 (2009: INR300 00 00 000) 492 900 555 926 – –
505 334 607 011 12 434 51 085
the Airport operator guarantee is limited to ACsA’s performance fee of UsD1 087 133 (2009: UsD1 066 014)
12 otHeR NoN-CURReNt Assets
Illembe Consortium
Balance at beginning of year – 32 716 – 32 716
short-term portion – (32 716) – (32 716)
Balance at end of year – – – –
the amount owing in the prior year relates to advances made to
Illembe Consortium for construction expenditure in respect of the
La Mercy development. the amount advanced did not bear interest
and the short-term portion was repaid in full in the 2010 financial year.
Lease receivable non-current portion 113 725 116 511 113 725 116 511
the lease receivable amount relates to the straight-lining of leases.
13 INVeNtoRIes
Consumables – 1 112 – 502
Hotel food and beverages 908 312 – –
908 1 424 – 502

107
NOTES TO THE FINANCIAL STATEMENTS (continued)for the year ended 31 March 2010
GROUP COMPANY
2010 2009 2010 2009 R’000 R’000 R’000 R’000
14 tRADe AND otHeR ReCeIVABLes trade receivables 453 936 371 734 448 866 360 208 Loan to joint venture 15 413 14 339 31 672 28 677 Impairment of trade and other receivables (18 390) (12 817) (18 390) (12 713)
Loans and receivables 450 959 373 256 462 148 376 172 VAt receivable 21 773 316 334 21 773 314 864 Current tax receivable 139 800 – 139 800 – Prepayments 8 035 38 019 8 035 36 375 other receivables 30 171 15 601 30 171 398 short-term portion of non-current receivable (refer note 12) – 32 716 – 32 716 sundry receivable – Dube tradePort 33 392 58 256 33 392 57 344 Lease receivables 105 389 48 334 94 865 48 334 Insurance rent-a-captive receivable1 78 842 83 787 78 842 83 787
868 361 966 303 869 026 949 990
An adjustment for impairment of receivables has been made for estimated irrecoverable amounts.
the Directors consider that the carrying amount of loans and receivables approximates their fair value.
the lease receivables relate to the straight-lining of lease accruals.
1 the contingency policies are underwritten by Guardrisk and Centriq. the amount receivable represents the balance of the special experience account. the special experience account is payable on demand.
the Group’s exposure to credit and currency risks and impairment losses related to trade and other receivables are disclosed in notes 4 and 39.
15 CAsH AND CAsH eQUIVALeNts Bank balances 306 015 670 651 222 634 529 336 Money markets 127 982 318 693 127 982 298 693
433 997 989 344 350 616 828 029
the Group’s exposure to interest rate risk and a sensitivity analysis for financial assets and liabilities are disclosed in note 39.
16 IssUeD sHARe CAPItAL AND sHARe PReMIUM Authorised: 1 000 000 000 ordinary R1 par value shares 1 000 000 1 000 000 1 000 000 1 000 000
Issued 500 000 000 ordinary R1 par value shares 500 000 500 000 500 000 500 000 share premium 250 000 250 000 250 000 250 000
750 000 750 000 750 000 750 000
GROUP
2010 2009 R’000 R’000
17 tReAsURY sHARe ReseRVe the treasury share Reserve represents the Company’s own
shares held by the Group. Refer also to note 9. 44 024 44 024
5 962 452 shares (2009: 5 962 452 shares) are held by the Airport Management share Incentive scheme Company (Pty) Ltd and Lexshell 342 Investment Holdings (Pty) Ltd.

108
NOTES TO THE FINANCIAL STATEMENTS (continued)for the year ended 31 March 2010
GROUP
Foreign currency translation Actuarial Life total reserve losses fund R’000 R’000 R’000 R’000
18 otHeR ReseRVes At 1 April 2009 (22 075) (8 258) (17 930) 4 113 translation differences net of tax (4 374) (4 374) – – transfer to Life fund 866 – – 866 Actuarial losses net of tax (2 930) – (2 930) –
At 31 March 2010 (28 513) (12 632) (20 860) 4 979
COMPANY
Foreign currency translation Actuarial Life total reserve losses fund R’000 R’000 R’000 R’000
At 1 April 2009 (17 930) – (17 930) – Actuarial losses net of tax (2 930) – (2 930) –
At 31 March 2010 (20 860) – (20 860) –
GROUP
2010 2009 R’000 R’000
19 DeBeNtURes Debentures issued to the North West Government. 6 000 6 000
Debentures issued to the North West Government at zero coupon rate in exchange for an allocation of a 20% equity in Pilanesberg International Airport (Pty) Ltd at a date still to be determined.
It is ACsA’s intention and understanding that the debentures will be convertible at the option of the North West Government. the contractual terms providing for the conversion of the debentures into an equity stake would result in government participation in the ownership of the Company. the debentures are at a zero coupon rate and no cash flows will be received in this respect. therefore the full amount received on initial recognition is equal to the residual amount that should be allocated to equity.
20 RetIReMeNt BeNeFIt oBLIGAtIoNs Defined contribution plans
Pension fund All full-time employees of the Company are members of the pension fund, a defined contribution fund, subject to the Pension Funds Act 1956. on
31 March 2010 an actuarial valuation was performed by independent consulting actuaries, who found the fund to be in a sound financial position. No events have had a significant effect on the fund’s position since this valuation.
Defined benefit plan
Post retirement medical benefits
GROUP COMPANY
2010 2009 2010 2009 R’000 R’000 R’000 R’000
Present value of unfunded obligations 105 043 89 280 105 043 89 280
the Company makes contributions to a defined benefit plan that provides medical benefits to employees upon retirement. the employees eligible for the post retirement medical aid benefit are those that were in employment at 1 August 2007. the plan entitles retired employees to receive a reimbursement of certain medical costs.

109
NOTES TO THE FINANCIAL STATEMENTS (continued)for the year ended 31 March 2010
GROUP COMPANY
2010 2009 2010 2009
R’000 R’000 R’000 R’000
20 RetIReMeNt BeNeFIt oBLIGAtIoNs (continued)
Movement in the present value of the defined benefit obligations
Balance at beginning of the year 89 280 70 455 89 280 70 455
Current service cost 4 551 4 355 4 551 4 355
Interest cost 7 142 7 169 7 142 7 169
Actuarial loss 4 070 7 301 4 070 7 301
Balance at end of the year 105 043 89 280 105 043 89 280
Expense recognised in comprehensive income
Current service cost 4 551 4 355 4 551 4 355
Interest cost 7 142 7 169 7 142 7 169
11 693 11 524 11 693 11 524
the expense is recognised in operational and administrative
expenses in the statement of comprehensive income..
Expense recognised in other comprehensive income
Balance at beginning of the year 24 903 17 602 24 903 17 602
Actuarial loss recognised during the year 4 070 7 301 4 070 7 301
Balance at end of the year 28 973 24 903 28 973 24 903
Principal actuarial assumptions at the financial position date.
Discount rate 9,00% 8,00% 9,00% 8,00%
Health care cost inflation 6,65% 5,83% 6,65% 5,83%
Average retirement age 60 60 60 60
the assumptions used by actuaries are the best estimates chosen from a range of possible actuarial assumptions which, due to the timescale
covered, may not necessarily be borne out in practice.
Assumed healthcare cost trend rates have a significant effect on the amounts recognised. A one percentage point change in assumed healthcare
cost trend would have the following effects:
1% increase 1% decrease
effect on the aggregate current service and interest cost 2 280 3 024
effect on defined benefit obligation 25 473 19 443
2010 2009 2008 2007 2006
R’000 R’000 R’000 R’000 R’000
Present value of unfunded obligations 105 043 89 280 70 455 57 812 38 824
expected contributions to post employment benefit plans for the year ended 31 March 2011 are R1 285 901.
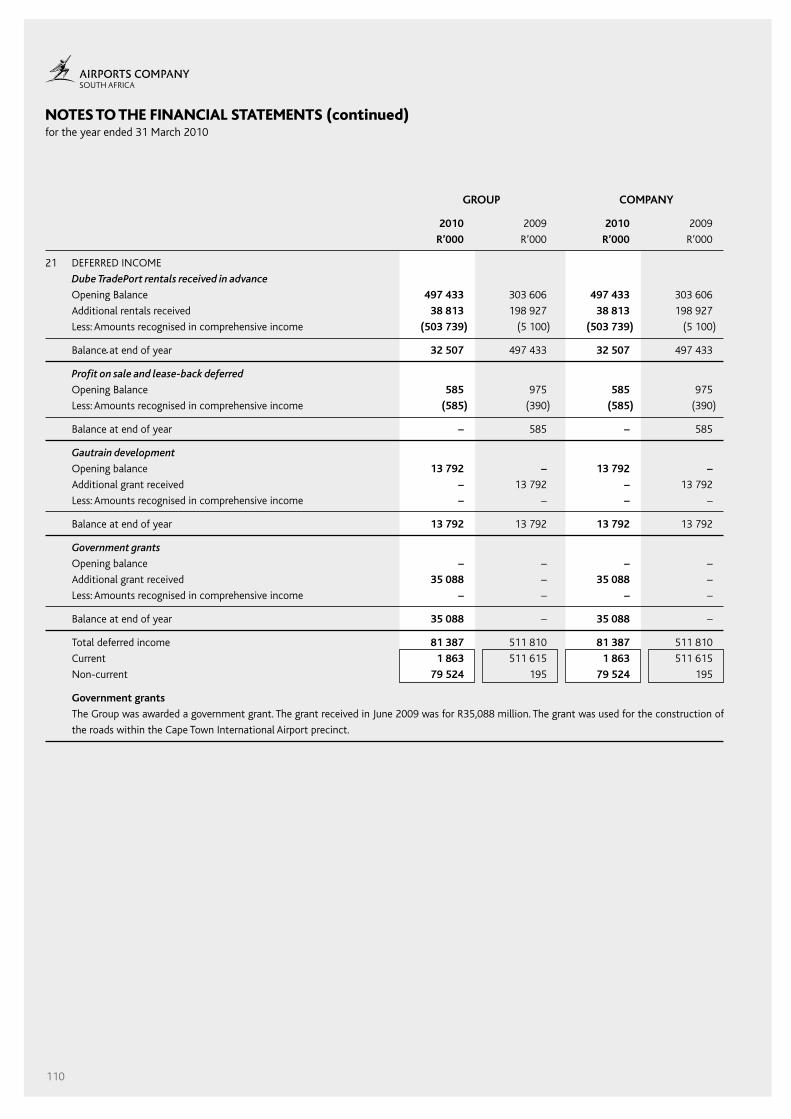
110
NOTES TO THE FINANCIAL STATEMENTS (continued)for the year ended 31 March 2010
GROUP COMPANY
2010 2009 2010 2009
R’000 R’000 R’000 R’000
21 DeFeRReD INCoMe
Dube TradePort rentals received in advance
opening Balance 497 433 303 606 497 433 303 606
Additional rentals received 38 813 198 927 38 813 198 927
Less: Amounts recognised in comprehensive income (503 739) (5 100) (503 739) (5 100)
Balance at end of year 32 507 497 433 32 507 497 433
Profit on sale and lease-back deferred
opening Balance 585 975 585 975
Less: Amounts recognised in comprehensive income (585) (390) (585) (390)
Balance at end of year – 585 – 585
Gautrain development
opening balance 13 792 – 13 792 –
Additional grant received – 13 792 – 13 792
Less: Amounts recognised in comprehensive income – – – –
Balance at end of year 13 792 13 792 13 792 13 792
Government grants
opening balance – – – –
Additional grant received 35 088 – 35 088 –
Less: Amounts recognised in comprehensive income – – – –
Balance at end of year 35 088 – 35 088 –
total deferred income 81 387 511 810 81 387 511 810
Current 1 863 511 615 1 863 511 615
Non-current 79 524 195 79 524 195
Government grants
the Group was awarded a government grant. the grant received in June 2009 was for R35,088 million. the grant was used for the construction of
the roads within the Cape town International Airport precinct.

111
NOTES TO THE FINANCIAL STATEMENTS (continued)for the year ended 31 March 2010
GROUP COMPANY
Carrying Fair Carrying Fair Carrying Fair Carrying Fair
value value value value value value value value
2010 2010 2009 2009 2010 2010 2009 2009
R’000 R’000 R’000 R’000 R’000 R’000 R’000 R’000
22 INteRest BeARING BoRRoWINGs Unsecured:
Commercial paper 1 046 892 1 065 199 719 393 720 360 1 046 892 1 065 199 719 393 720 360
Long-term bonds 9 786 607 10 004 698 5 033 807 4 900 918 9 786 607 10 004 698 5 033 807 4 900 918
standard Bank Plc – – 2 011 150 2 029 981 – – 2 011 150 2 029 981
Nedbank Loan 1 752 121 1 724 043 1 750 000 1 807 744 1 752 121 1 724 043 1 750 000 1 807 744
Infrastructure Finance
Corporation Limited (INCA) 248 702 248 185 249 440 253 899 248 702 248 185 249 440 253 899
Development Bank of south Africa 1 481 448 1 518 313 1 483 550 1 554 499 1 481 448 1 518 313 1 483 550 1 554 499
southern sun Loan 1 500 1 500 1 500 1 500 – – – –
Agence Française de
Développement (AFD) 1 017 076 1 003 076 – – 1 017 076 1 003 076 – –
15 334 346 15 565 014 11 248 840 11 268 901 15 332 846 15 563 514 11 247 340 11 267 401
Secured:
FirstRand Bank Ltd 607 995 620 617 606 000 597 919 – – –
Nedcor Investment Bank Ltd – Loan 1 – – 5 151 5 439 – – 5 151 5 439
Nedcor Investment Bank Ltd – Loan 2 – – 18 804 19 109 – – 18 804 18 804
Bidvest Properties (Pty) Ltd – Loan 1 12 124 12 124 12 980 12 980 – – – –
Bidvest Properties (Pty) Ltd – Loan 2 17 784 17 784 18 424 18 424 – – – –
Bidvest Properties (Pty) Ltd – Loan 3 37 779 37 779 38 127 38 127 – – – –
675 682 688 304 699 486 691 998 – – 23 955 23 954
16 010 028 16 253 318 11 948 326 11 960 899 15 332 846 15 563 514 11 271 295 11 291 948
Maturity analysis
Current portion 1 305 692 1 305 692 2 833 601 2 833 601 1 304 193 1 304 193 2 830 211 2 830 211
Non-current portion 14 704 336 14 947 626 9 114 726 9 127 298 14 028 653 14 259 321 8 441 084 8 461 737
16 010 028 16 253 318 11 948 327 11 960 899 15 332 846 15 563 514 11 271 295 11 291 948
Secured borrowings
total borrowings include liabilities that are secured by the land and buildings of the Group classified as investment property to the value of R701 million
(2009: R684 million).

112
NOTES TO THE FINANCIAL STATEMENTS (continued)for the year ended 31 March 2010
GROUP COMPANY Carrying value Carrying value
Interest
security rate Nominal Maturity 2010 2009 2010 2009
number % R’000 date R’000 R’000 R’000 R’000
22 INteRest BeARING BoRRoWINGs
(continued)
Terms and debt repayment schedule
Commercial paper ACCP09 11,23 707 000 4 May 2009 – 719 393 – 719 393
ACCP13 8,78 150 000 4 May 2010 158 663 – 158 663 –
ACCP16 7,43 378 000 12 May 2010 382 232 – 382 232 –
ACCP17 7,96 500 000 5 Augusts 2010 505 997 – 505 997 –
Long-term bonds AIR01U 13,78 312 000 6 February 2012 316 490 318 038 316 490 318 038
AIR02U 10 500 000 5 october 2014 510 783 – 510 783 –
AIR03U 10 500 000 26 october 2014 508 896 – 508 896 –
AIRL02 5,501 1 000 000 18 February 2014 1 061 513 1 007 471 1 061 513 1 007 471
AIR03 10,86 1 729 000 9 March 2016 1 738 576 558 988 1 738 576 558 988
AIR01 9 2 000 000 15 March 2019 1 999 867 1 999 251 1 999 867 1 999 251
AIR02 12 1 712 000 30 April 2023 1 839 938 996 609 1 839 938 996 609
AIRL01 3,641 1 191 000 30 April 2028 1 285 878 153 450 1 285 878 153 450
AIR04U 12 500 000 26 october 2029 524 666 – 524 666 –
10 833 499 5 753 200 10 833 499 5 753 200
standard Bank Plc JIBAR linked2 1000000 29 May 2009 – 1 011 150 – 1 011 150
standard Bank Plc JIBAR linked2 1000000 26 June 2009 – 1 000 000 – 1 000 000
Nedcor Investment Bank Ltd – Loan 1 Prime linked 10 302 31 March 2010 – 5 151 – 5 151
Nedcor Investment Bank Ltd – Loan 2 9,79 34 214 31 March 2010 – 18 804 – 18 804
FirstRand Bank Ltd 10,02 606 000 19 september 2012 607 995 606 000 – –
southern sun Hotel Interests (Pty) Ltd 2,00 1 500 31 December 2012 1 500 1 500 – –
Bidvest Properties (Pty) Ltd – Loan 1 10,72 12 980 1 september 2015 12 124 12 981 – –
Bidvest Properties (Pty) Ltd – Loan 2 10,72 18 424 1 september 2015 17 784 18 424 – –
Bidvest Properties (Pty) Ltd – Loan 3 11,00 38 127 1 May 2017 37 779 38 127 – –
Nedbank Loan Prime linked 1 750 000 30 september 2020 1 752 121 1 750 000 1 752 121 1 750 000
Agence Française de Développement (AFD) 10,35 985 490 15 November 2023 1 017 076 – 1 017 076 –
Infrastructure Finance
Corporation Limited (INCA) JIBAR linked2 250 000 30 November 2023 248 702 249 440 248 702 249 440
Development Bank of south Africa JIBAR linked2 1 500 000 31 December 2023 1 481 448 1 483 550 1 481 448 1 483 550
5 176 529 6 195 127 4 499 347 5 518 095
total interest bearing borrowings 16 010 028 11 948 327 15 332 846 11 271 295
Currency: All borrowings are denominated in ZAR.
1 Inflation indexed bond
2 JIBAR linked
– Credit spreads depend on the tenor of the obligations.
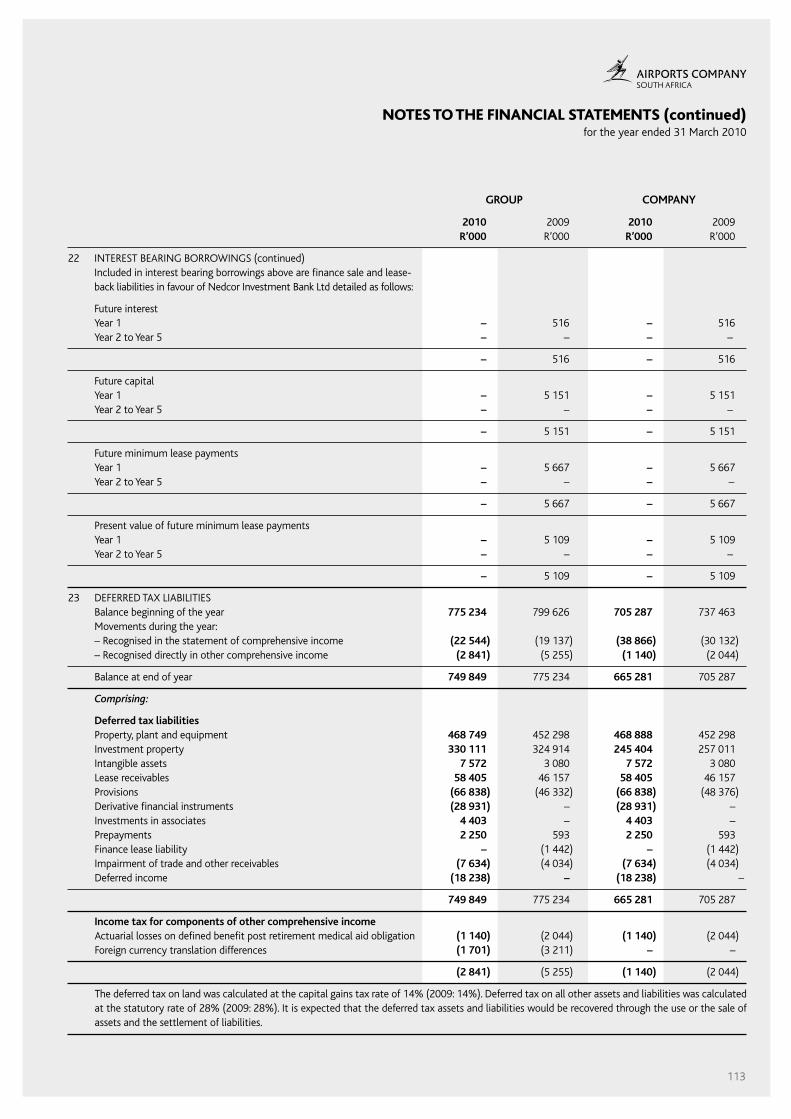
113
NOTES TO THE FINANCIAL STATEMENTS (continued)for the year ended 31 March 2010
GROUP COMPANY
2010 2009 2010 2009 R’000 R’000 R’000 R’000
22 INteRest BeARING BoRRoWINGs (continued) Included in interest bearing borrowings above are finance sale and lease-
back liabilities in favour of Nedcor Investment Bank Ltd detailed as follows:
Future interest Year 1 – 516 – 516 Year 2 to Year 5 – – – –
– 516 – 516
Future capital Year 1 – 5 151 – 5 151 Year 2 to Year 5 – – – –
– 5 151 – 5 151
Future minimum lease payments Year 1 – 5 667 – 5 667 Year 2 to Year 5 – – – –
– 5 667 – 5 667
Present value of future minimum lease payments Year 1 – 5 109 – 5 109 Year 2 to Year 5 – – – –
– 5 109 – 5 109
23 DeFeRReD tAX LIABILItIes Balance beginning of the year 775 234 799 626 705 287 737 463 Movements during the year: – Recognised in the statement of comprehensive income (22 544) (19 137) (38 866) (30 132) – Recognised directly in other comprehensive income (2 841) (5 255) (1 140) (2 044)
Balance at end of year 749 849 775 234 665 281 705 287
Comprising:
Deferred tax liabilities Property, plant and equipment 468 749 452 298 468 888 452 298 Investment property 330 111 324 914 245 404 257 011 Intangible assets 7 572 3 080 7 572 3 080 Lease receivables 58 405 46 157 58 405 46 157 Provisions (66 838) (46 332) (66 838) (48 376) Derivative financial instruments (28 931) – (28 931) – Investments in associates 4 403 – 4 403 – Prepayments 2 250 593 2 250 593 Finance lease liability – (1 442) – (1 442) Impairment of trade and other receivables (7 634) (4 034) (7 634) (4 034) Deferred income (18 238) – (18 238) –
749 849 775 234 665 281 705 287
Income tax for components of other comprehensive income Actuarial losses on defined benefit post retirement medical aid obligation (1 140) (2 044) (1 140) (2 044) Foreign currency translation differences (1 701) (3 211) – –
(2 841) (5 255) (1 140) (2 044)
the deferred tax on land was calculated at the capital gains tax rate of 14% (2009: 14%). Deferred tax on all other assets and liabilities was calculated at the statutory rate of 28% (2009: 28%). It is expected that the deferred tax assets and liabilities would be recovered through the use or the sale of assets and the settlement of liabilities.

114
NOTES TO THE FINANCIAL STATEMENTS (continued)for the year ended 31 March 2010
GROUP COMPANY
2010 2009 2010 2009 R’000 R’000 R’000 R’000
24 tRADe AND otHeR PAYABLes trade payables and accruals 1 694 878 2 044 180 1 682 238 1 996 394
Financial liabilities measured at amortised cost 1 694 878 2 044 180 1 682 238 1 996 394 Leave payable 39 128 28 011 38 435 28 011 Bonuses payable 16 078 9 933 15 924 9 933 other payables 50 071 42 434 54 304 40 257
1 800 155 2 124 558 1 790 901 2 074 595
trade payables and accruals principally comprise amounts outstanding for trade purchases, capital expenditure accruals and other costs.
the Directors consider that the carrying amount of trade payables approximates their fair value.
the bonuses payable represents the liability accrued for at year-end relating to contractual employee bonus payments.
25 PRoVIsIoNs staff incentive bonuses Balance at beginning of the year 48 216 47 968 48 179 47 968 Additional provision in the year 66 257 47 334 66 257 47 297 Utilisation of provision (48 216) (47 086) (48 179) (47 086)
Balance at end of the year 66 257 48 216 66 257 48 179
Analysed as: Current liabilities 66 257 48 216 66 257 48 179
the accumulated staff bonus represents the liability at year-end provided for a planned employee incentive bonus payment. the provision for bonuses is payable within three month of finalisation of the audited financial statements.
26 DeRIVAtIVe FINANCIAL INstRUMeNts GROUP 2010 2009 Assets Liabilities Assets Liabilities R’000 R’000 R’000 R’000
Interest rate swaps – 103 202 – – Forward exchange contracts – 124 – –
total – 103 326 – –
– 103 326 – – Current portion – 56 381 – – Non-current portion – 46 945 – –
COMPANY 2010 2009 Assets Liabilities Assets Liabilities R’000 R’000 R’000 R’000
Interest rate swaps – 103 202 – – Forward exchange contracts – 124 – –
total – 103 326 – –
– 103 326 – – Current portion – 56 381 – – Non-current portion – 46 945 – –
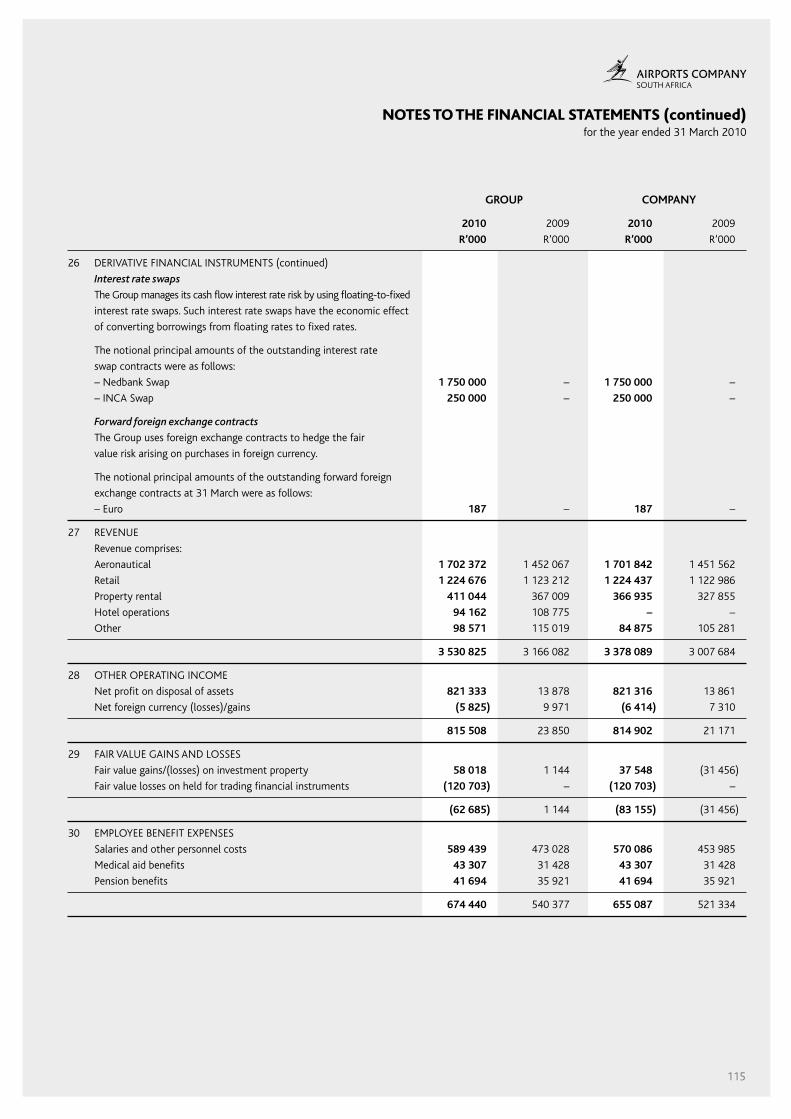
115
NOTES TO THE FINANCIAL STATEMENTS (continued)for the year ended 31 March 2010
GROUP COMPANY
2010 2009 2010 2009
R’000 R’000 R’000 R’000
26 DeRIVAtIVe FINANCIAL INstRUMeNts (continued)
Interest rate swaps
the Group manages its cash flow interest rate risk by using floating-to-fixed
interest rate swaps. such interest rate swaps have the economic effect
of converting borrowings from floating rates to fixed rates.
the notional principal amounts of the outstanding interest rate
swap contracts were as follows:
– Nedbank swap 1 750 000 – 1 750 000 –
– INCA swap 250 000 – 250 000 –
Forward foreign exchange contracts
the Group uses foreign exchange contracts to hedge the fair
value risk arising on purchases in foreign currency.
the notional principal amounts of the outstanding forward foreign
exchange contracts at 31 March were as follows:
– euro 187 – 187 –
27 ReVeNUe
Revenue comprises:
Aeronautical 1 702 372 1 452 067 1 701 842 1 451 562
Retail 1 224 676 1 123 212 1 224 437 1 122 986
Property rental 411 044 367 009 366 935 327 855
Hotel operations 94 162 108 775 – –
other 98 571 115 019 84 875 105 281
3 530 825 3 166 082 3 378 089 3 007 684
28 otHeR oPeRAtING INCoMe
Net profit on disposal of assets 821 333 13 878 821 316 13 861
Net foreign currency (losses)/gains (5 825) 9 971 (6 414) 7 310
815 508 23 850 814 902 21 171
29 FAIR VALUe GAINs AND Losses
Fair value gains/(losses) on investment property 58 018 1 144 37 548 (31 456)
Fair value losses on held for trading financial instruments (120 703) – (120 703) –
(62 685) 1 144 (83 155) (31 456)
30 eMPLoYee BeNeFIt eXPeNses
salaries and other personnel costs 589 439 473 028 570 086 453 985
Medical aid benefits 43 307 31 428 43 307 31 428
Pension benefits 41 694 35 921 41 694 35 921
674 440 540 377 655 087 521 334
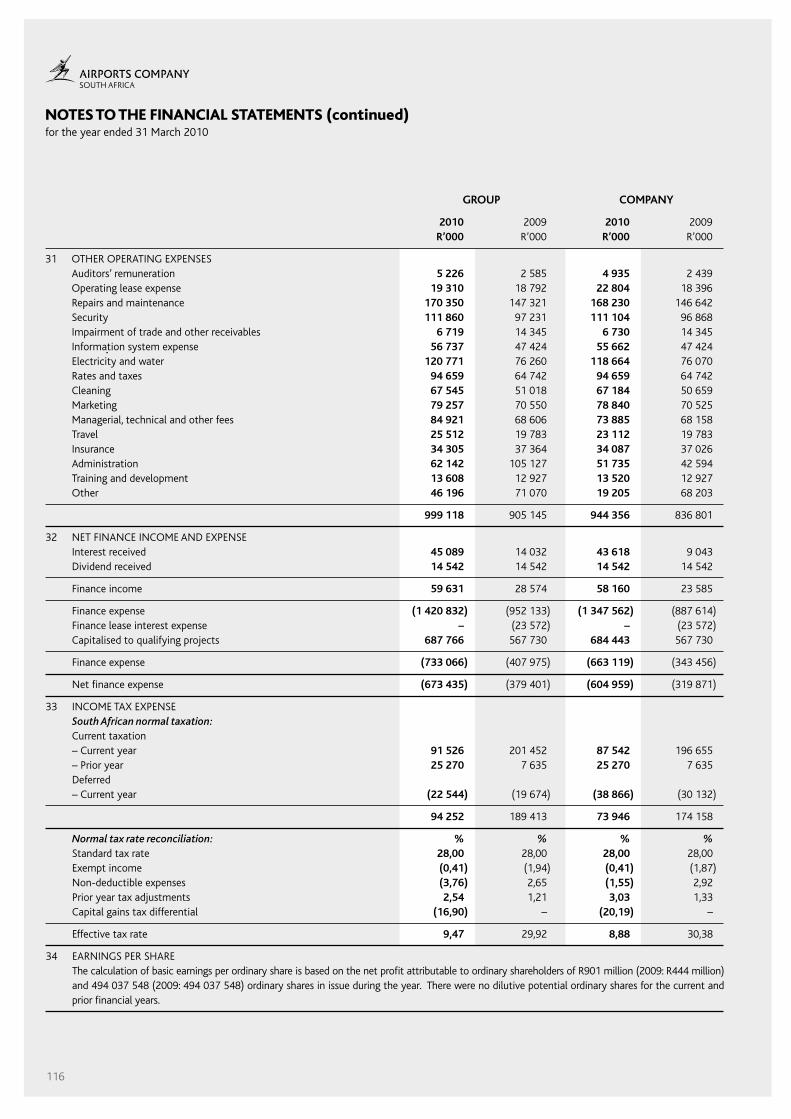
116
NOTES TO THE FINANCIAL STATEMENTS (continued)for the year ended 31 March 2010
GROUP COMPANY
2010 2009 2010 2009 R’000 R’000 R’000 R’000
31 otHeR oPeRAtING eXPeNses Auditors’ remuneration 5 226 2 585 4 935 2 439 operating lease expense 19 310 18 792 22 804 18 396 Repairs and maintenance 170 350 147 321 168 230 146 642 security 111 860 97 231 111 104 96 868 Impairment of trade and other receivables 6 719 14 345 6 730 14 345 Information system expense 56 737 47 424 55 662 47 424 electricity and water 120 771 76 260 118 664 76 070 Rates and taxes 94 659 64 742 94 659 64 742 Cleaning 67 545 51 018 67 184 50 659 Marketing 79 257 70 550 78 840 70 525 Managerial, technical and other fees 84 921 68 606 73 885 68 158 travel 25 512 19 783 23 112 19 783 Insurance 34 305 37 364 34 087 37 026 Administration 62 142 105 127 51 735 42 594 training and development 13 608 12 927 13 520 12 927 other 46 196 71 070 19 205 68 203
999 118 905 145 944 356 836 801
32 Net FINANCe INCoMe AND eXPeNse Interest received 45 089 14 032 43 618 9 043 Dividend received 14 542 14 542 14 542 14 542
Finance income 59 631 28 574 58 160 23 585
Finance expense (1 420 832) (952 133) (1 347 562) (887 614) Finance lease interest expense – (23 572) – (23 572) Capitalised to qualifying projects 687 766 567 730 684 443 567 730
Finance expense (733 066) (407 975) (663 119) (343 456)
Net finance expense (673 435) (379 401) (604 959) (319 871)
33 INCoMe tAX eXPeNse South African normal taxation: Current taxation – Current year 91 526 201 452 87 542 196 655 – Prior year 25 270 7 635 25 270 7 635 Deferred – Current year (22 544) (19 674) (38 866) (30 132)
94 252 189 413 73 946 174 158
Normal tax rate reconciliation: % % % % standard tax rate 28,00 28,00 28,00 28,00 exempt income (0,41) (1,94) (0,41) (1,87) Non-deductible expenses (3,76) 2,65 (1,55) 2,92 Prior year tax adjustments 2,54 1,21 3,03 1,33 Capital gains tax differential (16,90) – (20,19) –
effective tax rate 9,47 29,92 8,88 30,38
34 eARNINGs PeR sHARe the calculation of basic earnings per ordinary share is based on the net profit attributable to ordinary shareholders of R901 million (2009: R444 million)
and 494 037 548 (2009: 494 037 548) ordinary shares in issue during the year. there were no dilutive potential ordinary shares for the current and prior financial years.
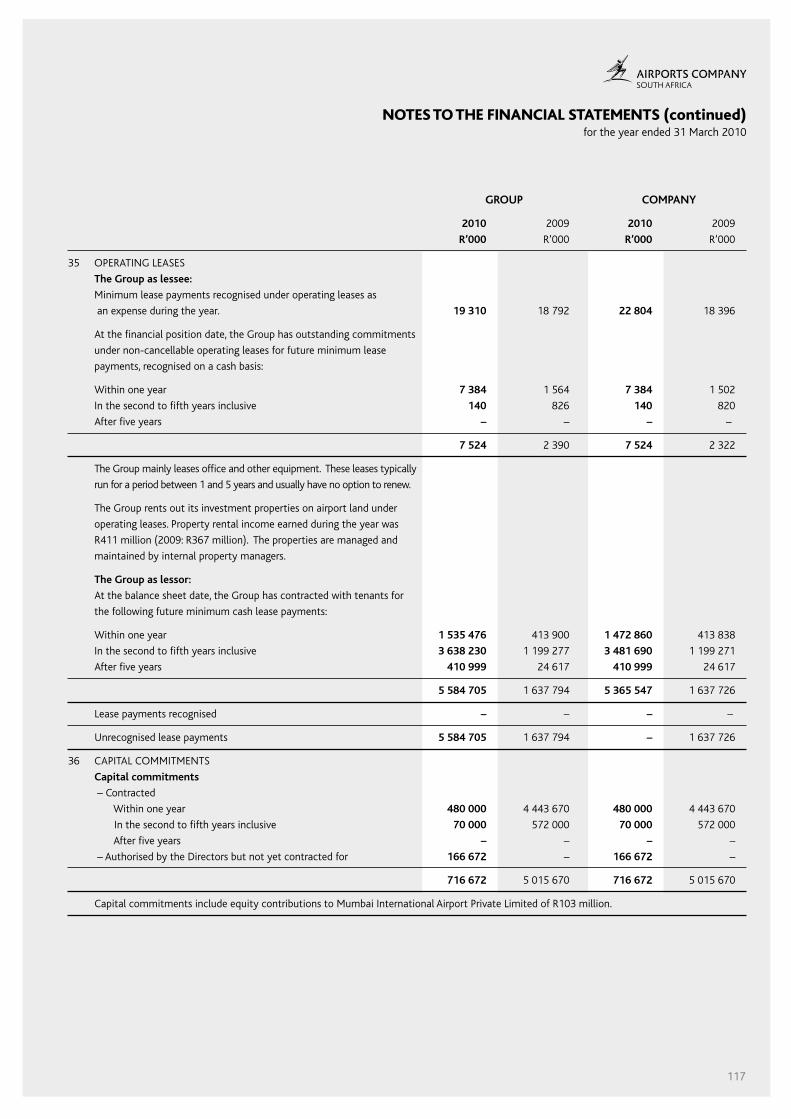
117
NOTES TO THE FINANCIAL STATEMENTS (continued)for the year ended 31 March 2010
GROUP COMPANY
2010 2009 2010 2009
R’000 R’000 R’000 R’000
35 oPeRAtING LeAses
The Group as lessee:
Minimum lease payments recognised under operating leases as
an expense during the year. 19 310 18 792 22 804 18 396
At the financial position date, the Group has outstanding commitments
under non-cancellable operating leases for future minimum lease
payments, recognised on a cash basis:
Within one year 7 384 1 564 7 384 1 502
In the second to fifth years inclusive 140 826 140 820
After five years – – – –
7 524 2 390 7 524 2 322
the Group mainly leases office and other equipment. these leases typically
run for a period between 1 and 5 years and usually have no option to renew.
the Group rents out its investment properties on airport land under
operating leases. Property rental income earned during the year was
R411 million (2009: R367 million). the properties are managed and
maintained by internal property managers.
The Group as lessor:
At the balance sheet date, the Group has contracted with tenants for
the following future minimum cash lease payments:
Within one year 1 535 476 413 900 1 472 860 413 838
In the second to fifth years inclusive 3 638 230 1 199 277 3 481 690 1 199 271
After five years 410 999 24 617 410 999 24 617
5 584 705 1 637 794 5 365 547 1 637 726
Lease payments recognised – – – –
Unrecognised lease payments 5 584 705 1 637 794 – 1 637 726
36 CAPItAL CoMMItMeNts
Capital commitments
– Contracted
Within one year 480 000 4 443 670 480 000 4 443 670
In the second to fifth years inclusive 70 000 572 000 70 000 572 000
After five years – – – –
– Authorised by the Directors but not yet contracted for 166 672 – 166 672 –
716 672 5 015 670 716 672 5 015 670
Capital commitments include equity contributions to Mumbai International Airport Private Limited of R103 million.

118
NOTES TO THE FINANCIAL STATEMENTS (continued)for the year ended 31 March 2010
37 ReLAteD PARtIes
the Airports Company south Africa Ltd is one of 20, schedule 2, major public entities in terms of the Public Finance Management Act (Act 1 of
1999 as amended) and therefore falls within the national sphere of government. As a consequence, Airports Company south Africa Ltd has a
significant number of related parties, being entities, that fall within the national sphere of government. In addition, the Company has a related
party relationship with its subsidiaries, associates, joint ventures and with its Directors and executive officers (key management). Unless specifically
disclosed these transactions are concluded on an arm’s-length basis and the Group is able to transact with any entity.
GROUP COMPANY
2010 2009 2010 2009
R’000 R’000 R’000 R’000
37.1 transactions with related entities
the following is a summary of transactions with related parties
during the year and balances due at year-end:
National departments*
services rendered 29 961 11 458 29 961 11 458
services received 1 443 160 1 443 160
Amount due from 8 334 2 999 8 334 2 999
Amount due (to) – (9) – (9)
Constitutional institutions*
services received 35 – 35 –
Major public entities*
services rendered 737 121 508 573 737 121 508 573
services received 44 416 44 346 44 416 44 346
Amount due from 86 402 82 687 86 402 82 687
Amount due (to) (926) (6 147) (926) (6 147)
Other national public entities*
services rendered 10 028 1 322 10 028 1 322
services received 60 168 – 60 168 –
Amount due from 741 159 741 159
Amount due (to) – (8) – (8)
National government business enterprises*
services rendered – 1 702 – 1 702
services received 5 648 – 5 648 –
Amount due (to) 587 (160) 587 (160)
Subsidiaries, associates, joint ventures and SPE’s
services rendered 34 192 27 427 34 192 27 427
sale of land 78 625 – 78 625 –
Amount due from – – 238 490 273 731
*the list of all national entities within national government with whom the entity is related may be found on National treasury’s website.
services rendered to related major public entities consist primarily of aeronautical and rental services for the Group and for the Company.
services received from related state owned entities consist primarily of telecommunication services, information technology support, transportation
services and energy provision for the Group and for the Company.
All transactions with these related parties (other than intercompany loan balances) are priced on an arm’s-length basis and are to be settled within
1 to 12 months of the reporting date. None of the balances are secured.
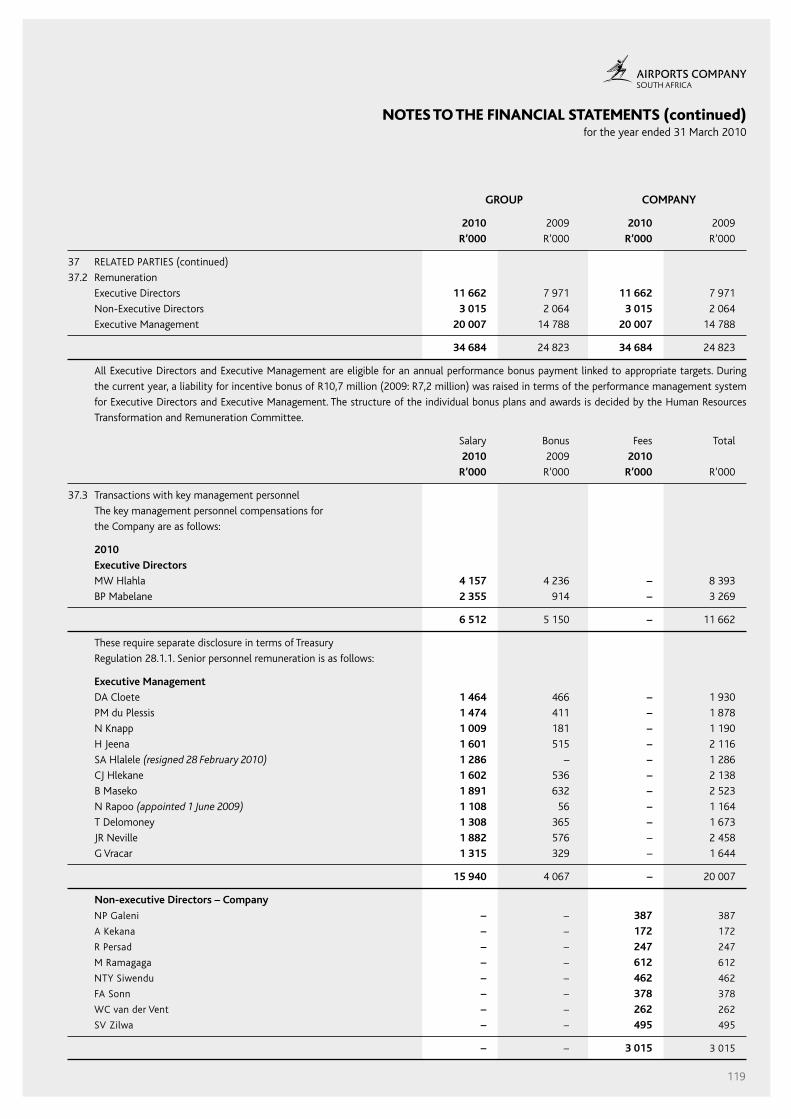
119
NOTES TO THE FINANCIAL STATEMENTS (continued)for the year ended 31 March 2010
GROUP COMPANY
2010 2009 2010 2009
R’000 R’000 R’000 R’000
37 ReLAteD PARtIes (continued)
37.2 Remuneration
executive Directors 11 662 7 971 11 662 7 971
Non-executive Directors 3 015 2 064 3 015 2 064
executive Management 20 007 14 788 20 007 14 788
34 684 24 823 34 684 24 823
All executive Directors and executive Management are eligible for an annual performance bonus payment linked to appropriate targets. During
the current year, a liability for incentive bonus of R10,7 million (2009: R7,2 million) was raised in terms of the performance management system
for executive Directors and executive Management. the structure of the individual bonus plans and awards is decided by the Human Resources
transformation and Remuneration Committee.
salary Bonus Fees total
2010 2009 2010
R’000 R’000 R’000 R’000
37.3 transactions with key management personnel
the key management personnel compensations for
the Company are as follows:
2010
Executive Directors
MW Hlahla 4 157 4 236 – 8 393
BP Mabelane 2 355 914 – 3 269
6 512 5 150 – 11 662
these require separate disclosure in terms of treasury
Regulation 28.1.1. senior personnel remuneration is as follows:
Executive Management
DA Cloete 1 464 466 – 1 930
PM du Plessis 1 474 411 – 1 878
N Knapp 1 009 181 – 1 190
H Jeena 1 601 515 – 2 116
sA Hlalele (resigned 28 February 2010) 1 286 – – 1 286
CJ Hlekane 1 602 536 – 2 138
B Maseko 1 891 632 – 2 523
N Rapoo (appointed 1 June 2009) 1 108 56 – 1 164
t Delomoney 1 308 365 – 1 673
JR Neville 1 882 576 – 2 458
G Vracar 1 315 329 – 1 644
15 940 4 067 – 20 007
Non-executive Directors – Company
NP Galeni – – 387 387
A Kekana – – 172 172
R Persad – – 247 247
M Ramagaga – – 612 612
NtY siwendu – – 462 462
FA sonn – – 378 378
WC van der Vent – – 262 262
sV Zilwa – – 495 495
– – 3 015 3 015

120
NOTES TO THE FINANCIAL STATEMENTS (continued)for the year ended 31 March 2010
salary Bonus Fees total
2009 2008 2009
R’000 R’000 R’000 R’000
37 ReLAteD PARtIes (continued)
37.3 transactions with key management personnel (continued)
the key management personnel compensations for
the Company are as follows:
2009
Executive Directors
MW Hlahla 3 677 2 100 – 5 777
BP Mabelane 2 194 – – 2 194
5 871 2 100 7 971
these require separate disclosure in terms of treasury
Regulation 28.1.1. senior personnel remuneration is as follows:
Executive Management
DA Cloete 1 207 475 – 1 682
PM du Plessis 1 329 462 – 1 791
N Knapp (appointed 1 March 2009) 70 – – 70
H Jeena 1 135 – – 1 135
sA Hlalele 945 153 – 1 098
CJ Hlekane 1 327 501 – 1 828
B Maseko 1 701 803 – 2 504
t Delomoney (appointed 1 August 2008) 893 – – 893
JR Neville 1 693 644 – 2 337
G Vracar 1 129 321 – 1 450
11 429 3 359 – 14 788
Non-executive Directors – Company
NP Galeni – – 264 264
A Kekana – – 167 167
R Persad – – 162 162
M Ramagaga – – 238 238
NtY siwendu – – 253 253
FA sonn – – 415 415
WC van der Vent – – 279 279
sV Zilwa – – 286 286
– – 2 064 2 064
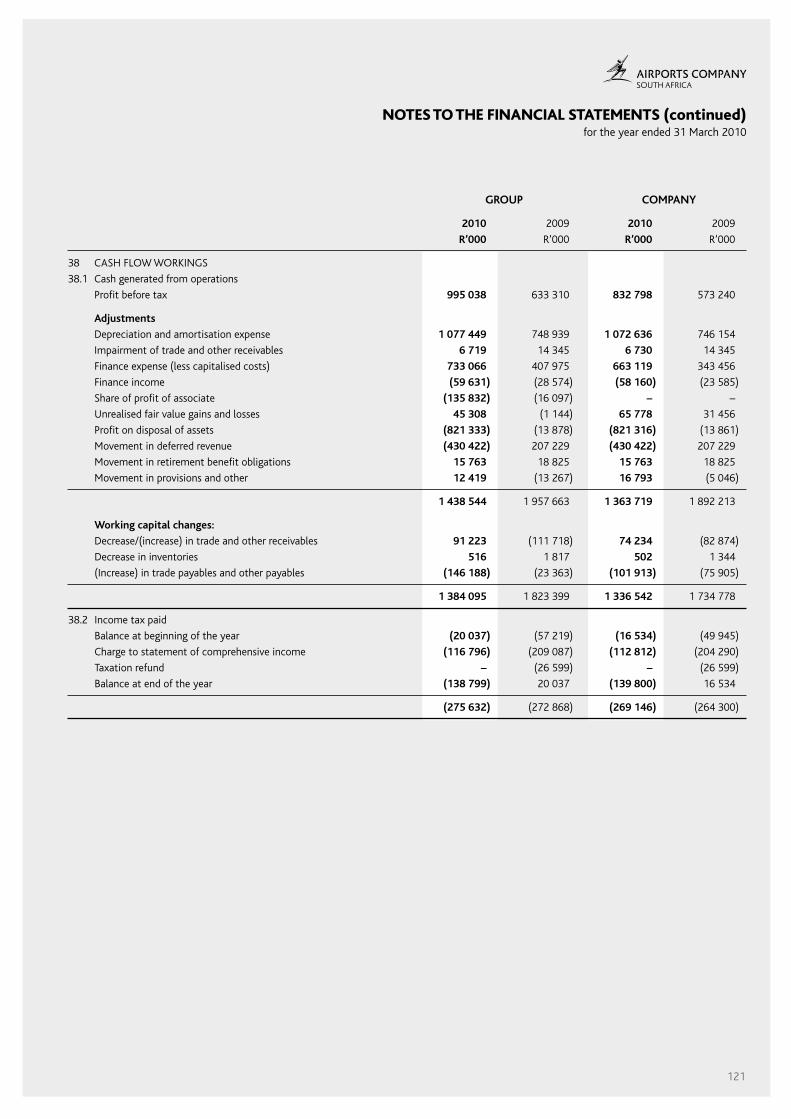
121
NOTES TO THE FINANCIAL STATEMENTS (continued)for the year ended 31 March 2010
GROUP COMPANY
2010 2009 2010 2009
R’000 R’000 R’000 R’000
38 CAsH FLoW WoRKINGs
38.1 Cash generated from operations
Profit before tax 995 038 633 310 832 798 573 240
Adjustments
Depreciation and amortisation expense 1 077 449 748 939 1 072 636 746 154
Impairment of trade and other receivables 6 719 14 345 6 730 14 345
Finance expense (less capitalised costs) 733 066 407 975 663 119 343 456
Finance income (59 631) (28 574) (58 160) (23 585)
share of profit of associate (135 832) (16 097) – –
Unrealised fair value gains and losses 45 308 (1 144) 65 778 31 456
Profit on disposal of assets (821 333) (13 878) (821 316) (13 861)
Movement in deferred revenue (430 422) 207 229 (430 422) 207 229
Movement in retirement benefit obligations 15 763 18 825 15 763 18 825
Movement in provisions and other 12 419 (13 267) 16 793 (5 046)
1 438 544 1 957 663 1 363 719 1 892 213
Working capital changes:
Decrease/(increase) in trade and other receivables 91 223 (111 718) 74 234 (82 874)
Decrease in inventories 516 1 817 502 1 344
(Increase) in trade payables and other payables (146 188) (23 363) (101 913) (75 905)
1 384 095 1 823 399 1 336 542 1 734 778
38.2 Income tax paid
Balance at beginning of the year (20 037) (57 219) (16 534) (49 945)
Charge to statement of comprehensive income (116 796) (209 087) (112 812) (204 290)
taxation refund – (26 599) – (26 599)
Balance at end of the year (138 799) 20 037 (139 800) 16 534
(275 632) (272 868) (269 146) (264 300)

122
NOTES TO THE FINANCIAL STATEMENTS (continued)for the year ended 31 March 2010
GROUP COMPANY
Carrying amount Carrying amount
2010 2009 2010 2009
R’000 R’000 R’000 R’000
39 FINANCIAL INstRUMeNts
Credit risk
Exposure to credit risk
the carrying amount of financial assets represents the maximum credit
exposure. the maximum exposure to credit risk at the reporting date was:
Loans and receivables 450 959 373 256 462 148 376 172
450 959 373 256 462 148 376 172
the maximum exposure to credit risk for trade receivables at the
reporting date by geographic region was:
Johannesburg – o.R. tambo International 265 610 253 555 265 610 253 555
Cape town 90 510 58 455 90 510 58 455
Durban 65 853 31 847 65 853 31 847
Port elizabeth 13 203 9 462 13 203 9 462
east London 5 259 5 406 5 259 5 406
George 2 788 4 295 2 788 4 295
Bloemfontein 2 843 2 106 2 843 2 106
Kimberley 758 1 152 758 1 152
Upington 2 216 1 824 2 216 1 824
Johannesburg corporate office and other 20 309 17 971 31 498 20 783
469 349 386 073 480 538 388 885
Less:
Impairment allowance (18 390) (12 817) (18 390) (12 713)
450 959 373 256 462 148 376 172
GROUP COMPANY
2010 2009 2010 2009
R’000 R’000 R’000 R’000
the maximum exposure to credit risk for trade receivable at the
reporting date before the impairment provision, guarantees and
deposits held by type of customer was:
Aeronautical 204 003 194 441 204 003 194 441
Commercial 137 986 72 297 137 986 72 297
other 127 360 119 335 138 549 122 147
469 349 386 073 480 538 388 885

123
NOTES TO THE FINANCIAL STATEMENTS (continued)for the year ended 31 March 2010
39 FINANCIAL INstRUMeNts (continued)
Credit risk (continued)
the following table represents an age analysis of trade receivables. trade receivables are considered past due should a qualifying payment not be
received within 30 days.
GROUP
trade Impairment as a
Allowance receivables net percentage
trade for of allowance of trade
receivables impairment for impairment receivables
R’000 R’000 R’000 %
2010
Not past due 338 696 – 338 696 0,0
Past due 0 – 30 days 15 186 – 15 186 0,0
Past due 31 – 60 days 35 503 – 35 503 0,0
Past due 61 – 90 days 79 964 (18 390) 61 574 23
total trade receivables 469 349 (18 390) 450 959 3,9
2009
Not past due 277 123 – 277 123 0,0
Past due 0 – 30 days 15 775 – 15 775 0,0
Past due 31 – 60 days 24 723 – 24 723 0,0
Past due 61 – 90 days 68 452 (12 817) 55 635 18,7
total trade receivables 386 073 (12 817) 373 266 3,3
COMPANY 2010
Not past due 349 885 – 349 885 0,0
Past due 0 – 30 days 15 186 – 15 186 0,0
Past due 31 – 60 days 35 503 – 35 503 0,0
Past due 61 – 90 days 79 964 (18 390) 61 574 23
total trade receivables 480 538 (18 390) 462 148 3,8
2009
Not past due 281 608 – 281 608 0,0
Past due 0 – 30 days 14 292 – 14 292 0,0
Past due 31 – 60 days 24 667 – 24 667 0,0
Past due 61 – 90 days 68 318 (12 713) 55 605 18,6
total trade receivables 388 885 (12 713) 376 172 3,3
GROUP COMPANY
2010 2009 2010 2009
R’000 R’000 R’000 R’000
Impairment loss
the movement in the allowance for impairment in respect of
trade receivables during the year was as follows:
Balance at 1 April 12 817 20 461 12 713 20 344
Increase/(decrease) in allowance 5 573 (7 644) 5 677 (7 631)
Balance at 31 March 18 390 12 817 18 390 12 713

124
NOTES TO THE FINANCIAL STATEMENTS (continued)for the year ended 31 March 2010
39 FINANCIAL INstRUMeNts (continued)
Credit quality of financial instruments
the credit quality of financial assets that are neither past due nor impaired can be assessed by reference to historical information about the customer.
Before accepting any new customer, the Group uses an external credit scoring system to assess the potential customer’s credit quality and defines
credit limits by customer. Limits and scoring attributed to customers are reviewed periodically. More than 50% of the trade receivables that are
neither past due nor impaired were recovered within three months after the reporting date. of the trade receivables balance at the end of the year,
R70 million (2009: R65 million) is due from the Group’s largest single customer. there are no other customers who represent more than 10% of
the total balance of trade receivables.
the allowance account in respect of trade receivables is used to record impairment losses unless the Group is satisfied that no recovery of the
amounts owing is possible. At that point, the amounts are considered irrecoverable and are written off against the allowance account.
the Group believes that, based on historic default rates, are no other impairment allowance in respect of trade receivables not past due or past
due 61-90 days is required.
Currency risk
Exposure to currency risk
In order to manage risks from fluctuations in currency rates, the Group make use of forward exchange contracts to manage exposure to fluctuations
in foreign currency rates on importation of equipment.
GROUP
2010 2009
GBP Euro UsD euro UsD
‘000 ‘000 ‘000 ‘000 ‘000
the Group’s exposure to foreign currency risks was as
follows, based on notional amounts:
trade receivables – – 1 873 – 784
Cash and cash equivalents – – 1 710 – 1 737
trade payables (47) (522) (80) – (28)
Gross balance sheet exposure (47) (522) 3 503 – 2 493
COMPANY
2010 2009
GBP Euro UsD euro UsD
‘000 ‘000 ‘ 000 ‘ 000 ‘ 000
trade payables (47) (522) (80) – –
Gross balance sheet exposure (47) (522) (80) – –
the following significant exchange rates applied during the year:
Average rate Reporting spot rate
2010 2009 2010 2009
euro 11,077 12,499 9,943 12,828
UsD 7,847 8,871 7,393 9,720
GBP 12,512 15,029 11,142 13, 816
INR 0,165 0,192 0,164 0,188
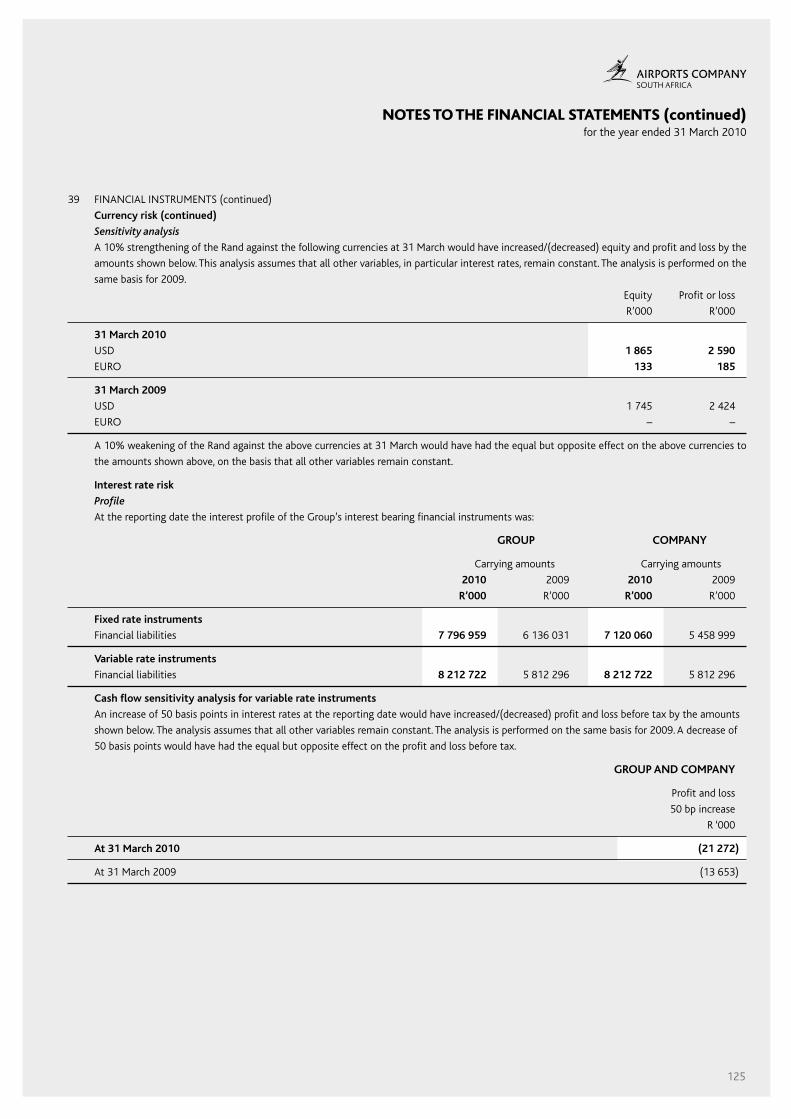
125
NOTES TO THE FINANCIAL STATEMENTS (continued)for the year ended 31 March 2010
39 FINANCIAL INstRUMeNts (continued)
Currency risk (continued)
Sensitivity analysis
A 10% strengthening of the Rand against the following currencies at 31 March would have increased/(decreased) equity and profit and loss by the
amounts shown below. this analysis assumes that all other variables, in particular interest rates, remain constant. the analysis is performed on the
same basis for 2009.
equity Profit or loss
R’000 R’000
31 March 2010
UsD 1 865 2 590
eURo 133 185
31 March 2009
UsD 1 745 2 424
eURo – –
A 10% weakening of the Rand against the above currencies at 31 March would have had the equal but opposite effect on the above currencies to
the amounts shown above, on the basis that all other variables remain constant.
Interest rate risk
Profile
At the reporting date the interest profile of the Group’s interest bearing financial instruments was:
GROUP COMPANY
Carrying amounts Carrying amounts
2010 2009 2010 2009
R’000 R’000 R’000 R’000
Fixed rate instruments
Financial liabilities 7 796 959 6 136 031 7 120 060 5 458 999
Variable rate instruments
Financial liabilities 8 212 722 5 812 296 8 212 722 5 812 296
Cash flow sensitivity analysis for variable rate instruments
An increase of 50 basis points in interest rates at the reporting date would have increased/(decreased) profit and loss before tax by the amounts
shown below. the analysis assumes that all other variables remain constant. the analysis is performed on the same basis for 2009. A decrease of
50 basis points would have had the equal but opposite effect on the profit and loss before tax.
GROUP AND COMPANY
Profit and loss
50 bp increase
R ‘000
At 31 March 2010 (21 272)
At 31 March 2009 (13 653)

126
NOTES TO THE FINANCIAL STATEMENTS (continued)for the year ended 31 March 2010
GROUP 31 March 2010 31 March 2009
Carrying Fair Carrying Fair
amount value amount value
Classification R’000 R’000 R’000 R’000
39 FINANCIAL INstRUMeNts (continued)
Fair values and financial instrument by category
Fair values versus carrying amount
the fair values of financial assets and liabilities,
together with the carrying amount shown in
the balance sheet, are as follows:
Interest bearing borrowings other liabilities at amortised cost (16 010 028) (16 253 318) (11 948 327) (11 960 899)
Derivative financial instruments – liabilities Held for trading (103 326) (103 326 ) – –
Cash and cash equivalents Loans and receivables 433 997 433 997 989 344 989 344
trade and other receivables Loans and receivables 450 959 450 959 340 540 340 540
trade payables and accruals other liabilities at amortised cost (1 694 878) (1 694 878) (2 044 180) (2 044 180)
COMPANY
31 March 2010 31 March 2009
Carrying Fair Carrying Fair
amount value amount value
Classification R’000 R’000 R’000 R’000
Interest bearing borrowings other liabilities at amortised cost (15 332 846) (15 563 514) (11 271 295) (11 291 355)
Derivative financial instruments – liabilities Held for trading (103 326) (103 326) – –
Cash and cash equivalents Loans and receivables 350 616 350 616 828 029 828 029
trade and other receivables Loans and receivables 462 148 462 148 343 456 343 456
trade payables and accruals other liabilities at amortised cost (1 682 238) (1 682 238) (1 996 395) (1 996 395)
the basis for determining the fair values is disclosed in note 4.
Fair value hierarchy
the table below analyses financial instruments carried at fair value, by valuation method. the different levels have been defined as follows:
GROUP
Level 1 Level 2 Level 3 total
31 March 2010
Derivative financial instruments liabilities – 103 326 – 103 326
31 March 2009
Derivative financial instruments liabilities – – – –
COMPANY
Level 1 Level 2 Level 3 total
31 March 2010
Derivative financial instruments liabilities – 103 326 – 103 326
31 March 2009
Derivative financial instruments liabilities – – – –
Level 1: quoted prices (unadjusted) in active markets for identical assets or liabilities
Level 2: inputs other than quoted prices included within Level 1 that are observable for the asset or liability, either directly (i.e. as prices) or indirectly
(i.e. derived from prices)
Level 3: inputs for the asset or liability that are not based on observable market data (unobservable inputs)

127
NOTES TO THE FINANCIAL STATEMENTS (continued)for the year ended 31 March 2010
40 CoNtINGeNt LIABILItIes
there were no material contingent liabilities at year-end.
41 eVeNts AFteR BALANCe sHeet DAte
there were no adjusting events after balance sheet date.
42 seGMeNt INFoRMAtIoN
the Group’s reported operating segments are based on reports reviewed by the executive Committee to make strategic decisions. the reportable
segments offer the same services, except for the Corporate Division, and are managed separately because they require different marketing
strategies.
Information regarding the operations of each reportable segment is included below. the executive Committee assesses the performance of the
operating segments as a measure of earnings before interest, taxation, depreciation and amortisation expense (eBItDA). Interest income and
expenditure are not allocated to operating segments as it is driven largely by the Corporate Division, which manages the cash requirements of the
Company.
sales between operating segments are carried out at arm’s-length. the revenue from external parties reported to the executive Committee is
measured in a manner consistent with that in the income statement.
2010 2009
R’000 R’000
A reconciliation of EBITDA to profit before tax is provided as follows:
eBItDA for reportable segments and other segments 2 672 775 1 744 410
Depreciation and amortisation expense (1 077 449) (748 939)
Fair value (loss)/gain on investment property (62 685) 1 144
share of profit of equity accounted associate 135 832 16 097
Net finance expense (673 435) (379 401)
Profit before tax 995 038 633 310
Reportable segment assets are reconciled to total assets as follows:
segment assets for reportable segments 25 439 068 20 938 126
other segment assets 2 452 110 2 659 986
27 891 178 23 598 112
Reportable segment liabilities are reconciled to total liabilities as follows:
segment liabilities for reportable segments 19 274 733 16 807 986
other segment liabilities and eliminations (17 221 891) (14 034 122)
Unallocated
Deferred tax 749 849 775 234
Derivative financial instruments – non-current 46 945 –
Derivative financial instruments – current 56 381 –
Income tax liabilities 1 001 20 037
Interest bearing liabilities – non-current 14 704 336 9 114 726
Interest bearing liabilities – current 1 305 692 2 833 601
18 917 046 15 517 462

128
NOTES TO THE FINANCIAL STATEMENTS (continued)for the year ended 31 March 2010
42 seGMeNt INFoRMAtIoN (continued)
Revenue, other operating income, expenses and operating profit
o.R. tambo Cape town Durban Port east Bloem– Corporate
International International International elizabeth London George fontein Kimberley Upington and other total
R’000 R’000 R’000 R’000 R’000 R’000 R’000 R’000 R’000 R’000 R’000
2010
Aeronautical 1 110 651 339 036 146 734 44 415 22 548 16 977 13 941 4 635 2 906 530 1 702 373
Non-aeronautical – – – – – – – – – – –
– Retail 843 839 225 346 95 992 24 339 11 242 11 169 7 556 3 450 1 505 239 1 224 677
– Property 232 632 82 569 31 688 10 725 2 709 1 977 1 773 862 2 001 44 108 411 044
other 53 036 21 121 8 844 4 062 1 561 1 816 893 412 1 007 99 980 192 732
total external revenue 2 240 158 668 072 283 258 83 541 38 060 31 939 24 163 9 359 7 419 144 857 3 530 826
eBItDA 1 605 581 396 401 932 901 39 485 13 531 7 295 2 752 (2 574) (1 769) (320 828) 2 672 775
Depreciation and amortisation 651 600 166 752 130 074 27 463 11 624 14 319 22 234 7 678 6 779 38 926 1 077 449
Interest income 1 420 1 686 668 – – – – – – 58 857 59 631
Interest expense – – – – – – – – – 1 420 832 1 420 832
Reportable total assets 9 758 892 4 474 338 9 018 788 579 550 462 474 264 419 487 035 244 694 148 878 2 452 110 27 891 178
Capital work in progress 994 443 503 996 8 067 295 44 423 192 803 28 043 11 108 21 299 5 749 140 651 10 009 810
Capital expenditure 1 150 939 922 863 3 000 838 21 369 50 880 18 775 – 11 560 34 449 28 941 5 240 614
Reportable total liabilities 6 272 226 3 539 101 7 870 894 356 388 336 869 194 017 395 965 166 903 142 371 (17 221 891) 2 052 843
2009
Aeronautical 946 885 292 674 117 447 39 747 19 570 16 321 12 050 4 523 2 346 504 1 452 067
Non-aeronautical – – – – – – – – – – –
– Retail 770 873 210 041 88 256 21 839 11 523 9 570 5 730 3 513 1 649 218 1 123 212
– Property 205 329 73 920 29 853 11 204 1 964 2 397 1 203 898 1 087 39 154 367 009
other 44 617 18 697 7 891 2 339 1 402 1 652 776 517 869 145 034 223 794
total external revenue 1 967 704 595 332 243 447 75 129 34 459 29 940 19 759 9 451 5 951 184 910 3 166 082
eBItDA 1 462 450 360 624 117 758 36 514 15 057 9 852 1 195 945 (2 005) (257 980) 1 744 410
Depreciation and amortisation 378 357 125 482 111 403 22 664 11 649 14 215 11 955 7 577 3 974 61 663 748 939
Interest income 195 4 – – – – – – – 28 375 28 574
Interest expense – – – – – – – – – 975 705 975 705
Reportable total assets 9 190 729 3 597 364 6 017 049 576 844 420 080 260 051 514 306 233 344 128 359 2 659 986 23 598 112
Capital work in progress 1 350 061 1 646 207 4 767 215 110 392 110 103 16 595 79 677 6 285 13 434 89 291 8 189 260
Capital expenditure 1 819 377 1 055 362 2 427 890 89 026 91 362 12 115 152 212 6 155 57 747 285 691 5 996 937
Reportable total liabilities 6 667 403 2 906 118 5 660 037 387 709 307 909 194 091 414 768 153 460 116 491 (14 034 122) 2 773 864

129
STATISTICAL REVIEWfor the year ended 31 March 2010
2010 2009 2008 2007 2006
R’000 R’000 R’000 R’000 R’000
Operations
Aeronautical revenue 1 702 372 1 452 067 1 368 258 1 375 495 1 190 203
Non-Aeronautical revenue 1 828 453 1 714 015 1 429 091 1 188 776 984 642
Revenue 3 530 825 3 166 082 2 797 349 2 564 271 2 174 845
eBItDA 2 672 775 1 744 410 1 624 701 1 641 223 1 360 884
operating profit 1 595 326 995 471 1 052 893 1 182 172 979 179
Profit before tax 995 038 633 310 1 113 119 1 142 750 929 936
Profit for the year 900 786 443 897 788 934 663 643 620 989
Depreciation and amortisation (1 077 449) (748 939) (571 808) (459 051) (381 705)
Dividends paid – – (135 890) (1 197 546) (291 482)
Capital expenditure (5 240 614) (5 996 937) (5 171 839) (1 642 259) (1 259 355)
Financial Position
Capital and reserves 8 968 132 8 074 650 7 364 044 6 707 924 6 215 521
Non current liabilities excluding deferred tax 14 935 849 9 204 201 3 047 356 2 112 639 116 163
Deferred tax 749 849 775 234 746 804 742 801 679 751
Debentures 6 000 6 000 6 000 6 000 6 000
Minority interest – – – – 35
24 659 830 18 060 085 311 164 204 39 569 364 7 017 470
Property, plant and equipment, investment
property and intangible assets 25 812 860 21 064 552 15 315 429 10 286 873 7 965 865
Investment in joint ventures – – – 2 104
Investment in associates 661 327 459 978 65 194 42 801 –
Goodwill – – – – –
Non-current receivables 113 725 116 511 32 716 – –
Current assets 1 303 266 1 957 071 1 100 717 2 444 853 1 871 783
total assets 27 891 178 23 598 112 16 514 056 12 774 527 9 839 752
Current liabilities (3 231 348) (5 538 027) (5 349 851) (3 205 163) (2 824 579)
24 659 830 18 060 085 11 164 205 9 569 364 7 015 173
Cash flow
Net cash available/(utilsed in) operating activities 1 168 094 1 579 105 975 428 (434 034) 1 024 018
Cash utilised in investing activities (4 330 247) (5 950 526) (5 162 098) (1 657 741) (1 260 670)
Net cash generated by financing activities 2 600 731 5 237 261 2 361 969 (19 005) 1 507 675
Net cash (outflow)/inflow (555 347) 877 309 (1 824 701) (2 110 780) 1 271 023
Profitability
earnings per share(cents) 182,33 89,85 159,69 134,33 125,01
Dividends per share(cents) – – 27,21 242,20 58,37
Productivity
Number of employees 2 225 2 232 2 116 1 886 1 832
Revenue per employee (sAR) 1 586 888 1 418 496 1 321 999 1 359 635 1 187 142
operating profit per employee (sAR) 717 001 445 999 497 586 626 814 534 486
Departing passengers per employee 7 549 7 525 8 601 8 728 8 110
Cost to Income 55% 69% 62% 54% 55%
The supplementary information presented on pages 129 to 131 does not form part of the financial statements and is unaudited.
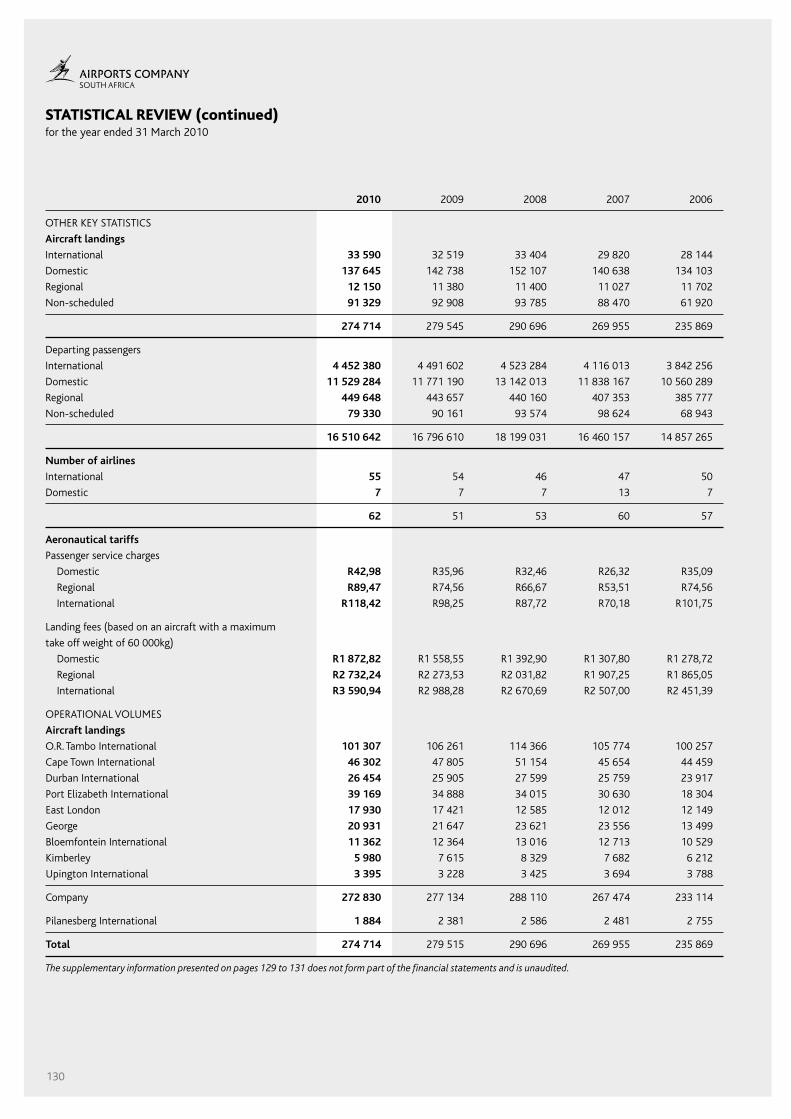
130
STATISTICAL REVIEW (continued)for the year ended 31 March 2010
2010 2009 2008 2007 2006
otHeR KeY stAtIstICs
Aircraft landings
International 33 590 32 519 33 404 29 820 28 144
Domestic 137 645 142 738 152 107 140 638 134 103
Regional 12 150 11 380 11 400 11 027 11 702
Non-scheduled 91 329 92 908 93 785 88 470 61 920
274 714 279 545 290 696 269 955 235 869
Departing passengers
International 4 452 380 4 491 602 4 523 284 4 116 013 3 842 256
Domestic 11 529 284 11 771 190 13 142 013 11 838 167 10 560 289
Regional 449 648 443 657 440 160 407 353 385 777
Non-scheduled 79 330 90 161 93 574 98 624 68 943
16 510 642 16 796 610 18 199 031 16 460 157 14 857 265
Number of airlines
International 55 54 46 47 50
Domestic 7 7 7 13 7
62 51 53 60 57
Aeronautical tariffs
Passenger service charges
Domestic R42,98 R35,96 R32,46 R26,32 R35,09
Regional R89,47 R74,56 R66,67 R53,51 R74,56
International R118,42 R98,25 R87,72 R70,18 R101,75
Landing fees (based on an aircraft with a maximum
take off weight of 60 000kg)
Domestic R1 872,82 R1 558,55 R1 392,90 R1 307,80 R1 278,72
Regional R2 732,24 R2 273,53 R2 031,82 R1 907,25 R1 865,05
International R3 590,94 R2 988,28 R2 670,69 R2 507,00 R2 451,39
oPeRAtIoNAL VoLUMes
Aircraft landings
o.R. tambo International 101 307 106 261 114 366 105 774 100 257
Cape town International 46 302 47 805 51 154 45 654 44 459
Durban International 26 454 25 905 27 599 25 759 23 917
Port elizabeth International 39 169 34 888 34 015 30 630 18 304
east London 17 930 17 421 12 585 12 012 12 149
George 20 931 21 647 23 621 23 556 13 499
Bloemfontein International 11 362 12 364 13 016 12 713 10 529
Kimberley 5 980 7 615 8 329 7 682 6 212
Upington International 3 395 3 228 3 425 3 694 3 788
Company 272 830 277 134 288 110 267 474 233 114
Pilanesberg International 1 884 2 381 2 586 2 481 2 755
Total 274 714 279 515 290 696 269 955 235 869
The supplementary information presented on pages 129 to 131 does not form part of the financial statements and is unaudited.

131
STATISTICAL REVIEW (continued)for the year ended 31 March 2010
2010 2009 2008 2007 2006
oPeRAtIoNAL VoLUMes (continued)
Departing passengers (‘000)
o.R. tambo International 8 819 9 045 9 772 8 911 8 099
Cape town International 3 912 3 917 4 235 3 768 3 433
Durban International 2 208 2 164 2 412 2 136 1 860
Port elizabeth International 676 705 760 724 656
east London 337 347 372 349 299
George 270 303 337 300 299
Bloemfontein International 199 205 207 181 128
Kimberley 66 76 75 66 58
Upington International 21 24 24 20 16
Company 16 508 16 786 18 194 16 455 14 848
Pilanesberg International 3 4 5 5 9
total 16 511 16 790 18 199 16 460 14 857
Staff
o.R. tambo International 986 1 031 1 010 906 894
Cape town International 442 460 432 332 331
Durban International 292 247 231 241 210
Port elizabeth International 100 99 86 82 84
east London 59 54 52 48 50
George 63 59 55 55 52
Bloemfontein International 69 67 66 59 54
Kimberley 31 33 31 35 34
Upington International 13 14 13 12 9
Corporate office 158 157 129 104 99
Regional office – – – – –
Company 2 213 2 221 2 105 1 874 1 817
Pilanesberg International 12 11 11 12 15
total 2 225 2 232 2 116 1 886 1 832
The supplementary information presented on pages 129 to 131 does not form part of the financial statements and is unaudited.

132
2010 FIFA WORLD CUP ExPENDITUREfor the year ended 31 March 2010
2009/2010 2008/2009
Quantity R’000 R’000
Tickets acquired 150 3 315 –
Distribution of tickets
Clients/stakeholders 115 2 542
Accounting authority
executive 1 22
Non-executive 5 111
Accounting officer
senior management 14 309
other employees 11 243
Family members of officials
other government entities
Audit committee members
other
Four tickets for a staff competition to subtitute for ‘no shows’ 4 88
Total 150 3 315 –
Travel costs
Clients/stakeholders
Accounting authority
executive
Non-executive
Accounting officer
senior management
other employees
Family members of officials
other government entities
Audit committee members
other
– –
Purchase of other World Cup apparel
specify the nature of the purchase (e.g. t-shirts, caps etc.) – –
Total World Cup expenditure 3 315 –

133
2010 FIFA WORLD CUP ExPENDITURE (continued)
2010/2011 2009/2010
Quantity R’000 R’000
Tickets acquired after year-end 31 March 2010 20 1 212 3 315
Distribution of tickets (acquired after year-end)
Clients/stakeholders 15 909 2 542
Accounting authority
executive 22
Non-executive 1 61 111
Accounting officer
senior management 4 242 309
other employees 243
Family members of officials
other government entities
Audit committee members
other
Four tickets for a staff competition to subtitute for ‘no shows’ 88
Total 20 1 212 3 315
Travel costs
Clients/stakeholders
Accounting authority
executive 8
Non-executive
Accounting officer
senior management 36
other employees 21
Family members of officials
other government entities
Audit committee members
other
Bus 193
258 –
Purchase of other World Cup apparel
specify the nature of the purchase (e.g. t-shirts, caps etc.)
sA scarves & beanies 100 22
Fleece gloves 100 4
Rainbow nation vuvuzelas 100 14
Rainbow nation sockzelas 30 4
2010 FIFA World Cup knitted scarves 30 7
Rainbow nation vuvuzela 40 2
Fleece blanket 40 4
440 57
Total World Cup expenditure 1 527 3 315

134
NOTICE OF ANNUAL GENERAL MEETING
NOTICE IS HEREBY GIVEN that the seventeenth Annual General Meeting of members of Airports Company south Africa Limited will be held in the
ACsA BoARDRooM, tHe MAPLes, RIVeRWooDs oFFICe PARK, 24 JoHNsoN RoAD, BeDFoRDVIeW on 9 september 2010 at 10h00 for the following
purposes:
1. to consider and adopt the Group Annual Financial statements for the year ended 31 March 2010. Refer to pages 76 to 128 of the Annual Report.
2. to consider and approve the remuneration of the Auditors for audit services provided for the year ended 31 March 2010. Refer to page 116 of the
Annual Report.
3. to consider the appointment of Auditors for the ensuing year.
4. to consider and approve the remuneration of the Directors as recommended by the Directors Affairs Committee and as contained in the Annual
Financial statements for the year ended 31 March 2010. Refer to page 119 of the Annual Report.
5. to consider and approve the remuneration of the Directors as recommended by the Directors Affairs Committee for the year ending 31 March 2011.
6. to note that the Directors have recommended that no dividend be declared by the Company in respect of the year ended 31 March 2010.
7. to approve the Retirement/election of Directors.
By order of the Board
NG Camhee
Company secretary
Bedfordview
10 August 2010
REGISTERED OFFICE:
Airports Company south Africa Limited
the Maples, Riverwoods office Park
24 Johnson Road
BeDFoRDVIeW
2008
Note:
shareholders entitled to attend and vote at the meeting are entitled to appoint one or more proxies to attend, speak and, on a poll, vote in their stead.
A proxy need not be a member of the Company.

135
FORM OF PROxYfor the year ended 31 March 2010
I/We
(PLeAse PRINt NAMe)
of
Appoint (see Note 1)
1. or failing him/her
2. or failing him/her
3. the Chairman of the meeting, as my/our proxy to act for me/us at the Seventeenth Annual General Meeting of members, which will be held in the
Boardroom of Airports Company South Africa, The Maples, Riverwoods, 24 Johnson Road Bedfordview, on 9 September 2010 at 10h00 for
the purpose of considering and, if deemed fit, passing, with or without modification, the resolutions arising from the matters on the agenda and to
vote for and/or against the resolutions and/or abstain from voting in respect of the shares in the issued share capital of the Company registered in
my/our name (see Note 2).
NUMBER OF VOTES
Resolution Motion For Against Abstain
1. Adoption of Group Annual Financial statements for the year ending 31 March 2010
2. Approval of remuneration of the Auditors for the year ended 31 March 2010
3. to consider the appointment of Auditors for the ensuing year
4. Approval of remuneration of Directors for the year ended 31 March 2010
5. Approval of remuneration of Directors for the year ending 31 March 2011
6. Approval of non-payment of dividends for the year ended 31 March 2010
7. election of Directors
signed at on this day of 2010.
Member of his/her authorised representative
Assisted by me (where applicable)
shareholders entitled to attend and vote at the meeting are entitled to appoint one or more proxies to attend, speak and, on a poll, vote in their stead.
A proxy need not be a member of the Company.
136
NOTES
1. A shareholder may insert the name of a proxy or the names of two alternative proxies of the shareholder’s choice in the space provided, with or
without deleting ‘the Chairman of the meeting’. Any such deletion must be initialled by the shareholder. the person whose name appears first on
the form of proxy and has not been deleted will be entitled to act as proxy to the exclusion of those whose names follow.
2. A shareholder’s instructions to the proxy must be indicated by the insertion of the relevant number of votes exercisable by the shareholder in
the appropriate space provided. Failure to comply with the above will be deemed to authorise the proxy to vote or to abstain from voting at the
meeting as he deems fit in respect of all the shareholder’s votes exercisable thereat, but, where the proxy is the Chairman, failure to so comply will
be deemed to authorise the proxy to vote in favour of the resolution. A shareholder or his proxy is not obliged to use all the votes exercisable by
the shareholder or by his proxy, but the total of the votes cast and in respect whereof abstention is recorded may not exceed the total of the votes
exercisable by the shareholder or by his proxy.
3. Forms of proxy must be lodged at the Company’s registered office to:
The Company Secretary
Airports Company South Africa Limited
The Maples
Riverwoods Office Park
24 Johnson Road
Bedfordview
oR
Posted to the Company to:
The Company Secretary
Airports Company South Africa Limited
P O Box 75480
Gardenview
2047
oR
Faxed to the Company to:
The Company Secretary
086 668 6910
to reach the Company by not later than 24 hours before the commencement of the meeting.
4. the completion and lodging of this form of proxy will not preclude the relevant shareholder from attending the meeting and speaking and voting
in person thereat to the exclusion of any proxy appointed in terms hereof, should such shareholder wish to do so.
5. Documentary evidence establishing the authority of a person signing this form of proxy in a representative capacity must be attached to this form
of proxy unless previously recorded by the Company’s transfer secretaries.
6. the Chairman of the meeting may reject or accept any proxy form that is completed and/or received other than in accordance with these notes.

ADMINISTRATION
AIRPORTS COMPANY SOUTH AFRICA LIMITED
Reg No 1993/004149/06
REGISTERED OFFICE
24 Johnson Road
Riverwoods Office Park
Bedfordview
2008
POSTAL ADDRESS
P O Box 75480
Gardenview
2047
BOARD OF DIRECTORS
Dr FA Sonn, Chairman (retired 21 September 2009)
SV Zilwa, Chairman (appointed 21 September 2009)
NP Galeni
MW Hlahla*
A Kekana
BP Mabelane*
R Persad
M Ramagaga
NTY Siwendu
WC van der Vent
COMPANY SECRETARY
NG Camhee
Independent External Auditors
Ngubane & Co Inc PricewaterhouseCoopers Inc
Director: T Nkomozephi Director: N Ayob
Registered Auditor Registered Auditor
Midrand Pretoria
* Executive Director
COMMITTEES
Audit Committee
NP Galeni (Chairman)
NTY Siwendu
M Ramagaga
Human Resources and Remuneration Committee
R Persad (Chairman)
SV Zilwa
WC van der Vent
Operational Risk Management Committee
NTY Siwendu (Chairman)
SV Zilwa
R Persad
A Kekana
Dr C Smith (co-opted member)
Commercial Board Committee
WC van der Vent (Chairman)
NTY Siwendu
M Ramagaga
Directors Affairs Committee
SV Zilwa (Chairman)
NTY Siwendu
NP Galeni
Treasury and Economic Regulation Committee
NP Galeni (Chairman)
M Ramagaga
A Kekana
M Janse van Rensburg (co-opted)
