statement on possible public health risks for infants and young children … nitrates.pdf ·...
TRANSCRIPT

EFSA Journal 2010;8(12):1935
Suggested citation: EFSA Panel on Contaminants in the Food Chain (CONTAM); Scientific Opinion on possible health risks for infants and young children from the presence of nitrates in leafy vegetables. EFSA Journal 2010;8(12):1935. [42 pp.] doi:10.2903/j.efsa.2010.1935. Available online: www.efsa.europa.eu/efsajournal.htm
1 © European Food Safety Authority, 2010
SCIENTIFIC OPINION
Statement on possible public health risks for infants and young children from the presence of nitrates in leafy vegetables1
EFSA Panel on Contaminants in the Food Chain (CONTAM)2, 3
European Food Safety Authority (EFSA), Parma, Italy
ABSTRACT Nitrate is a naturally occurring compound present in vegetables, the consumption of which can contribute significantly to nitrate dietary exposure. The European Food Safety Authority Panel on Contaminants in the Food Chain (CONTAM Panel) issued an opinion on ‘Nitrate in vegetables’ in 2008. The European Commission subsequently requested more information on potential acute effects of nitrate exposure in infants and young children consuming lettuce or spinach, taking into account the possibility of establishment of slightly higher maximum levels as an alternative to local derogations. For infants, cooked spinach is more likely to be a component of the diet than lettuce. Nitrate exposure at the current or proposed maximum levels for nitrate in spinach cooked from fresh is unlikely to be a health concern, although a risk for some infants eating more than one spinach meal in a day cannot be excluded. For children, the CONTAM Panel concluded that levels of nitrate in lettuce are not a health concern. However the concentrations of nitrate in spinach have the potential to increase dietary nitrate exposure to levels at which a health concern can not be excluded for some young children. Enforcing the current maximum levels for nitrate in lettuce and spinach, or proposed maximum levels at 500 mg/kg higher than the current maximum levels, would have a minor impact compared to the situation of local derogations from the maximum levels, because only about 1 % of lettuce samples and 5 % of spinach samples exceeded the respective current maximum levels. Inappropriate storage of cooked vegetables can result in in situ conversion of nitrate to nitrite, resulting in an increased potential for causing methaemoglobinaemia. The CONTAM Panel noted that infants and children with bacterial infections of the gastrointestinal tract are more sensitive to nitrate, and recommended against feeding spinach to such children.
© European Food Safety Authority, 2010
KEY WORDS Nitrate, risk assessment, leafy vegetables, spinach, lettuce, children, human health
1 On request from the European Commission, Question No EFSA-Q-2010-01037, adopted on 1 December 2010. 2 Panel members: Jan Alexander, Diane Benford, Alan Raymond Boobis, Sandra Ceccatelli, Jean-Pierre Cravedi,
Alessandro Di Domenico, Daniel Doerge, Eugenia Dogliotti, Lutz Edler, Peter Farmer, Metka Filipič, Johanna Fink-Gremmels, Peter Fürst, Thierry Guérin, Helle Katrine Knutsen, Miroslav Machala, Antonio Mutti, Josef Rudolf Schlatter and Rolaf van Leeuwen. Correspondence: [email protected]
3 Acknowledgement: The Panel wishes to thank the members of the Working Group on Working Group on nitrate in vegetables – children: Diane Benford and Andrew Cockburn for the preparatory work on this scientific opinion, and EFSA staff: Jean Lou Dorne and Stefan Fabiansson for the support provided to this scientific opinion.

Nitrate in vegetables - children
2 EFSA Journal 2010;8(12):1935
SUMMARY Nitrate is a naturally occurring compound present in vegetables, the consumption of which can contribute significantly to nitrate dietary exposure. Some vegetables, particularly leafy vegetables such as lettuce and spinach, have been shown to have relatively high levels of nitrate which are increased when grown under cover (e.g. in glass houses) and/or in conditions of reduced lighting. The European Commission, in considering options for a longer-term strategy to manage any risks from dietary nitrate exposure, used the scientific basis provided by the opinion of the European Food Safety Authority (EFSA) on ‘Nitrate in vegetables’ issued by the Panel on Contaminants in the Food Chain (CONTAM Panel) in 2008. As part of the process, more information was requested on potential acute health effects of nitrate exposure in infants and young children consuming lettuce or spinach taking into account the possibility of establishment of slightly higher maximum levels as an alternative to local derogations.
The CONTAM Panel considered the results of approximately 45,000 analytical results for nitrate in vegetables, including 3,733 results submitted to EFSA since the 2008 opinion, together with new data on children’s food consumption from 13 EU countries. Almost all children consumed fruit and vegetables during the survey periods, although not every day. Fruit consumption comprised 60 % of the combined amount leaving median vegetable consumption at 61 g per day with 95th percentile consumption at 207 g per day. Consumption varied with age in that younger children consumed relatively more spinach and older children more lettuce. Lettuce comprised on average 3.7 % of the vegetables consumed and spinach 2.6 %. The highest nitrate levels were recorded in lettuce. The median nitrate concentration in food other than vegetables was estimated from information in the literature with a major contribution typically from water.
Estimates of chronic exposure to nitrate of children aged 1-18 years, including nitrate from lettuce and spinach, were below or in the region of the Acceptable Daily Intake (ADI) for nitrate of 3.7 mg/kg body weight (b.w.), consistent with the results of the 2008 opinion.
As some estimates of chronic nitrate exposure were in the region of the ADI, it is to be expected that acute exposure will exceed the ADI on some instances Occasionally exceeding the ADI does not per se indicate a health risk, since the ADI for nitrate was derived from subchronic and chronic studies. Since nitrate, after reduction to nitrite, has the potential to cause methaemoglobinaemia, which can occur after a single exposure, it would be appropriate to establish an Acute Reference Dose (ARfD) in order to assess the safety of acute exposure to nitrate. The available data from studies in animals and reports of human nitrate poisoning did not provide an adequate basis for establishing an ARfD. However, the available data indicate that methaemoglobin (MetHb) is not elevated in children or infants above 3 months old when exposure to nitrate from drinking water or from vegetables is below at least 15 mg/kg b.w. per day.
For infants, cooked spinach is more likely to be a component of the diet than lettuce. Potential nitrate exposure was estimated based on a scenario of spinach cooked from fresh in one composite meal, with nitrate concentrations representing the median of the available occurrence data, the current maximum level for spinach, and the proposed higher maximum level. Nitrate exposure of infants at the median of the available occurrence data for nitrate in spinach is at or below the ADI and clearly not a health concern. Nitrate exposure at the current and proposed maximum levels would result in exposure up to approximately 15 mg/kg per day without taking into account other sources of exposure. Taking into account that the available data on nitrate exposure associated with elevated MetHb (> 15 mg/kg b.w.), such an exposure is unlikely to be of health concern. However, there could be a risk for some infants consuming more than one spinach meal in a day. Modelling using all of the available occurrence data indicated that 8.3 % of infants might exceed 15 mg/kg b.w. on consumption days of spinach and this proportion would be reduced to 5.6 % if the current maximum level of 3,000 mg/kg spinach is enforced, and to 6.4 % if a maximum level of 3,500 mg/kg is enforced.

Nitrate in vegetables - children
3 EFSA Journal 2010;8(12):1935
For lettuce, estimated total dietary exposures to nitrate of children aged 1-18 years ranged from below the ADI at median consumption to approximately 15 mg/kg b.w. at high level consumption and high level occurrence. Again these estimated exposures are not likely to be of health concern. Modelling using all the available occurrence data indicated that dietary exposure of 0.21 % of child consumers of lettuce might exceed 15 mg/kg b.w. on an individual day. Strictly enforcing the current highest maximum level of 4,500 mg/kg had the potential to decrease this percentage to 0.11 %, or to 0.13 % at a maximum level of 5,000 mg/kg. The numbers of children exceeding these exposures would be lower when applying the current and proposed maximum levels for lettuce harvested in the summer. Overall, the CONTAM Panel concluded that levels of nitrate in lettuce are not a health concern.
For spinach, based on median consumption and median concentration of nitrate in spinach the estimated exposure is slightly above the ADI for nitrate. Exposure estimates, based on high level consumption of spinach combined with high level occurrence data, are up to approximately three-fold higher than 15 mg/kg in children aged 1-3 years and the possibility of a risk for some young children cannot be excluded. It was estimated that 3.0 % might exceed 15 mg/kg b.w. on an individual day. Strictly enforcing the current maximum level of 3,000 mg/kg has the potential to decrease these percentages to 2.2 %, or to 2.3 % at a maximum level 3,500 mg. The prediction for spinach is an overestimation since there is a lower current maximum level for spinach other than fresh, but available consumption information could not differentiate between consumption of spinach purchased as preserved or frozen, and that cooked from fresh at home.
Overall the CONTAM Panel concluded that the concentrations of nitrate in spinach have the potential to increase dietary nitrate exposure to levels at which a health concern cannot be excluded. Enforcing the current maximum levels for nitrate in lettuce and spinach, or proposed maximum levels at 500 mg/kg higher than the current maximum levels, would have a minor impact compared to the situation of local derogations from the maximum levels, because only about 1 % of lettuce samples and 5 % of spinach samples exceeded the respective current maximum levels.
Inappropriate storage of cooked vegetables can result in in situ conversion of nitrate to nitrite, leading to an increased potential for causing methaemoglobinaemia. The CONTAM Panel noted that infants and children with bacterial infections of the gastrointestinal tract are more sensitive to nitrate, and recommended against feeding spinach to such children.

Nitrate in vegetables - children
4 EFSA Journal 2010;8(12):1935
TABLE OF CONTENTS Abstract .................................................................................................................................................... 1 Summary .................................................................................................................................................. 2 Table of contents ...................................................................................................................................... 4 Background as provided by the European Commission ........................................................................... 5 Terms of reference as provided by the European Commission ................................................................ 7 Evaluation ................................................................................................................................................. 8 1. Introduction ..................................................................................................................................... 8 2. Legislation ....................................................................................................................................... 9 3. Occurrence ....................................................................................................................................... 9
3.1. Occurrence results ................................................................................................................. 10 4. Consumption .................................................................................................................................. 11
4.1. Consumption results .............................................................................................................. 12 5. Dietary Exposure ........................................................................................................................... 16
5.1. Calculating exposure ............................................................................................................. 16 5.1.1. Chronic nitrate exposure ................................................................................................... 16 5.1.2. Acute nitrate exposure ...................................................................................................... 18 5.1.3. Calculating the probability of exceeding specific levels .................................................. 23
5.2. Summary of exposure ........................................................................................................... 24 6. Hazard identification and characterisation .................................................................................... 26
6.1. Acute toxicity of nitrate ........................................................................................................ 26 6.2. MetHb in humans .................................................................................................................. 26 6.3. Evidence of MetHb formation in infants and children.......................................................... 27
6.3.1. MetHb formation from consumption of vegetables .......................................................... 27 6.3.2. MetHb formation from exposure to nitrate via consumption of water ............................. 29
6.4. Possibilities for establishing an Acute Reference Dose (ARfD) ........................................... 31 7. Risk characterisation ...................................................................................................................... 31 8. Uncertainty .................................................................................................................................... 33
8.1. Assessment objectives ........................................................................................................... 33 8.2. Exposure scenarios/Exposure model .................................................................................... 34 8.3. Model input (parameters) ...................................................................................................... 34 8.4. Summary of uncertainties ..................................................................................................... 34
Conclusions and recommendations ........................................................................................................ 35 References .............................................................................................................................................. 37 Abbreviations ......................................................................................................................................... 42

Nitrate in vegetables - children
5 EFSA Journal 2010;8(12):1935
BACKGROUND AS PROVIDED BY THE EUROPEAN COMMISSION Maximum levels for nitrate in lettuce and spinach are established by Commission Regulation (EC) 1881/2006 of 19 December 2006 setting maximum levels for certain contaminants in foodstuffs.4 These levels are regularly reviewed using monitoring data from the Member States. In some cases, despite developments in good agricultural practice, compliance with the maximum levels cannot be achieved, particularly for fresh spinach.
To provide an up-to-date scientific basis for the longer-term strategy for managing the risk from nitrate in vegetables, the European Commission requested in July 2006 a scientific risk assessment from the European Food Safety Authority (EFSA) It was requested that the assessment should take into account the amounts of nitrate found in vegetables as consumed and any relevant considerations on the possible balance between risks and beneficial health effects any relevant considerations on risks and benefits.
THE OPINION OF THE PANEL ON CONTAMINANTS IN FOOD CHAIN ON A REQUEST FROM THE COMMISSION RELATED TO NITRATE IN VEGETABLES.
The Panel on Contaminants in the Food Chain adopted on 10 April 2008 a scientific opinion on nitrates in vegetables.5
The Panel compared the risk and benefits of exposure to nitrate from vegetables. The Panel concluded that overall, the estimated exposures to nitrate from vegetables are unlikely to result in appreciable health risks, therefore the recognised beneficial effects of consumption of vegetables prevail. The Panel recognised that there are occasional circumstances e.g. unfavourable local/home production conditions for vegetables which constitute a large part of the diet, or individuals with a diet high in vegetables which need to be assessed on a case by case basis.
DISCUSSIONS TO MODIFY EXISTING LEGISLATION ON NITRATES IN VEGETABLES TAKING INTO ACCOUNT THE OUTCOME OF EFSA'S RISK ASSESSMENT
In order to take into account the unfavourable production conditions in some regions in the EU during some periods of the year (unfavourable light conditions) and based on the conclusions of the risk assessment, slightly higher maximum levels are discussed in fresh spinach and lettuce as an alternative to the possibility for derogation.
Some concerns were expressed for the health of infants and young children following the consumption of vegetables with high nitrate content, in particular related to the acute intake of nitrates if the maximum levels of nitrates were to be slightly increased for fresh spinach and lettuce.
4 OJ L 364, 20.12.2006, p. 5. 5 Opinion of the Scientific Panel on Contaminants in the Food chain on a request from the European Commission to perform
a scientific risk assessment on nitrate in vegetables, The EFSA Journal, 689, 1-79, http://www.efsa.europa.eu/en/scdocs/doc/689.pdf

Nitrate in vegetables - children
6 EFSA Journal 2010;8(12):1935
Table 1: The current maximum levels for nitrates are given in the table hereafter.
Foodstuffs Maximum levels (mg NO3/kg)
1. Fresh spinach (Spinacia oleracea) Harvested 1 October to 31 March Harvested 1 April to 30 September
3000 2500
2. Preserved, deep-frozen or frozen spinach 2000 3. Fresh lettuce (Lactuca sativa L.) (protected
and open-grown lettuce) excluding lettuce listed in point 1.4
Harvested 1 October to 31 March: lettuce grown under cover lettuce grown in the open air Harvested 1 April to 30 September: lettuce grown under cover lettuce grown in the open air
4500 4000 3500 2500
4. “Iceberg” type lettuce Lettuce grown under cover Lettuce grown in the open air
2500 2000
5. Processed cereal-based foods and baby foods for infants and young children
200
The possible increased levels under discussion for fresh spinach (Table 1, point 1) are up to 3500 mg/kg nitrate and for fresh lettuce (Table 1, point 3), a possible increase of up to 500 mg/kg nitrate for each category is under discussion. No changes in maximum level are under discussion for preserved or frozen spinach, "Iceberg" type lettuce and processed cereal-based foods and baby foods for infants and young children (Table 1, points 2, 4 and 5). In addition, a maximum level for nitrate in rucola is under discussion.
As regards the exposure of children to nitrates from the consumption of vegetables, the abovementioned scientific opinion mentions that no accurate data are available for children’s fruit and vegetable consumption although it is known that overall they significantly favour the fruit component. Considering that nutritional recommendations are also valid for children, and in the absence of actual data the estimate was made that children could consume half the amount of adults. Thus 200 g of vegetables was considered to be a reasonable figure for children high consumers. Therefore, taking a body weight of 20 kg, the daily nitrate exposure for children would range from 2 to 12 mg/kg b.w. per day under the different scenarios when calculating dietary intakes at half the adult levels and without considering mitigation factors.
Based on an exposure scenario at which the 200 g of vegetables consist of 1/3 spinach as leafy vegetable making use of the median concentration and also taking into account the nitrate exposure from sources other than vegetables, the nitrate exposure was calculated to be at 78 mg/day. In this case, the ADI of 3.7 mg/kg b.w., corresponding to an acceptable nitrate intake of 74 mg/child/day, based on a body weight of 20 kg, would be exceeded by 5 %. This could also increase if the vegetable intake consists mainly of leafy vegetables. Nevertheless, the CONTAM Panel recognises that up to one half of the vegetable allocation is likely to be in the form of fruit, which typically contains low levels of nitrate (normally below 10 mg/kg), and thus for the majority of children the nitrate exposure is likely to be below the ADI.
Some delegations were of the opinion that it would be appropriate if EFSA could assess in more detail the possible risks for infants and young children related to the presence of nitrates in fresh vegetables, also considering the acute dietary intake, taking into account:
- recent occurrence data on the presence of nitrates in vegetables;
- more detailed consumption data of vegetables by infants and young children, if available;

Nitrate in vegetables - children
7 EFSA Journal 2010;8(12):1935
- the possibility of the establishment of slightly higher maximum levels in replacement of local derogations.
TERMS OF REFERENCE AS PROVIDED BY THE EUROPEAN COMMISSION In accordance with Art. 29 (1) (a) of Regulation (EC) No 178/2002 the Commission asks EFSA for a scientific statement as a complement to the scientific opinion on nitrates in vegetables, whereby the possible risks for infants and young children related to the presence of nitrates in fresh vegetables are assessed in more detail, also considering the acute dietary intake, taking into account:
- recent occurrence data on the presence of nitrates in vegetables;
- more detailed consumption data of vegetables by infants and young children, if available;
- the possibility of the establishment of slightly higher maximum levels for nitrates in leafy vegetables in replacement of local derogations.

Nitrate in vegetables - children
8 EFSA Journal 2010;8(12):1935
EVALUATION
1. Introduction
Nitrate is a naturally occurring compound present in vegetables. Some vegetables, particularly leafy vegetables like rucola, lettuce and spinach, have been shown to have relatively high levels of nitrate.
Nitrate per se is relatively non-toxic, but its metabolites, nitrite, nitric oxide and N-nitroso compounds, make nitrate of regulatory importance because of their potentially adverse health implications (EFSA, 2008). Nitrite levels in fresh, undamaged plant tissues are usually very low but are increased during post-harvest storage and wilting processes through reduction of nitrate and decreased water content. This process is accelerated when the produce is pureed (Phillips, 1968; Chung et al., 2004). Spinach has often been seen as one of several major vegetable sources for nitrate in the diet and high levels of nitrite have been found in homemade spinach baby food stored under inappropriate conditions (Filer et al., 1970; Sánchez-Echaniz et al., 2001; Greer and Shannon, 2005).
Nitrate and nitrite have been reviewed on a number of occasions by the Joint FAO/WHO Expert Committee on Food Additives (JECFA) and the Scientific Committee for Food (SCF) in the context of their uses as food additives. The SCF established an Acceptable Daily Intake (ADI) of 0-3.7 mg/kg body weight (b.w.) for nitrate in 1990 (EC, 1992), retained the ADI in 1995 and derived an ADI of 0-0.06 mg/kg for nitrite (EC, 1997). The JECFA completed its most recent review in 2002 and reconfirmed an ADI of 0-3.7 mg/kg b.w. for nitrate and set an ADI of 0-0.07 mg/kg b.w. for nitrite (FAO/WHO, 2003a,b). In its opinion on nitrate in vegetables, the Panel on Contaminants in the Food Chain (CONTAM Panel) concluded that in the absence of significant new toxicological data there was no need to re-consider these ADIs (EFSA, 2008). The CONTAM Panel compared the risks and benefits of exposure to nitrate from vegetables, and concluded that estimated exposures were unlikely to result in appreciable health risks and therefore the recognised beneficial effects of consumption of vegetables prevail. These conclusions were based on comparison of long term estimates of dietary exposure with the ADI for nitrate, which was derived from the no–observed-effect-levels identified in a subchronic study in dogs and chronic studies in rats. Since nitrate has the potential to cause methaemoglobinaemia in sensitive subgroups, and methaemoglobinaemia might occur after a single exposure, it would be appropriate to establish an acute reference dose (ARfD) for nitrate. However, an ARfD has not so far been established.
It is widely reported that infants younger than 4 months of age are especially prone to developing health effects from nitrate exposure, commonly due to formula baby-food diluted with water from rural domestic wells (Dusdieker and Dungy, 1996). At this age infants are not yet weaned and have not normally begun mixed (complementary) feeding, for example the addition of vegetables to the diet. This particular sensitivity of very young infants to nitrate exposure results from a combination of physiological reasons which rapidly reduce in importance after 3 months of age. After birth, a proportion of haemoglobin in young infants is still in the form of fetal haemoglobin. Fetal haemoglobin is more readily oxidised to methaemoglobin (MetHb) by nitrite derived from nitrate than is adult haemoglobin. In addition, NADH-dependent methaemoglobin reductase, the enzyme responsible for reduction of MetHb to normal haemoglobin, has only about half the activity in infants compared with adults (Smith, 1991; ATSDR, 2004). Moreover the relatively high pH of the infant stomach favours the growth of nitrate-reducing bacteria which can lead to gastroenteritis with concomitant increase of nitrite formation. These factors combine to place very young infants at greater risk for MetHb formation (Johnson and Kross, 1990; Zeman et al., 2002). However, as a consequence of milk feeding, and in the absence of any nutritional indication to add complementary foods to the diet of healthy term infants before 4 to 6 months of age (Philipps, 1971; Dusdieker et al., 1994), very young infants (up to 3 months) are not considered to be at significant risk of nitrate intoxication from vegetables. Consequently, this age group is not discussed further in this Statement.

Nitrate in vegetables - children
9 EFSA Journal 2010;8(12):1935
However, in older infants there have been occasional cases of nitrate poisoning from the ingestion of vegetables and baby food (Sinios and Wosak, 1965; Sander and Jacobi, 1967; Ritter and Schulze, 1971; Keating et al., 1973; Faivre et al., 1976; Hack et al., 1983; Sànchez-Echaniz et al., 2001) and this has resulted in the voluntary monitoring of some commercially prepared infant food for nitrate, such as spinach, carrots and squash, by private industry.
The European Commission asked the European Food Safety Authority (EFSA) to assess the possible risks for infants and young children related to the presence of nitrates in fresh vegetables, also considering the acute dietary intake. Therefore the CONTAM Panel has now estimated children’s acute dietary exposure to nitrate, taking into account the concentrations of nitrate reported in vegetables together with data on children’s food consumption that were not available at the time of the previous EFSA opinion, and reviewed the available information of relevance to induction of methaemoglobinaemia in infants and young children following acute exposure to nitrate.
2. Legislation
Commission Regulation (EC) No 1881/20066 of 19 December 2006, setting maximum levels for certain contaminants in food, establishes maximum levels for nitrates in some leafy vegetables and processed cereal-based foods and baby foods for infants and young children (see Table 1, section ‘Background as provided by the European Commission’) The maximum levels have been set taking into account the seasonal variations and the differences due to the production method (open air versus under cover).
Temporary derogation was granted:
- to Belgium, Ireland, the Netherlands and UK for the placing on the market of fresh spinach grown and intended for consumption in their territory with nitrate levels higher than the maximum levels;
- to Ireland, UK and France for the placing on the market of fresh lettuce grown and intended for consumption in their territory with nitrate levels higher than the maximum levels.
3. Occurrence
In 2006, the European Commission asked the EFSA to assess the risks to consumers from nitrate in vegetables. To assist EFSA, in November 2006 the European Commission issued a call to EU Member States for detailed information on nitrate concentrations (expressed as NO3
-) in vegetables. In total, EFSA received 41,415 analytical results from 19 Member States and Norway covering the period from 2000 to 2007. The EFSA opinion ‘Nitrate in vegetables’ issued by the Panel on Contaminants in the Food Chain presents the full distribution statistics for the reported nitrate concentrations in vegetables (EFSA, 2008). Since this opinion was issued, EFSA has received further submissions of 3,733 individual analytical results on nitrate levels in vegetables from nine countries.
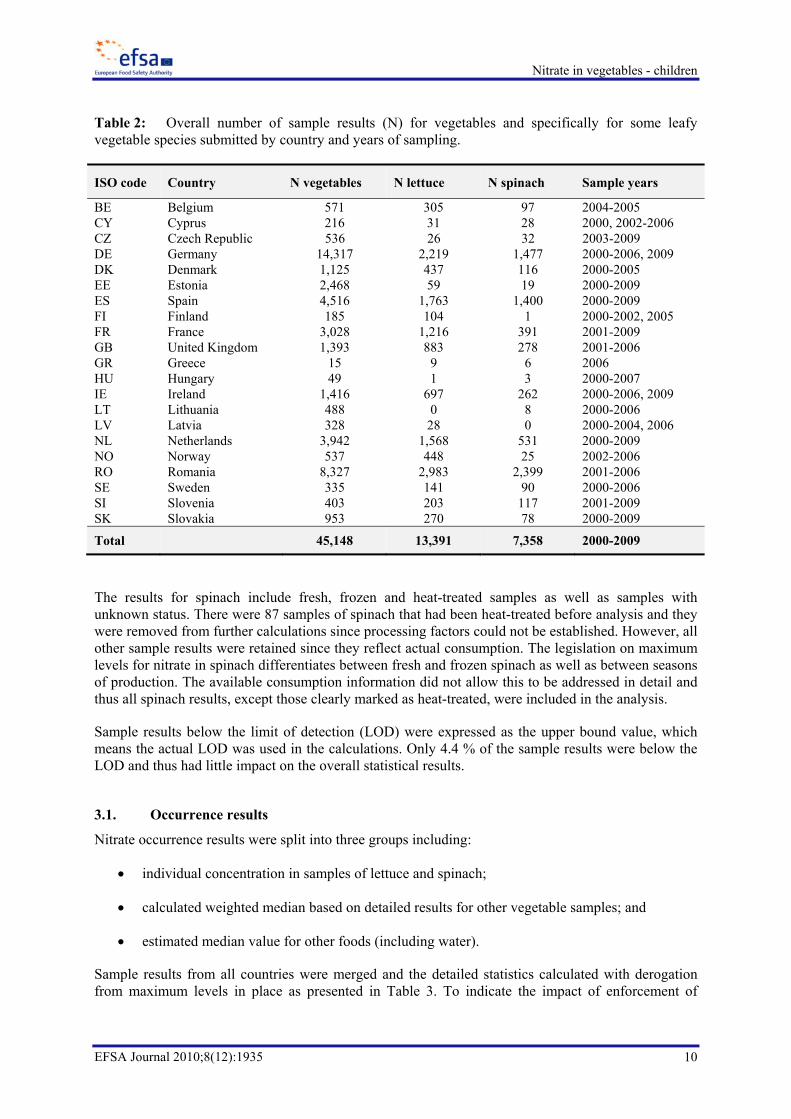
Within the overall submissions, 19 countries reported 13,391 analytical results of nitrate concentrations in lettuce (Lactuca sativa), excluding iceberg lettuce, and 7,358 analytical results for spinach (Spinacia oleracea). The number of analytical results submitted by each country for vegetables in general and for the types of leafy vegetables highlighted above is presented in Table 2.
6 OJ L 364, 20.12.2006, p. 5.
Nitrate in vegetables - children
10 EFSA Journal 2010;8(12):1935
Table 2: Overall number of sample results (N) for vegetables and specifically for some leafy vegetable species submitted by country and years of sampling.
ISO code Country N vegetables N lettuce N spinach Sample years
BE Belgium 571 305 97 2004-2005 CY Cyprus 216 31 28 2000, 2002-2006 CZ Czech Republic 536 26 32 2003-2009 DE Germany 14,317 2,219 1,477 2000-2006, 2009 DK Denmark 1,125 437 116 2000-2005 EE Estonia 2,468 59 19 2000-2009 ES Spain 4,516 1,763 1,400 2000-2009 FI Finland 185 104 1 2000-2002, 2005 FR France 3,028 1,216 391 2001-2009 GB United Kingdom 1,393 883 278 2001-2006 GR Greece 15 9 6 2006 HU Hungary 49 1 3 2000-2007 IE Ireland 1,416 697 262 2000-2006, 2009 LT Lithuania 488 0 8 2000-2006 LV Latvia 328 28 0 2000-2004, 2006 NL Netherlands 3,942 1,568 531 2000-2009 NO Norway 537 448 25 2002-2006 RO Romania 8,327 2,983 2,399 2001-2006 SE Sweden 335 141 90 2000-2006 SI Slovenia 403 203 117 2001-2009 SK Slovakia 953 270 78 2000-2009
Total 45,148 13,391 7,358 2000-2009
The results for spinach include fresh, frozen and heat-treated samples as well as samples with unknown status. There were 87 samples of spinach that had been heat-treated before analysis and they were removed from further calculations since processing factors could not be established. However, all other sample results were retained since they reflect actual consumption. The legislation on maximum levels for nitrate in spinach differentiates between fresh and frozen spinach as well as between seasons of production. The available consumption information did not allow this to be addressed in detail and thus all spinach results, except those clearly marked as heat-treated, were included in the analysis.
Sample results below the limit of detection (LOD) were expressed as the upper bound value, which means the actual LOD was used in the calculations. Only 4.4 % of the sample results were below the LOD and thus had little impact on the overall statistical results.
3.1. Occurrence results
Nitrate occurrence results were split into three groups including:
• individual concentration in samples of lettuce and spinach;
• calculated weighted median based on detailed results for other vegetable samples; and
• estimated median value for other foods (including water).
Sample results from all countries were merged and the detailed statistics calculated with derogation from maximum levels in place as presented in Table 3. To indicate the impact of enforcement of

Nitrate in vegetables - children
11 EFSA Journal 2010;8(12):1935
maximum levels, the results when restricting the distributions to the current legislated levels or to new levels under discussion were calculated. The highest nitrate levels were recorded in lettuce.
Table 3: Distributional statistics for nitrate concentration levels in lettuce and spinach with derogation in place and the possible impact of enforcement of maximum levels with mean, standard deviation (SD) for the mean, maximum (Max) and the respective percentiles (P).
Product Nitrate concentration mg/kg
P05 P25 P50 Mean SD P75 P95 P97.5 P99 Max Lettuce all 54 533 1,260 1,570 1,246 2,490 3,800 4,140 4,590 19,925 Lettuce <45001 53 526 1,239 1,524 1,170 2,438 3,700 3,980 4,200 4,490 Lettuce <50002 53 530 1,250 1,546 1,195 2,461 3,768 4,070 4,397 4,993 Spinach all3 64 320 816 1,092 981 1,600 3,078 3,500 4,100 10,470 Spinach <30001 56 300 749 941 763 1400 2496 2720 2883 2,998 Spinach <35002 63 315 785 1013 849 1500 2800 3080 3285 3,490 1 Current maximum level (for spinach the maximum level for fresh spinach) 2 Proposed maximum level 3 All spinach samples except heat-treated SD: standard deviation; P: percentile;
A weighted median nitrate concentration of 225 mg/kg for other vegetables was calculated according to the procedure presented in the EFSA opinion (EFSA, 2008). The median concentration in other food (including water) was estimated to be about 5 mg/kg. This assumes that vegetables contribute 50-70 % to total nitrate exposure (Gehle, 2007; EFSA, 2008), back calculating from a median exposure of 0.64 mg/kg b.w. per day from all vegetables (Table 9) and a median consumption of other food of 67.4 g/kg b.w. per day across all survey days. It is acknowledged that the contribution from food other than vegetables will vary considerably depending in particular on the water source, but sufficient information was not available to model this parameter.
4. Consumption
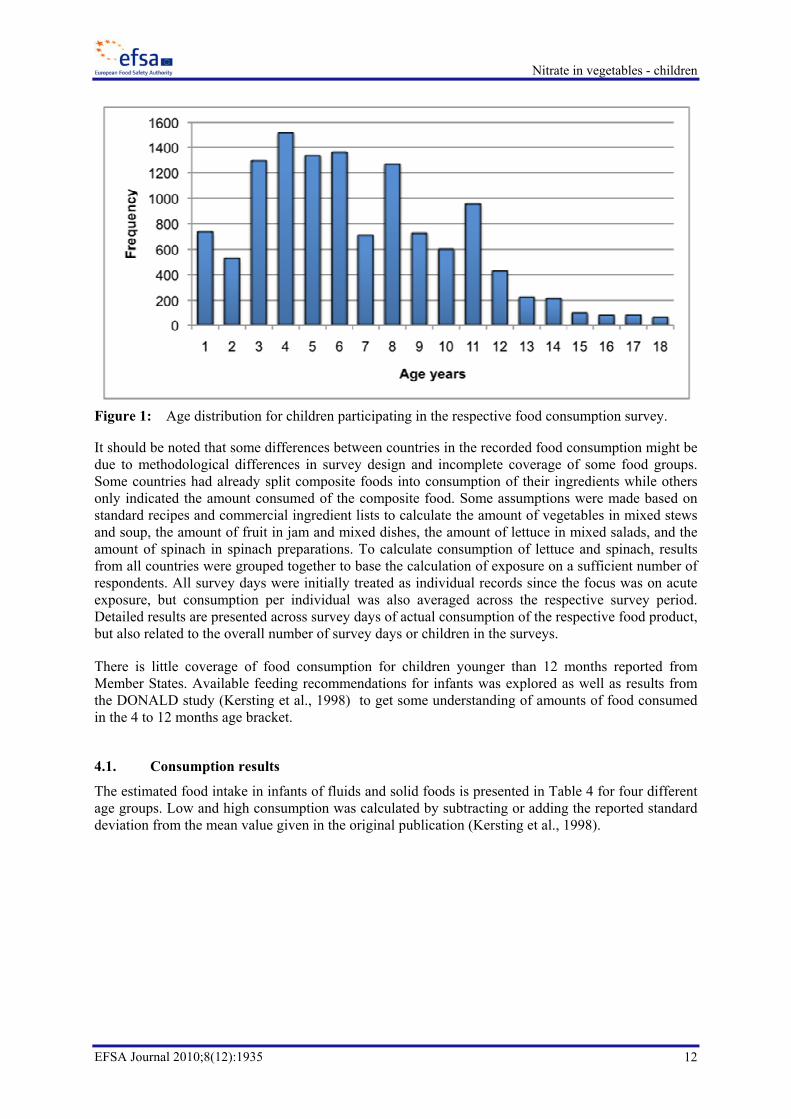
Figure 1: Detailed food consumption information for children has been made available to EFSA since the publication of the EFSA opinion on nitrate in vegetables. The EFSA Comprehensive European Food Consumption Database now includes information on food consumption for children collected by 13 countries participating in the EXPOCHI consortium.7 The database contains complete food consumption information for a total of 12,277 individuals covering 39,529 survey days. The length of the survey period varied from one day in Poland to seven days in Denmark and France. The children were between one and eighteen years old at the time of the survey, with only 326 individuals older than fourteen years of age (Figure 1). The children were grouped into three age classes, 1-3 years old, 4-6 years old and 7 years and older. Not all countries had surveyed children in all age classes.
7 The EXPOCHI consortium refers to the countries participating in the EFSA article 36 project ‘Individual food consumption
data and exposure assessments for children’.
Nitrate in vegetables - children
12 EFSA Journal 2010;8(12):1935
Figure 1: Age distribution for children participating in the respective food consumption survey.
It should be noted that some differences between countries in the recorded food consumption might be due to methodological differences in survey design and incomplete coverage of some food groups. Some countries had already split composite foods into consumption of their ingredients while others only indicated the amount consumed of the composite food. Some assumptions were made based on standard recipes and commercial ingredient lists to calculate the amount of vegetables in mixed stews and soup, the amount of fruit in jam and mixed dishes, the amount of lettuce in mixed salads, and the amount of spinach in spinach preparations. To calculate consumption of lettuce and spinach, results from all countries were grouped together to base the calculation of exposure on a sufficient number of respondents. All survey days were initially treated as individual records since the focus was on acute exposure, but consumption per individual was also averaged across the respective survey period. Detailed results are presented across survey days of actual consumption of the respective food product, but also related to the overall number of survey days or children in the surveys.
There is little coverage of food consumption for children younger than 12 months reported from Member States. Available feeding recommendations for infants was explored as well as results from the DONALD study (Kersting et al., 1998) to get some understanding of amounts of food consumed in the 4 to 12 months age bracket.
4.1. Consumption results
The estimated food intake in infants of fluids and solid foods is presented in Table 4 for four different age groups. Low and high consumption was calculated by subtracting or adding the reported standard deviation from the mean value given in the original publication (Kersting et al., 1998).

Nitrate in vegetables - children
13 EFSA Journal 2010;8(12):1935
Table 4: Food intake in total and in different food categories in four age groups (results from the DONALD Study).
Sample Total food¹ Commercial infant food² Other
Age (months) N b.w.
(kg) (g/day)³ (g/kg b.w.
per day)³ Formulae(%)ª
Solid(%)ª
Breast milk (%)ª
Home made food*(%) Low High Low High
3 118 6.1 661 949 112 154 47 4 47 2 6 153 7.7 745 1067 97 137 33 29 25 13 9 180 8.8 827 1241 91 143 20 33 4 43
12 229 9.7 831 1309 84 136 13 24 1 62 ¹ Solids and fluids, including water ² Ready-to-eat or -drink; reported amounts of dry products were recalculated as ready-to-eat or -drink at an average ratio of
dry product: added fluid 14:86 (formulae), 10:90 (simple cereals), and 20:80 (milk cereals). * Home-prepared infant food, family (table) food, cow's milk ³ Low is mean with standard deviation subtracted, high is mean with standard deviation added ª Percent of total food N: number of samples; b.w.: body weight.
Homemade food consumption varied between a low of 13.2 g/day in the 3 months age group to a high of 812 g/day in the 12 months age group. The survey of infant food consumption had commercial baby food as its focus with no detailed indication of the type of products included in the homemade category.
For children other than infants, the total median daily food consumption (solids and fluids) varied from 1,426 g for the youngest group of children to 1,865 g for the oldest age group (Table 5). When adjusted for individual body weight, the youngest age group showed, as expected, the highest daily food intake of 104 g/kg b.w., compared to 76 g/kg b.w. for the 4-6 years old and 53 g/kg b.w. for the oldest age class.
Table 5: Number of participating individuals, number of survey days and overall median food consumption in the three age groups in the respective country survey.
Country Number of individuals
Number of survey days
Median food consumption g 1-3 years 4-6 years ≥7 years
BE 661 3 1,522 1,581 . CY 303 3 . . 1,169 CZ 602 2 . 1,787 2,023 DE 921 3 1,210 1,498 1,915 DK 606 7 . 1,777 2,247 ES 1,432 2 1,562 1,789 2,099 FI 1,698 4 1,449 1,731 1,778 FR 574 7 1,259 1,450 1,710 GR 847 3 . 1,091 . IT 252 3 1,413 1,587 1,793 NL 1,279 2 1,435 1,594 . PL 611 1 1,500 1,807 1,964 SE 2,491 4 1,524 1,529 1,745
Total 12,277 1,426 1,534 1,865

Nitrate in vegetables - children
14 EFSA Journal 2010;8(12):1935
Vegetable and fruit consumption was common with 12,063 individuals out of 12,277 (98 %) recording the consumption of some sort of vegetable or fruit during at least one day of the survey period. The median fruit and vegetable consumption was 160 g/day with 95th percentile consumption at 429 g per day in the group of 12,063 children. Fruit consumption comprised on average 60 % of the combined amount leaving median vegetable consumption at 61 g/day with 95th percentile consumption at 207 g per day. The assumption in the previous EFSA opinion that children consumed more fruit than vegetables was correct, as was the assumed high vegetable consumption of 200 g per day for children (EFSA, 2008).
Vegetables were consumed on 30,196 of the 39,529 survey days (76 %). Looking solely at the consumption days of vegetables, the daily median consumption was 77 g with the 95th percentile at 285 g. The detailed vegetable consumption for individual days of consumption in the different age groups is shown in Table 6. On average, vegetables comprised 6 % of total food and beverage consumption, with the 95th percentile at 16 %.
Table 6: Mean and percentiles (P) vegetable consumption for individual days of consumption only in the different countries and age groups.
Country
Vegetable consumption g/day 1-3 years 4-6 years ≥7 years
P05 P50 Mean P95 P05 P50 Mean P95 P05 P50 Mean P95 BE 18 75 95 234 20 87 106 258 - - - - CY - - - - - - - - 50 140 162 340 CZ - - - - 6 55 81 250 9 72 103 305 DE 10 61 81 205 11 78 100 279 15 96 121 334 DK . . . . 10 110 135 344 11 120 160 439 ES 15 75 126 410 7 65 92 265 8 98 124 343 FI 7 53 68 177 8 62 81 222 10 65 88 235 FR 5 74 92 247 20 90 109 275 25 100 131 328 GR - - - - 20 100 109 260 - - - - IT 8 83 109 297 6 113 144 347 25 144 177 401 NL 7 48 60 153 9 52 71 185 - - - - PL 17 50 66 127 20 88 103 237 28 100 134 400 SE 15 60 74 200 10 54 72 184 15 75 93 245
Total 8 56 73 194 11 76 100 266 13 90 119 323
Lettuce comprised 3.7 % of overall vegetable consumption. There were 2,943 individuals out of 12,277 (24 %) who consumed lettuce in one or more days during the respective survey period giving 4,652 eating days out of a total of 39,529 (11.8 %). The overall daily median consumption of lettuce over the 4,652 days was 19.4 g. Statistics for days of lettuce consumption are presented separately for each age group in Table 7. Results are given both for total daily amount per child and as daily amount per kg body weight measured at the individual level.

Nitrate in vegetables - children
15 EFSA Journal 2010;8(12):1935
Table 7: Amount per consumption day of lettuce split into age groups with mean, standard deviation (SD) for the mean and the respective percentile (P).
Consumption P05 P25 P50 Mean SD P75 P95 P97.5 P99
All (N=4,652) In g 4.0 10.0 19.4 23.8 21.6 30.0 60.0 80.0 100 In g/kg b.w. 0.1 0.3 0.6 0.8 0.7 1.0 2.1 2.6 3.5 1-3 years (N=213) In g 1.0 5.0 10.0 13.1 11.5 20.0 39.4 40.5 70.0 In g/kg b.w. 0.1 0.3 0.7 0.8 0.8 1.1 2.4 3.1 3.5 4-6 years (N=1,235) In g 3.8 9.0 15.0 20.8 20.9 23.8 54.3 80.0 100 In g/kg b.w. 0.2 0.4 0.7 1.0 1.0 1.2 2.8 3.6 5.1 ≥7 years (N=3,204) In g 5.0 12.5 20.0 25.7 22.1 33.8 62.5 81.0 105 In g/kg b.w. 0.1 0.3 0.6 0.7 0.6 0.9 1.7 2.1 2.7 SD: standard deviation; P: percentile; N: number of individuals; b.w.: body weight. Spinach comprised 2.6 % of overall vegetable consumption. There were 1,172 individuals (9.6 %) out of 12,277 who consumed spinach in one or more days during the respective survey period, giving 1,305 eating days out of a total of 39,529 (3.3 %). The overall daily median consumption of spinach over the 1,305 days was 39.0 g. Statistics for days of spinach consumption are presented separately for each age group in Table 8. Results are given both for daily amount per child and as daily amount per kg body weight measured at the individual level.
Table 8: Amount per consumption day of spinach split into age groups with mean, standard deviation (SD) for the mean and the respective percentile (P).
Consumption P05 P25 P50 Mean SD P75 P95 P97.5 P99
All (N=1,305) In g 2.6 10.9 39.0 56.1 61.0 85.0 171 206 250 In g/kg b.w. 0.1 0.4 1.7 2.7 2.9 3.9 8.4 10.2 13.5 1-3 years (N=266) In g 4.6 19.9 44.2 55.2 48.4 77.6 156 180 225 In g/kg b.w. 0.3 1.3 3.0 4.0 3.5 6.0 10.5 13.8 16.4 4-6 years (N=586) In g 2.6 11.0 33.1 49.0 48.4 74.2 150 170 207 In g/kg b.w. 0.1 0.5 1.6 2.5 2.6 3.7 7.9 9.5 10.7 ≥7 years (N=453) In g 2.2 6.6 46.6 65.7 78.6 100 200 250 250 In g/kg b.w. 0.1 0.2 1.2 2.1 2.6 3.3 7.0 8.6 13.5 SD: standard deviation; P: percentile; N: number of individuals; b.w.: body weight.
Looking at the number of consumers of the respective product in relation to overall days of consumption there is little repeat consumption of spinach during the survey periods, but some repeat consumption of lettuce.

Nitrate in vegetables - children
16 EFSA Journal 2010;8(12):1935
5. Dietary Exposure
Distribution statistics were produced using the statistical program SPSS version 17 (SPSS Inc). Acute and chronic exposures were calculated for children other than infants using a deterministic approach. Acute exposure was also calculated using a stochastic approach to test the impact of different prescribed maximum levels for nitrate concentration. For the latter calculation nitrate occurrence and food consumption were modelled using the best fit equation module of @Risk version 5.0.1 (Palisade Inc). The modelled distribution statistics for nitrate concentration level, food consumption and nitrate exposure (by multiplying consumption and occurrence) were calculated using the Monte Carlo simulation with 50,000 iterations in @Risk.
Infant nitrate exposure was calculated only for the acute scenario because of a scarcity of specific food consumption information for this age group, and only for spinach since lettuce consumption seemed to be low in young children (see Table 6). Using point estimations, the following assumptions were made:
• All homemade foods were solids in the 3 and 6 months age groups and 50 % of the homemade foods were liquids (cows’ milk) in the 9 and 12 months age groups.
• Solid homemade food dishes were spread over three eating occasions in a day, of which one might be spinach-based for infants at six, nine and ten months of age, and two spinach-based meals for the three months age group requiring less variation.
• Preparation of spinach includes some dilution with water during cooking and the addition of some other ingredients so that spinach only constitutes two thirds of the weight of the final spinach dish for infants of three months of age.
• The spinach dish was consumed as part of a composite meal, with the spinach constituting half of the meal weight for infants at six, nine and twelve months of age.
5.1. Calculating exposure
5.1.1. Chronic nitrate exposure
Children’s chronic nitrate exposure from all foods (including water), from vegetables in general and the particular contribution of lettuce and spinach, were calculated using median nitrate concentrations and individual level body weight and consumption amounts averaged over the respective number of survey days for each child (Table 9). Median dietary nitrate exposure varied between 0.77 and 1.39 mg/kg b.w. per day and the 97.5th percentile exposure between 2.95 and 4.76 mg/kg b.w. per day. The highest levels were seen in younger children. Lettuce and spinach contributed on average 9 % and 6 %, respectively, to overall nitrate exposure.
Nitrate in vegetables - children
17 EFSA Journal 2010;8(12):1935
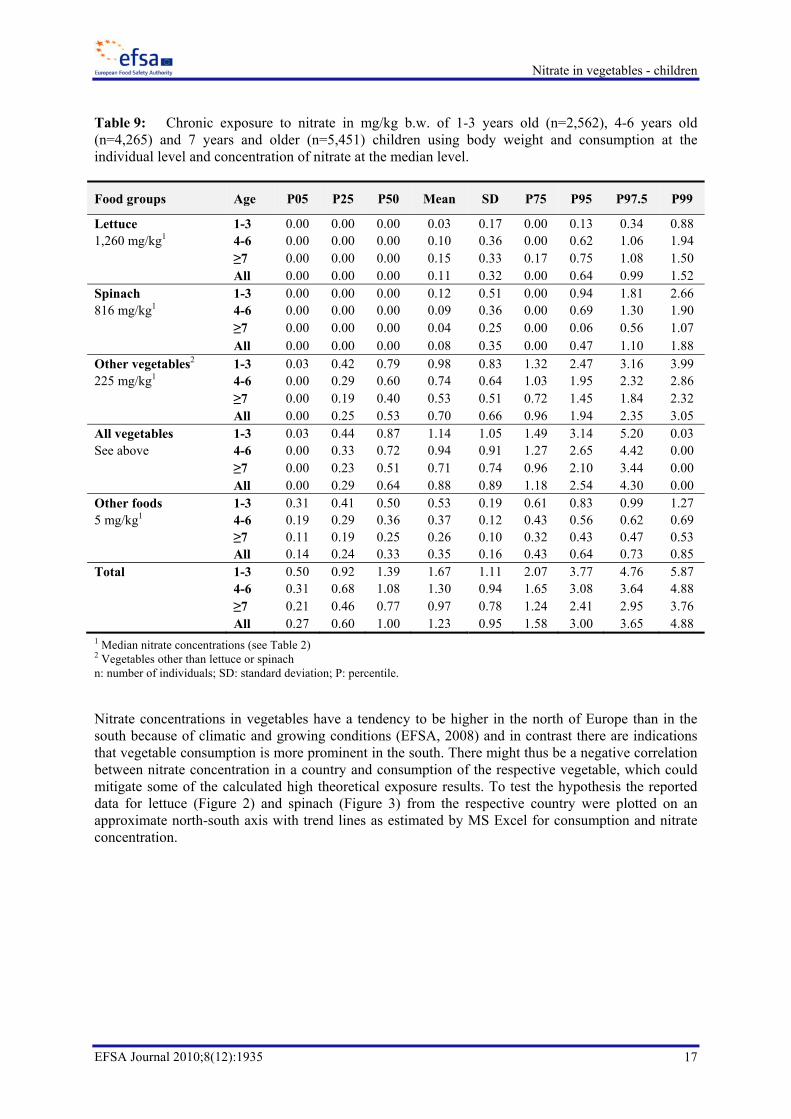
Table 9: Chronic exposure to nitrate in mg/kg b.w. of 1-3 years old (n=2,562), 4-6 years old (n=4,265) and 7 years and older (n=5,451) children using body weight and consumption at the individual level and concentration of nitrate at the median level.
Food groups Age P05 P25 P50 Mean SD P75 P95 P97.5 P99
Lettuce 1-3 0.00 0.00 0.00 0.03 0.17 0.00 0.13 0.34 0.88 1,260 mg/kg1 4-6 0.00 0.00 0.00 0.10 0.36 0.00 0.62 1.06 1.94 ≥7 0.00 0.00 0.00 0.15 0.33 0.17 0.75 1.08 1.50 All 0.00 0.00 0.00 0.11 0.32 0.00 0.64 0.99 1.52 Spinach 1-3 0.00 0.00 0.00 0.12 0.51 0.00 0.94 1.81 2.66 816 mg/kg1 4-6 0.00 0.00 0.00 0.09 0.36 0.00 0.69 1.30 1.90 ≥7 0.00 0.00 0.00 0.04 0.25 0.00 0.06 0.56 1.07 All 0.00 0.00 0.00 0.08 0.35 0.00 0.47 1.10 1.88 Other vegetables2 1-3 0.03 0.42 0.79 0.98 0.83 1.32 2.47 3.16 3.99 225 mg/kg1 4-6 0.00 0.29 0.60 0.74 0.64 1.03 1.95 2.32 2.86 ≥7 0.00 0.19 0.40 0.53 0.51 0.72 1.45 1.84 2.32 All 0.00 0.25 0.53 0.70 0.66 0.96 1.94 2.35 3.05 All vegetables 1-3 0.03 0.44 0.87 1.14 1.05 1.49 3.14 5.20 0.03 See above 4-6 0.00 0.33 0.72 0.94 0.91 1.27 2.65 4.42 0.00 ≥7 0.00 0.23 0.51 0.71 0.74 0.96 2.10 3.44 0.00 All 0.00 0.29 0.64 0.88 0.89 1.18 2.54 4.30 0.00 Other foods 1-3 0.31 0.41 0.50 0.53 0.19 0.61 0.83 0.99 1.27 5 mg/kg1 4-6 0.19 0.29 0.36 0.37 0.12 0.43 0.56 0.62 0.69 ≥7 0.11 0.19 0.25 0.26 0.10 0.32 0.43 0.47 0.53 All 0.14 0.24 0.33 0.35 0.16 0.43 0.64 0.73 0.85 Total 1-3 0.50 0.92 1.39 1.67 1.11 2.07 3.77 4.76 5.87 4-6 0.31 0.68 1.08 1.30 0.94 1.65 3.08 3.64 4.88 ≥7 0.21 0.46 0.77 0.97 0.78 1.24 2.41 2.95 3.76 All 0.27 0.60 1.00 1.23 0.95 1.58 3.00 3.65 4.88 1 Median nitrate concentrations (see Table 2) 2 Vegetables other than lettuce or spinach n: number of individuals; SD: standard deviation; P: percentile.
Nitrate concentrations in vegetables have a tendency to be higher in the north of Europe than in the south because of climatic and growing conditions (EFSA, 2008) and in contrast there are indications that vegetable consumption is more prominent in the south. There might thus be a negative correlation between nitrate concentration in a country and consumption of the respective vegetable, which could mitigate some of the calculated high theoretical exposure results. To test the hypothesis the reported data for lettuce (Figure 2) and spinach (Figure 3) from the respective country were plotted on an approximate north-south axis with trend lines as estimated by MS Excel for consumption and nitrate concentration.

Nitrate in vegetables - children
18 EFSA Journal 2010;8(12):1935
0.00
1.00
2.00
3.00
4.00
5.00
6.00
7.00
8.00
9.00
0
500
1,000
1,500
2,000
2,500
3,000
3,500
FI NO SE EE DK LV IE GB NL BE PL DE CZ SK FR HU SI RO IT ES GR CY
Consum
ption g/kg bw per day
Nitrate mg/kg
Countries along north‐south axis
Consumption Nitrate Linear (Consumption) Linear (Nitrate)
Figure 2: Consumption (bar) of and nitrate concentrations (line) in lettuce from north to south of Europe with estimated trend lines. Not all countries provided results for both consumption and occurrence.
Figure 3: Consumption (bar) of and nitrate concentrations (line) in spinach from north to south of Europe with estimated trend lines. Not all countries provided results for both consumption and occurrence.
The graphs should be interpreted with caution because of few or missing results from some of the countries, but there seems to be a stronger indication that the hypothesis is true for lettuce than for spinach.
5.1.2. Acute nitrate exposure
Infant acute dietary exposure to nitrate calculated using the consumption information provided by the DONALD study (Kersting et al., 1998) is presented in Table 10.
0.00
1.00
2.00
3.00
4.00
5.00
6.00
7.00
8.00
9.00
0
500
1,000
1,500
2,000
2,500
3,000
3,500
FI NO SE EE DK LT IE GB NL BE PL DE CZ SK FR HU SI RO IT ES GR CY
Consum
ption g/kg bw per day
Nitrate mg/kg
Countries along north‐south axis
Consumption Nitrate Linear (Consumption) Linear (Nitrate)
Nitrate in vegetables - children
19 EFSA Journal 2010;8(12):1935
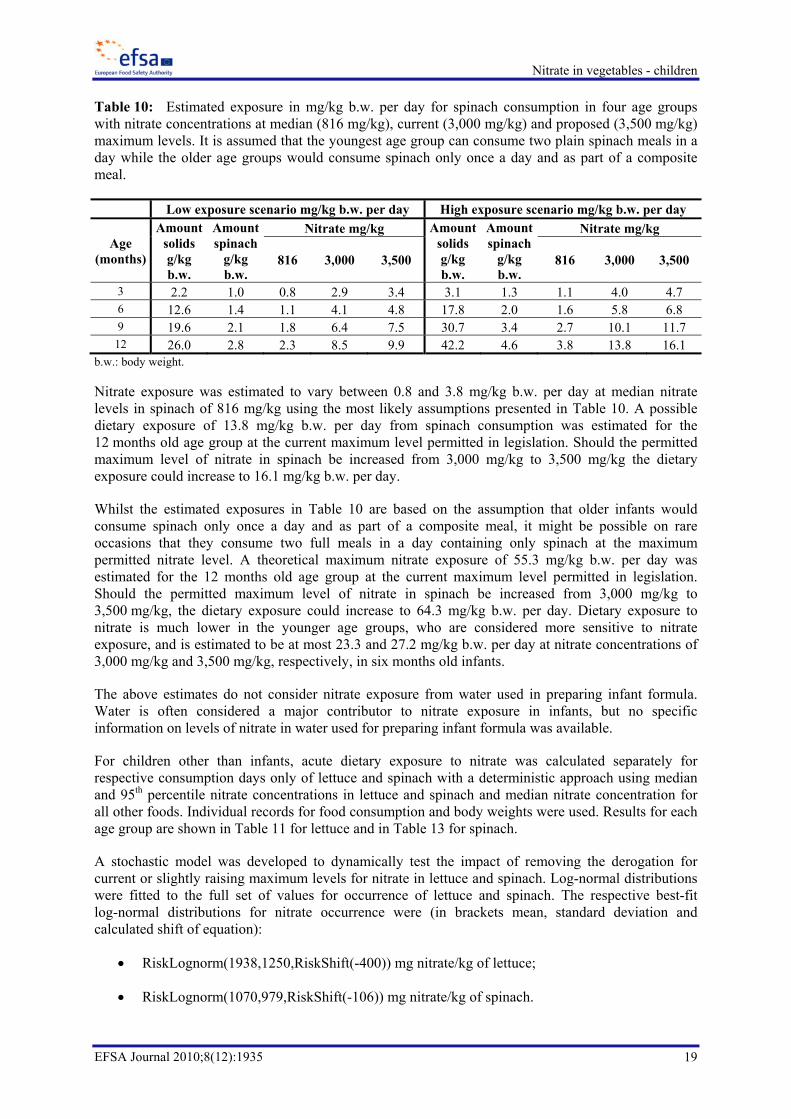
Table 10: Estimated exposure in mg/kg b.w. per day for spinach consumption in four age groups with nitrate concentrations at median (816 mg/kg), current (3,000 mg/kg) and proposed (3,500 mg/kg) maximum levels. It is assumed that the youngest age group can consume two plain spinach meals in a day while the older age groups would consume spinach only once a day and as part of a composite meal.
Low exposure scenario mg/kg b.w. per day High exposure scenario mg/kg b.w. per day
Age (months)
Amount solids g/kg b.w.
Amount spinach
g/kg b.w.
Nitrate mg/kg Amount solids g/kg b.w.
Amount spinach
g/kg b.w.
Nitrate mg/kg
816 3,000 3,500 816 3,000 3,500
3 2.2 1.0 0.8 2.9 3.4 3.1 1.3 1.1 4.0 4.7 6 12.6 1.4 1.1 4.1 4.8 17.8 2.0 1.6 5.8 6.8 9 19.6 2.1 1.8 6.4 7.5 30.7 3.4 2.7 10.1 11.7
12 26.0 2.8 2.3 8.5 9.9 42.2 4.6 3.8 13.8 16.1 b.w.: body weight. Nitrate exposure was estimated to vary between 0.8 and 3.8 mg/kg b.w. per day at median nitrate levels in spinach of 816 mg/kg using the most likely assumptions presented in Table 10. A possible dietary exposure of 13.8 mg/kg b.w. per day from spinach consumption was estimated for the 12 months old age group at the current maximum level permitted in legislation. Should the permitted maximum level of nitrate in spinach be increased from 3,000 mg/kg to 3,500 mg/kg the dietary exposure could increase to 16.1 mg/kg b.w. per day.
Whilst the estimated exposures in Table 10 are based on the assumption that older infants would consume spinach only once a day and as part of a composite meal, it might be possible on rare occasions that they consume two full meals in a day containing only spinach at the maximum permitted nitrate level. A theoretical maximum nitrate exposure of 55.3 mg/kg b.w. per day was estimated for the 12 months old age group at the current maximum level permitted in legislation. Should the permitted maximum level of nitrate in spinach be increased from 3,000 mg/kg to 3,500 mg/kg, the dietary exposure could increase to 64.3 mg/kg b.w. per day. Dietary exposure to nitrate is much lower in the younger age groups, who are considered more sensitive to nitrate exposure, and is estimated to be at most 23.3 and 27.2 mg/kg b.w. per day at nitrate concentrations of 3,000 mg/kg and 3,500 mg/kg, respectively, in six months old infants.
The above estimates do not consider nitrate exposure from water used in preparing infant formula. Water is often considered a major contributor to nitrate exposure in infants, but no specific information on levels of nitrate in water used for preparing infant formula was available.
For children other than infants, acute dietary exposure to nitrate was calculated separately for respective consumption days only of lettuce and spinach with a deterministic approach using median and 95th percentile nitrate concentrations in lettuce and spinach and median nitrate concentration for all other foods. Individual records for food consumption and body weights were used. Results for each age group are shown in Table 11 for lettuce and in Table 13 for spinach.
A stochastic model was developed to dynamically test the impact of removing the derogation for current or slightly raising maximum levels for nitrate in lettuce and spinach. Log-normal distributions were fitted to the full set of values for occurrence of lettuce and spinach. The respective best-fit log-normal distributions for nitrate occurrence were (in brackets mean, standard deviation and calculated shift of equation):
• RiskLognorm(1938,1250,RiskShift(-400)) mg nitrate/kg of lettuce;
• RiskLognorm(1070,979,RiskShift(-106)) mg nitrate/kg of spinach.

Nitrate in vegetables - children
20 EFSA Journal 2010;8(12):1935
The distributions were truncated at the respective range of occurrence results with minimum and maximum values of 1 and 19,925 mg nitrate /kg for lettuce and 1 and 10,500 mg nitrate /kg for spinach. Two further simulations were performed where either the current highest legislated maximum levels for lettuce (4,500 mg/kg) and fresh spinach (3,000 mg/kg) were used, or the possible new maximum levels for lettuce (5,000 mg/kg) and fresh spinach (3,500 mg/kg) replaced the actual maximum values in the datasets with the assumption that the legislation is equally effective in either situation (Tables 12 and 14).
Log-normal distributions were also fitted to the full set of consumption day only values for lettuce and spinach consumption treating children other than infants as one group.
The following log-normal distributions were fitted using actual consumption amounts:
• RiskLognorm(0.795,0.75951,RiskTruncate(0.02,12.5)) g/kg b.w. per day for lettuce;
• RiskLognorm(3.5565,9.3441,RiskTruncate(0.004,21.1)) g/kg b.w. per day for spinach.
To calculate the percentage of total individuals exceeding selected exposure levels, the simulation was set to pick individual exposure from consuming days (using the above equation) or enter zero for non-consuming days in the proportion indicated previously.
For infant consumption of spinach a pert distribution was used because of the limited knowledge of consumption behaviour. The following distribution indicates spinach consumption on consumption days only for the highest infant exposure group (12 months) estimating minimum, most likely and maximum consumption as 1, 4.6 and 18.4 g/kg b.w.:
• Risk Pert(1,4.6,18.4) g/kg b.w. per day for spinach
Simulated distribution statistics for food consumption, nitrate concentration levels and nitrate exposure (by multiplying consumption and occurrence) are shown in Tables 13 and 14 for children other than infants. Each simulation will give slightly different results because of the random nature of the probabilistic assessment, but with 50,000 iterations the differences became minute.

Nitrate in vegetables - children
21 EFSA Journal 2010;8(12):1935
Table 11: Exposure to nitrate from lettuce and total food in mg/kg b.w. per day covering survey days of lettuce consumption of 1-3 years old (n=213), 4-6 years old (n=1,235) and 7 years and older (n=3,204) children using body weight and consumption at individual level and concentration of nitrate at median and 95th percentile level for lettuce and median level for all other foods.
Product Age P05 P25 P50 Mean SD P75 P95 P97.5 P99
Lettuce P50 1-3 0.11 0.43 0.88 1.07 0.95 1.40 3.00 3.88 4.44 1,260 mg/kg 4-6 0.21 0.50 0.88 1.25 1.26 1.54 3.54 4.58 6.43 ≥7 0.18 0.42 0.71 0.89 0.74 1.12 2.19 2.70 3.39 All 0.19 0.43 0.76 0.99 0.93 1.24 2.64 3.32 4.44 Total median 1-3 1.04 1.84 2.53 3.00 1.74 3.76 6.63 7.63 8.57 Adding all other food at median level1
4-6 0.92 1.62 2.42 2.85 1.88 3.50 6.36 7.68 9.37 ≥7 0.65 1.13 1.71 2.02 1.30 2.55 4.40 5.19 6.28 All 0.70 1.26 1.91 2.29 1.55 2.88 5.08 6.16 7.76
Lettuce P95 1-3 0.34 1.31 2.64 3.22 2.87 4.22 9.05 11.69 13.38 3,800 mg/kg 4-6 0.63 1.51 2.64 3.78 3.80 4.65 10.67 13.82 19.39 ≥7 0.54 1.27 2.13 2.67 2.23 3.39 6.61 8.14 10.23 All 0.56 1.29 2.28 2.99 2.80 3.73 7.97 10.01 13.38 Total P95 1-3 1.49 2.95 4.23 5.16 3.34 6.46 11.72 14.44 19.65 Adding all other food at median level1
4-6 1.42 2.83 4.20 5.37 4.18 6.56 13.41 16.03 21.11 ≥7 1.16 2.08 3.19 3.81 2.62 4.73 8.54 10.06 12.44 All 1.22 2.27 3.48 4.28 3.22 5.27 9.94 12.44 15.98
1 Adding other food except lettuce at median nitrate concentration to lettuce exposure to arrive at total exposure (see Table 8).
n: number of individuals; SD: standard deviation; P: percentile. Median dietary nitrate exposure over the 4,652 days of lettuce consumption varied between 1.71 and 2.53 mg/kg b.w. per day and 3.19 and 4.23 mg/kg b.w. per day at a median and 95th percentile nitrate concentration in lettuce, respectively, and median nitrate concentration in other food. At the 97.5th percentile dietary nitrate exposure level the 4-6 years old age group recorded the highest nitrate exposure of 16.03 mg/kg b.w. per day at the 95th percentile nitrate concentration level in lettuce (Total P95) while in some other combinations the 1-3 years old age group showed the highest exposure.

Nitrate in vegetables - children
22 EFSA Journal 2010;8(12):1935
Table 12: The estimated contribution of lettuce to nitrate exposure for lettuce consuming days. Consumption (g/kg b.w. per day), occurrence (mg NO3
-/kg) and nitrate exposure (mg/kg b.w. per day) were calculated using the Monte Carlo simulation with derogation in place (All results) or enforcement of respective maximum level (<4,500 or <5,000 mg NO3
-/kg).
Lettuce P05 P25 P50 Mean SD P75 P95 P97.5 P99
Consumption 0.15 0.33 0.57 0.79 0.75 0.99 2.16 2.78 3.73 All results Occurrence 245 707 1239 1552 1244 2034 3906 4782 6025 Exposure 0.09 0.31 0.69 1.21 1.65 1.45 4.21 5.57 8.02 <4,500 mg NO3
-/kg Occurrence 240 692 1202 1412 945 1934 3346 3782 4157 Exposure 0.09 0.31 0.65 1.11 1.50 1.34 3.63 4.90 6.83 <5,000 mg NO3
-/kg Occurrence 242 697 1214 1446 998 1964 3495 4018 4503 Exposure 0.08 0.31 0.67 1.14 1.50 1.39 3.72 5.13 7.09 SD: standard deviation; P: percentile. The median and 97.5th percentile nitrate exposure from lettuce alone for consumption days of lettuce were 0.69 and 5.57 mg/kg b.w. per day, respectively. Strictly enforcing the current maximum level had the potential to decrease exposure on average by 8 % or if changing the maximum level from 4,500 mg/kg to 5,000 mg/kg by 6 %.
Table 13: Exposure to nitrate from spinach and total food in mg/kg b.w. per day covering survey days of spinach consumption of 1-3 years old (n=266), 4-6 years old (n=586) and 7 years and older (n=453) children, using body weight and consumption at individual level and concentration of nitrate at median and 95th percentile level for spinach and median level for all other foods.
Product Age P05 P25 P50 Mean SD P75 P95 P97.5 P99
Spinach P50 1-3 0.28 1.09 2.43 3.26 2.84 4.92 8.41 11.30 13.35 816 mg/kg 4-6 0.09 0.45 1.34 2.06 2.15 3.04 6.41 7.77 8.74 ≥7 0.06 0.16 0.97 1.69 2.09 2.67 5.69 7.02 10.20 All 0.07 0.36 1.40 2.17 2.35 3.18 6.83 8.35 11.05 Total median 1-3 1.51 2.65 4.53 5.35 3.51 7.16 12.07 15.41 17.37 Adding all other food at median level1
4-6 0.79 1.62 2.80 3.67 2.78 5.06 9.22 11.16 12.86 ≥7 0.59 1.54 2.49 3.31 2.73 4.28 8.33 9.46 13.98 All 0.76 1.74 3.01 3.88 3.02 5.28 9.67 12.00 14.60
Spinach P95 1-3 1.04 4.13 9.16 12.30 10.72 18.56 31.74 42.61 50.35 3,078 mg/kg 4-6 0.35 1.69 5.05 7.75 8.10 11.45 24.18 29.31 32.98 ≥7 0.21 0.59 3.66 6.37 7.87 10.06 21.45 26.49 38.48 All 0.27 1.37 5.30 8.20 8.88 11.98 25.77 31.48 41.67 Total P95 1-3 2.58 5.99 10.93 14.39 11.28 20.57 35.36 46.80 54.37 Adding all other food at median level1
4-6 1.53 3.25 6.15 9.36 8.60 13.61 26.64 31.97 36.92 ≥7 0.84 2.33 4.94 7.99 8.36 11.59 23.64 28.80 41.99 All 1.20 3.20 6.66 9.91 9.43 13.90 28.53 35.00 45.12
1 Adding other food except spinach at median nitrate concentration to spinach exposure to arrive at total exposure (see Table 8).
n: number of individuals; SD: standard deviation; P: percentile.

Nitrate in vegetables - children
23 EFSA Journal 2010;8(12):1935
Median dietary nitrate exposure on the 1,305 days of spinach consumption varied between 2.49 and 4.53 mg/kg b.w. per day and 4.94 and 10.93 mg/kg b.w. per day at a median and 95th percentile nitrate concentration in spinach, respectively, and median concentration in other food. Exposure was consistently highest in the 1-3 years old age group with a potential 46.80 mg/kg b.w. per day recorded at the 97.5th percentile consumption level and 95th percentile spinach nitrate concentration.
Table 14: The estimated contribution of spinach to nitrate exposure for spinach consuming days. Consumption (g/kg b.w. per day), occurrence (mg NO3-/kg) and nitrate exposure (mg/kg b.w. per day) calculated using the Monte Carlo simulation with derogation in place (All results) or enforcement of respective maximum level (<3,000 or <3,500 mg NO3-/kg).
Spinach P05 P25 P50 Mean SD P75 P95 P97.5 P99
Consumption 0.12 0.47 1.21 2.55 3.46 3.07 10.14 13.56 17.18 All results Occurrence 121 365 687 964 943 1233 2738 3516 4673 Exposure 0.04 0.24 0.79 2.42 4.81 2.42 10.4 15.5 23.2 <3,000 mg NO3
-/kg Occurrence 118 354 657 829 630 1142 2169 2490 2760 Exposure 0.04 0.24 0.75 2.11 3.96 2.16 8.78 12.9 20.6 <3,500 mg NO3
-/kg Occurrence 119 358 668 864 688 1173 2331 2742 3123 Exposure 0.04 0.24 0.75 2.24 4.29 2.32 9.43 14.5 20.7 SD: standard deviation; P: percentile.
The median and 97.5th percentile nitrate exposures from spinach alone for consuming days of spinach were 0.79 and 15.5 mg/kg b.w., respectively. Strictly enforcing the current maximum level had the potential to decrease exposure by 13 %, or if changing the maximum level from 3,000 mg/kg to 3,500 mg/kg - by 7 %.
Co-consumption of lettuce, iceberg lettuce (also covered in legislation) and spinach during one day was investigated. Five eating days included consumption of all three foods but the maximum amount was only 1.76 g/kg b.w. per day. A combination of iceberg lettuce and spinach was consumed for 11 days with a maximum amount of 5.5 g/kg b.w. per day. A combination of lettuce and iceberg lettuce was consumed on 71 days with a maximum amount of 4.52 g/kg b.w. per day. A combination of lettuce and spinach was consumed for 125 days with a maximum amount of 10.4 (1.74+8.70) g/kg b.w. per day. The latter combination could in a most likely scenario (median result) contribute 8.6 mg/kg b.w. per day to nitrate exposure according to simulation results and would thus be within the full range of results for spinach alone.
5.1.3. Calculating the probability of exceeding specific levels
With the stochastic modelling it is possible to calculate the proportion of individuals exceeding selected levels. Simulation included two scenarios, for all survey days (children other than infants) and for days of consumption of lettuce or spinach (all age groups). The levels tested were 3.7 mg/kg b.w. (ADI), and 15 mg/kg b.w. (see section 6.4) as presented in Table 15. For children other than infants estimated habitual exposure amounts for vegetables other than lettuce and spinach of 0.60 mg/kg b.w. per day (average over age groups from Table 8) and from other food and water of 0.35 mg/kg b.w. per day were added to the simulated exposure levels contributed by lettuce or spinach.

Nitrate in vegetables - children
24 EFSA Journal 2010;8(12):1935
Table 15: Probability of children exceeding exposure of 3.7 and 15 mg nitrate/kg b.w. in a day at different maximum levels (ML and ML+500) of nitrate in lettuce and spinach.
Exposure mg nitrate/kg b.w. per day
Probability of exceeding selected levels of exposure All survey days Consumption days only
All results ML ML+500 All results ML ML+500 Infants Spinach 3.7 0.5125 0.4920 0.4999 15 0.0828 0.0557 0.0644 Children other than infants Lettuce 3.7 0.0123 0.0099 0.0112 0.1041 0.0885 0.0943 15 0.0002 0.0001 0.0002 0.0021 0.0011 0.0013 Spinach 3.7 0.0077 0.0068 0.0071 0.2208 0.2040 0.2107 15 0.0008 0.0007 0.0007 0.0304 0.0219 0.0234 b.w.: body weight; ML: maximum level. Since spinach (cooked and pureed from fresh) can constitute a full meal for infants, 51 % might exceed an exposure of 3.7 mg nitrate/kg b.w. and 8.3 % exceed 15 mg/kg b.w. on consumption days of spinach according to the results of the model. This latter number was reduced to 5.6 % if strictly enforcing the current maximum level or, if changing the maximum level from 3,000 mg/kg to 3,500 mg/kg, to 6.4 %.
For children other than infants, the model showed that over all survey days at most 1.2 % might exceed an exposure level of 3.7 mg NO3
-/kg b.w. with derogation from maximum levels applied for lettuce or 10 % of lettuce consumption days. This latter number would be reduced to 8.9 % if strictly enforcing the current maximum level or, if changing the maximum level from 4,500 mg/kg to 5,000 mg/kg, to 9.4 %.
The model further showed that of all survey days at most 0.77 % of children might exceed an exposure level of 3.7 mg NO3
-/kg b.w. with derogation from maximum levels applied for spinach or 22 % of spinach consumption days. This latter number would be reduced to 20 % if strictly enforcing the current maximum level or, if changing the maximum level from 3,000 mg/kg to 3,500 mg/kg, to 21 %.
These above percentages for spinach are likely to be over-estimations since some meals could have been prepared from spinach purchased as preserved or frozen, for which lower maximum levels are currently in force.
5.2. Summary of exposure
The median chronic nitrate exposure in children aged 1-18 years from all foods was estimated to be 1.00 mg/kg b.w. per day with the 97.5th percentile at 3.65 mg/kg b.w. per day. Younger children had the highest estimated exposure to nitrate. In the 1-3 years old age group median nitrate exposure was 1.39 mg/kg b.w. per day and the 97.5th percentile was 4.76 mg/kg b.w. per day (see Table 9). Consumption of lettuce and spinach varied with age in that smaller children consumed relatively more spinach and older children more lettuce. Lettuce and spinach contributed on average 9 % and 6 %, respectively, to overall nitrate exposure.
The high percentile exposure is similar to results of 5.1 mg/kg b.w. per day reported for the 1-3 years old group in a smaller Dutch study, although they reported a higher median of 2.3 mg/kg b.w. per day (Westenbrink et al., 2005). However, in a later Dutch study a median of 1.9 mg/kg b.w. per day was reported for 2-year olds (Boon et al., 2009). The present results were also compared with the estimate

Nitrate in vegetables - children
25 EFSA Journal 2010;8(12):1935
in the previous EFSA opinion (EFSA, 2008). Overall, the 95th percentile exposure of children aged 1-18 years to nitrate from all food was estimated at 3.00 mg/kg b.w. per day in the current results, of which vegetables contributed 2.54 mg/kg b.w. per day. In the previous EFSA opinion, 3.90 mg/kg b.w. per day (78 mg per day for a 20 kg child) was presented as a best estimate approximating 95th percentile exposure to nitrate in vegetables without considering contribution from other food and water sources. Thus, the previous EFSA estimate was on the conservative side.
The focus of the present opinion is on acute exposure to nitrate in lettuce and spinach to assess the impact of current derogation measures for, or changes to, prescribed maximum levels. For that reason each individual day in the sample was treated as a separate entity.
For infants aged 12 months, the most likely high scenario with consumption of one composite meal in a day, of which half comprises spinach, would result in maximum nitrate exposure of 3.8, 13.8 and 16.1 mg/kg b.w. per day at the respective nitrate concentrations of 816, 3000 and 3500 mg/kg in the spinach, representing the median of the available occurrence data, the current maximum level for spinach, and the proposed higher maximum level. Dietary exposure to nitrate is much lower in the younger age groups, considered more sensitive to nitrate exposure, and is estimated to most likely not exceed 1.6, 5.8 and 6.8 mg/kg b.w. per day at the above nitrate concentrations (see Table 10). Modelling indicated that, with derogation to the current maximum level for nitrate in fresh spinach, 51 % of infants might exceed an exposure of 3.7 mg nitrate/kg b.w. and 8.3 % might exceed 15 mg/kg b.w. on consumption days of spinach. This latter number was reduced to 5.6 % if strictly enforcing the current maximum level or, if changing the maximum level from 3,000 mg/kg to 3,500 mg/kg, to 6.4 % (see Table 15).
For children aged 1-18 years a median nitrate exposure of 1.91 mg/kg b.w. per day was calculated for consumption days of lettuce, of which lettuce at a median concentration level contributed 0.76 mg/kg b.w. per day. This was increased to 3.48 mg/kg b.w. per day and 2.28 mg/kg b.w. per day, respectively, at the 95th percentile concentration level in lettuce. The estimated high level (97.5th percentile) exposure is 12.44 mg/kg b.w. (see Table 11). Strictly enforcing the current maximum level had the potential to on average decrease exposure by 8 % or if changing the maximum level from 4,500 mg/kg to 5,000 mg/kg by 6 % (see Table 12). It was estimated that with derogation to the current maximum level for nitrate in lettuce 10 % of children consumers might exceed a level of 3.7 mg/kg b.w. on an individual day, and 0.21 % might exceed 15 mg/kg b.w. Strictly enforcing the current maximum level had the potential to decrease the number exceeding 15 mg/kg b.w. to 0.11 % or to 0.13 % if changing the maximum level from 4,500 mg/kg to 5,000 mg/kg (see Table 15).
A median nitrate exposure of 3.01 mg/kg b.w. per day was calculated for consumption days of spinach of which spinach at a median concentration level contributed 1.40 mg/kg b.w. per day. This was increased to 6.66 mg/kg b.w. per day and 5.30 mg/kg b.w. per day, respectively, at the 95th percentile concentration level in spinach. The estimated high level (97.5th percentile) exposure is 35 mg/kg b.w. for all children aged 1-18, with the highest at 46.8 mg/kg b.w. (Table 13). These estimates include exposure to nitrate in other foods. Strictly enforcing the current maximum level had the potential to decrease exposure by 13 % or if changing the maximum level from 3,000 mg/kg to 3,500 mg/kg by 7 % (see Table 14).
It was estimated that 22 % of children consumers of spinach might exceed a level of 3.7 mg/kg b.w. and 3.0 % might exceed 15 mg/kg b.w. on an individual day. Strictly enforcing the current maximum level had the potential to decrease the number exceeding 15 mg/kg b.w. to 2.2 % or to 2.3 % if changing the maximum level from 3,000 mg/kg to 3,500 mg/kg (see Table 15).
The predictions for proportions of infants and children exceeding the exposure of 15 mg/kg b.w. by eating spinach are overestimations since there is a lower current maximum level for spinach other than fresh, but available consumption information could not differentiate between consumption of spinach purchased as preserved or frozen, and that cooked from fresh at home.

Nitrate in vegetables - children
26 EFSA Journal 2010;8(12):1935
The relatively modest impact of changes to the maximum levels can be explained by the fact that only about 1 % of lettuce samples and 5 % of spinach samples exceeded the respective current maximum limits.
6. Hazard identification and characterisation
To provide background and context for consideration of possible health risks for infants and young children from the presence of nitrate in leafy vegetables such as lettuce and spinach, this section focuses on human data covering the period above 3 months of age to 18 years of age. Information from laboratory animal studies and human epidemiology have been discussed in detail in the EFSA Scientific Opinion on Nitrate in Vegetables (EFSA, 2008). Following acute exposure, the critical toxicity of nitrate in animals and humans is the reduction of nitrate to nitrite and the ready formation of MetHb which can lead to cyanosis and, in the young infant, to the “blue baby syndrome”.
In humans, nitrate is well absorbed in the upper small intestine and is then concentrated from the plasma to the saliva and approximately 20 % is reduced to nitrite by nitrite reductase in bacteria on the back tongue. Salivary nitrite is then swallowed and reduced to nitric oxide (NO) in the acidic conditions of the stomach, oxidised to nitrate in the plasma and re-circulated through the saliva. In parallel, endogenous synthesis of NO occurs during the urea cycle through the oxidation of a guanido- nitrogen of L-arginine by the NO-synthase. Under normal physiological conditions, nitrate is readily excreted in the urine (EFSA, 2008). Excessive levels of nitrate can be reduced to nitrite which couples with oxyhaemoglobin resulting in formation of MetHb. The extent of MetHb formation in infants and young children depends on several variables including nitrate and nitrite exposure from diet and water, gastro-intestinal infections, diarrhoea, acidosis and exposure to a number of drugs (Sànchez-Echaniz et al., 2001).
6.1. Acute toxicity of nitrate
The acute oral toxicity of nitrate in animals is generally low with lethal dose (LD50) values of approximately 2500-6250 mg/kg b.w. per day in mice, 3300-9000 mg/kg b.w. per day in rats, 1900-2680 mg/kg b.w. in rabbits and 300 mg/kg b.w. in pigs (Walker, 1990; Speijers, 1987).
FAO/WHO (1996) noted human lethal doses of 4-50 g nitrate (equivalent to 67-833 mg/kg b.w.) and that MetHb formation was reported at 33–150 mg of nitrate per kg of body weight). However FAO/WHO considered that the reports of toxicity at low doses were difficult to interpret due to the lack of information in the reports (FAO/WHO, 1996). In contrast, no signs of toxicity were reported in a study of 12 volunteers receiving intravenously 9.5 g of sodium nitrate in 1 h (equivalent to 99 mg/kg b.w. nitrate for a 70 kg adult), while in 2 of 12 other persons orally administered 7-10.5 g of ammonium nitrate (equivalent to 78-116 mg/kg b.w. nitrate for a 70 kg adult) in one dose, vomiting and diarrhoea occurred (Ellen et al., 1982; FAO/WHO, 1996). FAO/WHO (1996) noted that the human lethal dose in adult humans is probably around 20 g, equivalent to 330 mg/kg b.w. nitrate for a 60 kg adult. This suggests that the sensitivity of adult humans to acute toxicity of nitrate is similar to that of the pig. In view of these species differences, the data from experimental animals were not considered to form an appropriate basis for deriving an ARfD for nitrate.
6.2. MetHb in humans
MetHb generally represents about 1 % of the total Hb of the healthy adult, although it can be slightly higher in preterm and term newborn infants. Methaemoglobinemia generally manifests with few clinical signs other than cyanosis. Table 16 illustrates the signs and symptoms generally considered to be associated with MetHb formation. Cyanosis has been reported at MetHb concentrations as low as 3 % in infants with low Hb concentrations (Greer and Shannon, 2005). Levels of 10 % or more are generally associated with clinically reduced oxygen transport. At levels above 20 %, cyanosis and

Nitrate in vegetables - children
27 EFSA Journal 2010;8(12):1935
hypoxia can occur and above 50 % MetHb can prove fatal (Mensinga et al., 2003). The relationship between blood nitrate and MetHb formation is not linear at lower nitrate concentrations, since the reduction to nitrite is the critical step before a measurable increase in MetHb formation can be detected (Kross et al.,1992).
Table 16: Methaemoglobin concentrations and clinical symptoms in humans (from Kross et al., 1992 adapted from Dabney et al., 1990).
Methaemoglobin concentration (%) Clinical findings 10–20 Central cyanosis of limbs/trunk; often asymptomatic but may
have weakness, tachycardia 20–35 Central nervous system depression (headache, dizziness, fatigue),
dyspnoea, nausea 35–55 Lethargy, syncope, coma, arrhythmias, shock, convulsions >70 High risk of mortality
Infants younger than 3 months of age are more susceptible to methaemoglobinemia than adults due to a 40-50 % lower activity of NADH-cytochrome b5 MetHb reductase (which converts MetHb back to Hb) and their increased risk for intestinal infections (Savino et al., 2006). Epidemiological data relating nitrate levels and MetHb formation in infants and children is derived from infants below 3 months, infants above 3 months of age and children above 1 year. Since this opinion deals with health risks related to the presence of nitrate in vegetables, which would not be consumed by infants below 3 months, the analysis presented below deals only with infants > 3 months of age and above unless the published data have not been stratified by age group.
6.3. Evidence of MetHb formation in infants and children
Methaemoglobinemia has been associated with a number of different conditions in addition to nitrate. These include gastro-intestinal infections (Yano et al., 1982, reviewed in Fewtrell, 2004; Bricker et al., 1983; Danish, 1983; Dagan et al., 1988; Kay et al., 1990; Lebby et al., 1993; Gebara and Goetting, 1994; Smith et al., 1988;) or secondary to cows’ milk protein intolerance. Additionally, nitric oxide, produced by several tissues in response to infection and inflammation, has also been proposed as a possible mechanism since it also generates nitrite (Gupta et al., 1998; Levine et al., 1998).
Other factors that may influence MetHb formation include acidosis, exposure to a number of drugs including topical anaesthetic agents, silver nitrate, chloroquin, sulfonamides, dapsone, phenacetin, sodium valproate, phenazopyridine, inhaled nitrous oxide, amyl nitrite, as well as acute nitrite toxicity resulting from accidental exposure to aniline dyes, colouring compounds or cleaning solutions (Sànchez-Echaniz et al., 2001). Yano et al. (1982) has discussed that diarrhoea produces acidosis that increases MetHb production and that acidosis impairs the MetHb reductase systems. Anti-oxidants such as vitamins C and E, which are present at relatively high levels in leafy vegetables, have been shown to be efficient inhibitors of MetHb formation (Chow et al., 1984; Hirneth and Classen, 1984; Doyle et al., 1985; Hong and Chow, 1987, 1988; Chow and Hong, 2002; Lundberg et al., 2008). The impact of this, if any, on MetHb formation under realistic conditions of dietary exposure is unclear.
6.3.1. MetHb formation from consumption of vegetables
There are few studies relating MetHb in infants and children to consumption of vegetables although there are many publications that discuss individual cases.
Kübler (1958) reported no clinically relevant MetHb formation in seven infants (average 5.7 months and 6.7 kg) after ingestion of spinach with about 680 mg/kg nitrate (corresponding to nitrate doses of 16.5-21 mg/kg b.w. per day) for one week compared to one week ingestion of vegetables with low
Nitrate in vegetables - children
28 EFSA Journal 2010;8(12):1935
(about 14 mg/kg) nitrate levels. Six of the infants (5-8 months old) showed no increase in MetHb formation after consumption of 200 g spinach a day for a week with the high nitrate level, whereas the youngest subject (3½ months) showed a slight increase in MetHb, which the author considered not clinically significant. This subject already had the highest MetHb level prior to consumption of the nitrate-rich spinach, and the MetHb level after the week of consuming low nitrate spinach was lower than at the start of the study (Table 17). The authors showed that nitrate was excreted in the urine and that nitrite levels in blood were low. Turek et al. (1980) reported that in infants the amount of nitrate excreted in the urine was 80-100 % of the amount ingested, whereas the amount in adults was only 30-35 %.
Sinios and Wosak (1965) reported fourteen cases of methaemoglobinaemia in infants aged 2-10 months from Germany. In these cases, meals were prepared with fresh spinach at least 24 hours before the meal time. The authors concluded that nitrite was formed in the spinach during storage. Recently, Tamme et al. (2010) investigated the influence of storage conditions on nitrate and nitrite contents, pH, and total viable bacterial count of raw vegetable juices. Reduction of nitrate to nitrite was shown after storage of vegetables, during storage for 48 h at ambient temperature, the nitrite content of carrot, beetroot and radish juices increased from 0.1 to 187, from 2.1 to 578, and from 0.5 to 259 mg/L, respectively. In the case of commercial lightly pasteurised products, the largest increase in nitrite content, from 3.2 to 11 mg/L, was found in red beetroot juice stored for 48 h at ambient temperature. After 48 h of storage at refrigerator temperature (4-6°C), the changes in nitrite and nitrate were smaller. In the case of consumption of 50 ml of homemade carrot juice, with nitrate and nitrite contents of 64 and 110 mg/L, respectively, stored for 24 h at ambient temperature, the average intake in children aged 1-2 years would be 7 % and 733 % of the ADIs for nitrate and nitrite, respectively.
Sànchez-Echaniz et al. (2001) reported cases of methaemoglobinaemia in 8 months old infants following ingestion of vegetable puree made from stored silver beets with mean nitrate levels of 200-3200 mg/kg. A case of elevated MetHb (25 %) in conjunction with supraventricular tachycardia and perioral cyanosis was reported in a 6 month old infant who had consumed mixed-vegetable puree from potatoes, carrots, squash and celery three hours before. The puree had been prepared five days earlier and kept in the refrigerator. No information was provided on the content of nitrate or nitrite or of the amount of puree consumed (Bryk et al., 2003).

Nitrate in vegetables - children
29 EFSA Journal 2010;8(12):1935
Table 17: Methaemoglobin levels in infants consuming vegetables containing high and low levels of nitrate (from Kübler, 1958).
Subject Age
(months)
Average a
body weight (kg)
% MetHb
MetHb control MetHb high nitrate
MetHb Low nitrate
1 5 7.3 0.6 0.2 1.2 2 8 8.0 0.2 0.2 0.4 3 8 7.2 0.1 0.6 0.8 4 4 8.2 0.8 0.8 0.8 5 6 7.3 0.3 0.05 1.0 6 3.5 5.9 2.6 3.4 1.0 7 5 6.5 0 0.2 0
Average 5.71 6.7 0.66 0.78 0.74 a Average of weight recorded at the start and end of the study MetHB: methaemoglobin.
Spinach contains vitamins C and E, β-carotene and other carotenes and phenolic compounds. Antioxidant activity and phenolic content of fresh, refrigerated, and processed spinach have been reported (Gupta and Wagle, 1998; Howard et al., 2002; Lomnitski et al., 2003; Aehle et al., 2004; Ismail et al., 2004; Bunea et al., 2008; Yosefi et al., 2010). Co-incubation of ascorbic acid with nitrite in rat and human erythrocytes showed a significant reduction in MetHb formation in a concentration-dependent manner compared with erythrocytes incubated with nitrite only. Human erythrocytes were shown to be 4-fold more sensitive to MetHb formation compared to rat erythrocytes (Calabrese et al., 1983).
6.3.2. MetHb formation from exposure to nitrate via consumption of water
Studies from the literature that correlate nitrate levels in water with MetHb in infants/children, have been reviewed by a number of authors and the limitations of these studies have been discussed. These limitations include: the nitrate levels were measured in water after the detection of elevated MetHb in infants/children; the contamination of well water with bacteria which reduce nitrate to nitrite; the presence of gastro-intestinal infections and diarrhoea in infants and children, which enhances the reduction of nitrate to nitrite and subsequent MetHb formation. Finally, for most studies, information on levels of nitrite in the water are not available (Mensinga et al., 2003; Addiscott and Benjamin, 2004; van Grinsven et al., 2006; Lundberg et al., 2008; Powlson et al., 2008; ). These factors can increase exogenous and/or endogenous exposure to nitrite, and therefore the observed associations often due to the unknown nitrite exposure, rather than to the measured nitrate content in the drinking water. On the other hand the MetHb response to authenticated nitrate levels in drinking water gives a good approximation of human dose response using MetHb as a biomarker. The following paragraphs summarise the data that provide some information on relationships between nitrate exposure and MetHb levels.
Simon et al. (1964) summarised 745 cases of infant methaemoglobinaemia, reported over an 8 year period using a questionnaire and associated with nitrate in water. Almost all cases of methaemoglobinaemia were associated with private well water (97 %) and related to infants under 3 months of age (98 %), of which 53 % had diarrhoea and 8.6 % died. For infants aged 3 to 6 months, out of 89 controls (considered by the authors as nitrate-free water), 38 received water containing 50-100 mg/L nitrate, and 25 infants received water containing >100 mg/L nitrate. Average MetHb levels were 0.80, 0.80, and 0.70 %, respectively, in these three groups, and clinical methaemoglobinaemia was not reported in any of the infants (Simon et al., 1964; Phillips, 1971).
Nitrate in vegetables - children
30 EFSA Journal 2010;8(12):1935
Shearer et al. (1972) studied infants in communities of the USA using ground water with nitrate content of <22.2, 22.2-<44.3 and >44.3 mg/L. Estimations of 24 h nitrogen intake from nitrate and nitrite were <5, 5-9.9 and 10-29 mg. None of the 144 infants aged 3 months or more had MetHb levels above 4 %. Shuval and Gruener (1972) found no differences between the mean levels of MetHb in Israeli infants up to about 18 months old in a region with 50-90 mg/L nitrate in drinking water and those in an area with low (5 mg/L) nitrate. The authors ascribed the lack of methaemoglobinaemia in the infants in the high nitrate region to the low consumption of tap water and to feeding of foods rich in vitamin C (e.g. citrus and tomato juices).
Super et al. (1981) reported a strong correlation between nitrate well-water levels (< 20 mg/L compared with > 20 mg/L) in Namibia and MetHb levels in infants up to 12 months old. MetHb levels ranged from 0 to 35 %, with a significantly greater proportion of infants with MetHb exceeding 3 % in the region with water nitrate > 20 mg/L and with estimated nitrate intakes > 2.93 mg/kg b.w. per day. The nitrite concentration of the water was reported to be low. In contrast to other studies the MetHb levels were not higher in younger infants. The author attributed this difference to the rarity of vitamin C administration in their study group.
A correlation study in children aged 1–8 years in Illinois, USA, found no difference in MetHb levels between 64 children consuming high nitrate well water (100–500 mg/L) and 38 children consuming low-nitrate water (44 mg/L), and that all the MetHb levels were within the normal range (Craun et al., 1981). Water consumption was reported to be 1.23 and 1.24 L per day for ages 1-4 and 5-8 years old, respectively, which would correspond to intakes of 123-615 mg per day for the younger age group (equivalent to an average of 18 mg/kg b.w. per day for a 20 kg child), before taking into account nitrate in food.
The prevalence of methaemoglobinaemia has been studied in areas of India, based on data for 178 children in groups of approximately 30 matched for age and weight average. Water concentrations were 26, 45, 95, 220, and 460 mg nitrate/L. The highest nitrate concentration (460 mg/L) was associated with MetHb levels of 7–27 % in the age groups < 1 year and < 18 years. (Gupta et al., 2000).
Table 18 summarises the associations between concentration of nitrate in drinking water and MetHb levels in healthy infants aged more than 3 months and in children, indicating that MetHb is not elevated when nitrate in drinking water is below 100 mg/L. Assuming a high level water intake of 150 mL/kg b.w. per day for formula-fed infants indicates that MetHb is not elevated at nitrate intakes below 15 mg/kg b.w. per day.

Nitrate in vegetables - children
31 EFSA Journal 2010;8(12):1935
Table 18: Relationship between water content of nitrate and MetHb in infants above 3 months and children above 1 year.
* statistically significant difference
6.4. Possibilities for establishing an Acute Reference Dose (ARfD)
Since nitrate, after reduction to nitrite, has the potential to cause methaemoglobinaemia, which might occur after a single exposure, it would be appropriate to establish an ARfD in order to assess the safety of acute exposure to nitrate.
The available data on acute lethal doses of nitrate span over an order of magnitude, ranging from 300 to 9000 mg/kg b.w. in different species of animals, with the pig being the most sensitive. The limited available human data on lethality indicate that the sensitivity of adult humans might be similar to that of the pig, but do not support the identification of an ARfD.
The toxicological effects of nitrate result from its reduction to nitrite and subsequent formation of MetHb, with young infants (0-3 months) being the most sensitive age group. This pre-weaning age group is not relevant to the focus on nitrate exposure from spinach and lettuce in the current statement. The few available data relating consumption of nitrate-containing vegetables to methaemoglobinaemia in infants do not provide adequate information on exposure to be used as the basis for setting an ARfD. The data relating nitrate in drinking water to methaemoglobinaemia in infants cannot be used in setting an ARfD for nitrate because of the possible confounding influences of bacterial infection, nitrite exposure, the limitations in the exposure data and the greater sensitivity of very young infants. However, the available data indicate that MetHb is not elevated in children or infants above 3 months old when exposure to nitrate from drinking water is below at least 15 mg/kg b.w. per day, and this value is supported by the data on MetHb formation from consumption of vegetables.
7. Risk characterisation
New data available to the CONTAM Panel on children’s food consumption supported a more refined exposure assessment than was conducted in the previous opinion (EFSA, 2008). The estimated 97.5th
percentile chronic exposure to nitrate from all foods, including spinach and lettuce, for children aged 1-18 years was below or in the region of the ADI of 3.7 mg/kg b.w. This supports the previous evaluation and is not a health concern. In the 1-3 years old age group estimated median nitrate
Water Nitrate (mg/L) Age N % MetHb Reference
Infants0 90-180 days 89 0.8 Simon et al. (1964)
50-100 90-180 days 38 0.8 Simon et al. (1964) >100 90-180 days 25 0.7 Simon et al. (1964) 22.2 91-120 days 68 <4 % Shearer et al. (1972) 44.3 >120 days 76 <4 % Shearer et al. (1972)
5 >91days 556 0.97 Shuval et al. (1972) 50-90 >91days 1426 0.99 Shuval et al. (1972)
Children≤44 1-4 years 37 0.98 Craun et al.(1981) ≥88 5-8 years 62 1.13 Craun et al. (1981) ≤44 >4 years 234 1.4-1.8 Diskalenko (1968) 792 >4 years 126 2.1-3.3* Diskalenko (1968) 898 >4 years 208 3.1-7.1* Diskalenko (1968) 8.8 >4 years 10 0.8 Subbotin (1961) 101 >4 years 11 5.3* Subbotin (1961)

Nitrate in vegetables - children
32 EFSA Journal 2010;8(12):1935
exposure was 1.39 mg/kg b.w. per day and at the 97.5th percentile was 4.76 mg/kg b.w. per day. This small exceedance of the ADI is undesirable but not clearly a health concern in the light of the established benefits of vegetable consumption. The focus of the present statement is on acute exposure to nitrate in lettuce and spinach and on the impact of current derogation measures or changes to prescribed maximum levels. As the chronic nitrate exposure is in the region of the ADI, it is to be expected that acute exposure will exceed the ADI on some occasions. Occasionally exceeding the ADI does not per se indicate a health risk, since the ADI for nitrate was derived from subchronic and chronic studies. Whilst the available data do not support establishment of an ARfD, the data from drinking water and vegetable consumption indicated that at nitrate exposures below at least 15 mg/kg b.w. per day, MetHb was not elevated in children or infants above 3 months old.
For infants, cooked spinach is more likely to be a component of the diet than lettuce. For the purposes of this statement, potential nitrate exposure was estimated based on a scenario of spinach cooked from fresh in one composite meal, with nitrate concentrations of 816, 3000, and 3500 mg/kg in the spinach, representing the median of the available occurrence data, the current maximum level for spinach, and the proposed higher maximum level, respectively. Nitrate exposure resulting from these nitrate concentrations would be highest in the 12 month-old age group, at 3.8, 13.8, and 16.1 mg/kg b.w. for high spinach consumption (42.2 g/kg). In infants aged 6 months, high level consumption of spinach (30.7 g/kg) is estimated to result in nitrate exposures of 1.6, 5.8, and 6.8 mg/kg b.w. per day at the above nitrate concentrations. Thus nitrate exposure of infants at the median of the available occurrence data for nitrate in spinach is below the ADI and clearly not a concern. Nitrate exposure at the current and proposed maximum levels would result in exposure up to 16 mg/kg b.w. without taking into account other sources of exposure, such as water. Taking into account that the available data indicate that nitrate exposure at about this level has not been associated with elevated MetHb, this level of exposure is not likely to be a health concern. However, in a worst-case consumption scenario in which infants eat 2 meals consisting solely of spinach in a single day, a dietary exposure of 55.3 mg/kg b.w. per day was estimated for the 12 months old age group at the current maximum level for nitrate in spinach permitted in legislation, or 64.3 mg/kg b.w. per day at the proposed maximum level of 3,500 mg/kg, and the possibility of a risk for some infants cannot be excluded.
Modelling using all of the available occurrence data indicated that 8.3 % of infants might exceed 15 mg/kg b.w. on consumption days of spinach. This scenario is relevant to the situation in which there are derogations of the regulations. This proportion reduces to 5.6 % if the occurrence data are truncated at 3,000 mg/kg spinach, representing a situation in which the current maximum level is enforced, and to 6.4 % if a higher maximum level of 3,500 mg/kg is introduced.
Estimated exposures to nitrate calculated for median consumption of lettuce by children aged 1-18 years and either median or 95th percentile concentration of nitrate in lettuce were below the ADI. At high level (97.5th percentile) consumption of lettuce, the estimated exposure is up to 12 mg/kg b.w. overall in children aged 1-18 years, with the highest value of 16 mg/kg b.w. in children aged 4-6 years. Since these estimates do not markedly exceed 15 mg/kg b.w., adverse health effects associated with such exposure are unlikely.
Based on all the available occurrence data it was estimated that exposure of 0.21 % of children consumers of lettuce might exceed 15 mg/kg b.w. on an individual day. Strictly enforcing the current highest maximum level of 4,500 mg/kg had the potential to decrease these percentages to 0.11 %, and to 0.13 % at a maximum level of 5,000 mg/kg. The numbers of children exceeding these exposures would be lower when applying the current and proposed maximum levels for lettuce harvested in the summer. The available consumption data are insufficient to determine differences in consumption between winter and summer months, but it is likely that consumption of lettuce is lower in the winter months when the maximum levels are higher. In addition, there is some indication that consumption of lettuce is lower in Northern European countries, where nitrate concentrations in lettuce are higher.
Overall the CONTAM Panel concluded that levels of nitrate in lettuce are not a health concern, and that enforcing the current maximum levels, or proposed maximum levels at 500 mg/kg higher than the
Nitrate in vegetables - children
33 EFSA Journal 2010;8(12):1935
current maximum levels, would have a minor impact compared to the situation of local derogations from the maximum levels.
Spinach also has the potential to be the greatest contributor to children’s total dietary exposure to nitrate. Based on median consumption of spinach and median concentration of nitrate in spinach the estimated exposure is slightly above the ADI for nitrate in 1-3 year olds, and below the ADI for older children. The estimated exposure was increased to 10.9 mg/kg b.w. in 1-3 year olds and to 6.66 mg/kg b.w. overall in children aged 1-18 years, at the 95th percentile concentration level in spinach. The highest estimated exposures are for high level consumption of spinach combined with high level occurrence, which at the 95th percentile in children aged 1-3 years is approximately three fold higher than the level of 15 mg/kg b.w. expected to be without effect and the possibility of a risk for some young children cannot be excluded.
For spinach, it was estimated that exposure of 3.0 % of children consumers of spinach might exceed 15 mg/kg b.w. on an individual day. Strictly enforcing the current maximum level of 3,000 mg/kg had the potential to decrease this percentage to 2.2 %, or 2.3 % at a maximum level of 3,500 mg. The prediction for spinach is an overestimation since there is a lower current maximum level for spinach other than fresh, but available consumption information could not differentiate between the groups.
Overall the CONTAM Panel concluded that levels of nitrate in spinach have the potential to increase dietary exposure to nitrate to levels at which a health concern cannot be excluded, particularly in infants fed spinach twice in a single day. Again, enforcing the current maximum levels, or proposed maximum levels at 500 mg/kg higher than the current maximum levels, would have a minor impact compared to the situation of local derogations from the maximum levels.
The relatively modest impact of changes to the maximum levels can be explained by the fact that only about 1 % of lettuce samples and 5 % of spinach samples exceeded the respective current maximum levels.
Inappropriate storage of cooked vegetables can result conversion of nitrate to nitrite in situ, resulting in greatly increased potential for causing methaemoglobinaemia.
The CONTAM Panel noted that infants and children with bacterial infections of the gastrointestinal tract are more sensitive to the effects of nitrate, and recommended against feeding spinach to such children.
8. Uncertainty
The evaluation of the inherent uncertainties in the assessment of exposure to nitrate has been performed following the guidance of the Opinion of the Scientific Committee related to Uncertainties in Dietary Exposure Assessment (EFSA, 2006). In addition, the World Health Organization/International Programme on Chemical Safety (WHO/IPCS) monograph on “Characterizing and Communicating Uncertainty in Exposure Assessment” has been considered (WHO/IPCS, 2008). According to the guidance provided by the EFSA (EFSA, 2006) the following sources of uncertainties have been considered: assessment objectives, exposure scenario, exposure model, and model input (parameters).
8.1. Assessment objectives
The objectives of the assessment were clearly specified in the terms of reference and the Panel prepared a risk assessment focussing on possible risk for infants and children related to the presence of nitrate in fresh vegetables, also considering acute dietary intake. The assessment took into account recent occurrence data, detailed consumption data and the impact of enforcing the current maximum

Nitrate in vegetables - children
34 EFSA Journal 2010;8(12):1935
level or slightly higher maximum levels. The uncertainty in the assessment objectives is considered to be negligible.
8.2. Exposure scenarios/Exposure model
Several exposure scenarios have been considered to estimate the exposure to nitrate. All scenarios are based on raw products. The possible changes of the nitrate content due to processing of the food commodities, such as washing, peeling and/or cooking, could not be considered due to lack of representative data. However, overall, the data indicate that processing is likely to reduce nitrate levels and thus the non-consideration of the quantitative impact of food processing on nitrate levels may lead to an overestimation of the exposure, provided that cooked vegetables are not stored under conditions promoting conversion of nitrate to nitrite.
8.3. Model input (parameters)
A number of uncertainties can be identified regarding the selection of parameters, such as characterisation of levels in food commodities and selection of consumption data.
The samples reported from the Member States differ greatly regarding the number of vegetables tested as well as concentrations determined in the respective products.
The use of the EFSA Comprehensive European Food Consumption Database reduces the uncertainty in exposure assessment for children aged 1-18 years, compared to the CONTAM Panel’s 2008 opinion. Remaining uncertainties relate to differences between survey methodologies between countries, not all European countries are represented and the limited availability of consumption data for infants.
There is uncertainty related to the possible health impact of acute dietary exposure above the ADI and the available data did not support the establishment of an ARfD. The Panel identified an intake of nitrate from drinking water that has not been shown to cause elevated MetHb in children or infants above 3 months old. It has been suggested that higher exposures from vegetables would be without adverse effect because of the concomitant exposure to antioxidants; however, the available data do not allow conclusions on this point.
8.4. Summary of uncertainties
Table 19 presents a summary of the uncertainty evaluation, highlighting the main sources of uncertainty and indicating an estimate of whether the respective source of uncertainty might have led to an over- or underestimation of the exposure or the resulting risk. The magnitude is related to the source of uncertainty and should not be compared/summed from one source to another.

Nitrate in vegetables - children
35 EFSA Journal 2010;8(12):1935
Table 19: Summary of qualitative evaluation of the impact of uncertainties on the risk assessment for infants and young children due to the presence of nitrate in leafy vegetables.
Sources of uncertainty Direction (a)
Uncertainty due to type of sampling, as samples are mostly collected in order to check for compliance with legal limits and not for monitoring purposes aimed at estimation of human exposure
+/-
Uncertainty about the representativeness of most samples concerning, country of origin, size, regional and seasonal differences, specific type of vegetable
+/-
Consumption data from only a number of Member States +/- Reliance on scenarios for infant consumption data + Uncertainties regarding the influence of food processing and/or cooking on the nitrate levels in the processed food
+
Uncertainties regarding the influence of storage on the nitrite level in food - Limitations in the toxicological data to assess risks of exposure above the ADI + (a): + = uncertainty with potential to cause over-estimation of exposure/risk; - = uncertainty with potential to cause
underestimation of exposure/risk. The Panel considered the impact of the uncertainties on the exposure to nitrate due to consumption of lettuce and spinach and assessment of the possible health impact and concluded that the risk assessment is likely to be conservative, i.e. more likely to over- than to underestimate the risk.
CONCLUSIONS AND RECOMMENDATIONS
CONCLUSIONS
• Nitrate is a naturally occurring compound present in vegetables. Some vegetables, particularly leafy vegetables like lettuce and spinach, have been shown to have relatively high levels of nitrate, which are increased when grown under cover and/or in conditions of reduced lighting.
• Approximately 45,000 analytical results for nitrate in vegetables were considered in this assessment, including 3,733 results submitted to EFSA since the 2008 opinion. The data included 13,391 results for lettuce and 7,358 results for spinach.
• New data available to the Panel on Contaminants in the Food Chain (CONTAM Panel) on children’s food consumption supported a more refined exposure assessment than was conducted in the 2008 opinion. Vegetable and fruit consumption was common with 98 % of the children consuming some sort of vegetable or fruit during at least one day of the respective survey period. Fruit consumption comprised 60 % of the combined amount leaving median vegetable consumption at 61 g per day with 95th percentile consumption at 207 g per day.
• On average, vegetable consumption comprised 6 % of total food and beverage consumption of children in the countries surveyed. Lettuce comprised on average 3.7 % of the vegetables consumed, and spinach 2.6 %.
• Estimates of chronic exposure to nitrate of children aged 1-18 years, including from lettuce and spinach, were below or in the region of the acceptable daily intake (ADI) of 3.7 mg/kg b.w., supporting the results of the 2008 opinion.
• In line with the request from the Commission, the CONTAM Panel focussed its current statement on children’s acute exposure to nitrate in lettuce and spinach and the impact of derogation measures or changes to the established maximum levels.

Nitrate in vegetables - children
36 EFSA Journal 2010;8(12):1935
• As some estimates of chronic nitrate exposure were in the region of the ADI, it is to be expected that acute exposure will exceed the ADI on some occasions. Occasionally exceeding the ADI does not per se indicate a health risk, since the ADI for nitrate was derived from subchronic and chronic studies.
• Since nitrate, after reduction to nitrite, has the potential to cause methaemoglobinaemia, which might occur after a single exposure, it would be appropriate to establish an Acute Reference Dose (ARfD). However, the available data from studies in experimental animals and reports of human nitrate poisoning did not provide an adequate basis for establishing an ARfD.
• The available data related to nitrate in drinking water and in vegetables indicated that methaemoglobin (MetHb) is not elevated in children or infants above 3 months old when exposure to nitrate is below at least 15 mg/kg body weight (b.w.) per day.
• For infants, cooked spinach is more likely to be a component of the diet than lettuce. Potential nitrate exposure was estimated based on a scenario of spinach cooked from fresh in one composite meal, with nitrate concentrations representing the median of the available occurrence data, the current maximum level for fresh spinach, and the proposed higher maximum level.
• Nitrate exposure of infants at the median of the available occurrence data for nitrate in spinach is at or below the ADI and clearly not a concern. Eating a single meal of spinach containing nitrate at the current or proposed maximum levels would result in exposure of about 15 mg/kg b.w. without taking into account other sources of exposure. Taking into account the available data on nitrate exposure associated with elevated MetHb, this exposure is not likely to be a health concern. However, a risk to some infants eating more than one spinach meal in a day cannot be excluded.
• Modelling using all of the available occurrence data indicated that 8.3 % of infants might exceed 15 mg/kg b.w. on consumption days of spinach. This proportion reduces to 5.6 % if the current maximum level of 3,000 mg/kg spinach is enforced, and to 6.4 % if a maximum level of 3,500 mg/kg is enforced.
• Estimated total dietary exposures to nitrate of children aged 1-18 years ranged from 1.7 to 4.2 mg/kg b.w. at median consumption of lettuce, to approximately 16 mg/kg b.w. at high level consumption of lettuce, combined with high level occurrence data. Taking into account the available data on nitrate exposure associated with elevated MetHb, this exposure is not likely to be a health concern.
• Modelling using all the available occurrence data indicated that dietary exposure of 0.21 % of child consumers of lettuce might exceed 15 mg/kg b.w. on an individual day. Strictly enforcing the current highest maximum level of 4,500 mg/kg had the potential to decrease this percentage to 0.11 %, or to 0.13 % at a maximum level of 5,000 mg/kg. The number of children exceeding these exposures would be lower when applying the current and proposed maximum levels for lettuce harvested in the summer.
• Overall, the CONTAM Panel concluded that levels of nitrate in lettuce are not a health concern.
• Based on median consumption of spinach and median concentration of nitrate in spinach the estimated exposure is slightly above the ADI for nitrate. Exposure estimates based on high level consumption of spinach and high level occurrence data, are up to approximately three-fold higher than 15 mg/kg b.w. in children aged 1-3 years, and the possibility of a risk for some young children cannot be excluded.
• For spinach, it was estimated that 3.0 % might exceed 15 mg/kg b.w. on an individual day. Strictly enforcing the current maximum level of 3,000 mg/kg had the potential to decrease these

Nitrate in vegetables - children
37 EFSA Journal 2010;8(12):1935
percentages to 2.2 %, or to 2.3 % at a maximum level of 3,500 mg. The prediction for spinach is an overestimation since there is a lower current maximum level for spinach other than fresh, but available consumption information could not differentiate between consumption of spinach purchased as preserved or frozen, and that cooked from fresh at home.
• Overall, the CONTAM Panel concluded that the concentrations of nitrate in spinach have the potential to increase dietary nitrate exposure to levels at which a health concern can not be excluded. Enforcing the current maximum levels for nitrate in lettuce and spinach, or proposed maximum levels at 500 mg/kg higher than the current maximum levels, would have a minor impact compared to the situation of local derogations from the maximum levels, because only about 1 % of lettuce samples and 5 % of spinach samples exceeded the respective current maximum levels.
• Inappropriate storage of cooked vegetables can result in direct conversion of nitrate to nitrite, resulting in greatly increased potential for causing methaemoglobinaemia.
RECOMMENDATIONS
• The CONTAM Panel noted that infants and children with bacterial infections of the gastrointestinal tract are more sensitive to the effects of nitrate, and recommended against feeding spinach to such children.
REFERENCES Addiscott TM and Benjamin N, 2004. Nitrate and human health. Soil Use and Management, 20, 98-
104.
Aehle E, Raynaud-Le Grandic S, Ralainirina R, Baltora-Rosset S, Mesnard F, Prouillet C, Maziere JC and Fliniaux MA, 2004. Development and evaluation of an enriched natural antioxidant preparation obtained from aqueous spinach (Spinacia oleracea) extracts by an adsorption procedure. Food Chemistry, 86, 579-585.
ATSDR (Agency for Toxic Substances and Disease Registry), 2004. Interaction profile for cyanide, fluoride, nitrate, and uranium. Atlanta: US Department of Health and Human Services.
Boon PE, Bakker MI, van Klaveren JD and van Rossum CTM 2009. Risk assessment of the dietary exposure to contaminants and pesticide residues in young children in the Netherlands. Report 350070002/2009, RIVM, Bilthoven, The Netherlands.
Bricker T, Jefferson LS and Mintz AA, 1983. Methemoglobinemia in infants with enteritis. Journal of Pediatrics, 102, 161-161.
Bryk T, Zalzstein E and Lifshitz M, 2003. Methemoglobinemia induced by refrigerated vegetable puree in conjunction with supraventricular tachycardia. Acta Paediatrica, 92, 1214-1215.
Bunea A, Andjelkovic M, Socaciu C, Bobis O, Neacsu M, Verhe R and Van Camp J, 2008. Total and individual carotenoids and phenolic acids content in fresh, refrigerated and processed spinach (Spinacia oleracea L.). Food Chemistry, 108, 649-656.
Calabrese EJ, Moore GS and McCarthy MS, 1983. The effect of ascorbic acid on nitrite-induced methemoglobin formation in rats, sheep, and normal human erythrocytes. Regulatory Toxicology and Pharmacology, 3, 184-188.
Chow CK and Hong CB, 2002. Dietary vitamin E and selenium and toxicity of nitrite and nitrate. Toxicology, 180, 195-207.
Chow CK, Hong CB, Reese ME and Gairola C, 1984. Effect of dietary vitamin E on nitrite-treated rats. Toxicology Letters, 23, 109-117.
Nitrate in vegetables - children
38 EFSA Journal 2010;8(12):1935
Chung JC, Chou SS and Hwang DF, 2004. Changes in nitrate and nitrite content of four vegetables during storage at refrigerated and ambient temperatures. Food Additives and Contaminants, 21, 317-322.
Craun GF, Greathouse DG and Gunderson DH, 1981. Methaemoglobin levels in young children consuming high nitrate well water in the United States. International Journal of Epidemiology, 10, 309-317.
Dabney BJ, Zelarney PT and Hall AH, 1990. Evaluation and treatment of patients exposed to systemic asphyxiants. Emerging Care Quarterly, 6, 65-80.
Dagan R, Zaltzstein E and Gorodischer R, 1988. Methaemoglobinaemia in young infants with diarrhoea. European Journal of Pediatrics, 147, 87-89.
Danish EH, 1983. Methemoglobinemia in infants with enteritis - reply. Journal of Pediatrics, 102, 162-163.
Diskalenko, AP (1968). Methemoglobinemia of water-nitrate origin in the Moldavian SSR. Hyg. Sanit., 33, 32-37.
Doyle MP, Herman JG and Dykstra RL, 1985. Autocatalytic oxidation of hemoglobin induced by nitrite: activation and chemical inhibition. Journal of Free Radicals in Biology & Medicine, 1, 145-153.
Dusdieker LB and Dungy CI, 1996. Nitrates and babies: A dangerous combination. Contemporary Pediatrics, 13, 91-102.
Dusdieker LB, Getchell JP, Liarakos TM, Hausler WJ and Dungy CI, 1994. Nitrate in baby foods. Adding to the nitrate mosaic. Archives of Pediatrics & Adolescent Medicine, 148, 490-494.
EC (European Commission), 1992. Opinion on nitrate and nitrite. Reports of the Scientific Committee for Food (SCF) 26th Series, 21-28. Available from http://ec.europa.eu/food/fs/sc/scf/reports/scf_reports_26.pdf.
EC (European Commission), 1997. Opinion on nitrate and nitrite. Reports of the Scientific Committee for Food (SCF) 38th Series, 1-33. Available from http://ec.europa.eu/food/fs/sc/scf/reports/scf_reports_38.pdf.
EFSA (European Food Safety Authority), 2006. Guidance of the Scientific Committee on a request from EFSA related to Uncertainties in Dietary Exposure Assessment. The EFSA Journal. 438, 1-54.
EFSA (European Food Safety Authority), 2008. Nitrate in vegetables - Scientific Opinion of the Panel on Contaminants in the Food chain. The EFSA Journal. 689, 1-79.
Ellen G, Schuller PL, Bruijns E, Froeling PG and Baadenhuijsen HU, 1982. Volatile N-nitrosamines, nitrate and nitrite in urine and saliva of healthy volunteers after administration of large amounts of nitrate. IARC Scientific Publications, 365-378.
Faivre J, Faivre M, Klepping C and Roche L, 1976. Methemoglobinemias caused by ingestion of nitrites and nitrates. Annales de la Nutrition et de l'Alimentation, 30, 831-838.
FAO/WHO (Food and Agriculture Organisation of the United Nations/World Health Organization), 1996. Nitrate. In: Safety evaluation of certain food additives (Food additives Series 35). Geneva: World Health Organization,. Available from http://www.inchem.org/documents/jecfa/jecmono/v35je14.htm
FAO/WHO (Food and Agriculture Organisation of the United Nations/World Health Organization), 2003a. Nitrate (and potential endogenous formation of N-nitroso compounds). WHO Food Additive series 50, Geneva: World Health Organisation. http://www.inchem.org/documents/jecfa/jecmono/v50je06.htm.

Nitrate in vegetables - children
39 EFSA Journal 2010;8(12):1935
FAO/WHO (Food and Agriculture Organisation of the United Nations/World Health Organization), 2003b. Nitrite (and potential endogenous formation of N-nitroso compounds). WHO Food Additive series 50, Geneva: World Health Organisation. http://www.inchem.org/documents/jecfa/jecmono/v50je05.htm.
Fewtrell L, 2004. Drinking-water nitrate, methemoglobinemia, and global burden of disease: a discussion. Environmental Health Perspectives, 112, 1371-1374.
Filer LJ, Lowe CU, Barness LA, Goldbloom RB, Heald FP, Holliday MA, Miller RW, O'Brien D, Owen GM, Pearson HA, C.R. S, Weil WB, Kine OL, Craviato J and Whitten C, 1970. Infant methemoglobinemia: The role of dietary nitrate. Pediatrics, 46, 475-478.
Gebara BM and Goetting MG, 1994. Life-threatening methemoglobinemia in infants with diarrhea and acidosis. Clinical Pediatrics, 33, 370-373.
Gehle K, 2007. Nitrate/Nitrite Toxicity. Case Studies in Environmental Medicine, Agency for Toxic Substances and Disease Registry. Available from http://www.atsdr.cdc.gov/csem/nitrate/docs/nitrate_nitrite.pdf.
Greer FR and Shannon M, 2005. Infant methemoglobinemia: the role of dietary nitrate in food and water. Pediatrics, 116, 784-786.
Gupta K and Wagle DS, 1998. Nutritional and anti-nutritional factors of green leafy vegetables. Journal of Agricultural and Food Chemistry, 36, 472-474.
Gupta SK, Fitzgerald JF, Chong SK, Croffie JM and Garcia JG, 1998. Expression of inducible nitric oxide synthase (iNOS) mRNA in inflamed esophageal and colonic mucosa in a pediatric population. The American Journal of Gastroenterology, 93, 795-798.
Gupta SK, Gupta RC, Seth AK, Gupta AB, Bassin JK and Gupta A, 2000. Methaemoglobinaemia in areas with high nitrate concentration in drinking water. The National Medical Journal of India, 13, 58-61.
Hack WW, Douwes AC and Veerman AJ, 1983. Spinach: A source of nitrite poisoning in young children. Ned Tijdschr Geneeskd, 127, 1428-1431.
Hirneth H and Classen HG, 1984. Inhibition of nitrate-induced increase of plasma nitrite and methemoglobinemia in rats by simultaneous feeding of ascorbic acid or tocopherol. Arzneimittel-Forschung, 34, 988-991.
Hong CB and Chow CK, 1987. Prevention of eosinophilic enteritis and eosinophilia in rats with selenium and vitamin E. Federation Proceedings, 46, 1154-1154.
Hong CB and Chow CK, 1988. Induction of eosinophilic enteritis and eosinophilia in rats by vitamin E and selenium deficiency. Experimental and Molecular Pathology, 48, 182-192.
Howard LR, Pandjaitan N, Morelock T and Gil MI, 2002. Antioxidant capacity and phenolic content of spinach as affected by genetics and growing season. Journal of Agricultural and Food Chemistry, 50, 5891-5896.
Ismail A, Marjan ZM and Foong CW, 2004. Total antioxidant activity and phenolic content in selected vegetables. Food Chemistry, 87, 581-586.
Johnson CJ and Kross BC, 1990. Continuing importance of nitrate contamination of groundwater and wells in rural areas. American Journal of Industrial Medicine, 18, 449-456.
Kay MA, O'Brien W, Kessler B, McVie R, Ursin S, Dietrich K and McCabe ER, 1990. Transient organic aciduria and methemoglobinemia with acute gastroenteritis. Pediatrics, 85, 589-592.
Keating JP, Lell ME, Strauss AW, Zarkowsky H and Smith GE, 1973. Infantile methemoglobinemia caused by carrot juice. The New England Journal of Medicine, 288, 824-826.
Kersting M, Alexy U, Sichert-Hellert W, Manz F and Schoch G, 1998. Measured consumption of commercial infant food products in German infants: results from the DONALD study. Dortmund
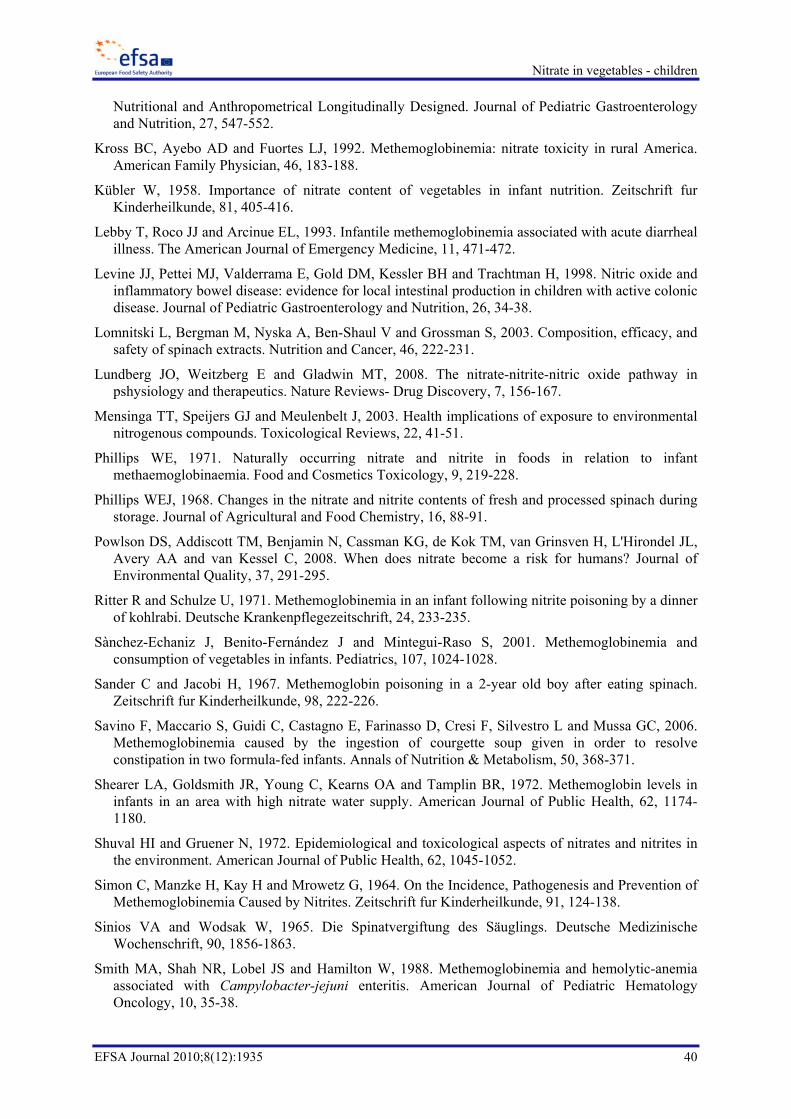
Nitrate in vegetables - children
40 EFSA Journal 2010;8(12):1935
Nutritional and Anthropometrical Longitudinally Designed. Journal of Pediatric Gastroenterology and Nutrition, 27, 547-552.
Kross BC, Ayebo AD and Fuortes LJ, 1992. Methemoglobinemia: nitrate toxicity in rural America. American Family Physician, 46, 183-188.
Kübler W, 1958. Importance of nitrate content of vegetables in infant nutrition. Zeitschrift fur Kinderheilkunde, 81, 405-416.
Lebby T, Roco JJ and Arcinue EL, 1993. Infantile methemoglobinemia associated with acute diarrheal illness. The American Journal of Emergency Medicine, 11, 471-472.
Levine JJ, Pettei MJ, Valderrama E, Gold DM, Kessler BH and Trachtman H, 1998. Nitric oxide and inflammatory bowel disease: evidence for local intestinal production in children with active colonic disease. Journal of Pediatric Gastroenterology and Nutrition, 26, 34-38.
Lomnitski L, Bergman M, Nyska A, Ben-Shaul V and Grossman S, 2003. Composition, efficacy, and safety of spinach extracts. Nutrition and Cancer, 46, 222-231.
Lundberg JO, Weitzberg E and Gladwin MT, 2008. The nitrate-nitrite-nitric oxide pathway in pshysiology and therapeutics. Nature Reviews- Drug Discovery, 7, 156-167.
Mensinga TT, Speijers GJ and Meulenbelt J, 2003. Health implications of exposure to environmental nitrogenous compounds. Toxicological Reviews, 22, 41-51.
Phillips WE, 1971. Naturally occurring nitrate and nitrite in foods in relation to infant methaemoglobinaemia. Food and Cosmetics Toxicology, 9, 219-228.
Phillips WEJ, 1968. Changes in the nitrate and nitrite contents of fresh and processed spinach during storage. Journal of Agricultural and Food Chemistry, 16, 88-91.
Powlson DS, Addiscott TM, Benjamin N, Cassman KG, de Kok TM, van Grinsven H, L'Hirondel JL, Avery AA and van Kessel C, 2008. When does nitrate become a risk for humans? Journal of Environmental Quality, 37, 291-295.
Ritter R and Schulze U, 1971. Methemoglobinemia in an infant following nitrite poisoning by a dinner of kohlrabi. Deutsche Krankenpflegezeitschrift, 24, 233-235.
Sànchez-Echaniz J, Benito-Fernández J and Mintegui-Raso S, 2001. Methemoglobinemia and consumption of vegetables in infants. Pediatrics, 107, 1024-1028.
Sander C and Jacobi H, 1967. Methemoglobin poisoning in a 2-year old boy after eating spinach. Zeitschrift fur Kinderheilkunde, 98, 222-226.
Savino F, Maccario S, Guidi C, Castagno E, Farinasso D, Cresi F, Silvestro L and Mussa GC, 2006. Methemoglobinemia caused by the ingestion of courgette soup given in order to resolve constipation in two formula-fed infants. Annals of Nutrition & Metabolism, 50, 368-371.
Shearer LA, Goldsmith JR, Young C, Kearns OA and Tamplin BR, 1972. Methemoglobin levels in infants in an area with high nitrate water supply. American Journal of Public Health, 62, 1174-1180.
Shuval HI and Gruener N, 1972. Epidemiological and toxicological aspects of nitrates and nitrites in the environment. American Journal of Public Health, 62, 1045-1052.
Simon C, Manzke H, Kay H and Mrowetz G, 1964. On the Incidence, Pathogenesis and Prevention of Methemoglobinemia Caused by Nitrites. Zeitschrift fur Kinderheilkunde, 91, 124-138.
Sinios VA and Wodsak W, 1965. Die Spinatvergiftung des Säuglings. Deutsche Medizinische Wochenschrift, 90, 1856-1863.
Smith MA, Shah NR, Lobel JS and Hamilton W, 1988. Methemoglobinemia and hemolytic-anemia associated with Campylobacter-jejuni enteritis. American Journal of Pediatric Hematology Oncology, 10, 35-38.
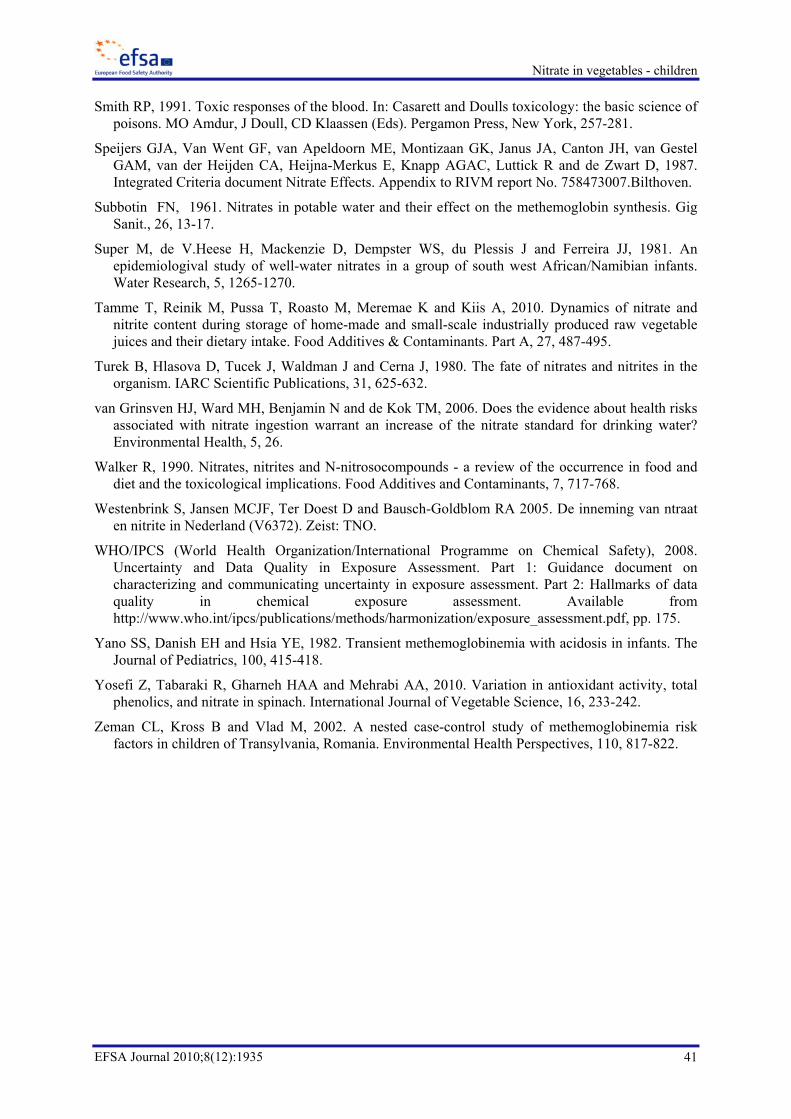
Nitrate in vegetables - children
41 EFSA Journal 2010;8(12):1935
Smith RP, 1991. Toxic responses of the blood. In: Casarett and Doulls toxicology: the basic science of poisons. MO Amdur, J Doull, CD Klaassen (Eds). Pergamon Press, New York, 257-281.
Speijers GJA, Van Went GF, van Apeldoorn ME, Montizaan GK, Janus JA, Canton JH, van Gestel GAM, van der Heijden CA, Heijna-Merkus E, Knapp AGAC, Luttick R and de Zwart D, 1987. Integrated Criteria document Nitrate Effects. Appendix to RIVM report No. 758473007.Bilthoven.
Subbotin FN, 1961. Nitrates in potable water and their effect on the methemoglobin synthesis. Gig Sanit., 26, 13-17.
Super M, de V.Heese H, Mackenzie D, Dempster WS, du Plessis J and Ferreira JJ, 1981. An epidemiologival study of well-water nitrates in a group of south west African/Namibian infants. Water Research, 5, 1265-1270.
Tamme T, Reinik M, Pussa T, Roasto M, Meremae K and Kiis A, 2010. Dynamics of nitrate and nitrite content during storage of home-made and small-scale industrially produced raw vegetable juices and their dietary intake. Food Additives & Contaminants. Part A, 27, 487-495.
Turek B, Hlasova D, Tucek J, Waldman J and Cerna J, 1980. The fate of nitrates and nitrites in the organism. IARC Scientific Publications, 31, 625-632.
van Grinsven HJ, Ward MH, Benjamin N and de Kok TM, 2006. Does the evidence about health risks associated with nitrate ingestion warrant an increase of the nitrate standard for drinking water? Environmental Health, 5, 26.
Walker R, 1990. Nitrates, nitrites and N-nitrosocompounds - a review of the occurrence in food and diet and the toxicological implications. Food Additives and Contaminants, 7, 717-768.
Westenbrink S, Jansen MCJF, Ter Doest D and Bausch-Goldblom RA 2005. De inneming van ntraat en nitrite in Nederland (V6372). Zeist: TNO.
WHO/IPCS (World Health Organization/International Programme on Chemical Safety), 2008. Uncertainty and Data Quality in Exposure Assessment. Part 1: Guidance document on characterizing and communicating uncertainty in exposure assessment. Part 2: Hallmarks of data quality in chemical exposure assessment. Available from http://www.who.int/ipcs/publications/methods/harmonization/exposure_assessment.pdf, pp. 175.
Yano SS, Danish EH and Hsia YE, 1982. Transient methemoglobinemia with acidosis in infants. The Journal of Pediatrics, 100, 415-418.
Yosefi Z, Tabaraki R, Gharneh HAA and Mehrabi AA, 2010. Variation in antioxidant activity, total phenolics, and nitrate in spinach. International Journal of Vegetable Science, 16, 233-242.
Zeman CL, Kross B and Vlad M, 2002. A nested case-control study of methemoglobinemia risk factors in children of Transylvania, Romania. Environmental Health Perspectives, 110, 817-822.

Nitrate in vegetables - children
42 EFSA Journal 2010;8(12):1935
ABBREVIATIONS
ADI Acceptable Daily Intake ARfD Acute Reference Dose b.w. Body weight CONTAM Panel EFSA Panel on Contaminants in the Food Chain EFSA European Food Safety Authority FAO/WHO Food and Agriculture Organisation of the United Nations/World Health
Organization JECFA The Joint FAO/WHO Expert Committee on Food Additives LD50 Lethal dose LOD Limit of detection MetHB Methaemoglobin ML Maximum level NADH- Nicotinamide Adenine Dinucleotide NO Nitric oxide SCF Scientific Committee for Food SD Standard deviation WHO/IPCS World Health Organization/International Programme on Chemical Safety