statements of intent: examples of reporting practice - office of the
TRANSCRIPT

20
09
Statemen
ts of in
tent: Exa
mp
les of rep
ortin
g p
ractice
Offi ce of the Auditor-GeneralPO Box 3928, Wellington 6140
Telephone: (04) 917 1500Facsimile: (04) 917 1549
Email: [email protected]
Discussion paper Statements of intent: Examples of reporting practice

Other publications issued by the Auditor-General recently have been:
The Auditor-General’s views on setting fi nancial reporting standards for the public sector•
Inland Revenue Department: Managing tax debt•
Electricity Commission: Review of the fi rst fi ve years•
Local government: Results of the 2007/08 audits•
How government departments monitor Crown entities•
Inquiry into immigration matters•
Central government: Results of the 2007/08 audits•
Annual Plan 2009/10•
Workforce planning in Crown Research Institutes•
Performance audits from 2007: Follow-up report•
Department of Corrections: Managing off enders on parole•
Housing New Zealand Corporation: Maintenance of state housing•
Annual Report 2007/08•
Ministry of Health: Monitoring the progress of the Primary Health Care Strategy•
Ministry of Education: Supporting professional development for teachers•
Inquiry into the West Coast Development Trust•
Maintaining and renewing the rail network•
Reporting the progress of defence acquisition projects•
Ministry of Education: Monitoring and supporting school boards of trustees•
Charging fees for public sector goods and services•
WebsiteAll these reports are available in HTML and PDF format on our website – www.oag.govt.nz.
They can also be obtained in hard copy on request – [email protected].
Mailing list for notifi cation of new reportsWe off er a facility for people to be notifi ed by email when new reports and public statements
are added to our website. The link to this service is in the Publications section of the website.
Sustainable publishingThe Offi ce of the Auditor-General has a policy of sustainable publishing practices. This
report is printed on environmentally responsible paper stocks manufactured under the
environmental management system ISO 14001 using Elemental Chlorine Free (ECF) pulp
sourced from sustainable well-managed forests. Processes for manufacture include use of
vegetable-based inks and water-based sealants, with disposal and/or recycling of waste
materials according to best business practices.
Publications by the Auditor-General
Offi ce of the Auditor-GeneralPO Box 3928, Wellington 6140
Telephone: (04) 917 1500Facsimile: (04) 917 1549
Email: [email protected]

ISBN 978-0-478-32632-1
This is a discussion paper produced under section 21 of the Public Audit Act 2001
June 2009
Statements of intent: Examples of reporting practice

2 Contents
Auditor-General’s overview 3
Glossary 4
Part 1 – Introduction 9
Purpose of this discussion paper 9
Scope of this discussion paper 10
Part 2 – Background 11
Performance information: The importance of external reports 11
Our role in auditing performance reports 12
Part 3 – The performance story 13
Part 4 – Strategic context 15
Example 1 Human Rights Commission 16
Example 2 Human Rights Commission 18
Example 3 Ministry of Economic Development 22
Part 5 – Specifying and presenting the outcomes framework 25
Example 4 Retirement Commission 26
Example 5 Retirement Commission 28
Example 6 Ministry of Economic Development 30
Example 7 Ministry of Agriculture and Forestry 32
Example 8 Charities Commission 34
Example 9 Te Māngai Paho 36
Example 10 New Zealand Customs Service 38
Part 6 – Main measures and targets for impacts and outcomes 39
Example 11 Ministry of Agriculture and Forestry 40
Example 12 Te Māngai Pāho 42
Example 13 New Zealand Fire Service Commission 43
Example 14 Retirement Commission 44
Part 7 – Linking impacts and outcomes to outputs 49
Example 15 Ministry of Economic Development 51
Example 16 Vote Transport 52
Example 17 Vote Transport 54
Example 18 Ministry of Transport 55
Example 19 Vote Biosecurity 56
Part 8 – Specifying outputs and output classes 59
Example 20 Vote Customs 60
Example 21 Vote National Library 62
Example 22 Offi ce of the Health and Disability Commissioner 64
Part 9 – Performance measures and targets for outputs 69
Example 23 Securities Commission 70
Example 24 Vote Veterans Aff airs 71
Example 25 Vote Internal Aff airs 73
Example 26 New Zealand Qualifi cations Authority 76
3Auditor-General’s overview
This discussion paper gives examples of reporting practice from the statements
of intent (SOIs) of government departments and Crown entities, including
statements of forecast service performance (forecast SSPs). The examples were
selected during my Offi ce’s review of the 2008/11 SOIs.
Each of the 26 examples includes features that I would refer to as “better
practice”. I hope that highlighting these examples will stimulate discussion within
public entities and contribute to better non-fi nancial performance reporting.
Performance reports (such as SOIs and SSPs) should refl ect the entity’s
management intentions, and are an essential part of accountability documents.
These documents help ensure that government departments and other state
sector entities are held accountable to Parliament and the public. The quality
of performance reports needs to improve signifi cantly to achieve their purpose
satisfactorily.
Although my staff have not identifi ed any SOIs as overall models of good practice,
the examples in this paper may serve as helpful references for public entities to
improve their accountability documents. I am confi dent that many entities have
begun to improve the quality of their SOIs. I am encouraged because many of the
entities featured in this discussion paper have already informed my Offi ce that
their 2009/12 SOIs (in draft at the time of writing) have signifi cantly improved
on 2008/11. Therefore, I encourage readers to seek out the latest SOIs for these
entities when they become available.
I expect to see a steady improvement in the quality of performance reporting,
and my Offi ce will continue to encourage this through our audit reports and
various other reports to Parliament and to the entities themselves. We plan to
publish a follow-up report in the near future about this expected improvement in
performance reporting.
K B Brady
Controller and Auditor-General
23 June 2009
4 Glossary
This glossary explains the technical terms used in this publication and provides
defi nitions from other relevant sources (see the shaded text).
Appropriateness refers to the usefulness or suitability of various aspects of the
non-fi nancial performance report and is a term that can be applied to:
the overall non-fi nancial performance reporting framework;•
the elements reported;•
the performance measures; and•
the targeted levels of performance or historical results.•
Specifi cally, appropriateness means that the reported subject matter provides an
adequate basis for an informed assessment of the entity’s service performance.
In assessing whether the service performance report is appropriate, consideration
is given to whether the information is relevant to the interests of users, reliable
(that is, faithfully represented, supportable, neutral, complete, and balanced),
understandable, and comparable.
Dimensions of performance are the aspects or properties of performance that
may be captured by a particular performance measure. They include, but are not
limited to, quantity, quality, timeliness, location, and cost.
Elements of non-fi nancial performance reporting include inputs, outputs, impacts,
and outcomes – all of which can be measured for the purpose of reporting and
assessing the reporting entity’s performance.
Impacts are the contributions made to an outcome by a specifi ed set of outputs.
Often referred to as “intermediate outcomes”, impacts represent the relatively
immediate or direct eff ect on stakeholders of the reporting entity’s outputs.
Impacts refer to the contribution made to an outcome by a specifi ed set of outputs, or actions, or both.
Source: Public Finance Act 1989
Inputs are the resources used by the reporting entity to produce its outputs.
Inputs are the resources used to produce the goods and services, which are the outputs of the reporting entity.
Source: Institute of Chartered Accountants of New Zealand – Statement of Concepts of General Purpose Financial Reporting (withdrawn), Financial Reporting Standard No. 2: Presentation of Financial Reports (withdrawn), Technical Practice Aid No. 9: Service Performance Reporting

Glossary
5
Non-fi nancial performance reporting framework, for the purpose of published,
statutory accountability reports, this kind of framework will typically be made up
of the following components:
A medium-term component that incorporates an outcome-oriented statement •
of intended or actual achievements. This should include information on
the public entity’s objectives, outcomes, impacts, and operating intentions,
together with related performance measures and targets and other
information required by legislation and generally accepted accounting practice
(GAAP).
An annual component that incorporates a service performance report (often •
referred to as a “statement of service performance” or “SSP”). This is an
output-oriented statement of forecast or historical service (that is, output)
delivery, together with related performance measures and targets and other
information required by legislation and GAAP.
To constitute a “framework”, these components need to give enough context
and links: (a) to strategic-level information; and (b) within and between the
information in the two components, to provide a coherent structure for reporting.
They need to clearly explain the rationale for, and the relationships among, the
contextual information, elements, performance measures, and performance
targets. The framework, including the two components described above, should
be evident both in the forecast non-fi nancial performance report and in the
historical (or “actual”) non-fi nancial performance report. The historical non-
fi nancial performance report is typically included in the annual report and should
report historical outcome and output performance against the targets set in the
forecast non-fi nancial performance report, together with related performance
measures and targets and other information required by legislation and GAAP.
Non-fi nancial performance reports provide primarily non-fi nancial information
that records the performance of a public entity against specifi ed objectives.
Such reports can encompass a comprehensive range of performance elements
(including outcomes, outputs, inputs, and capability), and the information
can be presented in various statements (for example, Information Supporting
the Estimates of Appropriation, statements of intent, statements of corporate
intent, long-term council community plans, annual plans, statements of service
performance, and other statements within annual reports).
“Service performance reports” are non-fi nancial reports concerned primarily with
output performance information.

6
Non-fi nancial performance reports can be:
forecast• performance reports, which are before-the-event statements that
express intended, expected, or targeted performance for the period, or
historical• performance reports, which are after-the-event statements on
results or achievements for the period, ideally against the forecast levels of
performance.
Outcomes refer to changes in the state, condition, impacts on, or consequences
for the community, society, economy, or environment resulting from the existence
and operations of the reporting entity. (The outcomes sought provide the rationale
for the range of outputs delivered by the entity.)
Outcomes are the impacts on, or consequences for, the community resulting from the existence and operations of the reporting entity. Desired outcomes provide the rationale for action and are the basis on which decisions should be made concerning the outputs as part of the range of possible interventions.
Source: Institute of Chartered Accountants of New Zealand – Statement of Concepts of General Purpose Financial Reporting (withdrawn), Financial Reporting Standard No. 2: Presentation of Financial Reports (withdrawn), Technical Practice Aid No. 9: Service Performance Reporting
Outcome means a state or condition of society, the economy, or the environment; and includes a change in that state or condition.
Source: Public Finance Act 1989
Output classes are groups of outputs of a similar nature. (They are sometimes
referred to as “groups of activities”.)
Class of outputs or class means a grouping of similar outputs.
Source: Public Finance Act 1989
Output class or group: For external reporting and appropriation purposes, individual outputs are often aggregated into output classes or groups that are similar in nature.
Source: Institute of Chartered Accountants of New Zealand – Technical Practice Aid No. 9: Service Performance Reporting
Outputs are the goods and services produced by the reporting entity. The term
refers only to the goods and services produced for third parties; it excludes goods
and services consumed within the reporting entity (such as services provided by
legal, research, human resources, and information technology functions to other
functional areas within the same entity, which are often referred to as “internal
outputs”).
Glossary

7
Glossary
Outputs are the goods and services produced by the reporting entity.
Source: Institute of Chartered Accountants of New Zealand – Statement of Concepts of General Purpose Financial Reporting (withdrawn), Financial Reporting Standard No. 2: Presentation of Financial Reports (withdrawn), Technical Practice Aid No. 9: Service Performance Reporting
Outputs means goods or services that are supplied by a department, Crown entity, Offi ce of Parliament, or other person or body; and includes goods and services that a department, Crown entity, Offi ce of Parliament, or other person or body has agreed or contracted to supply on a contingent basis, but that have not been supplied.
Source: Public Finance Act 1989
Outputs means goods or services that are supplied by a Crown entity; and does not include goods and services that are produced for purchase or consumption solely within the Crown entity group.
Source: Crown Entities Act 2004
Performance measures are the specifi c criteria or means used to measure
performance (most commonly of outputs produced and outcomes achieved).
They may be expressed as (but are not limited to) absolute numbers, percentages,
ratios, point estimates, or ranges. They might also be qualitative in nature.
Performance targets are the specifi c levels of performance (usually relating
to outputs produced and outcomes achieved) that the entity aims to meet.
Various pronouncements and literature on performance reporting often use the
term “performance standards” to refer to levels of planned performance. This
term carries the nuance of levels established by legislative or other mandatory
requirements; by contrast, the term “targets” is often reserved for levels that are
aspired to or otherwise discretionary. This discussion paper uses the term “targets”
as an over-arching concept to describe performance levels and, therefore, the term
“performance targets” encompasses the notion of “performance standards”.
Service performance reports are reports to users that provide primarily non-
fi nancial information that records the output delivery performance of a public
entity against specifi ed measures and targets. This information is usually shown
in statements of service performance (or equivalent reports) and is compared
with information contained in forecast non-fi nancial performance reports (for
example, Information Supporting the Estimates of Appropriation, statements of
intent, statements of corporate intent, long-term council community plans, and
annual plans).
Users are those persons who rely on published (that is, external) general purpose
reports as their major source of fi nancial and non-fi nancial information about
the entity. For this purpose, users are assumed to have a reasonable knowledge
and willingness to study the reported information with reasonable diligence.

8
Glossary
Regarding the public sector, specifi c users of published, general purpose, non-
fi nancial performance reports may include: customers (that is, the recipients of
public goods or services); funders and fi nancial supporters (including taxpayers
and ratepayers); elected or appointed representatives (for example, members of
Parliament and select committees); and interested members of the public (for
example, media commentators, academics and other analysts, and members of
relevant professional or community groups). Although governors (for example,
Ministers and local authority councillors), central agencies, other monitoring
agencies, some grant providers, and employees in management at entities
are also users of published reports, they have access to, or are able to request,
additional fi nancial and non-fi nancial performance information (that is, special
purpose reports) in carrying out their governance, monitoring, or management
responsibilities.
Part 1Introduction 9
Purpose of this discussion paper1.1 The purpose of this discussion paper is to provide helpful examples of reporting
practice to public sector entities required to produce forecast performance reports
under the Public Finance Act 1989 and the Crown Entities Act 2004.
1.2 During 2008, the Offi ce of the Auditor-General carried out in-depth reviews of
the 2008/11 statements of intent (SOIs), including statements of forecast service
performance (forecast SSPs), of 125 government departments and Crown entities.
The results of these reviews have been reported to Parliament.1 They show that
the overall quality of performance reporting in the state sector continues to be
poor.
1.3 Our observations on the state of public entities’ performance reports have been
comprehensively documented in our June 2008 report, The Auditor-General’s
observations on the quality of performance reporting. Our Offi ce’s fi ndings from
the 2008/11 SOI reviews are consistent with those expressed in that report.
1.4 We were unable to identify one 2008/11 SOI as a model of “best practice”. Further,
it is diffi cult to conclude that any specifi c sections of the SOIs reviewed can be
called defi nitive “best practice examples” because, without exception, they fall
short of being model statements. However, we are confi dent that entities are
improving their external accountability reports, and we hope that we will be able
to report more favourable results in the near future.
1.5 Despite the current lack of best practice examples, we were able to identify
“better” examples of reporting practice, which might be helpful for other entities.
We have reproduced these examples in this paper with a strong, general caveat
that although they illustrate features we fi nd useful, there are other aspects that
still need attention.
1.6 Therefore, it is important to remember that although this publication gives useful
examples of current reporting practice, it is not intended to be a best practice
guide, or even a good practice guide. It is descriptive, rather than prescriptive. It
does not critique the illustrative examples. We have at times referred to some of
the shortcomings in the examples given, but these comments are not an in-depth
evaluation of the reported information.
1.7 We have provided a Glossary which includes technical terms and legislative
defi nitions.
1 Central government: Results of the 2007/08 audits.

Part 1 Introduction
10
Scope of this discussion paper1.8 The examples in this document are reproduced from the 2008/11 SOIs and the
2008/09 forecast SSPs. For government departments, the forecast SSP information
is contained in the Information Supporting the Estimates of Appropriation.
1.9 Our comments are limited to presentation and content issues with the disclosed
material. Our comments do not address the overall validity of the SOI contents for
the featured entities. To evaluate each report’s relevance and reliability requires an
in-depth understanding of each entity’s strategies, operations and priorities, and
the performance management arrangements underpinning them. This is outside
the scope of this discussion paper.
1.10 The examples of reporting practice in this document focus on outcome, impact,
and output reporting. There are other elements of performance reporting (for
example, inputs, resources, processes, and other objectives) and specifi c legislative
reporting requirements (like cost-eff ectiveness measures, organisational health
and capability, and risk management approaches) that we do not discuss.
1.11 The commentary in this publication is provided as context for the examples.
Several publications are available that provide in-depth commentary on
performance reporting matters. These include guidelines issued by the Treasury
and State Services Commission for people who prepare accountability reports, as
well as other publications we have produced.
1.12 With regard to outcome, impact, and output reporting, we have not tried to
cover every issue or provide an example of every facet of performance reporting.
We hope that public sector entities will fi nd value in reviewing the examples of
reporting practice we have included.

Part 2Background 11
Performance information: The importance of external reports
2.1 Performance reports are an essential part of accountability documents.
Accountability documents ensure that government departments and other
state sector entities are answerable to Parliament and the public. Accountability
documents also ensure that local authorities and their controlled entities
are held accountable to local communities. Parliament and the public rely
on accountability documents to assess public entities’ performance and the
eff ectiveness of public entities’ use of taxes and rates.
2.2 There are legislative requirements for most public entities to prepare information
(in various forms) about their performance. Entities required to do this include
government departments, Crown entities (including district health boards,
Crown research institutes, tertiary education institutions, and schools), and local
authorities and their controlled subsidiaries.
2.3 A core purpose of performance reporting is to be accountable to the public
for the responsible use of public resources and regulatory powers, including
demonstrating that public services are being delivered eff ectively and effi ciently.
This means reporting on performance about delivering services the entity is
accountable for (output reporting), and the intended or actual eff ect of service
delivery on society or the community (impact and outcome reporting). Entities
can be accountable for their outputs only if they are transparent about both their
fi nancial and non-fi nancial performance and the relationship between the two.
2.4 As well as supporting their accountability purpose, performance reports should
refl ect good management practice. This practice involves clearly articulating
strategy, linking strategy to operational and other business plans, monitoring the
delivery of operational and business plans, and evaluating strategy eff ects and
results.
2.5 Well-considered and well-prepared reports about planned and actual progress
should provide useful insights into an entity – its purposes, outcomes, and
intentions, and the services it provides to achieve them.
2.6 Many public entities are required to produce forecast performance information,
and to report against it in their annual report. For many entities, the information
in the annual report (a statement of service performance (SSP), which reports
actual results against a forecast SSP) must be audited. For a small group of public
entities (almost entirely local authorities), forecast performance information must
also be audited.

Part 2 Background
12
Our role in auditing performance reports2.7 The Offi ce of the Auditor-General has worked to ensure that annual audits
address whether entities have met statutory requirements and complied with
generally accepted accounting practice (GAAP) in reporting their performance
information.
2.8 Along with the central agencies and others, we have previously reported on the
information required for Parliament to hold the Executive to account, and have
also provided guidance and good practice advice.
2.9 Before the changes to the Public Finance Act 1989 in 2004, and the passing of
the Local Government Act 2002 and the Crown Entities Act 2004, audit work
focused on verifying the SSP information. The audit would attest to the true and
fair disclosure of SSP results against the measures and performance targets1 set
in the forecast SSP. However, verifying actual results against forecast results does
not address the quality of the service performance information (for example, the
appropriateness of the choice of subject matter, performance measures used, or
performance targets set).
2.10 The legislative changes referred to in the earlier paragraph have put a greater
emphasis on information about medium- and longer-term context and strategy
in performance reporting. This information provides context that helps the
auditors to judge the quality (and therefore the appropriateness) of performance
information. It also forms the basis of, and sets the direction for, audit work and,
in particular, SSP audit work. Therefore, we have been placing more emphasis
on the appropriateness (that is, its relevance, whether it is understandable, its
reliability, and its comparability) of forecast and historical performance reports in
the SSP audit work.
1 We use the term "performance targets" in this discussion paper to refer to levels of planned performance (see
the Glossary). This term is equivalent to "performance standards", as used in the Public Finance Act 1989 and the
Crown Entities Act 2004.

13
Part 3The performance story
3.1 Performance reports should provide a clear picture of what the entity is trying to
achieve (its intended outcomes) and how it believes it contributes to them (its
outputs). Also, the report should tell a story about the services the entity delivers,
why it delivers them, and what diff erence it intends to make to the community
or to society. The emphasis and balance of the report content should faithfully
refl ect the entity’s performance management objectives, priorities, and signifi cant
achievements.
3.2 A useful performance story is one that provides a concise and balanced picture of
performance that emphasises matters according to their signifi cance. It should
present and clearly articulate the entity’s logic or “theory” behind why it does
what it does, focusing on outcomes, impacts, and outputs (that is, how cause-and-
eff ect assumptions factor into the entity’s business planning). The performance
story, and its framework, should help enable entities and their stakeholders assess
which actions work well and which do not work well. In this way, performance
reports help intervention logic to be continually evaluated and, accordingly, assist
in the drive towards providing the most cost-eff ective output mix.
3.3 Specifically, a good performance story within a forecast performance report will:
include a discussion of the entity’s strategic context – Part 4;•
specify intended outcomes and impacts, including their interrelationships at •
various levels, if applicable – Part 5;
identify the main measures (for impacts and outcomes) to gauge the entity’s •
eff ect or infl uence (with targets attached) – Part 6;
show the relationships between outputs, impacts, and outcomes – Part 7;•
group outputs into useful output classes – Part 8; and•
identify the measures that will show how well the entity delivers its outputs •
(with targets attached) – Part 9.

15
Part 4Strategic context
4.1 The relevance of specifi c performance objectives and priorities should become
apparent when they are presented within the context of the entity’s operating
environment, purpose, and strategic aims. The strategic context helps explain, at
a high level, the reason for the entity’s existence, what it exists to achieve, and the
powers and functions it may exercise to help achieve its goals.
4.2 A useful discussion about context will include information on the purpose of the
entity, its role, and the nature and scope of its functions and operations. Such
characteristics remain relatively fi xed over time, because they express, at a fairly
high level, the fundamental information on the entity’s strategic positioning
within the general, long-term aims of the Government.
4.3 Information that refl ects the dynamic context of the entity needs to complement
these discussions. This might include a discussion about changes to the entity’s
operating environment, and how the entity is managing its current priorities,
challenges, risks, and planned responses within that changing environment.
4.4 A common starting point for providing a strategic context for reported outcomes
is the entity’s governing legislation. In its SOI, the Human Rights Commission
succinctly outlines its purpose, functions, and roles in relation to the Human
Rights Act 1993 (Example 1), before discussing its operating environment
(Example 2).

16
The Human Rights CommissionTe Kāhui Tika Tangata
The Commission’s purpose and functions
The Human Rights Commission works for a fair, safe and just society, where diversity is valued,
human rights are respected, and everyone is able to live free from prejudice and discrimination.
The Human Rights Commission’s major statutory functions under the Human Rights Act 1993
(the Act) are:
To advocate and promote respect for, and an understanding and appreciation of, human •
rights in New Zealand society
To encourage the maintenance and development of harmonious relations between •
individuals and among the diverse groups in New Zealand society
To lead, evaluate, monitor and advise on equal employment opportunities•
To provide information to members of the public who have questions about discrimination, •
and to facilitate resolution between the parties in disputes about discrimination.
The Commissioners
The Act provides for the positions of Chief Commissioner, Equal Employment Opportunities
Commissioner, Race Relations Commissioner, fi ve part-time Human Rights Commissioners, and
the Director of Human Rights Proceedings. The Commissioners and the Director are required by
the Human Rights Act to act independently.
The Chief Commissioner, the Race Relations Commissioner and the Equal Employment
Opportunities Commissioner have a range of additional statutory functions. Acting jointly with
the Chief Commissioner, the Race Relations Commissioner is responsible for the maintenance
and development of harmonious relations in New Zealand. The EEO Commissioner is responsible
for the provision of advice, evaluation through benchmarks, developing guidelines, monitoring
progress, and liaising with others to progress equal employment opportunities. The EEO
Commissioner also has responsibility to provide guidance to Crown entities on their “Good
Employer” obligations under the Crown Entities Act 2004.
Offi ce of Human Rights Proceedings – Te Tari Whakatau Take Tika Tangata
The Offi ce of Human Rights Proceedings is established by the Human Rights Act 1993. It is an
independent part of the Commission headed by the Director of Human Rights Proceedings,
who is responsible to the Chief Commissioner. The Director decides whether to provide legal
representation for people who have complained of breaches of the Act. Those proceedings are
heard in the Human Rights Review Tribunal. The Director may also appear for the Human Rights
Commission before the Tribunal. The Director has functions under the Privacy Act 1993 which
include issuing proceedings in cases referred by the Privacy Commissioner and intervening in
Privacy Act cases before the Tribunal.
The key activities of the Offi ce of Human Rights Proceedings and the relevant reporting measures
are included in the Forecast Statement of Service Performance.
The Commission’s approach
Across the broad range of issues that the Commission could potentially become involved with,
the Commission tackles systemic issues, prioritising those aff ecting the people who are most
vulnerable to human rights violations. The Commission approaches its work through promotion
and education, advocacy and protection, handling enquiries and complaints, and undertaking
litigation.
Example 1
Human Rights Commission (Te Kāhui Tika Tangata), 2008-2011 Statement of Intent and Service Performance, pages 4-5
17
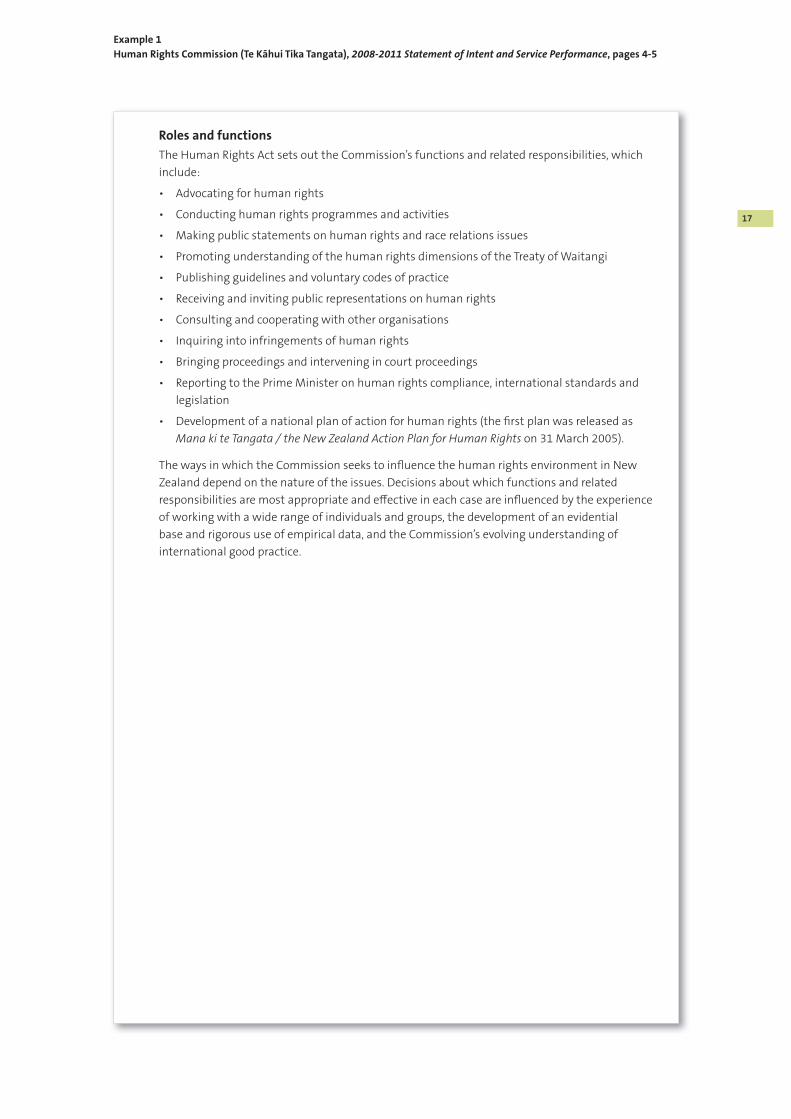
Roles and functions
The Human Rights Act sets out the Commission’s functions and related responsibilities, which
include:
Advocating for human rights•
Conducting human rights programmes and activities•
Making public statements on human rights and race relations issues•
Promoting understanding of the human rights dimensions of the Treaty of Waitangi•
Publishing guidelines and voluntary codes of practice•
Receiving and inviting public representations on human rights•
Consulting and cooperating with other organisations•
Inquiring into infringements of human rights•
Bringing proceedings and intervening in court proceedings•
Reporting to the Prime Minister on human rights compliance, international standards and •
legislation
Development of a national plan of action for human rights (the fi rst plan was released as •
Mana ki te Tangata / the New Zealand Action Plan for Human Rights on 31 March 2005).
The ways in which the Commission seeks to infl uence the human rights environment in New
Zealand depend on the nature of the issues. Decisions about which functions and related
responsibilities are most appropriate and eff ective in each case are infl uenced by the experience
of working with a wide range of individuals and groups, the development of an evidential
base and rigorous use of empirical data, and the Commission’s evolving understanding of
international good practice.
Example 1
Human Rights Commission (Te Kāhui Tika Tangata), 2008-2011 Statement of Intent and Service Performance, pages 4-5

18
Strategic ContextTe Mahinga Taiao o te Komihana
The human rights of people in New Zealand, and therefore the Commission’s work, are
aff ected by a broad range of global, regional and national infl uences and trends. These include
international and domestic law, the health of the New Zealand economy, and key demographic,
social and cultural trends.
The International Environment
Human rights are integral to security and sustainable development worldwide. Within the
international community there is increasing recognition of the centrality of human rights to
durable responses to the major challenges facing humanity: violent confl ict, terrorism, poverty,
climate change and environmental degradation, trade and economic inequalities, and global
migration.
Those challenges are particularly acute in the Asia-Pacifi c region, including in New Zealand’s
immediate Pacifi c neighbourhood. Recent events in Fiji, Timor-Leste and Tonga highlight the
vulnerability to violent civil unrest of societies where neither civil and political, nor economic,
social and cultural rights, are adequately respected. With Auckland being the largest Polynesian
city in the world, the impact of these developments is felt within New Zealand.
Geographical proximity, trading opportunities and recent migration patterns are increasingly
linking New Zealand’s prosperity and wellbeing to the stability and development of the Asian
region. New Zealand therefore has an interest in working with its trading partners on human
rights issues that are of signifi cance in New Zealand and in other parts of the region.
The United Nations establishment of the Human Rights Council in 2006 emphasised its
recognition of the importance of human rights to global peace. Replacing the former
UN Human Rights Commission, the Council now faces the challenge of demonstrating its
eff ectiveness on serious human rights issues, in order to build its credibility. The Human Rights
Council is mandated to undertake a “Universal Periodic Review” of every member State’s human
rights performance, regardless of whether they have ratifi ed the human rights Conventions.
The reviews begin in the second quarter of 2008. To assist in building the credibility of Universal
Periodic Reviews, and those of the Treaty Bodies, which report on compliance with specifi c
human rights Covenants and Conventions, provision has been made for direct engagement
by national institutions in the processes and procedures of the Human Rights Council. New
Zealand’s fi rst review will take place in 2009. Several of its regular treaty reports fall due
between 2008 and 2011.
The trend to have national human rights institutions contribute more directly to international
monitoring of States’ human rights performances was explicit in the two latest human rights
treaties: the Optional Protocol to the Convention against Torture and the Convention on the
Rights of Persons with Disabilities. New Zealand was amongst the fi rst countries to sign them.
Both have signifi cant implications for the work of the Commission.
Human Rights in New Zealand
In 2007, Cabinet required all government departments to engage with the Commission on the
New Zealand Action Plan for Human Rights priorities and to take account of these priorities in
developing their work programme. This represents a signifi cant step towards a more systematic
approach to incorporating human rights into legislation, policy and practice.
In most of the major legislative and policy reviews undertaken in the last 12 months there has
been evidence of a willingness to consider and to incorporate, at least in part, reference to the
relevant human rights standards. The reviews of the Police, Immigration and Public Health
Example 2
Human Rights Commission (Te Kāhui Tika Tangata), 2008-2011 Statement of Intent and Service Performance, pages 8-10

19
resulted in Bills before Parliament with greater human rights protections than the preceding
laws. All had also involved considerable public consultation and engagement with the
Commission before drafting of the legislation. Where engagement with the Commission has
only occurred at Select Committee stages, for example with the Electoral Finance Bill and anti-
terrorism legislation, there has also been some improvements in human rights provisions but
not to the extent that they could be deemed fully human rights compliant.
The promulgation of the revised national education curriculum in October 2007 included
references to human rights and responsibilities, recognition of the Treaty of Waitangi and
cultural diversity in its Principles and Values. The government is revising the New Zealand
Transport Strategy and will consider the Commission’s recommendations on accessibility
targets. Positive developments have also occurred in the use and protection of te Reo Māori and
Pacifi c languages.
Other factors contributing positively to the human rights environment in New Zealand include
a buoyant labour market, the reduction in public anxiety about race relations and increasing
ethnic and cultural diversity. While New Zealand has been enjoying a period of relatively strong
economic growth and high employment, the global credit crisis and other factors threaten
to soften this growth and may increase economic hardship. Poverty and economic inequality
impact negatively on human rights and harmonious relations. A range of current forecasts and
analyses suggest both may grow in the year ahead. At the same time New Zealand’s labour
market will continue to require new migrant and seasonal workers. Without recognition and
respect for their human rights, New Zealand workers will suff er as will New Zealand’s reputation
internationally.
The uneven nature of human rights legal protections in New Zealand remains a signifi cant
feature of the Commission’s operating environment. While New Zealand has a long history
of contributing to the development of and subsequently ratifying international human
rights standards, there is no single document, such as a written Constitution, which explicitly
incorporates them into domestic law or which comprehensively establishes the rights and
responsibilities of New Zealanders. Nor do New Zealanders grow up learning about their rights
and responsibilities explicitly as part of their education. While just under half of respondents
to a 2007 survey on knowledge of human rights said they knew a lot, one in fi ve respondents
claimed to know little or nothing about human rights.
And despite optimism about race relations, race-based discrimination continues to be the most
frequent ground of complaint to the Human Rights Commission. One in fi ve of respondents to
a 2007 survey reported personal experience of some form of discrimination – most commonly
in their interactions with government departments, in employment, or in the provision of goods
and services. The prevalence of discrimination in these areas, particularly in employment, is also
evidenced in the Commission’s complaints data. Structural disadvantages continue to limit the
participation of some groups. The Census of Women’s Participation 2008 highlights continuing
disparities, particularly for Māori, Pacifi c peoples and disabled people. An overall slowing of
progress in EEO is evident.
In the absence of a clear consensus on the place of the Treaty of Waitangi in New Zealand’s
constitutional arrangements, the level of recognition of the Treaty in legislation, policy and
practice continues to vary. Relationships between the Crown and Tangata Whenua are of
variable quality. In the past year, recognition of the Treaty in the new Curriculum and positive
progress in Treaty hearings and settlements have occurred, alongside challenges to settlements
and concerns about settlement policy and practice. Although some communities have made
progress in negotiating recognition of their customary rights under the Foreshore and Seabed
Act, concerns about the Act’s impact on indigenous rights continue to be raised.
Example 2
Human Rights Commission (Te Kāhui Tika Tangata), 2008-2011 Statement of Intent and Service Performance, pages 8-10

20
Human rights challenges and the Commission’s focus
The developments described above provide a context for the Commission to review and focus
its priorities, to ensure they remain relevant and responsive to the evolving national and
international human rights environments.
In 2005, the Commission published the Mana ki te Tangata / The New Zealand Action Plan for
Human Rights (the Action Plan), following a comprehensive review of the status of human
rights in New Zealand. The Action Plan acknowledged New Zealand’s considerable human
rights achievements, but found that there remain critical areas where action is needed to
eff ect change. An evaluation of progress in implementing the Action Plan has found that
despite signifi cant gains, the pressing issues and priorities identifi ed in the Action Plan
remain critical.
Continuing human rights challenges which demand the focus of the Commission include:
Building community-wide understanding of and respect for human rights and •
responsibilities – from children, families and communities, through to government law
and policy makers
Reducing discrimination, entrenched social and economic inequalities and barriers to full •
participation in society aff ecting particularly disabled people, Māori, Pacifi c peoples and
new migrants
Achieving more equal participation and representation; accelerating progress on EEO and •
expanding the use of ‘good employer’ policies, practices and tools to the private sector
Strengthening the Treaty relationship between the Crown and Tangata Whenua. •
Healthy Treaty relationships and eff ective methods of engagement are necessary if the
constitutional and human rights issues relating to the Treaty are to be progressed
Incorporating human rights systematically into legislation, policy and practice. Economic, •
social and cultural rights, in particular, lack robust protection
Maintaining a watching brief on the human rights implications of a range of global issues, •
such as terrorism, climate change, bioethics and developments in genetic technology.
The Action Plan sets out the key priorities for action over the period from 2005-2010 in
order to better ensure that the human rights of everyone in New Zealand are respected,
protected and fulfi lled. These priorities, along with subsequent research, inquiries and
surveys on specifi c human rights, race relations and EEO issues, provide the evidential basis
for determining the Commission’s strategic priorities and key activities described in this
Statement of Intent.
Example 2
Human Rights Commission (Te Kāhui Tika Tangata), 2008-2011 Statement of Intent and Service Performance, pages 8-10
Part 4
21
Strategic context
4.5 Another way to provide strategic context is to show how public entity outcomes
link to Government themes. Many entities describe these links, although the
extent to which the links are self-evident vary from entity to entity. The Ministry of
Economic Development (MED) provides a clear and simple illustration of the links
between Government economic transformation themes and the MED’s high-level
outcomes (Example 3).
4.6 Government agencies share many societal outcomes. Although their common
aims are sometimes clearly expressed, they are usually implied. Individual
agencies do not often make appropriate reference to the outcomes of other
agencies. We consider it would be useful for agencies to make such reference, as it
is a good way for the user to see how a particular agency’s work complements the
work done by other parts of government. The MED shows a summary of the most
important agencies it works with and the agency outcomes that relate closely to
the MED’s work. However, the diagram does imply that all outcomes relate to all
agencies. To improve it, the MED could identify which outcomes relate to which
specifi c agency.

22
How our work contributes to the Government’s Economic Transformation priority
Economic Transformation
Progress our economic transformation to a high-income, knowledge-based market
economy, which is both innovative and creative, and provides a unique quality of life
to all New Zealanders.
The Ministry of Economic Development’s overall aim:
To help develop an internationally-competitive and sustainable economy.
Example 3
Ministry of Economic Development (Manatū Ōhanga), Statement of Intent 2008/2011, pages 12-13
Auckland, aworld-class
city
EconomicTransformation
themes
The Ministry’s outcomes
Environmental sustainability
Innovative& productive workplaces
World-classinfrastructure
Auckland – aninternationally
competitivecity
Enterprising& innovative businesses
Effi cient,reliable, &responsive
infrastructureservices
Internationallinkages
Dynamic& trustedmarkets
Ease of doingbusiness
Globally competitive
fi rms

23
Example 3
Ministry of Economic Development (Manatū Ōhanga), Statement of Intent 2008/2011, pages 12-13
How our outcomes relate to those of other agencies
Ministry ofEconomic Development
Enterprising and innovative businesses
International linkages
Dynamic and trusted markets
Ease of doing business
Effi cient, reliable, and responsiveinfrastructure services
Auckland, a world-class city
The TreasuryImproved economic
performance
Stable and sustainable macroeconomic
environment
Department of LabourNZ will prosper and be enriched
through its connections with the rest of the world
NZ workplaces will raise the value of work and the quality of working lives
NZ businesses will be able to recruit and retain the skilled workers they
need to be internationallycompetitive
Ministry for the Environment
NZ is able to capitalise on its natural environmental
advantages
NZ’s natural resources are managed eff ectively, and
New Zealanders use resources sustainably
Ministry of Agriculture and
ForestryA business environment for the agriculture, food,
forestry, and related sectors that supports innovation,
enterprise, and high performance
Tertiary Education Commission
Increasing the achievement of advanced trade, technical and professional qualifi cations to
meet regional and industry needs
Improving research connections and linkages to create economic
opportunities
Ministry of EducationThe education system
produces the knowledge and develops people with the skills to drive NZ’s future economic
and social success
Foundation forResearch, Scienceand Technology
Accelerate the growth ofworld-class fi rms within NZ
Accelerate the commercialisation of technology outputs from
investments
Enhance activity in internationalisation
Ministry of Research, Science and TechnologyImproving business performance
through research and development
New Zealand Trade and Enterprise
Improve environment for enterprise and growth
Build business capability
Increase international connections
Ministry of Foreign Aff airs and Trade
NZ’s international connections support transformationof the NZ economy and sustainable economic
growth
Te Puni KkiriGrowing Māori
economic participation and success
Ministry of TransportGrowth and
development are increasingly integrated
with transport


25
Part 5Specifying and presenting the outcomes framework
5.1 The SOI must identify the outcomes the entity aims to contribute to or infl uence,
at least in the medium term. This is important because the outcomes explain why
the entity exists, whereas the outputs explain how the entity intends to intervene
to help bring about the outcomes. Therefore, if appropriate, the outcomes should
be identifi ed at various levels (for example, impacts, low-level intermediate or
intervening outcomes, high-level outcomes), with a clear depiction of the cause-
and-eff ect relationships between them.
5.2 It is important that the outcome statements are accurate and well-phrased;
they should capture and describe the desired eff ects. An outcome statement
should refer to the state or condition of society, the community, economy, or
environment. It should also include a statement about the desired change in
that state or condition.1 It is therefore important that the outcome statement
be “dynamic” – that is, it describes the direction of the change being sought and
preferably the targeted or desired level of change.
5.3 The SOI should capture those impacts and outcomes that are priorities for the
entity. It should be clear to the user why the reported impacts and outcomes are
priorities.
5.4 The Retirement Commission identifi es two high-level goals, which are then split
out into four stated outcomes (Example 4). The fi rst of these goals, and the fi rst of
the four stated outcomes, come closer to what we would expect to see than most
other outcome statements we reviewed. This is because they express something
about a desired state of society as a whole.
1 As defi ned in section 2 of the Public Finance Act.

26
Our goals and outcomes
The Retirement Commission’s vision is that New Zealanders are fi nancially sorted.1
There are two high level goals for New Zealand society that we seek to achieve both through
our own work, and through working with many other organisations, groups and individuals.
These are:
– New Zealanders are fi nancially well prepared for retirement.
– New Zealanders living in retirement villages have informed choice.
Outcomes
We identify four contributing outcomes that the Commission’s work is directly aimed at
achieving, and which contribute to these higher level goals. The four contributing outcomes of
the Commission are:
1. New Zealanders are well educated in fi nancial matters and can make informed fi nancial
decisions throughout their lives.
2. The fi nancial services sector is trusted.
3. Government’s retirement income policies are eff ective and stable.
4. All retirement villages meet societal expectations and current quality standards.
Outcome measures
We have found it challenging to identify useful, quantifi able and attributable outcome
measures to judge future performance. As many other factors infl uence outcomes, to
suggest that the Commission’s activities alone have resulted in a particular outcome is not
only misleading, but may take credit (or blame) for the work of other individuals or agencies.
Nevertheless, we have described the type of measures we will use and, where possible,
included some current numeric indicators and the expected change.
1 Our vision and goals complement the government social sector agencies’ common outcome of an inclusive
New Zealand where all people are able to participate in the social and economic life of their communities.
Example 4
Retirement Commission (Whiriwhiria), Statement of Intent 2008/11, page 8
27
Specifying and presenting the outcomes frameworkPart 5
5.5 In its SOI, the Retirement Commission expresses outcomes in static rather than
dynamic terms, although, within its performance measures and targets
(Example 5), the entity does point out the expected change. It is necessary to
specify the desired change of direction within the outcome statement to identify
precisely what the entity is seeking to achieve. This makes it easier to then identify
appropriate performance measures. We consider the Retirement Commission
could improve its outcome statements (and meet the statutory defi nition of
“outcomes”) by describing the specifi c improvement sought in the state or
condition of society.
5.6 The Retirement Commission’s usage data (use of “Sorted” resources, visits to the
website, and calculations made on the website) are all impact measures – in that
they measure the direct eff ects, on people, of the service provided. This is their
primary value. Impact measures are also useful because they have the potential to
imply something about the quality of the service.
5.7 By contrast, stating the number of booklets distributed (an output measure) is of
limited value because there is no sense of their quality or their impact on users.
To be really useful, both the impact and output measures shown in this example
need to be augmented by measures that capture their actual quality (in the case
of the booklets) and inferred quality (in the case of the impact measures).
28
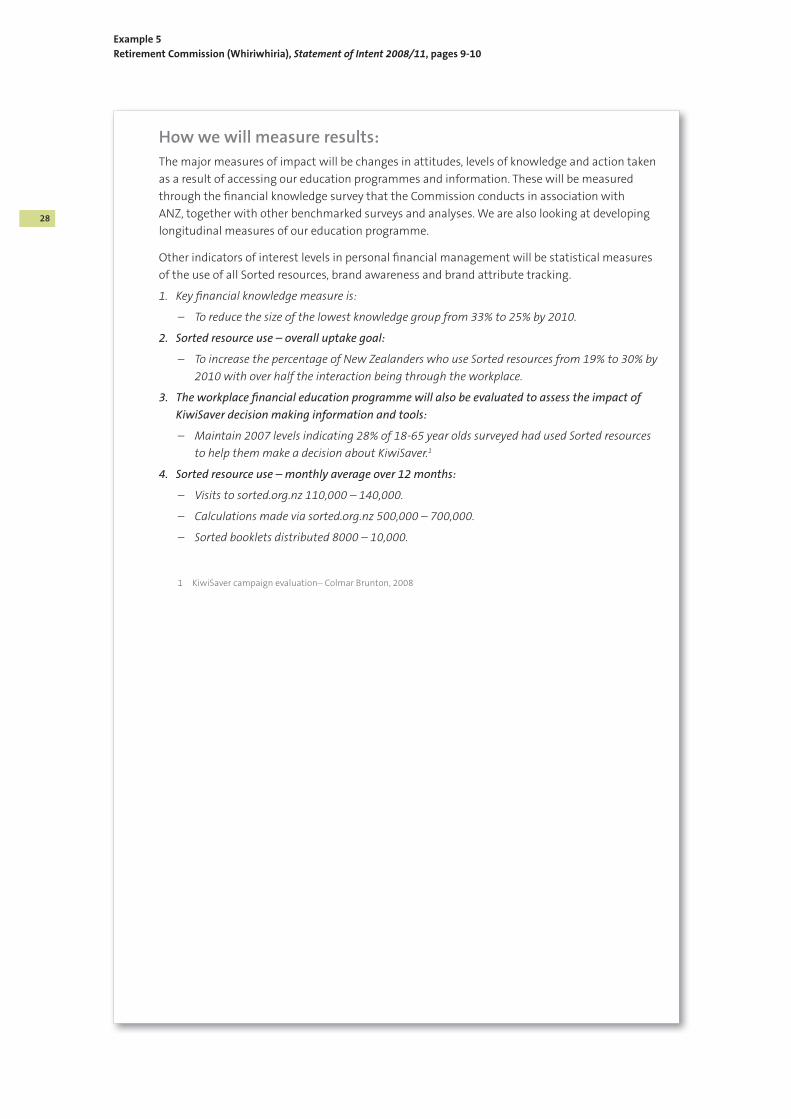
How we will measure results:
The major measures of impact will be changes in attitudes, levels of knowledge and action taken
as a result of accessing our education programmes and information. These will be measured
through the fi nancial knowledge survey that the Commission conducts in association with
ANZ, together with other benchmarked surveys and analyses. We are also looking at developing
longitudinal measures of our education programme.
Other indicators of interest levels in personal fi nancial management will be statistical measures
of the use of all Sorted resources, brand awareness and brand attribute tracking.
Key fi nancial knowledge measure is:1.
– To reduce the size of the lowest knowledge group from 33% to 25% by 2010.
Sorted resource use – overall uptake goal:2.
– To increase the percentage of New Zealanders who use Sorted resources from 19% to 30% by
2010 with over half the interaction being through the workplace.
The workplace fi nancial education programme will also be evaluated to assess the impact of 3.
KiwiSaver decision making information and tools:
– Maintain 2007 levels indicating 28% of 18-65 year olds surveyed had used Sorted resources
to help them make a decision about KiwiSaver.1
Sorted resource use – monthly average over 12 months:4.
– Visits to sorted.org.nz 110,000 – 140,000.
– Calculations made via sorted.org.nz 500,000 – 700,000.
– Sorted booklets distributed 8000 – 10,000.
1 KiwiSaver campaign evaluation– Colmar Brunton, 2008
Example 5
Retirement Commission (Whiriwhiria), Statement of Intent 2008/11, pages 9-10

29
Specifying and presenting the outcomes frameworkPart 5
5.8 The MED’s outcome statements describe the desired changed state, although the
desired change is stated simply as “improving” (Example 6). It is not always clear
from these statements what “improving” actually means (that is, more, or better).
More information is needed to explain what sorts of improvements are desired,
how each improvement will be measured (performance measures), and how
much improvement is required (performance targets). (The MED discusses what it
will measure in its “How we will demonstrate success” sections.)

30
What we are seeking to achieve
To support the Government’s aim of an innovative and creative, high-income, knowledge-based
economy, we have identifi ed six long-term outcomes for the Ministry:
→ Enterprising and innovative businesses – improving the drivers for success and productivity
improvement in fi rms.
→ International linkages – improving the linkages that allow New Zealand fi rms to benefi t from
trade, and the fl ows of investment, skills, and technology.
→ Dynamic and trusted markets – improving the competitiveness, integrity, and eff ectiveness of
New Zealand’s markets.
→ Ease of doing business – improving the way public agencies and the regulatory environment
interact with business.
→ Effi cient, reliable, and responsive infrastructure services – improving the quality and reliability
of key infrastructure services that support growth.
→ Auckland, a world-class city – improving Auckland as a world-class city that attracts fi rms,
investment, and skills.
Example 6
Ministry of Economic Development (Manatū Ōhanga), Statement of Intent 2008/2011, page 9

31
Specifying and presenting the outcomes frameworkPart 5
5.9 One of the major challenges in reporting outcomes is deciding on the most
appropriate level or levels at which they should be reported. Reporting outcomes
at only one level usually provides only an incomplete performance story. A more
informative story is one that reports a hierarchy of outcomes, demonstrating how
lower level impacts of service delivery feed through a cause-and-eff ect chain to
higher level outcomes and Government priorities. Therefore, it is helpful to include
intermediate outcomes or impacts (as defi ned in legislation)2 to clearly articulate
the entity’s assumptions about the intervention logic they use (that is, the theory
behind how courses of action resulting in outputs cause changes to the state of
individuals and society). On one page, the Ministry of Agriculture and Forestry
(MAF) illustrates its hierarchy of government priorities, high-level outcomes,
intermediate outcomes, output appropriations (called Votes), and inputs/
processes (for example, capability and collaboration) (Example 7). Many of MAF’s
intermediate outcome statements are dynamic, describing the change direction
sought.
2 The legislative defi nition is included in the Glossary.

32
Strategic Direction
Figure 1 illustrates the linkages between MAF’s operating environment, outputs/services,
intermediate and end outcomes and forms the basis for the discussion that follows.
Figure 1MAF’s outcome framework in context
Example 7
Ministry of Agriculture and Forestry (Te Manatū Ahuwhenua, Ngāherehere), 2008/11 Statement of Intent, page 9

33
Specifying and presenting the outcomes frameworkPart 5
5.10 The Charities Commission presents a succinct, two-layer outcomes framework
linked to outputs (Example 8). The framework clearly lays out the general
cause-and-eff ect chain between intermediate outcomes and the single
“overall outcome”. The cause-and-eff ect relationship between the outputs and
intermediate outcomes is also clear, although the diagram relates the bundle of
outputs to the bundle of intermediate outcomes (that is, it does not show which
specifi c outputs relate to which specifi c intermediate outcomes).
5.11 Another notable feature of this example is that the intermediate outcome
statements give a broad indication of the changed state desired.
5.12 However, we consider that some of the intermediate outcome statements would
be improved if they were not so complex: the second and third intermediate
outcome statements contain more than one outcome-type statement. We think
it would be better for each outcome statement to be simple and refer to only one
outcome. For example, the second intermediate outcome statement refers to:
(1) the sector being well advised; (2) improved governance and management;
and (3) more eff ective use of resources. Therefore, the specifi c focus of the second
intermediate outcome is unclear.
5.13 A clear expression of outcomes is also important for letting the user know
the important eff ects the entity measures and monitors. For the Charities
Commission’s second intermediate outcome, it is not clear which of the three
eff ects is most important. It may be that all three outcomes are vital, and there
may even be a cause-and-eff ect chain involving all three of these eff ects. If so,
then an alternative approach might be to express this intermediate outcome as
three separate outcome statements, one leading to the other, and to depict this in
a multi-layered diagram of impacts and consequent outcomes.

34
Our outcomes framework
This is our current Outcomes Framework, (below) based on our strategic priorities, and our
current pragmatic understandings of the Commission’s functions. We will develop and amend
this framework as we gather evidence about whether or not our activities are contributing to the
desired outcomes.
OVERALL OUTCOME
INTERMEDIATE OUTCOMES
OUTPUTS AND ACTIVITIES
A strong, eff ective charitable sector in which the public has trust and confi dence
Increased public trust and confi dence in the
charitable sector
Charities and the charitable sector are
well advised, resulting in improved governance and management and more eff ective use of charitable resources
Government is well-advised, enabling it to respond better to the
needs of charities and to the needs of the public in
supporting charities
Registration and
monitoring of charitable
entities
Investigate complaints and make
inquiries about registered charities
Provision of advice,
information and education
to charities
Provision of policy advice
relating to charities
Provision of information
about charities
Example 8
Charities Commission (Komihana Kaupapa Atawhai), Statement of Intent 2008-2011, page 11
35
Specifying and presenting the outcomes frameworkPart 5
5.14 Te Māngai Pāho’s framework sets out desired outcomes in a hierarchy of elements,
from its vision statement (high level) down to capability initiatives (low level)
(Example 9). The intermediate outcome statements could be improved by the
agency asserting the desired change in direction and level, in the state of society,
which would result from their outputs.
5.15 The outputs, and the major and intermediate outcomes, are set out in separate
layers. If there are specifi c relationships between individual outcomes and
individual output classes, then those relationships are not clear from this diagram.
5.16 It is common practice to include something about capabilities, inputs, or
resources in diagrams like this, and to show them feeding into the outputs. Some
entities overlay the input-output-outcome model with a depiction of strategic
goals, which relate to anything ranging from input/capabilities to outputs and
outcomes. Te Māngai Pāho has inserted a “Strategies” layer between outcomes
and outputs; the individual elements of this layer refer variously to inputs,
outputs, impacts, and outcomes. Another approach is to have the most important
strategic priorities spanning the various layers.

36
Our Outcome Framework
Vision Ahakoa kei whea, Ahakoa āwhea, Ahakoa pēwhea, Kōrero Māori!
Māori language – everywhere, every day, in every way!
Key Government Goals
National Identity;
Families Young and Old; and
Economic Transformation.
Major Outcome Kia tū noa te reo Māori, kia piki te arokā mō ngā uara, ngā tikanga me ngā whakaaro Māori, i roto o Aotearoa.
Normalisation of Māori language and greater awareness of Māori values, practices and views within Aotearoa.
Intermediate Outcomes
Whānau, hapū, iwi, and Māori communities, maintain and strengthen their te reo Māori and tikanga Māori
Learners of all ages and abilities are supported in their Māori language education, use and retention
New Zealanders experience te reo Māori and tikanga Māori
Te Māngai Pāho Strategies
Investment in the protection, promotion and development of te reo Māori and tikanga Māori
Investment in the promotion of a positive awareness of current issues that are important for Māori
Ensure that the programmes in which we invest are responsive to, and can reach, a large and diverse New Zealand audience
Support for initiatives and programmes that encourage New Zealanders to value, or at least, understand the value of te reo Māori and tikanga Māori
Te Māngai Pāho Outputs
Direct funding of Māori Television
Contestable Television Programme Funding
Television Industry Co-ordination and Development
Operational Funding for Iwi Radio
Contestable Radio Programme and Music Funding
Radio Distribution System and Coverage Extension
Capacity Building and Industry Co-ordination
Strategic, cost eff ective and transparent Administration of Broadcasting Funding
Te Māngai Pāho Capability Initiatives
Establish clear Purchasing, Management and Operational Policies for public and internal purposes
Establish a practical, cost eff ective evaluation tool
Implement strategies to consolidate and enhance the expertise and people resources available to carry out all aspects of our business.
Example 9
Te Māngai Pāho (Māori Broadcasting Funding Agency), Statement of Intent 2008-2013, page 17

37
Specifying and presenting the outcomes frameworkPart 5
5.17 The New Zealand Customs Service (Customs) has several outcomes-type layers in
their strategic framework diagram (Example 10). The diagram identifi es diff erent
elements, including immediate results, impacts, and outcomes stemming from its
output delivery. We consider this to be a good example, because of its structure,
orderliness, and general clarity. The elements are shown in layers, which is a useful
way of showing the performance framework, including the hierarchy of impacts,
outcomes, and inputs. As with the previous example, if there are any specifi c links
between output classes and their outcomes, then they are not explicit.
5.18 Customs’ diagram includes an “immediate results” column, which provides
additional and relevant information to the other columns. The immediate results
column appears to contain a mix of diff erent elements of performance. Some
of the statements in the column relate to the intended eff ects of Customs’
operations, whereas others refer to the quality of the services (or inputs/processes
relating to the services) themselves.
5.19 We consider that improvements could be made to the way outcomes are
expressed, because they fall short of being complete statements of the desired
change to the state of the community or society. Further, we would consider
“relationships” as an enabler of service delivery rather than an outcome of service
delivery, as defi ned under legislation.

38
Example 10
New Zealand Customs Service (Te Mana Ārai O Aotearoa), Statement of Intent 2008-2011, page 9
Customs’ Strategic Framework
Cro
wn
Rev
enu
e b
ase
is
pro
tect
ed
Leg
itim
ate
tra
de,
tr
avel
an
d t
ou
rism
is
faci
litat
ed
Relia
ble
an
d t
imel
y tr
ad
e d
ata
co
mp
iled
Secu
rity
fro
m e
xter
na
l th
reat
s is
ma
inta
ined
Inte
gri
ty o
f N
ew
Zea
lan
d’s
bo
rder
is
ass
ure
d
Wo
rkin
g r
elat
ion
ship
s a
re e
nh
an
ced
Go
vern
men
t
dec
isio
n-m
aki
ng
bet
ter
info
rmed
Peo
ple
an
d t
rad
e
tra
nsa
ctio
ns
pro
cess
ed
Co
mp
reh
ensi
ve
info
rmat
ion
colle
cted
ab
ou
t
peo
ple
an
d g
oo
ds
Vio
lati
on
s a
nd
vio
lato
rs d
etec
ted
Th
reat
s a
nd
ris
ks
iden
tifi
ed a
nd
targ
eted
Ag
reem
ents
an
d
Trea
ties
neg
oti
ated
an
d im
ple
men
ted
Reve
nu
e co
llect
ed
Deb
tors
an
d
off
end
ers
hel
d t
o
acc
ou
nt
Sta
keh
old
ers
un
der
sta
nd
Cu
sto
ms’
req
uir
emen
ts
Polic
y a
dvi
ce
Inte
llig
ence
an
d r
isk
ass
essm
ent
serv
ices
Cle
ara
nce
of
inte
rnat
ion
al
pa
ssen
ger
s, c
rew
an
d
cra
ft
Cle
ara
nce
of
imp
ort
, ex
po
rt a
nd
exc
ise
tra
nsa
ctio
ns
Reve
nu
e co
llect
ion
, a
cco
un
tin
g a
nd
deb
t m
an
ag
emen
t
Surv
eilla
nce
, sea
rch
an
d
con
tain
men
t
Inve
stig
atio
n o
f o
ff en
ces
Pro
secu
tio
ns
an
d c
ivil
pro
ceed
ing
s
Tech
nic
al a
dvi
sory
se
rvic
es
Nat
ion
al M
ari
tim
e C
oo
rdin
atio
n C
entr
e
Peo
ple
Lea
der
ship
Cu
ltu
re
Rela
tio
nsh
ips
Ass
ets
Info
rmat
ion
Kn
ow
led
ge
Pro
cess
es
Syst
ems
Tech
no
log
y
Stru
ctu
res
Delivery
Incr
easi
ng
sta
keh
old
er
serv
ice
exp
ecta
tio
ns
Incr
easi
ng
tra
de
an
d
pa
ssen
ger
vo
lum
es
Incr
ease
d
req
uir
emen
ts o
f b
ord
er c
on
tro
l fu
nct
ion
s
Ch
an
ges
in s
up
ply
ch
ain
an
d n
ew t
rad
e p
ract
ices
Hei
gh
ten
ed
inte
rnat
ion
al s
ecu
rity
co
nce
rns
Ch
an
gin
g
inte
rnat
ion
al
req
uir
emen
ts
Ra
pid
tec
hn
olo
gic
al
cha
ng
e
Incr
easi
ng
ly c
om
ple
x a
nd
div
erse
cri
min
al
off
end
ing
an
d o
ther
th
reat
s
Sust
ain
ab
ility
re
spo
nse
s n
eed
ed t
o
red
uce
en
viro
nm
enta
l im
pa
cts
Go
vern
men
t T
hem
es
Eco
no
mic
•
Tra
nsf
orm
atio
n
Fam
ilies
– y
ou
ng
•
an
d o
ld
Nat
ion
al I
den
tity
• Min
iste
ria
l Pri
ori
ties
Wo
rld
-cla
ss p
ass
eng
er
•
clea
ran
ce s
ervi
ces
Wo
rld
-cla
ss t
rad
e •
faci
litat
ion
arr
an
gem
ents
Spec
ialis
t su
pp
ort
fo
r N
ew
•
Zea
lan
d’s
inte
rnat
ion
al
inte
rest
s a
nd
rel
atio
nsh
ips
Dev
elo
pm
ent
Go
als
fo
r th
e St
ate
Serv
ices
Emp
loye
r o
f C
ho
ice
•
Net
wo
rked
Sta
te S
ervi
ces
•
Va
lue-
for-
mo
ney
Sta
te
•
Serv
ices
Co
ord
inat
ed S
tate
•
Ag
enci
es
Acc
essi
ble
Sta
te
•
Serv
ices
Tru
sted
Sta
te S
ervi
ces
• Sect
ora
l Co
ord
inat
ion
Bo
rder
sec
tor
•
Exte
rna
l sec
tor
•
Pro
tect
ion
Faci
litat
ion
Rela
tio
nsh
ips
Reve
nu
e
Op
erat
ing
En
viro
nm
ent
Cap
abili
ties
an
d O
utp
uts M
easu
res
of
Serv
ice
Perf
orm
an
ce
Vis
ion
, Mis
sio
n a
nd
Val
ues
Lon
g-t
erm
Dev
elo
pm
ent
Prio
riti
es
Imm
edia
te
Res
ult
s
Mea
sure
s o
f O
rga
nis
ati
on
al H
ealt
h
an
d C
ap
ab
ility
Bo
rder
Po
licy
&
Reg
ula
tio
nSe
rvic
e D
eliv
ery
Mo
del
Info
rmat
ion
, Pr
oce
sses
&
Tech
no
log
yPe
op
le C
ap
ab
ility
Co
llab
ora
tive
Re
lati
on
ship
s
Mea
sure
s o
f R
esu
lts
an
d C
ost
-Eff
ecti
ven
ess
Imp
acts
Ou
tco
mes
Key
Dri
vers
Go
vern
men
t G
oa
lsC
ap
ab
ilit
y(t
o c
on
trib
ute
to
o
utc
om
es)
Ou
tpu
tC
lass
es
Development

39
Part 6Main measures and targets for impacts and outcomes
6.1 Main measures and targets for impacts and outcomes are essential for the user
to know whether the entity is making progress. We expect entities to have a wide
range of measures for internal management purposes, but legislation requires
that SOIs report only main measures and standards. This section of the SOI should
focus on the vital few measures of achievement and the more signifi cant targets,
enabling users to see the “big picture” of the entity’s strategic intent, without
being overwhelmed by detail.
6.2 As part of that big picture, the SOI should show where the entity intends to have
its most direct impact. Impact measures and targets should be included wherever
relevant and practicable. Impacts refer to the lower-level eff ects of output
delivery; as intervening factors they contribute to higher-level outcomes. Impacts
are important because they describe the direct, or more immediate, eff ect of the
entity’s interventions. Some impacts can be directly attributable to an entity’s
outputs if the cause-and-eff ect relationship is tight enough. However, most
impacts represent the low-level outcomes over which the entity has signifi cant
infl uence or considerable (but not total) control through its service delivery.
6.3 There is a temptation for entities to focus on things that are easy to measure,
but this is unlikely to provide a relevant or balanced basis for demonstrating the
entity’s progress towards achieving its strategic outcomes.
6.4 Impact and outcomes targets must cover the full period of the SOI (a minimum
of three years). This should not be problematic, because managing for outcomes
requires a medium-to-long-term outlook.
6.5 For achievement targets to be meaningful to the user, enough context is needed
to explain the entity’s direction. Comparative data can help provide this context,
for example: past and future targets; past results; cross-sectional comparisons
with other organisations, countries, regions, or national averages; trend
information; and baseline data or other forms of benchmarking. This gives users
essential information for judging the appropriateness of the entity’s targets.
6.6 In its SOI, MAF explains what it will measure to demonstrate success (Example 11).
However, such a discussion, standing alone, falls short of what is required for
specifying main measures and targets. The discussion needs context to inform the
user about the current situation, the history, and the projected future. Discussions
like these need to describe not just what will be measured, but also the criteria by
which success will be measured (performance measures), the current state, and
the direction and extent of the targeted level of change.

40
How will we demonstrate our success?
MAF measures success in achieving this outcome by monitoring several macro-economic
variables impacting on the sustainability of business in the agricultural, food, forestry and
related sectors. These include, among other things, investment in research and development,
regulatory effi ciency and compliance cost/burden, overall productivity, profi tability and producer
returns. MAF also monitors and evaluates the eff ectiveness of its own interventions (such as the
Sustainable Farming Fund) aimed at supporting business sustainability.
As such, positive outcomes or success will be evident in the sectors if:
> there is a proportionate increase in the total level of investment in research and development
relevant to sectors’ activities;
> there is eff ective and effi cient (or fi t-for-purpose) regulation of sectors’ activities that, as far as
possible, minimises the overall cost of compliance;
> there is an increase in businesses’ overall productivity and profi tability;
> there are high and sustainable business survival rates;
> there are net positive outcomes or benefi ts associated with MAF initiatives to support
business sustainability and development (that is, those associated with the Sustainable
Farming Fund);
> there are positive spill-overs to other sectors from the success of the land-based primary
industries.
Example 11
Ministry of Agriculture and Forestry (Te Manatū Ahuwhenua, Ngāherehere), 2008/11 Statement of Intent, page 19

41
Main measures and targets for impacts and outcomesPart 6
6.7 Te Māngai Pāho (Example 12) provides reasonably precise indicators of outcome
achievement (based on survey data) but, in this example, provides no targets or
data on the current state of aff airs or trends.
6.8 The New Zealand Fire Service Commission (Fire Service) and Retirement
Commission do better than most other entities when disclosing main measures
and targets. Despite there being room for improvement, they have provided
specifi c measures and targets for the desired achievement of outcomes (Examples
13 and 14).
6.9 The Fire Service provides a useful set of data giving outcomes information
about fi re-related incidents. This could be enriched by providing the user with
information about how its targets for the present SOI period compare with the
current state and with historical trends.
6.10 The Fire Service has also provided useful impact targets relating to the public’s
knowledge and behaviour. One measure captures beliefs, another memory recall,
and the third, action. It is implied that if these impacts on the public are achieved
there will be positive outcomes for fi re-related incidents. Again, the Fire Service
could usefully add comparable trend information to these impact measures to put
the extent of change sought into context.
6.11 Although the Retirement Commission has more work to do to identify
appropriate measures and targets for its outcomes, it has made good progress
in identifying specifi c and measurable targets. The discussion of its intended
impacts acknowledges that some are not easy to measure and, to its credit, it has
not resorted to trying to present only the easily measured aspects. Rather than
avoiding the more diffi cult measures, the Commission has attempted to apply a
similar level of detail and care to all of its signifi cant outcomes.

42
Measuring Our Performance
Outcome Measures
We have worked with entities that share a direct stake in achieving Māori language outcomes,
particularly Te Puni Kōkiri, Te Taura Whiri i te Reo Māori and Māori Television to identify the scope
for collaboration and rationalisation of eff ort around outcome measurement and evaluation.
We continue to utilise longitudinal nationwide Māori language surveys such as the Survey of
the Health of the Māori Language and the Survey of the Attitudes, Values and Beliefs towards
the Māori Language to tell us how the Māori language environment that we are working in is
changing. Through our relationship with Te Puni Kōkiri, Māori Television and Te Taura Whiri i te
Reo Māori, we have had the opportunity to contribute to the development of these two national
Māori Language Surveys which will assist us all to measure progress towards our respective and
complementary Māori language outcomes.
During 2007/08 we have been developing and confi rming an evaluation approach. In 2008/09 we
plan to build that approach into an evaluation tool that will allow us to undertake practical, cost
eff ective evaluations of our broadcasting interventions. While this tool is in development we will
continue to monitor our performance using the indicators set out in the 2007 – 12 Statement of
Intent, which are outlined below.
Major Outcome
We will determine the state of the major outcome by monitoring results and trends in the
following set of indicators.
Intermediate Outcome Indicators
Whānau, hapū, iwi, and Māori communities, maintain and strengthen their te reo Māori and tikanga Māori
number of people able to converse in Māori about a lot of everyday • things. (Census)
% of Māori who speak to others mainly in Māori (for half or more of the • time):
in their household•
while socialising•
(Survey of the Health of the Māori Language)
Learners of all ages and abilities are supported in their Māori language education, use and retention
% of Māori who are participating in learning te reo Māori (Survey of the • Health of the Māori Language)
% of Māori and non-Māori who believe it is right that Māori speak Māori • in front of people who might not understand what they are saying (Survey of Attitudes Values and Beliefs towards the Māori Language)
New Zealanders experience te reo Māori and tikanga Māori
% of Māori and non-Māori who ‘really want to be involved in things to • do with the Māori culture’ (Survey of Attitudes Values and Beliefs towards the Māori Language)
% of New Zealanders who access Māori broadcasting (extent, level etc)•
Example 12
Te Māngai Pāho (Māori Broadcasting Funding Agency), Statement of Intent 2008-13, page 22.

43
Financial and non-Financial Measures
Main non-fi nancial measures
As part of its overall evaluation processes the Commission continually reviews and updates its
strategic approach to fi re risk management and the resulting measures of performance. Some of
the national goals listed below may evolve over time as part of that process. The targets included
in the following national goals have an improvement component included when compared to
the pervious fi ve-year average.
Fire-related
Achieve and maintain the estimated total number of fi res in New Zealand to less than 2,300 per 100,000 population.1
Achieve and maintain the number of fi res in structures to less than 130 per 100,000 population.
Achieve and maintain the number of vegetation fi res to less than 120 per 100,000 population.
Achieve and maintain an avoidable residential structure fi re fatality rate of less than 0.5 per 100,000 population.
Achieve and maintain the number of life threatening and moderate injuries to the public from fi re incidents to less than 4.5 per 100,000 population.
Maintain the estimated dollar value of damage from fi res in residential structures below $54m per annum.2
Maintain the estimated dollar value of damage from fi res in non-residential structures below $50m per annum.2
Response times for fi re incidents inside fi re districts will be monitored for performance against the national service delivery guidelines of:
7 minutes 30 seconds 90% of the time for career stations •
10 minutes 90% of the time for volunteer stations.•
Contain ninety-fi ve percent of all wildfi res within two hours of being reported.
Ensure annual area burnt by wildfi res is 5% less than the previous 10-year average 75th percentile.
1 The Fire Service has incident data on the number of fi res it attends, but independent surveys show this number is between
9% and 25% of all unwanted fi res people have in houses and between 19% and 44% of outside fi res. The Commission
estimates the total number of all fi res in New Zealand each year by taking the annual number of fi res attended by the Fire
Service and dividing it by the by 5-year average percentage attended by the Fire Service. The eff ect of this calculation is to
up-rate the Fire Service incident data as if it attended 100% of all fi res. 2 The Fire Service estimates dollar value lost by using its own estimate of area damaged and the standard industry quantity
survey tables for construction cost by building type.
The following national goals measure the impact fi re safety programmes have on changing
the level of fi re safety knowledge and behaviour of the public. Also included is the level of
preparedness of fi re authorities and the work of the NRFA to encourage fi re authorities to merge
into enlarged fi re authorities. These goals contribute to fi re-related goals above.
Improve the fi re safety knowledge and behaviour of the public: projections developed for 2011:
98% of people will believe a fi re can become unsurvivable in fi ve minutes or less •
85% of people recall a fi re safety message •
96% of homes will have at least one smoke alarm installed•
Improve rural fi re planning: 100% of fi re authorities will meet their legal obligations for adopting and reviewing their fi re plans. The readiness and response parts of the fi re plan will be reviewed every two years and the risk reduction and recovery parts of the fi re plan every fi ve years.
Reduce the number of fi re authorities from 89 to 60 by 2013.*
* The achievement of this national goal will only be achieved in consultation with fi re authorities and with the agreement of
fi re authorities.
Example 13
New Zealand Fire Service Commission (Whakaratonga Iwi), Statement of Intent 2008/2011, page 32

44
Outcome 1: New Zealanders are well educated in fi nancial matters and can make informed fi nancial decisions throughout their lives
Description:
This describes a population that has the necessary information and skills to help them make
sound decisions about planning and managing their personal fi nances throughout their lives.
Personal fi nancial education includes providing information and decision-making tools, and
increasing an individual’s skills and understanding of personal fi nancial issues.
Key impacts sought:
Increased information and skill levels will shape both fi nancial attitudes and behaviours. We aim
to help people become more aware of fi nancial issues and their signifi cance and therefore able
to make more confi dent and eff ective fi nancial choices. People will have the ability to assess their
personal fi nancial situation and make quality decisions about their involvement in KiwiSaver or
other savings options as a result of the Commission’s workplace fi nancial education programme.
Activities:
The main activities are education and information based.
The Commission’s Sorted programme with its website, printed information and Your Money
Sorted television series are key strategies. The Sorted website’s practical content and calculators
gives users the opportunity to develop their fi nancial plans and see the consequences of various
courses of action.
Extension of the workplace fi nancial education programme (featuring KiwiSaver decision making
tools and information), in addition to regular Sorted marketing activities, mean that future
Sorted activity will be dominated by:
– Repositioning the Sorted brand from a fi nancial knowledge source to off ering motivational
guidance around money matters in general.
– Enhancement of both the sorted.org.nz and retirement.org.nz websites to feature wider content
and more relevant audience engagement tactics (e.g. allowing user comments on sorted.org.nz).
– Providing a wider and targeted range of printed material for specifi c segments.
– Expand face-to-face communication to include community-based seminars and conversations.
– Expand the range of KiwiSaver decision making tools and information available for both
prospective and existing members.
The general Sorted and workplace fi nancial education programmes will complement each other
to allow key sectors of New Zealand society to have ready access to a range of fi nancial education
resources. The products required and communication mediums utilised are diff erent for each
sub-audience, but will continue to be segmented as follows:
– Children.
– Students in tertiary education.
– Adults in the workplace.
– Adults in the community.
– Older New Zealanders.
The Retirement Commission led the development of a national strategy for fi nancial literacy.
With input from many individuals and organisations across the public, private and voluntary
sectors, the strategy sets a direction to link providers of fi nancial education and information,
identify any gaps in coverage and avoid duplication.
Example 14
Retirement Commission (Whiriwhiria), Statement of Intent 2008/11, pages 8-11

45
The Retirement Commission and the Families Commission are working together on a project
looking at ‘indebtedness’ of New Zealand households.
How we will measure results:
The major measures of impact will be changes in attitudes, levels of knowledge and action taken
as a result of accessing our education programmes and information. These will be measured
through the fi nancial knowledge survey that the Commission conducts in association with
ANZ, together with other benchmarked surveys and analyses. We are also looking at developing
longitudinal measures of our education programme.
Other indicators of interest levels in personal fi nancial management will be statistical measures
of the use of all Sorted resources, brand awareness and brand attribute tracking.
Key fi nancial knowledge measure is:1.
– To reduce the size of the lowest knowledge group from 33% to 25% by 2010.
Sorted resource use – overall uptake goal:2.
– To increase the percentage of New Zealanders who use Sorted resources from 19% to 30% by
2010 with over half the interaction being through the workplace.
The workplace fi nancial education programme will also be evaluated to assess the impact of 3.
KiwiSaver decision making information and tools:
– Maintain 2007 levels indicating 28% of 18-65 year olds surveyed had used Sorted resources to
help them make a decision about KiwiSaver.1
Sorted resource use – monthly average over 12 months:4.
– Visits to sorted.org.nz 110,000 – 140,000.
– Calculations made via sorted.org.nz 500,000 – 700,000.
– Sorted booklets distributed 8000 – 10,000.
Outcome 2: The fi nancial services sector is trusted
Description:
A fi nancial sector that is trusted by the public and whose products, services and charges can be
clearly understood.
Key impacts sought:
These cover both the performance of the industry and New Zealanders’ increasing levels of trust
in the industry. The industry is trustworthy when it meets the expectations of clients for the
provision of products and services and can assure the quality of these.
New Zealanders dealing with a trustworthy fi nancial sector will fi nd the experience transparent
and straightforward. Transparency extends to disclosing to clients the actual costs of products
and services and any other relevant factors that could aff ect a client’s decision – such as an
adviser’s fi nancial interests that could in any possible way be seen to be in confl ict with the
services being off ered.
Activities:
The Commission will promote research and debate about ways of improving trust in, and the
effi ciency of, the retail savings industry. We will also promote the adoption and use of standard
forms of disclosure for fi nancial advisers about the actual costs of their services and any related
interests. We will watch with interest the progress of the Financial Advisers Bill and look at ways
1 KiwiSaver campaign evaluation – Colmar Brunton, 2008
Example 14
Retirement Commission (Whiriwhiria), Statement of Intent 2008/11, pages 8-11

46
of monitoring it once enacted. We will work with the sector and other government agencies to
achieve these goals.
How we will measure results:
Evidence of impacts will be provided by various indicators such as the development and use
of improved forms of disclosure and industry commitments to improved training processes
and standards and to standardised codes of practice and conduct. Public surveys will provide a
measure of the public’s perception of the industry and its practices.
We would like to see an increase of at least 5 percentage points over the next 3 years in the 32%
of adult New Zealanders who agree or strongly agree with the statement ‘I trust most fi nancial
advisers’.2
Monitoring media commentary on the industry will also provide an indicator of trust and public
perception.
Outcome 3: Government’s retirement income policies are eff ective and stable
Description:
The wide range of government policies that have implications for New Zealanders’ fi nancial
wellbeing in retirement will be eff ective in achieving the intended results, and will do so
effi ciently and fairly. Overall policy directions will be generally stable, and will form a reliable
retirement income framework on which individuals may confi dently base their personal fi nancial
retirement plans.
Key impacts sought:
The main impacts sought are that New Zealanders will be able to plan fi nancially for their future
with reasonable certainty about the long term intentions of government and that the state
funded retirement income will provide a basic income for older people.
Activities:
The Commission will provide information and education that describes the purpose and eff ects
of relevant legislation. We will implement and monitor the agreed recommendations of the 2007
review of retirement income policy and put a reporting process in place. Through our research
and evaluation work we will identify areas of policy that work well or that may need further
consideration, development or adjustment.
How we will measure results:
The eff ectiveness of government policies in achieving intended results will be monitored and,
as necessary, reported on. The extent to which the Retirement Commissioner’s advice to the
government and its agencies is acted on will be a measure of our impact on retirement policies
and agencies’ practices. Of particular interest will be the Government’s response to the 2007
review. Other proxy measures of impact will be the amount of advice given, and research and
analysis work undertaken on the operation of current legislation and government policies.
This is a diffi cult area for which to develop standards and measures that can reasonably be used
to judge future performance. The Retirement Commission will continue to work with offi cials on
measuring the eff ectiveness of the Government’s KiwiSaver savings initiative.
2 ‘Sorted, Financial and Retirement Planning in 2005.’ AC Nielsen.
Example 14
Retirement Commission (Whiriwhiria), Statement of Intent 2008/11, pages 8-11
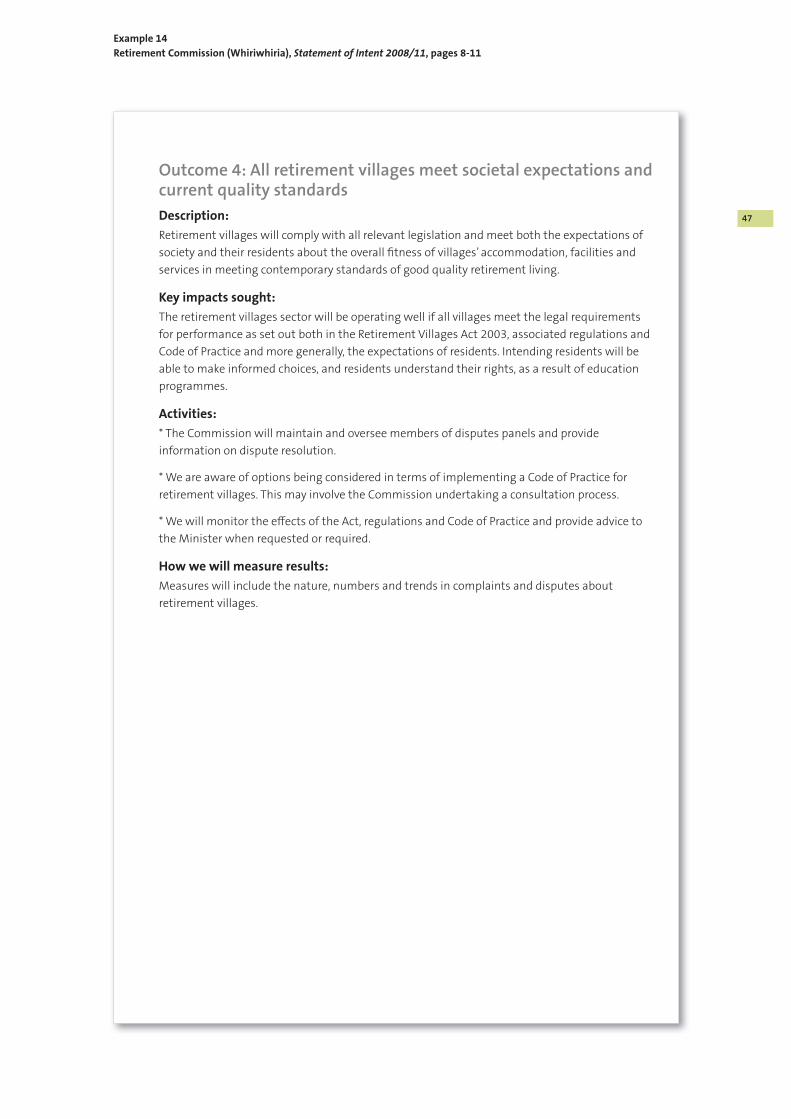
47
Outcome 4: All retirement villages meet societal expectations and current quality standards
Description:
Retirement villages will comply with all relevant legislation and meet both the expectations of
society and their residents about the overall fi tness of villages’ accommodation, facilities and
services in meeting contemporary standards of good quality retirement living.
Key impacts sought:
The retirement villages sector will be operating well if all villages meet the legal requirements
for performance as set out both in the Retirement Villages Act 2003, associated regulations and
Code of Practice and more generally, the expectations of residents. Intending residents will be
able to make informed choices, and residents understand their rights, as a result of education
programmes.
Activities:
* The Commission will maintain and oversee members of disputes panels and provide
information on dispute resolution.
* We are aware of options being considered in terms of implementing a Code of Practice for
retirement villages. This may involve the Commission undertaking a consultation process.
* We will monitor the eff ects of the Act, regulations and Code of Practice and provide advice to
the Minister when requested or required.
How we will measure results:
Measures will include the nature, numbers and trends in complaints and disputes about
retirement villages.
Example 14
Retirement Commission (Whiriwhiria), Statement of Intent 2008/11, pages 8-11


49
Part 7Linking impacts and outcomes to outputs
7.1 There should be a credible relationship between outputs and impacts/outcomes,
and it should be explained clearly in the SOI. Such an explanation helps the user to
understand how the entity believes that the goods and services it is accountable
for will result in improved outcomes. It also helps users to see the alignment
between the entity’s medium-term goals and its annual performance plan.
7.2 Information on the specifi c links is vital to evaluating the eff ectiveness of the
entity’s outputs and service performance. However, there is more than one way to
show links, and entities should experiment with diff erent formats while keeping
in mind the need for a precise and logical presentation.
7.3 Ideally, the entity’s explanation of the medium-term impacts and outcomes in
its SOI should link to a summary of the entity’s outputs (or output classes) and
illustrate the contributing outputs for each outcome. The outputs or (output
classes), depicted outside the forecast SSP as linking to the outcomes/impacts,
should correspond to those reported within the forecast SSP.
7.4 Entities are also encouraged to present the output information in SSPs (and
forecast SSPs) within the context of the outcomes they seek to infl uence
through delivering their outputs.1 However, this is more diffi cult for government
departments than for Crown entities, now that the forecast SSP is no longer
reported in the SOI. Instead this information is reported in the Information
Supporting the Estimates of Appropriation, which therefore constitutes the
forecast SSP. It is critical that government departments depict the output-to-
outcome links and explain the intervention logic within their SOIs, because the
specifi ed format of the Information Supporting the Estimates of Appropriation
constrains this part of the performance story (also see paragraph 7.12).
7.5 Entities should customise their diagrams to best depict the links among the
performance elements. Therefore, entities should not necessarily limit their model
by using a standard format if that format limits their ability to communicate the
performance story.
7.6 Specifi c links can be shown by grouping the outputs under related outcomes (if
they are discrete enough) or by using lines or arrows. MED uses a table to depict
the output-to-outcome links in its SOI (Example 15). This example contains a
useful innovation in that it identifi es its strategic priorities (SP) for particular
output/outcome relationships. This points the user to areas the entity considers to
be particularly important.
1 Technical Practice Aid No. 9: Service Performance Reporting, Institute of Chartered Accountants of New Zealand.
50
Part 7 Linking impacts and outcomes to outputs
7.7 The MED could now align its SOI with its forecast SSP in the Information
Supporting the Estimates of Appropriation. By using consistent descriptions of
outcomes and output classes, strategic priorities in the SOI could be identifi ed and
fl ow through into the forecast SSP.
7.8 Because the Information Supporting the Estimates of Appropriation now
constitutes the forecast SSP for government departments, it is important for users
that the outcome-to-output links are clear in this document. The links should
be succinctly presented in tables and description in each department's Part 1.2
(High-Level Objectives of the Vote) and Part 2.1 (Departmental Output Expenses)
of the Information Supporting the Estimates of Appropriation, as illustrated in Vote
Transport (Examples 16 and 17).
7.9 The output-to-outcome links are apparent in each example. Example 16 links the
output classes (appropriations) to “Government Outcomes” (although these are
not always phrased in outcomes language). Example 17 links the output classes to
the lower level outcomes and impacts.
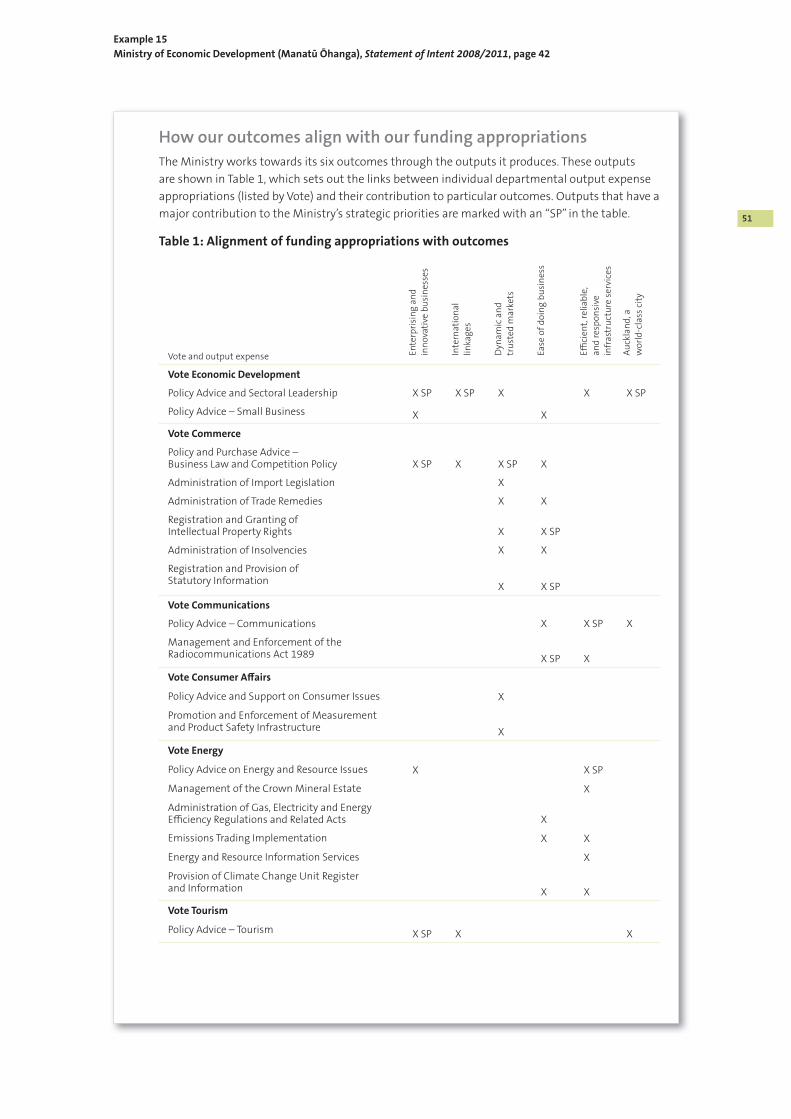
51
How our outcomes align with our funding appropriations
The Ministry works towards its six outcomes through the outputs it produces. These outputs
are shown in Table 1, which sets out the links between individual departmental output expense
appropriations (listed by Vote) and their contribution to particular outcomes. Outputs that have a
major contribution to the Ministry’s strategic priorities are marked with an “SP” in the table.
Table 1: Alignment of funding appropriations with outcomes
Vote and output expense Ente
rpri
sin
g a
nd
in
no
vati
ve b
usi
nes
ses
Inte
rnat
ion
al
linka
ges
Dyn
am
ic a
nd
tr
ust
ed m
ark
ets
Ease
of
do
ing
bu
sin
ess
Effi
cien
t, r
elia
ble
, a
nd
res
po
nsi
ve
infr
ast
ruct
ure
ser
vice
s
Au
ckla
nd
, a
wo
rld
-cla
ss c
ity
Vote Economic Development
Policy Advice and Sectoral Leadership X SP X SP X X X SP
Policy Advice – Small Business X X
Vote Commerce
Policy and Purchase Advice –Business Law and Competition Policy X SP X X SP X
Administration of Import Legislation X
Administration of Trade Remedies X X
Registration and Granting ofIntellectual Property Rights X X SP
Administration of Insolvencies X X
Registration and Provision ofStatutory Information
X X SP
Vote Communications
Policy Advice – Communications X X SP X
Management and Enforcement of theRadiocommunications Act 1989 X SP X
Vote Consumer Aff airs
Policy Advice and Support on Consumer Issues X
Promotion and Enforcement of Measurement and Product Safety Infrastructure X
Vote Energy
Policy Advice on Energy and Resource Issues X X SP
Management of the Crown Mineral Estate X
Administration of Gas, Electricity and Energy Effi ciency Regulations and Related Acts X
Emissions Trading Implementation X X
Energy and Resource Information Services X
Provision of Climate Change Unit Registerand Information X X
Vote Tourism
Policy Advice – Tourism X SP X X
Example 15
Ministry of Economic Development (Manatū Ōhanga), Statement of Intent 2008/2011, page 42
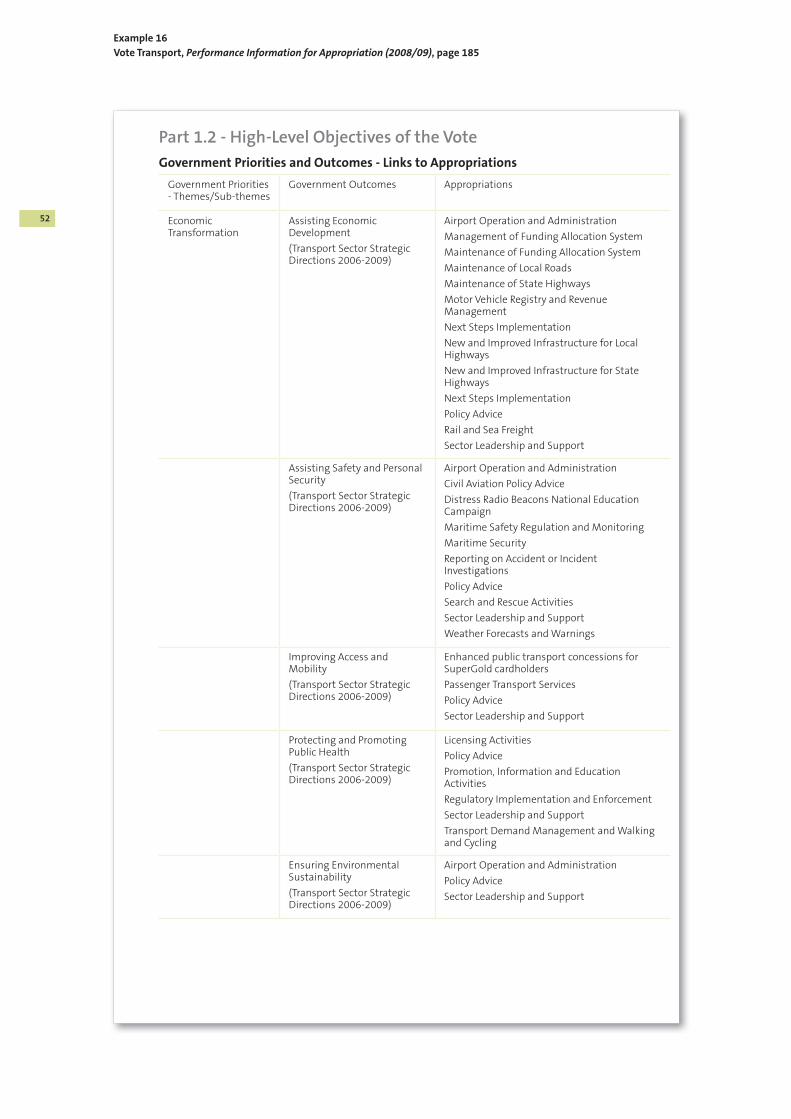
52
Part 1.2 - High-Level Objectives of the Vote
Government Priorities and Outcomes - Links to Appropriations
Government Priorities - Themes/Sub-themes
Government Outcomes Appropriations
Economic Transformation
Assisting Economic Development
(Transport Sector Strategic Directions 2006-2009)
Airport Operation and Administration
Management of Funding Allocation System
Maintenance of Funding Allocation System
Maintenance of Local Roads
Maintenance of State Highways
Motor Vehicle Registry and Revenue Management
Next Steps Implementation
New and Improved Infrastructure for Local Highways
New and Improved Infrastructure for State Highways
Next Steps Implementation
Policy Advice
Rail and Sea Freight
Sector Leadership and Support
Assisting Safety and Personal Security
(Transport Sector Strategic Directions 2006-2009)
Airport Operation and Administration
Civil Aviation Policy Advice
Distress Radio Beacons National Education Campaign
Maritime Safety Regulation and Monitoring
Maritime Security
Reporting on Accident or Incident Investigations
Policy Advice
Search and Rescue Activities
Sector Leadership and Support
Weather Forecasts and Warnings
Improving Access and Mobility
(Transport Sector Strategic Directions 2006-2009)
Enhanced public transport concessions for SuperGold cardholders
Passenger Transport Services
Policy Advice
Sector Leadership and Support
Protecting and Promoting Public Health
(Transport Sector Strategic Directions 2006-2009)
Licensing Activities
Policy Advice
Promotion, Information and Education Activities
Regulatory Implementation and Enforcement
Sector Leadership and Support
Transport Demand Management and Walking and Cycling
Ensuring Environmental Sustainability
(Transport Sector Strategic Directions 2006-2009)
Airport Operation and Administration
Policy Advice
Sector Leadership and Support
Example 16
Vote Transport, Performance Information for Appropriation (2008/09), page 185

53
Linking impacts and outcomes to outputsPart 7
7.10 The format does not show the links between the “Government Outcomes” (Part
1.2) and the lower-level outcomes and impacts (Part 2.1) for Vote Transport.
The Ministry of Transport has sensibly used its SOI to draw these links together
(Example 18). The “Government Outcomes” are referred to as “Objectives” in its
SOI and, for each of the fi ve “Objectives”, it lists the relevant outcomes (as in Part
2.1 of the Information Supporting the Estimates of Appropriation). Example 18 shows
the Ministry of Transport’s approach for its “Objective 1: Assisting Economic
Development”.
7.11 Although MAF’s “Strategic Direction” diagram in its SOI (see Example 7) does
not draw explicit links between output classes and outcomes, there are good
links with intermediate outcomes in the Information Supporting the Estimates of
Appropriation – for example, in Vote Biosecurity (Example 19).
7.12 Because of the specifi ed two-column format in the Information Supporting the
Estimates of Appropriation, any depiction of intervention logic in these documents
will necessarily be two-dimensional only. This format provides one approach
to showing how outputs link to outcomes, but it will not always be the most
eff ective approach. SOIs provide an opportunity for entities to use diff erent
formats.
7.13 In summary, it is important that government departments and Crown entities
depict and explain the important intervention logic links within their SOIs. The
SOI allows more freedom and fl exibility for entities to best present the model of
their intervention logic, including using diagrams, for drawing the important links
between outputs, impacts, and outcomes.

54
Part 2 - Details and Expected Performance for Output ExpensesPart 2.1 - Departmental Output Expenses
Intended Impacts, Outcomes and Objectives
Intended Impacts, Outcomes or Objectives of Appropriations Appropriations
Outcome - The eff ectiveness of the transport system is being maintained or improved.
Airport Operation and Administration
Motor Vehicle Registry and Revenue Management
Next Steps Implementation
Policy Advice
Sector Leadership and Support
Outcome - The effi ciency of the transport system is continuing to improve.
Airport Operation and Administration
Motor Vehicle Registry and Revenue Management
Next Steps Implementation
Policy Advice
Sector Leadership and Support
Outcome - The negative impacts of land-use developments on the transport system are reducing.
Policy Advice
Sector Leadership and Support
Outcome - Growth and development are increasingly integrated with transport.
Next Steps Implementation
Policy Advice
Sector Leadership and Support
Outcome - Transport users increasingly understand and meet the costs they create.
Policy Advice
Sector Leadership and Support
Outcome - New Zealand’s transport system is improving its international and domestic linkages including intermodal transfers.
Policy Advice
Sector Leadership and Support
Outcome - The transport system is improving its ability to recover quickly and eff ectively from adverse events.
Policy Advice
Sector Leadership and Support
Outcome - The transport system is increasingly providing aff ordable and reliable community access.
Policy Advice
Sector Leadership and Support
Outcome - New Zealand’s transport system is increasingly safe and secure.
Airport Operation and Administration
Distress Radio Beacons National Education Campaign
Motor Vehicle Registry and Revenue Management
Policy Advice
Sector Leadership and Support
Outcome - Negative impacts of transport are reducing in terms of fatalities, injuries and harm to health.
Policy Advice
Sector Leadership and Support
Outcome - Negative impacts of transport are reducing in terms of the human and natural environments.
Airport Operation and Administration
Policy Advice
Sector Leadership and Support
Outcome - The transport system is actively moving towards reducing the use of non-renewable resources and their replacement with renewable resources.
Policy Advice
Sector Leadership and Support
Example 17
Vote Transport, Performance Information for Appropriations (2008/09), page 190

55
Example 18
Ministry of Transport (Te Manatū Waka), Statement of Intent 2008-2011, page 9
Operating Intentions
Objective 1:
Assisting economic development
What are we seeking to achieve?
The objective is to achieve a transport system that supports and assists long-term economic
growth and improves the economic and social well-being of New Zealanders through more
productive use of resources.
Outcomes relating to this objective are:
+ growth and development are increasingly integrated with transport
+ transport users increasingly understand and meet the costs they create
+ New Zealand’s transport system is improving its international and domestic linkages
including inter-modal transfers
+ the effi ciency of the transport system is continuing to improve
+ the eff ectiveness of the transport system is being maintained or improved
+ the negative impacts of land-use developments on the transport system are reducing.

56
Part 2 - Details and Expected Performance for Output ExpensesPart 2.1 - Departmental Output Expenses
Intended Impacts, Outcomes and Objectives
Intended Impacts, Outcomes or Objectives of Appropriations Appropriation
Immediate outcome or impact
Policy advice and initiatives that support the ongoing development and implementation of New Zealand’s biosecurity system as articulated in the New Zealand Biosecurity Strategy.
Intermediate outcomes
A business environment for the agriculture, food, forestry and related sectors that supports innovation, enterprise and high performance.
New Zealanders are informed and involved participants in MAF’s regulatory systems.
Biosecurity Policy
Intermediate outcomes
Market access for New Zealand’s animal and plant products is maintained through the administration of biosecurity standards, and the provision of export certifi cation. It involves auditing against biosecurity regulatory standards and providing assurance to trading partners that New Zealand exporters are complying with the relevant regulations.
New Zealand’s reputation for consistent and principled application of international trade, sanitary and phytosanitary rules is maintained and/or enhanced through the provision of approvals and assurance to trading partners that New Zealand exporters are complying with the relevant regulations.
End outcome
Market access for New Zealand’s animal and plant products is maintained and/or enhanced.
Biosecurity Approvals and Assurance
Intermediate Outcomes
New Zealand’s reputation for consistent and principled application of international trade, sanitary and phytosanitary rules is maintained and/or enhanced through the investigation and (where appropriate) prosecution of individuals and organisations who breach biosecurity legislation.
New Zealanders are informed and involved participants in MAF’s regulatory systems.
Biosecurity Enforcement
Immediate outcome or impact
The development (and subsequent implementation) of the New Zealand Biosecurity System is based on scientifi c evidence and current research. This is refl ected in the development of system-wide standards (and subsequent implementation) that are integrated, adaptive, and timely in protecting New Zealand’s natural advantage. This process relies on MAF BNZ undertaking risk analysis to support standard development, administration of biosecurity standards and export certifi cation, and monitoring of border pathways.
End outcome
Market access for New Zealand’s animal and plant products is maintained.
New Zealand’s reputation for consistent and principled application of international trade, sanitary and phytosanitary rules, regulations and/or standards is maintained and/or enhanced.
Biosecurity Standards
Example 19
Vote Biosecurity, Performance Information for Appropriations (2008/09), pages 43-44

57
Immediate outcome or impact
Potentially harmful pests and diseases are detected (and/or eradicated) through the implementation of surveillance activity in the terrestrial and aquatic environments and, if necessary, pests are eradicated or managed.
Intermediate outcomes
Prevention and reduction of harm to:
economic activity•
human health and wellbeing•
the natural environment, and•
resources of economic and cultural value to Māori • from pests and diseases.
End outcomes
Sustainable economic growth and prosperity for New Zealanders.
Healthy New Zealanders.
Maintained and enhanced economic, social and cultural benefi ts for New Zealanders from the environment.
Biosecurity Surveillance and Incursion Response
Immediate outcome or impact
Potentially harmful pests and diseases are intercepted at main (border) entry points through the identifi cation and management of all biosecurity risk goods, and goods that may be contaminated with biosecurity risk organisms. It includes the inspection and clearance of aircraft, vessels, cargo, containers, mail and passengers, and the audit and approval of transitional facilities, in accordance with biosecurity legislation and standards.
Intermediate outcomes
Prevention and reduction of harm to:
economic activity•
human health and wellbeing•
the natural environment, and•
resources of economic and cultural value to Māori • from pests and diseases.
End outcomes
Sustainable economic growth and prosperity for New Zealanders.
Healthy New Zealanders.
Maintained and enhanced economic, social and cultural benefi ts for New Zealanders from the environment.
Border Clearance Services
Example 19
Vote Biosecurity, Performance Information for Appropriations (2008/09), pages 43-44


59
Part 8Specifying outputs and output classes
8.1 The forecast SSP sets out the entity’s plans for its service delivery for the fi rst
year of the period covered by the SOI. For Crown entities, the forecast SSP should
be clearly distinguishable within the SOI. For both government departments
and Crown entities, the subject of the forecast SSP is to report intended output
performance. Therefore, the reported elements should meet the defi nition of
outputs and should exclude other elements (for example, inputs, activities,
processes, impacts, or outcomes) except where these are useful or necessary to
provide context. If reference is made to other elements of performance within
the forecast SSP, they should be clearly distinguishable and not reported as if they
were outputs.
8.2 Another reason for clearly distinguishing the forecast SSP is that it forms the basis
for the historical SSP, the end-of year performance report, which is audited as part
of the entity’s annual report.
8.3 Using output classes allows the entity to group services, and to aggregate them
where possible. This gives report users enough information without burdening
them with too much detail. Output classes should group similar outputs within
one class. Irrespective of how the outputs are grouped, the underlying rationale
should be clear and justifi able in all instances.
8.4 Entities should use the same output classes and headings in the medium-term
part of the SOI as they have used in the forecast SSP. This is necessary to show a
consistent performance framework within their performance reports and to help
users identify the primary links from outputs to outcomes. It is also desirable that
output classes are consistent or reconcilable between the fi nancial and non-
fi nancial performance information, so users are better able to evaluate the entity’s
performance (for example, for cost-eff ectiveness).
8.5 Customs provides a well-structured list of its output classes (the column headed
“Appropriations”) in Part 1.2 of the Information Supporting the Estimates of
Appropriation for Vote Customs (Example 20).
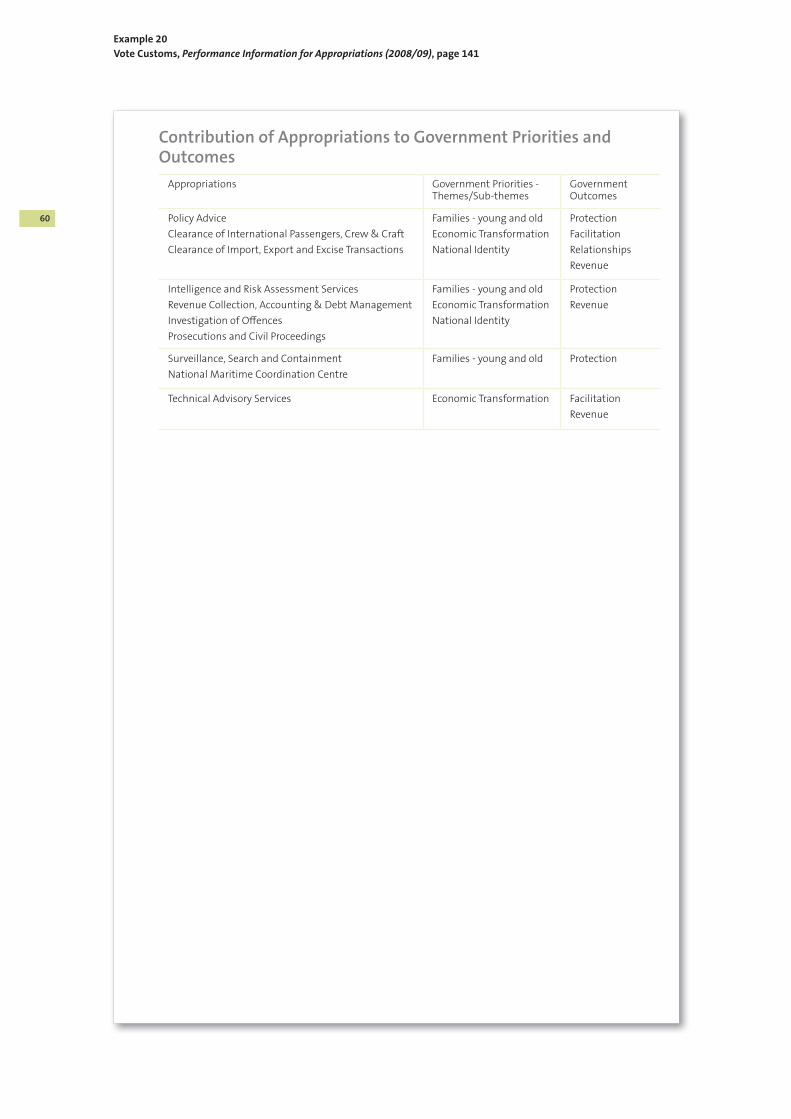
60
Contribution of Appropriations to Government Priorities and Outcomes
Appropriations Government Priorities - Themes/Sub-themes
Government Outcomes
Policy Advice
Clearance of International Passengers, Crew & Craft
Clearance of Import, Export and Excise Transactions
Families - young and old
Economic Transformation
National Identity
Protection
Facilitation
Relationships
Revenue
Intelligence and Risk Assessment Services
Revenue Collection, Accounting & Debt Management
Investigation of Off ences
Prosecutions and Civil Proceedings
Families - young and old
Economic Transformation
National Identity
Protection
Revenue
Surveillance, Search and Containment
National Maritime Coordination Centre
Families - young and old Protection
Technical Advisory Services Economic Transformation Facilitation
Revenue
Example 20
Vote Customs, Performance Information for Appropriations (2008/09), page 141

61
Specifying outputs and output classesPart 8
8.6 Within each output class, the forecast SSP should include the outputs for which
the entity is accountable. These are the goods and services provided to third
parties, whether delivered directly by the entity or delivered by contractors. All
signifi cant goods and services should be identifi ed and reported on, to ensure
users get a comprehensive, balanced, and proportionate picture of the entity’s
services.
8.7 What makes up an individual output as opposed to an output class or a sub-
output is a matter of judgement. Practices vary across entities on the extent to
which outputs are grouped into output classes or split into sub-outputs. The
National Library of New Zealand clearly lays out its output classes, and outputs
within those classes (Example 21).
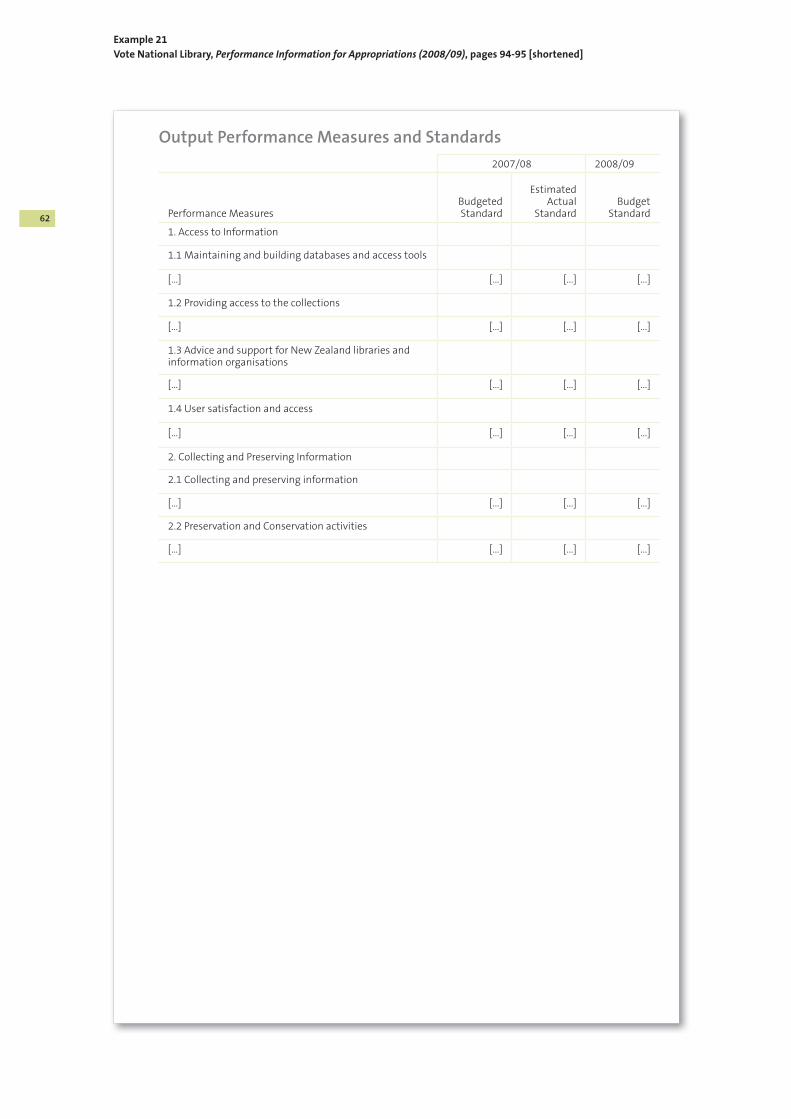
62
Output Performance Measures and Standards
2007/08 2008/09
Performance MeasuresBudgeted Standard
Estimated Actual
StandardBudget
Standard
1. Access to Information
1.1 Maintaining and building databases and access tools
[...] [...] [...] [...]
1.2 Providing access to the collections
[...] [...] [...] [...]
1.3 Advice and support for New Zealand libraries and information organisations
[...] [...] [...] [...]
1.4 User satisfaction and access
[...] [...] [...] [...]
2. Collecting and Preserving Information
2.1 Collecting and preserving information
[...] [...] [...] [...]
2.2 Preservation and Conservation activities
[...] [...] [...] [...]
Example 21
Vote National Library, Performance Information for Appropriations (2008/09), pages 94-95 [shortened]
63
Specifying outputs and output classesPart 8
8.8 The forecast SSP can be enriched by providing context informing the user about
why the services are being delivered. If enough context is given, and relevant
performance measures are chosen, the user should then be able to appreciate the
relationship between the performance dimensions being measured and reported,
and the eff ect that successful service delivery should have on the outcomes.
8.9 The Offi ce of the Health and Disability Commissioner (Example 22) provides
an informative contextual introduction to its output reporting. (However, the
outcomes context here does not correspond well to the outcomes discussion
elsewhere in the SOI, and we consider there is signifi cant room for improvement
in selecting and reporting its output performance measures.)
64
6.1 Output 1 – Complaints Resolution
Value 2008/09 $3,844,438
The Commissioner has various options when a complaint is received to secure a fair, simple,
speedy and effi cient resolution. He may decide to take no action, for example, where the passage
of time makes it impracticable to take any action, or where a complaint is made by someone
other than the consumer and the consumer does not wish the matter to proceed.
The other options open to the Commissioner include:
gathering additional information and sharing this with the parties concerned, which can •
often resolve the matter for the complainant
writing an educational letter to the relevant party•
referring the complainant to the provider to work with the complainant to resolve the •
concerns raised, and asking both the provider and the complainant to report back on the
outcome
referring the complainant to advocacy for assistance in resolving his or her complaint•
referring the parties to formal mediation to resolve the complaint•
referring the complaint for investigation•
referring the complaint to an agency who is better placed to manage the complaint, for •
example, the Privacy Commissioner or the Human Rights Commission.
Where complaints are outside jurisdiction, the Commissioner’s approach is always to assist the
complainant or enquirer to identify the correct agency, as many callers fi nd it diffi cult to discern
the Commissioner’s role from the name of the offi ce, and often expect the offi ce to be able to
deal with any matters related to the broader health and disability sector issues.
HDC responds to enquiries from the public, health and disability service providers, and from
a range of other associated bodies and organisations in the health and disability sectors. In
responding to enquiries, HDC off ers advice and information in order to assist consumers to better
understand health and disability services and systems and to participate more fully in their care.
The information and advice is provided both verbally and in writing. It can assist people to take
their own action in managing concerns they have with a health or disability service provider.
Sometimes it simply helps to clarify a matter and no further action on the part of the enquirer is
needed.
When someone makes a complaint about a health or disability service, HDC looks for the
lessons from the complaint and uses this to encourage improvements to the service in question.
Complaints help consumers to have their needs and expectations known and understood. They
assist in identifying poor practice and poor systems and allow remedial action to be taken.
Complaints help to keep people safe by off ering a learning opportunity to all involved, especially
the health or disability service provider. Complaints off er insight into the reasons for near misses,
preventable injuries, emotional harm and preventable deaths.
Serious complaints that are upheld off er an opportunity not only for learning but also for
accountability. An individual or organisation that has seriously breached the Code of Rights may
be censured by the Commissioner and face disciplinary action. Very serious cases are referred to
the Director of Proceedings for prosecution, and this may result in loss of the right to practise
as a registered health professional. This protects the public from providers whose practice is
signifi cantly below the acceptable standard and at risk of causing harm.
Example 22
Offi ce of the Health and Disability Commissioner (Te Toihau Hauora, Hauātanga), Statement of Intent 2008/09, pages 17-21
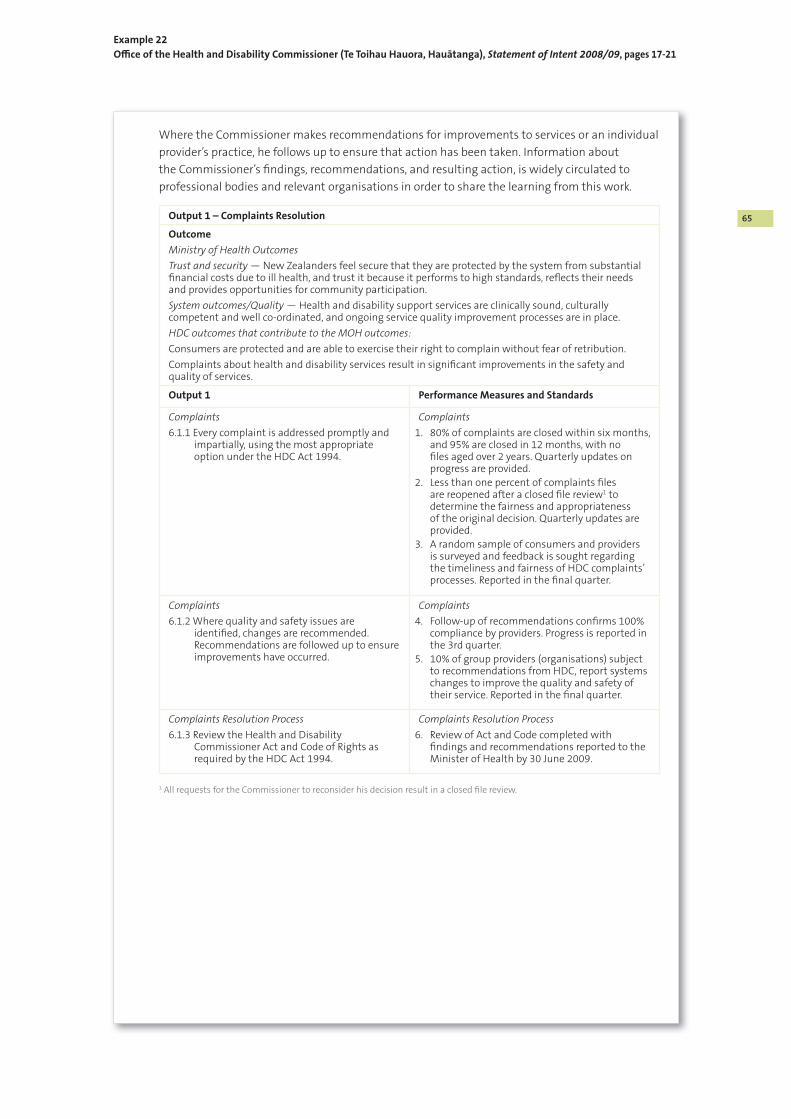
65
Example 22
Offi ce of the Health and Disability Commissioner (Te Toihau Hauora, Hauātanga), Statement of Intent 2008/09, pages 17-21
Where the Commissioner makes recommendations for improvements to services or an individual
provider’s practice, he follows up to ensure that action has been taken. Information about
the Commissioner’s fi ndings, recommendations, and resulting action, is widely circulated to
professional bodies and relevant organisations in order to share the learning from this work.
Output 1 – Complaints Resolution
Outcome
Ministry of Health Outcomes
Trust and security — New Zealanders feel secure that they are protected by the system from substantial fi nancial costs due to ill health, and trust it because it performs to high standards, refl ects their needs and provides opportunities for community participation.
System outcomes/Quality — Health and disability support services are clinically sound, culturally competent and well co-ordinated, and ongoing service quality improvement processes are in place.
HDC outcomes that contribute to the MOH outcomes:
Consumers are protected and are able to exercise their right to complain without fear of retribution.
Complaints about health and disability services result in signifi cant improvements in the safety and quality of services.
Output 1 Performance Measures and Standards
Complaints
6.1.1 Every complaint is addressed promptly and impartially, using the most appropriate option under the HDC Act 1994.
Complaints
80% of complaints are closed within six months, 1. and 95% are closed in 12 months, with no fi les aged over 2 years. Quarterly updates on progress are provided.
Less than one percent of complaints fi les 2. are reopened after a closed fi le review1 to determine the fairness and appropriateness of the original decision. Quarterly updates are provided.
A random sample of consumers and providers 3. is surveyed and feedback is sought regarding the timeliness and fairness of HDC complaints’ processes. Reported in the fi nal quarter.
Complaints
6.1.2 Where quality and safety issues are identifi ed, changes are recommended. Recommendations are followed up to ensure improvements have occurred.
Complaints
Follow-up of recommendations confi rms 100% 4. compliance by providers. Progress is reported in the 3rd quarter.
10% of group providers (organisations) subject 5. to recommendations from HDC, report systems changes to improve the quality and safety of their service. Reported in the fi nal quarter.
Complaints Resolution Process
6.1.3 Review the Health and Disability Commissioner Act and Code of Rights as required by the HDC Act 1994.
Complaints Resolution Process
Review of Act and Code completed with 6. fi ndings and recommendations reported to the Minister of Health by 30 June 2009.
1 All requests for the Commissioner to reconsider his decision result in a closed fi le review.

66
6.2 Output 2 — Education
Value 2008/09 $888,505
Through education HDC aims to have providers understand their responsibilities and comply
willingly with the requirements of the Health and Disability Commissioner Act 1994, and have
consumers know their rights under the Act and feel free from fear to exercise those rights.
The Advocacy Service is the primary vehicle for promoting awareness of the Code of Rights to
the public, both to consumers and providers of health and disability services. However, the
Commissioner’s Offi ce also focuses on several types of promotional and educational initiatives:
Presentations• at conferences and seminars, both nationally and internationally, on specifi c
areas of interest to provider and consumer audiences. Findings from the Commissioner’s
complaints resolution work are used to facilitate a deeper understanding of issues providers
and consumers need to be cognisant of, along with suggestions for service improvement.
Staff from the Commissioner’s Offi ce often work in a co-facilitation role with advocates and
consumers to deliver educational sessions to special interest groups.
Customised training• working with consumers to help them build support networks in
situations where they are likely to need ongoing help to work in partnership with a particular
provider or a number of providers. Customised training is also developed and implemented
with individual providers and group providers to address their specifi c needs in relation to
better meeting their obligations under the Code, whether it is changes to their practice or
their systems.
Opinions• given by the Commissioner provide information for the public and, in particular,
professional bodies on issues for improvement in the delivery of health and disability services.
The opinions outline areas for learning around professional accountability and systems
failure. Case studies are also available. These can be found on the Commissioner’s website,
www.hdc.org.nz.
Publications• in a range of media are available from the Commissioner’s Offi ce and can be
ordered on-line or by post or fax. These publications explain the role of the Health and
Disability Commissioner, the processes used in carrying out the Commissioner’s functions,
and information about the services off ered by the Commissioner’s Offi ce. Many of these
publications are available in languages other than English and Māori. There are easy-read
versions of the key publications. All information produced is free to the public.
Articles• written by the Commissioner and members of his senior management team
are published regularly in a wide range of health and disability journals, magazines and
newsletters.
Media interviews and releases• are given where there are opportunities for wider learning as a
result of HDC fi ndings or where there is a perceived public safety issue.
DVD movies• are provided for use as training and awareness-raising tools and for providing
general information.
Example 22
Offi ce of the Health and Disability Commissioner (Te Toihau Hauora, Hauātanga), Statement of Intent 2008/09, pages 17-21

67
Output 2 – Education
Outcome
Ministry of Health Outcomes
Trust and security — New Zealanders feel secure that they are protected by the system from substantial fi nancial costs due to ill health, and trust it because it performs to high standards, refl ects their needs and provides opportunities for community participation.
System outcomes/Quality — Health and disability support services are clinically sound, culturally competent and well co-ordinated, and ongoing service quality improvement processes are in place.
Reduced inequalities — we achieve an improvement in the health status of those currently disadvantaged, particularly Māori, Pacifi c peoples and people with low social economic status.
HDC outcomes that contribute to the MOH outcomes
Consumers are protected and are able to exercise their right to complain without fear of retribution.
Sustainable improvements in safety and quality in the health and disability sectors are achieved through learning from complaints.
Output 2 Performance Measures and Standards
6.2.1 Provide six-monthly Commissioner complaints trend reports to DHBs in September 2008 and March 2009.
6.2.2 Develop two national educational initiatives aimed at strengthening consumer voice and increasing the use of consumer-centred approaches by providers, by 30 June 2009.
6.2.3 Produce a DVD on the Code of Rights in New Zealand Sign Language by 30 June 2009.
6.2.4 Produce and deliver 300,000 units of educational material by 30 June 2009.
6.2.5 Facilitate two consumer seminars by 30 June 2009.
6.2.6 Provide 20 education presentations to health and disability sector organizations by 30 June 2009.
6.2.7 Provide two intensive provider training programmes for providers who may work in isolation or in settings where there is little or no input from consumers of the service.
6.2.8 Provide quality responses to relevant submission documents aff ecting the rights of health and disability services consumers.
80% of DHBs report that they fi nd the trend 1. reports useful and describe how they have used the trend information.
Educational initiatives implemented.2.
DVD produced.3.
Percentage of new orders rather than repeat 4. orders for educational material increases from 3% to 5% a month.
80% of participants who respond to the seminar 5. evaluation rate that they were satisfi ed or very satisfi ed with the usefulness of the seminar.
100% of requestors of education presentations 6. rate that the presentations met their expectations.
80% of participants who respond to an 7. evaluation of the intensive training programme rate that they were satisfi ed or very satisfi ed with the content and delivery of the programme.
Provide an annual report on the impact of policy 8. advice given and submissions made by 30 June 2009 with quarterly updates on the percentage of satisfaction with the quality of our policy advice and submissions.
Example 22
Offi ce of the Health and Disability Commissioner (Te Toihau Hauora, Hauātanga), Statement of Intent 2008/09, pages 17-21


69
Part 9Performance measures and targets for outputs
9.1 To provide a balanced and rounded performance story about service delivery, it is
usually necessary for output performance measures to cover several dimensions
of performance (for example, quantity, quality, and timeliness of service delivery).
It may also be necessary to include a variety of diff erent measures within each
dimension (that is, several quantity or quality measures).
9.2 The Securities Commission adopts a clear and orderly format, grouping together
measures of quantity, quality, timeliness, and cost in its forecast SSP (Example 23).
We have reservations about several of the performance measures themselves, but
consider the output information to be clearly presented and well organised.
9.3 The clear categorisation of dimensions presented by the Securities Commission
in its SOI can be easily applied to the Information Supporting the Estimates of
Appropriation, as shown by the Ministry of Social Development (Example 24). The
budgeted and estimated actual fi gures for 2007/08, required in the Information
Supporting the Estimates of Appropriation, provide a useful background to the
2008/09 targets.

70
Performance standards
Performance measuresSurveillance and enforcement
2008/2009 Forecast
2007/2008 Achievements as estimated at 30 April 2008
Quantity
Complete surveillance actions that meet the Commission’s case criteria relating to the above matters
132 87
Complete the enforcement actions that meet the Commission’s case selection criteria, relating to the above matters.
5 6
One key area (e.g. fi nance companies or adviser disclosure statements) is identifi ed, investigated & reported on
1 NA – new measure in 2008/09
Complete the fi nancial reporting surveillance programme 2 cycles in the year 2
Quality
Surveillance & enforcement resources are applied in accordance with the Commission’s market surveillance and enforcement priorities
Full compliance Full compliance
The desired regulatory result is achieved in surveillance cases where defi ciencies are identifi ed
90% NA – new measure in 2008/09
Enforcement actions achieve the desired regulatory result. 80% 80%
There is no successful judicial review of the Commission’s decisions or actions.
100% 100%
Timeliness
Complete surveillance actions On average within 3 months
On average within 3 months
Progress civil enforcement actions from investigation to the fi ling of proceedings.
On average, within 24 months of commencement of investigation
No cases taken
Complete other enforcement actions. On average, within 6 months of action commencing
1.5 months
Complete fi nancial reporting surveillance reporting programme
On average within 9 months of commencing each cycle
On average within 8.7 months of commencing each cycle
Cost
Expenditure allocated to surveillance and enforcement work
38% 38%
Example 23
Securities Commission, Statement of Intent 2008-2011, page 38

71
Output Performance Measures and Standards
2007/08 2008/09
Performance MeasuresBudgeted Standard
Estimated Actual
StandardBudget
Standard
Quality
The percentage of actions accurately processed by War Pensions Services will be no less than: 95% 95% 95%
Timeliness
The percentage of new disability applications and reassessments of accepted disability that are administered and processed by the Ministry of Social Development (applications are acknowledged and the decision of the claims panels relayed to veterans) will be completed within 14 working days will be no less than: 85% 90% 90%
The percentage of National Review Offi cer decisions that are administered and processed by the Ministry of Social Development (application acknowledged and decision referred to the claims panel) within 9 working days will be no less than: 90% 90% 90%
The percentage of ad hoc payments, overseas treatment schedules, rehabilitation schedules and reimbursements that will be made within 21 working days of receipt will be no less than: 97% 97% 97%
The percentage of calls answered within 20 seconds will be no less than: 90% 90% 90%
The percentage of new Veteran’s Pension applications that are administered and processed by the Ministry of Social Development (application acknowledged and decision relayed to the veteran) within 7 days will be no less than: 90% 90% 90%
Veterans’ satisfaction
The results of the veterans’ satisfaction survey will be reported biennially to the Minister, where veterans’ satisfaction with the level of service and information provided will be no less than: 85% 85% 85%
Example 24
Vote Veterans Aff airs – Social Development, Performance Information for Appropriations (2008/09), page 134

72
Part 9 Performance measures and targets for outputs
9.4 Performance measures need to be meaningful. They need to measure the service
aspects that represent good performance, and that are within the control of
the reporting entity. Therefore, performance measures need to be relevant,
controllable, valid, verifi able, unbiased, complete and balanced, understandable,
and comparable.
9.5 Specifi c and measurable targets should be attached to the performance measures,
preferably with comparative data, including prior-year targets and actuals (see
Example 24). The SOIs (including the forecast SSPs for Crown entities) provide
scope for reporting longer-term historical trend information that gives users some
context for the current set targets. At the very least, forecast targets should be
included for the forthcoming annual reporting period. Longer-term targets are
more useful in helping users understand the direction and level of the entity’s
intended performance. Comparative information from other entities, regions, or
countries can function as useful benchmarking.
9.6 Well-specifi ed targets with contextual information allow users to gauge the
entity’s intended level of performance for the period and to compare actual
performance against intended performance. Targets should be reasonable (in
terms of representing best estimates), and refl ect the priorities of the entity, its
resources, decisions, and past performance.
9.7 Many of the Department of Internal Aff airs’ performance measures in the Vote
Internal Aff airs Estimates material relates to quality measures (for example, error
rates) and timeliness measures (for example, turnaround times for applications).
Other types of measures are used in its Regulatory Services output class (Example 25).
Of note in Vote Internal Aff airs is the considerable amount of “activity
information”, which is demand-driven.

73
Output Performance Measures and Standards
2007/08 2008/09
Performance MeasuresBudgeted Standard
Estimated Actual
StandardBudget
Standard
Regulatory Services - Gambling
Percentage of licence renewal applications processed within two months of receipt is no less than:
80% 73% 80%
Percentage of all other licence applications processed within one month of receipt is no less than:
90% 80% 90%
Percentage of audits of gaming machine societies completed within three months and the balance within six months.
80% within 3 months
20% within 6 months
80% within 3 months
20% within 6 months
80% within 3 months
20% within 6 months
Percentage of breaches found in audits and investigations that are followed up and result in rectifi cation or further compliance action, in accordance with the timeframes set out in the relevant follow-up process, is no less than:
100% 100% 100%
Percentage of gambling prosecution cases dismissed where prima facie case is not established is no more than:
Revised measure
Revised measure
5%
Percentage of respondents to a survey of gambling sector organisations and operators who rate their satisfaction with how information services provided by the Department support their ability to comply with relevant laws, conditions and rules at 3 or above on a scale of 1 to 5 is no less than:
85% 85% 85%
Number of formal presentations and compliance educational inspections to the gambling sector.
10 formal presentations
500 compliance educational inspections
25 formal presentations
250 compliance educational inspections
10 formal presentations
As required for compliance educational inspections
Activity Information1
Number of licence renewal applications processed.
New measure New measure 350 - 400
Number of other licence applications processed. New measure New measure 5,500- 6,000
Number of audits of casino operators and gambling sector organisations identifi ed as high risk, in accordance with their risk profi le.
As required 60 As required
Number of investigations of casino operators and gambling sector organisations where serious non-compliance is identifi ed through audit, intelligence or complaints.
As required 70 As required
Example 25
Vote Internal Aff airs, Performance Information for Appropriations (2008/09), pages 195-196

74
Example 25
Vote Internal Aff airs, Performance Information for Appropriations (2008/09), pages 195-196
Number of instances of non-compliance with gambling laws that are detected during audits and investigations that result in a warning or sanction.
As required 400 As required
Number of non-compliant activities that have resulted in a prosecution, an infringement notice, or application to the Gambling Commission.
As required 70 As required
Gambling Commission
The Gambling Commission’s satisfaction with the services provided by the secretariat is 3 or above on a scale of 1 to 5.
3 or above 3 3 or above
Regulatory Services - Censorship
Percentage of non-compliant practices identifi ed during inspection processes or as a result of complaints are dealt with during the inspection or within 3 months, and the balance dealt with within 12 months.
75% within 3 months
25% within 12 months
75% within 3 months
25% within 12 months
75% within 3 months
25% within 12 months
Percentage of censorship prosecution cases dismissed where prima facie case is not established is no more than:
Revised measure
Revised measure
5%
Activity Information1
Number of inspections at outlets for publications/videos/fi lms undertaken.
1,500 1,500 1,500
Number of censorship complaints and proactive investigations for publications/videos/fi lms and on the Internet responded to.
700 700 700
Number of censorship prosecutions undertaken. 20 - 40 40 20 - 40
Regulatory Services - Unsolicited Electronic Messages
Percentage of non-compliant practices identifi ed as a result of complaints which are dealt with within 3 months of receipt and the balance dealt with within 12 months of receipt of the complaint.
New measure New measure 75% within 3 months
25% within 12 months
Number of formal presentations to industry and the community.
New measure New measure 4
Activity Information1
Number of New Zealand-linked complaints and proactive investigations responded to.
New measure New measure 700
1 Activity information relates to output volume measures that are demand driven and therefore outside the
Department’s control.

75
Performance measures and targets for outputsPart 9
9.8 Generally, data that record demand-driven events relate to matters outside
the reporting entity’s control (for example, number of applications received,
number of prisoners, and number of students enrolled in compulsory education
programmes). They are not often “true” measures of performance, because
demand-driven data do not tell the user about how well the service is being
delivered. However, purely demand-driven data may provide context, and be
useful when they relate to real measures of performance (for example, the eff ect
on the quality of services from a change in throughput volume).
9.9 Usually, reporting demand-driven data is unnecessary from an external
performance reporting perspective. However, if the demand-driven data are
included in a forecast SSP for contextual reasons, then this inclusion should
be justifi ed and explained. Importantly, reporting demand-driven data is not a
substitute for true service performance measures and targets, or results.
9.10 If the demand-driven data are considered necessary to provide meaning to service
performance reports, then they should be clearly identifi ed and separated from
the true performance measures. The Department of Internal Aff airs has done
exactly that and includes a useful footnote explanation (Example 25).
9.11 We consider that the New Zealand Qualifi cations Authority (NZQA) provides
one of the better examples of a Crown entity forecast SSP, in terms of its clear
and orderly layout (Example 26). The format of NZQA’s report provides a useful
starting point for showing its output classes, outputs, performance measures, and
targets. However, the report could be clearer if separate columns for performance
measures and performance targets are included to distinguish the measure from
the target.
9.12 Although there are areas for improvement in the content of the forecast SSP, we
consider this example shows a useful format for presenting performance targets
across the various dimensions (that is, quantity, quality, and timeliness). Areas
for improvement in content include: removing information on processes; better
identifi cation of some outputs; and identifying performance criteria where they
are currently absent.

76
Output 2.1: Monitor quality assurance process and bodies
This output class involves the development and management of quality assurance processes.
This includes the management of relationships with quality assurance bodies and education
agencies, the monitoring of the delegation to ITPQ, and processes associated with NZQA’s own
activities as a quality assurance body.
Description Quantity and Timeliness Quality
Audit ITPQ against quality assurance standards for quality assurance bodies
Complete an audit of degree processes
100% ITPQ audits are reviewed against agreed criteria for continuous improvement
Output 2.2: Support providers at risk
This output class involves services to monitor and support providers at risk and potentially at
risk, and manage complaints about tertiary education organisations that are quality-assured by
NZQA.
Description Quantity and Timeliness Quality
Provider trusts audited to ensure compliance with Student Fee Protection policy
[…]100% compliant with NZQA’s quality assurance standards and procedures
Complaints regarding PTEs are managed
90% of complaints concluded within agreed timeframes
All complaints are concluded to documented processes
Manage the process of deregistration, or other NZQA risk management action in relation to providers
(Volume is demand driven)
No successful appeals due to NZQA’s management of the process
Interventions in the tertiary sector
The interagency risk group is 100% satisfi ed with NZQA’s monitoring systems and interventions
Develop and agree a process to review key risks
Completion by December 2008Processes ensure key risks are identifi ed and mitigated
Output 2.3: Moderation and support
This output involves services to enhance and maintain systems that ensure valid and consistent
internal assessment for candidates in secondary schools.
Description Quantity and Timeliness Quality
School-based internal assessments moderated
10% of reported results • moderated
95% of moderation materials • returned and reports completed within published timeframes
Less than 1% successful appeal against secondary moderator judgements as a percentage of secondary moderator judgements made
Example 26
New Zealand Qualifi cations Authority (Mana Tohu Mātauranga O Aotearoa), Statement of Intent 2008 - 2011, pages 29-30

77
Quality audits, external evaluations and reviews completed during the year
(Note: Volume and performance will be impacted by the tertiary reforms)
500-580•
90% of draft audit reports • completed and sent to provider within 20 days of the completion of the audit visit
100% of quality audits of all types completed comply with the Quality Management System policies and procedures
Development of quality assurance processes and systems to support the Tertiary Reforms
Work completed to project planSLG satisfaction with project performance


Other publications issued by the Auditor-General recently have been:
The Auditor-General’s views on setting fi nancial reporting standards for the public sector•
Inland Revenue Department: Managing tax debt•
Electricity Commission: Review of the fi rst fi ve years•
Local government: Results of the 2007/08 audits•
How government departments monitor Crown entities•
Inquiry into immigration matters•
Central government: Results of the 2007/08 audits•
Annual Plan 2009/10•
Workforce planning in Crown Research Institutes•
Performance audits from 2007: Follow-up report•
Department of Corrections: Managing off enders on parole•
Housing New Zealand Corporation: Maintenance of state housing•
Annual Report 2007/08•
Ministry of Health: Monitoring the progress of the Primary Health Care Strategy•
Ministry of Education: Supporting professional development for teachers•
Inquiry into the West Coast Development Trust•
Maintaining and renewing the rail network•
Reporting the progress of defence acquisition projects•
Ministry of Education: Monitoring and supporting school boards of trustees•
Charging fees for public sector goods and services•
WebsiteAll these reports are available in HTML and PDF format on our website – www.oag.govt.nz.
They can also be obtained in hard copy on request – [email protected].
Mailing list for notifi cation of new reportsWe off er a facility for people to be notifi ed by email when new reports and public statements
are added to our website. The link to this service is in the Publications section of the website.
Sustainable publishingThe Offi ce of the Auditor-General has a policy of sustainable publishing practices. This
report is printed on environmentally responsible paper stocks manufactured under the
environmental management system ISO 14001 using Elemental Chlorine Free (ECF) pulp
sourced from sustainable well-managed forests. Processes for manufacture include use of
vegetable-based inks and water-based sealants, with disposal and/or recycling of waste
materials according to best business practices.
Publications by the Auditor-General
Offi ce of the Auditor-GeneralPO Box 3928, Wellington 6140
Telephone: (04) 917 1500Facsimile: (04) 917 1549
Email: [email protected]

20
09
Statemen
ts of in
tent: Exa
mp
les of rep
ortin
g p
ractice
Offi ce of the Auditor-GeneralPO Box 3928, Wellington 6140
Telephone: (04) 917 1500Facsimile: (04) 917 1549
Email: [email protected]
Discussion paper Statements of intent: Examples of reporting practice