states - institute for legal reform
TRANSCRIPT

SEPTEMBER 2019
Ranking the StatesA Survey of the Fairness and Reasonableness of State Liability Systems
2019 LAWSUIT CLIMATE SURVEY

2 2019 Lawsuit Climate Survey
© U.S. Chamber Institute for Legal Reform, September 2019. All rights reserved.
This publication, or part thereof, may not be reproduced in any form without the written permission of the U.S. Chamber Institute for Legal Reform. Forward requests for permission to reprint to: Reprint Permission Office, U.S. Chamber Institute for Legal Reform, 1615 H Street, N.W., Washington, D.C. 20062-2000 (202.463.5724).

U.S. Chamber Institute for Legal Reform
2019 Ranking of State Liability Systems ....................................................... 1
Overall Rankings of State Liability Systems 2012–2019 ..................... 2
Overview ........................................................................................................................... 3Impact of Litigation Environment on Important Business Decisions ......................... 4Average Percentage Across All Elements Among 50 States ...................................... 6Average Overall Score Among 50 States ........................................................................ 6Worst Local Jurisdictions ................................................................................................... 7Conclusion ............................................................................................................................. 7
Worst Local Jurisdictions .................................................................................8Cities or Counties With the Least Fair and Reasonable Litigation Environment ..... 9
Key Elements ................................................................................................................ 10Summary of Top/Bottom 5 States by Key Elements ................................................11Enforcing Meaningful Venue Requirements ................................................................. 13Overall Treatment of Tort and Contract Litigation ........................................................ 14Treatment of Class Action Suits and Mass Consolidation Suits ............................... 15Damages .............................................................................................................................. 16Proportional Discovery ................................................................................................17Scientific and Technical Evidence .............................................................................18Trial Judges’ Impartiality .............................................................................................19Trial Judges’ Competence ...........................................................................................20Juries’ Fairness .............................................................................................................21Quality of Appellate Review ........................................................................................22
Methodology ...........................................................................................................23Sample Design...............................................................................................................23Sample Characteristics ..................................................................................................... 24Telephone Interviewing Procedures .............................................................................. 24Online Interviewing Procedures ..................................................................................... 25Interviewing Protocol ........................................................................................................ 25Rating and Scoring of States ......................................................................................25
Reliability of Survey Percentages ..............................................................................26
Overall Rankings of State Liability Systems 2002–2019 ................27
Table of Contents
Prepared for the U.S. Chamber Institute for Legal Reform by The Harris Poll
1 2019 Lawsuit Climate Survey
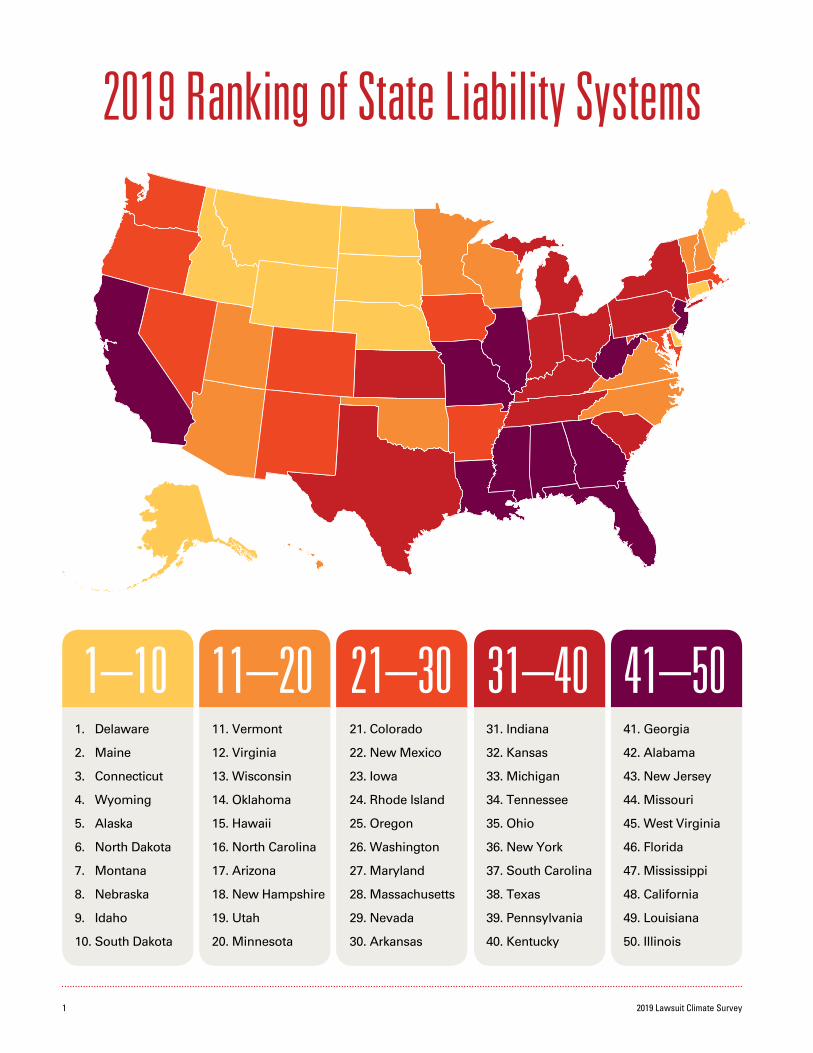
2019 Ranking of State Liability Systems
1–1011. Vermont
12. Virginia
13. Wisconsin
14. Oklahoma
15. Hawaii
16. North Carolina
17. Arizona
18. New Hampshire
19. Utah
20. Minnesota
11–2021. Colorado
22. New Mexico
23. Iowa
24. Rhode Island
25. Oregon
26. Washington
27. Maryland
28. Massachusetts
29. Nevada
30. Arkansas
21–3031. Indiana
32. Kansas
33. Michigan
34. Tennessee
35. Ohio
36. New York
37. South Carolina
38. Texas
39. Pennsylvania
40. Kentucky
31–4041. Georgia
42. Alabama
43. New Jersey
44. Missouri
45. West Virginia
46. Florida
47. Mississippi
48. California
49. Louisiana
50. Illinois
41–501. Delaware
2. Maine
3. Connecticut
4. Wyoming
5. Alaska
6. North Dakota
7. Montana
8. Nebraska
9. Idaho
10. South Dakota

2U.S. Chamber Institute for Legal Reform
Scores presented in this table have been rounded to one decimal place, but rankings are based on the unrounded number.
Note that due to changes in overall ranking criteria in 2017, the rankings from 2019 do not provide an exact apples-to-apples comparison to years prior to 2017; however, prior scores are provided for historical reference.
Overall Rankings of State Liability Systems 2012–2019
DelawareMaineConnecticutWyomingAlaskaNorth DakotaMontanaNebraskaIdahoSouth DakotaVermontVirginiaWisconsinOklahomaHawaiiNorth CarolinaArizonaNew HampshireUtahMinnesotaColoradoNew MexicoIowaRhode IslandOregonWashingtonMarylandMassachusettsNevadaArkansasIndianaKansasMichiganTennesseeOhioNew YorkSouth CarolinaTexasPennsylvaniaKentuckyGeorgiaAlabamaNew JerseyMissouriWest VirginiaFloridaMississippiCaliforniaLouisianaIllinois
123456789
1011121314151617181920212223242526272829303132333435363738394041424344454647484950
76.373.873.873.173.172.672.572.372.272.071.771.371.271.271.170.970.870.770.770.770.770.670.670.569.969.869.769.669.569.568.968.868.868.367.767.767.667.166.666.566.165.665.464.463.362.361.960.260.059.6
119
1686
17277312
1020312333255
124
353213242128191437361518223026293439384240434149454644475048
114228
1215343692
112033307
255
101316454
263229281735411819242327213640373931463842504443474948
112253
138
4526
11167
15422920172194
23441031282233193735145
272630183936403824433234504148474946
STATE RANK SCORE 2017 2015 2012
3 2019 Lawsuit Climate Survey
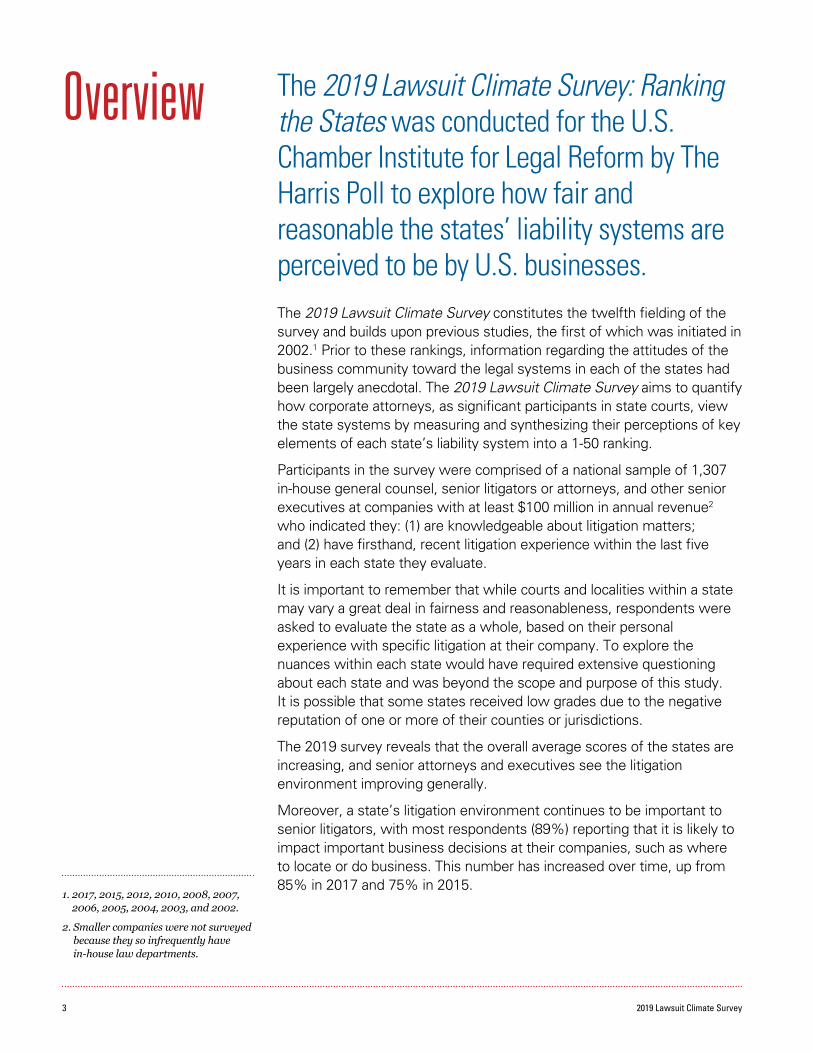
The 2019 Lawsuit Climate Survey: Ranking the States was conducted for the U.S. Chamber Institute for Legal Reform by The Harris Poll to explore how fair and reasonable the states’ liability systems are perceived to be by U.S. businesses. The 2019 Lawsuit Climate Survey constitutes the twelfth fielding of the survey and builds upon previous studies, the first of which was initiated in 2002.1 Prior to these rankings, information regarding the attitudes of the business community toward the legal systems in each of the states had been largely anecdotal. The 2019 Lawsuit Climate Survey aims to quantify how corporate attorneys, as significant participants in state courts, view the state systems by measuring and synthesizing their perceptions of key elements of each state’s liability system into a 1-50 ranking.
Participants in the survey were comprised of a national sample of 1,307 in-house general counsel, senior litigators or attorneys, and other senior executives at companies with at least $100 million in annual revenue2 who indicated they: (1) are knowledgeable about litigation matters; and (2) have firsthand, recent litigation experience within the last five years in each state they evaluate.
It is important to remember that while courts and localities within a state may vary a great deal in fairness and reasonableness, respondents were asked to evaluate the state as a whole, based on their personal experience with specific litigation at their company. To explore the nuances within each state would have required extensive questioning about each state and was beyond the scope and purpose of this study. It is possible that some states received low grades due to the negative reputation of one or more of their counties or jurisdictions.
The 2019 survey reveals that the overall average scores of the states are increasing, and senior attorneys and executives see the litigation environment improving generally.
Moreover, a state’s litigation environment continues to be important to senior litigators, with most respondents (89%) reporting that it is likely to impact important business decisions at their companies, such as where to locate or do business. This number has increased over time, up from 85% in 2017 and 75% in 2015.
Overview
1. 2017, 2015, 2012, 2010, 2008, 2007, 2006, 2005, 2004, 2003, and 2002.
2. Smaller companies were not surveyed because they so infrequently have in-house law departments.
4U.S. Chamber Institute for Legal Reform
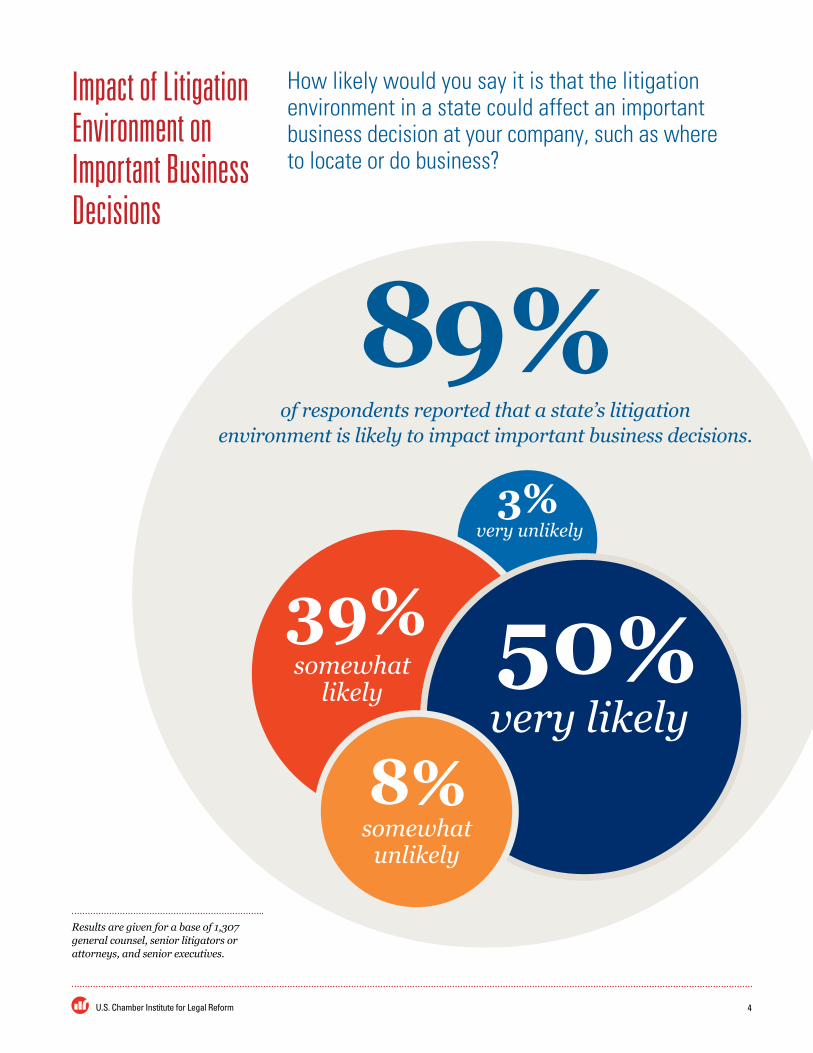
very unlikely
39%somewhat
likely50%very likely
somewhat unlikely
8%
Impact of Litigation Environment on Important Business Decisions
How likely would you say it is that the litigation environment in a state could affect an important business decision at your company, such as where to locate or do business?
3%
89%of respondents reported that a state’s litigation
environment is likely to impact important business decisions.
Results are given for a base of 1,307 general counsel, senior litigators or attorneys, and senior executives.
5 2019 Lawsuit Climate Survey
OVERVIEW
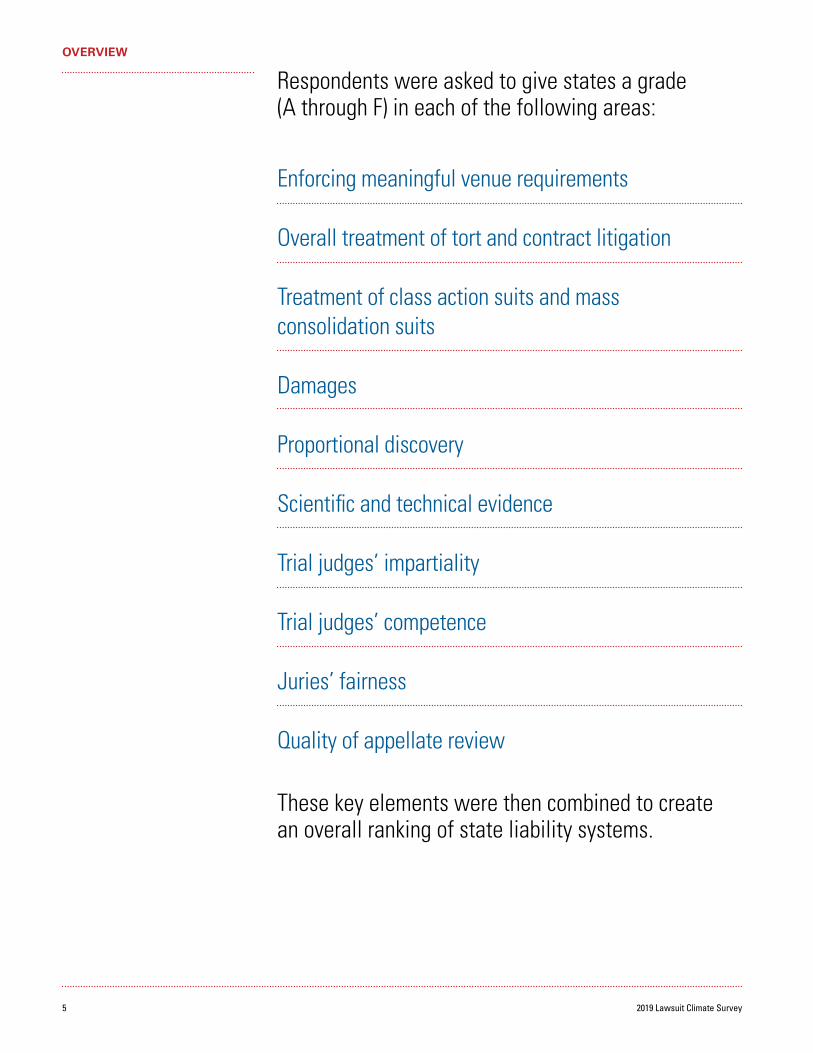
Respondents were asked to give states a grade (A through F) in each of the following areas:
Enforcing meaningful venue requirements
Overall treatment of tort and contract litigation
Treatment of class action suits and mass consolidation suits
Damages
Proportional discovery
Scientific and technical evidence
Trial judges’ impartiality
Trial judges’ competence
Juries’ fairness
Quality of appellate review
These key elements were then combined to create an overall ranking of state liability systems.

6U.S. Chamber Institute for Legal Reform
Taken as a whole, senior litigators and executives perceive state courts as doing better than average on the various elements. States received significantly more A’s and B’s (63%) than D’s and F’s (13%) when all of the elements were averaged together.
AVERAGE PERCENTAGE ACROSS ALL ELEMENTS AMONG 50 STATES
Since the inception of the survey, there has been a general increase in the overall average score of state liability systems (expressed numerically on a scale of 1 to 100). In 2019, the average overall score among the 50 states is 68.3. Note that due to changes in overall ranking criteria in 2017, this score does not provide an exact apples-to-apples comparison to years prior to 2017; however, prior scores are provided for historical reference.
AVERAGE OVERALL SCORE AMONG 50 STATES
Grade A
B
C
D
F
Not Sure/ Decline to Answer
Average Percentage*
26%
37%
23%
9%
4%
1%
Year 2019
2017
2015
2012
2010
2008
2007
2006
2005
2004
2003
2002
Average Overall Score
68.3
67.5
61.7
60.9
57.9
59.4
58.1
55.3
52.8
53.2
50.7
52.7* The percentages are rounded to the nearest whole number.
7 2019 Lawsuit Climate Survey
OVERVIEW
Worst Local JurisdictionsIn order to identify specific cities or counties that might impact a state’s ranking, respondents were provided a list of cities or counties with reputations for being problematic when it comes to litigation, and were then asked to select two that have the least fair and reasonable litigation environments. According to respondents, the five worst jurisdictions (with others very close behind) were Chicago or Cook County, Illinois (24%); Los Angeles, California (20%); San Francisco, California (19%); New York, New York (18%); and Jefferson County, Texas (14%).
ConclusionSeveral organizations and academics3 have conducted and analyzed surveys of attitudes toward the state courts held by various constituencies. The objective of these studies has been to understand how the state courts are perceived and, in some instances, to evaluate them, overall or in part. Until the Harris Lawsuit Climate Survey was initiated in 2002, no data existed on how the state courts are perceived by the business community, which is a significant user of, and participant in, the court system. This, the twelfth such survey and state ranking, finds that the overall average scores of the states are increasing and senior lawyers and executives in large corporations tend to have positive perceptions about the fairness and reasonableness of state liability systems overall.
An examination of individual state evaluations, however, reveals wide disparity among those states that are doing the best job and those states that are doing the worst job, with the highest-performing state (Delaware) scoring 76 (when rounded) out of a possible 100, and the poorest-performing state (Illinois) scoring 60 (when rounded) out of 100.
Clearly, corporate counsel see specific areas needing improvement in the individual states, and the perceptions of senior lawyers and executives in large companies matter. As stated earlier, 89% of senior lawyers and executives feel that the litigation environment in a state is likely to impact important business decisions. Decisions such as where to locate or where to expand businesses could have economic consequences for the state. The challenge for the states is to focus on those areas where they received the lowest scores and then make improvements where needed.
3. The State of State Courts: 2018 Poll, National Center for State Courts, fielded November 13-17, 2018; Perceptions of Justice, The American Bar Association, November 6, 2018; Cann, Damon M. and Yates, Jeff, These Estimable Courts: Understanding Public Perceptions of State Judicial Institutions and Legal Policy-Making, Oxford University Press (2016); Citizen Perceptions of Judicial Realism in the American State Courts, Brigham Young University Center for the Study of Elections and Democracy (2014); Public Trust and Confidence Survey, State of Utah Administrative Office of the Courts (2012); Trust and Confidence in the California Courts: A Survey of the Public and Attorneys, The Administrative Office of the Courts on Behalf of the Judicial Council of California (2005); The Sources of Public Confidence in State Courts, American Politics Research (2003).
“ The challenge for the states is to focus on those areas where they received the lowest scores and then make improvements where needed. ”
8U.S. Chamber Institute for Legal Reform
State policymakers and stakeholders inevitably want to know the reasons behind their state’s ranking, particularly if the state fared poorly. Exactly what happens in the courts that businesses find unfair or unreasonable? Are the problems in an individual state’s liability system statewide, or is the state’s ranking skewed by one (or more) individual city or county court that is viewed as particularly unfair or unreasonable? Respondents’ answers with regard to worst local jurisdictions provide additional context to the state ranking itself. While they are not part of the actual calculation of the overall rankings of state liability systems, they do provide additional insight for policymakers to consider.
Worst Local Jurisdictions

9 2019 Lawsuit Climate Survey
WORST LOCAL JURISDICTIONS
Thinking about the entire country, and based on anything you have seen, read, or heard, which of the following do you think are the worst city or county courts? That is, which city or county courts have the least fair and reasonable litigation environment for both defendants and plaintiffs?
Cities or Counties With the Least Fair and Reasonable Litigation Environment* Chicago or Cook County, Illinois
Los Angeles, California
San Francisco, California
New York, New York
Jefferson County, Texas
Miami or Dade County, Florida
Detroit, Michigan
Washington, DC
New Orleans or Orleans Parish, Louisiana
St. Louis, Missouri
Madison County, Illinois
Philadelphia, Pennsylvania
Not sure
Other
Decline to answer
24%
20%
19%
18%
14%
13%
13%
12%
10%
10%
9%
9%
6%
2%
<.05%
* Respondents were asked to respond to this closed-end list of city and county courts by selecting up to two responses. Other mentions volunteered by respondents are represented by “Other” in the list. The total number is greater than 100% due to the fact that this was a multiple-response question.
10U.S. Chamber Institute for Legal Reform
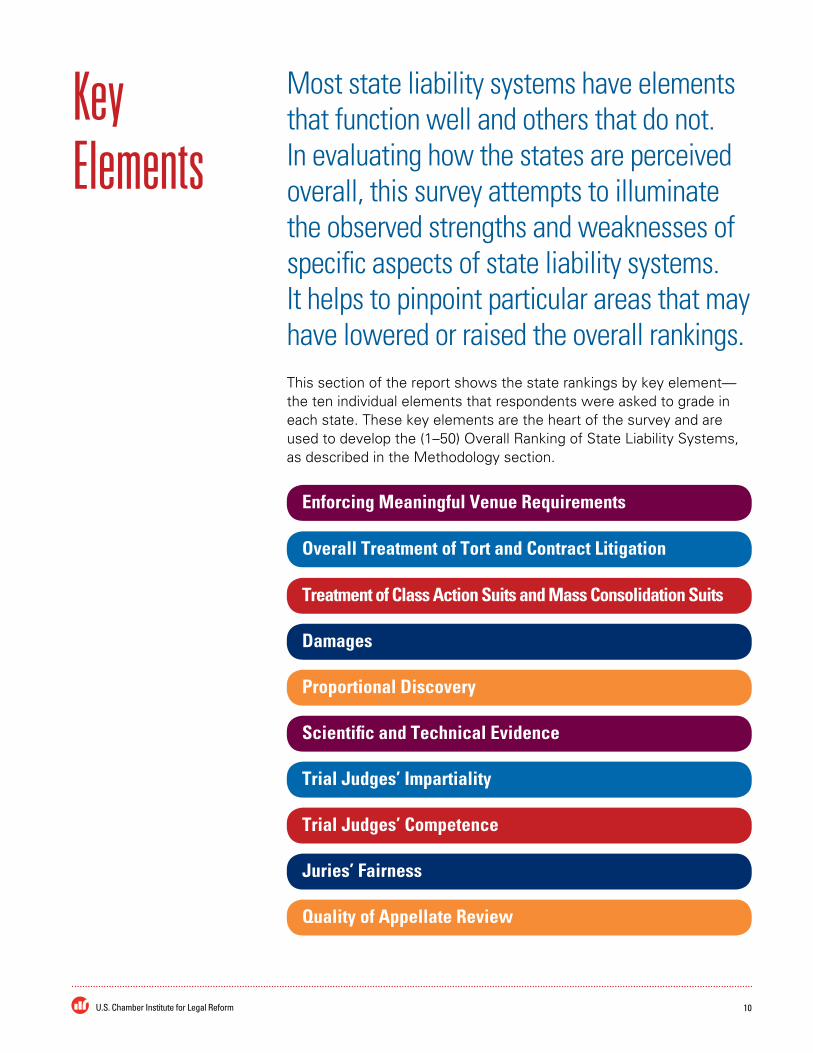
Most state liability systems have elements that function well and others that do not. In evaluating how the states are perceived overall, this survey attempts to illuminate the observed strengths and weaknesses of specific aspects of state liability systems. It helps to pinpoint particular areas that may have lowered or raised the overall rankings.This section of the report shows the state rankings by key element—the ten individual elements that respondents were asked to grade in each state. These key elements are the heart of the survey and are used to develop the (1–50) Overall Ranking of State Liability Systems, as described in the Methodology section.
Key Elements
Enforcing Meaningful Venue Requirements
Overall Treatment of Tort and Contract Litigation
Treatment of Class Action Suits and Mass Consolidation Suits
Damages
Proportional Discovery
Scientific and Technical Evidence
Trial Judges’ Impartiality
Trial Judges’ Competence
Juries’ Fairness
Quality of Appellate Review
11 2019 Lawsuit Climate Survey
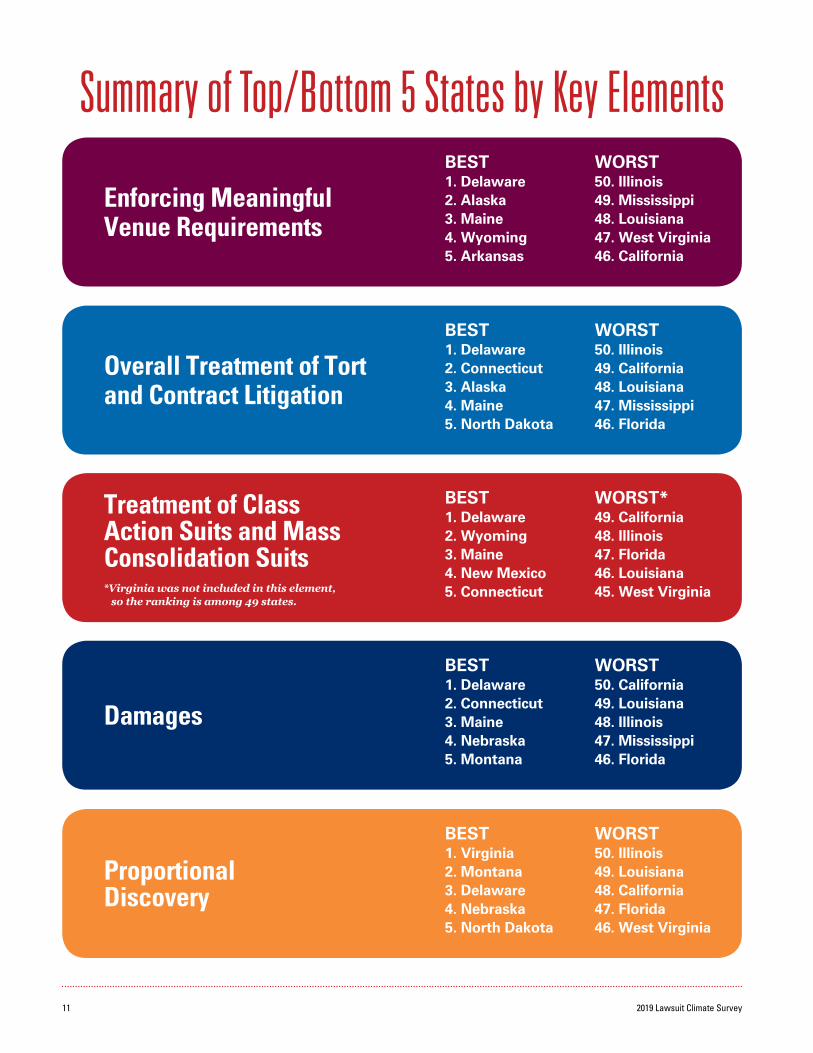
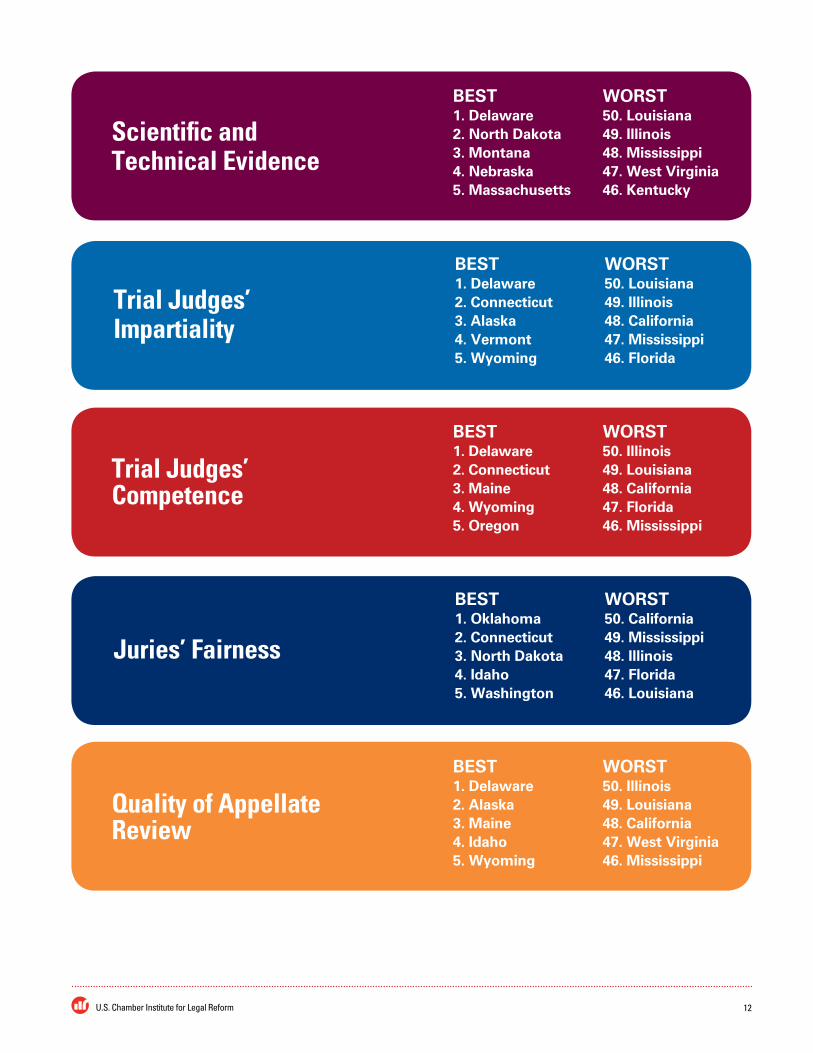
Summary of Top/Bottom 5 States by Key Elements
BEST1. Delaware 2. Connecticut 3. Alaska 4. Maine 5. North Dakota
WORST50. Illinois 49. California 48. Louisiana 47. Mississippi 46. Florida
Overall Treatment of Tort and Contract Litigation
BEST1. Delaware 2. Connecticut 3. Maine 4. Nebraska 5. Montana
WORST50. California 49. Louisiana 48. Illinois 47. Mississippi 46. Florida
Damages
BEST1. Virginia 2. Montana 3. Delaware 4. Nebraska 5. North Dakota
WORST50. Illinois 49. Louisiana 48. California 47. Florida 46. West Virginia
Proportional Discovery
BEST1. Delaware 2. Wyoming 3. Maine 4. New Mexico 5. Connecticut
WORST*49. California 48. Illinois 47. Florida 46. Louisiana 45. West Virginia
Treatment of Class Action Suits and Mass Consolidation Suits* Virginia was not included in this element, so the ranking is among 49 states.
BEST1. Delaware2. Alaska 3. Maine 4. Wyoming 5. Arkansas
WORST50. Illinois49. Mississippi 48. Louisiana 47. West Virginia 46. California
Enforcing Meaningful Venue Requirements
12U.S. Chamber Institute for Legal Reform
BEST1. Delaware2. North Dakota 3. Montana 4. Nebraska 5. Massachusetts
WORST50. Louisiana 49. Illinois 48. Mississippi 47. West Virginia 46. Kentucky
Scientific and Technical Evidence
BEST1. Delaware 2. Connecticut 3. Alaska 4. Vermont 5. Wyoming
WORST50. Louisiana 49. Illinois 48. California 47. Mississippi 46. Florida
Trial Judges’ Impartiality
BEST1. Oklahoma2. Connecticut3. North Dakota4. Idaho5. Washington
WORST50. California49. Mississippi48. Illinois47. Florida46. Louisiana
Juries’ Fairness
BEST1. Delaware 2. Alaska 3. Maine 4. Idaho 5. Wyoming
WORST50. Illinois 49. Louisiana 48. California 47. West Virginia 46. Mississippi
Quality of Appellate Review
BEST1. Delaware 2. Connecticut 3. Maine 4. Wyoming 5. Oregon
WORST50. Illinois 49. Louisiana 48. California 47. Florida 46. Mississippi
Trial Judges’ Competence

13 2019 Lawsuit Climate Survey
Enforcing Meaningful Venue Requirements
Delaware
Alaska
Maine
Wyoming
Arkansas
Idaho
Montana
New Mexico
South Dakota
Connecticut
North Dakota
Washington
Vermont
Hawaii
Utah
Oklahoma
New Hampshire
Virginia
Wisconsin
Rhode Island
Nebraska
Minnesota
Colorado
Kentucky
Iowa
1
2
3
4
5
6
7
8
9
10
11
12
13
14
15
16
17 (tied)
17 (tied)
17 (tied)
20
21
22
23
24
25
STATE STATERANK RANK
South Carolina
New York
Maryland
Nevada
Arizona
Massachusetts
Georgia
Tennessee
Texas
Michigan
North Carolina
Ohio
Kansas
Indiana
Oregon
Pennsylvania
Missouri
Alabama
New Jersey
Florida
California
West Virginia
Louisiana
Mississippi
Illinois
26
27
28
29
30
31
32
33
34
35
36
37
38
39
40
41
42
43
44
45
46
47
48
49
50
14U.S. Chamber Institute for Legal Reform
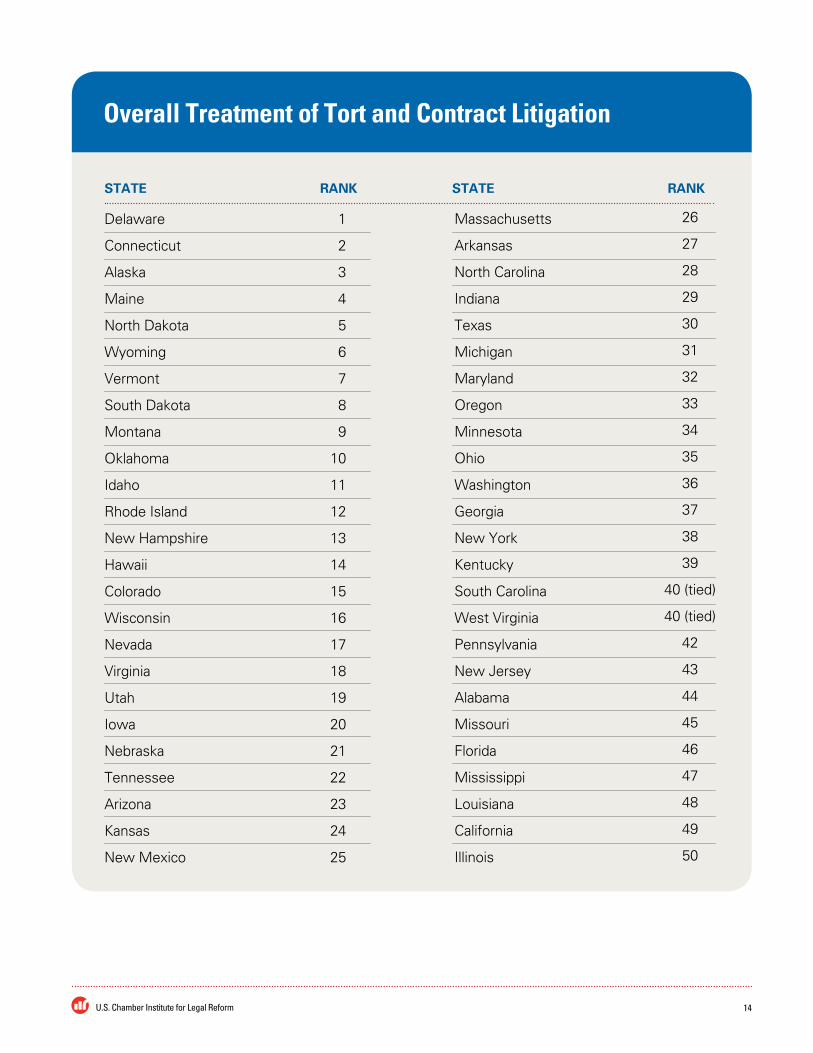
Overall Treatment of Tort and Contract Litigation
Delaware
Connecticut
Alaska
Maine
North Dakota
Wyoming
Vermont
South Dakota
Montana
Oklahoma
Idaho
Rhode Island
New Hampshire
Hawaii
Colorado
Wisconsin
Nevada
Virginia
Utah
Iowa
Nebraska
Tennessee
Arizona
Kansas
New Mexico
1
2
3
4
5
6
7
8
9
10
11
12
13
14
15
16
17
18
19
20
21
22
23
24
25
STATE STATERANK RANK
Massachusetts
Arkansas
North Carolina
Indiana
Texas
Michigan
Maryland
Oregon
Minnesota
Ohio
Washington
Georgia
New York
Kentucky
South Carolina
West Virginia
Pennsylvania
New Jersey
Alabama
Missouri
Florida
Mississippi
Louisiana
California
Illinois
26
27
28
29
30
31
32
33
34
35
36
37
38
39
40 (tied)
40 (tied)
42
43
44
45
46
47
48
49
50

15 2019 Lawsuit Climate Survey
* Virginia was excluded from this element.
Treatment of Class Action Suits and Mass Consolidation Suits
Delaware
Wyoming
Maine
New Mexico
Connecticut
Idaho
Maryland
North Dakota
Alaska
Wisconsin
Nebraska
Minnesota
Montana
Vermont
Iowa
North Carolina
Oklahoma
Oregon
Nevada
South Dakota
Arkansas
New Hampshire
Hawaii
South Carolina
Indiana
1
2
3
4
5
6
7
8
9
10
11
12
13
14
15
16
17 (tied)
17 (tied)
19
20
21
22
23
24
25
STATE STATERANK RANK
Utah
Colorado
Tennessee
Rhode Island
Michigan
Washington
Massachusetts
Arizona
Alabama
Texas
Pennsylvania
Ohio
Kentucky
Kansas
New York
Mississippi
New Jersey
Georgia
Missouri
West Virginia
Louisiana
Florida
Illinois
California
Virginia
26
27
28
29
30
31
32
33
34
35
36
37
38
39
40
41
42
43
44
45
46
47
48
49
*

16U.S. Chamber Institute for Legal Reform
Damages
Delaware
Connecticut
Maine
Nebraska
Montana
Minnesota
South Dakota
Alaska
Arizona
Oklahoma
Michigan
Wisconsin
Wyoming
North Carolina
Iowa
Hawaii
Rhode Island
Virginia
Nevada
Arkansas
Vermont
New Hampshire
Colorado
Massachusetts
Idaho
1
2
3
4
5
6
7
8
9
10
11
12
13
14
15
16
17
18
19
20
21
22
23
24
25
STATE STATERANK RANK
Indiana
Maryland
Tennessee
Oregon
North Dakota
South Carolina
Washington
Utah
Kansas
Ohio
Texas
Kentucky
New Mexico
Pennsylvania
New York
Alabama
Missouri
New Jersey
Georgia
West Virginia
Florida
Mississippi
Illinois
Louisiana
California
26
27
28
29
30
31
32
33
34
35
36
37
38
39
40
41
42
43
44
45
46
47
48
49
50

17 2019 Lawsuit Climate Survey
Proportional Discovery
Virginia
Montana
Delaware
Nebraska
North Dakota
South Dakota
Wyoming
Idaho
Connecticut
Vermont
Maine
Wisconsin
Oklahoma
Rhode Island
Iowa
Oregon
Alaska
Hawaii
Nevada
Utah
Indiana
Arizona
New Mexico
North Carolina
New Hampshire
1
2
3
4
5
6 (tied)
6 (tied)
8
9
10
11
12
13
14
15
16
17
18
19 (tied)
19 (tied)
21
22
23
24
25
STATE STATERANK RANK
Washington
Massachusetts
Kansas
Colorado
Minnesota
Maryland
South Carolina
Arkansas
New York
Ohio
Kentucky
Michigan
Georgia
Pennsylvania
Alabama
Texas
Tennessee
Mississippi
New Jersey
Missouri
West Virginia
Florida
California
Louisiana
Illinois
26
27
28
29
30
31
32
33
34
35
36
37
38
39
40
41
42
43
44
45
46
47
48
49
50
18U.S. Chamber Institute for Legal Reform
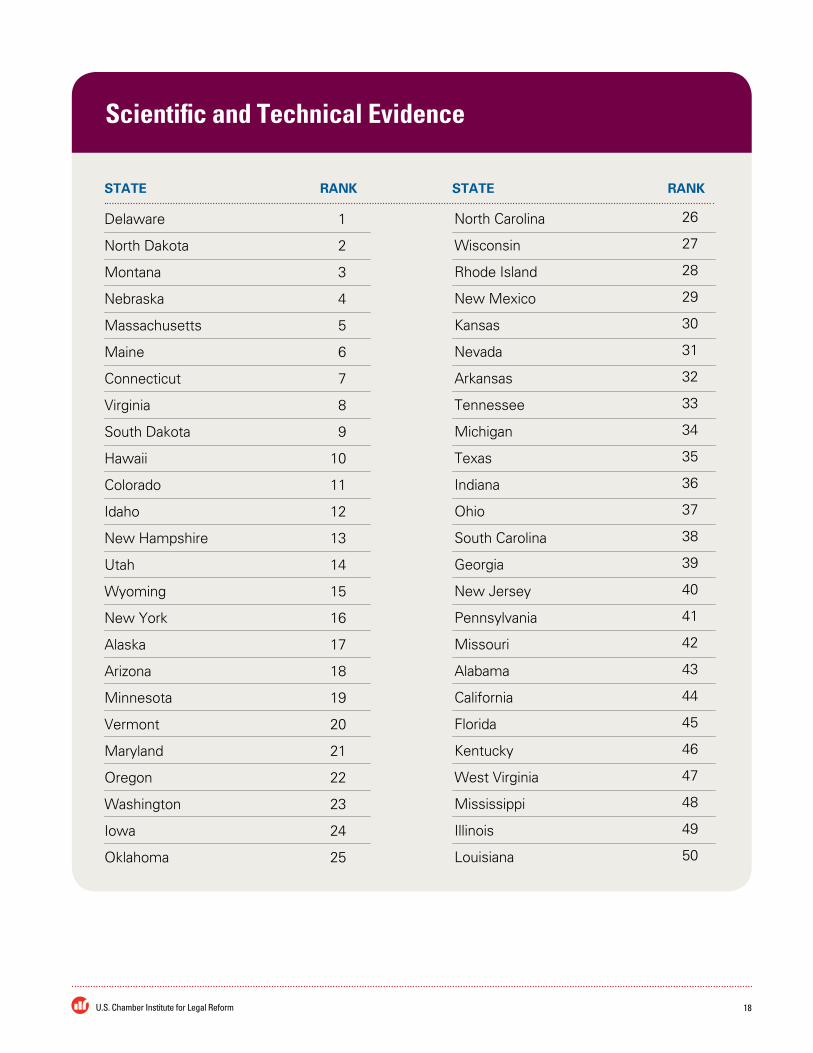
Scientific and Technical Evidence
1
2
3
4
5
6
7
8
9
10
11
12
13
14
15
16
17
18
19
20
21
22
23
24
25
STATE STATERANK RANK
Delaware
North Dakota
Montana
Nebraska
Massachusetts
Maine
Connecticut
Virginia
South Dakota
Hawaii
Colorado
Idaho
New Hampshire
Utah
Wyoming
New York
Alaska
Arizona
Minnesota
Vermont
Maryland
Oregon
Washington
Iowa
Oklahoma
North Carolina
Wisconsin
Rhode Island
New Mexico
Kansas
Nevada
Arkansas
Tennessee
Michigan
Texas
Indiana
Ohio
South Carolina
Georgia
New Jersey
Pennsylvania
Missouri
Alabama
California
Florida
Kentucky
West Virginia
Mississippi
Illinois
Louisiana
26
27
28
29
30
31
32
33
34
35
36
37
38
39
40
41
42
43
44
45
46
47
48
49
50

19 2019 Lawsuit Climate Survey
Trial Judges’ Impartiality
STATE STATERANK RANK
Delaware
Connecticut
Alaska
Vermont
Wyoming
North Carolina
Maine
Utah
Colorado
Nebraska
Arizona
Rhode Island
New Mexico
North Dakota
Minnesota
New Hampshire
Iowa
South Dakota
Wisconsin
Montana
Idaho
Virginia
Oklahoma
Hawaii
Oregon
1
2
3
4
5
6
7
8
9
10
11
12
13
14
15
16
17
18
19
20
21
22
23
24
25
Washington
Massachusetts
Indiana
Michigan
Tennessee
Maryland
Ohio
Kansas
Nevada
New York
Pennsylvania
New Jersey
Arkansas
Kentucky
Georgia
Alabama
West Virginia
South Carolina
Texas
Missouri
Florida
Mississippi
California
Illinois
Louisiana
26
27
28
29
30
31
32
33
34
35
36
37
38
39
40
41
42
43
44
45
46
47
48
49
50

20U.S. Chamber Institute for Legal Reform
Trial Judges’ Competence
Delaware
Connecticut
Maine
Wyoming
Oregon
Minnesota
New Hampshire
Alaska
Hawaii
Montana
Vermont
Arizona
Nebraska
North Carolina
Wisconsin
North Dakota
Colorado
South Dakota
Michigan
Idaho
Washington
Iowa
Virginia
Kansas
Indiana
1
2
3
4
5
6
7
8
9
10
11
12
13
14
15
16
17
18
19
20
21
22 (tied)
22 (tied)
24
25
STATE STATERANK RANK
Oklahoma
Pennsylvania
Rhode Island
Arkansas
Tennessee
Utah
New Mexico
New York
Massachusetts
Nevada
Ohio
New Jersey
Maryland
South Carolina
Kentucky
Texas
Georgia
Missouri
West Virginia
Alabama
Mississippi
Florida
California
Louisiana
Illinois
26
27
28
29
30
31
32
33
34
35
36
37
38
39
40
41
42
43
44
45
46
47
48
49
50

21 2019 Lawsuit Climate Survey
Juries’ Fairness
STATE STATERANK RANK
Oklahoma
Connecticut
North Dakota
Idaho
Washington
Montana
Utah
Nebraska
Maine
South Dakota
Alaska
Delaware
Oregon
Vermont
Minnesota
Wisconsin
North Carolina
Arkansas
Wyoming
Arizona
Rhode Island
Kansas
New Mexico
Colorado
Hawaii
1
2
3
4
5
6
7
8
9
10
11
12
13
14
15
16
17
18
19
20
21
22
23
24
25
Iowa
Indiana
Virginia
Massachusetts
New Hampshire
Maryland
Michigan
Ohio
Nevada
South Carolina
Tennessee
Kentucky
Texas
Alabama
Pennsylvania
New York
New Jersey
Georgia
Missouri
West Virginia
Louisiana
Florida
Illinois
Mississippi
California
26
27
28
29
30
31
32
33
34
35
36
37
38
39
40
41
42
43
44
45
46
47
48
49
50

22U.S. Chamber Institute for Legal Reform
Quality of Appellate Review
Delaware
Alaska
Maine
Idaho
Wyoming
North Dakota
Connecticut
North Carolina
New Mexico
Maryland
Hawaii
Virginia
South Dakota
Nebraska
Arizona
South Carolina
Utah
New Hampshire
Iowa
Rhode Island
New York
Nevada
Pennsylvania
Vermont
Oklahoma
1
2
3
4
5
6
7
8
9
10
11
12
13
14
15
16
17
18
19
20
21
22
23
24
25 (tied)
STATE STATERANK RANK
Wisconsin
Oregon
Massachusetts
Montana
Texas
Colorado
Georgia
Washington
Minnesota
Kansas
Alabama
Indiana
Arkansas
Ohio
Michigan
New Jersey
Tennessee
Kentucky
Missouri
Florida
Mississippi
West Virginia
California
Louisiana
Illinois
25 (tied)
27
28
29
30
31
32
33
34
35
36
37
38
39
40
41
42
43
44
45
46
47
48
49
50

23 2019 Lawsuit Climate Survey
Methodology The 2019 Lawsuit Climate Survey: Ranking the States was conducted for the U.S. Chamber Institute for Legal Reform by The Harris Poll. The final results are based on interviews with a national sample of 1,307 in-house general counsel, senior litigators or attorneys, and other senior executives who are knowledgeable about litigation matters at public and private companies with annual revenue of at least $100 million.The general counsel, senior litigators or attorneys, and other senior executives included in this study were involved in or are very familiar with litigation in the states they evaluated within the past five years. On average, each telephone respondent evaluated four states, and each online respondent evaluated seven states.4 As a result, these 1,307 individual respondents represent a total of 8,423 responses or state evaluations.
Phone interviews averaging 19 minutes in length were conducted with a total of 202 respondents and took place between March 28, 2019 and June 24, 2019. Online interviews using the same questionnaire and averaging 15 minutes in length were conducted with a total of 1,105 respondents and took place between March 27, 2019 and June 21, 2019.
Sample DesignFor the telephone sample, a comprehensive list of general counsel at companies with annual revenue of at least $100 million was compiled using Hoovers Phone, InfoUSA, and Leadership Directories, as well as a list of U.S. Chamber Institute for Legal Reform (ILR) donors. An alert letter was sent to the general counsel at each company when possible. This letter provided general information about the study and notified the recipient of the option to take the survey online or by phone. It told them that an interviewer from The Harris Poll would be contacting them to set up an appointment for a telephone interview if that was their preference.
4. The number of evaluations was rounded to the nearest whole number. Partial evaluations of states were not included.

24U.S. Chamber Institute for Legal Reform
METHODOLOGY
The letter included a toll-free number for respondents to call to schedule an appointment for a telephone interview. It also alerted the general counsel to a $100 honorarium given in appreciation of the time invested in taking the survey.
For the online sample, the e-mail addresses for a representative sample of general counsel and other senior attorneys were drawn from Hoovers ConnectMail, Critical Mix, SSI/Research Now, Empanel, Precision, and Leadership Directories, as well as a list of ILR donors. Non-panel respondents received an electronic version of the alert letter, which included a password-protected link to take the survey. Once they accessed the survey online, all respondents were screened to ensure that they worked for companies with more than $100 million in annual revenue and they had the appropriate title or role within the company.
Sample CharacteristicsOver a third of respondents (35%) were general counsel, corporate counsel, heads of litigation, senior counsel/litigators, or chief legal officers. The remaining 65% of respondents were senior executives knowledgeable about or responsible for litigation at their companies. Respondents had an average of 14 years of relevant experience with litigation at their companies, including in their current position. All respondents were familiar with or had litigated in the states they rated within the past five years, the majority (70%) within the past three years.
Telephone Interviewing ProceduresThe telephone interviews utilized a computer-assisted telephone interviewing (CATI) system, whereby trained interviewers call and immediately input responses into the computer. This system greatly enhances reporting reliability. It also reduces clerical error by eliminating the need for keypunching, since interviewers enter respondent answers directly into a computer terminal during the interview itself. This data entry program does not permit interviewers to inadvertently skip questions, as each question must be answered before the computer moves on to the next question. The data entry program also ensures that all skip patterns are correctly followed. Furthermore, the online data editing system refuses to accept punches that are out of range, demands confirmation of responses that exceed expected ranges, and asks for explanations for inconsistencies between certain key responses.
To achieve high participation, in addition to the alert letters, numerous telephone callbacks were made to reach respondents and conduct the interviews at a convenient time. Interviewers also offered to send respondents an e-mail invitation so that they could take the survey online on their own time. All phone interviewers participated in several sessions of rigorous training to ensure they were properly prepared to conduct interviews with the survey’s high level audience.

25 2019 Lawsuit Climate Survey
METHODOLOGY
Online Interviewing ProceduresAll online interviews were hosted on The Harris Poll’s server and were conducted using a self-administered online questionnaire via proprietary web-assisted interviewing software. The mail version of the alert letter directed respondents to a URL and provided them with a unique ID and password that they were required to enter on the landing page of the survey. Those who received an e-mail version of the alert letter accessed the survey by clicking on the password-protected URL included in the e-mail. Due to password protection, it was not possible for a respondent to answer the survey more than once. Respondents for whom we had e-mail addresses received an initial invitation as well as reminder e-mails.
Interviewing ProtocolAfter determining that respondents were qualified to participate in the survey using a series of screening questions, respondents identified the state liability systems with which they were familiar. The respondents were then asked to identify the last time they litigated in or were familiar with the states’ liability systems; responses included in this study were from respondents who were involved in or very familiar with litigation in the state within the past five years. From there, respondents were given the opportunity to evaluate the states’ liability systems, prioritized by their most recent litigation experience. As stated earlier, respondents evaluated four states, on average, via telephone and seven states, on average, online.
Rating and Scoring of StatesStates were given a grade (A through F) by respondents for each of the key elements of their liability system, providing a rating of the states by these grades, the percentage of respondents giving each grade, and the mean grade for each element. The mean grade was calculated by converting the letter grade using a 5.0 scale, where A=5.0, B=4.0, C=3.0, D=2.0, and F=1.0. Therefore, the mean score displayed can also be interpreted as a letter grade. For example, a mean score of 2.8 is roughly a C- grade.
The Overall Ranking of State Liability Systems was developed by creating an index using the grades provided for each of the key elements. To create the index, each grade across the elements was rescaled from 0 to 100 (A=100, B=75, C=50, D=25, and F=0). Then, any evaluation that contained six or more “not sure” or “decline to answer” responses per state was removed. A total of 1% of state evaluations were unusable. From the usable evaluations, the scores on the elements were then averaged to create the index score from 0 to 100.
A = 100B = 75C = 50D = 25F = 0
A = 5.0B = 4.0C = 3.0D = 2.0F = 1.0
Mean Grade Scale
Index Grade Scale
26U.S. Chamber Institute for Legal Reform
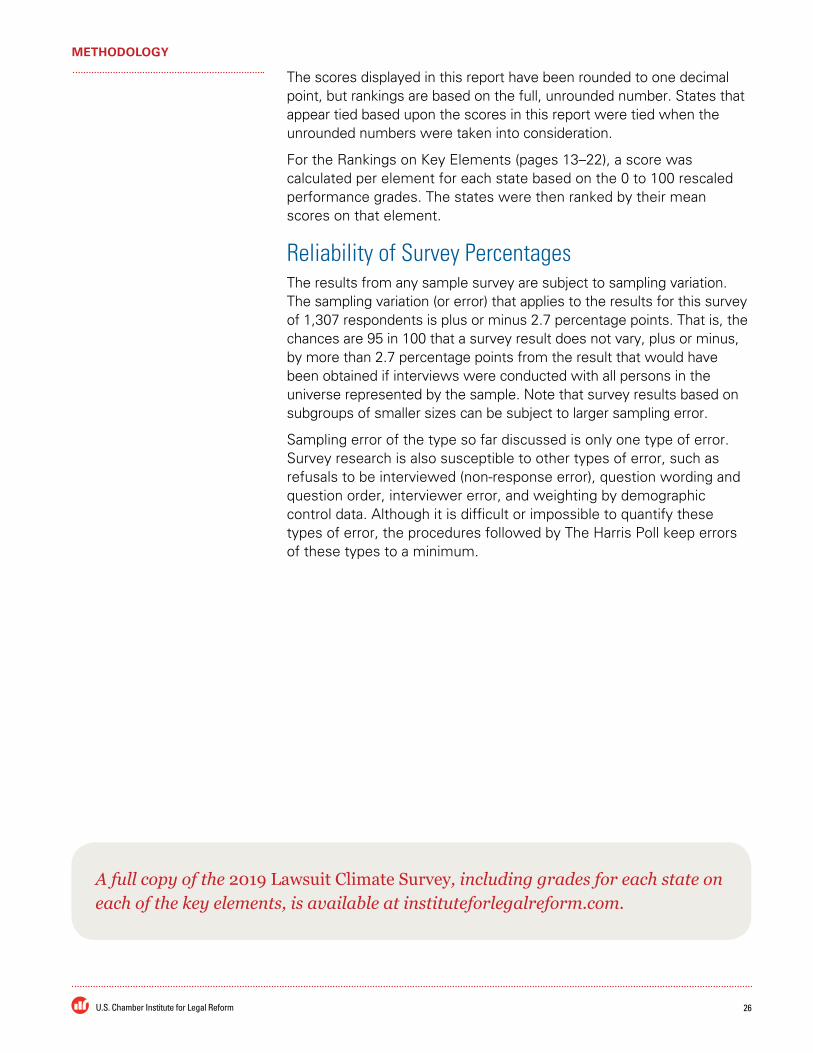
The scores displayed in this report have been rounded to one decimal point, but rankings are based on the full, unrounded number. States that appear tied based upon the scores in this report were tied when the unrounded numbers were taken into consideration.
For the Rankings on Key Elements (pages 13–22), a score was calculated per element for each state based on the 0 to 100 rescaled performance grades. The states were then ranked by their mean scores on that element.
Reliability of Survey PercentagesThe results from any sample survey are subject to sampling variation. The sampling variation (or error) that applies to the results for this survey of 1,307 respondents is plus or minus 2.7 percentage points. That is, the chances are 95 in 100 that a survey result does not vary, plus or minus, by more than 2.7 percentage points from the result that would have been obtained if interviews were conducted with all persons in the universe represented by the sample. Note that survey results based on subgroups of smaller sizes can be subject to larger sampling error.
Sampling error of the type so far discussed is only one type of error. Survey research is also susceptible to other types of error, such as refusals to be interviewed (non-response error), question wording and question order, interviewer error, and weighting by demographic control data. Although it is difficult or impossible to quantify these types of error, the procedures followed by The Harris Poll keep errors of these types to a minimum.
METHODOLOGY
A full copy of the 2019 Lawsuit Climate Survey, including grades for each state on each of the key elements, is available at instituteforlegalreform.com.

27 2019 Lawsuit Climate Survey
DelawareMaineConnecticutWyomingAlaskaNorth DakotaMontanaNebraskaIdahoSouth DakotaVermontVirginiaWisconsinOklahomaHawaiiNorth CarolinaArizonaNew HampshireUtahMinnesotaColoradoNew MexicoIowaRhode IslandOregonWashingtonMarylandMassachusettsNevadaArkansasIndianaKansasMichiganTennesseeOhioNew YorkSouth CarolinaTexasPennsylvaniaKentuckyGeorgiaAlabamaNew JerseyMissouriWest VirginiaFloridaMississippiCaliforniaLouisianaIllinois
STATE
107
1341
1120-1-6-9-9-27
178
178
-13-7
-161410
-100
-42
-8-14
86
-16-14-11-4-9-7-31
-12
-11
-2500
-3-11
-2
CHANGE FROM 2017Overall Rankings
of State Liability Systems 2002–2019
167130133130158149139140129140133157183123155135197143152147145102157148132186148157152115146152166172183289140276207148171173211159175296150409163255
N
76.373.873.873.173.172.672.572.372.272.071.771.371.271.271.170.970.870.770.770.770.770.670.670.569.969.869.769.669.569.568.968.868.868.367.767.767.667.166.666.566.165.665.464.463.362.361.960.260.059.6
SCORE
123456789
1011121314151617181920212223242526272829303132333435363738394041424344454647484950
2019 RANK
Scores displayed in this table have been rounded to one decimal point. The column labeled “N” represents the number of evaluations for a given state.

28U.S. Chamber Institute for Legal Reform
DelawareMaineConnecticutWyomingAlaskaNorth DakotaMontanaNebraskaIdahoSouth DakotaVermontVirginiaWisconsinOklahomaHawaiiNorth CarolinaArizonaNew HampshireUtahMinnesotaColoradoNew MexicoIowaRhode IslandOregonWashingtonMarylandMassachusettsNevadaArkansasIndianaKansasMichiganTennesseeOhioNew YorkSouth CarolinaTexasPennsylvaniaKentuckyGeorgiaAlabamaNew JerseyMissouriWest VirginiaFloridaMississippiCaliforniaLouisianaIllinois
STATE
114228
1215343692
112033307
255
101316454
263229281735411819242327213640373931463842504443474948
119
1686
17277312
1020312333255
124
353213242128191437361518223026293439384240434149454644475048
201220152017
1122415332
433
1810256
2231351713167
118
415
382126209
28444
14301929233936344027473237504248464945
2008
195
163612392
187
243
23334610136
17148
404
263028203237411115222919214243313427472535503848444945
2005
112253
138
4526
11167
15422920172194
23441031282233193735145
272630183936403824433234504148474946
2010
13
19232013382
261286
2417452115165
119
377
391427301840344
10332232254341362928473531504248444946
2007
111189
333
372
108
214
173241201912147
13385
352515233129436
16242226273944343628483040494250454746
2004
15
14224320403
301127121038421615692
21394
351725291828418
13237
24193744323331472634503649454846
2006
112181533164325
17203
1031391914768
13374
36272421283442119
232532224045303529482641493850464744
2003
1161725326
282
134
198
11364320181079
12413
371421232234455
15292624274246313539483033494050444738
11810203725436
149
212
1541401611178
197
395
35133
22363044124
282426274246313823483229493350454734
2002
29 2019 Lawsuit Climate Survey
NOTES
30U.S. Chamber Institute for Legal Reform
NOTES

31 2019 Lawsuit Climate Survey
NOTES

32U.S. Chamber Institute for Legal Reform

202.463.5724 main 202.463.5302 fax
1615 H Street, NW Washington, DC 20062
instituteforlegalreform.com