statewide public involvement survey...2007 completions 2007 % 2009 completions 2009 % mayors 52 22.3...
TRANSCRIPT

TranPlan 21 2009 Stakeholder Survey
Statewide Public Involvement Survey
State of Montana
Department of Transportation
Bureau of Business & Economic Research
University of Montana–Missoula


MDT attempts to provide accommodations for any known disability that may interfere with a person participating in any service, program or activity of the Dept.
Alternative accessible formats of this information will be provided upon request. For further information call (406) 444-3423 TTY (800) 335-7592, or Montana Relay at 711
or by contacting the ADA Coordinator at (406) 444-9229
25 copies of this public document were published at an estimated cost of $1.00 per copy for a total of
$25.00 which includes printing and distribution.

1
Table of Contents
INTRODUCTION .................................................................................................. 6
Survey Methods ................................................................................................................. 6
OVERVIEW OF ALL STAKEHOLDERS .............................................................. 8
Stakeholders’ Satisfaction with the Transportation System ......................................... 8
Prioritizing Actions to Improve the Transportation System ...................................... 12
Actions to Improve Roadways ....................................................................................... 14
General Communication Tool Ratings ......................................................................... 16
MDT’s Customer Service and Performance Grades ................................................... 18
Security for System Components .................................................................................. 20
BICYCLE AND PEDESTRIAN STAKEHOLDER GROUP ................................. 21
Transportation System Satisfaction .............................................................................. 21
Figure 13: 10 = High Satisfaction Rate ......................................................................... 21
Actions to Improve the Transportation System ........................................................... 22
Actions to Improve Roadways ....................................................................................... 23
General Communication Tool Ratings ......................................................................... 24
MDT Customer Service and Performance Grades ...................................................... 26
Figure 18: 4 = A ............................................................................................................... 26
Security for System Components .................................................................................. 27
ECONOMIC DEVELOPMENT STAKEHOLDER GROUP .................................. 28
Transportation System Satisfaction .............................................................................. 28

2
Actions to Improve the Transportation System ........................................................... 29
Actions to Improve Roadways ....................................................................................... 30
General Communication Tool Ratings ......................................................................... 31
MDT Customer Service and Performance Grades ...................................................... 33
Security for System Components .................................................................................. 34
ENVIRONMENTAL STAKEHOLDER GROUP .................................................. 35
Transportation System Satisfaction .............................................................................. 35
Actions to Improve the Transportation System ........................................................... 36
Actions to Improve Roadways ....................................................................................... 37
General Communication Tool Ratings ......................................................................... 38
MDT Customer Service and Performance Grades ...................................................... 40
Figure 32: 4 = A ............................................................................................................... 40
Security for System Components .................................................................................. 41
INTERMODAL FREIGHT STAKEHOLDER GROUP ......................................... 42
Transportation System Satisfaction .............................................................................. 42
Actions to Improve the Transportation System ........................................................... 43
Actions to Improve Roadways ....................................................................................... 44
General Communication Tool Ratings ......................................................................... 45
MDT Customer Service and Performance Grades ...................................................... 47
Security for System Components .................................................................................. 48
CITIES AND TOWNS STAKEHOLDER GROUP ............................................... 49
Transportation System Satisfaction .............................................................................. 49
Actions to Improve the Transportation System ........................................................... 50
Actions to Improve Roadways ....................................................................................... 51

3
General Communication Tool Ratings ......................................................................... 52
MDT Customer Service and Performance Grades ...................................................... 54
Security for System Components .................................................................................. 55
COUNTIES STAKEHOLDER GROUP ............................................................... 56
Transportation System Satisfaction .............................................................................. 56
Actions to Improve the Transportation System ........................................................... 57
Actions to Improve Roadways ....................................................................................... 58
General Communication Tool Ratings ......................................................................... 59
MDT Customer Service and Performance Grades ...................................................... 61
Security for System Components .................................................................................. 62
PASSENGER TRANSPORTATION STAKEHOLDER GROUP ......................... 63
Transportation System Satisfaction .............................................................................. 63
Actions to Improve the Transportation System ........................................................... 64
Actions to Improve Roadways ....................................................................................... 65
General Communication Tool Ratings ......................................................................... 66
MDT Customer Service and Performance Grades ...................................................... 68
Passenger group grades ranged from B to C+ (see Figure 60). These closely
paralleled the publics’. In no instance did the difference between groups have
practical significance. ..................................................................................................... 68
Security for System Components .................................................................................. 69
STATE AND FEDERAL GOVERNMENT STAKEHOLDER GROUP ................. 70
Transportation System Satisfaction .............................................................................. 70
Actions to Improve the Transportation System ........................................................... 71
Actions to Improve Roadways ....................................................................................... 72
General Communication Tool Ratings ......................................................................... 73

4
MDT Customer Service and Performance Grades ...................................................... 75
Security for System Components .................................................................................. 76
TRIBAL PLANNER GROUP .............................................................................. 77
Transportation System Satisfaction .............................................................................. 77
Actions to Improve the Transportation System ........................................................... 78
Actions to Improve Roadways ....................................................................................... 79
General Communication Tool Ratings ......................................................................... 80
MDT Customer Service and Performance Grades ...................................................... 82
Security for System Components .................................................................................. 83

5
EXECUTIVE SUMMARY
In 2009 Montana Department of Transportation’s (MDT) stakeholder groups were:
• Generally satisfied with Montana’s transportation system.
• Most satisfied with interstate highways and airports.
• Least satisfied with bus depots and intercity bus service.
Out of 17 possible actions to improve Montana’s transportations system, stakeholders’
highest priorities were:
• Maintaining pavement condition.
• Keep current with new transportation technologies.
• Improve transportation safety.
Stakeholders’ lowest priority was reducing single-occupant vehicles.
When compared to stakeholder surveys since 1997:
• It appears that 2009 stakeholder groups are more satisfied with components of the
transportation system than were stakeholders in previous studies.
• Overall satisfaction with the transportation system remains at a relatively high
level.
• Customer grades of MDT performance also continue to improve since the first
time they were measured in 2001.
Stakeholders’ top priorities for possible actions to improve roadways are increasing
shoulder and road widths.
Stakeholders’ lowest roadway improvement priority is increasing roadway lighting.
Stakeholders rate the following public communication tools highest:
• Radio and television
• The MDT Web site
• Maps
Stakeholders rate the following general public communication tools lowest:
• Special mailings
• Surveys
• Brochures
Customer grades of MDT performance are in the B+ to C+ range. These grades closely
parallel those given by the public.

6
INTRODUCTION
The primary purpose of this report is to document data collected through the 2009
Montana Department of Transportation Stakeholder Survey. It also references the 2009
Public Involvement Telephone Survey for comparisons between the general public and
transportation stakeholders. In addition, the report provides a limited number of
comparisons to the 1997, 1999, 2001, 2003, 2005, and 2007 Transportation Stakeholder
surveys.
Stakeholder surveys are an important part of MDT’s public involvement process. They
illustrate transportation stakeholders’ perception of the current condition of Montana’s
transportation system and consider possible actions and priorities that could be taken by
MDT to improve different areas of the transportation system. The public involvement
process provides citizens, constituency groups, transportation providers, local
governments, Montana’s American Indian tribes, and state and federal agencies the
opportunity to participate in planning and project development. Public involvement at the
future planning level reduces potential for future controversy, results in a better statewide
transportation system, and allows for open communication between the Department and
citizens of Montana. The surveys also help MDT staff determine changes in public
opinion that indicate a need to update Montana’s multimodal transportation plan,
TranPlan 21.
The stakeholder groups included in the 2009 survey were:
• Mayors and chief executives of cities and towns;
• County commissioners;
• Economic development associations, business organizations, local development
corporations and associations;
• Montana’s American Indian Tribal Planners;
• Metropolitan Planning Organizations, urban area planners, and state and federal
agencies;
• Commercial trucking, freight rail, air freight, and intermodal interests;
• Bicycle and pedestrian interests;
• Environmental organizations and associations;
• Passenger transportation interests include local transit, intercity bus, rail, and air.
Stakeholders were selected from MDT’s mailing list database, which consists of over 600
individuals, organizations, associations, businesses, and government agencies with an
interest in transportation-related issues, and local government officials.
Survey Methods
The stakeholder questionnaire has four parts. Part 1 includes a wide range of
transportation questions that are the same questions asked of Montana residents in the
2009 Public Involvement Telephone Survey. Using the same questions allows for
relevant comparisons between stakeholders and the public. Questions in Part 2 focus on
possible improvements to Montana’s road and highway system and on methods used by
MDT to communicate with the public. Part 3 focuses on the Department’s customer

7
service. Respondents grade MDT service areas using an A through F scale. Part 3 also
includes items that examine transportation system security.
The survey was administered by the University of Montana’s Bureau of Business and
Economic Research (BBER) using the telephone during the period 4/20/09 and 8/02/09.
A total of 709 stakeholders were included in the list of respondents provided by MDT,
but 50 were found to be verified out of business, no longer with the organization with no
replacement, or repeated names on the list. This yields 659 eligible respondents. Of those
659 respondents, 417 (63.3%) completed the questionnaire. BBER documented case
status in a manner that allowed calculation and reporting of a unit response rate using the
American Association for Public Opinion Research (2008) standard definition (RR1).1 A
response rate is the number of completed interviews divided by number of eligible
respondents surveyed.
BBER achieved improved response rates over 2003 in each of the iterations it has
administered since taking over data collection from MDT in 2005. The 2003 iteration of
this survey was administered by MDT using mail methods. Using mail in 2003, a 36%
response rate was achieved. The 2005 response rate of 65.2% represented a 29.2
percentage-point increase over 2003. The initial 2007 response rate of 80.1% was a 14.9
percentage-point improvement over 2005. While the 2009 response rate declined to just
under the 2005 rate, the 2009 Stakeholder Survey response rate is significantly higher
than rates that are typically achieved in general population surveys. The greatly improved
response rates achieved by BBER significantly decrease the likelihood that the data are
adversely affected by nonresponse bias.
Eight American Indian tribal planners responded in 2009. Their aggregated responses are
included in the body of this report.
Table 1 below shows the total number of responses received by stakeholder group. Stakeholder
Group
2003
Completions
2003
%
2005
Completions
2005
%
2007
Completions
2007
%
2009
Completions
2009
%
Mayors 52 22.3 109 27.0 105 19.0 83 20.0
County
commissioners
25
10.7
52
12.9
55
10.0
43
10.3
Economic
development
19
8.2
40
9.9
89
16.1
87
21.0
Tribal planners 7 3.0 4 1.0 8 1.4 8 1.4
State and
federal 19 8.2 20 5.0
25
4.5
19
4.5
Intermodal 28 12.0 55 13.6 78 14.1 46 11.1
Non-motorized
vehicle and
pedestrian
20
8.6
50
12.4
58
10.5
36
8.7
Environmental 10 4.3 18 4.5 21 3.8 25 6.0
Passenger
transportation
53
22.7
55
13.6
113
20.5
70
17.0
Total 233 100.0 403 100.0 552 100.0 417 100.0
Table 1
1 American Association for Public Opinion Research. 2008. Standard Definitions: Final Dispositions of Case Codes
and Outcome Rates for Surveys.4th edition. Lexana, Kansas: AAPOR.

8
OVERVIEW OF ALL STAKEHOLDERS
Stakeholders’ Satisfaction with the Transportation System
Respondents were asked to rate their satisfaction with various aspects of the
transportation system on a scale from one to ten. Though the mathematical midpoint of
the scale is 5.5, a response of 5.0 is considered a “middle response.” Answers above a 5.0
represent a higher level of satisfaction, while answers below 5.0 represent a lower level
of satisfaction. Stakeholder satisfaction is presented in two forms. When comparisons
with the 2009 Public Involvement Telephone survey are made, the statistic presented is
the mean of all 2009 stakeholder responses. This statistic was chosen because it most
closely matches the statistics that describe the Public Involvement Survey data. When
comparisons with past Stakeholder surveys are made, the statistic presented is a mean of
the nine stakeholder group means. This second statistic is chosen to maintain
comparability with the four previous iterations of the Stakeholder Survey. In the figures
that follow, 95% confidence interval bars are included on the 2009 Public Involvement
Telephone Survey point estimates. No confidence interval is calculated for the
Stakeholder Survey. If the Stakeholder Survey point falls outside the Public Involvement
Survey confidence interval bar, it can be said with 95% confidence that the Stakeholder
Survey value differs from the Public Involvement Survey value.
Figure 1: 10 = High Satisfaction
1.0
2.0
3.0
4.0
5.0
6.0
7.0
8.0
9.0
10.0
Overa
ll sys
tem
Phys
ica
l conditio
n o
f airp
orts
Phys
ica
l conditio
n o
f in
ters
tate
hig
hw
ays
Phys
ica
l conditio
n o
f oth
er m
ajo
r hig
hw
ays
Phys
ica
l conditio
n o
f re
st a
reas
Availa
bility
of a
ir tra
nsporta
tion to
destin
atio
ns …
Phys
ica
l conditio
n o
f pedestria
n w
alk
wa
ys
Phys
ica
l conditio
n o
f bic
ycle
path
wa
ys
Availa
bility
of fre
ight
rail s
erv
ice
Availa
bility
of tra
nsit
for th
e e
lderly o
r dis
able
d
Phys
ica
l conditio
n o
f city s
treets
Availa
bility
of lo
cal
bus o
r van s
erv
ice
Phys
ica
l conditio
n o
f bus d
epots
Availa
bility
of a
ir tra
nsporta
tion to
destin
atio
ns w
ithin
…
Availa
bility
of ta
xis
Availa
bility
of b
uses
betw
ee
n c
ities a
nd
tow
ns
Availa
bility
of
passeng
er ra
il serv
ice
2009, All Stakeholders: Transportation System Satisfaction
Stakeholder Public
9
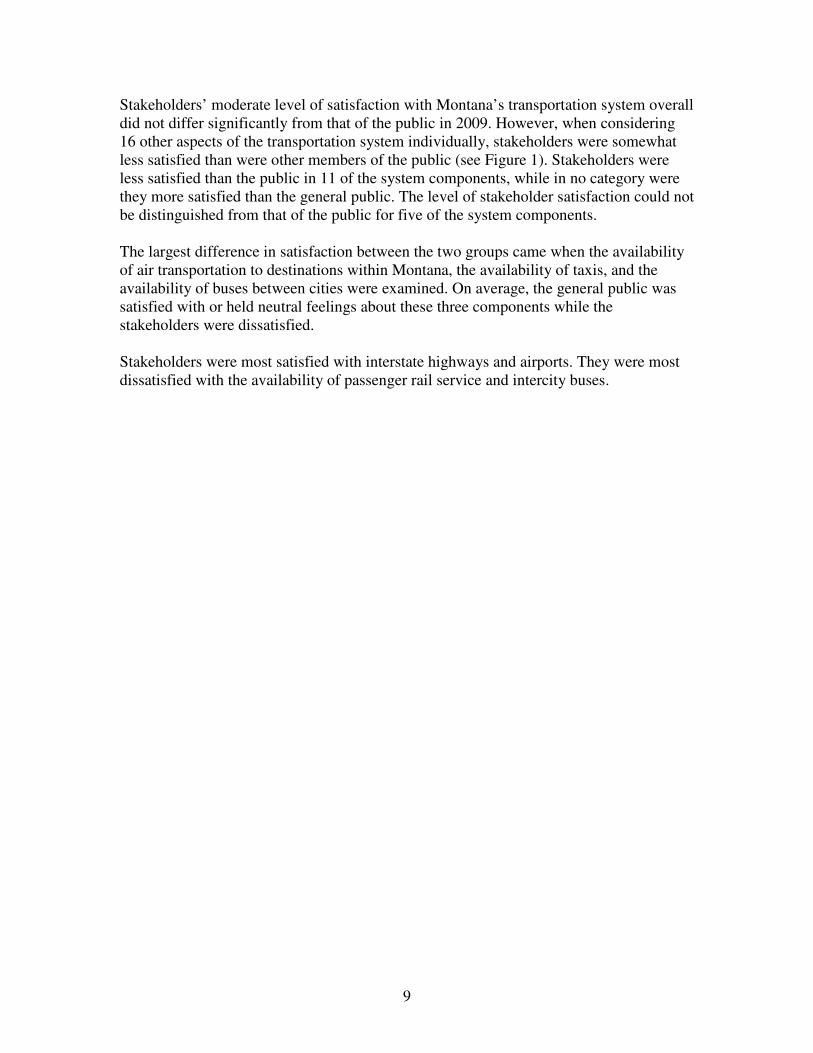
Stakeholders’ moderate level of satisfaction with Montana’s transportation system overall
did not differ significantly from that of the public in 2009. However, when considering
16 other aspects of the transportation system individually, stakeholders were somewhat
less satisfied than were other members of the public (see Figure 1). Stakeholders were
less satisfied than the public in 11 of the system components, while in no category were
they more satisfied than the general public. The level of stakeholder satisfaction could not
be distinguished from that of the public for five of the system components.
The largest difference in satisfaction between the two groups came when the availability
of air transportation to destinations within Montana, the availability of taxis, and the
availability of buses between cities were examined. On average, the general public was
satisfied with or held neutral feelings about these three components while the
stakeholders were dissatisfied.
Stakeholders were most satisfied with interstate highways and airports. They were most
dissatisfied with the availability of passenger rail service and intercity buses.

10
The 2009 stakeholder responses follow a pattern that has been found since 1997 (see
Figure 2). On first glance, it appears that 2009 stakeholders are, as a group, more satisfied
with components of the transportation system than were stakeholders in 1997, 1999, and
2001. In addition, stakeholders’ satisfaction with the physical condition of rest areas,
pedestrian walkways, bicycle pathways, and bus depots has steadily increased since 1997.
Stakeholder satisfaction with the availability of passenger rail service has steadily
declined since 1997.
Figure 2: 10 = High Satisfaction
1.0
2.0
3.0
4.0
5.0
6.0
7.0
8.0
9.0
10.0
Phys
ical c
onditio
n o
f airp
orts
Phys
ical c
onditio
n o
f inte
rsta
te
hig
hw
ays
Phys
ical c
onditio
n o
f oth
er m
ajo
r hig
hw
ays
Phys
ical c
onditio
n o
f rest a
reas
Availa
bility o
f air tra
nsporta
tion to
destin
atio
ns o
uts
ide M
onta
na
Phys
ical c
onditio
n o
f pedestria
n
walk
ways
Phys
ical c
onditio
n o
f bic
ycle
path
ways
Availa
bility o
f freig
ht ra
il serv
ice
Availa
bility o
f transit fo
r the e
lderly
or d
isable
d
Phys
ical c
onditio
n o
f city s
treets
Availa
bility o
f local b
us o
r van
serv
ice
Phys
ical c
onditio
n o
f bus d
epots
Availa
bility o
f air tra
nsporta
tion to
destin
atio
ns w
ithin
Monta
na
Availa
bility o
f taxis
Availa
bility o
f buses b
etw
een c
ities
and to
wns
Availa
bility o
f passenger ra
il serv
ice
All Stakeholders: System Satisfaction History2009
2007
2005
2003
2001
1999
1997

11
Examination of stakeholder satisfaction with the transportation system overall by group
reveals an overall system satisfaction rating at or near the highest yet measured among
five of the ten groups shown (see Figure 3).
Figure 3: 10 = High Satisfaction
Overall system satisfaction is declining among three stakeholder groups: intermodal,
passenger, and environmental.
1.0
2.0
3.0
4.0
5.0
6.0
7.0
8.0
9.0
10.0
Com
mis
sio
ners
Genera
l public
Govern
ment
Econom
ic
Mayors
Inte
rmodal
Passenger
Bik
e/p
ed
Enviro
nm
enta
l
Trib
al p
lanners
Stakeholder Satisfaction: Overall System
2009 2007 2005
2003 2001 1999
1997

12
Prioritizing Actions to Improve the Transportation System Stakeholders were asked to prioritize 17 possible actions to improve the transportation
system in Montana. The actions were rated on a scale of 1 to 5 where:
1 = Very low priority
2 = Somewhat low priority
3 = Medium priority
4 = Somewhat high priority
5 = Very high priority
Stakeholder priorities for the 17 items (see Figure 4) ranged from almost “somewhat
high” to just below “medium.” Stakeholders’ highest priority was supporting efforts to
preserve existing passenger rail service. Stakeholders’ lowest priority for action was
reducing single-occupant vehicles.
Figure 4: 5 = Very High
1.0
2.0
3.0
4.0
5.0
Supportin
g e
fforts
to p
reserv
e e
xis
ting p
assenger ra
il serv
ice
Main
tain
road p
avem
ent c
onditio
n
Pro
motin
g th
e u
se o
f local tra
nsit s
yste
ms, lik
e b
uses
or v
ans
Impro
vin
g th
e p
hys
ical c
onditio
n o
f oth
er ro
ads a
nd
stre
ets
Impro
vin
g tra
nsporta
tion s
afe
ty
Keepin
g th
e p
ublic
info
rmed a
bout tra
nsporta
tion
issues
Supportin
g e
fforts
to in
cre
ase th
e a
vaila
bility o
f schedule
d a
irline s
erv
ice
Usin
g n
ew
technolo
gie
s lik
e e
lectro
nic
message s
igns,
website
& ra
dio
update
s
Ensurin
g a
dequate
pedestria
n fa
cilitie
s (i.e
., sid
ew
alk
s, fo
otp
ath
s, c
rossin
gs)
Impro
vin
g th
e p
hys
ical c
onditio
n o
f the in
ters
tate
s a
nd
majo
r hig
hw
ays
Impro
vin
g re
st a
reas (i.e
. main
tenance, m
ore
facilitie
s)
Ensurin
g a
dequate
bic
ycle
facilitie
s
Impro
vin
g th
e p
hys
ical c
onditio
n o
f bus d
epots
Regula
ting th
e n
um
ber o
f hig
hw
ay a
ppro
aches a
nd
driv
ew
ays
to p
reserv
e tra
ns c
orrid
ors
Reducin
g tra
ffic c
ongestio
n b
y incre
asin
g th
e c
apacity
of th
e h
ighw
ay s
yste
m
Reducin
g th
e a
ir quality im
pacts
of ro
adw
ay u
se
Atte
mptin
g to
reduce s
ingle
occupancy v
ehic
le u
se
2009 Stakeholders: System Priorities
Stakeholder Public

13
Stakeholders rated six possible actions as higher priorities than did the public, and they
rated one possible action as a lower priority than the public. The remaining items were
not rated as significantly higher or lower priorities by stakeholders when compared to the
public.
Stakeholders’ priorities for possible actions to improve the transportation system were
lower in 2009 when compared with 2003 - 2007 (see Figure 5). Stakeholder priority
scores for the previous surveys used a different scale and are thus not reported here. The
largest decrease in priority in 2009 occurred for reducing the air quality impacts of
roadway use.
Figure 5: 5 = Very High
1.0
2.0
3.0
4.0
5.0
Supportin
g e
fforts
to p
reserv
e e
xis
ting p
assenger ra
il serv
ice
Main
tain
road p
avem
ent c
onditio
n
Pro
motin
g th
e u
se o
f local tra
nsit s
yste
ms, lik
e b
uses
or v
ans
Impro
vin
g th
e p
hys
ical c
onditio
n o
f oth
er ro
ads a
nd
stre
ets
Impro
vin
g tra
nsporta
tion s
afe
ty
Keepin
g th
e p
ublic
info
rmed a
bout tra
nsporta
tion
issues
Supportin
g e
fforts
to in
cre
ase th
e a
vaila
bility o
f schedule
d a
irline s
erv
ice
Usin
g n
ew
technolo
gie
s lik
e e
lectro
nic
message
sig
ns, w
ebsite
& ra
dio
update
s
Ensurin
g a
dequate
pedestria
n fa
cilitie
s (i.e
., sid
ew
alk
s, fo
otp
ath
s, c
rossin
gs)
Impro
vin
g th
e p
hys
ical c
onditio
n o
f the in
ters
tate
s
and m
ajo
r hig
hw
ays
Impro
vin
g re
st a
reas (i.e
. main
tenance, m
ore
fa
cilitie
s)
Ensurin
g a
dequate
bic
ycle
facilitie
s
Impro
vin
g th
e p
hys
ical c
onditio
n o
f bus d
epots
Regula
ting th
e n
um
ber o
f hig
hw
ay a
ppro
aches a
nd
driv
ew
ays
to p
reserv
e tra
ns c
orrid
ors
Reducin
g tra
ffic c
ongestio
n b
y incre
asin
g th
e
capacity o
f the h
ighw
ay s
yste
m
Reducin
g th
e a
ir quality im
pacts
of ro
adw
ay u
se
Stakeholders: System Priority History
2009 2007
2005 2003

14
Actions to Improve Roadways In addition to asking about a broad range of possible actions to improve the transportation
system, the 2009 stakeholder questionnaire asked eight questions that focused on possible
actions to improve Montana’s roadways. Each possible roadway improvement was
prioritized by respondents using the same very low to very high priority scale.
Every priority was ranked between “somewhat high” and “medium.” The highest
priorities for roadway improvement were: a) widen road shoulders for motorists,
b) widen road shoulders for bicycles, and c) widen roadways in general. The lowest
priority was adding more lighting for roadways.
The 2009 stakeholder priority scores for two of the eight possible roadway improvements
studied were not measurably different from those of the general public (see Figure 6).
Only three of the eight scores could be said to differ statistically from those found in the
Public Involvement Survey.
Figure 6: 5 = Very High
1.0
2.0
3.0
4.0
5.0
Incre
ase s
hould
er
wid
ths to
accom
modate
bic
ycle
s
Incre
ase s
hould
er
wid
ths to
accom
modate
m
oto
rists
More
guard
rails
More
pavem
ent
mark
ings (i.e
. should
er
More
traffic
lights
and
left tu
rn la
nes
Wid
er ro
adw
ays
More
dire
ctio
nal/in
form
atio
nal s
igns (i.e
.
More
lightin
g o
f ro
adw
ays
2009 Stakeholder Action to Improve Roadways Priorities
Stakeholder Public
15
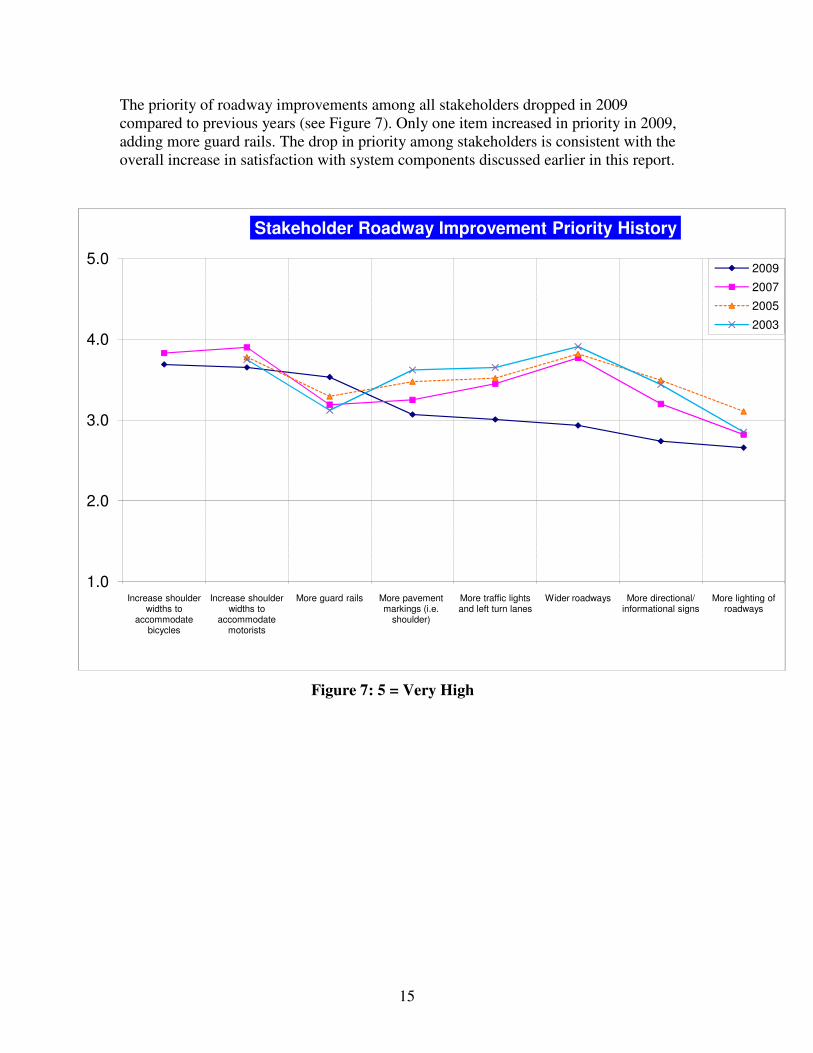
The priority of roadway improvements among all stakeholders dropped in 2009
compared to previous years (see Figure 7). Only one item increased in priority in 2009,
adding more guard rails. The drop in priority among stakeholders is consistent with the
overall increase in satisfaction with system components discussed earlier in this report.
Figure 7: 5 = Very High
1.0
2.0
3.0
4.0
5.0
Increase shoulder widths to
accommodate bicycles
Increase shoulder widths to
accommodate motorists
More guard rails More pavement markings (i.e.
shoulder)
More traffic lights and left turn lanes
Wider roadways More directional/ informational signs
More lighting of roadways
Stakeholder Roadway Improvement Priority History
2009
2007
2005
2003

16
General Communication Tool Ratings Keeping the public informed about transportation issues is a high priority to many
Montanans. In order to efficiently distribute information, respondents were asked to rate
some of the tools MDT uses in its public information sharing efforts (see Figure 8).
The 2009 stakeholders rated five tools between somewhat useful and very useful: the
Web site, electronic media, public meetings, a toll-free call in number, and newspapers.
Stakeholders rated special mailings and surveys as slightly less than somewhat useful.
Stakeholders rated the MDT Web site and public meetings higher than the public. The
public finds television and radio more useful than do stakeholders.
Figure 8: 5 = Extremely Useful
1.0
2.0
3.0
4.0
5.0
Website Radio and television Public meetings in your community
Toll-free call in number
Newspapers Special mailings (brochures, newsletters,
postcards, etc)
Surveys
2009 Stakeholders: Communication Tool Rating
Stakeholder Public

17
Planning and Project Communication Tool Ratings
MDT also asked stakeholders to rate planning and project-specific communication tools
(see Figure 9). Stakeholders rated four of six tools studied between very useful and
somewhat useful. Stakeholders gave their highest ratings to maps and pictures, graphics,
and the Web site.
The public rated all of the items studied lower than did stakeholders, though the public
also finds maps and pictures or graphics most useful.
Figure 9: 5 = Extremely Useful
1.0
2.0
3.0
4.0
5.0
Maps Pictures or graphics Web site Advanced technology Brochures Newsletters
2009 Stakeholders: Planning and Project Communication Tool Ratings
Stakeholder Public

18
MDT’s Customer Service and Performance Grades Respondents were asked to grade MDT in several areas of overall performance and
customer service. Each aspect was graded using an A through F scale where A = 4 and
F = 0.
Stakeholders gave MDT grades that fell in a very tight range; all fell between B and C+.
Stakeholders graded MDT’s quality of service when compared to five years ago highest,
though this was followed very closely by several other items (see Figure 10). The 2009
stakeholders graded MDT’s responsiveness to ideas and concerns lowest.
Stakeholders’ grades for MDT paralleled those given by the public very closely. There is
no practical or statistical difference between the stakeholders’ grades and the publics’.
Figure 10: 4 = A
0.0
1.0
2.0
3.0
4.0
Ove
rall c
urre
nt q
ua
lity o
f MD
T s
erv
ice
co
mp
are
d w
ith fiv
e y
ears
ag
o
Cu
rren
t MD
T q
uality
of s
erv
ice
MD
T's
ove
rall p
erfo
rma
nce
du
ring
th
e p
as
t ye
ar
MD
T e
fforts
to k
ee
p c
us
tom
ers
fully
info
rme
d
MD
T p
ub
lic n
otific
atio
n p
roc
es
s a
bou
t c
on
stru
ctio
n p
roje
cts
in y
our a
rea
Ov
era
ll con
ve
nie
nce
of tra
vel th
roug
h
co
nstru
ctio
n z
one
s a
nd m
ain
tena
nce
pro
jec
ts
MD
T o
vera
ll qua
lity o
f pla
nnin
g
MD
T re
sp
ons
ive
ne
ss to
cus
tom
er id
ea
s a
nd
c
onc
ern
s
2009 Stakeholders: Performance Grades for MDT
Stakeholder Public

19
Grades continued the overall trend of improvement since stakeholders were first asked to
grade MDT performance and customer service in 2001 (see Figure 11). The 2009 grades
are better than those found in 2001, 2003, and 2007.
Figure 11: 4 = A
0.0
1.0
2.0
3.0
4.0
Overa
ll curre
nt
quality o
f MD
T
serv
ice c
om
pare
d
with
five ye
ars
ago
Curre
nt M
DT
quality o
f serv
ice
MD
T's
overa
ll perfo
rmance
durin
g th
e p
ast
year
MD
T e
fforts
to
keep c
usto
mers
fu
lly info
rmed
MD
T p
ublic
notific
atio
n p
rocess
about c
onstru
ctio
n
pro
jects
in yo
ur
are
a
Overa
ll convenie
nce o
f tra
vel th
rough
constru
ctio
n z
ones
and m
ain
tenance
pro
jects
MD
T o
vera
ll quality
of p
lannin
g
MD
T
responsiv
eness to
custo
mer id
eas
and c
oncern
s
All Stakeholders: Performance Grade History for MDT
2009 2007 2005 2003 2001

20
Security for System Components Respondents were asked to rate the security importance of various transportation system
components. Each component was rated on a scale from 1 – 5 where 1 is not at all
important and 5 is extremely important.
Stakeholders gave importance ratings that fell between extremely important and
somewhat important. Stakeholders rated coordinating with other agencies, emergency
response plans, border crossings, and airports most important. The 2009 stakeholders
rated availability of alternate routes and public facilities, like bus terminals, lowest in
importance.
Stakeholders’ ratings for importance paralleled those given by the public very closely.
There is little practical meaning in the small statistical differences between the
stakeholders’ ratings and the publics’.
Figure 12: 5 = Extremely Important
1.0
2.0
3.0
4.0
5.0
Com
munic
atio
n a
nd
coord
inatio
n w
ith o
ther
agencie
s
Em
erg
ency re
sponse
pla
ns
Hom
ela
nd s
ecurity b
ord
er
cro
ssin
gs
Hom
ela
nd s
ecurity
airp
orts
Com
munic
atio
n w
ith th
e
public
usin
g a
vaila
ble
advanced te
chnolo
gie
s
Hom
ela
nd s
ecurity
inte
rsta
te h
ighw
ays
Hom
ela
nd s
ecurity o
ther
majo
r hig
hw
ays
Connectiv
ity of ro
adw
ays
Hom
ela
nd s
ecurity p
ublic
tra
nsit fa
cilitie
s lik
e b
us
term
inals
Availa
bility o
f alte
rnativ
e
route
s
2009, All Stakeholders: System Security Importance Rating
Stakeholder Public

21
BICYCLE AND PEDESTRIAN STAKEHOLDER GROUP
This group is represented by various bicycle and pedestrian interests from across
Montana. Stakeholders include representatives from:
• Bicycling clubs
• Community development groups
• Bicycle/pedestrian advisory boards
• County planning offices
• Cops on bikes
• City park and recreation organizations.
In 2009, 36 representatives of bicycle and pedestrian groups completed interviews in
2009.
Transportation System Satisfaction
Figure 13: 10 = High Satisfaction Rate
1.0
2.0
3.0
4.0
5.0
6.0
7.0
8.0
9.0
10.0
Phys
ical c
onditio
n o
f inte
rsta
te h
ighw
ays
Phys
ical c
onditio
n o
f airp
orts
Phys
ical c
onditio
n o
f rest a
reas
Phys
ical c
onditio
n o
f oth
er m
ajo
r hig
hw
ays
Availa
bility o
f air tra
nsporta
tion to
destin
atio
ns o
uts
ide M
onta
na
Overa
ll sys
tem
Availa
bility o
f freig
ht ra
il serv
ice
Phys
ical c
onditio
n o
f city s
treets
Availa
bility o
f local b
us o
r van s
erv
ice
Availa
bility o
f transit fo
r the e
lderly o
r dis
able
d
Phys
ical c
onditio
n o
f pedestria
n w
alk
ways
Availa
bility o
f taxis
Availa
bility o
f air tra
nsporta
tion to
destin
atio
ns w
ithin
Monta
na
Phys
ical c
onditio
n o
f bic
ycle
path
wa
ys
Availa
bility o
f buses b
etw
een c
ities a
nd
tow
ns
Phys
ical c
onditio
n o
f bus d
epots
Availa
bility o
f passenger ra
il serv
ice
2009, Bicycle & Pedestrian: System Satisfaction
StakeholderPublic

22
Bicycle and pedestrian group respondents were moderately satisfied with the
transportation system overall, giving it a mean rating of 6.14 on a 1 to 10 scale (see
Figure 13). This is lower than the public’s mean rating of 6.60. The 2009 rating is no
change from the 2007 rating (6.16).
When asked about specific components of the transportation system, bicycle and
pedestrian group members expressed satisfaction with 9 of 16 system components. They
were most satisfied with interstate highways and airports. Bicycle and pedestrian group
members expressed dissatisfaction with pedestrian walkways, taxis, availability of air
service to destinations within Montana, bike pathways, intercity bus service, bus depots,
and passenger rail service. This group expressed significantly less satisfaction than did
the public with pedestrian facilities and bicycle paths.
Actions to Improve the Transportation System
Figure 14: 5 = Very High Priority
The three highest priorities for improving components of the transportation system for
bicycle and pedestrian group members were ensuring adequate bicycle facilities,
supporting efforts to preserve existing passenger rail service, and ensuring adequate
pedestrian facilities (see Figure 14).
1.0
2.0
3.0
4.0
5.0
Ensurin
g a
dequate
bic
ycle
facilitie
s
Supportin
g e
fforts
to p
reserv
e e
xis
ting
passenger ra
il serv
ice
Ensurin
g a
dequate
pedestria
n fa
cilitie
s (i.e
., sid
ew
alk
s, fo
otp
ath
s, c
rossin
gs)
Pro
motin
g th
e u
se o
f local tra
nsit s
yste
ms,
like b
uses o
r vans
Keepin
g th
e p
ublic
info
rmed a
bout
transporta
tion is
sues
Impro
vin
g tra
nsporta
tion s
afe
ty
Atte
mptin
g to
reduce s
ingle
occupancy
vehic
le u
se
Reducin
g th
e a
ir quality im
pacts
of ro
adw
ay
use
Main
tain
road p
avem
ent c
onditio
n
Impro
vin
g th
e p
hys
ical c
onditio
n o
f oth
er
roads a
nd s
treets
Usin
g n
ew
technolo
gie
s lik
e e
lectro
nic
m
essage s
igns, w
ebsite
& ra
dio
update
s
Supportin
g e
fforts
to in
cre
ase th
e a
vaila
bility
of s
chedule
d a
irline s
erv
ice
Impro
vin
g th
e p
hys
ical c
onditio
n o
f bus
depots
Regula
ting th
e n
um
ber o
f hig
hw
ay
appro
aches a
nd d
rivew
ays
to p
reserv
e tra
ns
corrid
ors
Impro
vin
g re
st a
reas (i.e
. main
tenance, m
ore
fa
cilitie
s)
Reducin
g tra
ffic c
ongestio
n b
y incre
asin
g th
e
capacity o
f the h
ighw
ay s
yste
m
Impro
vin
g th
e p
hys
ical c
onditio
n o
f the
inte
rsta
tes a
nd m
ajo
r hig
hw
ays
2009, Bicycle & Pedestrian: System Priorities
Stakeholder Public

23
Three items were rated as less than a medium priority: improving interstates, reducing
traffic congestion by increasing system capacity, and improving rest areas. Bicycle and
pedestrian group members rate 7 of 17 possible actions to improve the transportation
system higher than did the public (see Figure 14).
This group rated the following items at least one full scale point higher in priority than
did the public: ensuring adequate bicycle facilities, and reducing the number of single
occupant vehicles. Ensuring adequate pedestrian facilities and reducing the air quality
impacts of roadway use was also rated a significantly higher priority by this stakeholder
group when compared to the public.
Actions to Improve Roadways
Figure 15: 5 = Very High Priority
The highest priority roadway improvement for the bicycle and pedestrian group was
increasing shoulder widths for bicycles, which was rated a “Very High Priority” (see
Figure 15). One of the remaining seven items - increasing shoulder widths for motorists
and widening roadways - were rated between “Somewhat High Priority” and “Medium
Priority”. Six items received a priority score lower than that delivered by the public.
1.0
2.0
3.0
4.0
5.0
Incre
ase
should
er w
idth
s
to a
ccom
modate
bic
ycle
s
Incre
ase
should
er w
idth
s
to a
ccom
modate
m
oto
rists
More
guard
rails
More
pavem
ent
mark
ings (i.e
. should
er
Wid
er ro
adw
ays
More
traffic
lights
and le
ft turn
la
nes
More
lightin
g o
f ro
adw
ays
More
dire
ctio
nal/in
form
atio
nal s
igns (i.e
.
2009 Bike & Pedestrian Actions to Improve Roadways Priorities
Stakeholder
Public

24
General Communication Tool Ratings The 2009 bicycle and pedestrian stakeholders rated three tools between somewhat useful
and very useful: the MDT Web site, electronic media, and a toll-free call in telephone
number. They also rated newspapers and surveys as slightly less than somewhat useful.
Bicycle and pedestrian stakeholders rated the MDT Web site, public meetings and special
mailings significantly more useful than did the public. The public found television and
radio and surveys more useful than did bicycle and pedestrian stakeholders.
Figure 16: 5 = Extremely Useful
1.0
2.0
3.0
4.0
5.0
Website
Radio
and
tele
vis
ion
Toll-fre
e c
all in
num
ber
Public
meetin
gs
in yo
ur
com
munity
Specia
l mailin
gs
(bro
chure
s,
new
sle
tters
, postc
ard
s, e
tc)
New
spapers
Surv
eys
2009, Bicycle & Pedestrian: Communication Tool Rating
Stakeholder Public

25
Planning and Project Communication Tool Ratings
MDT also asked bicycle and pedestrian stakeholders to rate planning and project specific
communication tools (see Figure 17). Bicycle and pedestrian stakeholders rated three of
six tools studied just over somewhat useful. Stakeholders gave their highest ratings to
maps, pictures or graphics, and Web site media.
The public rated three of the items studied lower than did bicycle and pedestrian
stakeholders: maps, the MDT Web site, and newsletters.
Figure 17: 5 = Extremely Useful
1.0
2.0
3.0
4.0
5.0
Maps
Pic
ture
s o
r gra
phic
s
Web s
ite
Advanced te
chnolo
gy
New
sle
tters
Bro
chure
s
2009, Bicycle & Pedestrian: Planning and Project Communication Tool Ratings
Stakeholder Public

26
MDT Customer Service and Performance Grades Bicycle and pedestrian group grades ranged from B to C+ (see Figure 18). These closely
paralleled the publics’. In only two instances were the differences between groups
significant. The public gave MDT a lower grade for keeping the public informed and for
public notification about construction than did the bicycle and pedestrian group.
Figure 18: 4 = A
0.0
1.0
2.0
3.0
4.0
Overa
ll curre
nt q
uality o
f MD
T s
erv
ice
com
pare
d w
ith fiv
e ye
ars
ago
MD
T p
ublic
notific
atio
n p
rocess a
bout
constru
ctio
n p
roje
cts
in yo
ur a
rea
MD
T e
fforts
to k
eep c
usto
mers
fully
info
rmed
Curre
nt M
DT
quality o
f serv
ice
Overa
ll convenie
nce o
f travel th
rough
constru
ctio
n z
ones a
nd m
ain
tenance
pro
jects
MD
T's
overa
ll perfo
rmance d
urin
g th
e
past ye
ar
MD
T o
vera
ll quality o
f pla
nnin
g
MD
T re
sponsiv
eness to
custo
mer id
eas
and c
oncern
s
2009, Bicycle & Pedestrian: Performance Grades for MDT
Stakeholder
Public
27
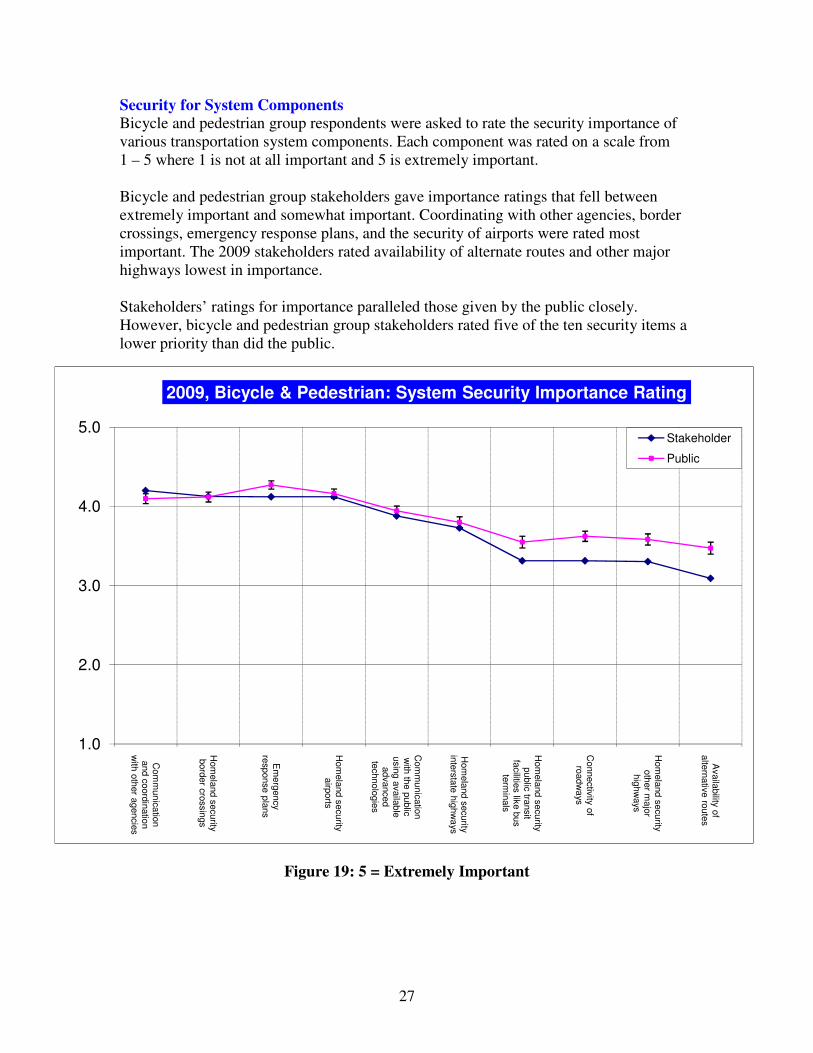
Security for System Components Bicycle and pedestrian group respondents were asked to rate the security importance of
various transportation system components. Each component was rated on a scale from
1 – 5 where 1 is not at all important and 5 is extremely important.
Bicycle and pedestrian group stakeholders gave importance ratings that fell between
extremely important and somewhat important. Coordinating with other agencies, border
crossings, emergency response plans, and the security of airports were rated most
important. The 2009 stakeholders rated availability of alternate routes and other major
highways lowest in importance.
Stakeholders’ ratings for importance paralleled those given by the public closely.
However, bicycle and pedestrian group stakeholders rated five of the ten security items a
lower priority than did the public.
Figure 19: 5 = Extremely Important
1.0
2.0
3.0
4.0
5.0
Com
munic
atio
n
and c
oord
inatio
n
with
oth
er a
gencie
s
Hom
ela
nd s
ecurity
bord
er c
rossin
gs
Em
erg
ency
response p
lans
Hom
ela
nd s
ecurity
airp
orts
Com
munic
atio
n
with
the p
ublic
usin
g a
vaila
ble
advanced
technolo
gie
s
Hom
ela
nd s
ecurity
inte
rsta
te h
ighw
ays
Hom
ela
nd s
ecurity
public
transit
facilitie
s lik
e b
us
term
inals
Connectiv
ity of
roadw
ays
Hom
ela
nd s
ecurity
oth
er m
ajo
r hig
hw
ays
Availa
bility o
f alte
rnativ
e ro
ute
s
2009, Bicycle & Pedestrian: System Security Importance Rating
Stakeholder
Public

28
ECONOMIC DEVELOPMENT STAKEHOLDER GROUP
This group is represented by various economic development interests from across
Montana. Stakeholders include representatives from:
• Economic development associations
• Business organizations
• Local development corporations and associations
In 2009, 87 completed interviews were collected from members of the economic
development group, compared to 89 responses in 2007.
Transportation System Satisfaction
Economic development group respondents were moderately satisfied with the
transportation system overall; giving it a mean rating of 6.45 on a 1 to 10 scale. This is
almost identical to the public’s mean rating of 6.60 (see Figure 20). The 2009 rating is
numerically unchanged from the 2007 rating (6.45).
Figure 20: 10 = High
1.0
2.0
3.0
4.0
5.0
6.0
7.0
8.0
9.0
10.0
Phys
ical c
onditio
n o
f airp
orts
Phys
ical c
onditio
n o
f inte
rsta
te h
ighw
ays
Phys
ical c
onditio
n o
f oth
er m
ajo
r hig
hw
ays
Availa
bility o
f air tra
nsporta
tion to
destin
atio
ns
outs
ide M
onta
na
Overa
ll sys
tem
Phys
ical c
onditio
n o
f rest a
reas
Phys
ical c
onditio
n o
f bic
ycle
path
wa
ys
Phys
ical c
onditio
n o
f pedestria
n w
alk
ways
Phys
ical c
onditio
n o
f city s
treets
Availa
bility o
f freig
ht ra
il serv
ice
Availa
bility o
f transit fo
r the e
lderly o
r dis
able
d
Availa
bility o
f local b
us o
r van s
erv
ice
Phys
ical c
onditio
n o
f bus d
epots
Availa
bility o
f taxis
Availa
bility o
f air tra
nsporta
tion to
destin
atio
ns
with
in M
onta
na
Availa
bility o
f passenger ra
il serv
ice
Availa
bility o
f buses b
etw
een c
ities a
nd to
wns
2009, Economic Development: System Satisfaction
Stakeholder
Public

29
When asked about specific components of the transportation system, economic
development group members expressed satisfaction with 12 of 16 system components.
They were most satisfied with airports, interstate highways and major highways other
than the interstates. Economic development group members expressed dissatisfaction
with intercity bus service, passenger rail service, air transportation in Montana, taxis, and
bus depots. This was mildly more favorable than the 2007 survey, when only 9 of 16
system components received at least a satisfactory score. This group expressed less
satisfaction than did the public with 14 specific system components.
Actions to Improve the Transportation System The three highest priorities for improving components of the transportation system for
economic development group members were promoting scheduled airline service,
supporting existing passenger rail service, and maintaining pavement conditions (see
Figure 21). Four items were rated as less than a “Medium Priority”: reducing single
occupancy vehicles, reducing air quality impacts, improving bus depots and reducing
traffic congestion by increasing highway capacity. Economic development group
members rated 12 of 17 possible actions to improve the transportation system higher than
did the public. The widest disparity between the priority rankings of economic
development group members and the general public was the promotion of scheduled
airline service.
Figure 21: 5 = Very High
1.0
2.0
3.0
4.0
5.0
Supportin
g e
fforts
to in
cre
ase th
e
availa
bility o
f schedule
d a
irline s
erv
ice
Supportin
g e
fforts
to p
reserv
e e
xis
ting
passenger ra
il serv
ice
Main
tain
road p
avem
ent c
onditio
n
Impro
vin
g th
e p
hys
ical c
onditio
n o
f oth
er
roads a
nd s
treets
Usin
g n
ew
technolo
gie
s lik
e e
lectro
nic
m
essage s
igns, w
ebsite
& ra
dio
update
s
Impro
vin
g tra
nsporta
tion s
afe
ty
Pro
motin
g th
e u
se o
f local tra
nsit
sys
tem
s, lik
e b
uses o
r vans
Keepin
g th
e p
ublic
info
rmed a
bout
transporta
tion is
sues
Ensurin
g a
dequate
pedestria
n fa
cilitie
s
(i.e., s
idew
alk
s, fo
otp
ath
s, c
rossin
gs)
Impro
vin
g th
e p
hys
ical c
onditio
n o
f the
inte
rsta
tes a
nd m
ajo
r hig
hw
ays
Impro
vin
g re
st a
reas (i.e
. main
tenance,
more
facilitie
s)
Ensurin
g a
dequate
bic
ycle
facilitie
s
Regula
ting th
e n
um
ber o
f hig
hw
ay
appro
aches a
nd d
rivew
ays
to p
reserv
e
trans c
orrid
ors
Reducin
g tra
ffic c
ongestio
n b
y incre
asin
g
the c
apacity o
f the h
ighw
ay s
yste
m
Impro
vin
g th
e p
hys
ical c
onditio
n o
f bus
depots
Reducin
g th
e a
ir quality im
pacts
of
roadw
ay u
se
Atte
mptin
g to
reduce s
ingle
occupancy
vehic
le u
se
2009, Economic Development: System Priorities
Stakeholder
Public

30
Actions to Improve Roadways The highest priority roadway improvements for the economic development group were
more guard rails and widening road shoulders for motorists, which had identical rankings
(see Figure 22). This was followed closely by increasing shoulder widths to
accommodate bicycles. The remaining five items were rated “Somewhat High” or
“Medium Priority”. Wider roadways, additional traffic lights and left turn lanes and
increased roadway lighting all receive priority scores lower than those expressed by the
public.
Figure 22: 5 = Very High
1.0
2.0
3.0
4.0
5.0
More
guard
rails
Incre
ase
should
er
wid
ths to
accom
mo
date
m
oto
rists
Incre
ase
should
er
wid
ths to
accom
mo
date
bic
ycle
s
More
pavem
ent
mark
ings
(i.e.
should
er
Wid
er
roadw
ays
More
tra
ffic
lights
and
left tu
rn
lanes
More
dire
ctio
nal
/info
rmatio
nal s
igns
(i.e.
More
lig
htin
g o
f ro
adw
ays
2009, Economic Development: Actions to Improve Roadways Priorities
Stakeholder
Public

31
General Communication Tool Ratings Economic development stakeholders rated two tools between somewhat useful and very
useful in 2009: Web sites and traditional electronic media. They also rated special
mailings and surveys as less than somewhat useful.
Figure 23: 5 = Extremely Useful
Economic development stakeholders rated the MDT Web site and public meetings just
lower than very useful, while the public rated the item as somewhat useful. Economic
development stakeholders also found public meetings more useful than did the general
public, while the situation was reversed for radio and television.
1.0
2.0
3.0
4.0
5.0
Website
Radio
and
tele
vis
ion
Toll-fre
e c
all in
num
ber
New
spapers
Public
meetin
gs
in yo
ur
com
munity
Surv
eys
Specia
l mailin
gs
(bro
chure
s,
new
sle
tters
, postc
ard
s, e
tc)
2009, Economic Development: Communication Tool Rating
Stakeholder
Public
32
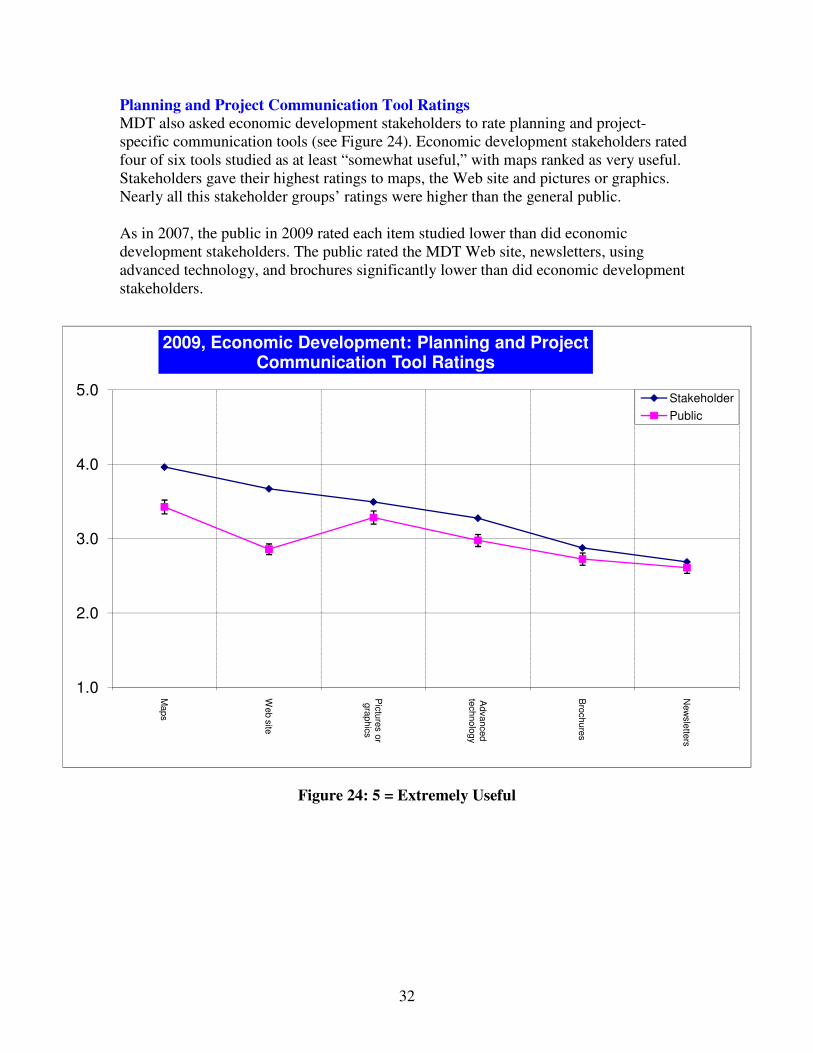
Planning and Project Communication Tool Ratings
MDT also asked economic development stakeholders to rate planning and project-
specific communication tools (see Figure 24). Economic development stakeholders rated
four of six tools studied as at least “somewhat useful,” with maps ranked as very useful.
Stakeholders gave their highest ratings to maps, the Web site and pictures or graphics.
Nearly all this stakeholder groups’ ratings were higher than the general public.
As in 2007, the public in 2009 rated each item studied lower than did economic
development stakeholders. The public rated the MDT Web site, newsletters, using
advanced technology, and brochures significantly lower than did economic development
stakeholders.
Figure 24: 5 = Extremely Useful
1.0
2.0
3.0
4.0
5.0
Maps
Web s
ite
Pic
ture
s o
r gra
phic
s
Advanced
technolo
gy
Bro
chure
s
New
sle
tters
2009, Economic Development: Planning and Project Communication Tool Ratings
Stakeholder
Public

33
MDT Customer Service and Performance Grades Economic development group grades for MDT ranged from B to C (see Figure 25).
These closely paralleled the publics’. The largest difference between the two groups’
grades was only two tenths of a point, referring to MDT’s overall performance over the
past year. Highest grades received by MDT from economic development stakeholders
were for service improvements over five years, performance over the last year, and the
current quality of MDT service. The lowest grade was for MDT responsiveness to
customer input.
Figure 25: 4 = A
0.0
1.0
2.0
3.0
4.0
Overa
ll curre
nt q
uality o
f MD
T s
erv
ice c
om
pare
d
with
five ye
ars
ago
MD
T's
overa
ll perfo
rmance d
urin
g th
e p
ast ye
ar
Curre
nt M
DT
quality o
f serv
ice
MD
T o
vera
ll quality o
f pla
nnin
g
Overa
ll convenie
nce o
f travel th
rough
constru
ctio
n z
ones a
nd m
ain
tenance p
roje
cts
MD
T p
ublic
notific
atio
n p
rocess a
bout
constru
ctio
n p
roje
cts
in yo
ur a
rea
MD
T e
fforts
to k
eep c
usto
mers
fully in
form
ed
MD
T re
sponsiv
eness to
custo
mer id
eas a
nd
concern
s
2009, Economic Development: Performance Grades for MDT
Stakeholder
Public

34
Security for System Components Economic development group respondents were asked to rate the security importance of
various transportation system components. Each component was rated on a scale from
1 – 5 where 1 is not at all important and 5 is extremely important.
Economic development stakeholders gave importance ratings that fell between extremely
important and somewhat important. Stakeholders rated inter-agency communication,
border crossings, emergency response plans and airports as the most important security
issues in 2009. Security at public transit facilities such as bus terminals received the
lowest security concerns.
Stakeholders’ ratings for importance relating to security were higher than the public
across most transportation areas.
Figure 26: 5 = Extremely Important
1.0
2.0
3.0
4.0
5.0
Com
munic
atio
n a
nd
coord
inatio
n w
ith
oth
er a
gencie
s
Hom
ela
nd s
ecurity
bord
er c
rossin
gs
Em
erg
ency re
sponse
pla
ns
Hom
ela
nd s
ecurity
airp
orts
Hom
ela
nd s
ecurity
inte
rsta
te h
ighw
ays
Com
munic
atio
n w
ith
the p
ublic
usin
g
availa
ble
advanced
technolo
gie
s
Hom
ela
nd s
ecurity
oth
er m
ajo
r hig
hw
ays
Connectiv
ity of
roadw
ays
Availa
bility o
f alte
rnativ
e ro
ute
s
Hom
ela
nd s
ecurity
public
transit fa
cilitie
s
like b
us te
rmin
als
2009, Economic Development: System Security Importance Rating
Stakeholder
Public

35
ENVIRONMENTAL STAKEHOLDER GROUP
This group is represented by various environmental interests from across Montana.
Stakeholders include representatives from:
• Wilderness coalitions
• Wildlife associations
• Audubon societies
• Preservation coalitions
• Sierra Club affiliates
• Resource centers
In 2009, 25 completed interviews were collected from members of the environmental
group compared to 21 responses collected in 2007.
Transportation System Satisfaction Environmental group respondents expressed neutral satisfaction with the transportation
system overall, giving it a mean rating of 5.4 on a 1 to 10 scale. This is significantly
lower than the public’s mean rating of 6.6 (see Figure 27). The 2009 environmental group
rating is lower than the 2007 rating (5.8).
Figure 27: 10 = High
1.0
2.0
3.0
4.0
5.0
6.0
7.0
8.0
9.0
10.0
Phys
ical c
onditio
n o
f airp
orts
Phys
ical c
onditio
n o
f inte
rsta
te h
ighw
ays
Phys
ical c
onditio
n o
f oth
er m
ajo
r hig
hw
ays
Phys
ical c
onditio
n o
f rest a
reas
Availa
bility o
f air tra
nsporta
tion to
destin
atio
ns o
uts
ide M
onta
na
Phys
ical c
onditio
n o
f city s
treets
Availa
bility o
f air tra
nsporta
tion to
destin
atio
ns w
ithin
Monta
na
Overa
ll sys
tem
Availa
bility o
f freig
ht ra
il serv
ice
Phys
ical c
onditio
n o
f bic
ycle
path
wa
ys
Phys
ical c
onditio
n o
f pedestria
n w
alk
ways
Availa
bility o
f local b
us o
r van s
erv
ice
Availa
bility o
f taxis
Phys
ical c
onditio
n o
f bus d
epots
Availa
bility o
f buses b
etw
een c
ities a
nd
tow
ns
Availa
bility o
f transit fo
r the e
lderly o
r dis
able
d
Availa
bility o
f passenger ra
il serv
ice
2009, Environmental: System Satisfaction
Stakeholder
Public

36
When asked about specific components of the transportation system, environmental
group members expressed satisfaction with 9 of 16 system components. They were most
satisfied with interstate highways and airports. Environmental group members expressed
dissatisfaction with bike pathways, pedestrian facilities, bus depots, local transit systems,
intercity bus service, transit for the elderly or disabled, and passenger rail service. This
group expressed less satisfaction than did the public with 11 specific system components.
Actions to Improve the Transportation System The highest priority (by a narrow margin) for improving components of the transportation
system among environmental group members was supporting efforts to preserve existing
rail passenger service (see Figure 28). The second highest rating went to promoting the
use of local transit systems, like buses or vans. These two items and three others were
rated as a “Very High Priority.” One item was rated as less than a ”Medium Priority”:
reducing traffic congestion by increasing system capacity. Environmental group members
rated 12 of 17 possible actions to improve the transportation system higher priority than
did the public. This group rated five items at least one full scale point higher in priority
relative to the public: reducing the air quality impacts of roadway use, ensuring adequate
bicycle facilities, promoting local transit, ensuring adequate pedestrian facilities, and
reducing the number of single occupant vehicles.
Figure 28: 5 = Very High
1.0
2.0
3.0
4.0
5.0
Supportin
g e
fforts
to p
reserv
e e
xis
ting
passenger ra
il serv
ice
Pro
motin
g th
e u
se o
f local tra
nsit s
yste
ms, lik
e
buses o
r vans
Ensurin
g a
dequate
bic
ycle
facilitie
s
Ensurin
g a
dequate
pedestria
n fa
cilitie
s (i.e
., sid
ew
alk
s, fo
otp
ath
s, c
rossin
gs)
Reducin
g th
e a
ir quality im
pacts
of ro
adw
ay
use
Atte
mptin
g to
reduce s
ingle
occupancy v
ehic
le
use
Keepin
g th
e p
ublic
info
rmed a
bout
transporta
tion is
sues
Impro
vin
g th
e p
hys
ical c
onditio
n o
f bus d
epots
Impro
vin
g tra
nsporta
tion s
afe
ty
Impro
vin
g th
e p
hys
ical c
onditio
n o
f oth
er ro
ads
and s
treets
Usin
g n
ew
technolo
gie
s lik
e e
lectro
nic
m
essage s
igns, w
ebsite
& ra
dio
update
s
Supportin
g e
fforts
to in
cre
ase th
e a
vaila
bility o
f schedule
d a
irline s
erv
ice
Impro
vin
g th
e p
hys
ical c
onditio
n o
f oth
er ro
ads
and s
treets
Regula
ting th
e n
um
ber o
f hig
hw
ay a
ppro
aches
and d
rivew
ays
to p
reserv
e tra
ns c
orrid
ors
Impro
vin
g re
st a
reas (i.e
. main
tenance, m
ore
fa
cilitie
s)
Impro
vin
g th
e p
hys
ical c
onditio
n o
f the
inte
rsta
tes a
nd m
ajo
r hig
hw
ays
Reducin
g tra
ffic c
ongestio
n b
y incre
asin
g th
e
capacity o
f the h
ighw
ay s
yste
m
2009, Environmental: System Priorities
Stakeholder
Public
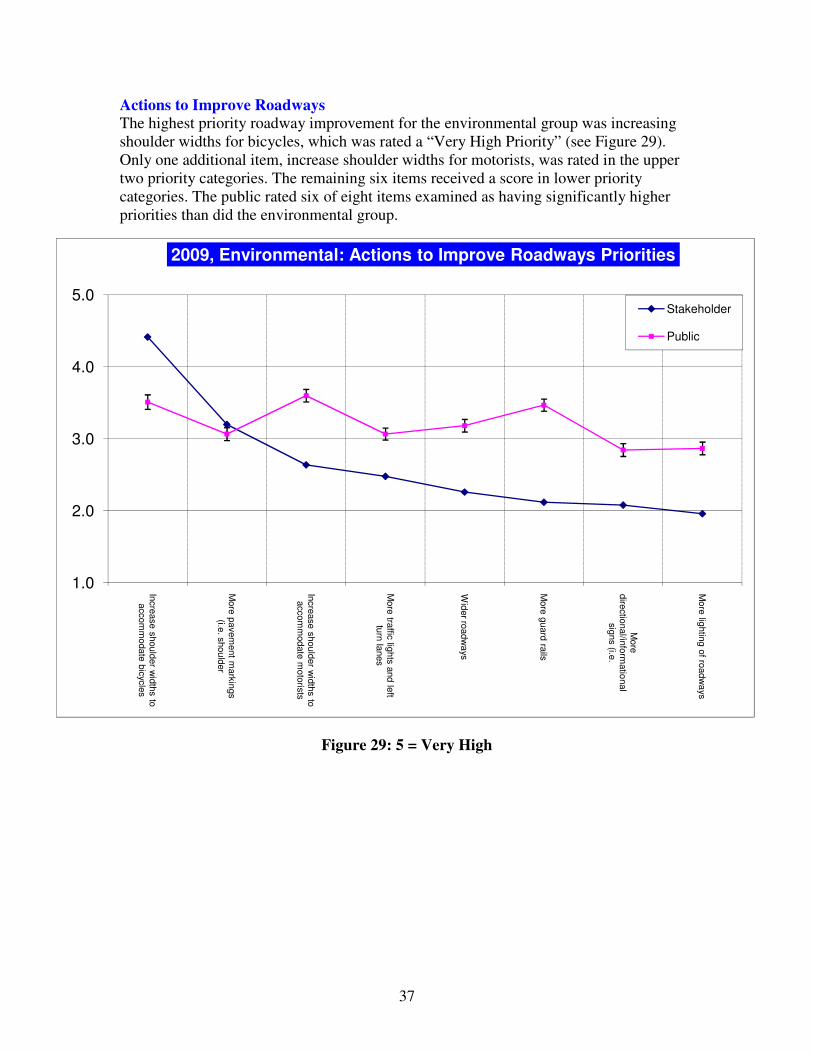
37
Actions to Improve Roadways The highest priority roadway improvement for the environmental group was increasing
shoulder widths for bicycles, which was rated a “Very High Priority” (see Figure 29).
Only one additional item, increase shoulder widths for motorists, was rated in the upper
two priority categories. The remaining six items received a score in lower priority
categories. The public rated six of eight items examined as having significantly higher
priorities than did the environmental group.
Figure 29: 5 = Very High
1.0
2.0
3.0
4.0
5.0
Incre
ase s
hould
er w
idth
s to
accom
modate
bic
ycle
s
More
pavem
ent m
ark
ings
(i.e. s
hould
er
Incre
ase s
hould
er w
idth
s to
accom
modate
moto
rists
More
traffic
lights
and le
ft tu
rn la
nes
Wid
er ro
adw
ays
More
guard
rails
More
dire
ctio
nal/in
form
atio
nal
sig
ns (i.e
.
More
lightin
g o
f roadw
ays
2009, Environmental: Actions to Improve Roadways Priorities
Stakeholder
Public

38
General Communication Tool Ratings The 2009 environmental stakeholders rated four tools just above somewhat useful:
electronic media, the MDT Web site, a toll-free call in telephone number, electronic
media, and newspapers. They also rated public meetings, surveys and public meetings as
slightly less than somewhat useful.
Both the public and environmental stakeholders rated the MDT Web site as somewhat
useful, with the public’s rating slightly higher than the stakeholder’s. The public found
television and radio more useful than did environmental stakeholders.
Figure 30: 5 = Extremely Useful
1.0
2.0
3.0
4.0
5.0
Website
Toll-fre
e c
all in
num
ber
Radio
and te
levis
ion
New
spapers
Public
meetin
gs in
your c
om
munity
Surv
eys
Specia
l mailin
gs (b
rochure
s, n
ew
sle
tters
, postc
ard
s, e
tc)
2009, Environmental: Communication Tool Rating
Stakeholder
Public

39
Planning and Project Communication Tool Ratings
MDT also asked environmental stakeholders to rate planning and project specific
communication tools (see Figure 31). Environmental stakeholders rated four of six tools
studied over somewhat useful. Environmental stakeholders gave their highest ratings to
maps and the Web site.
The public rated all but two of the items studied - brochures and newsletters - lower than
did environmental stakeholders.
Figure 31: 5 = Extremely Useful
1.0
2.0
3.0
4.0
5.0
Maps
Web s
ite
Pic
ture
s o
r gra
phic
s
Advanced te
chnolo
gy
Bro
chure
s
New
sle
tters
2009, Environmental: Planning and Project Communication Tool Ratings
Stakeholder
Public

40
MDT Customer Service and Performance Grades Environmental group grades ranged from B- to C- (see Figure 32). The public gave MDT
significantly higher grades than did the environmental group for seven of the eight
categories. Only the convenience of travel through construction zones was received a
higher grade from the environmental group.
Figure 32: 4 = A
0.0
1.0
2.0
3.0
4.0
Overa
ll convenie
nce o
f travel th
rough c
onstru
ctio
n
zones a
nd m
ain
tenance p
roje
cts
Overa
ll curre
nt q
uality o
f MD
T s
erv
ice c
om
pare
d w
ith
five ye
ars
ago
Curre
nt M
DT
quality o
f serv
ice
MD
T's
overa
ll perfo
rmance d
urin
g th
e p
ast ye
ar
MD
T p
ublic
notific
atio
n p
rocess a
bout c
onstru
ctio
n
pro
jects
in yo
ur a
rea
MD
T o
vera
ll quality o
f pla
nnin
g
MD
T e
fforts
to k
eep c
usto
mers
fully in
form
ed
MD
T re
sponsiv
eness to
custo
mer id
eas a
nd c
oncern
s
2009, Environmental: Performance Grades for MDT
Stakeholder
Public

41
Security for System Components Environmental group respondents were asked to rate the security importance of various
transportation system components. Each component was rated on a scale from 1 – 5
where 1 is not at all important and 5 is extremely important.
Environmental group stakeholders gave importance ratings that fell between very
important (4) and not very important (3). Stakeholders rated emergency response plans,
communication and coordination with other agencies, and communication with the public
most important. These stakeholders rated connectivity of roadways and availability of
alternative routes lowest in importance.
Stakeholders’ ratings for importance were significantly lower than those given by the
public for seven of the ten items examined.
Figure 33: 5 = Extremely Important
1.0
2.0
3.0
4.0
5.0
Em
erg
ency re
sponse p
lans
Com
munic
atio
n a
nd
coord
inatio
n w
ith o
ther
agencie
s
Com
munic
atio
n w
ith th
e
public
usin
g a
vaila
ble
advanced te
chnolo
gie
s
Hom
ela
nd s
ecurity b
ord
er
cro
ssin
gs
Hom
ela
nd s
ecurity a
irports
Hom
ela
nd s
ecurity
inte
rsta
te h
ighw
ays
Hom
ela
nd s
ecurity o
ther
majo
r hig
hw
ays
Hom
ela
nd s
ecurity p
ublic
tra
nsit fa
cilitie
s lik
e b
us
term
inals
Connectiv
ity of ro
adw
ays
Availa
bility o
f alte
rnativ
e
route
s
2009, Environmental: System Security Importance Rating
Stakeholder
Public

42
INTERMODAL FREIGHT STAKEHOLDER GROUP
This group is represented by various intermodal and freight interests from across
Montana. Stakeholders include representatives from:
• Trucking
• Air freight
• Rail freight
• Freight forwarding associations
In 2009, 46 completed interviews were collected from members of the Intermodal group
compared to 78 responses that were collected in 2007.
Transportation System Satisfaction Intermodal group respondents were moderately satisfied with the transportation system
overall, giving it a mean rating of 6.2 on a 1 to 10 scale. This is lower than the public’s
mean rating of 6.6 (see Figure 34). The 2009 rating is lower than the 2007 rating (6.54).
Figure 34: 10 = High
1.0
2.0
3.0
4.0
5.0
6.0
7.0
8.0
9.0
10.0
Phys
ical c
onditio
n o
f airp
orts
Phys
ical c
onditio
n o
f in
ters
tate
hig
hw
ays
Availa
bility o
f freig
ht ra
il serv
ice
Phys
ical c
onditio
n o
f oth
er
majo
r hig
hw
ays
Availa
bility o
f transit fo
r the
eld
erly o
r dis
able
d
Phys
ical c
onditio
n o
f bic
ycle
path
ways
Overa
ll sys
tem
Phys
ical c
onditio
n o
f pedestria
n w
alk
ways
Availa
bility o
f air
transporta
tion to
destin
atio
ns o
uts
ide …
Availa
bility o
f local b
us o
r van s
erv
ice
Availa
bility o
f taxis
Phys
ical c
onditio
n o
f rest
are
as
Availa
bility o
f buses
betw
een c
ities a
nd to
wns
Phys
ical c
onditio
n o
f city
stre
ets
Availa
bility o
f passenger ra
il serv
ice
Phys
ical c
onditio
n o
f bus
depots
Availa
bility o
f air
transporta
tion to
destin
atio
ns w
ithin
Monta
na
2009, Intermodal: System Satisfaction
Stakeholder Public
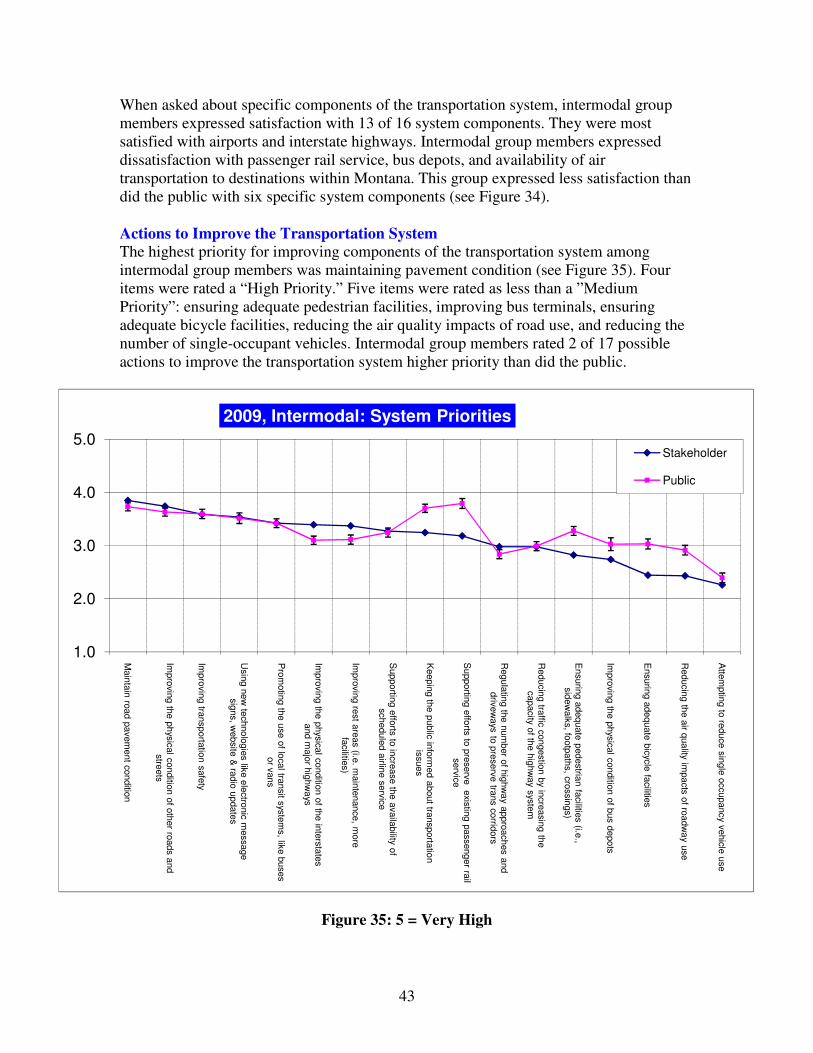
43
When asked about specific components of the transportation system, intermodal group
members expressed satisfaction with 13 of 16 system components. They were most
satisfied with airports and interstate highways. Intermodal group members expressed
dissatisfaction with passenger rail service, bus depots, and availability of air
transportation to destinations within Montana. This group expressed less satisfaction than
did the public with six specific system components (see Figure 34).
Actions to Improve the Transportation System The highest priority for improving components of the transportation system among
intermodal group members was maintaining pavement condition (see Figure 35). Four
items were rated a “High Priority.” Five items were rated as less than a ”Medium
Priority”: ensuring adequate pedestrian facilities, improving bus terminals, ensuring
adequate bicycle facilities, reducing the air quality impacts of road use, and reducing the
number of single-occupant vehicles. Intermodal group members rated 2 of 17 possible
actions to improve the transportation system higher priority than did the public.
Figure 35: 5 = Very High
1.0
2.0
3.0
4.0
5.0
Main
tain
road p
avem
ent c
onditio
n
Impro
vin
g th
e p
hys
ical c
onditio
n o
f oth
er ro
ads a
nd
stre
ets
Impro
vin
g tra
nsporta
tion s
afe
ty
Usin
g n
ew
technolo
gie
s lik
e e
lectro
nic
message
sig
ns, w
ebsite
& ra
dio
update
s
Pro
motin
g th
e u
se o
f local tra
nsit s
yste
ms, lik
e b
uses
or v
ans
Impro
vin
g th
e p
hys
ical c
onditio
n o
f the in
ters
tate
s
and m
ajo
r hig
hw
ays
Impro
vin
g re
st a
reas (i.e
. main
tenance, m
ore
fa
cilitie
s)
Supportin
g e
fforts
to in
cre
ase th
e a
vaila
bility o
f schedule
d a
irline s
erv
ice
Keepin
g th
e p
ublic
info
rmed a
bout tra
nsporta
tion
issues
Supportin
g e
fforts
to p
reserv
e e
xis
ting p
assenger ra
il serv
ice
Regula
ting th
e n
um
ber o
f hig
hw
ay a
ppro
aches a
nd
driv
ew
ays
to p
reserv
e tra
ns c
orrid
ors
Reducin
g tra
ffic c
ongestio
n b
y incre
asin
g th
e
capacity o
f the h
ighw
ay s
yste
m
Ensurin
g a
dequate
pedestria
n fa
cilitie
s (i.e
., sid
ew
alk
s, fo
otp
ath
s, c
rossin
gs)
Impro
vin
g th
e p
hys
ical c
onditio
n o
f bus d
epots
Ensurin
g a
dequate
bic
ycle
facilitie
s
Reducin
g th
e a
ir quality im
pacts
of ro
adw
ay u
se
Atte
mptin
g to
reduce s
ingle
occupancy v
ehic
le u
se
2009, Intermodal: System Priorities
Stakeholder
Public
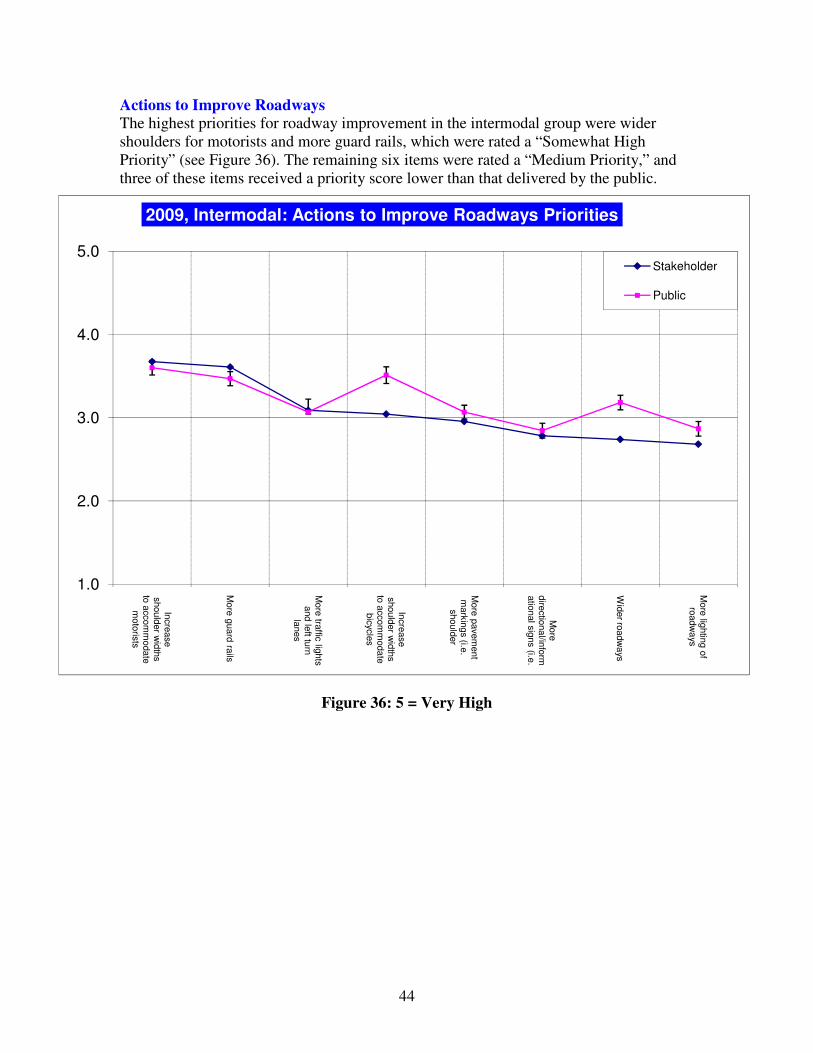
44
Actions to Improve Roadways The highest priorities for roadway improvement in the intermodal group were wider
shoulders for motorists and more guard rails, which were rated a “Somewhat High
Priority” (see Figure 36). The remaining six items were rated a “Medium Priority,” and
three of these items received a priority score lower than that delivered by the public.
Figure 36: 5 = Very High
1.0
2.0
3.0
4.0
5.0
Incre
ase
should
er w
idth
s
to a
ccom
modate
m
oto
rists
More
guard
rails
More
traffic
lights
and le
ft turn
la
nes
Incre
ase
should
er w
idth
s
to a
ccom
modate
bic
ycle
s
More
pavem
ent
mark
ings (i.e
. should
er
More
dire
ctio
nal/in
form
atio
nal s
igns (i.e
.
Wid
er ro
adw
ays
More
lightin
g o
f ro
adw
ays
2009, Intermodal: Actions to Improve Roadways Priorities
Stakeholder
Public

45
General Communication Tool Ratings The 2009 intermodal stakeholders rated two tools between somewhat useful and very
useful: electronic media and the MDT Web site (see Figure 37). They also rated
newspapers, the toll-free number, special mailings, and surveys as having less than
medium usefulness.
Intermodal stakeholders rated the MDT Web site higher than the public. The public found
television and radio more useful than did intermodal stakeholders.
Figure 37: 5 = Extremely Useful
1.0
2.0
3.0
4.0
5.0
Radio
and
tele
vis
ion
Website
Public
meetin
gs
in yo
ur
com
munity
New
spapers
Toll-fre
e c
all in
num
ber
Specia
l mailin
gs
(bro
chure
s,
new
sle
tters
, postc
ard
s, e
tc)
Surv
eys
2009, Intermodal: Communication Tool Rating
Stakeholder
Public

46
Planning and Project Communication Tool Ratings
MDT also asked intermodal stakeholders to rate planning and project specific
communication tools (see Figure 38). Intermodal stakeholders rated four of six tools
studied just over somewhat useful. Intermodal stakeholders gave their highest ratings to
maps, Web site, and pictures or graphics.
The public rated five of the items studied lower than did intermodal stakeholders: maps,
the MDT Web site, advanced technology, and pictures or graphics.
Figure 38: 5 = Extremely Useful
1.0
2.0
3.0
4.0
5.0
Maps
Web s
ite
Pic
ture
s o
r gra
phic
s
Advanced
technolo
gy
New
sle
tters
Bro
chure
s
2009, Intermodal: Planning and Project Communication Tool Ratings
Stakeholder
Public

47
MDT Customer Service and Performance Grades Intermodal group grades ranged from B- to C+ (see Figure 39). These closely paralleled
the publics’. In no instance were the differences between groups significant.
Figure 39: 4 = A
0.0
1.0
2.0
3.0
4.0
Overa
ll curre
nt q
uality o
f MD
T s
erv
ice c
om
pare
d w
ith
five ye
ars
ago
Curre
nt M
DT
quality o
f serv
ice
MD
T's
overa
ll perfo
rmance d
urin
g th
e p
ast ye
ar
MD
T o
vera
ll quality o
f pla
nnin
g
MD
T p
ublic
notific
atio
n p
rocess a
bout c
onstru
ctio
n
pro
jects
in yo
ur a
rea
Overa
ll convenie
nce o
f travel th
rough c
onstru
ctio
n
zones a
nd m
ain
tenance p
roje
cts
MD
T e
fforts
to k
eep c
usto
mers
fully in
form
ed
MD
T re
sponsiv
eness to
custo
mer id
eas a
nd c
oncern
s
2009, Intermodal: Performance Grades for MDT
Stakeholder
Public

48
Security for System Components Intermodal group respondents were asked to rate the security importance of various
transportation system components. Each component was rated on a scale from 1 – 5
where 1 is not at all important and 5 is extremely important.
Intermodal group stakeholders gave importance ratings that fell between extremely
important and medium importance. Stakeholders rated airports, emergency response
plans, border crossings, and communication with other agencies most important. The
2009 intermodal stakeholders rated availability of alternate routes lowest in importance.
Stakeholders’ ratings for importance paralleled those given by the public very closely on
seven of the ten measures. There is little practical meaning in the small statistical
differences between the stakeholders’ ratings and the publics’ with the exception of
intermodal stakeholders’ lower importance rating for the availability of alternative routes;
security of public transit facilities; and security of other major highways.
Figure 40: 5 = Extremely Important
1.0
2.0
3.0
4.0
5.0
Hom
ela
nd s
ecurity
airp
orts
Em
erg
ency
response p
lans
Hom
ela
nd s
ecurity
bord
er c
rossin
gs
Com
munic
atio
n a
nd
coord
inatio
n w
ith
oth
er a
gencie
s
Com
munic
atio
n w
ith
the p
ublic
usin
g
availa
ble
advanced
technolo
gie
s
Connectiv
ity of
roadw
ays
Hom
ela
nd s
ecurity
inte
rsta
te h
ighw
ays
Hom
ela
nd s
ecurity
oth
er m
ajo
r hig
hw
ays
Hom
ela
nd s
ecurity
public
transit
facilitie
s lik
e b
us
term
inals
Availa
bility o
f alte
rnativ
e ro
ute
s
2009, Intermodal: System Security Importance Rating
Stakeholder
Public

49
CITIES AND TOWNS STAKEHOLDER GROUP
This group consists of mayors and chief executives from across Montana. In 2009, 83
completed interviews were collected from members of the cities and towns group
compared to 105 responses that were collected in 2007.
Transportation System Satisfaction Cities and towns group respondents were moderately satisfied with the transportation
system overall, giving it a mean rating of 6.44 on a 1 to 10 scale. This is statistically
equal to the public’s mean rating of 6.6 (see Figure 41). The 2009 rating is essentially
identical to the 2007 rating (6.54).
Figure 41: 10 = High
1.0
2.0
3.0
4.0
5.0
6.0
7.0
8.0
9.0
10.0
Phys
ical c
onditio
n o
f airp
orts
Phys
ical c
onditio
n o
f in
ters
tate
hig
hw
ays
Phys
ical c
onditio
n o
f oth
er
majo
r hig
hw
ays
Phys
ical c
onditio
n o
f rest
are
as
Overa
ll sys
tem
Availa
bility o
f air
transporta
tion to
destin
atio
ns o
uts
ide …
Phys
ical c
onditio
n o
f pedestria
n w
alk
ways
Availa
bility o
f freig
ht ra
il serv
ice
Phys
ical c
onditio
n o
f bic
ycle
path
wa
ys
Availa
bility o
f transit fo
r the
eld
erly o
r dis
able
d
Phys
ical c
onditio
n o
f city
stre
ets
Availa
bility o
f air
transporta
tion to
destin
atio
ns w
ithin
…
Phys
ical c
onditio
n o
f bus
depots
Availa
bility o
f local b
us o
r van s
erv
ice
Availa
bility o
f passenger
rail s
erv
ice
Availa
bility o
f buses
betw
een c
ities a
nd to
wns
Availa
bility o
f taxis
2009, Cities and Towns: System Satisfaction
Stakeholder
Public

50
When asked about specific components of the transportation system, cities and towns
group members expressed satisfaction with 11 of 16 system components. They were most
satisfied with interstate highways and airports. Cities and towns group members
expressed dissatisfaction with passenger rail, local transit systems, taxis, and intercity bus
service. This group expressed less satisfaction than did the public with ten specific
system components.
Actions to Improve the Transportation System The highest five priorities for improving components of the transportation system among
cities and towns group members were, improving the physical condition of other roads
and streets, keeping the public informed about transportation issues, maintaining
pavement condition, and improving transportation safety (see Figure 42). Promoting the
use of existing rail service was rated just over a “High Priority.” Three items were rated
as less than a “Medium Priority”. Cities and towns group members rated seven possible
actions to improve the transportation system a higher priority than did the public.
Figure 42: 5 = Very High
1.0
2.0
3.0
4.0
5.0
Supportin
g e
fforts
to p
reserv
e e
xis
ting
passenger ra
il serv
ice
Impro
vin
g th
e p
hys
ical c
onditio
n o
f oth
er
roads a
nd s
treets
Keepin
g th
e p
ublic
info
rmed a
bout
transporta
tion is
sues
Main
tain
road p
avem
ent c
onditio
n
Impro
vin
g tra
nsporta
tion s
afe
ty
Pro
motin
g th
e u
se o
f local tra
nsit s
yste
ms,
like b
uses o
r vans
Usin
g n
ew
technolo
gie
s lik
e e
lectro
nic
m
essage s
igns, w
ebsite
& ra
dio
update
s
Ensurin
g a
dequate
pedestria
n fa
cilitie
s
(i.e., s
idew
alk
s, fo
otp
ath
s, c
rossin
gs)
Supportin
g e
fforts
to in
cre
ase th
e
availa
bility o
f schedule
d a
irline s
erv
ice
Impro
vin
g re
st a
reas (i.e
. main
tenance,
more
facilitie
s)
Impro
vin
g th
e p
hys
ical c
onditio
n o
f the
inte
rsta
tes a
nd m
ajo
r hig
hw
ays
Regula
ting th
e n
um
ber o
f hig
hw
ay
appro
aches a
nd d
rivew
ays
to p
reserv
e
trans c
orrid
ors
Impro
vin
g th
e p
hys
ical c
onditio
n o
f bus
depots
Reducin
g tra
ffic c
ongestio
n b
y incre
asin
g
the c
apacity o
f the h
ighw
ay s
yste
m
Ensurin
g a
dequate
bic
ycle
facilitie
s
Reducin
g th
e a
ir quality im
pacts
of
roadw
ay u
se
Atte
mptin
g to
reduce s
ingle
occupancy
vehic
le u
se
2009, Cities and Towns: System Priorities
Stakeholder
Public

51
Actions to Improve Roadways The highest priority for roadway improvement among the cities and towns group was
widening shoulders for motorists, which was rated a “Somewhat High Priority” (see
Figure 43). Only one of these eight items, wider roadways, received a priority score
lower than that delivered by the public.
Figure 43: 5 = Very High
1.0
2.0
3.0
4.0
5.0
Incre
ase
should
er w
idth
s
to a
ccom
modate
m
oto
rists
Incre
ase
should
er w
idth
s
to a
ccom
modate
bic
ycle
s
More
guard
rails
Wid
er ro
adw
ays
More
pavem
ent
mark
ings (i.e
. should
er
More
traffic
lig
hts
and le
ft tu
rn la
nes
More
lightin
g o
f ro
adw
ays
More
dire
ctio
nal/in
for
matio
nal s
igns
(i.e.
2009, Cities and Towns: Actions to Improve Roadways Priorities
Stakeholder
Public

52
General Communication Tool Ratings The 2009 city and town stakeholders rated all seven tools examined between somewhat
useful and very useful (see Figure 44). Both stakeholders and the public gave television
and radio their highest ratings. City and town stakeholders rated all tools as more useful
than did the public.
Figure 44: 5 = Extremely Useful
1.0
2.0
3.0
4.0
5.0
Radio
and
tele
vis
ion
Public
m
eetin
gs in
yo
ur
com
munity
Website
New
spapers
Toll-fre
e c
all in
num
ber
Surv
eys
Specia
l m
ailin
gs
(bro
chure
s,
new
sle
tters
, postc
ard
s, e
tc)
2009, Cities and Towns: Communication Tool Rating
Stakeholder
Public

53
Planning and Project Communication Tool Ratings
MDT also asked city and town stakeholders to rate planning and project specific
communication tools (see Figure 45). City and town stakeholders rated each of the six
tools studied just over somewhat useful. Stakeholders gave their highest ratings to maps
and pictures or graphics.
These scores are all higher than the general public, which rated only two of the items
studied higher than somewhat useful.
Figure 45: 5 = Extremely Useful
1.0
2.0
3.0
4.0
5.0
Maps
Pic
ture
s o
r gra
phic
s
Advanced
technolo
gy
Bro
chure
s
New
sle
tters
Web s
ite
2009, Cities and Towns: Planning and Project Communication Tool Ratings
Stakeholder
Public

54
MDT Customer Service and Performance Grades
City and town group grades ranged from B+ to C+ (see Figure 46). These closely
paralleled the publics’. In no instance did the difference between groups have statistical
significance.
Figure 46: 4 = A
0.0
1.0
2.0
3.0
4.0
Overa
ll curre
nt q
uality o
f MD
T s
erv
ice
com
pare
d w
ith fiv
e ye
ars
ago
Curre
nt M
DT
quality o
f serv
ice
MD
T's
overa
ll perfo
rmance d
urin
g th
e p
ast
year
MD
T p
ublic
notific
atio
n p
rocess a
bout
constru
ctio
n p
roje
cts
in yo
ur a
rea
Overa
ll convenie
nce o
f travel th
rough
constru
ctio
n z
ones a
nd m
ain
tenance
pro
jects
MD
T e
fforts
to k
eep c
usto
mers
fully
info
rmed
MD
T o
vera
ll quality o
f pla
nnin
g
MD
T re
sponsiv
eness to
custo
mer id
eas
and c
oncern
s
2009, Cities and Towns: Performance Grades for MDT
Stakeholder
Public

55
Security for System Components City and town group respondents were asked to rate the security importance of various
transportation system components. Each component was rated on a scale from 1 – 5
where 1 is not at all important and 5 is extremely important.
City and town group stakeholders gave importance ratings that fell between extremely
important and somewhat important. Stakeholders’ ratings for importance paralleled those
given by the public. However, city and town stakeholders rated six of the ten items as
more important than did the public.
Figure 47: 5 = Extremely Important
1.0
2.0
3.0
4.0
5.0
Com
munic
atio
n a
nd
coord
inatio
n w
ith o
ther
agencie
s
Em
erg
ency re
sponse
pla
ns
Hom
ela
nd s
ecurity
bord
er c
rossin
gs
Com
munic
atio
n w
ith
the p
ublic
usin
g
availa
ble
advanced
technolo
gie
s
Hom
ela
nd s
ecurity
inte
rsta
te h
ighw
ays
Hom
ela
nd s
ecurity
airp
orts
Hom
ela
nd s
ecurity
oth
er m
ajo
r hig
hw
ays
Connectiv
ity of
roadw
ays
Availa
bility o
f alte
rnativ
e ro
ute
s
Hom
ela
nd s
ecurity
public
transit fa
cilitie
s
like b
us te
rmin
als
2009, Cities and Towns: System Security Importance Rating
Stakeholder
Public

56
COUNTIES STAKEHOLDER GROUP
This group consists of county commission chairpersons from across Montana. In 2009,
43 completed interviews were collected from members of the counties group compared to
55 responses that were collected in 2007.
Transportation System Satisfaction Counties group respondents were moderately satisfied with the transportation system
overall, giving it a mean rating of 6.69 on a 1 to 10 scale. This is equal to the public’s
mean rating of 6.6 (see Figure 48). The 2009 rating is higher than this group’s 2007
rating (6.54).
Figure 48: 10 = High
1.0
2.0
3.0
4.0
5.0
6.0
7.0
8.0
9.0
10.0
Phys
ical c
onditio
n o
f airp
orts
Phys
ical c
onditio
n o
f inte
rsta
te h
ighw
ays
Phys
ical c
onditio
n o
f bic
ycle
path
wa
ys
Phys
ical c
onditio
n o
f oth
er m
ajo
r hig
hw
ays
Phys
ical c
onditio
n o
f pedestria
n w
alk
ways
Phys
ical c
onditio
n o
f rest a
reas
Overa
ll sys
tem
Availa
bility o
f air tra
nsporta
tion to
destin
atio
ns
outs
ide M
onta
na
Availa
bility o
f transit fo
r the e
lderly o
r dis
able
d
Availa
bility o
f freig
ht ra
il serv
ice
Phys
ical c
onditio
n o
f city s
treets
Phys
ical c
onditio
n o
f bus d
epots
Availa
bility o
f air tra
nsporta
tion to
destin
atio
ns
with
in M
onta
na
Availa
bility o
f local b
us o
r van s
erv
ice
Availa
bility o
f passenger ra
il serv
ice
Availa
bility o
f buses b
etw
een c
ities a
nd to
wns
Availa
bility o
f taxis
2009, Counties: System Satisfaction
Stakeholder
Public

57
When asked about specific components of the transportation system, counties group
members expressed satisfaction with 11 of 16 system components. They were most
satisfied with interstate highways and airports. Counties group members expressed
dissatisfaction with passenger rail service, local transit service, taxis, and intercity bus
service. This group expressed less satisfaction than did the public with five specific
system components.
Actions to Improve the Transportation System The highest priority for improving components of the transportation system among
counties group members was improving the physical condition of roads and streets
(see Figure 49). This item was rated a “High Priority.” Four items were rated as less
than a ”Medium Priority”: regulating the number of highway approaches, adequate bike
facilities, reducing the air quality impact of roadway use, and reducing the number of
single occupant vehicles. Counties group members rated five possible actions to improve
the transportation system a higher priority than did the public. This group rated no items
at least one full scale point higher in priority than did the public; their priorities closely
paralleled those of the public. However, ensuring adequate bicycle facilities and reducing
the air quality impact of roadway use were significantly higher priorities for the public
than they were for the county stakeholders.
Figure 49: 5 = Very High
1.0
2.0
3.0
4.0
5.0
Impro
vin
g th
e p
hys
ical c
onditio
n o
f oth
er ro
ads
and s
treets
Main
tain
road p
avem
ent c
onditio
n
Supportin
g e
fforts
to p
reserv
e e
xis
ting
passenger ra
il serv
ice
Impro
vin
g tra
nsporta
tion s
afe
ty
Pro
motin
g th
e u
se o
f local tra
nsit s
yste
ms, lik
e
buses o
r vans
Supportin
g e
fforts
to in
cre
ase th
e a
vaila
bility o
f schedule
d a
irline s
erv
ice
Impro
vin
g th
e p
hys
ical c
onditio
n o
f the
inte
rsta
tes a
nd m
ajo
r hig
hw
ays
Keepin
g th
e p
ublic
info
rmed a
bout tra
nsporta
tion
issues
Usin
g n
ew
technolo
gie
s lik
e e
lectro
nic
message
sig
ns, w
ebsite
& ra
dio
update
s
Impro
vin
g re
st a
reas (i.e
. main
tenance, m
ore
fa
cilitie
s)
Impro
vin
g th
e p
hys
ical c
onditio
n o
f bus d
epots
Reducin
g tra
ffic c
ongestio
n b
y incre
asin
g th
e
capacity o
f the h
ighw
ay s
yste
m
Ensurin
g a
dequate
pedestria
n fa
cilitie
s (i.e
., sid
ew
alk
s, fo
otp
ath
s, c
rossin
gs)
Regula
ting th
e n
um
ber o
f hig
hw
ay a
ppro
aches
and d
rivew
ays
to p
reserv
e tra
ns c
orrid
ors
Ensurin
g a
dequate
bic
ycle
facilitie
s
Reducin
g th
e a
ir quality im
pacts
of ro
adw
ay u
se
Atte
mptin
g to
reduce s
ingle
occupancy v
ehic
le
use
2009, Counties: System Priorities
Stakeholder
Public

58
Actions to Improve Roadways The highest priority roadway improvements for the counties group were more guard rails
and widening shoulders for motorists (see Figure 50). The remaining six items were rated
a “Medium Priority”, and none of these items received a priority score lower than that
delivered by the public. Increasing shoulder widths to accommodate bicycles are a
significantly higher priority for the public than they are for county stakeholders.
Figure 50: 5 = Very High
1.0
2.0
3.0
4.0
5.0
More
guard
rails
Incre
ase s
hould
er w
idth
s to
accom
modate
m
oto
rists
More
traffic
lights
and le
ft turn
lanes
More
pavem
ent m
ark
ings (i.e
. should
er
Wid
er ro
adw
ays
Incre
ase s
hould
er w
idth
s to
accom
modate
bic
ycle
s
More
dire
ctio
nal/in
form
atio
nal s
igns (i.e
.
More
lightin
g o
f roadw
ays
2009, Counties: Actions to Improve Roadways Priorities
Stakeholder
Public

59
General Communication Tool Ratings The 2009 county stakeholders rated six tools between somewhat useful and very useful.
County stakeholders rated public meetings, the MDT Web site, surveys, the toll-free
number, and newspapers just higher than somewhat useful, while the public rated the
items lower.
Figure 51: 5 = Extremely Useful
1.0
2.0
3.0
4.0
5.0
Radio
and
tele
vis
ion
Public
meetin
gs
in yo
ur
com
munity
Website
Toll-fre
e c
all in
num
ber
New
spapers
Specia
l mailin
gs
(bro
chure
s,
new
sle
tters
, postc
ard
s, e
tc)
Surv
eys
2009, Counties: Communication Tool Rating
Stakeholder
Public

60
Planning and Project Communication Tool Ratings
MDT also asked county stakeholders to rate planning and project specific communication
tools (see Figure 52). County stakeholders rated maps in the very useful range, with
pictures and graphics slightly lower. The other four tools were rated in the “useful”
range.
County stakeholders rated all six of the items studied higher than did the general public.
Figure 52: 5 = Extremely Useful
1.0
2.0
3.0
4.0
5.0
Maps
Pic
ture
s o
r gra
phic
s
Web s
ite
Advanced te
chnolo
gy
Bro
chure
s
New
sle
tters
2009, Counties: Planning and Project Communication Tool Ratings
Stakeholder
Public

61
MDT Customer Service and Performance Grades
County group grades ranged from B+ to B- (see Figure 53). These closely paralleled the
publics’, but were somewhat higher across the board.
Figure 53: 4 = A
0.0
1.0
2.0
3.0
4.0
Overa
ll curre
nt q
uality o
f MD
T s
erv
ice c
om
pare
d w
ith fiv
e
years
ago
Curre
nt M
DT
quality o
f serv
ice
MD
T p
ublic
notific
atio
n p
rocess a
bout c
onstru
ctio
n
pro
jects
in yo
ur a
rea
MD
T e
fforts
to k
eep c
usto
mers
fully in
form
ed
MD
T's
overa
ll perfo
rmance d
urin
g th
e p
ast ye
ar
Overa
ll convenie
nce o
f travel th
rough c
onstru
ctio
n z
ones
and m
ain
tenance p
roje
cts
MD
T re
sponsiv
eness to
custo
mer id
eas a
nd c
oncern
s
MD
T o
vera
ll quality o
f pla
nnin
g
2009, Counties: Performance Grades for MDT
Stakeholder
Public

62
Security for System Components County group respondents were asked to rate the security importance of various
transportation system components. Each component was rated on a scale from 1 – 5
where 1 is not at all important and 5 is extremely important.
County group stakeholders gave importance ratings that fell between extremely important
and somewhat important. Seven of the ten measures scored in the “extremely important”
range. The 2009 stakeholders rated availability of alternate routes and public facilities
like bus terminals lower in importance than other categories.
Stakeholders’ ratings for importance were higher than the general public’s in five of the
ten measures. There is little practical meaning in the small statistical differences between
the stakeholders’ ratings and the publics’, though, in general, county group stakeholders
rated security for system components higher than did the public.
Figure 54: 5 = Extremely Important
1.0
2.0
3.0
4.0
5.0
Hom
ela
nd s
ecurity b
ord
er c
rossin
gs
Hom
ela
nd s
ecurity in
ters
tate
hig
hw
ays
Em
erg
ency re
sponse p
lans
Com
munic
atio
n w
ith th
e p
ublic
usin
g a
vaila
ble
advanced te
chnolo
gie
s
Com
munic
atio
n a
nd c
oord
inatio
n w
ith o
ther a
gencie
s
Hom
ela
nd s
ecurity o
ther m
ajo
r hig
hw
ays
Hom
ela
nd s
ecurity a
irports
Connectiv
ity of ro
adw
ays
Availa
bility o
f alte
rnativ
e ro
ute
s
Hom
ela
nd s
ecurity p
ublic
transit fa
cilitie
s lik
e b
us
term
inals
2009, Counties: System Security Importance Rating
Stakeholder
Public

63
PASSENGER TRANSPORTATION STAKEHOLDER GROUP
This group is represented by various passenger transportation interests from across
Montana. Stakeholders include representatives from:
• Public transit agencies
• Social service agencies
• Intercity bus agencies
• Rail passenger interests
• Air passenger interests
In 2009, 70 completed interviews with passenger transportation group members were
obtained compared to 113 interviews that were obtained in 2007.
Transportation System Satisfaction Passenger transportation group respondents were moderately satisfied with the
transportation system overall, giving it a mean rating of 6.17 on a 1 to 10 scale. This is
lower than the public’s mean rating of 6.6 (see Figure 55). The 2009 rating is lower than
the 2007 rating (6.61).
Figure 55: 10 = High
1.0
2.0
3.0
4.0
5.0
6.0
7.0
8.0
9.0
10.0
Phys
ical c
onditio
n o
f airp
orts
Phys
ical c
onditio
n o
f inte
rsta
te h
ighw
ays
Phys
ical c
onditio
n o
f rest a
reas
Phys
ical c
onditio
n o
f bic
ycle
path
wa
ys
Phys
ical c
onditio
n o
f oth
er m
ajo
r hig
hw
ays
Overa
ll sys
tem
Phys
ical c
onditio
n o
f pedestria
n w
alk
ways
Availa
bility o
f transit fo
r the e
lderly o
r dis
able
d
Availa
bility o
f air tra
nsporta
tion to
destin
atio
ns
outs
ide M
onta
na
Availa
bility o
f local b
us o
r van s
erv
ice
Availa
bility o
f freig
ht ra
il serv
ice
Phys
ical c
onditio
n o
f city s
treets
Phys
ical c
onditio
n o
f bus d
epots
Availa
bility o
f taxis
Availa
bility o
f air tra
nsporta
tion to
destin
atio
ns
with
in M
onta
na
Availa
bility o
f passenger ra
il serv
ice
Availa
bility o
f buses b
etw
een c
ities a
nd to
wns
2009, Passengers: System Satisfaction
Stakeholder
Public

64
When asked about specific components of the transportation system, passenger
transportation group members expressed satisfaction with 11 of 16 system components.
They were most satisfied with airports and interstate highways. Passenger transportation
group members expressed dissatisfaction with promoting use of existing passenger rail
service, bus depots, taxis, intercity bus service, and the availability of transportation to
destinations within Montana. This group expressed less satisfaction than did the public
with 9 specific system components.
Actions to Improve the Transportation System The highest priority for improving components of the transportation system among
passenger transportation group members was supporting efforts to preserve existing
passenger rail service (see Figure 56). This item was rated a “Very High” priority, as was
promoting the use of local transit. Two items were rated as less than ”Medium Priority”.
Passenger transportation group members rated 8 of the 17 possible actions to improve the
transportation system higher priority than did the public.
This group rated no items at least one full scale point higher in priority than did the
public; however, the passenger group rated promoting local transit systems significantly
higher than the public.
Figure 56: 5 = Very High
1.0
2.0
3.0
4.0
5.0
Supportin
g e
fforts
to p
reserv
e e
xis
ting
passenger ra
il serv
ice
Pro
motin
g th
e u
se o
f local tra
nsit s
yste
ms, lik
e
buses o
r vans
Main
tain
road p
avem
ent c
onditio
n
Impro
vin
g th
e p
hys
ical c
onditio
n o
f oth
er ro
ads
and s
treets
Keepin
g th
e p
ublic
info
rmed a
bout tra
nsporta
tion
issues
Impro
vin
g tra
nsporta
tion s
afe
ty
Usin
g n
ew
technolo
gie
s lik
e e
lectro
nic
message
sig
ns, w
ebsite
& ra
dio
update
s
Supportin
g e
fforts
to in
cre
ase th
e a
vaila
bility o
f schedule
d a
irline s
erv
ice
Impro
vin
g th
e p
hys
ical c
onditio
n o
f bus d
epots
Ensurin
g a
dequate
pedestria
n fa
cilitie
s (i.e
., sid
ew
alk
s, fo
otp
ath
s, c
rossin
gs)
Impro
vin
g th
e p
hys
ical c
onditio
n o
f the
inte
rsta
tes a
nd m
ajo
r hig
hw
ays
Regula
ting th
e n
um
ber o
f hig
hw
ay a
ppro
aches
and d
rivew
ays
to p
reserv
e tra
ns c
orrid
ors
Impro
vin
g re
st a
reas (i.e
. main
tenance, m
ore
fa
cilitie
s)
Ensurin
g a
dequate
bic
ycle
facilitie
s
Reducin
g tra
ffic c
ongestio
n b
y incre
asin
g th
e
capacity o
f the h
ighw
ay s
yste
m
Atte
mptin
g to
reduce s
ingle
occupancy v
ehic
le
use
Reducin
g th
e a
ir quality im
pacts
of ro
adw
ay u
se
2009, Passengers: System Priorities
Stakeholder
Public

65
Actions to Improve Roadways The highest priority roadway improvement for the passenger transportation group was
more guard rails (see Figure 57). The passenger stakeholder group’s ratings very closely
matched those of the public.
Figure 57: 5 = Very High
1.0
2.0
3.0
4.0
5.0
More
guard
rails
Incre
ase s
hould
er
wid
ths to
accom
modate
m
oto
rists
Incre
ase s
hould
er
wid
ths to
accom
modate
bic
ycle
s
More
traffic
lights
and
left tu
rn la
nes
Wid
er ro
adw
ays
More
pavem
ent
mark
ings (i.e
. should
er
More
dire
ctio
nal/in
form
atio
nal s
igns (i.e
.
More
lightin
g o
f ro
adw
ays
2009, Passengers: Actions to Improve Roadways Priorities
Stakeholder
Public

66
General Communication Tool Ratings The 2009 passenger stakeholders rated three tools between somewhat useful and very
useful: electronic media, the MDT Web site, and the toll-free number. They also rated
public meetings, a toll-free call in telephone number, special mailings, and surveys
slightly lower, in the “somewhat useful” range.
Passenger stakeholders rated the MDT Web site higher than somewhat useful, while the
public rated the item at or below somewhat useful. The public found television and radio
more useful than did passenger stakeholders.
Figure 58: 5 = Extremely Useful
1.0
2.0
3.0
4.0
5.0
Website
Radio
and
tele
vis
ion
Toll-fre
e c
all in
num
ber
New
spapers
Public
meetin
gs
in yo
ur
com
munity
Specia
l mailin
gs
(bro
chure
s,
new
sle
tters
, postc
ard
s, e
tc)
Surv
eys
2009, Passengers: Communication Tool Rating
Stakeholder
Public
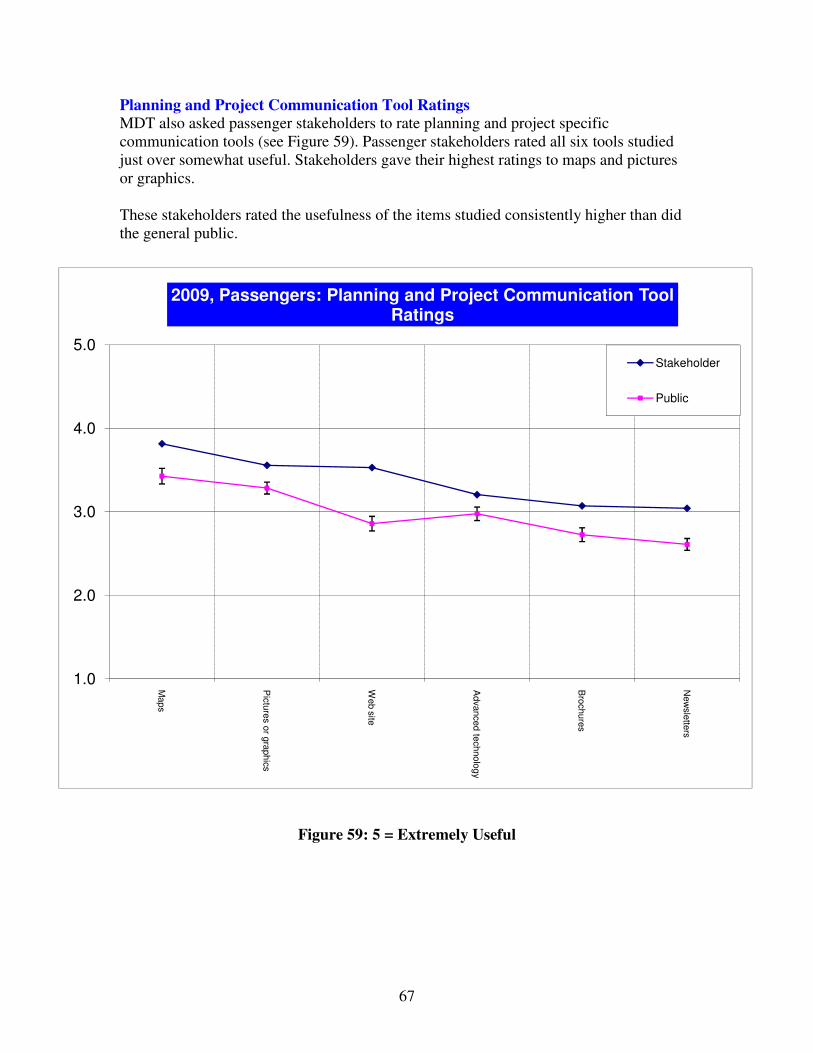
67
Planning and Project Communication Tool Ratings
MDT also asked passenger stakeholders to rate planning and project specific
communication tools (see Figure 59). Passenger stakeholders rated all six tools studied
just over somewhat useful. Stakeholders gave their highest ratings to maps and pictures
or graphics.
These stakeholders rated the usefulness of the items studied consistently higher than did
the general public.
Figure 59: 5 = Extremely Useful
1.0
2.0
3.0
4.0
5.0
Maps
Pic
ture
s o
r gra
phic
s
Web s
ite
Advanced te
chnolo
gy
Bro
chure
s
New
sle
tters
2009, Passengers: Planning and Project Communication Tool Ratings
Stakeholder
Public
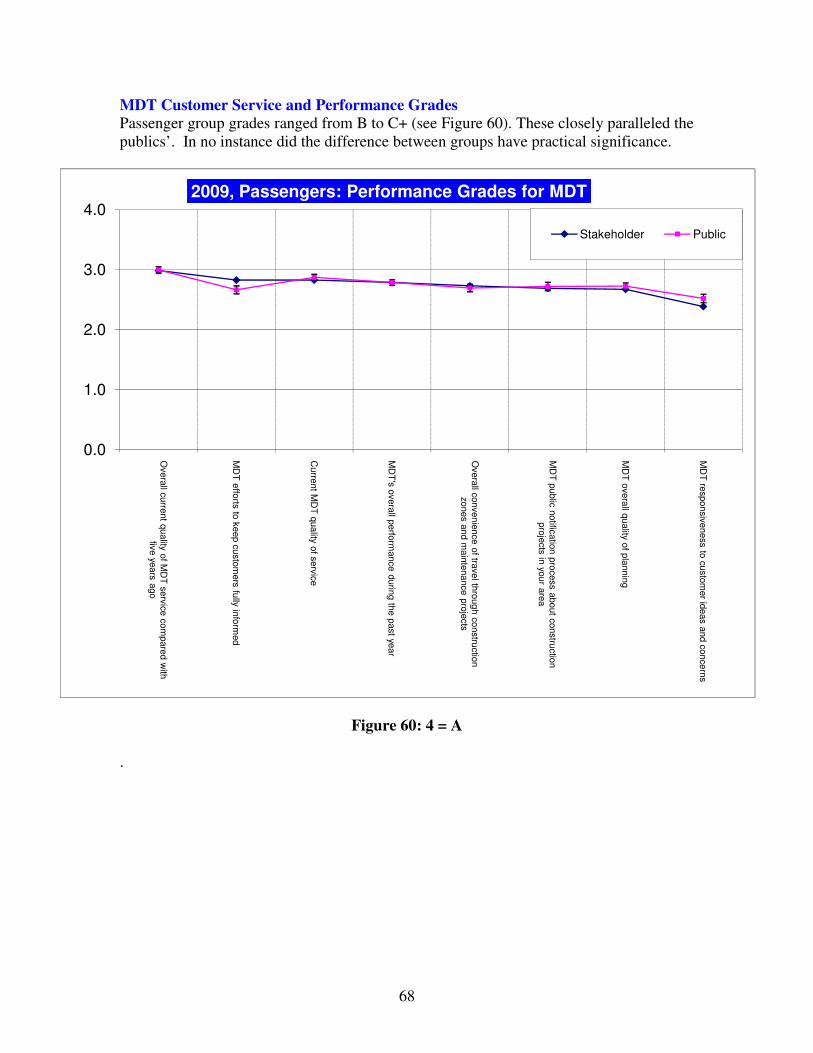
68
MDT Customer Service and Performance Grades
Passenger group grades ranged from B to C+ (see Figure 60). These closely paralleled the
publics’. In no instance did the difference between groups have practical significance.
Figure 60: 4 = A
.
0.0
1.0
2.0
3.0
4.0
Overa
ll curre
nt q
uality o
f MD
T s
erv
ice c
om
pare
d w
ith
five ye
ars
ago
MD
T e
fforts
to k
eep c
usto
mers
fully in
form
ed
Curre
nt M
DT
quality o
f serv
ice
MD
T's
overa
ll perfo
rmance d
urin
g th
e p
ast ye
ar
Overa
ll convenie
nce o
f travel th
rough c
onstru
ctio
n
zones a
nd m
ain
tenance p
roje
cts
MD
T p
ublic
notific
atio
n p
rocess a
bout c
onstru
ctio
n
pro
jects
in yo
ur a
rea
MD
T o
vera
ll quality o
f pla
nnin
g
MD
T re
sponsiv
eness to
custo
mer id
eas a
nd c
oncern
s
2009, Passengers: Performance Grades for MDT
Stakeholder Public

69
Security for System Components Passenger group respondents were asked to rate the security importance of various
transportation system components. Each component was rated on a scale from 1 – 5
where 1 is not at all important and 5 is extremely important.
Passenger group stakeholders gave importance ratings that fell between extremely
important and somewhat important. Stakeholders rated airports, coordinating with other
agencies, border crossings, and emergency response plans most important. The 2009
passenger stakeholders rated availability of alternate routes lowest in importance.
Stakeholders’ ratings for importance paralleled those given by the public, and were
generally higher. There is little practical meaning in the small statistical differences
between the stakeholders’ ratings and the publics’.
Figure 61: 5 = Extremely Important
1.0
2.0
3.0
4.0
5.0
Hom
ela
nd s
ecurity
bord
er c
rossin
gs
Em
erg
ency re
sponse
pla
ns
Com
munic
atio
n a
nd
coord
inatio
n w
ith o
ther
agencie
s
Hom
ela
nd s
ecurity
airp
orts
Hom
ela
nd s
ecurity
inte
rsta
te h
ighw
ays
Com
munic
atio
n w
ith
the p
ublic
usin
g
availa
ble
advanced
technolo
gie
s
Hom
ela
nd s
ecurity
oth
er m
ajo
r hig
hw
ays
Connectiv
ity of
roadw
ays
Hom
ela
nd s
ecurity
public
transit fa
cilitie
s
like b
us te
rmin
als
Availa
bility o
f alte
rnativ
e ro
ute
s
2009, Passengers: System Security Importance Rating
Stakeholder
Public

70
STATE AND FEDERAL GOVERNMENT STAKEHOLDER GROUP
This group is represented by non-elected state and federal government officials from
across Montana. Stakeholders include (but are not limited to) representatives from:
• Montana Department of Commerce
• Montana Department of Environmental Quality
• Montana Department of Justice (Highway Patrol)
• Montana Department of Natural Resources and Conservation
• Federal Highway Administration
• Federal Aviation Administration
• U.S. Forest Service
• U.S. Environmental Protection Agency
In 2009 19 completed interviews with state and federal government group members were
obtained compared to 25 interviews that were obtained in 2007.
Transportation System Satisfaction State and federal government group respondents were moderately satisfied with the
transportation system overall, giving it a mean rating of 6.6 on a 1 to 10 scale.
Figure 62: 10 = High
1.02.03.04.05.06.07.08.09.0
10.0
Phys
ical c
onditio
n o
f inte
rsta
te h
ighw
ays
Phys
ical c
onditio
n o
f airp
orts
Phys
ical c
onditio
n o
f oth
er m
ajo
r hig
hw
ays
Overa
ll sys
tem
Phys
ical c
onditio
n o
f rest a
reas
Availa
bility o
f taxis
Phys
ical c
onditio
n o
f city s
treets
Availa
bility o
f air tra
nsporta
tion to
destin
atio
ns o
uts
ide M
onta
na
Availa
bility o
f local b
us o
r van s
erv
ice
Availa
bility o
f freig
ht ra
il serv
ice
Availa
bility o
f transit fo
r the e
lderly o
r dis
able
d
Phys
ical c
onditio
n o
f pedestria
n w
alk
ways
Availa
bility o
f air tra
nsporta
tion to
destin
atio
ns w
ithin
Monta
na
Phys
ical c
onditio
n o
f bus d
epots
Phys
ical c
onditio
n o
f bic
ycle
path
wa
ys
Availa
bility o
f buses b
etw
een c
ities a
nd
tow
ns
Availa
bility o
f passenger ra
il serv
ice
2009, State & Federal: System Satisfaction
Stakeholder
Public

71
This is equal to the public’s mean rating of 6.6 (see Figure 62). The 2009 rating is
roughly the same as the 2007 rating (6.44).
When asked about specific components of the transportation system, state and federal
government group members expressed satisfaction with 10 of 16 system components.
They were most satisfied with interstate highways and airports. State and federal
government group members expressed most dissatisfaction with inter-city bus service and
passenger rail service. This group expressed less satisfaction than did the public with 12
specific system components.
Actions to Improve the Transportation System The highest priority for improving components of the transportation system among state
and federal government group members was supporting efforts to preserve existing
passenger rail service (see Figure 63). This item was rated a “Very High” priority. Two
items were rated under a ”Medium Priority”. State and federal government group
members rated eight possible actions to improve the transportation system a higher
priority than did the public.
Figure 63: 5 = Very High
1.0
2.0
3.0
4.0
5.0
Supportin
g e
fforts
to p
reserv
e e
xis
ting
passenger ra
il serv
ice
Pro
motin
g th
e u
se o
f local tra
nsit s
yste
ms,
like b
uses o
r vans
Impro
vin
g tra
nsporta
tion s
afe
ty
Supportin
g e
fforts
to in
cre
ase th
e a
vaila
bility
of s
chedule
d a
irline s
erv
ice
Main
tain
road p
avem
ent c
onditio
n
Regula
ting th
e n
um
ber o
f hig
hw
ay
appro
aches a
nd d
rivew
ays
to p
reserv
e tra
ns
corrid
ors
Keepin
g th
e p
ublic
info
rmed a
bout
transporta
tion is
sues
Ensurin
g a
dequate
pedestria
n fa
cilitie
s (i.e
., sid
ew
alk
s, fo
otp
ath
s, c
rossin
gs)
Ensurin
g a
dequate
bic
ycle
facilitie
s
Usin
g n
ew
technolo
gie
s lik
e e
lectro
nic
m
essage s
igns, w
ebsite
& ra
dio
update
s
Impro
vin
g th
e p
hys
ical c
onditio
n o
f oth
er
roads a
nd s
treets
Impro
vin
g re
st a
reas (i.e
. main
tenance, m
ore
fa
cilitie
s)
Impro
vin
g th
e p
hys
ical c
onditio
n o
f bus
depots
Atte
mptin
g to
reduce s
ingle
occupancy
vehic
le u
se
Impro
vin
g th
e p
hys
ical c
onditio
n o
f the
inte
rsta
tes a
nd m
ajo
r hig
hw
ays
Reducin
g th
e a
ir quality im
pacts
of ro
adw
ay
use
Reducin
g tra
ffic c
ongestio
n b
y incre
asin
g th
e
capacity o
f the h
ighw
ay s
yste
m
2009, State & Federal: System Priorities
Stakeholder
Public

72
This group rated no items at least one full scale point higher in priority than did the
public. However, several practical differences between the groups’ opinions were
observed.
Actions to Improve Roadways The highest priority roadway improvement for the state and federal government group
was widening shoulders for bicyclists, which was rated a “Very High Priority” (see
Figure 64). Five items were rated “Somewhat High” or “Medium Ppriority”, and the
remaining items were rated below “Medium” priority.
Figure 64: 5 = Very High
1.0
2.0
3.0
4.0
5.0
Incre
ase
should
er w
idth
s
to
accom
modate
bic
ycle
s
Incre
ase
should
er w
idth
s
to
accom
modate
m
oto
rists
More
guard
rails
More
traffic
lig
hts
and le
ft tu
rn la
nes
More
pavem
ent
mark
ings (i.e
. should
er
Wid
er ro
adw
ays
More
lightin
g o
f ro
adw
ays
More
dire
ctio
nal/in
for
matio
nal s
igns
(i.e.
2009, State & Federal: Actions to Improve Roadways Priorities
Stakeholder
Public

73
General Communication Tool Ratings The 2009 state and federal stakeholders rated one tool highest: the MDT Web site. The
remaining items were rated somewhat useful. Special mailings and surveys rated lower.
State and federal stakeholders rated the MDT Web site and public meetings higher than
the public. The public found television and radio, newspapers, and surveys more useful
than did state and federal stakeholders.
Figure 65: 5 = Extremely Useful
1.0
2.0
3.0
4.0
5.0
Website
Toll-fre
e
call in
num
ber
Radio
and
tele
vis
ion
Public
m
eetin
gs in
yo
ur
com
munity
New
spaper
s
Specia
l m
ailin
gs
(bro
chure
s,
new
sle
tters
, postc
ard
s,
etc
)
Surv
eys
2009, State & Federal: Communication Tool Rating
Stakeholder Public

74
Planning and Project Communication Tool Ratings
MDT also asked state and federal stakeholders to rate planning and project specific
communication tools (see Figure 66). State and federal stakeholders rated four of six
tools studied just over somewhat useful. State and federal stakeholders gave their highest
ratings to maps, Web sites, and pictures or graphics.
The public rated five of the items studied lower than did state and federal stakeholders:
pictures or graphics, the MDT Web site, newsletters, brochures, and using advanced
technology.
Figure 66: 5 = Extremely Useful
1.0
2.0
3.0
4.0
5.0
Maps
Web s
ite
Pic
ture
s o
r gra
phic
s
Advanced
technolo
gy
New
sle
tters
Bro
chure
s
2009, State & Federal: Planning and Project Communication Tool Ratings
Stakeholder
Public

75
MDT Customer Service and Performance Grades
State and federal group grades ranged from B+ to B- (see Figure 67). These closely
paralleled the publics’.
Figure 67: 4 = A
0.0
1.0
2.0
3.0
4.0
Overa
ll curre
nt q
uality o
f MD
T s
erv
ice c
om
pare
d
with
five ye
ars
ago
Curre
nt M
DT
quality o
f serv
ice
MD
T's
overa
ll perfo
rmance d
urin
g th
e p
ast ye
ar
MD
T re
sponsiv
eness to
custo
mer id
eas a
nd
concern
s
MD
T e
fforts
to k
eep c
usto
mers
fully in
form
ed
MD
T o
vera
ll quality o
f pla
nnin
g
MD
T p
ublic
notific
atio
n p
rocess a
bout c
onstru
ctio
n
pro
jects
in yo
ur a
rea
Overa
ll convenie
nce o
f travel th
rough c
onstru
ctio
n
zones a
nd m
ain
tenance p
roje
cts
2009, State & Federal: Performance Grades for MDT
Stakeholder
Public

76
Security for System Components State and federal group respondents were asked to rate the security importance of various
transportation system components. Each component was rated on a scale from 1 – 5
where 1 is not at all important and 5 is extremely important.
State and federal group stakeholders gave importance ratings that ranged between
extremely important and somewhat important. State and federal stakeholders rated
communication with other agencies, emergency response plans, and interstate highways
most important. The 2009 state and federal stakeholders rated availability of alternate
routes and public facilities like bus terminals lowest in importance.
State and federal stakeholders’ ratings for importance paralleled those given by the public
very closely. There is little practical meaning in the small statistical differences between
the stakeholders’ ratings and the public’s.
Figure 68: 5 = Extremely Important
1.0
2.0
3.0
4.0
5.0
Com
munic
atio
n a
nd
coord
inatio
n w
ith
oth
er a
gencie
s
Em
erg
ency
response p
lans
Hom
ela
nd s
ecurity
inte
rsta
te h
ighw
ays
Hom
ela
nd s
ecurity
bord
er c
rossin
gs
Hom
ela
nd s
ecurity
airp
orts
Com
munic
atio
n w
ith
the p
ublic
usin
g
availa
ble
advanced
technolo
gie
s
Hom
ela
nd s
ecurity
oth
er m
ajo
r hig
hw
ays
Connectiv
ity of
roadw
ays
Hom
ela
nd s
ecurity
public
transit
facilitie
s lik
e b
us
term
inals
Availa
bility o
f alte
rnativ
e ro
ute
s
2009, State & Federal: System Security Importance Rating
Stakeholder
Public

77
TRIBAL PLANNER GROUP
This group is represented by tribal planners from across Montana. In 2009 and 2007,
eight tribal planning representatives completed interviews There were four completed
questionnaires in 2005. Readers of this report should exercise caution when interpreting
the data presented for the tribal planner group due to the low number of respondents.
Transportation System Satisfaction Tribal planner group respondents expressed neutral satisfaction with the transportation
system overall, giving it a mean rating of 5.8 on a 1 to 10 scale. This rating is lower than
the public’s mean rating of 6.6 (see Figure 69). The 2009 rating is lower than the 2007
rating (6.13) and the 2005 rating (6.0).
Figure 69: 10 = High
1.0
2.0
3.0
4.0
5.0
6.0
7.0
8.0
9.0
10.0
Availa
bility o
f freig
ht ra
il serv
ice
Phys
ical c
onditio
n o
f airp
orts
Availa
bility o
f air tra
nsporta
tion to
destin
atio
ns
outs
ide M
onta
na
Phys
ical c
onditio
n o
f inte
rsta
te h
ighw
ays
Availa
bility o
f passenger ra
il serv
ice
Phys
ical c
onditio
n o
f bic
ycle
path
wa
ys
Overa
ll sys
tem
Availa
bility o
f transit fo
r the e
lderly o
r dis
able
d
Phys
ical c
onditio
n o
f bus d
epots
Phys
ical c
onditio
n o
f oth
er m
ajo
r hig
hw
ays
Phys
ical c
onditio
n o
f pedestria
n w
alk
ways
Availa
bility o
f air tra
nsporta
tion to
destin
atio
ns
with
in M
onta
na
Availa
bility o
f local b
us o
r van s
erv
ice
Phys
ical c
onditio
n o
f rest a
reas
Phys
ical c
onditio
n o
f city s
treets
Availa
bility o
f buses b
etw
een c
ities a
nd to
wns
Availa
bility o
f taxis
2009, Tribal Planners: System Satisfaction
Stakeholder
Public

78
When asked about specific components of the transportation system, these tribal planners
expressed satisfaction with 11 of the 16 components examined. They were most satisfied
with the availability of freight rail service and airports. Tribal planner group members
were least satisfied with the physical condition of city streets, intercity bus service, and
taxis.
Actions to Improve the Transportation System The three tribal planners rated two system improvement priorities, promoting the use of
local transit systems and improving transportation safety, at the highest level (see Figure
70). Twelve items were rated a “Somewhat High Priority”. Tribal planner group members
rated one possible action to improve the transportation system a “Somewhat Low
Priority”: attempting to reduce single occupancy vehicle use.
Figure 70: 5 = Very High
The largest differences between tribal planners and the public were found in reducing the
air quality impact of roadway use and improving the physical condition of bus depots.
Tribal planners rated these possible system improvements a “somewhat high priority,”
while the public rated these possible improvements a “Medium Priority.”
1.0
2.0
3.0
4.0
5.0
Pro
motin
g th
e u
se o
f local tra
nsit s
yste
ms,
like b
uses o
r vans
Impro
vin
g tra
nsporta
tion s
afe
ty
Supportin
g e
fforts
to p
reserv
e e
xis
ting
passenger ra
il serv
ice
Impro
vin
g th
e p
hys
ical c
onditio
n o
f bus
depots
Impro
vin
g re
st a
reas (i.e
. main
tenance, m
ore
fa
cilitie
s)
Impro
vin
g th
e p
hys
ical c
onditio
n o
f the
inte
rsta
tes a
nd m
ajo
r hig
hw
ays
Supportin
g e
fforts
to in
cre
ase th
e a
vaila
bility
of s
chedule
d a
irline s
erv
ice
Ensurin
g a
dequate
bic
ycle
facilitie
s
Keepin
g th
e p
ublic
info
rmed a
bout
transporta
tion is
sues
Main
tain
road p
avem
ent c
onditio
n
Reducin
g th
e a
ir quality im
pacts
of ro
adw
ay
use
Usin
g n
ew
technolo
gie
s lik
e e
lectro
nic
m
essage s
igns, w
ebsite
& ra
dio
update
s
Ensurin
g a
dequate
pedestria
n fa
cilitie
s (i.e
., sid
ew
alk
s, fo
otp
ath
s, c
rossin
gs)
Impro
vin
g th
e p
hys
ical c
onditio
n o
f oth
er
roads a
nd s
treets
Regula
ting th
e n
um
ber o
f hig
hw
ay
appro
aches a
nd d
rivew
ays
to p
reserv
e tra
ns
corrid
ors
Reducin
g tra
ffic c
ongestio
n b
y incre
asin
g th
e
capacity o
f the h
ighw
ay s
yste
m
Atte
mptin
g to
reduce s
ingle
occupancy
vehic
le u
se
2009, Tribal Planners: System Priorities
StakeholderPublic

79
Actions to Improve Roadways The tribal planners rated two of eight possible roadway improvement priorities a “Very
High Priority” (see Figure 71). The remaining items were rated a “Somewhat High
Priorit”. The tribal planners rated each possible roadway improvement a higher priority
than did the public. The largest differences were found in wider shoulders for motorists
and more guard rails. The tribal planners rated these possible system improvements a
“Very High Priority”, while the public rated these possible improvements a “somewhat
high priority”.
Figure 71: 5 = Very High
1.0
2.0
3.0
4.0
5.0
Incre
ase s
hould
er w
idth
s to
accom
modate
moto
rists
More
guard
rails
Incre
ase s
hould
er w
idth
s to
accom
modate
bic
ycle
s
More
traffic
lights
and le
ft turn
la
nes
Wid
er ro
adw
ays
More
pavem
ent m
ark
ings (i.e
. should
er
More
dire
ctio
nal/in
form
atio
nal
sig
ns (i.e
.
More
lightin
g o
f roadw
ays
2009, Tribal Planners: Priority Actions to Improve Roadways
Stakeholder
Public
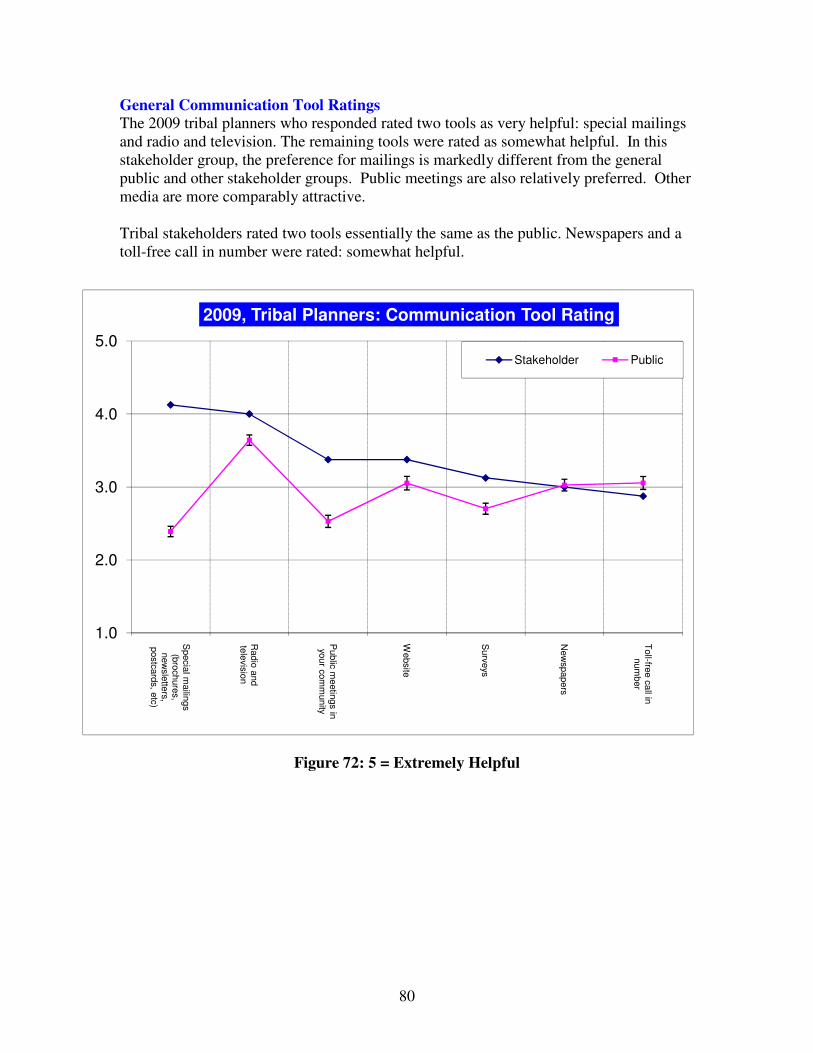
80
General Communication Tool Ratings The 2009 tribal planners who responded rated two tools as very helpful: special mailings
and radio and television. The remaining tools were rated as somewhat helpful. In this
stakeholder group, the preference for mailings is markedly different from the general
public and other stakeholder groups. Public meetings are also relatively preferred. Other
media are more comparably attractive.
Tribal stakeholders rated two tools essentially the same as the public. Newspapers and a
toll-free call in number were rated: somewhat helpful.
Figure 72: 5 = Extremely Helpful
1.0
2.0
3.0
4.0
5.0
Specia
l mailin
gs
(bro
chure
s,
new
sle
tters
, postc
ard
s, e
tc)
Radio
and
tele
vis
ion
Public
meetin
gs in
yo
ur c
om
munity
Website
Surv
eys
New
spapers
Toll-fre
e c
all in
num
ber
2009, Tribal Planners: Communication Tool Rating
Stakeholder Public

81
Planning and Project Communication Tool Ratings
MDT also asked tribal stakeholders to rate planning and project specific communication
tools (see Figure 73). Tribal planners rated all six tools studied very useful, Tribal
planners gave their highest ratings to pictures or graphics, brochures, and advanced
technology.
The public rated all of the items studied lower than did tribal planners.
Figure 73: 5 = Extremely Useful
1.0
2.0
3.0
4.0
5.0
Pic
ture
s o
r gra
phic
s
Advanced te
chnolo
gy
Bro
chure
s
Maps
Web s
ite
New
sle
tters
2009, Tribal Planners: Communication and Project Planning Tool Ratings
Stakeholder
Public

82
MDT Customer Service and Performance Grades
The tribal planners’ grade ratings for MDT averaged from B to C- (see Figure 74). Three
average grade ratings were slightly higher than the publics’ and one was lower. The
largest difference between the tribal planners and the public was observed in average
grades for MDT responsiveness to customer ideas and concerns. The tribal planners’
average grade for MDT responsiveness was about one-half a grade lower than the
publics’ average grade for MDT.
Figure 74: 4 = A
0.0
1.0
2.0
3.0
4.0
Overa
ll curre
nt q
uality o
f MD
T s
erv
ice c
om
pare
d
with
five ye
ars
ago
MD
T p
ublic
notific
atio
n p
rocess a
bout
constru
ctio
n p
roje
cts
in yo
ur a
rea
MD
T's
overa
ll perfo
rmance d
urin
g th
e p
ast ye
ar
Overa
ll convenie
nce o
f travel th
rough
constru
ctio
n z
ones a
nd m
ain
tenance p
roje
cts
Curre
nt M
DT
quality o
f serv
ice
MD
T e
fforts
to k
eep c
usto
mers
fully in
form
ed
MD
T o
vera
ll quality o
f pla
nnin
g
MD
T re
sponsiv
eness to
custo
mer id
eas a
nd
concern
s
2009, Tribal Planners: Performance Grades for MDT
Stakeholder
Public

83
Security for System Components The tribal planners were asked to rate the security importance of various transportation
system components. Each component was rated on a scale from 1 – 5 where 1 is not at all
important and 5 is extremely important.
Tribal planners rated every transportation system component’s security as “extremely
important” or “very important.” The 2009 tribal planners rated emergency response plans
as the highest priority.
Tribal planners’ ratings roughly paralleled those given by the public. However, the
differences between the planners’ average ratings and the publics’ average ratings are
quite large.
Figure 75: 5 = Extremely Important
1.0
2.0
3.0
4.0
5.0
Em
erg
ency re
sponse p
lans
Connectiv
ity of ro
adw
ays
Hom
ela
nd s
ecurity b
ord
er c
rossin
gs
Com
munic
atio
n w
ith th
e p
ublic
usin
g
availa
ble
advanced te
chnolo
gie
s
Com
munic
atio
n a
nd c
oord
inatio
n w
ith
oth
er a
gencie
s
Hom
ela
nd s
ecurity in
ters
tate
hig
hw
ays
Hom
ela
nd s
ecurity o
ther m
ajo
r hig
hw
ays
Hom
ela
nd s
ecurity a
irports
Availa
bility o
f alte
rnativ
e ro
ute
s
Hom
ela
nd s
ecurity p
ublic
transit fa
cilitie
s
like b
us te
rmin
als
2009, Tribal Planners: System Security Importance Rating
Stakeholder Public