statewide seismic needs assessment report
TRANSCRIPT
8/3/2019 Statewide Seismic Needs Assessment report
http://slidepdf.com/reader/full/statewide-seismic-needs-assessment-report 1/341
State of OregonDepartment of Geology and Mineral Industries
Vicki S. McConnell, State Geologist
Open-File Report O-07-02
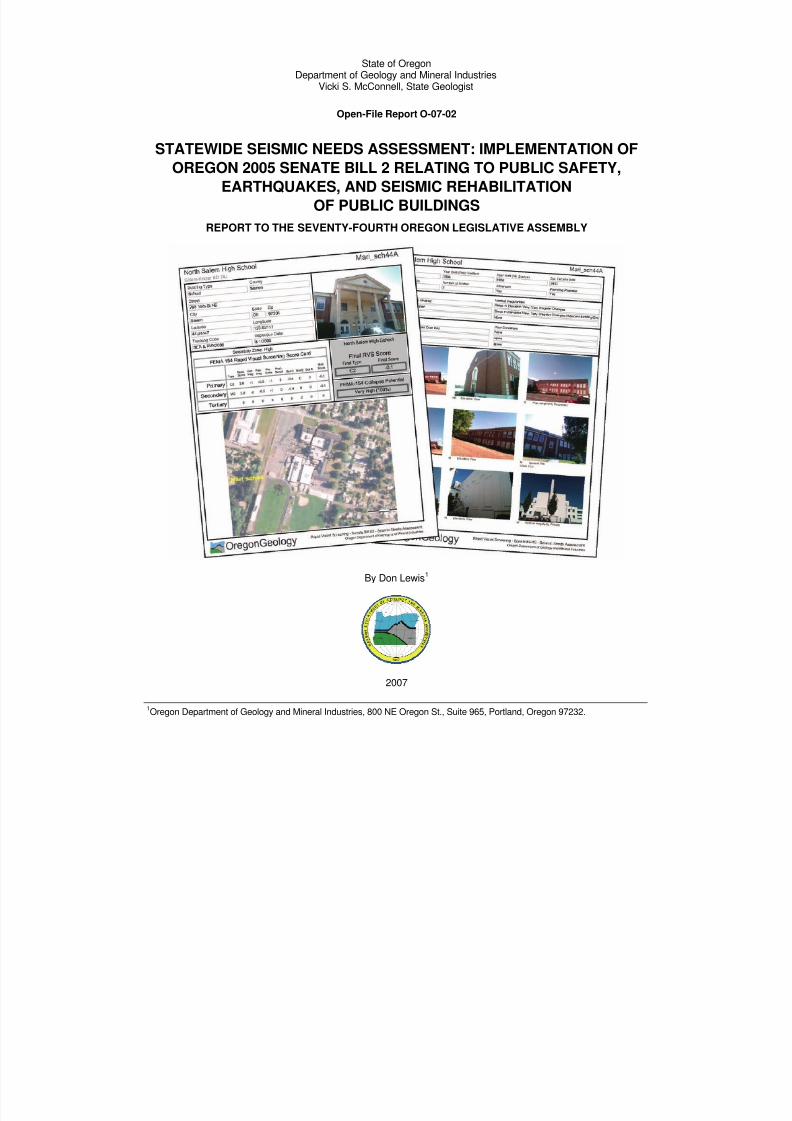
STATEWIDE SEISMIC NEEDS ASSESSMENT: IMPLEMENTATION OFOREGON 2005 SENATE BILL 2 RELATING TO PUBLIC SAFETY,
EARTHQUAKES, AND SEISMIC REHABILITATION
OF PUBLIC BUILDINGS
REPORT TO THE SEVENTY-FOURTH OREGON LEGISLATIVE ASSEMBLY
By Don Lewis1
2007
1Oregon Department of Geology and Mineral Industries, 800 NE Oregon St., Suite 965, Portland, Oregon 97232.
8/3/2019 Statewide Seismic Needs Assessment report
http://slidepdf.com/reader/full/statewide-seismic-needs-assessment-report 2/341
ii
Oregon Department of Geology and Mineral Industries Open-File Report O-07-02
Published in conformance with ORS 516.030
For copies of this publication or other information about Oregon’s geology and natural resources, contact:
Nature of the Northwest Information Center
800 NE Oregon Street #5
Portland, Oregon 97232(503) 872-2750
http://www.naturenw.org
or these DOGAMI field offices:
Baker City Field Office
510 Campbell St.
Baker City, OR 97814-3442
Telephone (541) 523-3133
Fax (541) 523-5992
Grants Pass Field Office
5375 Monument Drive
Grants Pass, OR 97526
Telephone (541) 476-2496
Fax (541) 474-3158
For additional information:
Administrative Offices
800 NE Oregon Street, Suite 965
Portland, OR 97232
Telephone (971) 673-1555
Fax (971) 673-1562
http://www.oregongeology.com
http://egov.oregon.gov/DOGAMI/
8/3/2019 Statewide Seismic Needs Assessment report
http://slidepdf.com/reader/full/statewide-seismic-needs-assessment-report 3/341
Oregon Department of Geology and Mineral Industries Open-File Report O-07-02 Statewide Seismic Needs Assessment iii
Districts Schools* Buildings*Educational Facilities:
K-12 Public School Districts & Education Service Districts 170 1101 2185
Community College Districts 17 179 184
Sum Education 187 1280 2369
Emergency Facilities:
City Districts (Police and Fire Departments) 143 327
Rural Fire Protection Districts 191 440
County Sheriff Offices 34 73
Oregon State Police 1 26
Port of Portland 1 1
Acute Care Hospitals 58 116
Sum Emergency 428 983 SUM ALL: 3352
*There are 179 community college buildings and 184 “building entities” at the 17 campuses.
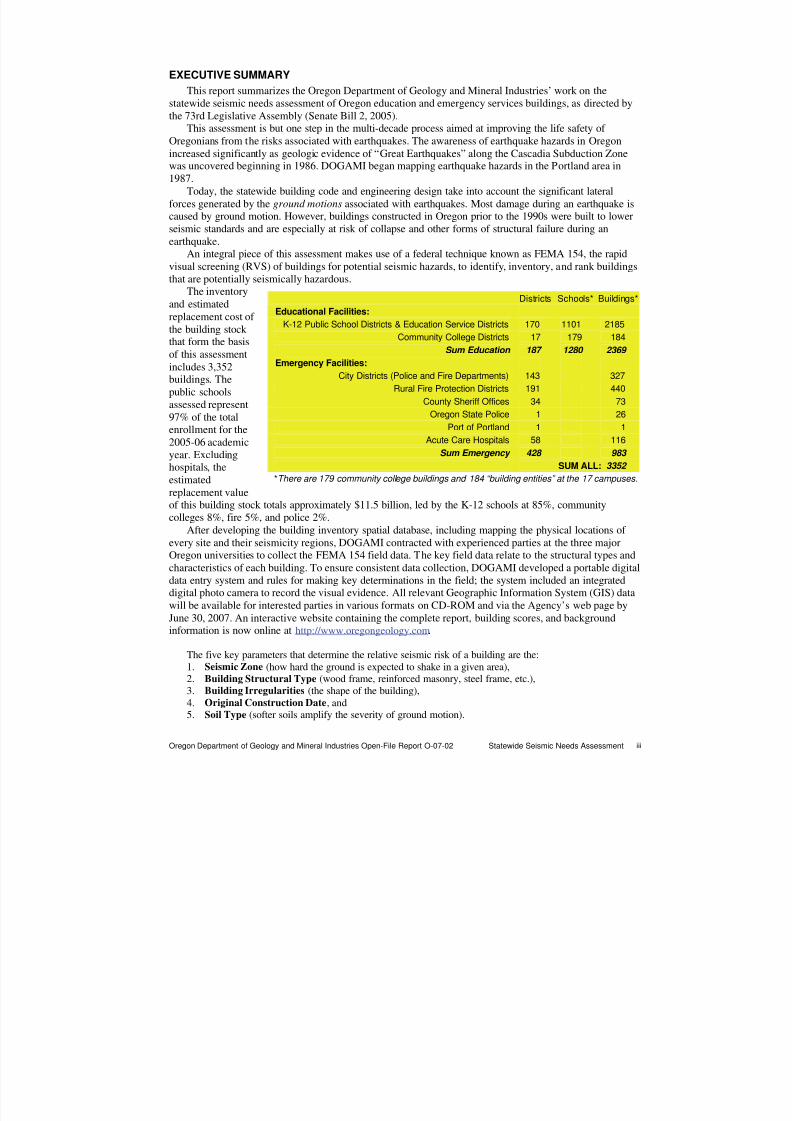
EXECUTIVE SUMMARY
This report summarizes the Oregon Department of Geology and Mineral Industries’ work on thestatewide seismic needs assessment of Oregon education and emergency services buildings, as directed bythe 73rd Legislative Assembly (Senate Bill 2, 2005).
This assessment is but one step in the multi-decade process aimed at improving the life safety of Oregonians from the risks associated with earthquakes. The awareness of earthquake hazards in Oregon
increased significantly as geologic evidence of “Great Earthquakes” along the Cascadia Subduction Zonewas uncovered beginning in 1986. DOGAMI began mapping earthquake hazards in the Portland area in1987.
Today, the statewide building code and engineering design take into account the significant lateralforces generated by the ground motions associated with earthquakes. Most damage during an earthquake iscaused by ground motion. However, buildings constructed in Oregon prior to the 1990s were built to lowerseismic standards and are especially at risk of collapse and other forms of structural failure during anearthquake.
An integral piece of this assessment makes use of a federal technique known as FEMA 154, the rapidvisual screening (RVS) of buildings for potential seismic hazards, to identify, inventory, and rank buildingsthat are potentially seismically hazardous.
The inventory
and estimatedreplacement cost of the building stock that form the basisof this assessmentincludes 3,352buildings. Thepublic schoolsassessed represent97% of the totalenrollment for the2005-06 academic
year. Excludinghospitals, theestimatedreplacement valueof this building stock totals approximately $11.5 billion, led by the K-12 schools at 85%, communitycolleges 8%, fire 5%, and police 2%.
After developing the building inventory spatial database, including mapping the physical locations of every site and their seismicity regions, DOGAMI contracted with experienced parties at the three majorOregon universities to collect the FEMA 154 field data. The key field data relate to the structural types andcharacteristics of each building. To ensure consistent data collection, DOGAMI developed a portable digitaldata entry system and rules for making key determinations in the field; the system included an integrateddigital photo camera to record the visual evidence. All relevant Geographic Information System (GIS) data
will be available for interested parties in various formats on CD-ROM and via the Agency’s web page byJune 30, 2007. An interactive website containing the complete report, building scores, and backgroundinformation is now online at http://www.oregongeology.com.
The five key parameters that determine the relative seismic risk of a building are the:1. Seismic Zone (how hard the ground is expected to shake in a given area),2. Building Structural Type (wood frame, reinforced masonry, steel frame, etc.),3. Building Irregularities (the shape of the building),4. Original Construction Date, and5. Soil Type (softer soils amplify the severity of ground motion).
8/3/2019 Statewide Seismic Needs Assessment report
http://slidepdf.com/reader/full/statewide-seismic-needs-assessment-report 4/341
Oregon Department of Geology and Mineral Industries Open-File Report O-07-02 Statewide Seismic Needs Assessment iv
The FEMA 154 technique results in a score ranging from 0.0 to 6.8 (negative scores are possible, butthese effectively translate to a score of 0.0). This score is particularly useful to characterize the relativeseismic risk within the universe of buildings being considered, but it is not an absolute measure for any onebuilding of where and how structural failure will occur.
The score relates to the probability that the building will collapse if ground motions occur that are equalto or exceed the maximum considered earthquake at that location. The maximum considered earthquake isdefined as the maximum event considered likely in a reasonable amount of time. The maximum considered
earthquake for any location is determined by the United States Geological Survey’s (USGS) work, mostrecently updated in 2002. This information can be found online at:http://earthquake.usgs.gov/research/hazmaps/ .
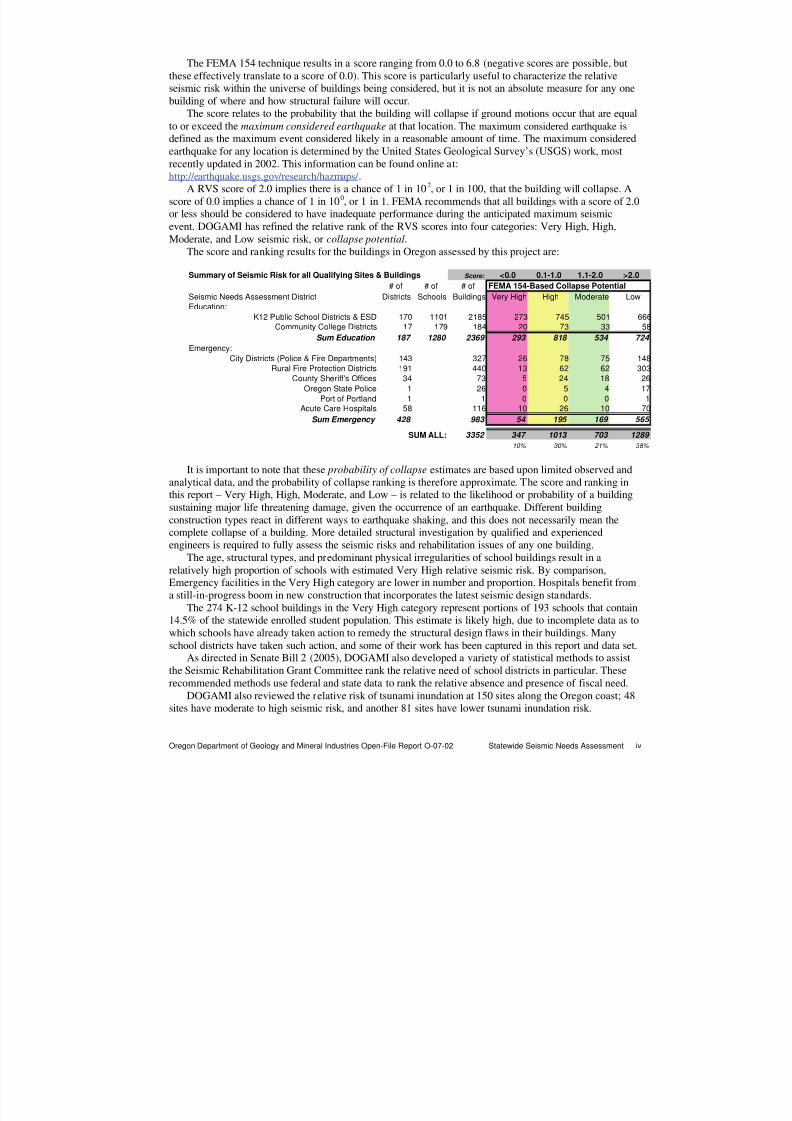
A RVS score of 2.0 implies there is a chance of 1 in 102, or 1 in 100, that the building will collapse. Ascore of 0.0 implies a chance of 1 in 100, or 1 in 1. FEMA recommends that all buildings with a score of 2.0or less should be considered to have inadequate performance during the anticipated maximum seismicevent. DOGAMI has refined the relative rank of the RVS scores into four categories: Very High, High,Moderate, and Low seismic risk, or collapse potential.
The score and ranking results for the buildings in Oregon assessed by this project are:
Summary of Seismic Risk for all Qualifying Sites & Buildings Score: <0.0 0.1-1.0 1.1-2.0 >2.0
# of # of # of FEMA 154-Based Collapse Potential
Seismic Needs Assessment District Districts Schools Buildings Very High High Moderate Low
Education:
K12 Public School Districts & ESD 170 1101 2185 273 745 501 666
Community College Districts 17 179 184 20 73 33 58
Sum Education 187 1280 2369 293 818 534 724
Emergency:
City Districts (Police & Fire Departments) 143 327 26 78 75 148
Rural Fire Protection Districts 191 440 13 62 62 303
County Sheriff's Offices 34 73 5 24 18 26
Oregon State Police 1 26 0 5 4 17
Port of Portland 1 1 0 0 0 1Acute Care Hospitals 58 116 10 26 10 70
Sum Emergency 428 983 54 195 169 565
SUM ALL: 3352 347 1013 703 1289
10% 30% 21% 38%
It is important to note that these probability of collapse estimates are based upon limited observed and
analytical data, and the probability of collapse ranking is therefore approximate. The score and ranking inthis report – Very High, High, Moderate, and Low – is related to the likelihood or probability of a buildingsustaining major life threatening damage, given the occurrence of an earthquake. Different buildingconstruction types react in different ways to earthquake shaking, and this does not necessarily mean thecomplete collapse of a building. More detailed structural investigation by qualified and experiencedengineers is required to fully assess the seismic risks and rehabilitation issues of any one building.
The age, structural types, and predominant physical irregularities of school buildings result in arelatively high proportion of schools with estimated Very High relative seismic risk. By comparison,Emergency facilities in the Very High category are lower in number and proportion. Hospitals benefit froma still-in-progress boom in new construction that incorporates the latest seismic design standards.
The 274 K-12 school buildings in the Very High category represent portions of 193 schools that contain14.5% of the statewide enrolled student population. This estimate is likely high, due to incomplete data as towhich schools have already taken action to remedy the structural design flaws in their buildings. Manyschool districts have taken such action, and some of their work has been captured in this report and data set.
As directed in Senate Bill 2 (2005), DOGAMI also developed a variety of statistical methods to assistthe Seismic Rehabilitation Grant Committee rank the relative need of school districts in particular. Theserecommended methods use federal and state data to rank the relative absence and presence of fiscal need.
DOGAMI also reviewed the relative risk of tsunami inundation at 150 sites along the Oregon coast; 48sites have moderate to high seismic risk, and another 81 sites have lower tsunami inundation risk.
8/3/2019 Statewide Seismic Needs Assessment report
http://slidepdf.com/reader/full/statewide-seismic-needs-assessment-report 5/341
Oregon Department of Geology and Mineral Industries Open-File Report O-07-02 Statewide Seismic Needs Assessment v
Oregon has relatively high seismic risk, yet the time interval between major subduction zone earthquakeevents is large, in human terms. The USGS predicts a 15% chance of a Cascadia Subduction Zoneearthquake in the next 50 years. For reference, they also predict a 62% chance of a major earthquake in theSan Francisco bay region in the next 25 years. This suggests that Oregonians have a manageable amount of time available to mitigate this risk over the next few decades.
Finally, DOGAMI makes these recommendations:
Recommendations to the Seismic Rehabilitation Grant Committee
The scoring data and needs analysis from this report should be the starting point for developing the grantprogram. Very High Risk and High Risk facilities should be prioritized for consideration for rehabilitation.Acute care hospitals within community health service districts should be considered eligible for the grants.Community-based acute care hospitals should also be considered eligible for the grant program. Theimportance of individual buildings to the community needs, as outlined as part of the ranking process inSenate Bill 2 (2005), needs further clarification.
Recommendations for Districts
DOGAMI recommends districts with buildings labeled as having High and Very High relative seismic risk of collapse during a seismic event to consider hiring a structural engineering consultant to more thoroughlyevaluate the seismic issues with their buildings. Please note that this FEMA 154 rapid visual screeningtechnique can both overestimate and underestimate relative seismic risk.
Recommendations for Fiscal Decision Makers
DOGAMI recommends that voters, community representatives, government administrators, and electedofficials carefully consider both the costs and benefits associated with seismic risk mitigation, rehabilitation,and community asset replacement. Many districts in Oregon have traveled down this path already and willhave valuable hard-won experience to share. The public school seismic rehabilitation program in BritishColumbia may also provide valuable lessons.
Note about Site and Building DataData gathered and used to calculate RVS final scores and links to sitesummary reports are available in these supplemental files:
• SSNA-all-data.xls• SSNA-abridged-data.xls (also available as a PDF)
Definitions, criteria, and methodology are available in theseappendices:
• Appendix I. Spreadsheet and Site Summary Report Data FieldDefinitions
• Appendix J. Building Irregularity Matrix
• Appendix K. Rapid Visual Screening Protocol Handbook
• Appendix L. FEMA 154, 2002 edition, Rapid Visual Screening of Buildings for Potential Seismic Hazards, A Handbook
8/3/2019 Statewide Seismic Needs Assessment report
http://slidepdf.com/reader/full/statewide-seismic-needs-assessment-report 6/341
Oregon Department of Geology and Mineral Industries Open-File Report 07-02 Statewide Seismic Needs Assessment vi
CONTENTS
EXECUTIVE SUMMARY................. ............. ............. ............. ............. ............. ............. ............. .............. ............. ...... III
1.0. INTRODUCTION...... ............. ............. ............. ............. ............. ............. ............. ............. ............. ............... ......... 1 1.1. Earthquake Geology of Oregon........... ............. ............. ............. ............. ............. ............. ............. ............. .... 2 1.2. Seismic Hazard in Oregon ............ ............. ............. ............ ............. ............. ............. ............... ............. ......... 3 1.3. Scope of Earthquake Hazard and Anticipated Monetary Losses in Oregon............. ............. ............. ............. ... 5 1.4. Building Codes, Structural Engineering Design, and Buildings in Oregon.................. ............. ............. .............. 6 1.5. Legislative Directives Regarding Statewide Seismic Needs Assessment ........... ............. ............ ............. ......... 8
2.0. DEFINING THE UNIVERSE FOR SEISMIC NEEDS ASSESSMENT............. ............. ............. ............. ............. ... 14 2.1: Qualifying Buildings: K-12 Public Schools and Education Service Districts (ESD) ............ ............ ............. ...... 14 2.2. Qualifying Buildings: Community College District Buildings ........... ............. ............. ............ ............. .............. 16 2.3. Qualifying Buildings: Hospitals ............. ............. ............. ............ ............. ............. ............. .............. ............. . 17 2.4. Qualifying Buildings: Fire and Police Stations............ ............ ............. ............. ............. ............ .............. ....... 20
3.0. OREGON SEISMIC NEEDS ASSESSMENT................ ............. ............. ............. ............. ............. ............. .......... 21 3.1. Understanding DOGAMI’s Seismic Needs Assessment Reports.............. ............. ............. ............. ............. ... 21 3.2. FEMA 154 and Rapid Visual Screening (RVS) Methodology ............ ............. ............. ............. ............. .......... 22 3.3. Oregon Seismic Zones for FEMA 154 Scoring............ ............ ............. ............. ............. ............ ............... ..... 23 3.4. RVS Soil Types ............ ............. ............. ............. ............. ............. ............. ............. ............... ............. ......... 24 3.5. RVS Building Irregularities, Plan Views, and “Buildings” versus “Sites”.............. ............ ............. ............. ....... 25 3.6. RVS Structural Type... ............. ............. ............. ............. ............. ............. ............. ............... ............. ........... 26 3.7. RVS Data Collection............. ............. ............. ............ ............. ............. ............. ............ ............... ............. ... 27 3.8. RVS Scoring............. ............. ............. ............. ............ ............. ............. ............. ............... ............. ............. . 28 3.9. RVS Building Type Results ............. ............. ............. ............. ............. ............. ............. .............. ............. ..... 29 3.10. RVS Score Results...... ............. ............. ............. ............. ............. ............. ............. .............. ............. ......... 30 3.11. District-Level Relative Seismic Risk........... ............. ............. ............ ............. ............. .............. ............. ....... 32 3.12. RVS Score Results...... ............. ............. ............. ............. ............. ............. ............. .............. ............. ......... 33
4.0. RELATIVE NEED..................... ............. ............. ............. ............ ............. ............. ............... ............. ............. ..... 36 4.1. K-12 School District Relative Fiscal Need............. ............. ............ ............. ............ ............. ............... ........... 37 4.2. Fiscal Need: General Obligation Bond Data.................. ............. ............. ............ ............. ............... ............. .. 40
5.0. OTHER RISK CATEGORIES: TSUNAMI INUNDATION RISK ............. ............. ............. ............. ............. ............ 44
6.0. OREGON SEISMIC REHABILITATION COSTS AND ACTIVITIES ............. ............. ............. ............. ............. ..... 48 6.1. Portland Public Schools (PPS)............... ............. ............. ............ ............. ............. ............. ............... ........... 48 6.2. Portland Fire Department......... ............. ............. .............. ............. ............. ............. .............. ............. ........... 49 6.3. Salem Fire Department........ ............. ............. ............. ............. ............. ............. ............. ............... ............. .. 49 6.4. Hillsboro School District... ............. ............. ............. ............. ............. ............. ............. .............. ............. ....... 50 6.5. Tualatin Valley Fire District............ ............. ............ ............. ............. ............. ............. ............... ............. ....... 50
7.0. COMPARABLE EARTHQUAKE ASSESSMENT AND MITIGATION PROGRAMS – BRITISH COLUMBIA........ .. 51
8.0. RECOMMENDATIONS TO THE SEISMIC REHABILITATION GRANT COMMITTEE............ ............. ............. ..... 53 Recommendations to the Seismic Rehabilitation Grant Committee ............. ............. ............. ............. ............. ...... 53 Recommendations for Districts ........... ............. ............. ............. ............. ............. ............. ............... ............. ....... 53 Recommendations for Fiscal Decision Makers ............. ............. ............. ............. ............. ............. .............. ......... 53
9.0. ACKNOWLEDGEMENTS............. ............. ............. ............. ............. ............. ............. ............. ............. ............... 54
10.0. REFERENCES.................. ............. ............. ............. ............. ............. ............. ............. ............... ............. ......... 55
11.0. ACRONYMS AND ABBREVIATIONS............... ............. ............. ............. ............. ............. ............. ............. ...... 55
8/3/2019 Statewide Seismic Needs Assessment report
http://slidepdf.com/reader/full/statewide-seismic-needs-assessment-report 7/341
Oregon Department of Geology and Mineral Industries Open-File Report O-07-02 Statewide Seismic Needs Assessment vii
CONTENTS (continued)
APPENDIX A. QUALIFYING K-12 PUBLIC SCHOOLS AND EDUCATION SERVICE DISTRICTS ............. ............ ... 57
APPENDIX B. QUALIFYING COMMUNITY COLLEGES..... ............. ............. ............. ............. ............. ............. ........ 79
APPENDIX C. RVS SCORES FOR K-12 SCHOOLS.............. ............ ............. ............. ............. ............. ............... .... 83
APPENDIX D. RVS SCORES FOR COMMUNITY COLLEGE BUILDINGS............. ............. .............. ............. ......... 113
APPENDIX E. RVS SCORES FOR CITY FIRE AND POLICE DEPARTMENTS, COUNTY SHERIFF’SOFFICES, OREGON STATE POLICE, AND RURAL FIRE PROTECTION DISTRICTS............ ......... 117
APPENDIX F. RVS SCORES FOR HOSPITALS............... ............. ............. ............. ............. ............. .............. ....... 129
APPENDIX G. DISTRICT-LEVEL RELATIVE SEISMIC RISK: K-12 AND COMMUNITY COLLEGE DISTRICTS...... 131
APPENDIX H. DISTRICT-LEVEL RELATIVE SEISMIC RISK: FIRE AND POLICE DISTRICTSAND ACUTE CARE HOSPITALS............. ............. ............. ............. ............. ............ ............. ........... 135
APPENDIX I. SPREADSHEET AND SITE SUMMARY REPORT DATA FIELD DEFINITIONS..................... ........... 143
APPENDIX J. BUILDING VERTICAL AND PLAN IRREGULARITY MATRIX............. ............. ............. ............. ...... 147
APPENDIX K. SENATE BILL 2 RAPID VISUAL SCREENING PROTOCOL HANDBOOK................. ............. ......... 149
APPENDIX L. FEMA 154, 2002 EDITION, RAPID VISUAL SCREENING OF BUILDINGS FOR POTENTIALSEISMIC HAZARDS, A HANDBOOK ............................................................................................... 171
8/3/2019 Statewide Seismic Needs Assessment report
http://slidepdf.com/reader/full/statewide-seismic-needs-assessment-report 8/341
Oregon Department of Geology and Mineral Industries Open-File Report O-07-02 Statewide Seismic Needs Assessment viii
LIST OF FIGURES Figure 1. Types of earthquakes that affect Oregon ............ ............. ............. .............. ............. .............. .............. ...... 2Figure 2. The 2001 Nisqually (M6.8) and 1994 Northridge (M6.7) earthquakes............ ............. ............. ............. ....... 2Figure 3. National Hazard Map shows the probability of earthquake shaking. ............ ............. ............ ............. .......... 3 Figure 4. Detail of USGS hazard map showing probability of ground shaking in Oregon due to seismic activity. ..... .... 3Figure 5. Earthquake ground motion amplification in southern California ............ ............. ............. ............. ............. ... 4Figure 6. Universal Building Code soil types in Oregon. ............. ............. ............. ............. ............. ............ ............. .. 4 Figure 7. Potential annual earthquake losses in millions of dollars by county due to seismic hazard. ............ ............. 5
Figure 8. Important seismic code events and code developments. ............ ............. ............. ............. ............. ............ 6 Figure 9. Reclassification of western Oregon as an area of higher seismic hazard........... ............. ............. ............. ... 7 Figure 10. Construction dates for Oregon education and emergency facilities........... ............. ............. ............. ............ 7 Figure 11. Flow chart of the seismic needs assessment and rehabilitation process............ ............. ............. ............. ... 9 Figure 12. DOGAMI’s process to conduct seismic needs assessment of public education buildings. ............. ............ ..13 Figure 13. Steps followed to determine qualifying K-12 sites in Baker County............... ............ ............. ............. ........15 Figure 14. Location of the 1,280 education and 829 emergency sites included in the assessment...... ............. ............20 Figure 15. Example seismic needs assessment site summary report and RVS score spreadsheet.............. ..... ......... ..21 Figure 16. FEMA 154 seismicity zones in Oregon................... ............. ............. ............. ............. ............. ............. .....23 Figure 17. Relationship of areas of NEHRP soil models to seismic assessment sites and ODWR well data................ .24Figure 18. Vertical and plan irregularities..................... ............. ............. ............. ............. .............. ............. ............. ..25 Figure 19. Plan view for each site shows the location of each building assessed at the site............... ............. .............25 Figure 20. FEMA 154 benchmark dates and building structural types............ ............. ............. ............. ............. .........26 Figure 21. Computer tablets for data entry used by screeners in the field. ............. .............. ............. .............. ............27Figure 22. Hypothetical, simplified RVS score sheet. ............ .............. ............. ............. ............. ............. .............. .....28
Figure 23. Distribution of building structural type.................... ............. ............. ............. ............. ............... ............. ....29 Figure 24. RVS scores for K-12 schools and fire and police facilities............. ............. ............. ............. ............. .........30 Figure 25. Variance between K-12 and police and fire station building RVS scores............ ............. ............. ............. ..31 Figure 26. Graphical summary of seismic risk for all qualifying sites and buildings... ............ ............. ............. .............33 Figure 27. Relative collapse potential for all sites in this seismic needs assessment study.............. ............. ............ ...34 Figure 28. All locations with Very High relative seismic risk in this seismic needs assessment. ............ ............. ..........35 Figure 29. Seismic risk and need can be reduced to a two-dimensional plot. ............ ............. ............. ............. ...........37 Figure 30. Plot of school district property tax per student versus percentage of enrolled students living in poverty
for the largest 43 school districts in Oregon...............................................................................................38 Figure 31. Plot of property tax paid per enrolled student versus percentage of children in poverty for all school
districts included in the assessment..........................................................................................................39 Figure 32. Oregon school district bond measures voting results 1997–2006. ............ ............. ............. ............. ...........40 Figure 33. Impact of 1964 Alaska Tsunami at Cannon Beach, Oregon. ............ ............ ............. ............. ............. .......44 Figure 34. Computer-generated tsunami inundation zones for Florence, Oregon. ............ ............. ............. ............. ....45 Figure 35. FEMA seismic rehabilitation cost estimator tool.. ............. ............. ............. ............. ............. ............. .........48
Figure 36. West Coast population growth trends for Oregon and Bristish Columbia, 1930-2005.... ............. ............. ....51Figure 37. British Columbia school district seismic zones............... ............. ............. ............. ............. .............. ..........52 Figure 38. Some members of the seismic needs assessment team.... ............. ............. ............ ............. ............... ......54
LIST OF TABLES Table 1. Replacement value of qualifying building stock in Oregon....................... ............ ............. ............ ............... 5Table 2. DOGAMI's qualifying public K-12 schools and education service districts............... ............. ............. ..........14Table 3. Qualifying community college district buildings... ............. ............. ............. ............. ............. ............ ..........16Table 4a. Oregon Department of Human Services 2003 patient and revenue data ............. ............. ............. .............18Table 4b. Parent organization and scale of revenues.................. ............. ............. ............. ............. ............ ............. .19Table 5. Fire and police stations ............. ............ ............. ............. ............. ............. ............. ............... ............. ......20Table 6. National Earthquake Hazards Reduction Program soil classification system........... ............ ............. ...........24Table 7. Benchmark years for building structural types in the assessment....... ............ ............. ............ .............. .....26Table 8. FEMA 154 post-benchmark dates for Oregon ............. ............. ............. ............. ............. ............ ............. .27
Table 9. Distribution of building types found in the assessment... ............. ............. ............. ............. ............. ...........29Table 10. District level seismic risk scores............ ............. ............. ............. ............. ............. .............. ............. ........32Table 11. Summary of seismic risk for all qualifying sites and buildings... ............. ............. ............. ............... ............33Table 12. November 2006 Oregon School District and Community College Capital Projects Bond Measure
Election Results.......................................................................................................................................41Table 13. The 92 Oregon school districts that passed bond measures 1997–2006........... ............. ............. ............. ..42Table 14. Oregon coast relative tsunami inundation risk ............. ............. ............. ............. ............. ............. .............46Table 15. Estimated seismic rehabilitation costs for Hillsboro school district schools................ ............. ............ .........50

8/3/2019 Statewide Seismic Needs Assessment report
http://slidepdf.com/reader/full/statewide-seismic-needs-assessment-report 9/341
Oregon Department of Geology and Mineral Industries Open-File Report O-07-02 Statewide Seismic Needs Assessment 1
1.0. INTRODUCTION
This report summarizes the Agency’s work on the statewide seismic needs assessment of Oregon publiceducation and emergency services buildings, as directed by the legislative assembly in 2005.
This assessment is one step in a process aimed at improving the life safety of Oregonians from the risksassociated with earthquakes. The awareness of earthquake hazards in Oregon increased significantly as theUnited States Geological Survey commenced detailed investigations into the field evidence of “Great
Earthquakes” in the geological record along the Pacific Northwest coast, commencing in 1986. DOGAMIalso began mapping earthquake hazards in the Portland area in 1987.
Work by the USGS, and many others, has pieced together very compelling evidence that the CascadiaSubduction Zone has ruptured 13 times during the past 7,600 years, most recently at 9pm, local time, onTuesday, January 26, 1700. In addition, shallow earthquakes in the Scott Mills and Klamath Falls areasduring 1993 remind us all that it is not just the risks of “the big one” that we need to mitigate.
Today, the statewide building code and engineering design take into account the significant lateral forcesassociated with earthquakes. However, buildings constructed in Oregon prior to the 1990’s were built tolower standards and are especially at risk of collapse and other forms of structural failure during anearthquake.
An integral piece of this assessment makes use of a federal technique known as FEMA 154 (AppendixL), the rapid visual screening of buildings for potential seismic hazards, to identify, inventory, and rank
buildings that are potentially seismically hazardous. Five key parameters determine the relative seismic risk of a building:
1. Seismicity Zone at that location (how hard the ground is expected to shake during the maximumconsidered earthquake)
2. Building Structural Type being considered (one or more of 15 different combinations of buildingsconstructed from wood, steel, concrete and masonry using moment frame, shear wall or bracinglateral force-resisting systems)
3. Building Irregularities a building may have (especially tall, oddly shaped, or built on slopedground)
4. Original Construction Date (as opposed to expansion or modification, although seismicrehabilitation work is noted), and
5. Soil Type (softer soils cannot transmit seismic shear waves as efficiently as rock, so the amplitude,
or size, of the shear waves and ground motion will increase)This screening technique is particularly useful to characterize the relative seismic risk within the universe
of buildings being considered, but it is not an absolute measure for any one building of where and howstructural failure will occur. That requires a full structural analysis. The FEMA 154 results are reported as aprobability that the building will collapse if ground motions occur that are equal to or exceed the maximumconsidered earthquake. These estimates are based upon limited observed and analytical data, and theprobability of collapse is therefore approximate. A score of 2.0 implies there is a chance of 1 in 10 2, or 1 in100, that the building will collapse.
A score of 0.0 implies a chance of 1 in 100, or 1 in 1. It is important to recognize that this estimate doesnot directly indicate that catastrophic building collapse will definitively occur. Different building types of varying vintage, shape and design will fail in different ways. More detailed structural investigation byqualified and experienced engineers is required to fully assess the seismic risks and rehabilitation issues of
any one building.Many districts in Oregon are well along in this process, and their data will exceed the accuracy of this
assessment.
8/3/2019 Statewide Seismic Needs Assessment report
http://slidepdf.com/reader/full/statewide-seismic-needs-assessment-report 10/341
Oregon Department of Geology and Mineral Industries Open-File Report O-07-02 Statewide Seismic Needs Assessment 2
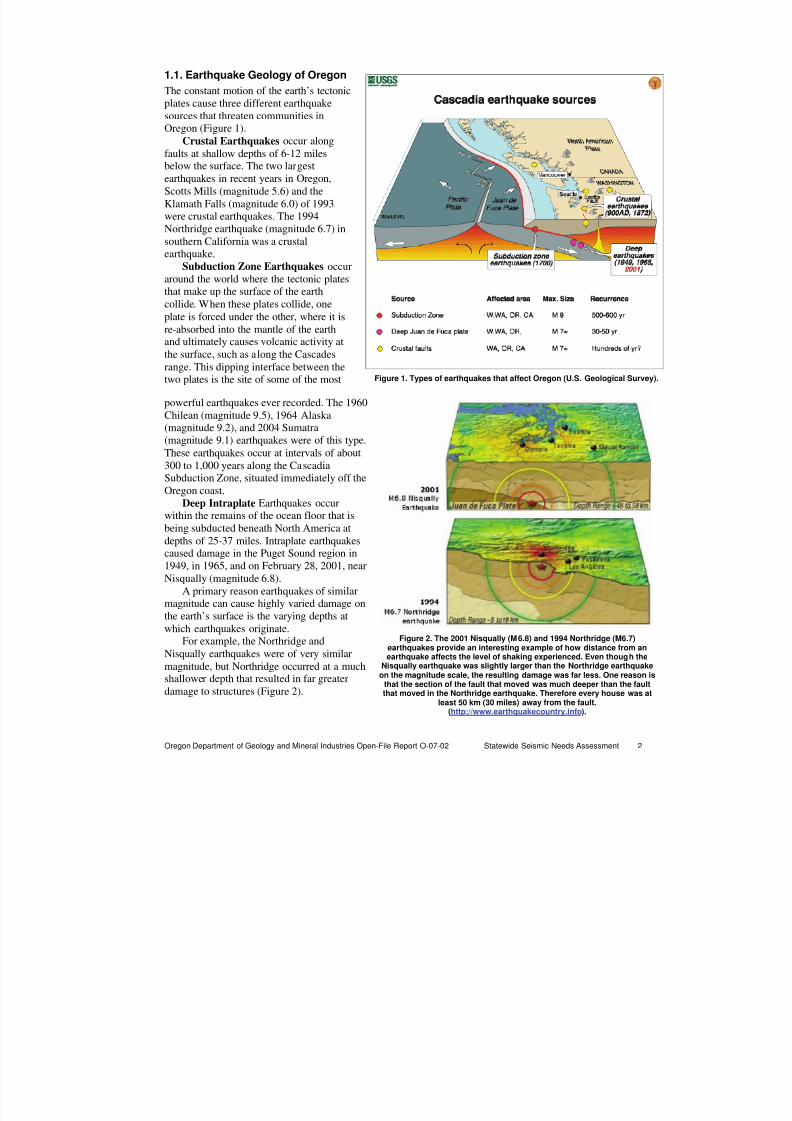
Figure 2. The 2001 Nisqually (M6.8) and 1994 Northridge (M6.7)earthquakes provide an interesting example of how distance from anearthquake affects the level of shaking experienced. Even though the
Nisqually earthquake was slightly larger than the Northridge earthquakeon the magnitude scale, the resulting damage was far less. One reason is
that the section of the fault that moved was much deeper than the faultthat moved in the Northridge earthquake. Therefore every house was at
least 50 km (30 miles) away from the fault.(http://www.earthquakecountry.info).
Figure 1. Types of earthquakes that affect Oregon (U.S. Geological Survey).
1.1. Earthquake Geology of Oregon
The constant motion of the earth’s tectonicplates cause three different earthquakesources that threaten communities inOregon (Figure 1).
Crustal Earthquakes occur along
faults at shallow depths of 6-12 milesbelow the surface. The two largestearthquakes in recent years in Oregon,Scotts Mills (magnitude 5.6) and theKlamath Falls (magnitude 6.0) of 1993were crustal earthquakes. The 1994Northridge earthquake (magnitude 6.7) insouthern California was a crustalearthquake.
Subduction Zone Earthquakes occuraround the world where the tectonic platesthat make up the surface of the earth
collide. When these plates collide, oneplate is forced under the other, where it isre-absorbed into the mantle of the earthand ultimately causes volcanic activity atthe surface, such as along the Cascadesrange. This dipping interface between thetwo plates is the site of some of the most
powerful earthquakes ever recorded. The 1960Chilean (magnitude 9.5), 1964 Alaska(magnitude 9.2), and 2004 Sumatra(magnitude 9.1) earthquakes were of this type.
These earthquakes occur at intervals of about300 to 1,000 years along the CascadiaSubduction Zone, situated immediately off theOregon coast.
Deep Intraplate Earthquakes occurwithin the remains of the ocean floor that isbeing subducted beneath North America atdepths of 25-37 miles. Intraplate earthquakescaused damage in the Puget Sound region in1949, in 1965, and on February 28, 2001, nearNisqually (magnitude 6.8).
A primary reason earthquakes of similar
magnitude can cause highly varied damage onthe earth’s surface is the varying depths atwhich earthquakes originate.
For example, the Northridge andNisqually earthquakes were of very similarmagnitude, but Northridge occurred at a muchshallower depth that resulted in far greaterdamage to structures (Figure 2).
8/3/2019 Statewide Seismic Needs Assessment report
http://slidepdf.com/reader/full/statewide-seismic-needs-assessment-report 11/341
Oregon Department of Geology and Mineral Industries Open-File Report O-07-02 Statewide Seismic Needs Assessment 3
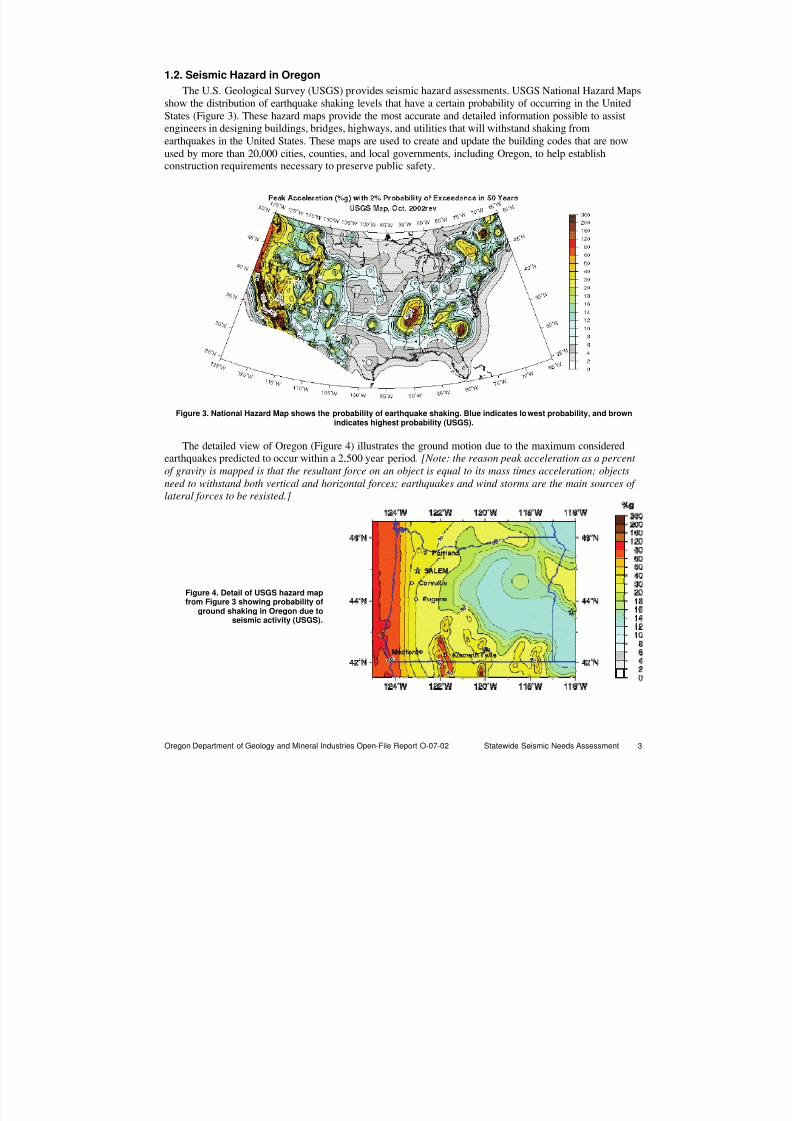
1.2. Seismic Hazard in Oregon
The U.S. Geological Survey (USGS) provides seismic hazard assessments. USGS National Hazard Mapsshow the distribution of earthquake shaking levels that have a certain probability of occurring in the UnitedStates (Figure 3). These hazard maps provide the most accurate and detailed information possible to assistengineers in designing buildings, bridges, highways, and utilities that will withstand shaking fromearthquakes in the United States. These maps are used to create and update the building codes that are now
used by more than 20,000 cities, counties, and local governments, including Oregon, to help establishconstruction requirements necessary to preserve public safety.
Figure 3. National Hazard Map shows the probability of earthquake shaking. Blue indicates lowest probability, and brownindicates highest probability (USGS).
The detailed view of Oregon (Figure 4) illustrates the ground motion due to the maximum considered
earthquakes predicted to occur within a 2,500 year period. [Note: the reason peak acceleration as a percent of gravity is mapped is that the resultant force on an object is equal to its mass times acceleration; objectsneed to withstand both vertical and horizontal forces; earthquakes and wind storms are the main sources of lateral forces to be resisted.]
Figure 4. Detail of USGS hazard mapfrom Figure 3 showing probability of
ground shaking in Oregon due toseismic activity (USGS).

8/3/2019 Statewide Seismic Needs Assessment report
http://slidepdf.com/reader/full/statewide-seismic-needs-assessment-report 12/341
Oregon Department of Geology and Mineral Industries Open-File Report O-07-02 Statewide Seismic Needs Assessment 4
Figure 5. Earthquake ground motion amplification in southern California.Shaking was much greater on landfill or soft soil (USGS).
It is important to note that the hazard map (Figure 4) portrays anticipated acceleration in bedrock.Various soil types have characteristics that can amplify ground motion. Passing from rock to soil, seismicwaves slow down but get bigger. Hence a soft, loose soil may shake more intensely than hard rock at thesame distance from the same earthquake. For example, shaking from an earthquake in Southern Californiacan be 5 or more times greater at a site in the Los Angeles basin than the level of shaking in the nearby
mountains (Figure 5).An extreme example of this for this
type of amplification was in the Marinadistrict of San Francisco during the 1989Loma Prieta earthquake. That earthquakewas 60 miles south of San Francisco. Mostof the Bay Area escaped serious damage.However, some sites in the Bay Area onlandfill or soft soil experienced significantshaking and damage. This amplifiedshaking was one of the reasons for thecollapse of the elevated Nimitz freeway inOakland. Ground motion at these sites wasmore than 10 times stronger than at
neighboring sites on rock.
In Oregon a similarsituation exists.In the Portland-Beaverton metro area,in the Willamette
Valley, along thecoast, and in south-central Oregon avariety of soils affectseismic waveamplification (Figure6). The manner inwhich we capturedthis critical soil-typedetermination isdescribed insection 3.3.
Figure 6. Universal Building Code soil types in Oregon (DOGAMI).
8/3/2019 Statewide Seismic Needs Assessment report
http://slidepdf.com/reader/full/statewide-seismic-needs-assessment-report 13/341
Oregon Department of Geology and Mineral Industries Open-File Report O-07-02 Statewide Seismic Needs Assessment 5
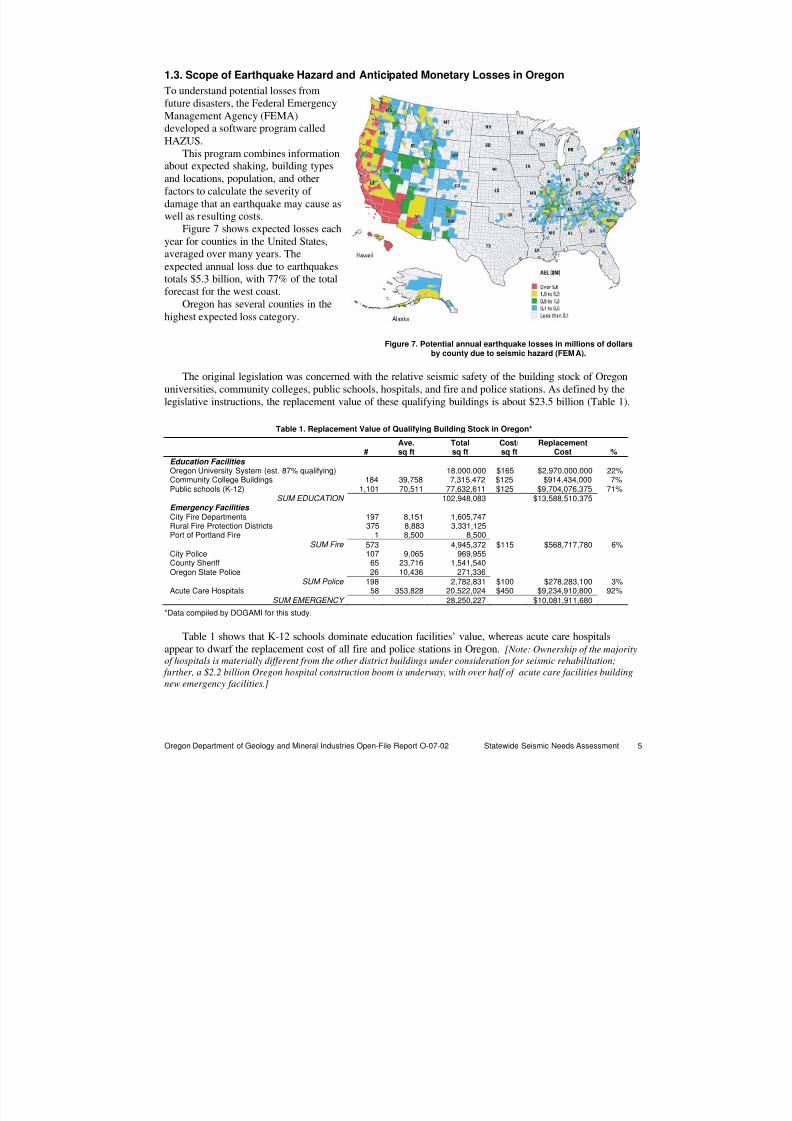
1.3. Scope of Earthquake Hazard and Anticipated Monetary Losses in Oregon
To understand potential losses fromfuture disasters, the Federal EmergencyManagement Agency (FEMA)developed a software program calledHAZUS.
This program combines informationabout expected shaking, building typesand locations, population, and otherfactors to calculate the severity of damage that an earthquake may cause aswell as resulting costs.
Figure 7 shows expected losses eachyear for counties in the United States,averaged over many years. Theexpected annual loss due to earthquakestotals $5.3 billion, with 77% of the totalforecast for the west coast.
Oregon has several counties in thehighest expected loss category.
Figure 7. Potential annual earthquake losses in millions of dollarsby county due to seismic hazard (FEMA).
The original legislation was concerned with the relative seismic safety of the building stock of Oregonuniversities, community colleges, public schools, hospitals, and fire and police stations. As defined by thelegislative instructions, the replacement value of these qualifying buildings is about $23.5 billion (Table 1).
Table 1. Replacement Value of Qualifying Building Stock in Oregon*
#
Ave.
sq ft
Total
sq ft
Cost/
sq ft
Replacement
Cost %Education Facilities Oregon University System (est. 87% qualifying) 18,000,000 $165 $2,970,000,000 22%Community College Buildings 184 39,758 7,315,472 $125 $914,434,000 7%Public schools (K-12) 1,101 70,511 77,632,611 $125 $9,704,076,375 71%
SUM EDUCATION 102,948,083 $13,588,510,375Emergency Facilities City Fire Departments 197 8,151 1,605,747Rural Fire Protection Districts 375 8,883 3,331,125Port of Portland Fire 1 8,500 8,500
SUM Fire 573 4,945,372 $115 $568,717,780 6%City Police 107 9,065 969,955County Sheriff 65 23,716 1,541,540Oregon State Police 26 10,436 271,336
SUM Police 198 2,782,831 $100 $278,283,100 3%Acute Care Hospitals 58 353,828 20,522,024 $450 $9,234,910,800 92%
SUM EMERGENCY 28,250,227 $10,081,911,680
*Data compiled by DOGAMI for this study.
Table 1 shows that K-12 schools dominate education facilities’ value, whereas acute care hospitalsappear to dwarf the replacement cost of all fire and police stations in Oregon. [Note: Ownership of the majorityof hospitals is materially different from the other district buildings under consideration for seismic rehabilitation;
further, a $2.2 billion Oregon hospital construction boom is underway, with over half of acute care facilities buildingnew emergency facilities.]
8/3/2019 Statewide Seismic Needs Assessment report
http://slidepdf.com/reader/full/statewide-seismic-needs-assessment-report 14/341
Oregon Department of Geology and Mineral Industries Open-File Report O-07-02 Statewide Seismic Needs Assessment 6
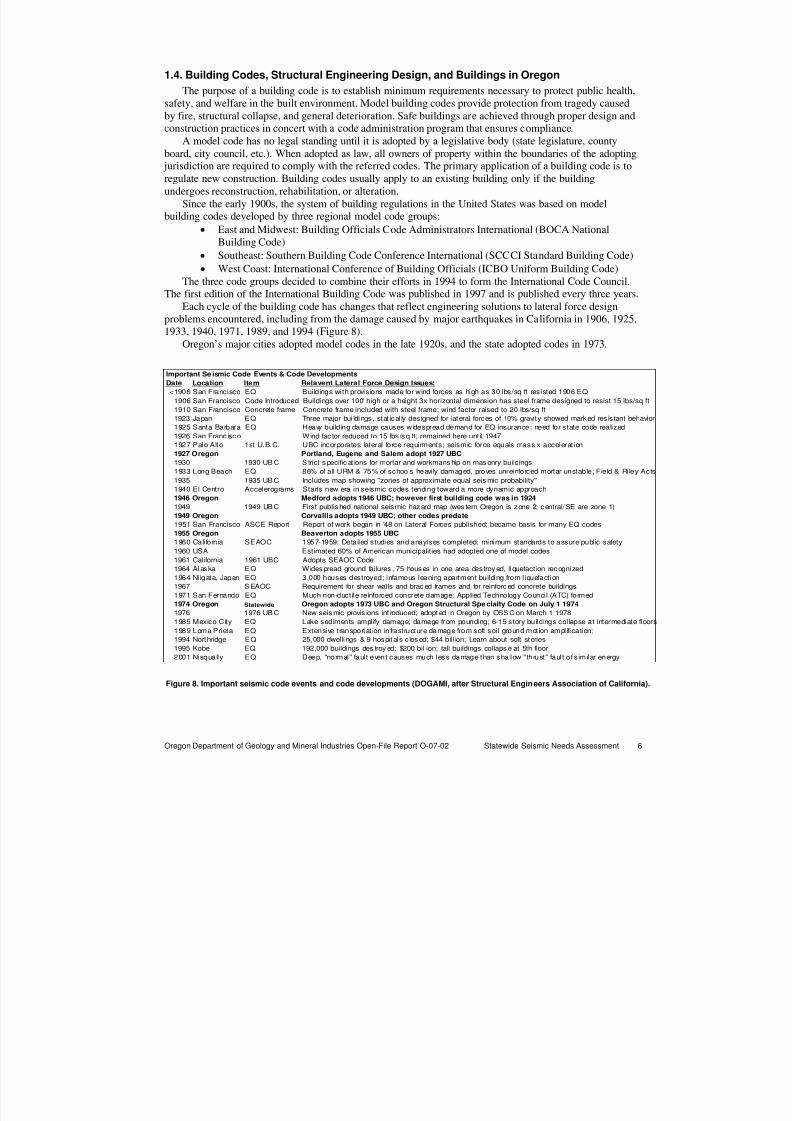
1.4. Building Codes, Structural Engineering Design, and Buildings in Oregon
The purpose of a building code is to establish minimum requirements necessary to protect public health,safety, and welfare in the built environment. Model building codes provide protection from tragedy causedby fire, structural collapse, and general deterioration. Safe buildings are achieved through proper design andconstruction practices in concert with a code administration program that ensures compliance.
A model code has no legal standing until it is adopted by a legislative body (state legislature, county
board, city council, etc.). When adopted as law, all owners of property within the boundaries of the adopting jurisdiction are required to comply with the referred codes. The primary application of a building code is toregulate new construction. Building codes usually apply to an existing building only if the buildingundergoes reconstruction, rehabilitation, or alteration.
Since the early 1900s, the system of building regulations in the United States was based on modelbuilding codes developed by three regional model code groups:
• East and Midwest: Building Officials Code Administrators International (BOCA NationalBuilding Code)
• Southeast: Southern Building Code Conference International (SCCCI Standard Building Code)
• West Coast: International Conference of Building Officials (ICBO Uniform Building Code)The three code groups decided to combine their efforts in 1994 to form the International Code Council.
The first edition of the International Building Code was published in 1997 and is published every three years.
Each cycle of the building code has changes that reflect engineering solutions to lateral force designproblems encountered, including from the damage caused by major earthquakes in California in 1906, 1925,1933, 1940, 1971, 1989, and 1994 (Figure 8).
Oregon’s major cities adopted model codes in the late 1920s, and the state adopted codes in 1973.
Figure 8. Important seismic code events and code developments (DOGAMI, after Structural Engineers Association of California).
Important Se ismic Code Events & Code Developments
Date Location Item Relavent Lateral Force Design Issues:
<1906 San Francisco EQ Buildings with provisions made for wind forces as high as 30 lbs/sq ft resisted 1906 EQ
1906 San Francisco Code Introduced Buildings over 100' high or a height 3x horizontal dimension has steel frame designed to resist 15 lbs/sq ft
1910 San Francisco Concrete frame Concrete frame included with steel frame; wind factor raised to 20 lbs/sq ft
1923 Japan EQ Three major bui ldings, stat ical ly designed for lateral forces of 10% gravity showed marked resistant behavior
1925 Santa Barbara EQ Heavy building damage causes widespread demand for EQ insurance; need for state code realized
1926 San Franc isco Wind fac tor reduced to 15 lbs /sq ft; remained here unt il 1947
1927 Palo Alto 1st U.B.C. UBC incorporates lateral force requirments; seismic force equals mass x acceleration
1927 Oregon Portland, Eugene and Salem adopt 1927 UBC1930 1930 UBC Strict s pecific at ions for mortar and workmans hip on mas onry buildings
1933 Long Beach EQ 86% of all URM & 75% of schools heavily damaged, proves unreinforced mortar unstable; Field & Riley Acts
1935 1935 UBC Includes map showing "zones of approximate equal seis mic probability"
1940 El Centro Accelerograms Starts new era in seismic codes tending toward a more dynamic approach
1946 Oregon Medford adopts 1946 UBC; however first building code was in 1924
1949 1949 UBC First published national seismic hazard map (wes tern Oregon is zone 2; central/SE are zone 1)
1949 Oregon Corvallis adopts 1949 UBC; other codes predate
1951 San Francisco ASCE Report Report of work began in '48 on Lateral Forces published; became basis for many EQ codes
1955 Oregon Beaverton adopts 1955 UBC
1960 California SEAOC 1957-1959: Detailed studies and anaylses completed; minimum standards to assure public safety
1960 USA Estimated 60% of American municipalities had adopted one of model codes
1961 California 1961 UBC Adopts SEAOC Code
1964 Alaska EQ Widespread ground failures , 75 houses in one area des troyed, li quefact ion recognized
1964 Niigata, Japan EQ 3,000 houses destroyed; infamous leaning apartment building from liquefaction
1967 SEAOC Requirement for shear walls and brac ed frames and for reinforc ed concrete buildings
1971 San Fernando EQ Much non-ductile reinforced concrete damage; Applied Technology Council (ATC) formed
1974 Oregon Statewide Oregon adopts 1973 UBC and Oregon Structural Specialty Code on July 1 19741976 1976 UBC New seis mic provis ions int roduced; adopt ed in Oregon by OSSC on March 1 1978
1985 Mexico City EQ Lake sediments amplify damage; damage from pounding; 6-15 story buildings collapse at intermediate floors
1989 Loma Prieta EQ Extensive transportation infrastructure damage from soft soi l ground motion amplification;
1994 Northridge EQ 25,000 dwellings & 9 hospitals c losed; $44 bill ion; Learn about soft stories
1995 Kobe EQ 192,000 buildings des troy ed; $200 billion; tall buildings collaps e at 5th floor
2001 Nisqually EQ Deep, "normal" fault event causes much less damage than shallow "thrust" fault of similar energy

8/3/2019 Statewide Seismic Needs Assessment report
http://slidepdf.com/reader/full/statewide-seismic-needs-assessment-report 15/341
Oregon Department of Geology and Mineral Industries Open-File Report O-07-02 Statewide Seismic Needs Assessment 7
Despite having adopted building codes, Oregon was designated a low seismic hazard region until theramifications of the Cascadia Subduction Zone were recognized between 1986 and 1993 (also see Figure 9).
Figure 9. As recently as 1988 Oregon wascategorized as a region of low seismic hazard.
Discovery of the Cascadia Subduction Zone(darker red area offshore Oregon andWashington) caused western Oregon to bereclassified as an area of higher seismichazard (USGS).
Because structural building codes reflect the lateral forces anticipated within a specific seismicity region,much construction in Oregon for certain building materials and lateral force systems before 1994 waseffectively under-designed. [Note: An exception is wood-frame construction. The most important codechanges for wood frame were incorporated in the 1976 Uniform Building Code, adopted 1978, and werelargely independent of seismic zone designation.]
Oregon public school district voters approved bonds totaling $3.7 billion during 1997–2006 to build 135new schools and make additions and renovations to many more. However, the majority of the 1,101 K-12schools being assessed were built in the 1945–1975 period, before either seismic zones or building codeswere updated (Figure 10). By comparison, 44 of the 184 community college buildings assessed were builtduring 1994–2006. In contrast, fire and police station median age is about 32 years old. Generally beingmuch smaller, simpler structures, these emergency facilities will not have the degree of risk for collapse dueto earthquakes as will the K-12 buildings.
Figure 10. Construction dates for Oregon education and emergency facilities.
Education & Emergency Facility Construction Dates
0
50
100
150
200
250
300
350
400
450
500
1900 1910 1920 1930 1940 1950 1960 1970 1980 1990 2000
Decade Built
F r e q u e n c y
K-12 (n=2187)
Fire & Police (n=882)
Community College (n=181)
Median
Median Age Fire &
Median
8/3/2019 Statewide Seismic Needs Assessment report
http://slidepdf.com/reader/full/statewide-seismic-needs-assessment-report 16/341
Oregon Department of Geology and Mineral Industries Open-File Report O-07-02 Statewide Seismic Needs Assessment 8
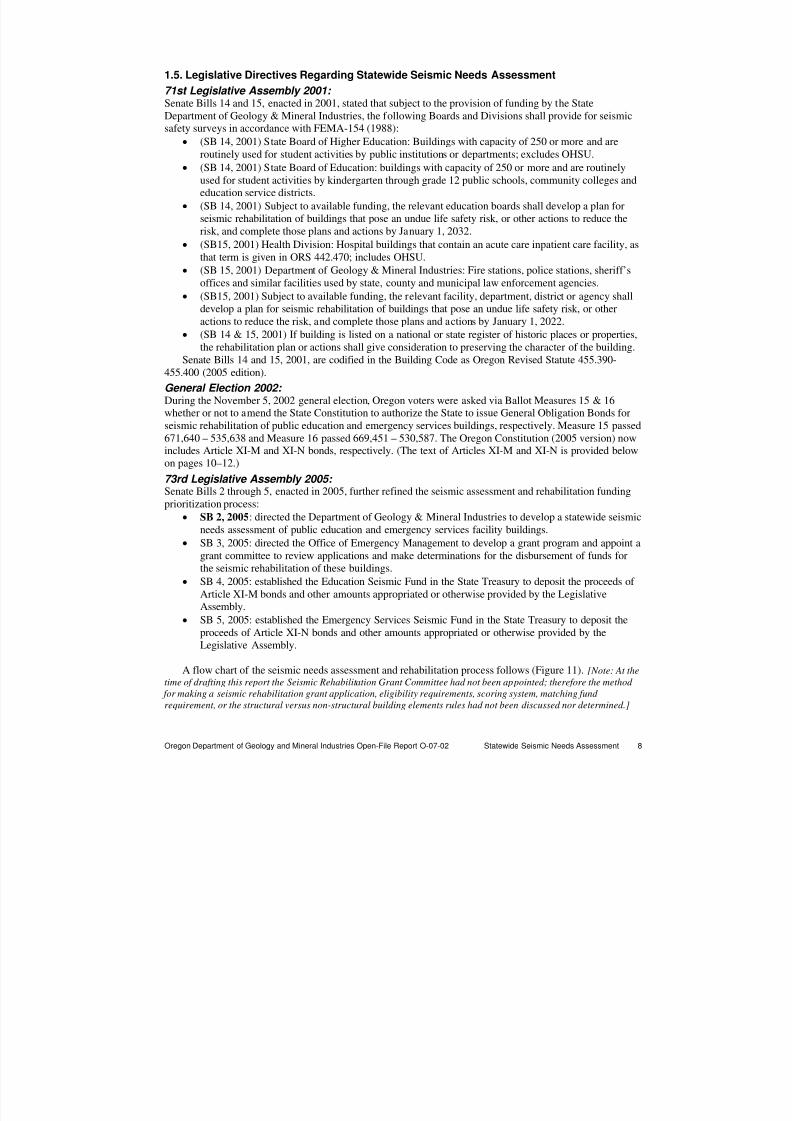
1.5. Legislative Directives Regarding Statewide Seismic Needs Assessment
71st Legislative Assembly 2001: Senate Bills 14 and 15, enacted in 2001, stated that subject to the provision of funding by the StateDepartment of Geology & Mineral Industries, the following Boards and Divisions shall provide for seismicsafety surveys in accordance with FEMA-154 (1988):
• (SB 14, 2001) State Board of Higher Education: Buildings with capacity of 250 or more and are
routinely used for student activities by public institutions or departments; excludes OHSU.• (SB 14, 2001) State Board of Education: buildings with capacity of 250 or more and are routinely
used for student activities by kindergarten through grade 12 public schools, community colleges andeducation service districts.
• (SB 14, 2001) Subject to available funding, the relevant education boards shall develop a plan forseismic rehabilitation of buildings that pose an undue life safety risk, or other actions to reduce therisk, and complete those plans and actions by January 1, 2032.
• (SB15, 2001) Health Division: Hospital buildings that contain an acute care inpatient care facility, asthat term is given in ORS 442.470; includes OHSU.
• (SB 15, 2001) Department of Geology & Mineral Industries: Fire stations, police stations, sheriff’soffices and similar facilities used by state, county and municipal law enforcement agencies.
• (SB15, 2001) Subject to available funding, the relevant facility, department, district or agency shalldevelop a plan for seismic rehabilitation of buildings that pose an undue life safety risk, or otheractions to reduce the risk, and complete those plans and actions by January 1, 2022.
• (SB 14 & 15, 2001) If building is listed on a national or state register of historic places or properties,the rehabilitation plan or actions shall give consideration to preserving the character of the building.
Senate Bills 14 and 15, 2001, are codified in the Building Code as Oregon Revised Statute 455.390-455.400 (2005 edition).
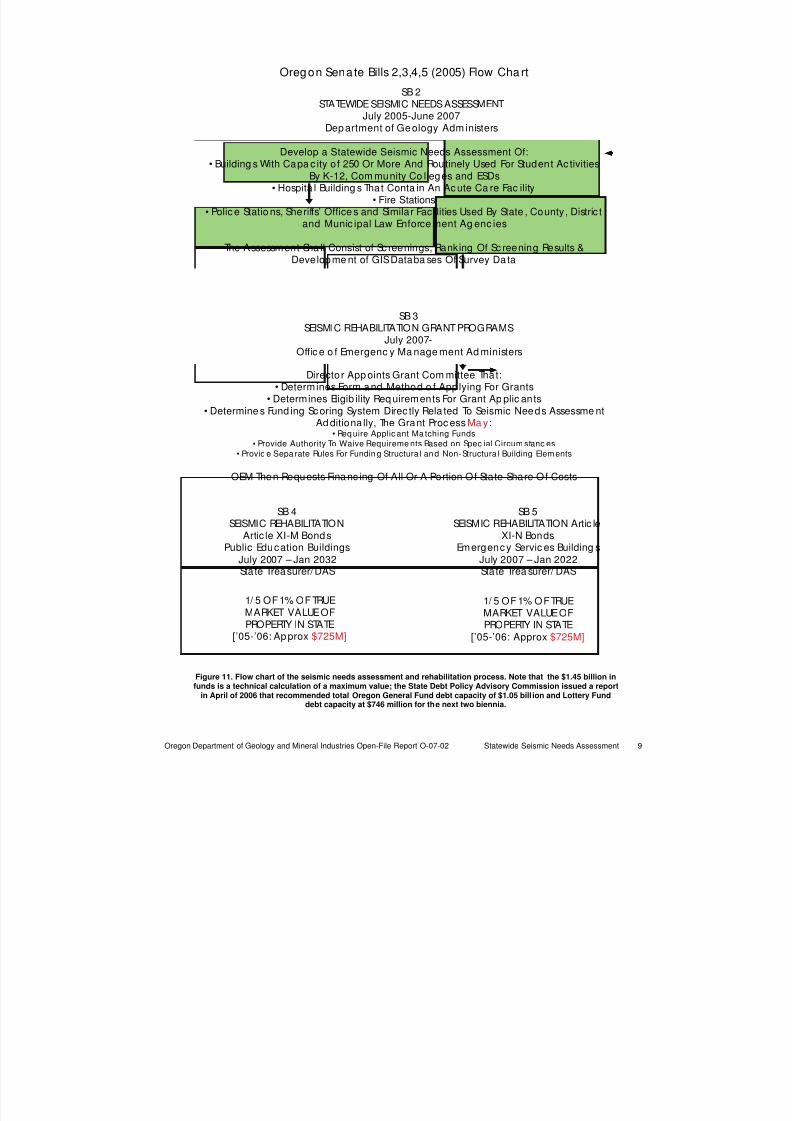
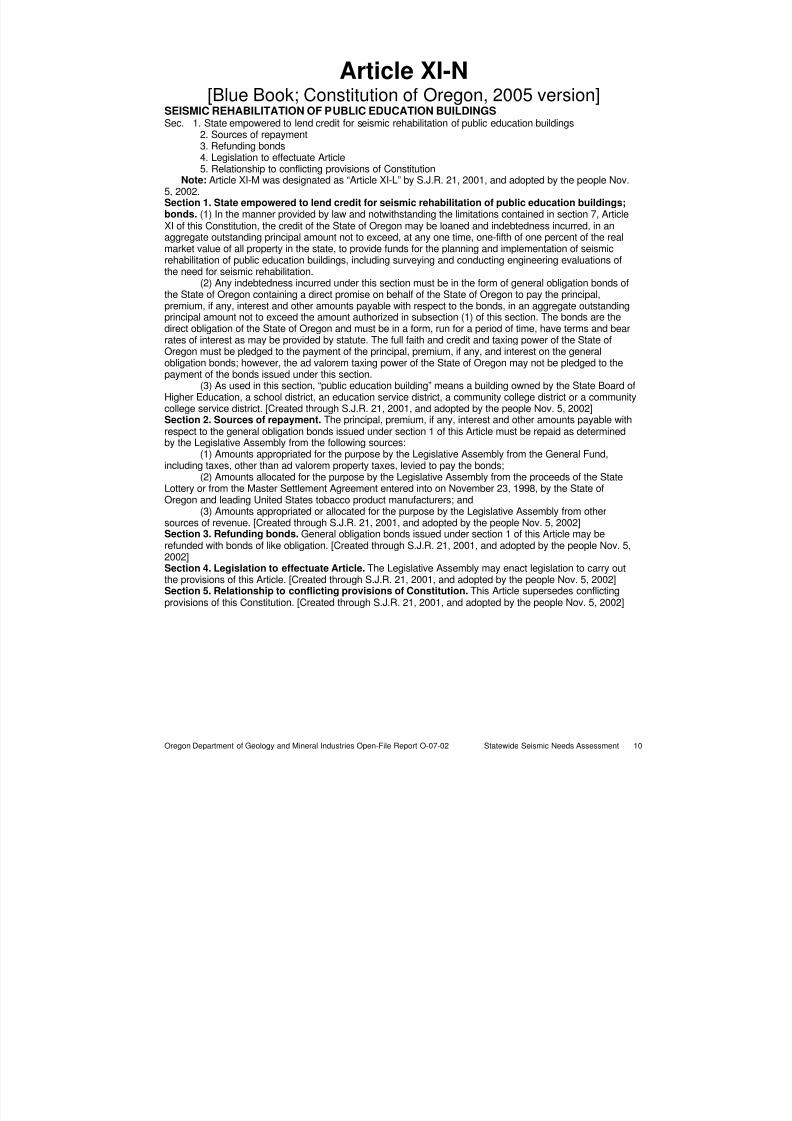
General Election 2002: During the November 5, 2002 general election, Oregon voters were asked via Ballot Measures 15 & 16whether or not to amend the State Constitution to authorize the State to issue General Obligation Bonds forseismic rehabilitation of public education and emergency services buildings, respectively. Measure 15 passed671,640 – 535,638 and Measure 16 passed 669,451 – 530,587. The Oregon Constitution (2005 version) now
includes Article XI-M and XI-N bonds, respectively. (The text of Articles XI-M and XI-N is provided belowon pages 10–12.)
73rd Legislative Assembly 2005: Senate Bills 2 through 5, enacted in 2005, further refined the seismic assessment and rehabilitation fundingprioritization process:
• SB 2, 2005: directed the Department of Geology & Mineral Industries to develop a statewide seismicneeds assessment of public education and emergency services facility buildings.
• SB 3, 2005: directed the Office of Emergency Management to develop a grant program and appoint agrant committee to review applications and make determinations for the disbursement of funds forthe seismic rehabilitation of these buildings.
• SB 4, 2005: established the Education Seismic Fund in the State Treasury to deposit the proceeds of Article XI-M bonds and other amounts appropriated or otherwise provided by the Legislative
Assembly.• SB 5, 2005: established the Emergency Services Seismic Fund in the State Treasury to deposit the
proceeds of Article XI-N bonds and other amounts appropriated or otherwise provided by theLegislative Assembly.
A flow chart of the seismic needs assessment and rehabilitation process follows (Figure 11). [Note: At thetime of drafting this report the Seismic Rehabilitation Grant Committee had not been appointed; therefore the method
for making a seismic rehabilitation grant application, eligibility requirements, scoring system, matching fund requirement, or the structural versus non-structural building elements rules had not been discussed nor determined.]
8/3/2019 Statewide Seismic Needs Assessment report
http://slidepdf.com/reader/full/statewide-seismic-needs-assessment-report 17/341
Oregon Department of Geology and Mineral Industries Open-File Report O-07-02 Statewide Seismic Needs Assessment 9
Oregon Senate Bills 2,3,4,5 (2005) Flow Cha rt
SB 2STATEWIDE SEISMIC NEEDS ASSESSMENT
July 2005-June 2007Department of Geology Adm inisters
SB 3SEISMIC REHABILITATION GRANT PROGRAMS
July 2007-Offic e o f Emergenc y Ma nage ment Ad ministers
SB 4SEISMIC REHABILITATION
Artic le XI-M BondsPublic Education Buildings
July 2007 – Jan 2032State Treasurer/DAS
SB 5SEISMIC REHABILITATION Artic le
XI-N BondsEmergency Servic es Building s
July 2007 – Jan 2022State Trea surer/ DAS
1/ 5 OF 1% OF TRUEMARKET VALUE OFPROPERTY IN STATE
[’05-’06: Approx $725M]
Director App oints Grant Com mittee That:• Determines Form and Method o f App lying For Grants
• Determines Eligib ility Req uirements For Grant Ap plic ants• Determine s Fund ing Sc oring System Direc tly Rela ted To Seismic Needs Assessme nt
Ad ditiona lly, The Grant Proc ess Ma y:• Req uire Applic ant Ma tching Funds
• Provide Authority To Waive Requireme nts Based on Spec ial Circum stanc es•
Provid e Sepa rate Rules For Fundin g Structura l and Non-Structura l Building Elements
OEM Then Requests Financ ing Of All Or A Portion Of State Share Of Costs
Develop a Statewide Seismic Needs Assessment Of:• Building s With Capa c ity of 250 Or More And Routinely Used For Student Ac tivities
By K-12, Com munity Co lleges and ESDs• Hospita l Building s That Conta in An Ac ute Ca re Fac ility
• Fire Stations• Polic e Statio ns, Sheriffs’ Office s and Similar Fac ilities Used By State , County, Distric t
and Munic ipal Law Enforce ment Ag enc ies
The Assessment Sha ll Consist of Sc reenings, Ranking Of Sc reening Results &Developme nt of GIS Databa ses Of Survey Data
1/ 5 OF 1% OF TRUEMARKET VALUE OFPROPERTY IN STATE
[’05-’06: Approx $725M]
Figure 11. Flow chart of the seismic needs assessment and rehabilitation process. Note that the $1.45 billion infunds is a technical calculation of a maximum value; the State Debt Policy Advisory Commission issued a report
in April of 2006 that recommended total Oregon General Fund debt capacity of $1.05 bill ion and Lottery Funddebt capacity at $746 million for the next two biennia.
8/3/2019 Statewide Seismic Needs Assessment report
http://slidepdf.com/reader/full/statewide-seismic-needs-assessment-report 18/341
Oregon Department of Geology and Mineral Industries Open-File Report O-07-02 Statewide Seismic Needs Assessment 10
Article XI-N[Blue Book; Constitution of Oregon, 2005 version]
SEISMIC REHABILITATION OF PUBLIC EDUCATION BUILDINGS Sec. 1. State empowered to lend credit for seismic rehabilitation of public education buildings
2. Sources of repayment
3. Refunding bonds4. Legislation to effectuate Article5. Relationship to conflicting provisions of Constitution
Note: Article XI-M was designated as “Article XI-L” by S.J.R. 21, 2001, and adopted by the people Nov.5, 2002. Section 1. State empowered to lend credit for seismic rehabilitation of public education buildings;bonds. (1) In the manner provided by law and notwithstanding the limitations contained in section 7, ArticleXI of this Constitution, the credit of the State of Oregon may be loaned and indebtedness incurred, in anaggregate outstanding principal amount not to exceed, at any one time, one-fifth of one percent of the realmarket value of all property in the state, to provide funds for the planning and implementation of seismicrehabilitation of public education buildings, including surveying and conducting engineering evaluations ofthe need for seismic rehabilitation.
(2) Any indebtedness incurred under this section must be in the form of general obligation bonds ofthe State of Oregon containing a direct promise on behalf of the State of Oregon to pay the principal,
premium, if any, interest and other amounts payable with respect to the bonds, in an aggregate outstandingprincipal amount not to exceed the amount authorized in subsection (1) of this section. The bonds are thedirect obligation of the State of Oregon and must be in a form, run for a period of time, have terms and bearrates of interest as may be provided by statute. The full faith and credit and taxing power of the State ofOregon must be pledged to the payment of the principal, premium, if any, and interest on the generalobligation bonds; however, the ad valorem taxing power of the State of Oregon may not be pledged to thepayment of the bonds issued under this section.
(3) As used in this section, “public education building” means a building owned by the State Board ofHigher Education, a school district, an education service district, a community college district or a communitycollege service district. [Created through S.J.R. 21, 2001, and adopted by the people Nov. 5, 2002] Section 2. Sources of repayment. The principal, premium, if any, interest and other amounts payable withrespect to the general obligation bonds issued under section 1 of this Article must be repaid as determinedby the Legislative Assembly from the following sources:
(1) Amounts appropriated for the purpose by the Legislative Assembly from the General Fund,including taxes, other than ad valorem property taxes, levied to pay the bonds;
(2) Amounts allocated for the purpose by the Legislative Assembly from the proceeds of the StateLottery or from the Master Settlement Agreement entered into on November 23, 1998, by the State ofOregon and leading United States tobacco product manufacturers; and
(3) Amounts appropriated or allocated for the purpose by the Legislative Assembly from othersources of revenue. [Created through S.J.R. 21, 2001, and adopted by the people Nov. 5, 2002] Section 3. Refunding bonds. General obligation bonds issued under section 1 of this Article may berefunded with bonds of like obligation. [Created through S.J.R. 21, 2001, and adopted by the people Nov. 5,2002] Section 4. Legislation to effectuate Article. The Legislative Assembly may enact legislation to carry outthe provisions of this Article. [Created through S.J.R. 21, 2001, and adopted by the people Nov. 5, 2002] Section 5. Relationship to conflicting provisions of Constitution. This Article supersedes conflicting
provisions of this Constitution. [Created through S.J.R. 21, 2001, and adopted by the people Nov. 5, 2002]
8/3/2019 Statewide Seismic Needs Assessment report
http://slidepdf.com/reader/full/statewide-seismic-needs-assessment-report 19/341
Oregon Department of Geology and Mineral Industries Open-File Report O-07-02 Statewide Seismic Needs Assessment 11
Article XI-N[Blue Book; Constitution of Oregon, 2005 version]
SEISMIC REHABILITATION OF EMERGENCY SERVICES BUILDINGSSec. 1. State empowered to lend credit for seismic rehabilitation of emergency services buildings; bonds
2. Sources of repayment3. Refunding bonds4. Legislation to effectuate Article5. Relationship to conflicting provisions of Constitution
Note: Article XI-N was designated as “Article XI-L” by S.J.R. 22, 2001, and adopted by the people Nov.5, 2002.
Section 1. State empowered to lend credit for seismic rehabilitation of emergency servicesbuildings; bonds. (1) In the manner provided by law and notwithstanding the limitations contained in section7, Article XI of this Constitution, the credit of the State of Oregon may be loaned and indebtedness incurred,in an aggregate outstanding principal amount not to exceed, at any one time, one-fifth of one percent of thereal market value of all property in the state, to provide funds for the planning and implementation of seismicrehabilitation of emergency services buildings, including surveying and conducting engineering evaluationsof the need for seismic rehabilitation.
(2) Any indebtedness incurred under this section must be in the form of general obligation bonds ofthe State of Oregon containing a direct promise on behalf of the State of Oregon to pay the principal,
premium, if any, interest and other amounts payable with respect to the bonds, in an aggregate outstandingprincipal amount not to exceed the amount authorized in subsection (1) of this section. The bonds are thedirect obligation of the State of Oregon and must be in a form, run for a period of time, have terms and bearrates of interest as may be provided by statute. The full faith and credit and taxing power of the State ofOregon must be pledged to the payment of the principal, premium, if any, and interest on the generalobligation bonds; however, the ad valorem taxing power of the State of Oregon may not be pledged to thepayment of the bonds issued under this section.
(3) As used in this section:(a) “Acute inpatient care facility” means a licensed hospital with an organized medical staff, with
permanent facilities that include inpatient beds, and with comprehensive medical services, includingphysician services and continuous nursing services under the supervision of registered nurses, to providediagnosis and medical or surgical treatment primarily for but not limited to acutely ill patients and accidentvictims. “Acute inpatient care facility” includes the Oregon Health and Science University.
(b) “Emergency services building” means a public building used for fire protection services, a hospitalbuilding that contains an acute inpatient care facility, a police station, a sheriff’s office or a similar facilityused by a state, county, district or municipal law enforcement agency. [Created through S.J.R. 22, 2001, andadopted by the people Nov. 5, 2002]
Section 2. Sources of repayment. The principal, premium, if any, interest and other amountspayable with respect to the general obligation bonds issued under section 1 of this Article must be repaid asdetermined by the Legislative Assembly from the following sources:
(1) Amounts appropriated for the purpose by the Legislative Assembly from the General Fund,including taxes, other than ad valorem property taxes, levied to pay the
(2) Amounts allocated for the purpose by the Legislative Assembly from the proceeds of the StateLottery or from the Master Settlement Agreement entered into on November 23, 1998, by the State ofOregon and leading United States tobacco product manufacturers; and
(3) Amounts appropriated or allocated for the purpose by the Legislative Assembly from other
sources of revenue. [Created through S.J.R. 22, 2001, and adopted by the people Nov. 5, 2002]Section 3. Refunding bonds. General obligation bonds issued under section 1 of this Article maybe refunded with bonds of like obligation. [Created through S.J.R. 22, 2001, and adopted by the people Nov.5, 2002]
Section 4. Legislation to effectuate Article. The Legislative Assembly may enact legislation tocarry out the provisions of this Article. [Created through S.J.R. 22, 2001, and adopted by the people Nov. 5,2002]
Section 5. Relationship to conflicting provisions of Constitution. This Article supersedesconflicting provisions of this Constitution. [Created through S.J.R. 21, 2001, and adopted by the people Nov.5, 2002]

8/3/2019 Statewide Seismic Needs Assessment report
http://slidepdf.com/reader/full/statewide-seismic-needs-assessment-report 20/341
Oregon Department of Geology and Mineral Industries Open-File Report O-07-02 Statewide Seismic Needs Assessment 12
The key directives to DOGAMI to conduct the seismic needs assessment were [excerpted from the text
of Senate Bill 2, 2005 (emphasis added)]:
SECTION 1:(1) The State Department of Geology and Mineral Industries [in consultation with the Seismic Safety Policy
Advisory Commission, the Office of Emergency Management, the Department of Human Services, the
State Board of Education, the State Board of Higher Education] and any grant committee establishedpursuant to a statewide grant program for seismic rehabilitation, shall develop a statewide seismic needsassessment that includes seismic safety surveys of:(a) Buildings that have a capacity of 250 or more persons and are routinely used for student activities by
kindergarten through grade 12 public schools, community colleges and education service districts;(b) Hospital buildings that contain an acute inpatient care facility;(c) Fire stations; and(d) Police stations, sheriffs' offices and similar facilities used by state, county, district and municipal law
enforcement agencies.(2) The statewide seismic needs assessment shall consist of:
(a) Rapid visual screenings of the buildings specified in this section, conducted in accordance with thestandards for rapid visual screening procedures established in 'Rapid Visual Screening of Buildingsfor Potential Seismic Hazards: A Handbook,' FEMA-154, 2002 Edition, or an equivalent standardadopted by the State Department of Geology and Mineral Industries;
(b) The ranking of the rapid visual screening results in risk categories based on• need,• importance of the building to the community,• risk to the building posed by its location,• risk posed to the community by the collapse of the building during a seismic event,• projected cost of the necessary seismic rehabilitation• other categories determined necessary by the State Department of Geology and Mineral
Industries;(c) The development of geographic information system (GIS) databases of survey data and the sharing
of that data with interested parties.(3) The statewide seismic needs assessment may include:
(a) Rapid visual screenings conducted by entities or persons other than the State Department of Geologyand Mineral Industries;
(b) Questionnaires or other information gathering techniques to supplement the rapid visual screeningand aid in the ranking of rapid visual screening results in risk categories; and
(c) Training for persons interested in conducting rapid visual screenings.
SECTION 2:The statewide seismic needs assessment specified in section 1 of this 2005 Act shall be completed by July1, 2007.
8/3/2019 Statewide Seismic Needs Assessment report
http://slidepdf.com/reader/full/statewide-seismic-needs-assessment-report 21/341
Oregon Department of Geology and Mineral Industries Open-File Report O-07-02 Statewide Seismic Needs Assessment 13
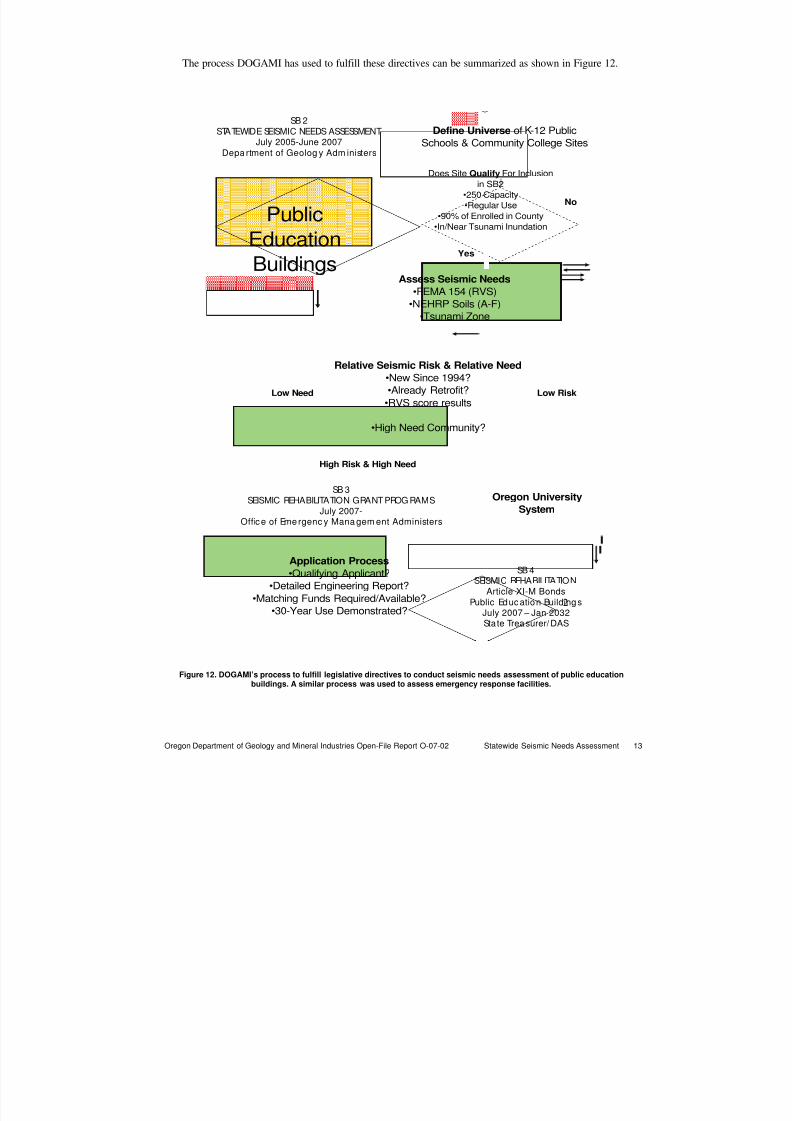
The process DOGAMI has used to fulfill these directives can be summarized as shown in Figure 12.
2
Public
Education
Buildings
SB 3SEISMIC REHABILITATION GRANT PROG RAMS
July 2007-Office of Emergenc y Mana gem ent Administers
SB 4SEISMIC REHABILITATION
Article XI-M Bonds
Public Education BuildingsJuly 2007 – Jan 2032State Treasurer/ DAS
SB 2
STATEWIDE SEISMIC NEEDS ASSESSMENTJuly 2005-June 2007
Department of Geolog y Adm inisters
Does Site Qualify For Inclusion
in SB2
•250 Capacity•Regular Use
•90% of Enrolled in County
•In/Near Tsunami Inundation
Define Universe of k-12 PublicSchools & Community College Sites
Assess Seismic Needs
•FEMA 154 (RVS)
•NEHRP Soils (A-F)•Tsunami Zone
Relative Seismic Risk & Relative Need
•New Since 1994?•Already Retrofit?
•RVS score results
•High Need Community?
Application Process
•Qualifying Applicant?•Detailed Engineering Report?
•Matching Funds Required/Available?•30-Year Use Demonstrated?
Yes
No
High Risk & High Need
Low Need Low Risk
Oregon University
System
Figure 12. DOGAMI’s process to fulfill legislative directives to conduct seismic needs assessment of public educationbuildings. A similar process was used to assess emergency response facilities.
K

8/3/2019 Statewide Seismic Needs Assessment report
http://slidepdf.com/reader/full/statewide-seismic-needs-assessment-report 22/341
Oregon Department of Geology and Mineral Industries Open-File Report O-07-02 Statewide Seismic Needs Assessment 14
2.0. DEFINING THE UNIVERSE FOR SEISMIC NEEDS ASSESSMENT
2.1: Qualifying Buildings: K-12 Public Schools and Education Service Districts (ESD)
In the absence of a data set containing capacity information, DOGAMI used the Oregon Department of Education’s 2005-06 schools enrollment database to determine the qualifying schools sites. Initially, weselected an enrollment of 200 as the cutoff; we then increased the number of schools assessed by employing
two additional rules:• at least 90% of each county’s enrolled students must be included
• 100% of public schools potentially at risk of tsunami inundation must be includedThe effect of these criteria is summarized in Table 2 (see Appendix A for detailed listing). All 1,030
schools in the state with an enrollment of 154 or higher, along with 71 schools with enrollments ranging from8 to 153, were included. The process resulted in the inclusion of nearly 97% of all enrolled K-12 students.
Table 2. Oregon Statewide Seismic Needs Assessment: DOGAMI's Qualifying Public K-12 Schools andEducation Service Districts
n is number of students enrolled; DNQ indicates do not qualify.
8/3/2019 Statewide Seismic Needs Assessment report
http://slidepdf.com/reader/full/statewide-seismic-needs-assessment-report 23/341
Oregon Department of Geology and Mineral Industries Open-File Report O-07-02 Statewide Seismic Needs Assessment 15
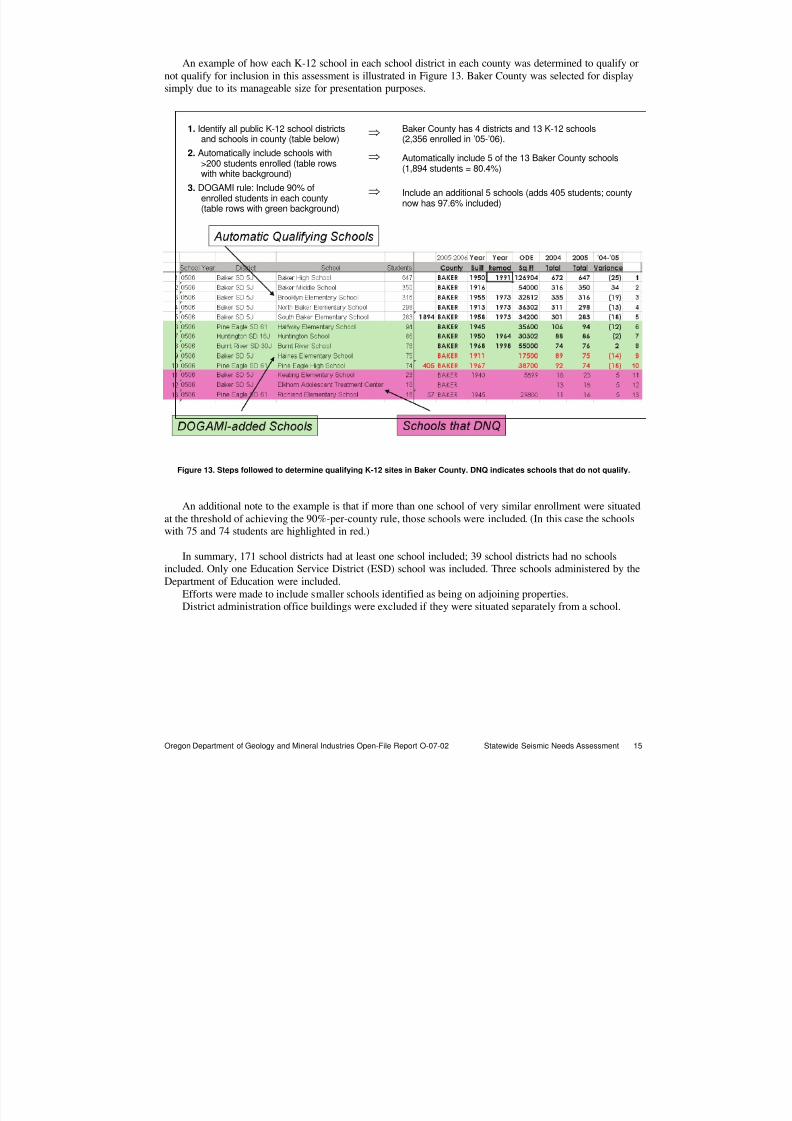
An example of how each K-12 school in each school district in each county was determined to qualify ornot qualify for inclusion in this assessment is illustrated in Figure 13. Baker County was selected for displaysimply due to its manageable size for presentation purposes.
1. Identify all public K-12 school districtsand schools in county (table below)
⇒ Baker County has 4 districts and 13 K-12 schools(2,356 enrolled in ’05-’06).
2. Automatically include schools with>200 students enrolled (table rowswith white background)
⇒ Automatically include 5 of the 13 Baker County schools(1,894 students = 80.4%)
3. DOGAMI rule: Include 90% ofenrolled students in each county(table rows with green background)
⇒ Include an additional 5 schools (adds 405 students; countynow has 97.6% included)
Figure 13. Steps followed to determine qualifying K-12 sites in Baker County. DNQ indicates schools that do not qualify.
An additional note to the example is that if more than one school of very similar enrollment were situatedat the threshold of achieving the 90%-per-county rule, those schools were included. (In this case the schoolswith 75 and 74 students are highlighted in red.)
In summary, 171 school districts had at least one school included; 39 school districts had no schoolsincluded. Only one Education Service District (ESD) school was included. Three schools administered by theDepartment of Education were included.
Efforts were made to include smaller schools identified as being on adjoining properties.
District administration office buildings were excluded if they were situated separately from a school.
8/3/2019 Statewide Seismic Needs Assessment report
http://slidepdf.com/reader/full/statewide-seismic-needs-assessment-report 24/341
Oregon Department of Geology and Mineral Industries Open-File Report O-07-02 Statewide Seismic Needs Assessment 16
Table 3. Qualifying Community College District Buildings
CC Campus # All Bldg # Qual Bldg
Blue Mountain 10 6
Blue Mountain Branch 4 -
Central Oregon 22 13
Central Oregon-Redmond 3 3
Chemeketa 52 12
Chemeketa Branch 11 4
Clackamas 25 17
Clatsop 9 6
Columbia Gorge 12 2
Klamath 5 2
Lane 34 18
Lane-Branch 17 4
Linn-Benton 14 12
Linn-Benton Branch 4 3
Mt Hood 15 11 Oregon Coast 1 -
Portland-Cascade 12 10
Portland-Sylvania 12 11
Portland-Rock Creek 13 7
Rogue-Redwood 33 5
Rogue-Riverside 9 5
Rogue-Table Rock 3 3
Southwest Oregon 39 10
Tillamook Bay 3 -
Treasure Valley 18 7
Umpqua 15 8
395 179
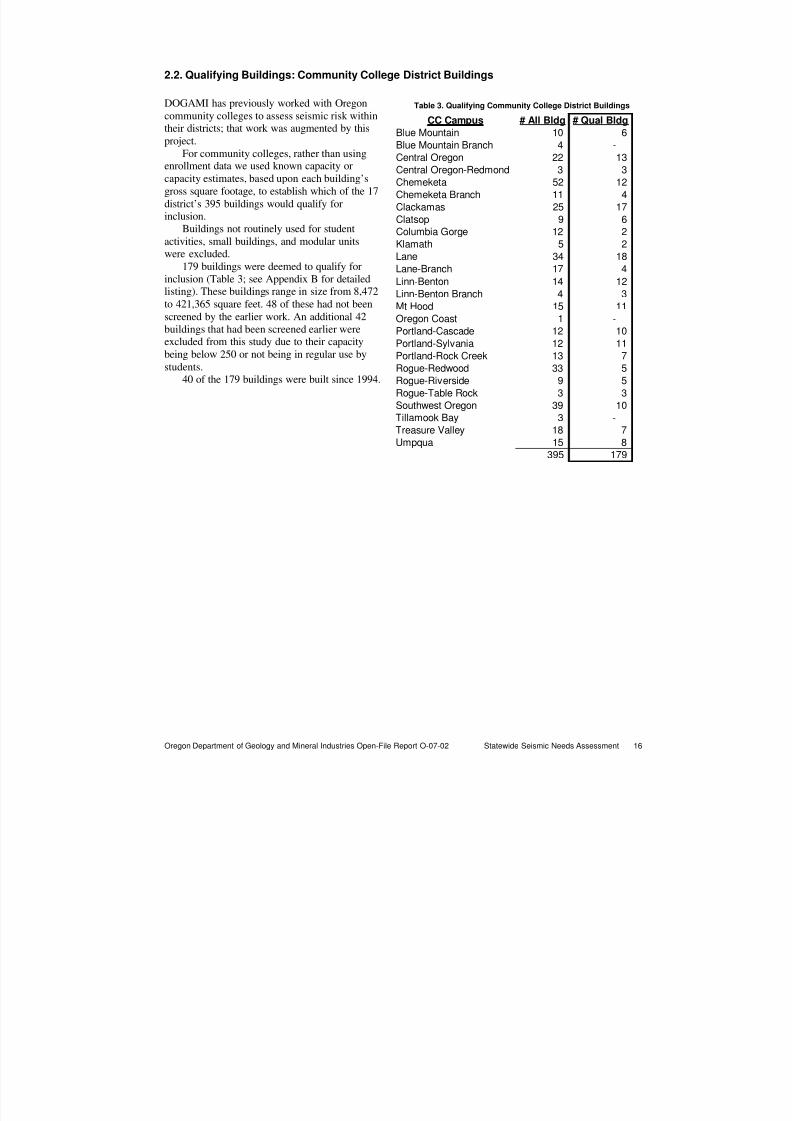
2.2. Qualifying Buildings: Community College District Buildings
DOGAMI has previously worked with Oregoncommunity colleges to assess seismic risk withintheir districts; that work was augmented by thisproject.
For community colleges, rather than usingenrollment data we used known capacity orcapacity estimates, based upon each building’sgross square footage, to establish which of the 17district’s 395 buildings would qualify forinclusion.
Buildings not routinely used for studentactivities, small buildings, and modular unitswere excluded.
179 buildings were deemed to qualify forinclusion (Table 3; see Appendix B for detailedlisting). These buildings range in size from 8,472
to 421,365 square feet. 48 of these had not beenscreened by the earlier work. An additional 42buildings that had been screened earlier wereexcluded from this study due to their capacitybeing below 250 or not being in regular use bystudents.
40 of the 179 buildings were built since 1994.
8/3/2019 Statewide Seismic Needs Assessment report
http://slidepdf.com/reader/full/statewide-seismic-needs-assessment-report 25/341
Oregon Department of Geology and Mineral Industries Open-File Report O-07-02 Statewide Seismic Needs Assessment 17
2.3. Qualifying Buildings: Hospitals
Acute inpatient care facilities (hospitals) are defined in ORS 442.470:(1) "Acute inpatient care facility" means a licensed hospital with an organized medical staff, with
permanent facilities that include inpatient beds, and with comprehensive medical services, including physician services and continuous nursing services under the supervision of registered nurses, to providediagnosis and medical or surgical treatment primarily for but not limited to acutely ill patients and accident
victims.The Oregon Department of Health Services provided the list of 58 acute care hospitals, as shown Table
4. (Note: Tuality Healthcare reports results as a singular entity but operates hospitals in both Hillsboro and Forest Grove.)
For the purposes of this assessment all 58 facilities were deemed to qualify for inclusion. However,hospitals have very significant dissimilarities with the other public district-owned facilities included in thisassessment. Specifically, this list of hospitals:
• includes hospitals ranging in size from 12-bed facilities with less than $5 million in gross annualrevenue to 447-bed facilities with $1 billion in annual revenues
• includes 2 hospitals owned by a stock exchange listed, for-profit, corporation
• includes 22 hospitals owned by faith-based organizations with local to international scope
• includes 1 hospital owned and operated by the nation’s largest HMO
• includes 11 hospitals that use public health district tax levies to contribute to revenueIt was noted in the minutes of the March 22, 2001, Senate Committee on General Government and
Transportation that the intent of this assessment is to focus on emergency room facilities at hospitals thatwould serve victims of earthquakes, as opposed to those areas that handle existing or long-term patient care:
• 22 of the 58 hospitals have built or are building new emergency room facilities
• another 10 have completed major upgrades or expansion to existing facilities
• 1 hospital has completed a seismic retrofit
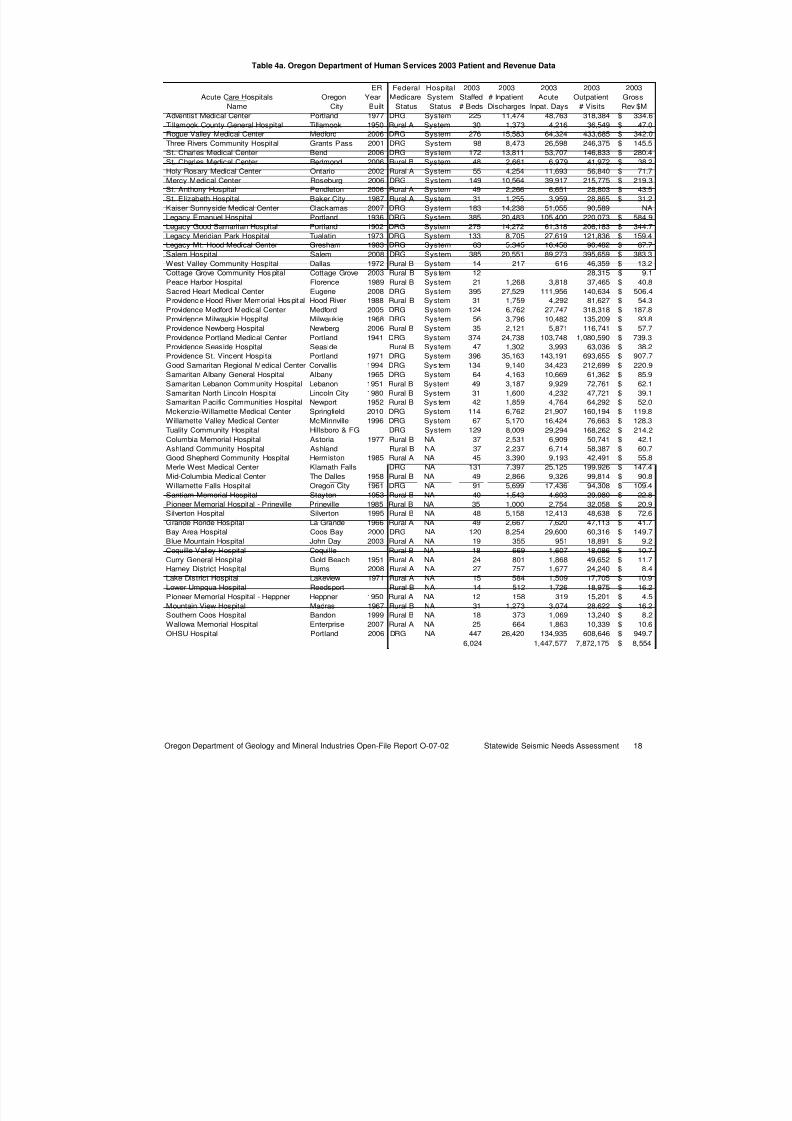
8/3/2019 Statewide Seismic Needs Assessment report
http://slidepdf.com/reader/full/statewide-seismic-needs-assessment-report 26/341
Oregon Department of Geology and Mineral Industries Open-File Report O-07-02 Statewide Seismic Needs Assessment 18
Table 4a. Oregon Department of Human Services 2003 Patient and Revenue Data
ER Federal Hospital 2003 2003 2003 2003 2003
Acute Care Hospitals Oregon Year Medicare System Staffed # Inpatient Acute Outpatient Gross
Name City Built Status Status # Beds Discharges Inpat. Days # Visits Rev $M
Adventist Medical Center Portland 1977 DRG System 225 11,474 48,763 318,384 334.6$
Tillamook County General Hospital Tillamook 1950 Rural A System 30 1,373 4,216 36,549 47.0$
Rogue Valley Medical Center Medford 2006 DRG System 276 15,583 64,324 433,685 342.0$
Three Rivers Community Hospital Grants Pass 2001 DRG System 98 8,473 26,598 246,375 145.5$
St. Charles Medical Center Bend 2006 DRG System 172 13,811 53,707 146,833 280.4$St. Charles Medical Center Redmond 2006 Rural B System 48 2,661 6,979 41,972 38.2$
Holy Rosary Medical Center Ontario 2002 Rural A System 55 4,254 11,693 56,840 71.7$
Mercy Medical Center Roseburg 2006 DRG System 149 10,564 39,917 215,775 219.3$
St. Anthony Hospital Pendleton 2006 Rural A System 49 2,266 6,651 28,803 43.5$
St. Elizabeth Hospital Baker City 1987 Rural A System 31 1,255 3,959 28,865 31.2$
Kaiser Sunnyside Medical Center Clackamas 2007 DRG System 183 14,238 51,055 90,589 NA
Legacy Emanuel Hospital Portland 1936 DRG System 385 20,483 105,400 220,073 584.9$
Legacy Good Samaritan Hospital Portland 1902 DRG System 275 14,272 61,318 206,183 344.7$
Legacy Meridian Park Hospital Tualatin 1973 DRG System 133 8,705 27,619 121,836 159.4$
Legacy Mt. Hood Medical Center Gresham 1983 DRG System 63 5,345 16,458 90,482 87.7$
Salem Hospital Salem 2008 DRG System 385 20,551 89,273 395,659 383.3$
West Valley Community Hospital Dallas 1972 Rural B System 14 217 616 46,359 13.2$
Cottage Grove Community Hos pital Cottage Grove 2003 Rural B Sys tem 12 28,315 9.1$
Peace Harbor Hospital Florence 1989 Rural B System 21 1,268 3,818 37,465 40.8$
Sacred Heart Medical Center Eugene 2008 DRG System 395 27,529 111,956 140,634 506.4$
Providence Hood River Memorial Hospital Hood River 1988 Rural B System 31 1,759 4,292 81,627 54.3$Providence Medford Medical Center Medford 2005 DRG System 124 6,762 27,747 318,318 187.8$
Providence Milwaukie Hospital Milwaukie 1968 DRG System 56 3,796 10,482 135,209 93.8$
Providence Newberg Hospital Newberg 2006 Rural B System 35 2,121 5,871 116,741 57.7$
Providence Portland Medical Center Portland 1941 DRG System 374 24,738 103,748 1,080,590 739.3$
Providence Seaside Hospital Seaside Rural B System 47 1,302 3,993 63,036 38.2$
Providence St. Vincent Hospital Portland 1971 DRG System 396 35,163 143,191 693,655 907.7$
Good Samaritan Regional Medical Center Corvallis 1994 DRG Sys tem 134 9,140 34,423 212,699 220.9$
Samaritan Albany General Hospital Albany 1965 DRG System 64 4,163 10,669 61,362 85.9$
Samaritan Lebanon Community Hospital Lebanon 1951 Rural B System 49 3,187 9,929 72,761 62.1$
Samaritan North Lincoln Hospital Lincoln City 1980 Rural B System 31 1,600 4,232 47,721 39.1$
Samaritan Pacific Communities Hospital Newport 1952 Rural B Sys tem 42 1,859 4,764 64,292 52.0$
Mckenzie-Willamette Medical Center Springfield 2010 DRG System 114 6,762 21,907 160,194 119.8$
Willamette Valley Medical Center McMinnville 1996 DRG System 67 5,170 16,424 76,663 128.3$
Tuality Community Hospital Hillsboro & FG DRG System 129 8,009 29,294 168,262 214.2$
Columbia Memorial Hospital Astoria 1977 Rural B NA 37 2,531 6,909 50,741 42.1$
Ashland Community Hospital Ashland Rural B NA 37 2,237 6,714 58,387 60.7$
Good Shepherd Community Hospital Hermiston 1985 Rural A NA 45 3,390 9,193 42,491 55.8$
Merle West Medical Center Klamath Falls DRG NA 131 7,397 25,125 199,926 147.4$
Mid-Columbia Medical Center The Dalles 1958 Rural B NA 49 2,866 9,326 99,814 90.8$
Willamette Falls Hospital Oregon City 1961 DRG NA 91 5,699 17,436 94,308 109.4$
Santiam Memorial Hospital Stayton 1953 Rural B NA 40 1,543 4,603 29,980 22.8$
Pioneer Memorial Hospital - Prineville Prineville 1985 Rural B NA 35 1,000 2,754 32,058 20.9$
Silverton Hospital Silverton 1995 Rural B NA 48 5,158 12,413 48,638 72.6$
Grande Ronde Hospital La Grande 1966 Rural A NA 49 2,667 7,620 47,113 41.7$
Bay Area Hospital Coos Bay 2000 DRG NA 120 8,254 29,600 60,316 149.7$
Blue Mountain Hospital John Day 2003 Rural A NA 19 355 951 18,891 9.2$
Coquille Valley Hospital Coquille Rural B NA 18 669 1,607 18,086 10.7$
Curry General Hospital Gold Beach 1951 Rural A NA 24 801 1,868 49,652 11.7$
Harney District Hospital Burns 2008 Rural A NA 27 757 1,677 24,240 8.4$
Lake District Hospital Lakeview 1971 Rural A NA 15 584 1,509 17,705 10.9$
Lower Umpqua Hospital Reedsport Rural B NA 14 512 1,726 18,975 16.2$
Pioneer Memorial Hospital - Heppner Heppner 1950 Rural A NA 12 158 319 15,201 4.5$
Mountain View Hospital Madras 1967 Rural B NA 31 1,273 3,074 28,622 16.2$Southern Coos Hospital Bandon 1999 Rural B NA 18 373 1,069 13,240 8.2$
Wallowa Memorial Hospital Enterprise 2007 Rural A NA 25 664 1,863 10,339 10.6$
OHSU Hospital Portland 2006 DRG NA 447 26,420 134,935 608,646 949.7$
6,024 1,447,577 7,872,175 8,554$
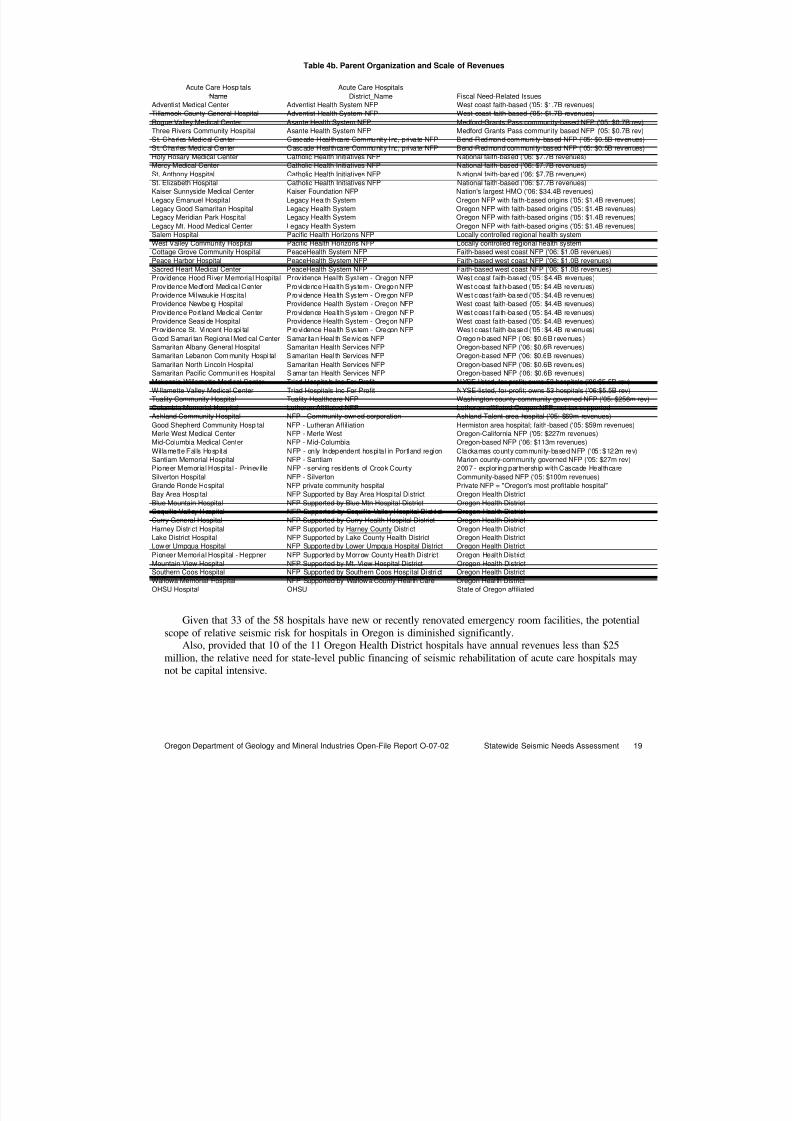
8/3/2019 Statewide Seismic Needs Assessment report
http://slidepdf.com/reader/full/statewide-seismic-needs-assessment-report 27/341
Oregon Department of Geology and Mineral Industries Open-File Report O-07-02 Statewide Seismic Needs Assessment 19
Table 4b. Parent Organization and Scale of Revenues
Given that 33 of the 58 hospitals have new or recently renovated emergency room facilities, the potentialscope of relative seismic risk for hospitals in Oregon is diminished significantly.
Also, provided that 10 of the 11 Oregon Health District hospitals have annual revenues less than $25million, the relative need for state-level public financing of seismic rehabilitation of acute care hospitals maynot be capital intensive.
Acute Care Hospitals Acute Care Hospitals
Name District_Name Fiscal Need-Related IssuesAdventist Medical Center Adventist Health System NFP West coast faith-based ('05: $1.7B revenues)
Tillamook County General Hospital Adventist Health System NFP West coast faith-based ('05: $1.7B revenues)
Rogue Valley Medical Center Asante Health System NFP Medford-Grants Pass community-based NFP ('05: $0.7B rev)Three Rivers Community Hospital Asante Health System NFP Medford-Grants Pass community-based NFP ('05: $0.7B rev)
St. Charles Medical Center Cascade Healthcare Community Inc, private NFP Bend-Redmond community-based NFP ('05: $0.5B revenues)
St. Charles Medical Center Cascade Healthcare Community Inc, private NFP Bend-Redmond community-based NFP ('05: $0.5B revenues)Holy Rosary Medical Center Catholic Health Initiatives NFP National faith-based ('06: $7.7B revenues)
Mercy Medical Center Catholic Health Initiatives NFP National faith-based ('06: $7.7B revenues)
St. Anthony Hospital Catholic Health Initiatives NFP National faith-based ('06: $7.7B revenues)
St. Elizabeth Hospital Catholic Health Initiatives NFP National faith-based ('06: $7.7B revenues)
Kaiser Sunnyside Medical Center Kaiser Foundation NFP Nation's largest HMO ('06: $34.4B revenues)
Legacy Emanuel Hospital Legacy Health System Oregon NFP with faith-based origins ('05: $1.4B revenues)
Legacy Good Samaritan Hospital Legacy Health System Oregon NFP with faith-based origins ('05: $1.4B revenues)Legacy Meridian Park Hospital Legacy Health System Oregon NFP with faith-based origins ('05: $1.4B revenues)
Legacy Mt. Hood Medical Center Legacy Health System Oregon NFP with faith-based origins ('05: $1.4B revenues)Salem Hospital Pacific Health Horizons NFP Locally controlled regional health system
West Valley Community Hospital Pacific Health Horizons NFP Locally controlled regional health system
Cottage Grove Community Hospital PeaceHealth System NFP Faith-based west coast NFP ('06: $1.0B revenues)
Peace Harbor Hospital PeaceHealth System NFP Faith-based west coast NFP ('06: $1.0B revenues)
Sacred Heart Medical Center PeaceHealth System NFP Faith-based west coast NFP ('06: $1.0B revenues)
Providence Hood River Memorial Hospital Providence Health System - Oregon NFP West coast faith-based ('05: $4.4B revenues)
Providence Medford Medical Center Providence Health System - Oregon NFP West coast fa ith-based ( '05: $4.4B revenues)
Providence Milwauk ie Hospita l Providence Hea lth Sys tem - Oregon NFP West coas t faith -based ('05 : $4.4B revenues)
Providence Newbe rg Hospital Providence Health System - Oregon NFP West coast faith-based ('05: $4.4B revenues)Providence Port land Medical Center Providence Health System - Oregon NFP West coast faith-based ( '05: $4.4B revenues)
Providence Seaside Hospital Providence Health System - Oregon NFP West coast faith-based ('05: $4.4B revenues)Prov idence St. Vincent Hospi tal Providence Hea lth Sys tem - Oregon NFP West coas t faith -based ( '05 : $4.4B revenues)
Good Samari tan Regiona l Med ical Center Samar itan Heal th Services NFP Oregon-based NFP ( '06: $0.6B revenues)Samaritan Albany General Hospital Samaritan Health Services NFP Oregon-based NFP ('06: $0.6B revenues)
Samaritan Lebanon Community Hospi tal Samaritan Heal th Services NFP Oregon-based NFP ('06: $0.6B revenues)
Samaritan North Lincoln Hospital Samaritan Health Services NFP Oregon-based NFP ('06: $0.6B revenues)Samaritan Pacific Communities Hospital Samaritan Health Services NFP Oregon-based NFP ('06: $0.6B revenues)
Mckenzie-Willamette Medical Center Triad Hospita ls Inc For Profit NYSE-l isted, for-profit; owns 53 hospitals ('06:$5 .5B rev)
Willamette Valley Medical Center Triad Hospitals Inc For Profit NYSE-listed, for-profit; owns 53 hospitals ('06:$5.5B rev)
Tuality Community Hospital Tuality Healthcare NFP Washington county-community governed NFP ('05: $256m rev)
Columbia Memorial Hospital Lutheran Affiliated NFP Lutheran-affiliated Oregon NFP; not tax supportedAshland Community Hospital NFP - Community-owned corporation Ashland-Talent area hospital ('05: $69m revenues)
Good Shepherd Community Hospital NFP - Lutheran Affiliation Hermiston area hospital; faith-based ('05: $59m revenues)Merle West Medical Center NFP - Merle West Oregon-California NFP ('05: $227m revenues)
Mid-Columbia Medical Center NFP - Mid-Columbia Oregon-based NFP ('06: $113m revenues)
Wil lamette Fal ls Hospital NFP - only Independent hospita l in Portland region Clackamas county community-based NFP ('05: $122m rev)Santiam Memorial Hospital NFP - Santiam Marion county-community governed NFP ('05: $27m rev)
Pioneer Memorial Hospital - Prineville NFP - serving residents of Crook County 2007 - exploring partnership with Cascade Healthcare
Silverton Hospital NFP - Silverton Community-based NFP ('05: $100m revenues)
Grande Ronde Hospital NFP private community hospital Private NFP = "Oregon's most profitable hospital"
Bay Area Hospital NFP Supported by Bay Area Hospital District Oregon Health District
Blue Mountain Hospital NFP Supported by Blue Mtn Hospital District Oregon Health District
Coquille Valley Hospital NFP Supported by Coquille Valle y Hospital Dist ri ct Oregon Heal th District
Curry General Hospital NFP Supported by Curry Health Hospital District Oregon Health District
Harney District Hospital NFP Supported by Harney County District Oregon Health District
Lake District Hospital NFP Supported by Lake County Health District Oregon Health DistrictLower Umpqua Hospital NFP Supporte d by Lower Umpqua Hospital District Oregon Health District
Pioneer Memorial Hospital - Heppner NFP Supported by Morrow County Health District Oregon Health District
Mountain View Hospital NFP Supported by Mt. View Hospital District Oregon Health DistrictSouthern Coos Hospital NFP Supported by Southern Coos Hospital Distri ct Oregon Health District
Wallowa Memorial Hospital NFP Supported by Wallowa County Heal th Care Oregon Heal th District
OHSU Hospital OHSU State of Oregon affiliated
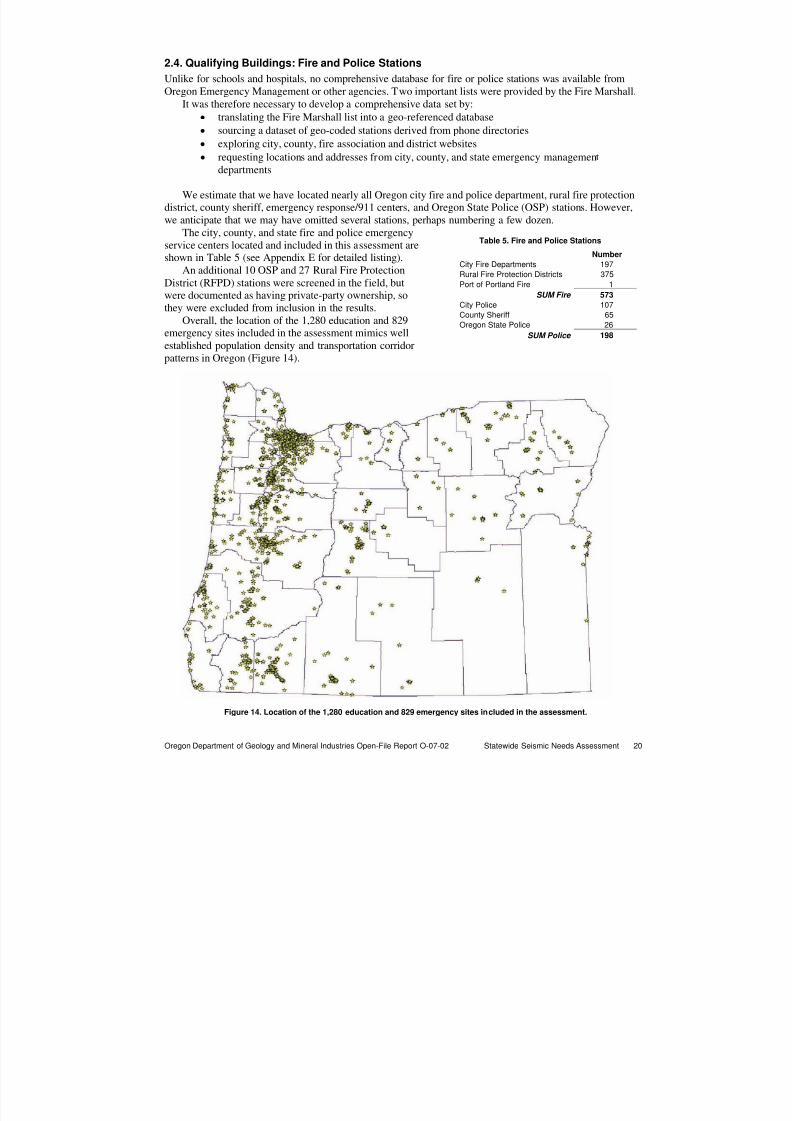
8/3/2019 Statewide Seismic Needs Assessment report
http://slidepdf.com/reader/full/statewide-seismic-needs-assessment-report 28/341
Oregon Department of Geology and Mineral Industries Open-File Report O-07-02 Statewide Seismic Needs Assessment 20
Table 5. Fire and Police Stations
Number
City Fire Departments 197
Rural Fire Protection Districts 375
Port of Portland Fire 1
SUM Fire 573
City Police 107County Sheriff 65
Oregon State Police 26
SUM Police 198
2.4. Qualifying Buildings: Fire and Police Stations
Unlike for schools and hospitals, no comprehensive database for fire or police stations was available fromOregon Emergency Management or other agencies. Two important lists were provided by the Fire Marshall.
It was therefore necessary to develop a comprehensive data set by:
• translating the Fire Marshall list into a geo-referenced database
• sourcing a dataset of geo-coded stations derived from phone directories
• exploring city, county, fire association and district websites
• requesting locations and addresses from city, county, and state emergency managementdepartments
We estimate that we have located nearly all Oregon city fire and police department, rural fire protectiondistrict, county sheriff, emergency response/911 centers, and Oregon State Police (OSP) stations. However,we anticipate that we may have omitted several stations, perhaps numbering a few dozen.
The city, county, and state fire and police emergencyservice centers located and included in this assessment areshown in Table 5 (see Appendix E for detailed listing).
An additional 10 OSP and 27 Rural Fire ProtectionDistrict (RFPD) stations were screened in the field, butwere documented as having private-party ownership, sothey were excluded from inclusion in the results.
Overall, the location of the 1,280 education and 829emergency sites included in the assessment mimics wellestablished population density and transportation corridorpatterns in Oregon (Figure 14).
Figure 14. Location of the 1,280 education and 829 emergency sites included in the assessment.
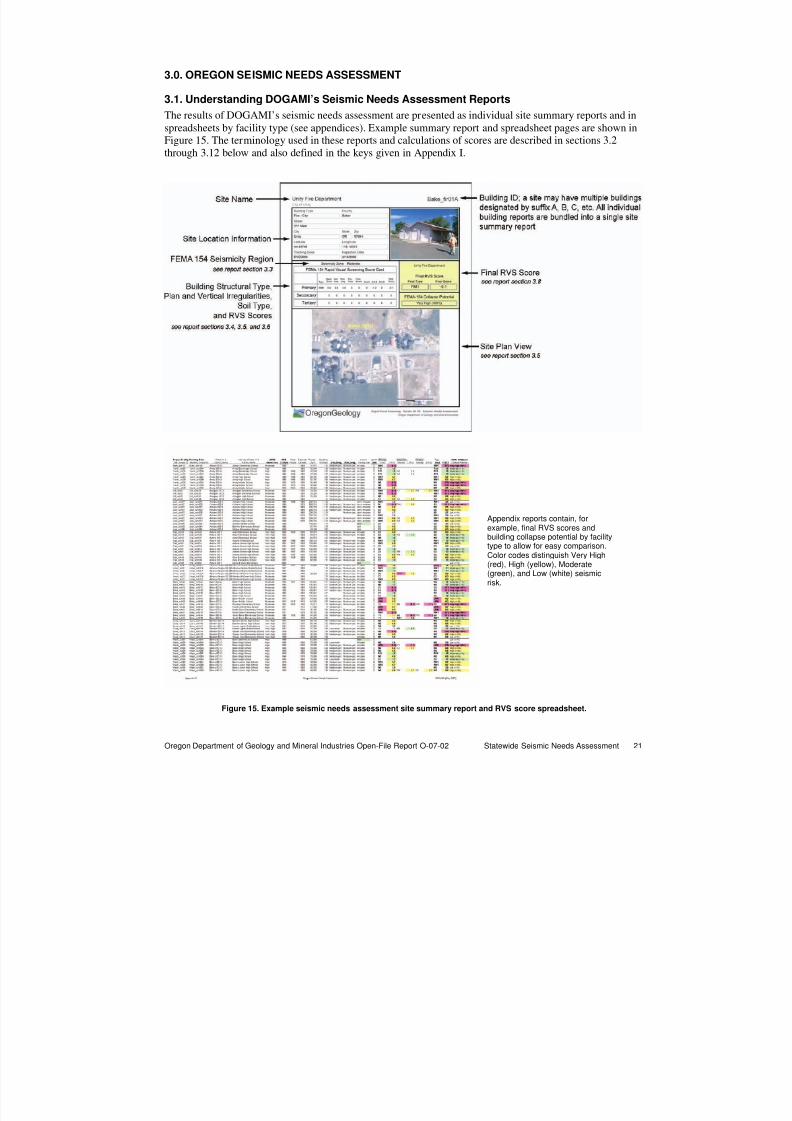
8/3/2019 Statewide Seismic Needs Assessment report
http://slidepdf.com/reader/full/statewide-seismic-needs-assessment-report 29/341
Oregon Department of Geology and Mineral Industries Open-File Report O-07-02 Statewide Seismic Needs Assessment 21
3.0. OREGON SEISMIC NEEDS ASSESSMENT
3.1. Understanding DOGAMI’s Seismic Needs Assessment Reports
The results of DOGAMI’s seismic needs assessment are presented as individual site summary reports and inspreadsheets by facility type (see appendices). Example summary report and spreadsheet pages are shown inFigure 15. The terminology used in these reports and calculations of scores are described in sections 3.2
through 3.12 below and also defined in the keys given in Appendix I.
Figure 15. Example seismic needs assessment site summary report and RVS score spreadsheet.
Appendix reports contain, forexample, final RVS scores andbuilding collapse potential by facilitytype to allow for easy comparison.Color codes distinguish Very High(red), High (yellow), Moderate(green), and Low (white) seismicrisk.
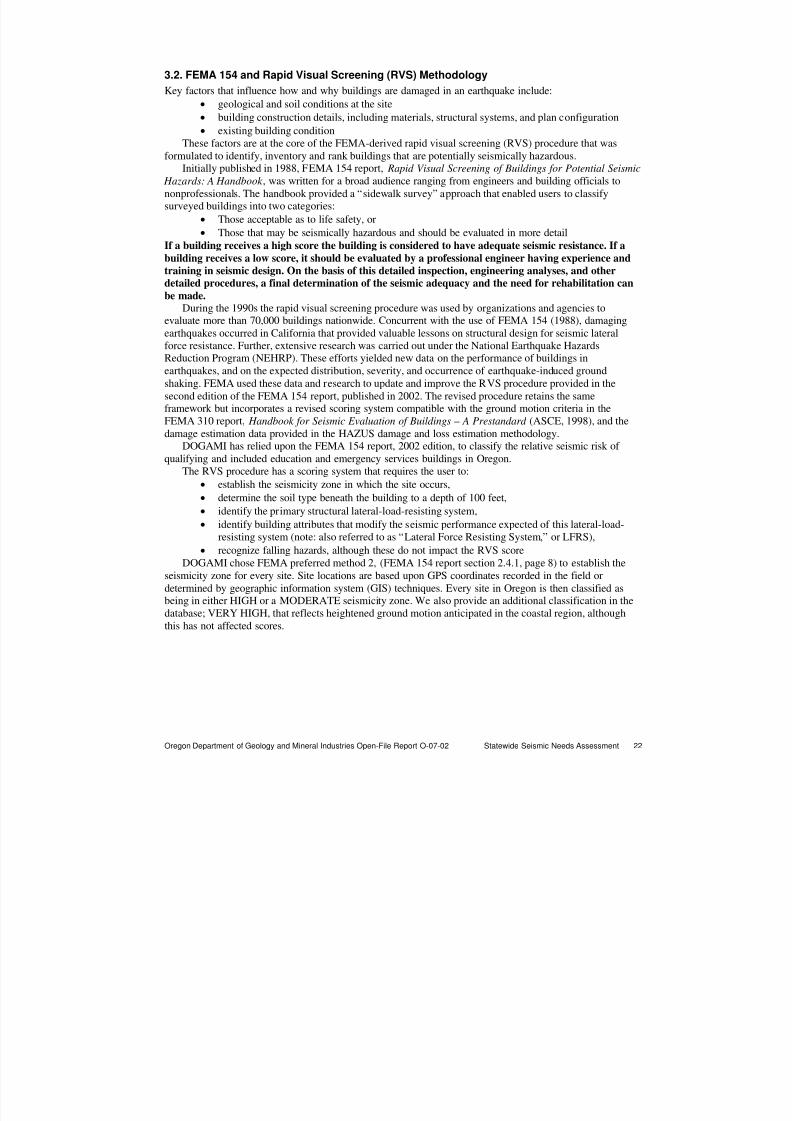
8/3/2019 Statewide Seismic Needs Assessment report
http://slidepdf.com/reader/full/statewide-seismic-needs-assessment-report 30/341
Oregon Department of Geology and Mineral Industries Open-File Report O-07-02 Statewide Seismic Needs Assessment 22
3.2. FEMA 154 and Rapid Visual Screening (RVS) Methodology
Key factors that influence how and why buildings are damaged in an earthquake include:
• geological and soil conditions at the site
• building construction details, including materials, structural systems, and plan configuration
• existing building conditionThese factors are at the core of the FEMA-derived rapid visual screening (RVS) procedure that was
formulated to identify, inventory and rank buildings that are potentially seismically hazardous.Initially published in 1988, FEMA 154 report, Rapid Visual Screening of Buildings for Potential Seismic
Hazards: A Handbook , was written for a broad audience ranging from engineers and building officials tononprofessionals. The handbook provided a “sidewalk survey” approach that enabled users to classifysurveyed buildings into two categories:
• Those acceptable as to life safety, or
• Those that may be seismically hazardous and should be evaluated in more detailIf a building receives a high score the building is considered to have adequate seismic resistance. If a
building receives a low score, it should be evaluated by a professional engineer having experience and
training in seismic design. On the basis of this detailed inspection, engineering analyses, and otherdetailed procedures, a final determination of the seismic adequacy and the need for rehabilitation can
be made.During the 1990s the rapid visual screening procedure was used by organizations and agencies to
evaluate more than 70,000 buildings nationwide. Concurrent with the use of FEMA 154 (1988), damagingearthquakes occurred in California that provided valuable lessons on structural design for seismic lateralforce resistance. Further, extensive research was carried out under the National Earthquake HazardsReduction Program (NEHRP). These efforts yielded new data on the performance of buildings inearthquakes, and on the expected distribution, severity, and occurrence of earthquake-induced groundshaking. FEMA used these data and research to update and improve the RVS procedure provided in thesecond edition of the FEMA 154 report, published in 2002. The revised procedure retains the sameframework but incorporates a revised scoring system compatible with the ground motion criteria in theFEMA 310 report, Handbook for Seismic Evaluation of Buildings – A Prestandard (ASCE, 1998), and thedamage estimation data provided in the HAZUS damage and loss estimation methodology.
DOGAMI has relied upon the FEMA 154 report, 2002 edition, to classify the relative seismic risk of
qualifying and included education and emergency services buildings in Oregon.The RVS procedure has a scoring system that requires the user to:
• establish the seismicity zone in which the site occurs,
• determine the soil type beneath the building to a depth of 100 feet,
• identify the primary structural lateral-load-resisting system,
• identify building attributes that modify the seismic performance expected of this lateral-load-resisting system (note: also referred to as “Lateral Force Resisting System,” or LFRS),
• recognize falling hazards, although these do not impact the RVS scoreDOGAMI chose FEMA preferred method 2, (FEMA 154 report section 2.4.1, page 8) to establish the
seismicity zone for every site. Site locations are based upon GPS coordinates recorded in the field ordetermined by geographic information system (GIS) techniques. Every site in Oregon is then classified asbeing in either HIGH or a MODERATE seismicity zone. We also provide an additional classification in thedatabase; VERY HIGH, that reflects heightened ground motion anticipated in the coastal region, althoughthis has not affected scores.
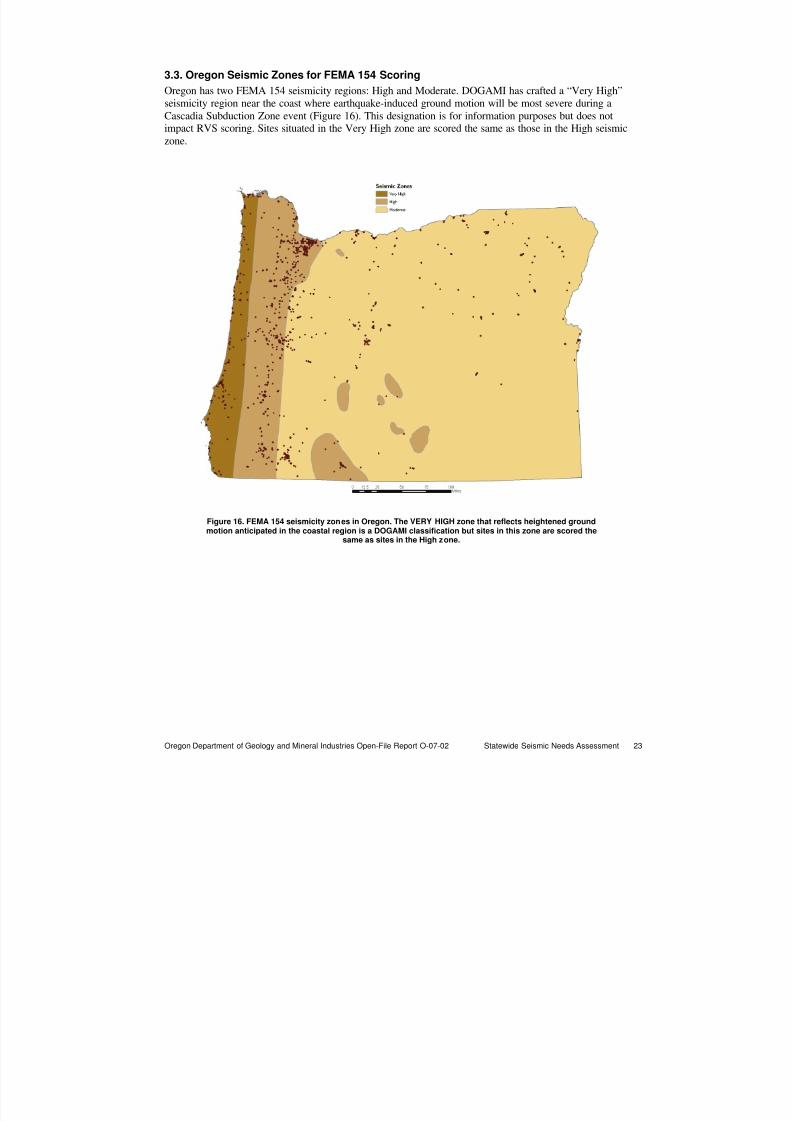
8/3/2019 Statewide Seismic Needs Assessment report
http://slidepdf.com/reader/full/statewide-seismic-needs-assessment-report 31/341
Oregon Department of Geology and Mineral Industries Open-File Report O-07-02 Statewide Seismic Needs Assessment 23
3.3. Oregon Seismic Zones for FEMA 154 Scoring
Oregon has two FEMA 154 seismicity regions: High and Moderate. DOGAMI has crafted a “Very High”seismicity region near the coast where earthquake-induced ground motion will be most severe during aCascadia Subduction Zone event (Figure 16). This designation is for information purposes but does notimpact RVS scoring. Sites situated in the Very High zone are scored the same as those in the High seismiczone.
Figure 16. FEMA 154 seismicity zones in Oregon. The VERY HIGH zone that reflects heightened groundmotion anticipated in the coastal region is a DOGAMI classification but sites in this zone are scored the
same as sites in the High zone.
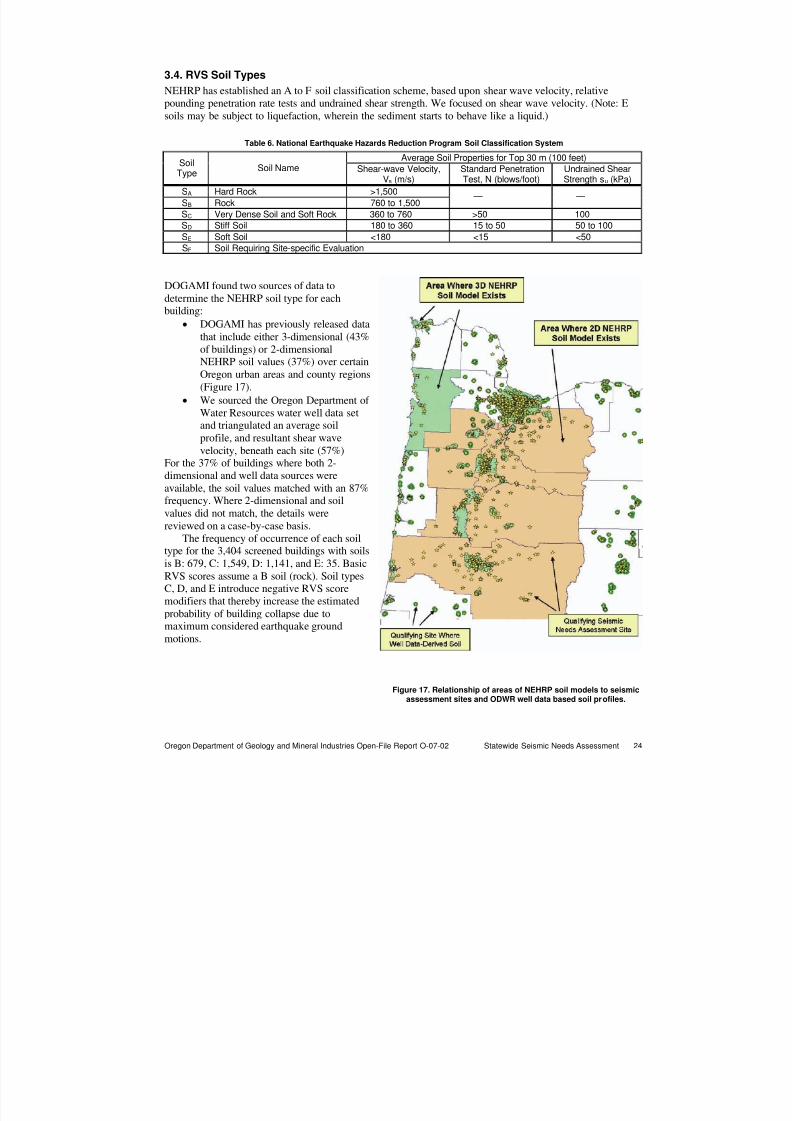
8/3/2019 Statewide Seismic Needs Assessment report
http://slidepdf.com/reader/full/statewide-seismic-needs-assessment-report 32/341
Oregon Department of Geology and Mineral Industries Open-File Report O-07-02 Statewide Seismic Needs Assessment 24
3.4. RVS Soil Types
NEHRP has established an A to F soil classification scheme, based upon shear wave velocity, relativepounding penetration rate tests and undrained shear strength. We focused on shear wave velocity. (Note: Esoils may be subject to liquefaction, wherein the sediment starts to behave like a liquid.)
Table 6. National Earthquake Hazards Reduction Program Soil Classification System
Average Soil Properties for Top 30 m (100 feet)SoilType
Soil Name Shear-wave Velocity,Vs (m/s)
Standard PenetrationTest, N (blows/foot)
Undrained ShearStrength su (kPa)
SA Hard Rock >1,500
SB Rock 760 to 1,500 — —
SC Very Dense Soil and Soft Rock 360 to 760 >50 100SD Stiff Soil 180 to 360 15 to 50 50 to 100
SE Soft Soil <180 <15 <50SF Soil Requiring Site-specific Evaluation
DOGAMI found two sources of data to
determine the NEHRP soil type for eachbuilding:
• DOGAMI has previously released datathat include either 3-dimensional (43%of buildings) or 2-dimensionalNEHRP soil values (37%) over certainOregon urban areas and county regions(Figure 17).
• We sourced the Oregon Department of Water Resources water well data setand triangulated an average soilprofile, and resultant shear wave
velocity, beneath each site (57%)For the 37% of buildings where both 2-dimensional and well data sources wereavailable, the soil values matched with an 87%frequency. Where 2-dimensional and soilvalues did not match, the details werereviewed on a case-by-case basis.
The frequency of occurrence of each soiltype for the 3,404 screened buildings with soilsis B: 679, C: 1,549, D: 1,141, and E: 35. BasicRVS scores assume a B soil (rock). Soil typesC, D, and E introduce negative RVS score
modifiers that thereby increase the estimatedprobability of building collapse due tomaximum considered earthquake groundmotions.
Figure 17. Relationship of areas of NEHRP soil models to seismicassessment sites and ODWR well data based soil profiles.
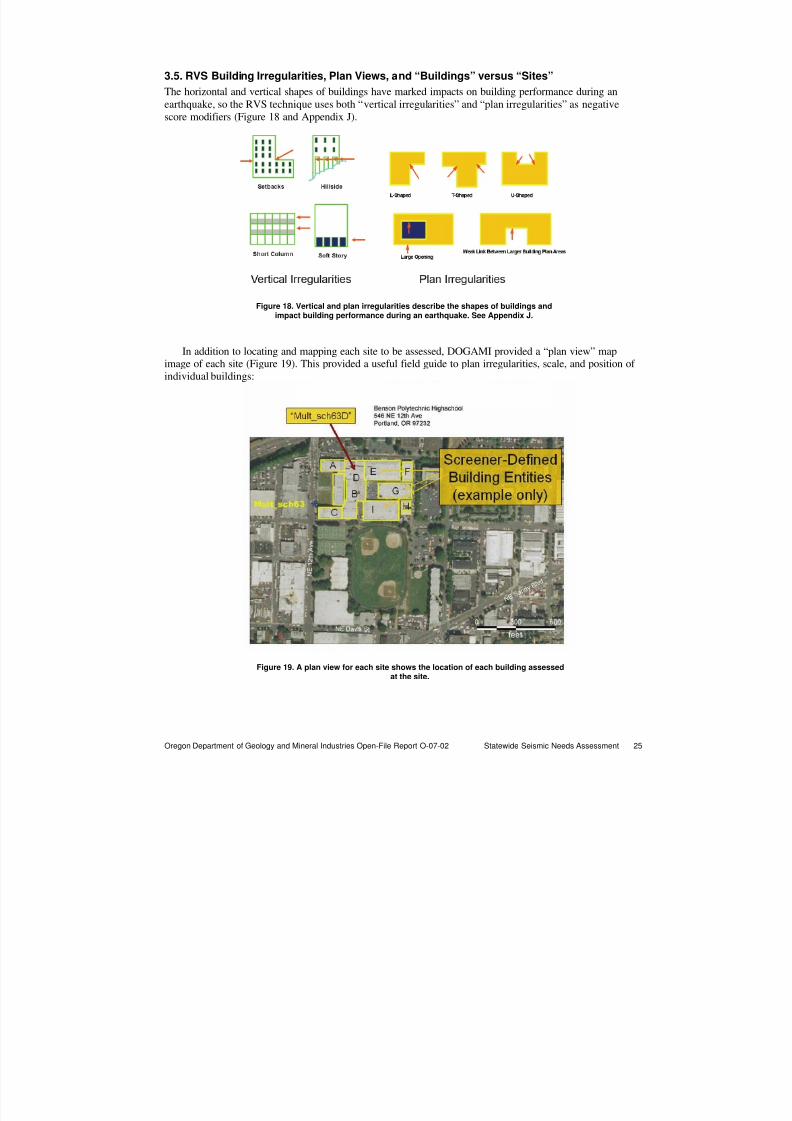
8/3/2019 Statewide Seismic Needs Assessment report
http://slidepdf.com/reader/full/statewide-seismic-needs-assessment-report 33/341
Oregon Department of Geology and Mineral Industries Open-File Report O-07-02 Statewide Seismic Needs Assessment 25
3.5. RVS Building Irregularities, Plan Views, and “Buildings” versus “Sites”
The horizontal and vertical shapes of buildings have marked impacts on building performance during anearthquake, so the RVS technique uses both “vertical irregularities” and “plan irregularities” as negativescore modifiers (Figure 18 and Appendix J).
Figure 18. Vertical and plan irregularities describe the shapes of buildings andimpact building performance during an earthquake. See Appendix J.
In addition to locating and mapping each site to be assessed, DOGAMI provided a “plan view” mapimage of each site (Figure 19). This provided a useful field guide to plan irregularities, scale, and position of individual buildings:
Figure 19. A plan view for each site shows the location of each building assessedat the site.
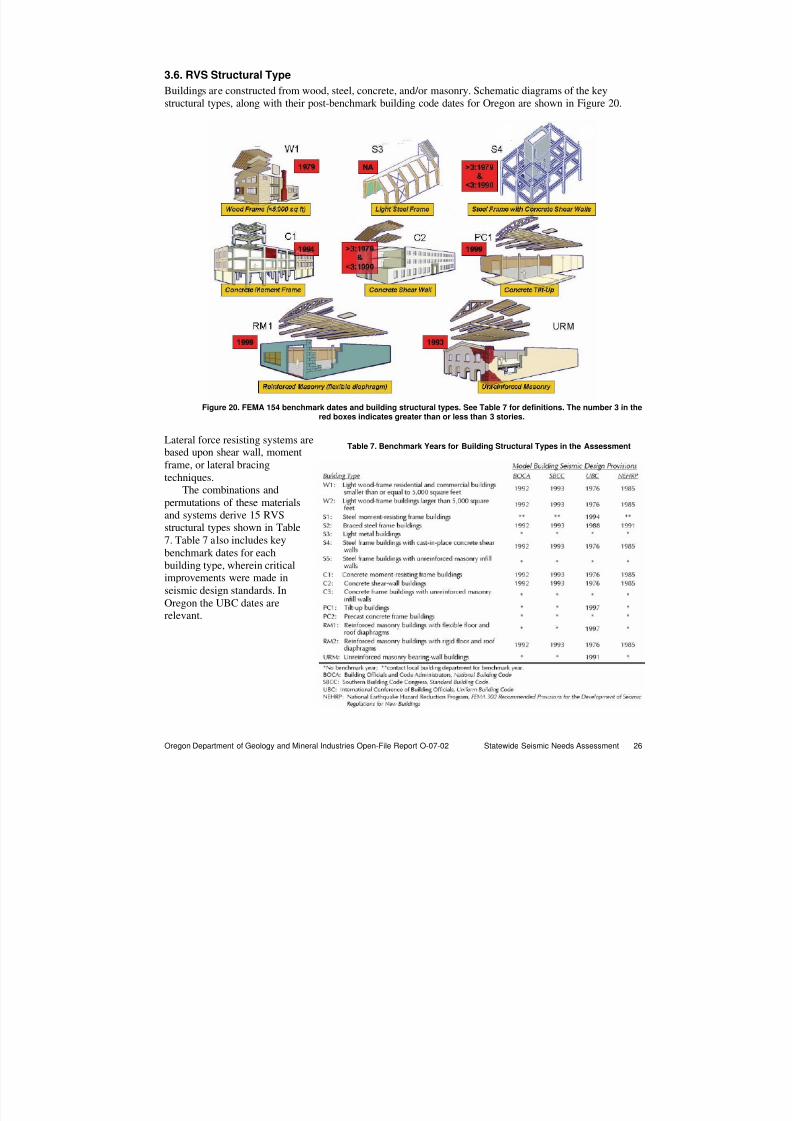
8/3/2019 Statewide Seismic Needs Assessment report
http://slidepdf.com/reader/full/statewide-seismic-needs-assessment-report 34/341
Oregon Department of Geology and Mineral Industries Open-File Report O-07-02 Statewide Seismic Needs Assessment 26
Table 7. Benchmark Years for Building Structural Types in the Assessment
3.6. RVS Structural Type
Buildings are constructed from wood, steel, concrete, and/or masonry. Schematic diagrams of the keystructural types, along with their post-benchmark building code dates for Oregon are shown in Figure 20.
Figure 20. FEMA 154 benchmark dates and building structural types. See Table 7 for definitions. The number 3 in thered boxes indicates greater than or less than 3 stories.
Lateral force resisting systems are
based upon shear wall, momentframe, or lateral bracingtechniques.
The combinations andpermutations of these materialsand systems derive 15 RVSstructural types shown in Table7. Table 7 also includes keybenchmark dates for eachbuilding type, wherein criticalimprovements were made inseismic design standards. In
Oregon the UBC dates arerelevant.
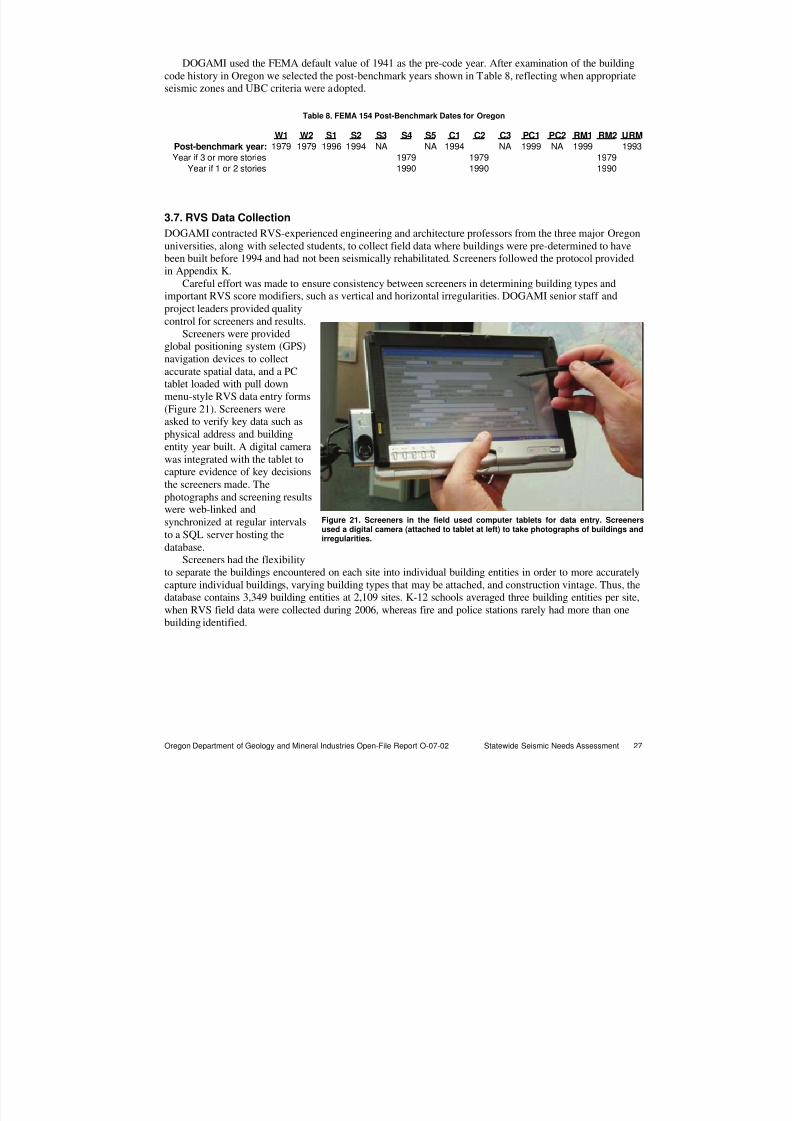
8/3/2019 Statewide Seismic Needs Assessment report
http://slidepdf.com/reader/full/statewide-seismic-needs-assessment-report 35/341
Oregon Department of Geology and Mineral Industries Open-File Report O-07-02 Statewide Seismic Needs Assessment 27
Figure 21. Screeners in the field used computer tablets for data entry. Screenersused a digital camera (attached to tablet at left) to take photographs of buildings andirregularities.
DOGAMI used the FEMA default value of 1941 as the pre-code year. After examination of the buildingcode history in Oregon we selected the post-benchmark years shown in Table 8, reflecting when appropriateseismic zones and UBC criteria were adopted.
Table 8. FEMA 154 Post-Benchmark Dates for Oregon
3.7. RVS Data Collection
DOGAMI contracted RVS-experienced engineering and architecture professors from the three major Oregonuniversities, along with selected students, to collect field data where buildings were pre-determined to havebeen built before 1994 and had not been seismically rehabilitated. Screeners followed the protocol providedin Appendix K.
Careful effort was made to ensure consistency between screeners in determining building types andimportant RVS score modifiers, such as vertical and horizontal irregularities. DOGAMI senior staff andproject leaders provided qualitycontrol for screeners and results.
Screeners were providedglobal positioning system (GPS)navigation devices to collectaccurate spatial data, and a PCtablet loaded with pull downmenu-style RVS data entry forms(Figure 21). Screeners wereasked to verify key data such asphysical address and buildingentity year built. A digital camerawas integrated with the tablet tocapture evidence of key decisionsthe screeners made. Thephotographs and screening resultswere web-linked andsynchronized at regular intervalsto a SQL server hosting thedatabase.
Screeners had the flexibilityto separate the buildings encountered on each site into individual building entities in order to more accuratelycapture individual buildings, varying building types that may be attached, and construction vintage. Thus, thedatabase contains 3,349 building entities at 2,109 sites. K-12 schools averaged three building entities per site,
when RVS field data were collected during 2006, whereas fire and police stations rarely had more than onebuilding identified.
W1 W2 S1 S2 S3 S4 S5 C1 C2 C3 PC1 PC2 RM1 RM2 URM
Post-benchmark year:1979 1979 1996 1994 NA NA 1994 NA 1999 NA 1999 1993
Year if 3 or more stories 1979 1979 1979Year if 1 or 2 stories 1990 1990 1990
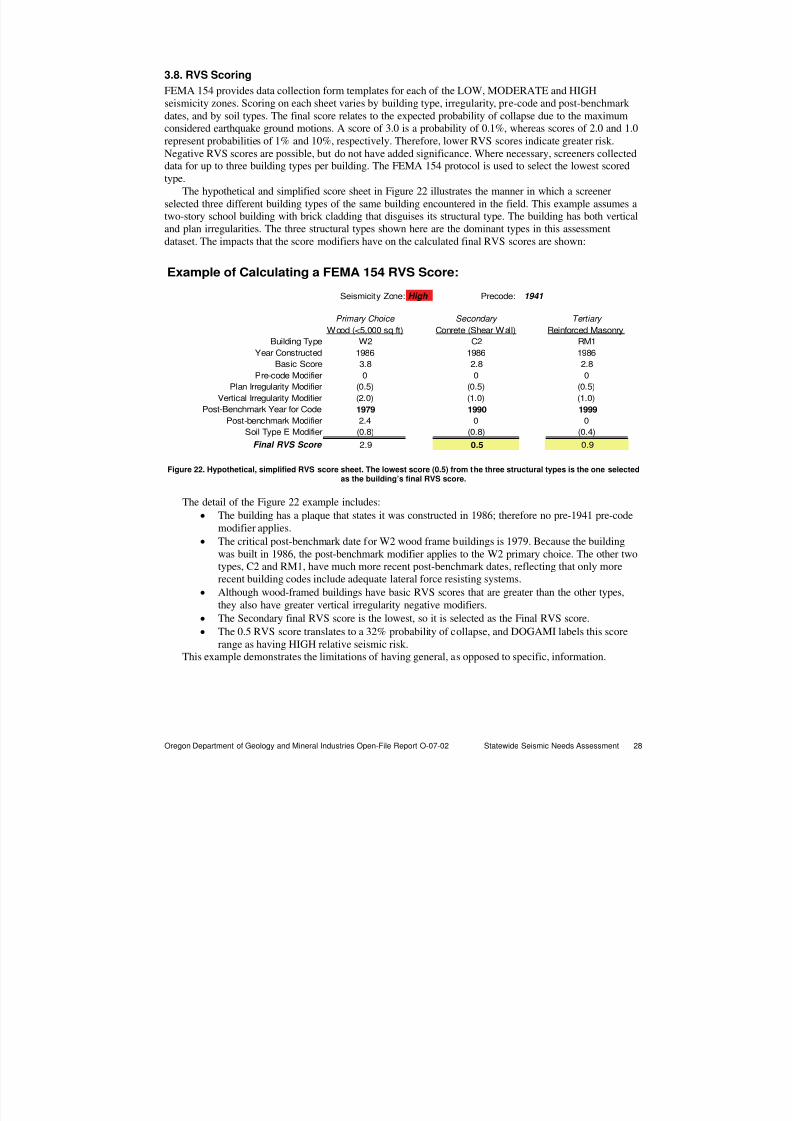
8/3/2019 Statewide Seismic Needs Assessment report
http://slidepdf.com/reader/full/statewide-seismic-needs-assessment-report 36/341
Oregon Department of Geology and Mineral Industries Open-File Report O-07-02 Statewide Seismic Needs Assessment 28
3.8. RVS Scoring
FEMA 154 provides data collection form templates for each of the LOW, MODERATE and HIGHseismicity zones. Scoring on each sheet varies by building type, irregularity, pre-code and post-benchmark dates, and by soil types. The final score relates to the expected probability of collapse due to the maximumconsidered earthquake ground motions. A score of 3.0 is a probability of 0.1%, whereas scores of 2.0 and 1.0represent probabilities of 1% and 10%, respectively. Therefore, lower RVS scores indicate greater risk.
Negative RVS scores are possible, but do not have added significance. Where necessary, screeners collecteddata for up to three building types per building. The FEMA 154 protocol is used to select the lowest scoredtype.
The hypothetical and simplified score sheet in Figure 22 illustrates the manner in which a screenerselected three different building types of the same building encountered in the field. This example assumes atwo-story school building with brick cladding that disguises its structural type. The building has both verticaland plan irregularities. The three structural types shown here are the dominant types in this assessmentdataset. The impacts that the score modifiers have on the calculated final RVS scores are shown:
Figure 22. Hypothetical, simplified RVS score sheet. The lowest score (0.5) from the three structural types is the one selectedas the building’s final RVS score.
The detail of the Figure 22 example includes:
• The building has a plaque that states it was constructed in 1986; therefore no pre-1941 pre-codemodifier applies.
• The critical post-benchmark date for W2 wood frame buildings is 1979. Because the buildingwas built in 1986, the post-benchmark modifier applies to the W2 primary choice. The other twotypes, C2 and RM1, have much more recent post-benchmark dates, reflecting that only morerecent building codes include adequate lateral force resisting systems.
• Although wood-framed buildings have basic RVS scores that are greater than the other types,
they also have greater vertical irregularity negative modifiers.• The Secondary final RVS score is the lowest, so it is selected as the Final RVS score.
• The 0.5 RVS score translates to a 32% probability of collapse, and DOGAMI labels this scorerange as having HIGH relative seismic risk.
This example demonstrates the limitations of having general, as opposed to specific, information.
Example of Calculating a FEMA 154 RVS Score:
Seismicity Zone: High Precode: 1941
Primary Choice Secondary Tertiary
Wood (<5,000 sq ft) Conrete (Shear Wall) Reinforced Masonry
Building Type W2 C2 RM1
Year Constructed 1986 1986 1986
Basic Score 3.8 2.8 2.8
Pre-code Modifier 0 0 0
Plan Irregularity Modifier (0.5) (0.5) (0.5)
Vertical Irregularity Modifier (2.0) (1.0) (1.0)
Post-Benchmark Year for Code 1979 1990 1999
Post-benchmark Modifier 2.4 0 0
Soil Type E Modifier (0.8) (0.8) (0.4)
Final RVS Score 2.9 0.5 0.9
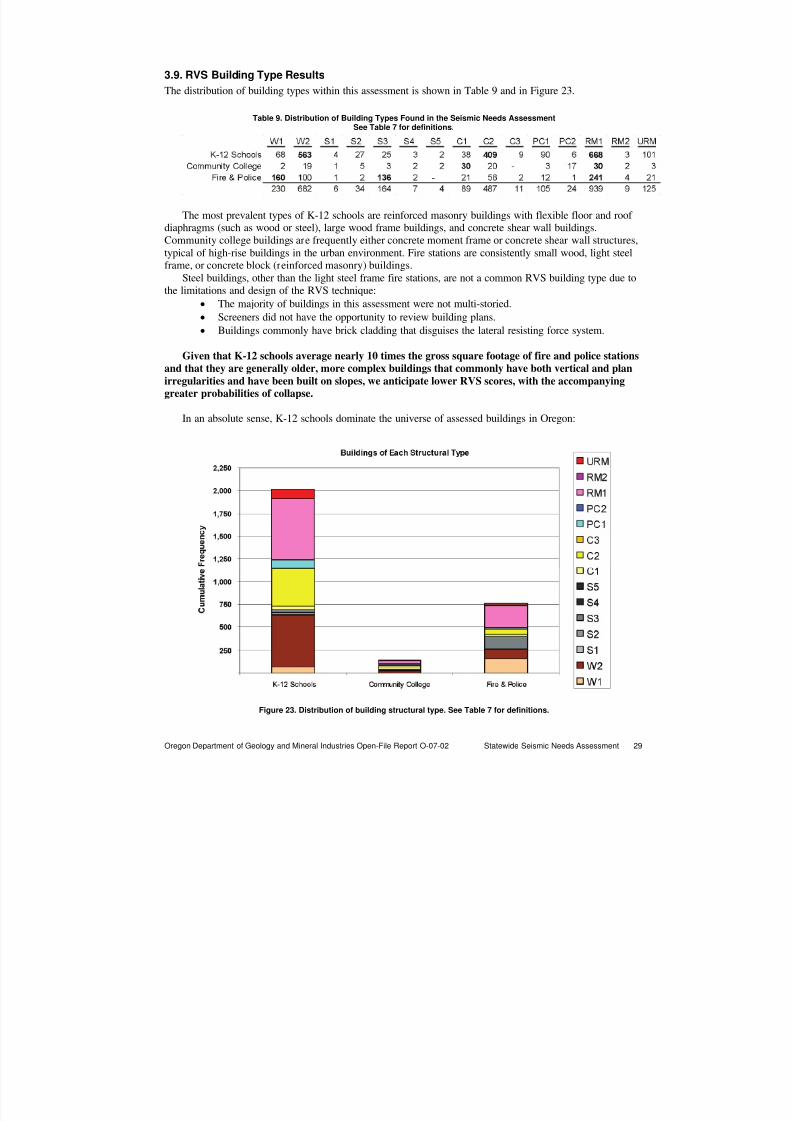
8/3/2019 Statewide Seismic Needs Assessment report
http://slidepdf.com/reader/full/statewide-seismic-needs-assessment-report 37/341
Oregon Department of Geology and Mineral Industries Open-File Report O-07-02 Statewide Seismic Needs Assessment 29
3.9. RVS Building Type Results
The distribution of building types within this assessment is shown in Table 9 and in Figure 23.
Table 9. Distribution of Building Types Found in the Seismic Needs AssessmentSee Table 7 for definitions.
The most prevalent types of K-12 schools are reinforced masonry buildings with flexible floor and roof diaphragms (such as wood or steel), large wood frame buildings, and concrete shear wall buildings.Community college buildings are frequently either concrete moment frame or concrete shear wall structures,typical of high-rise buildings in the urban environment. Fire stations are consistently small wood, light steelframe, or concrete block (reinforced masonry) buildings.
Steel buildings, other than the light steel frame fire stations, are not a common RVS building type due tothe limitations and design of the RVS technique:
• The majority of buildings in this assessment were not multi-storied.• Screeners did not have the opportunity to review building plans.
• Buildings commonly have brick cladding that disguises the lateral resisting force system.
Given that K-12 schools average nearly 10 times the gross square footage of fire and police stations
and that they are generally older, more complex buildings that commonly have both vertical and plan
irregularities and have been built on slopes, we anticipate lower RVS scores, with the accompanyinggreater probabilities of collapse.
In an absolute sense, K-12 schools dominate the universe of assessed buildings in Oregon:
Figure 23. Distribution of building structural type. See Table 7 for definitions.
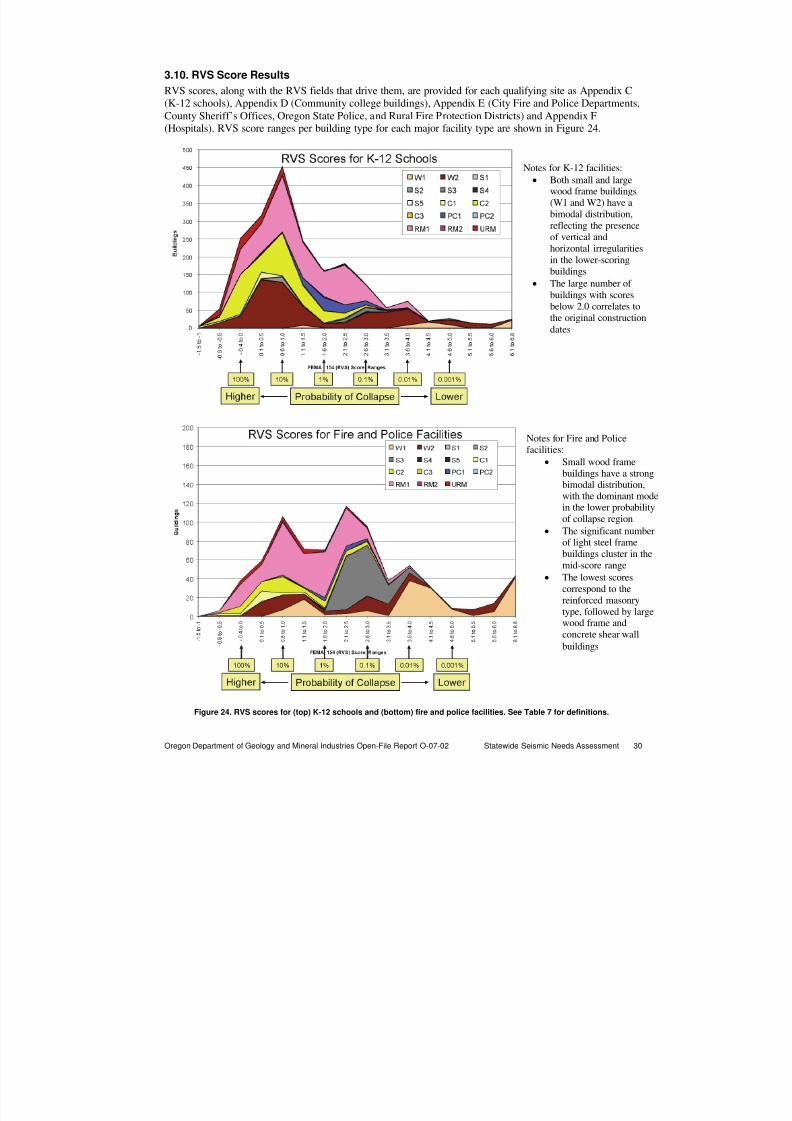
8/3/2019 Statewide Seismic Needs Assessment report
http://slidepdf.com/reader/full/statewide-seismic-needs-assessment-report 38/341
Oregon Department of Geology and Mineral Industries Open-File Report O-07-02 Statewide Seismic Needs Assessment 30
3.10. RVS Score Results
RVS scores, along with the RVS fields that drive them, are provided for each qualifying site as Appendix C(K-12 schools), Appendix D (Community college buildings), Appendix E (City Fire and Police Departments,County Sheriff’s Offices, Oregon State Police, and Rural Fire Protection Districts) and Appendix F(Hospitals). RVS score ranges per building type for each major facility type are shown in Figure 24.
Figure 24. RVS scores for (top) K-12 schools and (bottom) fire and police facilities. See Table 7 for definitions.
Notes for K-12 facilities:
• Both small and largewood frame buildings(W1 and W2) have abimodal distribution,reflecting the presenceof vertical andhorizontal irregularitiesin the lower-scoringbuildings
• The large number of buildings with scores
below 2.0 correlates tothe original constructiondates
Notes for Fire and Police
facilities:• Small wood frame
buildings have a strongbimodal distribution,with the dominant modein the lower probabilityof collapse region
• The significant numberof light steel framebuildings cluster in themid-score range
• The lowest scorescorrespond to thereinforced masonrytype, followed by largewood frame andconcrete shear wall
buildings
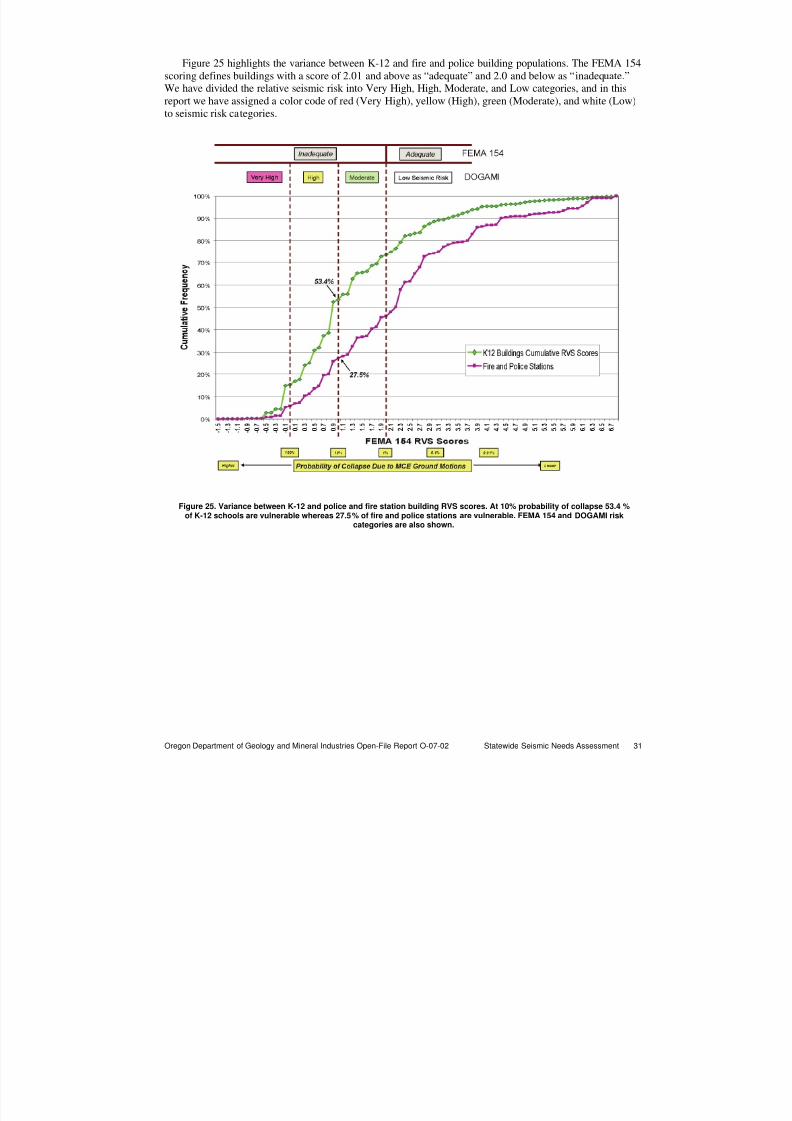
8/3/2019 Statewide Seismic Needs Assessment report
http://slidepdf.com/reader/full/statewide-seismic-needs-assessment-report 39/341
Oregon Department of Geology and Mineral Industries Open-File Report O-07-02 Statewide Seismic Needs Assessment 31
Figure 25 highlights the variance between K-12 and fire and police building populations. The FEMA 154scoring defines buildings with a score of 2.01 and above as “adequate” and 2.0 and below as “inadequate.”We have divided the relative seismic risk into Very High, High, Moderate, and Low categories, and in thisreport we have assigned a color code of red (Very High), yellow (High), green (Moderate), and white (Low)to seismic risk categories.
Figure 25. Variance between K-12 and police and fire station building RVS scores. At 10% probability of collapse 53.4 %of K-12 schools are vulnerable whereas 27.5% of fire and police stations are vulnerable. FEMA 154 and DOGAMI risk
categories are also shown.
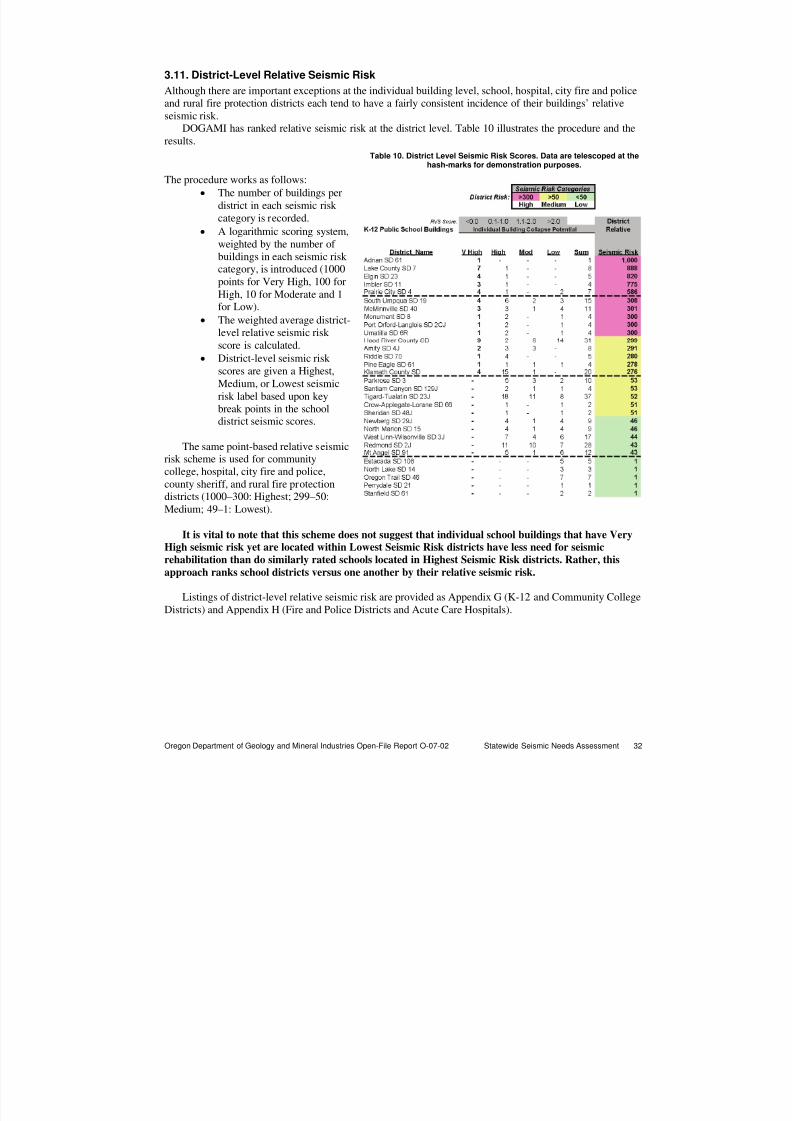
8/3/2019 Statewide Seismic Needs Assessment report
http://slidepdf.com/reader/full/statewide-seismic-needs-assessment-report 40/341
Oregon Department of Geology and Mineral Industries Open-File Report O-07-02 Statewide Seismic Needs Assessment 32
3.11. District-Level Relative Seismic Risk
Although there are important exceptions at the individual building level, school, hospital, city fire and policeand rural fire protection districts each tend to have a fairly consistent incidence of their buildings’ relativeseismic risk.
DOGAMI has ranked relative seismic risk at the district level. Table 10 illustrates the procedure and theresults.
Table 10. District Level Seismic Risk Scores. Data are telescoped at thehash-marks for demonstration purposes.
The procedure works as follows:
• The number of buildings perdistrict in each seismic risk category is recorded.
• A logarithmic scoring system,weighted by the number of buildings in each seismic risk category, is introduced (1000points for Very High, 100 forHigh, 10 for Moderate and 1
for Low).• The weighted average district-
level relative seismic risk score is calculated.
• District-level seismic risk scores are given a Highest,Medium, or Lowest seismicrisk label based upon keybreak points in the schooldistrict seismic scores.
The same point-based relative seismicrisk scheme is used for communitycollege, hospital, city fire and police,county sheriff, and rural fire protectiondistricts (1000–300: Highest; 299–50:Medium; 49–1: Lowest).
It is vital to note that this scheme does not suggest that individual school buildings that have VeryHigh seismic risk yet are located within Lowest Seismic Risk districts have less need for seismic
rehabilitation than do similarly rated schools located in Highest Seismic Risk districts. Rather, this
approach ranks school districts versus one another by their relative seismic risk.
Listings of district-level relative seismic risk are provided as Appendix G (K-12 and Community College
Districts) and Appendix H (Fire and Police Districts and Acute Care Hospitals).
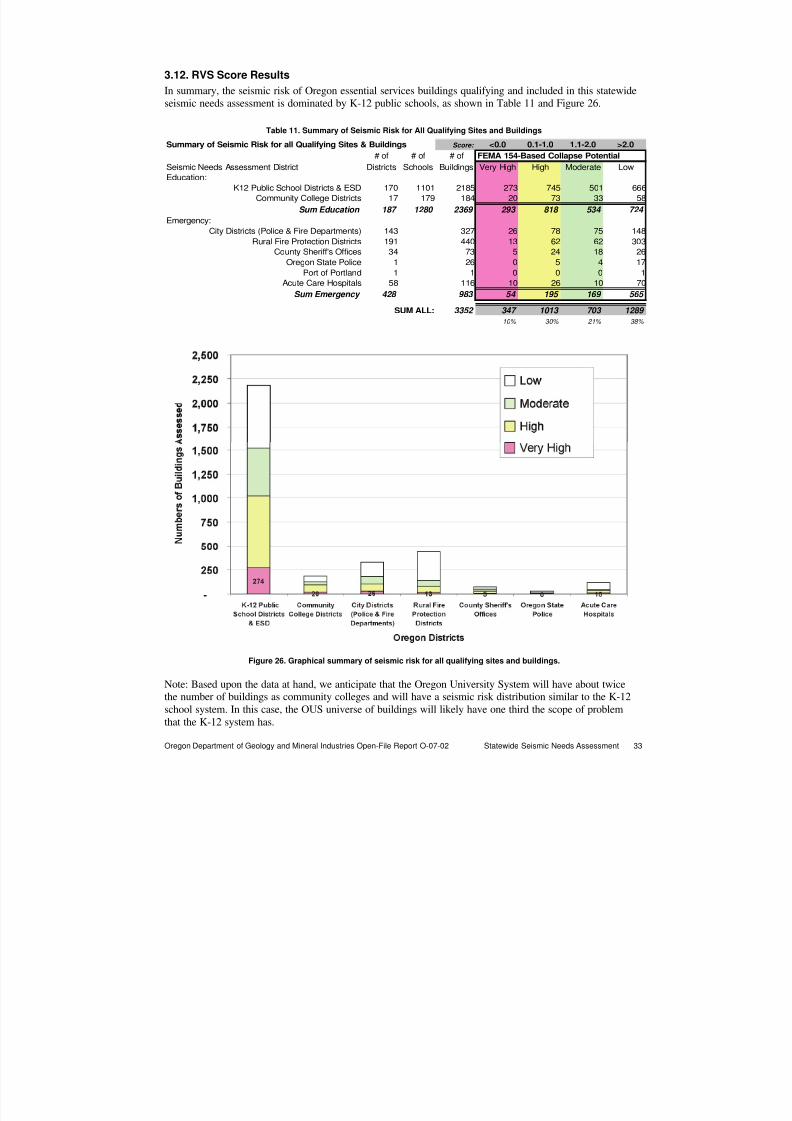
8/3/2019 Statewide Seismic Needs Assessment report
http://slidepdf.com/reader/full/statewide-seismic-needs-assessment-report 41/341
Oregon Department of Geology and Mineral Industries Open-File Report O-07-02 Statewide Seismic Needs Assessment 33
3.12. RVS Score Results
In summary, the seismic risk of Oregon essential services buildings qualifying and included in this statewideseismic needs assessment is dominated by K-12 public schools, as shown in Table 11 and Figure 26.
Table 11. Summary of Seismic Risk for All Qualifying Sites and Buildings
Summary of Seismic Risk for all Qualifying Sites & Buildings Score: <0.0 0.1-1.0 1.1-2.0 >2.0
# of # of # of FEMA 154-Based Collapse Potential
Seismic Needs Assessment District Districts Schools Buildings Very High High Moderate Low
Education:
K12 Public School Districts & ESD 170 1101 2185 273 745 501 666
Community College Districts 17 179 184 20 73 33 58
Sum Education 187 1280 2369 293 818 534 724
Emergency:
City Districts (Police & Fire Departments) 143 327 26 78 75 148
Rural Fire Protection Districts 191 440 13 62 62 303
County Sheriff's Offices 34 73 5 24 18 26
Oregon State Police 1 26 0 5 4 17
Port of Portland 1 1 0 0 0 1
Acute Care Hospitals 58 116 10 26 10 70
Sum Emergency 428 983 54 195 169 565
SUM ALL: 3352 347 1013 703 1289
10% 30% 21% 38%
Figure 26. Graphical summary of seismic risk for all qualifying sites and buildings.
Note: Based upon the data at hand, we anticipate that the Oregon University System will have about twicethe number of buildings as community colleges and will have a seismic risk distribution similar to the K-12school system. In this case, the OUS universe of buildings will likely have one third the scope of problemthat the K-12 system has.
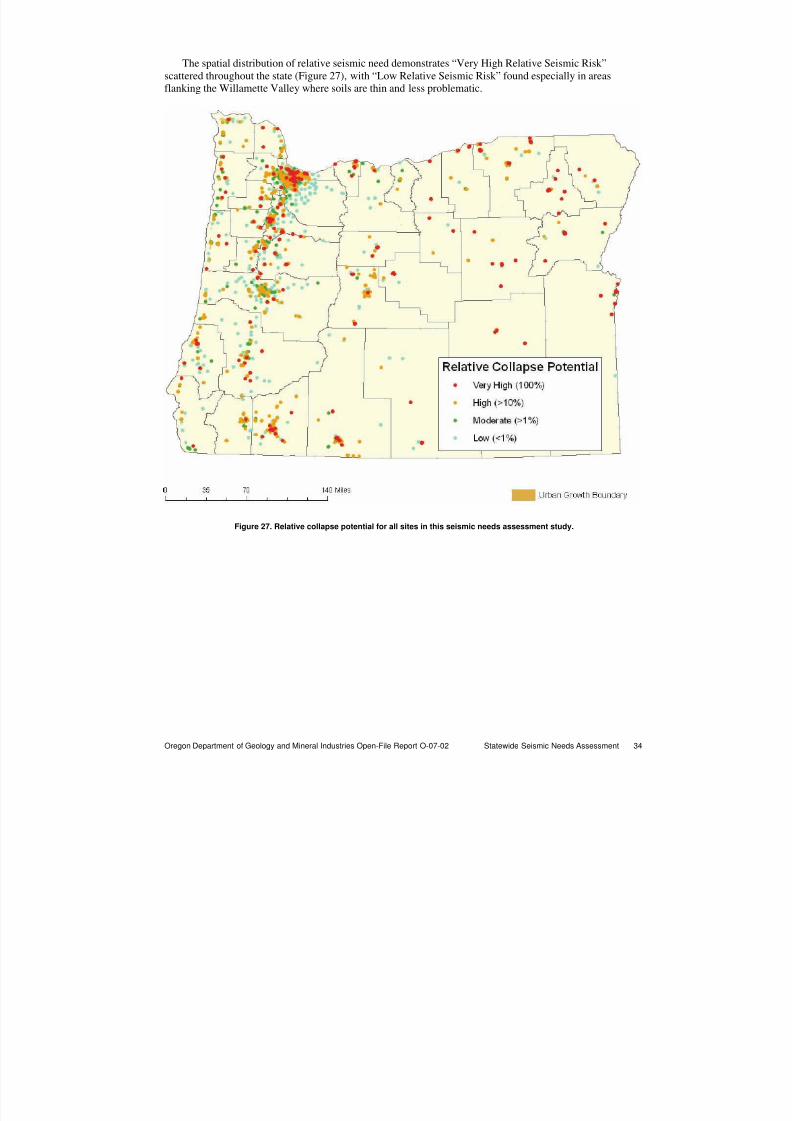
8/3/2019 Statewide Seismic Needs Assessment report
http://slidepdf.com/reader/full/statewide-seismic-needs-assessment-report 42/341
Oregon Department of Geology and Mineral Industries Open-File Report O-07-02 Statewide Seismic Needs Assessment 34
The spatial distribution of relative seismic need demonstrates “Very High Relative Seismic Risk”scattered throughout the state (Figure 27), with “Low Relative Seismic Risk” found especially in areasflanking the Willamette Valley where soils are thin and less problematic.
Figure 27. Relative collapse potential for all sites in this seismic needs assessment study.
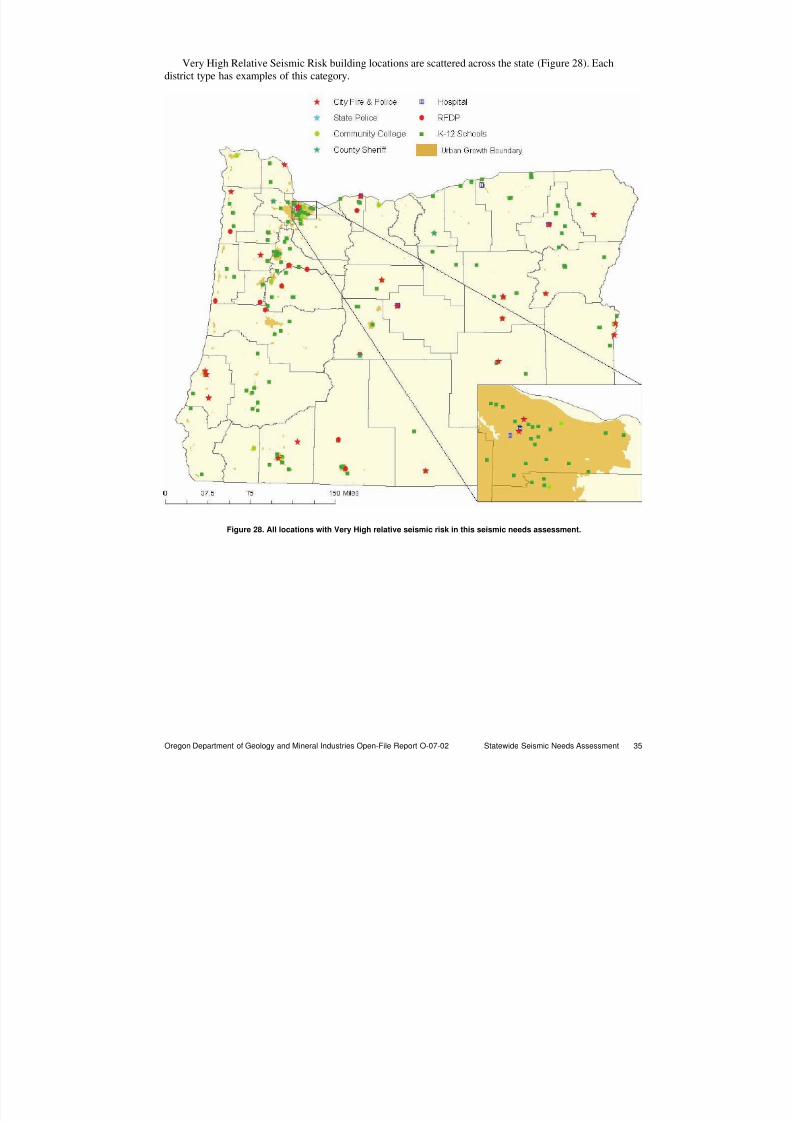
8/3/2019 Statewide Seismic Needs Assessment report
http://slidepdf.com/reader/full/statewide-seismic-needs-assessment-report 43/341
Oregon Department of Geology and Mineral Industries Open-File Report O-07-02 Statewide Seismic Needs Assessment 35
Very High Relative Seismic Risk building locations are scattered across the state (Figure 28). Eachdistrict type has examples of this category.
Figure 28. All locations with Very High relative seismic risk in this seismic needs assessment.
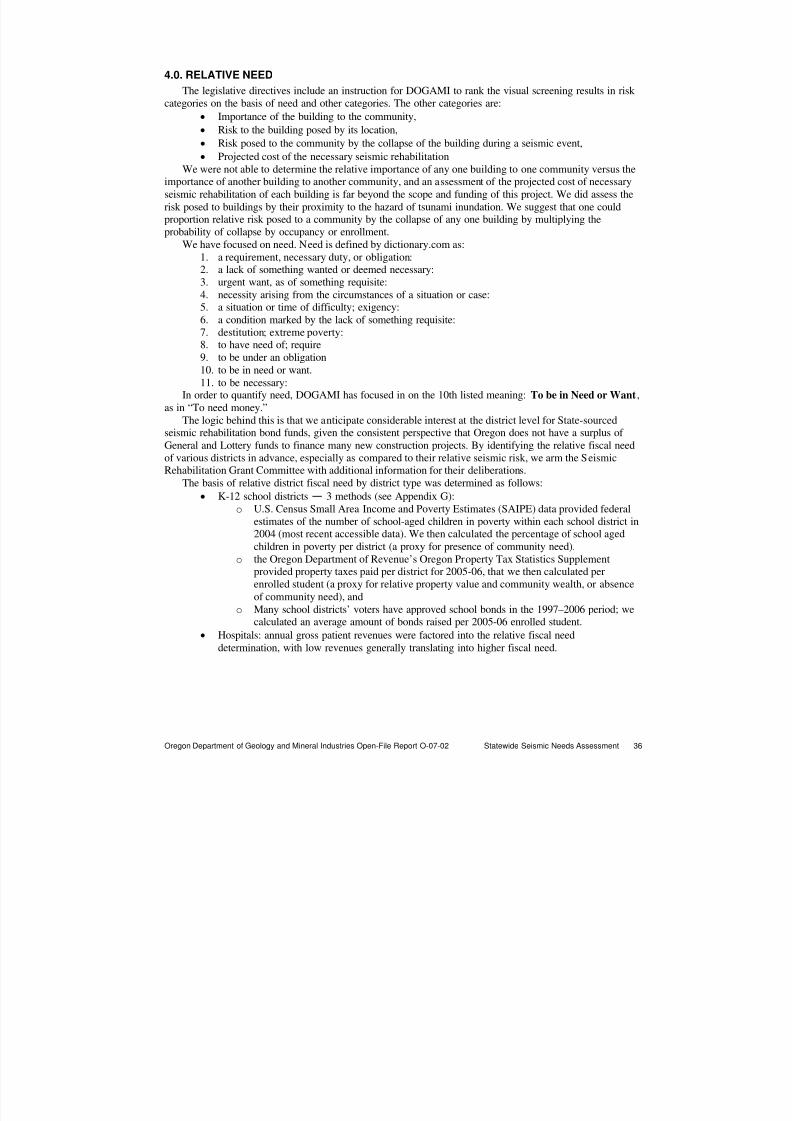
8/3/2019 Statewide Seismic Needs Assessment report
http://slidepdf.com/reader/full/statewide-seismic-needs-assessment-report 44/341
Oregon Department of Geology and Mineral Industries Open-File Report O-07-02 Statewide Seismic Needs Assessment 36
4.0. RELATIVE NEED
The legislative directives include an instruction for DOGAMI to rank the visual screening results in risk categories on the basis of need and other categories. The other categories are:
• Importance of the building to the community,
• Risk to the building posed by its location,
• Risk posed to the community by the collapse of the building during a seismic event,
• Projected cost of the necessary seismic rehabilitationWe were not able to determine the relative importance of any one building to one community versus the
importance of another building to another community, and an assessment of the projected cost of necessaryseismic rehabilitation of each building is far beyond the scope and funding of this project. We did assess therisk posed to buildings by their proximity to the hazard of tsunami inundation. We suggest that one couldproportion relative risk posed to a community by the collapse of any one building by multiplying theprobability of collapse by occupancy or enrollment.
We have focused on need. Need is defined by dictionary.com as:1. a requirement, necessary duty, or obligation:2. a lack of something wanted or deemed necessary:3. urgent want, as of something requisite:4. necessity arising from the circumstances of a situation or case:5. a situation or time of difficulty; exigency:6. a condition marked by the lack of something requisite:7. destitution; extreme poverty:8. to have need of; require9. to be under an obligation10. to be in need or want.11. to be necessary:
In order to quantify need, DOGAMI has focused in on the 10th listed meaning: To be in Need or Want,as in “To need money.”
The logic behind this is that we anticipate considerable interest at the district level for State-sourcedseismic rehabilitation bond funds, given the consistent perspective that Oregon does not have a surplus of General and Lottery funds to finance many new construction projects. By identifying the relative fiscal need
of various districts in advance, especially as compared to their relative seismic risk, we arm the SeismicRehabilitation Grant Committee with additional information for their deliberations.
The basis of relative district fiscal need by district type was determined as follows:
• K-12 school districts— 3 methods (see Appendix G):o U.S. Census Small Area Income and Poverty Estimates (SAIPE) data provided federal
estimates of the number of school-aged children in poverty within each school district in2004 (most recent accessible data). We then calculated the percentage of school agedchildren in poverty per district (a proxy for presence of community need).
o the Oregon Department of Revenue’s Oregon Property Tax Statistics Supplementprovided property taxes paid per district for 2005-06, that we then calculated perenrolled student (a proxy for relative property value and community wealth, or absenceof community need), and
o Many school districts’ voters have approved school bonds in the 1997–2006 period; wecalculated an average amount of bonds raised per 2005-06 enrolled student.
• Hospitals: annual gross patient revenues were factored into the relative fiscal needdetermination, with low revenues generally translating into higher fiscal need.

8/3/2019 Statewide Seismic Needs Assessment report
http://slidepdf.com/reader/full/statewide-seismic-needs-assessment-report 45/341
Oregon Department of Geology and Mineral Industries Open-File Report O-07-02 Statewide Seismic Needs Assessment 37
The objective was to provide reliable quantitative data for the Seismic Rehabilitation Grants Committee.In essence, the objective is to reduce risk and need into a two-dimensional plot (Figure 29).
Figure 29. Seismic risk and need can be reduced to a two-dimensional plot.
4.1. K-12 School District Relative Fiscal Need
The U.S. Census SAIPE data for 2004 provides estimates of the total population, age 5-17 school-agedpopulation, and number of age 5–17 living in households in poverty for every school district (SD) in thenation. We calculated the proportion of school aged children in poverty (Oregon average: 14.2%, rangingfrom 26.9% in Elgin SD and North Powders SD to 2.7% in Lake Oswego SD) as one method to determinethe presence or absence of school district relative fiscal need:
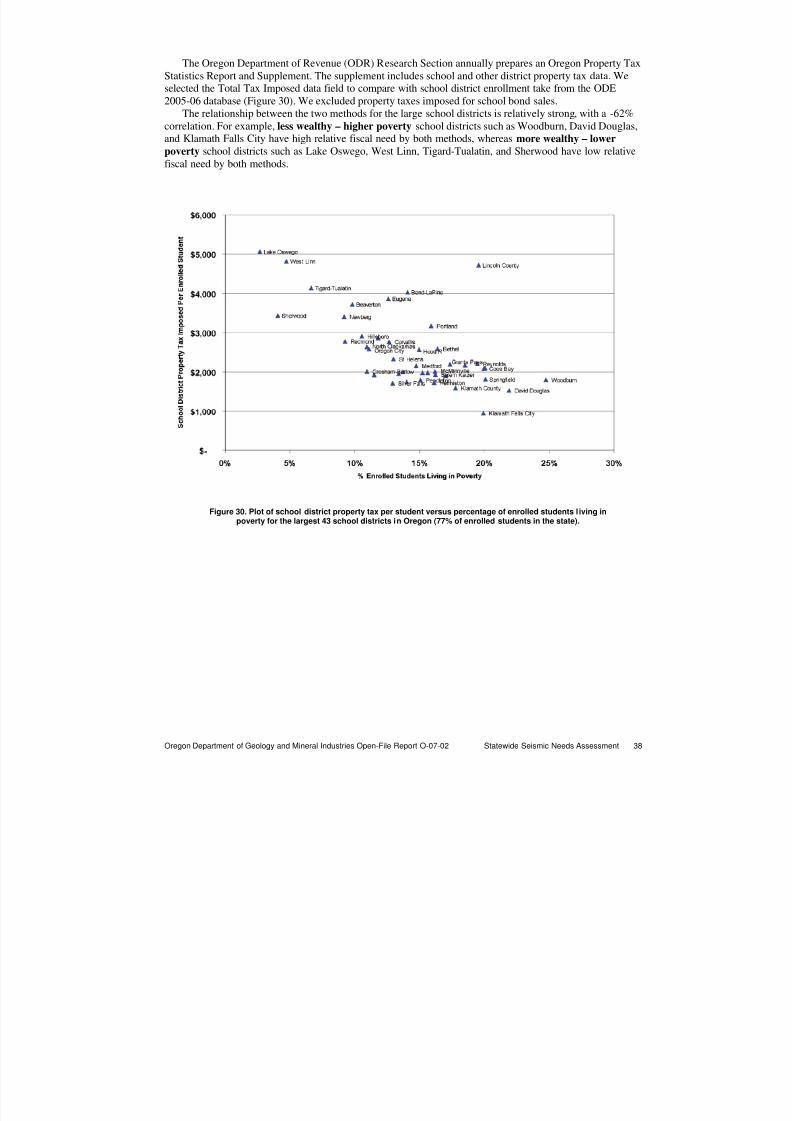
8/3/2019 Statewide Seismic Needs Assessment report
http://slidepdf.com/reader/full/statewide-seismic-needs-assessment-report 46/341
Oregon Department of Geology and Mineral Industries Open-File Report O-07-02 Statewide Seismic Needs Assessment 38
The Oregon Department of Revenue (ODR) Research Section annually prepares an Oregon Property TaxStatistics Report and Supplement. The supplement includes school and other district property tax data. Weselected the Total Tax Imposed data field to compare with school district enrollment take from the ODE2005-06 database (Figure 30). We excluded property taxes imposed for school bond sales.
The relationship between the two methods for the large school districts is relatively strong, with a -62%correlation. For example, less wealthy – higher poverty school districts such as Woodburn, David Douglas,and Klamath Falls City have high relative fiscal need by both methods, whereas more wealthy – lower
poverty school districts such as Lake Oswego, West Linn, Tigard-Tualatin, and Sherwood have low relativefiscal need by both methods.
Figure 30. Plot of school district property tax per student versus percentage of enrolled students l iving inpoverty for the largest 43 school districts in Oregon (77% of enrolled students in the state).
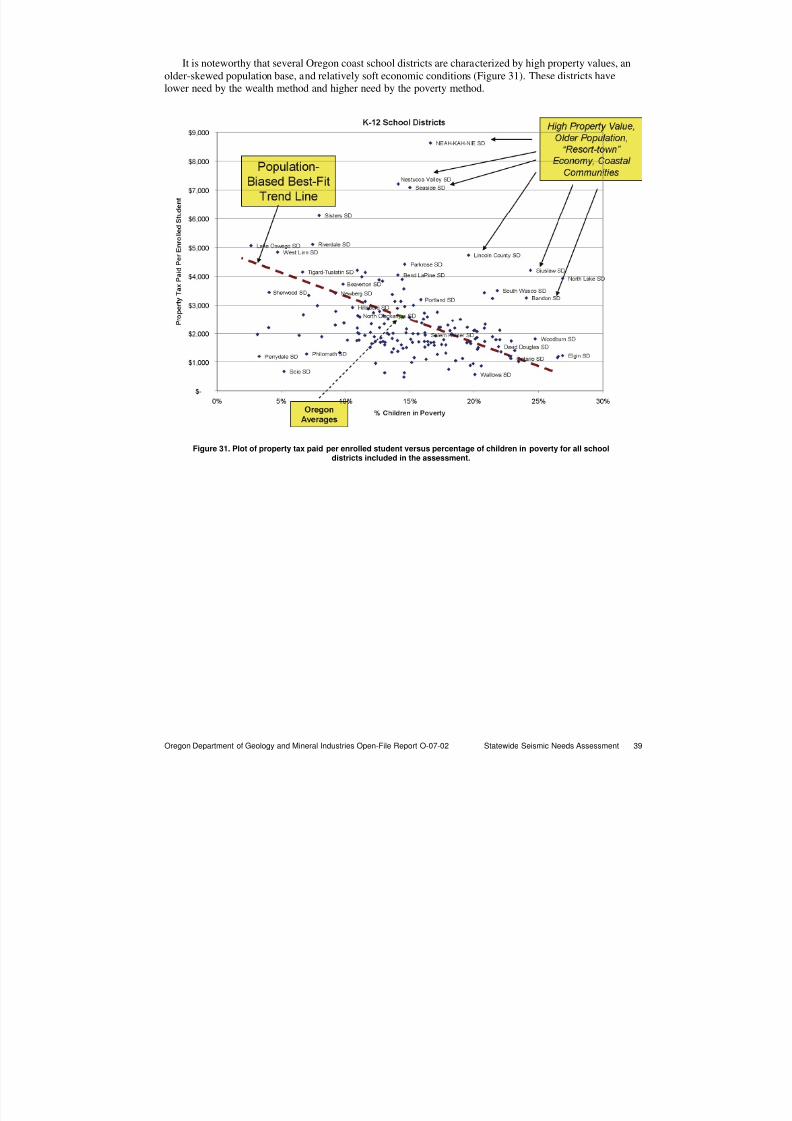
8/3/2019 Statewide Seismic Needs Assessment report
http://slidepdf.com/reader/full/statewide-seismic-needs-assessment-report 47/341
Oregon Department of Geology and Mineral Industries Open-File Report O-07-02 Statewide Seismic Needs Assessment 39
It is noteworthy that several Oregon coast school districts are characterized by high property values, anolder-skewed population base, and relatively soft economic conditions (Figure 31). These districts havelower need by the wealth method and higher need by the poverty method.
Figure 31. Plot of property tax paid per enrolled student versus percentage of children in poverty for all schooldistricts included in the assessment.
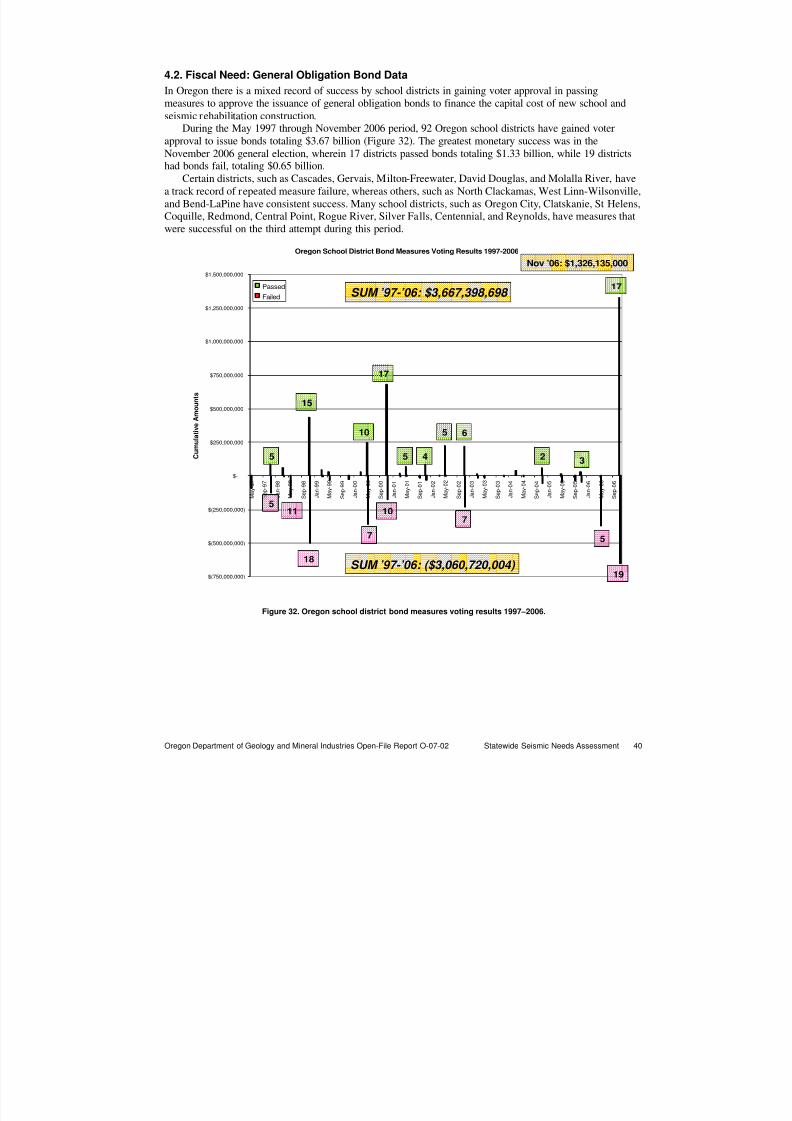
8/3/2019 Statewide Seismic Needs Assessment report
http://slidepdf.com/reader/full/statewide-seismic-needs-assessment-report 48/341
Oregon Department of Geology and Mineral Industries Open-File Report O-07-02 Statewide Seismic Needs Assessment 40
4.2. Fiscal Need: General Obligation Bond Data
In Oregon there is a mixed record of success by school districts in gaining voter approval in passingmeasures to approve the issuance of general obligation bonds to finance the capital cost of new school andseismic rehabilitation construction.
During the May 1997 through November 2006 period, 92 Oregon school districts have gained voterapproval to issue bonds totaling $3.67 billion (Figure 32). The greatest monetary success was in the
November 2006 general election, wherein 17 districts passed bonds totaling $1.33 billion, while 19 districtshad bonds fail, totaling $0.65 billion.
Certain districts, such as Cascades, Gervais, Milton-Freewater, David Douglas, and Molalla River, havea track record of repeated measure failure, whereas others, such as North Clackamas, West Linn-Wilsonville,and Bend-LaPine have consistent success. Many school districts, such as Oregon City, Clatskanie, St Helens,Coquille, Redmond, Central Point, Rogue River, Silver Falls, Centennial, and Reynolds, have measures thatwere successful on the third attempt during this period.
Oregon School District Bond Measures Voting Results 1997-2006
$(750,000,000)
$(500,000,000)
$(250,000,000)
$-
$250,000,000
$500,000,000
$750,000,000
$1,000,000,000
$1,250,000,000
$1,500,000,000
M a y - 9 7
S e p - 9 7
J a n - 9 8
M a y - 9 8
S e p - 9 8
J a n - 9 9
M a y - 9 9
S e p - 9 9
J a n - 0 0
M a y - 0 0
S e p - 0 0
J a n - 0 1
M a y - 0 1
S e p - 0 1
J a n - 0 2
M a y - 0 2
S e p - 0 2
J a n - 0 3
M a y - 0 3
S e p - 0 3
J a n - 0 4
M a y - 0 4
S e p - 0 4
J a n - 0 5
M a y - 0 5
S e p - 0 5
J a n - 0 6
M a y - 0 6
S e p - 0 6
C u m u l a t i v e A m o u n t s
Passed
Failed
Nov ’06: $1,326,135,000
SUM ’97-’06: $3,667,398,698
SUM ’97-’06: ($3,060,720,004)
15
10
17
5 6
5 4 2 3
17
18
11
5
5
7
107
5
19
Figure 32. Oregon school district bond measures voting results 1997–2006.
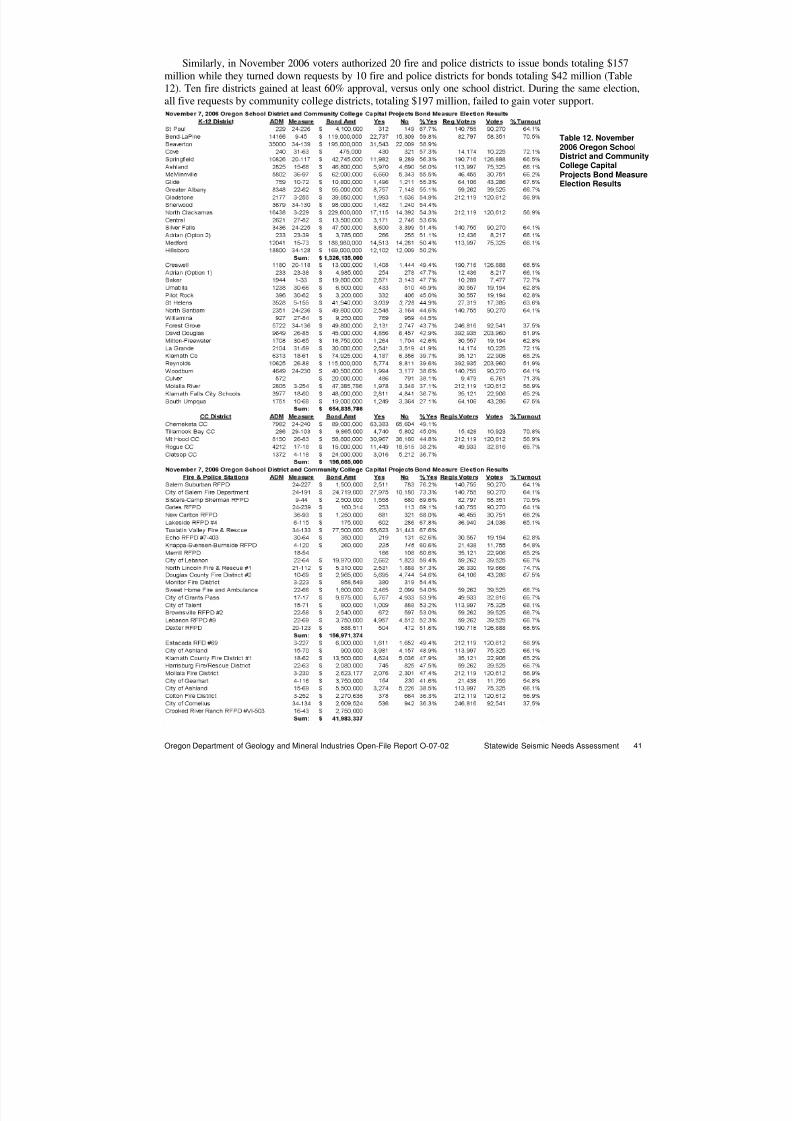
8/3/2019 Statewide Seismic Needs Assessment report
http://slidepdf.com/reader/full/statewide-seismic-needs-assessment-report 49/341
Oregon Department of Geology and Mineral Industries Open-File Report O-07-02 Statewide Seismic Needs Assessment 41
Similarly, in November 2006 voters authorized 20 fire and police districts to issue bonds totaling $157million while they turned down requests by 10 fire and police districts for bonds totaling $42 million (Table12). Ten fire districts gained at least 60% approval, versus only one school district. During the same election,all five requests by community college districts, totaling $197 million, failed to gain voter support.
Table 12. November
2006 Oregon SchoolDistrict and CommunityCollege CapitalProjects Bond MeasureElection Results
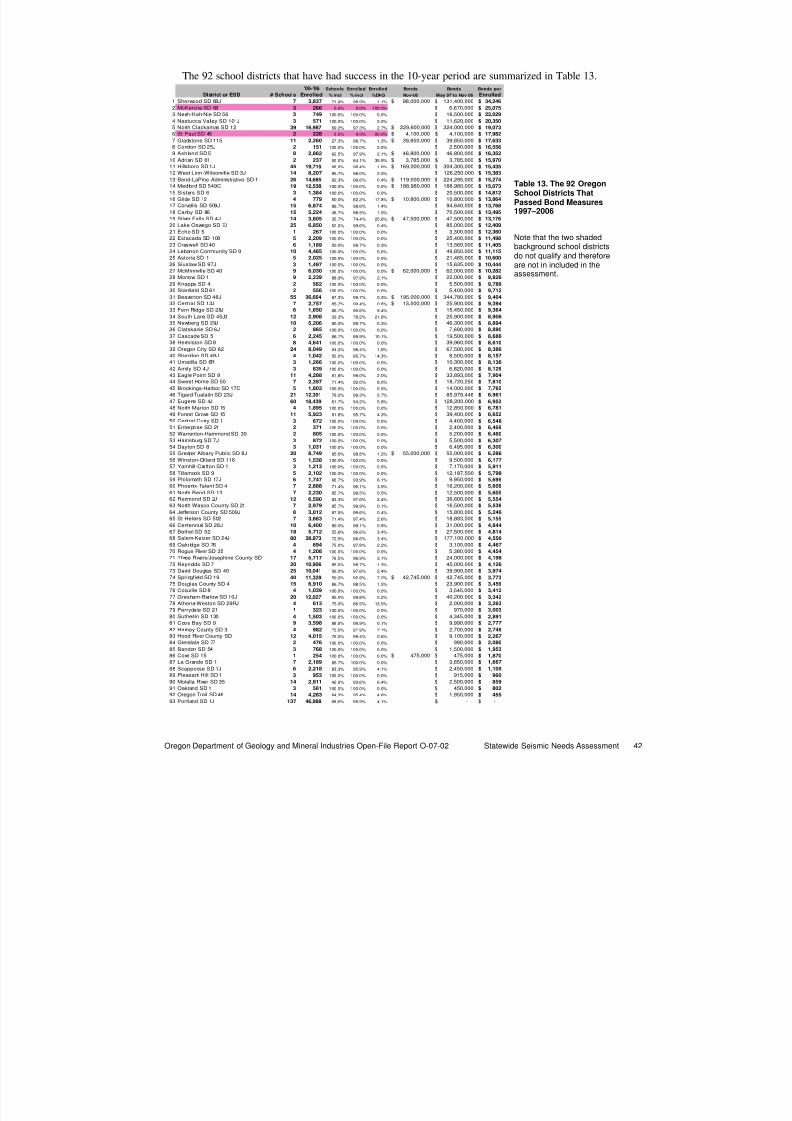
8/3/2019 Statewide Seismic Needs Assessment report
http://slidepdf.com/reader/full/statewide-seismic-needs-assessment-report 50/341
8/3/2019 Statewide Seismic Needs Assessment report
http://slidepdf.com/reader/full/statewide-seismic-needs-assessment-report 51/341
Oregon Department of Geology and Mineral Industries Open-File Report O-07-02 Statewide Seismic Needs Assessment 43
Table 13 includes a calculation of the amount of bonds approved in the past decade per currentlyenrolled student. This statistic ranges up to $34,246 per student, and averages $8,729.
Note that since the average K-12 school in Oregon is 70,500 square feet and has an enrollment of 488,there is about 144 square feet of school per student. At a capital cost of $125 per square foot, the averagecapital cost of a school building is $18,000 per enrolled student. Further, at $15 per square foot, and whereneeded, the rough seismic rehabilitation cost per enrolled student in Oregon is about $2,160 per student.
Although the measure occurred prior to this study period, the $196.7 million in bonds approved by
Portland voters in 1996 works out to $4,186 per currently enrolled student and is proportionately very similarto the $24 million investment made by Three Rivers/Josephine County voters during the 1997–2006 period.
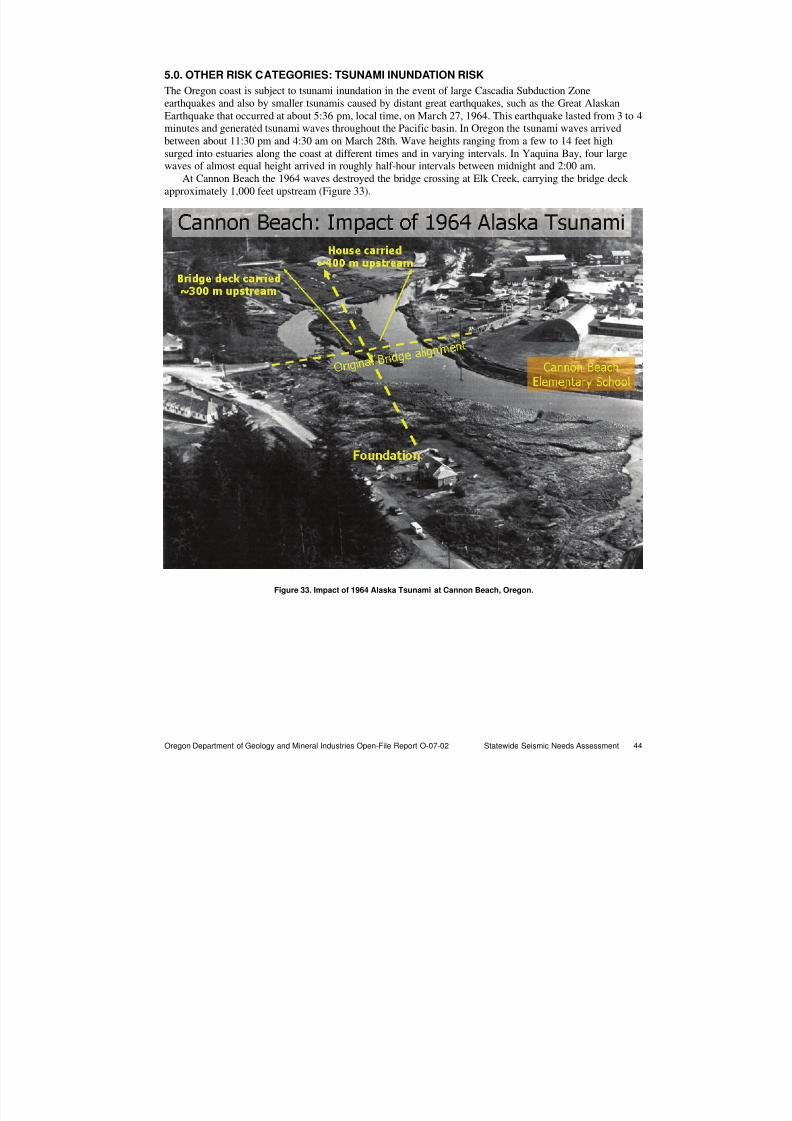
8/3/2019 Statewide Seismic Needs Assessment report
http://slidepdf.com/reader/full/statewide-seismic-needs-assessment-report 52/341
Oregon Department of Geology and Mineral Industries Open-File Report O-07-02 Statewide Seismic Needs Assessment 44
5.0. OTHER RISK CATEGORIES: TSUNAMI INUNDATION RISK
The Oregon coast is subject to tsunami inundation in the event of large Cascadia Subduction Zoneearthquakes and also by smaller tsunamis caused by distant great earthquakes, such as the Great AlaskanEarthquake that occurred at about 5:36 pm, local time, on March 27, 1964. This earthquake lasted from 3 to 4minutes and generated tsunami waves throughout the Pacific basin. In Oregon the tsunami waves arrivedbetween about 11:30 pm and 4:30 am on March 28th. Wave heights ranging from a few to 14 feet high
surged into estuaries along the coast at different times and in varying intervals. In Yaquina Bay, four largewaves of almost equal height arrived in roughly half-hour intervals between midnight and 2:00 am.
At Cannon Beach the 1964 waves destroyed the bridge crossing at Elk Creek, carrying the bridge deck approximately 1,000 feet upstream (Figure 33).
Figure 33. Impact of 1964 Alaska Tsunami at Cannon Beach, Oregon.
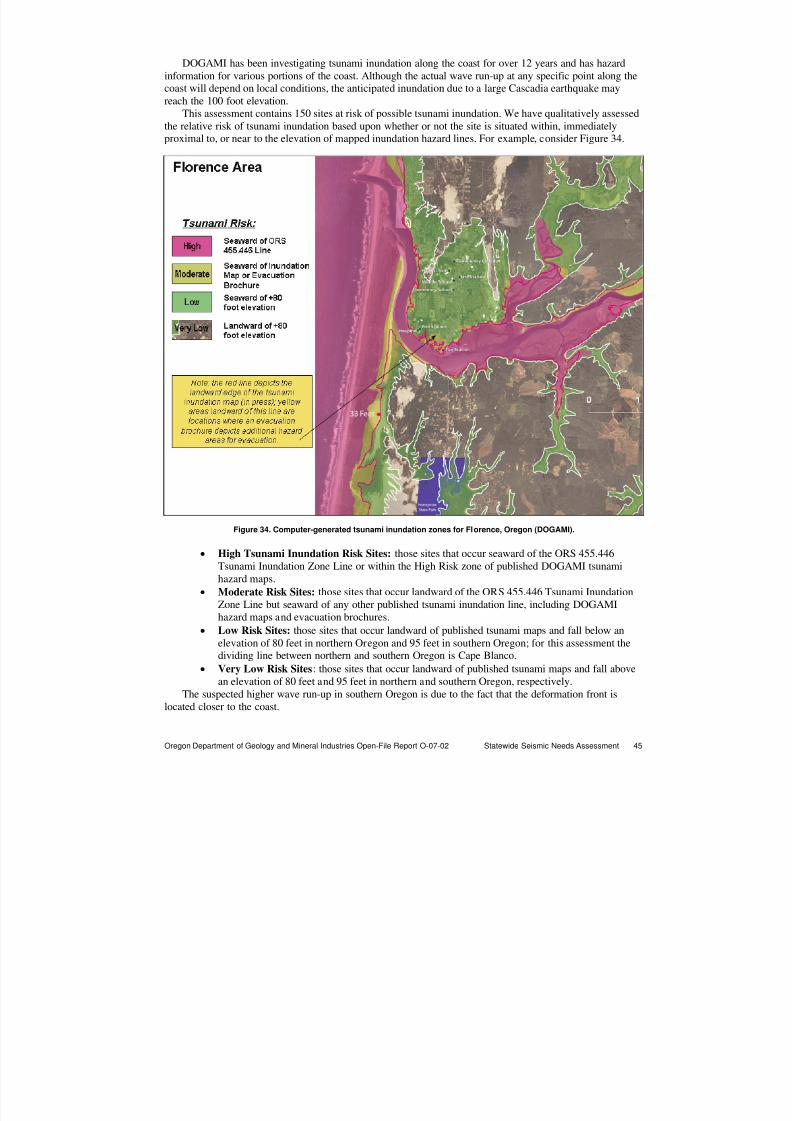
8/3/2019 Statewide Seismic Needs Assessment report
http://slidepdf.com/reader/full/statewide-seismic-needs-assessment-report 53/341
Oregon Department of Geology and Mineral Industries Open-File Report O-07-02 Statewide Seismic Needs Assessment 45
DOGAMI has been investigating tsunami inundation along the coast for over 12 years and has hazardinformation for various portions of the coast. Although the actual wave run-up at any specific point along thecoast will depend on local conditions, the anticipated inundation due to a large Cascadia earthquake mayreach the 100 foot elevation.
This assessment contains 150 sites at risk of possible tsunami inundation. We have qualitatively assessedthe relative risk of tsunami inundation based upon whether or not the site is situated within, immediatelyproximal to, or near to the elevation of mapped inundation hazard lines. For example, consider Figure 34.
Figure 34. Computer-generated tsunami inundation zones for Florence, Oregon (DOGAMI).
• High Tsunami Inundation Risk Sites: those sites that occur seaward of the ORS 455.446
Tsunami Inundation Zone Line or within the High Risk zone of published DOGAMI tsunamihazard maps.
• Moderate Risk Sites: those sites that occur landward of the ORS 455.446 Tsunami Inundation
Zone Line but seaward of any other published tsunami inundation line, including DOGAMIhazard maps and evacuation brochures.
• Low Risk Sites: those sites that occur landward of published tsunami maps and fall below anelevation of 80 feet in northern Oregon and 95 feet in southern Oregon; for this assessment thedividing line between northern and southern Oregon is Cape Blanco.
• Very Low Risk Sites: those sites that occur landward of published tsunami maps and fall abovean elevation of 80 feet and 95 feet in northern and southern Oregon, respectively.
The suspected higher wave run-up in southern Oregon is due to the fact that the deformation front islocated closer to the coast.
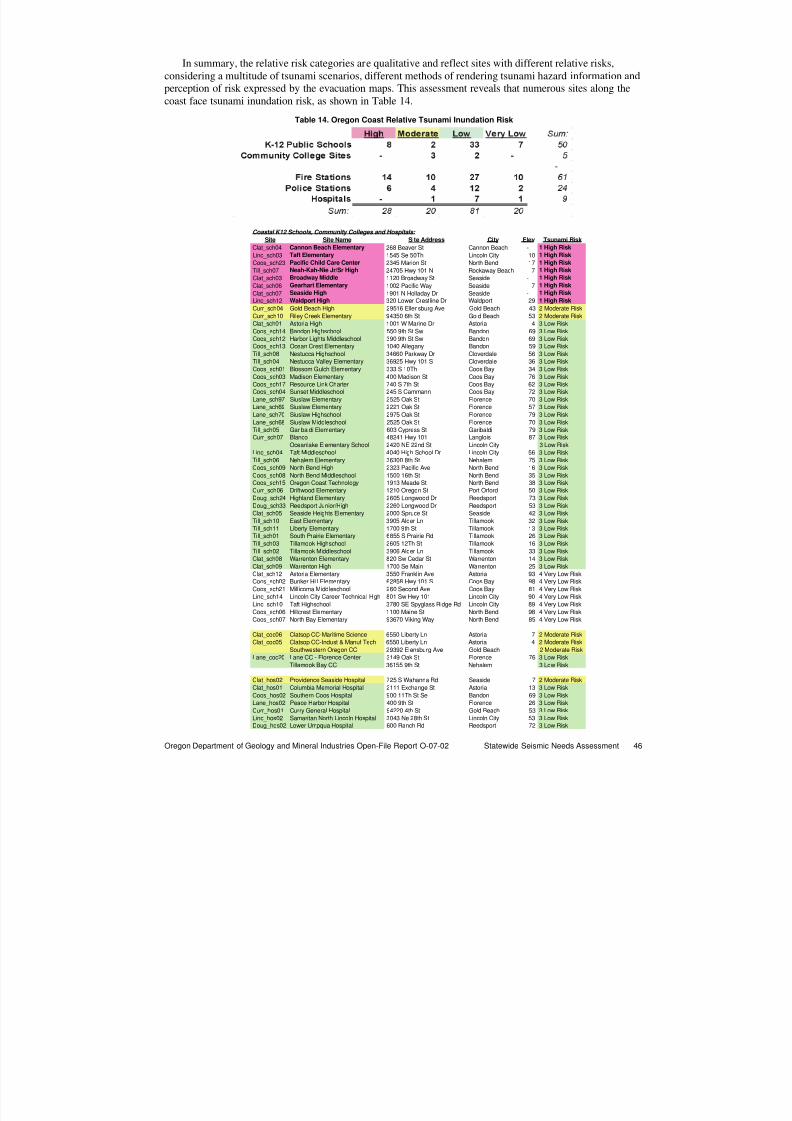
8/3/2019 Statewide Seismic Needs Assessment report
http://slidepdf.com/reader/full/statewide-seismic-needs-assessment-report 54/341
Oregon Department of Geology and Mineral Industries Open-File Report O-07-02 Statewide Seismic Needs Assessment 46
In summary, the relative risk categories are qualitative and reflect sites with different relative risks,considering a multitude of tsunami scenarios, different methods of rendering tsunami hazard information andperception of risk expressed by the evacuation maps. This assessment reveals that numerous sites along thecoast face tsunami inundation risk, as shown in Table 14.
Table 14. Oregon Coast Relative Tsunami Inundation Risk
Coastal K12 Schools, Community Colleges and Hospitals:
Site Site Name Site Address City Elev Tsunami Risk
Clat_sch04 Cannon Beach Elementary 268 Beaver St Cannon Beach - 1 High Risk
Linc_sch03 Taft Elementary 1545 Se 50Th Lincoln City 10 1 High Risk
Coos_sch23 Pacific Child Care Center 2345 Marion St North Bend 17 1 High Risk
Till_sch07 Neah-Kah-Nie Jr/Sr High 24705 Hwy 101 N Rockaway Beach 7 1 High Risk
Clat_sch03 Broadway Middle 1120 Broadway St Seaside - 1 High Risk
Clat_sch06 Gearhart Elementary 1002 Pacific Way Seaside 7 1 High Risk
Clat_sch07 Seaside High 1901 N Holladay Dr Seaside - 1 High Risk
Linc_sch12 Waldport High 320 Lower Crestline Dr Waldport 29 1 High RiskCurr_sch04 Gold Beach High 29516 Ellensburg Ave Gold Beach 43 2 Moderate Risk
Curr_sch10 Riley Creek Elementary 94350 6th St Gold Beach 53 2 Moderate RiskClat_sch01 Astoria High 1001 W Marine Dr Astoria 4 3 Low Risk
Coos_sch14 Bandon Highschool 550 9th St Sw Bandon 69 3 Low RiskCoos_sch12 Harbor Lights Middleschool 390 9th St Sw Bandon 69 3 Low RiskCoos_sch13 Ocean Crest Elementary 1040 Allegany Bandon 59 3 Low Risk
Till_sch08 Nestucca Highschool 34660 Parkway Dr Cloverdale 56 3 Low RiskTill_sch04 Nestucca Valley Elementary 36925 Hwy 101 S Cloverdale 36 3 Low Risk
Coos_sch01 Blossom Gulch Elementary 333 S 10Th Coos Bay 34 3 Low Risk
Coos_sch03 Madison Elementary 400 Madison St Coos Bay 76 3 Low RiskCoos_sch17 Resource Link Charter 740 S 7th St Coos Bay 62 3 Low RiskCoos_sch04 Sunset Middleschool 245 S Cammann Coos Bay 72 3 Low Risk
Lane_sch97 Siuslaw Elementary 2525 Oak St Florence 70 3 Low RiskLane_sch69 Siuslaw Elementary 2221 Oak St Florence 57 3 Low Risk
Lane_sch70 Siuslaw Highschool 2975 Oak St Florence 79 3 Low Risk
Lane_sch68 Siuslaw Middleschool 2525 Oak St Florence 70 3 Low RiskTill_sch05 Garibaldi Elementary 603 Cypress St Garibaldi 79 3 Low RiskCurr_sch07 Blanco 48241 Hwy 101 Langlois 87 3 Low Risk
Oceanlake Elementary School 2420 NE 22nd St Lincoln City 3 Low Risk
Linc_sch04 Taft Middleschool 4040 High School Dr Lincoln City 56 3 Low RiskTill_sch06 Nehalem Elementary 36300 8th St Nehalem 75 3 Low RiskCoos_sch09 North Bend High 2323 Pacific Ave North Bend 16 3 Low Risk
Coos_sch08 North Bend Middleschool 1500 16th St North Bend 35 3 Low RiskCoos_sch15 Oregon Coast Technology 1913 Meade St North Bend 38 3 Low RiskCurr_sch06 Driftwood Elementary 1210 Oregon St Port Orford 50 3 Low Risk
Doug_sch24 Highland Elementary 2605 Longwood Dr Reedsport 73 3 Low Risk
Doug_sch33 Reedsport Junior/High 2260 Longwood Dr Reedsport 53 3 Low RiskClat_sch05 Seaside Heights Elementary 2000 Spruce St Seaside 42 3 Low Risk
Till_sch10 East Elementary 3905 Alder Ln Tillamook 32 3 Low RiskTill_sch11 Liberty Elementary 1700 9th St Tillamook 13 3 Low RiskTill_sch01 South Prairie Elementary 6855 S Prairie Rd Tillamook 26 3 Low Risk
Till_sch03 Tillamook Highschool 2605 12Th St Tillamook 16 3 Low Risk
Till_sch02 Tillamook Middleschool 3906 Alder Ln Tillamook 33 3 Low RiskClat_sch08 Warrenton Elementary 820 Sw Cedar St Warrenton 14 3 Low Risk
Clat_sch09 Warrenton High 1700 Se Main Warrenton 25 3 Low RiskClat_sch12 Astoria Elementary 3550 Franklin Ave Astoria 93 4 Very Low RiskCoos_sch02 Bunker Hill Elementary 62858 Hwy 101 S Coos Bay 98 4 Very Low Risk
Coos_sch21 Millicoma Middleschool 260 Second Ave Coos Bay 81 4 Very Low RiskLinc_sch14 Lincoln City Career Technical High 801 Sw Hwy 101 Lincoln City 90 4 Very Low Risk
Linc_sch10 Taft Highschool 3780 SE Spyglass Ridge Rd Lincoln City 89 4 Very Low RiskCoos_sch06 Hillcrest Elementary 1100 Maine St North Bend 98 4 Very Low RiskCoos_sch07 North Bay Elementary 93670 Viking Way North Bend 85 4 Very Low Risk
Clat_coc06 Clatsop CC-Maritime Science 6550 Liberty Ln Astoria 7 2 Moderate RiskClat_coc05 Clatsop CC-Indust & Manuf Tech 6550 Liberty Ln Astoria 4 2 Moderate Risk
Southwestern Oregon CC 29392 Elensburg Ave Gold Beach 2 Moderate RiskLane_coc20 Lane CC - Florence Center 3149 Oak St Florence 76 3 Low Risk
Tillamook Bay CC 36155 9th St Nehalem 3 Low Risk
Clat_hos02 Providence Seaside Hospital 725 S Wahanna Rd Seaside 7 2 Moderate Risk
Clat_hos01 Columbia Memorial Hospital 2111 Exchange St Astoria 13 3 Low Risk
Coos_hos02 Southern Coos Hospital 900 11Th St Se Bandon 69 3 Low RiskLane_hos02 Peace Harbor Hospital 400 9th St Florence 26 3 Low Risk
Curr_hos01 Curry General Hospital 94220 4th St Gold Beach 53 3 Low Risk
Linc_hos02 Samaritan North Lincoln Hospital 3043 Ne 28th St Lincoln City 53 3 Low RiskDoug_hos02 Lower Umpqua Hospital 600 Ranch Rd Reedsport 72 3 Low Risk
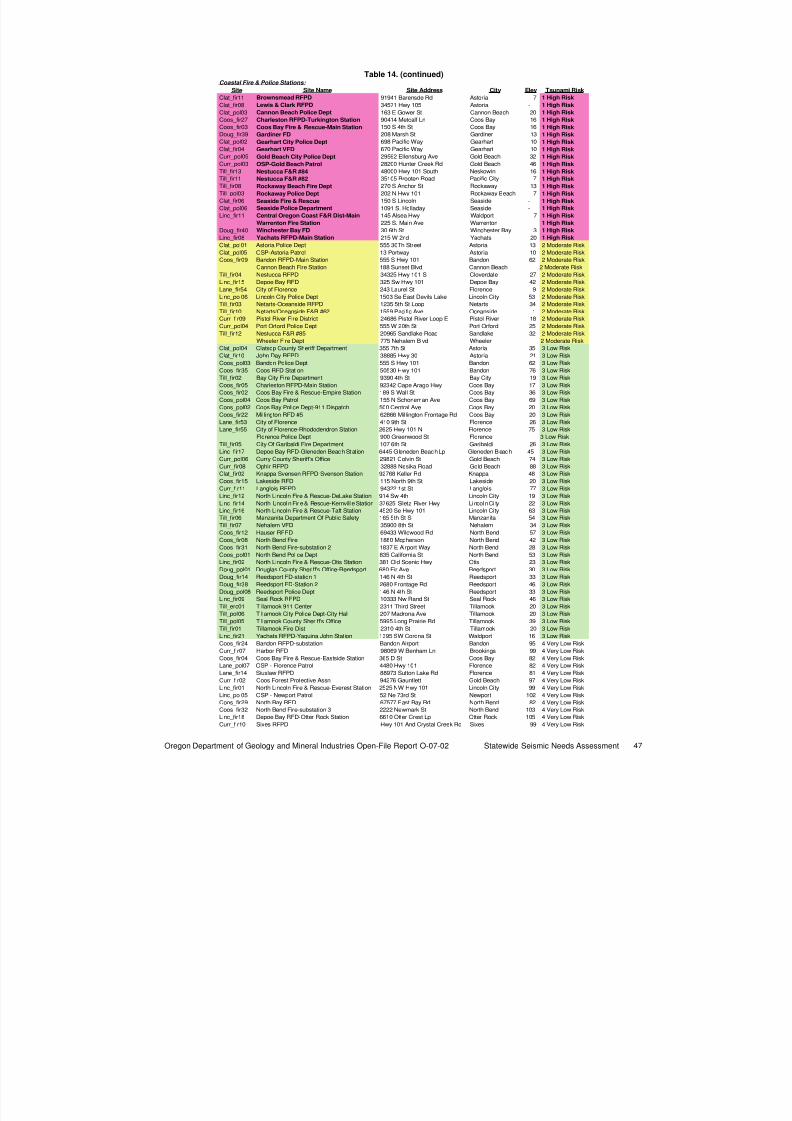
8/3/2019 Statewide Seismic Needs Assessment report
http://slidepdf.com/reader/full/statewide-seismic-needs-assessment-report 55/341
Oregon Department of Geology and Mineral Industries Open-File Report O-07-02 Statewide Seismic Needs Assessment 47
Table 14. (continued)
Coastal Fire & Police Stations:
Site Site Name Site Address City Elev Tsunami Risk
Clat_fir11 Brownsmead RFPD 91941 Barensde Rd Astoria 7 1 High Risk
Clat_fir08 Lewis & Clark RFPD 34571 Hwy 105 Astoria - 1 High Risk
Clat_pol03 Cannon Beach Police Dept 163 E Gower St Cannon Beach 20 1 High Risk
Coos_fir27 Charleston RFPD-Turkington Station 90414 Metcalf Ln Coos Bay 16 1 High Risk
Coos_fir03 Coos Bay Fire & Rescue-Main Station 150 S 4th St Coos Bay 16 1 High RiskDoug_fir39 Gardiner FD 208 Marsh St Gardiner 13 1 High Risk
Clat_pol02 Gearhart City Police Dept 698 Pacific Way Gearhart 10 1 High Risk
Clat_fir04 Gearhart VFD 670 Pacific Way Gearhart 10 1 High RiskCurr_pol05 Gold Beach City Police Dept 29592 Ellensburg Ave Gold Beach 32 1 High Risk
Curr_pol03 OSP-Gold Beach Patrol 28200 Hunter Creek Rd Gold Beach 46 1 High Risk
Till_fir13 Nestucca F&R #84 48000 Hwy 101 South Neskowin 16 1 High RiskTill_fir11 Nestucca F&R #82 35105 Brooten Road Pacific City 7 1 High Risk
Till_fir08 Rockaway Beach Fire Dept 270 S Anchor St Rockaway 13 1 High Risk
Till_pol03 Rockaway Police Dept 202 N Hwy 101 Rockaway Beach 7 1 High Risk
Clat_fir06 Seaside Fire & Rescue 150 S Lincoln Seaside - 1 High Risk
Clat_pol06 Seaside Police Department 1091 S. Holladay Seaside - 1 High Risk
Linc_fir11 Central Oregon Coast F&R Dist-Main 145 Alsea Hwy Waldport 7 1 High Risk
Warrenton Fire Station 225 S. Main Ave Warrenton 1 High Risk
Doug_fir40 Winchester Bay FD 30 6th St Winchester Bay 3 1 High Risk
Linc_fir08 Yachats RFPD-Main Station 215 W 2nd Yachats 20 1 High Risk
Clat_pol01 Astoria Police Dept 555 30Th Street Astoria 13 2 Moderate Risk
Clat_pol05 OSP-Astoria Patrol 13 Portway Astoria 10 2 Moderate Risk
Coos_fir09 Bandon RFPD-Main Station 555 S Hwy 101 Bandon 62 2 Moderate Risk
Cannon Beach Fire Station 188 Sunset Blvd Cannon Beach 2 Moderate Risk
Till_fir04 Nestucca RFPD 34325 Hwy 101 S Cloverdale 27 2 Moderate Risk
Linc_fir15 Depoe Bay RFD 325 Sw Hwy 101 Depoe Bay 42 2 Moderate Risk
Lane_fir54 City of Florence 243 Laurel St Florence 9 2 Moderate Risk
Linc_pol06 Lincoln City Police Dept 1503 Se East Devils Lake Lincoln City 53 2 Moderate Risk
Till_fir03 Netarts-Oceanside RFPD 1235 5th St Loop Netarts 34 2 Moderate RiskTill_fir10 Netarts/Oceanside F&R #62 1559 Pacific Ave Oceanside 1 2 Moderate Risk
Curr_fir09 Pistol River Fire District 24686 Pistol River Loop E Pistol River 18 2 Moderate Risk
Curr_pol04 Port Orford Police Dept 555 W 20th St Port Orford 25 2 Moderate Risk
Till_fir12 Nestucca F&R #85 20965 Sandlake Road Sandlake 32 2 Moderate Risk
Wheeler Fire Dept 775 Nehalem Blvd Wheeler 2 Moderate Risk
Clat_pol04 Clatsop County Sheriff Department 355 7th St Astoria 35 3 Low Risk
Clat_fir10 John Day RFPD 38885 Hwy 30 Astoria 21 3 Low Risk
Coos_pol03 Bandon Police Dept 555 S Hwy 101 Bandon 62 3 Low Risk
Coos_fir35 Coos RFD Station 50530 Hwy 101 Bandon 76 3 Low Risk
Till_fir02 Bay City Fire Department 9390 4th St Bay City 19 3 Low Risk
Coos_fir05 Charleston RFPD-Main Station 92342 Cape Arago Hwy Coos Bay 17 3 Low Risk
Coos_fir02 Coos Bay Fire & Rescue-Empire Station 189 S Wall St Coos Bay 36 3 Low Risk
Coos_pol04 Coos Bay Patrol 155 N Schoneman Ave Coos Bay 69 3 Low Risk
Coos_pol02 Coos Bay Police Dept-911 Dispatch 500 Central Ave Coos Bay 20 3 Low Risk
Coos_fir22 Millington RFD #5 62866 Millington Frontage Rd Coos Bay 20 3 Low Risk
Lane_fir53 City of Florence 410 9th St Florence 26 3 Low Risk
Lane_fir55 City of Florence-Rhododendron Station 2625 Hwy 101 N Florence 75 3 Low Risk
Florence Police Dept 900 Greenwood St Florence 3 Low Risk
Till_fir05 City Of Garibaldi Fire Department 107 6th St Garibaldi 26 3 Low Risk
Linc_f ir17 Depoe Bay RFD-Gleneden Beach Stat ion 6445 Gleneden Beach Lp Gleneden Beach 45 3 Low Risk
Curr_pol06 Curry County Sheriff's Office 29821 Colvin St Gold Beach 74 3 Low Risk
Curr_fir08 Ophir RFPD 32888 Nesika Road Gold Beach 88 3 Low Risk
Clat_fir02 Knappa Svensen RFPD-Svenson Station 92768 Keller Rd Knappa 48 3 Low Risk
Coos_fir15 Lakeside RFD 115 North 9th St Lakeside 20 3 Low Risk
Curr_fir11 Langlois RFPD 94322 1st St Langlois 77 3 Low Risk
Linc_fir12 North Lincoln Fire & Rescue-DeLake Station 914 Sw 4th Lincoln City 19 3 Low Risk
Linc_fir14 North Lincoln Fire & Rescue-Kernvill e Station 37625 Siletz River Hwy Lincoln Ci ty 22 3 Low Risk
Linc_fir16 North Lincoln Fire & Rescue-Taft Station 4520 Se Hwy 101 Lincoln City 63 3 Low Risk
Till_fir06 Manzanita Department Of Public Safety 165 5th St S Manzanita 54 3 Low Risk
Till_fir07 Nehalem VFD 35900 8th St Nehalem 34 3 Low Risk
Coos_fir12 Hauser RFPD 69433 Wildwood Rd North Bend 57 3 Low Risk
Coos_fir08 North Bend Fire 1880 Mcpherson North Bend 42 3 Low Risk
Coos_fir31 North Bend Fire-substation 2 1837 E Airport Way North Bend 28 3 Low Risk
Coos_pol01 North Bend Police Dept 835 California St North Bend 53 3 Low Risk
Linc_fir02 North Lincoln Fire & Rescue-Otis Station 381 Old Scenic Hwy Otis 23 3 Low Risk
Doug_pol01 Douglas County Sheriff's Office-Reedsport 680 Fir Ave Reedsport 30 3 Low Risk
Doug_fir14 Reedsport FD-station 1 146 N 4th St Reedsport 33 3 Low Risk
Doug_fir38 Reedsport FD-Station 2 2680 Frontage Rd Reedsport 46 3 Low Risk
Doug_pol08 Reedsport Police Dept 146 N 4th St Reedsport 33 3 Low Risk
Linc_fir09 Seal Rock RFPD 10333 Nw Rand St Seal Rock 46 3 Low Risk
Till_erc01 Tillamook 911 Center 2311 Third Street Tillamook 20 3 Low RiskTill_pol06 Tillamook City Police Dept-City Hall 207 Madrona Ave Tillamook 20 3 Low Risk
Till_pol05 Tillamook County Sheriff's Office 5995 Long Prairie Rd Tillamook 39 3 Low Risk
Till_fir01 Tillamook Fire Dist 2310 4th St Tillamook 20 3 Low Risk
Linc_fir21 Yachats RFPD-Yaquina John Station 1395 SW Corona St Waldport 16 3 Low Risk
Coos_fir24 Bandon RFPD-substation Bandon Airport Bandon 95 4 Very Low Risk
Curr_fir07 Harbor RFD 98069 W Benham Ln Brookings 99 4 Very Low Risk
Coos_fir04 Coos Bay Fire & Rescue-Eastside Station 365 D St Coos Bay 82 4 Very Low Risk
Lane_pol07 OSP - Florence Patrol 4480 Hwy 101 Florence 82 4 Very Low Risk
Lane_fir14 Siuslaw RFPD 88973 Sutton Lake Rd Florence 81 4 Very Low Risk
Curr_fir02 Coos Forest Protective Assn 94276 Gauntlett Gold Beach 97 4 Very Low Risk
Linc_fir01 North Lincoln Fire & Rescue-Everest Station 2525 NW Hwy 101 Lincoln City 99 4 Very Low Risk
Linc_pol05 OSP - Newport Patrol 52 Ne 73rd St Newport 102 4 Very Low Risk
Coos_fir29 North Bay RFD 67577 East Bay Rd North Bend 82 4 Very Low Risk
Coos_fir32 North Bend Fire-substation 3 2222 Newmark St North Bend 103 4 Very Low Risk
Linc_fir18 Depoe Bay RFD-Otter Rock Station 6610 Otter Crest Lp Otter Rock 105 4 Very Low Risk
Curr_fir10 Sixes RFPD Hwy 101 And Crystal Creek Rd Sixes 99 4 Very Low Risk
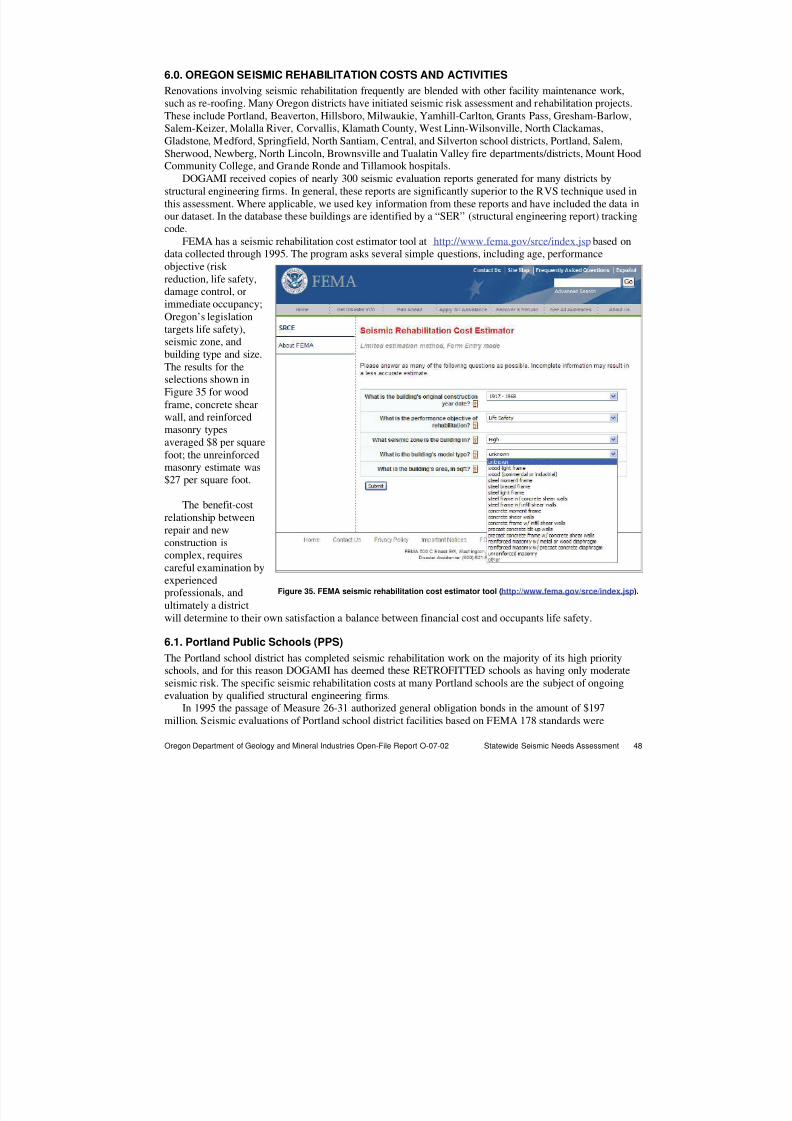
8/3/2019 Statewide Seismic Needs Assessment report
http://slidepdf.com/reader/full/statewide-seismic-needs-assessment-report 56/341
Oregon Department of Geology and Mineral Industries Open-File Report O-07-02 Statewide Seismic Needs Assessment 48
Figure 35. FEMA seismic rehabilitation cost estimator tool (http://www.fema.gov/srce/index.jsp).
6.0. OREGON SEISMIC REHABILITATION COSTS AND ACTIVITIES
Renovations involving seismic rehabilitation frequently are blended with other facility maintenance work,such as re-roofing. Many Oregon districts have initiated seismic risk assessment and rehabilitation projects.These include Portland, Beaverton, Hillsboro, Milwaukie, Yamhill-Carlton, Grants Pass, Gresham-Barlow,Salem-Keizer, Molalla River, Corvallis, Klamath County, West Linn-Wilsonville, North Clackamas,Gladstone, Medford, Springfield, North Santiam, Central, and Silverton school districts, Portland, Salem,
Sherwood, Newberg, North Lincoln, Brownsville and Tualatin Valley fire departments/districts, Mount HoodCommunity College, and Grande Ronde and Tillamook hospitals.
DOGAMI received copies of nearly 300 seismic evaluation reports generated for many districts bystructural engineering firms. In general, these reports are significantly superior to the RVS technique used inthis assessment. Where applicable, we used key information from these reports and have included the data inour dataset. In the database these buildings are identified by a “SER” (structural engineering report) trackingcode.
FEMA has a seismic rehabilitation cost estimator tool at http://www.fema.gov/srce/index.jspbased ondata collected through 1995. The program asks several simple questions, including age, performanceobjective (risk reduction, life safety,damage control, or
immediate occupancy;Oregon’s legislationtargets life safety),seismic zone, andbuilding type and size.The results for theselections shown inFigure 35 for woodframe, concrete shearwall, and reinforcedmasonry typesaveraged $8 per square
foot; the unreinforcedmasonry estimate was$27 per square foot.
The benefit-costrelationship betweenrepair and newconstruction iscomplex, requirescareful examination byexperiencedprofessionals, and
ultimately a districtwill determine to their own satisfaction a balance between financial cost and occupants life safety.
6.1. Portland Public Schools (PPS)
The Portland school district has completed seismic rehabilitation work on the majority of its high priorityschools, and for this reason DOGAMI has deemed these RETROFITTED schools as having only moderateseismic risk. The specific seismic rehabilitation costs at many Portland schools are the subject of ongoingevaluation by qualified structural engineering firms.
In 1995 the passage of Measure 26-31 authorized general obligation bonds in the amount of $197million. Seismic evaluations of Portland school district facilities based on FEMA 178 standards were
8/3/2019 Statewide Seismic Needs Assessment report
http://slidepdf.com/reader/full/statewide-seismic-needs-assessment-report 57/341
Oregon Department of Geology and Mineral Industries Open-File Report O-07-02 Statewide Seismic Needs Assessment 49
conducted by five structural engineering firms. Their work was based on design considerations to preventcollapse and allow occupants to safely exit during or after a seismic event. Subsequently, the district hired astructural engineering firm to normalize these evaluations and assign a relative hazard rating to eachbuilding. The findings of these studies were used to develop a prioritized program of seismic upgrades,which were designed to enhance the ability of occupants to safely exit a building damaged by a seismicevent. By summer 2003, seismic upgrades were reported as completed at 53 facilities, upgrading over half of the district’s schools, including those with the highest seismic hazard rating. Through 2001 PPS had
expended in excess of $20 million on these seismic upgrades.In 2002 PPS hired a consultant to review the seismic work recommended and completed, and to
recommend what further upgrades were necessary. In a news article dated January 16, 2007, PPS is quoted asindicating that 15 of the district’s 87 schools have a seismic ranking of 5, on a one to five scale (five havingthe highest priority), derived in 2005 by the same structural engineering firm that conducted the 2002appraisal. This work illustrates how costs can increase over time. For example, in 2002 the firm estimated thecost of rehabilitating Fernwood Middle School at $1.1 million. The article reports that by 2005 this work wasestimated at $1.5 million. PPS is quoted as debating the cost of fixing the facility versus an outrightreplacement.
6.2. Portland Fire Department
In 1998 Portland voters authorized the sale of $53.8 million in bonds for a $61.1 million program to improve
emergency facilities to be able to function after a seismic event. The program also considers accessibilityrequirements, energy conservation measures, and community needs. Twenty fire stations were to beupgraded to seismic code and 11 new stations were to be constructed over a ten year period. By August 200618 stations had been renovated and 4 new stations had completed construction.
6.3. Salem Fire Department
In 2006 Salem voters approved a $25 million bond to replace equipment ($9.3 million), build two newstations (10 and 11, $6.8 million), replace two existing fire stations (5 and 7, $6.6 million), and performseismic reinforcing at other stations (1, 2, 3, 4, 6 and 9, $1.3 million). Station 7 is vulnerable to collapse andwould require such extensive retrofitting to make it seismically sound that it was more cost effective torebuild.

8/3/2019 Statewide Seismic Needs Assessment report
http://slidepdf.com/reader/full/statewide-seismic-needs-assessment-report 58/341
Oregon Department of Geology and Mineral Industries Open-File Report O-07-02 Statewide Seismic Needs Assessment 50
6.4. Hillsboro School District
Data provided by Hillsboro demonstrates how estimated rehabilitation costs can vary significantly for bothstructural and non-structural seismic risk mitigation, within and across building structural types (Table 15).
Table 15. Estimated Seismic Rehabilitation Costs for Hillsboro School District Schools
Hillsboro School District SER Seismic Structural Seismic Non-struct Sum
General_Name Yr Built Type SqFt Stories SE Date Structural per sq ft Non-structural per sq ft per sq ftReedville Elementary 1922 W2 16,247 1 Miller Sep-01 $ 246,366 $ 15 $ 41,334 $ 2.54 18$
David Hill Elementary 1948 W2 33,904 1 Miller Jul-01 $ 580,626 $ 17 $ 122,844 $ 3.62 21$
W est Union Elementary 1948 W 2 42,757 1 Miller Sep-01 $ 560,876 $ 13 $ 94,506 $ 2. 21 15$
Groner Elementary 1948 W2 28,985 1 Miller Sep-01 $ 805,527 $ 28 $ 25,596 $ 0.88 29$
W L Henry Elementary 1967 W2 48,813 1 Miller Sep-01 $ 24,660 $ 1 $ 217,800 $ 4.46 5$
W Verne Mckinney Elementary 1970 W2 53,129 1 Mil ler Sep-01 $ 414,181 $ 8 $ 152,423 $ 2.87 11$
Eastwood Elementary 1977 W2 45,963 1 Miller Sep-01 $ 57,360 $ 1 $ 2 81,100 $ 6.12 7$
But ternut Creek E lementary 1977 W2 42,638 1 Miller Sep-01 $ 24,090 $ 1 $ 87,306 $ 2.05 3$
Lenox Elementary 1978 W2 51,074 1 Miller Sep-01 $ 153,504 $ 3 $ 142,040 $ 2.78 6$
Minter Bridge E lementary 1979 W2 47,563 1 Miller Sep-01 $ 57,360 $ 1 $ 281,100 $ 5.91 7$
Indian Hills Elementary 1979 W2 45,181 1 Miller Sep-01 $ 43,410 $ 1 $ 87,306 $ 1.93 3$Jackson Elementary 1989 W2 48,367 1 Miller Sep-01 $ 57,360 $ 1 $ 158,678 $ 3.28 4$
ave W2: $ 6 $ 3
Peter Boscow E lementary 1922 C2 60,750 1 Miller Sep-01 $ 934,677 $ 15 $ 126,270 $ 2.08 17$
J B Thomas Middle 1928 C2 215,000 3 Miller Sep-01 $5,142,543 $ 24 $ 389,595 $ 1.81 26$
W itch Hazel Elementary 1946 C2 18,440 1 Miller Sep-01 $ 214,809 $ 12 $ 41,787 $ 2. 27 14$Farmington View Elementary 1949 C2 20,467 1 Miller Sep-01 $ 427,425 $ 21 $ 73,995 $ 3.62 24$
Brookwood Elementary 1953 C2 40,641 1 Miller Sep-01 $1,528,475 $ 38 $ -
North Plains Elementary 1954 C2 46,913 1 Miller Sep-01 $ 421,244 $ 9 $ 14,010 $ 0. 30 9$
J W Poynter Middle 1959 C2 102,691 1 Miller Sep-01 $2,529,011 $ 25 $ 217,578 $ 2.12 27$Ladd Acres Elementary 1967 C2 60,825 1 Miller Sep-01 $ 71,385 $ 1 $ 171,105 $ 2.81 4$
ave C2: 20$ $ 2
Structural seismic rehabilitation cost estimates ranged from $1 to $28 per square foot for wood frameschools and from $1 to $38 per square foot for concrete shear frame-type schools. Non-structural seismicmitigation cost estimates averaged $2 to $3.50 per square foot.
6.5. Tualatin Valley Fire District
In 2006 western and southern Portland metro-area voters approved measure 34-133, a $77.5 million bondmeasure to correct seismic safety deficiencies at eight stations (#64, 65, 66, 69, 51, 35, 34, and 52), rebuildfive stations (68, 53, 56, 59 and 58), build two new stations, and other items.
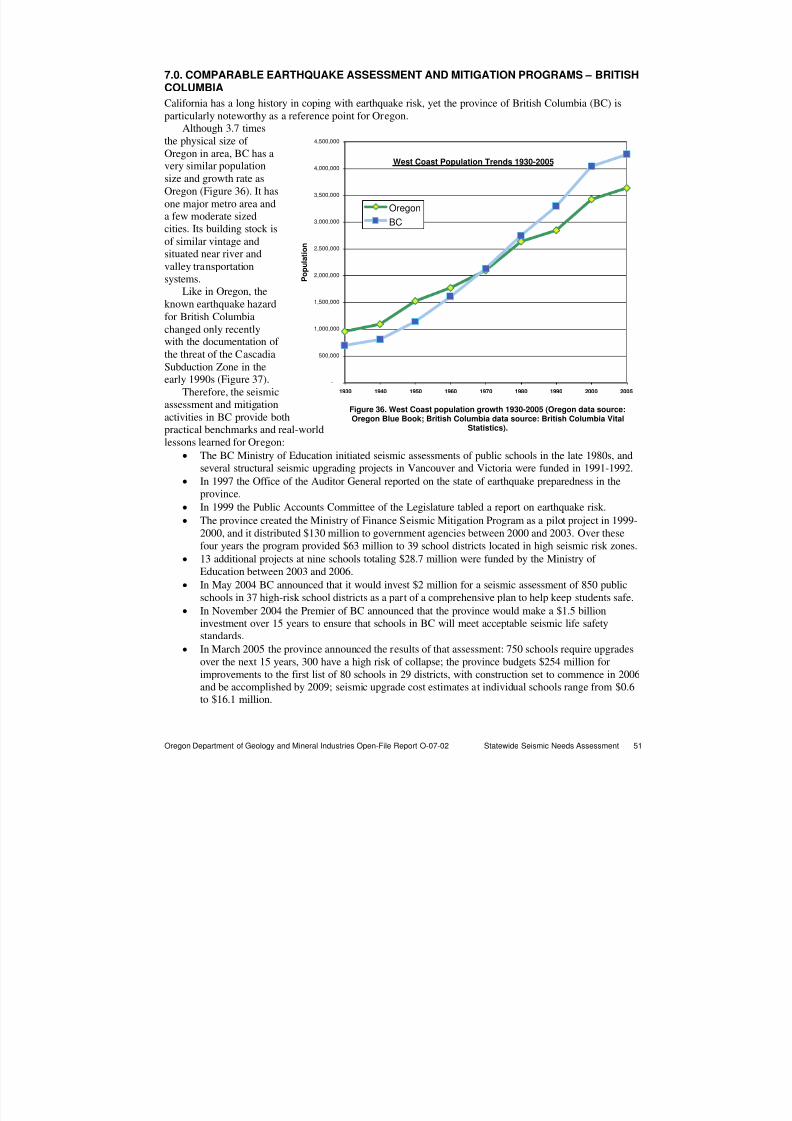
8/3/2019 Statewide Seismic Needs Assessment report
http://slidepdf.com/reader/full/statewide-seismic-needs-assessment-report 59/341
Oregon Department of Geology and Mineral Industries Open-File Report O-07-02 Statewide Seismic Needs Assessment 51
Figure 36. West Coast population growth 1930-2005 (Oregon data source:Oregon Blue Book; British Columbia data source: British Columbia Vital
Statistics).
7.0. COMPARABLE EARTHQUAKE ASSESSMENT AND MITIGATION PROGRAMS – BRITISHCOLUMBIA
California has a long history in coping with earthquake risk, yet the province of British Columbia (BC) isparticularly noteworthy as a reference point for Oregon.
Although 3.7 timesthe physical size of
Oregon in area, BC has avery similar populationsize and growth rate asOregon (Figure 36). It hasone major metro area anda few moderate sizedcities. Its building stock isof similar vintage andsituated near river andvalley transportationsystems.
Like in Oregon, the
known earthquake hazardfor British Columbiachanged only recentlywith the documentation of the threat of the CascadiaSubduction Zone in theearly 1990s (Figure 37).
Therefore, the seismicassessment and mitigationactivities in BC provide bothpractical benchmarks and real-worldlessons learned for Oregon:
• The BC Ministry of Education initiated seismic assessments of public schools in the late 1980s, andseveral structural seismic upgrading projects in Vancouver and Victoria were funded in 1991-1992.
• In 1997 the Office of the Auditor General reported on the state of earthquake preparedness in theprovince.
• In 1999 the Public Accounts Committee of the Legislature tabled a report on earthquake risk.
• The province created the Ministry of Finance Seismic Mitigation Program as a pilot project in 1999-2000, and it distributed $130 million to government agencies between 2000 and 2003. Over thesefour years the program provided $63 million to 39 school districts located in high seismic risk zones.
• 13 additional projects at nine schools totaling $28.7 million were funded by the Ministry of Education between 2003 and 2006.
• In May 2004 BC announced that it would invest $2 million for a seismic assessment of 850 publicschools in 37 high-risk school districts as a part of a comprehensive plan to help keep students safe.
• In November 2004 the Premier of BC announced that the province would make a $1.5 billioninvestment over 15 years to ensure that schools in BC will meet acceptable seismic life safetystandards.
• In March 2005 the province announced the results of that assessment: 750 schools require upgradesover the next 15 years, 300 have a high risk of collapse; the province budgets $254 million forimprovements to the first list of 80 schools in 29 districts, with construction set to commence in 2006and be accomplished by 2009; seismic upgrade cost estimates at individual schools range from $0.6to $16.1 million.
West Coast Population Trends 1930-2005
-
500,000
1,000,000
1,500,000
2,000,000
2,500,000
3,000,000
3,500,000
4,000,000
4,500,000
1930 1940 1950 1960 1970 1980 1990 2000 2005
P o p u l a t i o n
Oregon
BC
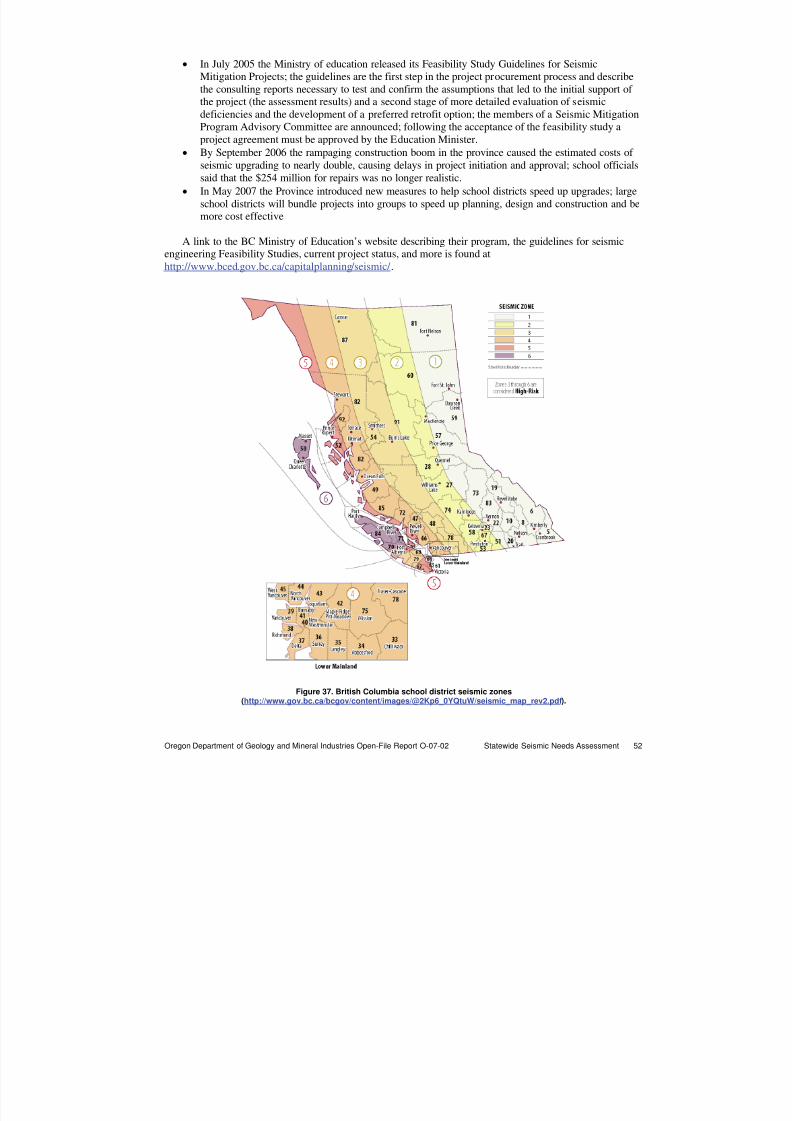
8/3/2019 Statewide Seismic Needs Assessment report
http://slidepdf.com/reader/full/statewide-seismic-needs-assessment-report 60/341
Oregon Department of Geology and Mineral Industries Open-File Report O-07-02 Statewide Seismic Needs Assessment 52
• In July 2005 the Ministry of education released its Feasibility Study Guidelines for SeismicMitigation Projects; the guidelines are the first step in the project procurement process and describethe consulting reports necessary to test and confirm the assumptions that led to the initial support of the project (the assessment results) and a second stage of more detailed evaluation of seismicdeficiencies and the development of a preferred retrofit option; the members of a Seismic MitigationProgram Advisory Committee are announced; following the acceptance of the feasibility study aproject agreement must be approved by the Education Minister.
• By September 2006 the rampaging construction boom in the province caused the estimated costs of seismic upgrading to nearly double, causing delays in project initiation and approval; school officialssaid that the $254 million for repairs was no longer realistic.
• In May 2007 the Province introduced new measures to help school districts speed up upgrades; largeschool districts will bundle projects into groups to speed up planning, design and construction and bemore cost effective
A link to the BC Ministry of Education’s website describing their program, the guidelines for seismicengineering Feasibility Studies, current project status, and more is found athttp://www.bced.gov.bc.ca/capitalplanning/seismic/ .
Figure 37. British Columbia school district seismic zones(http://www.gov.bc.ca/bcgov/content/images/@2Kp6_0YQtuW/seismic_map_rev2.pdf).
8/3/2019 Statewide Seismic Needs Assessment report
http://slidepdf.com/reader/full/statewide-seismic-needs-assessment-report 61/341
Oregon Department of Geology and Mineral Industries Open-File Report O-07-02 Statewide Seismic Needs Assessment 53
8.0. RECOMMENDATIONS TO THE SEISMIC REHABILITATION GRANT COMMITTEE
Recommendations to the Seismic Rehabilitation Grant Committee
The scoring data and needs analysis from this report should be the starting point for developing the grantprogram. Very High Risk and High Risk facilities should be prioritized for consideration for rehabilitation.Acute care hospitals within community health service districts should be considered eligible for the grants.
Community-based acute care hospitals should also be considered eligible for the grant program. Theimportance of individual buildings to the community needs, as outlined as part of the ranking process inSenate Bill 2 (2005), needs further clarification.
Recommendations for Districts
DOGAMI recommends districts with buildings labeled as having High and Very High relative seismic risk of collapse during a seismic event to consider hiring a structural engineering consultant to more thoroughlyevaluate the seismic issues with their buildings. Please note that this FEMA 154 rapid visual screeningtechnique can both overestimate and underestimate relative seismic risk.
Recommendations for Fiscal Decision Makers
DOGAMI recommends that voters, community representatives, government administrators, and electedofficials carefully consider both the costs and benefits associated with seismic risk mitigation, rehabilitation,and community asset replacement. Many districts in Oregon have traveled down this path already and willhave valuable hard-won experience to share. Oregon has relatively high seismic risk, yet the time intervalbetween major subduction zone earthquake events is large, in human terms. The USGS predicts a 15%chance of a Cascadia Subduction Zone earthquake in the next 50 years. For reference, they also predict a62% chance of a major event in the San Francisco bay region in the next 25 years. This suggests thatOregonians have a manageable amount of time available to mitigate this risk over the next few decades. Thepublic school seismic rehabilitation program in British Columbia may provide valuable lessons.
Report submitted June 29, 2007.
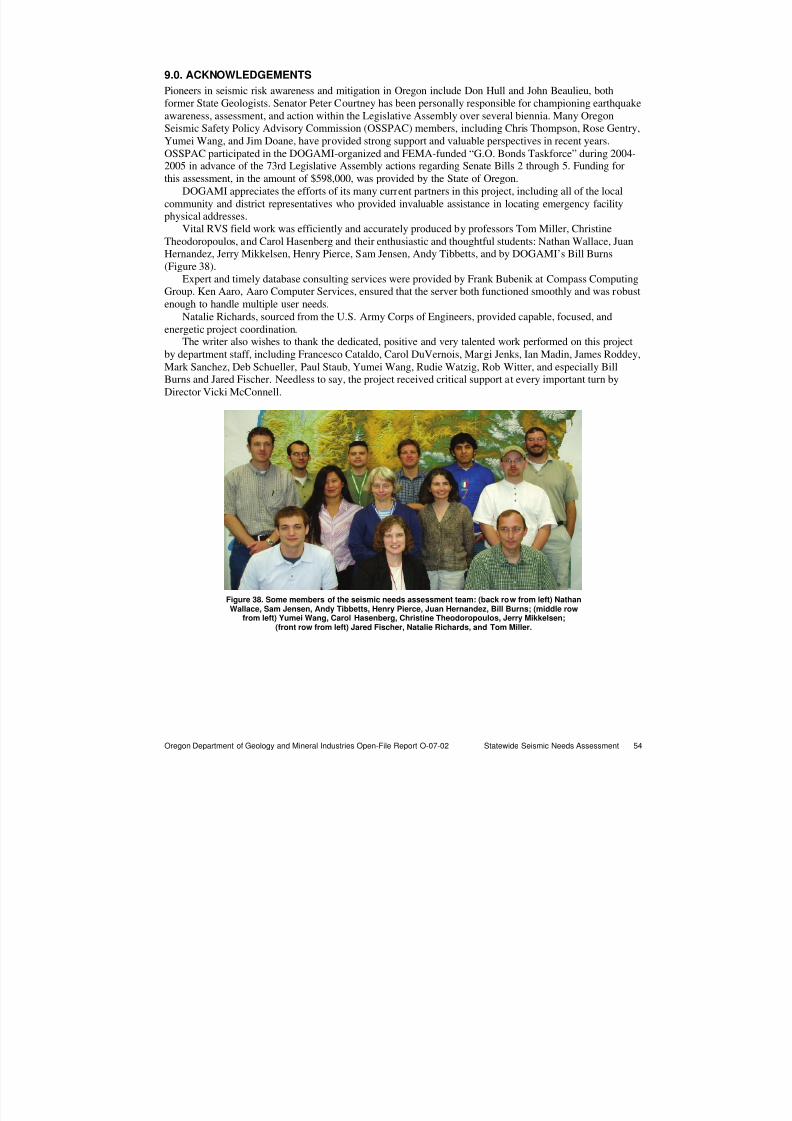
8/3/2019 Statewide Seismic Needs Assessment report
http://slidepdf.com/reader/full/statewide-seismic-needs-assessment-report 62/341
Oregon Department of Geology and Mineral Industries Open-File Report O-07-02 Statewide Seismic Needs Assessment 54
9.0. ACKNOWLEDGEMENTS
Pioneers in seismic risk awareness and mitigation in Oregon include Don Hull and John Beaulieu, bothformer State Geologists. Senator Peter Courtney has been personally responsible for championing earthquakeawareness, assessment, and action within the Legislative Assembly over several biennia. Many OregonSeismic Safety Policy Advisory Commission (OSSPAC) members, including Chris Thompson, Rose Gentry,Yumei Wang, and Jim Doane, have provided strong support and valuable perspectives in recent years.
OSSPAC participated in the DOGAMI-organized and FEMA-funded “G.O. Bonds Taskforce” during 2004-2005 in advance of the 73rd Legislative Assembly actions regarding Senate Bills 2 through 5. Funding forthis assessment, in the amount of $598,000, was provided by the State of Oregon.
DOGAMI appreciates the efforts of its many current partners in this project, including all of the localcommunity and district representatives who provided invaluable assistance in locating emergency facilityphysical addresses.
Vital RVS field work was efficiently and accurately produced by professors Tom Miller, ChristineTheodoropoulos, and Carol Hasenberg and their enthusiastic and thoughtful students: Nathan Wallace, JuanHernandez, Jerry Mikkelsen, Henry Pierce, Sam Jensen, Andy Tibbetts, and by DOGAMI’s Bill Burns(Figure 38).
Expert and timely database consulting services were provided by Frank Bubenik at Compass ComputingGroup. Ken Aaro, Aaro Computer Services, ensured that the server both functioned smoothly and was robust
enough to handle multiple user needs.Natalie Richards, sourced from the U.S. Army Corps of Engineers, provided capable, focused, and
energetic project coordination.The writer also wishes to thank the dedicated, positive and very talented work performed on this project
by department staff, including Francesco Cataldo, Carol DuVernois, Margi Jenks, Ian Madin, James Roddey,Mark Sanchez, Deb Schueller, Paul Staub, Yumei Wang, Rudie Watzig, Rob Witter, and especially BillBurns and Jared Fischer. Needless to say, the project received critical support at every important turn byDirector Vicki McConnell.
Figure 38. Some members of the seismic needs assessment team: (back row from left) Nathan
Wallace, Sam Jensen, Andy Tibbetts, Henry Pierce, Juan Hernandez, Bill Burns; (middle rowfrom left) Yumei Wang, Carol Hasenberg, Christine Theodoropoulos, Jerry Mikkelsen;
(front row from left) Jared Fischer, Natalie Richards, and Tom Miller.
8/3/2019 Statewide Seismic Needs Assessment report
http://slidepdf.com/reader/full/statewide-seismic-needs-assessment-report 63/341
Oregon Department of Geology and Mineral Industries Open-File Report O-07-02 Statewide Seismic Needs Assessment 55
10.0. REFERENCES
ASCE, 1998, Handbook for the Seismic Evaluation of Buildings — A Pre-standard , prepared by theAmerican Society of Civil Engineers for the Federal Emergency Management Agency, FEMA 310 Report,Washington D.C.Available online: http://www.degenkolb.com/0_0_Misc/0_1_FEMADocuments/fema310/prestnd.html
Federal Emergency Management Agency, 1998, FEMA 154 report, Rapid Visual Screening of Buildings for Potential Seismic Hazards: A Handbook , 2nd ed., Earthquake Hazards Reduction Series 41. Availableonline: http://www.fema.gov/plan/prevent/earthquake/pdf/fema-154.pdf
McClure, F. E., 2006, Modern earthquake codes: History and development, Computers and Structures, Inc.,http://www.csiberkeley.com/Tech_Info/McClure_book_smll.pdf
Oregon Department of Revenue, Oregon property tax statistics, fiscal year 2005-06,http://www.oregon.gov/DOR/STATS/statistics.shtml#property
Office for Oregon Health Policy and Research, 2007, Oregon’s acute care hospitals: Capacity, utilization andfinancial trends, 2003 to 2005, http://www.oregon.gov/DAS/OHPR/
Visit the FEMA Earthquake Publications for Building Professionals and Engineers website(http://www.fema.gov/plan/prevent/earthquake/professionals.shtm#2) for brief descriptions of FEMAhandbooks and links to FEMA publications online.
11.0. ACRONYMS AND ABBREVIATIONS
CC community collegeDNQ did not qualifyDOGAMI Oregon Department of Geology and Mineral Industries
ESD education service districtFEMA Federal Emergency Management AdministrationGIS geographic information systemG.O. Bond General Obligation BondGPS global positioning systemLFRS lateral force resisting systemNEHRP National Earthquake Hazards Reduction ProgramODE Oregon Department of RevenueODWR Oregon Department of Water ResourcesOHSU Oregon Health Sciences UniversityORS Oregon Revised StatutesOSP Oregon State Police
OSSPAC Oregon Seismic Safety Policy Advisory CommissionOUS Oregon University SystemRFPD rural fire protection districtRVS rapid visual screeningSAIPE U.S. Census Small Area Income and Poverty EstimatesSER structural engineering reportUBC Uniform Building CodeUSGS U.S. Geological Survey

8/3/2019 Statewide Seismic Needs Assessment report
http://slidepdf.com/reader/full/statewide-seismic-needs-assessment-report 64/341
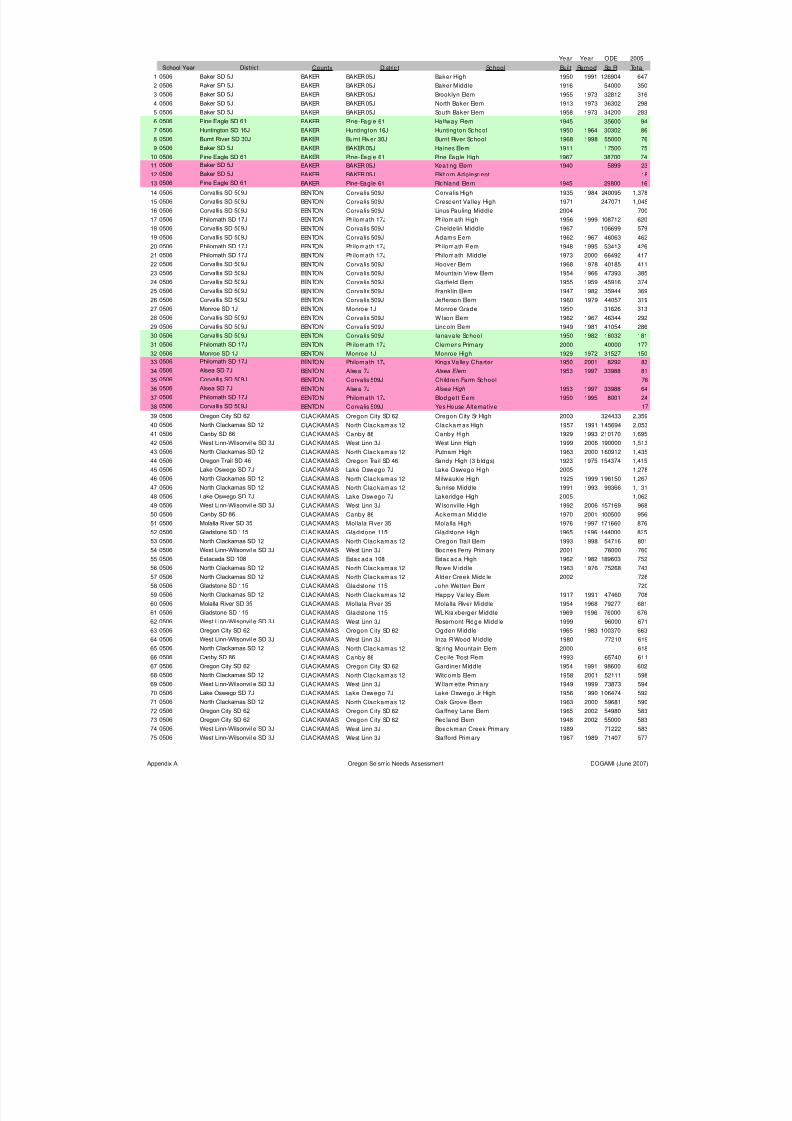
8/3/2019 Statewide Seismic Needs Assessment report
http://slidepdf.com/reader/full/statewide-seismic-needs-assessment-report 65/341
Year Year ODE 2005
School Year District County Distric t School Built Remod Sq Ft Total
1 0506 Baker SD 5J BAKER BAKER 05J Baker High 1950 1991 126904 647
2 0506 Baker SD 5J BAKER BAKER 05J Baker Middle 1916 54000 350
3 0506 Baker SD 5J BAKER BAKER 05J Brooklyn Elem 1955 1973 32812 316
4 0506 Baker SD 5J BAKER BAKER 05J North Baker Elem 1913 1973 36302 298
5 0506 Baker SD 5J BAKER BAKER 05J South Baker Elem 1958 1973 34200 283
6 0506 Pine Eagle SD 61 BAKER Pine-Eagle 61 Halfway Elem 1945 35600 94
7 0506 Huntington SD 16J BAKER Huntington 16J Huntington Sc hool 1950 1964 30302 86
8 0506 Burnt River SD 30J BAKER Burnt River 30J Burnt River School 1968 1998 55000 76
9 0506 Baker SD 5JBAKER BAKER 05J Haines Elem 1911 17500 75
10 0506 Pine Eagle SD 61 BAKER Pine-Eagle 61 Pine Eagle High 1967 38700 74
11 0506 Baker SD 5J BAKER BAKER 05J Keating Elem 1940 5899 23
12 0506 Baker SD 5J BAKER BAKER 05J Elkhorn Adolesc ent 18
13 0506 Pine Eagle SD 61 BAKER Pine-Eagle 61 Richland Elem 1945 29800 16
14 0506 Corvallis SD 509J BENTON Corva lis 509J Corvalis High 1935 1984 240095 1,378
15 0506 Corvallis SD 509J BENTON Corva lis 509J Crescent Va lley High 1971 247071 1,045
16 0506 Corvallis SD 509J BENTON Corva lis 509J Linus Pauling Middle 2004 700
17 0506 Philomath SD 17J BENTON Philomath 17J Philomath High 1956 1999 108712 620
18 0506 Corvallis SD 509J BENTON Corva lis 509J Cheldelin Midd le 1967 106699 579
19 0506 Corvallis SD 509J BENTON Corva lis 509J Adams Elem 1962 1967 46063 462
20 0506 Philomath SD 17J BENTON Philomath 17J Philomath Elem 1948 1995 53413 426
21 0506 Philomath SD 17J BENTON Philomath 17J Philomath Middle 1973 2000 66492 417
22 0506 Corvallis SD 509J BENTON Corva lis 509J Hoover Elem 1968 1978 40185 411
23 0506 Corvallis SD 509J BENTON Corva lis 509J Mountain View Elem 1954 1966 47393 385
24 0506 Corvallis SD 509J BENTON Corva lis 509J Garfield Elem 1955 1959 45916 374
25 0506 Corvallis SD 509J BENTON Corva lis 509J Franklin Elem 1947 1982 35944 369
26 0506 Corvallis SD 509J BENTON Corva lis 509J Jefferson Elem 1960 1979 44057 319 27 0506 Monroe SD 1J BENTON Monroe 1J Monroe Grade 1950 31626 313
28 0506 Corvallis SD 509J BENTON Corva lis 509J Wilson Elem 1962 1967 46344 292
29 0506 Corvallis SD 509J BENTON Corva lis 509J Lincoln Elem 1949 1981 41054 286
30 0506 Corvallis SD 509J BENTON Corva lis 509J Ianavale School 1950 1982 16032 181
31 0506 Philomath SD 17J BENTON Philomath 17J Clemens Primary 2000 40000 177
32 0506 Monroe SD 1J BENTON Monroe 1J Monroe High 1929 1972 31527 150
33 0506 Philomath SD 17J BENTON Philomath 17J Kings Va lley Charter 1950 2001 8292 83
34 0506 Alsea SD 7J BENTON Alsea 7J Alsea Elem 1953 1997 33988 81
35 0506 Corvallis SD 509J BENTON Corva lis 509J Child ren Farm Sc hool 76
36 0506 Alsea SD 7J BENTON Alsea 7J Alsea High 1953 1997 33988 64
37 0506 Philomath SD 17J BENTON Philomath 17J Blodgett Elem 1950 1995 8001 24
38 0506 Corvallis SD 509J BENTON Corva lis 509J Yes House Alternative 17
39 0506 Oregon City SD 62 CLACKAMAS Oregon City SD 62 Oregon City Sr High 2003 324433 2,359
40 0506 North Clackamas SD 12 CLACKAMAS North Clac kamas 12 Clackamas High 1957 1991 145694 2,053
41 0506 Canby SD 86 CLACKAMAS Canby 86 Canby High 1929 1993 210170 1,695
42 0506 West Linn-Wilsonville SD 3J CLACKAMAS West Linn 3J West Linn High 1999 2006 190000 1,513
43 0506 North Clackamas SD 12 CLACKAMAS North Clac kamas 12 Putnam High 1963 2000 160912 1,435 44 0506 Oregon Trail SD 46 CLACKAMAS Oregon Tra il SD 46 Sandy High (3 bldgs) 1923 1975 154374 1,415
45 0506 Lake Oswego SD 7J CLACKAMAS Lake Oswego 7J Lake Oswego High 2005 1,278
46 0506 North Clackamas SD 12 CLACKAMAS North Clac kamas 12 Milwaukie High 1925 1999 196150 1,267
47 0506 North Clackamas SD 12 CLACKAMAS North Clac kamas 12 Sunrise Middle 1991 1993 99366 1,131
48 0506 Lake Oswego SD 7J CLACKAMAS Lake Oswego 7J Lakeridge High 2005 1,062
49 0506 West Linn-Wilsonville SD 3J CLACKAMAS West Linn 3J Wilsonville High 1992 2006 157169 968
50 0506 Canby SD 86 CLACKAMAS Canby 86 Ackerman Middle 1970 2001 100500 956
51 0506 Molalla River SD 35 CLACKAMAS Mollala River 35 Molalla High 1976 1997 171660 876
52 0506 Gladstone SD 115 CLACKAMAS Gladstone 115 Gladstone High 1965 1996 144000 835
53 0506 North Clackamas SD 12 CLACKAMAS North Clac kamas 12 Oregon Trail Elem 1993 1998 54716 801
54 0506 West Linn-Wilsonville SD 3J CLACKAMAS West Linn 3J Boones Ferry Primary 2001 76000 760
55 0506 Estacada SD 108 CLACKAMAS Estacada 108 Estacada High 1962 1982 189603 752
56 0506 North Clackamas SD 12 CLACKAMAS North Clac kamas 12 Rowe Middle 1963 1976 75268 743
57 0506 North Clackamas SD 12 CLACKAMAS North Clac kamas 12 Alder Creek Midd le 2002 726
58 0506 Gladstone SD 115 CLACKAMAS Gladstone 115 John Wetten Elem 720
59 0506 North Clackamas SD 12 CLACKAMAS North Clac kamas 12 Happy Valley Elem 1917 1991 47460 708
60 0506 Molalla River SD 35 CLACKAMAS Mollala River 35 Molalla River Midd le 1954 1968 79277 681 61 0506 Gladstone SD 115 CLACKAMAS Gladstone 115 WL Kraxberger Middle 1969 1996 76000 676
62 0506 West Linn-Wilsonville SD 3J CLACKAMAS West Linn 3J Rosemont Ridge Middle 1999 96000 671
63 0506 Oregon City SD 62 CLACKAMAS Oregon City SD 62 Ogden Middle 1965 1983 100370 663
64 0506 West Linn-Wilsonville SD 3J CLACKAMAS West Linn 3J Inza R Wood Middle 1980 77210 619
65 0506 North Clackamas SD 12 CLACKAMAS North Clac kamas 12 Spring Mountain Elem 2000 618
66 0506 Canby SD 86 CLACKAMAS Canby 86 Cec ile Trost Elem 1993 65740 611
67 0506 Oregon City SD 62 CLACKAMAS Oregon City SD 62 Gardiner Midd le 1954 1991 98600 602
68 0506 North Clackamas SD 12 CLACKAMAS North Clac kamas 12 Witcomb Elem 1958 2001 52111 598
69 0506 West Linn-Wilsonville SD 3J CLACKAMAS West Linn 3J Willamette Primary 1949 1999 73873 594
70 0506 Lake Oswego SD 7J CLACKAMAS Lake Oswego 7J Lake Oswego Jr High 1956 1990 106474 592
71 0506 North Clackamas SD 12 CLACKAMAS North Clac kamas 12 Oak Grove Elem 1963 2000 59681 590
72 0506 Oregon City SD 62 CLACKAMAS Oregon City SD 62 Gaffney Lane Elem 1965 2002 54980 583
73 0506 Oregon City SD 62 CLACKAMAS Oregon City SD 62 Redland Elem 1948 2002 55000 583
74 0506 West Linn-Wilsonville SD 3J CLACKAMAS West Linn 3J Boec kman Creek Primary 1989 71222 583
75 0506 West Linn-Wilsonville SD 3J CLACKAMAS West Linn 3J Sta fford Primary 1967 1989 71407 577
Appendix A Oregon Seismic Needs Assessment DOGAMI (June 2007)
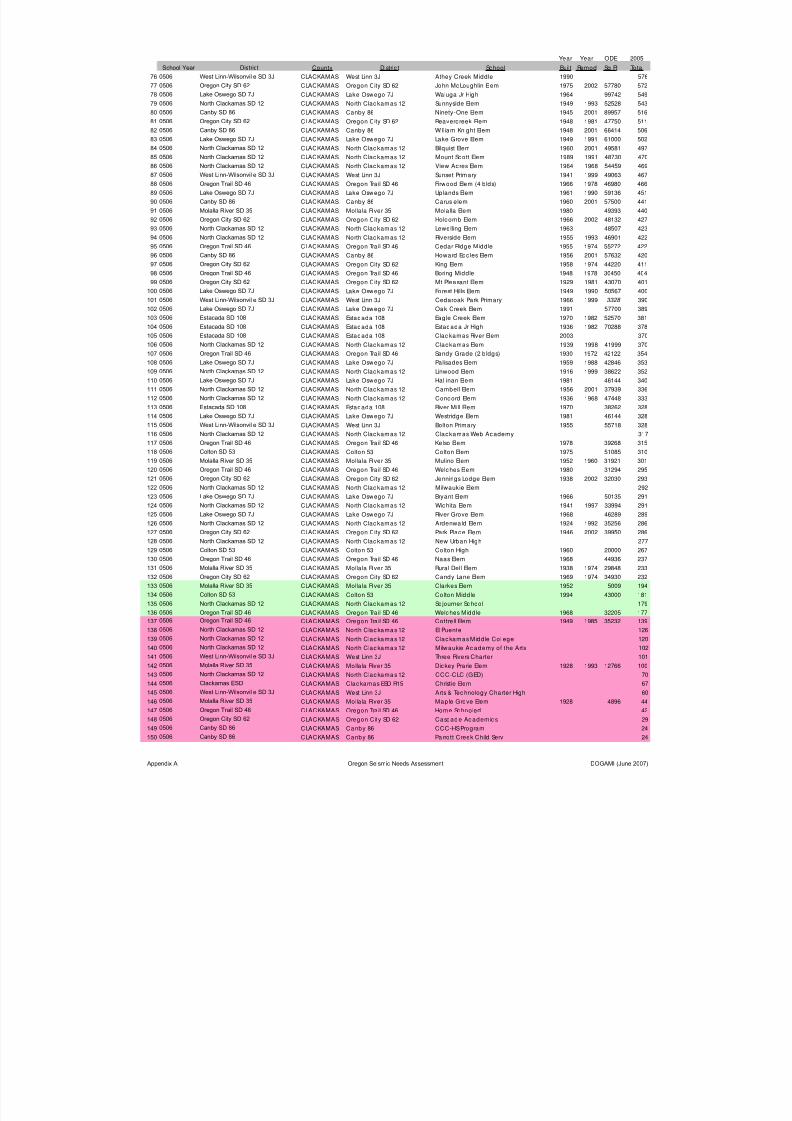
8/3/2019 Statewide Seismic Needs Assessment report
http://slidepdf.com/reader/full/statewide-seismic-needs-assessment-report 66/341
Year Year ODE 2005
School Year District County Distric t School Built Remod Sq Ft Total
76 0506 West Linn-Wilsonville SD 3J CLACKAMAS West Linn 3J Athey Creek Middle 1990 576
77 0506 Oregon City SD 62 CLACKAMAS Oregon City SD 62 John McLoughlin Elem 1975 2002 57780 572
78 0506 Lake Oswego SD 7J CLACKAMAS Lake Oswego 7J Waluga Jr High 1964 99742 549
79 0506 North Clackamas SD 12 CLACKAMAS North Clac kamas 12 Sunnyside Elem 1949 1993 52528 543
80 0506 Canby SD 86 CLACKAMAS Canby 86 Ninety-One Elem 1945 2001 89957 516
81 0506 Oregon City SD 62 CLACKAMAS Oregon City SD 62 Beaverc reek Elem 1948 1981 47750 511
82 0506 Canby SD 86 CLACKAMAS Canby 86 William Knight Elem 1948 2001 66414 506
83 0506 Lake Oswego SD 7J CLACKAMAS Lake Oswego 7J Lake Grove Elem 1949 1991 61000 502
84 0506 North Clackamas SD 12CLACKAMAS North Clac kamas 12 Bilquist Elem 1960 2001 49581 497
85 0506 North Clackamas SD 12 CLACKAMAS North Clac kamas 12 Mount Scott Elem 1989 1991 48730 470
86 0506 North Clackamas SD 12 CLACKAMAS North Clac kamas 12 View Acres Elem 1964 1968 54459 469
87 0506 West Linn-Wilsonville SD 3J CLACKAMAS West Linn 3J Sunset Primary 1941 1999 49063 467
88 0506 Oregon Trail SD 46 CLACKAMAS Oregon Tra il SD 46 Firwood Elem (4 blds) 1966 1978 46980 466
89 0506 Lake Oswego SD 7J CLACKAMAS Lake Oswego 7J Uplands Elem 1961 1990 59136 451
90 0506 Canby SD 86 CLACKAMAS Canby 86 Carus elem 1960 2001 57500 441
91 0506 Molalla River SD 35 CLACKAMAS Mollala River 35 Molalla Elem 1980 49393 440
92 0506 Oregon City SD 62 CLACKAMAS Oregon City SD 62 Holcomb Elem 1966 2002 48132 427
93 0506 North Clackamas SD 12 CLACKAMAS North Clac kamas 12 Lewelling Elem 1963 48507 423
94 0506 North Clackamas SD 12 CLACKAMAS North Clac kamas 12 Riverside Elem 1955 1993 46901 422
95 0506 Oregon Trail SD 46 CLACKAMAS Oregon Tra il SD 46 Cedar Ridge Middle 1955 1974 55272 422
96 0506 Canby SD 86 CLACKAMAS Canby 86 Howard Ecc les Elem 1956 2001 57632 420
97 0506 Oregon City SD 62 CLACKAMAS Oregon City SD 62 King Elem 1958 1974 44220 411
98 0506 Oregon Trail SD 46 CLACKAMAS Oregon Tra il SD 46 Boring Middle 1948 1978 30450 404
99 0506 Oregon City SD 62 CLACKAMAS Oregon City SD 62 Mt Pleasant Elem 1929 1981 43070 401
100 0506 Lake Oswego SD 7J CLACKAMAS Lake Oswego 7J Forest Hills Elem 1949 1990 50567 400
101 0506 West Linn-Wilsonville SD 3J CLACKAMAS West Linn 3J Cedaroak Park Primary 1966 19993328
390 102 0506 Lake Oswego SD 7J CLACKAMAS Lake Oswego 7J Oak Creek Elem 1991 57700 389
103 0506 Estacada SD 108 CLACKAMAS Estacada 108 Eagle Creek Elem 1970 1982 52570 381
104 0506 Estacada SD 108 CLACKAMAS Estacada 108 Estacada Jr High 1936 1982 70288 378
105 0506 Estacada SD 108 CLACKAMAS Estacada 108 Clac kamas River Elem 2003 370
106 0506 North Clackamas SD 12 CLACKAMAS North Clac kamas 12 Clackamas Elem 1939 1998 41999 370
107 0506 Oregon Trail SD 46 CLACKAMAS Oregon Tra il SD 46 Sandy Grade (2 b ldgs) 1930 1972 42122 354
108 0506 Lake Oswego SD 7J CLACKAMAS Lake Oswego 7J Palisades Elem 1959 1988 42846 353
109 0506 North Clackamas SD 12 CLACKAMAS North Clac kamas 12 Linwood Elem 1916 1999 38622 352
110 0506 Lake Oswego SD 7J CLACKAMAS Lake Oswego 7J Hallinan Elem 1981 46144 340
111 0506 North Clackamas SD 12 CLACKAMAS North Clac kamas 12 Cambell Elem 1956 2001 37939 336
112 0506 North Clackamas SD 12 CLACKAMAS North Clac kamas 12 Concord Elem 1936 1968 47448 333
113 0506 Estacada SD 108 CLACKAMAS Estacada 108 River Mill Elem 1970 38262 328
114 0506 Lake Oswego SD 7J CLACKAMAS Lake Oswego 7J Westridge Elem 1981 46144 328
115 0506 West Linn-Wilsonville SD 3J CLACKAMAS West Linn 3J Bolton Primary 1955 55718 328
116 0506 North Clackamas SD 12 CLACKAMAS North Clac kamas 12 Clackamas Web Academy 317
117 0506 Oregon Trail SD 46 CLACKAMAS Oregon Tra il SD 46 Kelso Elem 1978 39268 315
118 0506 Colton SD 53 CLACKAMAS Colton 53 Colton Elem 1975 51085 310 119 0506 Molalla River SD 35 CLACKAMAS Mollala River 35 Mulino Elem 1952 1960 31921 301
120 0506 Oregon Trail SD 46 CLACKAMAS Oregon Tra il SD 46 Welches Elem 1980 31294 295
121 0506 Oregon City SD 62 CLACKAMAS Oregon City SD 62 Jennings Lodge Elem 1938 2002 32030 293
122 0506 North Clackamas SD 12 CLACKAMAS North Clac kamas 12 Milwaukie Elem 292
123 0506 Lake Oswego SD 7J CLACKAMAS Lake Oswego 7J Bryant Elem 1966 50135 291
124 0506 North Clackamas SD 12 CLACKAMAS North Clac kamas 12 Wichita Elem 1941 1997 33994 291
125 0506 Lake Oswego SD 7J CLACKAMAS Lake Oswego 7J River Grove Elem 1968 46289 289
126 0506 North Clackamas SD 12 CLACKAMAS North Clac kamas 12 Ardenwald Elem 1924 1992 35256 286
127 0506 Oregon City SD 62 CLACKAMAS Oregon City SD 62 Park Place Elem 1946 2002 39950 286
128 0506 North Clackamas SD 12 CLACKAMAS North Clac kamas 12 New Urban High 277
129 0506 Colton SD 53 CLACKAMAS Colton 53 Colton High 1960 20000 267
130 0506 Oregon Trail SD 46 CLACKAMAS Oregon Tra il SD 46 Naas Elem 1968 44936 237
131 0506 Molalla River SD 35 CLACKAMAS Mollala River 35 Rural Dell Elem 1938 1974 29848 233
132 0506 Oregon City SD 62 CLACKAMAS Oregon City SD 62 Candy Lane Elem 1969 1974 34930 232
133 0506 Molalla River SD 35 CLACKAMAS Mollala River 35 Clarkes Elem 1952 5009 194
134 0506 Colton SD 53 CLACKAMAS Colton 53 Colton Middle 1994 43000 181
135 0506 North Clackamas SD 12 CLACKAMAS North Clac kamas 12 Sojourner Sc hool 179 136 0506 Oregon Trail SD 46 CLACKAMAS Oregon Tra il SD 46 Welches Midd le 1968 32205 177
137 0506 Oregon Trail SD 46 CLACKAMAS Oregon Tra il SD 46 Cottrell Elem 1949 1985 35232 139
138 0506 North Clackamas SD 12 CLACKAMAS North Clac kamas 12 El Puente 126
139 0506 North Clackamas SD 12 CLACKAMAS North Clac kamas 12 Clac kamas Midd le College 120
140 0506 North Clackamas SD 12 CLACKAMAS North Clac kamas 12 Milwaukie Ac ademy of the Arts 102
141 0506 West Linn-Wilsonville SD 3J CLACKAMAS West Linn 3J Three Rivers Charter 101
142 0506 Molalla River SD 35 CLACKAMAS Molla la River 35 Dickey Prarie Elem 1928 1993 12766 100
143 0506 North Clackamas SD 12 CLACKAMAS North Clac kamas 12 CCC-CLC (GED) 70
144 0506 Clackamas ESD CLACKAMAS Clackamas ESD R15 Christie Elem 67
145 0506 West Linn-Wilsonville SD 3J CLACKAMAS West Linn 3J Arts & Tec hnology Charter High 60
146 0506 Molalla River SD 35 CLACKAMAS Molla la River 35 Maple Grove Elem 1928 4896 44
147 0506 Oregon Trail SD 46 CLACKAMAS Oregon Tra il SD 46 Home Schooled 42
148 0506 Oregon City SD 62 CLACKAMAS Oregon City SD 62 Casc ade Ac ademic s 29
149 0506 Canby SD 86 CLACKAMAS Canby 86 CCC-HSProgram 24
150 0506 Canby SD 86 CLACKAMAS Canby 86 Pa rrott Creek Child Serv 24
Appendix A Oregon Seismic Needs Assessment DOGAMI (June 2007)

8/3/2019 Statewide Seismic Needs Assessment report
http://slidepdf.com/reader/full/statewide-seismic-needs-assessment-report 67/341
Year Year ODE 2005
School Year District County Distric t School Built Remod Sq Ft Total
151 0506 Oregon City SD 62 CLACKAMAS Oregon City SD 62 Crossroads Alterna tive Sc hool 24
152 0506 Oregon City SD 62 CLACKAMAS Oregon City SD 62 CCC-CLC (GED) 23
153 0506 Molalla River SD 35 CLACKAMAS M olla la River 35 CCC-CLC (GED) 17
154 0506 Oregon City SD 62 CLACKAMAS Oregon City SD 62 Northwest Sc hool of Succ ess 16
155 0506 Canby SD 86 CLACKAMAS Canby 86 Canby SD 86 15
156 0506 Oregon Trail SD 46 CLACKAMAS Oregon Tra il SD 46 Mt Hood CC GED 15
157 0506 North Clackamas SD 12 CLACKAMAS North Clac kamas 12 Milwaukie High E-School 14
158 0506 North Clackamas SD 12 CLACKAMAS North Clac kamas 12 Adult Transition p rog 12
159 0506 Oregon City SD 62 CLACKAMAS Oregon City SD 62 Oregon City SD 62 12
160 0506 Clackamas ESD CLACKAMAS Clackamas ESD R15 Elem Day Treatment - Intermed 11
161 0506 Clackamas ESD CLACKAMAS Clackamas ESD R15 Elem Day Treatment - Prima ry 11
162 0506 Gladstone SD 115 CLACKAMAS Gladstone 115 Casc ade Ac ademic s 11
163 0506 Lake Oswego SD 7J CLACKAMAS Lake Oswego 7J PCC GED 11
164 0506 Clackamas ESD CLACKAMAS Clackamas ESD R15 ESD at Kraxberger Midd le 10
165 0506 Clackamas ESD CLACKAMAS Clackamas ESD R15 ESD at Ogden Jr High 10
166 0506 Clackamas ESD CLACKAMAS Clackamas ESD R15 OR City High Prog 10
167 0506 Clackamas ESD CLACKAMAS Clackamas ESD R15 Seth Lewelling Prog 10
168 0506 Clackamas ESD CLACKAMAS C lackamas ESD R15 Sunrise Prog 10
169 0506 Molalla River SD 35 CLACKAMAS Molla la River 35 CCC 10
170 0506 Clackamas ESD CLACKAMAS Clackamas ESD R15 Clac kamas High LEEP 9
171 0506 Clackamas ESD CLACKAMAS C lackamas ESD R15 Ha llinan Prog 9
172 0506 Clackamas ESD CLACKAMAS Clackamas ESD R15 McLoughlin Prog 9
173 0506 Clackamas ESD CLACKAMAS C lackamas ESD R15 Mt Sc ott Prog 9
174 0506 Clackamas ESD CLACKAMAS Clackamas ESD R15 Post High LEEP 9
175 0506 Oregon City SD 62 CLACKAMAS O regon City SD 62 CCC-YPOP Prog 9
176 0506 Clackamas ESD CLACKAMAS Clackamas ESD R15 Clac kamas River Elem-LEEP 8
177 0506 Clackamas ESD CLACKAMAS Clackamas ESD R15 Gladstone High Prog 8
178 0506 Clackamas ESD CLACKAMAS Clackamas ESD R15 Ogden AIM 8
179 0506 Clackamas ESD CLACKAMAS Clackamas ESD R15 Pa rk Plac e - LEEP 8
180 0506 Clackamas ESD CLACKAMAS Clackamas ESD R15 Heron Cr Jr Acad 7
181 0506 Canby SD 86 CLACKAMAS Canby 86 NW School Suc cess 6
182 0506 Clackamas ESD CLACKAMAS Clackamas ESD R15 ESD at Jac kson Post High 6
183 0506 Clackamas ESD CLACKAMAS Clackamas ESD R15 Ninety-One Prog 6
184 0506 Canby SD 86 CLACKAMAS Canby 86 Serend ip ity 5
185 0506 Clackamas ESD CLACKAMAS Clackamas ESD R15 Eagle Cr Primary - LEEP 5
186 0506 Clackamas ESD CLACKAMAS Clackamas ESD R15 Lk Oswego Achievement 5
187 0506 Clackamas ESD CLACKAMAS Clackamas ESD R15 River Grove - AIM 5
188 0506 Gladstone SD 115 CLACKAMAS Gladstone 115 CCC-HSProg 5
189 0506 Molalla River SD 35 CLACKAMAS Molla la River 35 CCC-YPOP Prog 5
190 0506 North Clackamas SD 12 CLACKAMAS North Clac kamas 12 CCC-Tri Cities 5
191 0506 North Clackamas SD 12 CLACKAMAS North Clac kamas 12 CCC-YPOP Prog 5
192 0506 Oregon City SD 62 CLACKAMAS Oregon City SD 62 Tuc ker-Maxon Ora l 5
193 0506 Clackamas ESD CLACKAMAS Clackamas ESD R15 Heron Cr High Acad 4
194 0506 Molalla River SD 35 CLACKAMAS Molla la River 35 CCC-HSProg 4
195 0506 Molalla River SD 35 CLACKAMAS Molla la River 35 CCC-Tri Cities 4
196 0506 Clackamas ESD CLACKAMAS Clackamas ESD R15 Transition Prog -Clack ESD 3
197 0506 Gladstone SD 115 CLACKAMAS Gladstone 115 CCC 3
198 0506 Gladstone SD 115 CLACKAMAS Gladstone 115 CCC-CLC (GED) 3
199 0506 Gladstone SD 115 CLACKAMAS Gladstone 115 Serend ip ity 3
200 0506 Oregon City SD 62 CLACKAMAS O regon City SD 62 CCC-Tri Cities 3
201 0506 Oregon City SD 62 CLACKAMAS Oregon City SD 62 Serend ip ity 3
202 0506 Canby SD 86 CLACKAMAS Canby 86 Casc ades Ac ademics 2
203 0506 Canby SD 86 CLACKAMAS Canby 86 Crossroads Alt 2
204 0506 Gladstone SD 115 CLACKAMAS Gladstone 115 CCC-YPOP Prog 2
205 0506 Lake Oswego SD 7J CLACKAMAS Lake Oswego 7J Casc ade Ac ademic s 2
206 0506 Lake Oswego SD 7J CLACKAMAS Lake Oswego 7J CCC-CLC (GED) 2
207 0506 Lake Oswego SD 7J CLACKAMAS Lake Oswego 7J PCC College Bound 2
208 0506 Lake Oswego SD 7J CLACKAMAS Lake Oswego 7J Tuc ker-Maxon Ora l 2
209 0506 Molalla River SD 35 CLACKAMAS Molla la River 35 Northwest Sc hool of Succ ess 2
2100506 North Clackamas SD 12
CLACKAMAS North Clac kamas 12 CCC-HSProg 2 211 0506 North Clackamas SD 12 CLACKAMAS North Clac kamas 12 Serend ip ity 2
212 0506 Canby SD 86 CLACKAMAS Canby 86 SERP Enterprises 1
213 0506 Gladstone SD 115 CLACKAMAS Gladstone 115 CCC-ESL Prog 1
214 0506 Gladstone SD 115 CLACKAMAS Gladstone 115 OR Outreac h 1
215 0506 Lake Oswego SD 7J CLACKAMAS Lake Oswego 7J CCC 1
216 0506 Lake Oswego SD 7J CLACKAMAS Lake Oswego 7J CCC-Tri Cities 1
217 0506 Lake Oswego SD 7J CLACKAMAS Lake Oswego 7J PCC 1
218 0506 Lake Oswego SD 7J CLACKAMAS Lake Oswego 7J Quest Schools Inc 1
219 0506 Lake Oswego SD 7J CLACKAMAS Lake Oswego 7J Serend ip ity 1
220 0506 Lake Oswego SD 7J CLACKAMAS Lake Oswego 7J The Child rens Hour 1
221 0506 Lake Oswego SD 7J CLACKAMAS Lake Oswego 7J Thomas Ed ison High 1
222 0506 North Clackamas SD 12 CLACKAMAS North Clac kamas 12 Crossroads Alterna tive Sc hool 1
223 0506 North Clackamas SD 12 CLACKAMAS North Clac kamas 12 Portland Youth Builders 1
224 0506 Oregon City SD 62 CLACKAMAS O regon City SD 62 Home Schooled 1
225 0506 Oregon City SD 62 CLACKAMAS Oregon City SD 62 SERP Enterprises Inc 1
Appendix A Oregon Seismic Needs Assessment DOGAMI (June 2007)
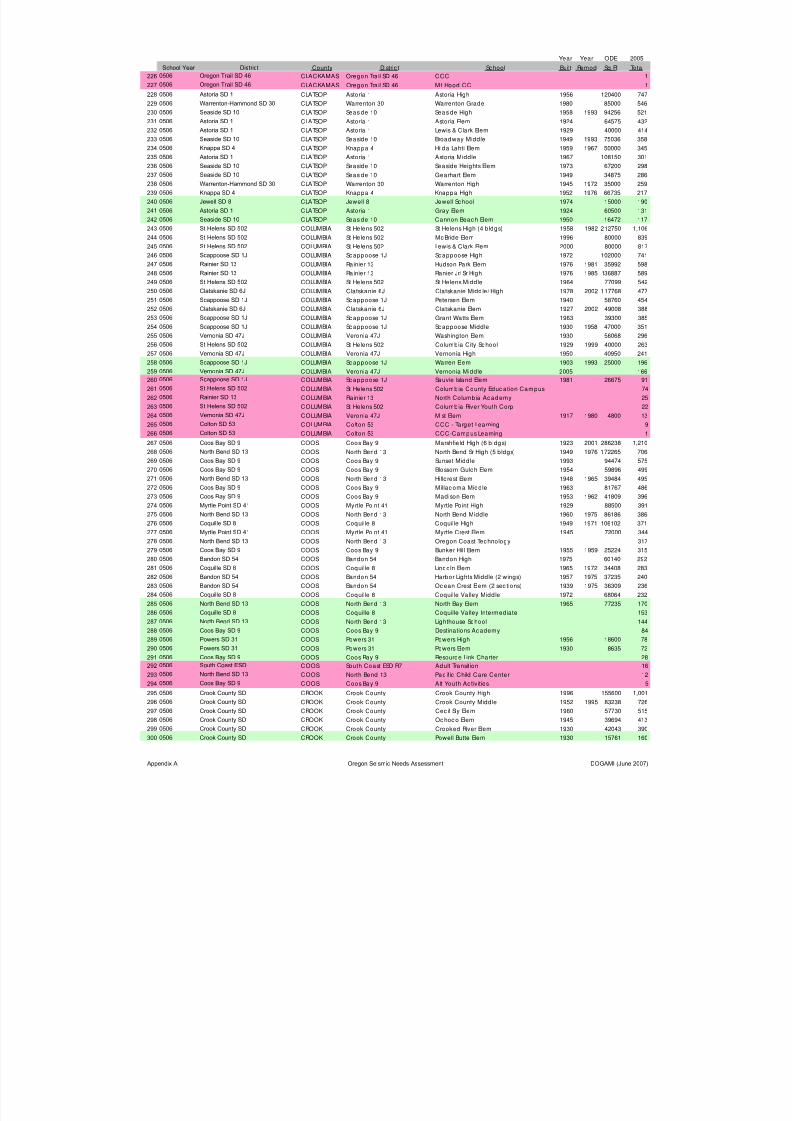
8/3/2019 Statewide Seismic Needs Assessment report
http://slidepdf.com/reader/full/statewide-seismic-needs-assessment-report 68/341
Year Year ODE 2005
School Year District County Distric t School Built Remod Sq Ft Total
226 0506 Oregon Trail SD 46 CLACKAMAS Oregon Tra il SD 46 CCC 1
227 0506 Oregon Trail SD 46 CLACKAMAS Oregon Tra il SD 46 Mt Hood CC 1
228 0506 Astoria SD 1 CLATSOP Astoria 1 Astoria High 1956 120400 747
229 0506 Warrenton-Hammond SD 30 CLATSOP Warrenton 30 Warrenton Grade 1980 85000 546
230 0506 Seaside SD 10 CLATSOP Seaside 10 Seaside High 1958 1993 94256 521
231 0506 Astoria SD 1 CLATSOP Astoria 1 Astoria Elem 1924 64575 432
232 0506 Astoria SD 1 CLATSOP Astoria 1 Lewis & Clark Elem 1929 40000 414
233 0506 Seaside SD 10 CLATSOP Seaside 10 Broadway Middle 1949 1993 75036 358
234 0506 Knappa SD 4CLATSOP Knappa 4 Hilda Lahti Elem 1959 1967 50000 345
235 0506 Astoria SD 1 CLATSOP Astoria 1 Astoria Middle 1967 108150 301
236 0506 Seaside SD 10 CLATSOP Seaside 10 Seaside Heights Elem 1973 67200 298
237 0506 Seaside SD 10 CLATSOP Seaside 10 Gearhart Elem 1949 34875 286
238 0506 Warrenton-Hammond SD 30 CLATSOP Warrenton 30 Warrenton High 1945 1972 35000 259
239 0506 Knappa SD 4 CLATSOP Knappa 4 Knappa High 1952 1976 66735 217
240 0506 Jewell SD 8 CLATSOP Jewell 8 Jewell School 1974 15000 190
241 0506 Astoria SD 1 CLATSOP Astoria 1 Gray Elem 1924 60500 131
242 0506 Seaside SD 10 CLATSOP Seaside 10 Cannon Beac h Elem 1950 16472 117
243 0506 St Helens SD 502 COLUMBIA St Helens 502 St Helens High (4 bldgs) 1958 1982 212750 1,106
244 0506 St Helens SD 502 COLUMBIA St Helens 502 McBride Elem 1996 80000 839
245 0506 St Helens SD 502 COLUMBIA St Helens 502 Lewis & Clark Elem 2000 80000 817
246 0506 Scappoose SD 1J COLUMBIA Scappoose 1J Scappoose High 1972 102000 741
247 0506 Rainier SD 13 COLUMBIA Rainier 13 Hudson Park Elem 1976 1981 35992 598
248 0506 Rainier SD 13 COLUMBIA Rainier 13 Ranier Jr/ Sr High 1976 1985 136887 589
249 0506 St Helens SD 502 COLUMBIA St Helens 502 St Helens Middle 1964 77099 542
250 0506 Clatskanie SD 6J COLUMBIA Clatskanie 6J Clatskanie Midd le/ High 1978 2002 117768 477
251 0506 Scappoose SD 1J COLUMBIA Scappoose 1J Petersen Elem 1940 58760 454 252 0506 Clatskanie SD 6J COLUMBIA Clatskanie 6J Clatskanie Elem 1927 2002 49008 388
253 0506 Scappoose SD 1J COLUMBIA Scappoose 1J Grant Watts Elem 1963 39300 385
254 0506 Scappoose SD 1J COLUMBIA Scappoose 1J Scappoose Middle 1930 1958 47000 351
255 0506 Vernonia SD 47J COLUMBIA Veronia 47J Washington Elem 1930 56068 296
256 0506 St Helens SD 502 COLUMBIA St Helens 502 Columbia City Sc hool 1929 1999 40000 263
257 0506 Vernonia SD 47J COLUMBIA Veronia 47J Vernonia High 1950 40950 241
258 0506 Scappoose SD 1J COLUMBIA Scappoose 1J Warren Elem 1903 1993 25000 196
259 0506 Vernonia SD 47J COLUMBIA Veronia 47J Vernonia Middle 2005 166
260 0506 Scappoose SD 1J COLUMBIA Scappoose 1J Sauvie Island Elem 1981 26675 91
261 0506 St Helens SD 502 COLUMBIA St Helens 502 Columbia County Educ ation Campus 74
262 0506 Rainier SD 13 COLUMBIA Rainier 13 North Columb ia Academy 25
263 0506 St Helens SD 502 COLUMBIA St Helens 502 Columbia River Youth Corp 22
264 0506 Vernonia SD 47J COLUMBIA Veronia 47J Mist Elem 1917 1980 4800 13
265 0506 Colton SD 53 COLUMBIA Colton 53 CCC - Target Lea rning 9
266 0506 Colton SD 53 COLUMBIA Colton 53 CCC-Campus Learning 1
267 0506 Coos Bay SD 9 COOS Coos Bay 9 Marshfield High (6 b ldgs) 1923 2001 286238 1,210
268 0506 North Bend SD 13 COOS North Bend 13 North Bend Sr High (5 bldgs) 1949 1976 172265 706 269 0506 Coos Bay SD 9 COOS Coos Bay 9 Sunset Middle 1993 94474 575
270 0506 Coos Bay SD 9 COOS Coos Bay 9 Blossom Gulch Elem 1954 59896 499
271 0506 North Bend SD 13 COOS North Bend 13 Hillc rest Elem 1948 1965 39484 495
272 0506 Coos Bay SD 9 COOS Coos Bay 9 Millacoma Middle 1963 81767 486
273 0506 Coos Bay SD 9 COOS Coos Bay 9 Madison Elem 1953 1962 41809 396
274 0506 Myrtle Point SD 41 COOS Myrtle Point 41 Myrtle Point High 1929 88500 391
275 0506 North Bend SD 13 COOS North Bend 13 North Bend Middle 1960 1975 86186 386
276 0506 Coquille SD 8 COOS Coquille 8 Coquille High 1949 1971 106102 371
277 0506 Myrtle Point SD 41 COOS Myrtle Point 41 Myrtle Crest Elem 1945 72000 344
278 0506 North Bend SD 13 COOS North Bend 13 Oregon Coast Technology 317
279 0506 Coos Bay SD 9 COOS Coos Bay 9 Bunker Hill Elem 1955 1959 25224 315
280 0506 Bandon SD 54 COOS Bandon 54 Bandon High 1975 60140 292
281 0506 Coquille SD 8 COOS Coquille 8 Lincoln Elem 1965 1972 34408 283
282 0506 Bandon SD 54 COOS Bandon 54 Harbor Lights Middle (2 wings) 1957 1975 37235 240
283 0506 Bandon SD 54 COOS Bandon 54 Oc ean Crest Elem (2 sec tions) 1939 1975 36309 236
284 0506 Coquille SD 8 COOS Coquille 8 Coquille Valley Midd le 1972 68064 232
285 0506 North Bend SD 13 COOS North Bend 13 North Bay Elem 1965 77235 170 286 0506 Coquille SD 8 COOS Coquille 8 Coquille Valley Intermediate 153
287 0506 North Bend SD 13 COOS North Bend 13 Lighthouse School 144
288 0506 Coos Bay SD 9 COOS Coos Bay 9 Destinations Academy 84
289 0506 Powers SD 31 COOS Powers 31 Powers High 1956 18600 78
290 0506 Powers SD 31 COOS Powers 31 Powers Elem 1930 8635 72
291 0506 Coos Bay SD 9 COOS Coos Bay 9 Resource Link Charter 28
292 0506 South Coast ESD COOS South Coast ESD R7 Adult Transition 16
293 0506 North Bend SD 13 COOS North Bend 13 Pac ific Child Care Center 12
294 0506 Coos Bay SD 9 COOS Coos Bay 9 Alt Youth Ac tivities 5
295 0506 Crook County SD CROOK Crook County Crook County High 1996 155600 1,001
296 0506 Crook County SD CROOK Crook County Crook County Middle 1952 1995 83238 726
297 0506 Crook County SD CROOK Crook County Cec il Sly Elem 1960 57730 515
298 0506 Crook County SD CROOK Crook County Oc hoc o Elem 1945 39694 413
299 0506 Crook County SD CROOK Crook County Crooked River Elem 1930 42043 390
300 0506 Crook County SD CROOK Crook County Powell Butte Elem 1930 15761 160
Appendix A Oregon Seismic Needs Assessment DOGAMI (June 2007)
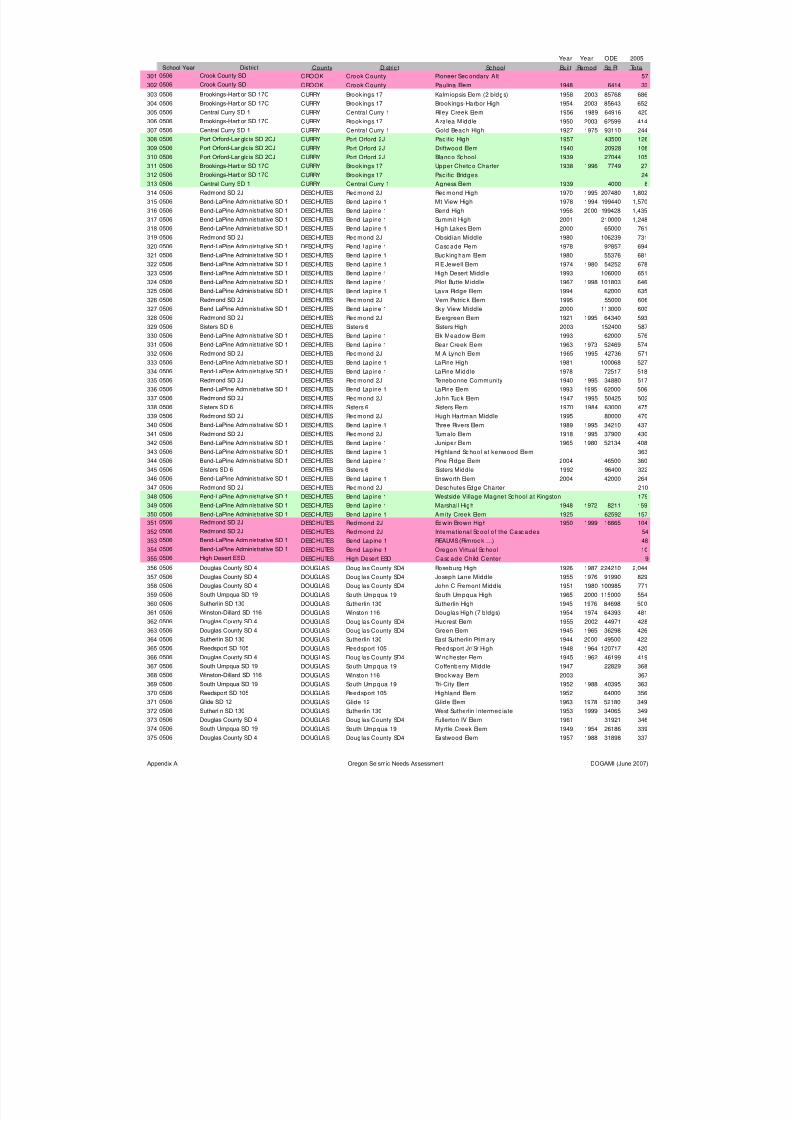
8/3/2019 Statewide Seismic Needs Assessment report
http://slidepdf.com/reader/full/statewide-seismic-needs-assessment-report 69/341
Year Year ODE 2005
School Year District County Distric t School Built Remod Sq Ft Total
301 0506 Crook County SD CROOK Crook County Pioneer Sec ondary Alt 57
302 0506 Crook County SD CROOK Crook County Paulina Elem 1948 6414 33
303 0506 Brookings-Harbor SD 17C CURRY Brookings 17 Kalmiopsis Elem (2 bldgs) 1958 2003 85768 686
304 0506 Brookings-Harbor SD 17C CURRY Brookings 17 Brookings-Harbor High 1954 2003 85643 652
305 0506 Central Curry SD 1 CURRY Centra l Curry 1 Riley Creek Elem 1956 1989 64916 420
306 0506 Brookings-Harbor SD 17C CURRY Brookings 17 Azalea Midd le 1950 2003 62599 414
307 0506 Central Curry SD 1 CURRY Centra l Curry 1 Gold Beach High 1927 1975 93110 244
308 0506 Port Orford-Langlois SD 2CJ CURRY Port Orford 2J Pac ific High 1957 43500 126
309 0506 Port Orford-Langlois SD 2CJCURRY Port Orford 2J Driftwood Elem 1940 20928 108
310 0506 Port Orford-Langlois SD 2CJ CURRY Port Orford 2J Blanco School 1939 27044 105
311 0506 Brookings-Harbor SD 17C CURRY Brookings 17 Upper Chetc o Charter 1938 1996 7749 27
312 0506 Brookings-Harbor SD 17C CURRY Brookings 17 Pac ific Bridges 24
313 0506 Central Curry SD 1 CURRY Centra l Curry 1 Agness Elem 1939 4000 8
314 0506 Redmond SD 2J DESCHUTES Redmond 2J Redmond High 1970 1995 207480 1,802
315 0506 Bend-LaPine Administrat ive SD 1 DESCHUTES Bend Lap ine 1 Mt View High 1978 1994 199440 1,570
316 0506 Bend-LaPine Administrat ive SD 1 DESCHUTES Bend Lap ine 1 Bend High 1956 2000 199428 1,435
317 0506 Bend-LaPine Administrat ive SD 1 DESCHUTES Bend Lap ine 1 Summit High 2001 210000 1,248
318 0506 Bend-LaPine Administrat ive SD 1 DESCHUTES Bend Lap ine 1 High Lakes Elem 2000 65000 761
319 0506 Redmond SD 2J DESCHUTES Redmond 2J Obsid ian Middle 1980 106239 731
320 0506 Bend-LaPine Administrat ive SD 1 DESCHUTES Bend Lap ine 1 Casc ade Elem 1978 92857 694
321 0506 Bend-LaPine Administrat ive SD 1 DESCHUTES Bend Lap ine 1 Buc kingham Elem 1980 55376 681
322 0506 Bend-LaPine Administrat ive SD 1 DESCHUTES Bend Lap ine 1 R E Jewell Elem 1974 1980 54252 678
323 0506 Bend-LaPine Administrat ive SD 1 DESCHUTES Bend Lap ine 1 High Desert Middle 1993 106000 651
324 0506 Bend-LaPine Administrat ive SD 1 DESCHUTES Bend Lap ine 1 Pilot Butte Middle 1967 1998 101803 646
325 0506 Bend-LaPine Administrat ive SD 1 DESCHUTES Bend Lap ine 1 Lava Ridge Elem 1994 62000 635
326 0506 Redmond SD 2J DESCHUTES Redmond 2J Vern Patric k Elem 1995 55000 606 327 0506 Bend-LaPine Administrat ive SD 1 DESCHUTES Bend Lap ine 1 Sky View Middle 2000 113000 600
328 0506 Redmond SD 2J DESCHUTES Redmond 2J Evergreen Elem 1921 1995 64340 593
329 0506 Sisters SD 6 DESCHUTES Sisters 6 Sisters High 2003 152400 587
330 0506 Bend-LaPine Administrat ive SD 1 DESCHUTES Bend Lap ine 1 Elk Meadow Elem 1993 62000 576
331 0506 Bend-LaPine Administrat ive SD 1 DESCHUTES Bend Lap ine 1 Bear Creek Elem 1963 1973 52469 574
332 0506 Redmond SD 2J DESCHUTES Redmond 2J M A Lynch Elem 1965 1995 42736 571
333 0506 Bend-LaPine Administrat ive SD 1 DESCHUTES Bend Lap ine 1 LaPine High 1981 100068 527
334 0506 Bend-LaPine Administrat ive SD 1 DESCHUTES Bend Lap ine 1 LaPine Middle 1978 72517 518
335 0506 Redmond SD 2J DESCHUTES Redmond 2J Terrebonne Community 1940 1995 34880 517
336 0506 Bend-LaPine Administrat ive SD 1 DESCHUTES Bend Lap ine 1 LaPine Elem 1993 1995 62000 506
337 0506 Redmond SD 2J DESCHUTES Redmond 2J John Tuck Elem 1947 1995 50425 502
338 0506 Sisters SD 6 DESCHUTES Sisters 6 Sisters Elem 1970 1984 63000 475
339 0506 Redmond SD 2J DESCHUTES Redmond 2J Hugh Hartman Middle 1995 80000 470
340 0506 Bend-LaPine Administrat ive SD 1 DESCHUTES Bend Lap ine 1 Three Rivers Elem 1989 1995 34210 437
341 0506 Redmond SD 2J DESCHUTES Redmond 2J Tumalo Elem 1918 1995 37900 430
342 0506 Bend-LaPine Administrat ive SD 1 DESCHUTES Bend Lap ine 1 Juniper Elem 1965 1980 52134 408
343 0506 Bend-LaPine Administrat ive SD 1 DESCHUTES Bend Lap ine 1 Highland Sc hool at kenwood Elem 363 344 0506 Bend-LaPine Administrat ive SD 1 DESCHUTES Bend Lap ine 1 Pine Ridge Elem 2004 46500 360
345 0506 Sisters SD 6 DESCHUTES Sisters 6 Sisters Midd le 1992 96400 322
346 0506 Bend-LaPine Administrat ive SD 1 DESCHUTES Bend Lap ine 1 Ensworth Elem 2004 42000 264
347 0506 Redmond SD 2J DESCHUTES Redmond 2J Deschutes Edge Charter 210
348 0506 Bend-LaPine Administrat ive SD 1 DESCHUTES Bend Lap ine 1 Westside Village Magnet Sc hool at Kingston 179
349 0506 Bend-LaPine Administrat ive SD 1 DESCHUTES Bend Lap ine 1 Marshall High 1948 1972 8211 159
350 0506 Bend-LaPine Administrat ive SD 1 DESCHUTES Bend Lap ine 1 Amity Creek Elem 1925 62592 157
351 0506 Redmond SD 2J DESCHUTES Redmond 2J Edwin Brown High 1950 1999 16665 104
352 0506 Redmond SD 2J DESCHUTES Redmond 2J Internationa l Sc ool of the Casc ades 54
353 0506 Bend-LaPine Administrat ive SD 1 DESCHUTES Bend Lap ine 1 REALMS(Rimroc k …) 48
354 0506 Bend-LaPine Administrat ive SD 1 DESCHUTES Bend Lap ine 1 Oregon Virtua l Sc hool 10
355 0506 High Desert ESD DESCHUTES High Desert ESD Casc ade Child Center 9
356 0506 Douglas County SD 4 DOUGLAS Douglas County SD4 Roseburg High 1926 1987 224210 2,044
357 0506 Douglas County SD 4 DOUGLAS Douglas County SD4 Joseph Lane Middle 1955 1976 91990 829
358 0506 Douglas County SD 4 DOUGLAS Douglas County SD4 John C Fremont Middle 1951 1980 100985 771
359 0506 South Umpqua SD 19 DOUGLAS South Umpqua 19 South Umpqua High 1965 2000 115000 554
360 0506 Sutherlin SD 130 DOUGLAS Sutherlin 130 Sutherlin High 1945 1976 84698 500 361 0506 Winston-Dillard SD 116 DOUGLAS Winston 116 Douglas High (7 b ldgs) 1954 1974 64393 481
362 0506 Douglas County SD 4 DOUGLAS Douglas County SD4 Hucrest Elem 1955 2002 44971 428
363 0506 Douglas County SD 4 DOUGLAS Douglas County SD4 Green Elem 1945 1965 36298 426
364 0506 Sutherlin SD 130 DOUGLAS Sutherlin 130 East Sutherlin Primary 1944 2000 49500 422
365 0506 Reedsport SD 105 DOUGLAS Reedsport 105 Reedsport Jr/ Sr High 1948 1964 120717 420
366 0506 Douglas County SD 4 DOUGLAS Douglas County SD4 Winchester Elem 1945 1962 46199 419
367 0506 South Umpqua SD 19 DOUGLAS South Umpqua 19 Coffenberry Middle 1947 22829 368
368 0506 Winston-Dillard SD 116 DOUGLAS Winston 116 Broc kway Elem 2003 367
369 0506 South Umpqua SD 19 DOUGLAS South Umpqua 19 Tri-City Elem 1952 1988 40395 363
370 0506 Reedsport SD 105 DOUGLAS Reedsport 105 Highland Elem 1952 64000 356
371 0506 Glide SD 12 DOUGLAS Glide 12 Glide Elem 1963 1978 52180 349
372 0506 Sutherlin SD 130 DOUGLAS Sutherlin 130 West Sutherlin Intermedia te 1953 1999 34065 349
373 0506 Douglas County SD 4 DOUGLAS Douglas County SD4 Fullerton IV Elem 1961 31921 346
374 0506 South Umpqua SD 19 DOUGLAS South Umpqua 19 Myrtle Creek Elem 1949 1954 26186 339
375 0506 Douglas County SD 4 DOUGLAS Douglas County SD4 Eastwood Elem 1957 1988 31898 337
Appendix A Oregon Seismic Needs Assessment DOGAMI (June 2007)
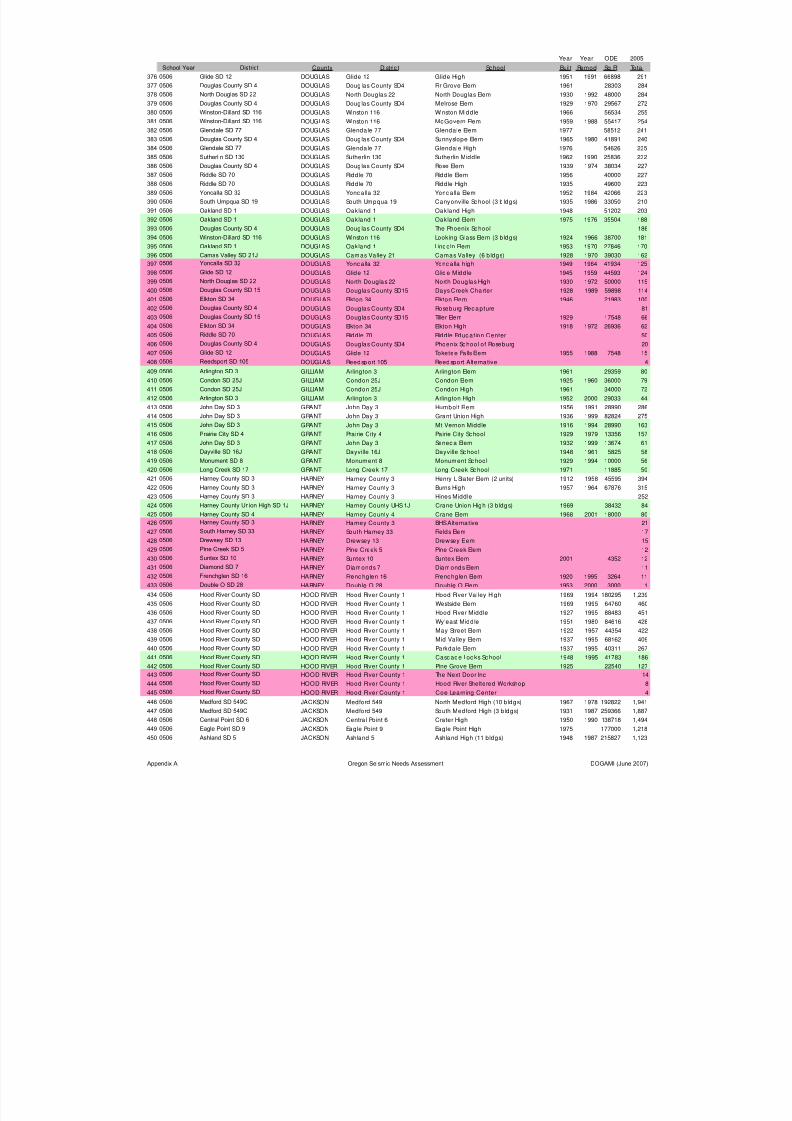
8/3/2019 Statewide Seismic Needs Assessment report
http://slidepdf.com/reader/full/statewide-seismic-needs-assessment-report 70/341
Year Year ODE 2005
School Year District County Distric t School Built Remod Sq Ft Total
376 0506 Glide SD 12 DOUGLAS Glide 12 Glide High 1951 1991 66898 291
377 0506 Douglas County SD 4 DOUGLAS Douglas County SD4 Fir Grove Elem 1961 28303 284
378 0506 North Douglas SD 22 DOUGLAS North Douglas 22 North Douglas Elem 1930 1992 48000 284
379 0506 Douglas County SD 4 DOUGLAS Douglas County SD4 Melrose Elem 1929 1970 29567 272
380 0506 Winston-Dillard SD 116 DOUGLAS Winston 116 Winston Middle 1966 56534 255
381 0506 Winston-Dillard SD 116 DOUGLAS Winston 116 McGovern Elem 1959 1988 55417 254
382 0506 Glendale SD 77 DOUGLAS Glenda le 77 Glendale Elem 1977 58512 241
383 0506 Douglas County SD 4 DOUGLAS Douglas County SD4 Sunnyslope Elem 1965 1980 41891 240
384 0506 Glendale SD 77DOUGLAS Glenda le 77 Glendale High 1976 54626 235
385 0506 Sutherlin SD 130 DOUGLAS Sutherlin 130 Sutherlin Middle 1962 1990 25836 232
386 0506 Douglas County SD 4 DOUGLAS Douglas County SD4 Rose Elem 1939 1974 38034 227
387 0506 Riddle SD 70 DOUGLAS Riddle 70 Riddle Elem 1956 40000 227
388 0506 Riddle SD 70 DOUGLAS Riddle 70 Riddle High 1935 49600 223
389 0506 Yoncalla SD 32 DOUGLAS Yoncalla 32 Yonc alla Elem 1952 1984 42066 223
390 0506 South Umpqua SD 19 DOUGLAS South Umpqua 19 Canyonville School (3 b ldgs) 1935 1986 33050 210
391 0506 Oakland SD 1 DOUGLAS Oakland 1 Oakland High 1948 51202 203
392 0506 Oakland SD 1 DOUGLAS Oakland 1 Oakland Elem 1975 1976 35504 188
393 0506 Douglas County SD 4 DOUGLAS Douglas County SD4 The Phoenix School 186
394 0506 Winston-Dillard SD 116 DOUGLAS Winston 116 Looking Glass Elem (3 bldgs) 1924 1966 38700 181
395 0506 Oakland SD 1 DOUGLAS Oakland 1 Lincoln Elem 1953 1970 27846 170
396 0506 Camas Valley SD 21J DOUGLAS Camas Valley 21 Camas Va lley (6 b ldgs) 1928 1970 39030 162
397 0506 Yoncalla SD 32 DOUGLAS Yonca lla 32 Yonc a lla high 1949 1964 41934 125
398 0506 Glide SD 12 DOUGLAS Glide 12 Glide Midd le 1945 1959 44593 124
399 0506 North Douglas SD 22 DOUGLAS North Douglas 22 North Douglas High 1930 1972 50000 115
400 0506 Douglas County SD 15 DOUGLAS Douglas County SD15 Days Creek Cha rter 1928 1989 59898 114
401 0506 Elkton SD 34 DOUGLAS Elkton 34 Elkton Elem 1946 21983 100
402 0506 Douglas County SD 4 DOUGLAS Douglas County SD4 Roseburg Recapture 81
403 0506 Douglas County SD 15 DOUGLAS Douglas County SD15 Tiller Elem 1929 17548 66
404 0506 Elkton SD 34 DOUGLAS Elkton 34 Elkton High 1918 1972 26936 62
405 0506 Riddle SD 70 DOUGLAS Ridd le 70 Ridd le Educ ation Center 50
406 0506 Douglas County SD 4 DOUGLAS Douglas County SD4 Phoenix Sc hool of Roseburg 20
407 0506 Glide SD 12 DOUGLAS Glide 12 Toketee Fa lls Elem 1955 1988 7548 15
408 0506 Reedsport SD 105 DOUGLAS Reedsport 105 Reedsport Alternative 4
409 0506 Arlington SD 3 GILLIAM Arling ton 3 Arlington Elem 1961 29359 80
410 0506 Condon SD 25J GILLIAM Condon 25J Condon Elem 1925 1960 36000 79
411 0506 Condon SD 25J GILLIAM Condon 25J Condon High 1961 34000 72
412 0506 Arlington SD 3 GILLIAM Arling ton 3 Arlington High 1952 2000 29033 44
413 0506 John Day SD 3 GRANT John Day 3 Humbolt Elem 1956 1991 28990 286
414 0506 John Day SD 3 GRANT John Day 3 Grant Union High 1936 1999 82824 275
415 0506 John Day SD 3 GRANT John Day 3 Mt Vernon Midd le 1916 1994 28990 163
416 0506 Prairie City SD 4 GRANT Prairie City 4 Pairie City School 1929 1979 13356 157
417 0506 John Day SD 3 GRANT John Day 3 Senec a Elem 1932 1999 13674 61
418 0506 Dayville SD 16J GRANT Dayville 16J Dayville Sc hool 1948 1961 5825 58 419 0506 Monument SD 8 GRANT Monument 8 Monument Sc hool 1929 1994 10000 56
420 0506 Long Creek SD 17 GRANT Long Creek 17 Long Creek Sc hool 1971 11885 50
421 0506 Harney County SD 3 HARNEY Harney County 3 Henry L Slater Elem (2 units) 1912 1958 45595 394
422 0506 Harney County SD 3 HARNEY Harney County 3 Burns High 1957 1964 67876 315
423 0506 Harney County SD 3 HARNEY Harney County 3 Hines Middle 252
424 0506 Harney County Union High SD 1J HARNEY Harney County UHS 1J Crane Union High (3 bldgs) 1969 38432 84
425 0506 Harney County SD 4 HARNEY Harney County 4 Crane Elem 1968 2001 18000 80
426 0506 Harney County SD 3 HARNEY Harney County 3 BHSAlternative 21
427 0506 South Harney SD 33 HARNEY South Harney 33 Fields Elem 17
428 0506 Drewsey SD 13 HARNEY Drewsey 13 Drewsey Elem 15
429 0506 Pine Creek SD 5 HARNEY Pine Creek 5 Pine Creek Elem 12
430 0506 Suntex SD 10 HARNEY Suntex 10 Suntex Elem 2001 4352 12
431 0506 Diamond SD 7 HARNEY Diamonds 7 Diamonds Elem 11
432 0506 Frenchglen SD 16 HARNEY Frenc hglen 16 Frenchg len Elem 1920 1995 3264 11
433 0506 Double O SD 28 HARNEY Doub le O 28 Double O Elem 1953 2000 3000 1
434 0506 Hood River County SD HOOD RIVER Hood River County 1 Hood River Valley High 1969 1994 180295 1,239
435 0506 Hood River County SD HOOD RIVER Hood River County 1 Westside Elem 1969 1995 64760 460 436 0506 Hood River County SD HOOD RIVER Hood River County 1 Hood River Middle 1927 1995 88483 451
437 0506 Hood River County SD HOOD RIVER Hood River County 1 Wy'east Midd le 1951 1980 84616 428
438 0506 Hood River County SD HOOD RIVER Hood River County 1 May Street Elem 1922 1957 44354 422
439 0506 Hood River County SD HOOD RIVER Hood River County 1 Mid Valley Elem 1937 1995 68162 409
440 0506 Hood River County SD HOOD RIVER Hood River County 1 Parkdale Elem 1937 1995 40311 267
441 0506 Hood River County SD HOOD RIVER Hood River County 1 Casc ade Loc ks School 1948 1995 41783 186
442 0506 Hood River County SD HOOD RIVER Hood River County 1 Pine Grove Elem 1925 22540 127
443 0506 Hood River County SD HOOD RIVER Hood River County 1 The Next Door Inc 14
444 0506 Hood River County SD HOOD RIVER Hood River County 1 Hood River Sheltered Workshop 8
445 0506 Hood River County SD HOOD RIVER Hood River County 1 Coe Learning Center 4
446 0506 Medford SD 549C JACKSON Medford 549 North Medford High (10 bldgs) 1967 1978 192822 1,941
447 0506 Medford SD 549C JACKSON Medford 549 South Medford High (3 bldgs) 1931 1987 259366 1,887
448 0506 Central Point SD 6 JACKSON Centra l Point 6 Crater High 1950 1990 138718 1,494
449 0506 Eagle Point SD 9 JACKSON Eagle Point 9 Eagle Point High 1975 177000 1,218
450 0506 Ashland SD 5 JACKSON Ashland 5 Ashland High (11 bldgs) 1948 1987 215827 1,123
Appendix A Oregon Seismic Needs Assessment DOGAMI (June 2007)
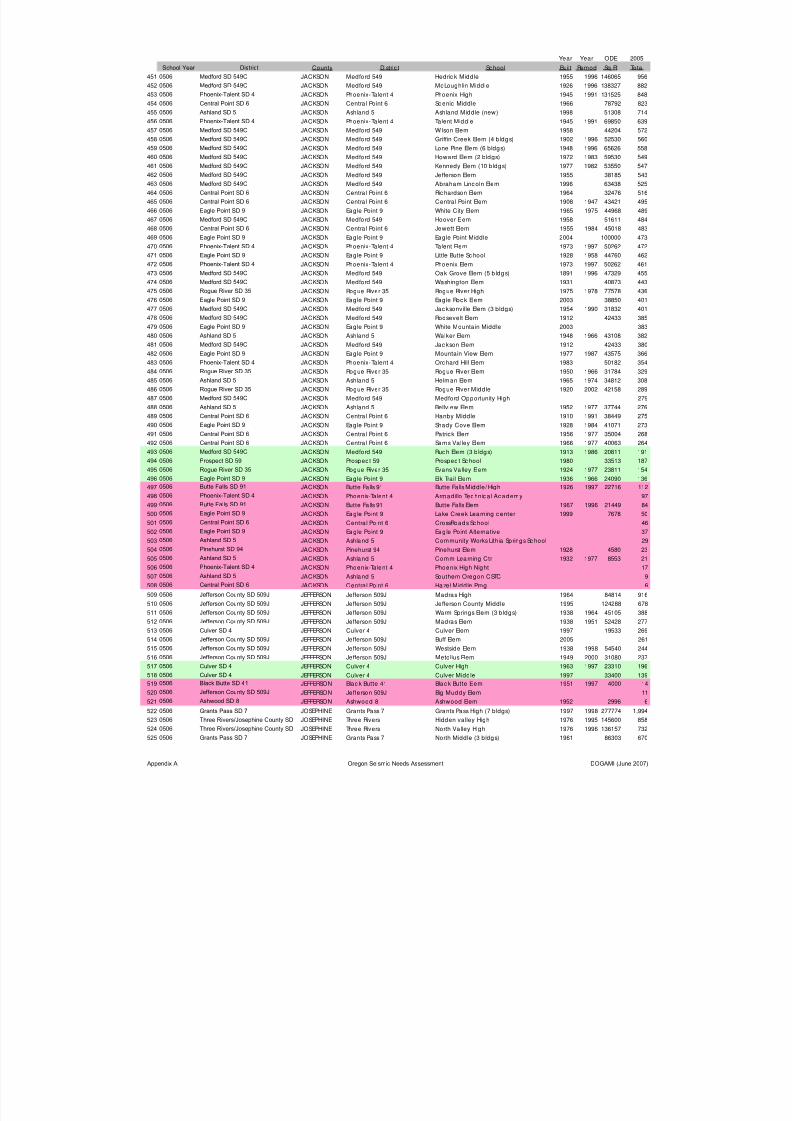
8/3/2019 Statewide Seismic Needs Assessment report
http://slidepdf.com/reader/full/statewide-seismic-needs-assessment-report 71/341
Year Year ODE 2005
School Year District County Distric t School Built Remod Sq Ft Total
451 0506 Medford SD 549C JACKSON Medford 549 Hedric k Midd le 1955 1996 146065 956
452 0506 Medford SD 549C JACKSON Medford 549 McLoughlin Middle 1926 1996 138327 882
453 0506 Phoenix-Talent SD 4 JACKSON Phoenix-Talent 4 Phoenix High 1945 1991 131525 848
454 0506 Central Point SD 6 JACKSON Centra l Point 6 Sc enic Middle 1966 78792 823
455 0506 Ashland SD 5 JACKSON Ashland 5 Ashland Midd le (new) 1998 51308 714
456 0506 Phoenix-Talent SD 4 JACKSON Phoenix-Talent 4 Talent Middle 1945 1991 69850 639
457 0506 Medford SD 549C JACKSON Medford 549 Wilson Elem 1958 44204 572
458 0506 Medford SD 549C JACKSON Medford 549 Griffin Creek Elem (4 b ldgs) 1902 1996 52530 560
459 0506 Medford SD 549CJACKSON Medford 549 Lone Pine Elem (6 bldgs) 1948 1996 65626 558
460 0506 Medford SD 549C JACKSON Medford 549 Howard Elem (2 bldgs) 1972 1983 59530 549
461 0506 Medford SD 549C JACKSON Medford 549 Kennedy Elem (10 bldgs) 1977 1982 53550 547
462 0506 Medford SD 549C JACKSON Medford 549 Jefferson Elem 1955 38185 543
463 0506 Medford SD 549C JACKSON Medford 549 Abraham Lincoln Elem 1996 63438 525
464 0506 Central Point SD 6 JACKSON Centra l Point 6 Ric hardson Elem 1964 32476 516
465 0506 Central Point SD 6 JACKSON Centra l Point 6 Central Point Elem 1908 1947 43421 495
466 0506 Eagle Point SD 9 JACKSON Eagle Point 9 White City Elem 1965 1975 44968 489
467 0506 Medford SD 549C JACKSON Medford 549 Hoover Elem 1958 51611 484
468 0506 Central Point SD 6 JACKSON Centra l Point 6 Jewett Elem 1955 1984 45018 483
469 0506 Eagle Point SD 9 JACKSON Eagle Point 9 Eagle Point Middle 2004 100000 473
470 0506 Phoenix-Talent SD 4 JACKSON Phoenix-Talent 4 Talent Elem 1973 1997 50262 472
471 0506 Eagle Point SD 9 JACKSON Eagle Point 9 Little Butte Sc hool 1928 1958 44760 462
472 0506 Phoenix-Talent SD 4 JACKSON Phoenix-Talent 4 Phoenix Elem 1973 1997 50262 461
473 0506 Medford SD 549C JACKSON Medford 549 Oak Grove Elem (5 b ldgs) 1891 1996 47329 455
474 0506 Medford SD 549C JACKSON Medford 549 Washington Elem 1931 40873 443
475 0506 Rogue River SD 35 JACKSON Rogue River 35 Rogue River High 1975 1978 77578 436
476 0506 Eagle Point SD 9 JACKSON Eagle Point 9 Eagle Rock Elem 2003 38850 401 477 0506 Medford SD 549C JACKSON Medford 549 Jacksonville Elem (3 bldgs) 1954 1990 31832 401
478 0506 Medford SD 549C JACKSON Medford 549 Roosevelt Elem 1912 42433 385
479 0506 Eagle Point SD 9 JACKSON Eagle Point 9 White Mounta in Middle 2003 383
480 0506 Ashland SD 5 JACKSON Ashland 5 Walker Elem 1948 1966 43108 382
481 0506 Medford SD 549C JACKSON Medford 549 Jackson Elem 1912 42433 380
482 0506 Eagle Point SD 9 JACKSON Eagle Point 9 Mountain View Elem 1977 1987 43575 366
483 0506 Phoenix-Talent SD 4 JACKSON Phoenix-Talent 4 Orc hard Hill Elem 1983 50182 354
484 0506 Rogue River SD 35 JACKSON Rogue River 35 Rogue River Elem 1950 1966 31784 329
485 0506 Ashland SD 5 JACKSON Ashland 5 Helman Elem 1965 1974 34812 308
486 0506 Rogue River SD 35 JACKSON Rogue River 35 Rogue River Middle 1920 2002 42158 289
487 0506 Medford SD 549C JACKSON Medford 549 Medford Opportunity High 279
488 0506 Ashland SD 5 JACKSON Ashland 5 Bellview Elem 1952 1977 37744 276
489 0506 Central Point SD 6 JACKSON Centra l Point 6 Hanby Middle 1910 1991 38449 275
490 0506 Eagle Point SD 9 JACKSON Eagle Point 9 Shady Cove Elem 1928 1984 41071 273
491 0506 Central Point SD 6 JACKSON Centra l Point 6 Patrick Elem 1956 1977 35004 268
492 0506 Central Point SD 6 JACKSON Centra l Point 6 Sams Valley Elem 1966 1977 40063 264
493 0506 Medford SD 549C JACKSON Medford 549 Ruc h Elem (3 b ldgs) 1913 1986 20811 191 494 0506 Prospect SD 59 JACKSON Prospec t 59 Prospec t Sc hool 1980 33513 187
495 0506 Rogue River SD 35 JACKSON Rogue River 35 Evans Va lley Elem 1924 1977 23811 154
496 0506 Eagle Point SD 9 JACKSON Eagle Point 9 Elk Trail Elem 1936 1966 24090 136
497 0506 Butte Falls SD 91 JACKSON Butte Fa lls 91 Butte Fa lls Midd le/ High 1926 1997 22716 112
498 0506 Phoenix-Talent SD 4 JACKSON Phoenix-Ta lent 4 Armadillo Technic a l Academy 97
499 0506 Butte Falls SD 91 JACKSON Butte Fa lls 91 Butte Fa lls Elem 1967 1996 21449 84
500 0506 Eagle Point SD 9 JACKSON Eagle Point 9 Lake Creek Lea rning center 1999 7678 50
501 0506 Central Point SD 6 JACKSON Centra l Point 6 CrossRoads Sc hool 46
502 0506 Eagle Point SD 9 JACKSON Eagle Point 9 Eagle Point Alterna tive 37
503 0506 Ashland SD 5 JACKSON Ashland 5 Community Works Lithia Springs Sc hool 29
504 0506 Pinehurst SD 94 JACKSON Pinehurst 94 Pinehurst Elem 1928 4580 23
505 0506 Ashland SD 5 JACKSON Ashland 5 Comm Lea rning Ctr 1932 1977 8553 21
506 0506 Phoenix-Talent SD 4 JACKSON Phoenix-Ta lent 4 Phoenix High Night 17
507 0506 Ashland SD 5 JACKSON Ashland 5 Southern Oregon CSTC 9
508 0506 Central Point SD 6 JACKSON Centra l Point 6 Hazel Midd le Prog 6
509 0506 Jefferson County SD 509J JEFFERSON Jefferson 509J Madras High 1964 84814 916
510 0506 Jefferson County SD 509J JEFFERSON Jefferson 509J Jefferson County Middle 1995 124288 678 511 0506 Jefferson County SD 509J JEFFERSON Jefferson 509J Warm Springs Elem (3 b ldgs) 1938 1964 45105 388
512 0506 Jefferson County SD 509J JEFFERSON Jefferson 509J Madras Elem 1938 1951 52428 277
513 0506 Culver SD 4 JEFFERSON Culver 4 Culver Elem 1997 19533 269
514 0506 Jefferson County SD 509J JEFFERSON Jefferson 509J Buff Elem 2005 261
515 0506 Jefferson County SD 509J JEFFERSON Jefferson 509J Westside Elem 1938 1998 54540 244
516 0506 Jefferson County SD 509J JEFFERSON Jefferson 509J Metolius Elem 1949 2000 31080 237
517 0506 Culver SD 4 JEFFERSON Culver 4 Culver High 1963 1997 23310 196
518 0506 Culver SD 4 JEFFERSON Culver 4 Culver Middle 1997 33400 139
519 0506 Black Butte SD 41 JEFFERSON Blac k Butte 41 Black Butte Elem 1951 1997 4000 14
520 0506 Jefferson County SD 509J JEFFERSON Jefferson 509J Big Muddy Elem 11
521 0506 Ashwood SD 8 JEFFERSON Ashwood 8 Ashwood Elem 1952 2996 6
522 0506 Grants Pass SD 7 JOSEPHINE Grants Pass 7 Grants Pass High (7 bldgs) 1997 1998 277774 1,994
523 0506 Three Rivers/Josephine County SD JOSEPHINE Three Rivers Hidden valley High 1976 1995 145600 858
524 0506 Three Rivers/Josephine County SD JOSEPHINE Three Rivers North Va lley High 1976 1996 136157 732
525 0506 Grants Pass SD 7 JOSEPHINE Grants Pass 7 North Middle (3 bldgs) 1961 86303 670
Appendix A Oregon Seismic Needs Assessment DOGAMI (June 2007)
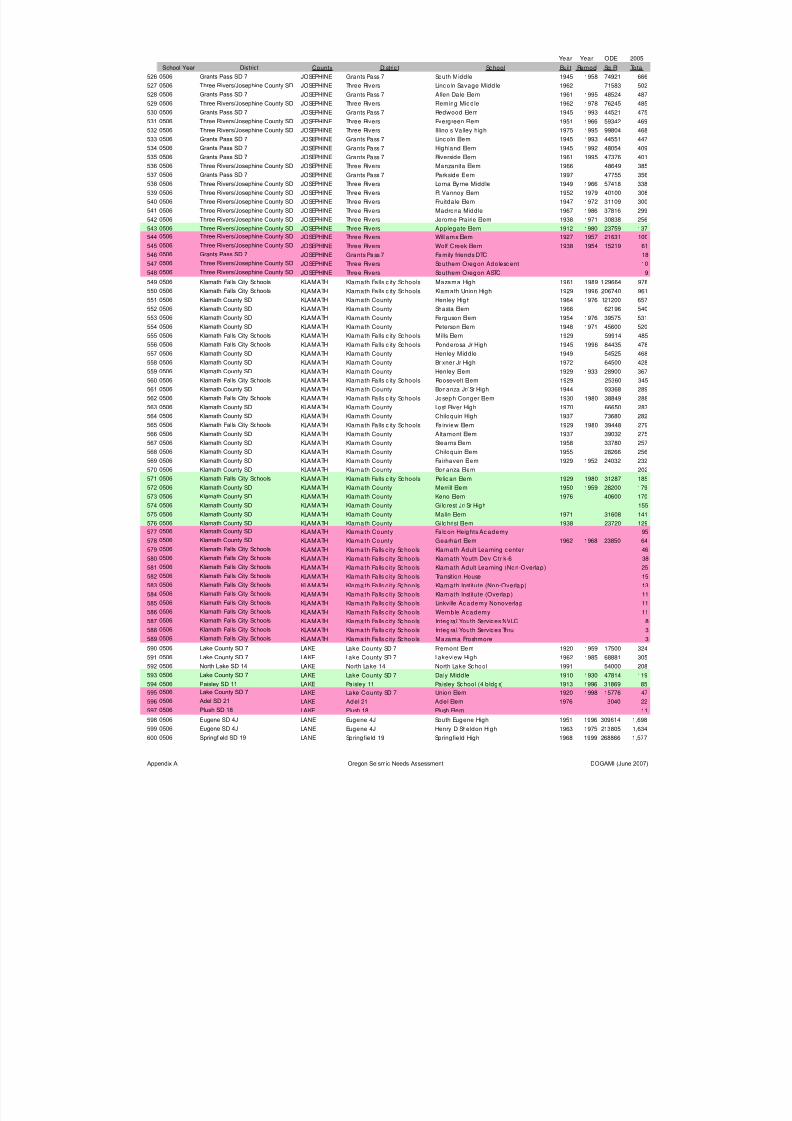
8/3/2019 Statewide Seismic Needs Assessment report
http://slidepdf.com/reader/full/statewide-seismic-needs-assessment-report 72/341
Year Year ODE 2005
School Year District County Distric t School Built Remod Sq Ft Total
526 0506 Grants Pass SD 7 JOSEPHINE Grants Pass 7 South Middle 1945 1958 74921 666
527 0506 Three Rivers/Josephine County SD JOSEPHINE Three Rivers Lincoln Savage Midd le 1962 71583 502
528 0506 Grants Pass SD 7 JOSEPHINE Grants Pass 7 Allen Dale Elem 1961 1995 48524 487
529 0506 Three Rivers/Josephine County SD JOSEPHINE Three Rivers Fleming Middle 1962 1978 76245 485
530 0506 Grants Pass SD 7 JOSEPHINE Grants Pass 7 Redwood Elem 1945 1993 44521 475
531 0506 Three Rivers/Josephine County SD JOSEPHINE Three Rivers Evergreen Elem 1951 1966 59342 469
532 0506 Three Rivers/Josephine County SD JOSEPHINE Three Rivers Illinois Valley high 1975 1995 99804 468
533 0506 Grants Pass SD 7 JOSEPHINE Grants Pass 7 Lincoln Elem 1945 1993 44551 447
534 0506 Grants Pass SD 7JOSEPHINE Grants Pass 7 Highland Elem 1945 1992 48054 409
535 0506 Grants Pass SD 7 JOSEPHINE Grants Pass 7 Riverside Elem 1961 1995 47376 401
536 0506 Three Rivers/Josephine County SD JOSEPHINE Three Rivers Manzanita Elem 1966 48649 385
537 0506 Grants Pass SD 7 JOSEPHINE Grants Pass 7 Parkside Elem 1997 47755 356
538 0506 Three Rivers/Josephine County SD JOSEPHINE Three Rivers Lorna Byrne Midd le 1949 1966 57418 338
539 0506 Three Rivers/Josephine County SD JOSEPHINE Three Rivers Ft Vannoy Elem 1952 1979 40100 308
540 0506 Three Rivers/Josephine County SD JOSEPHINE Three Rivers Fruitdale Elem 1947 1972 31109 300
541 0506 Three Rivers/Josephine County SD JOSEPHINE Three Rivers Madrona Midd le 1967 1986 37816 299
542 0506 Three Rivers/Josephine County SD JOSEPHINE Three Rivers Jerome Prairie Elem 1938 1971 30838 256
543 0506 Three Rivers/Josephine County SD JOSEPHINE Three Rivers Applegate Elem 1912 1980 23759 137
544 0506 Three Rivers/Josephine County SD JOSEPHINE Three Rivers Williams Elem 1927 1957 21631 100
545 0506 Three Rivers/Josephine County SD JOSEPHINE Three Rivers Wolf Creek Elem 1938 1954 15219 61
546 0506 Grants Pass SD 7 JOSEPHINE Grants Pass 7 Family friends DTC 18
547 0506 Three Rivers/Josephine County SD JOSEPHINE Three Rivers Southern Oregon Adolesc ent 10
548 0506 Three Rivers/Josephine County SD JOSEPHINE Three Rivers Southern Oregon ASTC 9
549 0506 Klamath Falls City Schools KLAMATH Klamath Falls c ity Sc hools Mazama High 1961 1989 129664 978
550 0506 Klamath Falls City Schools KLAMATH Klamath Falls c ity Sc hools Klamath Union High 1929 1996 206740 961
551 0506 Klamath County SD KLAMATH Klamath County Henley High 1964 1976 121200 657 552 0506 Klamath County SD KLAMATH Klamath County Shasta Elem 1966 62196 540
553 0506 Klamath County SD KLAMATH Klamath County Ferguson Elem 1954 1976 39575 531
554 0506 Klamath County SD KLAMATH Klamath County Peterson Elem 1948 1971 45600 520
555 0506 Klamath Falls City Schools KLAMATH Klamath Falls c ity Sc hools Mills Elem 1929 59914 485
556 0506 Klamath Falls City Schools KLAMATH Klamath Falls c ity Sc hools Ponderosa Jr High 1945 1996 84435 478
557 0506 Klamath County SD KLAMATH Klamath County Henley Middle 1949 54525 468
558 0506 Klamath County SD KLAMATH Klamath County Brixner Jr High 1972 64500 428
559 0506 Klamath County SD KLAMATH Klamath County Henley Elem 1929 1933 28900 367
560 0506 Klamath Falls City Schools KLAMATH Klamath Falls c ity Sc hools Roosevelt Elem 1929 25360 345
561 0506 Klamath County SD KLAMATH Klamath County Bonanza Jr/ Sr High 1944 93368 289
562 0506 Klamath Falls City Schools KLAMATH Klamath Falls c ity Sc hools Joseph Conger Elem 1930 1980 38849 288
563 0506 Klamath County SD KLAMATH Klamath County Lost River High 1970 66650 287
564 0506 Klamath County SD KLAMATH Klamath County Chiloquin High 1937 73680 282
565 0506 Klamath Falls City Schools KLAMATH Klamath Falls c ity Sc hools Fa irview Elem 1929 1980 39448 279
566 0506 Klamath County SD KLAMATH Klamath County Altamont Elem 1937 39032 275
567 0506 Klamath County SD KLAMATH Klamath County Stearns Elem 1958 33780 257
568 0506 Klamath County SD KLAMATH Klamath County Chiloquin Elem 1955 28266 256 569 0506 Klamath County SD KLAMATH Klamath County Fa irhaven Elem 1929 1952 24032 232
570 0506 Klamath County SD KLAMATH Klamath County Bonanza Elem 202
571 0506 Klamath Falls City Schools KLAMATH Klamath Falls c ity Sc hools Pelic an Elem 1929 1980 31287 185
572 0506 Klamath County SD KLAMATH Klamath County Merrill Elem 1950 1959 28200 179
573 0506 Klamath County SD KLAMATH Klamath County Keno Elem 1976 40600 170
574 0506 Klamath County SD KLAMATH Klamath County Gilc rest Jr/ Sr High 155
575 0506 Klamath County SD KLAMATH Klamath County Malin Elem 1971 31608 141
576 0506 Klamath County SD KLAMATH Klamath County Gilc hrist Elem 1938 23720 129
577 0506 Klamath County SD KLAMATH Klama th County Fa lcon Heights Ac ademy 95
578 0506 Klamath County SD KLAMATH Klama th County Gearhart Elem 1962 1968 23850 64
579 0506 Klamath Falls City Schools KLAMATH Klama th Fa lls c ity Sc hools Klamath Adult Lea rning center 46
580 0506 Klamath Falls City Schools KLAMATH Klama th Fa lls c ity Sc hools Klamath Youth Dev Ctr k-6 38
581 0506 Klamath Falls City Schools KLAMATH Klama th Fa lls c ity Sc hools Klamath Adult Lea rning (Non-Overlap) 25
582 0506 Klamath Falls City Schools KLAMATH Klama th Fa lls c ity Sc hools Transition House 15
583 0506 Klamath Falls City Schools KLAMATH Klama th Fa lls c ity Sc hools Klamath Institute (Non-Overlap) 13
584 0506 Klamath Falls City Schools KLAMATH Klama th Fa lls c ity Sc hools Klamath Institute (Overlap ) 11
5850506 Klamath Falls City Schools
KLAMATH Klama th Fa lls c ity Sc hools Linkville Ac ademy Nonoverlap 11 586 0506 Klamath Falls City Schools KLAMATH Klama th Fa lls c ity Sc hools Wemble Academy 11
587 0506 Klamath Falls City Schools KLAMATH Klama th Fa lls c ity Sc hools Integra l Youth Services NVLC 8
588 0506 Klamath Falls City Schools KLAMATH Klama th Fa lls c ity Sc hools Integra l Youth Services Thru 3
589 0506 Klamath Falls City Schools KLAMATH Klama th Fa lls c ity Sc hools Mazama Froshmore 3
590 0506 Lake County SD 7 LAKE Lake County SD 7 Fremont Elem 1920 1959 17500 324
591 0506 Lake County SD 7 LAKE Lake County SD 7 Lakeview High 1962 1985 68881 305
592 0506 North Lake SD 14 LAKE North Lake 14 North Lake Sc hool 1991 54000 208
593 0506 Lake County SD 7 LAKE Lake County SD 7 Daly Midd le 1910 1930 47814 119
594 0506 Paisley SD 11 LAKE Paisley 11 Paisley School (4 b ldgs) 1913 1996 31869 85
595 0506 Lake County SD 7 LAKE Lake County SD 7 Union Elem 1920 1998 15776 47
596 0506 Adel SD 21 LAKE Adel 21 Adel Elem 1976 3040 22
597 0506 Plush SD 18 LAKE Plush 18 Plush Elem 11
598 0506 Eugene SD 4J LANE Eugene 4J South Eugene High 1951 1996 309614 1,698
599 0506 Eugene SD 4J LANE Eugene 4J Henry D Sheldon High 1963 1975 213805 1,634
600 0506 Springfield SD 19 LANE Springfield 19 Springfield High 1968 1999 268866 1,577
Appendix A Oregon Seismic Needs Assessment DOGAMI (June 2007)

8/3/2019 Statewide Seismic Needs Assessment report
http://slidepdf.com/reader/full/statewide-seismic-needs-assessment-report 73/341
Year Year ODE 2005
School Year District County Distric t School Built Remod Sq Ft Total
601 0506 Springfield SD 19 LANE Springfield 19 Thurston High 1959 1997 290210 1,514
602 0506 Bethel SD 52 LANE Bethel 52 Willamette High 1948 1981 249910 1,492
603 0506 Eugene SD 4J LANE Eugene 4J Winston Churchill High 1966 1977 232466 1,330
604 0506 Eugene SD 4J LANE Eugene 4J North Eugene High 1957 1977 212181 1,215
605 0506 South Lane SD 45J3 LANE South Lane 45J Cottage Grove High 1940 1990 117912 892
606 0506 Eugene SD 4J LANE Eugene 4J Theodore Roosevelt Middle 1950 1986 105770 672
607 0506 Bethel SD 52 LANE Bethel 52 Meadow View Sc hool 1998 114798 668
608 0506 Bethel SD 52 LANE Bethel 52 Prairie Mountain Sc hool 2002 641
609 0506 Eugene SD 4JLANE Eugene 4J James Monroe Middle 1965 1966 81051 634
610 0506 Junction City SD 69 LANE Junc tion City 69 Junc tion City High (2 wings) 1937 1998 205500 630
611 0506 Springfield SD 19 LANE Springfield 19 Agnes Stewart Middle 1997 94000 612
612 0506 Eugene SD 4J LANE Eugene 4J Bertha Holt Elem 2004 67400 587
613 0506 Eugene SD 4J LANE Eugene 4J Cal Young Middle 1952 1980 87591 577
614 0506 Siuslaw SD 97J LANE Siuslaw 97J Suislaw Elem 1994 76435 573
615 0506 Siuslaw SD 97J LANE Siuslaw 97J Siuslaw High 1970 1990 109747 572
616 0506 Creswell SD 40 LANE Creswell 40 Creslane Elem (4 b ldgs) 1950 1982 35370 561
617 0506 South Lane SD 45J3 LANE South Lane 45J Lincoln Midd le 1963 1990 91698 560
618 0506 Junction City SD 69 LANE Junc tion City 69 Laurel Elem 1949 1996 53102 558
619 0506 Springfield SD 19 LANE Springfield 19 Briggs Midd le 1963 93303 553
620 0506 Springfield SD 19 LANE Springfield 19 Thurston Midd le 1953 1990 72212 542
621 0506 Eugene SD 4J LANE Eugene 4J Gilham Elem 1966 1995 74500 535
622 0506 Springfield SD 19 LANE Springfield 19 Mt Vernon Elem 1997 58000 531
623 0506 Eugene SD 4J LANE Eugene 4J Colin Kelly Middle 1945 1995 112356 522
624 0506 Junction City SD 69 LANE Junc tion City 69 Oaklea Middle 1976 1996 84700 514
625 0506 Fern Ridge SD 28J LANE Fern Ridge 28J Elmira High (5+ bldgs) 1961 2000 97688 509
626 0506 Eugene SD 4J LANE Eugene 4J John F Kennedy Middle 1965 1967 80532 487 627 0506 Eugene SD 4J LANE Eugene 4J Awbrey Park Elem 1967 1971 56816 472
628 0506 South Lane SD 45J3 LANE South Lane 45J Bohemia Elem 1976 1989 53411 469
629 0506 Springfield SD 19 LANE Springfield 19 Thurston Elem 1950 1987 43674 462
630 0506 Bethel SD 52 LANE Bethel 52 Shasta Middle 1962 1996 79506 457
631 0506 Springfield SD 19 LANE Springfield 19 Elizabeth Page Elem 1953 1956 38283 453
632 0506 Eugene SD 4J LANE Eugene 4J Spencer Butte Middle 1960 1965 82414 447
633 0506 Springfield SD 19 LANE Springfield 19 Hamlin Middle 1957 1990 83881 445
634 0506 Bethel SD 52 LANE Bethel 52 Irving Elem 1965 1972 8350 444
635 0506 Springfield SD 19 LANE Springfield 19 Douglas Gardens Elem 1963 1990 50321 443
636 0506 Springfield SD 19 LANE Springfield 19 Centennial Elem 1963 1991 64868 427
637 0506 Springfield SD 19 LANE Springfield 19 Yolanda Elem 1963 1969 45121 426
638 0506 Springfield SD 19 LANE Springfield 19 Ridgeview Elem 1981 1987 62930 424
639 0506 Eugene SD 4J LANE Eugene 4J Spring Creek Elem 1964 1966 37569 421
640 0506 Eugene SD 4J LANE Eugene 4J McCornack Elem 1968 1996 49133 419
641 0506 Eugene SD 4J LANE Eugene 4J James Madison Middle 1963 1967 72528 414
642 0506 Fern Ridge SD 28J LANE Fern Ridge 28J Fern Ridge Middle 1961 1999 94036 396
643 0506 Springfield SD 19 LANE Springfield 19 Riverbend Elem 1997 58000 395 644 0506 Bethel SD 52 LANE Bethel 52 Casc ade Middle 1955 1980 5030 393
645 0506 Bethel SD 52 LANE Bethel 52 Fairfield Elem 1952 1999 38172 390
646 0506 Pleasant Hill SD 1 LANE Pleasant Hill 1 Pleasant Hill High 1961 1982 80180 387
647 0506 Bethel SD 52 LANE Bethel 52 Clear lake Elem 1977 51911 380
648 0506 Springfield SD 19 LANE Springfield 19 Guy Lee Elem 1961 1989 49610 377
649 0506 Eugene SD 4J LANE Eugene 4J Cesar E Chavez Elem 2004 67400 367
650 0506 Bethel SD 52 LANE Bethel 52 Danebo Elem 1966 1991 11000 355
651 0506 Creswell SD 40 LANE Creswell 40 Creswell High (3 bldgs) 1967 2001 103098 354
652 0506 Siuslaw SD 97J LANE Siuslaw 97J Siuslaw Middle 2001 111616 352
653 0506 South Lane SD 45J3 LANE South Lane 45J Harrison Elem 1948 1990 39348 352
654 0506 Springfield SD 19 LANE Springfield 19 Maple Elem 1947 1991 41706 327
655 0506 Eugene SD 4J LANE Eugene 4J River Road Elem 1953 1968 50381 314
656 0506 Eugene SD 4J LANE Eugene 4J Howard Elem 1949 1968 45775 313
657 0506 Eugene SD 4J LANE Eugene 4J Yujin Gakuen 1961 1969 22220 309
658 0506 Pleasant Hill SD 1 LANE Pleasant Hill 1 Pleasant Hill Middle 1930 1985 43451 305
659 0506 Fern Ridge SD 28J LANE Fern Ridge 28J Veneta Elem 1945 2001 44283 303
660 0506 Eugene SD 4J LANE Eugene 4J Fox Hollow French immersion 1967 27872 301 661 0506 Bethel SD 52 LANE Bethel 52 Malabon Elem (2 bldgs) 1954 1991 27300 295
662 0506 Springfield SD 19 LANE Springfield 19 Springfield Middle 1950 1990 70389 293
663 0506 Springfield SD 19 LANE Springfield 19 Moffitt Elem 1950 1993 41910 292
664 0506 Eugene SD 4J LANE Eugene 4J Edison Elem 1926 1962 42195 287
665 0506 Fern Ridge SD 28J LANE Fern Ridge 28J Elmira Elem 1945 2001 36486 287
666 0506 Creswell SD 40 LANE Creswell 40 Creswell Midd le (3 bldgs) 1941 1950 24185 271
667 0506 Oakridge SD 76 LANE Oakridge 76 Oakridge Elem 1948 1999 48960 270
668 0506 Eugene SD 4J LANE Eugene 4J Thomas Jefferson Middle 1957 1968 80190 266
669 0506 Eugene SD 4J LANE Eugene 4J Willagillespie Elem 1925 1996 57500 266
670 0506 Eugene SD 4J LANE Eugene 4J Corridor Alternative 1961 1969 22220 263
671 0506 Pleasant Hill SD 1 LANE Pleasant Hill 1 Trent Elem 1929 1998 31212 261
672 0506 Springfield SD 19 LANE Springfield 19 Brattain Elem 1925 1990 27746 254
673 0506 Eugene SD 4J LANE Eugene 4J Twin Oaks Elem 1958 1968 33910 252
674 0506 Oakridge SD 76 LANE Oakridge 76 Oakridge High 1957 1998 104546 252
675 0506 Eugene SD 4J LANE Eugene 4J Buena Vista Spanish Immersion 1960 1968 24792 250
Appendix A Oregon Seismic Needs Assessment DOGAMI (June 2007)
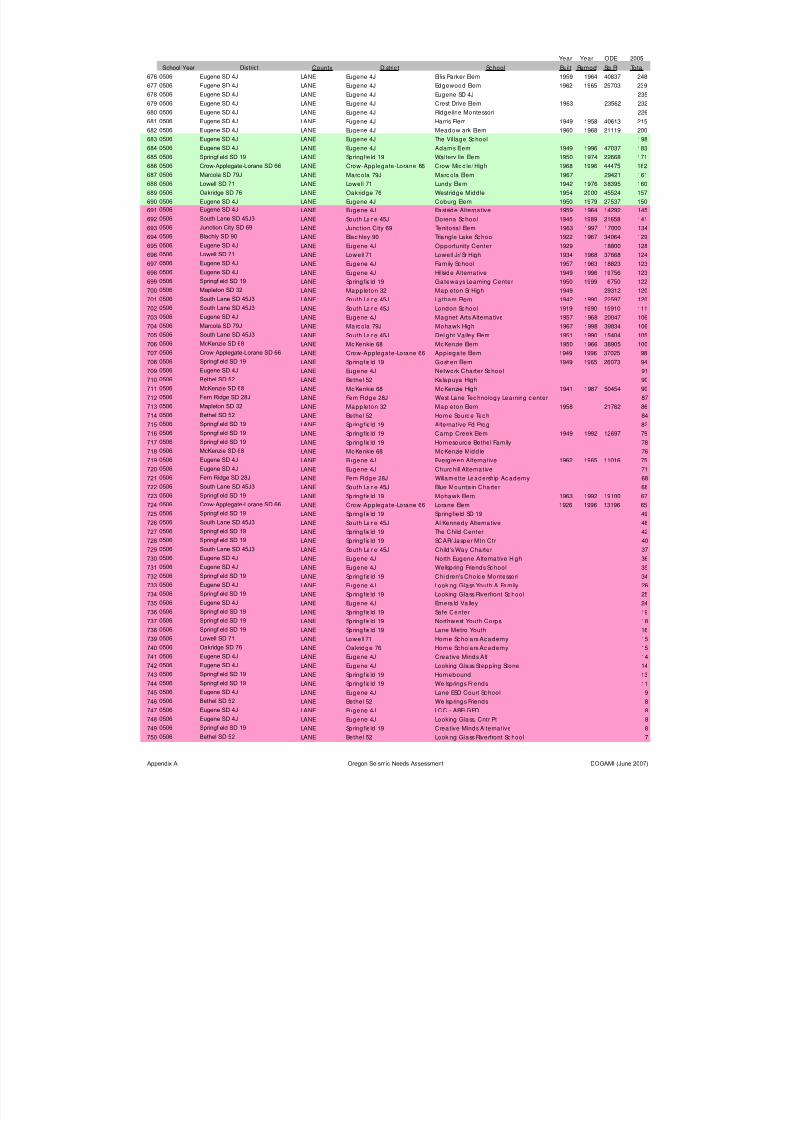
8/3/2019 Statewide Seismic Needs Assessment report
http://slidepdf.com/reader/full/statewide-seismic-needs-assessment-report 74/341
Year Year ODE 2005
School Year District County Distric t School Built Remod Sq Ft Total
676 0506 Eugene SD 4J LANE Eugene 4J Ellis Parker Elem 1959 1964 40837 248
677 0506 Eugene SD 4J LANE Eugene 4J Edgewood Elem 1962 1965 25703 239
678 0506 Eugene SD 4J LANE Eugene 4J Eugene SD 4J 235
679 0506 Eugene SD 4J LANE Eugene 4J Crest Drive Elem 1963 23562 232
680 0506 Eugene SD 4J LANE Eugene 4J Ridgeline Montessori 226
681 0506 Eugene SD 4J LANE Eugene 4J Harris Elem 1949 1958 40613 215
682 0506 Eugene SD 4J LANE Eugene 4J Meadowlark Elem 1960 1968 21119 200
683 0506 Eugene SD 4J LANE Eugene 4J The Village School 198
684 0506 Eugene SD 4JLANE Eugene 4J Adams Elem 1949 1996 47037 183
685 0506 Springfield SD 19 LANE Springfield 19 Walterville Elem 1950 1974 22668 171
686 0506 Crow-Applegate-Lorane SD 66 LANE Crow-Applegate-Lorane 66 Crow Midd le/ High 1968 1996 44475 162
687 0506 Marcola SD 79J LANE Marcola 79J Marc ola Elem 1967 29421 161
688 0506 Lowell SD 71 LANE Lowell 71 Lundy Elem 1942 1976 38395 160
689 0506 Oakridge SD 76 LANE Oakridge 76 Westridge Midd le 1954 2000 45524 157
690 0506 Eugene SD 4J LANE Eugene 4J Coburg Elem 1950 1979 27537 150
691 0506 Eugene SD 4J LANE Eugene 4J Eastside Alternative 1959 1964 14292 145
692 0506 South Lane SD 45J3 LANE South Lane 45J Dorena School 1945 1989 21658 141
693 0506 Junction City SD 69 LANE Junc tion City 69 Territoria l Elem 1963 1997 17000 134
694 0506 Blachly SD 90 LANE Blac hley 90 Triang le Lake School 1922 1967 34064 129
695 0506 Eugene SD 4J LANE Eugene 4J Opportunity Center 1929 18800 128
696 0506 Lowell SD 71 LANE Lowell 71 Lowell Jr/ Sr High 1934 1968 37668 124
697 0506 Eugene SD 4J LANE Eugene 4J Family Sc hool 1957 1963 18823 123
698 0506 Eugene SD 4J LANE Eugene 4J Hillside Alternative 1949 1996 19756 123
699 0506 Springfield SD 19 LANE Springfield 19 Gateways Learning Center 1950 1999 6750 122
700 0506 Mapleton SD 32 LANE Mappleton 32 Mapleton Sr High 1949 29312 120
701 0506 South Lane SD 45J3 LANE South Lane 45J Latham Elem 1942 1990 22597 120
702 0506 South Lane SD 45J3 LANE South Lane 45J London Sc hool 1919 1990 15910 111
703 0506 Eugene SD 4J LANE Eugene 4J Magnet Arts Alternative 1957 1968 20047 106
704 0506 Marcola SD 79J LANE Marcola 79J Mohawk High 1967 1998 39834 106
705 0506 South Lane SD 45J3 LANE South Lane 45J Delight Va lley Elem 1951 1990 15404 105
706 0506 McKenzie SD 68 LANE Mc Kenkie 68 McKenzie Elem 1950 1966 38905 100
707 0506 Crow-Applegate-Lorane SD 66 LANE Crow-Applegate-Lorane 66 Applegate Elem 1949 1996 37025 98
708 0506 Springfield SD 19 LANE Springfield 19 Goshen Elem 1949 1965 26073 94
709 0506 Eugene SD 4J LANE Eugene 4J Network Charter School 91
710 0506 Bethel SD 52 LANE Bethel 52 Kalapuya High 90
711 0506 McKenzie SD 68 LANE Mc Kenkie 68 McKenzie High 1941 1987 50454 90
712 0506 Fern Ridge SD 28J LANE Fern Ridge 28J West Lane Tec hnology Learning c enter 87
713 0506 Mapleton SD 32 LANE Mappleton 32 Mapleton Elem 1958 21762 86
714 0506 Bethel SD 52 LANE Bethel 52 Home Sourc e Tec h 84
715 0506 Springfield SD 19 LANE Springfield 19 Alternative Ed Prog 82
716 0506 Springfield SD 19 LANE Springfield 19 Camp Creek Elem 1949 1992 12697 79
717 0506 Springfield SD 19 LANE Springfield 19 Homesource Bethel Family 78
718 0506 McKenzie SD 68 LANE Mc Kenkie 68 McKenzie Midd le 76
719 0506 Eugene SD 4J LANE Eugene 4J Evergreen Alternative 1962 1965 11016 75
720 0506 Eugene SD 4J LANE Eugene 4J Churc hill Alternative 71
721 0506 Fern Ridge SD 28J LANE Fern Ridge 28J Willamette Leadership Ac ademy 68
722 0506 South Lane SD 45J3 LANE South Lane 45J Blue Mounta in Charter 68
723 0506 Springfield SD 19 LANE Springfield 19 Mohawk Elem 1963 1992 19100 67
724 0506 Crow-Applegate-Lorane SD 66 LANE Crow-Applegate-Lorane 66 Lorane Elem 1926 1996 13196 65
725 0506 Springfield SD 19 LANE Springfield 19 Springfield SD 19 49
726 0506 South Lane SD 45J3 LANE South Lane 45J Al Kennedy Alterna tive 48
727 0506 Springfield SD 19 LANE Springfield 19 The Child Center 42
728 0506 Springfield SD 19 LANE Springfield 19 SCAR/ Jasper Mtn Ctr 40
729 0506 South Lane SD 45J3 LANE South Lane 45J Child 's Way Charter 37
730 0506 Eugene SD 4J LANE Eugene 4J North Eugene Alternative High 36
731 0506 Eugene SD 4J LANE Eugene 4J Wellspring Friends Sc hool 35
732 0506 Springfield SD 19 LANE Springfield 19 Child ren's Choic e Montessori 34
733 0506 Eugene SD 4J LANE Eugene 4J Looking Glass Youth & Family 26
734 0506 Springfield SD 19 LANE Springfield 19 Looking Glass Riverfront Sc hool 25
7350506 Eugene SD 4J
LANE Eugene 4J Emera ld Va lley 24 736 0506 Springfield SD 19 LANE Springfield 19 Safe Center 19
737 0506 Springfield SD 19 LANE Springfield 19 Northwest Youth Corps 18
738 0506 Springfield SD 19 LANE Springfield 19 Lane Metro Youth 16
739 0506 Lowell SD 71 LANE Lowell 71 Home Scholars Academy 15
740 0506 Oakridge SD 76 LANE Oakridge 76 Home Scholars Academy 15
741 0506 Eugene SD 4J LANE Eugene 4J Creative Minds Alt 14
742 0506 Eugene SD 4J LANE Eugene 4J Looking Glass Stepp ing Stone 14
743 0506 Springfield SD 19 LANE Springfield 19 Homebound 13
744 0506 Springfield SD 19 LANE Springfield 19 Wellsprings Friends 11
745 0506 Eugene SD 4J LANE Eugene 4J Lane ESD Court Sc hool 9
746 0506 Bethel SD 52 LANE Bethel 52 Wellsprings Friends 8
747 0506 Eugene SD 4J LANE Eugene 4J LCC - ABE/ GED 8
748 0506 Eugene SD 4J LANE Eugene 4J Looking Glass, Cntr Pt 8
749 0506 Springfield SD 19 LANE Springfield 19 Creative Minds Alterna tive 8
750 0506 Bethel SD 52 LANE Bethel 52 Looking Glass Riverfront Sc hool 7
Appendix A Oregon Seismic Needs Assessment DOGAMI (June 2007)
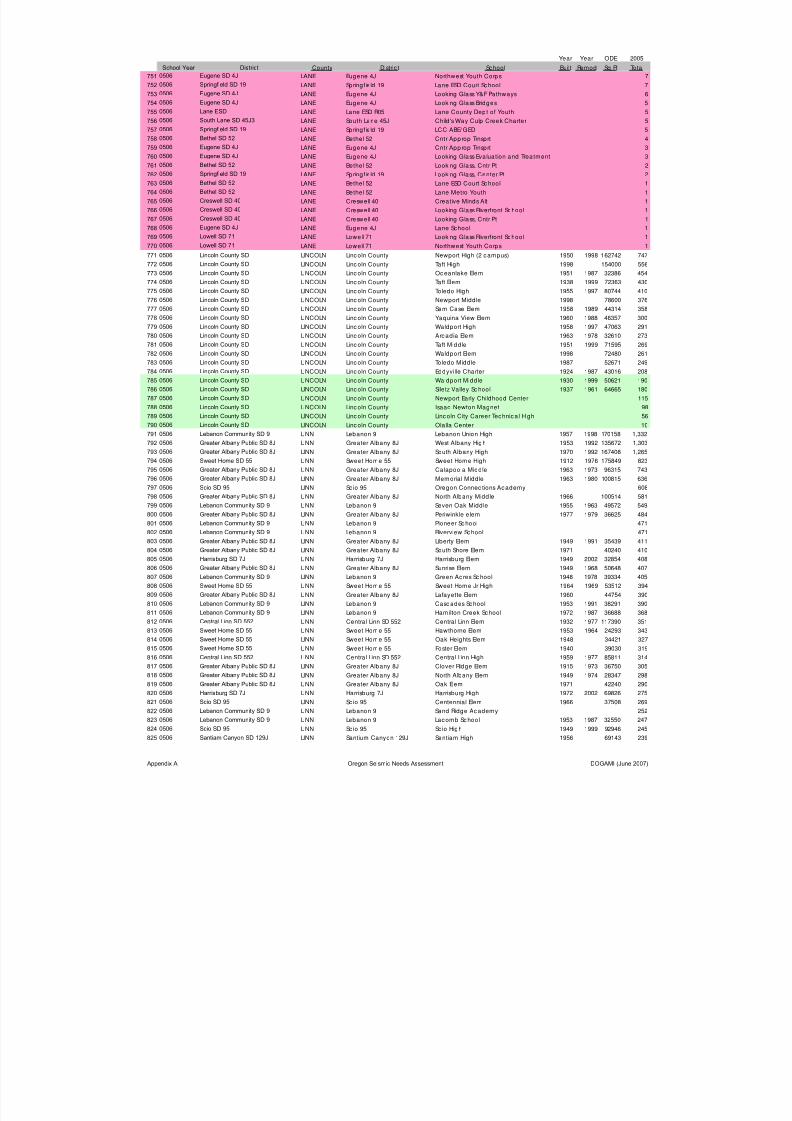
8/3/2019 Statewide Seismic Needs Assessment report
http://slidepdf.com/reader/full/statewide-seismic-needs-assessment-report 75/341
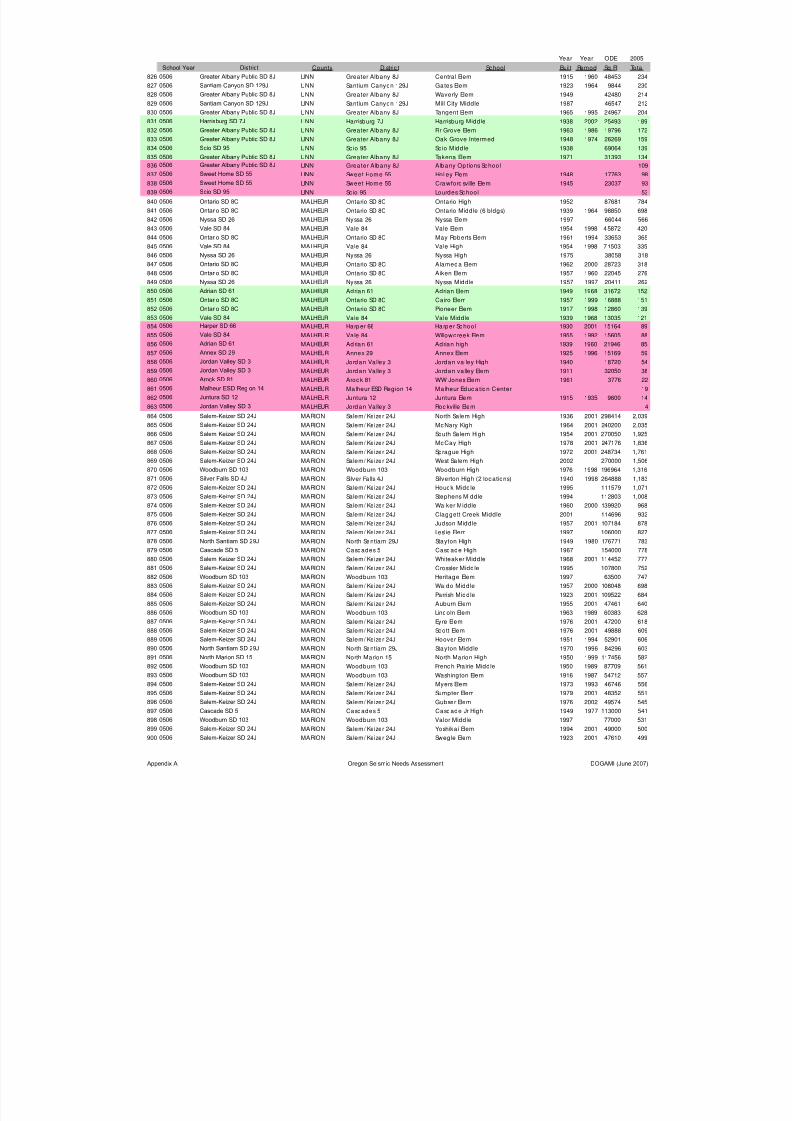
8/3/2019 Statewide Seismic Needs Assessment report
http://slidepdf.com/reader/full/statewide-seismic-needs-assessment-report 76/341
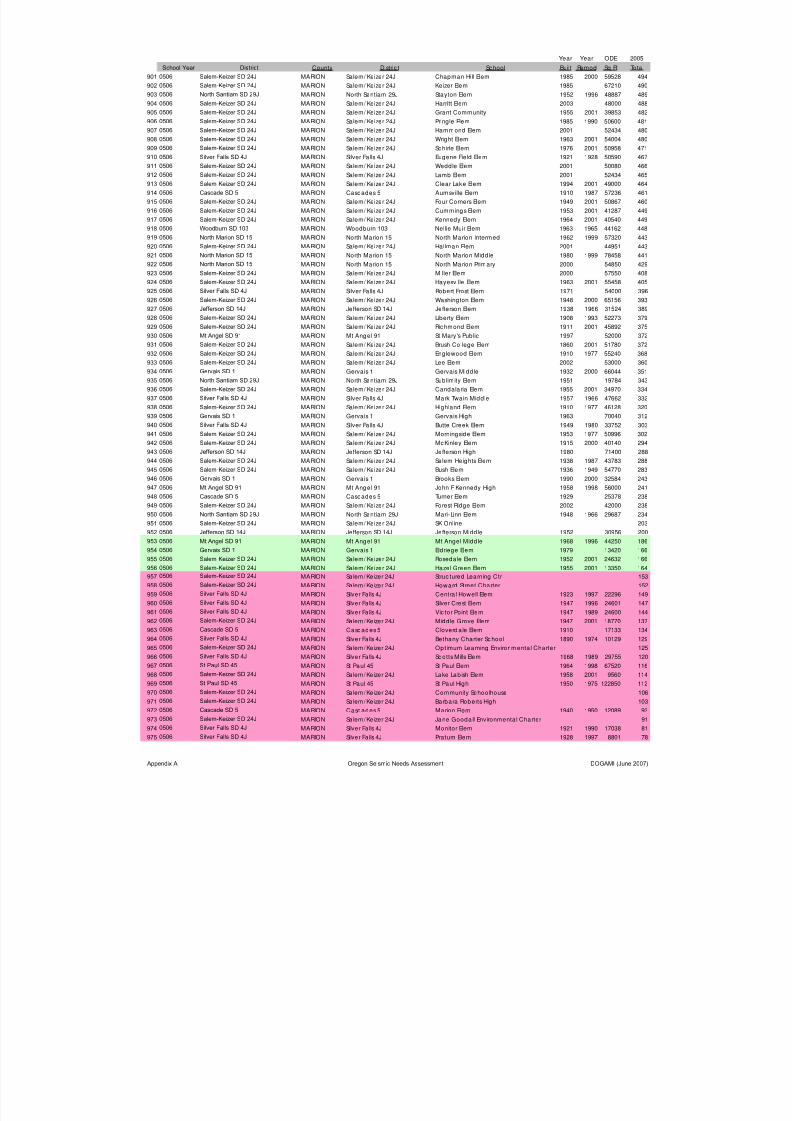
8/3/2019 Statewide Seismic Needs Assessment report
http://slidepdf.com/reader/full/statewide-seismic-needs-assessment-report 77/341
Year Year ODE 2005
School Year District County Distric t School Built Remod Sq Ft Total
901 0506 Salem-Keizer SD 24J MARION Salem/ Keizer 24J Chapman Hill Elem 1985 2000 59528 494
902 0506 Salem-Keizer SD 24J MARION Salem/ Keizer 24J Keizer Elem 1985 67210 490
903 0506 North Santiam SD 29J MARION North Santiam 29J Stayton Elem 1952 1996 48887 489
904 0506 Salem-Keizer SD 24J MARION Salem/ Keizer 24J Harritt Elem 2003 48000 488
905 0506 Salem-Keizer SD 24J MARION Salem/ Keizer 24J Grant Community 1955 2001 39853 482
906 0506 Salem-Keizer SD 24J MARION Salem/ Keizer 24J Pringle Elem 1985 1990 50600 481
907 0506 Salem-Keizer SD 24J MARION Salem/ Keizer 24J Hammond Elem 2001 52434 480
908 0506 Salem-Keizer SD 24J MARION Salem/ Keizer 24J Wright Elem 1963 2001 54004 480
909 0506 Salem-Keizer SD 24JMARION Salem/ Keizer 24J Schirle Elem 1976 2001 50958 471
910 0506 Silver Falls SD 4J MARION Silver Falls 4J Eugene Field Elem 1921 1928 50590 467
911 0506 Salem-Keizer SD 24J MARION Salem/ Keizer 24J Weddle Elem 2001 50080 466
912 0506 Salem-Keizer SD 24J MARION Salem/ Keizer 24J Lamb Elem 2001 52434 465
913 0506 Salem-Keizer SD 24J MARION Salem/ Keizer 24J Clear Lake Elem 1994 2001 49000 464
914 0506 Cascade SD 5 MARION Cascades 5 Aumsville Elem 1910 1987 57236 461
915 0506 Salem-Keizer SD 24J MARION Salem/ Keizer 24J Four Corners Elem 1949 2001 50867 460
916 0506 Salem-Keizer SD 24J MARION Salem/ Keizer 24J Cummings Elem 1953 2001 41287 449
917 0506 Salem-Keizer SD 24J MARION Salem/ Keizer 24J Kennedy Elem 1964 2001 40540 449
918 0506 Woodburn SD 103 MARION Woodburn 103 Nellie Muir Elem 1963 1965 44162 448
919 0506 North Marion SD 15 MARION North Marion 15 North Marion Intermed 1962 1999 57320 443
920 0506 Salem-Keizer SD 24J MARION Salem/ Keizer 24J Hallman Elem 2001 44951 443
921 0506 North Marion SD 15 MARION North Marion 15 North Marion Middle 1980 1999 78458 441
922 0506 North Marion SD 15 MARION North Marion 15 North Marion Primary 2000 54850 429
923 0506 Salem-Keizer SD 24J MARION Salem/ Keizer 24J Miller Elem 2000 57550 408
924 0506 Salem-Keizer SD 24J MARION Salem/ Keizer 24J Hayesville Elem 1963 2001 55458 405
925 0506 Silver Falls SD 4J MARION Silver Falls 4J Robert Frost Elem 1971 54000 396
926 0506 Salem-Keizer SD 24J MARION Salem/ Keizer 24J Washington Elem 1948 2000 65156 393 927 0506 Jefferson SD 14J MARION Jefferson SD 14J Jefferson Elem 1938 1966 31524 389
928 0506 Salem-Keizer SD 24J MARION Salem/ Keizer 24J Liberty Elem 1908 1993 52273 379
929 0506 Salem-Keizer SD 24J MARION Salem/ Keizer 24J Ric hmond Elem 1911 2001 45892 375
930 0506 Mt Angel SD 91 MARION Mt Angel 91 St Mary's Pub lic 1997 52000 372
931 0506 Salem-Keizer SD 24J MARION Salem/ Keizer 24J Brush College Elem 1860 2001 51780 372
932 0506 Salem-Keizer SD 24J MARION Salem/ Keizer 24J Englewood Elem 1910 1977 55240 368
933 0506 Salem-Keizer SD 24J MARION Salem/ Keizer 24J Lee Elem 2002 53000 360
934 0506 Gervais SD 1 MARION Gervais 1 Gervais Middle 1932 2000 66044 351
935 0506 North Santiam SD 29J MARION North Santiam 29J Sublimity Elem 1951 19784 343
936 0506 Salem-Keizer SD 24J MARION Salem/ Keizer 24J Candalaria Elem 1955 2001 34970 334
937 0506 Silver Falls SD 4J MARION Silver Falls 4J Mark Twain Middle 1957 1966 47662 332
938 0506 Salem-Keizer SD 24J MARION Salem/ Keizer 24J Highland Elem 1910 1977 46128 320
939 0506 Gervais SD 1 MARION Gervais 1 Gervais High 1963 70040 312
940 0506 Silver Falls SD 4J MARION Silver Falls 4J Butte Creek Elem 1949 1980 33752 303
941 0506 Salem-Keizer SD 24J MARION Salem/ Keizer 24J Morningside Elem 1953 1977 50996 302
942 0506 Salem-Keizer SD 24J MARION Salem/ Keizer 24J McKinley Elem 1915 2000 40140 294
943 0506 Jefferson SD 14J MARION Jefferson SD 14J Jefferson High 1980 71400 288 944 0506 Salem-Keizer SD 24J MARION Salem/ Keizer 24J Salem Heights Elem 1938 1987 43783 288
945 0506 Salem-Keizer SD 24J MARION Salem/ Keizer 24J Bush Elem 1936 1949 54770 283
946 0506 Gervais SD 1 MARION Gervais 1 Brooks Elem 1990 2000 32584 243
947 0506 Mt Angel SD 91 MARION Mt Angel 91 John F Kennedy High 1958 1998 56000 241
948 0506 Cascade SD 5 MARION Cascades 5 Turner Elem 1929 25378 238
949 0506 Salem-Keizer SD 24J MARION Salem/ Keizer 24J Forest Ridge Elem 2002 42000 238
950 0506 North Santiam SD 29J MARION North Santiam 29J Mari-Linn Elem 1948 1966 29687 234
951 0506 Salem-Keizer SD 24J MARION Salem/ Keizer 24J SK Online 203
952 0506 Jefferson SD 14J MARION Jefferson SD 14J Jefferson Middle 1952 30956 200
953 0506 Mt Angel SD 91 MARION Mt Angel 91 Mt Angel Middle 1968 1996 44250 186
954 0506 Gervais SD 1 MARION Gervais 1 Eldriege Elem 1979 13420 166
955 0506 Salem-Keizer SD 24J MARION Salem/ Keizer 24J Rosedale Elem 1952 2001 24632 166
956 0506 Salem-Keizer SD 24J MARION Salem/ Keizer 24J Hazel Green Elem 1955 2001 13350 164
957 0506 Salem-Keizer SD 24J MARION Salem/ Keizer 24J Struc tured Learning Ctr 153
958 0506 Salem-Keizer SD 24J MARION Salem/ Keizer 24J Howard Street Charter 152
959 0506 Silver Falls SD 4J MARION Silver Fa lls 4J Centra l Howell Elem 1923 1997 22296 149
9600506 Silver Falls SD 4J
MARION Silver Fa lls 4J Silver Crest Elem 1947 1996 24601 147 961 0506 Silver Falls SD 4J MARION Silver Fa lls 4J Vic tor Point Elem 1947 1989 24600 144
962 0506 Salem-Keizer SD 24J MARION Salem/ Keizer 24J Midd le Grove Elem 1947 2001 18770 137
963 0506 Cascade SD 5 MARION Casc ades 5 Cloverda le Elem 1910 17133 134
964 0506 Silver Falls SD 4J MARION Silver Fa lls 4J Bethany Charter Sc hool 1890 1974 10129 129
965 0506 Salem-Keizer SD 24J MARION Salem/ Keizer 24J Optimum Learning Environmenta l Charter 125
966 0506 Silver Falls SD 4J MARION Silver Fa lls 4J Sc otts Mills Elem 1968 1989 29755 120
967 0506 St Paul SD 45 MARION St Paul 45 St Paul Elem 1964 1998 67520 116
968 0506 Salem-Keizer SD 24J MARION Salem/ Keizer 24J Lake Lab ish Elem 1958 2001 9560 114
969 0506 St Paul SD 45 MARION St Paul 45 St Paul High 1950 1975 122850 112
970 0506 Salem-Keizer SD 24J MARION Salem/ Keizer 24J Community Schoolhouse 106
971 0506 Salem-Keizer SD 24J MARION Salem/ Keizer 24J Barbara Roberts High 103
972 0506 Cascade SD 5 MARION Casc ades 5 Marion Elem 1940 1950 12089 93
973 0506 Salem-Keizer SD 24J MARION Salem/ Keizer 24J Jane Gooda ll Environmenta l Charter 91
974 0506 Silver Falls SD 4J MARION Silver Fa lls 4J Monitor Elem 1921 1990 17038 81
975 0506 Silver Falls SD 4J MARION Silver Fa lls 4J Pratum Elem 1928 1997 8801 78
Appendix A Oregon Seismic Needs Assessment DOGAMI (June 2007)
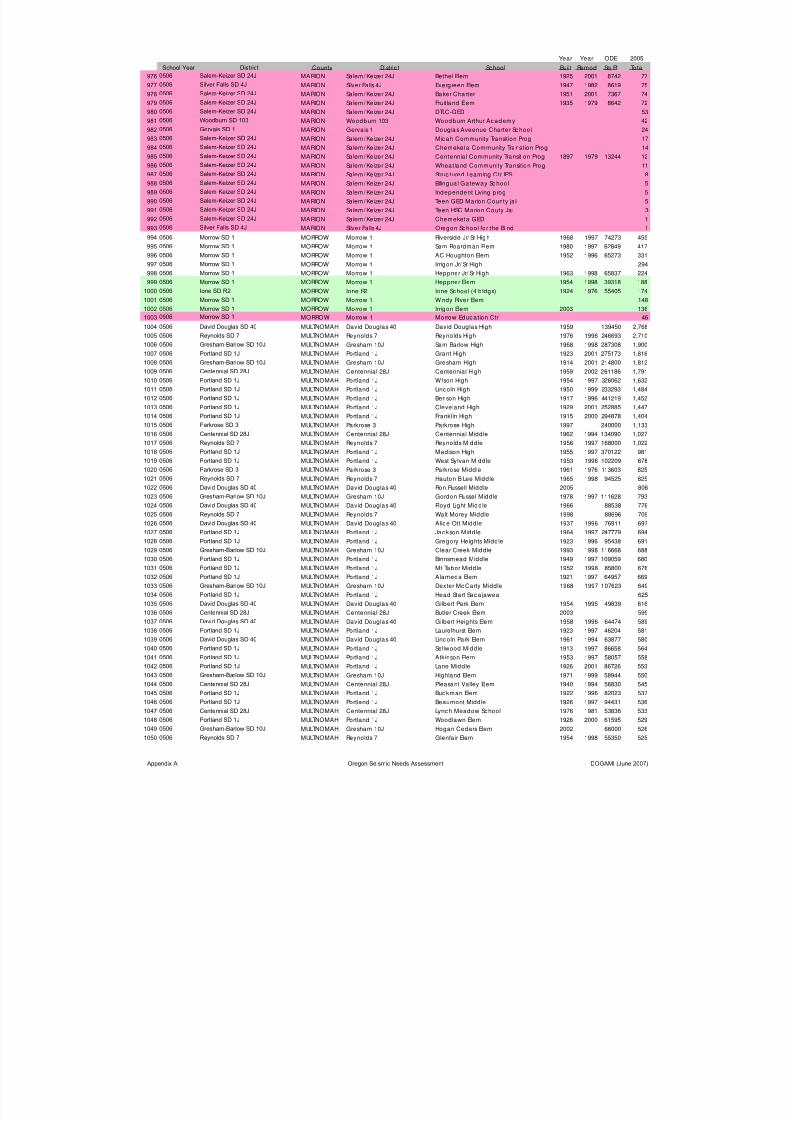
8/3/2019 Statewide Seismic Needs Assessment report
http://slidepdf.com/reader/full/statewide-seismic-needs-assessment-report 78/341
Year Year ODE 2005
School Year District County Distric t School Built Remod Sq Ft Total
976 0506 Salem-Keizer SD 24J MARION Salem/ Keizer 24J Bethel Elem 1925 2001 8742 77
977 0506 Silver Falls SD 4J MARION Silver Fa lls 4J Evergreen Elem 1947 1982 8619 75
978 0506 Salem-Keizer SD 24J MARION Salem/ Keizer 24J Baker Charter 1951 2001 7367 74
979 0506 Salem-Keizer SD 24J MARION Salem/ Keizer 24J Fruitland Elem 1935 1979 8642 72
980 0506 Salem-Keizer SD 24J MARION Salem/ Keizer 24J DTLC-GED 53
981 0506 Woodburn SD 103 MARION Woodburn 103 Woodburn Arthur Academy 42
982 0506 Gervais SD 1 MARION Gerva is 1 Douglas Aveenue Cha rter Sc hool 24
983 0506 Salem-Keizer SD 24J MARION Salem/ Keizer 24J Micah Community Transition Prog 17
984 0506 Salem-Keizer SD 24J MARION Salem/ Keizer 24J Chemeketa Community Transition Prog 14
985 0506 Salem-Keizer SD 24J MARION Salem/ Keizer 24J Centennia l Community Transition Prog 1897 1979 13244 12
986 0506 Salem-Keizer SD 24J MARION Salem/ Keizer 24J Wheatland Community Transition Prog 11
987 0506 Salem-Keizer SD 24J MARION Salem/ Keizer 24J Struc tured Learning Ctr IPS 8
988 0506 Salem-Keizer SD 24J MARION Salem/ Keizer 24J Bilingua l Gateway Sc hool 5
989 0506 Salem-Keizer SD 24J MARION Salem/ Keizer 24J Independent Living prog 5
990 0506 Salem-Keizer SD 24J MARION Salem/ Keizer 24J Teen GED Marion County ja il 5
991 0506 Salem-Keizer SD 24J MARION Salem/ Keizer 24J Teen HSC Marion Couty Ja il 3
992 0506 Salem-Keizer SD 24J MARION Salem/ Keizer 24J Chemeketa GED 1
993 0506 Silver Falls SD 4J MARION Silver Fa lls 4J Oregon School for the Blind 1
994 0506 Morrow SD 1 MORROW Morrow 1 Riverside Jr/ Sr High 1968 1997 74273 455
995 0506 Morrow SD 1 MORROW Morrow 1 Sam Boardman Elem 1980 1997 62849 417
996 0506 Morrow SD 1 MORROW Morrow 1 AC Houghton Elem 1952 1996 65273 331
997 0506 Morrow SD 1 MORROW Morrow 1 Irrigon Jr/ Sr High 294
998 0506 Morrow SD 1 MORROW Morrow 1 Heppner Jr/ Sr High 1963 1998 65837 224
999 0506 Morrow SD 1 MORROW Morrow 1 Heppner Elem 1954 1998 39318 188
1000 0506 Ione SD R2 MORROW Ione R2 Ione School (4 b ldgs) 1924 1976 55405 174
1001 0506 Morrow SD 1 MORROW Morrow 1 Windy River Elem 148 1002 0506 Morrow SD 1 MORROW Morrow 1 Irrigon Elem 2003 136
1003 0506 Morrow SD 1 MORROW Morrow 1 Morrow Educ ation Ctr 46
1004 0506 David Douglas SD 40 MULTNOMAH David Douglas 40 David Douglas High 1959 139450 2,768
1005 0506 Reynolds SD 7 MULTNOMAH Reynolds 7 Reynolds High 1976 1996 246693 2,710
1006 0506 Gresham-Barlow SD 10J MULTNOMAH Gresham 10J Sam Barlow High 1968 1998 287308 1,900
1007 0506 Portland SD 1J MULTNOMAH Portland 1J Grant High 1923 2001 275173 1,816
1008 0506 Gresham-Barlow SD 10J MULTNOMAH Gresham 10J Gresham High 1914 2001 214800 1,812
1009 0506 Centennial SD 28J MULTNOMAH Centennial 28J Centennial High 1959 2002 261186 1,791
1010 0506 Portland SD 1J MULTNOMAH Portland 1J Wilson High 1954 1997 326062 1,632
1011 0506 Portland SD 1J MULTNOMAH Portland 1J Lincoln High 1950 1999 233293 1,484
1012 0506 Portland SD 1J MULTNOMAH Portland 1J Benson High 1917 1996 441219 1,452
1013 0506 Portland SD 1J MULTNOMAH Portland 1J Cleveland High 1929 2001 252885 1,447
1014 0506 Portland SD 1J MULTNOMAH Portland 1J Franklin High 1915 2000 294878 1,404
1015 0506 Parkrose SD 3 MULTNOMAH Parkrose 3 Parkrose High 1997 240000 1,133
1016 0506 Centennial SD 28J MULTNOMAH Centennial 28J Centennial Midd le 1962 1994 134090 1,027
1017 0506 Reynolds SD 7 MULTNOMAH Reynolds 7 Reynolds Middle 1956 1997 168000 1,022
1018 0506 Portland SD 1J MULTNOMAH Portland 1J Madison High 1955 1997 370122 981 1019 0506 Portland SD 1J MULTNOMAH Portland 1J West Sylvan Middle 1953 1996 102209 878
1020 0506 Parkrose SD 3 MULTNOMAH Parkrose 3 Parkrose Middle 1961 1976 113603 825
1021 0506 Reynolds SD 7 MULTNOMAH Reynolds 7 Hauton B Lee Midd le 1965 1998 94525 825
1022 0506 David Douglas SD 40 MULTNOMAH David Douglas 40 Ron Russell Middle 2005 806
1023 0506 Gresham-Barlow SD 10J MULTNOMAH Gresham 10J Gordon Russel Middle 1978 1997 111628 793
1024 0506 David Douglas SD 40 MULTNOMAH David Douglas 40 Floyd Light Middle 1966 88538 776
1025 0506 Reynolds SD 7 MULTNOMAH Reynolds 7 Walt Morey Middle 1998 88696 709
1026 0506 David Douglas SD 40 MULTNOMAH David Douglas 40 Alice Ott Middle 1937 1996 76911 697
1027 0506 Portland SD 1J MULTNOMAH Portland 1J Jackson Middle 1964 1997 247779 694
1028 0506 Portland SD 1J MULTNOMAH Portland 1J Gregory Heights Middle 1923 1996 95438 691
1029 0506 Gresham-Barlow SD 10J MULTNOMAH Gresham 10J Clear Creek Middle 1993 1998 116668 688
1030 0506 Portland SD 1J MULTNOMAH Portland 1J Binnsmead Middle 1949 1997 109059 680
1031 0506 Portland SD 1J MULTNOMAH Portland 1J Mt Tabor Middle 1952 1998 85800 676
1032 0506 Portland SD 1J MULTNOMAH Portland 1J Alameda Elem 1921 1997 64957 669
1033 0506 Gresham-Barlow SD 10J MULTNOMAH Gresham 10J Dexter McCarty Middle 1968 1997 107623 649
1034 0506 Portland SD 1J MULTNOMAH Portland 1J Head Start Sacajawea 625
1035 0506 David Douglas SD 40 MULTNOMAH David Douglas 40 Gilbert Park Elem 1954 1995 49839 616 1036 0506 Centennial SD 28J MULTNOMAH Centennial 28J Butler Creek Elem 2003 595
1037 0506 David Douglas SD 40 MULTNOMAH David Douglas 40 Gilbert Heights Elem 1958 1996 64474 589
1038 0506 Portland SD 1J MULTNOMAH Portland 1J Laurelhurst Elem 1923 1997 46204 581
1039 0506 David Douglas SD 40 MULTNOMAH David Douglas 40 Lincoln Park Elem 1961 1994 63877 580
1040 0506 Portland SD 1J MULTNOMAH Portland 1J Sellwood Middle 1913 1997 86658 564
1041 0506 Portland SD 1J MULTNOMAH Portland 1J Atkinson Elem 1953 1997 58057 558
1042 0506 Portland SD 1J MULTNOMAH Portland 1J Lane Middle 1926 2001 86726 553
1043 0506 Gresham-Barlow SD 10J MULTNOMAH Gresham 10J Highland Elem 1971 1999 58944 550
1044 0506 Centennial SD 28J MULTNOMAH Centennial 28J Pleasant Valley Elem 1940 1994 56830 545
1045 0506 Portland SD 1J MULTNOMAH Portland 1J Buc kman Elem 1922 1996 82023 537
1046 0506 Portland SD 1J MULTNOMAH Portland 1J Beaumont Midd le 1926 1997 94431 536
1047 0506 Centennial SD 28J MULTNOMAH Centennial 28J Lynch Meadow School 1976 1981 53836 533
1048 0506 Portland SD 1J MULTNOMAH Portland 1J Woodlawn Elem 1926 2000 61595 529
1049 0506 Gresham-Barlow SD 10J MULTNOMAH Gresham 10J Hogan Cedars Elem 2002 66000 526
1050 0506 Reynolds SD 7 MULTNOMAH Reynolds 7 Glenfair Elem 1954 1998 55350 525
Appendix A Oregon Seismic Needs Assessment DOGAMI (June 2007)
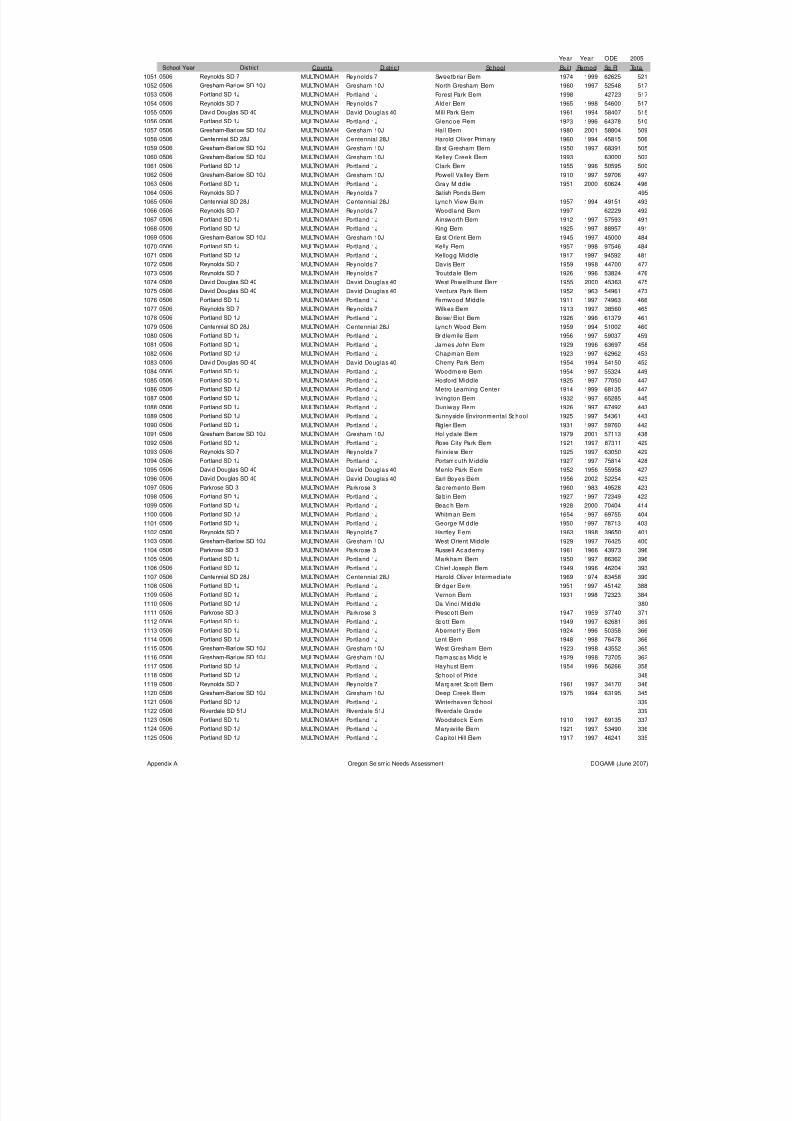
8/3/2019 Statewide Seismic Needs Assessment report
http://slidepdf.com/reader/full/statewide-seismic-needs-assessment-report 79/341
Year Year ODE 2005
School Year District County Distric t School Built Remod Sq Ft Total
1051 0506 Reynolds SD 7 MULTNOMAH Reynolds 7 Sweetbria r Elem 1974 1999 62625 521
1052 0506 Gresham-Barlow SD 10J MULTNOMAH Gresham 10J North Gresham Elem 1960 1997 52548 517
1053 0506 Portland SD 1J MULTNOMAH Portland 1J Forest Park Elem 1998 42723 517
1054 0506 Reynolds SD 7 MULTNOMAH Reynolds 7 Alder Elem 1965 1998 54600 517
1055 0506 David Douglas SD 40 MULTNOMAH David Douglas 40 Mill Park Elem 1961 1994 58407 515
1056 0506 Portland SD 1J MULTNOMAH Portland 1J Glencoe Elem 1923 1996 64378 510
1057 0506 Gresham-Barlow SD 10J MULTNOMAH Gresham 10J Hall Elem 1980 2001 58804 509
1058 0506 Centennial SD 28J MULTNOMAH Centennial 28J Harold Oliver Primary 1960 1994 45815 506
1059 0506 Gresham-Barlow SD 10JMULTNOMAH Gresham 10J East Gresham Elem 1950 1997 68391 505
1060 0506 Gresham-Barlow SD 10J MULTNOMAH Gresham 10J Kelley Creek Elem 1993 63000 503
1061 0506 Portland SD 1J MULTNOMAH Portland 1J Clark Elem 1955 1996 50595 500
1062 0506 Gresham-Barlow SD 10J MULTNOMAH Gresham 10J Powell Va lley Elem 1910 1997 59706 497
1063 0506 Portland SD 1J MULTNOMAH Portland 1J Gray Middle 1951 2000 60624 496
1064 0506 Reynolds SD 7 MULTNOMAH Reynolds 7 Salish Ponds Elem 495
1065 0506 Centennial SD 28J MULTNOMAH Centennial 28J Lynch View Elem 1957 1994 49151 493
1066 0506 Reynolds SD 7 MULTNOMAH Reynolds 7 Woodland Elem 1997 62229 492
1067 0506 Portland SD 1J MULTNOMAH Portland 1J Ainsworth Elem 1912 1997 57593 491
1068 0506 Portland SD 1J MULTNOMAH Portland 1J King Elem 1925 1997 88957 491
1069 0506 Gresham-Barlow SD 10J MULTNOMAH Gresham 10J East Orient Elem 1945 1997 45000 484
1070 0506 Portland SD 1J MULTNOMAH Portland 1J Kelly Elem 1957 1998 97546 484
1071 0506 Portland SD 1J MULTNOMAH Portland 1J Kellogg Middle 1917 1997 94592 481
1072 0506 Reynolds SD 7 MULTNOMAH Reynolds 7 Davis Elem 1959 1998 44700 477
1073 0506 Reynolds SD 7 MULTNOMAH Reynolds 7 Troutdale Elem 1926 1996 53824 476
1074 0506 David Douglas SD 40 MULTNOMAH David Douglas 40 West Powellhurst Elem 1955 2000 45363 475
1075 0506 David Douglas SD 40 MULTNOMAH David Douglas 40 Ventura Park Elem 1952 1963 54961 473
1076 0506 Portland SD 1J MULTNOMAH Portland 1J Fernwood Midd le 1911 1997 74963 466 1077 0506 Reynolds SD 7 MULTNOMAH Reynolds 7 Wilkes Elem 1913 1997 38560 465
1078 0506 Portland SD 1J MULTNOMAH Portland 1J Boise/ Eliot Elem 1926 1996 61379 461
1079 0506 Centennial SD 28J MULTNOMAH Centennial 28J Lynch Wood Elem 1959 1994 51002 460
1080 0506 Portland SD 1J MULTNOMAH Portland 1J Bridlemile Elem 1956 1997 59037 459
1081 0506 Portland SD 1J MULTNOMAH Portland 1J James John Elem 1929 1996 63697 458
1082 0506 Portland SD 1J MULTNOMAH Portland 1J Chapman Elem 1923 1997 62962 453
1083 0506 David Douglas SD 40 MULTNOMAH David Douglas 40 Cherry Park Elem 1954 1994 54150 452
1084 0506 Portland SD 1J MULTNOMAH Portland 1J Woodmere Elem 1954 1997 55324 449
1085 0506 Portland SD 1J MULTNOMAH Portland 1J Hosford Middle 1925 1997 77050 447
1086 0506 Portland SD 1J MULTNOMAH Portland 1J Metro Learning Center 1914 1999 68135 447
1087 0506 Portland SD 1J MULTNOMAH Portland 1J Irvington Elem 1932 1997 65285 445
1088 0506 Portland SD 1J MULTNOMAH Portland 1J Duniway Elem 1926 1997 67492 443
1089 0506 Portland SD 1J MULTNOMAH Portland 1J Sunnyside Environmental School 1925 1997 54361 443
1090 0506 Portland SD 1J MULTNOMAH Portland 1J Rig ler Elem 1931 1997 59760 442
1091 0506 Gresham-Barlow SD 10J MULTNOMAH Gresham 10J Hollydale Elem 1979 2001 57113 438
1092 0506 Portland SD 1J MULTNOMAH Portland 1J Rose City Park Elem 1921 1997 87311 429
1093 0506 Reynolds SD 7 MULTNOMAH Reynolds 7 Fa irview Elem 1925 1997 63050 429 1094 0506 Portland SD 1J MULTNOMAH Portland 1J Portsmouth Middle 1927 1997 75814 428
1095 0506 David Douglas SD 40 MULTNOMAH David Douglas 40 Menlo Park Elem 1952 1956 55958 427
1096 0506 David Douglas SD 40 MULTNOMAH David Douglas 40 Earl Boyes Elem 1956 2002 52254 423
1097 0506 Parkrose SD 3 MULTNOMAH Parkrose 3 Sac remento Elem 1960 1983 49528 423
1098 0506 Portland SD 1J MULTNOMAH Portland 1J Sabin Elem 1927 1997 72349 422
1099 0506 Portland SD 1J MULTNOMAH Portland 1J Beac h Elem 1928 2000 70404 414
1100 0506 Portland SD 1J MULTNOMAH Portland 1J Whitman Elem 1654 1997 69755 404
1101 0506 Portland SD 1J MULTNOMAH Portland 1J George Middle 1950 1997 78713 403
1102 0506 Reynolds SD 7 MULTNOMAH Reynolds 7 Hartley Elem 1963 1998 39650 401
1103 0506 Gresham-Barlow SD 10J MULTNOMAH Gresham 10J West Orient Midd le 1929 1997 76425 400
1104 0506 Parkrose SD 3 MULTNOMAH Parkrose 3 Russell Academy 1961 1966 43973 396
1105 0506 Portland SD 1J MULTNOMAH Portland 1J Markham Elem 1950 1997 86362 396
1106 0506 Portland SD 1J MULTNOMAH Portland 1J Chief Joseph Elem 1949 1996 46204 393
1107 0506 Centennial SD 28J MULTNOMAH Centennial 28J Harold Oliver Intermediate 1969 1974 83458 390
1108 0506 Portland SD 1J MULTNOMAH Portland 1J Bridger Elem 1951 1997 45142 388
1109 0506 Portland SD 1J MULTNOMAH Portland 1J Vernon Elem 1931 1998 72323 384
1110 0506 Portland SD 1J MULTNOMAH Portland 1J Da Vinc i Middle 380 1111 0506 Parkrose SD 3 MULTNOMAH Parkrose 3 Prescott Elem 1947 1959 37740 371
1112 0506 Portland SD 1J MULTNOMAH Portland 1J Scott Elem 1949 1997 62681 369
1113 0506 Portland SD 1J MULTNOMAH Portland 1J Abernethy Elem 1924 1996 50358 366
1114 0506 Portland SD 1J MULTNOMAH Portland 1J Lent Elem 1948 1998 76478 366
1115 0506 Gresham-Barlow SD 10J MULTNOMAH Gresham 10J West Gresham Elem 1923 1998 43552 365
1116 0506 Gresham-Barlow SD 10J MULTNOMAH Gresham 10J Damascas Midd le 1929 1998 73705 362
1117 0506 Portland SD 1J MULTNOMAH Portland 1J Hayhust Elem 1954 1996 56266 358
1118 0506 Portland SD 1J MULTNOMAH Portland 1J School of Pride 348
1119 0506 Reynolds SD 7 MULTNOMAH Reynolds 7 Margaret Scott Elem 1961 1997 34170 346
1120 0506 Gresham-Barlow SD 10J MULTNOMAH Gresham 10J Deep Creek Elem 1975 1994 63195 345
1121 0506 Portland SD 1J MULTNOMAH Portland 1J Winterhaven Sc hool 339
1122 0506 Riverdale SD 51J MULTNOMAH Riverda le 51J Riverdale Grade 339
1123 0506 Portland SD 1J MULTNOMAH Portland 1J Woodstock Elem 1910 1997 69135 337
1124 0506 Portland SD 1J MULTNOMAH Portland 1J Marysville Elem 1921 1997 53490 336
1125 0506 Portland SD 1J MULTNOMAH Portland 1J Capitol Hill Elem 1917 1997 46241 335
Appendix A Oregon Seismic Needs Assessment DOGAMI (June 2007)
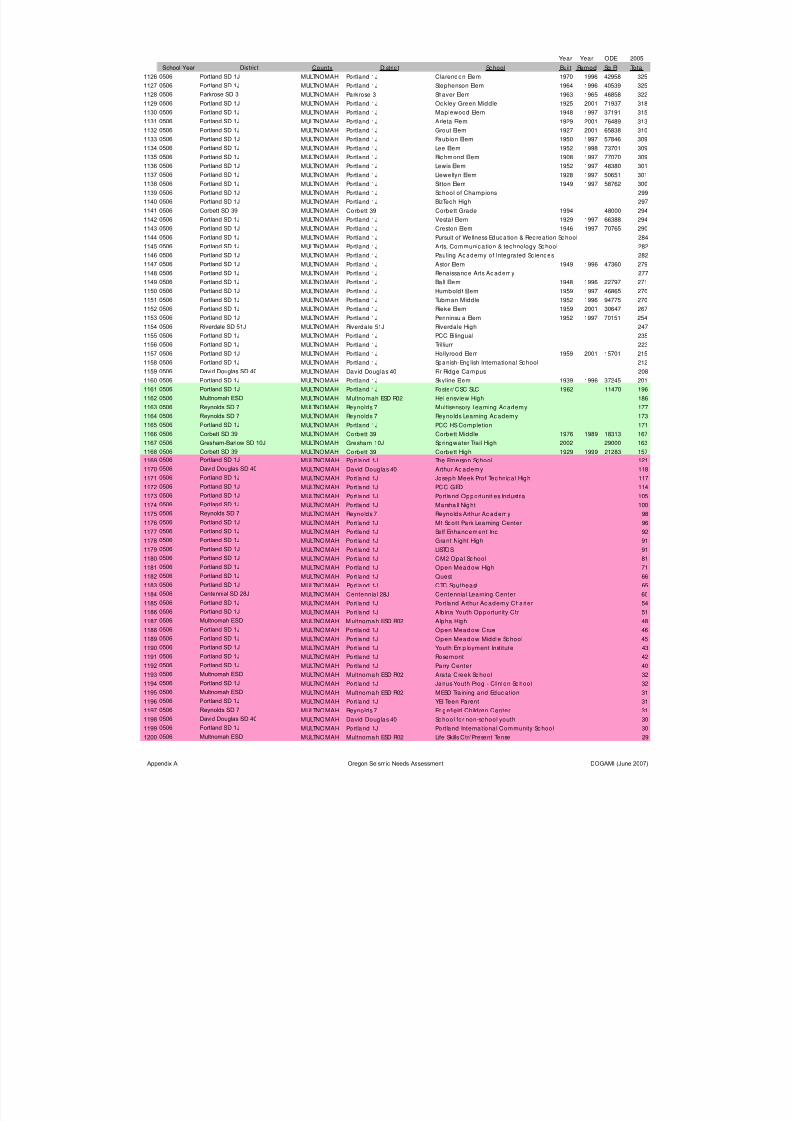
8/3/2019 Statewide Seismic Needs Assessment report
http://slidepdf.com/reader/full/statewide-seismic-needs-assessment-report 80/341
Year Year ODE 2005
School Year District County Distric t School Built Remod Sq Ft Total
1126 0506 Portland SD 1J MULTNOMAH Portland 1J Clarendon Elem 1970 1996 42958 325
1127 0506 Portland SD 1J MULTNOMAH Portland 1J Stephenson Elem 1964 1996 40539 325
1128 0506 Parkrose SD 3 MULTNOMAH Parkrose 3 Shaver Elem 1963 1965 46858 322
1129 0506 Portland SD 1J MULTNOMAH Portland 1J Oc kley Green Middle 1925 2001 71937 318
1130 0506 Portland SD 1J MULTNOMAH Portland 1J Maplewood Elem 1948 1997 37191 315
1131 0506 Portland SD 1J MULTNOMAH Portland 1J Arleta Elem 1929 2001 76489 313
1132 0506 Portland SD 1J MULTNOMAH Portland 1J Grout Elem 1927 2001 65838 310
1133 0506 Portland SD 1J MULTNOMAH Portland 1J Faubion Elem 1950 1997 57846 309
1134 0506 Portland SD 1JMULTNOMAH Portland 1J Lee Elem 1952 1998 73701 309
1135 0506 Portland SD 1J MULTNOMAH Portland 1J Ric hmond Elem 1908 1997 77070 309
1136 0506 Portland SD 1J MULTNOMAH Portland 1J Lewis Elem 1952 1997 48380 301
1137 0506 Portland SD 1J MULTNOMAH Portland 1J Llewellyn Elem 1928 1997 50651 301
1138 0506 Portland SD 1J MULTNOMAH Portland 1J Sitton Elem 1949 1997 58762 300
1139 0506 Portland SD 1J MULTNOMAH Portland 1J School of Champions 299
1140 0506 Portland SD 1J MULTNOMAH Portland 1J BizTech High 297
1141 0506 Corbett SD 39 MULTNOMAH Corbett 39 Corbett Grade 1994 48000 294
1142 0506 Portland SD 1J MULTNOMAH Portland 1J Vestal Elem 1929 1997 66388 294
1143 0506 Portland SD 1J MULTNOMAH Portland 1J Creston Elem 1946 1997 70765 290
1144 0506 Portland SD 1J MULTNOMAH Portland 1J Pursuit of Wellness Education & Recreation School 284
1145 0506 Portland SD 1J MULTNOMAH Portland 1J Arts, Communication & technology Sc hool 282
1146 0506 Portland SD 1J MULTNOMAH Portland 1J Pauling Academy of Integrated Sc iences 282
1147 0506 Portland SD 1J MULTNOMAH Portland 1J Astor Elem 1949 1996 47360 279
1148 0506 Portland SD 1J MULTNOMAH Portland 1J Renaissance Arts Academy 277
1149 0506 Portland SD 1J MULTNOMAH Portland 1J Ball Elem 1948 1996 22797 271
1150 0506 Portland SD 1J MULTNOMAH Portland 1J Humbold t Elem 1959 1997 46865 270
1151 0506 Portland SD 1J MULTNOMAH Portland 1J Tubman Middle 1952 1996 94775 270 1152 0506 Portland SD 1J MULTNOMAH Portland 1J Rieke Elem 1959 2001 30647 267
1153 0506 Portland SD 1J MULTNOMAH Portland 1J Penninsula Elem 1952 1997 70151 254
1154 0506 Riverdale SD 51J MULTNOMAH Riverda le 51J Riverdale High 247
1155 0506 Portland SD 1J MULTNOMAH Portland 1J PCC Bilingual 235
1156 0506 Portland SD 1J MULTNOMAH Portland 1J Trillium 223
1157 0506 Portland SD 1J MULTNOMAH Portland 1J Hollyrood Elem 1959 2001 15701 215
1158 0506 Portland SD 1J MULTNOMAH Portland 1J Spanish-English International School 212
1159 0506 David Douglas SD 40 MULTNOMAH David Douglas 40 Fir Ridge Campus 208
1160 0506 Portland SD 1J MULTNOMAH Portland 1J Skyline Elem 1939 1996 37245 201
1161 0506 Portland SD 1J MULTNOMAH Portland 1J Foster/ CSC SLC 1962 11470 196
1162 0506 Multnomah ESD MULTNOMAH Multnomah ESD R02 Hellensview High 186
1163 0506 Reynolds SD 7 MULTNOMAH Reynolds 7 Multisensory Learning Ac ademy 177
1164 0506 Reynolds SD 7 MULTNOMAH Reynolds 7 Reynolds Learning Ac ademy 173
1165 0506 Portland SD 1J MULTNOMAH Portland 1J PCC HS Completion 171
1166 0506 Corbett SD 39 MULTNOMAH Corbett 39 Corbett Middle 1976 1989 18313 167
1167 0506 Gresham-Barlow SD 10J MULTNOMAH Gresham 10J Springwater Trail High 2002 29000 163
1168 0506 Corbett SD 39 MULTNOMAH Corbett 39 Corbett High 1929 1999 21283 157 1169 0506 Portland SD 1J MULTNOMAH Portland 1J The Emerson School 121
1170 0506 David Douglas SD 40 MULTNOMAH David Douglas 40 Arthur Ac ademy 118
1171 0506 Portland SD 1J MULTNOMAH Portland 1J Joseph Meek Prof Tec hnica l High 117
1172 0506 Portland SD 1J MULTNOMAH Portland 1J PCC GED 114
1173 0506 Portland SD 1J MULTNOMAH Portland 1J Portland Opportunities Industria l 105
1174 0506 Portland SD 1J MULTNOMAH Portland 1J Marsha ll Night 100
1175 0506 Reynolds SD 7 MULTNOMAH Reynolds 7 Reynolds Arthur Ac ademy 98
1176 0506 Portland SD 1J MULTNOMAH Portland 1J Mt Sc ott Park Learning Center 96
1177 0506 Portland SD 1J MULTNOMAH Portland 1J Self Enhancement Inc 92
1178 0506 Portland SD 1J MULTNOMAH Portland 1J Grant Night High 91
1179 0506 Portland SD 1J MULTNOMAH Portland 1J LISTOS 91
1180 0506 Portland SD 1J MULTNOMAH Portland 1J CM2 Opal Sc hool 81
1181 0506 Portland SD 1J MULTNOMAH Portland 1J Open Meadow High 71
1182 0506 Portland SD 1J MULTNOMAH Portland 1J Quest 66
1183 0506 Portland SD 1J MULTNOMAH Portland 1J CTC Southeast 65
1184 0506 Centennial SD 28J MULTNOMAH Centennia l 28J Centennia l Learning Center 60
11850506 Portland SD 1J
MULTNOMAH Portland 1J Portland Arthur Ac ademy Charter 54 1186 0506 Portland SD 1J MULTNOMAH Portland 1J Alb ina Youth Opportunity Ctr 51
1187 0506 Multnomah ESD MULTNOMAH M ultnomah ESD R02 Alpha High 48
1188 0506 Portland SD 1J MULTNOMAH Portland 1J Open Meadow Crue 46
1189 0506 Portland SD 1J MULTNOMAH Portland 1J Open Meadow Midd le Sc hool 45
1190 0506 Portland SD 1J MULTNOMAH Portland 1J Youth Employment Institute 43
1191 0506 Portland SD 1J MULTNOMAH Portland 1J Rosemont 42
1192 0506 Portland SD 1J MULTNOMAH Portland 1J Pa rry Center 40
1193 0506 Multnomah ESD MULTNOMAH Multnomah ESD R02 Arata Creek Sc hool 32
1194 0506 Portland SD 1J MULTNOMAH Portland 1J Janus Youth Prog - Clinton Sc hool 32
1195 0506 Multnomah ESD MULTNOMAH Multnomah ESD R02 MESD Tra ining and Educ ation 31
1196 0506 Portland SD 1J MULTNOMAH Portland 1J YEI Teen Parent 31
1197 0506 Reynolds SD 7 MULTNOMAH Reynolds 7 Edgefield Child ren Center 31
1198 0506 David Douglas SD 40 MULTNOMAH David Douglas 40 Sc hool for non-school youth 30
1199 0506 Portland SD 1J MULTNOMAH Portland 1J Portland Internationa l Community Sc hool 30
1200 0506 Multnomah ESD MULTNOMAH Multnomah ESD R02 Life Skills Ctr/ Present Tense 29
Appendix A Oregon Seismic Needs Assessment DOGAMI (June 2007)
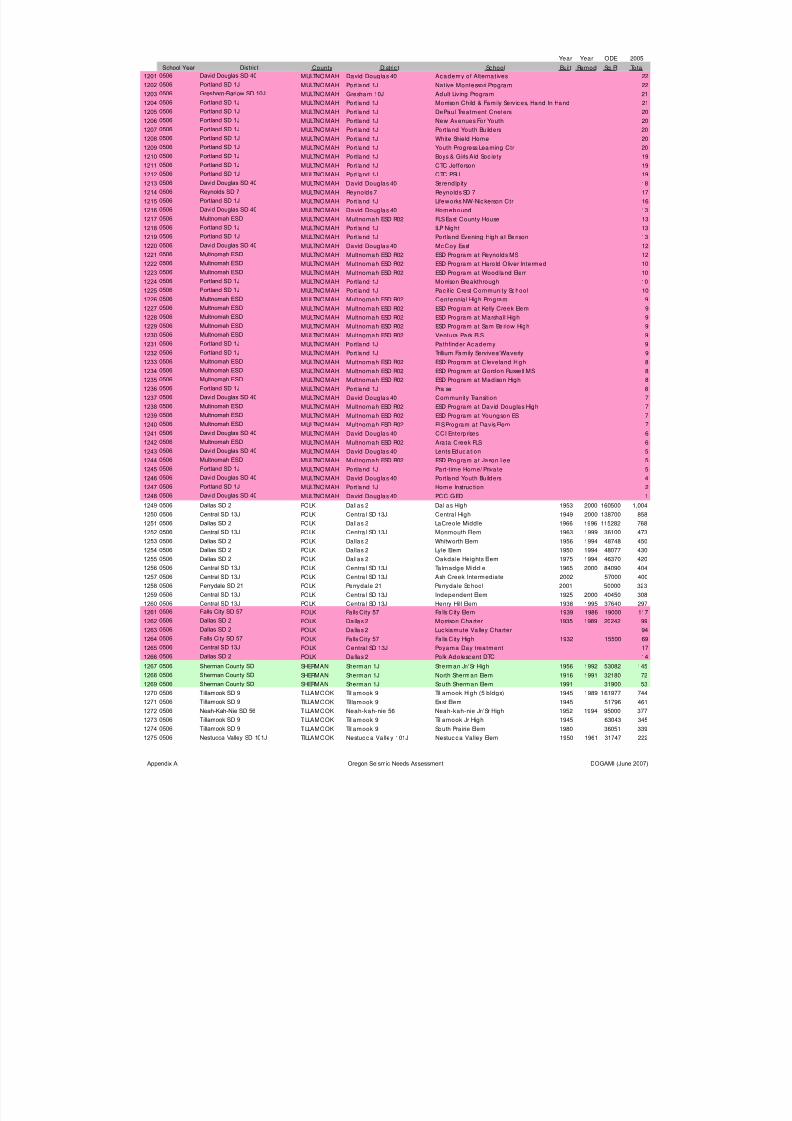
8/3/2019 Statewide Seismic Needs Assessment report
http://slidepdf.com/reader/full/statewide-seismic-needs-assessment-report 81/341
Year Year ODE 2005
School Year District County Distric t School Built Remod Sq Ft Total
1201 0506 David Douglas SD 40 MULTNOMAH David Douglas 40 Academy of Alternatives 22
1202 0506 Portland SD 1J MULTNOMAH Portland 1J Native Montessori Program 22
1203 0506 Gresham-Barlow SD 10J MULTNOMAH Gresham 10J Adult Living Program 21
1204 0506 Portland SD 1J MULTNOMAH Portland 1J Morrison Child & Family Services, Hand In Hand 21
1205 0506 Portland SD 1J MULTNOMAH Portland 1J DePaul Treatment Cneters 20
1206 0506 Portland SD 1J MULTNOMAH Portland 1J New Avenues For Youth 20
1207 0506 Portland SD 1J MULTNOMAH Portland 1J Portland Youth Builders 20
1208 0506 Portland SD 1J MULTNOMAH Portland 1J White Shield Home 20
1209 0506 Portland SD 1J MULTNOMAH Portland 1J Youth Progress Lea rning Ctr 20
1210 0506 Portland SD 1J MULTNOMAH Portland 1J Boys & Girls Aid Soc iety 19
1211 0506 Portland SD 1J MULTNOMAH Portland 1J CTC Jefferson 19
1212 0506 Portland SD 1J MULTNOMAH Portland 1J CTC PSU 19
1213 0506 David Douglas SD 40 MULTNOMAH David Douglas 40 Serend ip ity 18
1214 0506 Reynolds SD 7 MULTNOMAH Reynolds 7 Reynolds SD 7 17
1215 0506 Portland SD 1J MULTNOMAH Portland 1J Lifeworks NW-Nic kerson Ctr 16
1216 0506 David Douglas SD 40 MULTNOMAH David Douglas 40 Homebound 13
1217 0506 Multnomah ESD MULTNOMAH Multnomah ESD R02 FLSEast County House 13
1218 0506 Portland SD 1J MULTNOMAH Portland 1J ILP Night 13
1219 0506 Portland SD 1J MULTNOMAH Portland 1J Portland Evening High a t Benson 13
1220 0506 David Douglas SD 40 MULTNOMAH David Douglas 40 McCoy East 12
1221 0506 Multnomah ESD MULTNOMAH Multnomah ESD R02 ESD Program a t Reynolds MS 12
1222 0506 Multnomah ESD MULTNOMAH Multnomah ESD R02 ESD Program a t Harold Oliver Intermed 10
1223 0506 Multnomah ESD MULTNOMAH Multnomah ESD R02 ESD Program a t Wood land Elem 10
1224 0506 Portland SD 1J MULTNOMAH Portland 1J Morrison Breakthrough 10
1225 0506 Portland SD 1J MULTNOMAH Portland 1J Pac ific Crest Community School 10
1226 0506 Multnomah ESD MULTNOMAH Multnomah ESD R02 Centennia l High Program 9
1227 0506 Multnomah ESD MULTNOMAH Multnomah ESD R02 ESD Program a t Kelly Creek Elem 9
1228 0506 Multnomah ESD MULTNOMAH Multnomah ESD R02 ESD Program a t Marsha ll High 9
1229 0506 Multnomah ESD MULTNOMAH Multnomah ESD R02 ESD Program a t Sam Barlow High 9
1230 0506 Multnomah ESD MULTNOMAH Multnomah ESD R02 Ventura Park FLS 9
1231 0506 Portland SD 1J MULTNOMAH Portland 1J Pa thfinder Academy 9
1232 0506 Portland SD 1J MULTNOMAH Portland 1J Trillium Family Servives/ Waverly 9
1233 0506 Multnomah ESD MULTNOMAH Multnomah ESD R02 ESD Program a t Cleveland High 8
1234 0506 Multnomah ESD MULTNOMAH Multnomah ESD R02 ESD Program a t Gordon Russell MS 8
1235 0506 Multnomah ESD MULTNOMAH Multnomah ESD R02 ESD Program a t Madison High 8
1236 0506 Portland SD 1J MULTNOMAH Portland 1J Pra ise 8
1237 0506 David Douglas SD 40 MULTNOMAH David Douglas 40 Community Transition 7
1238 0506 Multnomah ESD MULTNOMAH Multnomah ESD R02 ESD Program a t David Douglas High 7
1239 0506 Multnomah ESD MULTNOMAH Multnomah ESD R02 ESD Program a t Youngson ES 7
1240 0506 Multnomah ESD MULTNOMAH Multnomah ESD R02 FLSProgram at Davis Elem 7
1241 0506 David Douglas SD 40 MULTNOMAH David Douglas 40 CCI Enterprises 6
1242 0506 Multnomah ESD MULTNOMAH Multnomah ESD R02 Arata Creek FLS 6
1243 0506 David Douglas SD 40 MULTNOMAH David Douglas 40 Lents Education 5
1244 0506 Multnomah ESD MULTNOMAH Multnomah ESD R02 ESD Program a t Jason Lee 5
1245 0506 Portland SD 1J MULTNOMAH Portland 1J Pa rt-time Home/ Priva te 5
1246 0506 David Douglas SD 40 MULTNOMAH David Douglas 40 Portland Youth Builders 4
1247 0506 Portland SD 1J MULTNOMAH Portland 1J Home Instruc tion 2
1248 0506 David Douglas SD 40 MULTNOMAH David Douglas 40 PCC GED 1
1249 0506 Dallas SD 2 POLK Dallas 2 Dallas High 1953 2000 160500 1,004
1250 0506 Central SD 13J POLK Centra l SD 13J Central High 1949 2000 138700 858
1251 0506 Dallas SD 2 POLK Dallas 2 LaCreole Middle 1966 1996 115282 768
1252 0506 Central SD 13J POLK Centra l SD 13J Monmouth Elem 1963 1999 36100 473
1253 0506 Dallas SD 2 POLK Dallas 2 Whitworth Elem 1956 1994 48748 450
1254 0506 Dallas SD 2 POLK Dallas 2 Lyle Elem 1950 1994 48077 430
1255 0506 Dallas SD 2 POLK Dallas 2 Oakdale Heights Elem 1975 1994 46370 420
1256 0506 Central SD 13J POLK Centra l SD 13J Talmadge Middle 1965 2000 84090 404
1257 0506 Central SD 13J POLK Centra l SD 13J Ash Creek Intermediate 2002 57000 400
1258 0506 Perrydale SD 21 POLK Perrydale 21 Perrydale School 2001 50000 323
1259 0506 Central SD 13J POLK Centra l SD 13J Independent Elem 1925 2000 40450 308
1260 0506 Central SD 13J POLK Centra l SD 13J Henry Hill Elem 1938 1995 37640 297 1261 0506 Falls City SD 57 POLK Falls City 57 Falls City Elem 1939 1986 19000 117
1262 0506 Dallas SD 2 POLK Dallas 2 Morrison Cha rter 1935 1989 20242 99
1263 0506 Dallas SD 2 POLK Dallas 2 Luc kiamute Va lley Charter 94
1264 0506 Falls City SD 57 POLK Falls City 57 Falls City High 1932 15500 69
1265 0506 Central SD 13J POLK Centra l SD 13J Poyama Day treatment 17
1266 0506 Dallas SD 2 POLK Dallas 2 Polk Adolesc ent DTC 14
1267 0506 Sherman County SD SHERMAN Sherman 1J Sherman Jr/ Sr High 1956 1992 53082 145
1268 0506 Sherman County SD SHERMAN Sherman 1J North Sherman Elem 1916 1991 32180 72
1269 0506 Sherman County SD SHERMAN Sherman 1J South Sherman Elem 1991 31900 53
1270 0506 Tillamook SD 9 TILLAMOOK Tillamook 9 Tillamook High (5 bldgs) 1945 1989 161977 744
1271 0506 Tillamook SD 9 TILLAMOOK Tillamook 9 East Elem 1945 51796 461
1272 0506 Neah-Kah-Nie SD 56 TILLAMOOK Neah-kah-nie 56 Neah-kah-nie Jr/ Sr High 1952 1994 95000 377
1273 0506 Tillamook SD 9 TILLAMOOK Tillamook 9 Tillamook Jr High 1945 63043 345
1274 0506 Tillamook SD 9 TILLAMOOK Tillamook 9 South Prairie Elem 1980 36051 339
1275 0506 Nestucca Valley SD 101J TILLAMOOK Nestucc a Valley 101J Nestuc ca Valley Elem 1950 1961 31747 222
Appendix A Oregon Seismic Needs Assessment DOGAMI (June 2007)
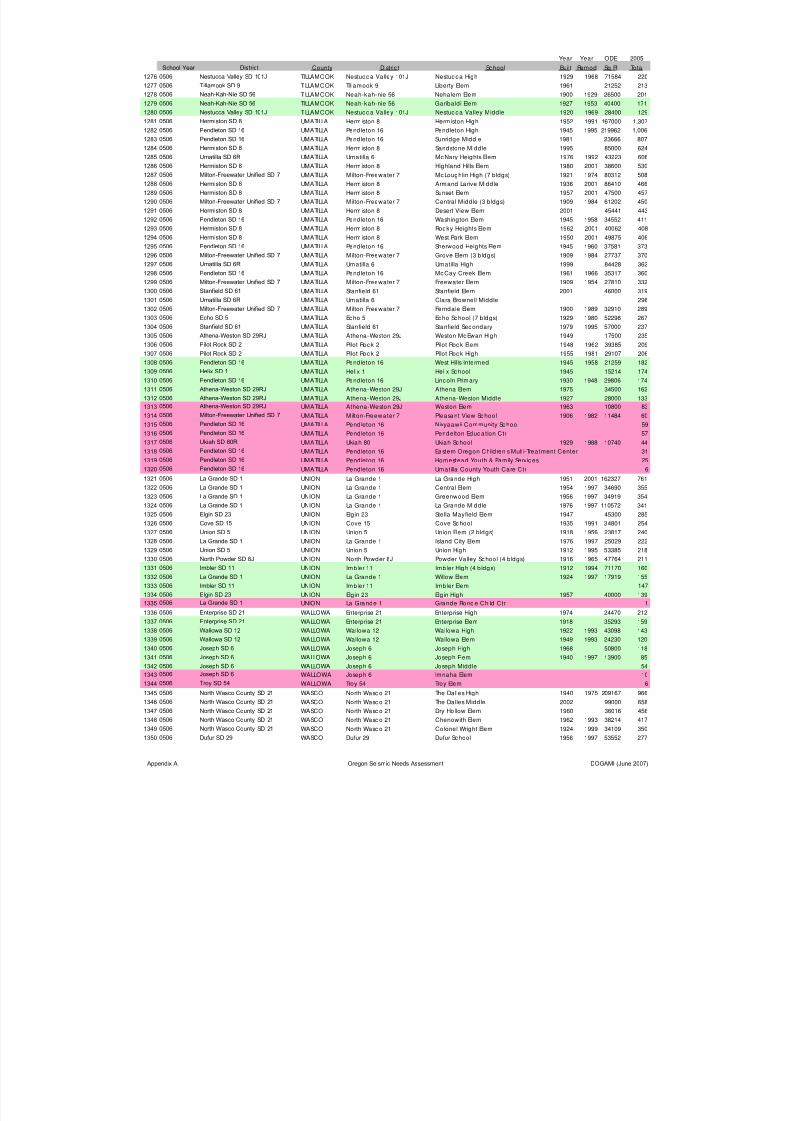
8/3/2019 Statewide Seismic Needs Assessment report
http://slidepdf.com/reader/full/statewide-seismic-needs-assessment-report 82/341
Year Year ODE 2005
School Year District County Distric t School Built Remod Sq Ft Total
1276 0506 Nestucca Valley SD 101J TILLAMOOK Nestucc a Valley 101J Nestuc ca High 1929 1968 71584 220
1277 0506 Tillamook SD 9 TILLAMOOK Tillamook 9 Liberty Elem 1961 21252 213
1278 0506 Neah-Kah-Nie SD 56 TILLAMOOK Neah-kah-nie 56 Nehalem Elem 1900 1929 26500 201
1279 0506 Neah-Kah-Nie SD 56 TILLAMOOK Neah-kah-nie 56 Gariba ldi Elem 1927 1953 40400 171
1280 0506 Nestucca Valley SD 101J TILLAMOOK Nestucc a Valley 101J Nestuc ca Valley Middle 1920 1969 28400 129
1281 0506 Hermiston SD 8 UMATILLA Hermiston 8 Hermiston High 1952 1991 167000 1,307
1282 0506 Pendleton SD 16 UMATILLA Pendleton 16 Pendleton High 1945 1995 219962 1,006
1283 0506 Pendleton SD 16 UMATILLA Pendleton 16 Sunridge Middle 1981 23666 807
1284 0506 Hermiston SD 8UMATILLA Hermiston 8 Sandstone Middle 1995 85000 624
1285 0506 Umatilla SD 6R UMATILLA Umatilla 6 McNary Heights Elem 1976 1992 43223 606
1286 0506 Hermiston SD 8 UMATILLA Hermiston 8 Highland Hills Elem 1980 2001 38600 530
1287 0506 Milton-Freewater Unified SD 7 UMATILLA Milton-Freewater 7 McLoughlin High (7 bldgs) 1921 1974 80312 508
1288 0506 Hermiston SD 8 UMATILLA Hermiston 8 Armand Larive Middle 1936 2001 86410 466
1289 0506 Hermiston SD 8 UMATILLA Hermiston 8 Sunset Elem 1957 2001 47500 457
1290 0506 Milton-Freewater Unified SD 7 UMATILLA Milton-Freewater 7 Central Middle (3 bldgs) 1909 1984 61202 450
1291 0506 Hermiston SD 8 UMATILLA Hermiston 8 Desert View Elem 2001 45441 443
1292 0506 Pendleton SD 16 UMATILLA Pendleton 16 Washington Elem 1945 1958 34552 411
1293 0506 Hermiston SD 8 UMATILLA Hermiston 8 Rocky Heights Elem 1962 2001 40062 408
1294 0506 Hermiston SD 8 UMATILLA Hermiston 8 West Park Elem 1950 2001 49875 406
1295 0506 Pendleton SD 16 UMATILLA Pendleton 16 Sherwood Heights Elem 1945 1960 37581 373
1296 0506 Milton-Freewater Unified SD 7 UMATILLA Milton-Freewater 7 Grove Elem (3 bldgs) 1909 1984 27737 370
1297 0506 Umatilla SD 6R UMATILLA Umatilla 6 Umatilla High 1999 84428 362
1298 0506 Pendleton SD 16 UMATILLA Pendleton 16 McCay Creek Elem 1961 1966 35317 360
1299 0506 Milton-Freewater Unified SD 7 UMATILLA Milton-Freewater 7 Freewater Elem 1909 1954 27810 332
1300 0506 Stanfield SD 61 UMATILLA Stanfield 61 Stanfield Elem 2001 46000 319
1301 0506 Umatilla SD 6R UMATILLA Umatilla 6 Clara Brownell Middle 298 1302 0506 Milton-Freewater Unified SD 7 UMATILLA Milton-Freewater 7 Ferndale Elem 1900 1989 32910 289
1303 0506 Echo SD 5 UMATILLA Echo 5 Echo School (7 bldgs) 1929 1980 52298 267
1304 0506 Stanfield SD 61 UMATILLA Stanfield 61 Stanfield Secondary 1979 1995 57000 237
1305 0506 Athena-Weston SD 29RJ UMATILLA Athena-Weston 29J Weston McEwan High 1949 17500 235
1306 0506 Pilot Rock SD 2 UMATILLA Pilot Rock 2 Pilot Rock Elem 1948 1962 39385 209
1307 0506 Pilot Rock SD 2 UMATILLA Pilot Rock 2 Pilot Rock High 1955 1981 29107 206
1308 0506 Pendleton SD 16 UMATILLA Pendleton 16 West Hills Intermed 1945 1958 21259 182
1309 0506 Helix SD 1 UMATILLA Helix 1 Helix School 1945 15214 174
1310 0506 Pendleton SD 16 UMATILLA Pendleton 16 Lincoln Primary 1930 1948 29806 174
1311 0506 Athena-Weston SD 29RJ UMATILLA Athena-Weston 29J Athena Elem 1975 34500 162
1312 0506 Athena-Weston SD 29RJ UMATILLA Athena-Weston 29J Athena-Weston Middle 1927 28000 133
1313 0506 Athena-Weston SD 29RJ UMATILLA Athena-Weston 29J Weston Elem 1963 10800 83
1314 0506 Milton-Freewater Unified SD 7 UMATILLA Milton-Freewater 7 Pleasant View Sc hool 1906 1982 11484 60
1315 0506 Pendleton SD 16 UMATILLA Pendleton 16 Nixyaawii Community Sc hool 59
1316 0506 Pendleton SD 16 UMATILLA Pendleton 16 Pendelton Educ ation Ctr 57
1317 0506 Ukiah SD 80R UMATILLA Ukiah 80 Ukiah School 1929 1988 10740 44
1318 0506 Pendleton SD 16 UMATILLA Pendleton 16 Eastern Oregon Child ren's Multi-Treatment Center 31
1319 0506 Pendleton SD 16 UMATILLA Pendleton 16 Homestead Youth & Family Servic es 25
1320 0506 Pendleton SD 16 UMATILLA Pendleton 16 Umatilla County Youth Care Ctr 6
1321 0506 La Grande SD 1 UNION La Grande 1 La Grande High 1951 2001 162327 761
1322 0506 La Grande SD 1 UNION La Grande 1 Central Elem 1954 1997 34690 355
1323 0506 La Grande SD 1 UNION La Grande 1 Greenwood Elem 1956 1997 34919 354
1324 0506 La Grande SD 1 UNION La Grande 1 La Grande Middle 1976 1997 110572 341
1325 0506 Elgin SD 23 UNION Elgin 23 Stella Mayfield Elem 1947 45300 285
1326 0506 Cove SD 15 UNION Cove 15 Cove Sc hool 1935 1991 34801 254
1327 0506 Union SD 5 UNION Union 5 Union Elem (2 bldgs) 1918 1956 23817 240
1328 0506 La Grande SD 1 UNION La Grande 1 Island City Elem 1976 1997 25029 222
1329 0506 Union SD 5 UNION Union 5 Union High 1912 1995 53385 218
1330 0506 North Powder SD 8J UNION North Powder 8J Powder Valley Sc hool (4 bldgs) 1916 1965 47764 211
1331 0506 Imbler SD 11 UNION Imbler 11 Imbler High (4 b ldgs) 1912 1994 71170 160
1332 0506 La Grande SD 1 UNION La Grande 1 Willow Elem 1924 1997 17919 155
1333 0506 Imbler SD 11 UNION Imbler 11 Imbler Elem 147
1334 0506 Elgin SD 23 UNION Elgin 23 Elgin High 1957 40000 139
13350506 La Grande SD 1
UNION La Grande 1 Grande Ronde Child Ctr 1 1336 0506 Enterprise SD 21 WALLOWA Enterprise 21 Enterprise High 1974 24470 212
1337 0506 Enterprise SD 21 WALLOWA Enterprise 21 Enterprise Elem 1918 35293 159
1338 0506 Wallowa SD 12 WALLOWA Wallowa 12 Wallowa High 1922 1993 43098 143
1339 0506 Wallowa SD 12 WALLOWA Wallowa 12 Wallowa Elem 1949 1993 24230 120
1340 0506 Joseph SD 6 WALLOWA Joseph 6 Joseph High 1968 50800 118
1341 0506 Joseph SD 6 WALLOWA Joseph 6 Joseph Elem 1940 1997 13900 85
1342 0506 Joseph SD 6 WALLOWA Joseph 6 Joseph Middle 54
1343 0506 Joseph SD 6 WALLOWA Joseph 6 Imnaha Elem 10
1344 0506 Troy SD 54 WALLOWA Troy 54 Troy Elem 6
1345 0506 North Wasco County SD 21 WASCO North Wasc o 21 The Dalles High 1940 1975 209167 966
1346 0506 North Wasco County SD 21 WASCO North Wasc o 21 The Dalles Middle 2002 99000 658
1347 0506 North Wasco County SD 21 WASCO North Wasc o 21 Dry Hollow Elem 1960 36016 456
1348 0506 North Wasco County SD 21 WASCO North Wasc o 21 Chenowith Elem 1962 1993 38214 417
1349 0506 North Wasco County SD 21 WASCO North Wasc o 21 Colonel Wright Elem 1924 1999 34109 350
1350 0506 Dufur SD 29 WASCO Dufur 29 Dufur School 1956 1997 53552 277
Appendix A Oregon Seismic Needs Assessment DOGAMI (June 2007)

8/3/2019 Statewide Seismic Needs Assessment report
http://slidepdf.com/reader/full/statewide-seismic-needs-assessment-report 83/341
Year Year ODE 2005
School Year District County Distric t School Built Remod Sq Ft Total
1351 0506 South Wasco County SD 1 WASCO South Wasco County 1 South Wasco County High 1955 1998 42724 141
1352 0506 North Wasco County SD 21 WASCO North Wasc o 21 Mosier Community School 1920 14500 128
1353 0506 South Wasco County SD 1 WASCO South Wasco County 1 Maupin Elem 1930 1978 31691 123
1354 0506 Region 9 ESD WASCO Region 9 ESD Mid-Columbia Child Center 11
1355 0506 North Wasco County SD 21 WASCO North Wasco 21 Post Sec ondary High Needs program 4
1356 0506 Beaverton SD 48J WASHINGTON Beaverton 48J Westview High 1994 2001 258000 2,487
1357 0506 Beaverton SD 48J WASHINGTON Beaverton 48J Sunset High 1958 2002 217068 2,130
1358 0506 Beaverton SD 48J WASHINGTON Beaverton 48J Beaverton High 1996 271512 2,074
1359 0506 Beaverton SD 48JWASHINGTON Beaverton 48J Southridge High 1999 259081 2,034
1360 0506 Tigard-Tualatin SD 23J WASHINGTON Tigard 23J Tigard High (3 bldgs) 1950 1998 304439 2,005
1361 0506 Beaverton SD 48J WASHINGTON Beaverton 48J Aloha High 1967 2002 232200 2,002
1362 0506 Tigard-Tualatin SD 23J WASHINGTON Tigard 23J Tualatin High (3 bldgs) 1992 1998 255636 1,791
1363 0506 Forest Grove SD 15 WASHINGTON Forest Grove 15 Forest Grove High 1983 1998 267784 1,707
1364 0506 Hillsboro SD 1J WASHINGTON Hillsborough 1J Century High 1997 270000 1,492
1365 0506 Hillsboro SD 1J WASHINGTON Hillsborough 1J Hillsboro High 1969 2000 256652 1,474
1366 0506 Hillsboro SD 1J WASHINGTON Hillsborough 1J Glencoe High 1980 1986 240000 1,443
1367 0506 Hillsboro SD 1J WASHINGTON Hillsborough 1J Liberty High 2003 290000 1,268
1368 0506 Beaverton SD 48J WASHINGTON Beaverton 48J Stoller Midd le 1999 2001 122600 1,143
1369 0506 Beaverton SD 48J WASHINGTON Beaverton 48J Five Oaks Middle 1,106
1370 0506 Beaverton SD 48J WASHINGTON Beaverton 48J Conestoga Middle 1994 2002 120000 1,072
1371 0506 Beaverton SD 48J WASHINGTON Beaverton 48J Mountain View Midd le 1968 2002 136296 1,046
1372 0506 Tigard-Tualatin SD 23J WASHINGTON Tigard 23J Hazelbrook Middle 1992 104200 1,010
1373 0506 Beaverton SD 48J WASHINGTON Beaverton 48J Highland Park Middle 1965 2002 121777 1,009
1374 0506 Forest Grove SD 15 WASHINGTON Forest Grove 15 Neil Armstrong Middle 1970 1996 136410 946
1375 0506 Tigard-Tualatin SD 23J WASHINGTON Tigard 23J Thomas R Fowler Middle 1975 1989 124488 935
1376 0506 Sherwood SD 88J WASHINGTON Sherwood 88J Sherwood High 1971 2001 146259 930 1377 0506 Beaverton SD 48J WASHINGTON Beaverton 48J Cedar Park Middle 1965 2002 121777 926
1378 0506 Forest Grove SD 15 WASHINGTON Forest Grove 15 Tom McCall Upper Elem 1952 1996 114708 905
1379 0506 Tigard-Tualatin SD 23J WASHINGTON Tigard 23J Twality Midd le 1950 1996 113954 888
1380 0506 Sherwood SD 88J WASHINGTON Sherwood 88J Sherwood Middle 1936 2001 90249 887
1381 0506 Hillsboro SD 1J WASHINGTON Hillsborough 1J Raymond A Brown Middle 1963 1981 94215 875
1382 0506 Beaverton SD 48J WASHINGTON Beaverton 48J Meadow park Middle 1963 2002 121777 859
1383 0506 Beaverton SD 48J WASHINGTON Beaverton 48J Aloha Park Elem 1912 2002 52348 814
1384 0506 Beaverton SD 48J WASHINGTON Beaverton 48J Whitford Midd le 1963 2002 122947 814
1385 0506 Beaverton SD 48J WASHINGTON Beaverton 48J Findlay Elem 1997 1998 71300 802
1386 0506 Hillsboro SD 1J WASHINGTON Hillsborough 1J Evergreen Jr High 1981 1982 120000 778
1387 0506 Beaverton SD 48J WASHINGTON Beaverton 48J Jacob Wismer Elem 2001 73526 762
1388 0506 Beaverton SD 48J WASHINGTON Beaverton 48J Beaver Ac res Elem 1955 2002 56709 758
1389 0506 Beaverton SD 48J WASHINGTON Beaverton 48J Barnes Elem 1927 2002 52941 732
1390 0506 Beaverton SD 48J WASHINGTON Beaverton 48J Scholls Heights Elem 1999 68495 721
1391 0506 Hillsboro SD 1J WASHINGTON Hillsborough 1J JW Poynter Jr High 1959 1980 83200 721
1392 0506 Sherwood SD 88J WASHINGTON Sherwood 88J Archer Glen Elem 1995 65800 698
1393 0506 Hillsboro SD 1J WASHINGTON Hillsborough 1J Paul Patterson Elem 2000 69435 677 1394 0506 Beaverton SD 48J WASHINGTON Beaverton 48J Nancy Ryles Elem 1992 1997 69325 662
1395 0506 Tigard-Tualatin SD 23J WASHINGTON Tigard 23J Edward Byrom Elem 1980 59435 661
1396 0506 Hillsboro SD 1J WASHINGTON Hillsborough 1J Imlay Elem 2002 656
1397 0506 Hillsboro SD 1J WASHINGTON Hillsborough 1J Jackson Elem 1990 48367 656
1398 0506 Beaverton SD 48J WASHINGTON Beaverton 48J Elmonica Elem 1980 2002 50490 652
1399 0506 Sherwood SD 88J WASHINGTON Sherwood 88J Middleton Elem 2000 63306 643
1400 0506 Sherwood SD 88J WASHINGTON Sherwood 88J J Clyde Hopkins Elem 1950 2000 44500 636
1401 0506 Hillsboro SD 1J WASHINGTON Hillsborough 1J WL Henry Elem 1968 48813 616
1402 0506 Beaverton SD 48J WASHINGTON Beaverton 48J Sexton Mountain Elem 1989 2002 66500 608
1403 0506 Tigard-Tualatin SD 23J WASHINGTON Tigard 23J Charles Tigard Elem 2004 67000 605
1404 0506 Hillsboro SD 1J WASHINGTON Hillsborough 1J Ladd Ac res Elem 1968 1973 60825 603
1405 0506 Banks SD 13 WASHINGTON Banks 13 Banks Elem 1998 62000 602
1406 0506 Beaverton SD 48J WASHINGTON Beaverton 48J Rock Creek Elem 1974 1997 51687 600
1407 0506 Beaverton SD 48J WASHINGTON Beaverton 48J Hazeldale Elem 1949 2001 51250 599
1408 0506 Hillsboro SD 1J WASHINGTON Hillsborough 1J Orenc o Elem 2000 69435 594
1409 0506 Tigard-Tualatin SD 23J WASHINGTON Tigard 23J Metzger Elem 2004 67000 578
1410 0506 Beaverton SD 48J WASHINGTON Beaverton 48J Oak Hills Elem 1967 1998 48177 574 1411 0506 Hillsboro SD 1J WASHINGTON Hillsborough 1J Tobias Elem 1992 50000 563
1412 0506 Tigard-Tualatin SD 23J WASHINGTON Tigard 23J Deer Creek Elem 1997 61380 563
1413 0506 Hillsboro SD 1J WASHINGTON Hillsborough 1J Brookwood Elem 1953 1957 40641 558
1414 0506 Beaverton SD 48J WASHINGTON Beaverton 48J McKinley Elem 1955 1999 45893 552
1415 0506 Hillsboro SD 1J WASHINGTON Hillsborough 1J JB Thomas Middle 1928 1972 215000 543
1416 0506 Hillsboro SD 1J WASHINGTON Hillsborough 1J Mooberry Elem 1963 1971 47096 543
1417 0506 Beaverton SD 48J WASHINGTON Beaverton 48J Vose Elem 1960 1999 51520 542
1418 0506 Beaverton SD 48J WASHINGTON Beaverton 48J Cooper Mountain Elem 1914 1999 51935 541
1419 0506 Tigard-Tualatin SD 23J WASHINGTON Tigard 23J James Templeton Elem 1965 1996 48798 537
1420 0506 Tigard-Tualatin SD 23J WASHINGTON Tigard 23J Mary Woodward Elem 1980 65750 537
1421 0506 Tigard-Tualatin SD 23J WASHINGTON Tigard 23J Tualatin Elem 2004 67000 537
1422 0506 Beaverton SD 48J WASHINGTON Beaverton 48J Fir Grove Elem 1954 1999 59912 533
1423 0506 Hillsboro SD 1J WASHINGTON Hillsborough 1J W Verne McKinney Elem 1970 46763 533
1424 0506 Tigard-Tualatin SD 23J WASHINGTON Tigard 23J Durham Elem 1989 1996 63175 532
1425 0506 Beaverton SD 48J WASHINGTON Beaverton 48J Bethany Elem 1970 1992 49934 515
Appendix A Oregon Seismic Needs Assessment DOGAMI (June 2007)
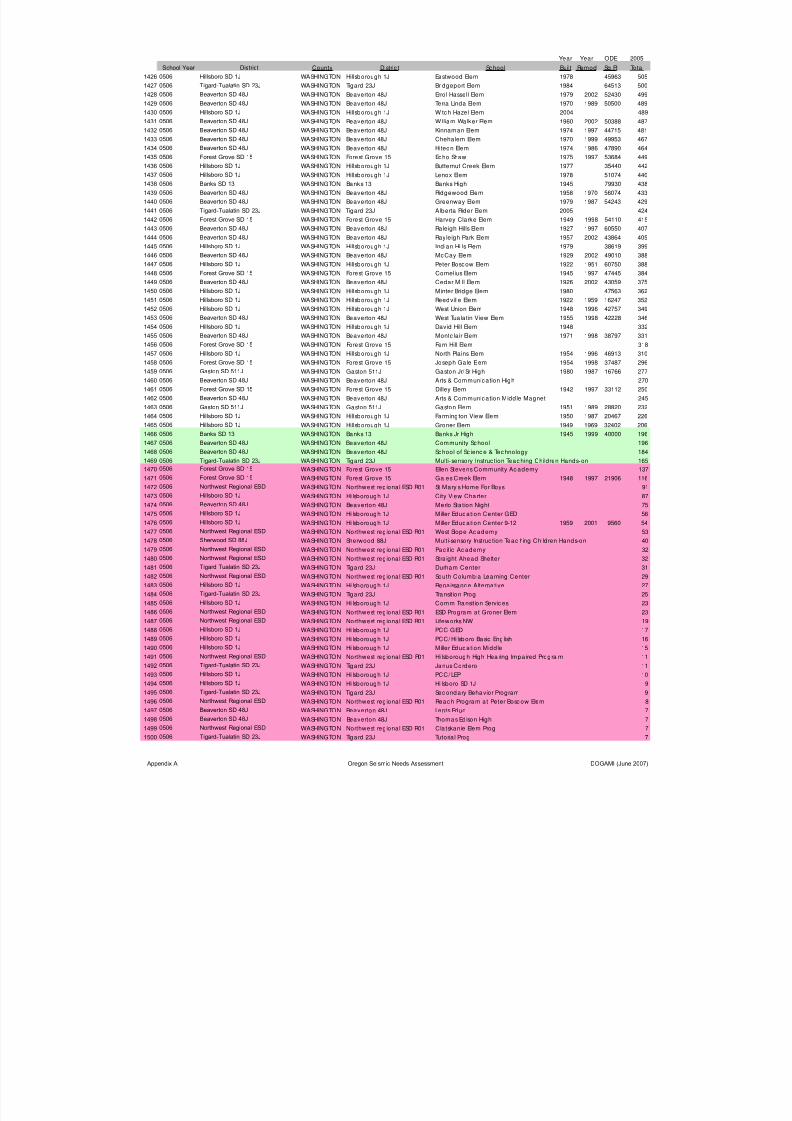
8/3/2019 Statewide Seismic Needs Assessment report
http://slidepdf.com/reader/full/statewide-seismic-needs-assessment-report 84/341
Year Year ODE 2005
School Year District County Distric t School Built Remod Sq Ft Total
1426 0506 Hillsboro SD 1J WASHINGTON Hillsborough 1J Eastwood Elem 1978 45963 505
1427 0506 Tigard-Tualatin SD 23J WASHINGTON Tigard 23J Bridgeport Elem 1984 64513 500
1428 0506 Beaverton SD 48J WASHINGTON Beaverton 48J Errol Hassell Elem 1979 2002 52430 499
1429 0506 Beaverton SD 48J WASHINGTON Beaverton 48J Terra Linda Elem 1970 1989 50500 489
1430 0506 Hillsboro SD 1J WASHINGTON Hillsborough 1J Witch Hazel Elem 2004 489
1431 0506 Beaverton SD 48J WASHINGTON Beaverton 48J William Walker Elem 1960 2002 50388 487
1432 0506 Beaverton SD 48J WASHINGTON Beaverton 48J Kinnaman Elem 1974 1997 44715 481
1433 0506 Beaverton SD 48J WASHINGTON Beaverton 48J Chehalem Elem 1970 1999 49953 467
1434 0506 Beaverton SD 48JWASHINGTON Beaverton 48J Hiteon Elem 1974 1986 47890 464
1435 0506 Forest Grove SD 15 WASHINGTON Forest Grove 15 Echo Shaw 1975 1997 53684 449
1436 0506 Hillsboro SD 1J WASHINGTON Hillsborough 1J Butternut Creek Elem 1977 35440 442
1437 0506 Hillsboro SD 1J WASHINGTON Hillsborough 1J Lenox Elem 1978 51074 440
1438 0506 Banks SD 13 WASHINGTON Banks 13 Banks High 1945 79930 438
1439 0506 Beaverton SD 48J WASHINGTON Beaverton 48J Ridgewood Elem 1958 1970 56074 433
1440 0506 Beaverton SD 48J WASHINGTON Beaverton 48J Greenway Elem 1979 1987 54243 429
1441 0506 Tigard-Tualatin SD 23J WASHINGTON Tigard 23J Alberta Rider Elem 2005 424
1442 0506 Forest Grove SD 15 WASHINGTON Forest Grove 15 Harvey Clarke Elem 1949 1998 54110 415
1443 0506 Beaverton SD 48J WASHINGTON Beaverton 48J Raleigh Hills Elem 1927 1997 60550 407
1444 0506 Beaverton SD 48J WASHINGTON Beaverton 48J Rayleigh Park Elem 1957 2002 43864 405
1445 0506 Hillsboro SD 1J WASHINGTON Hillsborough 1J Indian Hills Elem 1979 38619 399
1446 0506 Beaverton SD 48J WASHINGTON Beaverton 48J McCay Elem 1929 2002 49010 388
1447 0506 Hillsboro SD 1J WASHINGTON Hillsborough 1J Peter Boscow Elem 1922 1951 60750 388
1448 0506 Forest Grove SD 15 WASHINGTON Forest Grove 15 Cornelius Elem 1945 1997 47445 384
1449 0506 Beaverton SD 48J WASHINGTON Beaverton 48J Cedar Mill Elem 1926 2002 43059 375
1450 0506 Hillsboro SD 1J WASHINGTON Hillsborough 1J Minter Bridge Elem 1980 47563 362
1451 0506 Hillsboro SD 1J WASHINGTON Hillsborough 1J Reedville Elem 1922 1959 16247 352 1452 0506 Hillsboro SD 1J WASHINGTON Hillsborough 1J West Union Elem 1948 1996 42757 349
1453 0506 Beaverton SD 48J WASHINGTON Beaverton 48J West Tua latin View Elem 1955 1998 42228 346
1454 0506 Hillsboro SD 1J WASHINGTON Hillsborough 1J David Hill Elem 1948 332
1455 0506 Beaverton SD 48J WASHINGTON Beaverton 48J Montc lair Elem 1971 1998 38797 331
1456 0506 Forest Grove SD 15 WASHINGTON Forest Grove 15 Fern Hill Elem 318
1457 0506 Hillsboro SD 1J WASHINGTON Hillsborough 1J North Plains Elem 1954 1996 46913 310
1458 0506 Forest Grove SD 15 WASHINGTON Forest Grove 15 Joseph Gale Elem 1954 1998 37487 296
1459 0506 Gaston SD 511J WASHINGTON Gaston 511J Gaston Jr/ Sr High 1980 1987 16766 277
1460 0506 Beaverton SD 48J WASHINGTON Beaverton 48J Arts & Communication High 270
1461 0506 Forest Grove SD 15 WASHINGTON Forest Grove 15 Dilley Elem 1942 1997 33112 250
1462 0506 Beaverton SD 48J WASHINGTON Beaverton 48J Arts & Communication Midd le Magnet 245
1463 0506 Gaston SD 511J WASHINGTON Gaston 511J Gaston Elem 1951 1989 28820 232
1464 0506 Hillsboro SD 1J WASHINGTON Hillsborough 1J Farmington View Elem 1950 1987 20467 226
1465 0506 Hillsboro SD 1J WASHINGTON Hillsborough 1J Groner Elem 1949 1969 32402 206
1466 0506 Banks SD 13 WASHINGTON Banks 13 Banks Jr High 1945 1999 40000 196
1467 0506 Beaverton SD 48J WASHINGTON Beaverton 48J Community School 196
1468 0506 Beaverton SD 48J WASHINGTON Beaverton 48J School of Sc ienc e & Technology 184 1469 0506 Tigard-Tualatin SD 23J WASHINGTON Tigard 23J Multi-sensory Instruc tion Teaching Children Hands-on 165
1470 0506 Forest Grove SD 15 WASHINGTON Forest Grove 15 Ellen Stevens Community Ac ademy 137
1471 0506 Forest Grove SD 15 WASHINGTON Forest Grove 15 Gales Creek Elem 1948 1997 21906 116
1472 0506 Northwest Regional ESD WASHINGTON Northwest regiona l ESD R01 St Mary's Home For Boys 91
1473 0506 Hillsboro SD 1J WASHINGTON Hillsborough 1J City View Cha rter 87
1474 0506 Beaverton SD 48J WASHINGTON Beaverton 48J Merlo Sta tion Night 75
1475 0506 Hillsboro SD 1J WASHINGTON Hillsborough 1J Miller Education Center GED 56
1476 0506 Hillsboro SD 1J WASHINGTON Hillsborough 1J Miller Education Center 9-12 1959 2001 9560 54
1477 0506 Northwest Regional ESD WASHINGTON Northwest regiona l ESD R01 West Slope Ac ademy 53
1478 0506 Sherwood SD 88J WASHINGTON Sherwood 88J Multi-sensory Instruc tion Teac hing Child ren Hands-on 40
1479 0506 Northwest Regional ESD WASHINGTON Northwest regiona l ESD R01 Pac ific Ac ademy 32
1480 0506 Northwest Regional ESD WASHINGTON Northwest regiona l ESD R01 Stra ight Ahead Shelter 32
1481 0506 Tigard-Tualatin SD 23J WASHINGTON Tigard 23J Durham Center 31
1482 0506 Northwest Regional ESD WASHINGTON Northwest regiona l ESD R01 South Columb ia Learning Center 29
1483 0506 Hillsboro SD 1J WASHINGTON Hillsborough 1J Renaissanc e Alterna tive 27
1484 0506 Tigard-Tualatin SD 23J WASHINGTON Tigard 23J Transition Prog 25
14850506 Hillsboro SD 1J
WASHINGTON Hillsborough 1J Comm Transition Servic es 23 1486 0506 Northwest Regional ESD WASHINGTON Northwest regiona l ESD R01 ESD Program at Groner Elem 23
1487 0506 Northwest Regional ESD WASHINGTON Northwest regiona l ESD R01 Lifeworks NW 19
1488 0506 Hillsboro SD 1J WASHINGTON Hillsborough 1J PCC GED 17
1489 0506 Hillsboro SD 1J WASHINGTON Hillsborough 1J PCC/ Hillsboro Basic Eng lish 16
1490 0506 Hillsboro SD 1J WASHINGTON Hillsborough 1J Miller Education Midd le 15
1491 0506 Northwest Regional ESD WASHINGTON Northwest regiona l ESD R01 Hillsborough High Hea ring Impaired Progra m 11
1492 0506 Tigard-Tualatin SD 23J WASHINGTON Tigard 23J Janus Cordero 11
1493 0506 Hillsboro SD 1J WASHINGTON Hillsborough 1J PCC/ LEP 10
1494 0506 Hillsboro SD 1J WASHINGTON Hillsborough 1J Hillsboro SD 1J 9
1495 0506 Tigard-Tualatin SD 23J WASHINGTON Tigard 23J Sec ondary Behavior Program 9
1496 0506 Northwest Regional ESD WASHINGTON Northwest regiona l ESD R01 Reac h Program at Peter Bosc ow Elem 8
1497 0506 Beaverton SD 48J WASHINGTON Beaverton 48J Lents Educ 7
1498 0506 Beaverton SD 48J WASHINGTON Beaverton 48J Thomas Ed ison High 7
1499 0506 Northwest Regional ESD WASHINGTON Northwest regiona l ESD R01 Cla tskanie Elem Prog 7
1500 0506 Tigard-Tualatin SD 23J WASHINGTON Tigard 23J Tutoria l Prog 7
Appendix A Oregon Seismic Needs Assessment DOGAMI (June 2007)
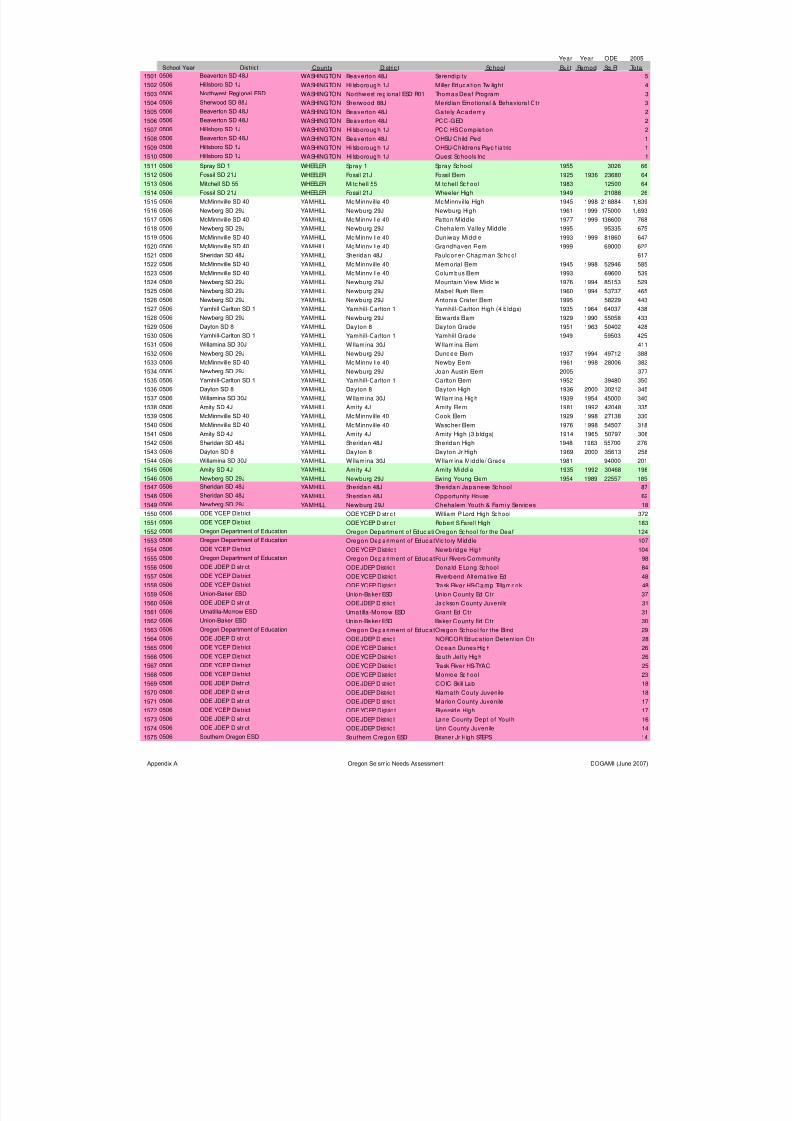
8/3/2019 Statewide Seismic Needs Assessment report
http://slidepdf.com/reader/full/statewide-seismic-needs-assessment-report 85/341
Year Year ODE 2005
School Year District County Distric t School Built Remod Sq Ft Total
1501 0506 Beaverton SD 48J WASHINGTON Beaverton 48J Serend ip ity 5
1502 0506 Hillsboro SD 1J WASHINGTON Hillsborough 1J Miller Education Twilight 4
1503 0506 Northwest Regional ESD WASHINGTON Northwest regiona l ESD R01 Thomas Deaf Program 3
1504 0506 Sherwood SD 88J WASHINGTON Sherwood 88J Merid ian Emotiona l & Behaviora l Ctr 3
1505 0506 Beaverton SD 48J WASHINGTON Beaverton 48J Gately Ac ademy 2
1506 0506 Beaverton SD 48J WASHINGTON Beaverton 48J PCC-GED 2
1507 0506 Hillsboro SD 1J WASHINGTON Hillsborough 1J PCC HSComp letion 2
1508 0506 Beaverton SD 48J WASHINGTON Beaverton 48J OHSU-Child Ped 1
1509 0506 Hillsboro SD 1J WASHINGTON Hillsborough 1J OHSU-Child rens Psychia tric 1
1510 0506 Hillsboro SD 1J WASHINGTON Hillsborough 1J Quest Schools Inc 1
1511 0506 Spray SD 1 WHEELER Spray 1 Spray School 1955 3026 66
1512 0506 Fossil SD 21J WHEELER Fossil 21J Fossil Elem 1925 1936 23680 64
1513 0506 Mitchell SD 55 WHEELER Mitc hell 55 Mitchell School 1983 12500 64
1514 0506 Fossil SD 21J WHEELER Fossil 21J Wheeler High 1949 21088 26
1515 0506 McMinnville SD 40 YAMHILL Mc Minnville 40 McMinnville High 1945 1998 216884 1,839
1516 0506 Newberg SD 29J YAMHILL Newburg 29J Newburg High 1961 1999 175000 1,693
1517 0506 McMinnville SD 40 YAMHILL Mc Minnville 40 Patton Midd le 1977 1999 136600 768
1518 0506 Newberg SD 29J YAMHILL Newburg 29J Chehalem Valley Middle 1995 95335 675
1519 0506 McMinnville SD 40 YAMHILL Mc Minnville 40 Duniway Middle 1993 1999 81860 647
1520 0506 McMinnville SD 40 YAMHILL Mc Minnville 40 Grandhaven Elem 1999 69000 622
1521 0506 Sheridan SD 48J YAMHILL Sheridan 48J Faulconer-Chapman School 617
1522 0506 McMinnville SD 40 YAMHILL Mc Minnville 40 Memorial Elem 1945 1998 52946 585
1523 0506 McMinnville SD 40 YAMHILL Mc Minnville 40 Columbus Elem 1993 69600 539
1524 0506 Newberg SD 29J YAMHILL Newburg 29J Mountain View Midd le 1976 1994 85153 529
1525 0506 Newberg SD 29J YAMHILL Newburg 29J Mabel Rush Elem 1960 1994 53737 465
1526 0506 Newberg SD 29J YAMHILL Newburg 29J Antonia Crater Elem 1995 58229 443 1527 0506 Yamhill-Carlton SD 1 YAMHILL Yamhill-Carlton 1 Yamhill-Carlton High (4 bldgs) 1935 1964 64037 438
1528 0506 Newberg SD 29J YAMHILL Newburg 29J Edwards Elam 1929 1990 55058 433
1529 0506 Dayton SD 8 YAMHILL Dayton 8 Dayton Grade 1951 1963 50402 428
1530 0506 Yamhill-Carlton SD 1 YAMHILL Yamhill-Carlton 1 Yamhill Grade 1949 59503 425
1531 0506 Willamina SD 30J YAMHILL Willamina 30J Willamina Elem 411
1532 0506 Newberg SD 29J YAMHILL Newburg 29J Dundee Elem 1937 1994 49712 388
1533 0506 McMinnville SD 40 YAMHILL Mc Minnville 40 Newby Elem 1961 1998 28006 382
1534 0506 Newberg SD 29J YAMHILL Newburg 29J Joan Austin Elem 2005 377
1535 0506 Yamhill-Carlton SD 1 YAMHILL Yamhill-Carlton 1 Carlton Elem 1952 39480 350
1536 0506 Dayton SD 8 YAMHILL Dayton 8 Dayton High 1936 2000 30212 345
1537 0506 Willamina SD 30J YAMHILL Willamina 30J Willamina High 1939 1954 45000 340
1538 0506 Amity SD 4J YAMHILL Amity 4J Amity Elem 1981 1992 42048 335
1539 0506 McMinnville SD 40 YAMHILL Mc Minnville 40 Cook Elem 1929 1998 27138 330
1540 0506 McMinnville SD 40 YAMHILL Mc Minnville 40 Wascher Elem 1976 1998 54507 318
1541 0506 Amity SD 4J YAMHILL Amity 4J Amity High (3 bldgs) 1914 1965 50797 306
1542 0506 Sheridan SD 48J YAMHILL Sheridan 48J Sheridan High 1948 1963 55700 276
1543 0506 Dayton SD 8 YAMHILL Dayton 8 Dayton Jr High 1969 2000 35613 258 1544 0506 Willamina SD 30J YAMHILL Willamina 30J Willamina Middle/ Grade 1981 94000 201
1545 0506 Amity SD 4J YAMHILL Amity 4J Amity Middle 1935 1992 30468 198
1546 0506 Newberg SD 29J YAMHILL Newburg 29J Ewing Young Elem 1954 1989 22557 185
1547 0506 Sheridan SD 48J YAMHILL Sheridan 48J Sheridan Japanese Sc hool 87
1548 0506 Sheridan SD 48J YAMHILL Sheridan 48J Opportunity House 62
1549 0506 Newberg SD 29J YAMHILL Newburg 29J Chehalem Youth & Family Servic es 18
1550 0506 ODE YCEP District ODE YCEP Distric t William P Lord High School 372
1551 0506 ODE YCEP District ODE YCEP Distric t Robert S Farell High 183
1552 0506 Oregon Department of Educat ion Oregon Department of Educ atiOregon School for the Deaf 124
1553 0506 Oregon Department of Educat ion Oregon Department of EducatVic tory Midd le 107
1554 0506 ODE YCEP District ODE YCEP Distric t Newbridge High 104
1555 0506 Oregon Department of Educat ion Oregon Department of EducatFour Rivers Community 98
1556 0506 ODE JDEP District ODE JDEP Distric t Donald E Long School 84
1557 0506 ODE YCEP District ODE YCEP Distric t Riverbend Alterna tive Ed 48
1558 0506 ODE YCEP District ODE YCEP Distric t Trask River HS-Camp Tillamook 48
1559 0506 Union-Baker ESD Union-Baker ESD Union County Ed Ctr 37
15600506 ODE JDEP District
ODE JDEP Distric t Jackson County Juvenile 31 1561 0506 Umatilla-Morrow ESD Umatilla -Morrow ESD Grant Ed Ctr 31
1562 0506 Union-Baker ESD Union-Baker ESD Baker County Ed Ctr 30
1563 0506 Oregon Department of Educat ion Oregon Department of EducatOregon School for the Blind 29
1564 0506 ODE JDEP District ODE JDEP Distric t NORCOR Educ ation Detention Ctr 28
1565 0506 ODE YCEP District ODE YCEP Distric t Ocean Dunes High 26
1566 0506 ODE YCEP District ODE YCEP Distric t South Jetty High 26
1567 0506 ODE YCEP District ODE YCEP Distric t Trask River HS-TYAC 25
1568 0506 ODE YCEP District ODE YCEP Distric t Monroe Sc hool 23
1569 0506 ODE JDEP District ODE JDEP Distric t COIC Skill Lab 18
1570 0506 ODE JDEP District ODE JDEP Distric t Klamath Couty Juvenile 18
1571 0506 ODE JDEP District ODE JDEP Distric t Marion County Juvenile 17
1572 0506 ODE YCEP District ODE YCEP Distric t Riverside High 17
1573 0506 ODE JDEP District ODE JDEP Distric t Lane County Dept of Youth 16
1574 0506 ODE JDEP District ODE JDEP Distric t Linn County Juvenile 14
1575 0506 Southern Oregon ESD Southern Oregon ESD Brixner Jr High STEPS 14
Appendix A Oregon Seismic Needs Assessment DOGAMI (June 2007)
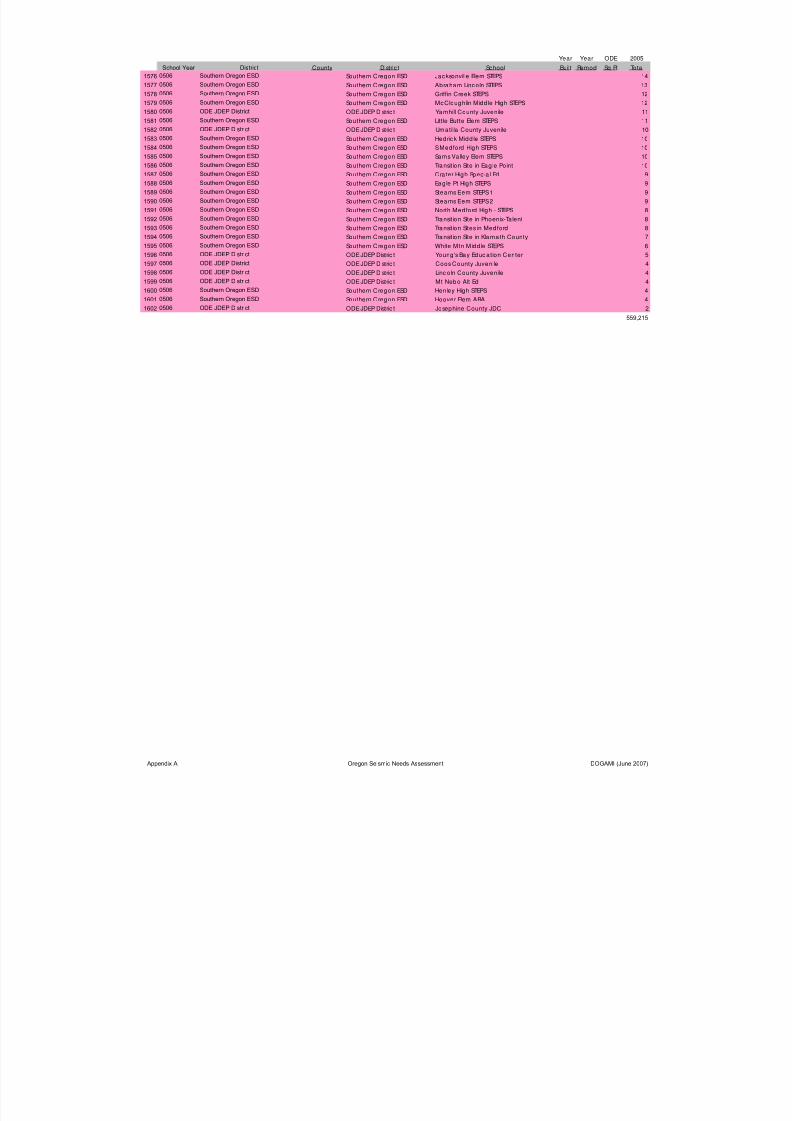
8/3/2019 Statewide Seismic Needs Assessment report
http://slidepdf.com/reader/full/statewide-seismic-needs-assessment-report 86/341
Year Year ODE 2005
School Year District County Distric t School Built Remod Sq Ft Total
1576 0506 Southern Oregon ESD Southern Oregon ESD Jacksonville Elem STEPS 14
1577 0506 Southern Oregon ESD Southern Oregon ESD Abraham Lincoln STEPS 13
1578 0506 Southern Oregon ESD Southern Oregon ESD Griffin Creek STEPS 12
1579 0506 Southern Oregon ESD Southern Oregon ESD McCloughlin Midd le High STEPS 12
1580 0506 ODE JDEP District ODE JDEP Distric t Yamhill County Juvenile 11
1581 0506 Southern Oregon ESD Southern Oregon ESD Little Butte Elem STEPS 11
1582 0506 ODE JDEP District ODE JDEP Distric t Umatilla County Juvenile 10
1583 0506 Southern Oregon ESD Southern Oregon ESD Hedrick Midd le STEPS 10
1584 0506 Southern Oregon ESD Southern Oregon ESD SMedford High STEPS 10
1585 0506 Southern Oregon ESD Southern Oregon ESD Sams Va lley Elem STEPS 10
1586 0506 Southern Oregon ESD Southern Oregon ESD Transition Site in Eag le Point 10
1587 0506 Southern Oregon ESD Southern Oregon ESD Cra ter High Spec ia l Ed 9
1588 0506 Southern Oregon ESD Southern Oregon ESD Eagle Pt High STEPS 9
1589 0506 Southern Oregon ESD Southern Oregon ESD Stearns Elem STEPS1 9
1590 0506 Southern Oregon ESD Southern Oregon ESD Stearns Elem STEPS2 9
1591 0506 Southern Oregon ESD Southern Oregon ESD North Medford High - STEPS 8
1592 0506 Southern Oregon ESD Southern Oregon ESD Transition Site in Phoenix-Ta lent 8
1593 0506 Southern Oregon ESD Southern Oregon ESD Transition Sites in Medford 8
1594 0506 Southern Oregon ESD Southern Oregon ESD Transition Site in Klamath County 7
1595 0506 Southern Oregon ESD Southern Oregon ESD White Mtn Midd le STEPS 6
1596 0506 ODE JDEP District ODE JDEP Distric t Young 's Bay Educ ation Center 5
1597 0506 ODE JDEP District ODE JDEP Distric t Coos County Juvenile 4
1598 0506 ODE JDEP District ODE JDEP Distric t Linc oln County Juvenile 4
1599 0506 ODE JDEP District ODE JDEP Distric t Mt Nebo Alt Ed 4
1600 0506 Southern Oregon ESD Southern Oregon ESD Henley High STEPS 4
1601 0506 Southern Oregon ESD Southern Oregon ESD Hoover Elem ABA 4
1602 0506 ODE JDEP District ODE JDEP Distric t Josephine County JDC 2
559,215
Appendix A Oregon Seismic Needs Assessment DOGAMI (June 2007)
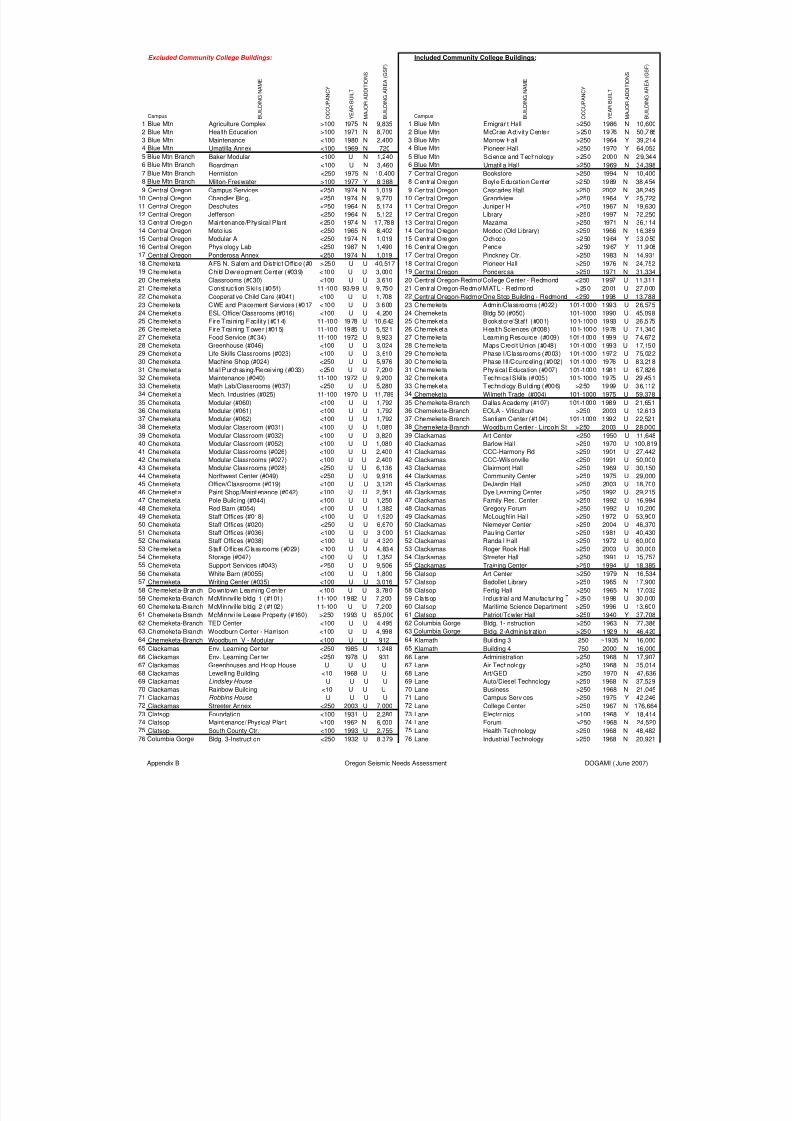
8/3/2019 Statewide Seismic Needs Assessment report
http://slidepdf.com/reader/full/statewide-seismic-needs-assessment-report 87/341
Excluded Community College Buildings: Included Community College Buildings:
Campus B U I L D I N G N
A M E
O C C U P A N C Y
Y E A R
B U I L T
M A J O R
A D D I T I O N S
B U I L D I N G A
R E A
( G S F )
Campus B U I L D I N G N
A M E
O C C U P A N C Y
Y E A R
B U I L T
M A J O R
A D D I T I O N S
B U I L D I N G A
R E A
( G S F )
1 Blue Mtn Agriculture Complex >100 1975 N 9,835 1 Blue Mtn Emigrant Hall >250 1986 N 10,600
2 Blue Mtn Health Education >100 1971 N 8,700 2 Blue Mtn McCrae Act iv ity Center >250 1976 N 50,786
3 Blue Mtn Maintenance <100 1980 N 2,400 3 Blue Mtn Morrow Hall >250 1964 Y 39,214
4 Blue Mtn Umatilla Annex <100 1969 N 720 4 Blue Mtn Pioneer Hall >250 1970 Y 64,0525 Blue Mtn Branch Baker Modular <100 U N 1,240 5 Blue Mtn Science and Technology >250 2000 N 29,344
6 Blue Mtn Branch Boardman <100 U N 3,460 6 Blue Mtn Umatilla Hall >250 1969 N 34,398
7 Blue Mtn Branch Hermiston <250 1975 N 10,400 7 Central Oregon Bookstore >250 1994 N 10,400
8 Blue Mtn Branch Milton-Freewater >100 1977 Y 8,388 8 Central Oregon Boyle Educat ion Center >250 1989 N 38,454
9 Central Oregon Campus Services <250 1974 N 1,019 9 Central Oregon Cascades Hall >250 2002 N 38,245
10 Central Oregon Chandler Bldg. <250 1974 N 9,770 10 Central Oregon Grandview >250 1964 Y 25,722
11 Central Oregon Deschutes <250 1964 N 5,174 11 Central Oregon Juniper H. <250 1967 N 19,630
12 Central Oregon Jefferson <250 1964 N 5,122 12 Central Oregon Library >250 1997 N 72,250
13 Central Oregon Maintenance/Physical Plant <250 1974 N 17,788 13 Central Oregon Mazama >250 1971 N 36,114
14 Central Oregon Metolius <250 1965 N 8,402 14 Central Oregon Modoc (Old Library) >250 1966 N 16,389
15 Central Oregon Modular A <250 1974 N 1,019 15 Central Oregon Ochoco >250 1964 Y 33,050
16 Central Oregon Physiology Lab <250 1987 N 1,490 16 Central Oregon Pence >250 1967 Y 11,908
17 Central Oregon Ponderosa Annex <250 1974 N 1,019 17 Central Oregon Pinckney Ctr. >250 1983 N 14,931
18 Chemeketa AFS N. Salem and Distr ict Office (#0 >250 U U 40,517 18 Central Oregon Pioneer Hall >250 1976 N 24,752
19 Chemeketa Chi ld Development Center (#039) <100 U U 3,000 19 Central Oregon Ponderosa >250 1971 N 31,334
20 Chemeketa Classrooms (#030) <100 U U 3,610 20 Central Oregon-Redmo College Center - Redmond <250 1997 U 11,311
21 Chemeketa Construction Ski lls (#051) 11-100 93/99 U 9,750 21 Central Oregon-Redmo MATL - Redmond >250 2001 U 27,000
22 Chemeketa Cooperative Child Care (#041) <100 U U 1,708 22 Central Oregon-Redmo One Stop Building - Redmond <250 1998 U 13,788
23 Chemeketa CWE and Placement Services (#017 <100 U U 3,600 23 Chemeketa Admin/Classrooms (#022) 101-1000 1993 U 26,57524 Chemeketa ESL Office/Classrooms (#016) <100 U U 4,200 24 Chemeketa Bldg 50 (#050) 101-1000 1990 U 45,098
25 Chemeketa Fire Training Facil ity (#014) 11-100 1978 U 10,642 25 Chemeketa Bookstore/Staff (#001) 101-1000 1993 U 26,575
26 Chemeketa Fire Training Tower (#015) 11-100 1985 U 5,521 26 Chemeketa Health Sciences (#008) 101-1000 1978 U 71,340
27 Chemeketa Food Service (#034) 11-100 1972 U 9,923 27 Chemeketa Learning Resource (#009) 101-1000 1999 U 74,672
28 Chemeketa Greenhouse (#046) <100 U U 3,024 28 Chemeketa Maps Credit Union (#048) 101-1000 1993 U 17,150
29 Chemeketa Life Skills Classrooms (#023) <100 U U 3,610 29 Chemeketa Phase I/Classrooms (#003) 101-1000 1972 U 75,022
30 Chemeketa Machine Shop (#024) <250 U U 5,976 30 Chemeketa Phase III/Councel ing (#002) 101-1000 1976 U 83,218
31 Chemeketa Mai l Purchasing/Receiving (#033) <250 U U 7,200 31 Chemeketa Physical Education (#007) 101-1000 1981 U 67,826
32 Chemeketa Maintenance (#040) 11-100 1972 U 9,200 32 Chemeketa Technica l Skil ls (#005) 101-1000 1975 U 29,451
33 Chemeketa Math Lab/Classrooms (#037) <250 U U 5,280 33 Chemeketa Technology Building (#006) >250 1999 U 36,112
34 Chemeketa Mech. Industries (#025) 11-100 1970 U 11,789 34 Chemeketa Wilmeth Trade (#004) 101-1000 1975 U 59,378
35 Chemeketa Modular (#060) <100 U U 1,792 35 Chemeketa-Branch Dallas Academy (#107) 101-1000 1989 U 21,651
36 Chemeketa Modular (#061) <100 U U 1,792 36 Chemeketa-Branch EOLA - Viticulture >250 2003 U 12,613
37 Chemeketa Modular (#062) <100 U U 1,792 37 Chemeketa-Branch Santiam Center (#104) 101-1000 1992 U 22,521
38 Chemeketa Modular Classroom (#031) <100 U U 1,080 38 Chemeketa-Branch Woodburn Center - Lincoln St >250 2003 U 28,000
39 Chemeketa Modular Classroom (#032) <100 U U 3,820 39 Clackamas Art Center <250 1950 U 11,648
40 Chemeketa Modular Classroom (#052) <100 U U 1,080 40 Clackamas Barlow Hall >250 1970 U 100,819
41 Chemeketa Modular Classrooms (#026) <100 U U 2,400 41 Clackamas CCC-Harmony Rd >250 1901 U 27,44242 Chemeketa Modular Classrooms (#027) <100 U U 2,400 42 Clackamas CCC-Wilsonville <250 1991 U 50,000
43 Chemeketa Modular Classrooms (#028) <250 U U 6,136 43 Clackamas Clairmont Hall >250 1969 U 30,150
44 Chemeketa Northwest Center (#049) <250 U U 9,916 44 Clackamas Community Center >250 1975 U 29,000
45 Chemeketa Office/Classrooms (#019) <100 U U 3,120 45 Clackamas DeJardin Hall >250 2003 U 18,700
46 Chemeketa Paint Shop/Maintenance (#042) <100 U U 2,561 46 Clackamas Dye Learning Center >250 1992 U 29,215
47 Chemeketa Pole Building (#044) <100 U U 1,250 47 Clackamas Family Res. Center >250 1992 U 16,994
48 Chemeketa Red Barn (#054) <100 U U 1,382 48 Clackamas Gregory Forum >250 1992 U 10,200
49 Chemeketa Staff Offices (#018) <100 U U 1,920 49 Clackamas McLoughlin Hall >250 1972 U 53,900
50 Chemeketa Staff Offices (#020) <250 U U 6,670 50 Clackamas Niemeyer Center >250 2004 U 46,370
51 Chemeketa Staff Offices (#036) <100 U U 3,000 51 Clackamas Pauling Center >250 1981 U 40,430
52 Chemeketa Staff Offices (#038) <100 U U 4,320 52 Clackamas Randall Hall >250 1972 U 60,000
53 Chemeketa Sta ff Off ices/Classrooms (#029) <100 U U 4,834 53 Clackamas Roger Rook Hall >250 2003 U 30,000
54 Chemeketa Storage (#047) <100 U U 1,352 54 Clackamas Streeter Hall >250 1991 U 15,757
55 Chemeketa Support Services (#043) <250 U U 9,506 55 Clackamas Training Center >250 1994 U 18,385
56 Chemeketa White Barn (#0055) <100 U U 1,800 56 Clatsop Art Center >250 1979 N 16,534
57 Chemeketa Writing Center (#035) <100 U U 3,016 57 Clatsop Badollet Library >250 1965 N 17,900
58 Chemeketa-Branch Downtown Learning Center <100 U U 3,780 58 Clatsop Fertig Hall >250 1965 N 17,032
59 Chemeketa-Branch McMinnville bldg 1 (#101) 11-100 1982 U 7,200 59 Clatsop Industr ial and Manufactur ing >250 1998 U 30,000
60 Chemeketa-Branch McMinnvil le bldg 2 (#102) 11-100 U U 7,200 60 Clatsop Maritime Science Department >250 1996 U 13,60061 Chemeketa-Branch McMinnville Lease Property (#160) >250 1993 U 65,000 61 Clatsop Patriot/Towler Hall >250 1940 Y 37,708
62 Chemeketa-Branch TED Center <100 U U 4,495 62 Columbia Gorge Bldg. 1-Instruction >250 1963 N 77,386
63 Chemeketa-Branch Woodburn Center - Harrison <100 U U 4,998 63 Columbia Gorge Bldg. 2-Administration >250 1929 N 46,420
64 Chemeketa-Branch Woodburn IV - Modular <100 U U 912 64 Klamath Building 3 250 ~1935 N 16,000
65 Clackamas Env. Learning Center <250 1985 U 1,248 65 Klamath Building 4 750 2000 N 16,000
66 Clackamas Env. Learning Center <250 1978 U 931 66 Lane Administration >250 1968 N 17,907
67 Clackamas Greenhouses and Hoop House U U U U 67 Lane Air Technology >250 1968 N 35,014
68 Clackamas Lewelling Building <10 1968 U U 68 Lane Art/GED >250 1970 N 47,636
69 Clackamas Lindsley House U U U U 69 Lane Auto/Diesel Technology >250 1968 N 37,529
70 Clackamas Rainbow Building <10 U U U 70 Lane Business >250 1968 N 21,045
71 Clackamas Robbins House U U U U 71 Lane Campus Services >250 1975 Y 42,246
72 Clackamas Streeter Annex <250 2003 U 7,000 72 Lane College Center >250 1967 N 176,664
73 Clatsop Foundation <100 1931 U 2,280 73 Lane Electronics >100 1968 Y 18,414
74 Clatsop Maintenance/Physical Plant >100 1962 N 6,000 74 Lane Forum >250 1968 N 24,520
75 Clatsop South County Ctr. <100 1993 U 2,755 75 Lane Health Technology >250 1968 N 48,482
76 Columbia Gorge Bldg. 3-Instruction <250 1932 U 8,379 76 Lane Industrial Technology >250 1968 N 20,921
Appendix B Oregon Seismic Needs Assessment DOGAMI (June 2007)
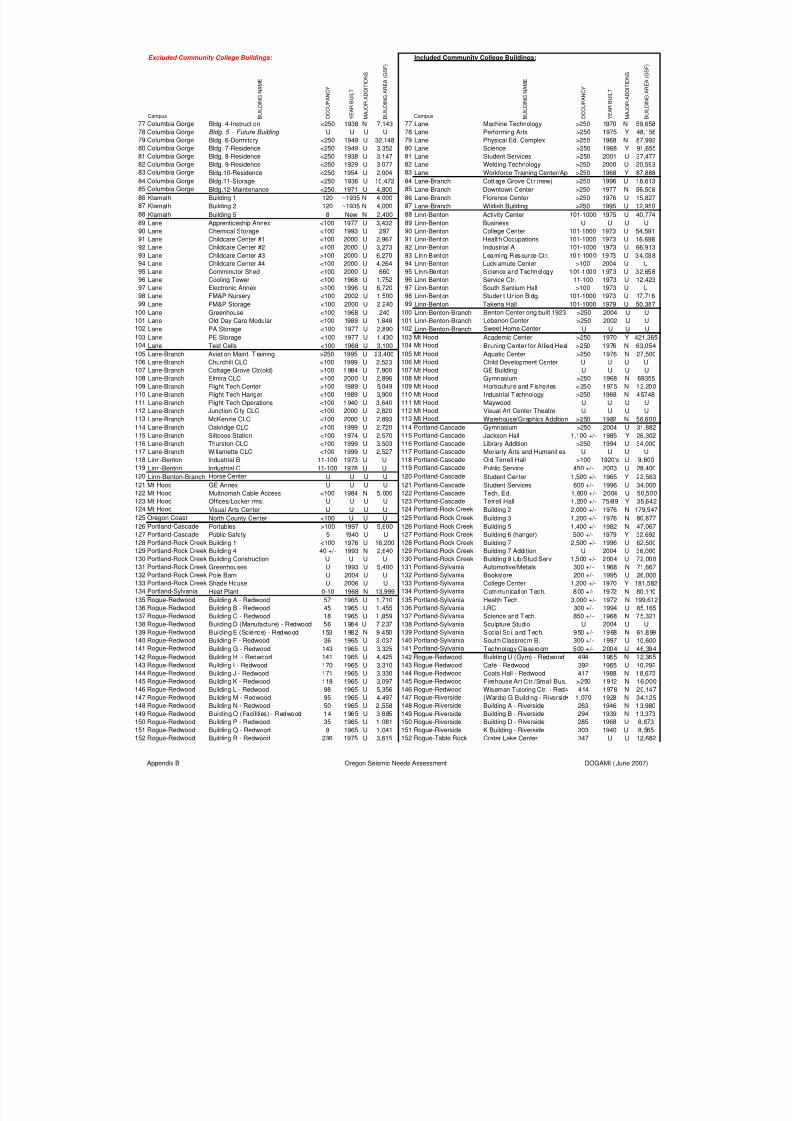
8/3/2019 Statewide Seismic Needs Assessment report
http://slidepdf.com/reader/full/statewide-seismic-needs-assessment-report 88/341
Excluded Community College Buildings: Included Community College Buildings:
Campus B U I L D I N G N
A M E
O C C U P A N C Y
Y E A R
B U I L T
M A J O R
A D D I T I O N S
B U I L D I N G A
R E A
( G S F )
Campus B U I L D I N G N
A M E
O C C U P A N C Y
Y E A R
B U I L T
M A J O R
A D D I T I O N S
B U I L D I N G A
R E A
( G S F )
77 Columbia Gorge Bldg. 4-Instruction <250 1938 N 7,143 77 Lane Machine Technology >250 1970 N 59,658
78 Columbia Gorge Bldg. 5 - Future Building U U U U 78 Lane Performing Arts >250 1975 Y 48,156
79 Columbia Gorge Bldg. 6-Dormitory <250 1949 U 32,148 79 Lane Physical Ed. Complex >250 1968 N 87,992
80 Columbia Gorge Bldg. 7-Residence <250 1949 U 3,352 80 Lane Science >250 1968 Y 91,65581 Columbia Gorge Bldg. 8-Residence <250 1938 U 3,147 81 Lane Student Services >250 2001 U 37,477
82 Columbia Gorge Bldg. 9-Residence <250 1929 U 3,077 82 Lane Welding Technology >250 2000 U 20,593
83 Columbia Gorge Bldg.10-Residence <250 1954 U 2,004 83 Lane Workforce Training Center/Ap >250 1968 Y 87,888
84 Columbia Gorge Bldg.11-Storage <250 1936 U 10,472 84 Lane-Branch Cottage Grove Ct r (new) >250 1996 U 18,613
85 Columbia Gorge Bldg.12-Maintenance <250 1971 U 4,800 85 Lane-Branch Downtown Center >250 1977 N 56,508
86 Klamath Building 1 120 ~1935 N 4,000 86 Lane-Branch Florence Center >250 1976 U 15,827
87 Klamath Building 2 120 ~1935 N 4,000 87 Lane-Branch Wildish Building >250 1995 U 12,950
88 Klamath Building 5 8 New N 2,400 88 Linn-Benton Activity Center 101-1000 1975 U 40,774
89 Lane Apprenticeship Annex <100 1977 U 3,432 89 Linn-Benton Business U U U U
90 Lane Chemical Storage <100 1993 U 297 90 Linn-Benton College Center 101-1000 1973 U 54,591
91 Lane Childcare Center #1 <100 2000 U 2,967 91 Linn-Benton Health Occupations 101-1000 1973 U 16,698
92 Lane Childcare Center #2 <100 2000 U 3,273 92 Linn-Benton Industrial A 101-1000 1973 U 66,913
93 Lane Childcare Center #3 >100 2000 U 6,270 93 Linn-Benton Learning Resource Ctr. 101-1000 1973 U 34,038
94 Lane Childcare Center #4 <100 2000 U 4,264 94 Linn-Benton Luckiamute Center >100 2004 U U
95 Lane Comminutor Shed <100 2000 U 660 95 Linn-Benton Science and Technology 101-1000 1973 U 32,658
96 Lane Cooling Tower <100 1968 U 1,752 96 Linn-Benton Service Ctr. 11-100 1973 U 12,423
97 Lane Electronic Annex >100 1996 U 6,720 97 Linn-Benton South Santium Hall >100 1973 U U
98 Lane FM&P Nursery <100 2002 U 1,500 98 Linn-Benton Student Union Bldg. 101-1000 1973 U 17,716
99 Lane FM&P Storage <100 2000 U 2,240 99 Linn-Benton Takena Hall 101-1000 1979 U 50,387100 Lane Greenhouse <100 1968 U 240 100 Linn-Benton-Branch Benton Center orig built 1923 >250 2004 U U
101 Lane Old Day Care Modular <100 1989 U 1,848 101 Linn-Benton-Branch Lebanon Center >250 2002 U U
102 Lane PA Storage <100 1977 U 2,890 102 Linn-Benton-Branch Sweet Home Center U U U U
103 Lane PE Storage <100 1977 U 1,430 103 Mt Hood Academic Center >250 1970 Y 421,365
104 Lane Test Cells <100 1968 U 3,100 104 Mt Hood Bruning Center for Allied Heal >250 1976 N 63,054
105 Lane-Branch Aviation Maint. T raining >250 1995 U 23,400 105 Mt Hood Aquatic Center >250 1976 N 27,500
106 Lane-Branch Churchill CLC <100 1999 U 2,523 106 Mt Hood Child Development Center U U U U
107 Lane-Branch Cottage Grove Ctr(old) >100 1 984 U 7,900 107 Mt Hood GE Building U U U U
108 Lane-Branch Elmira CLC <100 2000 U 2,896 108 Mt Hood Gymnasium >250 1968 N 69355
109 Lane-Branch Flight Tech Center >100 1989 U 5,049 109 Mt Hood Horticulture and Fisheries <250 1975 N 12,200
110 Lane-Branch Flight Tech Hanger <100 1989 U 3,900 110 Mt Hood Industrial Technology >250 1968 N 45748
111 Lane-Branch Flight Tech Operations <100 1 940 U 3,640 111 Mt Hood Maywood U U U U
112 Lane-Branch Junction City CLC <100 2000 U 2,820 112 Mt Hood Visual Art Center Theatre U U U U
113 Lane-Branch McKenzie CLC <100 2000 U 2,893 113 Mt Hood Warehouse/Graphics Addition >250 1982 N 56,600
114 Lane-Branch Oakridge CLC <100 1999 U 2,720 114 Portland-Cascade Gymnasium >250 2004 U 31,882
115 Lane-Branch Siltcoos Station <100 1974 U 2,570 115 Portland-Cascade Jackson Hall 1,100 +/- 1985 Y 26,302
116 Lane-Branch Thurston CLC <100 1999 U 3,503 116 Portland-Cascade Library Addition >250 1994 U 34,000
117 Lane-Branch Willamette CLC <100 1999 U 2,527 117 Portland-Cascade Moriarty Arts and Humanities U U U U118 Linn-Benton Industrial B 11-100 1973 U U 118 Portland-Cascade Old Terrell Hall >100 1920's U 9,600
119 Linn-Benton Industrial C 11-100 1978 U U 119 Portland-Cascade Public Service 450 +/- 2003 U 28,400
120 Linn-Benton-Branch Horse Center U U U U 120 Portland-Cascade Student Center 1,500 +/- 1965 Y 22,563
121 Mt Hood GE Annex U U U U 121 Portland-Cascade Student Services 600 +/- 1996 U 34,000
122 Mt Hood Multnomah Cable Access <100 1984 N 5,000 122 Portland-Cascade Tech. Ed. 1,600 +/- 2004 U 50,500
123 Mt Hood Offices/Locker rms. U U U U 123 Portland-Cascade Terrell Hall 1,200 +/- 75/89 Y 35,642
124 Mt Hood Visual Arts Center U U U U 124 Portland-Rock Creek Building 2 2,000 +/- 1976 N 179,947
125 Oregon Coast North County Center <100 U U U 125 Portland-Rock Creek Building 3 1,200 +/- 1976 N 80,877
126 Portland-Cascade Portables >100 1997 U 5,600 126 Portland-Rock Creek Building 5 1,400 +/- 1982 N 47,067
127 Portland-Cascade Public Safety 5 1940 U U 127 Portland-Rock Creek Building 6 (hanger) 500 +/- 1979 Y 32,692
128 Portland-Rock Creek Building 1 <100 1976 U 16,200 128 Portland-Rock Creek Building 7 2,500 +/- 1996 U 62,500
129 Portland-Rock Creek Building 4 40 +/- 1993 N 2,640 129 Portland-Rock Creek Building 7 Addition U 2004 U 36,000
130 Portland-Rock Creek Building Construction U U U U 130 Portland-Rock Creek Building 9 Lib/Stud Serv 1,500 +/- 2004 U 72,000
131 Portland-Rock Creek Greenhouses U 1993 U 5,400 131 Portland-Sylvania Automotive/Metals 300 +/ - 1968 N 71,667
132 Portland-Rock Creek Pole Barn U 2004 U U 132 Portland-Sylvania Bookstore 200 +/- 1995 U 26,000
133 Portland-Rock Creek Shade House U 2006 U U 133 Portland-Sylvania College Center 1,200 +/- 1970 Y 181,582
134 Portland-Sylvania Heat Plant 0-10 1968 N 13,999 134 Portland-Sylvania Communication Tech. 800 +/- 1972 N 80,110
135 Rogue-Redwood Building A - Redwood 57 1965 U 1,710 135 Portland-Sylvania Health Tech. 3,000 +/- 1972 N 199,612
136 Rogue-Redwood Building B - Redwood 45 1965 U 1,455 136 Portland-Sylvania LRC 300 +/- 1994 U 65,165137 Rogue-Redwood Building C - Redwood 18 1965 U 1 ,859 137 Portland-Sylvania Science and Tech. 850 +/ - 1968 N 75,321
138 Rogue-Redwood Building D (Manufacture) - Redwood 56 1984 U 7,237 138 Portland-Sylvania Sculpture Studio U 2004 U U
139 Rogue-Redwood Building E (Science) - Redwood 153 1982 N 9,450 139 Portland-Sylvania Socia l Sci. and Tech. 950 +/- 1968 N 61,899
140 Rogue-Redwood Building F - Redwood 36 1965 U 3,037 140 Portland-Sylvania South Classroom B. 300 +/ - 1997 U 10,600
141 Rogue-Redwood Building G - Redwood 143 1965 U 3,325 141 Portland-Sylvania Technology Classroom 500 +/- 2004 U 46,394
142 Rogue-Redwood Building H - Redwood 141 1965 U 4,425 142 Rogue-Redwood Building U (Gym) - Redwood 494 1965 N 12,365
143 Rogue-Redwood Building I - Redwood 170 1965 U 3,310 143 Rogue-Redwood Café - Redwood 392 1965 U 10,292
144 Rogue-Redwood Building J - Redwood 171 1965 U 3,330 144 Rogue-Redwood Coats Hall - Redwood 417 1988 N 18,673
145 Rogue-Redwood Building K - Redwood 118 1965 U 3,097 145 Rogue-Redwood Firehouse Art Ctr./Small Bus. >250 1912 N 16,000
146 Rogue-Redwood Building L - Redwood 98 1965 U 5,356 146 Rogue-Redwood Wiseman Tutoring Ctr. - Red 414 1978 N 20,147
147 Rogue-Redwood Building M - Redwood 95 1965 U 4,497 147 Rogue-Riverside (Wards) G Building - Riversid 1,070 1928 N 34,125
148 Rogue-Redwood Building N - Redwood 50 1965 U 2 ,558 148 Rogue-Riverside Building A - Riverside 263 1946 N 13,980
149 Rogue-Redwood Building O (Faci li ties) - Redwood 14 1965 U 3,885 149 Rogue-Riverside Building B - Riverside 294 1939 N 13,373
150 Rogue-Redwood Building P - Redwood 35 1965 U 1,081 150 Rogue-Riverside Building D - Riverside 285 1968 U 8,673
151 Rogue-Redwood Building Q - Redwood 9 1965 U 1,041 151 Rogue-Riverside K Building - Riverside 303 1940 U 8,565
152 Rogue-Redwood Building R - Redwood 236 1975 U 3,615 152 Rogue-Table Rock Crater Lake Center 347 U U 12,682
Appendix B Oregon Seismic Needs Assessment DOGAMI (June 2007)
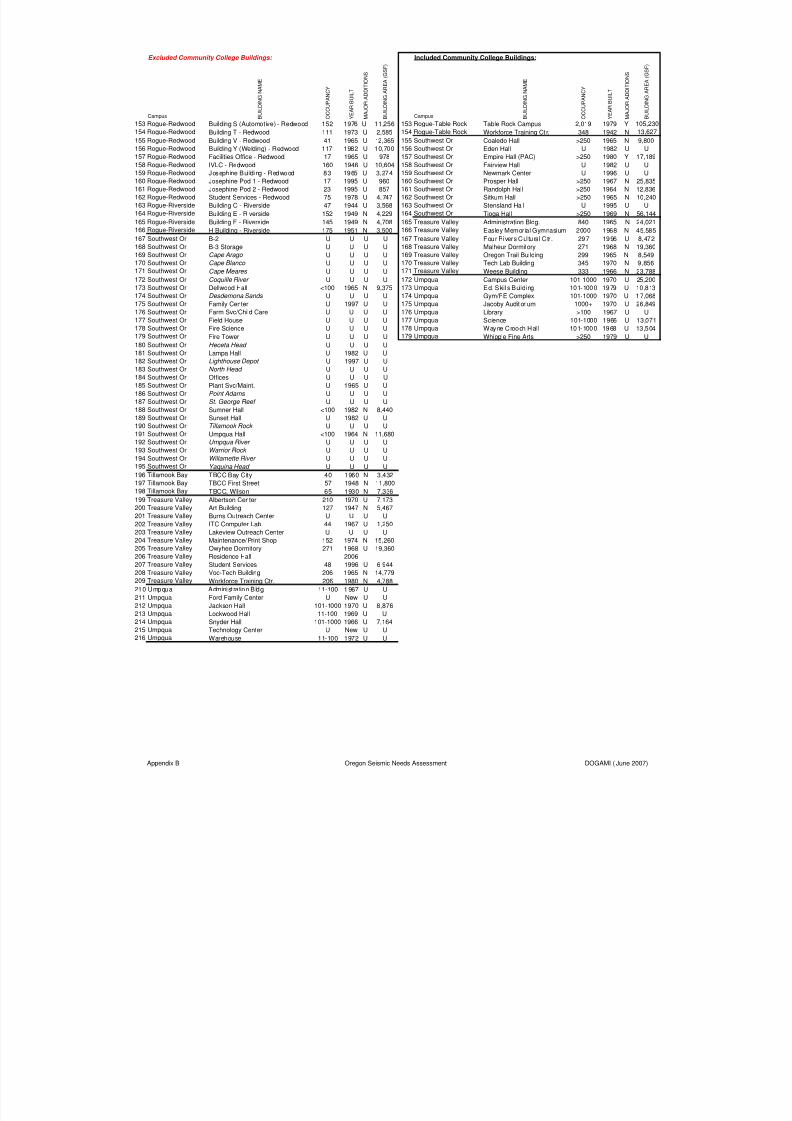
8/3/2019 Statewide Seismic Needs Assessment report
http://slidepdf.com/reader/full/statewide-seismic-needs-assessment-report 89/341
Excluded Community College Buildings: Included Community College Buildings:
Campus B U I L D I N G N
A M E
O C C U P A N C Y
Y E A R
B U I L T
M A J O R
A D D I T I O N S
B U I L D I N G A
R E A
( G S F )
Campus B U I L D I N G N
A M E
O C C U P A N C Y
Y E A R
B U I L T
M A J O R
A D D I T I O N S
B U I L D I N G A
R E A
( G S F )
153 Rogue-Redwood Building S (Automotive) - Redwood 152 1976 U 11,256 153 Rogue-Table Rock Table Rock Campus 2,019 1979 Y 105,230
154 Rogue-Redwood Building T - Redwood 111 1973 U 2,585 154 Rogue-Table Rock Workforce Training Ct r. 348 1942 N 13,627
155 Rogue-Redwood Building V - Redwood 41 1965 U 12,365 155 Southwest Or Coaledo Hall >250 1965 N 9,800
156 Rogue-Redwood Building Y (Welding) - Redwood 117 1982 U 10,700 156 Southwest Or Eden Hall U 1982 U U157 Rogue-Redwood Facilities Office - Redwood 17 1965 U 978 157 Southwest Or Empire Hall (PAC) >250 1980 Y 17,189
158 Rogue-Redwood IVLC - Redwood 160 1946 U 10,604 158 Southwest Or Fairview Hall U 1982 U U
159 Rogue-Redwood Josephine Bui lding - Redwood 83 1965 U 3,274 159 Southwest Or Newmark Center U 1996 U U
160 Rogue-Redwood Josephine Pod 1 - Redwood 17 1995 U 960 160 Southwest Or Prosper Hall >250 1967 N 25,835
161 Rogue-Redwood Josephine Pod 2 - Redwood 23 1995 U 857 161 Southwest Or Randolph Hall >250 1964 N 12,836
162 Rogue-Redwood Student Services - Redwood 75 1978 U 4,747 162 Southwest Or Sitkum Hall >250 1965 N 10,240
163 Rogue-Riverside Building C - Riverside 47 1944 U 3,568 163 Southwest Or Stensland Hall U 1995 U U
164 Rogue-Riverside Building E - Riverside 152 1949 N 4,229 164 Southwest Or Tioga Hall >250 1969 N 56,144
165 Rogue-Riverside Building F - Riverside 145 1949 N 4,708 165 Treasure Valley Administration Bldg. 840 1965 N 24,021
166 Rogue-Riverside H Building - Riverside 175 1951 N 3,500 166 Treasure Valley Easley Memorial Gymnasium 2000 1968 N 45,585
167 Southwest Or B-2 U U U U 167 Treasure Valley Four Rivers Cul tural Ctr . 297 1996 U 8,472
168 Southwest Or B-3 Storage U U U U 168 Treasure Valley Malheur Dormitory 271 1968 N 19,360
169 Southwest Or Cape Arago U U U U 169 Treasure Valley Oregon Trail Building 299 1965 N 8,549
170 Southwest Or Cape Blanco U U U U 170 Treasure Valley Tech Lab Building 345 1970 N 9,856
171 Southwest Or Cape Meares U U U U 171 Treasure Valley Weese Building 333 1966 N 23,788
172 Southwest Or Coquille River U U U U 172 Umpqua Campus Center 101-1000 1970 U 25,200
173 Southwest Or Dellwood Hall <100 1965 N 9,375 173 Umpqua Ed. Ski lls Bui lding 101-1000 1979 U 10,813
174 Southwest Or Desdemona Sands U U U U 174 Umpqua Gym/PE Complex 101-1000 1970 U 17,068
175 Southwest Or Family Center U 1997 U U 175 Umpqua Jacoby Auditorium 1000+ 1970 U 26,849176 Southwest Or Farm Svc/Child Care U U U U 176 Umpqua Library >100 1967 U U
177 Southwest Or Field House U U U U 177 Umpqua Science 101-1000 1966 U 13,071
178 Southwest Or Fire Science U U U U 178 Umpqua Wayne Crooch Hal l 101-1000 1968 U 13,504
179 Southwest Or Fire Tower U U U U 179 Umpqua Whipple Fine Arts >250 1979 U U
180 Southwest Or Heceta Head U U U U
181 Southwest Or Lampa Hall U 1982 U U
182 Southwest Or Lighthouse Depot U 1997 U U
183 Southwest Or North Head U U U U
184 Southwest Or Offices U U U U
185 Southwest Or Plant Svc/Maint. U 1965 U U
186 Southwest Or Point Adams U U U U
187 Southwest Or St. George Reef U U U U
188 Southwest Or Sumner Hall <100 1982 N 8,440
189 Southwest Or Sunset Hall U 1982 U U
190 Southwest Or Tillamook Rock U U U U
191 Southwest Or Umpqua Hall <100 1964 N 11,680
192 Southwest Or Umpqua River U U U U
193 Southwest Or Warrior Rock U U U U
194 Southwest Or Willamette River U U U U
195 Southwest Or Yaquina Head U U U U
196 Tillamook Bay TBCC Bay City 40 1960 N 3,432
197 Tillamook Bay TBCC First Street 57 1948 N 11,800
198 Tillamook Bay TBCC, Wilson 65 1930 N 7,336
199 Treasure Valley Albertson Center 210 1970 U 7,173
200 Treasure Valley Art Building 127 1947 N 5,467
201 Treasure Valley Burns Outreach Center U U U U
202 Treasure Valley ITC Computer Lab 44 1967 U 1,250
203 Treasure Valley Lakeview Outreach Center U U U U
204 Treasure Valley Maintenance/Print Shop 152 1974 N 15,260
205 Treasure Valley Owyhee Dormitory 271 1968 U 19,360
206 Treasure Valley Residence Hall 2006
207 Treasure Valley Student Services 48 1996 U 6,944
208 Treasure Valley Voc-Tech Building 206 1965 N 14,779
209 Treasure Valley Workforce Training Ctr. 206 1980 N 4,788
210 Umpqua Administra tion Bldg. 11-100 1 967 U U
211 Umpqua Ford Family Center U New U U
212 Umpqua Jackson Hall 101-1000 1970 U 8,876213 Umpqua Lockwood Hall 11-100 1969 U U
214 Umpqua Snyder Hall 101-1000 1966 U 7,164
215 Umpqua Technology Center U New U U
216 Umpqua Warehouse 11-100 1972 U U
Appendix B Oregon Seismic Needs Assessment DOGAMI (June 2007)

8/3/2019 Statewide Seismic Needs Assessment report
http://slidepdf.com/reader/full/statewide-seismic-needs-assessment-report 90/341

8/3/2019 Statewide Seismic Needs Assessment report
http://slidepdf.com/reader/full/statewide-seismic-needs-assessment-report 91/341
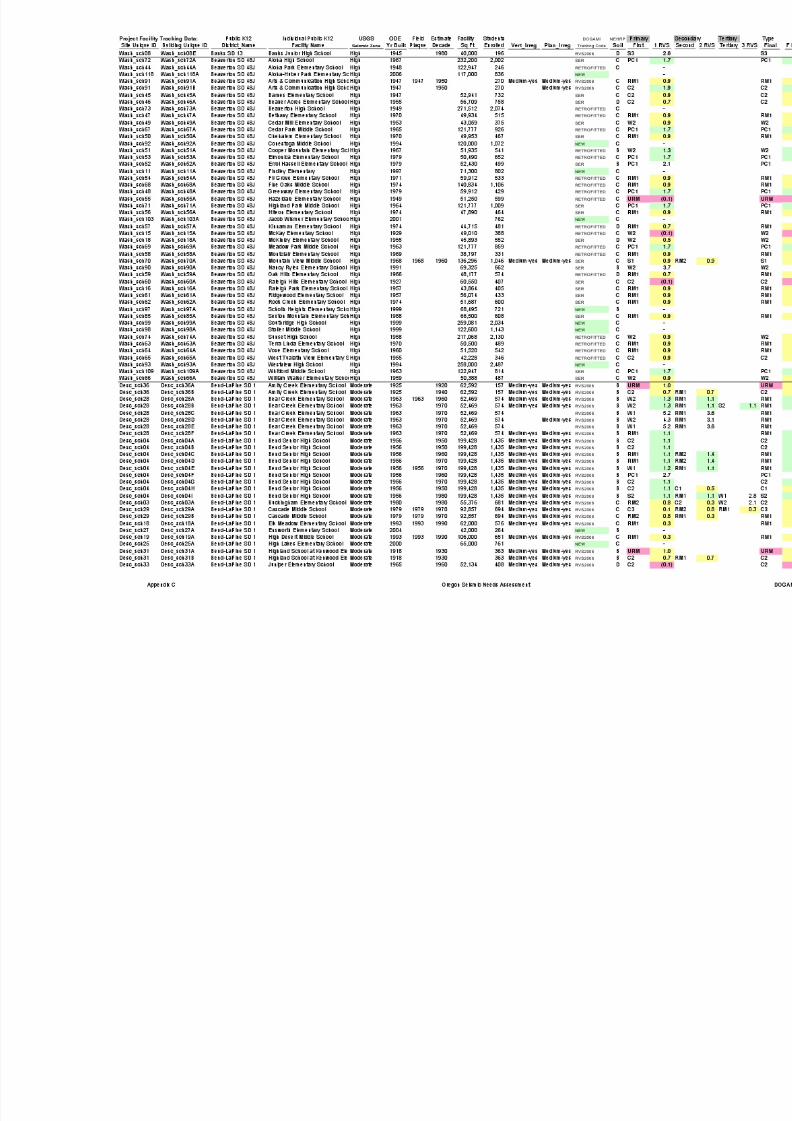
8/3/2019 Statewide Seismic Needs Assessment report
http://slidepdf.com/reader/full/statewide-seismic-needs-assessment-report 92/341
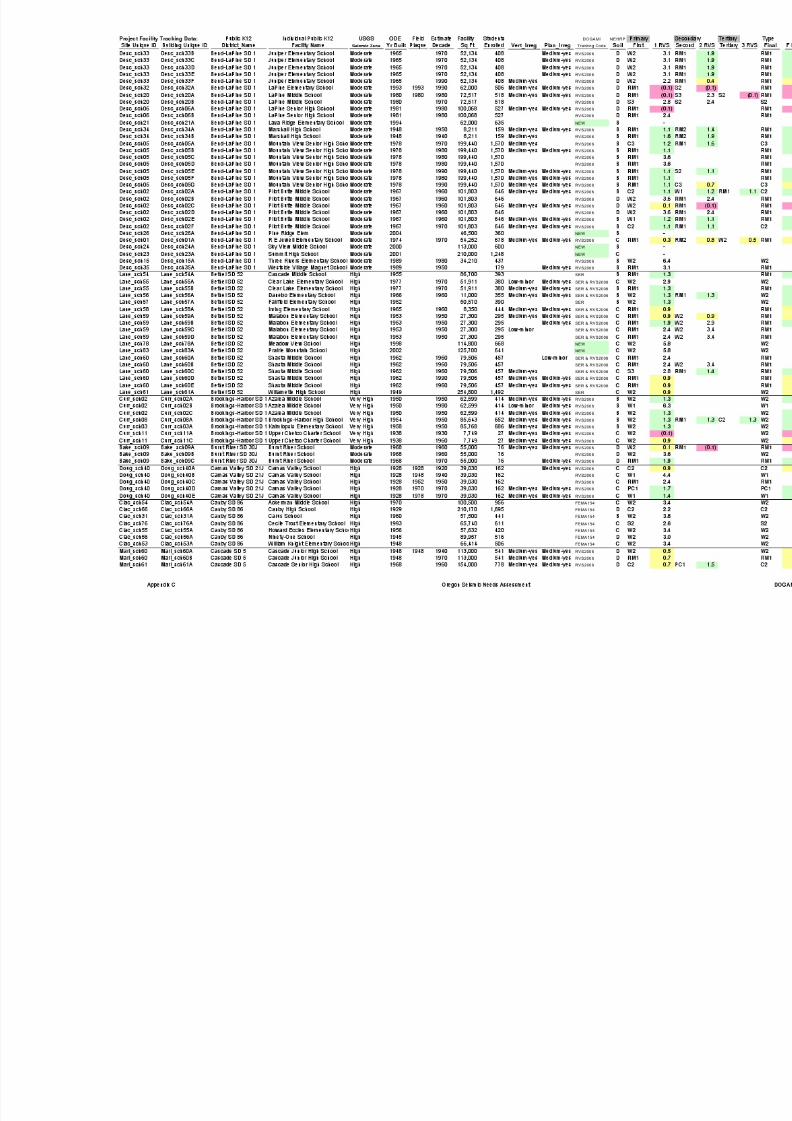
8/3/2019 Statewide Seismic Needs Assessment report
http://slidepdf.com/reader/full/statewide-seismic-needs-assessment-report 93/341
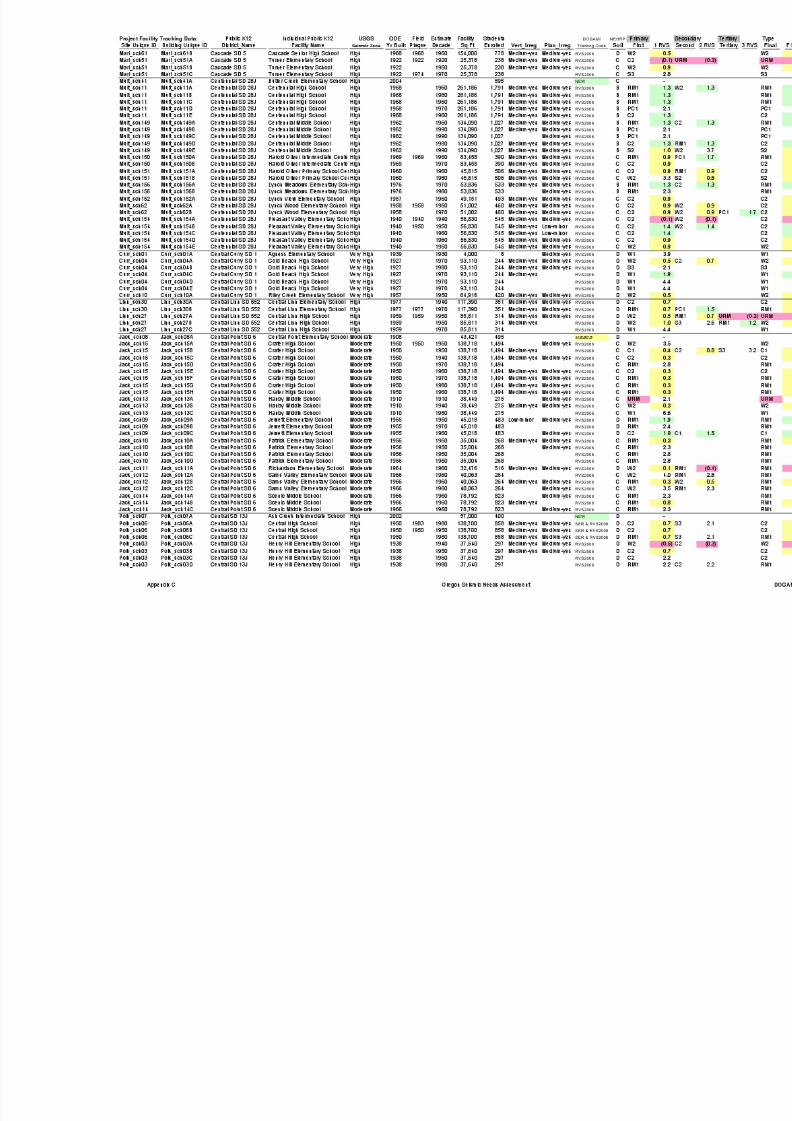
8/3/2019 Statewide Seismic Needs Assessment report
http://slidepdf.com/reader/full/statewide-seismic-needs-assessment-report 94/341
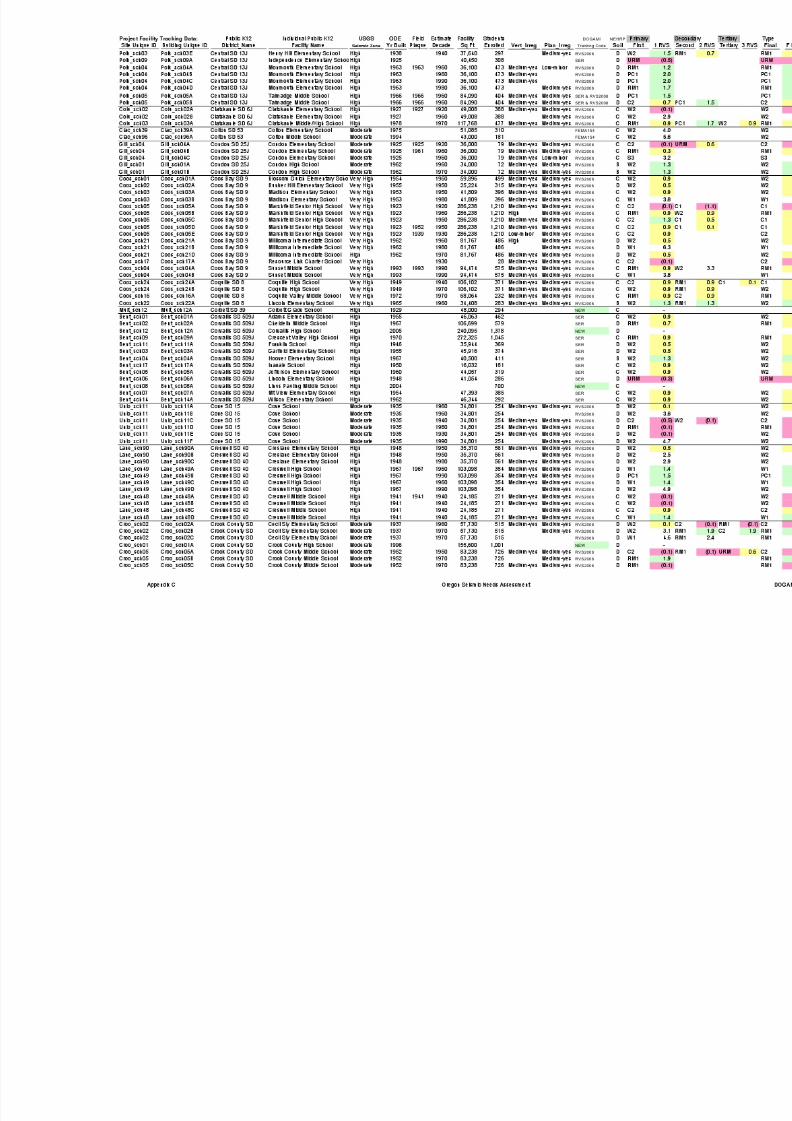
8/3/2019 Statewide Seismic Needs Assessment report
http://slidepdf.com/reader/full/statewide-seismic-needs-assessment-report 95/341
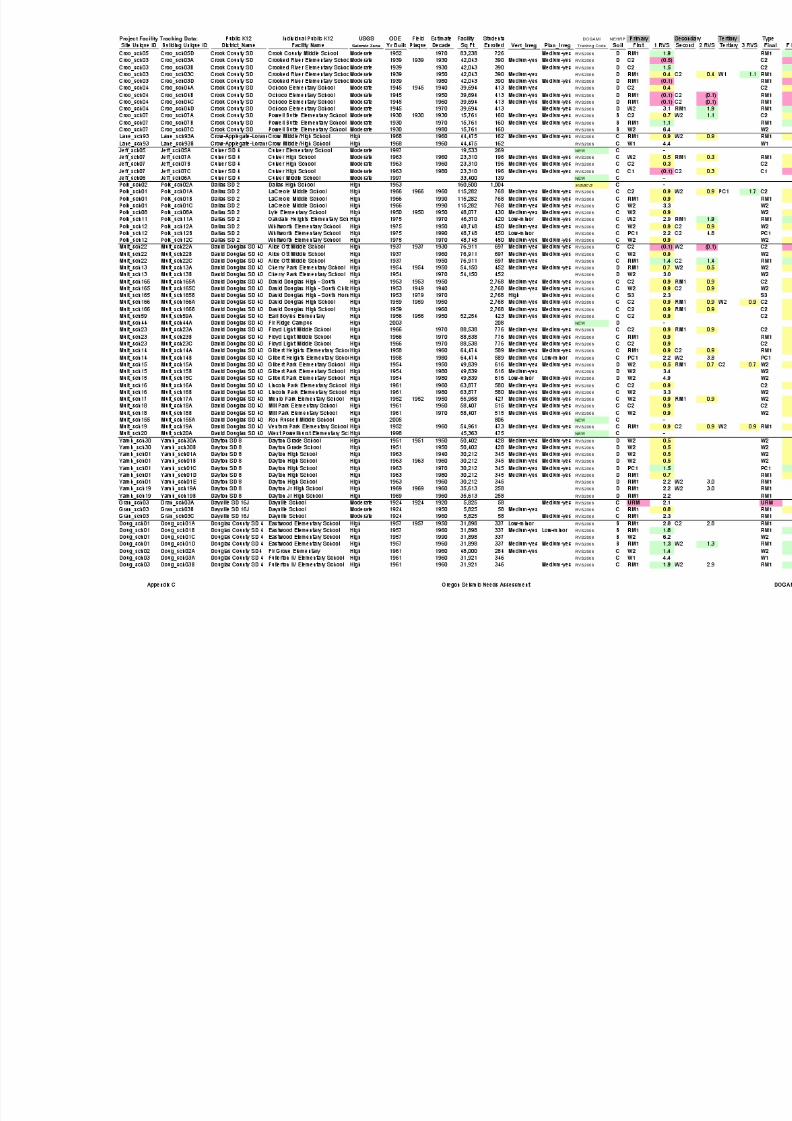
8/3/2019 Statewide Seismic Needs Assessment report
http://slidepdf.com/reader/full/statewide-seismic-needs-assessment-report 96/341
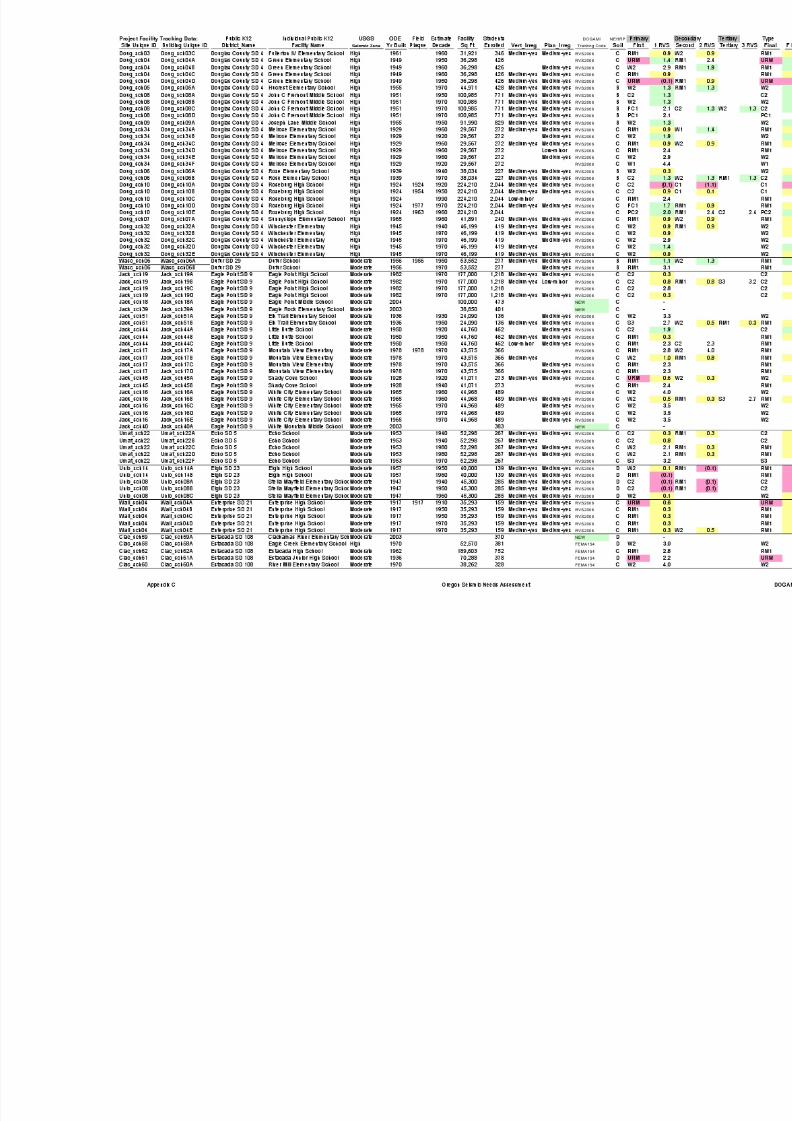
8/3/2019 Statewide Seismic Needs Assessment report
http://slidepdf.com/reader/full/statewide-seismic-needs-assessment-report 97/341
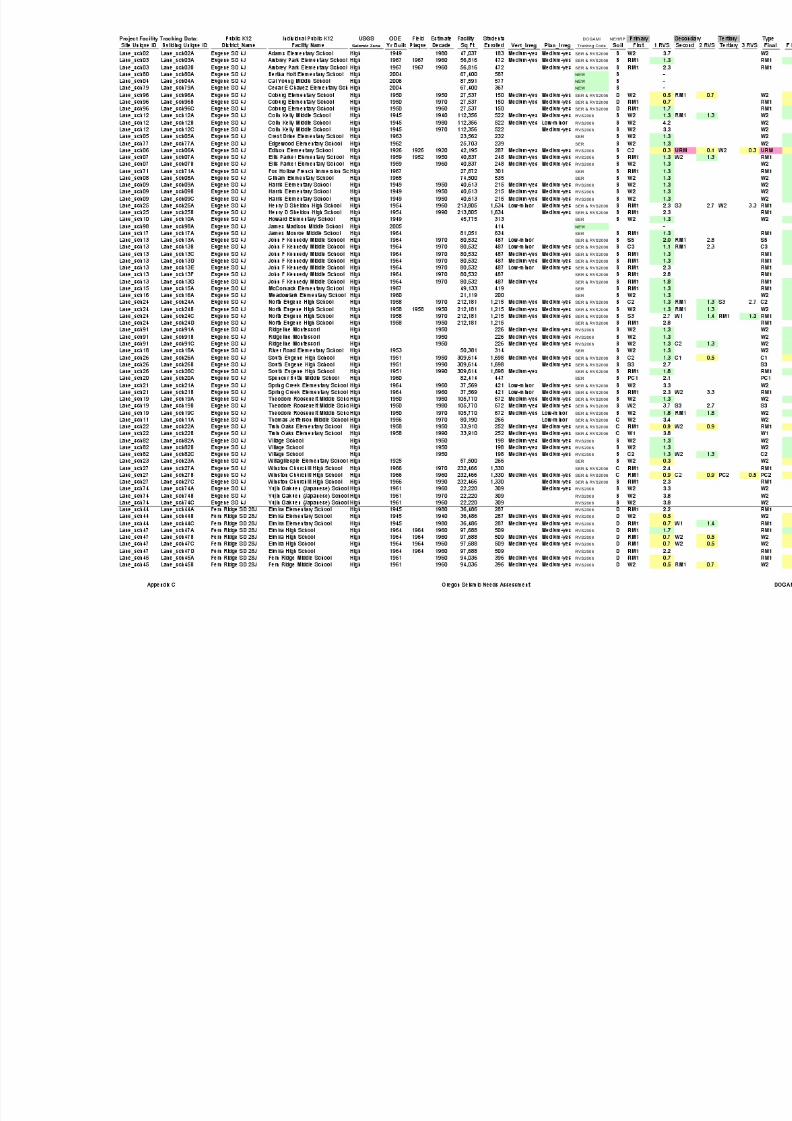
8/3/2019 Statewide Seismic Needs Assessment report
http://slidepdf.com/reader/full/statewide-seismic-needs-assessment-report 98/341
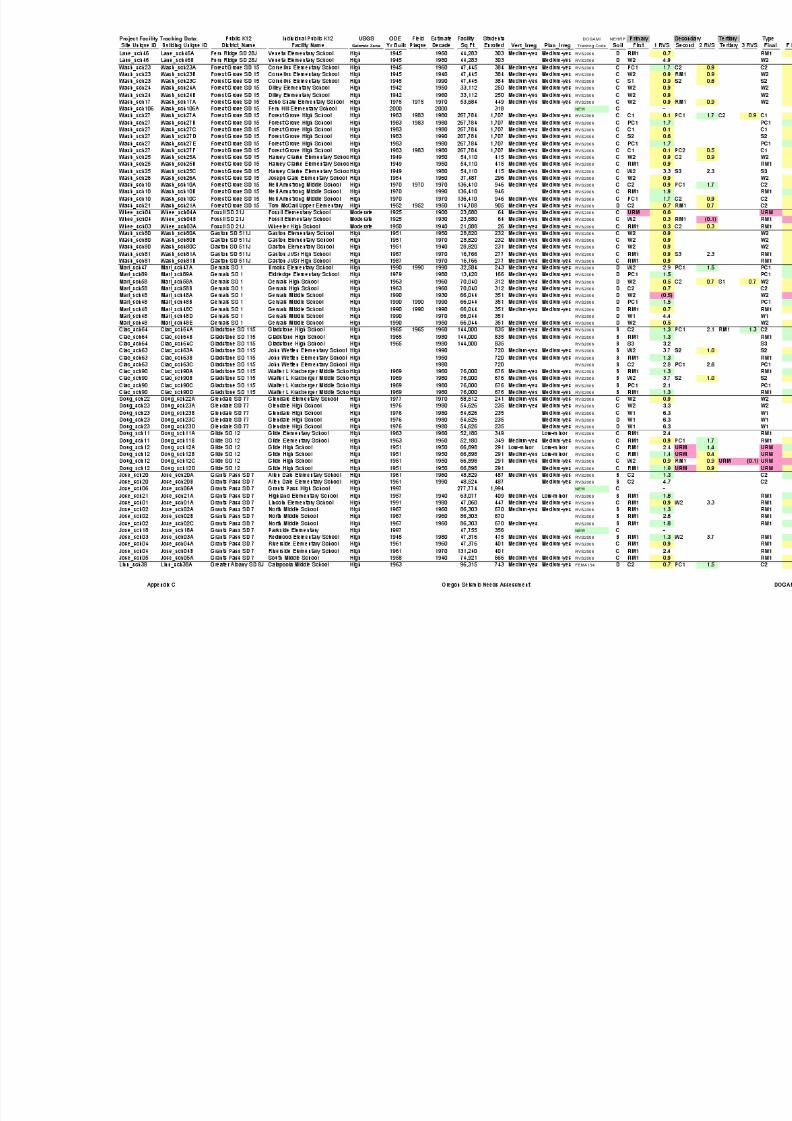
8/3/2019 Statewide Seismic Needs Assessment report
http://slidepdf.com/reader/full/statewide-seismic-needs-assessment-report 99/341
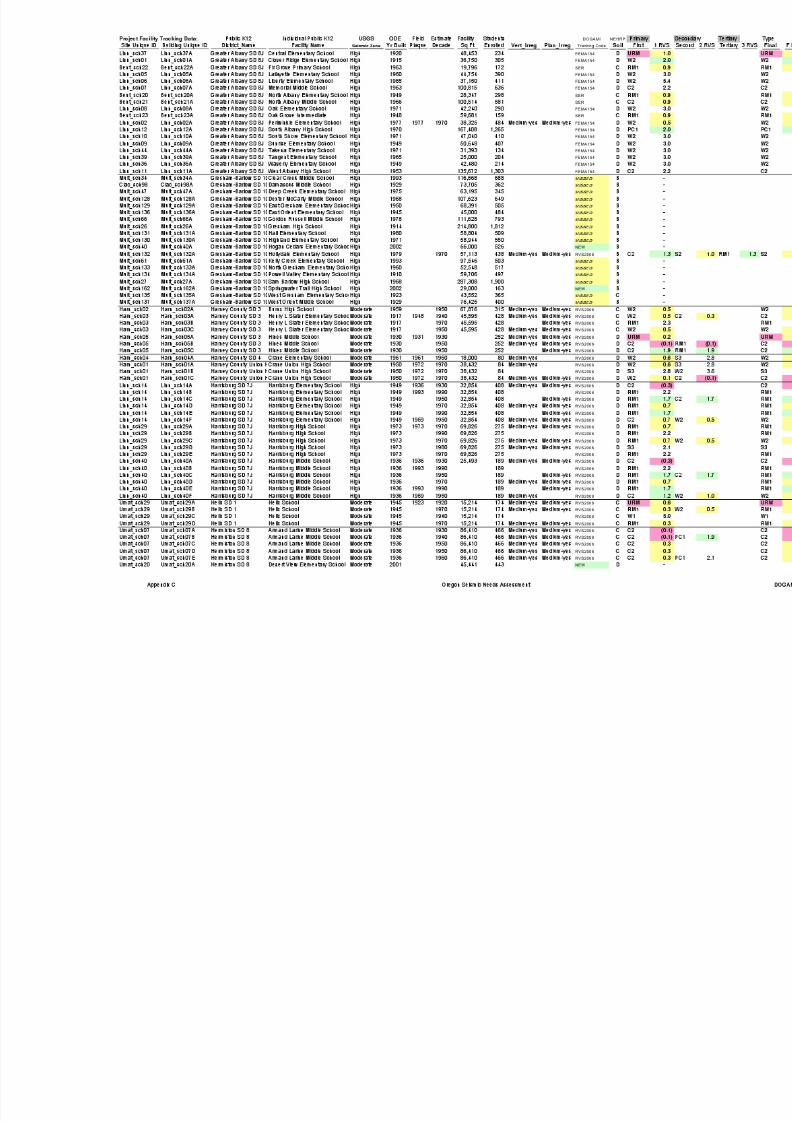
8/3/2019 Statewide Seismic Needs Assessment report
http://slidepdf.com/reader/full/statewide-seismic-needs-assessment-report 100/341

8/3/2019 Statewide Seismic Needs Assessment report
http://slidepdf.com/reader/full/statewide-seismic-needs-assessment-report 101/341
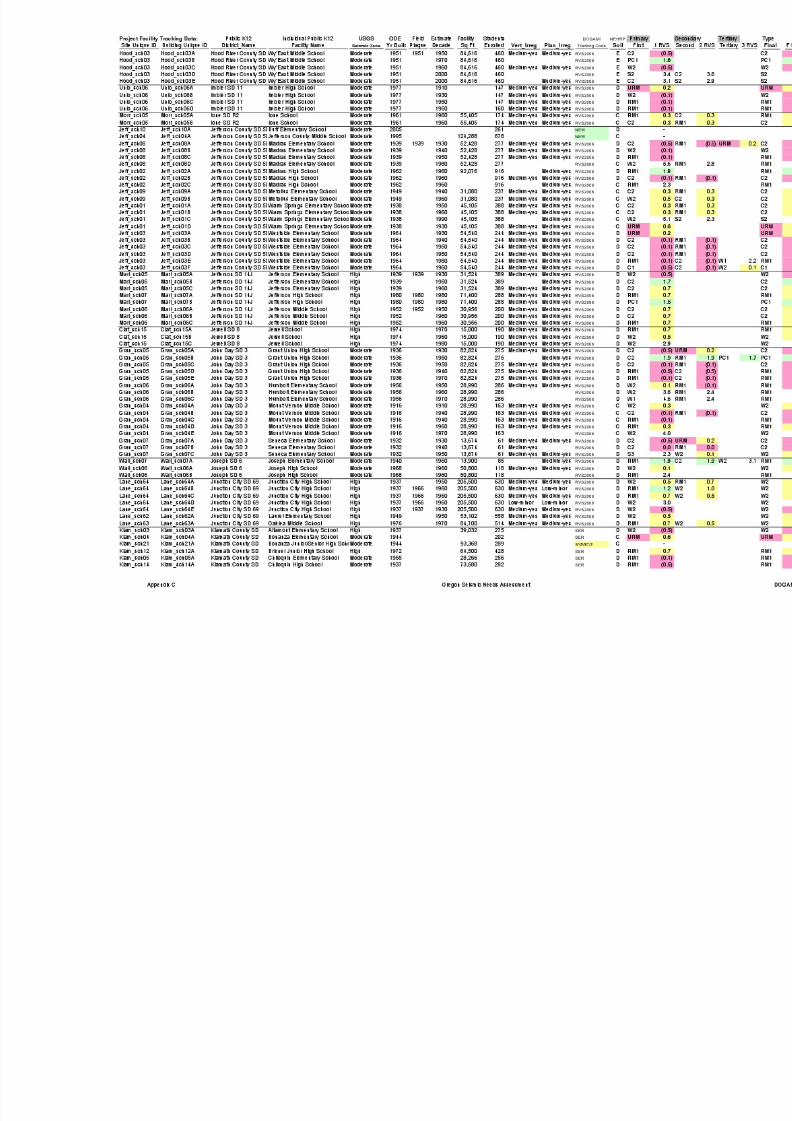
8/3/2019 Statewide Seismic Needs Assessment report
http://slidepdf.com/reader/full/statewide-seismic-needs-assessment-report 102/341

8/3/2019 Statewide Seismic Needs Assessment report
http://slidepdf.com/reader/full/statewide-seismic-needs-assessment-report 103/341

8/3/2019 Statewide Seismic Needs Assessment report
http://slidepdf.com/reader/full/statewide-seismic-needs-assessment-report 104/341
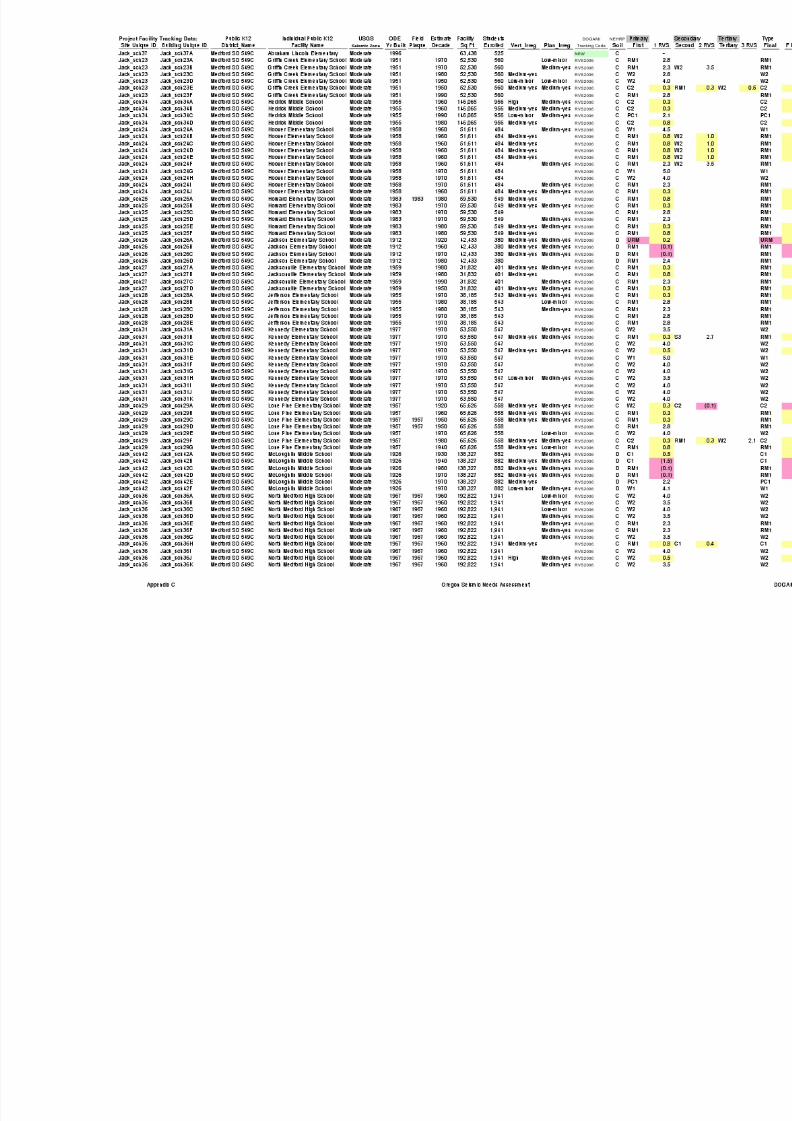
8/3/2019 Statewide Seismic Needs Assessment report
http://slidepdf.com/reader/full/statewide-seismic-needs-assessment-report 105/341
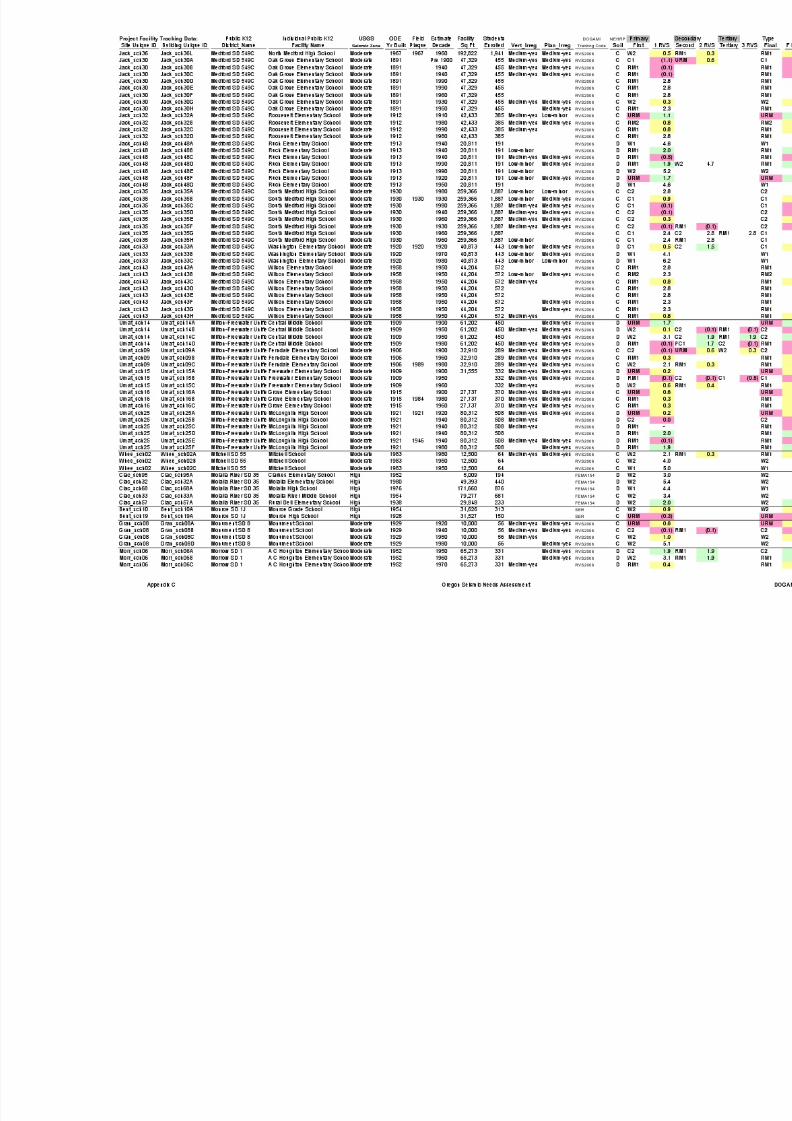
8/3/2019 Statewide Seismic Needs Assessment report
http://slidepdf.com/reader/full/statewide-seismic-needs-assessment-report 106/341
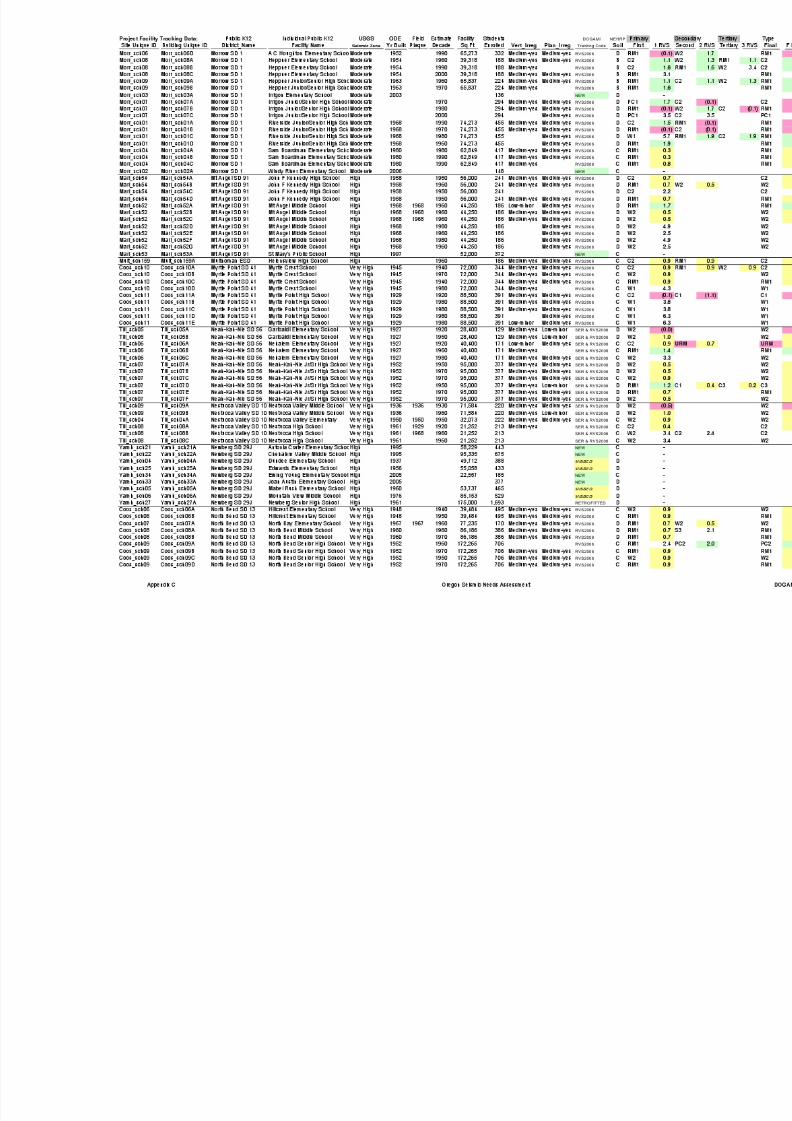
8/3/2019 Statewide Seismic Needs Assessment report
http://slidepdf.com/reader/full/statewide-seismic-needs-assessment-report 107/341
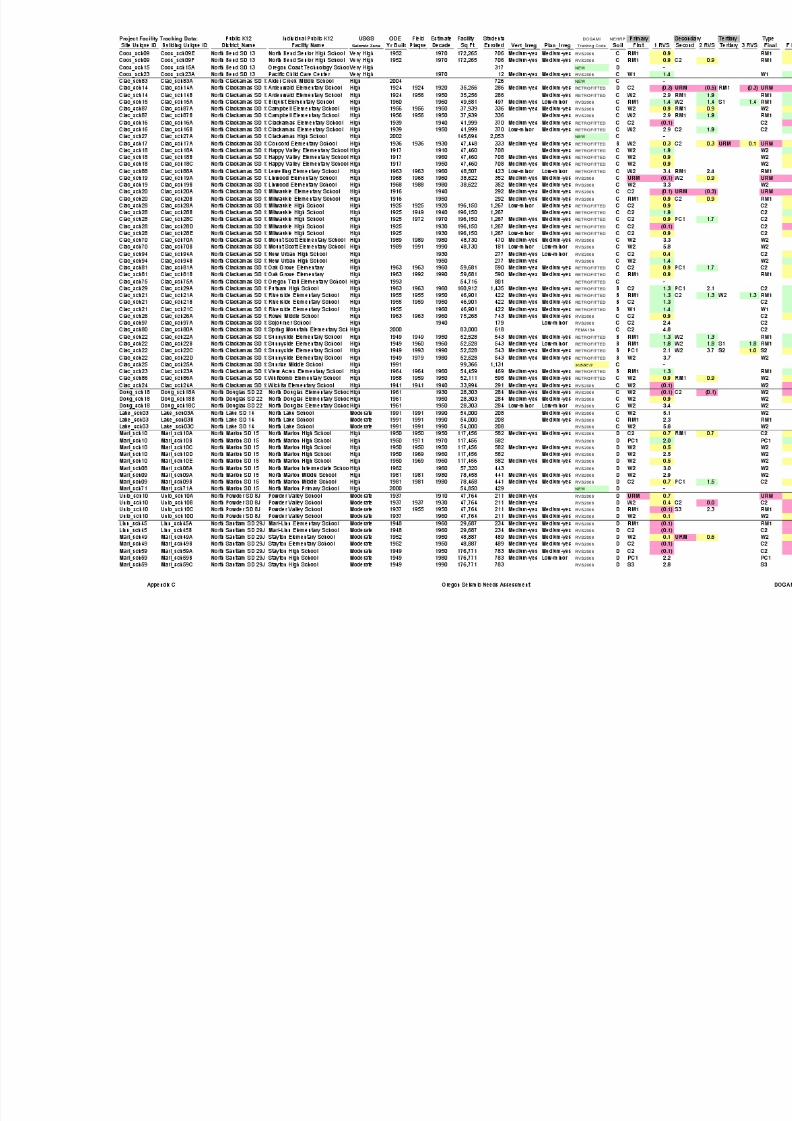
8/3/2019 Statewide Seismic Needs Assessment report
http://slidepdf.com/reader/full/statewide-seismic-needs-assessment-report 108/341
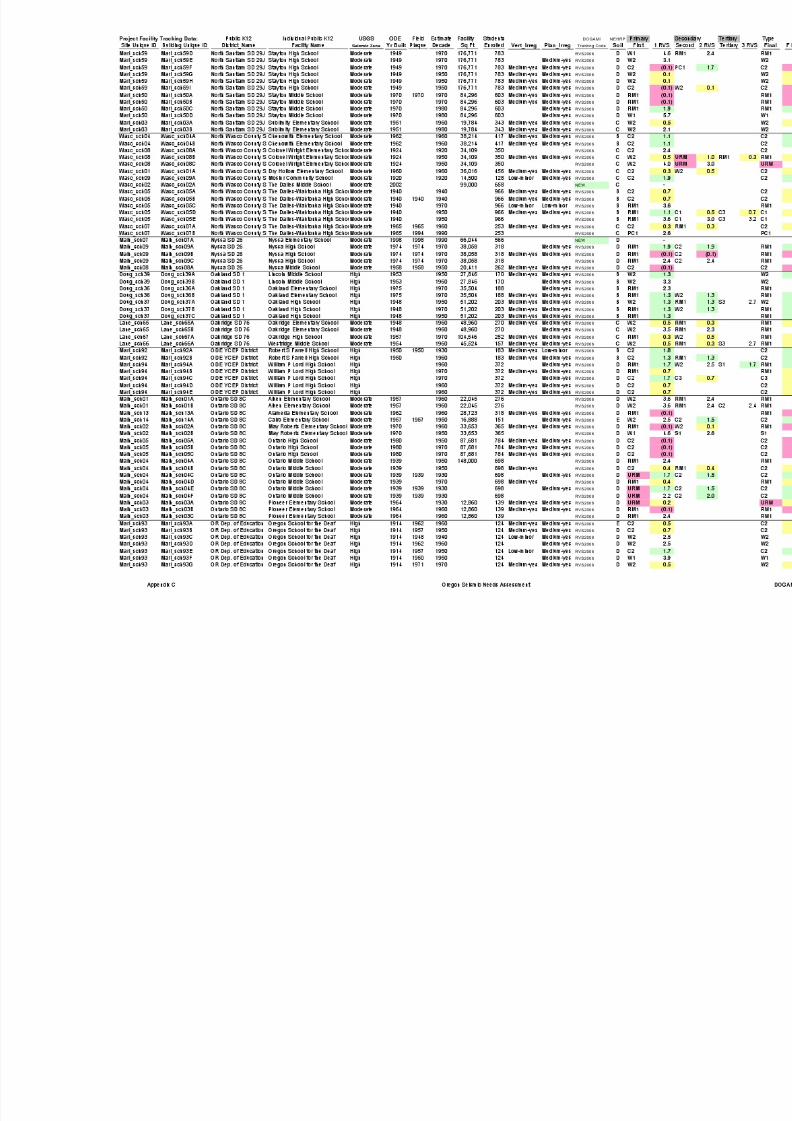
8/3/2019 Statewide Seismic Needs Assessment report
http://slidepdf.com/reader/full/statewide-seismic-needs-assessment-report 109/341

8/3/2019 Statewide Seismic Needs Assessment report
http://slidepdf.com/reader/full/statewide-seismic-needs-assessment-report 110/341
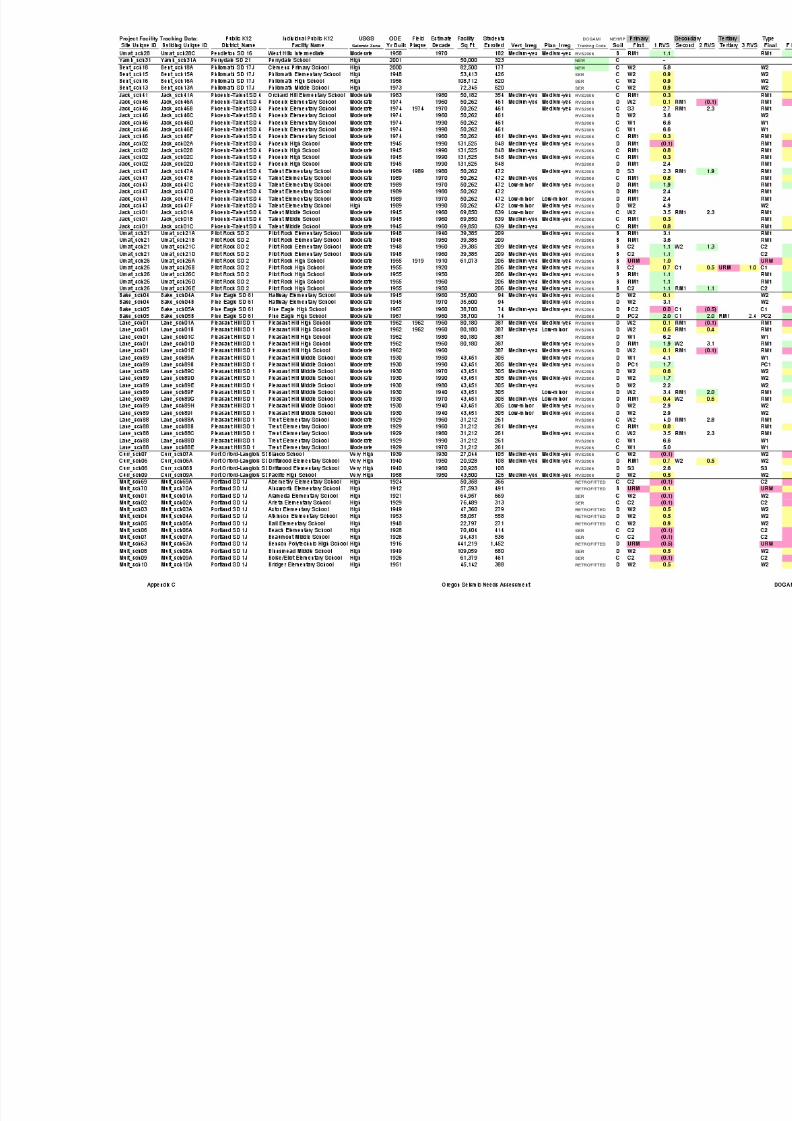
8/3/2019 Statewide Seismic Needs Assessment report
http://slidepdf.com/reader/full/statewide-seismic-needs-assessment-report 111/341
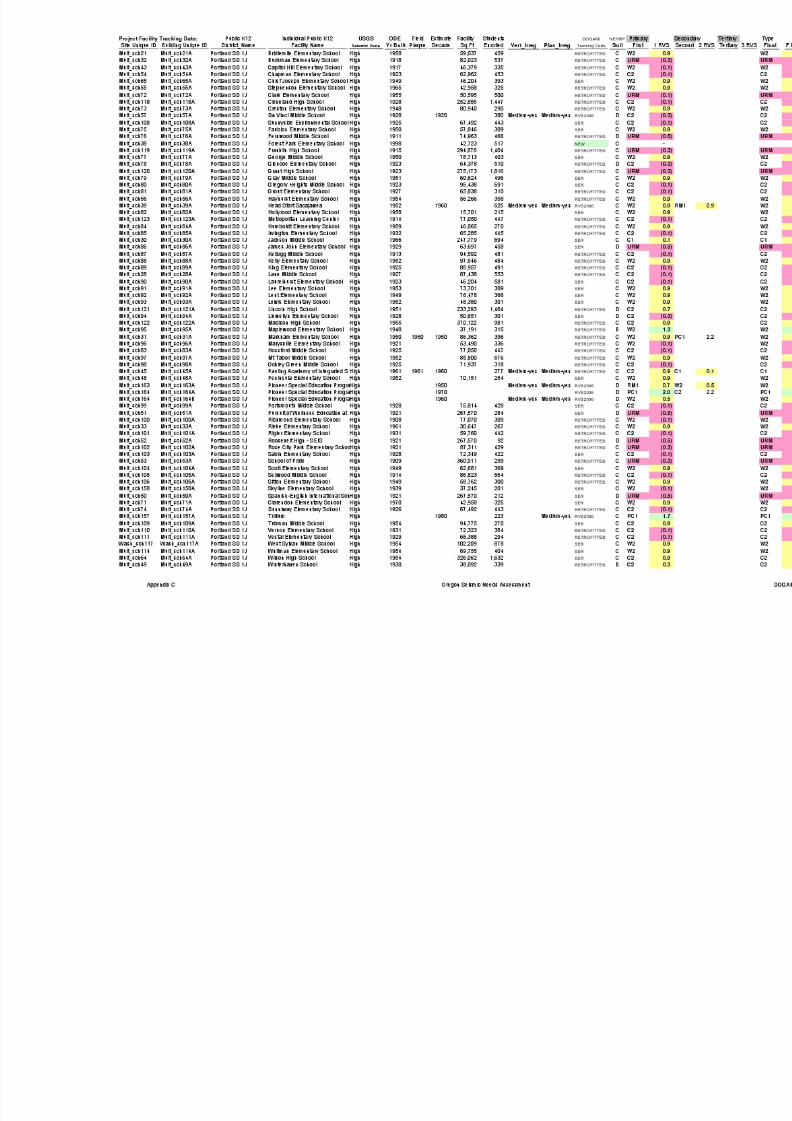
8/3/2019 Statewide Seismic Needs Assessment report
http://slidepdf.com/reader/full/statewide-seismic-needs-assessment-report 112/341
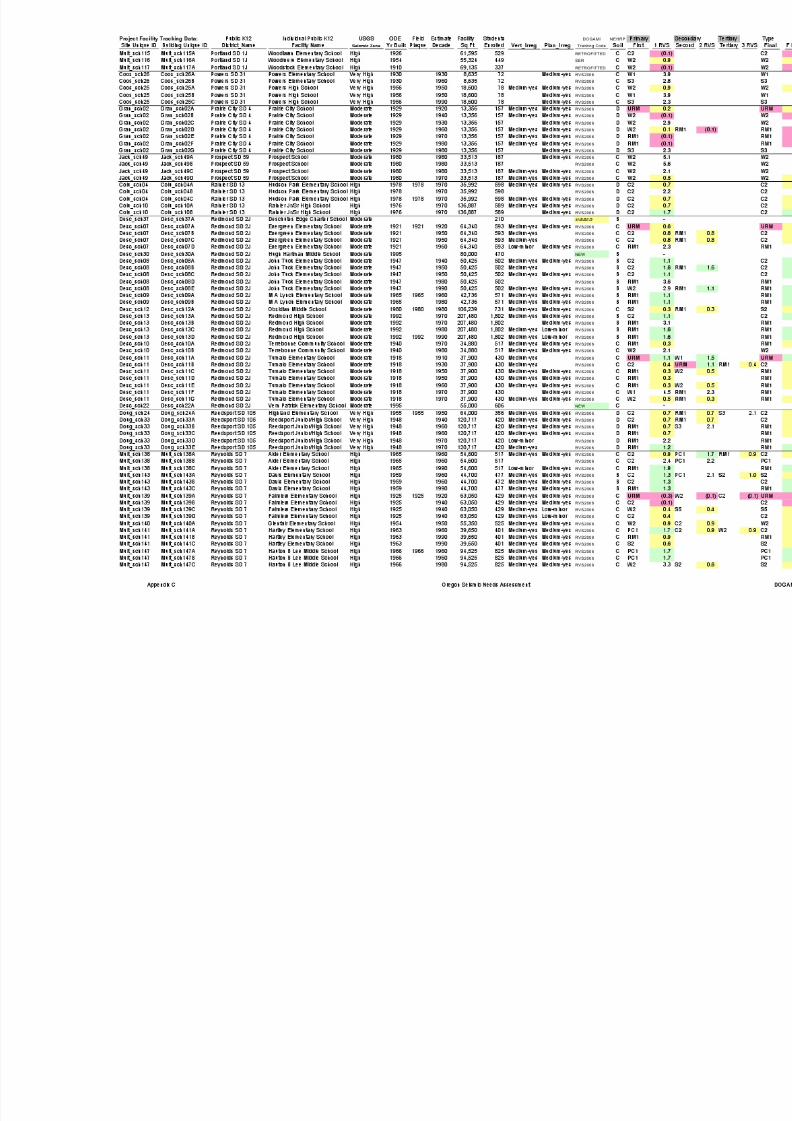
8/3/2019 Statewide Seismic Needs Assessment report
http://slidepdf.com/reader/full/statewide-seismic-needs-assessment-report 113/341

8/3/2019 Statewide Seismic Needs Assessment report
http://slidepdf.com/reader/full/statewide-seismic-needs-assessment-report 114/341
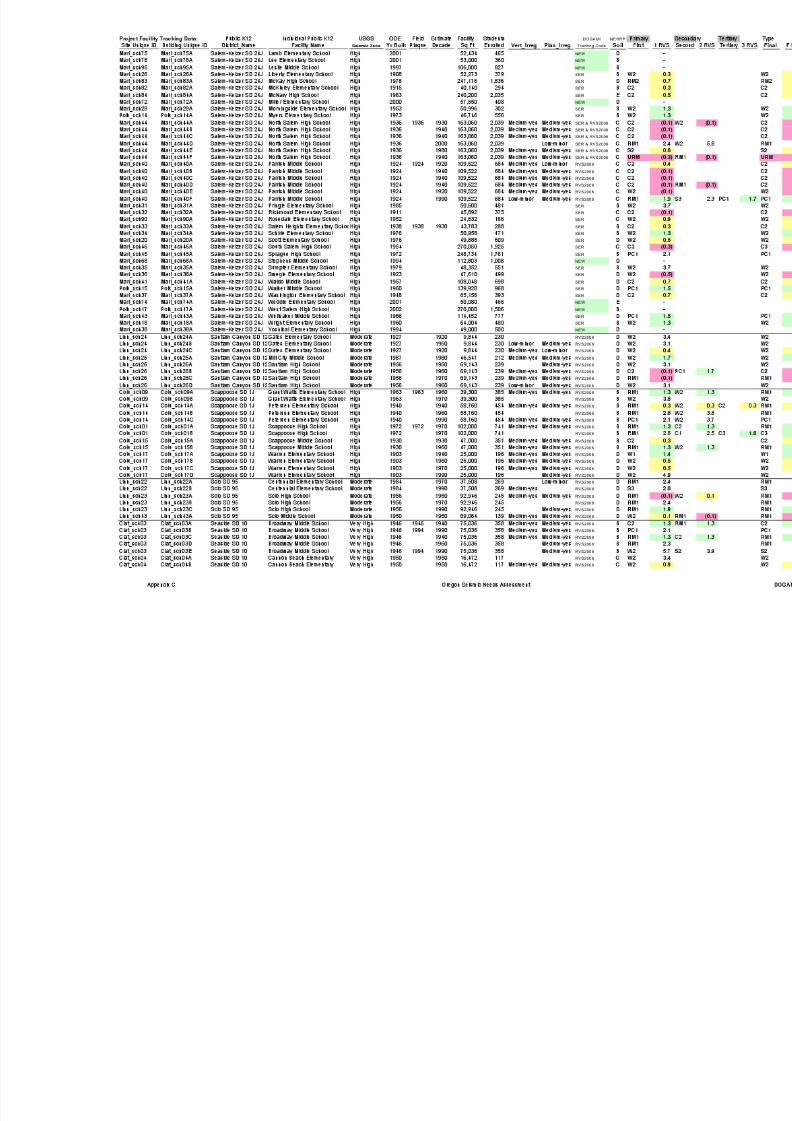
8/3/2019 Statewide Seismic Needs Assessment report
http://slidepdf.com/reader/full/statewide-seismic-needs-assessment-report 115/341
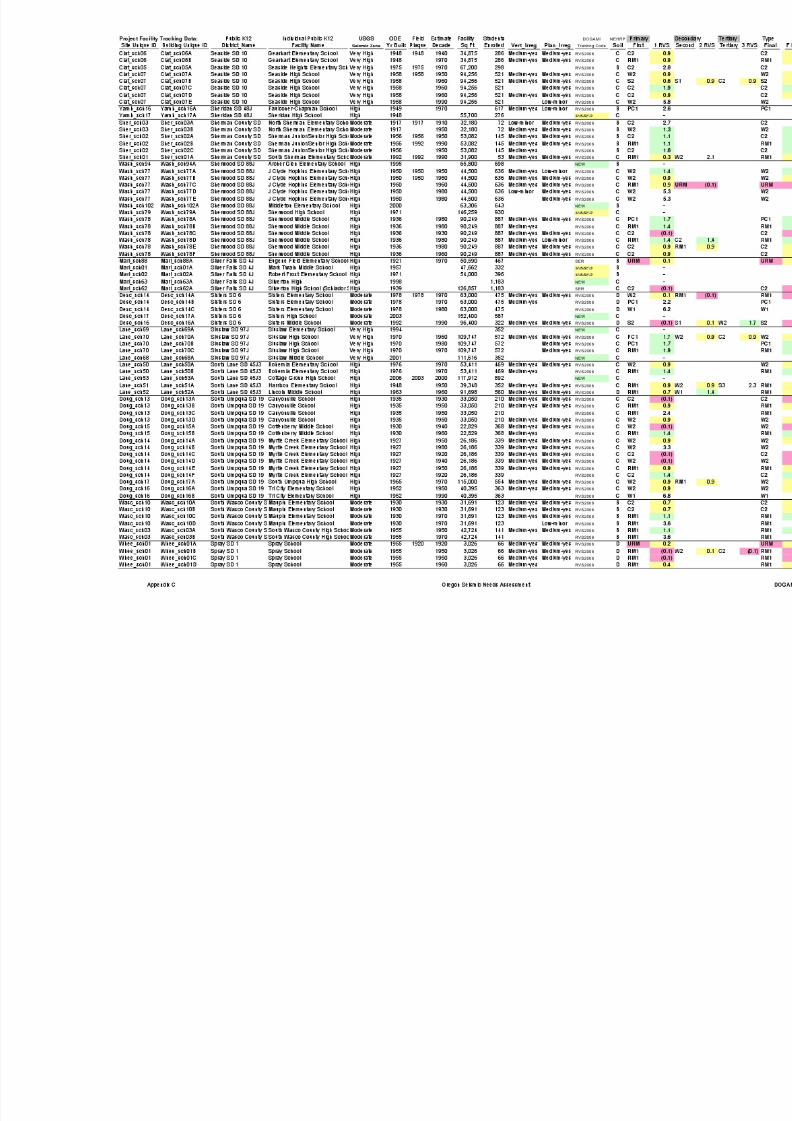
8/3/2019 Statewide Seismic Needs Assessment report
http://slidepdf.com/reader/full/statewide-seismic-needs-assessment-report 116/341

8/3/2019 Statewide Seismic Needs Assessment report
http://slidepdf.com/reader/full/statewide-seismic-needs-assessment-report 117/341

8/3/2019 Statewide Seismic Needs Assessment report
http://slidepdf.com/reader/full/statewide-seismic-needs-assessment-report 118/341
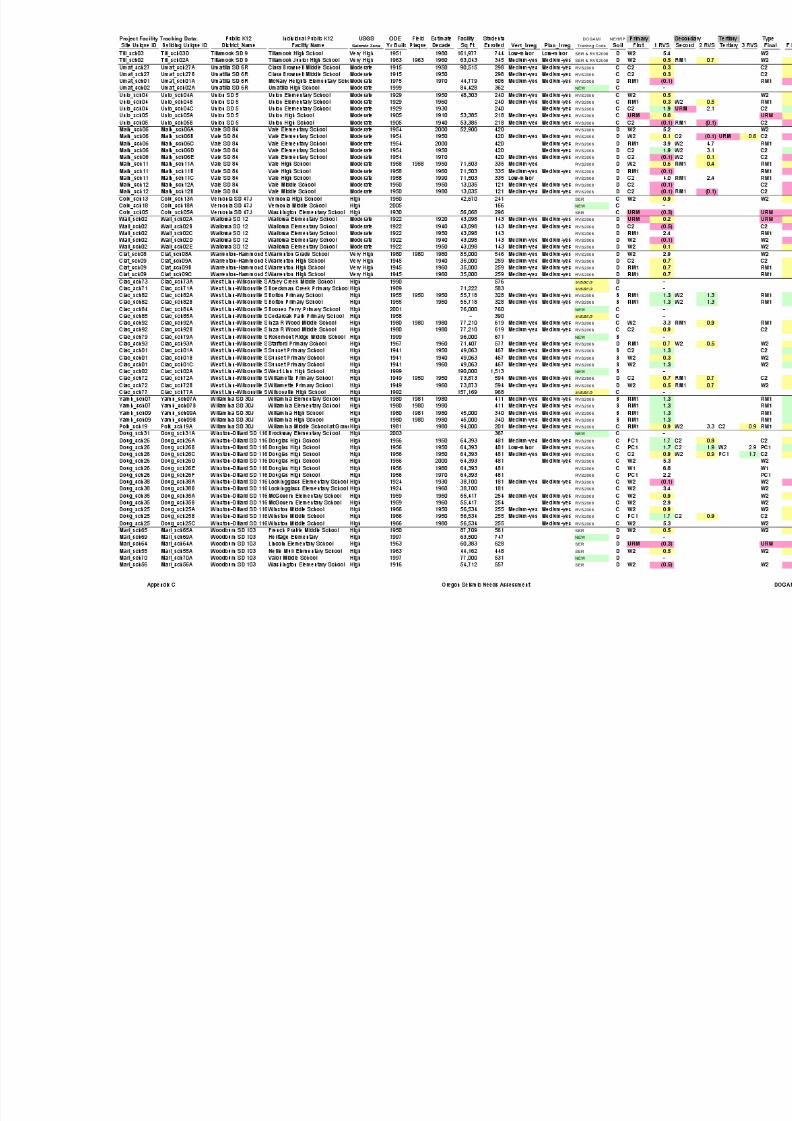
8/3/2019 Statewide Seismic Needs Assessment report
http://slidepdf.com/reader/full/statewide-seismic-needs-assessment-report 119/341

8/3/2019 Statewide Seismic Needs Assessment report
http://slidepdf.com/reader/full/statewide-seismic-needs-assessment-report 120/341
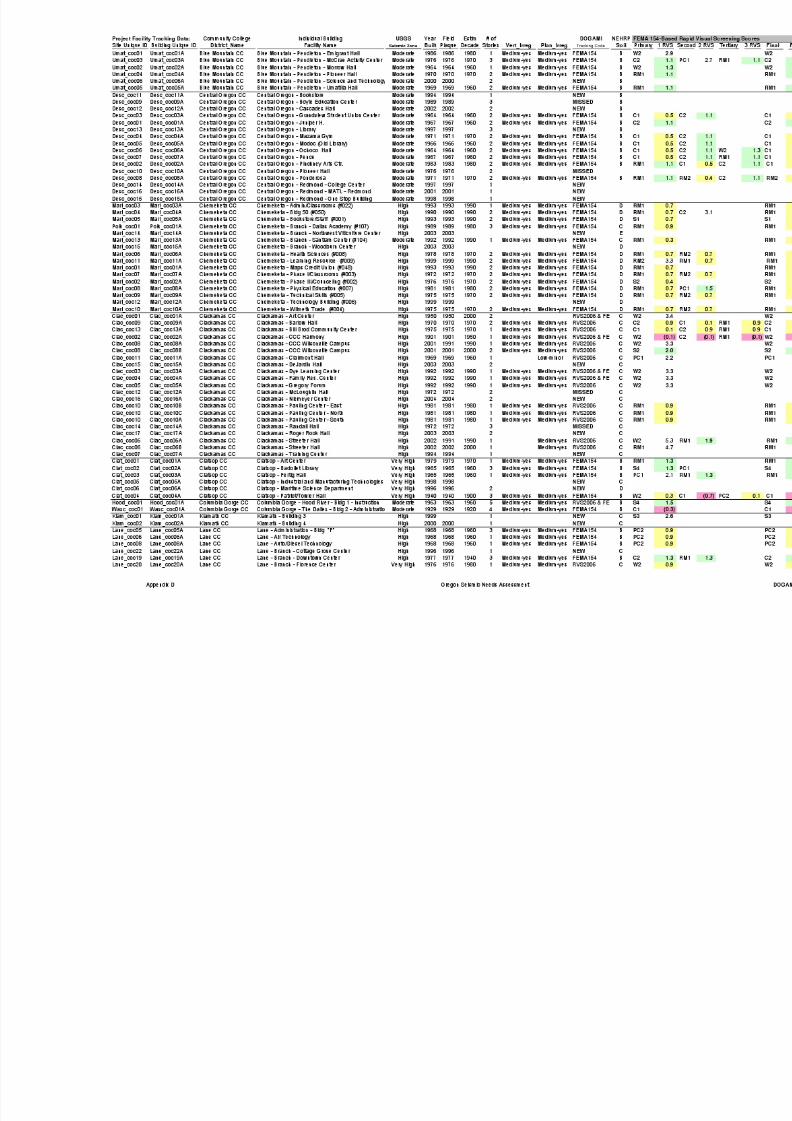
8/3/2019 Statewide Seismic Needs Assessment report
http://slidepdf.com/reader/full/statewide-seismic-needs-assessment-report 121/341
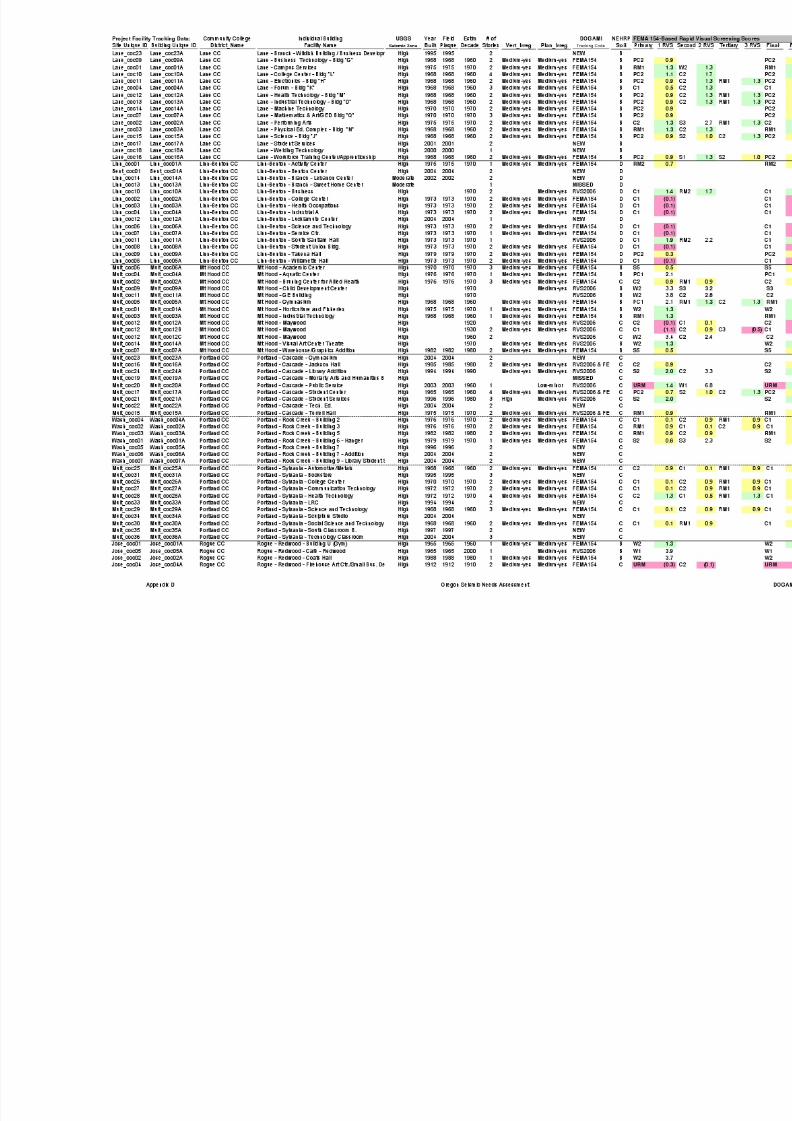
8/3/2019 Statewide Seismic Needs Assessment report
http://slidepdf.com/reader/full/statewide-seismic-needs-assessment-report 122/341
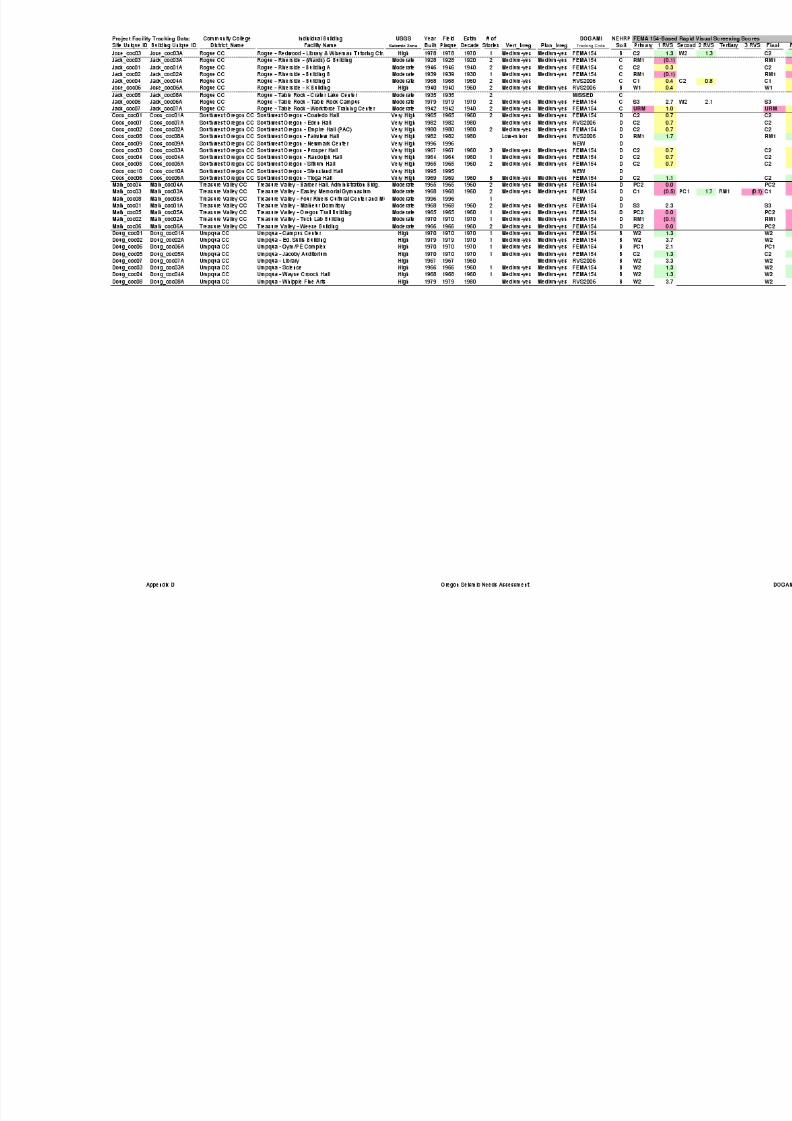
8/3/2019 Statewide Seismic Needs Assessment report
http://slidepdf.com/reader/full/statewide-seismic-needs-assessment-report 123/341

8/3/2019 Statewide Seismic Needs Assessment report
http://slidepdf.com/reader/full/statewide-seismic-needs-assessment-report 124/341
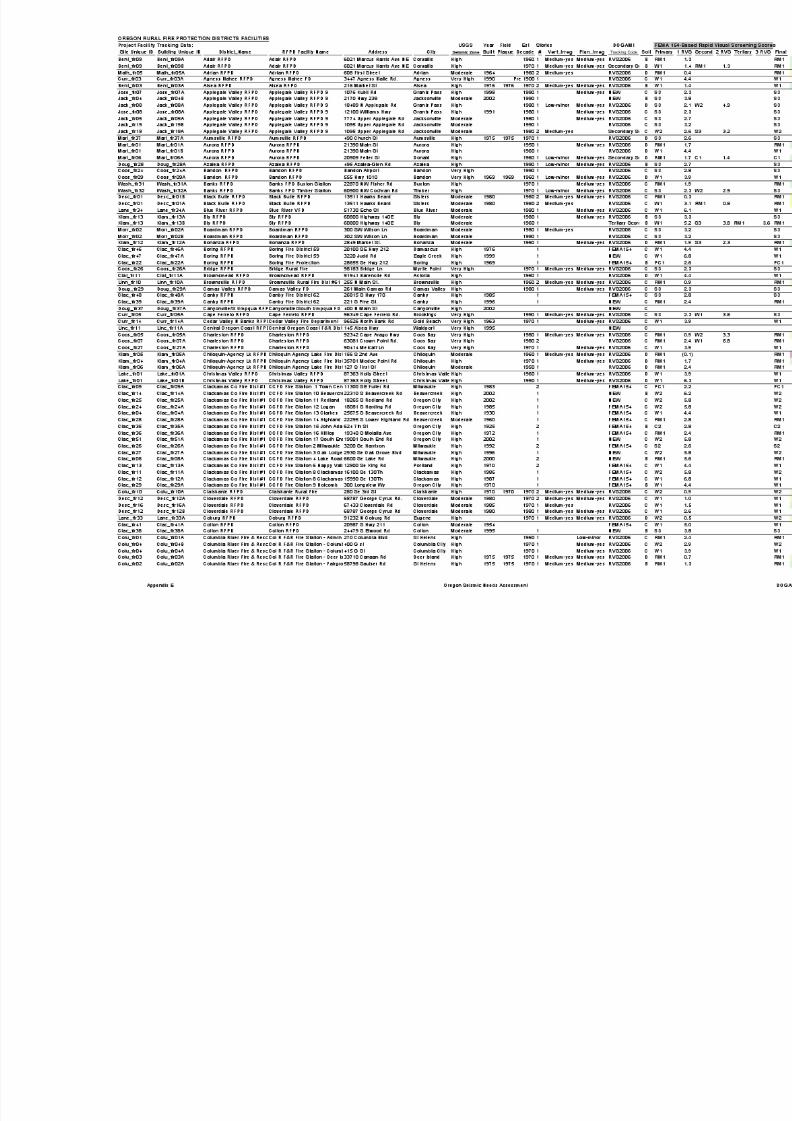
8/3/2019 Statewide Seismic Needs Assessment report
http://slidepdf.com/reader/full/statewide-seismic-needs-assessment-report 125/341
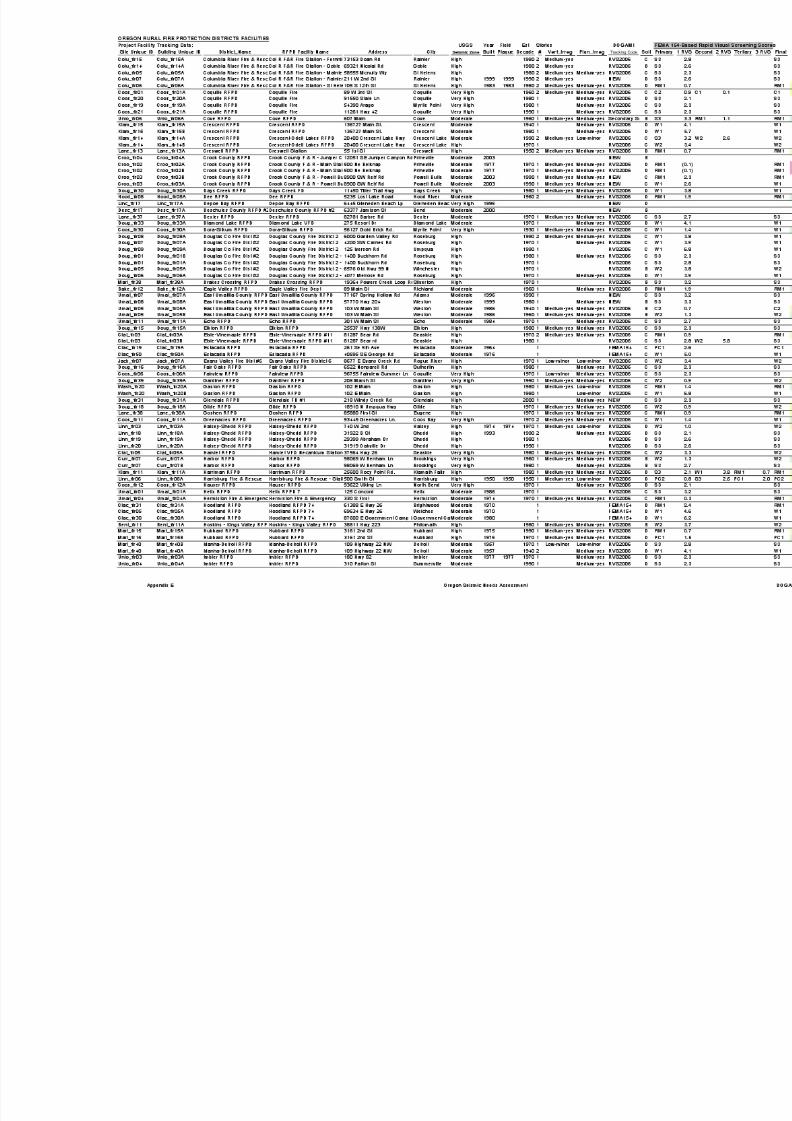
8/3/2019 Statewide Seismic Needs Assessment report
http://slidepdf.com/reader/full/statewide-seismic-needs-assessment-report 126/341
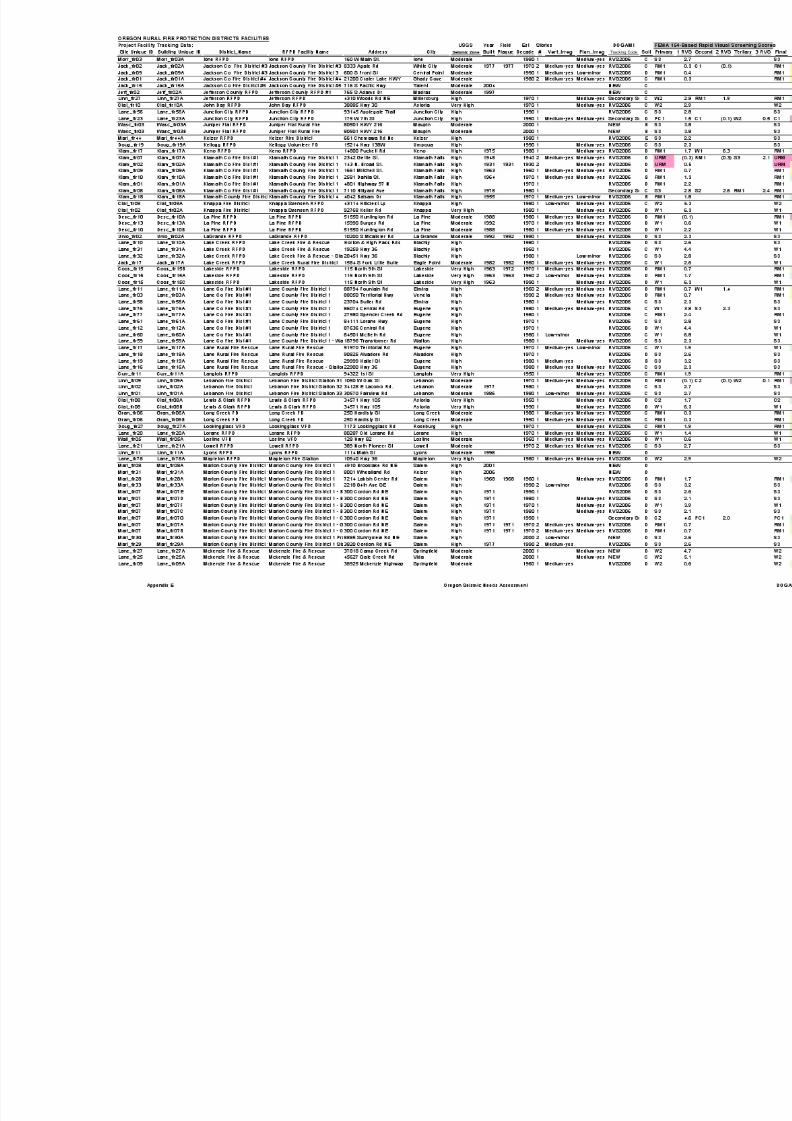
8/3/2019 Statewide Seismic Needs Assessment report
http://slidepdf.com/reader/full/statewide-seismic-needs-assessment-report 127/341
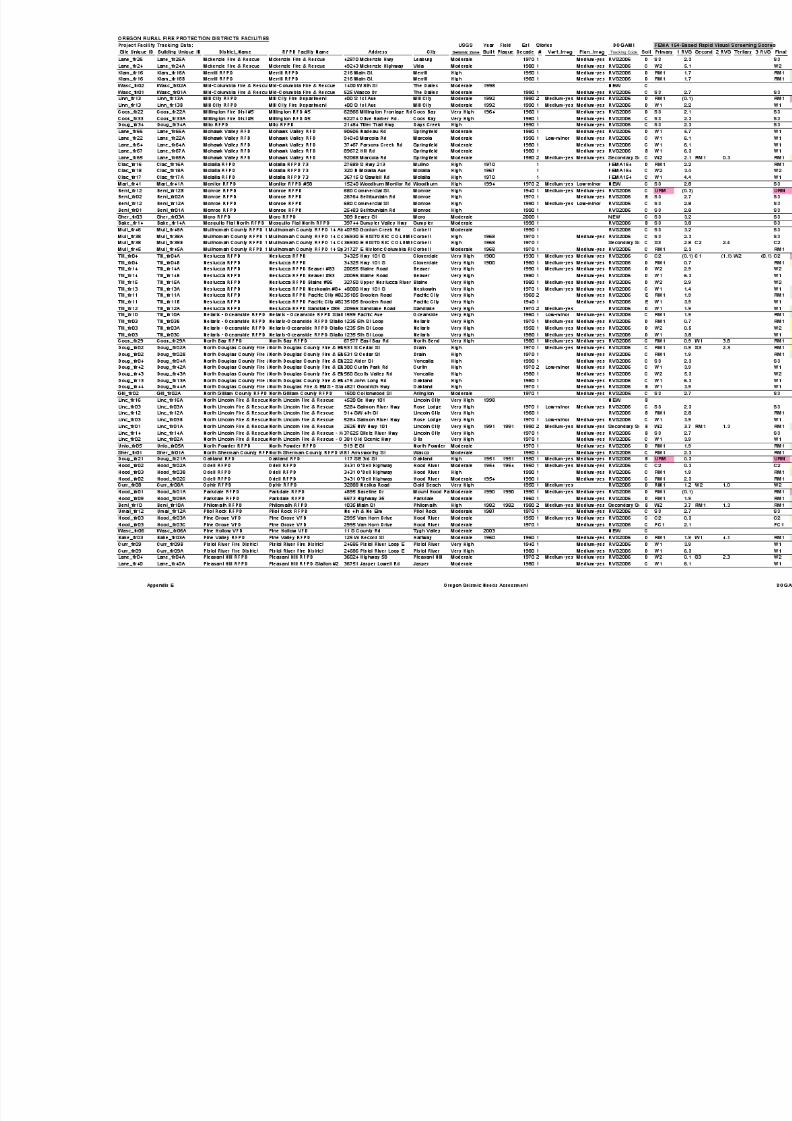
8/3/2019 Statewide Seismic Needs Assessment report
http://slidepdf.com/reader/full/statewide-seismic-needs-assessment-report 128/341
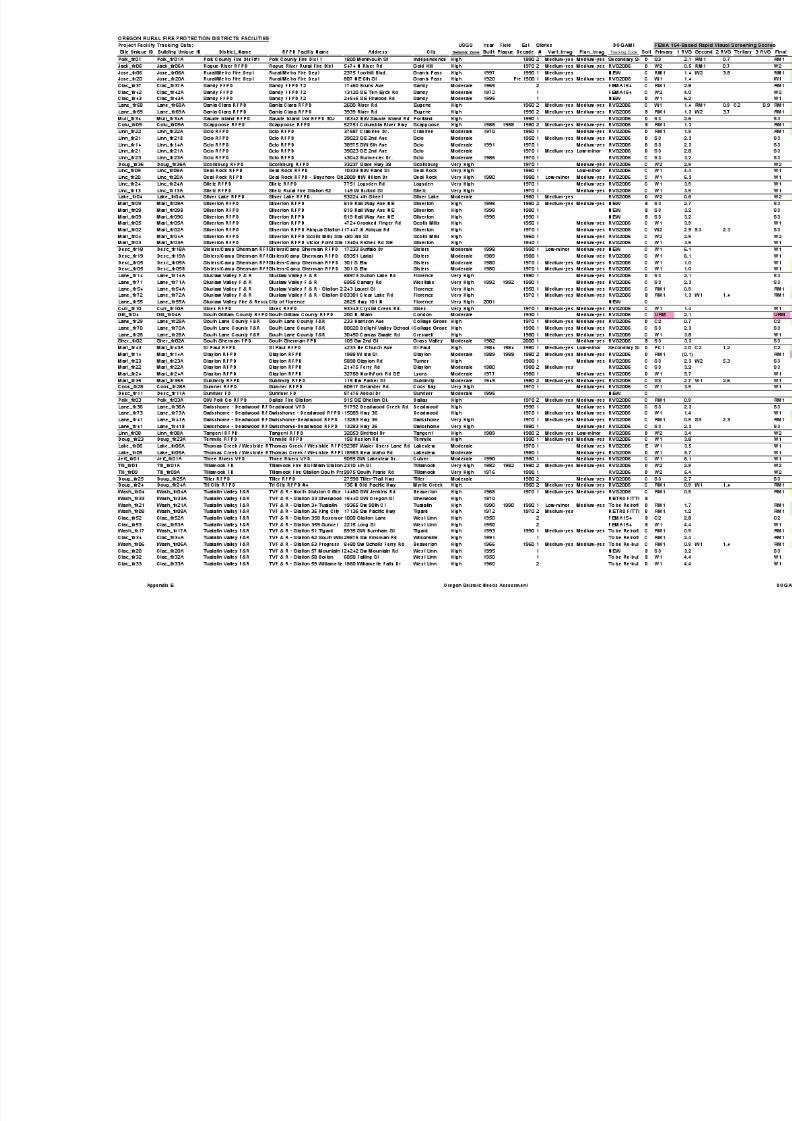
8/3/2019 Statewide Seismic Needs Assessment report
http://slidepdf.com/reader/full/statewide-seismic-needs-assessment-report 129/341
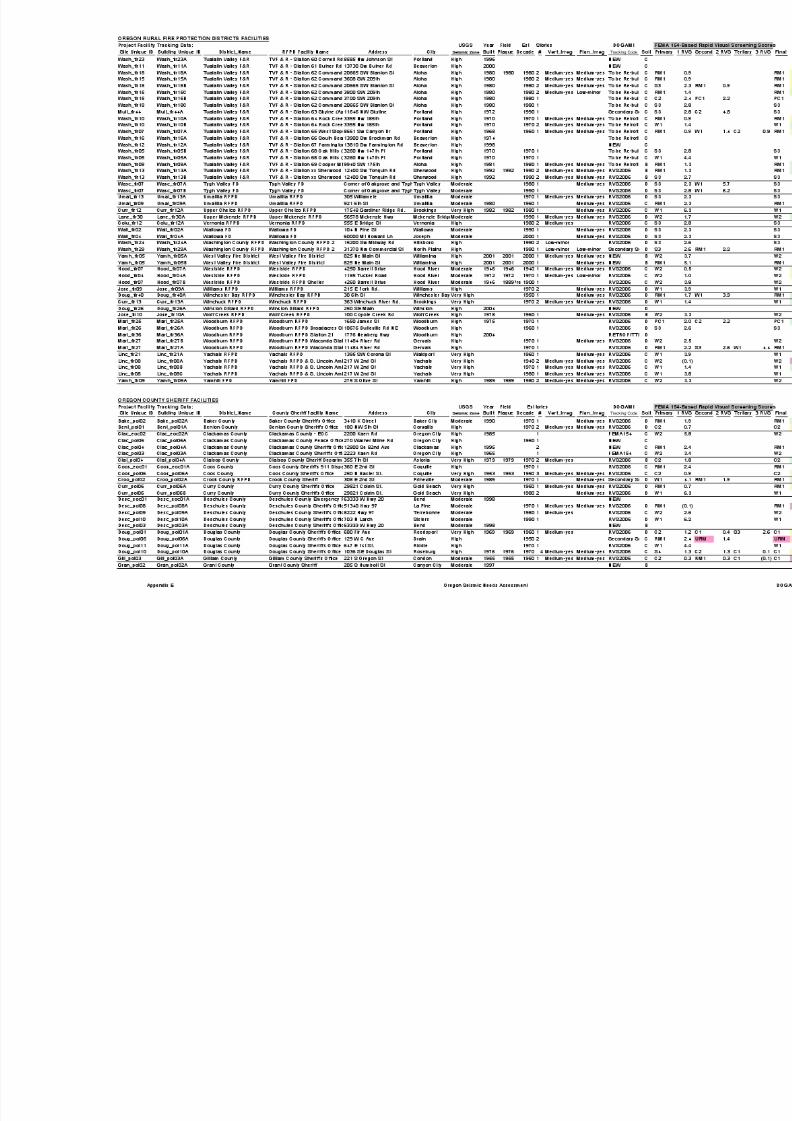
8/3/2019 Statewide Seismic Needs Assessment report
http://slidepdf.com/reader/full/statewide-seismic-needs-assessment-report 130/341
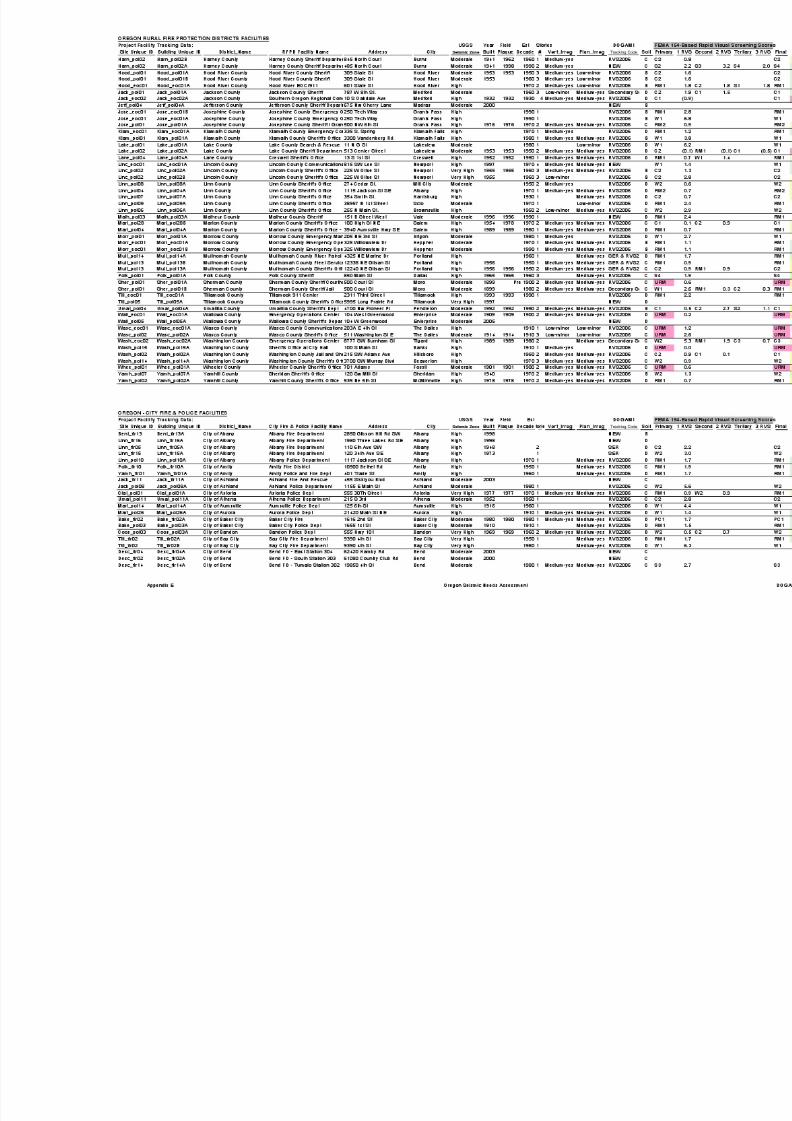
8/3/2019 Statewide Seismic Needs Assessment report
http://slidepdf.com/reader/full/statewide-seismic-needs-assessment-report 131/341
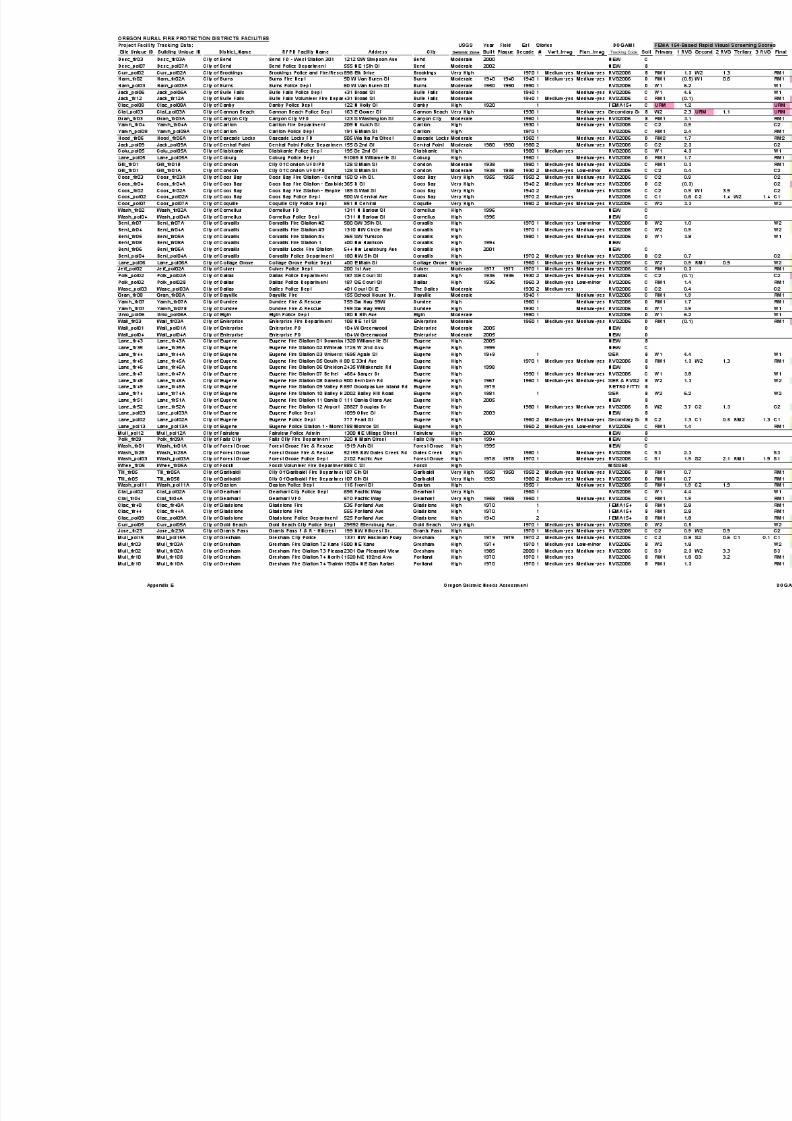
8/3/2019 Statewide Seismic Needs Assessment report
http://slidepdf.com/reader/full/statewide-seismic-needs-assessment-report 132/341
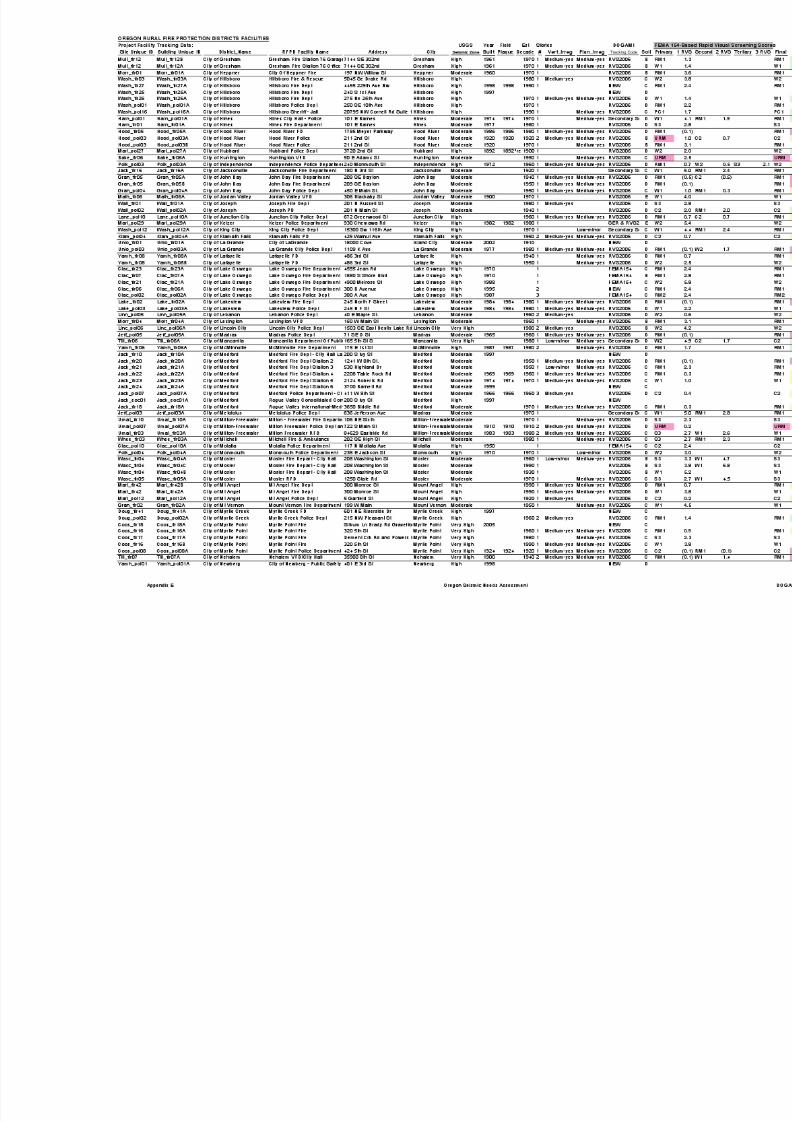
8/3/2019 Statewide Seismic Needs Assessment report
http://slidepdf.com/reader/full/statewide-seismic-needs-assessment-report 133/341
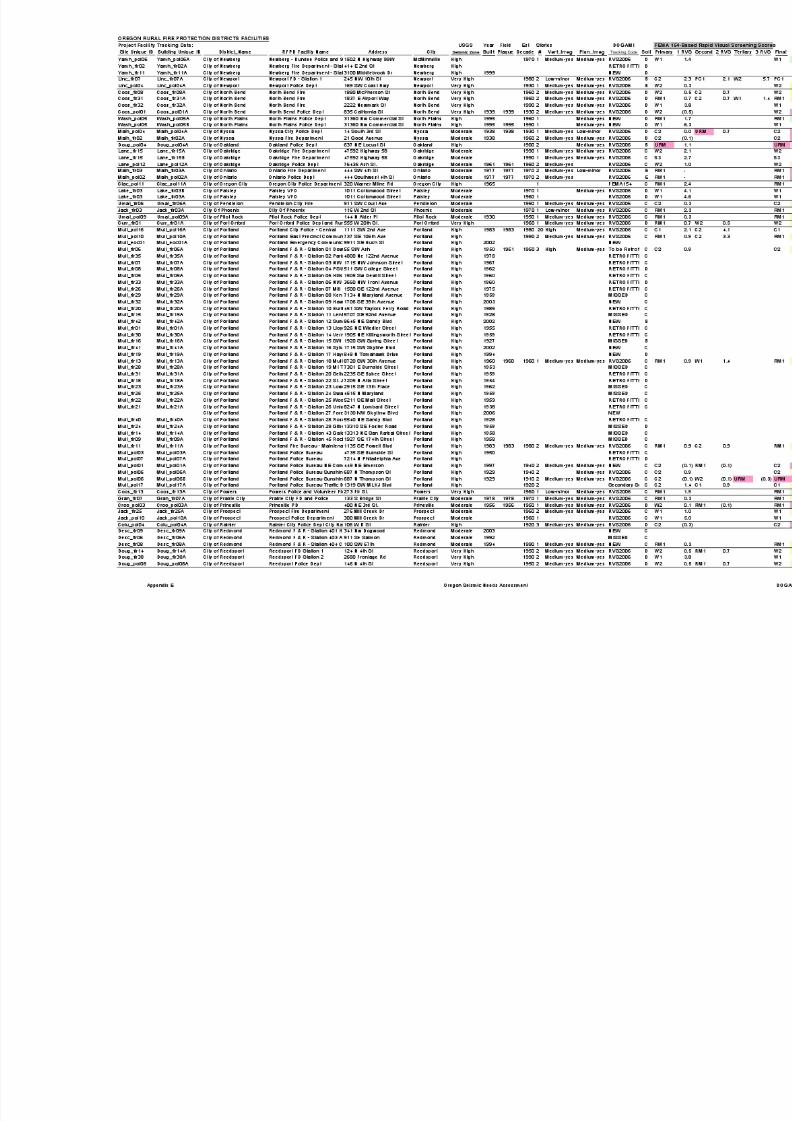
8/3/2019 Statewide Seismic Needs Assessment report
http://slidepdf.com/reader/full/statewide-seismic-needs-assessment-report 134/341
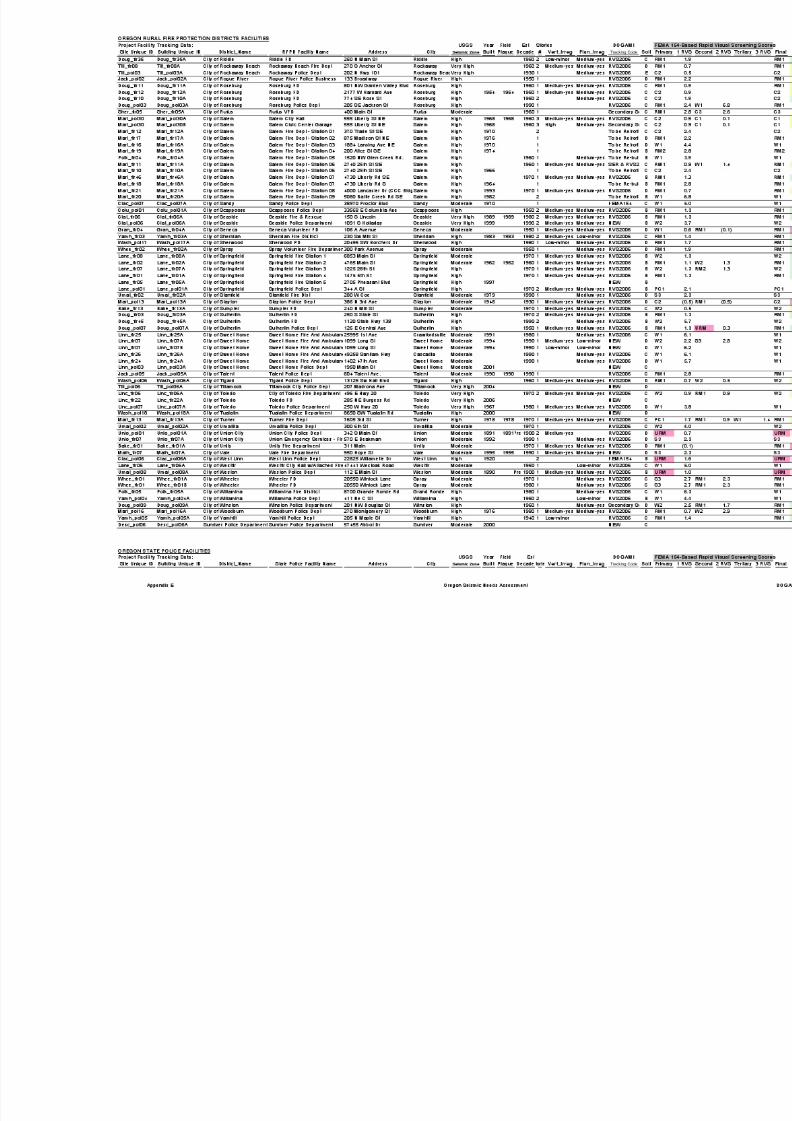
8/3/2019 Statewide Seismic Needs Assessment report
http://slidepdf.com/reader/full/statewide-seismic-needs-assessment-report 135/341
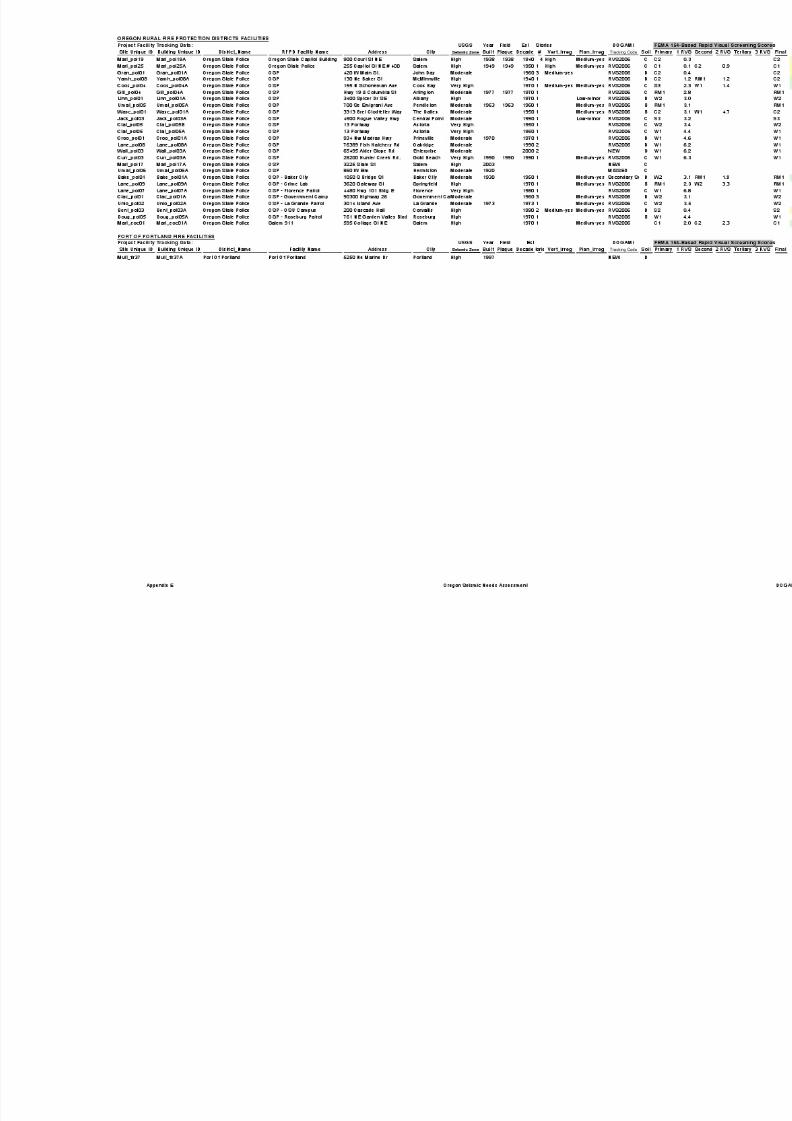
8/3/2019 Statewide Seismic Needs Assessment report
http://slidepdf.com/reader/full/statewide-seismic-needs-assessment-report 136/341
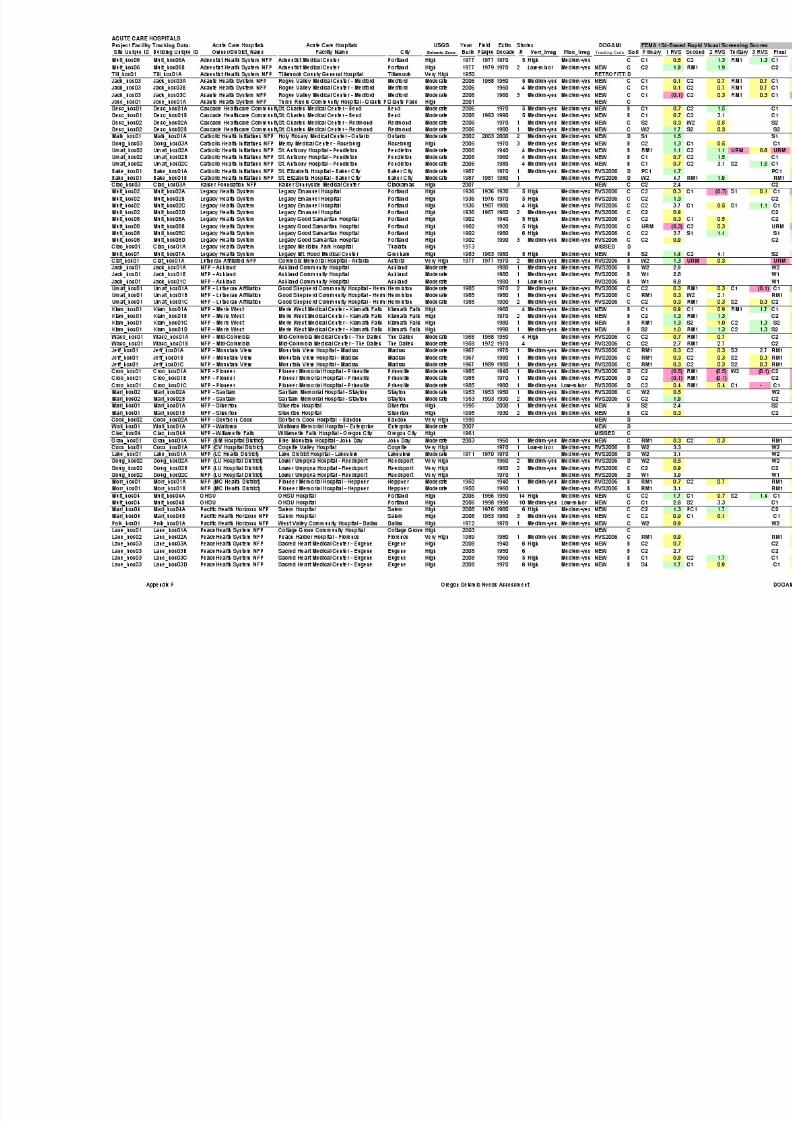
8/3/2019 Statewide Seismic Needs Assessment report
http://slidepdf.com/reader/full/statewide-seismic-needs-assessment-report 137/341
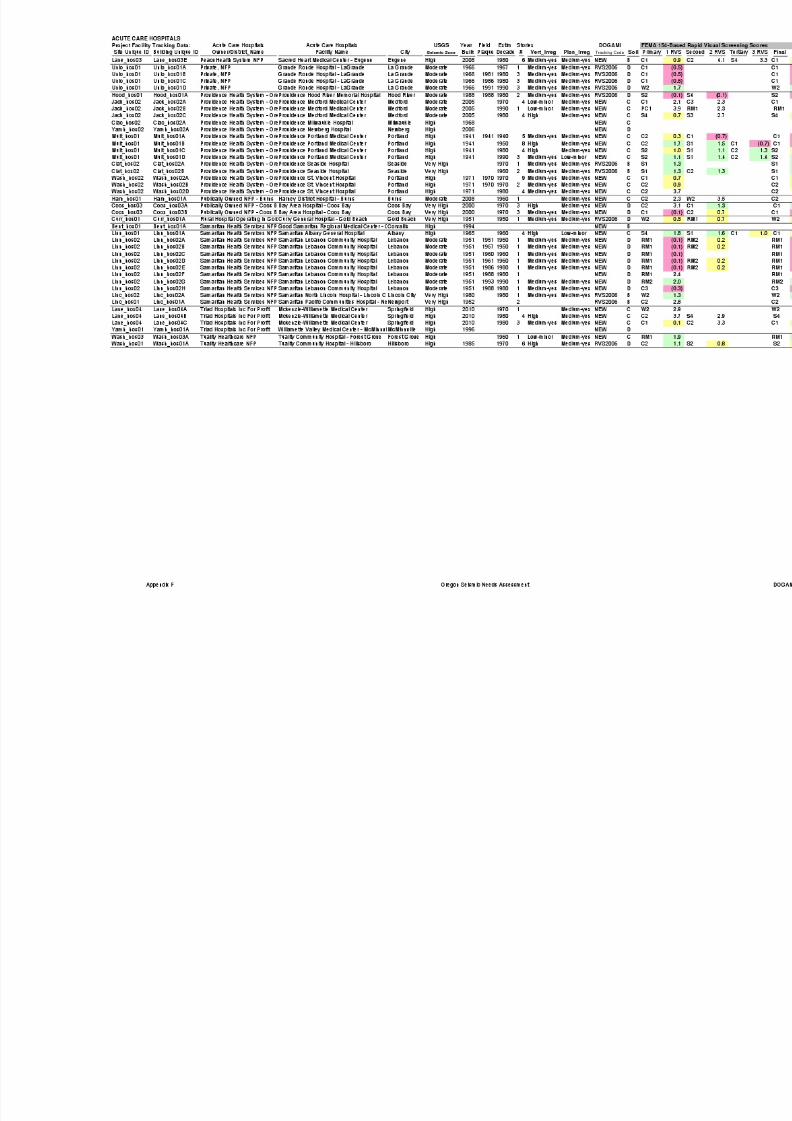
8/3/2019 Statewide Seismic Needs Assessment report
http://slidepdf.com/reader/full/statewide-seismic-needs-assessment-report 138/341
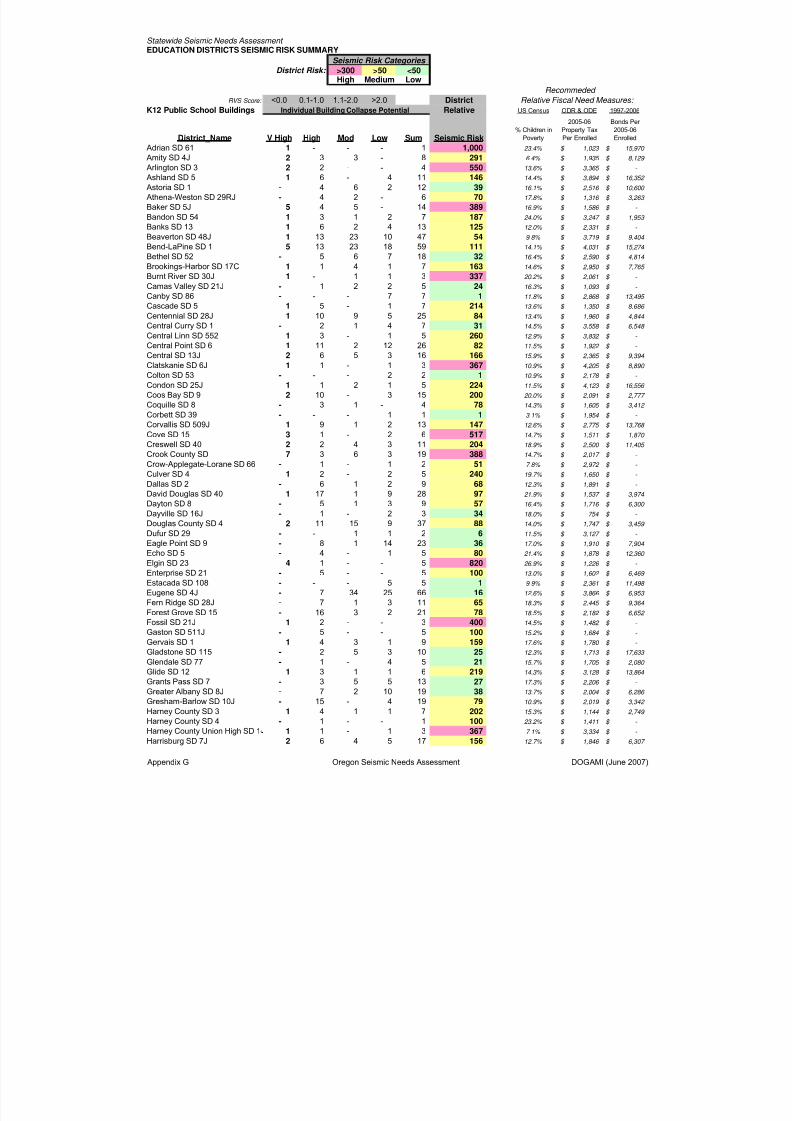
8/3/2019 Statewide Seismic Needs Assessment report
http://slidepdf.com/reader/full/statewide-seismic-needs-assessment-report 139/341
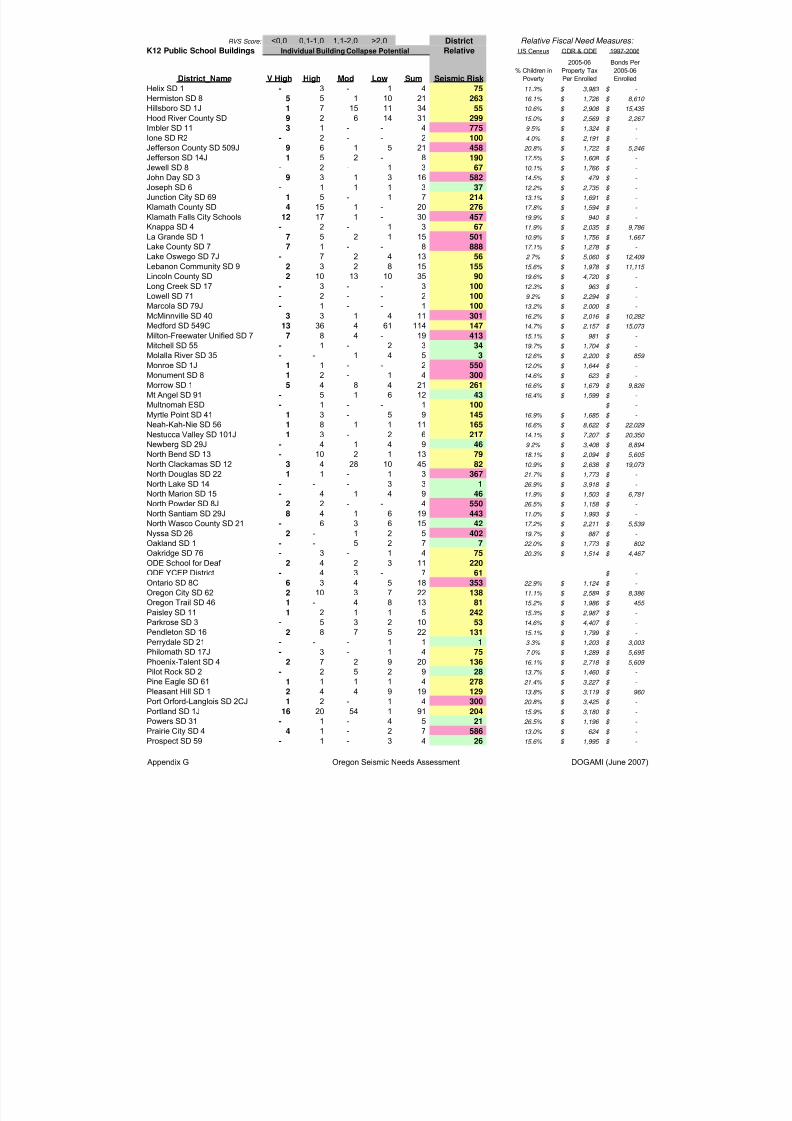
8/3/2019 Statewide Seismic Needs Assessment report
http://slidepdf.com/reader/full/statewide-seismic-needs-assessment-report 140/341
RVS Score: <0.0 0.1-1.0 1.1-2.0 >2.0 District Relative Fiscal Need Measures:
K12 Public School Buildings Individual Building Collapse Potential Relative US Census ODR & ODE 1997-2006
District_Name V High High Mod Low Sum Seismic Risk% Children in
Poverty
2005-06
Property Tax
Per Enrolled
Bonds Per
2005-06
Enrolled
Helix SD 1 - 3 - 1 4 75 11.3% 3,983 $ - $
Hermiston SD 8 5 5 1 10 21 263 16.1% 1,726 $ 8,610 $
Hillsboro SD 1J 1 7 15 11 34 55 10.6% 2,908 $ 15,435 $
Hood River County SD 9 2 6 14 31 299 15.0% 2,569 $ 2,267 $
Imbler SD 11 3 1 - - 4 775 9.5% 1,324 $ - $
Ione SD R2 - 2 - - 2 100 4.0% 2,191$ - $
Jefferson County SD 509J 9 6 1 5 21 458 20.8% 1,722 $ 5,246 $
Jefferson SD 14J 1 5 2 - 8 190 17.5% 1,608 $ - $
Jewell SD 8 - 2 - 1 3 67 10.1% 1,766 $ - $
John Day SD 3 9 3 1 3 16 582 14.5% 479 $ - $
Joseph SD 6 - 1 1 1 3 37 12.2% 2,735 $ - $
Junction City SD 69 1 5 - 1 7 214 13.1% 1,691$ - $
Klamath County SD 4 15 1 - 20 276 17.8% 1,594 $ - $
Klamath Falls City Schools 12 17 1 - 30 457 19.9% 940 $ - $
Knappa SD 4 - 2 - 1 3 67 11.9% 2,035 $ 9,786 $
La Grande SD 1 7 5 2 1 15 501 10.9% 1,756 $ 1,667 $
Lake County SD 7 7 1 - - 8 888 17.1% 1,278 $ - $
Lake Oswego SD 7J - 7 2 4 13 56 2.7% 5,060 $ 12,409 $
Lebanon Community SD 9 2 3 2 8 15 155 15.6% 1,978 $ 11,115 $
Lincoln County SD 2 10 13 10 35 90 19.6% 4,720 $ - $
Long Creek SD 17 - 3 - - 3 100 12.3% 963 $ - $
Lowell SD 71 - 2 - - 2 100 9.2% 2,294 $ - $
Marcola SD 79J - 1 - - 1 100 13.2% 2,000 $ - $
McMinnville SD 40 3 3 1 4 11 301 16.2% 2,016 $ 10,282 $
Medford SD 549C 13 36 4 61 114 147 14.7% 2,157 $ 15,073 $
Milton-Freewater Unified SD 7 7 8 4 - 19 413 15.1% 981$ - $
Mitchell SD 55 - 1 - 2 3 34 19.7% 1,704 $ - $
Molalla River SD 35 - - 1 4 5 3 12.6% 2,200 $ 859 $
Monroe SD 1J 1 1 - - 2 550 12.0% 1,644 $ - $
Monument SD 8 1 2 - 1 4 300 14.6% 623 $ - $
Morrow SD 1 5 4 8 4 21 261 16.6% 1,679 $ 9,826 $
Mt Angel SD 91 - 5 1 6 12 43 16.4% 1,599 $ - $
Multnomah ESD - 1 - - 1 100 - $
Myrtle Point SD 41 1 3 - 5 9 145 16.9% 1,685 $ - $
Neah-Kah-Nie SD 56 1 8 1 1 11 165 16.6% 8,622 $ 22,029 $
Nestucca Valley SD 101J 1 3 - 2 6 217 14.1% 7,207 $ 20,350 $
Newberg SD 29J - 4 1 4 9 46 9.2% 3,408 $ 8,894 $
North Bend SD 13 - 10 2 1 13 79 18.1% 2,094 $ 5,605 $ North Clackamas SD 12 3 4 28 10 45 82 10.9% 2,638 $ 19,073 $
North Douglas SD 22 1 1 - 1 3 367 21.7% 1,773 $ - $
North Lake SD 14 - - - 3 3 1 26.9% 3,918 $ - $
North Marion SD 15 - 4 1 4 9 46 11.9% 1,503 $ 6,781$
North Powder SD 8J 2 2 - - 4 550 26.5% 1,158 $ - $
North Santiam SD 29J 8 4 1 6 19 443 11.0% 1,993 $ - $
North Wasco County SD 21 - 6 3 6 15 42 17.2% 2,211$ 5,539 $
Nyssa SD 26 2 - 1 2 5 402 19.7% 887 $ - $
Oakland SD 1 - - 5 2 7 7 22.0% 1,773 $ 802 $
Oakridge SD 76 - 3 - 1 4 75 20.3% 1,514 $ 4,467 $
ODE School for Deaf 2 4 2 3 11 220 ODE YCEP District - 4 3 - 7 61 - $
Ontario SD 8C 6 3 4 5 18 353 22.9% 1,124 $ - $
Oregon City SD 62 2 10 3 7 22 138 11.1% 2,589 $ 8,386 $
Oregon Trail SD 46 1 - 4 8 13 81 15.2% 1,986 $ 455 $
Paisley SD 11 1 2 1 1 5 242 15.3% 2,987 $ - $
Parkrose SD 3 - 5 3 2 10 53 14.6% 4,407 $ - $
Pendleton SD 16 2 8 7 5 22 131 15.1% 1,799 $ - $
Perrydale SD 21 - - - 1 1 1 3.3% 1,203 $ 3,003 $
Philomath SD 17J - 3 - 1 4 75 7.0% 1,289 $ 5,695 $
Phoenix-Talent SD 4 2 7 2 9 20 136 16.1% 2,718 $ 5,609 $
Pilot Rock SD 2 - 2 5 2 9 28 13.7% 1,460 $ - $
Pine Eagle SD 61 1 1 1 1 4 278 21.4% 3,227 $ - $
Pleasant Hill SD 1 2 4 4 9 19 129 13.8% 3,119 $ 960 $
Port Orford-Langlois SD 2CJ 1 2 - 1 4 300 20.8% 3,425 $ - $
Portland SD 1J 16 20 54 1 91 204 15.9% 3,180 $ - $
Powers SD 31 - 1 - 4 5 21 26.5% 1,196 $ - $
Prairie City SD 4 4 1 - 2 7 586 13.0% 624 $ - $
Prospect SD 59 - 1 - 3 4 26 15.6% 1,995 $ - $
Appendix G Oregon Seismic Needs Assessment DOGAMI (June 2007)

8/3/2019 Statewide Seismic Needs Assessment report
http://slidepdf.com/reader/full/statewide-seismic-needs-assessment-report 141/341

8/3/2019 Statewide Seismic Needs Assessment report
http://slidepdf.com/reader/full/statewide-seismic-needs-assessment-report 142/341

8/3/2019 Statewide Seismic Needs Assessment report
http://slidepdf.com/reader/full/statewide-seismic-needs-assessment-report 143/341
Statewide Seismic Needs Assessment
EMERGENCY DISTRICTS SEISMIC RISK SUMMARY
Seismic Risk Categories
Oregon Seismic Needs Assessment District Risk: >300 >50 <50
City Fire & Police Departments High Medium Low
RVS Score: <0.0 0.1-1.0 1.1-2.0 >2.0 District
Individual Building Collapse Potential Relative
City Fire & Police Departments V hi Hi Mod Low Sum Seismic Risk
City of Albany - - 1 4 5 3
City of Amity - - 2 - 2 10 City of Ashland - - - 2 2 1
City of Astoria - 1 - - 1 100
City of Athena - - - 1 1 1
City of Aumsville - - - 1 1 1
City of Aurora - - 1 - 1 10
City of Baker City - - 2 - 2 10
City of Bandon - 1 - - 1 100
City of Bay City - - 1 1 2 6
City of Bend - - - 5 5 1
City of Brookings - - 1 - 1 10
City of Burns 1 - - 1 2 501
City of Butte Falls 1 - - 1 2 501
City of Canby - - 1 - 1 10
City of Cannon Beach - - 1 - 1 10
City of Canyon City - - - 1 1 1 City of Carlton - 1 - 1 2 51
City of Cascade Locks - - 1 - 1 10
City of Central Point - - - 1 1 1
City of Clatskanie - - - 1 1 1
City of Coburg - - 1 - 1 10
City of Condon - 2 - - 2 100
City of Coos Bay 1 3 - - 4 325
City of Coquille - - - 1 1 1
City of Cornelius - - - 2 2 1
City of Corvallis - 3 - 3 6 51
City of Cottage Grove - 1 - - 1 100
City of Culver - 1 - - 1 100
City of Dallas 1 1 1 - 3 370
City of Dayville - - 1 - 1 10
City of Dundee - - 1 1 2 6 City of Elgin - - - 1 1 1
City of Enterprise 1 - - 2 3 334
City of Eugene - 1 5 8 14 11
City of Fairview - - - 1 1 1
City of Falls City - - - 1 1 1
City of Forest Grove - - 1 2 3 4
City of Fossil - 1 - - 1 100
City of Garibaldi - 2 - - 2 100
City of Gaston - - 1 - 1 10
City of Gearhart - - 1 1 2 6
City of Gladstone - - 1 2 3 4
City of Gold Beach - 1 - - 1 100
City of Grants Pass - 1 - - 1 100
City of Gresham - 1 5 1 7 22
City of Heppner - - - 1 1 1 City of Hillsboro - - 2 4 6 4
City of Hines - - 1 1 2 6
City of Hood River 1 1 - 1 3 367
City of Hubbard - - 1 - 1 10
City of Huntington - - - 1 1 1
City of Independence - 1 - - 1 100
City of Jacksonville - - - 1 1 1
City of John Day 2 1 - - 3 700
City of Jordan Valley - - - 1 1 1
City of Joseph - - 1 1 2 6
City of Junction City - 1 - - 1 100
City of Keizer - - - 1 1 1
City of King City - - - 1 1 1
Appendix H Oregon Seismic Needs Assessment DOGAMI (June 2007)

8/3/2019 Statewide Seismic Needs Assessment report
http://slidepdf.com/reader/full/statewide-seismic-needs-assessment-report 144/341
City Fire & Police Departments V hi Hi Mod Low Sum Seismic Risk
City of Klamath Falls - 1 - - 1 100
City of La Grande 1 - - 1 2 501
City of Lafayette - 1 - 1 2 51
City of Lake Oswego - - - 5 5 1
City of Lakeview 1 - - 1 2 501
City of Lebanon - 1 - - 1 100
City of Lexington - - - 1 1 1
City of Lincoln City - - - 1 1 1
City of Madras 1 - - - 1 1,000 City of Manzanita - - 1 - 1 10
City of McMinnville - - 1 - 1 10
City of Medford 1 4 - 4 9 156
City of Metoloius - - - 1 1 1
City of Milton-Freewater - 1 - 2 3 34
City of Mitchell - - - 1 1 1
City of Molalla - - - 1 1 1
City of Monmouth - - - 1 1 1
City of Mosier - - - 4 4 1
City of Mt Angel - 2 - 1 3 67
City of Mt Vernon - - - 1 1 1
City of Myrtle Creek - - 1 1 2 6
City of Myrtle Point 1 1 - 3 5 221
City of Nehalem 1 - - - 1 1,000
City of Newberg - - 2 2 4 6 City of Newport - 1 - 1 2 51
City of North Bend 1 2 - 1 4 300
City of North Plains - - 1 1 2 6
City of Nyssa 2 - - - 2 1,000
City of Oakland - - 1 - 1 10
City of Oakridge - 1 - 2 3 34
City of Ontario 2 - - - 2 1,000
City of Oregon City - - - 1 1 1
City of Paisley - - - 2 2 1
City of Pendleton - 1 - - 1 100
City Of Phoenix - - - 1 1 1
City of Pilot Rock - 1 - - 1 100
City of Port Orford - 1 - - 1 100
City of Portland 2 14 16 8 40 89
City of Powers - - 1 - 1 10 City of Prairie City - 1 - - 1 100
City of Prineville 1 - - - 1 1,000
City of Prospect - 1 - 1 2 51
City of Rainier 1 - - - 1 1,000
City of Redmond - 2 - 1 3 67
City of Reedsport - 2 - 1 3 67
City of Riddle - - 1 - 1 10
City of Rockaway Beach - 2 - - 2 100
City of Rogue River - - - 1 1 1
City of Roseburg - 2 1 1 4 53
City of Rufus - - - 1 1 1
City of Salem - 4 1 8 13 32
City of Sandy - - - 1 1 1
City of Scappoose - - 1 - 1 10
City of Seaside - - 1 1 2 6 City of Seneca 1 - - - 1 1,000
City of Sheridan - - 1 - 1 10
City of Sherwood - - 1 - 1 10
City of Spray - - 1 - 1 10
City of Springfield - - 4 2 6 7
City of Stanfield - - - 1 1 1
City of Stayton 1 - - - 1 1,000
City of Sumpter - 1 - - 1 100
City of Sutherlin - - 2 1 3 7
City of Sweet Home - - - 6 6 1
City of Talent - - - 1 1 1
City of Tigard - 1 - - 1 100
City of Tillamook - - - 1 1 1
Appendix H Oregon Seismic Needs Assessment DOGAMI (June 2007)

8/3/2019 Statewide Seismic Needs Assessment report
http://slidepdf.com/reader/full/statewide-seismic-needs-assessment-report 145/341
City Fire & Police Departments V hi Hi Mod Low Sum Seismic Risk
City of Toledo - 1 - 2 3 34
City of Tualatin - - - 1 1 1
City of Turner - 1 - - 1 100
City of Umatilla - - - 1 1 1
City of Union City - 1 - 1 2 51
City of Unity 1 - - - 1 1,000
City of Vale - - - 1 1 1
City of West Linn - - 1 - 1 10
City of Westfir - - - 1 1 1 City of Weston - 1 - - 1 100
City of Wheeler - - - 2 2 1
City of Willamina - - - 2 2 1
City of Winston - - 1 - 1 10
City of Woodburn - 1 - - 1 100
City of Yamhill - - 1 - 1 10
Sunriver - - - 1 1 1
26 78 75 148 327
Seismic Risk Categories
Oregon Seismic Needs Assessment District Risk: >300 >50 <50
County Sheriff's Buildings High Medium Low District
Individual Building Collapse Potential Relative
District_Name V hi Hi Mod Low Sum Seismic Risk
Baker County - - 1 - 1 10
Benton County - 1 - - 1 100
Clackamas County - - - 4 4 1
Clatsop County - - 1 - 1 10
Columbia County - - - - - -
Coos County - 1 - 1 2 51
Crook County - - 1 - 1 10
Curry County - 1 - 1 2 51
Deschutes County 1 - - 4 5 201
Douglas County - 2 1 1 4 53
Gilliam County 1 - - - 1 1,000
Grant County - - - 1 1 1
Harney County - 1 1 - 2 55
Hood River County - - 3 - 3 10
Jackson County 1 - 1 - 2 505
Jefferson County - - - 1 1 1
Josephine County - 1 - 2 3 34
Klamath County - - 1 1 2 6
Lake County 1 - - 1 2 501
Lane County - 1 - - 1 100
Lincoln County - - 2 1 3 7
Linn County - 3 - 2 5 60
Malheur County - - - 1 1 1
Marion County - 2 - - 2 100
Morrow County - - 2 1 3 7
Multnomah County - 2 1 - 3 70
Polk County - - 1 - 1 10
Sherman County - 2 - - 2 100
Tillamook County - - - 2 2 1
Umatilla County - 1 - - 1 100
Union County - - - - - -
Wallowa County - 1 - 1 2 51
Wasco County - - 1 1 2 6
Washington County 1 3 - - 4 325
Wheeler County - 1 - - 1 100
Yamhill County - 1 1 - 2 55
5 24 18 26 73
District_Name V hi Hi Mod Low Sum Seismic Risk
Oregon State Police - 5 4 17 26 21
Port Of Portland - - - 1 1 1
Appendix H Oregon Seismic Needs Assessment DOGAMI (June 2007)
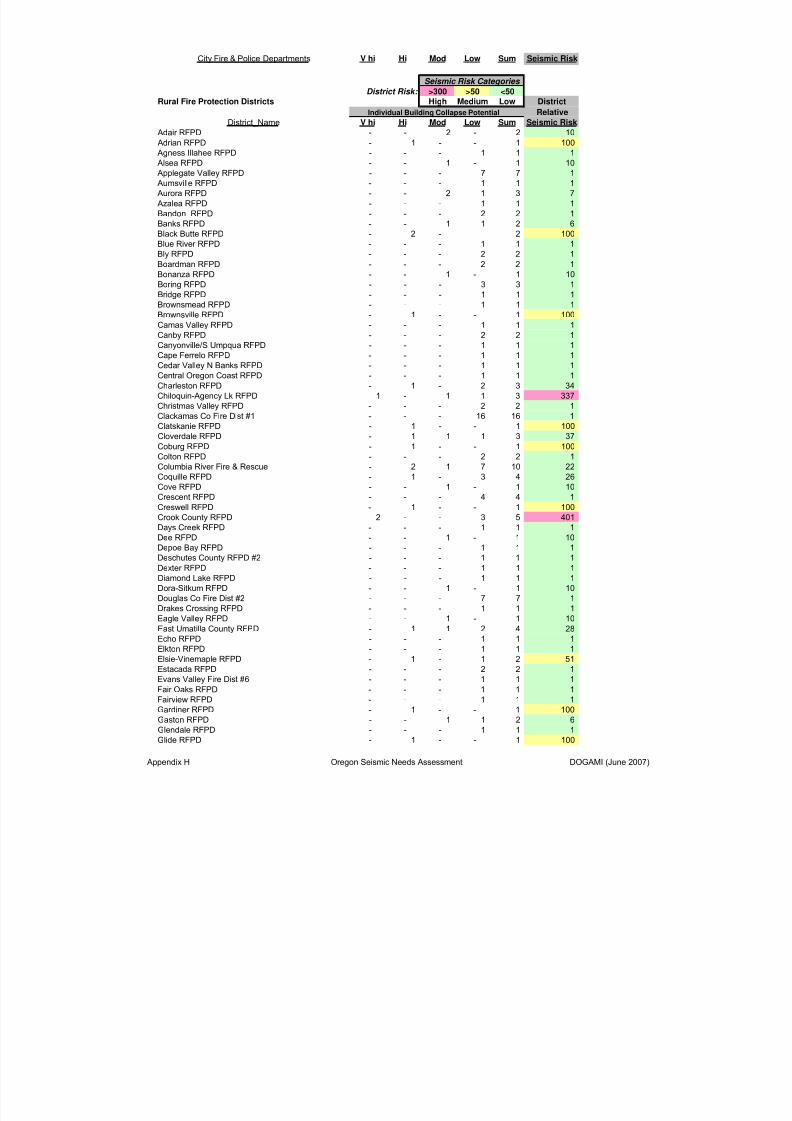
8/3/2019 Statewide Seismic Needs Assessment report
http://slidepdf.com/reader/full/statewide-seismic-needs-assessment-report 146/341
City Fire & Police Departments V hi Hi Mod Low Sum Seismic Risk
Seismic Risk Categories
District Risk: >300 >50 <50
Rural Fire Protection Districts High Medium Low District
Individual Building Collapse Potential Relative
District_Name V hi Hi Mod Low Sum Seismic Risk
Adair RFPD - - 2 - 2 10
Adrian RFPD - 1 - - 1 100
Agness Illahee RFPD - - - 1 1 1 Alsea RFPD - - 1 - 1 10
Applegate Valley RFPD - - - 7 7 1
Aumsville RFPD - - - 1 1 1
Aurora RFPD - - 2 1 3 7
Azalea RFPD - - - 1 1 1
Bandon RFPD - - - 2 2 1
Banks RFPD - - 1 1 2 6
Black Butte RFPD - 2 - 2 100
Blue River RFPD - - - 1 1 1
Bly RFPD - - - 2 2 1
Boardman RFPD - - - 2 2 1
Bonanza RFPD - - 1 - 1 10
Boring RFPD - - - 3 3 1
Bridge RFPD - - - 1 1 1
Brownsmead RFPD - - - 1 1 1 Brownsville RFPD - 1 - - 1 100
Camas Valley RFPD - - - 1 1 1
Canby RFPD - - - 2 2 1
Canyonville/S Umpqua RFPD - - - 1 1 1
Cape Ferrelo RFPD - - - 1 1 1
Cedar Valley N Banks RFPD - - - 1 1 1
Central Oregon Coast RFPD - - - 1 1 1
Charleston RFPD - 1 - 2 3 34
Chiloquin-Agency Lk RFPD 1 - 1 1 3 337
Christmas Valley RFPD - - - 2 2 1
Clackamas Co Fire Dist #1 - - - 16 16 1
Clatskanie RFPD - 1 - - 1 100
Cloverdale RFPD - 1 1 1 3 37
Coburg RFPD - 1 - - 1 100
Colton RFPD - - - 2 2 1 Columbia River Fire & Rescue - 2 1 7 10 22
Coquille RFPD - 1 - 3 4 26
Cove RFPD - - 1 - 1 10
Crescent RFPD - - - 4 4 1
Creswell RFPD - 1 - - 1 100
Crook County RFPD 2 - - 3 5 401
Days Creek RFPD - - - 1 1 1
Dee RFPD - - 1 - 1 10
Depoe Bay RFPD - - - 1 1 1
Deschutes County RFPD #2 - - - 1 1 1
Dexter RFPD - - - 1 1 1
Diamond Lake RFPD - - - 1 1 1
Dora-Sitkum RFPD - - 1 - 1 10
Douglas Co Fire Dist #2 - - - 7 7 1
Drakes Crossing RFPD - - - 1 1 1 Eagle Valley RFPD - - 1 - 1 10
East Umatilla County RFPD - 1 1 2 4 28
Echo RFPD - - - 1 1 1
Elkton RFPD - - - 1 1 1
Elsie-Vinemaple RFPD - 1 - 1 2 51
Estacada RFPD - - - 2 2 1
Evans Valley Fire Dist #6 - - - 1 1 1
Fair Oaks RFPD - - - 1 1 1
Fairview RFPD - - - 1 1 1
Gardiner RFPD - 1 - - 1 100
Gaston RFPD - - 1 1 2 6
Glendale RFPD - - - 1 1 1
Glide RFPD - 1 - - 1 100
Appendix H Oregon Seismic Needs Assessment DOGAMI (June 2007)
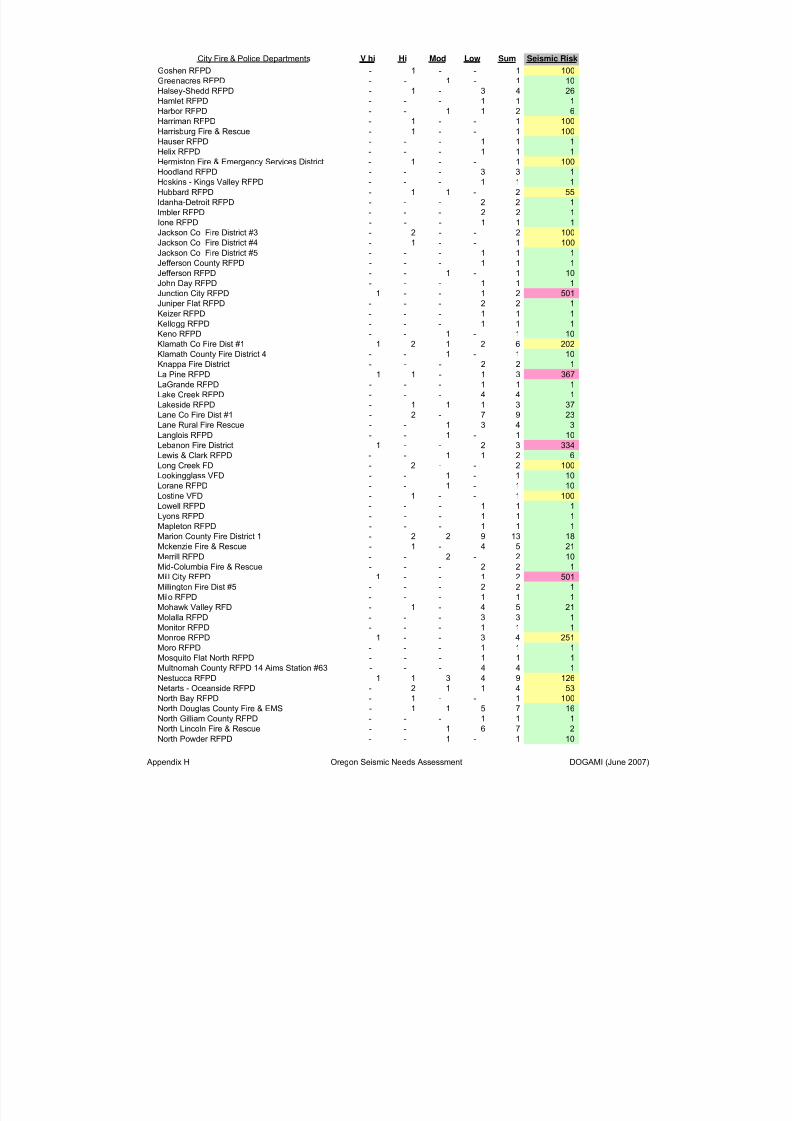
8/3/2019 Statewide Seismic Needs Assessment report
http://slidepdf.com/reader/full/statewide-seismic-needs-assessment-report 147/341
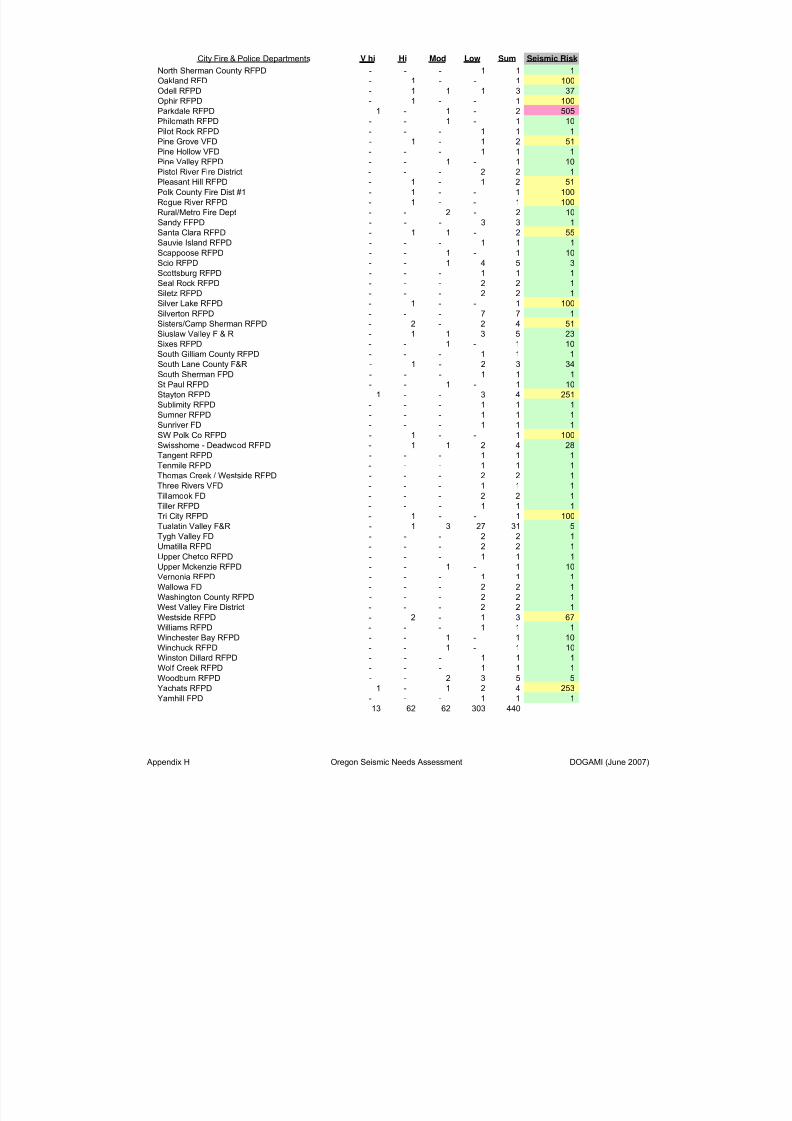
8/3/2019 Statewide Seismic Needs Assessment report
http://slidepdf.com/reader/full/statewide-seismic-needs-assessment-report 148/341
City Fire & Police Departments V hi Hi Mod Low Sum Seismic Risk
North Sherman County RFPD - - - 1 1 1
Oakland RFD - 1 - - 1 100
Odell RFPD - 1 1 1 3 37
Ophir RFPD - 1 - - 1 100
Parkdale RFPD 1 - 1 - 2 505
Philomath RFPD - - 1 - 1 10
Pilot Rock RFPD - - - 1 1 1
Pine Grove VFD - 1 - 1 2 51
Pine Hollow VFD - - - 1 1 1 Pine Valley RFPD - - 1 - 1 10
Pistol River Fire District - - - 2 2 1
Pleasant Hill RFPD - 1 - 1 2 51
Polk County Fire Dist #1 - 1 - - 1 100
Rogue River RFPD - 1 - - 1 100
Rural/Metro Fire Dept - - 2 - 2 10
Sandy FFPD - - - 3 3 1
Santa Clara RFPD - 1 1 - 2 55
Sauvie Island RFPD - - - 1 1 1
Scappoose RFPD - - 1 - 1 10
Scio RFPD - - 1 4 5 3
Scottsburg RFPD - - - 1 1 1
Seal Rock RFPD - - - 2 2 1
Siletz RFPD - - - 2 2 1
Silver Lake RFPD - 1 - - 1 100 Silverton RFPD - - - 7 7 1
Sisters/Camp Sherman RFPD - 2 - 2 4 51
Siuslaw Valley F & R - 1 1 3 5 23
Sixes RFPD - - 1 - 1 10
South Gilliam County RFPD - - - 1 1 1
South Lane County F&R - 1 - 2 3 34
South Sherman FPD - - - 1 1 1
St Paul RFPD - - 1 - 1 10
Stayton RFPD 1 - - 3 4 251
Sublimity RFPD - - - 1 1 1
Sumner RFPD - - - 1 1 1
Sunriver FD - - - 1 1 1
SW Polk Co RFPD - 1 - - 1 100
Swisshome - Deadwood RFPD - 1 1 2 4 28
Tangent RFPD - - - 1 1 1 Tenmile RFPD - - - 1 1 1
Thomas Creek / Westside RFPD - - - 2 2 1
Three Rivers VFD - - - 1 1 1
Tillamook FD - - - 2 2 1
Tiller RFPD - - - 1 1 1
Tri City RFPD - 1 - - 1 100
Tualatin Valley F&R - 1 3 27 31 5
Tygh Valley FD - - - 2 2 1
Umatilla RFPD - - - 2 2 1
Upper Chetco RFPD - - - 1 1 1
Upper Mckenzie RFPD - - 1 - 1 10
Vernonia RFPD - - - 1 1 1
Wallowa FD - - - 2 2 1
Washington County RFPD - - - 2 2 1
West Valley Fire District - - - 2 2 1 Westside RFPD - 2 - 1 3 67
Williams RFPD - - - 1 1 1
Winchester Bay RFPD - - 1 - 1 10
Winchuck RFPD - - 1 - 1 10
Winston Dillard RFPD - - - 1 1 1
Wolf Creek RFPD - - - 1 1 1
Woodburn RFPD - - 2 3 5 5
Yachats RFPD 1 - 1 2 4 253
Yamhill FPD - - - 1 1 1
13 62 62 303 440
Appendix H Oregon Seismic Needs Assessment DOGAMI (June 2007)
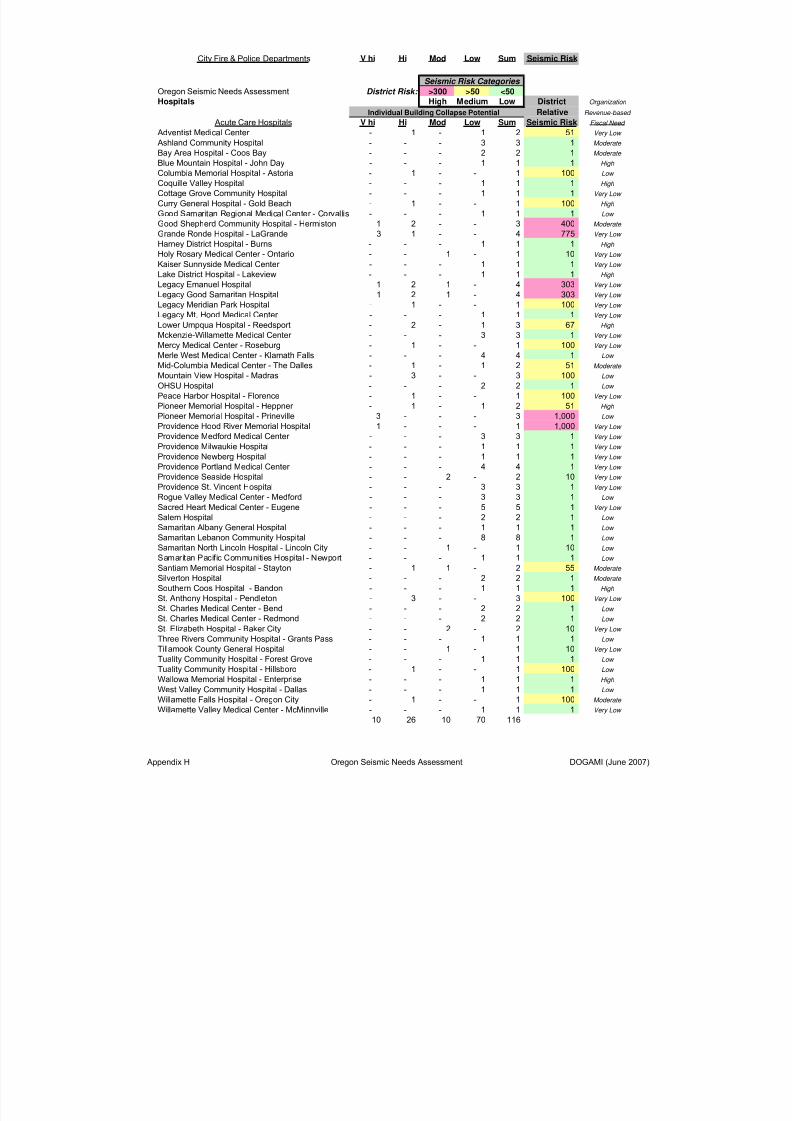
8/3/2019 Statewide Seismic Needs Assessment report
http://slidepdf.com/reader/full/statewide-seismic-needs-assessment-report 149/341
City Fire & Police Departments V hi Hi Mod Low Sum Seismic Risk
Seismic Risk Categories
Oregon Seismic Needs Assessment District Risk: >300 >50 <50
Hospitals High Medium Low District Organization
Individual Building Collapse Potential Relative Revenue-based
Acute Care Hospitals V hi Hi Mod Low Sum Seismic Risk Fiscal Need
Adventist Medical Center - 1 - 1 2 51 Very Low
Ashland Community Hospital - - - 3 3 1 Moderate
Bay Area Hospital - Coos Bay - - - 2 2 1 Moderate
Blue Mountain Hospital - John Day - - - 1 1 1 High
Columbia Memorial Hospital - Astoria - 1 - - 1 100 Low
Coquille Valley Hospital - - - 1 1 1 High
Cottage Grove Community Hospital - - - 1 1 1 Very Low
Curry General Hospital - Gold Beach - 1 - - 1 100 High
Good Samaritan Regional Medical Center - Corvallis - - - 1 1 1 Low
Good Shepherd Community Hospital - Hermiston 1 2 - - 3 400 Moderate
Grande Ronde Hospital - LaGrande 3 1 - - 4 775 Very Low
Harney District Hospital - Burns - - - 1 1 1 High
Holy Rosary Medical Center - Ontario - - 1 - 1 10 Very Low
Kaiser Sunnyside Medical Center - - - 1 1 1 Very Low
Lake District Hospital - Lakeview - - - 1 1 1 High
Legacy Emanuel Hospital 1 2 1 - 4 303 Very Low
Legacy Good Samaritan Hospital 1 2 1 - 4 303 Very Low
Legacy Meridian Park Hospital - 1 - - 1 100 Very Low
Legacy Mt. Hood Medical Center - - - 1 1 1 Very Low
Lower Umpqua Hospital - Reedsport - 2 - 1 3 67 High
Mckenzie-Willamette Medical Center - - - 3 3 1 Very Low
Mercy Medical Center - Roseburg - 1 - - 1 100 Very Low
Merle West Medical Center - Klamath Falls - - - 4 4 1 Low
Mid-Columbia Medical Center - The Dalles - 1 - 1 2 51 Moderate
Mountain View Hospital - Madras - 3 - - 3 100 Low
OHSU Hospital - - - 2 2 1 Low
Peace Harbor Hospital - Florence - 1 - - 1 100 Very Low
Pioneer Memorial Hospital - Heppner - 1 - 1 2 51 High
Pioneer Memorial Hospital - Prineville 3 - - - 3 1,000 Low
Providence Hood River Memorial Hospital 1 - - - 1 1,000 Very Low
Providence Medford Medical Center - - - 3 3 1 Very Low
Providence Milwaukie Hospital - - - 1 1 1 Very Low
Providence Newberg Hospital - - - 1 1 1 Very Low
Providence Portland Medical Center - - - 4 4 1 Very Low
Providence Seaside Hospital - - 2 - 2 10 Very Low
Providence St. Vincent Hospital - - - 3 3 1 Very Low
Rogue Valley Medical Center - Medford - - - 3 3 1 Low
Sacred Heart Medical Center - Eugene - - - 5 5 1 Very Low
Salem Hospital - - - 2 2 1 Low
Samaritan Albany General Hospital - - - 1 1 1 Low
Samaritan Lebanon Community Hospital - - - 8 8 1 Low
Samaritan North Lincoln Hospital - Lincoln City - - 1 - 1 10 Low
Samaritan Pacific Communities Hospital - Newport - - - 1 1 1 Low
Santiam Memorial Hospital - Stayton - 1 1 - 2 55 Moderate
Silverton Hospital - - - 2 2 1 Moderate
Southern Coos Hospital - Bandon - - - 1 1 1 High
St. Anthony Hospital - Pendleton - 3 - - 3 100 Very Low
St. Charles Medical Center - Bend - - - 2 2 1 Low
St. Charles Medical Center - Redmond - - - 2 2 1 Low
St. Elizabeth Hospital - Baker City - - 2 - 2 10 Very Low
Three Rivers Community Hospital - Grants Pass - - - 1 1 1 Low
Tillamook County General Hospital - - 1 - 1 10 Very Low
Tuality Community Hospital - Forest Grove - - - 1 1 1 Low
Tuality Community Hospital - Hillsboro - 1 - - 1 100 Low
Wallowa Memorial Hospital - Enterprise - - - 1 1 1 High
West Valley Community Hospital - Dallas - - - 1 1 1 Low
Willamette Falls Hospital - Oregon City - 1 - - 1 100 Moderate
Willamette Valley Medical Center - McMinnville - - - 1 1 1 Very Low
10 26 10 70 116
Appendix H Oregon Seismic Needs Assessment DOGAMI (June 2007)

8/3/2019 Statewide Seismic Needs Assessment report
http://slidepdf.com/reader/full/statewide-seismic-needs-assessment-report 150/341

8/3/2019 Statewide Seismic Needs Assessment report
http://slidepdf.com/reader/full/statewide-seismic-needs-assessment-report 151/341
Oregon Department of Geology and Mineral Industries Open-File Report O-07-02 Statewide Seismic Needs Assessment Appendix I
APPENDIX I. SPREADSHEET AND SITE SUMMARY REPORT DATA FIELD DEFINITIONSThis appendix contains keys to the column headings in the SSNA-all-data.xls (Excel) spreadsheet file andthe SSNA-abridged-data.xls file.
SSNA-all-data.xls
Site_UniqueID Unique ID assigned by DOGAMI for each siteBuildingUniqueID Unique ID assigned by DOGAMI for each building entitySite_Type Major use of the building
Tracking_Code Code utilized for site tracking of various categoriesDistrict District authority name
Name Building nameField_Physical_Address Physical street address
Field_Physical_City CityGPS_X Latitude
GPS_Y LongitudeMaxOccupancy Maximum occupancyEnrollment_ODE Actual October 2005 enrollment from Oregon Department of
Education
Screener_Name Name of person collecting field data
InspectionDate Date field data was collectedField_Verified_Year_Built Construction date as indicated by plaque encountered in thefield
Estimated_Decade_Built Screener estimate of construction period, to nearest decadestart
Year_Built Data from ODE database and other sourcesNumber_Stories Number of stories above ground level
Building_Total_Area Total Area square feetComments Special notation by screenerSeismicityZone Seismic zones (low, moderate, high) defined by FEMA 154
and very high defined as 60% g on the 1.0 second spectralacceleration 2% probability of exceedance in 50 yearsUSGS seismic hazard map
Primary_Structural_Type The field screener’s best judgment of Building StructuralType as defined by FEMA 154Primary_Structural_Certainty_Type Field screener confidence in assigned primary structural
type ( in percent)Secondary_Structural_Type The field screener’s second best judgment of Building
Structural Type as defined by FEMA 154
Secondary_Structural_Certainty_Type Field screener coarse confidence in assigned secondarystructural type ( in percent)
Tertiary_Structural_Type The field screener’s third best judgment of BuildingStructural Type as defined by FEMA 154
Tertiary_Structural_Certainty_Type Field screener confidence in assigned tertiary structural type(in percent)
Poor_Condition_Primary Screener’s notations of poor condition
Pounding_Potential Possibility of building swaying during earthquake intoadjacent structures
Falling_Hazard_Primary Potential falling hazards during earthquakeVertical_Irregularity_Primary Vertical irregularity as defined by DOGAMI 2006 vertical and
plan irregularities definition documentPlan_Irregularity_Primary Plan irregularity as defined by DOGAMI 2006 vertical and
plan irregularities definition documentPoor_Condition_Secondary Additional noted poor condition
Poor_Condition_Tertiary Additional noted poor conditionFalling_Hazard_Secondary Additional falling hazardFalling_Hazard_Tertiary Additional falling hazard
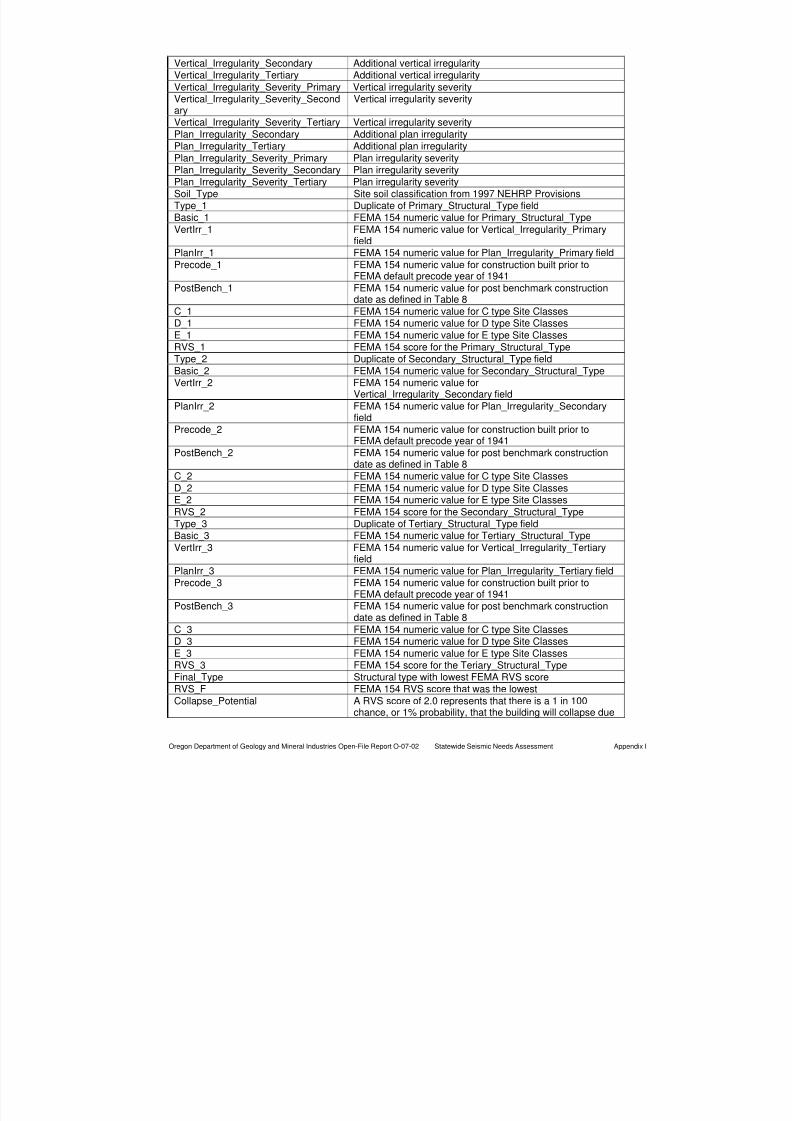
8/3/2019 Statewide Seismic Needs Assessment report
http://slidepdf.com/reader/full/statewide-seismic-needs-assessment-report 152/341
Oregon Department of Geology and Mineral Industries Open-File Report O-07-02 Statewide Seismic Needs Assessment Appendix I
Vertical_Irregularity_Secondary Additional vertical irregularityVertical_Irregularity_Tertiary Additional vertical irregularity
Vertical_Irregularity_Severity_Primary Vertical irregularity severityVertical_Irregularity_Severity_Secondary
Vertical irregularity severity
Vertical_Irregularity_Severity_Tertiary Vertical irregularity severity
Plan_Irregularity_Secondary Additional plan irregularity
Plan_Irregularity_Tertiary Additional plan irregularityPlan_Irregularity_Severity_Primary Plan irregularity severityPlan_Irregularity_Severity_Secondary Plan irregularity severity
Plan_Irregularity_Severity_Tertiary Plan irregularity severitySoil_Type Site soil classification from 1997 NEHRP ProvisionsType_1 Duplicate of Primary_Structural_Type fieldBasic_1 FEMA 154 numeric value for Primary_Structural_Type
VertIrr_1 FEMA 154 numeric value for Vertical_Irregularity_Primaryfield
PlanIrr_1 FEMA 154 numeric value for Plan_Irregularity_Primary field
Precode_1 FEMA 154 numeric value for construction built prior toFEMA default precode year of 1941
PostBench_1 FEMA 154 numeric value for post benchmark construction
date as defined in Table 8C_1 FEMA 154 numeric value for C type Site ClassesD_1 FEMA 154 numeric value for D type Site Classes
E_1 FEMA 154 numeric value for E type Site ClassesRVS_1 FEMA 154 score for the Primary_Structural_TypeType_2 Duplicate of Secondary_Structural_Type field
Basic_2 FEMA 154 numeric value for Secondary_Structural_TypeVertIrr_2 FEMA 154 numeric value for
Vertical_Irregularity_Secondary field
PlanIrr_2 FEMA 154 numeric value for Plan_Irregularity_Secondaryfield
Precode_2 FEMA 154 numeric value for construction built prior toFEMA default precode year of 1941
PostBench_2 FEMA 154 numeric value for post benchmark constructiondate as defined in Table 8
C_2 FEMA 154 numeric value for C type Site Classes
D_2 FEMA 154 numeric value for D type Site ClassesE_2 FEMA 154 numeric value for E type Site Classes
RVS_2 FEMA 154 score for the Secondary_Structural_TypeType_3 Duplicate of Tertiary_Structural_Type fieldBasic_3 FEMA 154 numeric value for Tertiary_Structural_Type
VertIrr_3 FEMA 154 numeric value for Vertical_Irregularity_Tertiaryfield
PlanIrr_3 FEMA 154 numeric value for Plan_Irregularity_Tertiary fieldPrecode_3 FEMA 154 numeric value for construction built prior to
FEMA default precode year of 1941
PostBench_3 FEMA 154 numeric value for post benchmark constructiondate as defined in Table 8
C_3 FEMA 154 numeric value for C type Site ClassesD_3 FEMA 154 numeric value for D type Site Classes
E_3 FEMA 154 numeric value for E type Site ClassesRVS_3 FEMA 154 score for the Teriary_Structural_TypeFinal_Type Structural type with lowest FEMA RVS scoreRVS_F FEMA 154 RVS score that was the lowest
Collapse_Potential A RVS score of 2.0 represents that there is a 1 in 100chance, or 1% probability, that the building will collapse due

8/3/2019 Statewide Seismic Needs Assessment report
http://slidepdf.com/reader/full/statewide-seismic-needs-assessment-report 153/341
Oregon Department of Geology and Mineral Industries Open-File Report O-07-02 Statewide Seismic Needs Assessment Appendix I
to the ground motion caused by the maximum consideredearthquake. A score of 0.0 implies a 1 in 1 chance, or a100% probability. FEMA recommends that all buildings witha score of 2.0 or less should be considered to haveinadequate performance during the anticipated maximumseismic event. DOGAMI has refined the relative rank of theRVS scores into four categories: Very High (RVS less thanor equal to zero, 100% probability of collapse), High (RVS
from 0.1 to 1.0; greater than a 10% probability of collapse),Moderate (RVS from 1.1 to 2.0, greater than a 1%probability of collapse), and Low (RVS greater than or equalto 2.1, probability of collapse less than 1%). Newconstruction is deemed to have low collapse potential. Sitesthat have been or are planned to have seismic rehabilitationare deemed to have moderate collapse potential. Sites thatwere missed during the filed screening are deemed to havehigh collapse potential.
PDF Site Summary Report Web link site data report for all building screened atparticular site. Contains descriptive data, locationinformation, screener comments, photos, RVS scores, andplan views for each building. A site may have multiple
building entities designated by suffix A, B, C etc. Allindividual building reports are bundled into a single sitesummary report.
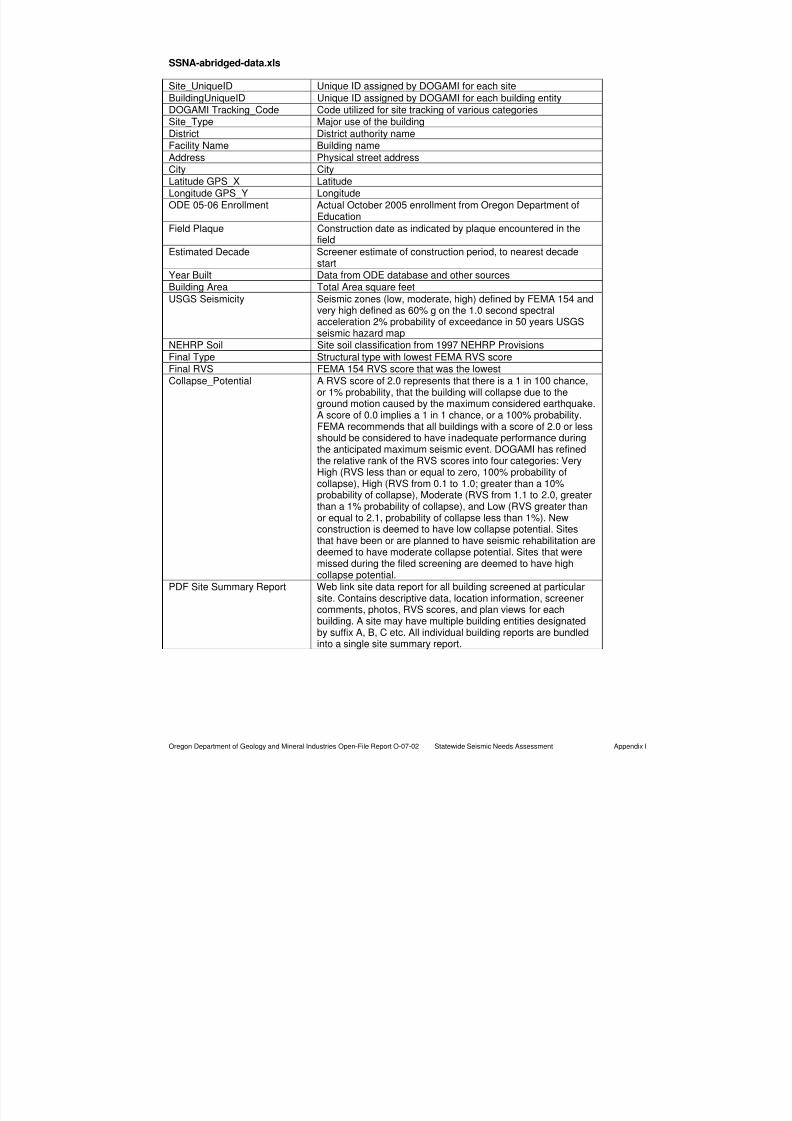
8/3/2019 Statewide Seismic Needs Assessment report
http://slidepdf.com/reader/full/statewide-seismic-needs-assessment-report 154/341
Oregon Department of Geology and Mineral Industries Open-File Report O-07-02 Statewide Seismic Needs Assessment Appendix I
SSNA-abridged-data.xls
Site_UniqueID Unique ID assigned by DOGAMI for each site
BuildingUniqueID Unique ID assigned by DOGAMI for each building entityDOGAMI Tracking_Code Code utilized for site tracking of various categoriesSite_Type Major use of the building
District District authority nameFacility Name Building name
Address Physical street addressCity City
Latitude GPS_X LatitudeLongitude GPS_Y LongitudeODE 05-06 Enrollment Actual October 2005 enrollment from Oregon Department of
Education
Field Plaque Construction date as indicated by plaque encountered in thefield
Estimated Decade Screener estimate of construction period, to nearest decadestart
Year Built Data from ODE database and other sourcesBuilding Area Total Area square feet
USGS Seismicity Seismic zones (low, moderate, high) defined by FEMA 154 andvery high defined as 60% g on the 1.0 second spectralacceleration 2% probability of exceedance in 50 years USGSseismic hazard map
NEHRP Soil Site soil classification from 1997 NEHRP Provisions
Final Type Structural type with lowest FEMA RVS scoreFinal RVS FEMA 154 RVS score that was the lowest
Collapse_Potential A RVS score of 2.0 represents that there is a 1 in 100 chance,or 1% probability, that the building will collapse due to theground motion caused by the maximum considered earthquake.A score of 0.0 implies a 1 in 1 chance, or a 100% probability.FEMA recommends that all buildings with a score of 2.0 or lessshould be considered to have inadequate performance duringthe anticipated maximum seismic event. DOGAMI has refinedthe relative rank of the RVS scores into four categories: VeryHigh (RVS less than or equal to zero, 100% probability ofcollapse), High (RVS from 0.1 to 1.0; greater than a 10%probability of collapse), Moderate (RVS from 1.1 to 2.0, greaterthan a 1% probability of collapse), and Low (RVS greater thanor equal to 2.1, probability of collapse less than 1%). Newconstruction is deemed to have low collapse potential. Sitesthat have been or are planned to have seismic rehabilitation aredeemed to have moderate collapse potential. Sites that weremissed during the filed screening are deemed to have highcollapse potential.
PDF Site Summary Report Web link site data report for all building screened at particularsite. Contains descriptive data, location information, screener
comments, photos, RVS scores, and plan views for eachbuilding. A site may have multiple building entities designatedby suffix A, B, C etc. All individual building reports are bundledinto a single site summary report.
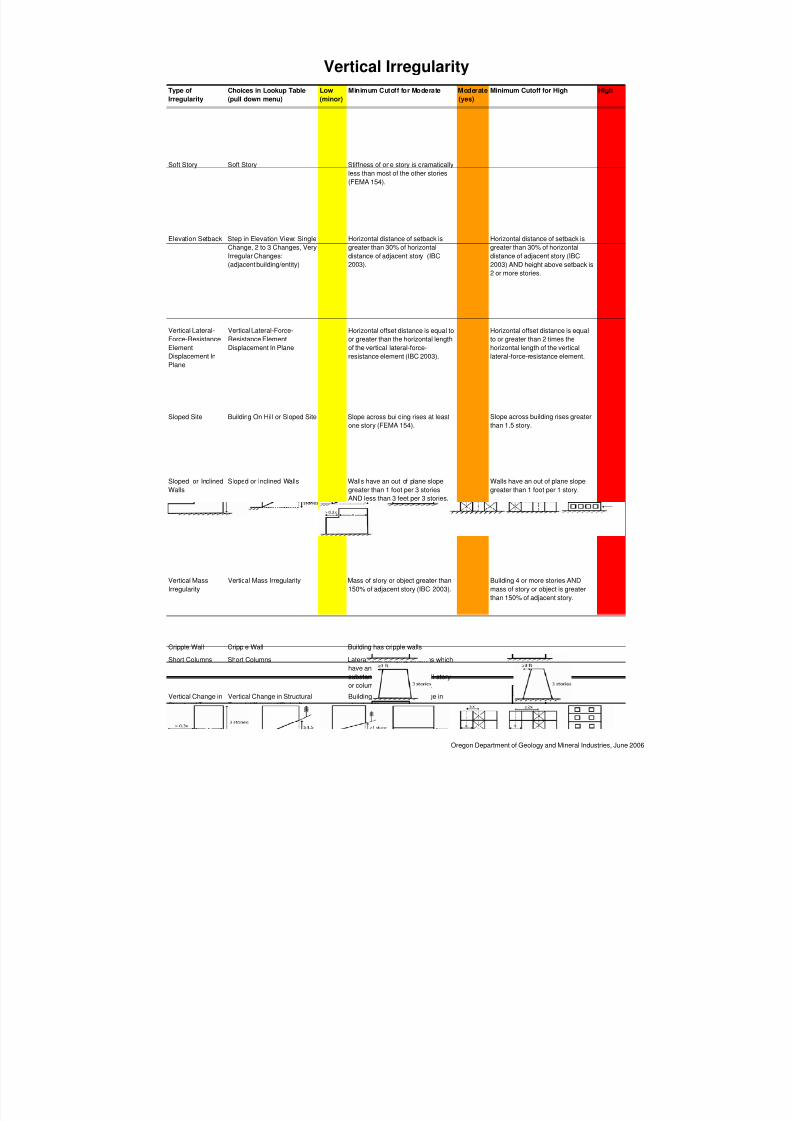
8/3/2019 Statewide Seismic Needs Assessment report
http://slidepdf.com/reader/full/statewide-seismic-needs-assessment-report 155/341
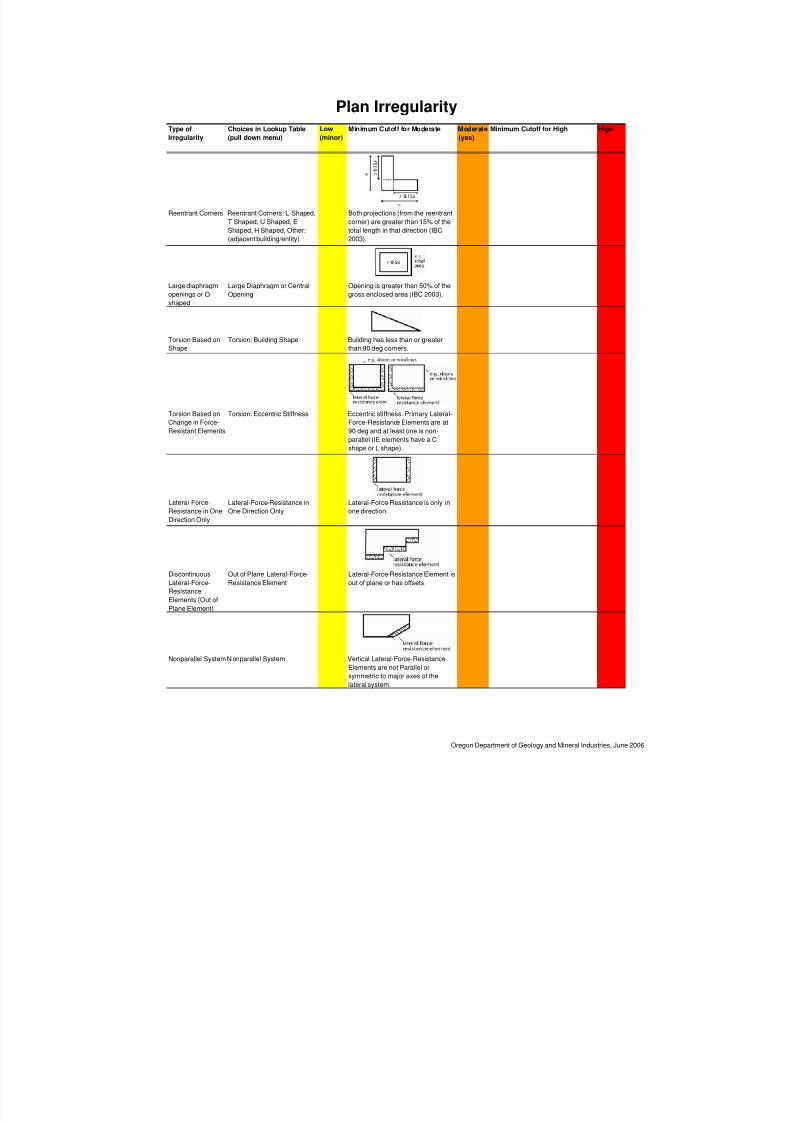
8/3/2019 Statewide Seismic Needs Assessment report
http://slidepdf.com/reader/full/statewide-seismic-needs-assessment-report 156/341
Type of
Irregularity
Choices in Lookup Table
(pull down menu)
Low
(minor)
Minimum Cutoff for Moderate Moderate
(yes)
Minimum Cutoff for High High
Reentrant Corners Reentrant Corners: L Shaped,
T Shaped, U Shaped, E
Shaped, H Shaped, Other:
(adjacent building/entity)
Both projections (from the reentrant
corner) are greater than 15% of the
total length in that direction (IBC
2003).
Large diaphragm
openings or O
shaped
Large Diaphragm or Central
Opening
Opening is greater than 50% of the
gross enclosed area (IBC 2003).
Torsion Based on
Shape
Torsion: Building Shape Building has less than or greater
than 90 deg corners.
Torsion Based on
Change in Force-
Resistant Elements
Torsion: Eccentric Stiffness Eccentric stiffness. Primary Lateral-
Force-Resistance Elements are at
90 deg and at least one is non-
parallel (IE elements have a C
shape or L shape).
Lateral-Force-
Resistance in One
Direction Only
Lateral-Force-Resistance in
One Direction Only
Lateral-Force-Resistance is only in
one direction.
Discontinuous
Lateral-Force-
Resistance
Elements (Out of
Plane Element)
Out of Plane Lateral-Force-
Resistance Element
Lateral-Force-Resistance Element is
out of plane or has offsets.
Nonparallel System N onparallel System Vertical Lateral-Force-Resistance
Elements are not Parallel or
symmetric to major axes of the
lateral system.
Plan Irregularity
Oregon Department of Geology and Mineral Industries, June 2006
8/3/2019 Statewide Seismic Needs Assessment report
http://slidepdf.com/reader/full/statewide-seismic-needs-assessment-report 157/341
1
8/3/2019 Statewide Seismic Needs Assessment report
http://slidepdf.com/reader/full/statewide-seismic-needs-assessment-report 158/341

8/3/2019 Statewide Seismic Needs Assessment report
http://slidepdf.com/reader/full/statewide-seismic-needs-assessment-report 159/341
3
Protocol for Rapid Visual Screening
This Handbook is provided as a guide for completion of this work. It will not answer all questions.
Please contact Don Lewis or Natalie Richards if there are major issues in the field
Introduction to Senate Bill #2 and Rapid Visual Screening-
http://www.oregongeology.com/sub/projects/rvs/default.htm
Project Overview
Oregon Senate Bill 2 directs DOGAMI, in consultation with project partners (see below), to develop a statewideseismic needs assessment that includes seismic safety surveys of K-12 public school buildings and communitycollege buildings that have a capacity of 250 or more persons, hospital buildings with acute inpatient carefacilities, fire stations, police stations, sheriffs' offices and other law enforcement agency buildings.
The statewide needs assessment will consist of rapid visual screenings (RVS) of these buildings in accordancewith FEMA-154, 2002 Edition, or an equivalent standard adopted by DOGAMI; information gathering tosupplement RVS; and ranking of RVS results into risk categories. The results will be posted on a publiclyaccessible web site.
Rapid Visual Screening-All Rapid Visual screenings will follow the procedures discussed in FEMA 154 Edition 2,July 2005. The manual for Rapid Visual Screening using FEMA 154 is provided in each computer system to useas a reference.
8/3/2019 Statewide Seismic Needs Assessment report
http://slidepdf.com/reader/full/statewide-seismic-needs-assessment-report 160/341
9
Checklist of equipment Please treat all equipment with care.
• Notebook of Planviews, lists of sites/buildings including Multi-buildings school information
• Vest
• Clip board
• Tablet with stylus- Make and Model, screen protector, black tablet holder,
• Logitech QuickCam for Notebook Pro
• Printer- HP and Model with power supply, printer manual one replacement cartridge for black and color and paper
• 2- Bonzai Secure Digital cards with one USB Flash Drive
• GPS unit
• Surge Protector
• Auto/Air Adapter- Power2
• Personal Cell Phone
• FEMA 155 manual
• USB Cable
• Duracell battery charger with batteries
• 1 black and 1 yellow Modem cords
Each team leader (Carol Hasenberg, Tom Miller and Christine Theodoropoulos) will assure that allequipment listed above is returned in good working order to DOGAMI
Equipment breakdowns- If your computer breaks down in the field, call DOGAMI. If we need to
provide a backup, FED Ex it in computer appropriate packaging back to DOGAMI care of:Natalie Richards, PE
SB2 Project Coordinator
DOGAMI
800 NE Oregon St, #28
Suite #965
Portland, OR 97232
971-673-0481
DOGAMI will FED EX a backup computer we have and fix the other. If there is no backup available,conduct RVS surveys using paper the forms provided then they will have to be input into the database at
a later date.
Once a backup is available, DOGAMI will contact you about getting you the computer equipment.
It is very important to treat the computers as fragile and important equipment.
• Do not leave them at a eating establishment,
• Do not place them in adverse conditions either hot or cold,
•
Do not eat or drink close to them to prevent something spilling on them
• Please use common sense and treat them as if they were your own equipment.
Information that needs to be downloaded onto tablets-
• Maps-o County
o Cityo Planviews
• RVS Protocol Handbook
• Travel/Misc Voucher for cell phones and disposable camera
8/3/2019 Statewide Seismic Needs Assessment report
http://slidepdf.com/reader/full/statewide-seismic-needs-assessment-report 161/341
10
• FEMA 154 manuals
• List of Sites- County, Unique ID, Name Address, Year, Year remodeled, site access issues #
• Flyers
• Worksheet which is the Tablet forms in case there is rain.
• Multi-building schools with scans
Database download procedure to get site information –Will be ADDED here

8/3/2019 Statewide Seismic Needs Assessment report
http://slidepdf.com/reader/full/statewide-seismic-needs-assessment-report 162/341

8/3/2019 Statewide Seismic Needs Assessment report
http://slidepdf.com/reader/full/statewide-seismic-needs-assessment-report 163/341
12
Please keep the receipt for the disposable camera and provide it on the cell phone miscellaneous voucher
for reimbursement.
The GPS unit can be used in the rain so the coordinates can be acquired and written down on the tablet
form.
This screening can also be completed in your car along with photographs if they are easy to decipher.
RAPID VISUAL SURVEY PROCEDURE
1.0 Site Info – General setup
When you first get to a site, turn on the GPS unit, set it on the dashboard or the hood of the car (but out
from under trees), and let it acquire satellites (it sometimes takes the unit ~10 min to acquire thesatellites and then get the accuracy down to 20 ft. or less). Once the GPS unit has gone through it’s boot
up screens and satellites are acquired and accuracy to 20ft or less, the screen will look like the example
in Figure 1.
Figure 1: Example of GPS screen after boot-up.
Get out the paper Plan View Map (air photo of the site, Figure 2). Find your location and identify thebuilding, buildings, and/or building entities to be surveyed. Review the additional information (building
construction dates, etc Figure 3), which will be similar to example below and finalize the identification
of the buildings/entities to be surveyed.
Establish a plan of surveying. Take a quick walk around the site and identify all the buildings/entities
which will be surveyed. Outline each of the areas in pencil or visually on the plan view map (see
example in Figure 3 with yellow outlines of buildings).
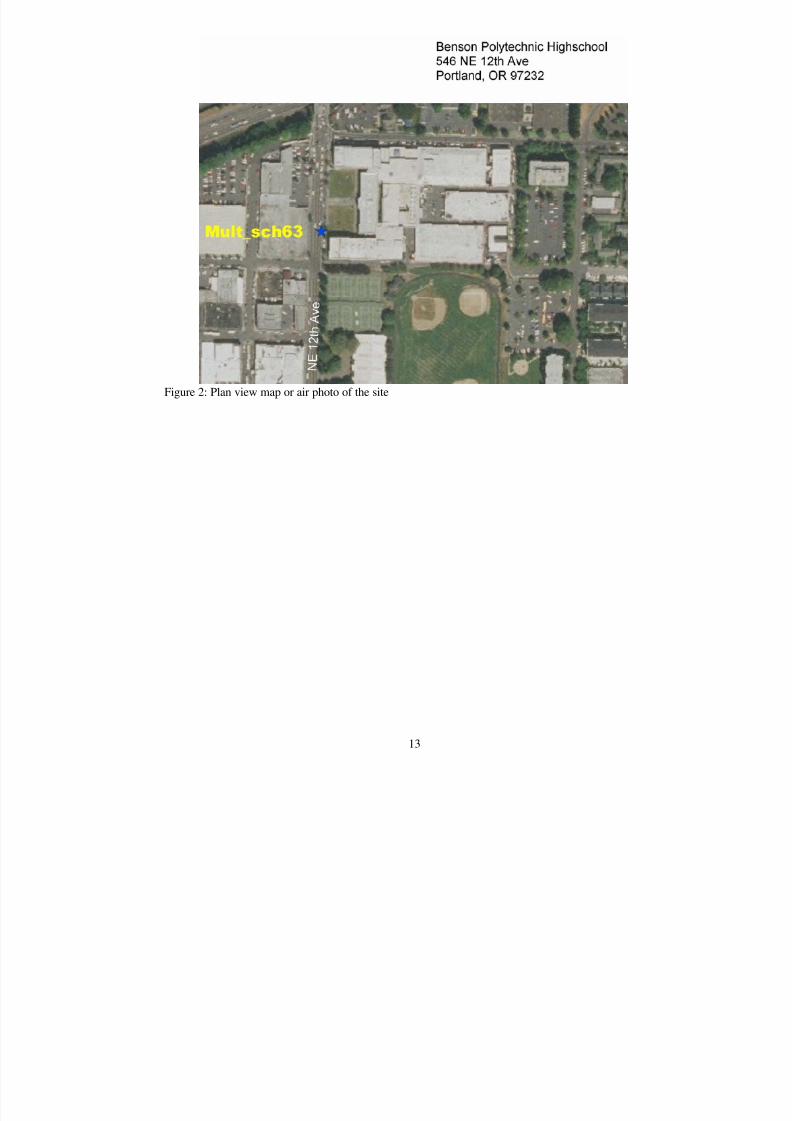
8/3/2019 Statewide Seismic Needs Assessment report
http://slidepdf.com/reader/full/statewide-seismic-needs-assessment-report 164/341
13
Figure 2: Plan view map or air photo of the site
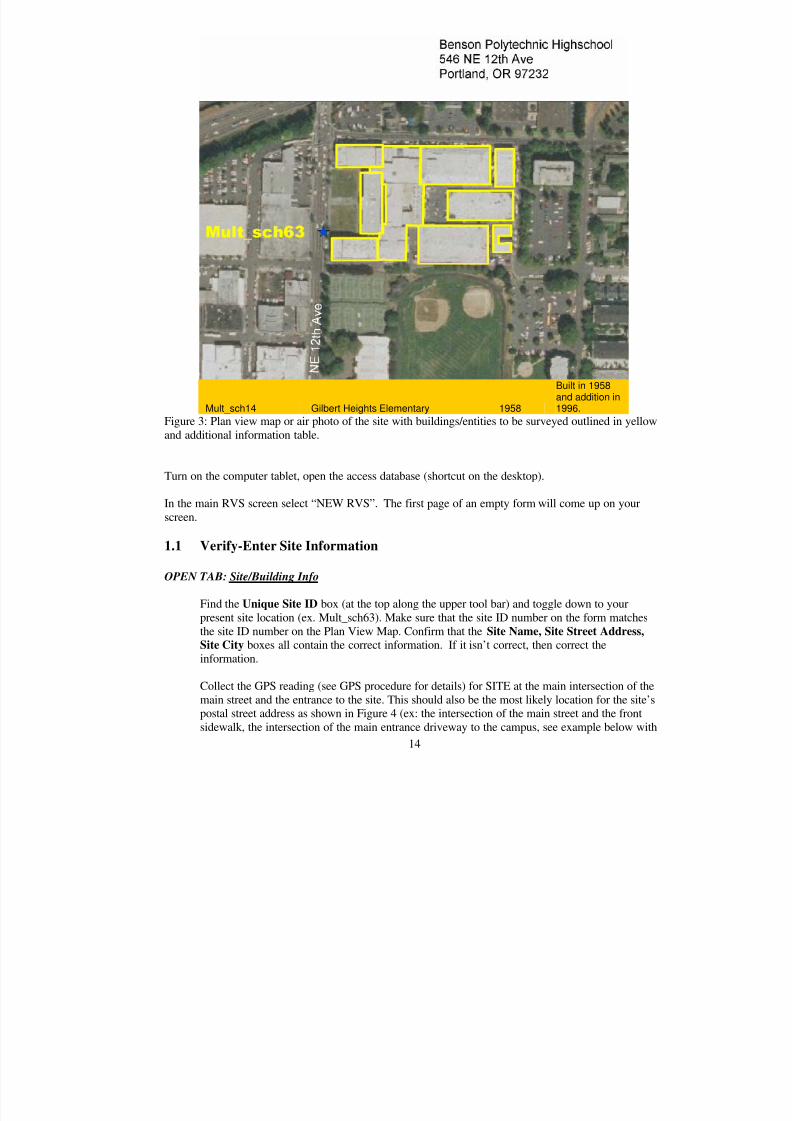
8/3/2019 Statewide Seismic Needs Assessment report
http://slidepdf.com/reader/full/statewide-seismic-needs-assessment-report 165/341
14
Mult_sch14 Gilbert Heights Elementary 1958
Built in 1958and addition in1996.
Figure 3: Plan view map or air photo of the site with buildings/entities to be surveyed outlined in yellow
and additional information table.
Turn on the computer tablet, open the access database (shortcut on the desktop).
In the main RVS screen select “NEW RVS”. The first page of an empty form will come up on your
screen.
1.1 Verify-Enter Site Information
OPEN TAB: Site/Building Info
Find the Unique Site ID box (at the top along the upper tool bar) and toggle down to yourpresent site location (ex. Mult_sch63). Make sure that the site ID number on the form matches
the site ID number on the Plan View Map. Confirm that the Site Name, Site Street Address,Site City boxes all contain the correct information. If it isn’t correct, then correct the
information.
Collect the GPS reading (see GPS procedure for details) for SITE at the main intersection of the
main street and the entrance to the site. This should also be the most likely location for the site’spostal street address as shown in Figure 4 (ex: the intersection of the main street and the front
sidewalk, the intersection of the main entrance driveway to the campus, see example below with
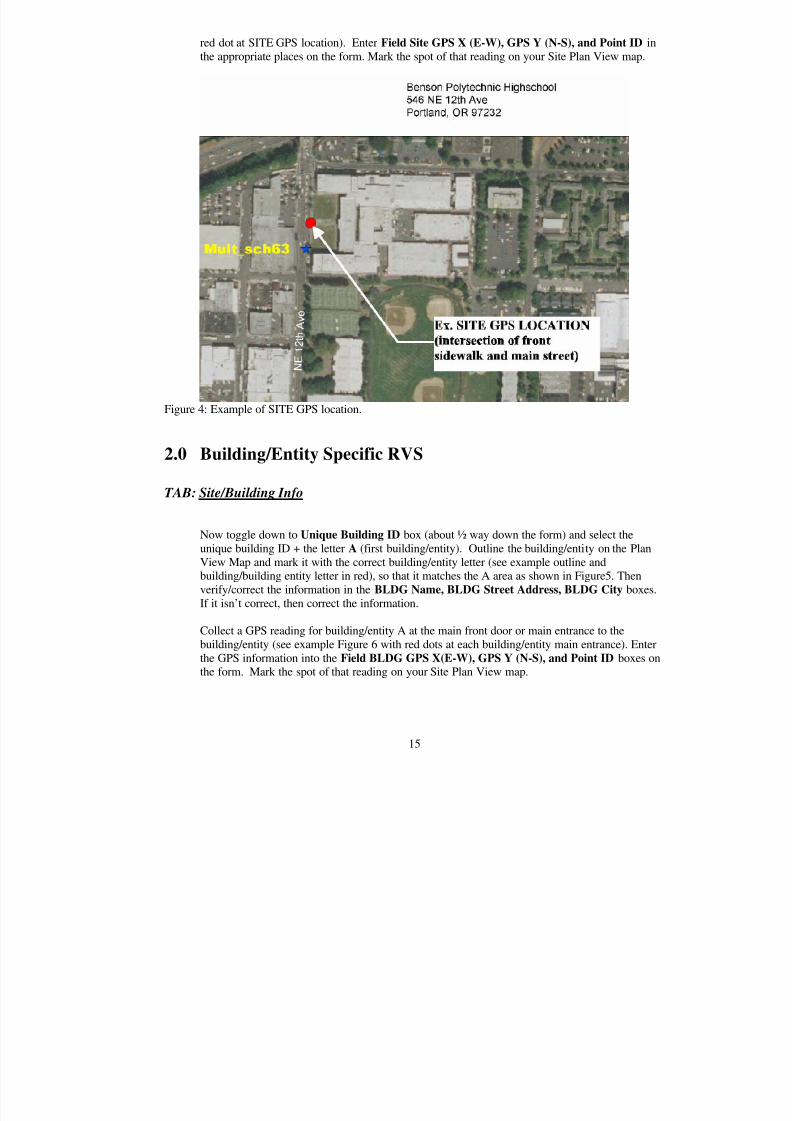
8/3/2019 Statewide Seismic Needs Assessment report
http://slidepdf.com/reader/full/statewide-seismic-needs-assessment-report 166/341
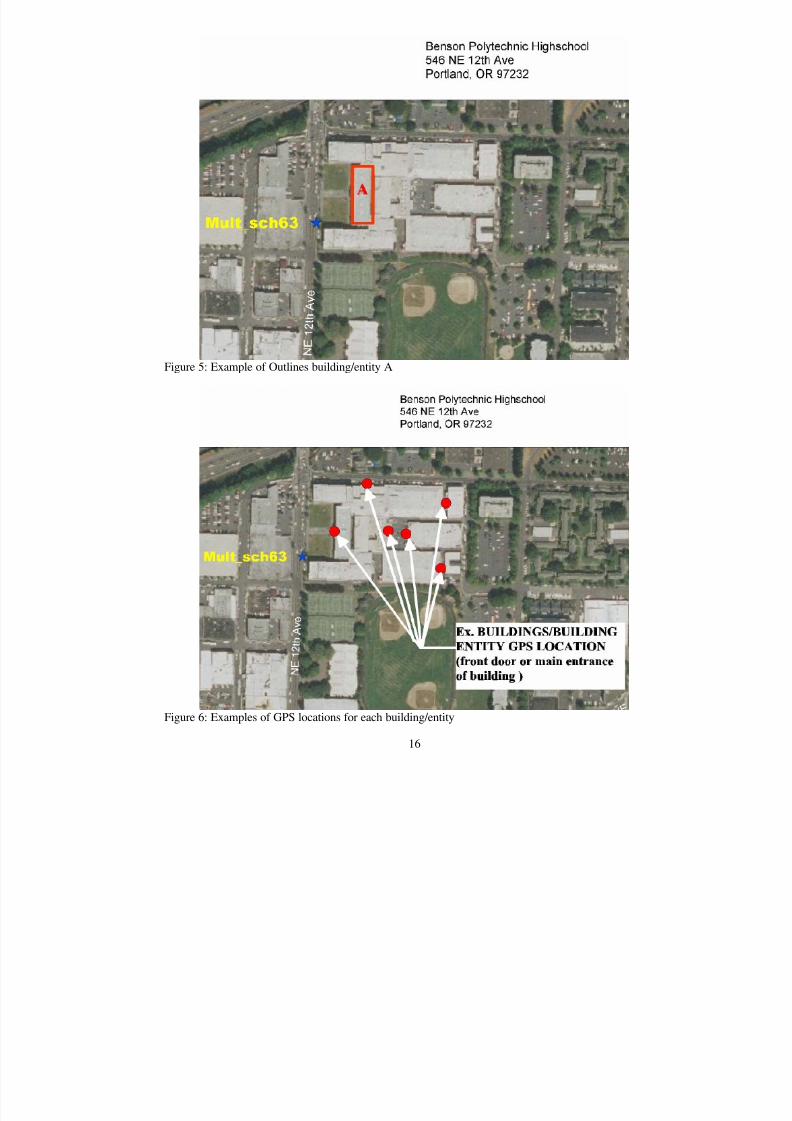
8/3/2019 Statewide Seismic Needs Assessment report
http://slidepdf.com/reader/full/statewide-seismic-needs-assessment-report 167/341
16
Figure 5: Example of Outlines building/entity A
Figure 6: Examples of GPS locations for each building/entity
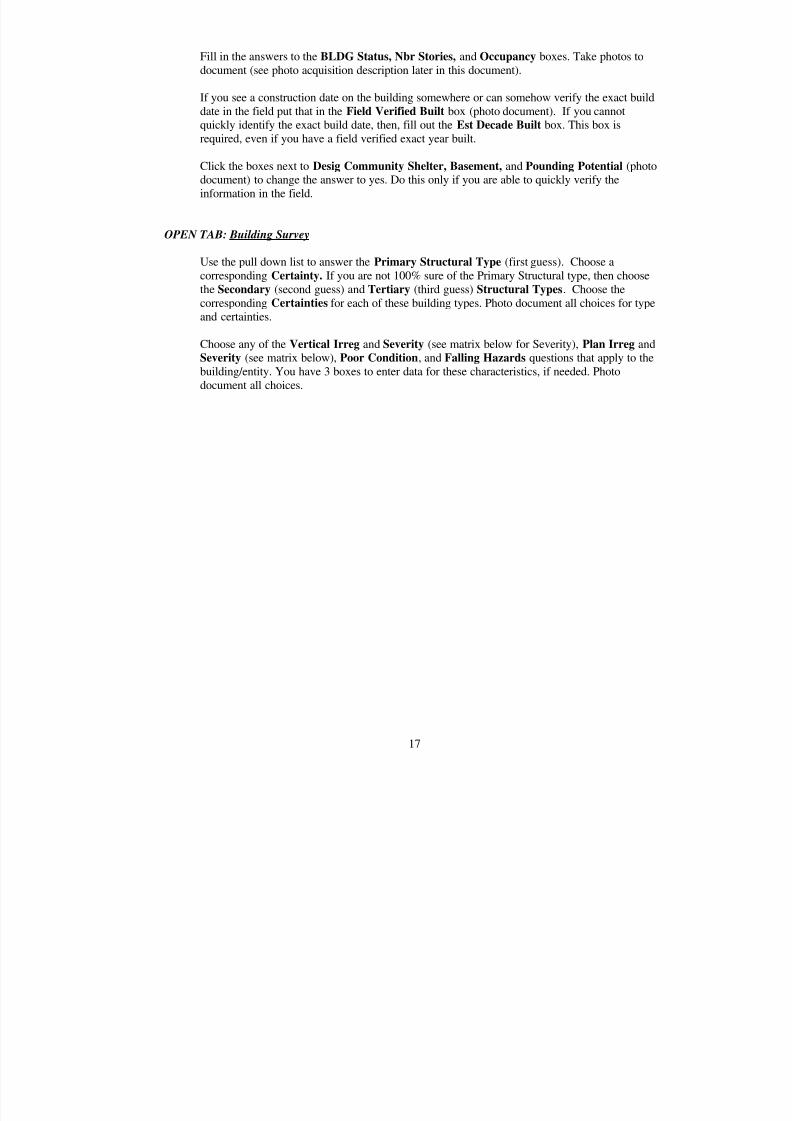
8/3/2019 Statewide Seismic Needs Assessment report
http://slidepdf.com/reader/full/statewide-seismic-needs-assessment-report 168/341
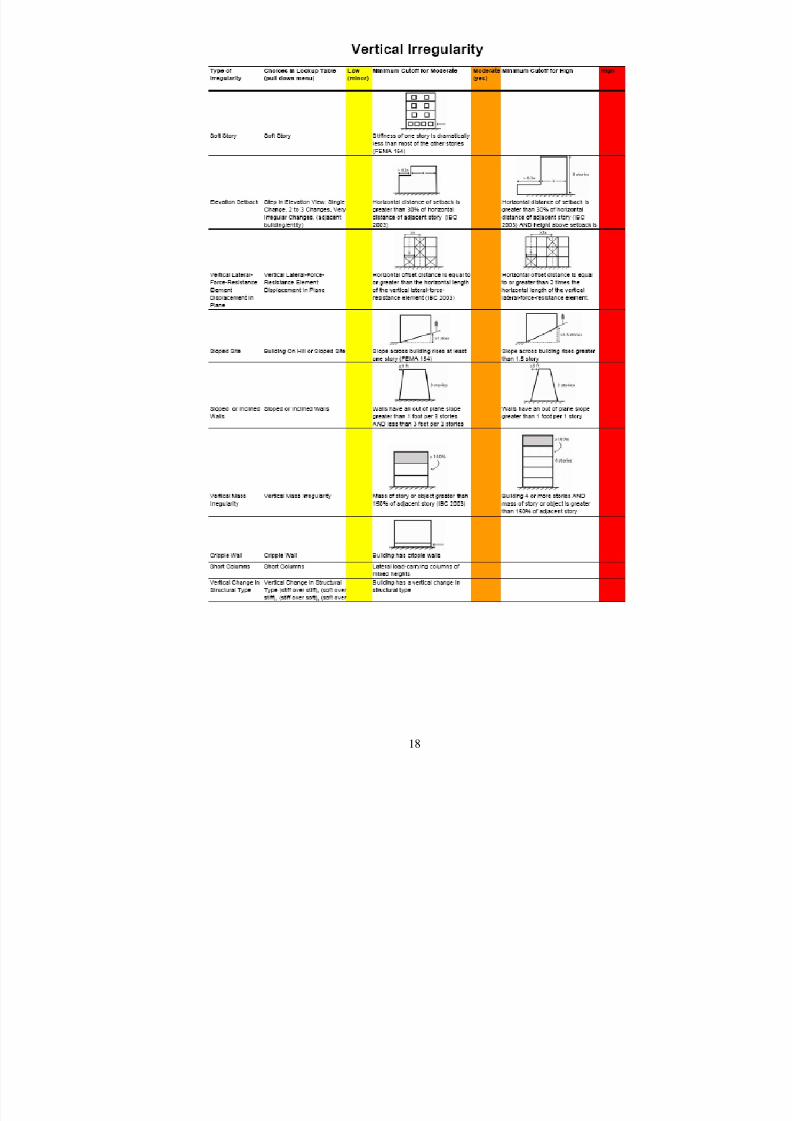
8/3/2019 Statewide Seismic Needs Assessment report
http://slidepdf.com/reader/full/statewide-seismic-needs-assessment-report 169/341
18
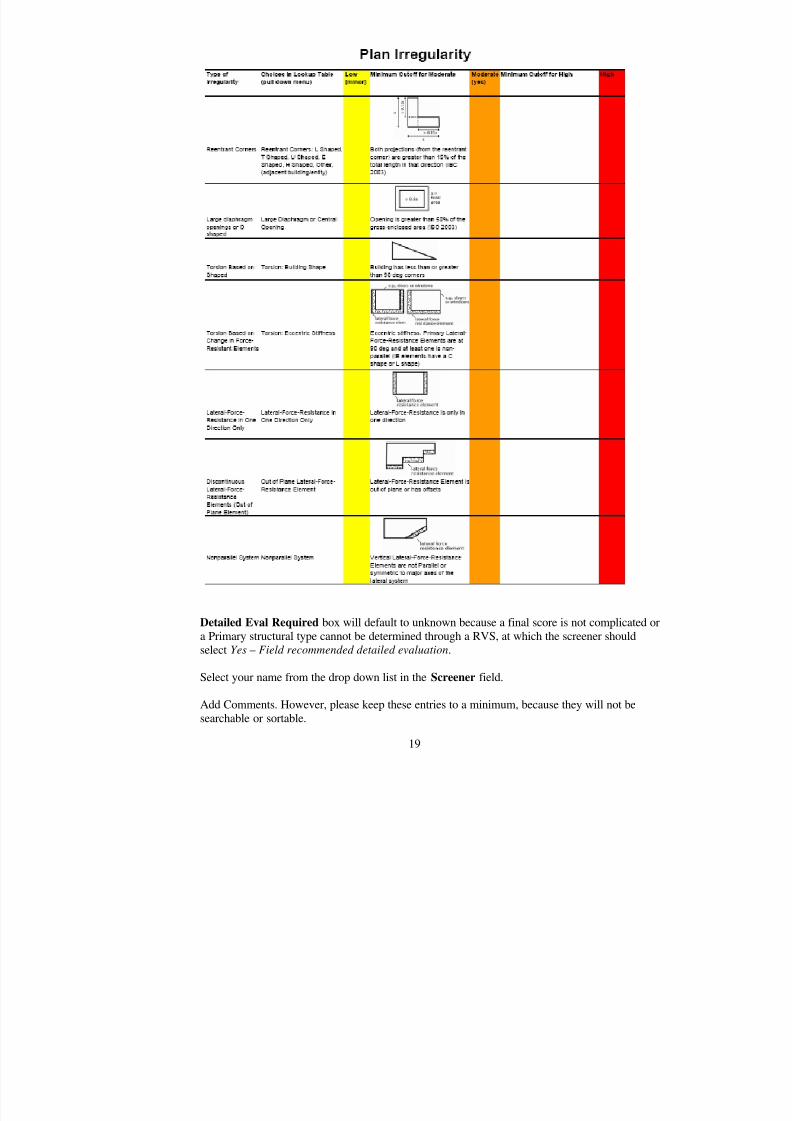
8/3/2019 Statewide Seismic Needs Assessment report
http://slidepdf.com/reader/full/statewide-seismic-needs-assessment-report 170/341
8/3/2019 Statewide Seismic Needs Assessment report
http://slidepdf.com/reader/full/statewide-seismic-needs-assessment-report 171/341
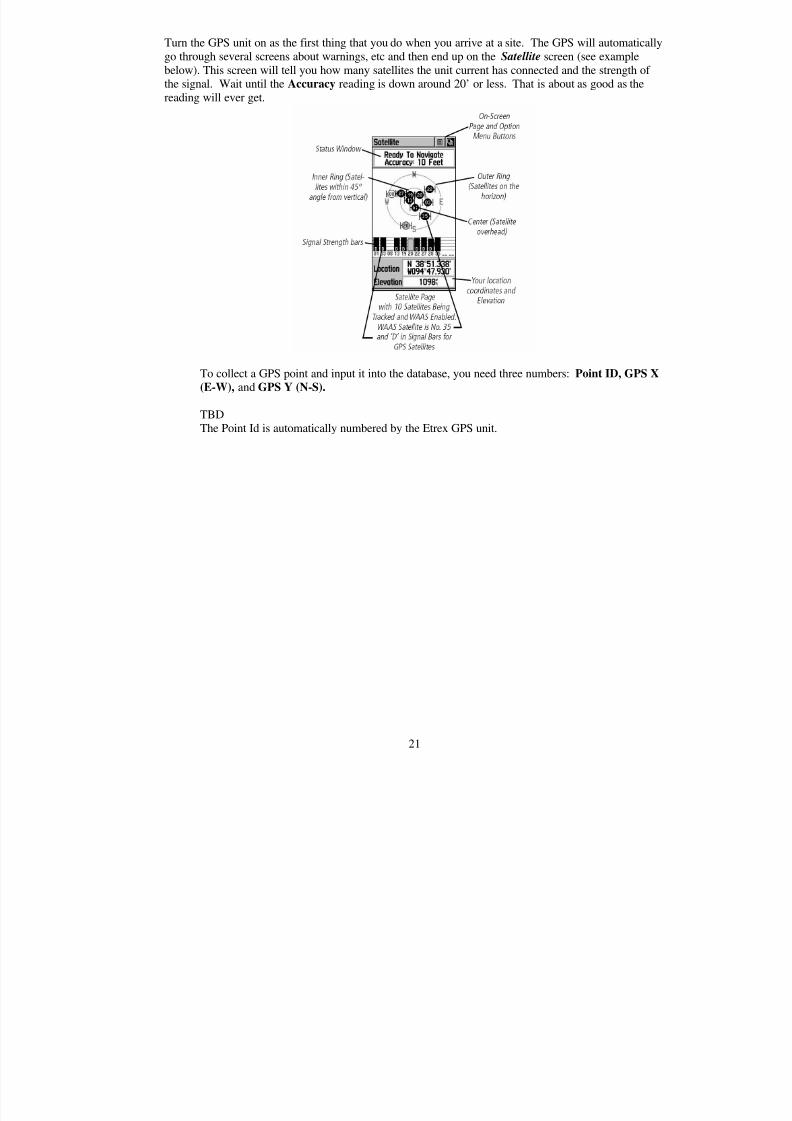
8/3/2019 Statewide Seismic Needs Assessment report
http://slidepdf.com/reader/full/statewide-seismic-needs-assessment-report 172/341
21
Turn the GPS unit on as the first thing that you do when you arrive at a site. The GPS will automatically
go through several screens about warnings, etc and then end up on the Satellite screen (see example
below). This screen will tell you how many satellites the unit current has connected and the strength of the signal. Wait until the Accuracy reading is down around 20’ or less. That is about as good as the
reading will ever get.
To collect a GPS point and input it into the database, you need three numbers: Point ID, GPS X(E-W), and GPS Y (N-S).
TBDThe Point Id is automatically numbered by the Etrex GPS unit.
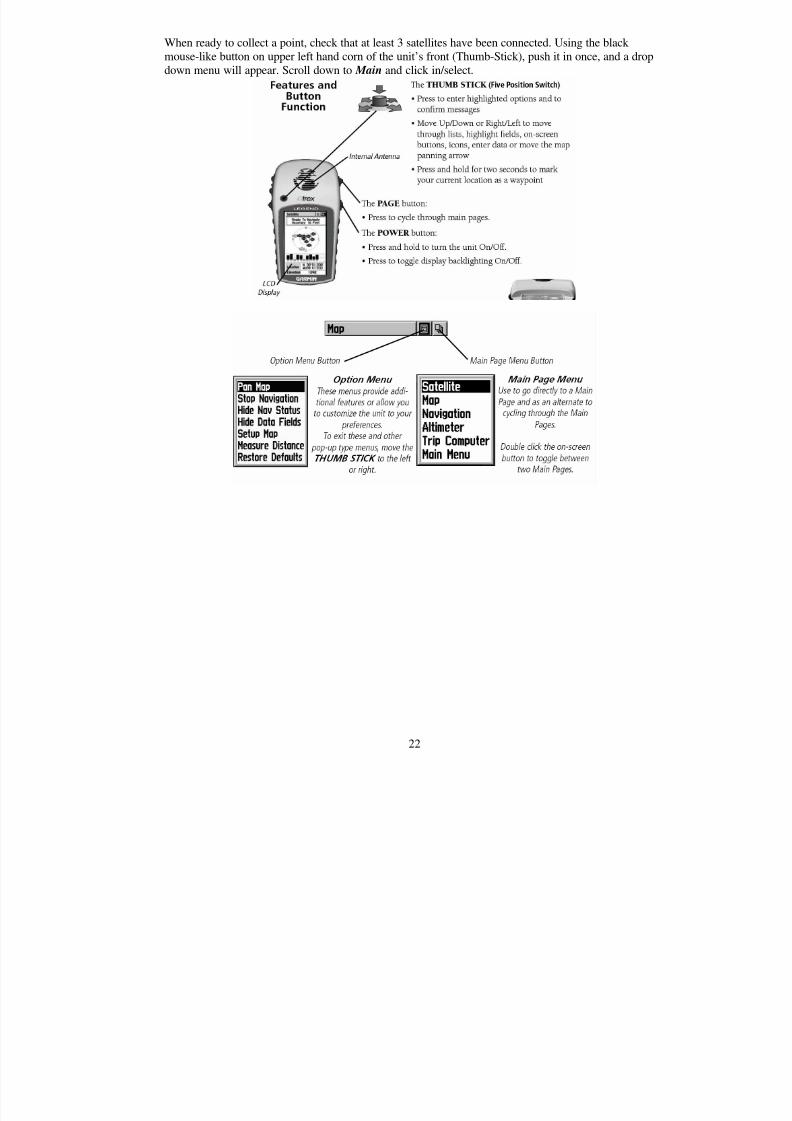
8/3/2019 Statewide Seismic Needs Assessment report
http://slidepdf.com/reader/full/statewide-seismic-needs-assessment-report 173/341
22
When ready to collect a point, check that at least 3 satellites have been connected. Using the black
mouse-like button on upper left hand corn of the unit’s front (Thumb-Stick), push it in once, and a drop
down menu will appear. Scroll down to Main and click in/select.
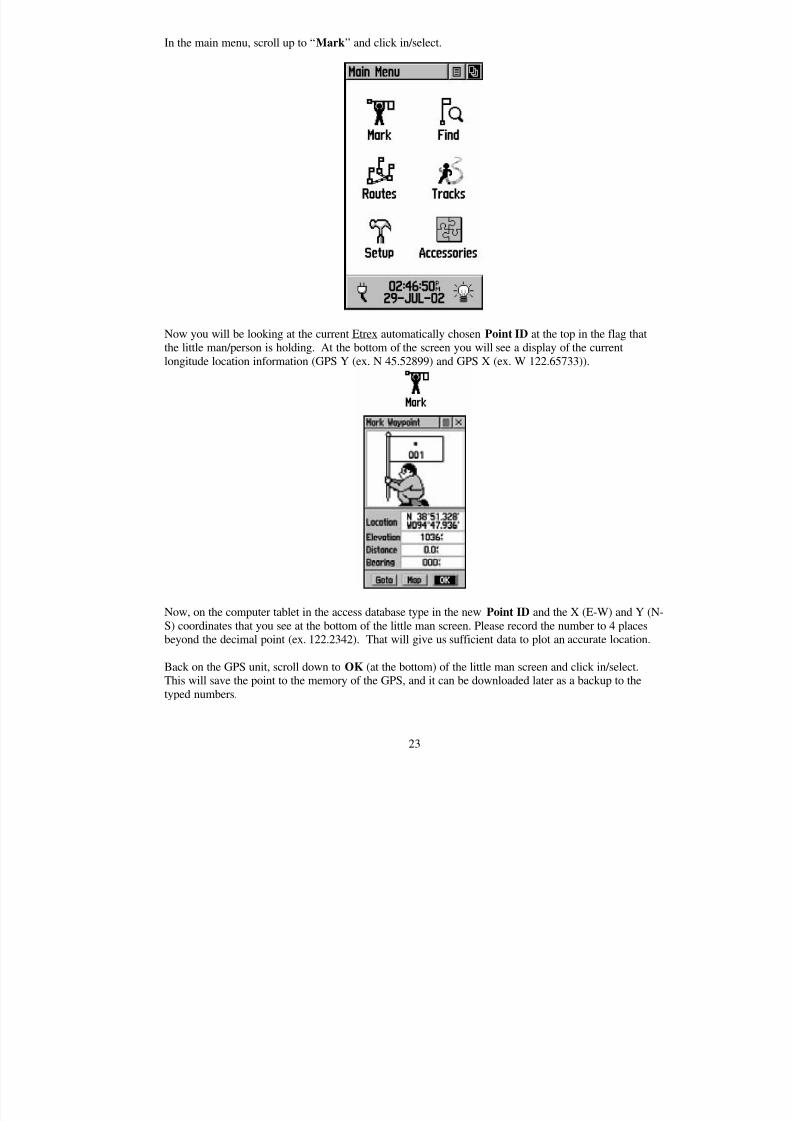
8/3/2019 Statewide Seismic Needs Assessment report
http://slidepdf.com/reader/full/statewide-seismic-needs-assessment-report 174/341
23
In the main menu, scroll up to “Mark” and click in/select.
Now you will be looking at the current Etrex automatically chosen Point ID at the top in the flag thatthe little man/person is holding. At the bottom of the screen you will see a display of the current
longitude location information (GPS Y (ex. N 45.52899) and GPS X (ex. W 122.65733)).
Now, on the computer tablet in the access database type in the new Point ID and the X (E-W) and Y (N-
S) coordinates that you see at the bottom of the little man screen. Please record the number to 4 placesbeyond the decimal point (ex. 122.2342). That will give us sufficient data to plot an accurate location.
Back on the GPS unit, scroll down to OK (at the bottom) of the little man screen and click in/select.This will save the point to the memory of the GPS, and it can be downloaded later as a backup to the
typed numbers.
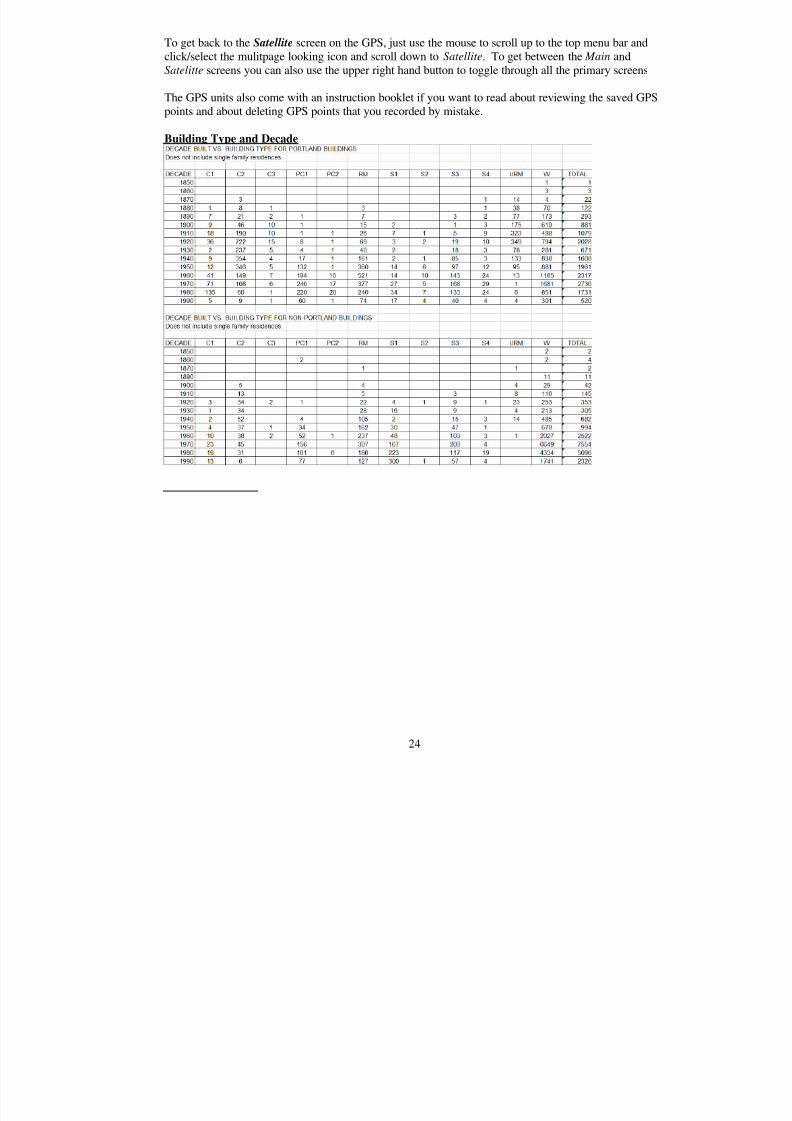
8/3/2019 Statewide Seismic Needs Assessment report
http://slidepdf.com/reader/full/statewide-seismic-needs-assessment-report 175/341
24
To get back to the Satellite screen on the GPS, just use the mouse to scroll up to the top menu bar and
click/select the mulitpage looking icon and scroll down to Satellite. To get between the Main andSatelitte screens you can also use the upper right hand button to toggle through all the primary screens
The GPS units also come with an instruction booklet if you want to read about reviewing the saved GPS
points and about deleting GPS points that you recorded by mistake.
Building Type and Decade
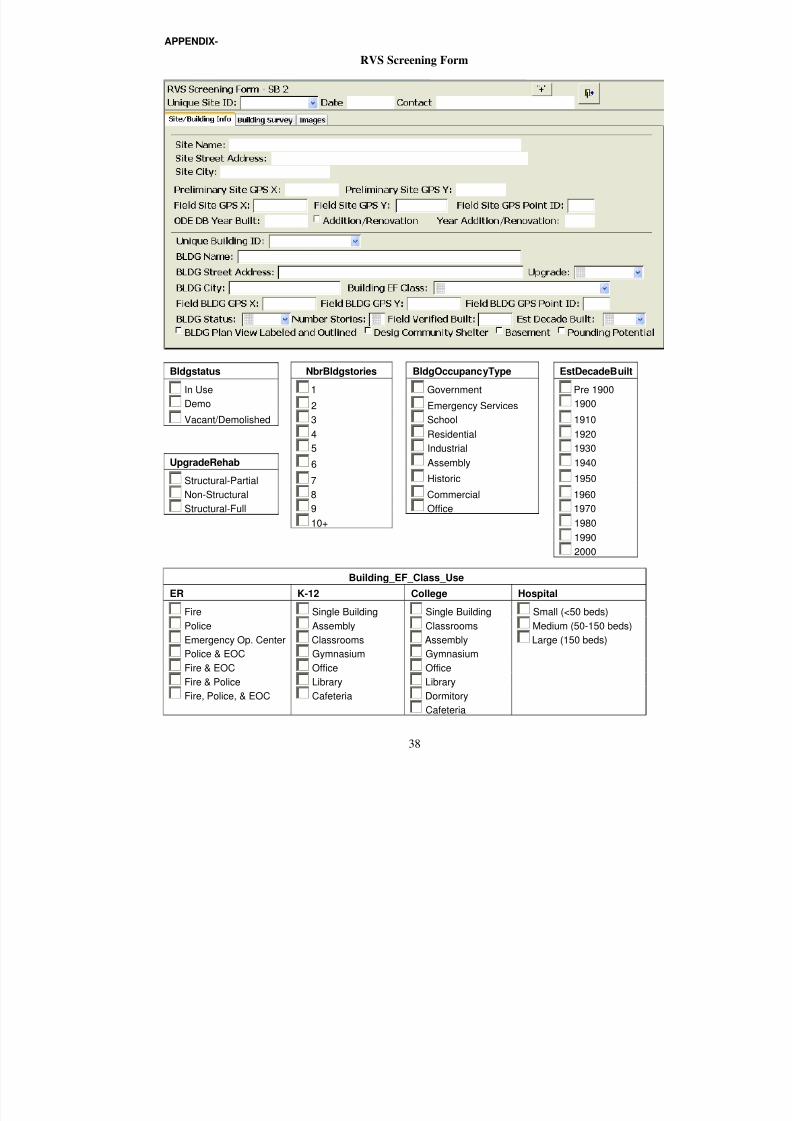
8/3/2019 Statewide Seismic Needs Assessment report
http://slidepdf.com/reader/full/statewide-seismic-needs-assessment-report 176/341
38
APPENDIX-
RVS Screening Form
Bldgstatus NbrBldgstories BldgOccupancyType EstDecadeBuilt
In Use 1 Government Pre 1900
Demo 2 Emergency Services 1900
Vacant/Demolished 3 School 1910
4 Residential 1920
5 Industrial 1930
UpgradeRehab 6 Assembly 1940
Structural-Partial 7 Historic 1950
Non-Structural 8 Commercial 1960
Structural-Full 9 Office 1970
10+ 1980
1990
2000
Building_EF_Class_Use
ER K-12 College Hospital
Fire Single Building Single Building Small (<50 beds)
Police Assembly Classrooms Medium (50-150 beds)
Emergency Op. Center Classrooms Assembly Large (150 beds)
Police & EOC Gymnasium Gymnasium
Fire & EOC Office Office
Fire & Police Library Library
Fire, Police, & EOC Cafeteria Dormitory
Cafeteria
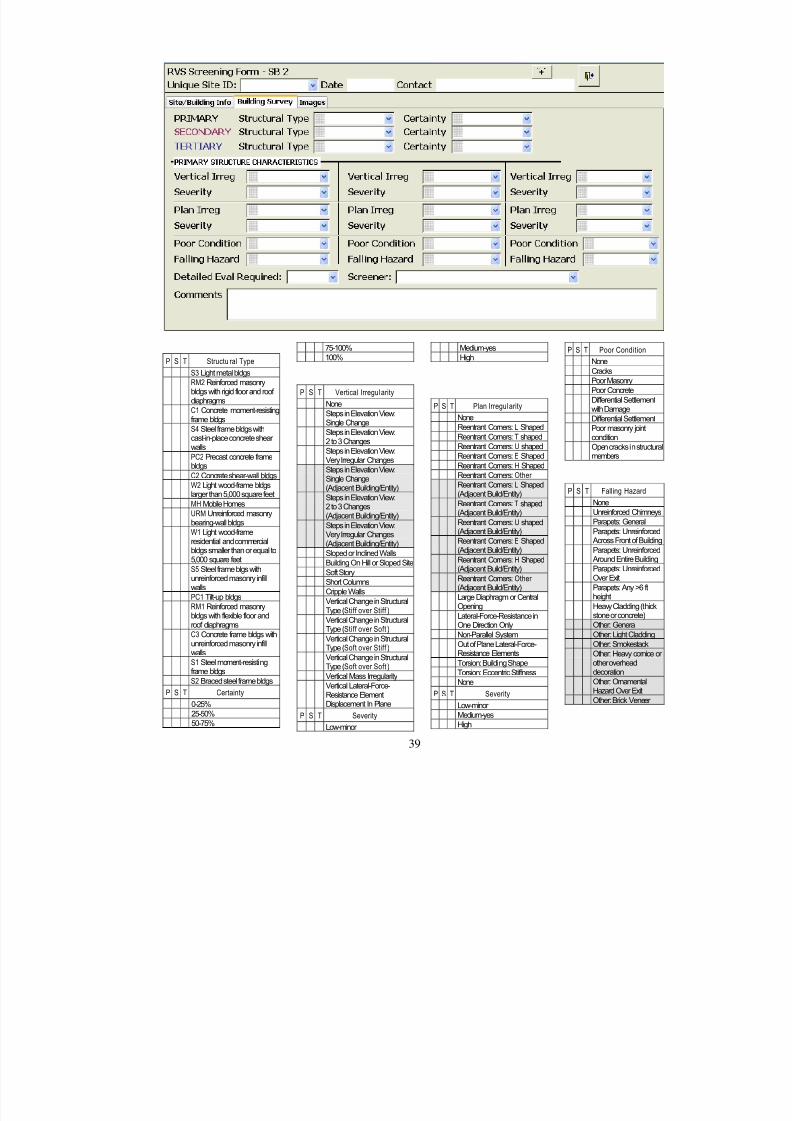
8/3/2019 Statewide Seismic Needs Assessment report
http://slidepdf.com/reader/full/statewide-seismic-needs-assessment-report 177/341
39
P S T Structu ral Type
S3 Light metal bldgs
RM2 Reinforced masonrybldgs with rigid floor and roof diaphragms
C1 Concrete moment-resistingframe bldgs
S4 Steel frame bldgs withcast-in-place concrete shear walls
PC2 Precast concrete framebldgs
C2 Concrete shear-wall bldgs
W2 Light wood-frame bldgslarger than 5,000 square feet
MH Mobile Homes
URM Unreinforced masonrybearing-wall bldgs
W1 Light wood-frameresidential and commercialbldgs smaller than or equal to5,000 square feet
S5 Steel frame blgs withunreinforced masonry infillwalls
PC1 Tilt-up bldgs
RM1 Reinforced masonrybldgs with flexible floor androof diaphragms
C3 Concrete frame bldgs withunreinforced masonry infillwalls
S1 Steel moment-resistingframe bldgs
S2 Braced steel frame bldgs
P S T Certainty
0-25%
25-50%
50-75%
75-100%
100%
P S T Vertical Irregul arity
None
Steps in Elevation View:Single Change
Steps in Elevation View:2 to 3 Changes
Steps in Elevation View:Very Irregular Changes
Steps in Elevation View:Single Change(Adjacent Building/Entity)
Steps in Elevation View:2 to 3 Changes(Adjacent Building/Entity)
Steps in Elevation View:Very Irregular Changes(Adjacent Building/Entity)
Sloped or Inclined Walls
Building On Hill or Sloped Site
Soft Story
Short Columns
Cripple Walls
Vertical Change in StructuralType (Stiff over Stiff )
Vertical Change in StructuralType (Stiff over Soft)
Vertical Change in StructuralType (Soft over Stiff )
Vertical Change in StructuralType (Soft over Soft)
Vertical Mass Irregularity
Vertical Lateral-Force-Resistance ElementDisplacement In Plane
P S T Severity
Low-minor
Medium-yes
High
P S T Plan Irregul arity
None
Reentrant Corners: L Shaped
Reentrant Corners: T shaped
Reentrant Corners: U shaped
Reentrant Corners: E ShapedReentrant Corners: H Shaped
Reentrant Corners: Other
Reentrant Corners: L Shaped(Adjacent Build/Entity)
Reentrant Corners: T shaped(Adjacent Build/Entity)
Reentrant Corners: U shaped(Adjacent Build/Entity)
Reentrant Corners: E Shaped(Adjacent Build/Entity)
Reentrant Corners: H Shaped(Adjacent Build/Entity)
Reentrant Corners: Other (Adjacent Build/Entity)
Large Diaphragm or Central
OpeningLateral-Force-Resistance inOne Direction Only
Non-Parallel System
Out of Plane Lateral-Force-Resistance Elements
Torsion: Building Shape
Torsion: Eccentric Stiffness
None
P S T Severity
Low-minor
Medium-yes
High
P S T Poor Condition
None
Cracks
Poor Masonry
Poor Concrete
Differential Settlementwith Damage
Differential Settlement
Poor masonry jointcondition
Open cracks in structura
members
P S T Falling Hazard
None
Unreinforced Chimneys
Parapets: General
Parapets: UnreinforcedAcross Front of Building
Parapets: UnreinforcedAround Entire Building
Parapets: UnreinforcedOver Exit
Parapets: Any >6 ftheight
Heavy Cladding (thickstone or concrete)
Other: General
Other: Light Cladding
Other: Smokestack
Other: Heavy cornice or other overheaddecoration
Other: OrnamentalHazard Over Exit
Other: Brick Veneer

8/3/2019 Statewide Seismic Needs Assessment report
http://slidepdf.com/reader/full/statewide-seismic-needs-assessment-report 178/341

8/3/2019 Statewide Seismic Needs Assessment report
http://slidepdf.com/reader/full/statewide-seismic-needs-assessment-report 179/341
FEMA
Rapid Visual Screening of Buildings for PotentialSeismic HazardsA HandbookFEMA 154, Edition 2 / March 2002
8/3/2019 Statewide Seismic Needs Assessment report
http://slidepdf.com/reader/full/statewide-seismic-needs-assessment-report 180/341
8/3/2019 Statewide Seismic Needs Assessment report
http://slidepdf.com/reader/full/statewide-seismic-needs-assessment-report 181/341
ATC-21 UPDATE PROJECT PARTICIPANTS
PRINCIPAL INVESTIGATOR Christopher Rojahn
CO-PRINCIPAL INVESTIGATOR
Charles Scawthorn
PROJECT ADVISORY PANELThalia AnagnosJohn BaalsJames CagleyMelvyn GreenTerry HughesAnne S. KiremidjianJoan MacQuarrieChris D. PolandLawrence D. ReaveleyDoug Smits
Ted Winstead
CONSULTANTSKent M. DavidWilliam T. HolmesStephanie A. KingKeith Porter Vincent PrabisRichard Ranous Nilesh Shome
ATC STAFFA. Gerald BradyPeter N. Mork Bernadette A. MosbyMichelle S. Schwartzbach
APPLIED TECHNOLOGY COUNCIL
The Applied Technology Council (ATC) is anonprofit, tax-exempt corporation established in1971 through the efforts of the Structural EngineersAssociation of California. ATC’s mission is todevelop state-of-the-art, user-friendly engineeringresources and applications for use in mitigating the
effects of natural and other hazards on the builtenvironment. ATC also identifies and encouragesneeded research and develops consensus opinionson structural engineering issues in a non- proprietary format. ATC thereby fulfills a uniquerole in funded information transfer.
ATC is guided by a Board of Directorsconsisting of representatives appointed by theAmerican Society of Civil Engineers, the NationalCouncil of Structural Engineers Associations, the
Structural Engineers Association of California, theWestern Council of Structural EngineersAssociations, and four at-large representativesconcerned with the practice of structuralengineering. Each director serves a three-year term.
Project management and administration are
carried out by a full-time Executive Director andsupport staff. Project work is conducted by a widerange of highly qualified consulting professionals,thus incorporating the experience of manyindividuals from academia, research, and professional practice who would not be availablefrom any single organization. Funding for ATC projects is obtained from government agencies andfrom the private sector in the form of tax-deductiblecontributions.
2001-2002 Board of Directors
Andrew T. Merovich, PresidentJames R. Cagley, Vice PresidentStephen H. Pelham, Secretary/Treasurer Arthur N. L. Chiu, Past PresidentSteven M. BaldridgePatrick Buscovich Anthony B. CourtEdwin T. DeanJames M. DelahayMelvyn GreenRichard L. HessChristopher P. JonesMaryann T. Phipps
Lawrence D. Reaveley
ATC DISCLAIMER
While the information presented in this report is believed to be correct, ATC and the sponsoring
agency assume no responsibility for its accuracy or for the opinions expressed herein. The materials presented in this publication should not be used or relied upon for any specific application withoutcompetent examination and verification of itsaccuracy, suitability, and applicability by qualified professionals. Users of information from this publication assume all liability arising from suchuse.
8/3/2019 Statewide Seismic Needs Assessment report
http://slidepdf.com/reader/full/statewide-seismic-needs-assessment-report 182/341
FEMA 154 FEMA Foreword iii
FEMA Foreword
The Federal Emergency Management Agency
(FEMA) is pleased to present the second edition of the widely used Rapid Visual Screening of Buildings for Potential Seismic Hazards: A Handbook , and its companion, Supporting Documentation. The policy of improving reportsand manuals that deal with the seismic safety of existing buildings as soon as new information andadequate resources are available is thus beingreaffirmed. Users should take note of some major differences between the two editions of the Handbook . The technical content of the newedition is based more on experiential data and lesson expert judgment than was the case in the earlier
edition, as is explained in the Supporting Documentation. From the presentational point of view, the Handbook retains much of the materialof the earlier edition, but the material has beenrather thoroughly rearranged to further facilitatethe step-by-step process of conducting the rapidvisual screening of a building. By far the mostsignificant difference between the two editions,
however, is the need for a higher level of
engineering understanding and expertise on the part of the users of the second edition. This shifthas been caused primarily by the difficultyexperienced by users of the first edition inidentifying the lateral-force-resisting system of a building without entry—a critical decision of therapid visual screening process. The contents of the Supporting Documentation volume have also
been enriched to reflect the technical advances inthe Handbook .
FEMA and the Project Officer wish to expresstheir gratitude to the members of the ProjectAdvisory Panel, to the technical and workshop
consultants, to the project management, and to thereport production and editing staff for their expertise and dedication in the upgrading of thesetwo volumes.
The Federal Emergency Management Agency

8/3/2019 Statewide Seismic Needs Assessment report
http://slidepdf.com/reader/full/statewide-seismic-needs-assessment-report 183/341
8/3/2019 Statewide Seismic Needs Assessment report
http://slidepdf.com/reader/full/statewide-seismic-needs-assessment-report 184/341
FEMA 154 Preface v
Preface
In August 1999 the Federal Emergency
Management Agency (FEMA) awarded theApplied Technology Council (ATC) a two-year contract to update the FEMA 154 report, Rapid Visual Screening of Buildings for Potential Seismic Hazards: A Handbook , and thecompanion FEMA-155 report, Rapid Visual Screening of Buildings for Potential Seismic Hazards: Supporting Documentation, both of which were originally published in 1988.
The impetus for the project stemmed in partfrom the general recommendation in the FEMA315 report, Seismic Rehabilitation of Buildings:Strategic Plan 2005, to update periodically all
existing reports in the FEMA-developed series onthe seismic evaluation and rehabilitation of existing buildings. In addition, a vast amount of information had been developed since 1988,including: (1) new knowledge about the performance of buildings during damagingearthquakes, including the 1989 Loma Prieta and1994 Northridge earthquakes; (2) new knowledgeabout seismic hazards, including updated nationalseismic hazard maps published by the U. S.Geological Survey in 1996; (3) other new seismicevaluation and damage prediction tools, such asthe FEMA 310 report, Handbook for the Seismic
Evaluation of Buildings – a Prestandard , (anupdated version of FEMA 178, NEHRP Handbook for the Seismic Evaluation of Existing Buildings),and HAZUS, FEMA’s tool for estimating potentiallosses from natural disasters; and (4) experiencefrom the widespread use of the original FEMA154 Handbook by federal, state and municipalagencies, and others.
The project included the following tasks:(1) an effort to obtain users feedback, which wasexecuted through the distribution of a voluntaryFEMA 154 Users Feedback Form to organizations
that had ordered or were known to have usedFEMA 154 (the Feedback Form was also postedon ATC’s web site); (2) a review of availableinformation on the seismic performance of buildings, including a detailed review of theHAZUS fragility curves and an effort to correlatethe relationship between results from the use of both the FEMA 154 rapid visual screening procedure and the FEMA 178 detailed seismicevaluation procedures on the same buildings;
(3) a Users Workshop midway in the project to
learn first hand the problems and successes of organizations that had used the rapid visualscreening procedure on buildings under their jurisdiction; (4) updating of the original FEMA154 Handbook to create the second edition; and(5) updating of the original FEMA 155 Supporting Documentation report to create the second edition.
This second edition of the FEMA 154 Handbook provides a standard rapid visualscreening procedure to identify, inventory, andrank buildings that are potentially seismicallyhazardous. The scoring system has been revised, based on new information, and the Handbook has
been shortened and focused to facilitateimplementation. The technical basis for the rapidvisual screening procedure, including a summaryof results from the efforts to solicit user feedback,is documented in the companion second edition of the FEMA 155 report, Rapid Visual Screening of
Buildings for Potential Seismic Hazards:Supporting Documentation.
ATC gratefully acknowledges the personnelinvolved in developing the second editions of theFEMA 154 and FEMA 155 reports. CharlesScawthorn served as Co-Principal Investigator andProject Director. He was assisted by Kent David,
Vincent Prabis, Richard A. Ranous, and NileshShome, who served as Technical Consultants.Members of the Project Advisory Panel, who provided overall review and guidance for the project, were: Thalia Anagnos, John Baals, JamesR. Cagley (ATC Board Representative), MelvynGreen, Terry Hughes, Anne S. Kiremidjian, JoanMacQuarrie, Chris D. Poland, Lawrence D.Reaveley, Doug Smits, and Ted Winstead.William T. Holmes served as facilitator for theUsers Workshop, and Keith Porter served asrecorder. Stephanie A. King verified the Basic
Structural Hazard Scores and the Score Modifiers.A. Gerald Brady, Peter N. Mork, and MichelleSchwartzbach provided report editing and production services. The affiliations of theseindividuals are provided in the list of project participants.
ATC also gratefully acknowledges thevaluable assistance, support, and cooperation provided by Ugo Morelli, FEMA Project Officer.In addition, ATC acknowledges participants in the
8/3/2019 Statewide Seismic Needs Assessment report
http://slidepdf.com/reader/full/statewide-seismic-needs-assessment-report 185/341
vi Preface
FEMA 154 Users Workshop, which included, inaddition to the project personnel listed above, thefollowing individuals: Al Berstein, U. S. Bureauof Reclamation; Amitabha Datta, General ServicesAdministration; Ben Emam, Amazon.com;Richard K. Eisner, California Office of EmergencyServices; Ali Fattah, City of San Diego; BrianKehoe, Wiss Janney Elstner Associates, Inc.;
David Leung, City and County of San Francisco;Douglas McCall, Marx/Okubo; Richard Silva, National Park Service; Howard Simpson, Simpson
Gumpertz & Heger Inc.; Steven Sweeney, U. S.Army Civil Engineering Research Laboratory;Christine Theodooropoulos, University of Oregon;and Zan Turner, City and County of SanFrancisco. Those persons who responded toATC’s request to complete the voluntary FEMA154 Users Feedback form are also gratefullyacknowledged.
Christopher Rojahn, Principal Investigator ATC Executive Director

8/3/2019 Statewide Seismic Needs Assessment report
http://slidepdf.com/reader/full/statewide-seismic-needs-assessment-report 186/341
FEMA 154 Summary and Application vii
Summary and Application
This FEMA 154 Report, Rapid Visual Screening of Buildings for Potential Seismic Hazards: A
Handbook, is the first of a two-volume publicationon a recommended methodology for rapid visualscreening of buildings for potential seismichazards. The technical basis for the methodology,including the scoring system and its development,are contained in the companion FEMA 155 report, Rapid Visual Screening of Buildings for Potential Seismic Hazards: Supporting Documentation.Both this document and the companion documentare second editions of similar documents published by FEMA in 1988.
The rapid visual screening procedure (RVS)has been developed for a broad audience,
including building officials and inspectors, andgovernment agency and private-sector buildingowners (hereinafter, the "RVS authority"), toidentify, inventory, and rank buildings that are potentially seismically hazardous. Although RVSis applicable to all buildings, its principal purposeis to identify (1) older buildings designed andconstructed before the adoption of adequateseismic design and detailing requirements, (2) buildings on soft or poor soils, or (3) buildingshaving performance characteristics that negativelyinfluence their seismic response. Once identifiedas potentially hazardous, such buildings should be
further evaluated by a design professionalexperienced in seismic design to determine if, infact, they are seismically hazardous.
The RVS uses a methodology based on a“sidewalk survey” of a building and a DataCollection Form, which the person conducting thesurvey (hereafter referred to as the screener)completes, based on visual observation of the building from the exterior, and if possible, theinterior. The Data Collection Form includes spacefor documenting building identificationinformation, including its use and size, a
photograph of the building, sketches, anddocumentation of pertinent data related to seismic performance, including the development of anumeric seismic hazard score.
Once the decision to conduct rapid visualscreening for a community or group of buildingshas been made by the RVS authority, thescreening effort can be expedited by pre-planning,including the training of screeners, and carefuloverall management of the process.
Completion of the Data Collection Form in thefield begins with identifying the primary structural
lateral-load-resisting system and structuralmaterials of the building. Basic Structural HazardScores for various building types are provided onthe form, and the screener circles the appropriateone. For many buildings, viewed only from theexterior, this important decision requires thescreener to be trained and experienced in buildingconstruction. The screener modifies the BasicStructural Hazard Score by identifying andcircling Score Modifiers, which are related toobserved performance attributes, and which arethen added (or subtracted) to the Basic StructuralHazard Score to arrive at a final Structural Score,
S . The Basic Structural Hazard Score, ScoreModifiers, and final Structural Score, S , all relateto the probability of building collapse, shouldsevere ground shaking occur (that is, a groundshaking level equivalent to that currently used inthe seismic design of new buildings). Final S scores typically range from 0 to 7, with higher S scores corresponding to better expected seismic performance.
Use of the RVS on a community-wide basisenables the RVS authority to divide screened buildings into two categories: those that areexpected to have acceptable seismic performance,
and those that may be seismically hazardous andshould be studied further. An S score of 2 issuggested as a “cut-off”, based on present seismicdesign criteria. Using this cut-off level, buildingshaving an S score of 2 or less should beinvestigated by a design professional experiencedin seismic design.
The procedure presented in this Handbook ismeant to be the preliminary screening phase of amulti-phase procedure for identifying potentiallyhazardous buildings. Buildings identified by this procedure must be analyzed in more detail by an
experienced seismic design professional. Becauserapid visual screening is designed to be performedfrom the street, with interior inspection not always possible, hazardous details will not always bevisible, and seismically hazardous buildings maynot be identified as such. Conversely, buildingsinitially identified as potentially hazardous byRVS may prove to be adequate.

8/3/2019 Statewide Seismic Needs Assessment report
http://slidepdf.com/reader/full/statewide-seismic-needs-assessment-report 187/341
8/3/2019 Statewide Seismic Needs Assessment report
http://slidepdf.com/reader/full/statewide-seismic-needs-assessment-report 188/341
FEMA 154 Contents ix
Contents
FEMA Foreword................................................................................................................................................ iii
Preface .................................................................................................................................................................v
Summary and Application ................................................................................................................................ vii
List of Figures.................................................................................................................................................. xiii
List of Tables ....................................................................................................................................................xix
Illustration Credits ............................................................................................................................................xxi
1. Introduction ...................................................................................................................................................11.1 Background..........................................................................................................................................11.2 Screening Procedure Purpose, Overview, and Scope ..........................................................................21.3 Companion FEMA 155 Report............................................................................................................31.4 Relationship of FEMA 154 to Other Documents in the FEMA Existing Building Series ..................4
1.5 Uses of RVS Survey Results ...............................................................................................................41.6 How to Use this Handbook..................................................................................................................4
2. Planning and Managing Rapid Visual Screening..........................................................................................52.1 Screening Implementation Sequence...................................................................................................52.2 Budget Development and Cost Estimation..........................................................................................62.3 Pre-Field Planning ...............................................................................................................................62.4 Selection and Review of the Data Collection Form ............................................................................7
2.4.1 Determination of Seismicity Region ......................................................................................82.4.2 Determination of Key Seismic Code Adoption Dates and Other Considerations ..................82.4.3 Determination of Cut-Off Score ...........................................................................................10
2.5 Qualifications and Training for Screeners .........................................................................................112.6 Acquisition and Review of Pre-Field Data........................................................................................11
2.6.1 Assessor’s Files ....................................................................................................................112.6.2 Building Department Files....................................................................................................122.6.3 Sanborn Maps.......................................................................................................................122.6.4 Municipal Databases.............................................................................................................152.6.5 Previous Studies ...................................................................................................................152.6.6 Soils Information..................................................................................................................15
2.7 Review of Construction Documents..................................................................................................172.8 Field Screening of Buildings .............................................................................................................182.9 Checking the Quality and Filing the Field Data in the Record-Keeping System ..............................18
3. Completing the Data Collection Form ........................................................................................................193.1 Introduction .......................................................................................................................................193.2 Verifying and Updating the Building Identification Information......................................................20
3.2.1 Number of Stories.................................................................................................................203.2.2 Year Built .............................................................................................................................203.2.3 Screener Identification..........................................................................................................203.2.4 Total Floor Area ...................................................................................................................21
3.3 Sketching the Plan and Elevation Views ...........................................................................................213.4 Determining Soil Type ......................................................................................................................213.5 Determining and Documenting Occupancy.......................................................................................22
3.5.1 Occupancy ............................................................................................................................223.5.2 Occupancy Load...................................................................................................................23
8/3/2019 Statewide Seismic Needs Assessment report
http://slidepdf.com/reader/full/statewide-seismic-needs-assessment-report 189/341
x Contents FEMA 154
3.6 Identifying Potential Nonstructural Falling Hazards .........................................................................233.7 Identifying the Lateral-Load-Resisting System and Documenting the Related Basic
Structural Score .................................................................................................................................243.7.1 Fifteen Building Types Considered by the RVS Procedure and Related Basic
Structural Scores...................................................................................................................243.7.2 Identifying the Lateral-Force-Resisting System...................................................................253.7.3 Interior Inspections...............................................................................................................363.7.4 Screening Buildings with More Than One Lateral-Force Resisting System........................37
3.8 Identifying Seismic Performance Attributes and Recording Score Modifiers ..................................383.8.1 Mid-Rise Buildings...............................................................................................................383.8.2 High-Rise Buildings .............................................................................................................383.8.3 Vertical Irregularity ..............................................................................................................383.8.4 Plan Irregularity....................................................................................................................403.8.5 Pre-Code ...............................................................................................................................403.8.6 Post-Benchmark....................................................................................................................413.8.7 Soil Type C, D, or E .............................................................................................................41
3.9 Determining the Final Score..............................................................................................................413.10 Photographing the Building...............................................................................................................423.11 Comments Section.............................................................................................................................42
4. Using the RVS Procedure Results...............................................................................................................434.1 Interpretation of RVS Score ..............................................................................................................434.2 Selection of RVS “Cut-Off” Score ....................................................................................................434.3 Prior Uses of the RVS Procedure ......................................................................................................444.4 Other Possible Uses of the RVS Procedure.......................................................................................45
4.4.1 Using RVS Scores as a Basis for Hazardous Building Mitigation Programs.......................454.4.2 Using RVS Data in Community Building Inventory Development .....................................464.4.3 Using RVS Data to Plan Postearthquake Building-Safety-Evaluation Efforts.....................464.4.4 Resources Needed for the Various Uses of the RVS Procedure...........................................46
5. Example Application of Rapid Visual Screening........................................................................................495.1 Step 1: Budget and Cost Estimation.................................................................................................495.2 Step 2: Pre-Field Planning................................................................................................................505.3 Step 3: Selection and Review of the Data Collection Form .............................................................505.4 Step 4: Qualifications and Training for Screeners............................................................................515.5 Step 5: Acquisition and Review of Pre-Field Data...........................................................................515.6 Step 6: Review of Construction Documents.....................................................................................555.7 Step 7: Field Screening of Buildings................................................................................................555.8 Step 8: Transferring the RVS Field Data to the Electronic Building RVS Database .......................64
Appendix A: Maps Showing Seismicity Regions.............................................................................................65
Appendix B: Data Collection Forms and Quick Reference Guide ...................................................................77
Appendix C: Review of Design and Construction Drawings ...........................................................................83
Appendix D: Exterior Screening for Seismic System and Age ........................................................................85
D.1 Introduction .......................................................................................................................................85D.2 What to Look for and How to Find It ................................................................................................85D.3 Identification of Building Age...........................................................................................................85D.4 Identification of Structural Type .......................................................................................................88D.5 Characteristics of Exposed Construction Materials...........................................................................95
Appendix E: Characteristics and Earthquake Performance of RVS Building Types........................................99E.1 Introduction .......................................................................................................................................99E.2 Wood Frame (W1, W2) .....................................................................................................................99

8/3/2019 Statewide Seismic Needs Assessment report
http://slidepdf.com/reader/full/statewide-seismic-needs-assessment-report 190/341
FEMA 154 Contents xi
E.2.1 Characteristics ......................................................................................................................99E.2.2 Typical Earthquake Damage ..............................................................................................100E.2.3 Common Rehabilitation Techniques ..................................................................................102
E.3 Steel Frames (S1, S2) ......................................................................................................................103E.3.1 Characteristics ....................................................................................................................103E.3.2 Typical Earthquake Damage ..............................................................................................105E.3.3 Common Rehabilitation Techniques ..................................................................................105
E.4 Light Metal (S3) ..............................................................................................................................106
E.4.1 Characteristics ....................................................................................................................106E.4.2 Typical Earthquake Damage ..............................................................................................107
E.5 Steel Frame with Concrete Shear Wall (S4)....................................................................................107E.5.1 Characteristics ....................................................................................................................107E.5.2 Typical Earthquake Damage ..............................................................................................108
E.6 Steel Frame with Unreinforced Masonry Infill (S5)........................................................................108E.6.1 Characteristics ....................................................................................................................108E.6.2 Typical Earthquake Damage ..............................................................................................109E.6.3 Common Rehabilitation Techniques ..................................................................................110
E.7 Concrete Moment-Resisting Frame (C1).........................................................................................110E.7.1 Characteristics ....................................................................................................................110E.7.2 Typical Earthquake Damage ..............................................................................................112
E.7.3 Common Rehabilitation Techniques ..................................................................................113E.8 Concrete Shear Wall (C2)................................................................................................................113E.8.1 Characteristics ....................................................................................................................113E.8.2 Typical Types of Earthquake Damage ...............................................................................114E.8.3 Common Rehabilitation......................................................................................................114
E.9 Concrete Frame with Unreinforced Masonry Infill (C3).................................................................114E.9.1 Characteristics ....................................................................................................................114E.9.2 Typical Earthquake Damage ..............................................................................................116E.9.3 Common Rehabilitation Techniques ..................................................................................116
E.10 Tilt-up Structures (PC1) ..................................................................................................................116E.10.1 Characteristics ....................................................................................................................116E.10.2 Typical Earthquake Damage ..............................................................................................117E.10.3 Common Rehabilitation Techniques ..................................................................................118
E.11 Precast Concrete Frame (PC2).........................................................................................................118E.11.1 Characteristics ....................................................................................................................118E.11.2 Typical Earthquake Damage ..............................................................................................120E.11.3 Common Rehabilitation Techniques ..................................................................................120
E.12 Reinforced Masonry (RM1 and RM2) ............................................................................................121E.12.1 Characteristics ....................................................................................................................121E.12.2 Typical Earthquake Damage ..............................................................................................121E.12.3 Common Rehabilitation Techniques ..................................................................................121
E.13 Unreinforced Masonry (URM)........................................................................................................122E.13.1 Characteristics ....................................................................................................................122E.13.2 Typical Earthquake Damage ..............................................................................................126E.13.3 Common Rehabilitation Techniques ..................................................................................126
Appendix F: Earthquakes and How Buildings Resist Them...........................................................................129F.1 The Nature of Earthquakes ..............................................................................................................129F.2 Seismicity of the United States........................................................................................................130F.3 Earthquake Effects...........................................................................................................................131F.4 How Buildings Resist Earthquakes .................................................................................................134
References........................................................................................................................................................137
Project Participants ..........................................................................................................................................139

8/3/2019 Statewide Seismic Needs Assessment report
http://slidepdf.com/reader/full/statewide-seismic-needs-assessment-report 191/341

8/3/2019 Statewide Seismic Needs Assessment report
http://slidepdf.com/reader/full/statewide-seismic-needs-assessment-report 192/341
FEMA 154 List of Figures xiii
List of Figures
Figure 1-1 High, moderate, and low seismicity regions of the conterminous United States. Adifferent RVS Data Collection Form has been developed for each of these regions.................1
Figure 1-2 Data Collection Forms for the three designated seismicity regions (low, moderate,and high). ...................................................................................................................................3
Figure 2-1 Rapid visual screening implementation sequence. ....................................................................5
Figure 2-2 Example RVS Data Collection Form (high seismicity).............................................................7
Figure 2-3 Sections 1 and 2 of Quick Reference Guide (for use with Data Collection Form)..................10
Figure 2-4 Building identification portion of RVS Data Collection Form................................................11
Figure 2-5 Example Sanborn map showing building information for a city block. ..................................12
Figure 2-6 Key to Sanborn map symbols. ...............................................................................................13
Figure 2-7 Sanborn map and corresponding aerial photograph of a city block.........................................14
Figure 2-8 Photographs of elevation views of buildings shown in Figure 2-7..........................................15
Figure 2-9 Examples of in-house screen displays of municipal databases................................................16
Figure 2-10 Location on Data Collection Form where soil type information is recorded...........................17
Figure 3-1 Example RVS Data Collection Form (high seismicity)...........................................................19
Figure 3-2 Portion of Data Collection Form for documenting building identification. ............................20
Figure 3-3 Sample Data Collection Form showing location for sketches of building plan andelevation views. .......................................................................................................................21
Figure 3-4 Location on Data Collection Form where soil type information is documented (circled).......21
Figure 3-5 Occupancy portion of Data Collection Form...........................................................................22
Figure 3-6 Portion of Data Collection Form for documenting nonstructural falling hazards. ..................23
Figure 3-7 Portion of Data Collection Form containing Basic Structural Hazard Scores. ........................25
Figure 3-8 Typical frame structure. Features include: large window spans, window openings onmany sides, and clearly visible column-beam grid pattern......................................................35
Figure 3-9 Typical bearing wall structure. Features include small window span, at least twomostly solid walls, and thick load-bearing walls. ....................................................................35
Figure 3-10 Frame and bearing wall structures ...........................................................................................36
Figure 3-11 Interior view showing fireproofed columns and beams, which indicate a steel building(S1, S2, or S4)..........................................................................................................................37
8/3/2019 Statewide Seismic Needs Assessment report
http://slidepdf.com/reader/full/statewide-seismic-needs-assessment-report 193/341
xiv List of Figures FEMA 154
Figure 3-12 Interior view showing concrete columns and girders, which indicate a concrete momentframe (C1). ..............................................................................................................................37
Figure 3-13 Portion of Data Collection Form containing attributes that modify performance andassociated score modifiers....................................................................................................... 38
Figure 3-14 Elevation views showing vertical irregularities, with arrows indicating locationsof particular concern................................................................................................................ 39
Figure 3-15 Example of setbacks and a soft first story ............................................................................... 39
Figure 3-16 Example of soft story conditions, where parking requirements result in largeweak openings. ........................................................................................................................ 40
Figure 3-17 Plan views of various building configurations showing plan irregularities; arrowsindicate possible areas of damage. .......................................................................................... 40
Figure 3-18 Example of a building, with a plan irregularity, with two wings meeting at right angles....... 41
Figure 3-19 Example of a building, triangular in plan, subject to torsion. ................................................. 41
Figure 3-20 Location on Data Collection Form where the final score, comments, and an indicationif the building needs detailed evaluation are documented....................................................... 42
Figure 5-1 Screen capture of USGS web page showing SA values for 0.2 sec and 1.0 sec for groundmotions having 2% probability of being exceeded in 50 years............................................... 50
Figure 5-2 High seismicity Data Collection Form selected for Anyplace, USA ...................................... 52
Figure 5-3 Quick Reference Guide for Anyplace USA showing entries for years in which seismiccodes were first adopted and enforced and benchmark years. ................................................ 53
Figure 5-4 Property information at example site in city’s geographic information system...................... 54
Figure 5-5 Exterior view of 3703 Roxbury Street .................................................................................... 56
Figure 5-6 Close-up view of 3703 Roxbury Street exterior showing perimeter braced steel framing...... 56
Figure 5-7 Building identification portion of Data Collection Form for Example 1,3703 Roxbury Street................................................................................................................ 56
Figure 5-8 Completed Data Collection Form for Example 1, 3703 Roxbury Street................................. 57
Figure 5-9 Exterior view of 3711 Roxbury............................................................................................... 58
Figure 5-10 Close-up view of 3711 Roxbury Street building exterior showing infill
frame construction................................................................................................................... 58
Figure 5-11 Completed Data Collection Form for Example 2, 3711 Roxbury Street................................. 59
Figure 5-12 Exterior view of 5020 Ebony Drive ........................................................................................ 60
Figure 5-13 Completed Data Collection Form for Example 3, 5020 Ebony Drive .................................... 61
Figure 5-14 Exterior view of 1450 Addison Avenue.................................................................................. 62
8/3/2019 Statewide Seismic Needs Assessment report
http://slidepdf.com/reader/full/statewide-seismic-needs-assessment-report 194/341
FEMA 154 List of Figures xv
Figure 5-15 Building identification portion of Data Collection Form for Example 4, 1450 AddisonAvenue.....................................................................................................................................62
Figure 5-16 Completed Data Collection Form for Example 4, 1450 Addison Avenue ..............................62
Figure A-1 Seismicity Regions of the Conterminous United States ..........................................................66
Figure A-2 Seismicity Regions in California, Idaho, Nevada, Oregon, and Washington..........................67
Figure A-3 Seismicity Regions in Arizona, Montana, Utah, and Wyoming..............................................68
Figure A-4 Seismicity Regions in Colorado, Kansas, New Mexico, Oklahoma, and Texas......................69
Figure A-5 Seismicity Regions in Iowa, Michigan, Minnesota, Nebraska, North Dakota,South Dakota and Wisconsin...................................................................................................70
Figure A-6 Seismicity Regions in Illinois, Indiana, Kentucky, Missouri, and Ohio..................................71
Figure A-7 Seismicity Regions in Alabama, Arkansas, Louisiana, Mississippi, and Tennessee...............72
Figure A-8 Seismicity Regions in Connecticut, Maine, Massachusetts, New Hampshire, RhodeIsland, and Vermont.................................................................................................................73
Figure A-9 Seismicity Regions in Delaware, Maryland, New Jersey, Pennsylvania, Virginia, andWest Virginia...........................................................................................................................74
Figure A-10 Seismicity Regions in Florida, Georgia, North Carolina, and South Carolina ........................75
Figure A-11 Seismicity Regions in Alaska and Hawaii ...............................................................................76
Figure D-1 Photos showing basic construction, in steel-frame buildings and reinforcedconcrete-frame buildings. ........................................................................................................91
Figure D-2 Building with exterior columns covered with a façade material..............................................94
Figure D-3 Detail of the column façade of Figure D-2. .............................................................................94
Figure D-4 Building with both shear walls (in the short direction) and frames (in the long direction) .....94
Figure D-5 Regular, full-height joints in a building’s wall indicate a concrete tilt-up. .............................95
Figure D-6 Reinforced masonry wall showing no course of header bricks (a row of visible brick ends). 95
Figure D-7 Reinforced masonry building with exterior wall of concrete masonry units, or concrete blocks.......................................................................................................................................95
Figure D-8 A 1970s renovated façade hides a URM bearing-wall structure..............................................95
Figure D-9 A concrete shear-wall structure with a 1960s renovated façade. .............................................96
Figure D-10 URM wall showing header courses (identified by arrows) and two washer platesindicating wall anchors. ...........................................................................................................96
Figure D-11 Drawing of two types of masonry pattern showing header bricks...........................................96
8/3/2019 Statewide Seismic Needs Assessment report
http://slidepdf.com/reader/full/statewide-seismic-needs-assessment-report 195/341
xvi List of Figures FEMA 154
Figure D-12 Diagram of common reinforced masonry construction. Bricks are left out of the bottomcourse at intervals to create cleanout holes, then inserted before grouting ............................. 97
Figure D-13 Brick veneer panels. ................................................................................................................ 97
Figure D-14 Hollow clay tile wall with punctured tiles............................................................................... 97
Figure D-15 Sheet metal siding with masonry pattern................................................................................. 97
Figure D-16 Asphalt siding with brick pattern. ........................................................................................... 98
Figure D-17 Pre-1940 cast-in-place concrete with formwork pattern. ........................................................ 98
Figure E-1 Single family residence (an example of the W1 identifier, light wood-frame residentialand commercial buildings less than 5000 square feet). ........................................................... 99
Figure E-2 Larger wood-framed structure, typically with room-width spans (W2, light, wood-frame buildings greater than 5000 square feet). ................................................................................ 99
Figure E-3 Drawing of wood stud frame construction. ........................................................................... 100
Figure E-4 Stud wall, wood-framed house. ............................................................................................. 101
Figure E-5 Drawing of timber pole framed house................................................................................... 101
Figure E-6 Timber pole framed house..................................................................................................... 101
Figure E-7 House off its foundation, 1983 Coalinga earthquake. ........................................................... 101
Figure E-8 Failed cripple stud wall, 1992 Big Bear earthquake.............................................................. 102
Figure E-9 Failure of post and pier foundation, Humbolt County. ......................................................... 102
Figure E-10 Seismic strengthening of a cripple wall, with plywood sheathing. ....................................... 103
Figure E-11 Drawing of steel moment-resisting frame building............................................................... 103
Figure E-12 Braced frame configurations. ................................................................................................ 104
Figure E-13 Braced steel frame, with chevron and diagonal braces. The braces and steel frames areusually covered by finish material after the steel is erected.................................................. 104
Figure E-14 Chevron bracing in steel building under construction........................................................... 104
Figure E-15 Rehabilitation of a concrete parking structure using exterior X-braced steel frames............ 105
Figure E-16 Use of a braced frame to rehabilitate an unreinforced masonry building.............................. 106
Figure E-17 Drawing of light metal construction...................................................................................... 106
Figure E-18 Connection of metal siding to light metal frame with rows of screws (encircled)................ 107
Figure E-19 Prefabricated metal building (S3, light metal building). ....................................................... 107
Figure E-20 Drawing of steel frame with interior concrete shear-walls.................................................... 108

8/3/2019 Statewide Seismic Needs Assessment report
http://slidepdf.com/reader/full/statewide-seismic-needs-assessment-report 196/341
FEMA 154 List of Figures xvii
Figure E-21 Concrete shear wall on building exterior. ..............................................................................108
Figure E-22 Close-up of exterior shear wall damage during a major earthquake......................................108
Figure E-23 Drawing of steel frame with URM infill................................................................................109
Figure E-24 Example of steel frame with URM infill walls (S5). .............................................................110
Figure E-25 Drawing of concrete moment-resisting frame building .........................................................111
Figure E-26 Extreme example of ductility in concrete, 1994 Northridge earthquake. ..............................111
Figure E-27 Example of ductile reinforced concrete column, 1994 Northridge earthquake; horizontalties would need to be closer for greater demands. .................................................................112
Figure E-28 Concrete moment-resisting frame building (C1) with exposed concrete, deep beams,wide columns (and with architectural window framing) .......................................................112
Figure E-29 Locations of failures at beam-to-column joints in nonductile frames, 1994 Northridgeearthquake..............................................................................................................................113
Figure E-30 Drawing of concrete shear-wall building...............................................................................114
Figure E-31 Tall concrete shear-wall building: walls connected by damaged spandrel beams................115
Figure E-32 Shear-wall damage, 1989 Loma Prieta earthquake................................................................115
Figure E-33 Concrete frame with URM infill............................................................................................115
Figure E-34 Blow-up (lower photo) of distant view of C3 building (upper photo) showing concreteframe with URM infill (left wall), and face brick (right wall)...............................................115
Figure E-35 Drawing of tilt-up construction typical of the western United States. Tilt-up
construction in the eastern United States may incorporate a steel frame...............................116
Figure E-36 Tilt-up industrial building, 1970s. .........................................................................................117
Figure E-37 Tilt-up industrial building, mid- to late 1980s.......................................................................117
Figure E-38 Tilt-up construction anchorage failure...................................................................................117
Figure E-39 Result of failure of the roof beam anchorage to the wall in tilt-up building..........................117
Figure E-40 Newly installed anchorage of roof beam to wall in tilt-up building. .....................................118
Figure E-41 Drawing of precast concrete frame building..........................................................................119
Figure E-42 Typical precast column cover on a steel or concrete moment frame. ....................................120
Figure E-43 Exposed precast double-T sections and overlapping beams are indicative of precast frames ........................................................................................................................120
Figure E-44 Example of precast double-T section during installation.......................................................120
8/3/2019 Statewide Seismic Needs Assessment report
http://slidepdf.com/reader/full/statewide-seismic-needs-assessment-report 197/341
xviii List of Figures FEMA 154
Figure E-45 Precast structural cross; installation joints are at sections where bending is minimumduring high seismic demand.................................................................................................. 120
Figure E-46 Modern reinforced brick masonry. ........................................................................................ 121
Figure E-47 Drawing of unreinforced masonry bearing-wall building, 2-story........................................ 122
Figure E-48 Drawing of unreinforced masonry bearing-wall building, 4-story........................................ 123
Figure E-49 Drawing of unreinforced masonry bearing-wall building, 6-story........................................ 124
Figure E-50 East coast URM bearing-wall building. ................................................................................ 124
Figure E-51 West coast URM bearing-wall building................................................................................ 124
Figure E-52 Drawings of typical window head features in URM bearing-wall buildings........................ 125
Figure E-53 Parapet failure leaving an uneven roof line, due to inadequate anchorage, 1989 LomaPrieta earthquake. .................................................................................................................. 126
Figure E-54 Damaged URM building, 1992 Big Bear earthquake............................................................ 126
Figure E-55 Upper: Two existing anchors above three new wall anchors at floor line usingdecorative washer plates. Lower: Rehabilitation techniques include closely spacedanchors at floor and roof levels. ............................................................................................ 127
Figure F-1 The separate tectonic plates comprising the earth’s crust superimposed on a map of the world................................................................................................................................ 129
Figure F-2 Seismicity of the conterminous United States 1977-1997. This reproduction showsearthquake locations without regard to magnitude or depth. The San Andreas fault andother plate boundaries are indicated with white lines............................................................ 131
Figure F-3 Seismicity of Alaska 1977 – 1997. The white line close to most of the earthquakes isthe plate boundary, on the ocean floor, between the Pacific and North America plates. ...... 132
Figure F-4 Seismicity of Hawaii 1977 – 1997. ...................................................................................... 132.
Figure F-5 Mid-rise building collapse, 1985 Mexico City earthquake. .................................................. 133
Figure F-6 Near-field effects, 1992 Landers earthquake, showing house (white arrow) close tosurface faulting (black arrow); the insert shows a house interior.......................................... 134
Figure F-7 Collapsed chimney with damaged roof, 1987 Whittier Narrows earthquake........................ 134
Figure F-8 House that slid off foundation, 1994 Northridge earthquake. ............................................... 135
Figure F-9 Collapsed cripple stud walls dropped this house to the ground, 1992 Landers and BigBear earthquakes. .................................................................................................................. 135
Figure F-10 This house has settled to the ground due to collapse of its post and pier foundation............ 135
Figure F-11 Collapse of unreinforced masonry bearing wall, 1933 Long Beach earthquake................... 135
Figure F-12 Collapse of a tilt-up bearing wall, 1994 Northridge earthquake. .......................................... 135
8/3/2019 Statewide Seismic Needs Assessment report
http://slidepdf.com/reader/full/statewide-seismic-needs-assessment-report 198/341
FEMA 154 List of Tables xix
List of Tables
Table 2-1 Regions of Seismicity with Corresponding Spectral Acceleration Response
(from FEMA 310)......................................................................................................................8
Table 2-2 Benchmark Years for RVS Procedure Building Types (from FEMA 310). ..............................9
Table 2-3 Checklist of Issues to be Considered During Pre-Field Work Review of the DataCollection Form .......................................................................................................................10
Table 2-4 Checklist of Field Equipment Needed for Rapid Visual Screening.........................................18
Table 3-1 Build Type Descriptions, Basic Structural Hazard Scores, and Performance in PastEarthquakes..............................................................................................................................26
Table 4-1 Matrix of Personnel and Material Resources Needed for Various FEMA 154 RVS
Applications.............................................................................................................................47
Table D-1 Photographs, Architectural Characteristics, and Age of Residential Buildings.......................86
Table D-2 Illustrations, Architectural Characteristics, and Age of Commercial Structures .....................87
Table D-3 Photographs, Architectural Characteristics, and Age of Miscellaneous Structures.................90
Table D-4 Most Likely Structural Types for Pre-1930 Buildings ............................................................92
Table D-5 Most Likely Structural Types for 1930-1945 Buildings..........................................................92
Table D-6 Most Likely Structural Types for 1945-1960 Buildings..........................................................93
Table D-7 Most Likely Structural Types for Post-1960 Buildings...........................................................93

8/3/2019 Statewide Seismic Needs Assessment report
http://slidepdf.com/reader/full/statewide-seismic-needs-assessment-report 199/341
8/3/2019 Statewide Seismic Needs Assessment report
http://slidepdf.com/reader/full/statewide-seismic-needs-assessment-report 200/341

8/3/2019 Statewide Seismic Needs Assessment report
http://slidepdf.com/reader/full/statewide-seismic-needs-assessment-report 201/341
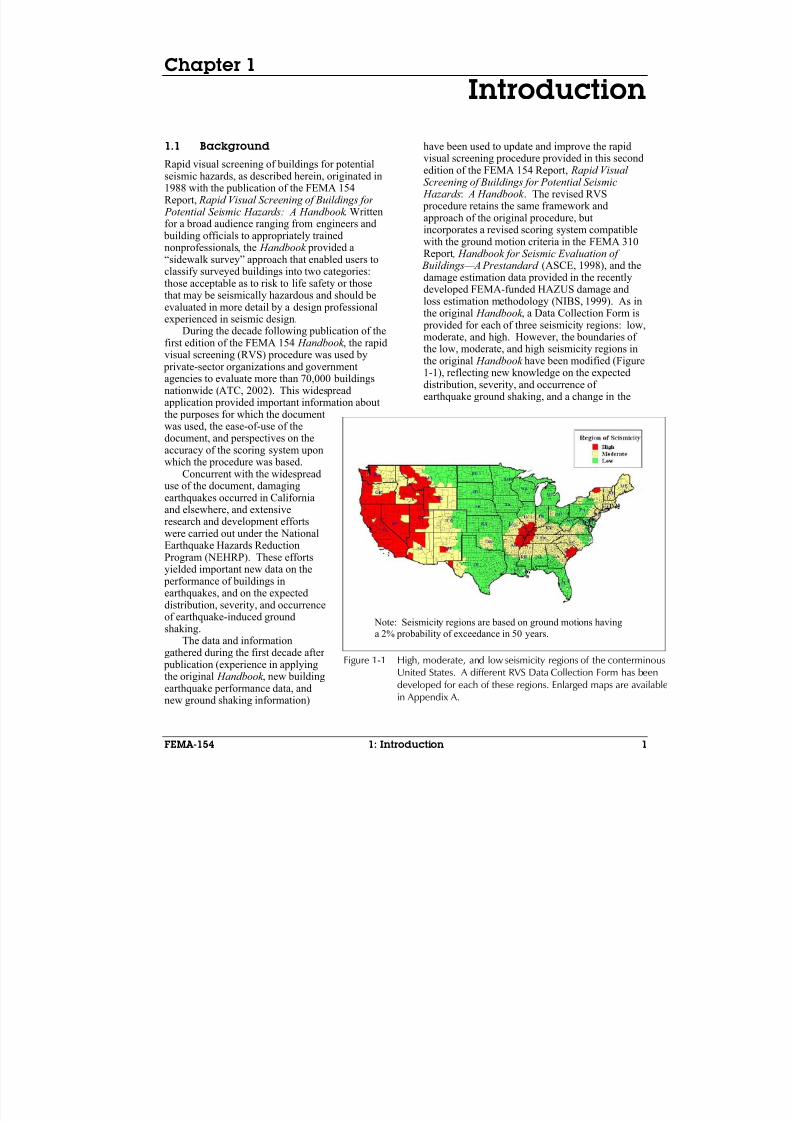
8/3/2019 Statewide Seismic Needs Assessment report
http://slidepdf.com/reader/full/statewide-seismic-needs-assessment-report 202/341
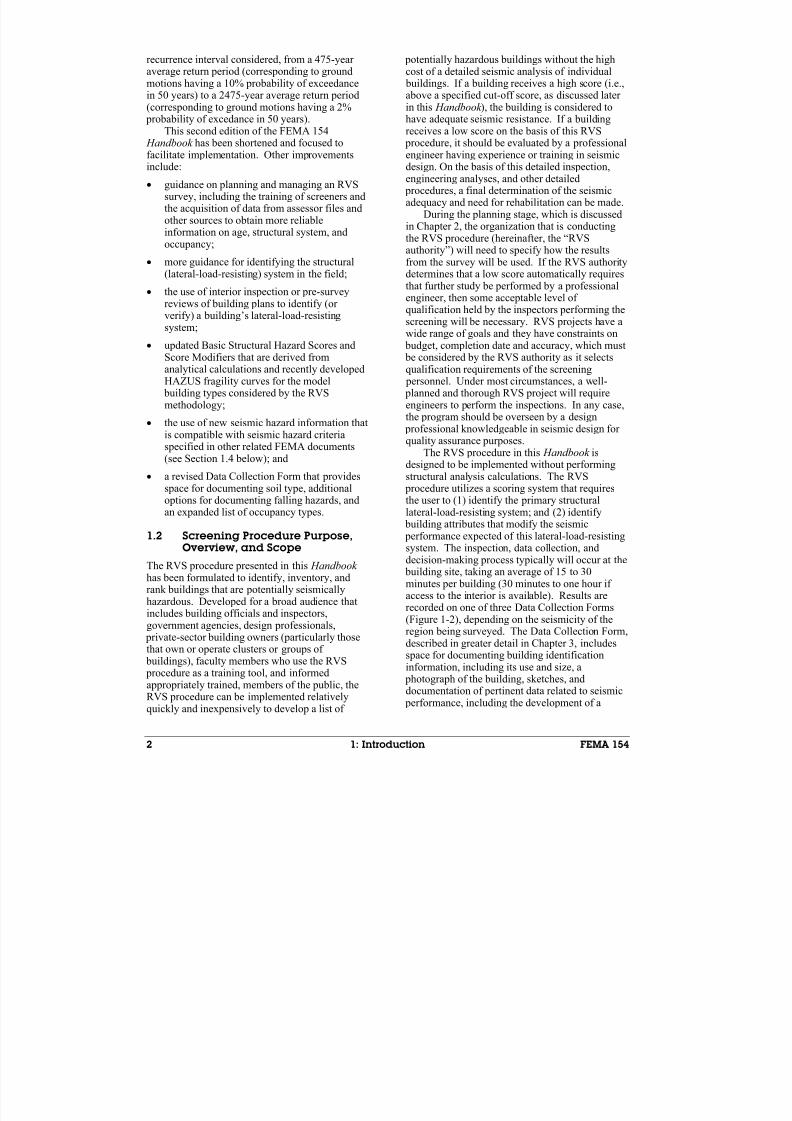
8/3/2019 Statewide Seismic Needs Assessment report
http://slidepdf.com/reader/full/statewide-seismic-needs-assessment-report 203/341
2 1: Introduction FEMA 154
recurrence interval considered, from a 475-year average return period (corresponding to groundmotions having a 10% probability of exceedancein 50 years) to a 2475-year average return period(corresponding to ground motions having a 2% probability of excedance in 50 years).
This second edition of the FEMA 154 Handbook has been shortened and focused to
facilitate implementation. Other improvementsinclude:
• guidance on planning and managing an RVSsurvey, including the training of screeners andthe acquisition of data from assessor files andother sources to obtain more reliableinformation on age, structural system, andoccupancy;
• more guidance for identifying the structural(lateral-load-resisting) system in the field;
• the use of interior inspection or pre-survey
reviews of building plans to identify (or verify) a building’s lateral-load-resistingsystem;
• updated Basic Structural Hazard Scores andScore Modifiers that are derived fromanalytical calculations and recently developedHAZUS fragility curves for the model building types considered by the RVSmethodology;
• the use of new seismic hazard information thatis compatible with seismic hazard criteriaspecified in other related FEMA documents(see Section 1.4 below); and
• a revised Data Collection Form that providesspace for documenting soil type, additionaloptions for documenting falling hazards, andan expanded list of occupancy types.
1.2 Screening Procedure Purpose,Overview, and Scope
The RVS procedure presented in this Handbook has been formulated to identify, inventory, andrank buildings that are potentially seismically
hazardous. Developed for a broad audience thatincludes building officials and inspectors,government agencies, design professionals, private-sector building owners (particularly thosethat own or operate clusters or groups of buildings), faculty members who use the RVS procedure as a training tool, and informedappropriately trained, members of the public, theRVS procedure can be implemented relativelyquickly and inexpensively to develop a list of
potentially hazardous buildings without the highcost of a detailed seismic analysis of individual buildings. If a building receives a high score (i.e.,above a specified cut-off score, as discussed later in this Handbook ), the building is considered tohave adequate seismic resistance. If a buildingreceives a low score on the basis of this RVS procedure, it should be evaluated by a professional
engineer having experience or training in seismicdesign. On the basis of this detailed inspection,engineering analyses, and other detailed procedures, a final determination of the seismicadequacy and need for rehabilitation can be made.
During the planning stage, which is discussedin Chapter 2, the organization that is conductingthe RVS procedure (hereinafter, the “RVSauthority”) will need to specify how the resultsfrom the survey will be used. If the RVS authoritydetermines that a low score automatically requiresthat further study be performed by a professional
engineer, then some acceptable level of qualification held by the inspectors performing thescreening will be necessary. RVS projects have awide range of goals and they have constraints on budget, completion date and accuracy, which must be considered by the RVS authority as it selectsqualification requirements of the screening personnel. Under most circumstances, a well- planned and thorough RVS project will requireengineers to perform the inspections. In any case,the program should be overseen by a design professional knowledgeable in seismic design for quality assurance purposes.
The RVS procedure in this Handbook isdesigned to be implemented without performingstructural analysis calculations. The RVS procedure utilizes a scoring system that requiresthe user to (1) identify the primary structurallateral-load-resisting system; and (2) identify building attributes that modify the seismic performance expected of this lateral-load-resistingsystem. The inspection, data collection, anddecision-making process typically will occur at the building site, taking an average of 15 to 30minutes per building (30 minutes to one hour if access to the interior is available). Results are
recorded on one of three Data Collection Forms(Figure 1-2), depending on the seismicity of theregion being surveyed. The Data Collection Form,described in greater detail in Chapter 3, includesspace for documenting building identificationinformation, including its use and size, a photograph of the building, sketches, anddocumentation of pertinent data related to seismic performance, including the development of a

8/3/2019 Statewide Seismic Needs Assessment report
http://slidepdf.com/reader/full/statewide-seismic-needs-assessment-report 204/341
FEMA 154 1: Introduction 3
numeric seismic hazard score.The scores are based on averageexpected ground shaking levels for the seismicity region as well as theseismic design and construction practices for that region1.Buildings may be reviewed fromthe sidewalk without the benefit of
building entry, structuraldrawings, or structuralcalculations. Reliability andconfidence in building attributedetermination are increased,however, if the structural framingsystem can be verified duringinterior inspection, or on the basisof a review of constructiondocuments.
The RVS procedure isintended to be applicable
nationwide, for all conventional building types. Bridges, largetowers, and other non-buildingstructure types, however, are notcovered by the procedure. Due to budget or other constraints, someRVS authorities may wish torestrict their RVS to identifying building types that they consider the most hazardous, such asunreinforced masonry or nonductile concrete buildings.However, it is recommended, at
least initially, that all conventional building types be considered, andthat elimination of certain buildingtypes from the screening be welldocumented and supported withoffice calculations and fieldsurvey data that justify their elimination. It is possible that, in some cases,even buildings designed to modern codes, such asthose with configurations that induce extremetorsional response and those with abrupt changesin stiffness, may be potentially hazardous.
1 Seismic design and construction practices vary byseismicity region, with little or no seismic designrequirements in low seismicity regions, moderateseismic design requirements in moderate seismicityregions, and extensive seismic design requirements inhigh seismicity regions. The requirements also varywith time, and are routinely updated to reflect newknowledge about building seismic performance.
1.3 Companion FEMA 155 Report
A companion volume to this report, Rapid Visual Screening of Buildings for Potential Seismic Hazards: Supporting Documentation (second edition) (FEMA 155) documents the technical
basis for the RVS procedure described in this Handbook , including the method for calculatingthe Basic Structural Scores and Score Modifiers.The FEMA 155 report (ATC, 2002) alsosummarizes other information considered duringdevelopment of this Handbook , including theefforts to solicit user feedback and a FEMA 154Users Workshop held in September 2000. TheFEMA 155 document is available from FEMA by
Figure 1-2 Data Collection Forms for the three designatedseismicity regions (low, moderate, and high).
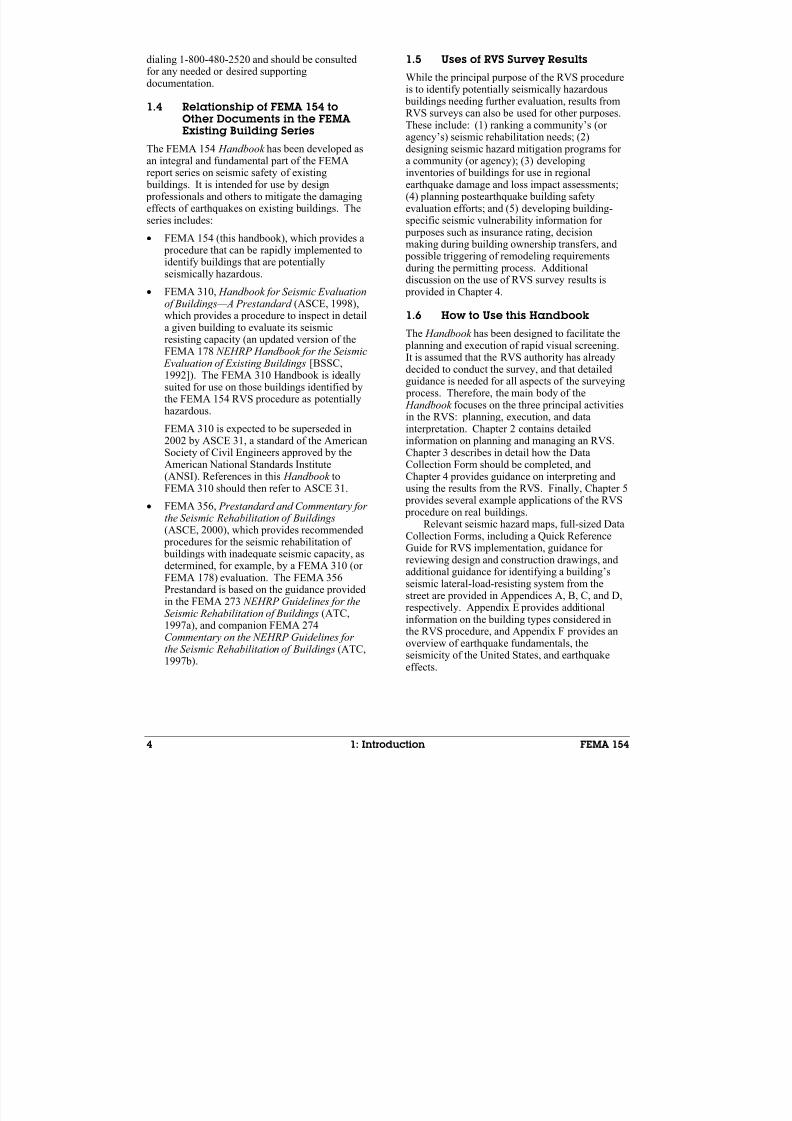
8/3/2019 Statewide Seismic Needs Assessment report
http://slidepdf.com/reader/full/statewide-seismic-needs-assessment-report 205/341
4 1: Introduction FEMA 154
dialing 1-800-480-2520 and should be consultedfor any needed or desired supportingdocumentation.
1.4 Relationship of FEMA 154 toOther Documents in the FEMA Existing Building Series
The FEMA 154 Handbook has been developed asan integral and fundamental part of the FEMAreport series on seismic safety of existing buildings. It is intended for use by design professionals and others to mitigate the damagingeffects of earthquakes on existing buildings. Theseries includes:
• FEMA 154 (this handbook), which provides a procedure that can be rapidly implemented toidentify buildings that are potentiallyseismically hazardous.
• FEMA 310, Handbook for Seismic Evaluation
of Buildings—A Prestandard (ASCE, 1998),which provides a procedure to inspect in detaila given building to evaluate its seismicresisting capacity (an updated version of theFEMA 178 NEHRP Handbook for the Seismic Evaluation of Existing Buildings [BSSC,1992]). The FEMA 310 Handbook is ideallysuited for use on those buildings identified bythe FEMA 154 RVS procedure as potentiallyhazardous.
FEMA 310 is expected to be superseded in2002 by ASCE 31, a standard of the American
Society of Civil Engineers approved by theAmerican National Standards Institute(ANSI). References in this Handbook toFEMA 310 should then refer to ASCE 31.
• FEMA 356, Prestandard and Commentary for the Seismic Rehabilitation of Buildings (ASCE, 2000), which provides recommended procedures for the seismic rehabilitation of buildings with inadequate seismic capacity, asdetermined, for example, by a FEMA 310 (or FEMA 178) evaluation. The FEMA 356Prestandard is based on the guidance provided
in the FEMA 273 NEHRP Guidelines for theSeismic Rehabilitation of Buildings (ATC,1997a), and companion FEMA 274Commentary on the NEHRP Guidelines for the Seismic Rehabilitation of Buildings (ATC,1997b).
1.5 Uses of RVS Survey Results
While the principal purpose of the RVS procedureis to identify potentially seismically hazardous buildings needing further evaluation, results fromRVS surveys can also be used for other purposes.These include: (1) ranking a community’s (or agency’s) seismic rehabilitation needs; (2)
designing seismic hazard mitigation programs for a community (or agency); (3) developinginventories of buildings for use in regionalearthquake damage and loss impact assessments;(4) planning postearthquake building safetyevaluation efforts; and (5) developing building-specific seismic vulnerability information for purposes such as insurance rating, decisionmaking during building ownership transfers, and possible triggering of remodeling requirementsduring the permitting process. Additionaldiscussion on the use of RVS survey results is provided in Chapter 4.
1.6 How to Use this Handbook
The Handbook has been designed to facilitate the planning and execution of rapid visual screening.It is assumed that the RVS authority has alreadydecided to conduct the survey, and that detailedguidance is needed for all aspects of the surveying process. Therefore, the main body of the Handbook focuses on the three principal activitiesin the RVS: planning, execution, and datainterpretation. Chapter 2 contains detailedinformation on planning and managing an RVS.
Chapter 3 describes in detail how the DataCollection Form should be completed, andChapter 4 provides guidance on interpreting andusing the results from the RVS. Finally, Chapter 5 provides several example applications of the RVS procedure on real buildings.
Relevant seismic hazard maps, full-sized DataCollection Forms, including a Quick ReferenceGuide for RVS implementation, guidance for reviewing design and construction drawings, andadditional guidance for identifying a building’sseismic lateral-load-resisting system from thestreet are provided in Appendices A, B, C, and D,
respectively. Appendix E provides additionalinformation on the building types considered inthe RVS procedure, and Appendix F provides anoverview of earthquake fundamentals, theseismicity of the United States, and earthquakeeffects.

8/3/2019 Statewide Seismic Needs Assessment report
http://slidepdf.com/reader/full/statewide-seismic-needs-assessment-report 206/341
FEMA 154 2: Planning and Managing Rapid Visual Screening 5
Chapter 2
Planning and ManagingRapid Visual Screening
Once the decision to conduct rapid visualscreening (RVS) for a community or group of buildings has been made by the RVS authority, thescreening effort can be expedited by pre-planningand careful overall management of the process. This chapter describes the overallscreening implementation sequence and provides detailed information on important pre-planning and management aspects.Instructions on how to complete the Data
Collection Form are provided in Chapter 3.
2.1 Screening ImplementationSequence
There are several steps involved in planning and performing an RVS of potentially seismically hazardous buildings.As a first step, if it is to be a public or community project, the local governing body and local building officials shouldformally approve of the general procedure.Second, the public or the members of the
community should be informed about the purpose of the screening process and how itwill be carried out. There are also other decisions to be made, such as use of thescreening results, responsibilities of the building owners and the community, andactions to be taken. Some of thesedecisions are specific to each communityand therefore are not discussed in this Handbook .
The general sequence of implementingthe RVS procedure is depicted in Figure2-1. The implementation sequence
includes:
• Budget development and costestimation, recognizing the expectedextent of the screening and further useof the gathered data;
• Pre-field planning, including selectionof the area to be surveyed,identification of building types to be
screened, selection and development of arecord-keeping system, and compilation anddevelopment of maps that document localseismic hazard information;
Figure 2-1 Rapid visual screening implementation sequence.
Pre-plan field survey andidentify the area to be
screened
Acquire and reviewpre-field data,
including existingbuilding files,
databases, and soiltypes for the
surveyed area
Choose your screeners, train
them and make assignments
If you have access
to the interior, verify
construction type
and plan
irregularities
Review existing
construction
drawings, if
available to verify
age, size,construction type,
and irregularities
Photograph the building with
instant or digital camera
Screen the building
from the exterior on
all available sides;
sketch the plan and
elevation
Select and reviewData Collection
Form
Develop budget
and cost estimate
Check for quality andfile the fielddata in the
record keepingsystem
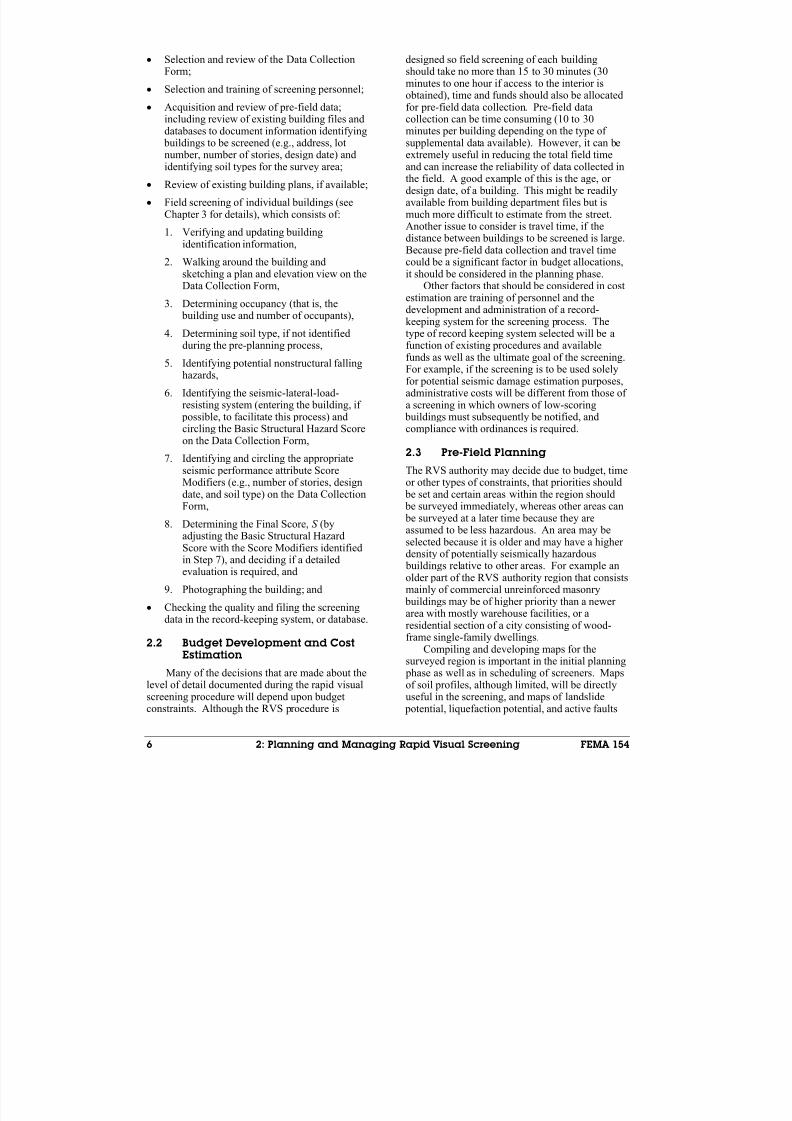
8/3/2019 Statewide Seismic Needs Assessment report
http://slidepdf.com/reader/full/statewide-seismic-needs-assessment-report 207/341
6 2: Planning and Managing Rapid Visual Screening FEMA 154
• Selection and review of the Data CollectionForm;
• Selection and training of screening personnel;
• Acquisition and review of pre-field data;including review of existing building files anddatabases to document information identifying buildings to be screened (e.g., address, lot
number, number of stories, design date) andidentifying soil types for the survey area;
• Review of existing building plans, if available;
• Field screening of individual buildings (seeChapter 3 for details), which consists of:
1. Verifying and updating buildingidentification information,
2. Walking around the building andsketching a plan and elevation view on theData Collection Form,
3. Determining occupancy (that is, the building use and number of occupants),
4. Determining soil type, if not identifiedduring the pre-planning process,
5. Identifying potential nonstructural fallinghazards,
6. Identifying the seismic-lateral-load-resisting system (entering the building, if possible, to facilitate this process) andcircling the Basic Structural Hazard Scoreon the Data Collection Form,
7. Identifying and circling the appropriateseismic performance attribute ScoreModifiers (e.g., number of stories, designdate, and soil type) on the Data CollectionForm,
8. Determining the Final Score, S (byadjusting the Basic Structural HazardScore with the Score Modifiers identifiedin Step 7), and deciding if a detailedevaluation is required, and
9. Photographing the building; and
• Checking the quality and filing the screeningdata in the record-keeping system, or database.
2.2 Budget Development and CostEstimation
Many of the decisions that are made about thelevel of detail documented during the rapid visualscreening procedure will depend upon budgetconstraints. Although the RVS procedure is
designed so field screening of each buildingshould take no more than 15 to 30 minutes (30minutes to one hour if access to the interior isobtained), time and funds should also be allocatedfor pre-field data collection. Pre-field datacollection can be time consuming (10 to 30minutes per building depending on the type of supplemental data available). However, it can be
extremely useful in reducing the total field timeand can increase the reliability of data collected inthe field. A good example of this is the age, or design date, of a building. This might be readilyavailable from building department files but ismuch more difficult to estimate from the street.Another issue to consider is travel time, if thedistance between buildings to be screened is large.Because pre-field data collection and travel timecould be a significant factor in budget allocations,it should be considered in the planning phase.
Other factors that should be considered in cost
estimation are training of personnel and thedevelopment and administration of a record-keeping system for the screening process. Thetype of record keeping system selected will be afunction of existing procedures and availablefunds as well as the ultimate goal of the screening.For example, if the screening is to be used solelyfor potential seismic damage estimation purposes,administrative costs will be different from those of a screening in which owners of low-scoring buildings must subsequently be notified, andcompliance with ordinances is required.
2.3 Pre-Field PlanningThe RVS authority may decide due to budget, timeor other types of constraints, that priorities should be set and certain areas within the region should be surveyed immediately, whereas other areas can be surveyed at a later time because they areassumed to be less hazardous. An area may beselected because it is older and may have a higher density of potentially seismically hazardous buildings relative to other areas. For example anolder part of the RVS authority region that consistsmainly of commercial unreinforced masonry
buildings may be of higher priority than a newer area with mostly warehouse facilities, or aresidential section of a city consisting of wood-frame single-family dwellings.
Compiling and developing maps for thesurveyed region is important in the initial planning phase as well as in scheduling of screeners. Mapsof soil profiles, although limited, will be directlyuseful in the screening, and maps of landslide potential, liquefaction potential, and active faults

8/3/2019 Statewide Seismic Needs Assessment report
http://slidepdf.com/reader/full/statewide-seismic-needs-assessment-report 208/341
FEMA 154 2: Planning and Managing Rapid Visual Screening 7
provide useful background information about therelative hazard in different areas. Maps of lotswill be useful in scheduling screeners and, as dataare collected, in identifying areas with largenumbers of potentially hazardous buildings.
Another important phase of pre-field planningis interaction with the local design profession and building officials. Discussions should include
verification of when certain aspects of seismicdesign and detailing were adopted and enforced.This will be used in adjusting the scoring systemfor local practices and specifying benchmark years.
The record-keeping system will vary amongRVS authorities, depending on needs, goals, budgets and other constraints, and may in factconsist of several systems. Part of this planning phase may include deciding how buildings are to be identified. Some suggestions are street address,assessor’s parcel number, census tract, and lot
number or owner. Consideration should be givento developing a computerized database containinglocation and other building information, whichcould easily be used to generate peel-off labelsfor the Data Collection Form, or to generateforms that incorporate unique information for each building.
The advantage of using a computerizedrecord generation and collection system is thatgraphical data, such as sketches and photographs, are increasingly more easilyconverted to digital form and stored on thecomputer, especially if they are collected in
digital format in the field. This can befacilitated through the use of personal digitalassistants (PDAs), which would require thedevelopment of a FEMA 154 application, andthe use of digital cameras.
If a computerized database is not used,microfilm is a good storage medium for original hard copy, because photographs, building plans, screening forms and subsequentfollow-up documentation can be kept together and easily copied. Another method that has been used is to generate a separate hard-copyfile for each building as it is screened. In fact,
the screening form can be reproduced on alarge envelope and all supporting material and photographs stored inside. This solves any problems associated with attaching multiplesketches and photographs, but the files growrapidly and may become unmanageable.
2.4 Selection and Review of theData Collection Form
There are three Data Collection Forms, one for each of the following three regions of seismicity:low (L), moderate (M), and high (H). Full-sizedversions of each form are provided in Appendix B,along with a Quick Reference Guide that contains
definitions and explanations for terms used on theData Collection Form. Each Data Collection Form(see example, Figure 2-2) provides space torecord the building identification information,draw a sketch of the building (plan andelevation views), attach a photograph of the building, indicate the occupancy, indicate the soiltype, document the existence of falling hazards,develop a Final Structural Score, S , for the building, indicate if a detailed evaluation isrequired, and provide additional comments. Thestructural scoring system consists of a matrix of Basic Structural Hazard Scores (one for each
building type and its associated seismic lateral-force-resisting system) and Score Modifiers to
Figure 2-2 Example RVS Data Collection Form (highseismicity).

8/3/2019 Statewide Seismic Needs Assessment report
http://slidepdf.com/reader/full/statewide-seismic-needs-assessment-report 209/341
8 2: Planning and Managing Rapid Visual Screening FEMA 154
account for observed attributes that modifyseismic performance. The Basic Structural HazardScores and Score Modifiers are based on (1)design and construction practices in the region, (2)attributes known to decrease or increase seismicresistance capacity, and (3) maximum consideredground motions for the seismicity region under consideration. The Basic Structural Hazard Score,
Score Modifiers, and Final Structural Score, S , allrelate to the probability of building collapse,should the maximum ground motions considered by the RVS procedure occur at the site. Final S scores typically range from 0 to 7, with higher S scores corresponding to better seismic performance.
The maximum ground motions considered inthe scoring system of the RVS procedure areconsistent with those specified for detailed building seismic evaluation in the FEMA 310Report, Handbook for the Seismic Evaluation of
Buildings—A Prestandard . Such ground motionsgenerally have a 2% chance of being exceeded in50 years, and are multiplied by a 2/3 factor in theFEMA 310 evaluation procedures and in thedesign requirements for new buildings in FEMA302, Recommended Provisions for Seismic Regulations for New Buildings and Other Structures (BSSC, 1997). (Ground motions havinga 2% probability of being exceeded in 50 years arecommonly referred to as the maximum consideredearthquake (MCE) ground motions.)
2.4.1 Determination of Seismicity Region
To select the appropriate Data Collection Form,it is first necessary to determine the seismicityregion in which the area to be screened is located.The seismicity region (H, M, or L) for the screeningarea can be determined by one of two methods:
1. Find the location of the surveyed region on theseismicity map of Figure 1-1, or one of theenlarged seismicity maps provided in AppendixA, and identify the corresponding seismicityregion, or;
2. Access the U.S. Geological Survey web page
(http://geohazards.cr.usgs.gov/eq/), select“Hazard by Zip Code” or “Hazard by Lat/Long”under the “Seismic Hazard” heading, enter theappropriate values of zip code or latitude andlongitude, select the spectral acceleration value(SA) for a period of 0.2 seconds and the SAvalue for a period of 1.0 second, multiply the SAvalues by 2/3, and use the criteria of Table 2-1 toselect the appropriate seismicity region,assuming that the highest seismicity level
defined by the parameters in Table 2-1 shallgovern.
Use more recent additions of these maps whenthey become available.
The web site approach of Method 2, which usesseismicity region definitions used in other recentlydeveloped FEMA documents, is preferred as it
enables the user to determine seismicity based on amore precisely specified location. In contrast, eachcounty shown in Figure 1-1 is assigned its seismicityon the basis of the highest seismicity in that county,even though it may only apply to a small portion of the county.
Table 2-1 Regions of Seismicity withCorresponding Spectral AccelerationResponse (from FEMA 310)
Region of
Seismicity
Spectral AccelerationResponse, SA (short-
period, or 0.2 sec)
Spectral AccelerationResponse, SA (long-
period or 1.0 sec)
Low less than 0.167 g (inhorizontal direction)
less than 0.067 g (inhorizontal direction)
Moderate greater than or equalto 0.167 g but lessthan 0.500 g (inhorizontal direction)
greater than or equalto 0.067 g but lessthan 0.200 g (inhorizontal direction)
High greater than or equalto 0.500 g (inhorizontal direction)
greater than or equalto 0.200 g (inhorizontal direction)
Notes: g = acceleration of gravity
2.4.2 Determination of Key Seismic Code
Adoption Dates and Other
Considerations
The Data Collection Form is meant to be a
model that may be adopted and used as it is
presented in this Handbook . The form may also bemodified according to the needs of the RVSauthority. Therefore, another aspect of thescreening planning process is to review the DataCollection Form to determine if all required data
are represented or if modifications should be madeto reflect the needs and special circumstances of the authority. For example, an RVS authority maychoose to define additional occupancy classes suchas “parking structure” or “multi-familyresidential.”
One of the key issues that must be addressedin the planning process is the determination of (1)the year in which seismic codes were initially
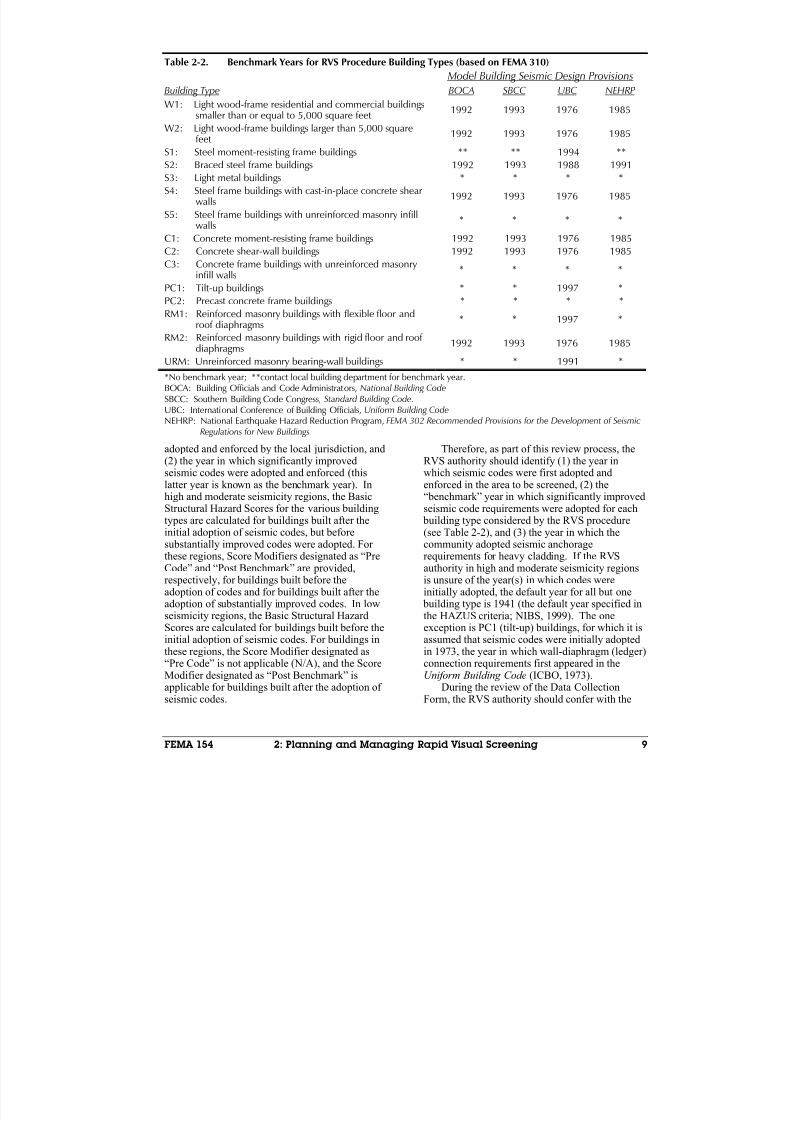
8/3/2019 Statewide Seismic Needs Assessment report
http://slidepdf.com/reader/full/statewide-seismic-needs-assessment-report 210/341
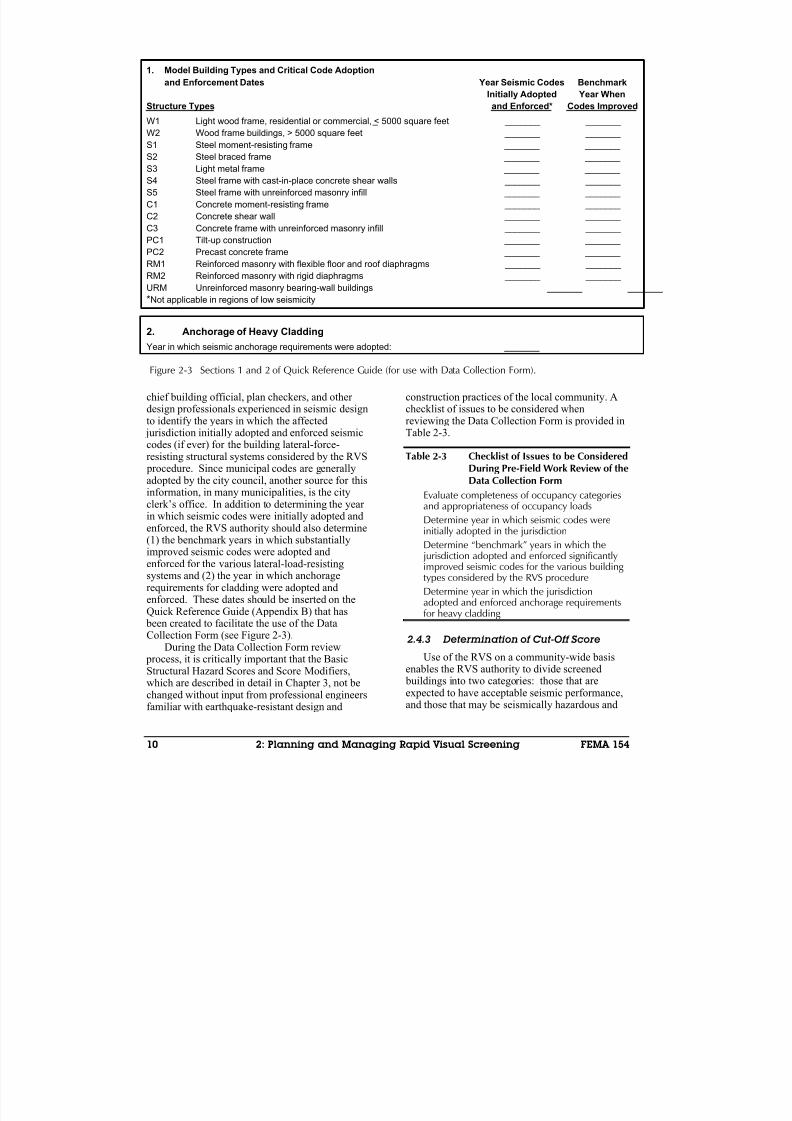
8/3/2019 Statewide Seismic Needs Assessment report
http://slidepdf.com/reader/full/statewide-seismic-needs-assessment-report 211/341
10 2: Planning and Managing Rapid Visual Screening FEMA 154
1. Model Building Types and Critical Code Adoption
and Enforcement Dates Year Seismic Codes Benchmark
Initially Adopted Year When
Structure Types and Enforced* Codes Improved
W1 Light wood frame, residential or commercial, < 5000 square feet _______ _______
W2 Wood frame buildings, > 5000 square feet _______ _______
S1 Steel moment-resisting frame _______ _______
S2 Steel braced frame _______ _______
S3 Light metal frame _______ _______
S4 Steel frame with cast-in-place concrete shear walls _______ _______
S5 Steel frame with unreinforced masonry infill _______ _______
C1 Concrete moment-resisting frame _______ _______
C2 Concrete shear wall _______ _______
C3 Concrete frame with unreinforced masonry infill _______ _______
PC1 Tilt-up construction _______ _______
PC2 Precast concrete frame _______ _______
RM1 Reinforced masonry with flexible floor and roof diaphragms _______ _______
RM2 Reinforced masonry with rigid diaphragms _______ _______
URM Unreinforced masonry bearing-wall buildings _______ _______
*Not applicable in regions of low seismicity
2. Anchorage of Heavy Cladding
Year in which seismic anchorage requirements were adopted: _______
chief building official, plan checkers, and other design professionals experienced in seismic designto identify the years in which the affected jurisdiction initially adopted and enforced seismiccodes (if ever) for the building lateral-force-
resisting structural systems considered by the RVS procedure. Since municipal codes are generallyadopted by the city council, another source for thisinformation, in many municipalities, is the cityclerk’s office. In addition to determining the year in which seismic codes were initially adopted andenforced, the RVS authority should also determine(1) the benchmark years in which substantiallyimproved seismic codes were adopted andenforced for the various lateral-load-resistingsystems and (2) the year in which anchoragerequirements for cladding were adopted andenforced. These dates should be inserted on theQuick Reference Guide (Appendix B) that has been created to facilitate the use of the DataCollection Form (see Figure 2-3).
During the Data Collection Form review process, it is critically important that the BasicStructural Hazard Scores and Score Modifiers,which are described in detail in Chapter 3, not bechanged without input from professional engineersfamiliar with earthquake-resistant design and
construction practices of the local community. Achecklist of issues to be considered whenreviewing the Data Collection Form is provided inTable 2-3.
Table 2-3 Checklist of Issues to be ConsideredDuring Pre-Field Work Review of theData Collection Form
Evaluate completeness of occupancy categoriesand appropriateness of occupancy loads
Determine year in which seismic codes wereinitially adopted in the jurisdiction
Determine “benchmark” years in which the jurisdiction adopted and enforced significantlyimproved seismic codes for the various building types considered by the RVS procedure
Determine year in which the jurisdiction
adopted and enforced anchorage requirementsfor heavy cladding
2.4.3 Determination of Cut-Off Score
Use of the RVS on a community-wide basisenables the RVS authority to divide screened buildings into two categories: those that areexpected to have acceptable seismic performance,and those that may be seismically hazardous and
Figure 2-3 Sections 1 and 2 of Quick Reference Guide (for use with Data Collection Form).

8/3/2019 Statewide Seismic Needs Assessment report
http://slidepdf.com/reader/full/statewide-seismic-needs-assessment-report 212/341
FEMA 154 2: Planning and Managing Rapid Visual Screening 11
should be studied further. This requires that theRVS authority determine, preferably as part of the pre-planning process, an appropriate “cut-off”score.
An S score of 2 is suggested as a “cut-off”, based on present seismic design criteria. Usingthis cut-off level, buildings having an S score of 2or less should be investigated by a design
professional experienced in seismic design (seeSection 3.9, 4.1 and 4.2 for additional informationon this issue).
2.5 Qualifications and Training forScreeners
It is anticipated that a training program will berequired to ensure a consistent, high quality of thedata and uniformity of decisions among screeners.Training should include discussions of lateral-force-resisting systems and how they behave whensubjected to seismic loads, hw to use the Data
Collection Form, what to look for in the field, andhow to account for uncertainty. In conjunctionwith a professional engineer experienced inseismic design, screeners should simultaneouslyconsider and score buildings of several differenttypes and compare results. This will serve as a“calibration” for the screeners.
This process can easily be accomplished in aclassroom setting with photographs of actual buildings to use as examples. Prospectivescreeners review the photographs and perform theRVS procedure as though they were on thesidewalk. Upon completion, the class discussesthe results and students can compare how they didin relation to the rest of the class.
2.6 Acquisition and Review of Pre-Field Data
Information on the structural system, age or occupancy (that is, use) may be available fromsupplemental sources. These data, from assessor and building department files, insurance (Sanborn)maps, and previous studies, should be reviewedand collated for a given area before commencingthe field survey for that area. It is recommended
that this supplemental information either bewritten directly on the Data Collection Forms as itis retrieved or be entered into a computerizeddatabase. The advantage of a database is thatselected information can be printed in a reportformat that can be taken into the field, or printedonto peel-off labels that can be affixed to the DataCollection Form (see Figure 2-4). In addition,screening data can be added to the databases and
used to generate maps and reports. Some sourcesof supplemental information are described inSections 2.6.1 through 2.6.5.
2.6.1 Assessor’s Files
Although assessor’s files may contain informationabout the age of the building, the floor area andthe number of stories, most information relates toownership and assessed value of the land andimprovements, and thus is of relatively little valuefor RVS purposes. The construction typeindicated is often incorrect and in most casesshould not be used. In addition, the age of a
building retrieved from assessor’s files may not,and most likely is not, the year that the structurewas built. Usually assessor’s files contain the year that the building was first eligible for taxation.Because the criteria for this may vary, the datemay be several years after the building wasdesigned or constructed. If no other source of information is available this will give a goodestimate of the period during which the building
Figure 2-4 Building identification portion of RVSData Collection Form.
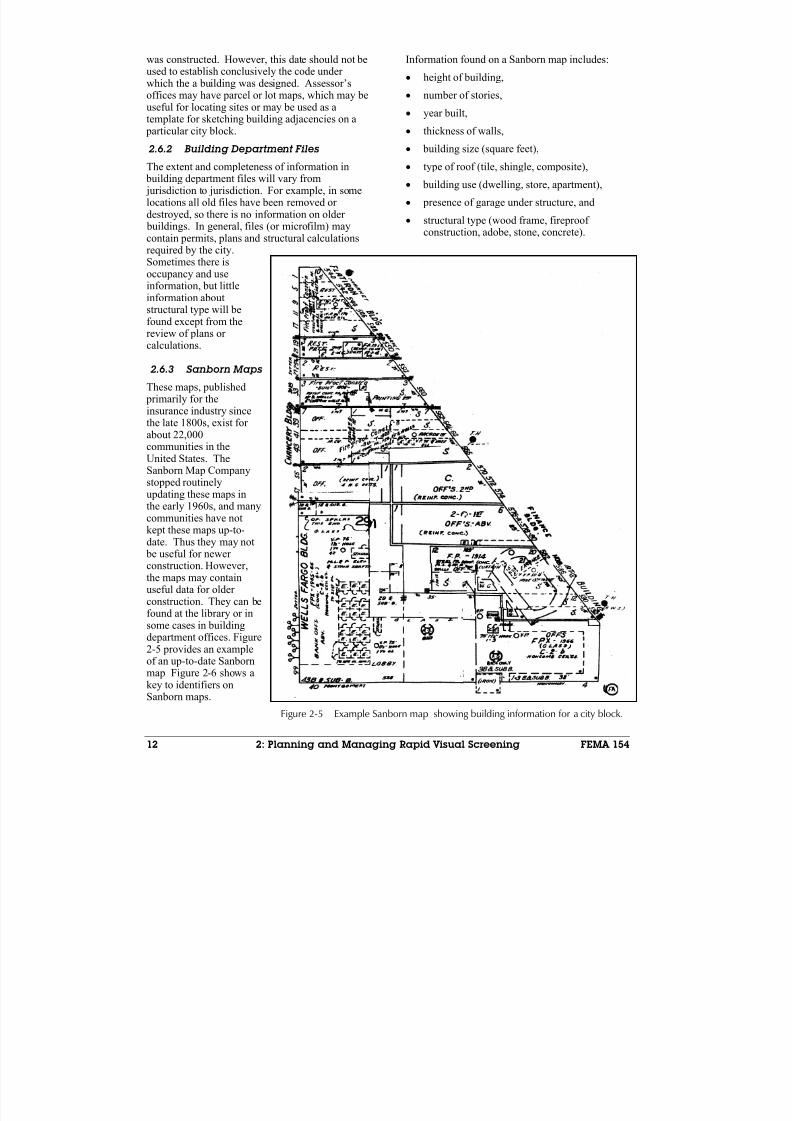
8/3/2019 Statewide Seismic Needs Assessment report
http://slidepdf.com/reader/full/statewide-seismic-needs-assessment-report 213/341
12 2: Planning and Managing Rapid Visual Screening FEMA 154
was constructed. However, this date should not beused to establish conclusively the code under which the a building was designed. Assessor’soffices may have parcel or lot maps, which may beuseful for locating sites or may be used as atemplate for sketching building adjacencies on a particular city block.
2.6.2 Building Department FilesThe extent and completeness of information in building department files will vary from jurisdiction to jurisdiction. For example, in somelocations all old files have been removed or destroyed, so there is no information on older buildings. In general, files (or microfilm) maycontain permits, plans and structural calculationsrequired by the city.Sometimes there isoccupancy and useinformation, but little
information aboutstructural type will befound except from thereview of plans or calculations.
2.6.3 Sanborn Maps
These maps, published primarily for theinsurance industry sincethe late 1800s, exist for about 22,000communities in theUnited States. TheSanborn Map Companystopped routinelyupdating these maps inthe early 1960s, and manycommunities have notkept these maps up-to-date. Thus they may not be useful for newer construction. However,the maps may containuseful data for older
construction. They can befound at the library or insome cases in buildingdepartment offices. Figure2-5 provides an exampleof an up-to-date Sanbornmap Figure 2-6 shows akey to identifiers onSanborn maps.
Information found on a Sanborn map includes:
• height of building,
• number of stories,
• year built,
• thickness of walls,
• building size (square feet),• type of roof (tile, shingle, composite),
• building use (dwelling, store, apartment),
• presence of garage under structure, and
• structural type (wood frame, fireproof construction, adobe, stone, concrete).
Figure 2-5 Example Sanborn map showing building information for a city block.
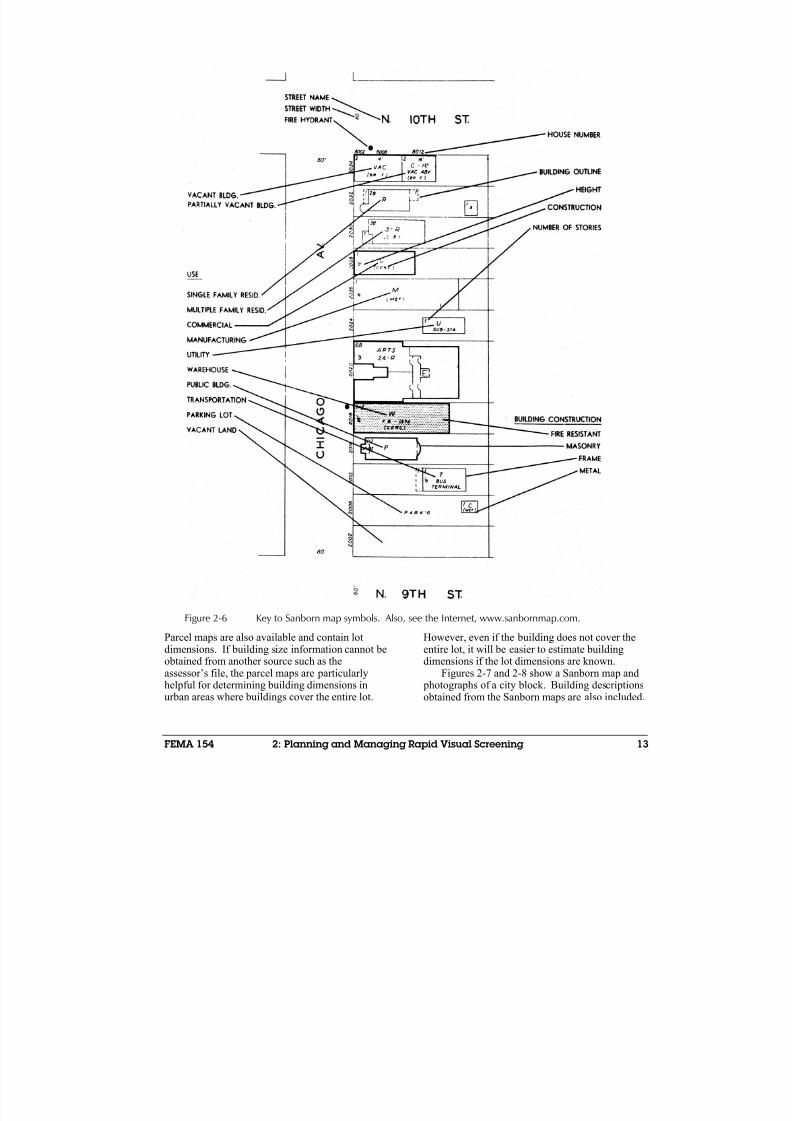
8/3/2019 Statewide Seismic Needs Assessment report
http://slidepdf.com/reader/full/statewide-seismic-needs-assessment-report 214/341
FEMA 154 2: Planning and Managing Rapid Visual Screening 13
Parcel maps are also available and contain lotdimensions. If building size information cannot beobtained from another source such as theassessor’s file, the parcel maps are particularlyhelpful for determining building dimensions inurban areas where buildings cover the entire lot.
However, even if the building does not cover theentire lot, it will be easier to estimate buildingdimensions if the lot dimensions are known.
Figures 2-7 and 2-8 show a Sanborn map and photographs of a city block. Building descriptionsobtained from the Sanborn maps are also included.
Figure 2-6 Key to Sanborn map symbols. Also, see the Internet, www.sanbornmap.com.
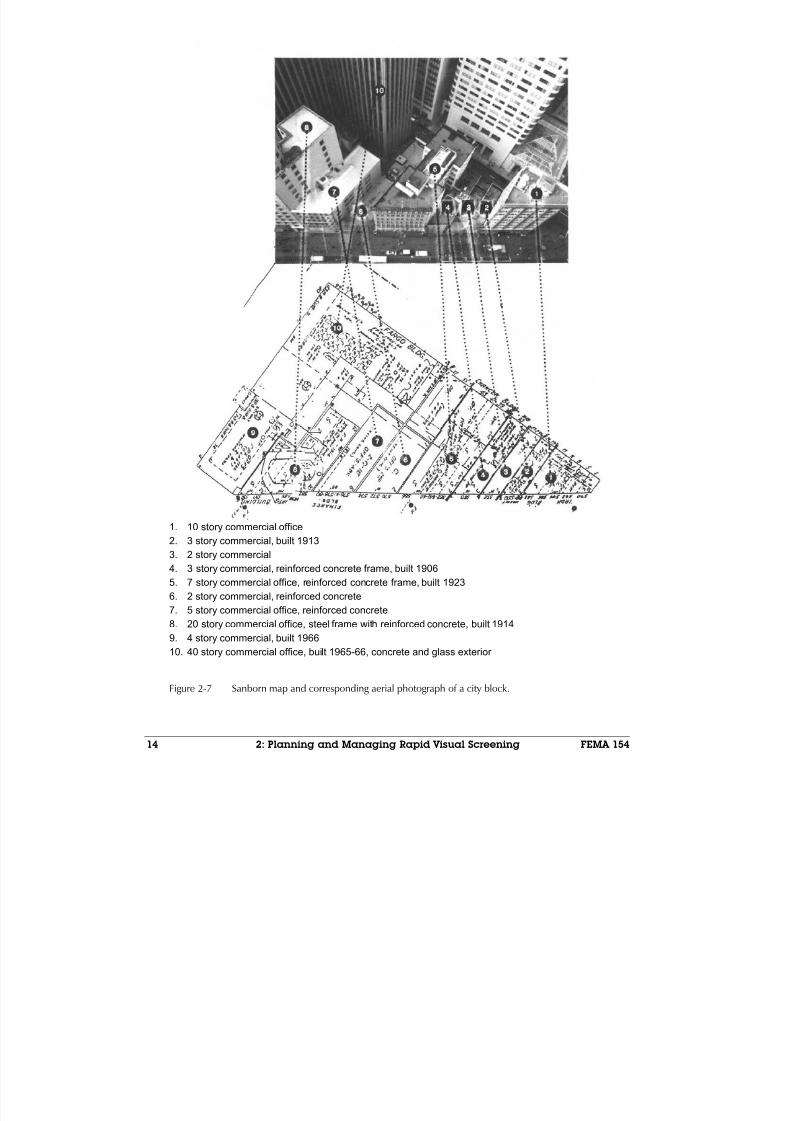
8/3/2019 Statewide Seismic Needs Assessment report
http://slidepdf.com/reader/full/statewide-seismic-needs-assessment-report 215/341
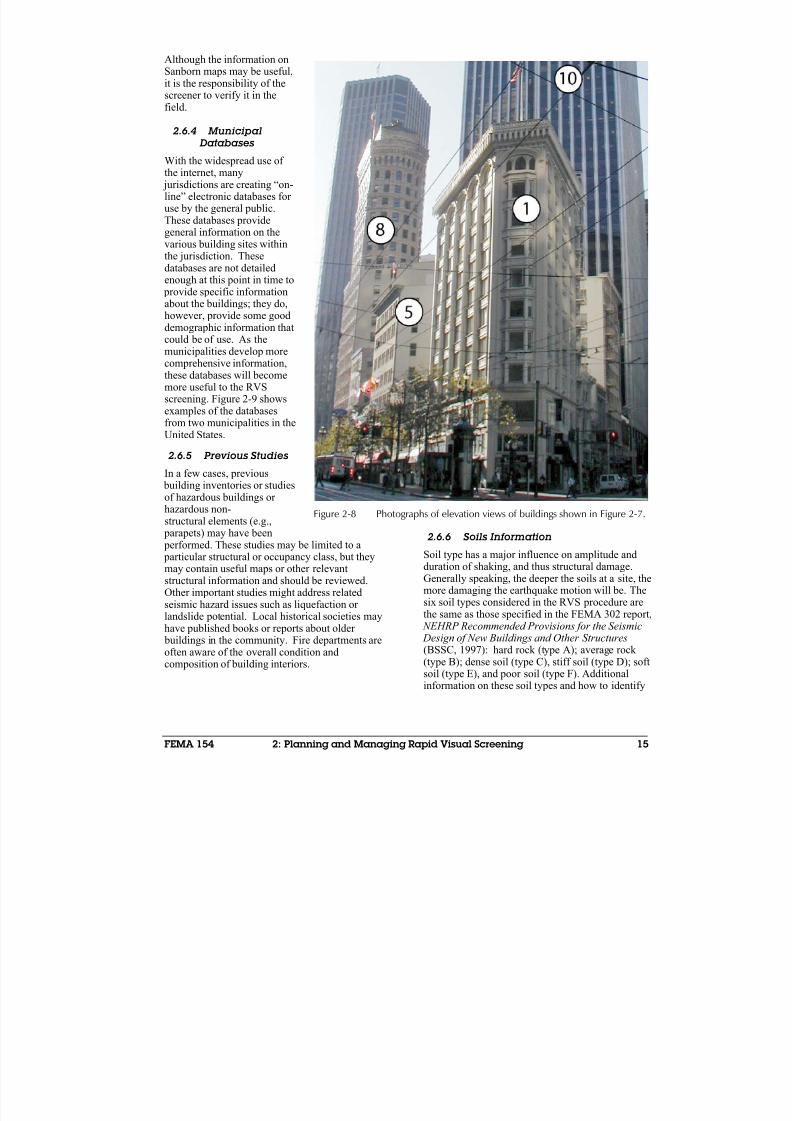
8/3/2019 Statewide Seismic Needs Assessment report
http://slidepdf.com/reader/full/statewide-seismic-needs-assessment-report 216/341
FEMA 154 2: Planning and Managing Rapid Visual Screening 15
Although the information onSanborn maps may be useful,it is the responsibility of thescreener to verify it in thefield.
2.6.4 Municipal
Databases
With the widespread use of the internet, many jurisdictions are creating “on-line” electronic databases for use by the general public.These databases providegeneral information on thevarious building sites withinthe jurisdiction. Thesedatabases are not detailedenough at this point in time to provide specific information
about the buildings; they do,however, provide some gooddemographic information thatcould be of use. As themunicipalities develop morecomprehensive information,these databases will becomemore useful to the RVSscreening. Figure 2-9 showsexamples of the databasesfrom two municipalities in theUnited States.
2.6.5 Previous Studies
In a few cases, previous building inventories or studiesof hazardous buildings or hazardous non-structural elements (e.g., parapets) may have been performed. These studies may be limited to a particular structural or occupancy class, but theymay contain useful maps or other relevantstructural information and should be reviewed.Other important studies might address related
seismic hazard issues such as liquefaction or landslide potential. Local historical societies mayhave published books or reports about older buildings in the community. Fire departments areoften aware of the overall condition andcomposition of building interiors.
2.6.6 Soils Information
Soil type has a major influence on amplitude andduration of shaking, and thus structural damage.Generally speaking, the deeper the soils at a site, themore damaging the earthquake motion will be. The
six soil types considered in the RVS procedure arethe same as those specified in the FEMA 302 report, NEHRP Recommended Provisions for the Seismic Design of New Buildings and Other Structures (BSSC, 1997): hard rock (type A); average rock (type B); dense soil (type C), stiff soil (type D); softsoil (type E), and poor soil (type F). Additionalinformation on these soil types and how to identify
Figure 2-8 Photographs of elevation views of buildings shown in Figure 2-7.
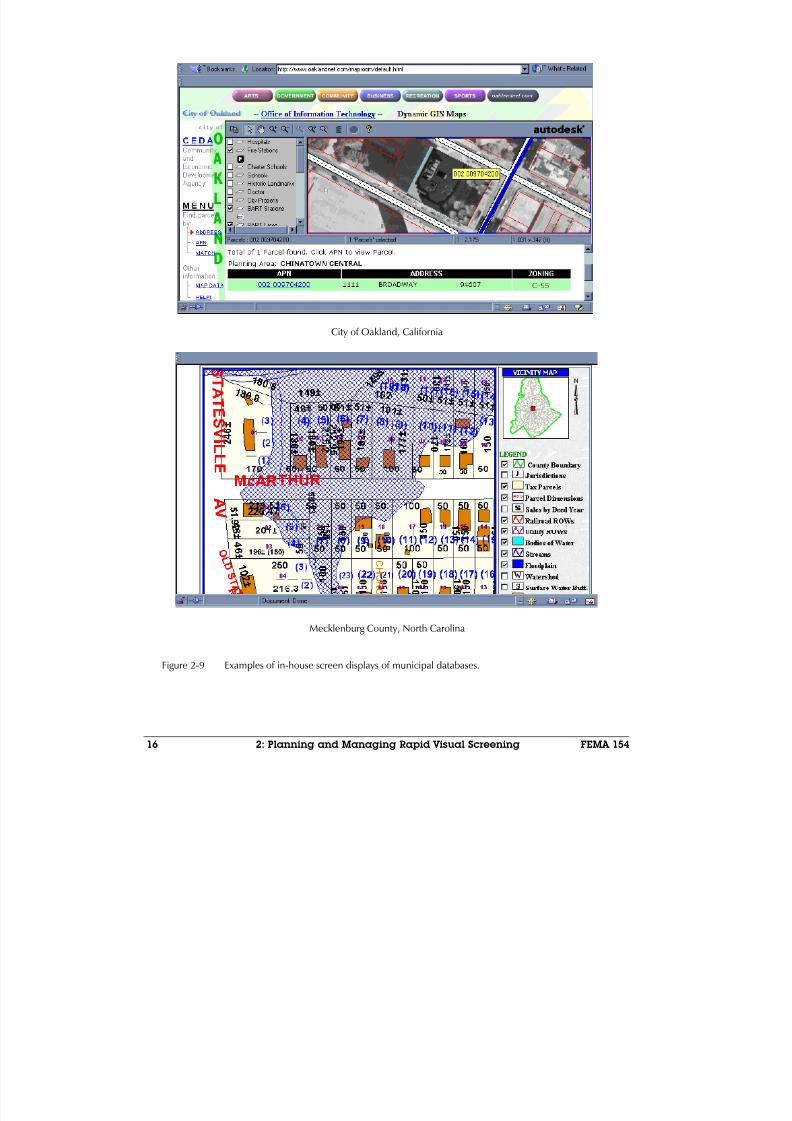
8/3/2019 Statewide Seismic Needs Assessment report
http://slidepdf.com/reader/full/statewide-seismic-needs-assessment-report 217/341
16 2: Planning and Managing Rapid Visual Screening FEMA 154
City of Oakland, California
Mecklenburg County, North Carolina
Figure 2-9 Examples of in-house screen displays of municipal databases.
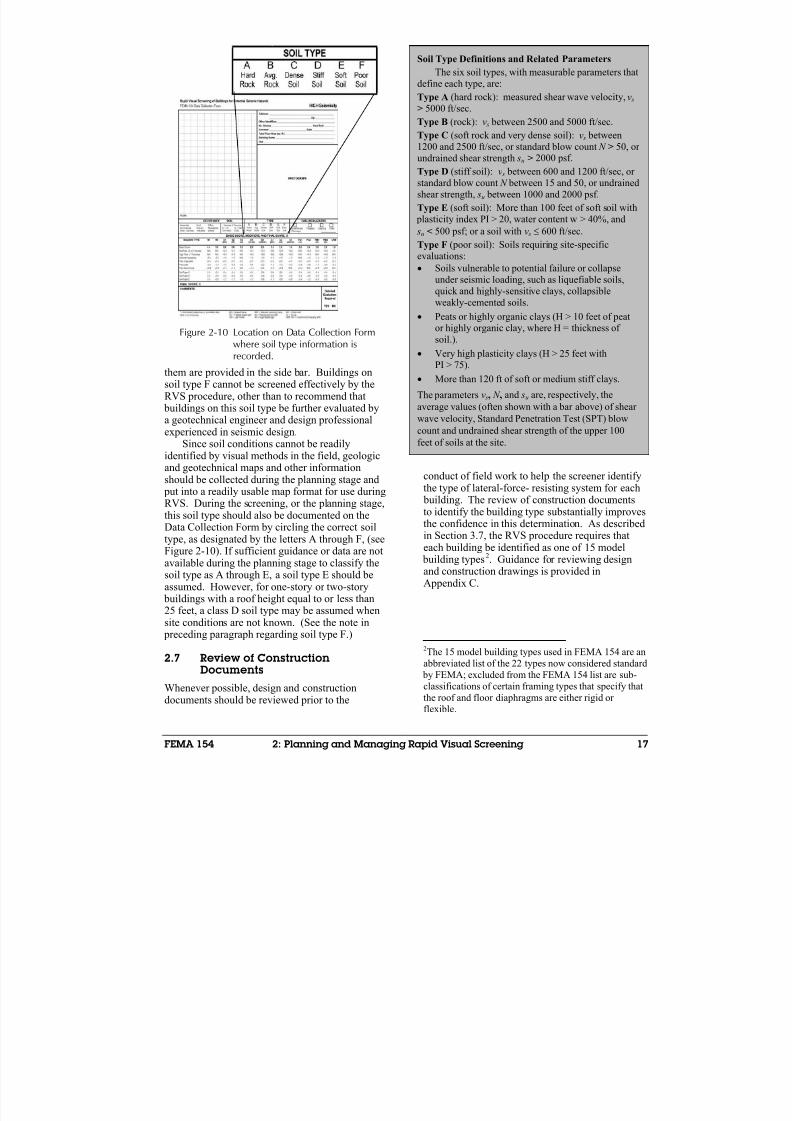
8/3/2019 Statewide Seismic Needs Assessment report
http://slidepdf.com/reader/full/statewide-seismic-needs-assessment-report 218/341
FEMA 154 2: Planning and Managing Rapid Visual Screening 17
them are provided in the side bar. Buildings onsoil type F cannot be screened effectively by theRVS procedure, other than to recommend that buildings on this soil type be further evaluated bya geotechnical engineer and design professionalexperienced in seismic design.
Since soil conditions cannot be readily
identified by visual methods in the field, geologicand geotechnical maps and other informationshould be collected during the planning stage and put into a readily usable map format for use duringRVS. During the screening, or the planning stage,this soil type should also be documented on theData Collection Form by circling the correct soiltype, as designated by the letters A through F, (seeFigure 2-10). If sufficient guidance or data are notavailable during the planning stage to classify thesoil type as A through E, a soil type E should beassumed. However, for one-story or two-story buildings with a roof height equal to or less than25 feet, a class D soil type may be assumed whensite conditions are not known. (See the note in preceding paragraph regarding soil type F.)
2.7 Review of ConstructionDocuments
Whenever possible, design and constructiondocuments should be reviewed prior to the
conduct of field work to help the screener identifythe type of lateral-force- resisting system for each building. The review of construction documentsto identify the building type substantially improvesthe confidence in this determination. As describedin Section 3.7, the RVS procedure requires thateach building be identified as one of 15 model building types2. Guidance for reviewing designand construction drawings is provided inAppendix C.
2The 15 model building types used in FEMA 154 are an
abbreviated list of the 22 types now considered standard
by FEMA; excluded from the FEMA 154 list are sub-
classifications of certain framing types that specify that
the roof and floor diaphragms are either rigid or flexible.
Soil Type Definitions and Related Parameters
The six soil types, with measurable parameters that
define each type, are:
Type A (hard rock): measured shear wave velocity, v s
> 5000 ft/sec.
Type B (rock): v s between 2500 and 5000 ft/sec.
Type C (soft rock and very dense soil): v s between
1200 and 2500 ft/sec, or standard blow count N > 50, or undrained shear strength su > 2000 psf.
Type D (stiff soil): v s between 600 and 1200 ft/sec, or
standard blow count N between 15 and 50, or undrained
shear strength, su between 1000 and 2000 psf.
Type E (soft soil): More than 100 feet of soft soil with
plasticity index PI > 20, water content w > 40%, and
su < 500 psf; or a soil with v s ≤ 600 ft/sec.
Type F (poor soil): Soils requiring site-specific
evaluations:
• Soils vulnerable to potential failure or collapse
under seismic loading, such as liquefiable soils,
quick and highly-sensitive clays, collapsible
weakly-cemented soils.• Peats or highly organic clays (H > 10 feet of peat
or highly organic clay, where H = thickness of
soil.).
• Very high plasticity clays (H > 25 feet withPI > 75).
• More than 120 ft of soft or medium stiff clays.
The parameters v s, N , and su are, respectively, the
average values (often shown with a bar above) of shear
wave velocity, Standard Penetration Test (SPT) blow
count and undrained shear strength of the upper 100
feet of soils at the site.
Figure 2-10 Location on Data Collection Formwhere soil type information isrecorded.
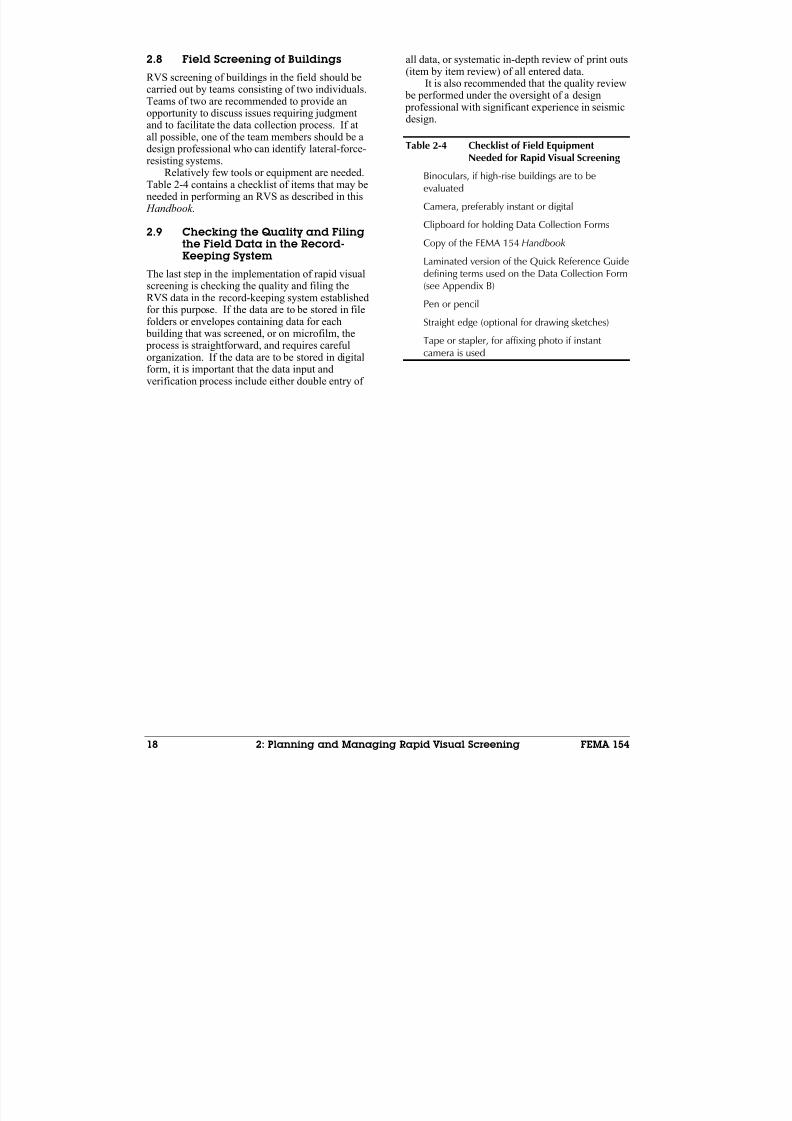
8/3/2019 Statewide Seismic Needs Assessment report
http://slidepdf.com/reader/full/statewide-seismic-needs-assessment-report 219/341
18 2: Planning and Managing Rapid Visual Screening FEMA 154
2.8 Field Screening of Buildings
RVS screening of buildings in the field should becarried out by teams consisting of two individuals.Teams of two are recommended to provide anopportunity to discuss issues requiring judgmentand to facilitate the data collection process. If atall possible, one of the team members should be a
design professional who can identify lateral-force-resisting systems.
Relatively few tools or equipment are needed.Table 2-4 contains a checklist of items that may beneeded in performing an RVS as described in this Handbook.
2.9 Checking the Quality and Filingthe Field Data in the Record-Keeping System
The last step in the implementation of rapid visualscreening is checking the quality and filing the
RVS data in the record-keeping system establishedfor this purpose. If the data are to be stored in filefolders or envelopes containing data for each building that was screened, or on microfilm, the process is straightforward, and requires carefulorganization. If the data are to be stored in digitalform, it is important that the data input andverification process include either double entry of
all data, or systematic in-depth review of print outs(item by item review) of all entered data.
It is also recommended that the quality review be performed under the oversight of a design professional with significant experience in seismicdesign.
Table 2-4 Checklist of Field EquipmentNeeded for Rapid Visual Screening
Binoculars, if high-rise buildings are to beevaluated
Camera, preferably instant or digital
Clipboard for holding Data Collection Forms
Copy of the FEMA 154 Handbook
Laminated version of the Quick Reference Guidedefining terms used on the Data Collection Form(see Appendix B)
Pen or pencil
Straight edge (optional for drawing sketches)
Tape or stapler, for affixing photo if instant camera is used
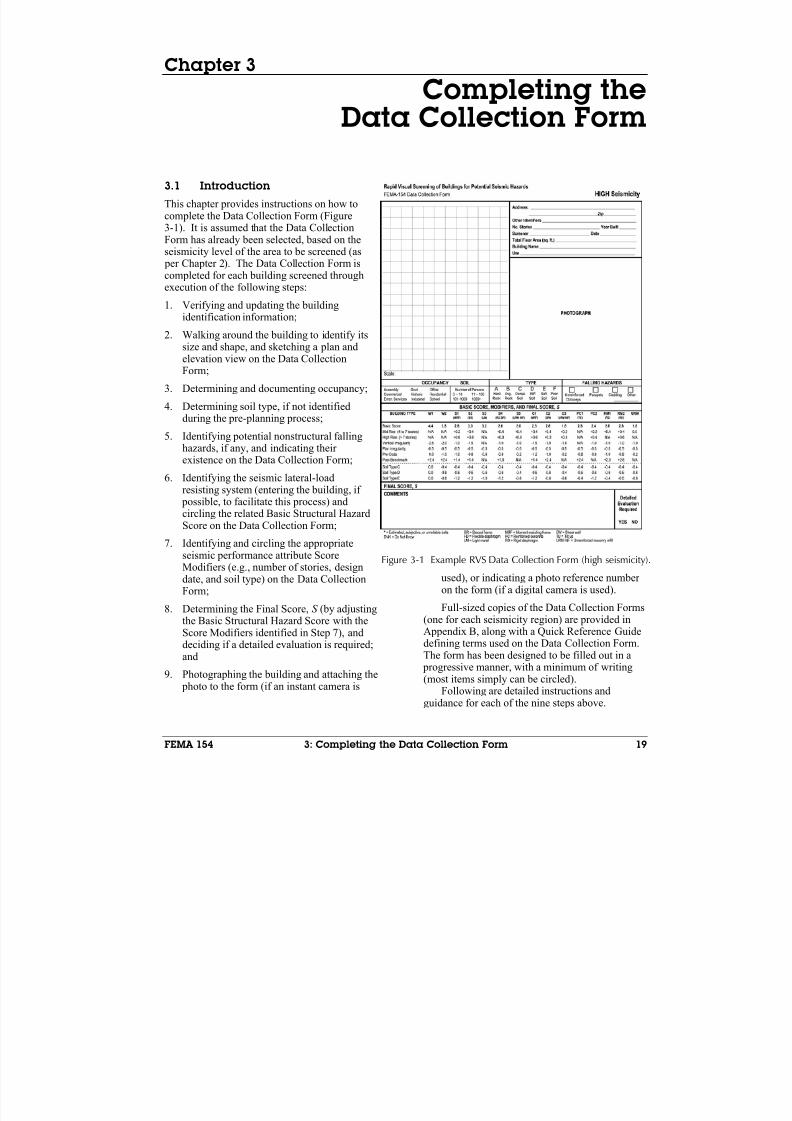
8/3/2019 Statewide Seismic Needs Assessment report
http://slidepdf.com/reader/full/statewide-seismic-needs-assessment-report 220/341
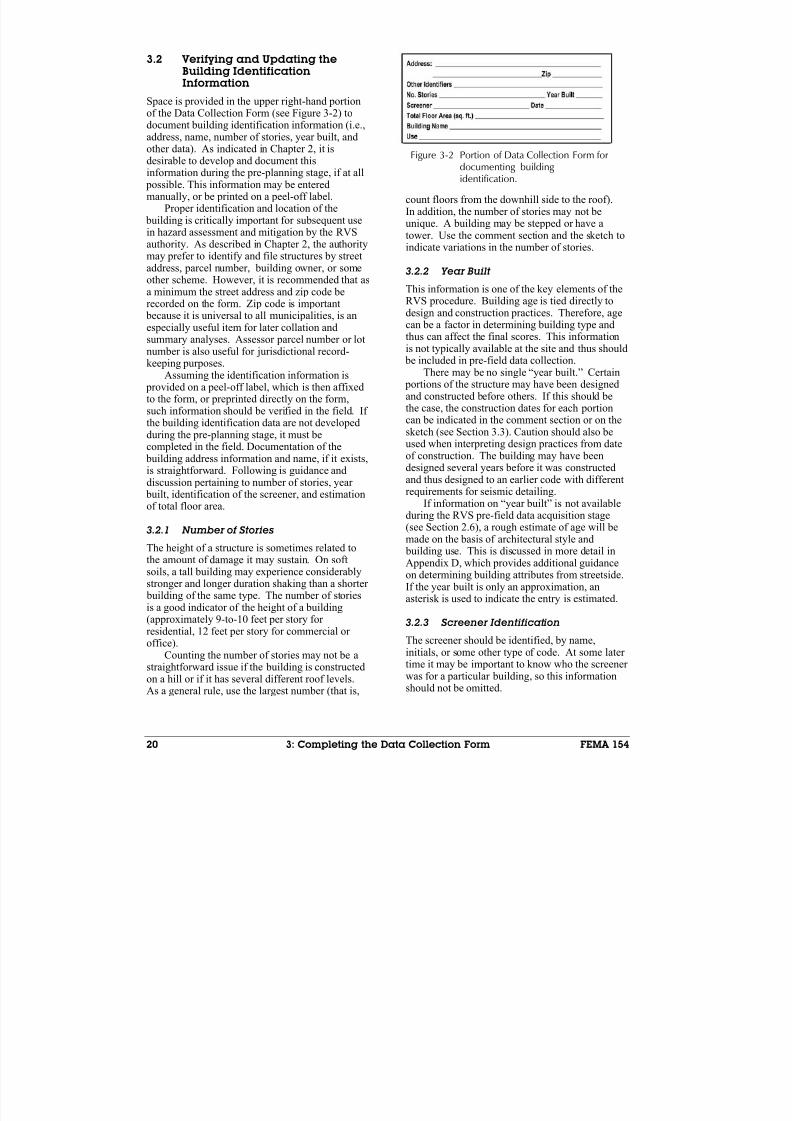
8/3/2019 Statewide Seismic Needs Assessment report
http://slidepdf.com/reader/full/statewide-seismic-needs-assessment-report 221/341
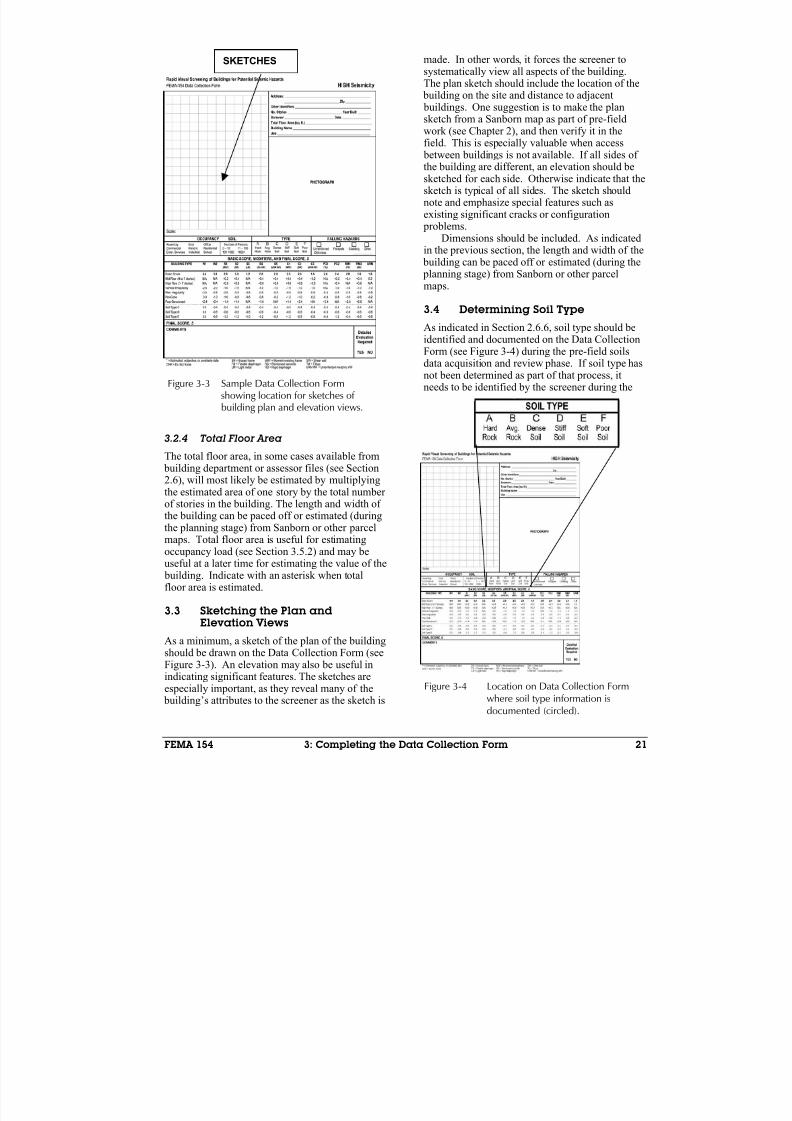
8/3/2019 Statewide Seismic Needs Assessment report
http://slidepdf.com/reader/full/statewide-seismic-needs-assessment-report 222/341
FEMA 154 3: Completing the Data Collection Form 21
3.2.4 Total Floor Area
The total floor area, in some cases available from building department or assessor files (see Section2.6), will most likely be estimated by multiplyingthe estimated area of one story by the total number of stories in the building. The length and width of the building can be paced off or estimated (duringthe planning stage) from Sanborn or other parcelmaps. Total floor area is useful for estimatingoccupancy load (see Section 3.5.2) and may beuseful at a later time for estimating the value of the building. Indicate with an asterisk when totalfloor area is estimated.
3.3 Sketching the Plan andElevation Views
As a minimum, a sketch of the plan of the buildingshould be drawn on the Data Collection Form (seeFigure 3-3). An elevation may also be useful inindicating significant features. The sketches areespecially important, as they reveal many of the building’s attributes to the screener as the sketch is
made. In other words, it forces the screener tosystematically view all aspects of the building.The plan sketch should include the location of the building on the site and distance to adjacent buildings. One suggestion is to make the plansketch from a Sanborn map as part of pre-fieldwork (see Chapter 2), and then verify it in thefield. This is especially valuable when access
between buildings is not available. If all sides of the building are different, an elevation should besketched for each side. Otherwise indicate that thesketch is typical of all sides. The sketch shouldnote and emphasize special features such asexisting significant cracks or configuration problems.
Dimensions should be included. As indicatedin the previous section, the length and width of the building can be paced off or estimated (during the planning stage) from Sanborn or other parcelmaps.
3.4 Determining Soil Type
As indicated in Section 2.6.6, soil type should beidentified and documented on the Data CollectionForm (see Figure 3-4) during the pre-field soilsdata acquisition and review phase. If soil type hasnot been determined as part of that process, itneeds to be identified by the screener during theFigure 3-3 Sample Data Collection Form
showing location for sketches of building plan and elevation views.
SKETCHES
Figure 3-4 Location on Data Collection Formwhere soil type information isdocumented (circled).

8/3/2019 Statewide Seismic Needs Assessment report
http://slidepdf.com/reader/full/statewide-seismic-needs-assessment-report 223/341
22 3: Completing the Data Collection Form FEMA 154
building site visit. If there is no basis for classifying the soil type, a soil type E should beassumed. However, for one-story or two-story buildings with a roof height equal to or less than25 feet, a class D soil type may be assumed whensite conditions are not known.
3.5 Determining and Documenting
Occupancy
Two sets of information are needed relative tooccupancy: (1) building use, and (2) estimatednumber of persons occupying the building.
3.5.1 Occupancy
Occupancy-related information is indicated bycircling the appropriate information in the left-center portion of the form (see Figure 3-5). Theoccupancy of a building refers to its use, whereasthe occupancy load is the number of people in the
building (see Section 3.5.2). Although usually not bearing directly on the structural hazard or probability of sustaining major damage, theoccupancy of a building is of interest and usewhen determining priorities for mitigation.
Nine general occupancy classes that are easyto recognize have been defined. They are listed onthe form as Assembly, Commercial, EmergencyServices (Emer. Services), Government (Govt),Historic, Industrial, Office, Residential, School buildings. These are the same classes used in thefirst edition of FEMA 154. They have beenretained in this edition for consistency, they are
easily identifiable from the street, they generallyrepresent the broad spectrum of building uses inthe United States, and they are similar to theoccupancy categories in the Uniform Building Code (ICBO, 1997).
The occupancy class that best describes the building being evaluated should be circled on theform. If there are several types of uses in the building, such as commercial and residential, bothshould be circled. The actual use of the buildingmay be written in the upper right hand portion of the form. For example, one might indicate thatthe building is a post office or a library on the line
titled “use” in the upper right of the form (seeFigure 3-2). In both of these cases, one would alsocircle “Govt”. If none of the defined classes seemto fit the building, indicate the use in the upper right portion of the form (the buildingidentification area) or include an explanation inthe comments section. The nine occupancyclasses are described below (with generalindications of occupancy load):
• Assembly. Places of public assembly are thosewhere 300 or more people might be gatheredin one room at the same time. Examples aretheaters, auditoriums, community centers, performance halls, and churches. (Occupancyload varies greatly and can be as much as 1 person per 10 sq. ft. of floor area, depending primarily on the condition of the seating— fixed versus moveable).
• Commercial. The commercial occupancyclass refers to retail and wholesale businesses,financial institutions, restaurants, parkingstructures and light warehouses. (Occupancyload varies; use 1 person per 50 to 200 sq. ft.).
• Emergency Services. The emergency servicesclass is defined as any facility that wouldlikely be needed in a major catastrophe. Theseinclude police and fire stations, hospitals, andcommunications centers. (Occupancy load istypically 1 person per 100 sq. ft.).
•Government. This class includes local, stateand federal non-emergency related buildings(Occupancy load varies; use 1 person per 100to 200 sq. ft.).
• Historic. This class will vary from communityto community. It is included because historic buildings may be subjected to specificordinances and codes.
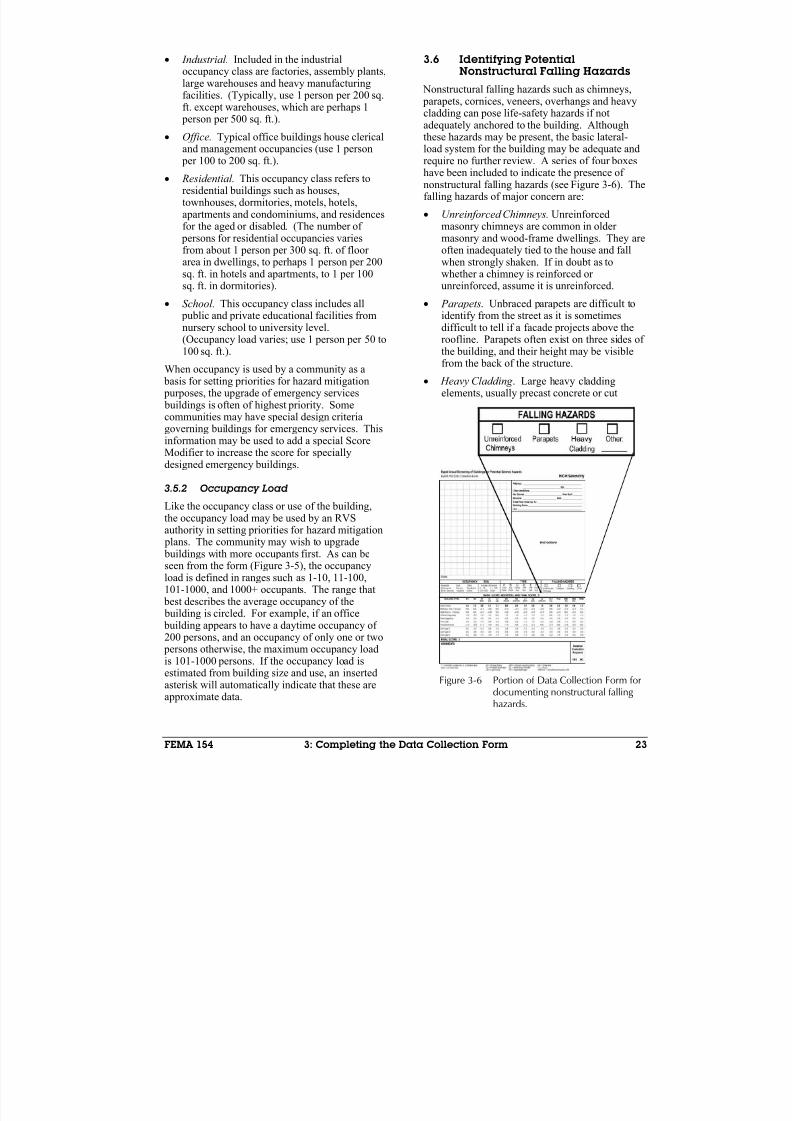
8/3/2019 Statewide Seismic Needs Assessment report
http://slidepdf.com/reader/full/statewide-seismic-needs-assessment-report 224/341
FEMA 154 3: Completing the Data Collection Form 23
• Industrial. Included in the industrialoccupancy class are factories, assembly plants,large warehouses and heavy manufacturingfacilities. (Typically, use 1 person per 200 sq.ft. except warehouses, which are perhaps 1 person per 500 sq. ft.).
• Office. Typical office buildings house clerical
and management occupancies (use 1 person per 100 to 200 sq. ft.).
• Residential. This occupancy class refers toresidential buildings such as houses,townhouses, dormitories, motels, hotels,apartments and condominiums, and residencesfor the aged or disabled. (The number of persons for residential occupancies variesfrom about 1 person per 300 sq. ft. of floor area in dwellings, to perhaps 1 person per 200sq. ft. in hotels and apartments, to 1 per 100sq. ft. in dormitories).
• School. This occupancy class includes all public and private educational facilities fromnursery school to university level.(Occupancy load varies; use 1 person per 50 to100 sq. ft.).
When occupancy is used by a community as a basis for setting priorities for hazard mitigation purposes, the upgrade of emergency services buildings is often of highest priority. Somecommunities may have special design criteriagoverning buildings for emergency services. Thisinformation may be used to add a special Score
Modifier to increase the score for speciallydesigned emergency buildings.
3.5.2 Occupancy Load
Like the occupancy class or use of the building,the occupancy load may be used by an RVSauthority in setting priorities for hazard mitigation plans. The community may wish to upgrade buildings with more occupants first. As can beseen from the form (Figure 3-5), the occupancyload is defined in ranges such as 1-10, 11-100,101-1000, and 1000+ occupants. The range that
best describes the average occupancy of the building is circled. For example, if an office building appears to have a daytime occupancy of 200 persons, and an occupancy of only one or two persons otherwise, the maximum occupancy loadis 101-1000 persons. If the occupancy load isestimated from building size and use, an insertedasterisk will automatically indicate that these areapproximate data.
3.6 Identifying PotentialNonstructural Falling Hazards
Nonstructural falling hazards such as chimneys, parapets, cornices, veneers, overhangs and heavycladding can pose life-safety hazards if notadequately anchored to the building. Althoughthese hazards may be present, the basic lateral-
load system for the building may be adequate andrequire no further review. A series of four boxeshave been included to indicate the presence of nonstructural falling hazards (see Figure 3-6). Thefalling hazards of major concern are:
• Unreinforced Chimneys. Unreinforcedmasonry chimneys are common in older masonry and wood-frame dwellings. They areoften inadequately tied to the house and fallwhen strongly shaken. If in doubt as towhether a chimney is reinforced or unreinforced, assume it is unreinforced.
• Parapets. Unbraced parapets are difficult toidentify from the street as it is sometimesdifficult to tell if a facade projects above theroofline. Parapets often exist on three sides of the building, and their height may be visiblefrom the back of the structure.
• Heavy Cladding . Large heavy claddingelements, usually precast concrete or cut
Figure 3-6 Portion of Data Collection Form fordocumenting nonstructural falling hazards.

8/3/2019 Statewide Seismic Needs Assessment report
http://slidepdf.com/reader/full/statewide-seismic-needs-assessment-report 225/341
24 3: Completing the Data Collection Form FEMA 154
stone, may fall off the building during anearthquake if improperly anchored. The lossof panels may also create major changes to the building stiffness (the elements are considerednonstructural but often contribute substantialstiffness to a building), thus setting up planirregularities or torsion when only some fall.(Glass curtain walls are not considered as
heavy cladding in the RVS procedure.) Theexistence of heavy cladding is of concern if the connections were designed and installed before the jurisdiction adopted seismicanchorage requirements (normally twice thatfor gravity loads). The date of such codeadoption will vary with jurisdiction and should be established by an experienced design professional in the planning stages of the RVS process (see Section 2.4.2).
If any of the above nonstructural fallinghazards exist, the appropriate box should be
checked. If there are any other falling hazards, the“Other” box should be checked, and the type of hazard indicated on the line beneath this box. Usethe comments section if additional space isrequired.
The RVS authority may later use thisinformation as a basis for notifying the owner of potential problems.
3.7 Identifying the Lateral-Load-Resisting System andDocumenting the Related BasicStructural Score
The RVS procedure is based on the premise thatthe screener will be able to determine the building’s lateral-load-resisting system from thestreet, or to eliminate all those that it cannot possibly be. It is further assumed that the lateral-load-resisting system is one of fifteen types thathave been observed to be prevalent, based onstudies of building stock in the United States. Thefifteen types are consistent with the model building types identified in the FEMA 310 Reportand the predecessor documents that haveaddressed seismic evaluation of buildings (e.g.,
ATC, 1987; BSSC, 1992)). The fifteen model building types used in this document, however, arean abbreviated subset of the 22 types nowconsidered standard by FEMA; excluded from theFEMA 154 list are sub-classifications of certainframing types that specify that the roof and floor diaphragms are either rigid or flexible.
3.7.1 Fifteen Building Types Considered
by the RVS Procedure and Related
Basic Structural Scores
Following are the fifteen building types used in theRVS procedure. Alpha-numeric reference codesused on the Data Collection Form are shown in parentheses.
1. Light wood-frame residential and commercial buildings smaller than or equal to 5,000 squarefeet (W1)
2. Light wood-frame buildings larger than 5,000square feet (W2)
3. Steel moment-resisting frame buildings (S1)
4. Braced steel frame buildings (S2)
5. Light metal buildings (S3)
6. Steel frame buildings with cast-in-placeconcrete shear walls (S4)
7. Steel frame buildings with unreinforcedmasonry infill walls (S5)
8. Concrete moment-resisting frame buildings(C1)
9. Concrete shear-wall buildings (C2)
10. Concrete frame buildings with unreinforcedmasonry infill walls (C3)
11. Tilt-up buildings (PC1)
12. Precast concrete frame buildings (PC2)
13. Reinforced masonry buildings with flexiblefloor and roof diaphragms (RM1)
14. Reinforced masonry buildings with rigid floor and roof diaphragms (RM2)
15. Unreinforced masonry bearing-wall buildings(URM)
For each of these fifteen model building types,a Basic Structural Hazard Score has beencomputed that reflects the estimated likelihoodthat building collapse will occur if the building issubjected to the maximum considered earthquake
ground motions for the region. The BasicStructural Hazard Scores are based on the damageand loss estimation functions provided in theFEMA-funded HAZUS damage and lossestimation methodology (NIBS, 1999). For moreinformation about the development of the BasicStructural Hazard Scores, see the companionFEMA 155 report (ATC, 2002).
The Basic Structural Scores are provided oneach Data Collection Form in the first row of the
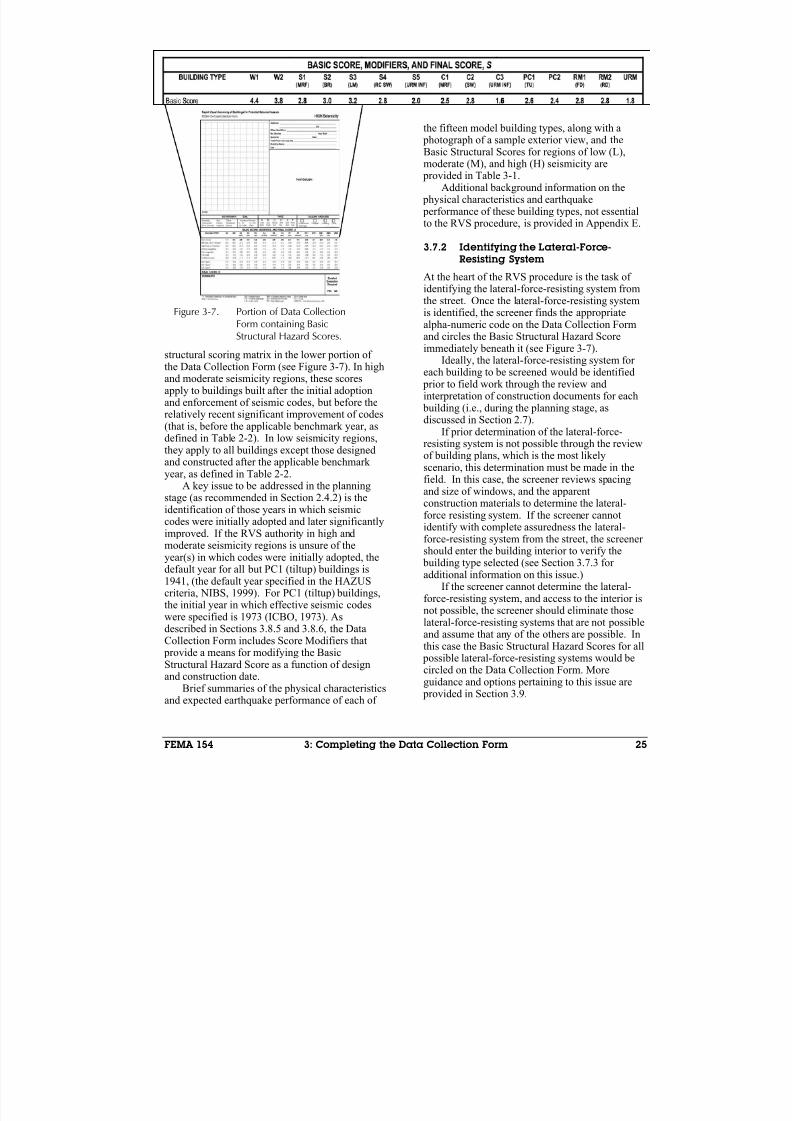
8/3/2019 Statewide Seismic Needs Assessment report
http://slidepdf.com/reader/full/statewide-seismic-needs-assessment-report 226/341
FEMA 154 3: Completing the Data Collection Form 25
structural scoring matrix in the lower portion of the Data Collection Form (see Figure 3-7). In highand moderate seismicity regions, these scoresapply to buildings built after the initial adoptionand enforcement of seismic codes, but before therelatively recent significant improvement of codes(that is, before the applicable benchmark year, asdefined in Table 2-2). In low seismicity regions,
they apply to all buildings except those designedand constructed after the applicable benchmark year, as defined in Table 2-2.
A key issue to be addressed in the planningstage (as recommended in Section 2.4.2) is theidentification of those years in which seismiccodes were initially adopted and later significantlyimproved. If the RVS authority in high andmoderate seismicity regions is unsure of theyear(s) in which codes were initially adopted, thedefault year for all but PC1 (tiltup) buildings is1941, (the default year specified in the HAZUScriteria, NIBS, 1999). For PC1 (tiltup) buildings,
the initial year in which effective seismic codeswere specified is 1973 (ICBO, 1973). Asdescribed in Sections 3.8.5 and 3.8.6, the DataCollection Form includes Score Modifiers that provide a means for modifying the BasicStructural Hazard Score as a function of designand construction date.
Brief summaries of the physical characteristicsand expected earthquake performance of each of
the fifteen model building types, along with a photograph of a sample exterior view, and the
Basic Structural Scores for regions of low (L),moderate (M), and high (H) seismicity are provided in Table 3-1.
Additional background information on the physical characteristics and earthquake performance of these building types, not essentialto the RVS procedure, is provided in Appendix E.
3.7.2 Identifying the Lateral-Force-
Resisting System
At the heart of the RVS procedure is the task of identifying the lateral-force-resisting system from
the street. Once the lateral-force-resisting systemis identified, the screener finds the appropriatealpha-numeric code on the Data Collection Formand circles the Basic Structural Hazard Scoreimmediately beneath it (see Figure 3-7).
Ideally, the lateral-force-resisting system for each building to be screened would be identified prior to field work through the review andinterpretation of construction documents for each building (i.e., during the planning stage, asdiscussed in Section 2.7).
If prior determination of the lateral-force-resisting system is not possible through the review
of building plans, which is the most likelyscenario, this determination must be made in thefield. In this case, the screener reviews spacingand size of windows, and the apparentconstruction materials to determine the lateral-force resisting system. If the screener cannotidentify with complete assuredness the lateral-force-resisting system from the street, the screener should enter the building interior to verify the building type selected (see Section 3.7.3 for additional information on this issue.)
If the screener cannot determine the lateral-force-resisting system, and access to the interior isnot possible, the screener should eliminate thoselateral-force-resisting systems that are not possibleand assume that any of the others are possible. Inthis case the Basic Structural Hazard Scores for all possible lateral-force-resisting systems would becircled on the Data Collection Form. Moreguidance and options pertaining to this issue are provided in Section 3.9.
Figure 3-7. Portion of Data CollectionForm containing BasicStructural Hazard Scores.
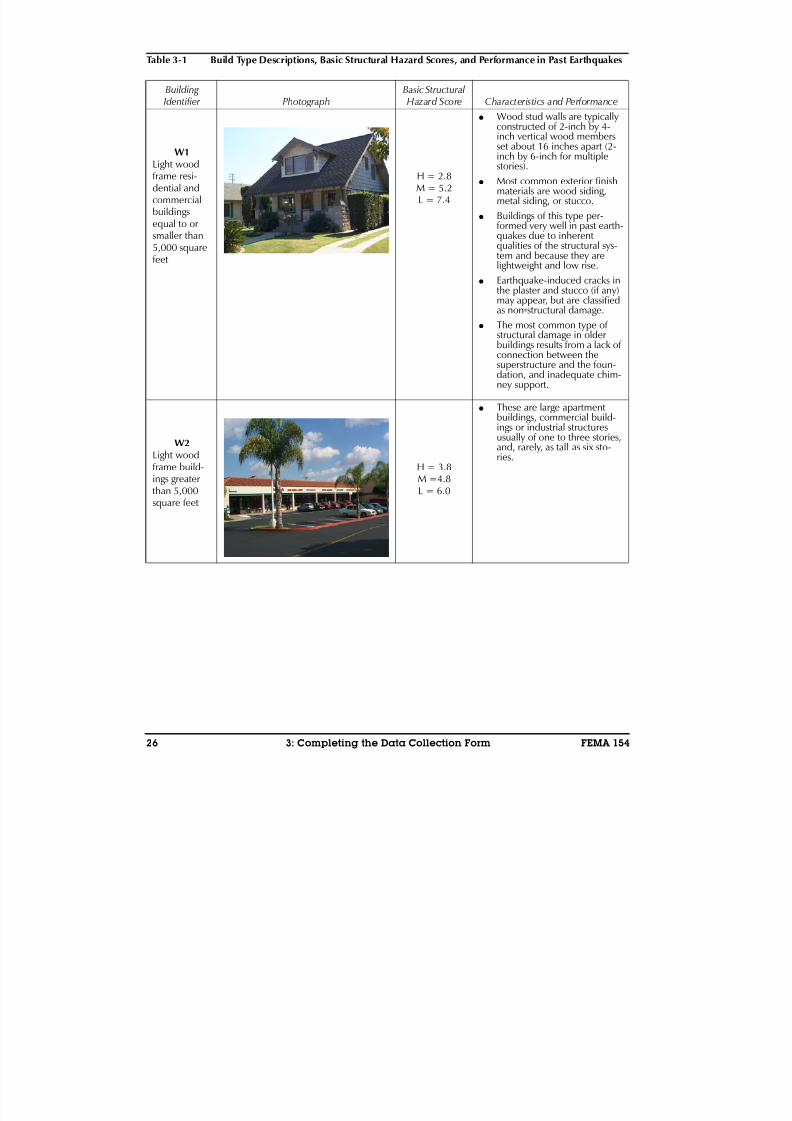
8/3/2019 Statewide Seismic Needs Assessment report
http://slidepdf.com/reader/full/statewide-seismic-needs-assessment-report 227/341
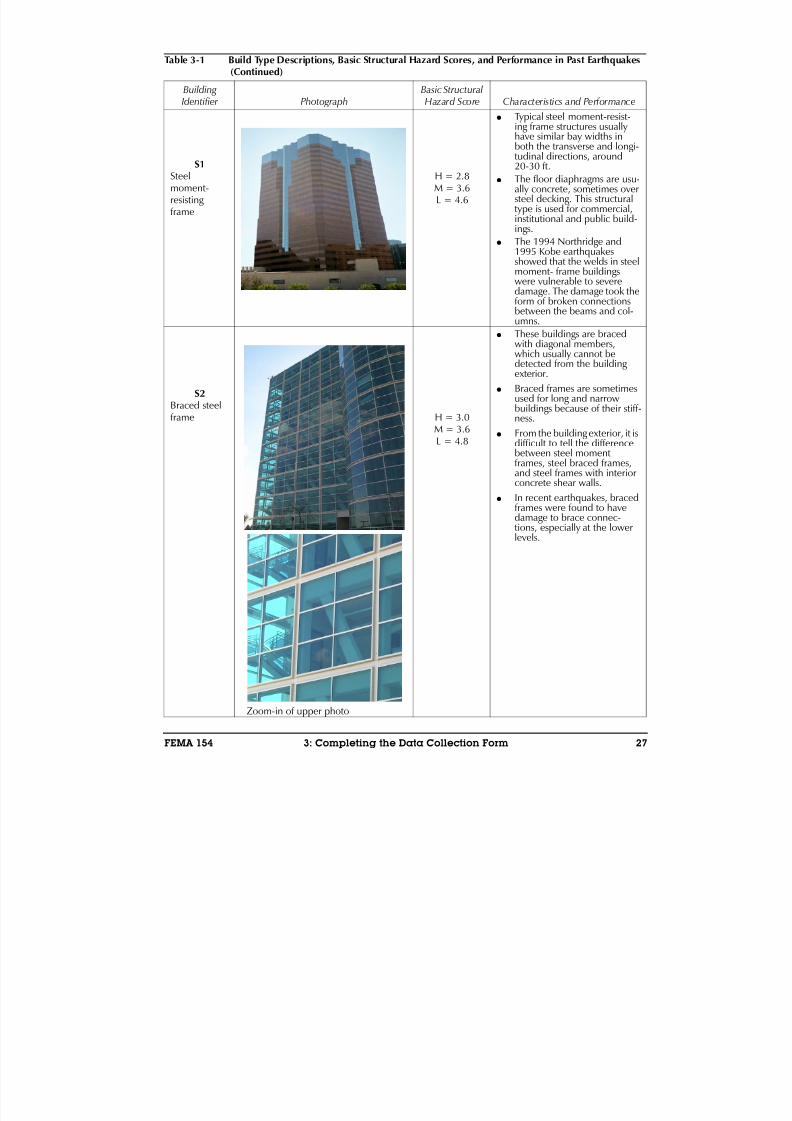
8/3/2019 Statewide Seismic Needs Assessment report
http://slidepdf.com/reader/full/statewide-seismic-needs-assessment-report 228/341
FEMA 154 3: Completing the Data Collection Form 27
S1Steelmoment-resisting frame
H = 2.8M = 3.6L = 4.6
● Typical steel moment-resist-ing frame structures usuallyhave similar bay widths in
both the transverse and longi-tudinal directions, around20-30 ft.
● The floor diaphragms are usu-ally concrete, sometimes oversteel decking. This structuraltype is used for commercial,institutional and public build-ings.
● The 1994 Northridge and1995 Kobe earthquakesshowed that the welds in steelmoment- frame buildingswere vulnerable to severedamage. The damage took the
form of broken connectionsbetween the beams and col-umns.
S2Braced steelframe
Zoom-in of upper photo
H = 3.0M = 3.6L = 4.8
● These buildings are bracedwith diagonal members,which usually cannot bedetected from the building exterior.
● Braced frames are sometimesused for long and narrowbuildings because of their stiff-ness.
● From the building exterior, it isdifficult to tell the difference
between steel moment frames, steel braced frames,and steel frames with interiorconcrete shear walls.
● In recent earthquakes, bracedframes were found to havedamage to brace connec-tions, especially at the lowerlevels.
Table 3-1 Build Type Descriptions, Basic Structural Hazard Scores, and Performance in Past Earthquakes(Continued)
BuildingIdentifier Photograph
Basic StructuralHazard Score Characteristics and Performance
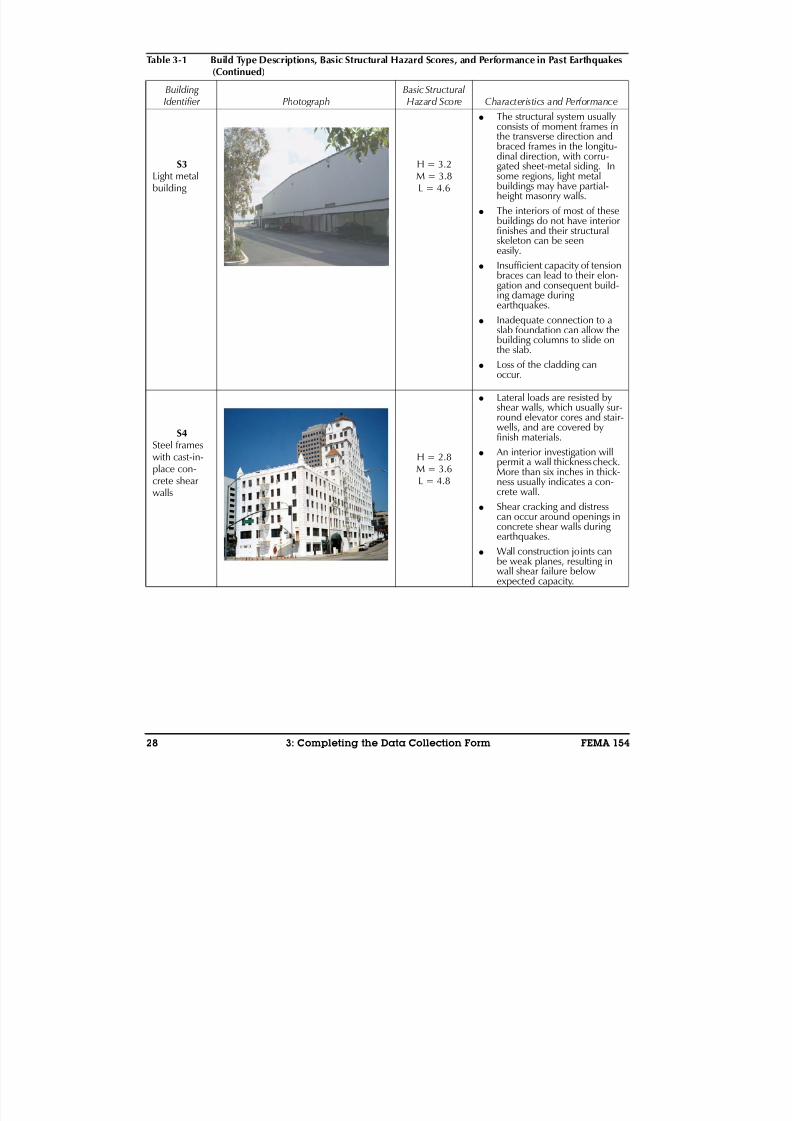
8/3/2019 Statewide Seismic Needs Assessment report
http://slidepdf.com/reader/full/statewide-seismic-needs-assessment-report 229/341
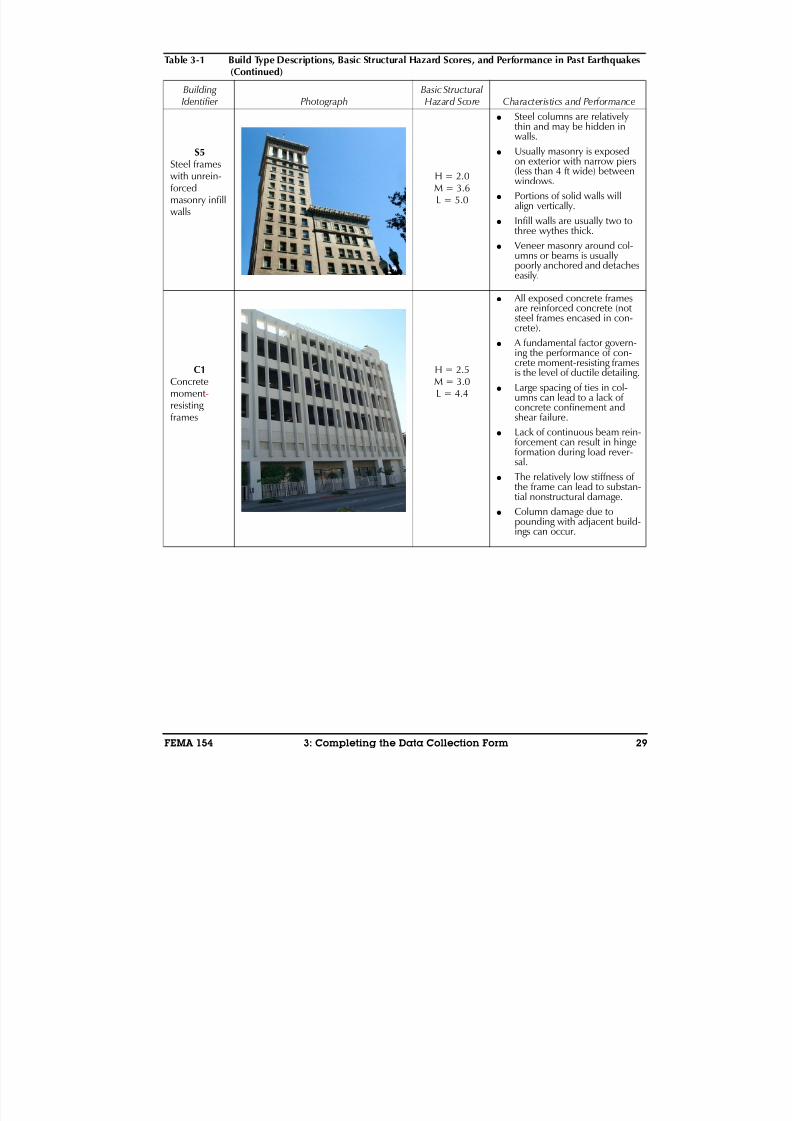
8/3/2019 Statewide Seismic Needs Assessment report
http://slidepdf.com/reader/full/statewide-seismic-needs-assessment-report 230/341
FEMA 154 3: Completing the Data Collection Form 29
S5Steel frameswith unrein-forcedmasonry infillwalls
H = 2.0M = 3.6L = 5.0
● Steel columns are relativelythin and may be hidden inwalls.
● Usually masonry is exposedon exterior with narrow piers(less than 4 ft wide) betweenwindows.
● Portions of solid walls willalign vertically.
● Infill walls are usually two tothree wythes thick.
● Veneer masonry around col-umns or beams is usuallypoorly anchored and detacheseasily.
C1Concretemoment - resisting frames
H = 2.5M = 3.0L = 4.4
●
All exposed concrete framesare reinforced concrete (not steel frames encased in con-crete).
● A fundamental factor govern-ing the performance of con-crete moment-resisting framesis the level of ductile detailing.
● Large spacing of ties in col-umns can lead to a lack of concrete confinement andshear failure.
● Lack of continuous beam rein-forcement can result in hinge
formation during load rever-sal.
● The relatively low stiffness of the frame can lead to substan-tial nonstructural damage.
● Column damage due topounding with adjacent build-ings can occur.
Table 3-1 Build Type Descriptions, Basic Structural Hazard Scores, and Performance in Past Earthquakes(Continued)
BuildingIdentifier Photograph
Basic StructuralHazard Score Characteristics and Performance
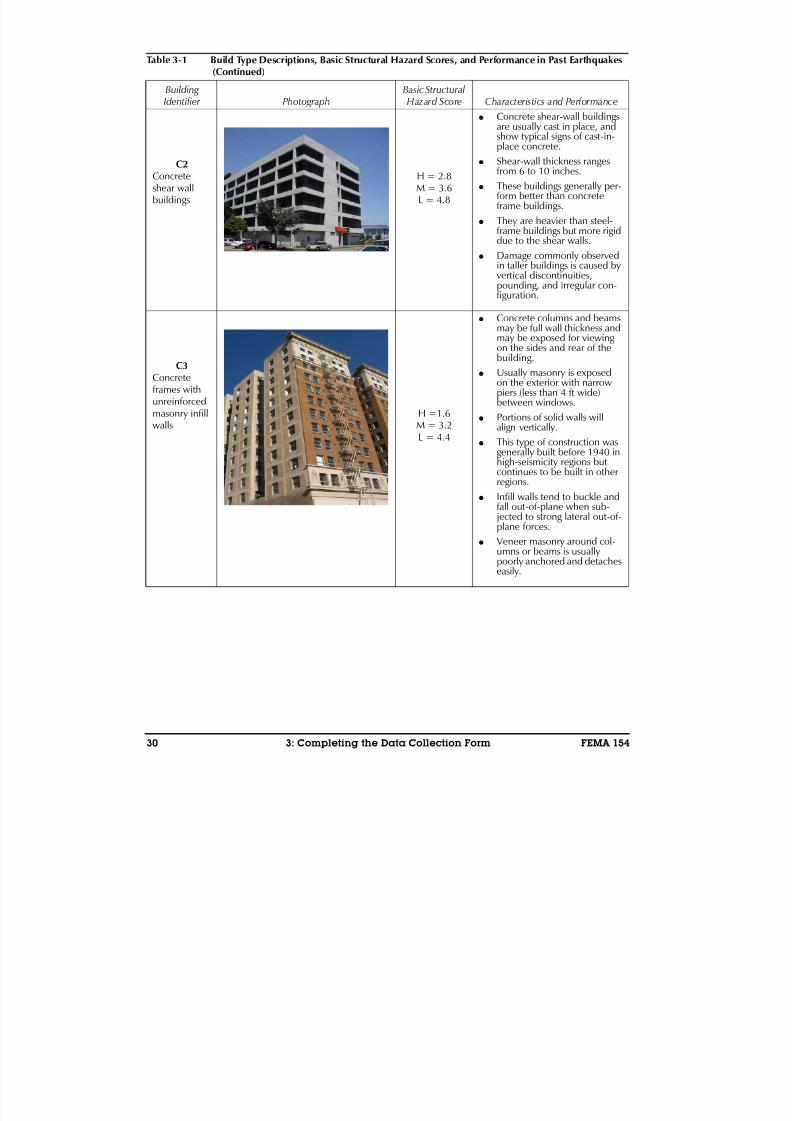
8/3/2019 Statewide Seismic Needs Assessment report
http://slidepdf.com/reader/full/statewide-seismic-needs-assessment-report 231/341
30 3: Completing the Data Collection Form FEMA 154
C2Concreteshear wallbuildings
H = 2.8M = 3.6L = 4.8
● Concrete shear-wall buildingsare usually cast in place, andshow typical signs of cast-in-
place concrete.● Shear-wall thickness ranges
from 6 to 10 inches.
● These buildings generally per-form better than concreteframe buildings.
● They are heavier than steel-frame buildings but more rigiddue to the shear walls.
● Damage commonly observedin taller buildings is caused byvertical discontinuities,pounding, and irregular con-figuration.
C3Concreteframes withunreinforcedmasonry infillwalls
H =1.6M = 3.2L = 4.4
● Concrete columns and beamsmay be full wall thickness andmay be exposed for viewing on the sides and rear of thebuilding.
● Usually masonry is exposedon the exterior with narrowpiers (less than 4 ft wide)between windows.
● Portions of solid walls willalign vertically.
● This type of construction was
generally built before 1940 inhigh-seismicity regions but continues to be built in otherregions.
● Infill walls tend to buckle andfall out-of-plane when sub- jected to strong lateral out-of-plane forces.
● Veneer masonry around col-umns or beams is usuallypoorly anchored and detacheseasily.
Table 3-1 Build Type Descriptions, Basic Structural Hazard Scores, and Performance in Past Earthquakes(Continued)
BuildingIdentifier Photograph
Basic StructuralHazard Score Characteristics and Performance

8/3/2019 Statewide Seismic Needs Assessment report
http://slidepdf.com/reader/full/statewide-seismic-needs-assessment-report 232/341
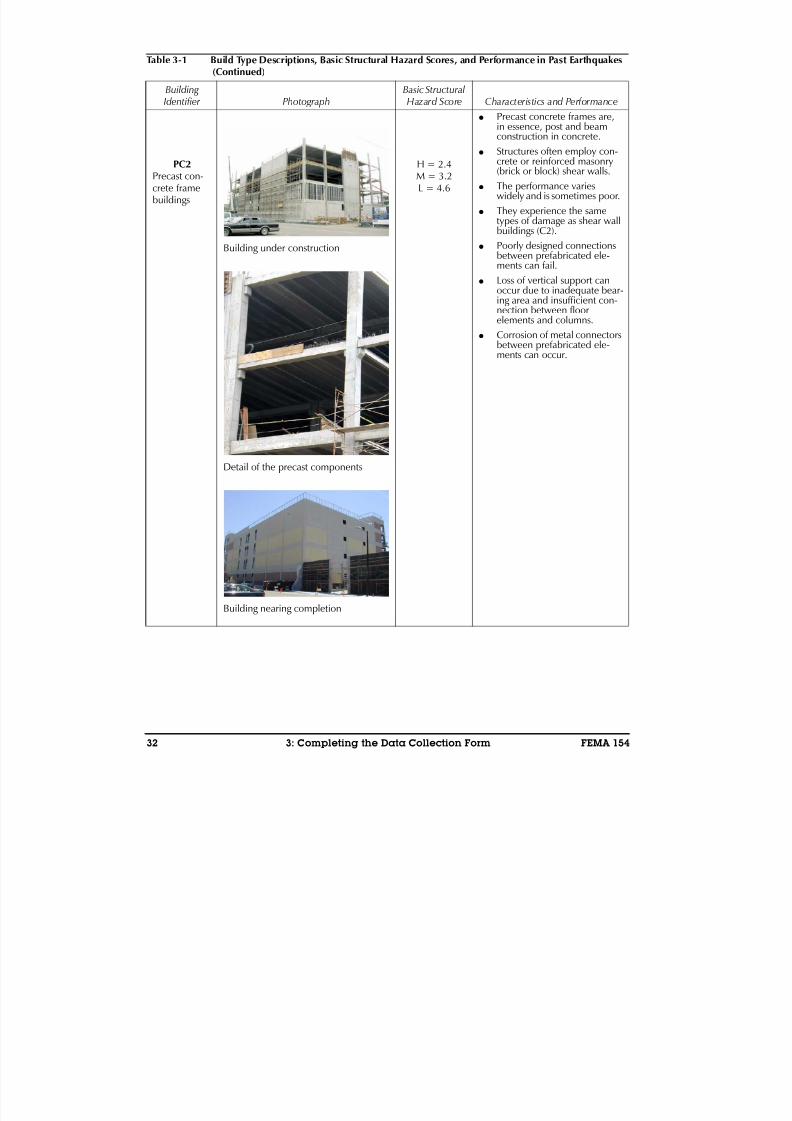
8/3/2019 Statewide Seismic Needs Assessment report
http://slidepdf.com/reader/full/statewide-seismic-needs-assessment-report 233/341
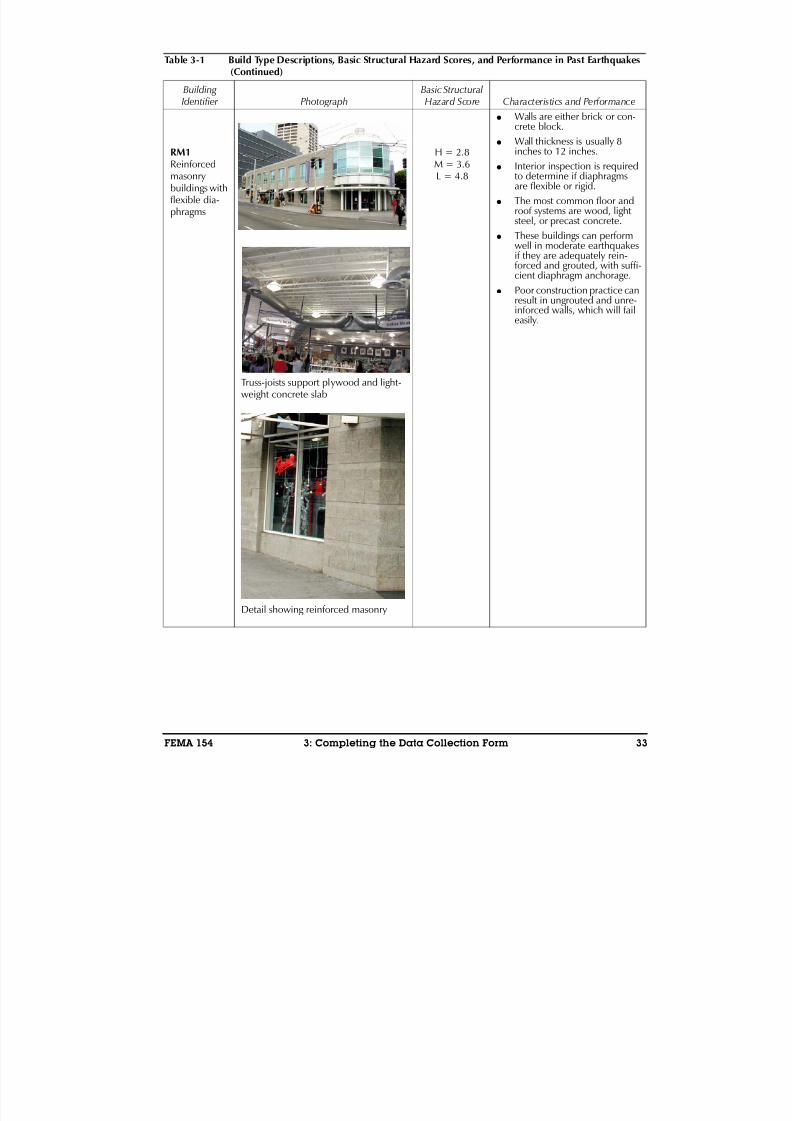
8/3/2019 Statewide Seismic Needs Assessment report
http://slidepdf.com/reader/full/statewide-seismic-needs-assessment-report 234/341
FEMA 154 3: Completing the Data Collection Form 33
RM1Reinforcedmasonrybuildings withflexible dia-phragms
Truss-joists support plywood and light-weight concrete slab
Detail showing reinforced masonry
H = 2.8M = 3.6L = 4.8
● Walls are either brick or con-crete block.
● Wall thickness is usually 8
inches to 12 inches.● Interior inspection is required
to determine if diaphragmsare flexible or rigid.
● The most common floor androof systems are wood, light steel, or precast concrete.
● These buildings can performwell in moderate earthquakesif they are adequately rein-forced and grouted, with suffi-cient diaphragm anchorage.
● Poor construction practice can
result in ungrouted and unre-inforced walls, which will faileasily.
Table 3-1 Build Type Descriptions, Basic Structural Hazard Scores, and Performance in Past Earthquakes(Continued)
BuildingIdentifier Photograph
Basic StructuralHazard Score Characteristics and Performance
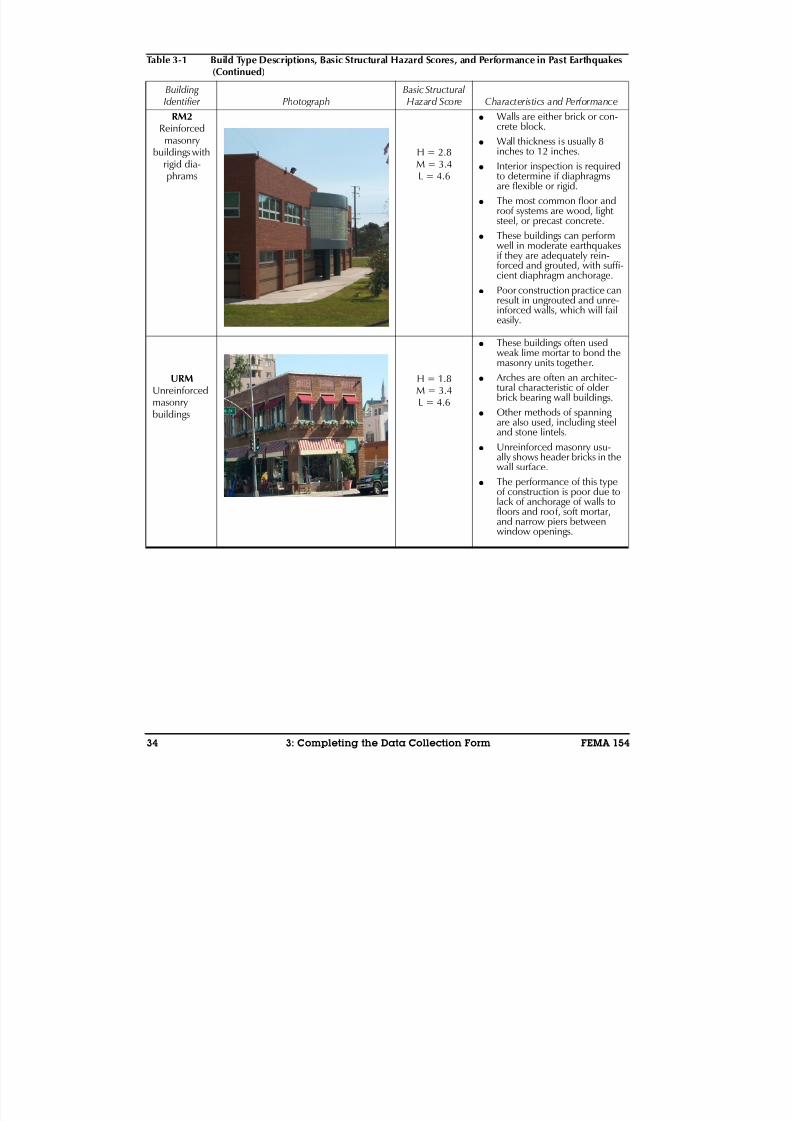
8/3/2019 Statewide Seismic Needs Assessment report
http://slidepdf.com/reader/full/statewide-seismic-needs-assessment-report 235/341
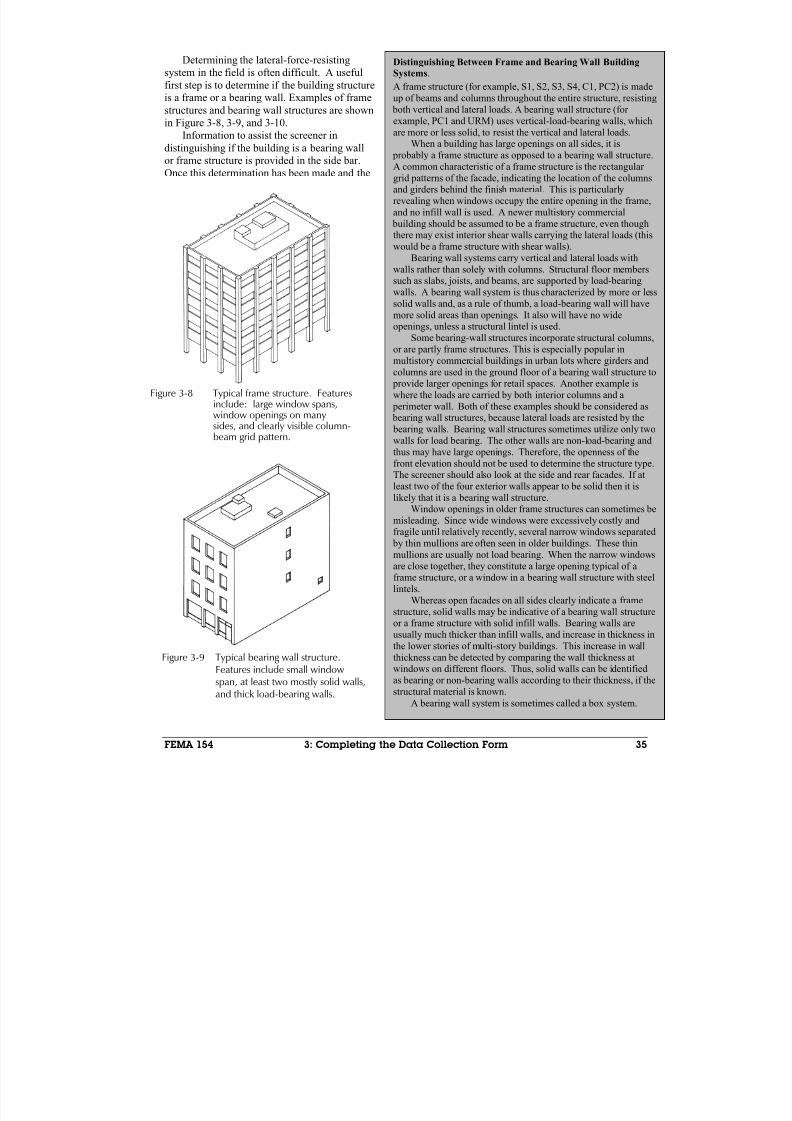
8/3/2019 Statewide Seismic Needs Assessment report
http://slidepdf.com/reader/full/statewide-seismic-needs-assessment-report 236/341

8/3/2019 Statewide Seismic Needs Assessment report
http://slidepdf.com/reader/full/statewide-seismic-needs-assessment-report 237/341

8/3/2019 Statewide Seismic Needs Assessment report
http://slidepdf.com/reader/full/statewide-seismic-needs-assessment-report 238/341

8/3/2019 Statewide Seismic Needs Assessment report
http://slidepdf.com/reader/full/statewide-seismic-needs-assessment-report 239/341
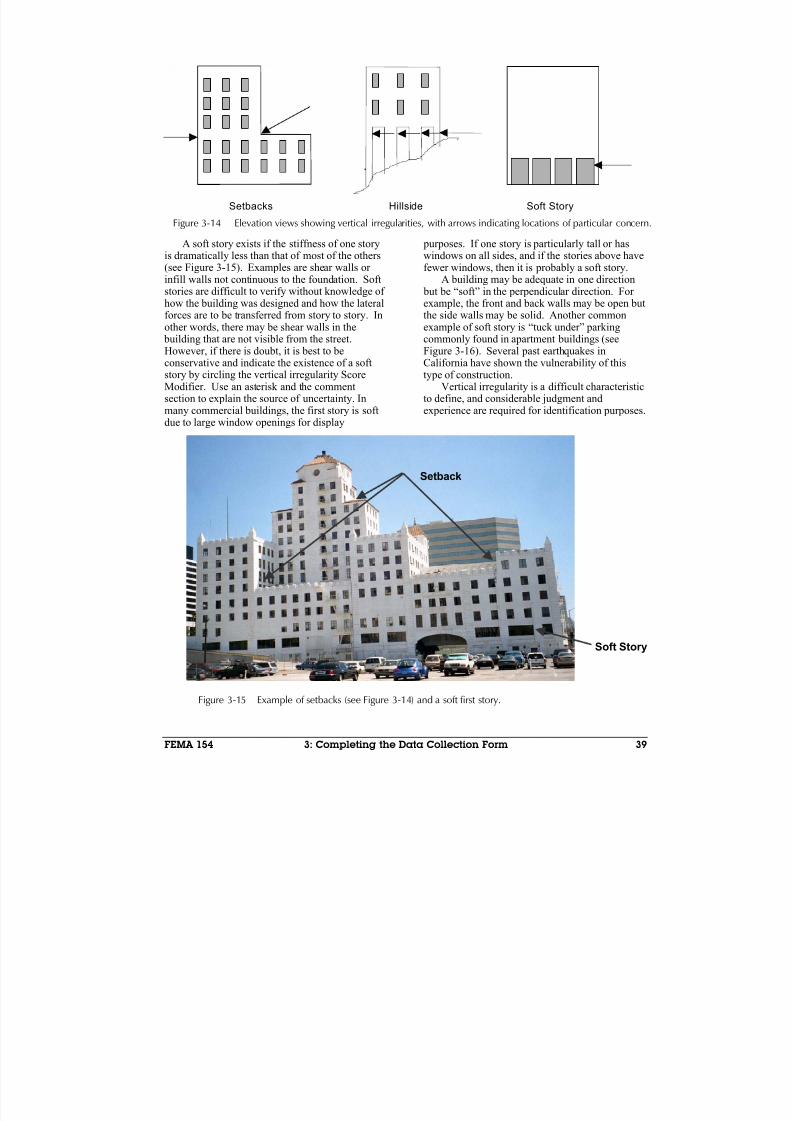
8/3/2019 Statewide Seismic Needs Assessment report
http://slidepdf.com/reader/full/statewide-seismic-needs-assessment-report 240/341

8/3/2019 Statewide Seismic Needs Assessment report
http://slidepdf.com/reader/full/statewide-seismic-needs-assessment-report 241/341
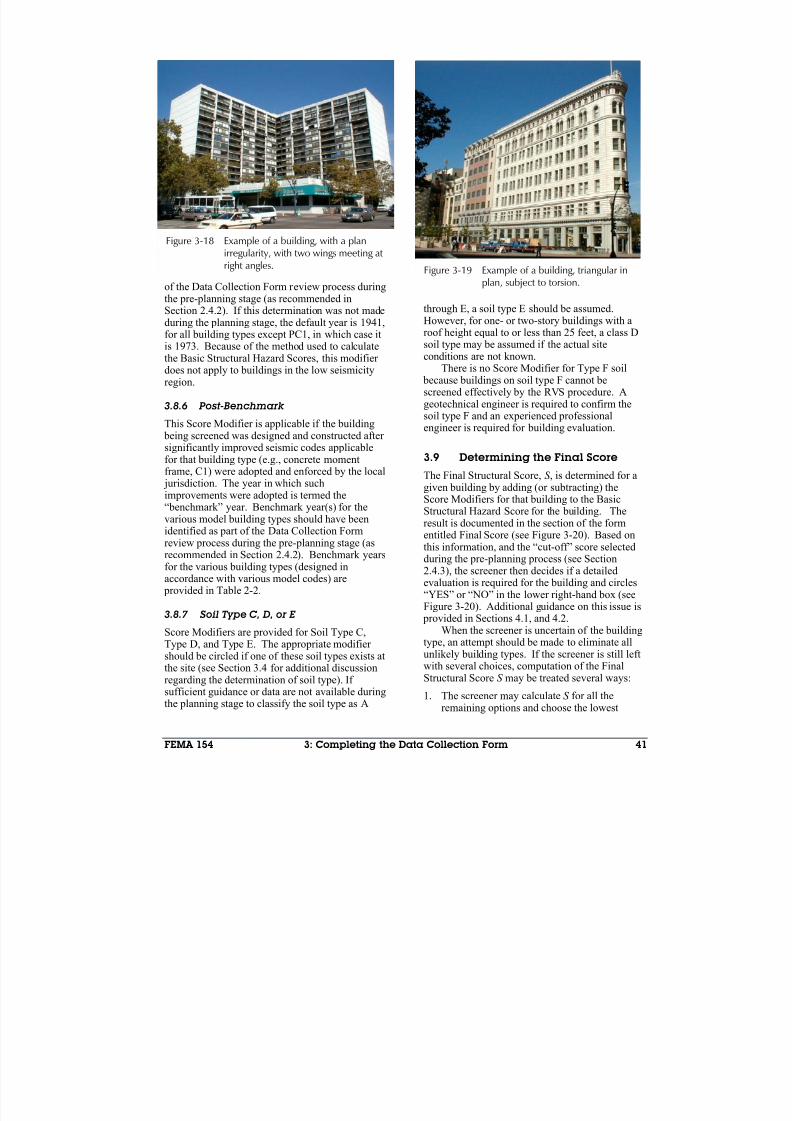
8/3/2019 Statewide Seismic Needs Assessment report
http://slidepdf.com/reader/full/statewide-seismic-needs-assessment-report 242/341

8/3/2019 Statewide Seismic Needs Assessment report
http://slidepdf.com/reader/full/statewide-seismic-needs-assessment-report 243/341
42 3: Completing the Data Collection Form FEMA 154
Figure 3-20 Location on Data Collection Formwhere the final score, comments, andan indication if the building needsdetailed evaluation are documented.
score. This is a conservative approach, andhas the disadvantage that it may be tooconservative and the assigned score mayindicate that the building presents a greater risk than it actually does. This conservativeapproach will not pose problems in caseswhere all the possible remaining buildingtypes result in scores below the cut-off value.In all these cases the building hascharacteristics that justify further reviewanyway by a design professional experiencedin seismic design.
2. If the screener has little or no confidenceabout any choice for the structural system, thescreener should write DNK below the word“Building Type” (see Figure 3-7), whichindicates the screener does not know. In thiscase there should be an automatic default tothe need for a detailed review of the building by an experienced design professional. A more
detailed field inspection would includeentering the building, and examining the basement, roof, and all structural elements.
Which of these two options the RVS authoritywishes to adopt should be decided in the RVS planning phase (see Section 2.3).
3.10 Photographing the Building
At least one photograph of the building should be
taken for identification purposes. The screener isnot limited to one photograph. A photographcontains much more information, although perhapsless emphasized, than the elevation sketch. Large buildings are difficult to photograph from thestreet and the camera lens introduces distortion for high-rise buildings. If possible, the photographshould be taken from a sufficient distance toinclude the whole building, and such that adjacentfaces are included. A wide angle or a zoom lensmay be helpful. Strong sunlit facades should beavoided, as harsh contrasts between shadows andsunlit portions of the facade will be introduced.
Lastly, if possible, the front of the building shouldnot be obscured by trees, vehicles or other objects,as they obscure the lower (and often the mostimportant) stories.
3.11 Comments Section
This last section of the form (see Figure 3-20) isfor recording any comments the screener maywish to make regarding the building, occupancy,condition, quality of the data or unusualcircumstances of any type. For example, if not allsignificant details can be effectively photographed
or drawn, the screener could describe additionalimportant information in the comments area.Comments may be made on the strength of mortar used in a masonry wall, or building features thatcan be seen at or through window openings. Other examples where comments are helpful aredescribed throughout Chapter 3.

8/3/2019 Statewide Seismic Needs Assessment report
http://slidepdf.com/reader/full/statewide-seismic-needs-assessment-report 244/341

8/3/2019 Statewide Seismic Needs Assessment report
http://slidepdf.com/reader/full/statewide-seismic-needs-assessment-report 245/341

8/3/2019 Statewide Seismic Needs Assessment report
http://slidepdf.com/reader/full/statewide-seismic-needs-assessment-report 246/341
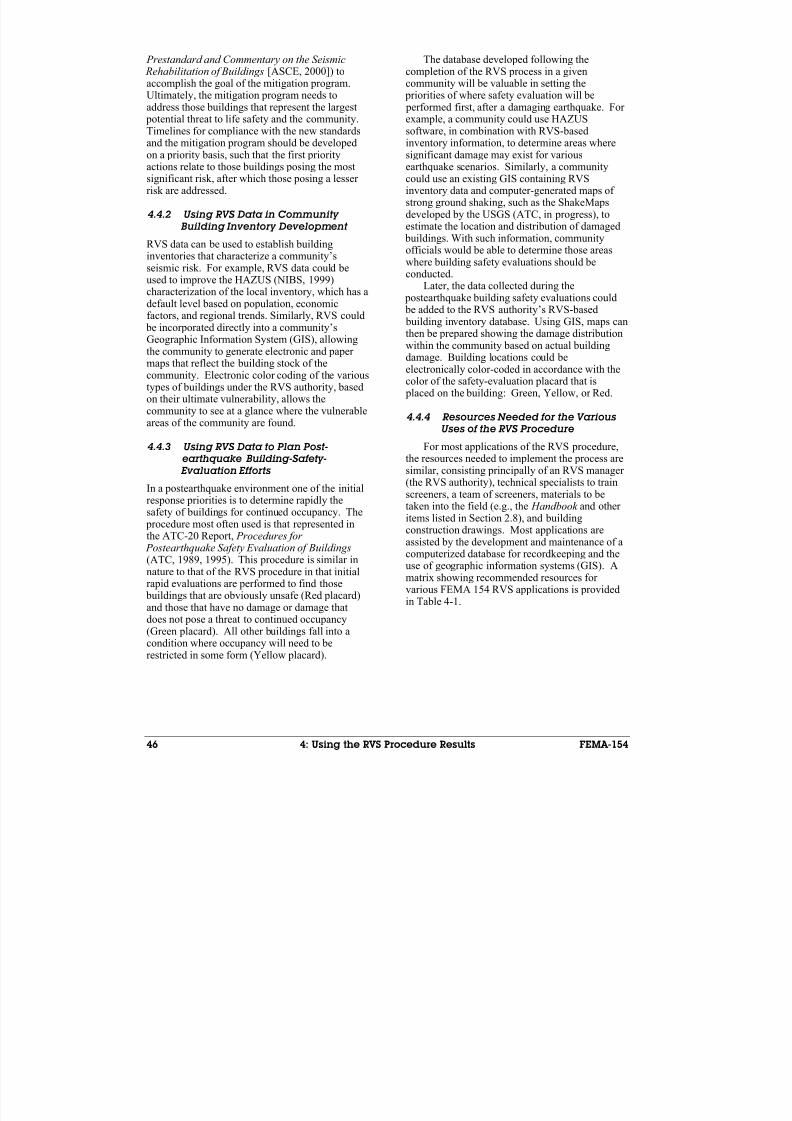
8/3/2019 Statewide Seismic Needs Assessment report
http://slidepdf.com/reader/full/statewide-seismic-needs-assessment-report 247/341
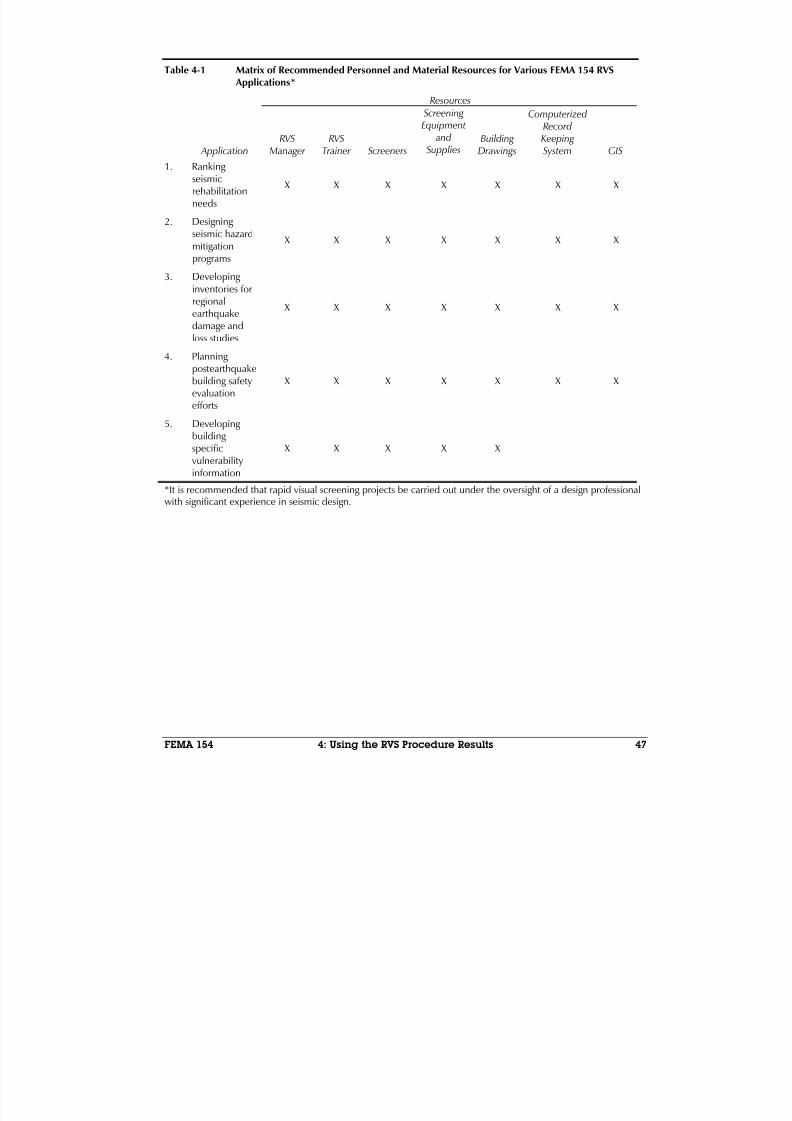
8/3/2019 Statewide Seismic Needs Assessment report
http://slidepdf.com/reader/full/statewide-seismic-needs-assessment-report 248/341

8/3/2019 Statewide Seismic Needs Assessment report
http://slidepdf.com/reader/full/statewide-seismic-needs-assessment-report 249/341
8/3/2019 Statewide Seismic Needs Assessment report
http://slidepdf.com/reader/full/statewide-seismic-needs-assessment-report 250/341
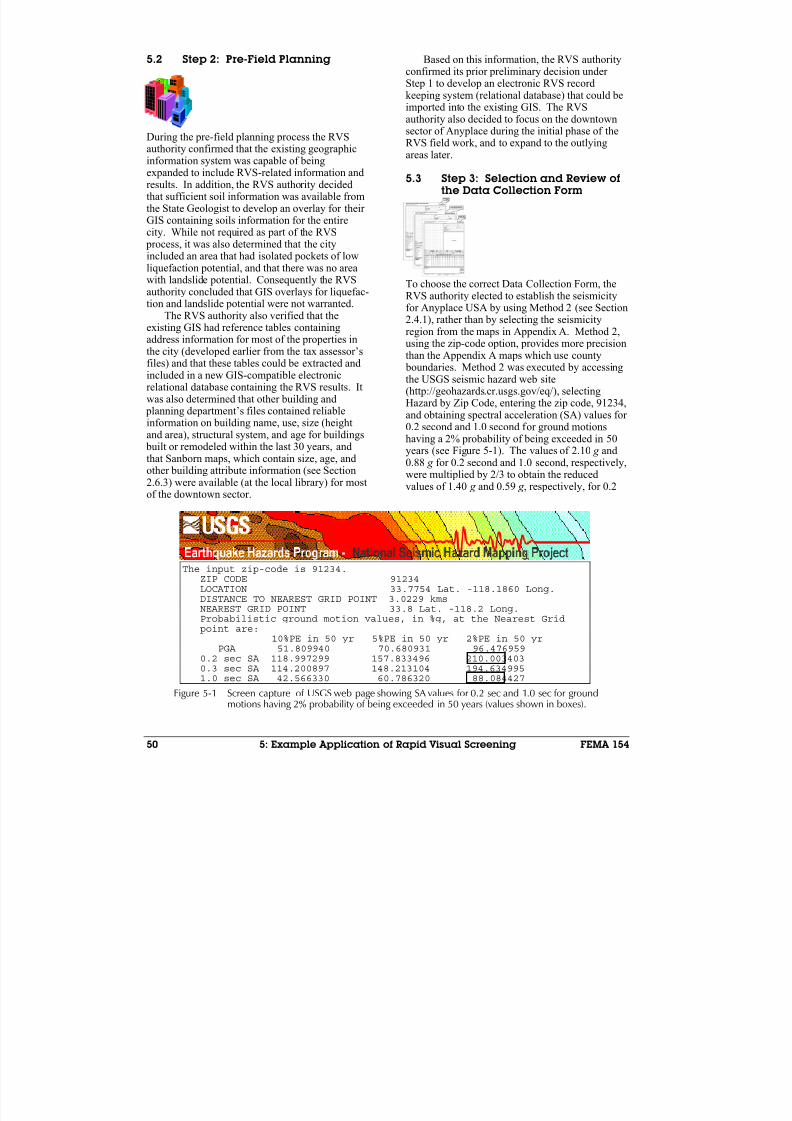
8/3/2019 Statewide Seismic Needs Assessment report
http://slidepdf.com/reader/full/statewide-seismic-needs-assessment-report 251/341
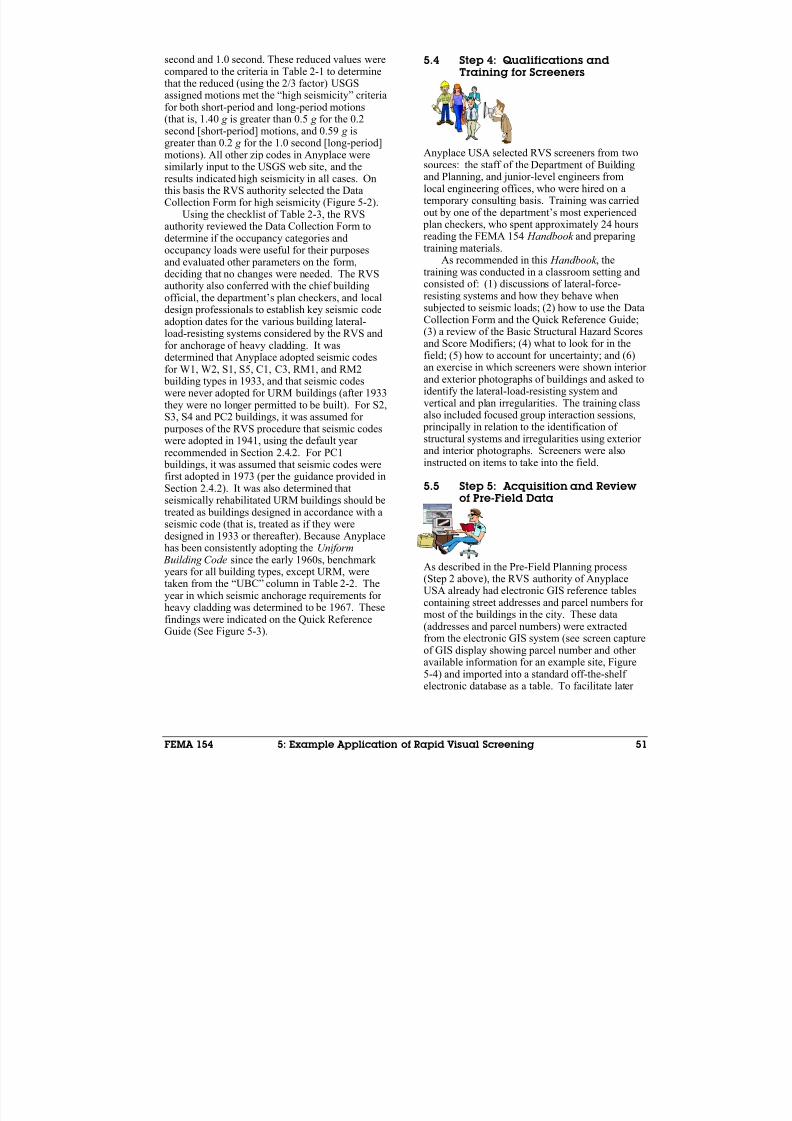
8/3/2019 Statewide Seismic Needs Assessment report
http://slidepdf.com/reader/full/statewide-seismic-needs-assessment-report 252/341
FEMA 154 5: Example Application of Rapid Visual Screening 51
second and 1.0 second. These reduced values werecompared to the criteria in Table 2-1 to determinethat the reduced (using the 2/3 factor) USGSassigned motions met the “high seismicity” criteriafor both short-period and long-period motions(that is, 1.40 g is greater than 0.5 g for the 0.2second [short-period] motions, and 0.59 g isgreater than 0.2 g for the 1.0 second [long-period]
motions). All other zip codes in Anyplace weresimilarly input to the USGS web site, and theresults indicated high seismicity in all cases. Onthis basis the RVS authority selected the DataCollection Form for high seismicity (Figure 5-2).
Using the checklist of Table 2-3, the RVSauthority reviewed the Data Collection Form todetermine if the occupancy categories andoccupancy loads were useful for their purposesand evaluated other parameters on the form,deciding that no changes were needed. The RVSauthority also conferred with the chief building
official, the department’s plan checkers, and localdesign professionals to establish key seismic codeadoption dates for the various building lateral-load-resisting systems considered by the RVS andfor anchorage of heavy cladding. It wasdetermined that Anyplace adopted seismic codesfor W1, W2, S1, S5, C1, C3, RM1, and RM2 building types in 1933, and that seismic codeswere never adopted for URM buildings (after 1933they were no longer permitted to be built). For S2,S3, S4 and PC2 buildings, it was assumed for purposes of the RVS procedure that seismic codeswere adopted in 1941, using the default year
recommended in Section 2.4.2. For PC1 buildings, it was assumed that seismic codes werefirst adopted in 1973 (per the guidance provided inSection 2.4.2). It was also determined thatseismically rehabilitated URM buildings should betreated as buildings designed in accordance with aseismic code (that is, treated as if they weredesigned in 1933 or thereafter). Because Anyplacehas been consistently adopting the Uniform Building Code since the early 1960s, benchmark years for all building types, except URM, weretaken from the “UBC” column in Table 2-2. Theyear in which seismic anchorage requirements for
heavy cladding was determined to be 1967. Thesefindings were indicated on the Quick ReferenceGuide (See Figure 5-3).
5.4 Step 4: Qualifications andTraining for Screeners
Anyplace USA selected RVS screeners from twosources: the staff of the Department of Buildingand Planning, and junior-level engineers fromlocal engineering offices, who were hired on atemporary consulting basis. Training was carriedout by one of the department’s most experienced plan checkers, who spent approximately 24 hoursreading the FEMA 154 Handbook and preparingtraining materials.
As recommended in this Handbook , thetraining was conducted in a classroom setting andconsisted of: (1) discussions of lateral-force-resisting systems and how they behave whensubjected to seismic loads; (2) how to use the DataCollection Form and the Quick Reference Guide;(3) a review of the Basic Structural Hazard Scoresand Score Modifiers; (4) what to look for in thefield; (5) how to account for uncertainty; and (6)an exercise in which screeners were shown interior and exterior photographs of buildings and asked toidentify the lateral-load-resisting system andvertical and plan irregularities. The training classalso included focused group interaction sessions, principally in relation to the identification of structural systems and irregularities using exterior
and interior photographs. Screeners were alsoinstructed on items to take into the field.
5.5 Step 5: Acquisition and Reviewof Pre-Field Data
As described in the Pre-Field Planning process(Step 2 above), the RVS authority of AnyplaceUSA already had electronic GIS reference tables
containing street addresses and parcel numbers for most of the buildings in the city. These data(addresses and parcel numbers) were extractedfrom the electronic GIS system (see screen captureof GIS display showing parcel number and other available information for an example site, Figure5-4) and imported into a standard off-the-shelf electronic database as a table. To facilitate later
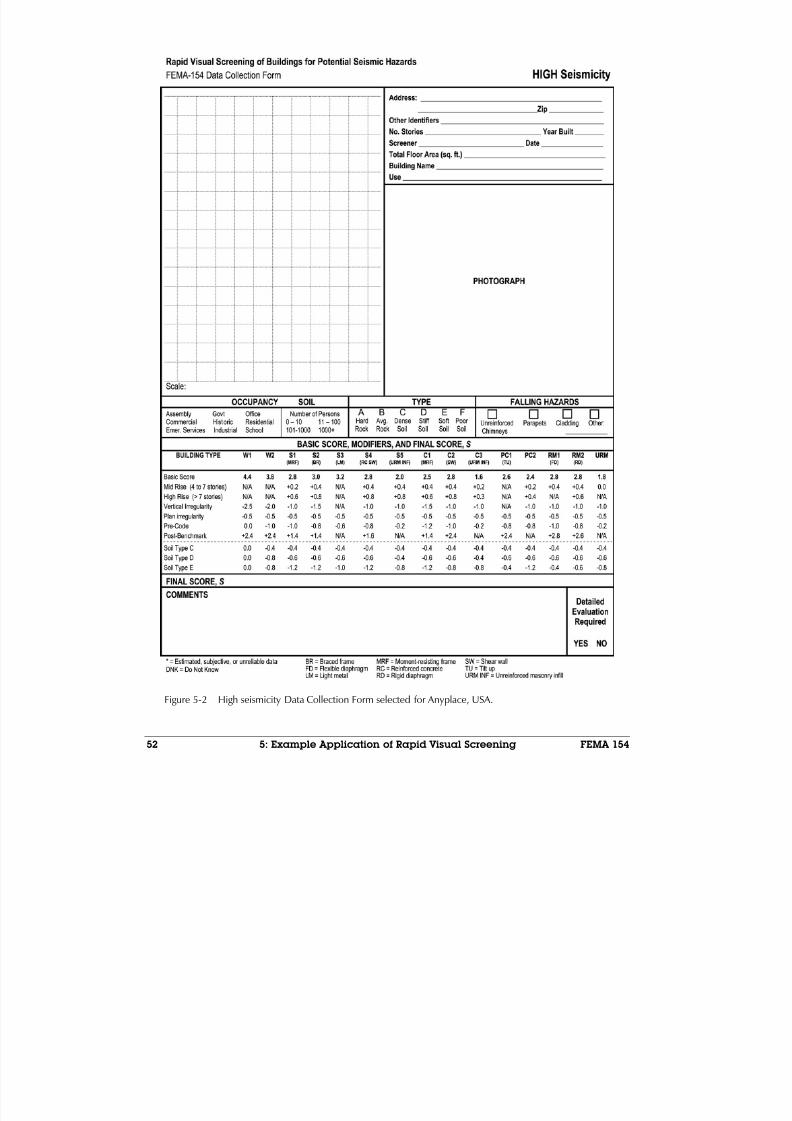
8/3/2019 Statewide Seismic Needs Assessment report
http://slidepdf.com/reader/full/statewide-seismic-needs-assessment-report 253/341

8/3/2019 Statewide Seismic Needs Assessment report
http://slidepdf.com/reader/full/statewide-seismic-needs-assessment-report 254/341
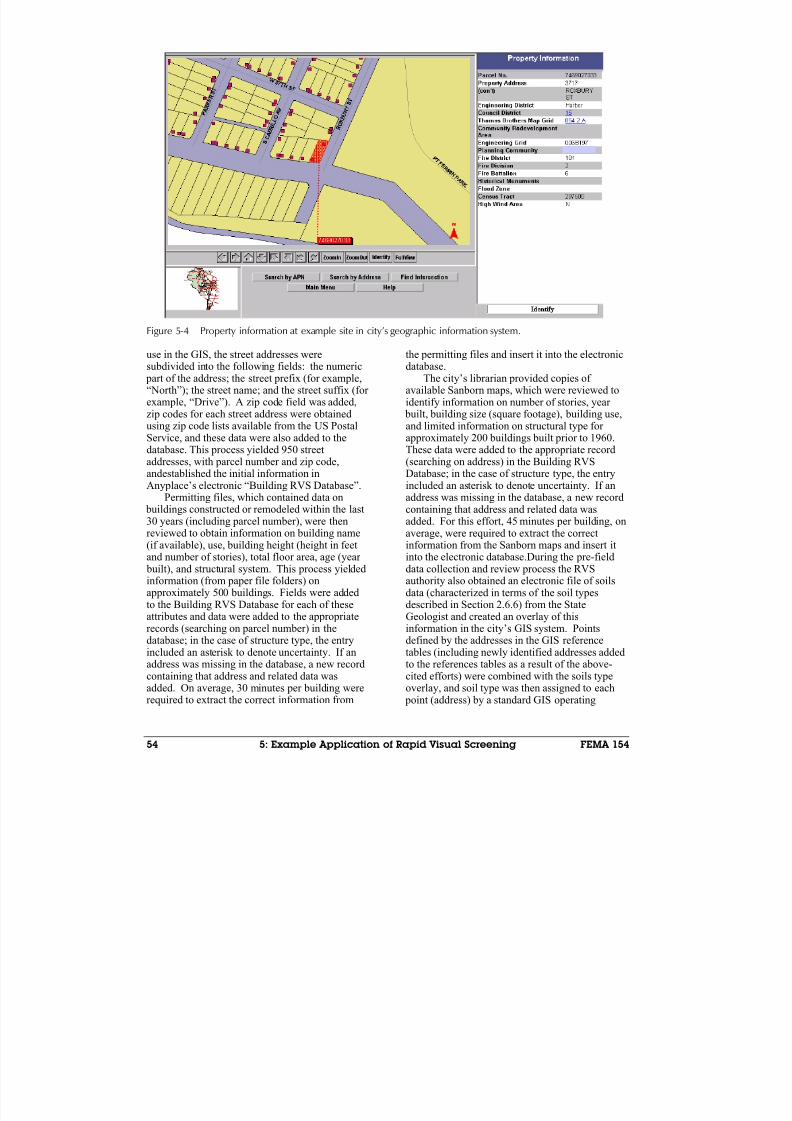
8/3/2019 Statewide Seismic Needs Assessment report
http://slidepdf.com/reader/full/statewide-seismic-needs-assessment-report 255/341
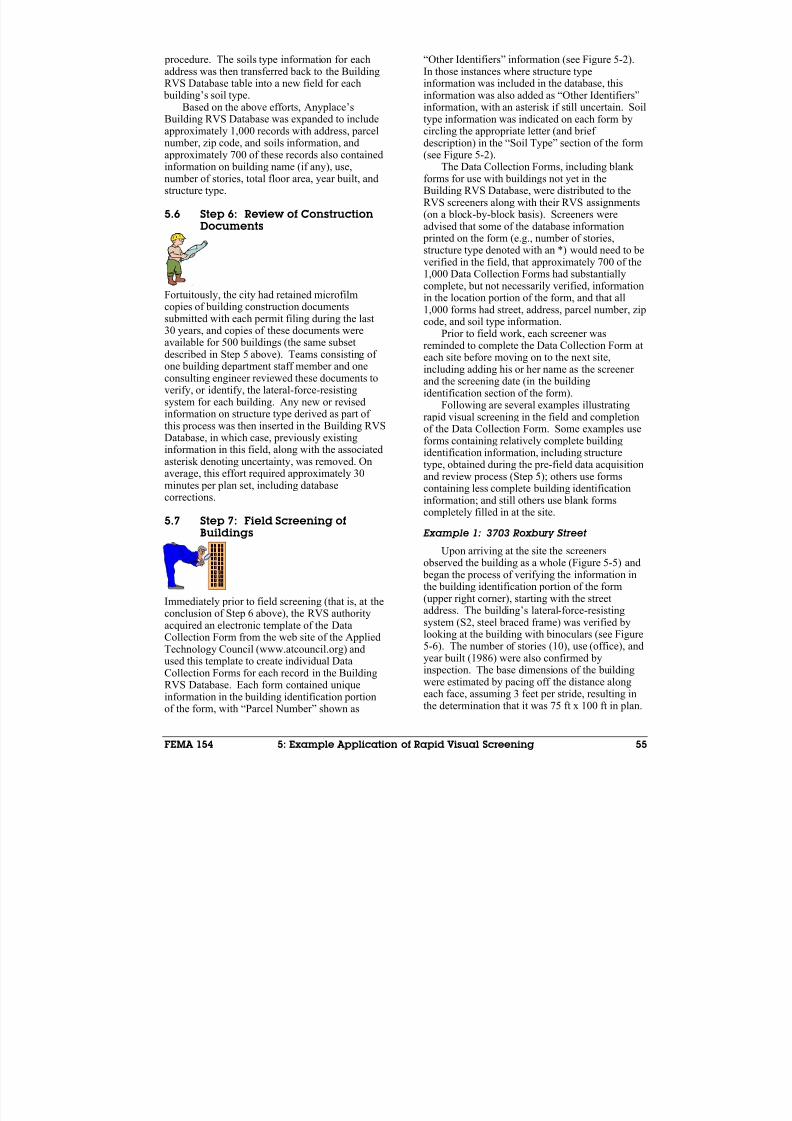
8/3/2019 Statewide Seismic Needs Assessment report
http://slidepdf.com/reader/full/statewide-seismic-needs-assessment-report 256/341
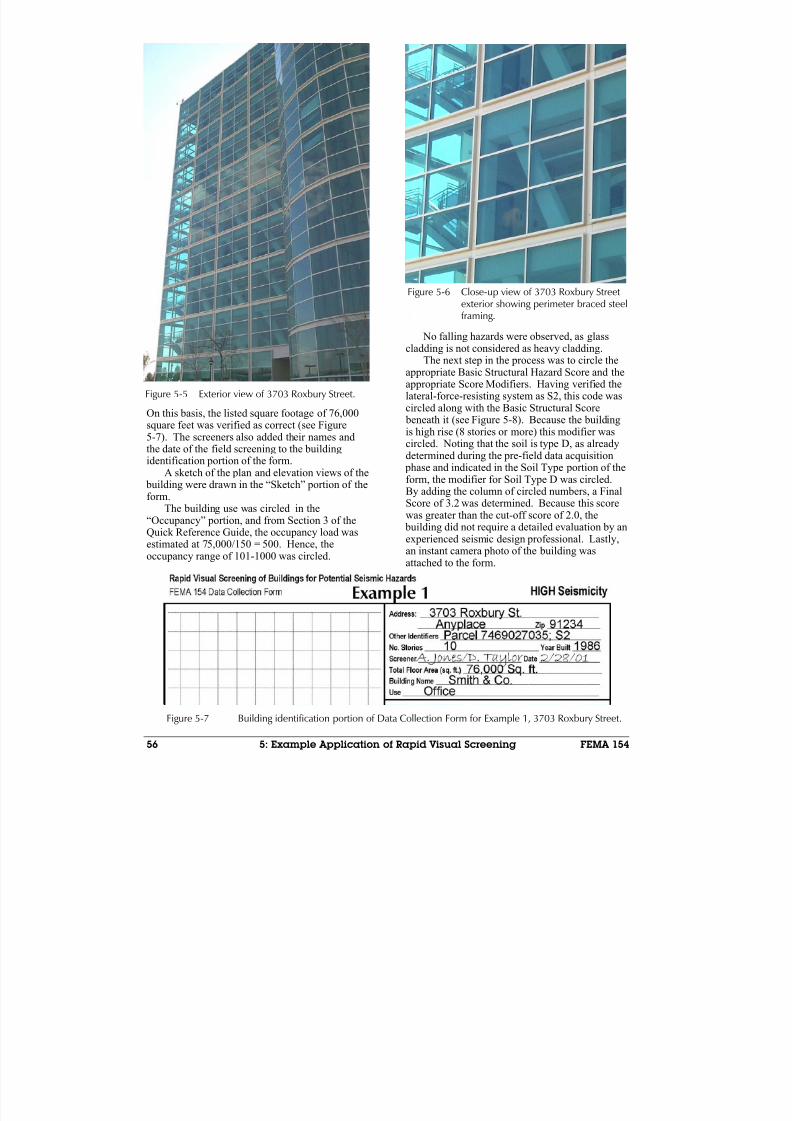
8/3/2019 Statewide Seismic Needs Assessment report
http://slidepdf.com/reader/full/statewide-seismic-needs-assessment-report 257/341
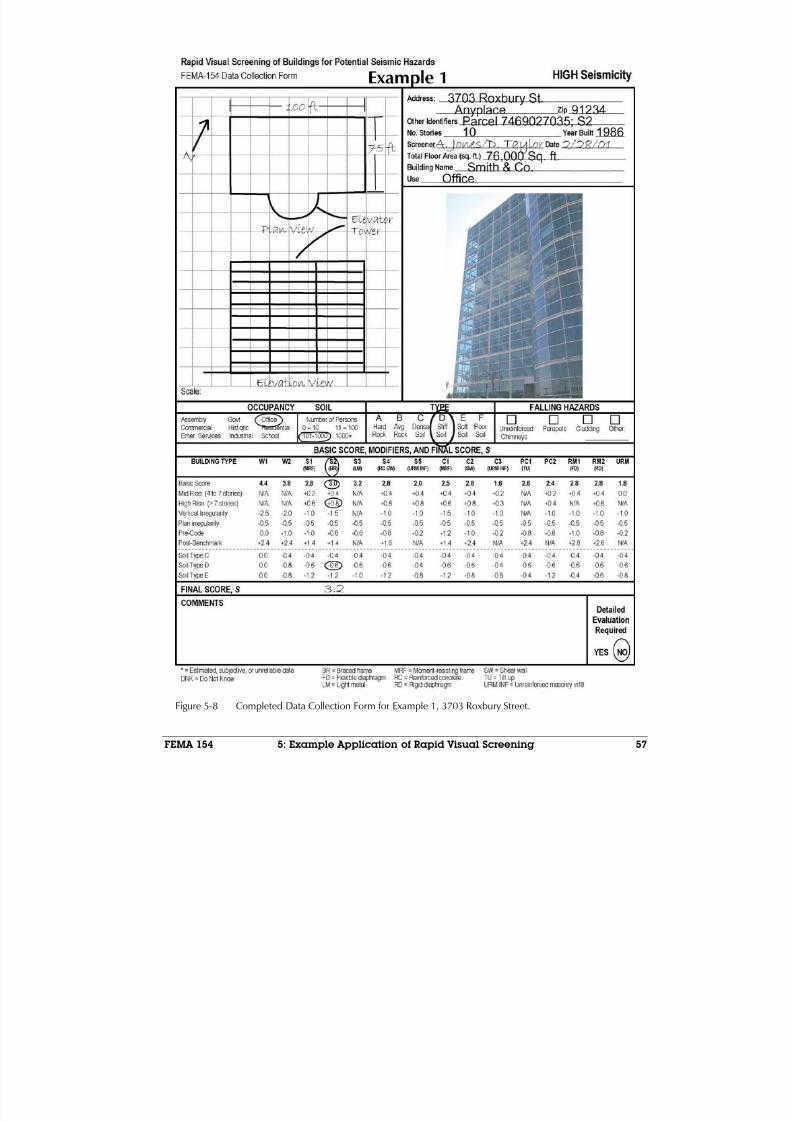
8/3/2019 Statewide Seismic Needs Assessment report
http://slidepdf.com/reader/full/statewide-seismic-needs-assessment-report 258/341
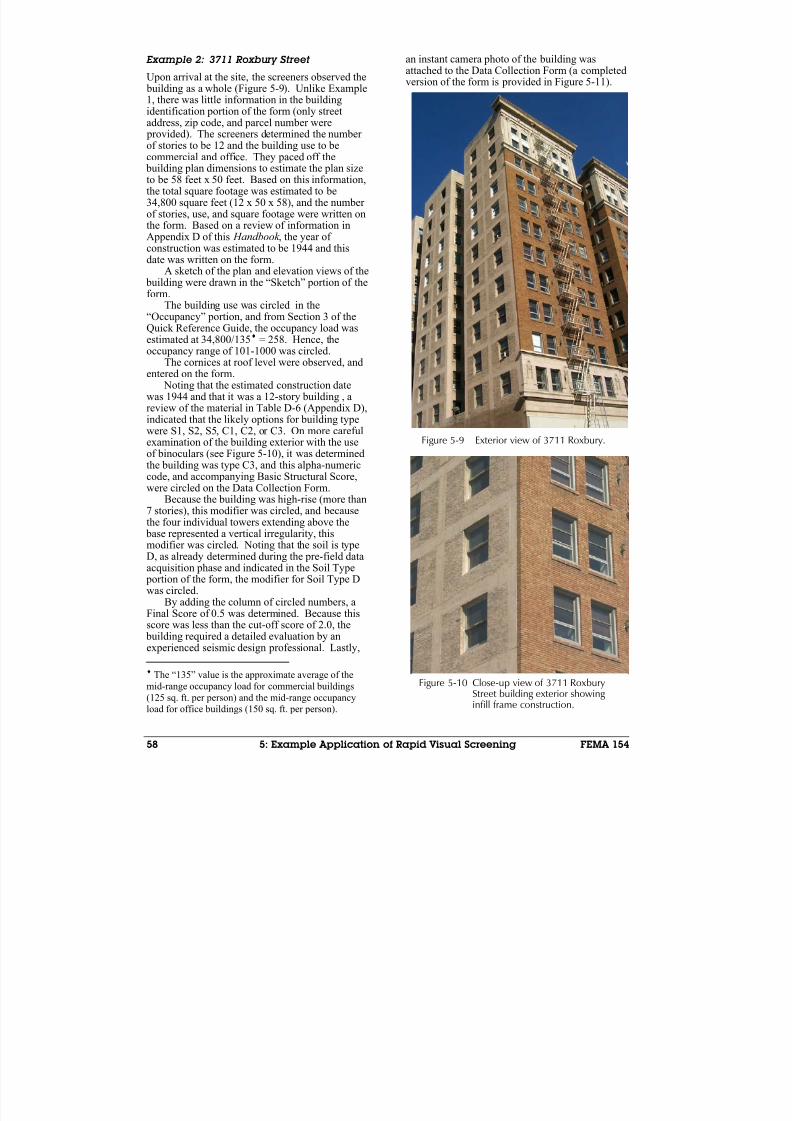
8/3/2019 Statewide Seismic Needs Assessment report
http://slidepdf.com/reader/full/statewide-seismic-needs-assessment-report 259/341
58 5: Example Application of Rapid Visual Screening FEMA 154
Example 2: 3711 Roxbury Street
Upon arrival at the site, the screeners observed the building as a whole (Figure 5-9). Unlike Example1, there was little information in the buildingidentification portion of the form (only streetaddress, zip code, and parcel number were provided). The screeners determined the number of stories to be 12 and the building use to becommercial and office. They paced off the building plan dimensions to estimate the plan sizeto be 58 feet x 50 feet. Based on this information,the total square footage was estimated to be34,800 square feet (12 x 50 x 58), and the number of stories, use, and square footage were written onthe form. Based on a review of information inAppendix D of this Handbook , the year of construction was estimated to be 1944 and thisdate was written on the form.
A sketch of the plan and elevation views of the building were drawn in the “Sketch” portion of theform.
The building use was circled in the“Occupancy” portion, and from Section 3 of theQuick Reference Guide, the occupancy load wasestimated at 34,800/135♦ = 258. Hence, theoccupancy range of 101-1000 was circled.
The cornices at roof level were observed, andentered on the form.
Noting that the estimated construction datewas 1944 and that it was a 12-story building , areview of the material in Table D-6 (Appendix D),indicated that the likely options for building typewere S1, S2, S5, C1, C2, or C3. On more carefulexamination of the building exterior with the use
of binoculars (see Figure 5-10), it was determinedthe building was type C3, and this alpha-numericcode, and accompanying Basic Structural Score,were circled on the Data Collection Form.
Because the building was high-rise (more than7 stories), this modifier was circled, and becausethe four individual towers extending above the base represented a vertical irregularity, thismodifier was circled. Noting that the soil is typeD, as already determined during the pre-field dataacquisition phase and indicated in the Soil Type portion of the form, the modifier for Soil Type Dwas circled.
By adding the column of circled numbers, aFinal Score of 0.5 was determined. Because thisscore was less than the cut-off score of 2.0, the building required a detailed evaluation by anexperienced seismic design professional. Lastly,
♦ The “135” value is the approximate average of themid-range occupancy load for commercial buildings(125 sq. ft. per person) and the mid-range occupancyload for office buildings (150 sq. ft. per person).
an instant camera photo of the building wasattached to the Data Collection Form (a completedversion of the form is provided in Figure 5-11).
Figure 5-9 Exterior view of 3711 Roxbury.
Figure 5-10 Close-up view of 3711 RoxburyStreet building exterior showing infill frame construction.
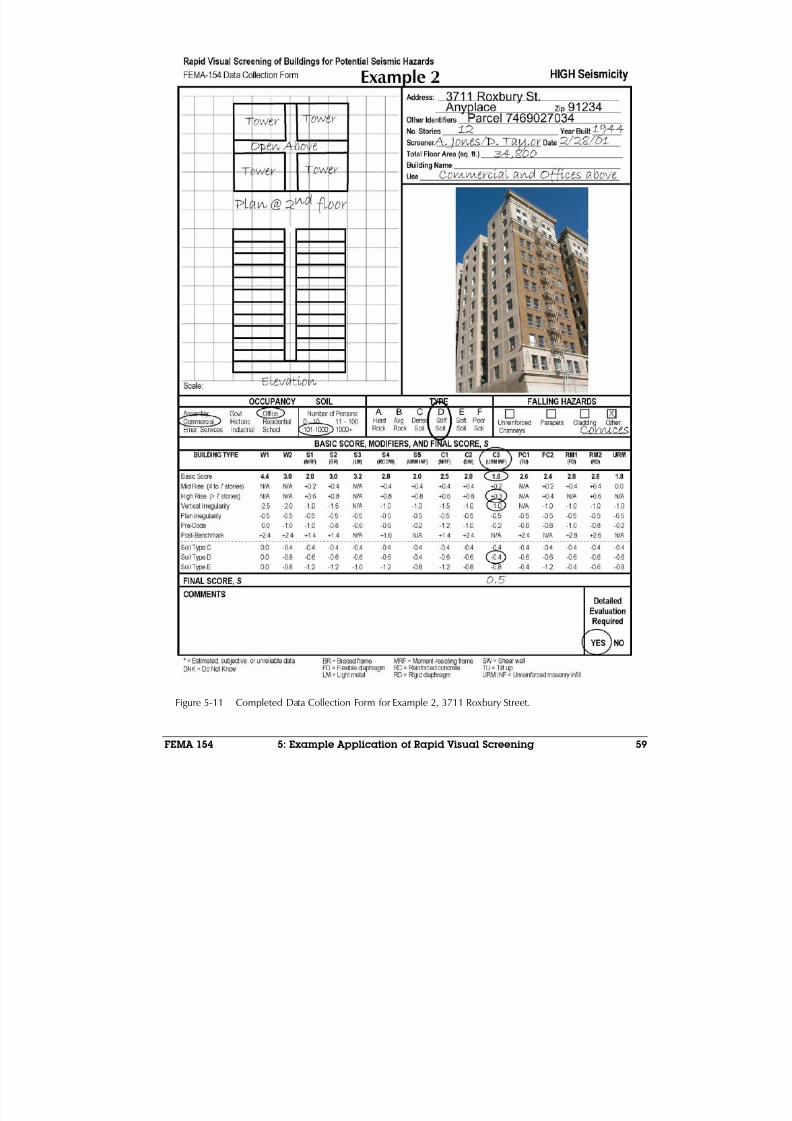
8/3/2019 Statewide Seismic Needs Assessment report
http://slidepdf.com/reader/full/statewide-seismic-needs-assessment-report 260/341
FEMA 154 5: Example Application of Rapid Visual Screening 59
Figure 5-11 Completed Data Collection Form for Example 2, 3711 Roxbury Street.
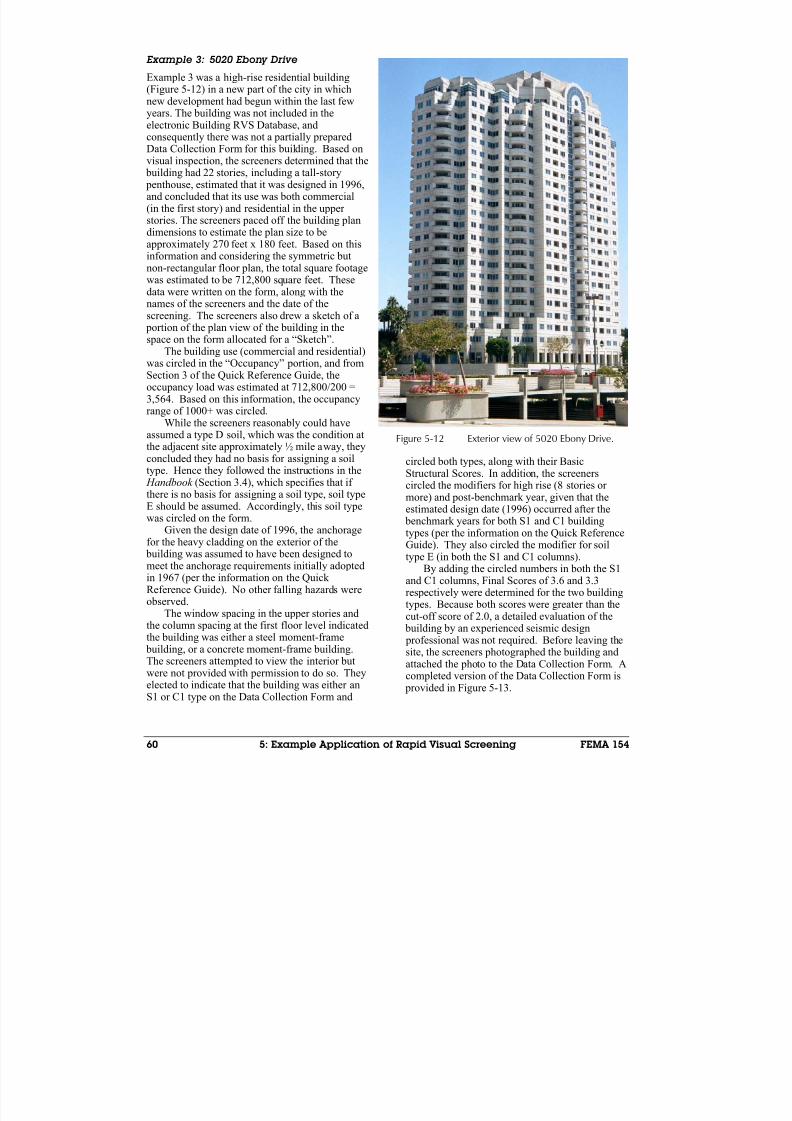
8/3/2019 Statewide Seismic Needs Assessment report
http://slidepdf.com/reader/full/statewide-seismic-needs-assessment-report 261/341
60 5: Example Application of Rapid Visual Screening FEMA 154
Example 3: 5020 Ebony Drive
Example 3 was a high-rise residential building(Figure 5-12) in a new part of the city in whichnew development had begun within the last fewyears. The building was not included in theelectronic Building RVS Database, andconsequently there was not a partially prepared
Data Collection Form for this building. Based onvisual inspection, the screeners determined that the building had 22 stories, including a tall-story penthouse, estimated that it was designed in 1996,and concluded that its use was both commercial(in the first story) and residential in the upper stories. The screeners paced off the building plandimensions to estimate the plan size to beapproximately 270 feet x 180 feet. Based on thisinformation and considering the symmetric butnon-rectangular floor plan, the total square footagewas estimated to be 712,800 square feet. Thesedata were written on the form, along with the
names of the screeners and the date of thescreening. The screeners also drew a sketch of a portion of the plan view of the building in thespace on the form allocated for a “Sketch”.
The building use (commercial and residential)was circled in the “Occupancy” portion, and fromSection 3 of the Quick Reference Guide, theoccupancy load was estimated at 712,800/200 =3,564. Based on this information, the occupancyrange of 1000+ was circled.
While the screeners reasonably could haveassumed a type D soil, which was the condition atthe adjacent site approximately ½ mile away, theyconcluded they had no basis for assigning a soiltype. Hence they followed the instructions in the Handbook (Section 3.4), which specifies that if there is no basis for assigning a soil type, soil typeE should be assumed. Accordingly, this soil typewas circled on the form.
Given the design date of 1996, the anchoragefor the heavy cladding on the exterior of the building was assumed to have been designed tomeet the anchorage requirements initially adoptedin 1967 (per the information on the Quick Reference Guide). No other falling hazards were
observed.The window spacing in the upper stories andthe column spacing at the first floor level indicatedthe building was either a steel moment-frame building, or a concrete moment-frame building.The screeners attempted to view the interior butwere not provided with permission to do so. Theyelected to indicate that the building was either anS1 or C1 type on the Data Collection Form and
circled both types, along with their BasicStructural Scores. In addition, the screenerscircled the modifiers for high rise (8 stories or more) and post-benchmark year, given that theestimated design date (1996) occurred after the benchmark years for both S1 and C1 buildingtypes (per the information on the Quick ReferenceGuide). They also circled the modifier for soiltype E (in both the S1 and C1 columns).
By adding the circled numbers in both the S1and C1 columns, Final Scores of 3.6 and 3.3respectively were determined for the two building
types. Because both scores were greater than thecut-off score of 2.0, a detailed evaluation of the building by an experienced seismic design professional was not required. Before leaving thesite, the screeners photographed the building andattached the photo to the Data Collection Form. Acompleted version of the Data Collection Form is provided in Figure 5-13.
Figure 5-12 Exterior view of 5020 Ebony Drive.
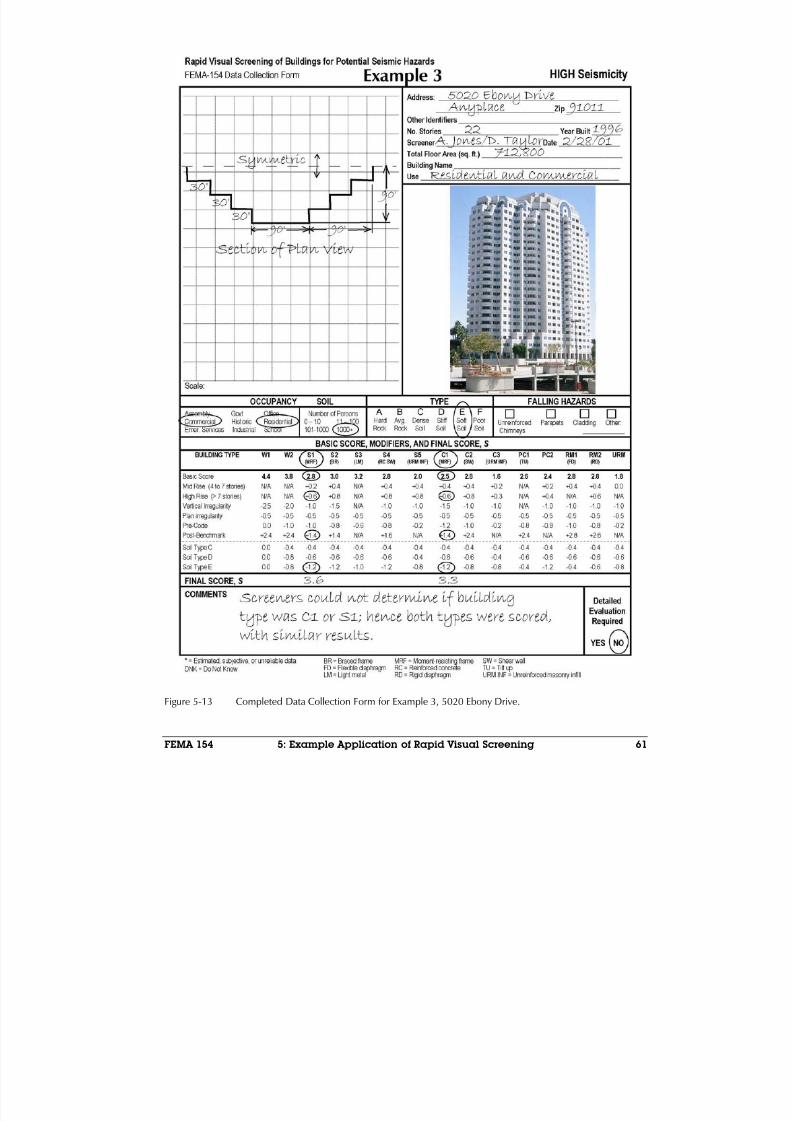
8/3/2019 Statewide Seismic Needs Assessment report
http://slidepdf.com/reader/full/statewide-seismic-needs-assessment-report 262/341
FEMA 154 5: Example Application of Rapid Visual Screening 61
Figure 5-13 Completed Data Collection Form for Example 3, 5020 Ebony Drive.
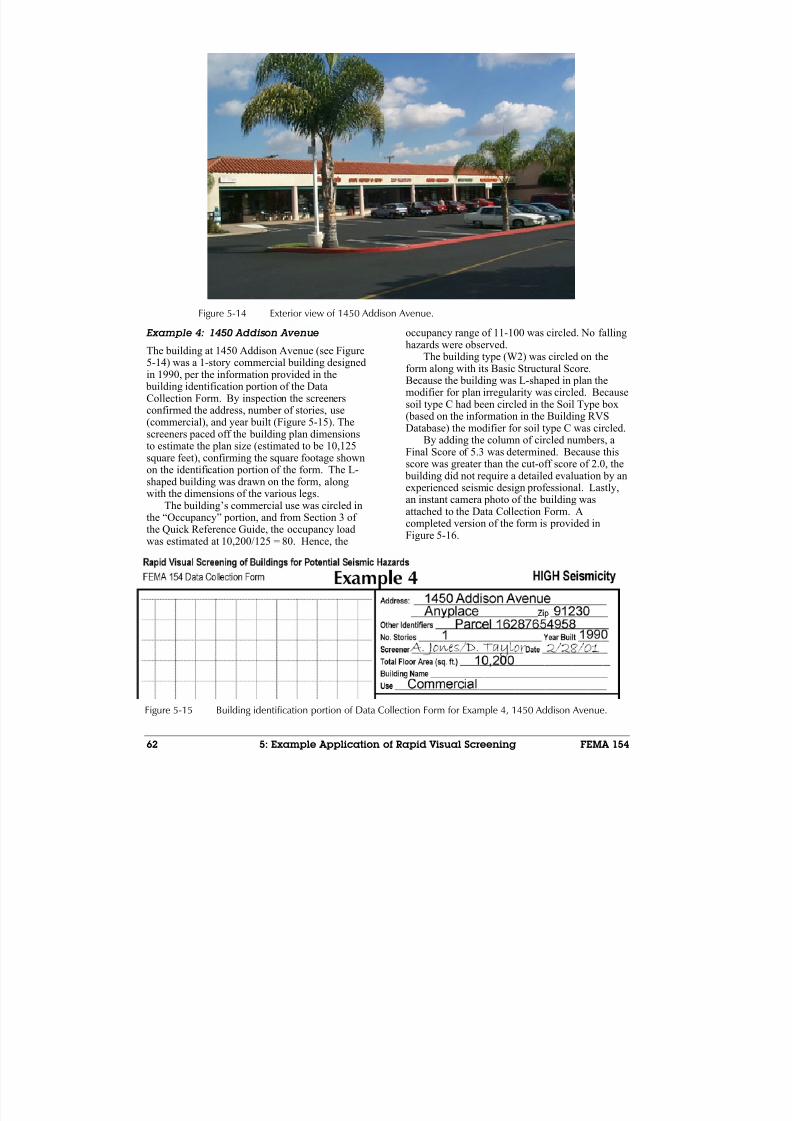
8/3/2019 Statewide Seismic Needs Assessment report
http://slidepdf.com/reader/full/statewide-seismic-needs-assessment-report 263/341
62 5: Example Application of Rapid Visual Screening FEMA 154
Figure 5-15 Building identification portion of Data Collection Form for Example 4, 1450 Addison Avenue.
Example 4: 1450 Addison Avenue
The building at 1450 Addison Avenue (see Figure5-14) was a 1-story commercial building designedin 1990, per the information provided in the building identification portion of the DataCollection Form. By inspection the screenersconfirmed the address, number of stories, use(commercial), and year built (Figure 5-15). Thescreeners paced off the building plan dimensionsto estimate the plan size (estimated to be 10,125
square feet), confirming the square footage shownon the identification portion of the form. The L-shaped building was drawn on the form, alongwith the dimensions of the various legs.
The building’s commercial use was circled inthe “Occupancy” portion, and from Section 3 of the Quick Reference Guide, the occupancy loadwas estimated at 10,200/125 = 80. Hence, the
occupancy range of 11-100 was circled. No fallinghazards were observed.
The building type (W2) was circled on theform along with its Basic Structural Score.Because the building was L-shaped in plan themodifier for plan irregularity was circled. Becausesoil type C had been circled in the Soil Type box(based on the information in the Building RVSDatabase) the modifier for soil type C was circled.
By adding the column of circled numbers, a
Final Score of 5.3 was determined. Because thisscore was greater than the cut-off score of 2.0, the building did not require a detailed evaluation by anexperienced seismic design professional. Lastly,an instant camera photo of the building wasattached to the Data Collection Form. Acompleted version of the form is provided inFigure 5-16.
Figure 5-14 Exterior view of 1450 Addison Avenue.
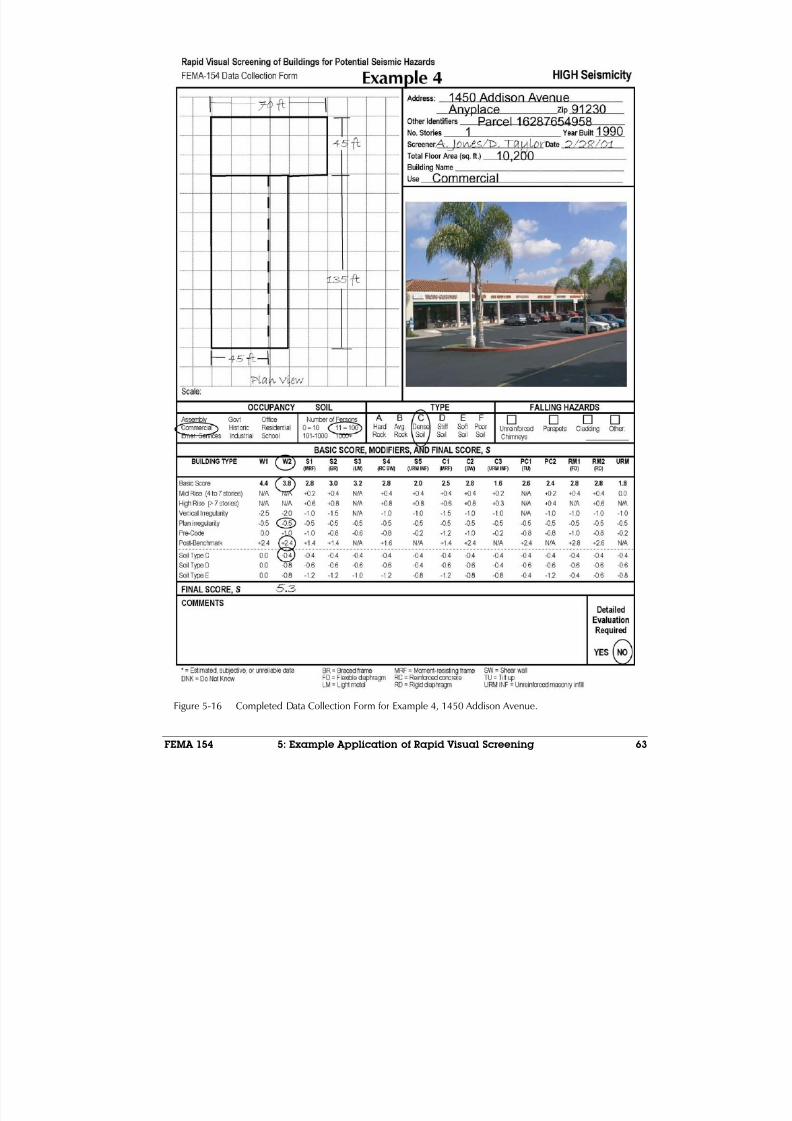
8/3/2019 Statewide Seismic Needs Assessment report
http://slidepdf.com/reader/full/statewide-seismic-needs-assessment-report 264/341
FEMA 154 5: Example Application of Rapid Visual Screening 63
Figure 5-16 Completed Data Collection Form for Example 4, 1450 Addison Avenue.
8/3/2019 Statewide Seismic Needs Assessment report
http://slidepdf.com/reader/full/statewide-seismic-needs-assessment-report 265/341
64 5: Example Application of Rapid Visual Screening FEMA 154
5.8 Step 8: Transferring the RVSField Data to the ElectronicBuilding RVS Database
The last step in the implementation of rapid visualscreening for Anyplace USA was transferring theinformation on the RVS Data Collection Formsinto the relational electronic Building RVSDatabase. This required that all photos andsketches on the forms be scanned and numbered(for reference purposes), and that additional fields(and tables) be added to the database for thoseattributes not originally included in the database.
For quality control purposes, data wereentered separately into two different versions of the electronic database, except photographs and
sketches, which were scanned only once. Adouble-entry data verification process was thenused, whereby the data from one database werecompared to the same entries in the seconddatabase to identify those entries that were notexactly the same. Non-identical entries wereexamined and corrected as necessary. The entire process, including scanning of sketches and
photographs, required approximately 45 minutes per Data Collection Form.
After the electronic Building RVS Databasewas verified, it was imported into the city’s GIS,thereby providing Anyplace with a state-of-the-artcapability to identify and plot building groups based on any set of criteria desired by the city’s policy makers. Photographs and sketches of individual buildings could also be shown in theGIS simply by clicking on the dot or symbol usedto represent each building and selecting thedesired image.
8/3/2019 Statewide Seismic Needs Assessment report
http://slidepdf.com/reader/full/statewide-seismic-needs-assessment-report 266/341
FEMA 154 A: Maps Showing Seismicity Regions 65
Appendix A
Maps ShowingSeismicity Regions
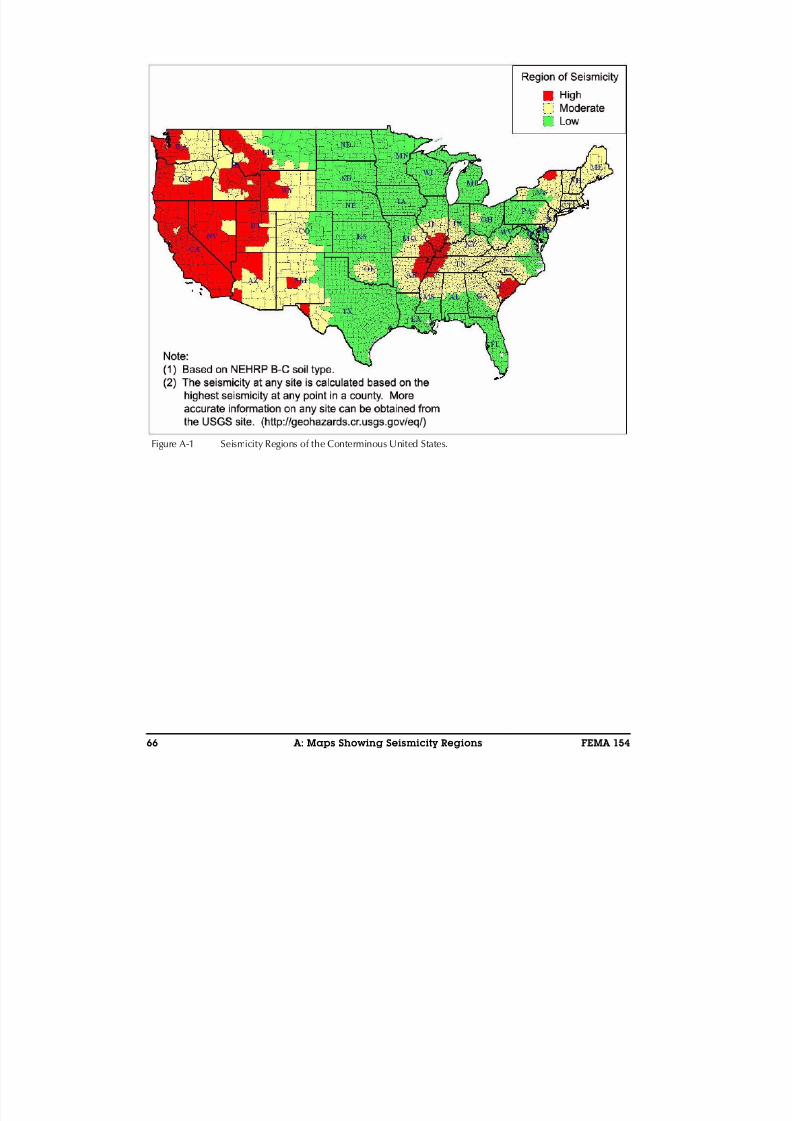
8/3/2019 Statewide Seismic Needs Assessment report
http://slidepdf.com/reader/full/statewide-seismic-needs-assessment-report 267/341
66 A: Maps Showing Seismicity Regions FEMA 154
Figure A-1 Seismicity Regions of the Conterminous United States.
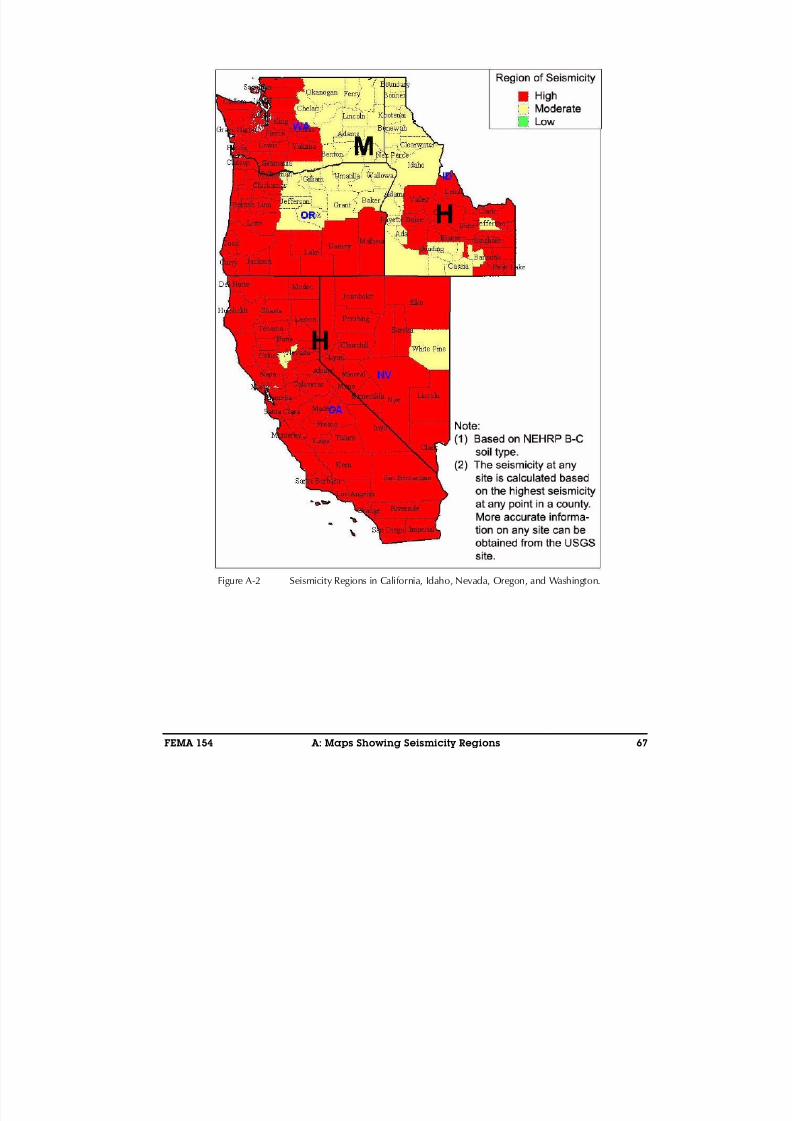
8/3/2019 Statewide Seismic Needs Assessment report
http://slidepdf.com/reader/full/statewide-seismic-needs-assessment-report 268/341
FEMA 154 A: Maps Showing Seismicity Regions 67
Figure A-2 Seismicity Regions in California, Idaho, Nevada, Oregon, and Washington.
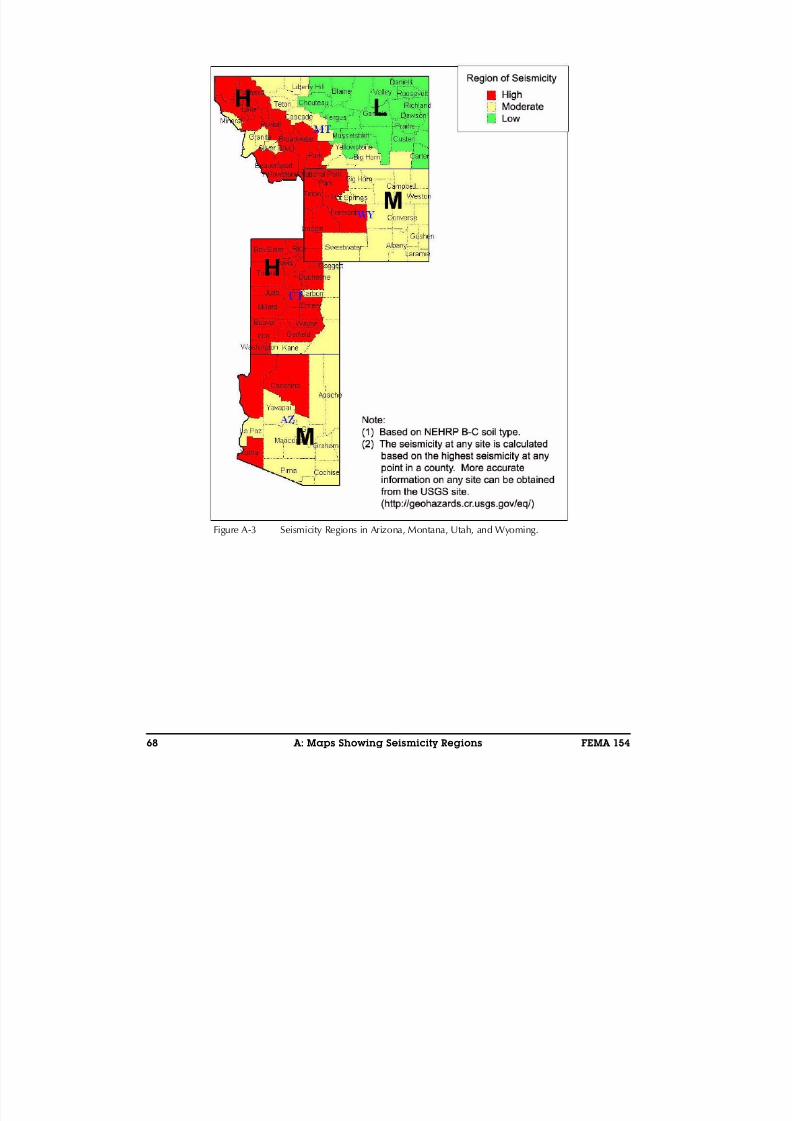
8/3/2019 Statewide Seismic Needs Assessment report
http://slidepdf.com/reader/full/statewide-seismic-needs-assessment-report 269/341
68 A: Maps Showing Seismicity Regions FEMA 154
Figure A-3 Seismicity Regions in Arizona, Montana, Utah, and Wyoming.
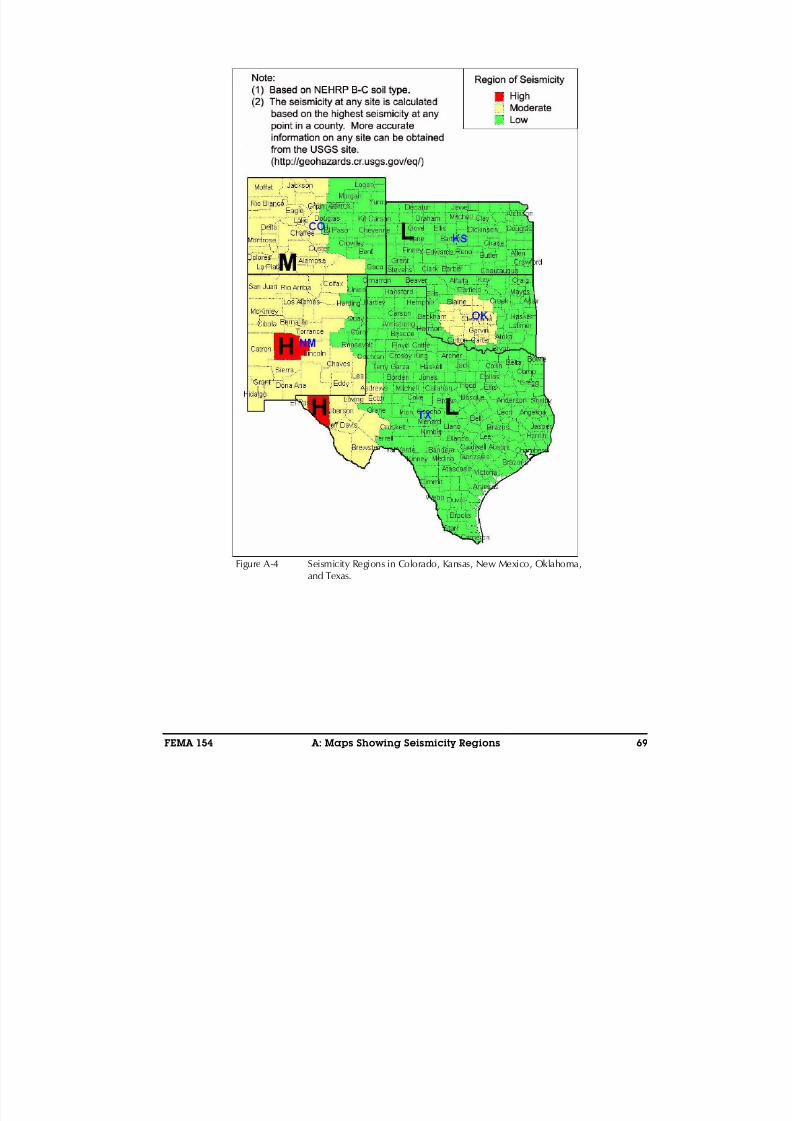
8/3/2019 Statewide Seismic Needs Assessment report
http://slidepdf.com/reader/full/statewide-seismic-needs-assessment-report 270/341
FEMA 154 A: Maps Showing Seismicity Regions 69
Figure A-4 Seismicity Regions in Colorado, Kansas, New Mexico, Oklahoma,and Texas.
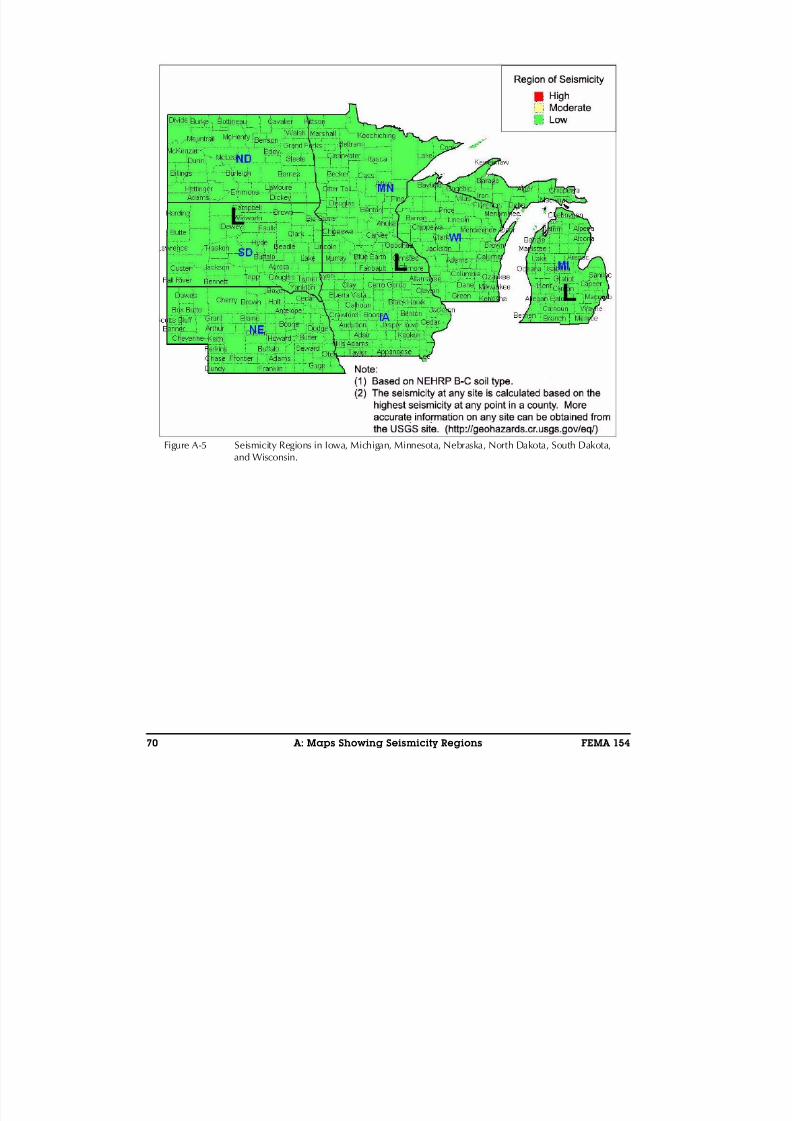
8/3/2019 Statewide Seismic Needs Assessment report
http://slidepdf.com/reader/full/statewide-seismic-needs-assessment-report 271/341
70 A: Maps Showing Seismicity Regions FEMA 154
Figure A-5 Seismicity Regions in Iowa, Michigan, Minnesota, Nebraska, North Dakota, South Dakota,
and Wisconsin.
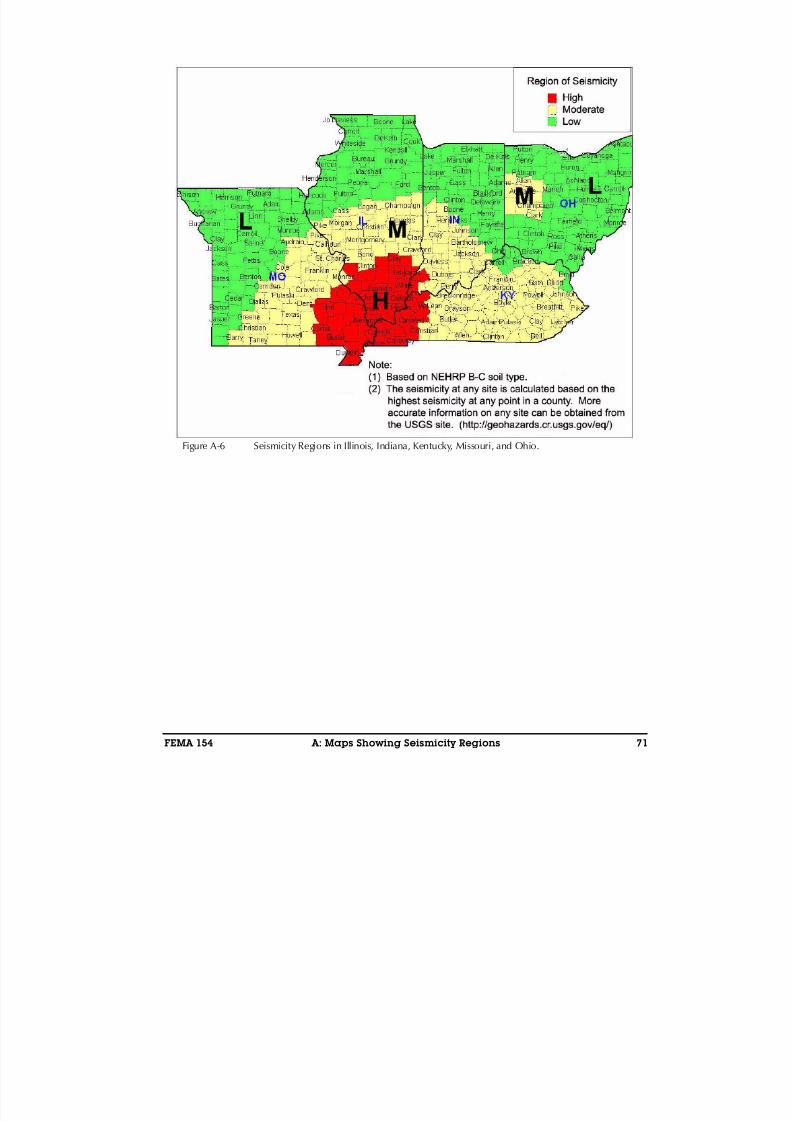
8/3/2019 Statewide Seismic Needs Assessment report
http://slidepdf.com/reader/full/statewide-seismic-needs-assessment-report 272/341
FEMA 154 A: Maps Showing Seismicity Regions 71
Figure A-6 Seismicity Regions in Illinois, Indiana, Kentucky, Missouri, and Ohio.
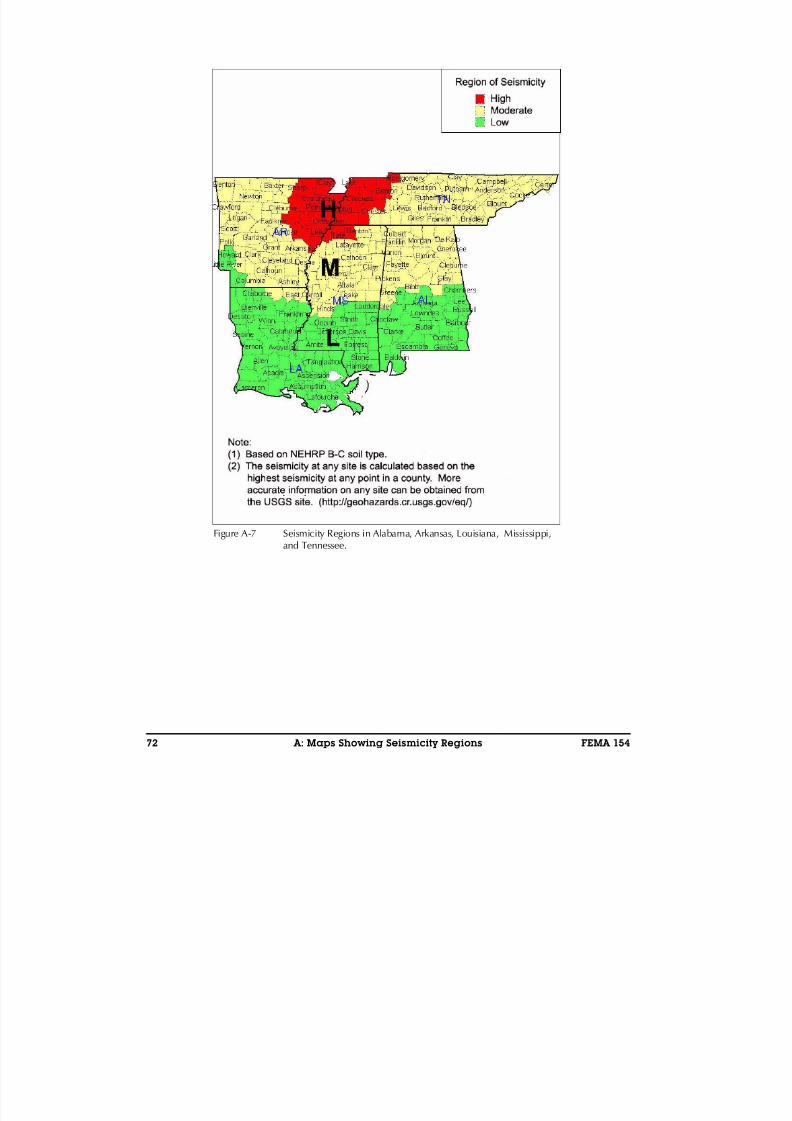
8/3/2019 Statewide Seismic Needs Assessment report
http://slidepdf.com/reader/full/statewide-seismic-needs-assessment-report 273/341
72 A: Maps Showing Seismicity Regions FEMA 154
Figure A-7 Seismicity Regions in Alabama, Arkansas, Louisiana, Mississippi,and Tennessee.
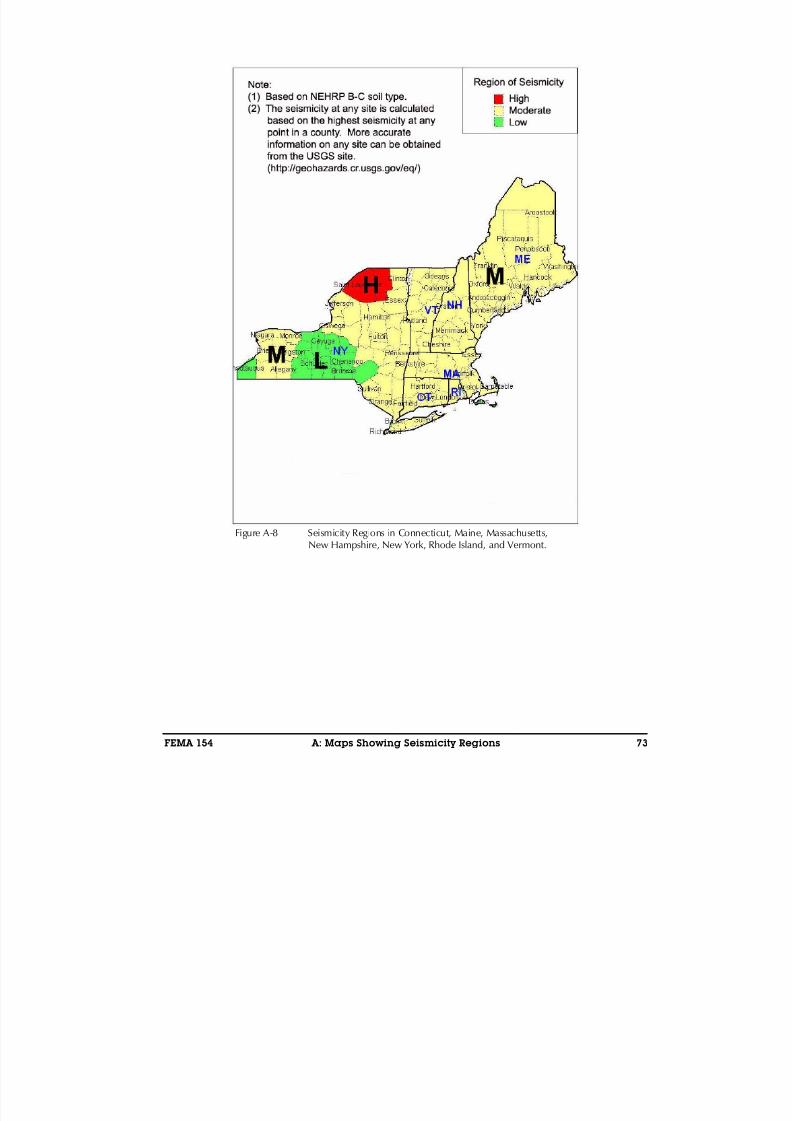
8/3/2019 Statewide Seismic Needs Assessment report
http://slidepdf.com/reader/full/statewide-seismic-needs-assessment-report 274/341
FEMA 154 A: Maps Showing Seismicity Regions 73
Figure A-8 Seismicity Regions in Connecticut, Maine, Massachusetts,New Hampshire, New York, Rhode Island, and Vermont.
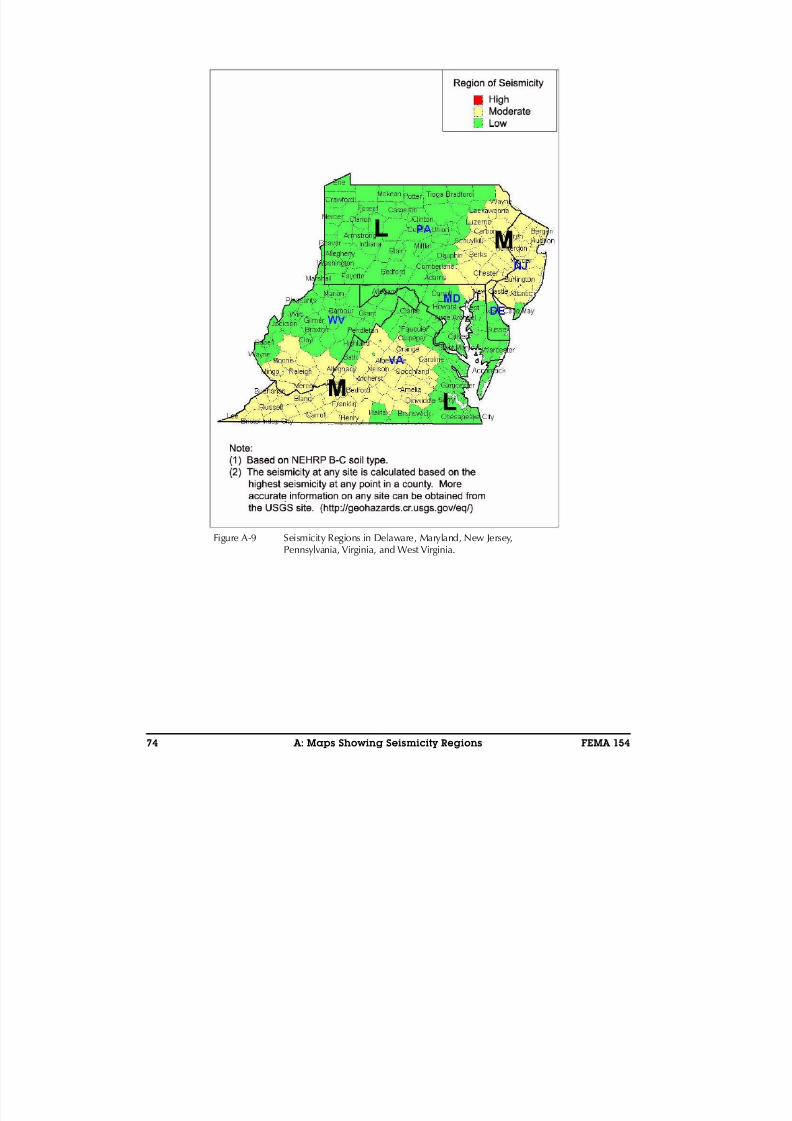
8/3/2019 Statewide Seismic Needs Assessment report
http://slidepdf.com/reader/full/statewide-seismic-needs-assessment-report 275/341
74 A: Maps Showing Seismicity Regions FEMA 154
Figure A-9 Seismicity Regions in Delaware, Maryland, New Jersey,Pennsylvania, Virginia, and West Virginia.
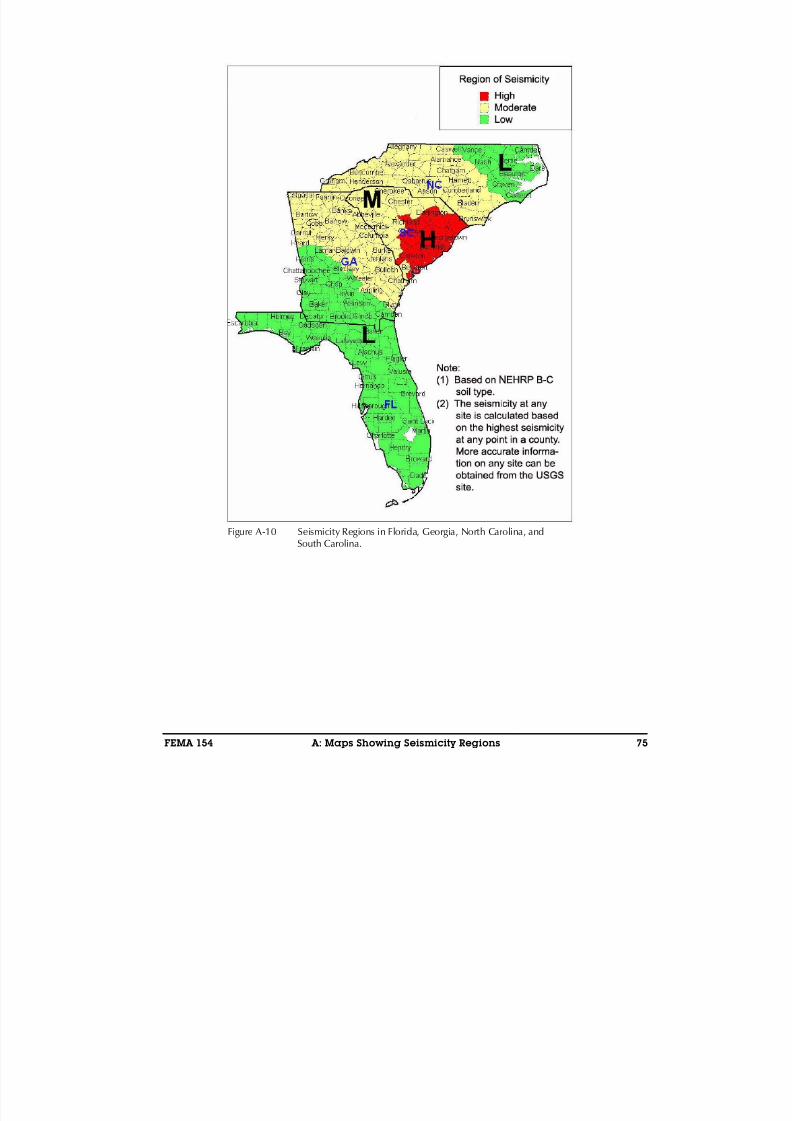
8/3/2019 Statewide Seismic Needs Assessment report
http://slidepdf.com/reader/full/statewide-seismic-needs-assessment-report 276/341
FEMA 154 A: Maps Showing Seismicity Regions 75
Figure A-10 Seismicity Regions in Florida, Georgia, North Carolina, andSouth Carolina.
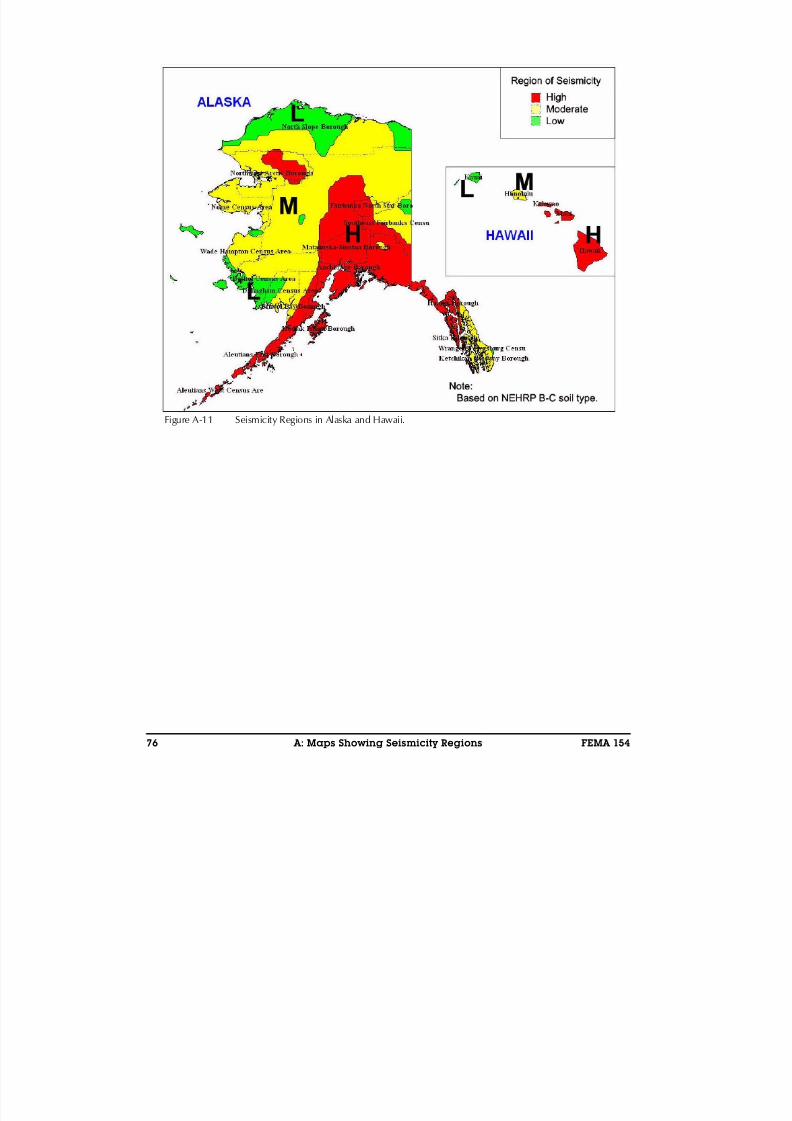
8/3/2019 Statewide Seismic Needs Assessment report
http://slidepdf.com/reader/full/statewide-seismic-needs-assessment-report 277/341
76 A: Maps Showing Seismicity Regions FEMA 154
Figure A-11 Seismicity Regions in Alaska and Hawaii.

8/3/2019 Statewide Seismic Needs Assessment report
http://slidepdf.com/reader/full/statewide-seismic-needs-assessment-report 278/341
FEMA 154 B: Data Collection Forms and Quick Reference Guide 77
Appendix B
Data Collection Forms andQuick Reference Guide
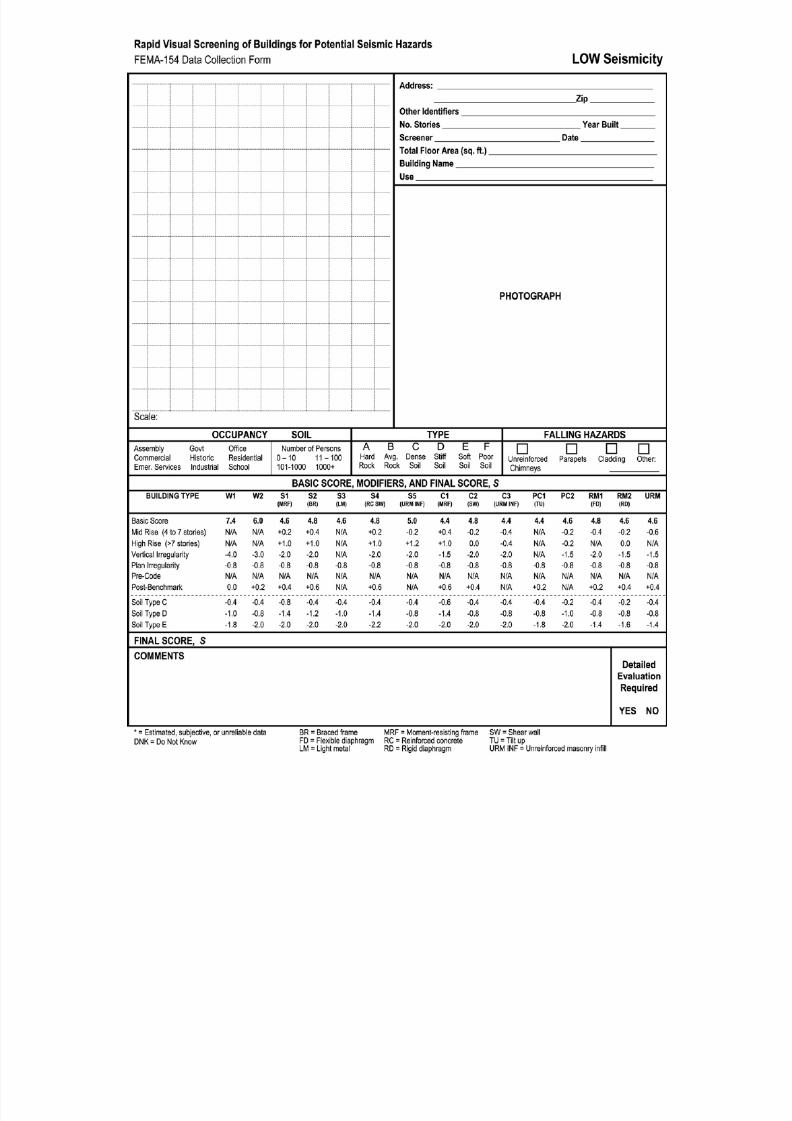
8/3/2019 Statewide Seismic Needs Assessment report
http://slidepdf.com/reader/full/statewide-seismic-needs-assessment-report 279/341
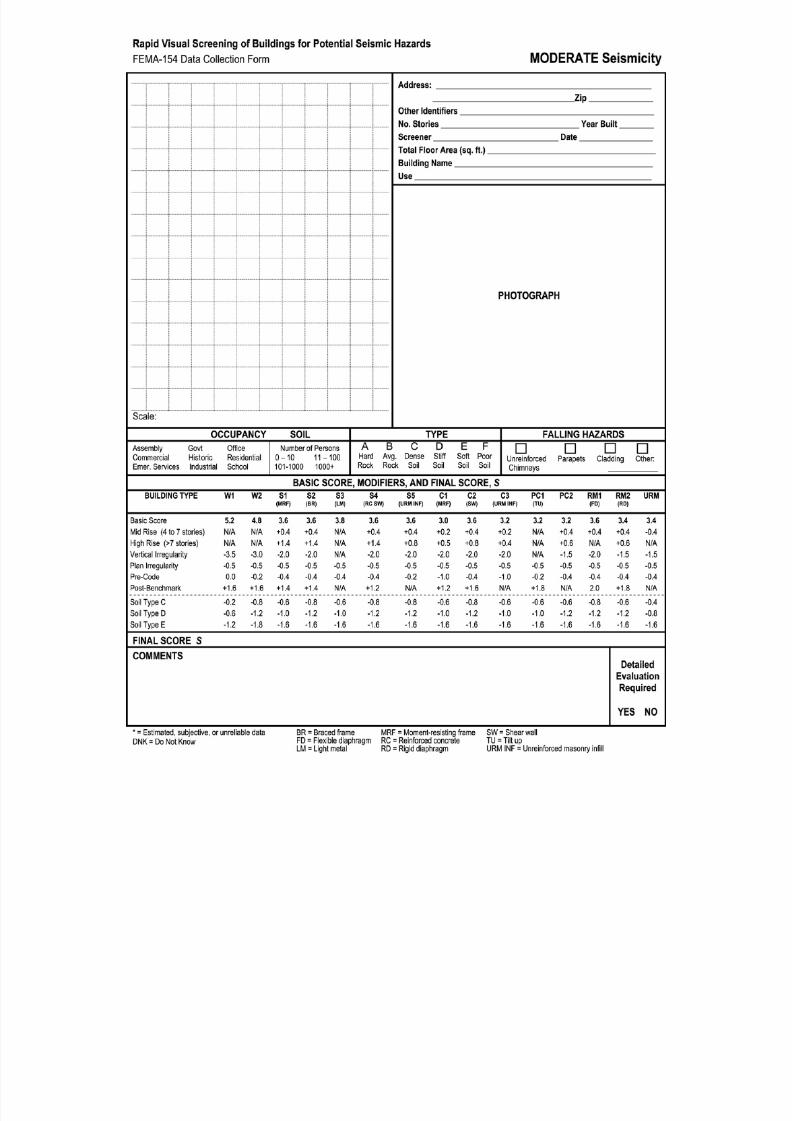
8/3/2019 Statewide Seismic Needs Assessment report
http://slidepdf.com/reader/full/statewide-seismic-needs-assessment-report 280/341

8/3/2019 Statewide Seismic Needs Assessment report
http://slidepdf.com/reader/full/statewide-seismic-needs-assessment-report 281/341
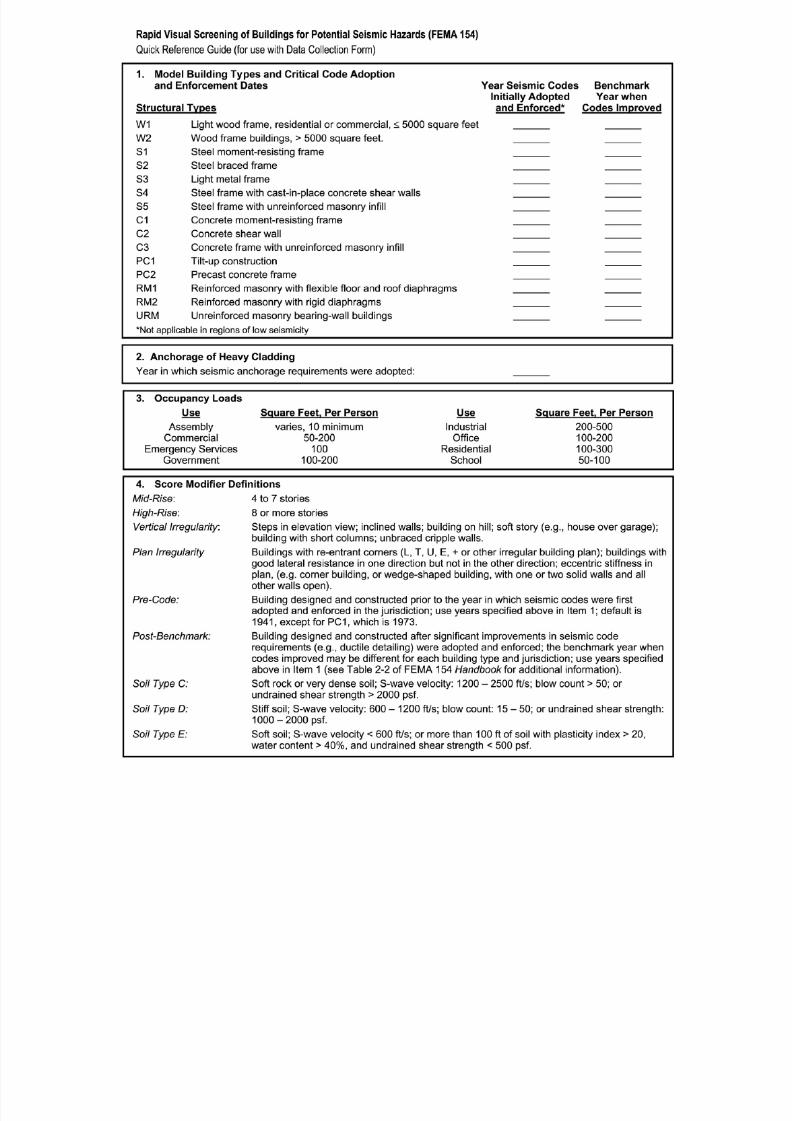
8/3/2019 Statewide Seismic Needs Assessment report
http://slidepdf.com/reader/full/statewide-seismic-needs-assessment-report 282/341

8/3/2019 Statewide Seismic Needs Assessment report
http://slidepdf.com/reader/full/statewide-seismic-needs-assessment-report 283/341
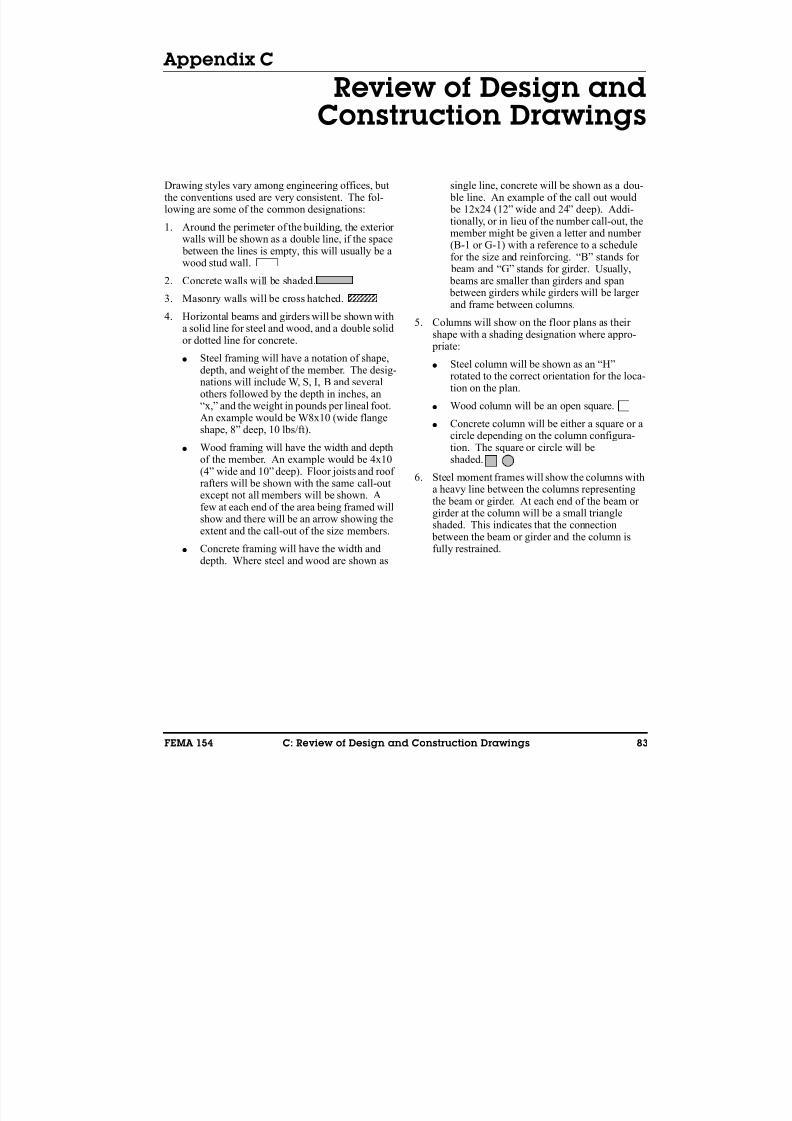
8/3/2019 Statewide Seismic Needs Assessment report
http://slidepdf.com/reader/full/statewide-seismic-needs-assessment-report 284/341
FEMA 154 C: Review of Design and Construction Drawings 83
Appendix C
Review of Design andConstruction Drawings
Drawing styles vary among engineering offices, butthe conventions used are very consistent. The fol-lowing are some of the common designations:
1. Around the perimeter of the building, the exterior walls will be shown as a double line, if the space between the lines is empty, this will usually be awood stud wall.
2. Concrete walls will be shaded.
3. Masonry walls will be cross hatched.4. Horizontal beams and girders will be shown with
a solid line for steel and wood, and a double solidor dotted line for concrete.
● Steel framing will have a notation of shape,depth, and weight of the member. The desig-nations will include W, S, I, B and severalothers followed by the depth in inches, an“x,” and the weight in pounds per lineal foot.An example would be W8x10 (wide flangeshape, 8” deep, 10 lbs/ft).
● Wood framing will have the width and depthof the member. An example would be 4x10(4” wide and 10” deep). Floor joists and roof rafters will be shown with the same call-outexcept not all members will be shown. Afew at each end of the area being framed willshow and there will be an arrow showing theextent and the call-out of the size members.
● Concrete framing will have the width anddepth. Where steel and wood are shown as
single line, concrete will be shown as a dou- ble line. An example of the call out would be 12x24 (12” wide and 24” deep). Addi-tionally, or in lieu of the number call-out, themember might be given a letter and number (B-1 or G-1) with a reference to a schedulefor the size and reinforcing. “B” stands for beam and “G” stands for girder. Usually, beams are smaller than girders and span between girders while girders will be larger
and frame between columns.
5. Columns will show on the floor plans as their shape with a shading designation where appro- priate:
● Steel column will be shown as an “H”rotated to the correct orientation for the loca-tion on the plan.
● Wood column will be an open square.
● Concrete column will be either a square or acircle depending on the column configura-tion. The square or circle will beshaded.
6. Steel moment frames will show the columns witha heavy line between the columns representingthe beam or girder. At each end of the beam or girder at the column will be a small triangleshaded. This indicates that the connection between the beam or girder and the column isfully restrained.

8/3/2019 Statewide Seismic Needs Assessment report
http://slidepdf.com/reader/full/statewide-seismic-needs-assessment-report 285/341
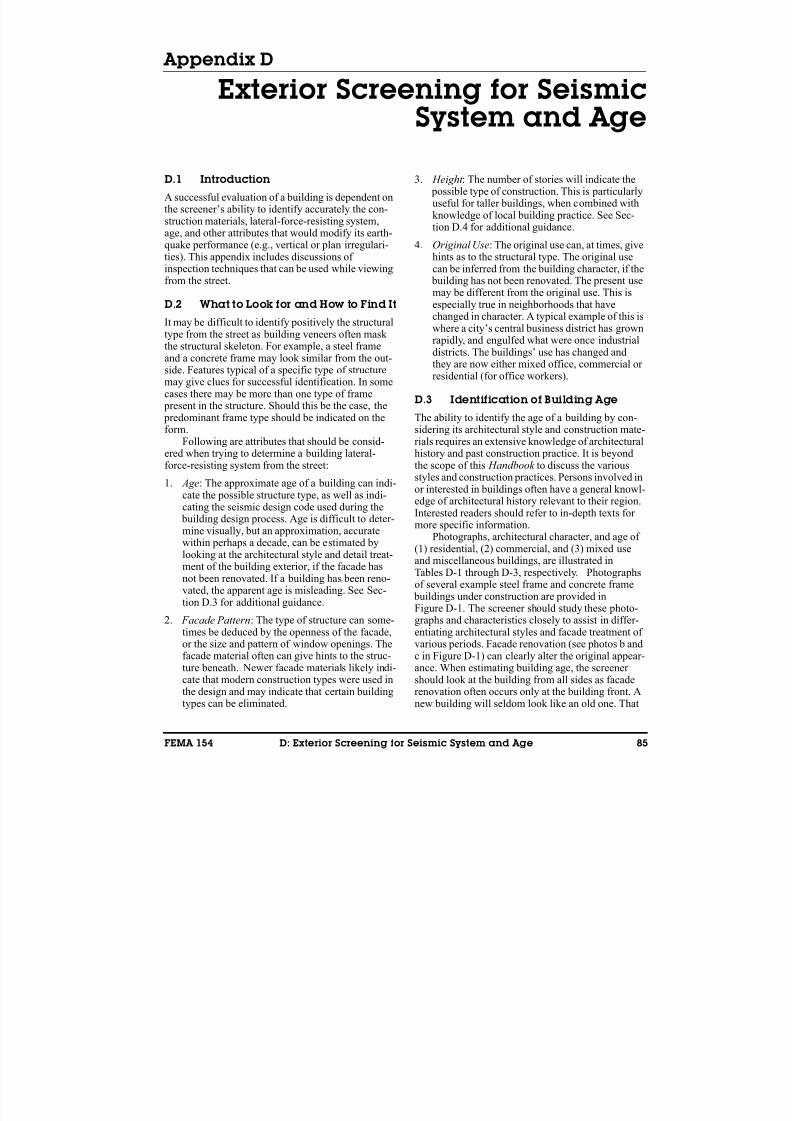
8/3/2019 Statewide Seismic Needs Assessment report
http://slidepdf.com/reader/full/statewide-seismic-needs-assessment-report 286/341
FEMA 154 D: Exterior Screening for Seismic System and Age 85
Appendix D
Exterior Screening for SeismicSystem and Age
D.1 Introduction
A successful evaluation of a building is dependent onthe screener’s ability to identify accurately the con-struction materials, lateral-force-resisting system,age, and other attributes that would modify its earth-quake performance (e.g., vertical or plan irregulari-ties). This appendix includes discussions of inspection techniques that can be used while viewingfrom the street.
D.2 What to Look for and How to Find It
It may be difficult to identify positively the structuraltype from the street as building veneers often mask the structural skeleton. For example, a steel frameand a concrete frame may look similar from the out-side. Features typical of a specific type of structuremay give clues for successful identification. In somecases there may be more than one type of frame present in the structure. Should this be the case, the predominant frame type should be indicated on theform.
Following are attributes that should be consid-
ered when trying to determine a building lateral-force-resisting system from the street:
1. Age: The approximate age of a building can indi-cate the possible structure type, as well as indi-cating the seismic design code used during the building design process. Age is difficult to deter-mine visually, but an approximation, accuratewithin perhaps a decade, can be estimated bylooking at the architectural style and detail treat-ment of the building exterior, if the facade hasnot been renovated. If a building has been reno-vated, the apparent age is misleading. See Sec-
tion D.3 for additional guidance.2. Facade Pattern: The type of structure can some-
times be deduced by the openness of the facade,or the size and pattern of window openings. Thefacade material often can give hints to the struc-ture beneath. Newer facade materials likely indi-cate that modern construction types were used inthe design and may indicate that certain buildingtypes can be eliminated.
3. Height : The number of stories will indicate the possible type of construction. This is particularlyuseful for taller buildings, when combined withknowledge of local building practice. See Sec-tion D.4 for additional guidance.
4. Original Use: The original use can, at times, givehints as to the structural type. The original usecan be inferred from the building character, if the building has not been renovated. The present usemay be different from the original use. This is
especially true in neighborhoods that havechanged in character. A typical example of this iswhere a city’s central business district has grownrapidly, and engulfed what were once industrialdistricts. The buildings’ use has changed andthey are now either mixed office, commercial or residential (for office workers).
D.3 Identification of Building Age
The ability to identify the age of a building by con-sidering its architectural style and construction mate-rials requires an extensive knowledge of architectural
history and past construction practice. It is beyondthe scope of this Handbook to discuss the variousstyles and construction practices. Persons involved inor interested in buildings often have a general knowl-edge of architectural history relevant to their region.Interested readers should refer to in-depth texts for more specific information.
Photographs, architectural character, and age of (1) residential, (2) commercial, and (3) mixed useand miscellaneous buildings, are illustrated inTables D-1 through D-3, respectively. Photographsof several example steel frame and concrete frame buildings under construction are provided in
Figure D-1. The screener should study these photo-graphs and characteristics closely to assist in differ-entiating architectural styles and facade treatment of various periods. Facade renovation (see photos b andc in Figure D-1) can clearly alter the original appear-ance. When estimating building age, the screener should look at the building from all sides as facaderenovation often occurs only at the building front. Anew building will seldom look like an old one. That
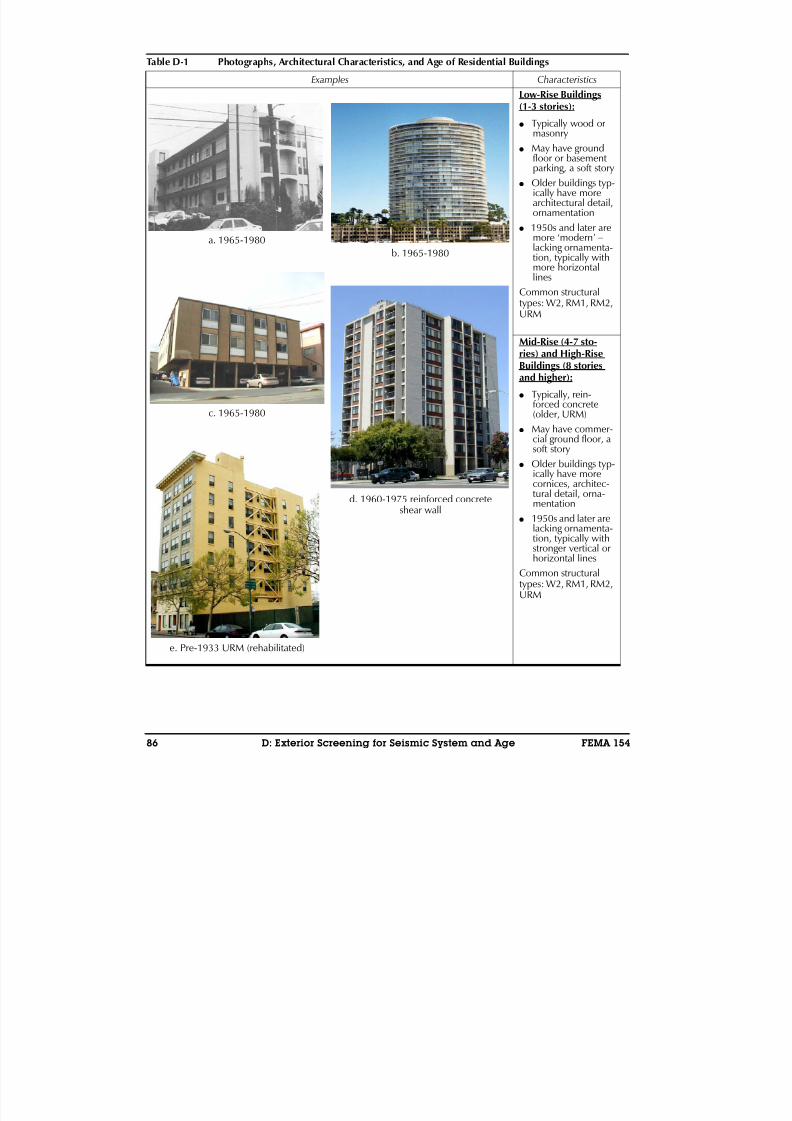
8/3/2019 Statewide Seismic Needs Assessment report
http://slidepdf.com/reader/full/statewide-seismic-needs-assessment-report 287/341
86 D: Exterior Screening for Seismic System and Age FEMA 154
Table D-1 Photographs, Architectural Characteristics, and Age of Residential Buildings
Examples Characteristics
a. 1965-1980
c. 1965-1980
e. Pre-1933 URM (rehabilitated)
b. 1965-1980
d. 1960-1975 reinforced concreteshear wall
Low-Rise Buildings(1-3 stories):
● Typically wood ormasonry
●
May have groundfloor or basement parking, a soft story
● Older buildings typ-ically have morearchitectural detail,ornamentation
● 1950s and later aremore ‘modern’ −
lacking ornamenta-tion, typically withmore horizontallines
Common structural
types: W2, RM1, RM2,URM
Mid-Rise (4-7 sto-ries) and High-RiseBuildings (8 storiesand higher):
● Typically, rein-forced concrete(older, URM)
● May have commer-cial ground floor, a
soft story● Older buildings typ-
ically have morecornices, architec-tural detail, orna-mentation
● 1950s and later arelacking ornamenta-tion, typically withstronger vertical orhorizontal lines
Common structuraltypes: W2, RM1, RM2,URM
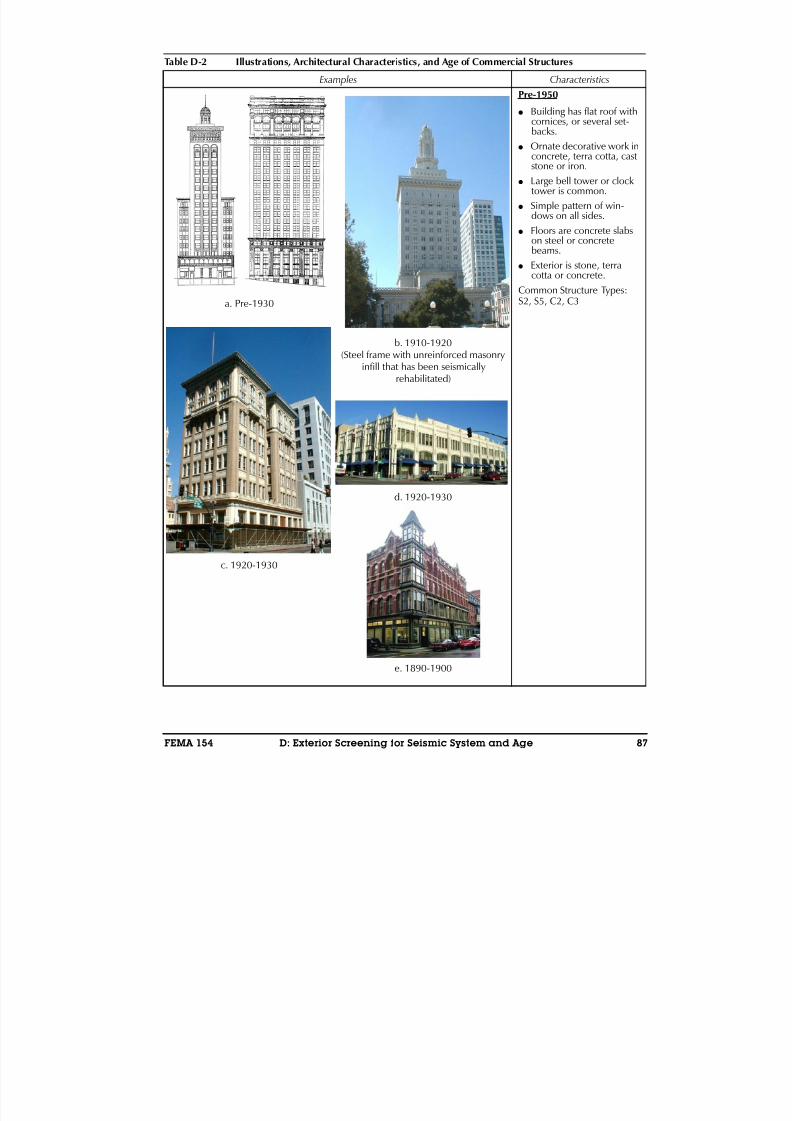
8/3/2019 Statewide Seismic Needs Assessment report
http://slidepdf.com/reader/full/statewide-seismic-needs-assessment-report 288/341
FEMA 154 D: Exterior Screening for Seismic System and Age 87
Table D-2 Illustrations, Architectural Characteristics, and Age of Commercial Structures
Examples Characteristics
a. Pre-1930
c. 1920-1930
b. 1910-1920(Steel frame with unreinforced masonry
infill that has been seismicallyrehabilitated)
d. 1920-1930
e. 1890-1900
Pre-1950
● Building has flat roof withcornices, or several set-backs.
●
Ornate decorative work inconcrete, terra cotta, cast stone or iron.
● Large bell tower or clocktower is common.
● Simple pattern of win-dows on all sides.
● Floors are concrete slabson steel or concretebeams.
● Exterior is stone, terracotta or concrete.
Common Structure Types:
S2, S5, C2, C3

8/3/2019 Statewide Seismic Needs Assessment report
http://slidepdf.com/reader/full/statewide-seismic-needs-assessment-report 289/341
88 D: Exterior Screening for Seismic System and Age FEMA 154
f. 44 story, 1960s, L-shape on the left;20 story, 1914, with setback onthe right
h. 1940-1950
g. 1950-1975
i. 1950-1975
j. 1950-1975
1950-1975
● Flat roof, typically with nocornice.
● Building is square or rect-
angular full height, fewersetbacks.
● First story and top storycan be taller than otherstories. In some cases thetop story could be shorterthan others.
● Exterior finishes metal orglass, pre-cast stone orconcrete.
● Floors are concrete slabover steel or concretebeams.
Common Structure Types:S1, S2, S4, C1, C2
Table D-2 Illustrations, Architectural Characteristics, and Age of Commercial Structures (Continued)
Examples Characteristics

8/3/2019 Statewide Seismic Needs Assessment report
http://slidepdf.com/reader/full/statewide-seismic-needs-assessment-report 290/341
FEMA 154 D: Exterior Screening for Seismic System and Age 89
is, a building is usually at least as old as it looks.Even when designed to look old, telltale signs of modern techniques can usually be seen in the type of windows, fixtures, and material used.
D.4 Identification of Structural Type
The most common inspection that will be utilizedwith the RVS procedure will be the exterior or “side-walk” or “streetside” survey. First, the evaluationshould be as thorough as possible and performed in a
logical manner. The street-facing front of the build-ing is the starting point and the evaluation begins atthe ground and progressively moves up the exterior wall to the roof or parapet line. For taller buildings, a pair of binoculars is useful. When a thorough inspec-tion of the street-front elevation has been completed,the procedure is repeated on the next accessible wall. From the exterior, the screener should be able todetermine the approximate age of the building, itsoriginal occupancy, and count the number of stories.
k. Post-1975
m. Post-1975
l. Post-1975
n. Post-1975
Post-1975
● Flat roof, typically with nocornice.
● Building is square or rect-
angular for its full height,fewer setbacks.
● First story and top storycan be taller than otherstories. (In some cases,though, the top storycould be shorter than oth-ers.)
● Exterior finishes: metal orglass, pre-cast stone orconcrete, with little orna-mentation
● Floors are concrete slabsover steel or concrete
beams.Common Structure Types:S1, S2, S4, C1, C2
o. Post-1975
Table D-2 Illustrations, Architectural Characteristics, and Age of Commercial Structures (Continued)
Examples Characteristics
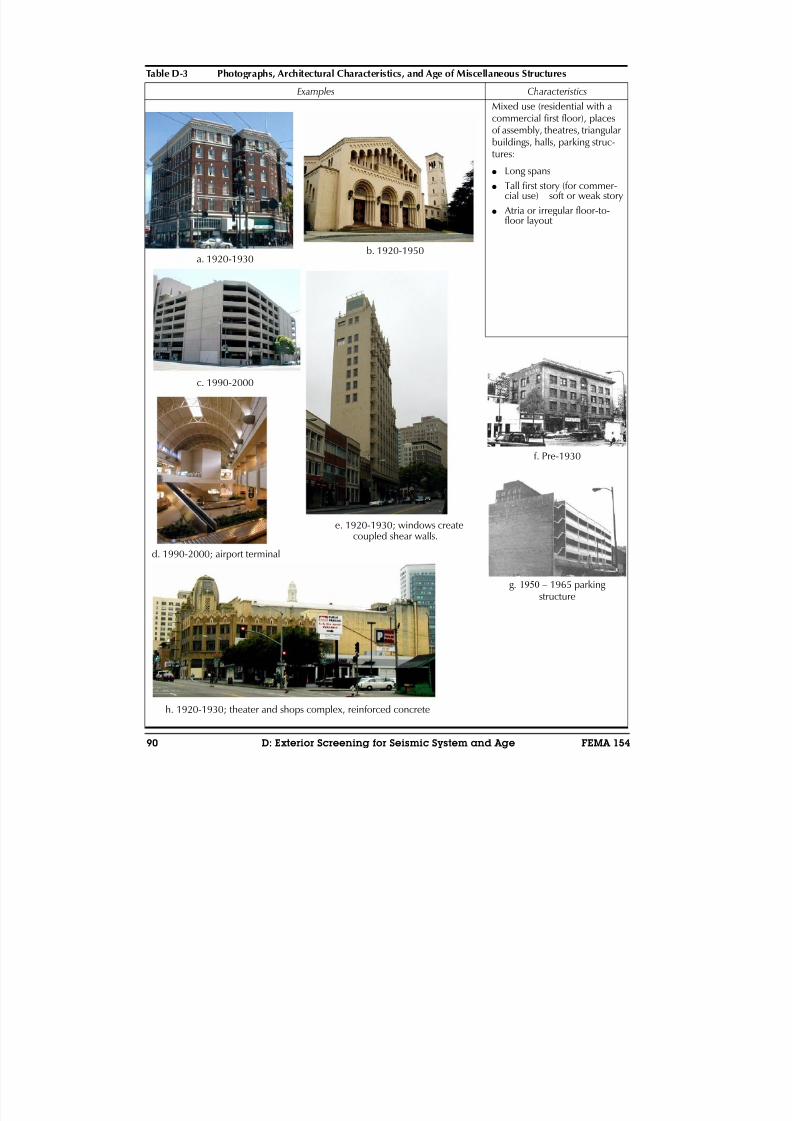
8/3/2019 Statewide Seismic Needs Assessment report
http://slidepdf.com/reader/full/statewide-seismic-needs-assessment-report 291/341
90 D: Exterior Screening for Seismic System and Age FEMA 154
Table D-3 Photographs, Architectural Characteristics, and Age of Miscellaneous Structures
Examples Characteristics
a. 1920-1930
c. 1990-2000
d. 1990-2000; airport terminal
b. 1920-1950
e. 1920-1930; windows createcoupled shear walls.
Mixed use (residential with acommercial first floor), placesof assembly, theatres, triangularbuildings, halls, parking struc-
tures:
● Long spans
● Tall first story (for commer-cial use) − soft or weak story
● Atria or irregular floor-to-floor layout
f. Pre-1930
g. 1950 − 1965 parking structure
h. 1920-1930; theater and shops complex, reinforced concrete
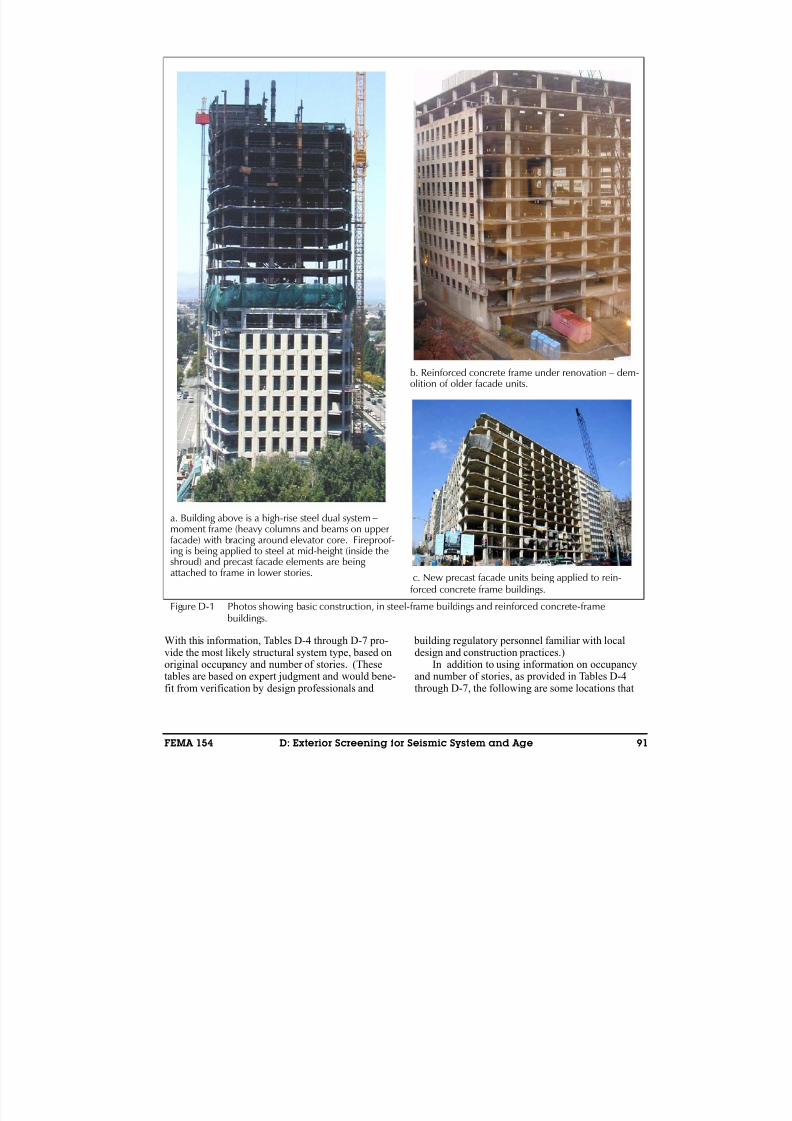
8/3/2019 Statewide Seismic Needs Assessment report
http://slidepdf.com/reader/full/statewide-seismic-needs-assessment-report 292/341
FEMA 154 D: Exterior Screening for Seismic System and Age 91
With this information, Tables D-4 through D-7 pro-vide the most likely structural system type, based onoriginal occupancy and number of stories. (Thesetables are based on expert judgment and would bene-fit from verification by design professionals and
building regulatory personnel familiar with localdesign and construction practices.)
In addition to using information on occupancyand number of stories, as provided in Tables D-4through D-7, the following are some locations that
a. Building above is a high-rise steel dual system − moment frame (heavy columns and beams on upperfacade) with bracing around elevator core. Fireproof-ing is being applied to steel at mid-height (inside theshroud) and precast facade elements are being attached to frame in lower stories.
b. Reinforced concrete frame under renovation − dem-olition of older facade units.
c. New precast facade units being applied to rein-forced concrete frame buildings.
Figure D-1 Photos showing basic construction, in steel-frame buildings and reinforced concrete-framebuildings.
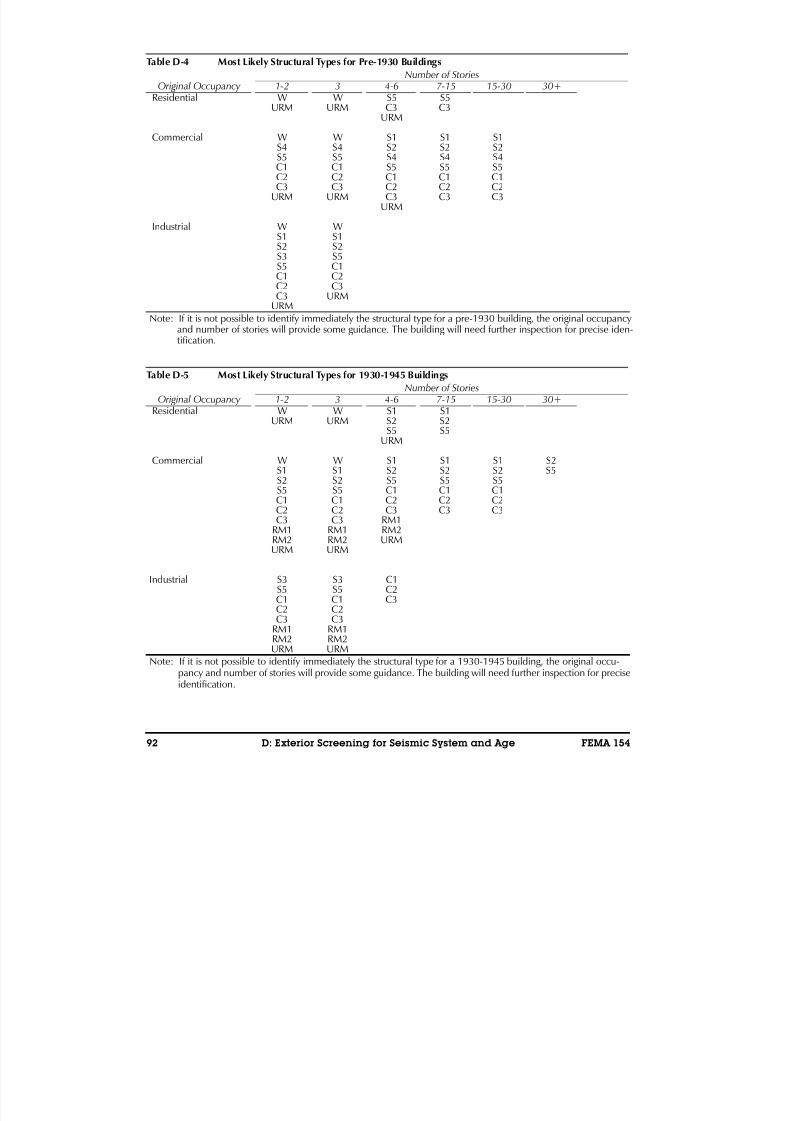
8/3/2019 Statewide Seismic Needs Assessment report
http://slidepdf.com/reader/full/statewide-seismic-needs-assessment-report 293/341
92 D: Exterior Screening for Seismic System and Age FEMA 154
Table D-4 Most Likely Structural Types for Pre-1930 Buildings
Number of StoriesOriginal Occupancy 1-2 3 4-6 7-15 15-30 30+
Residential W W S5 S5URM URM C3 C3
URM
Commercial W W S1 S1 S1
S4 S4 S2 S2 S2S5 S5 S4 S4 S4C1 C1 S5 S5 S5C2 C2 C1 C1 C1C3 C3 C2 C2 C2
URM URM C3 C3 C3URM
Industrial W WS1 S1S2 S2S3 S5S5 C1C1 C2C2 C3C3 URM
URMNote: If it is not possible to identify immediately the structural type for a pre-1930 building, the original occupancy
and number of stories will provide some guidance. The building will need further inspection for precise iden-tification.
Table D-5 Most Likely Structural Types for 1930-1945 Buildings
Number of StoriesOriginal Occupancy 1-2 3 4-6 7-15 15-30 30+
Residential W W S1 S1URM URM S2 S2
S5 S5URM
Commercial W W S1 S1 S1 S2S1 S1 S2 S2 S2 S5S2 S2 S5 S5 S5S5 S5 C1 C1 C1C1 C1 C2 C2 C2C2 C2 C3 C3 C3C3 C3 RM1
RM1 RM1 RM2RM2 RM2 URMURM URM
Industrial S3 S3 C1S5 S5 C2C1 C1 C3C2 C2C3 C3
RM1 RM1RM2 RM2URM URM
Note: If it is not possible to identify immediately the structural type for a 1930-1945 building, the original occu-pancy and number of stories will provide some guidance. The building will need further inspection for preciseidentification.
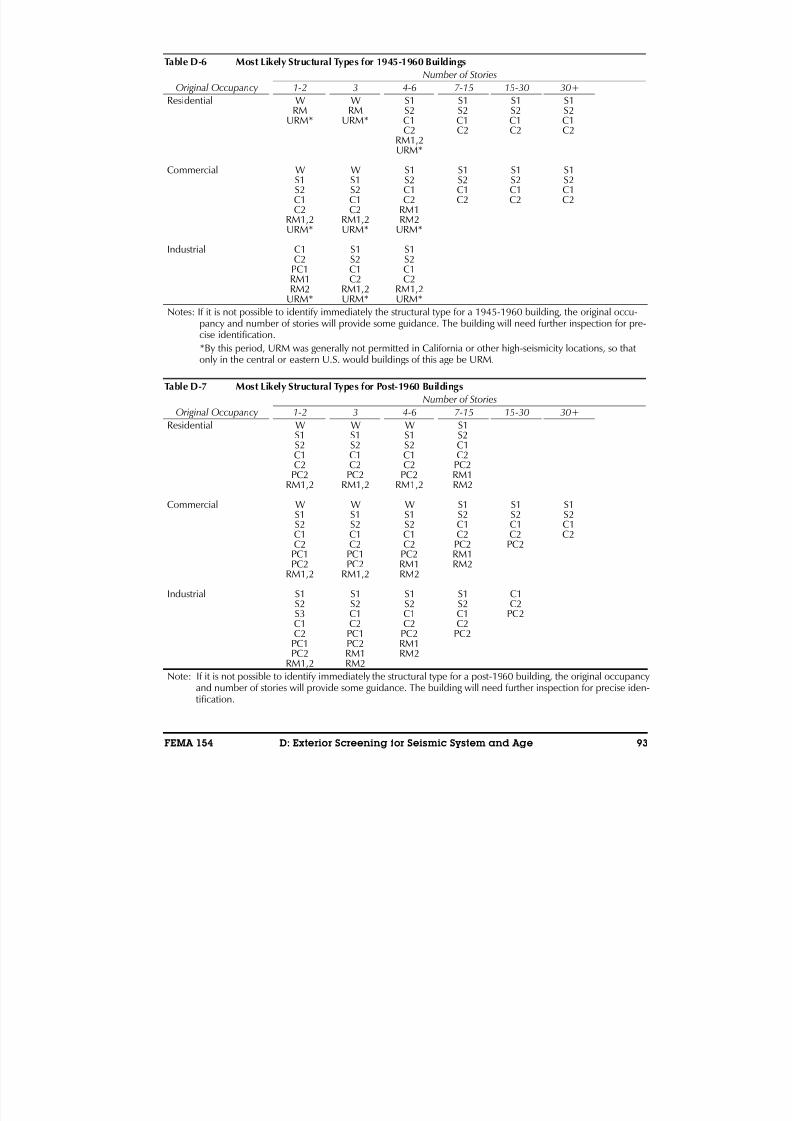
8/3/2019 Statewide Seismic Needs Assessment report
http://slidepdf.com/reader/full/statewide-seismic-needs-assessment-report 294/341
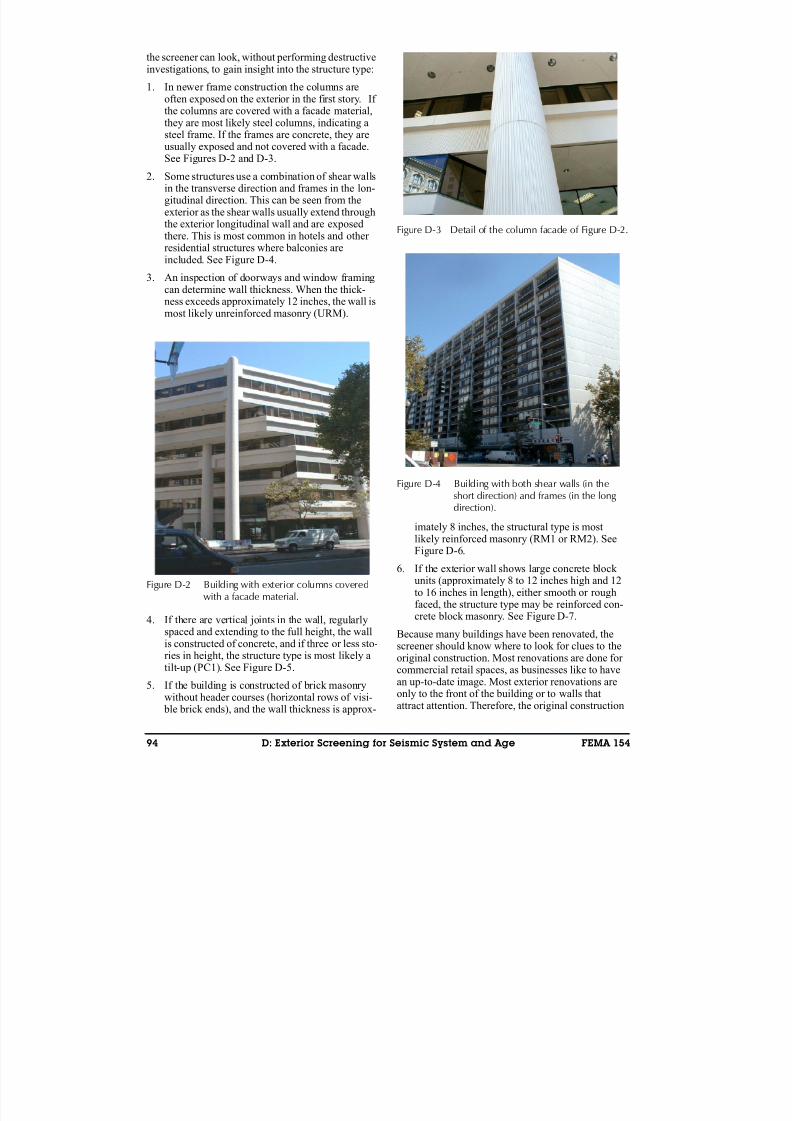
8/3/2019 Statewide Seismic Needs Assessment report
http://slidepdf.com/reader/full/statewide-seismic-needs-assessment-report 295/341
94 D: Exterior Screening for Seismic System and Age FEMA 154
the screener can look, without performing destructiveinvestigations, to gain insight into the structure type:
1. In newer frame construction the columns areoften exposed on the exterior in the first story. If the columns are covered with a facade material,they are most likely steel columns, indicating asteel frame. If the frames are concrete, they are
usually exposed and not covered with a facade.See Figures D-2 and D-3.
2. Some structures use a combination of shear wallsin the transverse direction and frames in the lon-gitudinal direction. This can be seen from theexterior as the shear walls usually extend throughthe exterior longitudinal wall and are exposedthere. This is most common in hotels and other residential structures where balconies areincluded. See Figure D-4.
3. An inspection of doorways and window framingcan determine wall thickness. When the thick-
ness exceeds approximately 12 inches, the wall ismost likely unreinforced masonry (URM).
4. If there are vertical joints in the wall, regularlyspaced and extending to the full height, the wallis constructed of concrete, and if three or less sto-ries in height, the structure type is most likely atilt-up (PC1). See Figure D-5.
5. If the building is constructed of brick masonrywithout header courses (horizontal rows of visi- ble brick ends), and the wall thickness is approx-
imately 8 inches, the structural type is mostlikely reinforced masonry (RM1 or RM2). SeeFigure D-6.
6. If the exterior wall shows large concrete block units (approximately 8 to 12 inches high and 12to 16 inches in length), either smooth or rough
faced, the structure type may be reinforced con-crete block masonry. See Figure D-7.
Because many buildings have been renovated, thescreener should know where to look for clues to theoriginal construction. Most renovations are done for commercial retail spaces, as businesses like to havean up-to-date image. Most exterior renovations areonly to the front of the building or to walls thatattract attention. Therefore, the original construction
Figure D-2 Building with exterior columns coveredwith a facade material.
Figure D-3 Detail of the column facade of Figure D-2.
Figure D-4 Building with both shear walls (in theshort direction) and frames (in the long direction).

8/3/2019 Statewide Seismic Needs Assessment report
http://slidepdf.com/reader/full/statewide-seismic-needs-assessment-report 296/341
FEMA 154 D: Exterior Screening for Seismic System and Age 95
can often be seen at the sides, or the rear, where peo- ple generally do not look. If the original material iscovered in these areas, it is often just painted or lightly plastered. In this case, the pattern of the older material can often still be seen.
Clues helping identify the original material areapparent if one is looking for them. Two examplesare included here:
● Figure D-8 shows a building with a 1970s pol-ished stone and glass facade. The side of the
building indicates that it is a pre-1930 URM bearing-wall structure.
● Figure D-9 shows a building facade with typical1960s material. The side was painted. Showingthrough the paint, the horizontal board patterns inthe poured-in-place concrete wall of pre-1940construction could still be seen.
D.5 Characteristics of Exposed Con-struction Materials
Accurate identification of the structural type oftendepends on the ability to recognize the exposed con-struction material. The screener should be familiar
Figure D-5 Regular, full-height joints in a building’swall indicate a concrete tilt-up.
Figure D-6 Reinforced masonry wall showing no
course of header bricks (a row of visiblebrick ends).
Figure D-7 Reinforced masonry building withexterior wall of concrete masonry units, orconcrete blocks.
Figure D-8 A 1970s renovated facade hides a URM
bearing-wall structure.
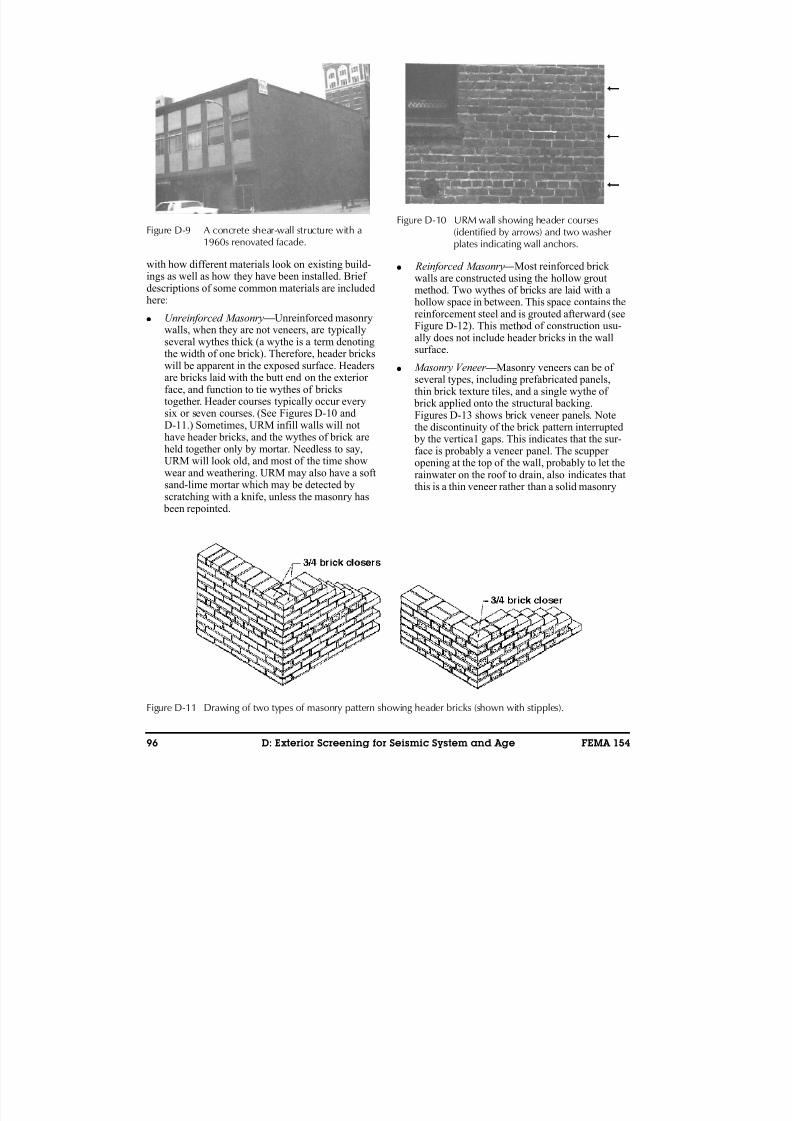
8/3/2019 Statewide Seismic Needs Assessment report
http://slidepdf.com/reader/full/statewide-seismic-needs-assessment-report 297/341
96 D: Exterior Screening for Seismic System and Age FEMA 154
with how different materials look on existing build-ings as well as how they have been installed. Brief descriptions of some common materials are included
here:● Unreinforced Masonry — Unreinforced masonry
walls, when they are not veneers, are typicallyseveral wythes thick (a wythe is a term denotingthe width of one brick). Therefore, header brickswill be apparent in the exposed surface. Headersare bricks laid with the butt end on the exterior face, and function to tie wythes of brickstogether. Header courses typically occur everysix or seven courses. (See Figures D-10 andD-11.) Sometimes, URM infill walls will nothave header bricks, and the wythes of brick areheld together only by mortar. Needless to say,URM will look old, and most of the time showwear and weathering. URM may also have a softsand-lime mortar which may be detected byscratching with a knife, unless the masonry has been repointed.
● Reinforced Masonry — Most reinforced brick walls are constructed using the hollow groutmethod. Two wythes of bricks are laid with a
hollow space in between. This space contains thereinforcement steel and is grouted afterward (seeFigure D-12). This method of construction usu-ally does not include header bricks in the wallsurface.
● Masonry Veneer — Masonry veneers can be of several types, including prefabricated panels,thin brick texture tiles, and a single wythe of brick applied onto the structural backing.Figures D-13 shows brick veneer panels. Notethe discontinuity of the brick pattern interrupted by the vertica1 gaps. This indicates that the sur-
face is probably a veneer panel. The scupper opening at the top of the wall, probably to let therainwater on the roof to drain, also indicates thatthis is a thin veneer rather than a solid masonry
Figure D-9 A concrete shear-wall structure with a1960s renovated facade.
Figure D-10 URM wall showing header courses(identified by arrows) and two washerplates indicating wall anchors.
Figure D-11 Drawing of two types of masonry pattern showing header bricks (shown with stipples).
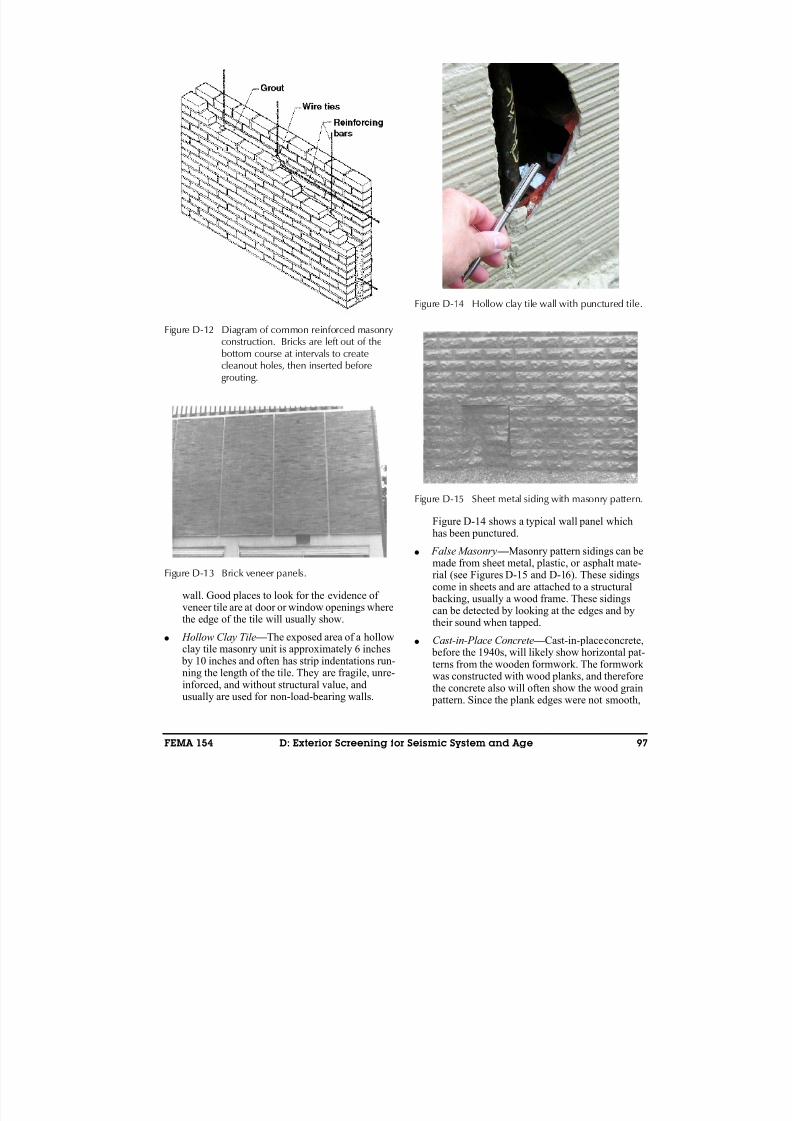
8/3/2019 Statewide Seismic Needs Assessment report
http://slidepdf.com/reader/full/statewide-seismic-needs-assessment-report 298/341
FEMA 154 D: Exterior Screening for Seismic System and Age 97
wall. Good places to look for the evidence of
veneer tile are at door or window openings wherethe edge of the tile will usually show.
● Hollow Clay Tile — The exposed area of a hollowclay tile masonry unit is approximately 6 inches by 10 inches and often has strip indentations run-ning the length of the tile. They are fragile, unre-inforced, and without structural value, andusually are used for non-load-bearing walls.
Figure D-14 shows a typical wall panel whichhas been punctured.
● False Masonry — Masonry pattern sidings can bemade from sheet metal, plastic, or asphalt mate-rial (see Figures D-15 and D-16). These sidingscome in sheets and are attached to a structural backing, usually a wood frame. These sidingscan be detected by looking at the edges and bytheir sound when tapped.
● Cast-in-Place Concrete — Cast-in-place concrete, before the 1940s, will likely show horizontal pat-terns from the wooden formwork. The formwork was constructed with wood planks, and thereforethe concrete also will often show the wood grain pattern. Since the plank edges were not smooth,
Figure D-12 Diagram of common reinforced masonryconstruction. Bricks are left out of thebottom course at intervals to createcleanout holes, then inserted beforegrouting.
Figure D-13 Brick veneer panels.
Figure D-14 Hollow clay tile wall with punctured tile.
Figure D-15 Sheet metal siding with masonry pattern.
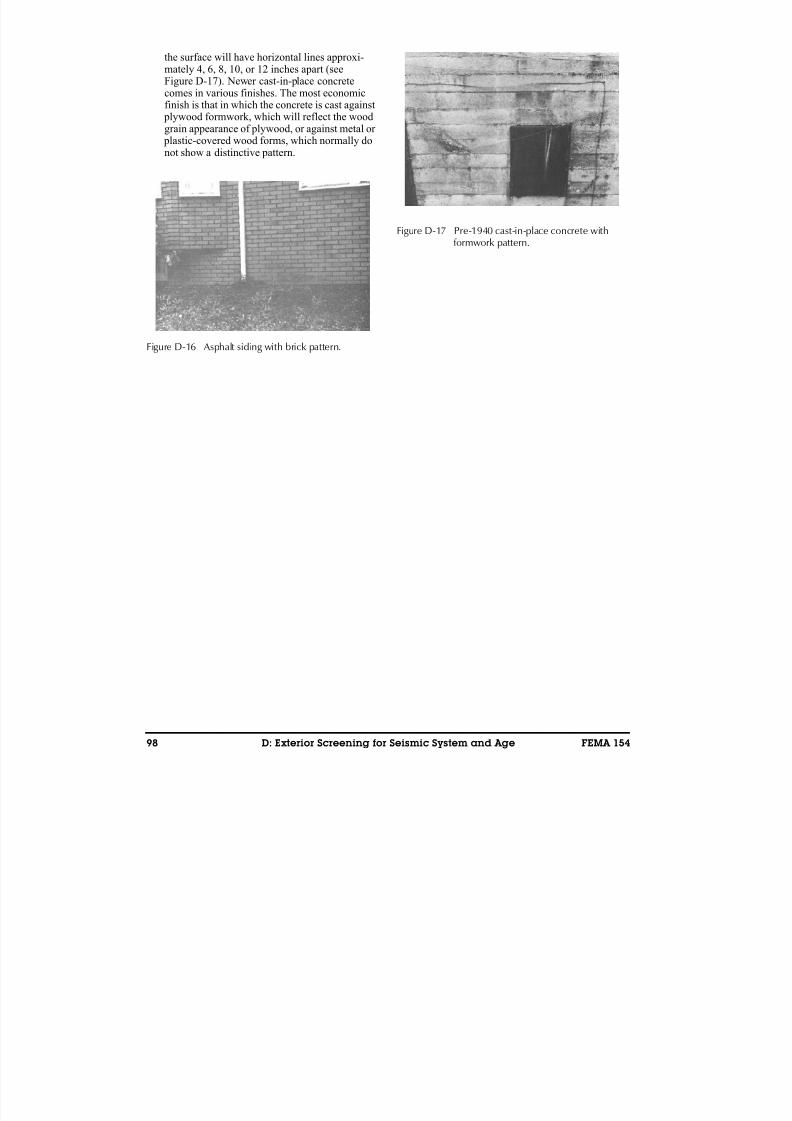
8/3/2019 Statewide Seismic Needs Assessment report
http://slidepdf.com/reader/full/statewide-seismic-needs-assessment-report 299/341
98 D: Exterior Screening for Seismic System and Age FEMA 154
the surface will have horizontal lines approxi-mately 4, 6, 8, 10, or 12 inches apart (seeFigure D-17). Newer cast-in-place concretecomes in various finishes. The most economicfinish is that in which the concrete is cast against plywood formwork, which will reflect the woodgrain appearance of plywood, or against metal or plastic-covered wood forms, which normally do
not show a distinctive pattern.
Figure D-16 Asphalt siding with brick pattern.
Figure D-17 Pre-1940 cast-in-place concrete withformwork pattern.
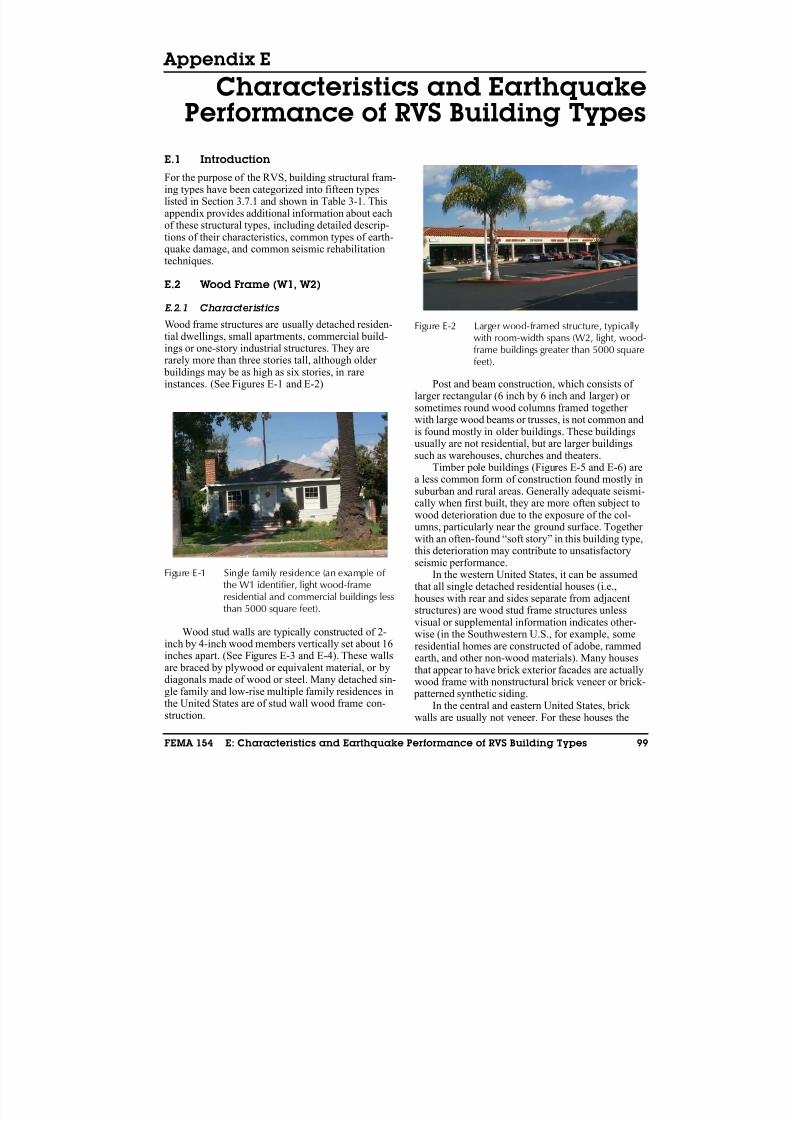
8/3/2019 Statewide Seismic Needs Assessment report
http://slidepdf.com/reader/full/statewide-seismic-needs-assessment-report 300/341
FEMA 154 E: Characteristics and Earthquake Performance of RVS Building Types 99
Appendix E
Characteristics and EarthquakePerformance of RVS Building Types
E.1 Introduction
For the purpose of the RVS, building structural fram-ing types have been categorized into fifteen typeslisted in Section 3.7.1 and shown in Table 3-1. Thisappendix provides additional information about eachof these structural types, including detailed descrip-tions of their characteristics, common types of earth-quake damage, and common seismic rehabilitationtechniques.
E.2 Wood Frame (W1, W2)
E.2.1 Characteristics
Wood frame structures are usually detached residen-tial dwellings, small apartments, commercial build-ings or one-story industrial structures. They arerarely more than three stories tall, although older buildings may be as high as six stories, in rareinstances. (See Figures E-1 and E-2)
Wood stud walls are typically constructed of 2-inch by 4-inch wood members vertically set about 16inches apart. (See Figures E-3 and E-4). These wallsare braced by plywood or equivalent material, or bydiagonals made of wood or steel. Many detached sin-gle family and low-rise multiple family residences inthe United States are of stud wall wood frame con-struction.
Post and beam construction, which consists of larger rectangular (6 inch by 6 inch and larger) or sometimes round wood columns framed together with large wood beams or trusses, is not common andis found mostly in older buildings. These buildingsusually are not residential, but are larger buildings
such as warehouses, churches and theaters.Timber pole buildings (Figures E-5 and E-6) are
a less common form of construction found mostly insuburban and rural areas. Generally adequate seismi-cally when first built, they are more often subject towood deterioration due to the exposure of the col-umns, particularly near the ground surface. Together with an often-found “soft story” in this building type,this deterioration may contribute to unsatisfactoryseismic performance.
In the western United States, it can be assumedthat all single detached residential houses (i.e.,houses with rear and sides separate from adjacentstructures) are wood stud frame structures unlessvisual or supplemental information indicates other-wise (in the Southwestern U.S., for example, someresidential homes are constructed of adobe, rammedearth, and other non-wood materials). Many housesthat appear to have brick exterior facades are actuallywood frame with nonstructural brick veneer or brick- patterned synthetic siding.
In the central and eastern United States, brick walls are usually not veneer. For these houses the
Figure E-1 Single family residence (an example of the W1 identifier, light wood-frameresidential and commercial buildings less
than 5000 square feet).
Figure E-2 Larger wood-framed structure, typicallywith room-width spans (W2, light, wood-frame buildings greater than 5000 squarefeet).
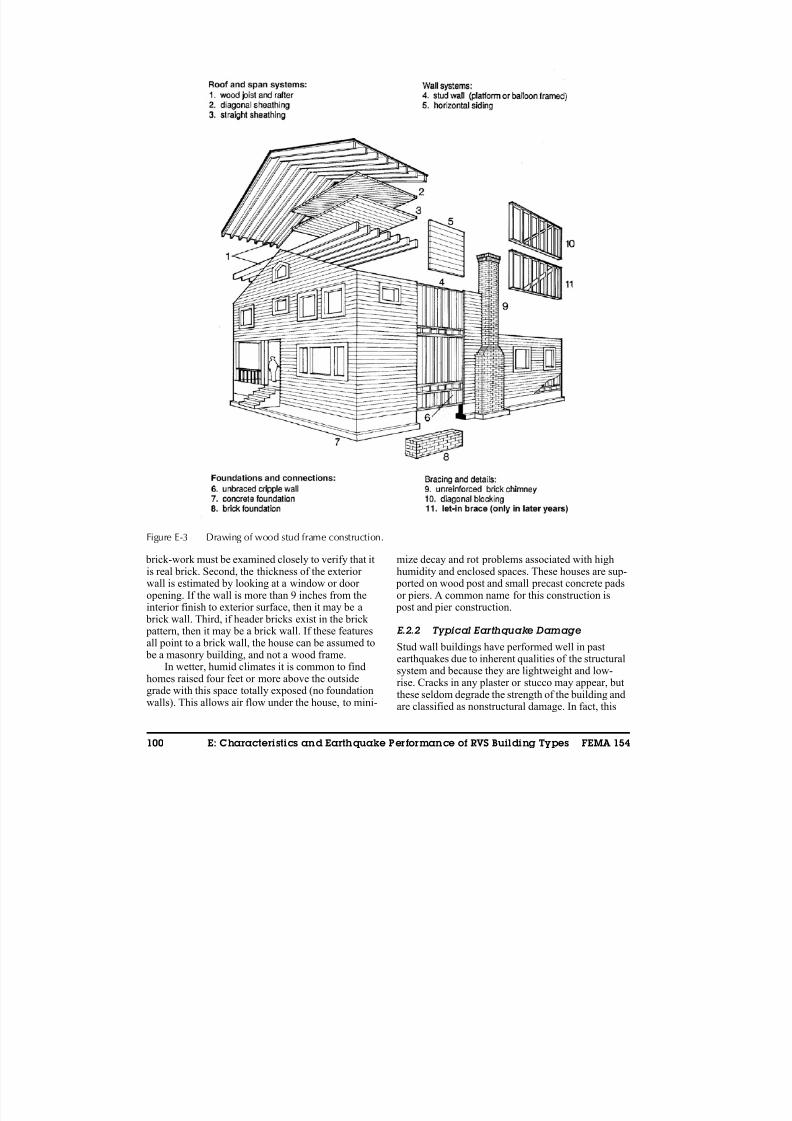
8/3/2019 Statewide Seismic Needs Assessment report
http://slidepdf.com/reader/full/statewide-seismic-needs-assessment-report 301/341
100 E: Characteristics and Earthquake Performance of RVS Building Types FEMA 154
brick-work must be examined closely to verify that itis real brick. Second, the thickness of the exterior wall is estimated by looking at a window or door opening. If the wall is more than 9 inches from the
interior finish to exterior surface, then it may be a brick wall. Third, if header bricks exist in the brick pattern, then it may be a brick wall. If these featuresall point to a brick wall, the house can be assumed to be a masonry building, and not a wood frame.
In wetter, humid climates it is common to findhomes raised four feet or more above the outsidegrade with this space totally exposed (no foundationwalls). This allows air flow under the house, to mini-
mize decay and rot problems associated with highhumidity and enclosed spaces. These houses are sup- ported on wood post and small precast concrete padsor piers. A common name for this construction is
post and pier construction.
E.2.2 Typical Earthquake Damage
Stud wall buildings have performed well in pastearthquakes due to inherent qualities of the structuralsystem and because they are lightweight and low-rise. Cracks in any plaster or stucco may appear, butthese seldom degrade the strength of the building andare classified as nonstructural damage. In fact, this
Figure E-3 Drawing of wood stud frame construction.
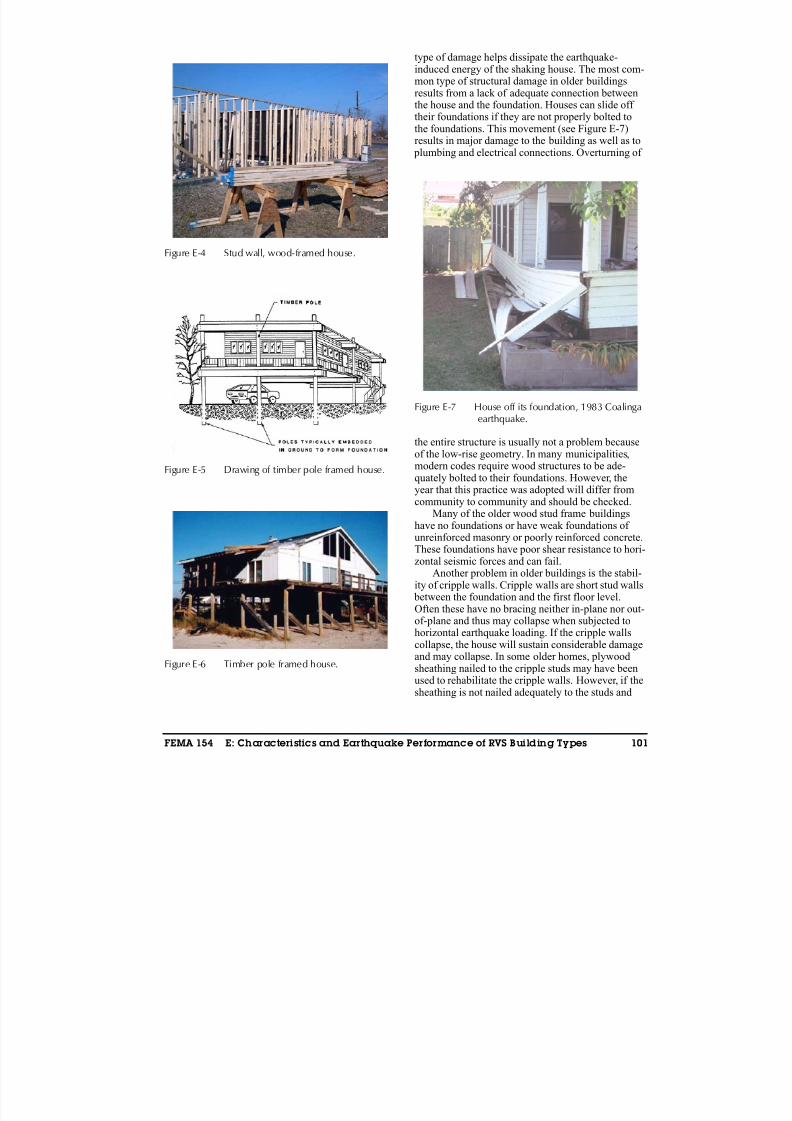
8/3/2019 Statewide Seismic Needs Assessment report
http://slidepdf.com/reader/full/statewide-seismic-needs-assessment-report 302/341
FEMA 154 E: Characteristics and Earthquake Performance of RVS Building Types 101
type of damage helps dissipate the earthquake-induced energy of the shaking house. The most com-mon type of structural damage in older buildingsresults from a lack of adequate connection betweenthe house and the foundation. Houses can slide off their foundations if they are not properly bolted tothe foundations. This movement (see Figure E-7)results in major damage to the building as well as to
plumbing and electrical connections. Overturning of
the entire structure is usually not a problem because
of the low-rise geometry. In many municipalities,modern codes require wood structures to be ade-quately bolted to their foundations. However, theyear that this practice was adopted will differ fromcommunity to community and should be checked.
Many of the older wood stud frame buildingshave no foundations or have weak foundations of unreinforced masonry or poorly reinforced concrete.These foundations have poor shear resistance to hori-zontal seismic forces and can fail.
Another problem in older buildings is the stabil-ity of cripple walls. Cripple walls are short stud walls between the foundation and the first floor level.
Often these have no bracing neither in-plane nor out-of-plane and thus may collapse when subjected tohorizontal earthquake loading. If the cripple wallscollapse, the house will sustain considerable damageand may collapse. In some older homes, plywoodsheathing nailed to the cripple studs may have beenused to rehabilitate the cripple walls. However, if thesheathing is not nailed adequately to the studs and
Figure E-4 Stud wall, wood-framed house.
Figure E-5 Drawing of timber pole framed house.
Figure E-6 Timber pole framed house.
Figure E-7 House off its foundation, 1983 Coalingaearthquake.
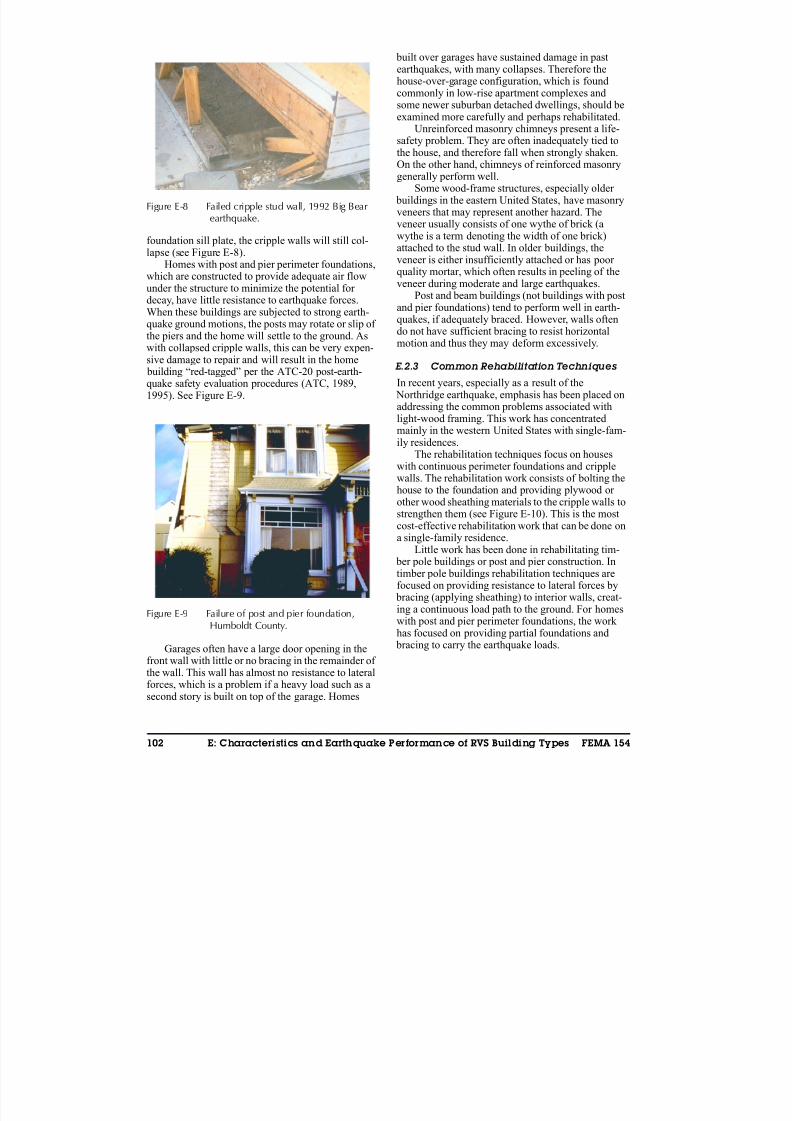
8/3/2019 Statewide Seismic Needs Assessment report
http://slidepdf.com/reader/full/statewide-seismic-needs-assessment-report 303/341
102 E: Characteristics and Earthquake Performance of RVS Building Types FEMA 154
foundation sill plate, the cripple walls will still col-lapse (see Figure E-8).
Homes with post and pier perimeter foundations,which are constructed to provide adequate air flowunder the structure to minimize the potential for
decay, have little resistance to earthquake forces.When these buildings are subjected to strong earth-quake ground motions, the posts may rotate or slip of the piers and the home will settle to the ground. Aswith collapsed cripple walls, this can be very expen-sive damage to repair and will result in the home building “red-tagged” per the ATC-20 post-earth-quake safety evaluation procedures (ATC, 1989,1995). See Figure E-9.
Garages often have a large door opening in thefront wall with little or no bracing in the remainder of the wall. This wall has almost no resistance to lateralforces, which is a problem if a heavy load such as asecond story is built on top of the garage. Homes
built over garages have sustained damage in pastearthquakes, with many collapses. Therefore thehouse-over-garage configuration, which is foundcommonly in low-rise apartment complexes andsome newer suburban detached dwellings, should beexamined more carefully and perhaps rehabilitated.
Unreinforced masonry chimneys present a life-safety problem. They are often inadequately tied to
the house, and therefore fall when strongly shaken.On the other hand, chimneys of reinforced masonrygenerally perform well.
Some wood-frame structures, especially older buildings in the eastern United States, have masonryveneers that may represent another hazard. Theveneer usually consists of one wythe of brick (awythe is a term denoting the width of one brick)attached to the stud wall. In older buildings, theveneer is either insufficiently attached or has poor quality mortar, which often results in peeling of theveneer during moderate and large earthquakes.
Post and beam buildings (not buildings with postand pier foundations) tend to perform well in earth-quakes, if adequately braced. However, walls oftendo not have sufficient bracing to resist horizontalmotion and thus they may deform excessively.
E.2.3 Common Rehabilitation Techniques
In recent years, especially as a result of the Northridge earthquake, emphasis has been placed onaddressing the common problems associated withlight-wood framing. This work has concentratedmainly in the western United States with single-fam-ily residences.
The rehabilitation techniques focus on houseswith continuous perimeter foundations and cripplewalls. The rehabilitation work consists of bolting thehouse to the foundation and providing plywood or other wood sheathing materials to the cripple walls tostrengthen them (see Figure E-10). This is the mostcost-effective rehabilitation work that can be done ona single-family residence.
Little work has been done in rehabilitating tim- ber pole buildings or post and pier construction. Intimber pole buildings rehabilitation techniques arefocused on providing resistance to lateral forces by bracing (applying sheathing) to interior walls, creat-
ing a continuous load path to the ground. For homeswith post and pier perimeter foundations, the work has focused on providing partial foundations and bracing to carry the earthquake loads.
Figure E-8 Failed cripple stud wall, 1992 Big Bearearthquake.
Figure E-9 Failure of post and pier foundation,Humboldt County.
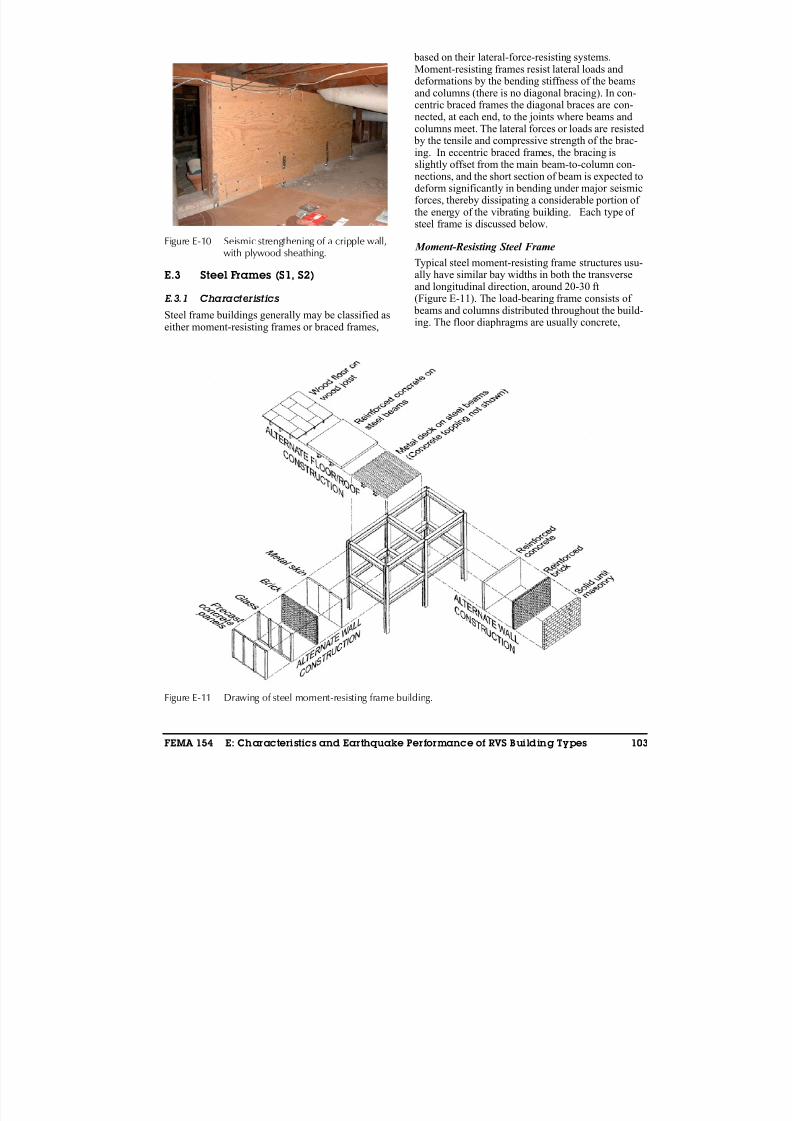
8/3/2019 Statewide Seismic Needs Assessment report
http://slidepdf.com/reader/full/statewide-seismic-needs-assessment-report 304/341
FEMA 154 E: Characteristics and Earthquake Performance of RVS Building Types 103
E.3 Steel Frames (S1, S2)
E.3.1 CharacteristicsSteel frame buildings generally may be classified aseither moment-resisting frames or braced frames,
based on their lateral-force-resisting systems.Moment-resisting frames resist lateral loads anddeformations by the bending stiffness of the beamsand columns (there is no diagonal bracing). In con-centric braced frames the diagonal braces are con-nected, at each end, to the joints where beams andcolumns meet. The lateral forces or loads are resisted by the tensile and compressive strength of the brac-
ing. In eccentric braced frames, the bracing isslightly offset from the main beam-to-column con-nections, and the short section of beam is expected todeform significantly in bending under major seismicforces, thereby dissipating a considerable portion of the energy of the vibrating building. Each type of steel frame is discussed below.
Moment-Resisting Steel Frame
Typical steel moment-resisting frame structures usu-ally have similar bay widths in both the transverseand longitudinal direction, around 20-30 ft
(Figure E-11). The load-bearing frame consists of beams and columns distributed throughout the build-ing. The floor diaphragms are usually concrete,
Figure E-10 Seismic strengthening of a cripple wall,with plywood sheathing.
Figure E-11 Drawing of steel moment-resisting frame building.

8/3/2019 Statewide Seismic Needs Assessment report
http://slidepdf.com/reader/full/statewide-seismic-needs-assessment-report 305/341
104 E: Characteristics and Earthquake Performance of RVS Building Types FEMA 154
sometimes over steel decking. Moment-resistingframe structures built since 1950 often incorporate prefabricated panels hung onto the structural frameas the exterior finish. These panels may be precastconcrete, stone or masonry veneer, metal, glass or plastic.
This structural type is used for commercial, insti-tutional and other public buildings. It is seldom used
for low-rise residential buildings.Steel frame structures built before 1945 are usu-
ally clad or infilled with unreinforced masonry suchas bricks, hollow clay tiles and terra cotta tiles andtherefore should be classified as S5 structures (seeSection E.6 for a detailed discussion). Other frame buildings of this period are encased in concrete.Wood or concrete floor diaphragms are common for these older buildings.
Braced Steel Frame
Braced steel frame structures (Figures E-12 and
E-13) have been built since the late 1800s with simi-lar usage and exterior finish as the steel moment-frame buildings. Braced frames are sometimes usedfor long and narrow buildings because of their stiff-ness. Although these buildings are braced with diag-onal members, the bracing members usually cannot be detected from the building exterior.
From the building exterior, it is usually difficultto tell the difference between steel moment frames, braced frames, and frames with shear walls. In mostmodern buildings, the bracing or shear walls arelocated in the interior or covered by cladding mate-rial. Figure E-14 shows heavy diagonal bracing for ahigh rise building, located at the side walls, which
will be subsequently covered by finish materials andwill not be apparent. In fact, it is difficult to differen-tiate steel frame structures and concrete frame struc-tures from the exterior. Most of the time, the
structural members are clad in finish material. Inolder buildings, steel members can also be encased inconcrete. There are no positive ways of distinguish-ing these various frame types except in the two caseslisted below:
1. If a building can be determined to be a bracedframe, it is probably a steel structure.
Figure E-12 Braced frame configurations.
Figure E-13 Braced steel frame, with chevron anddiagonal braces. The braces and steelframes are usually covered by finishmaterial after the steel is erected.
Figure E-14 Chevron bracing in steel building underconstruction.
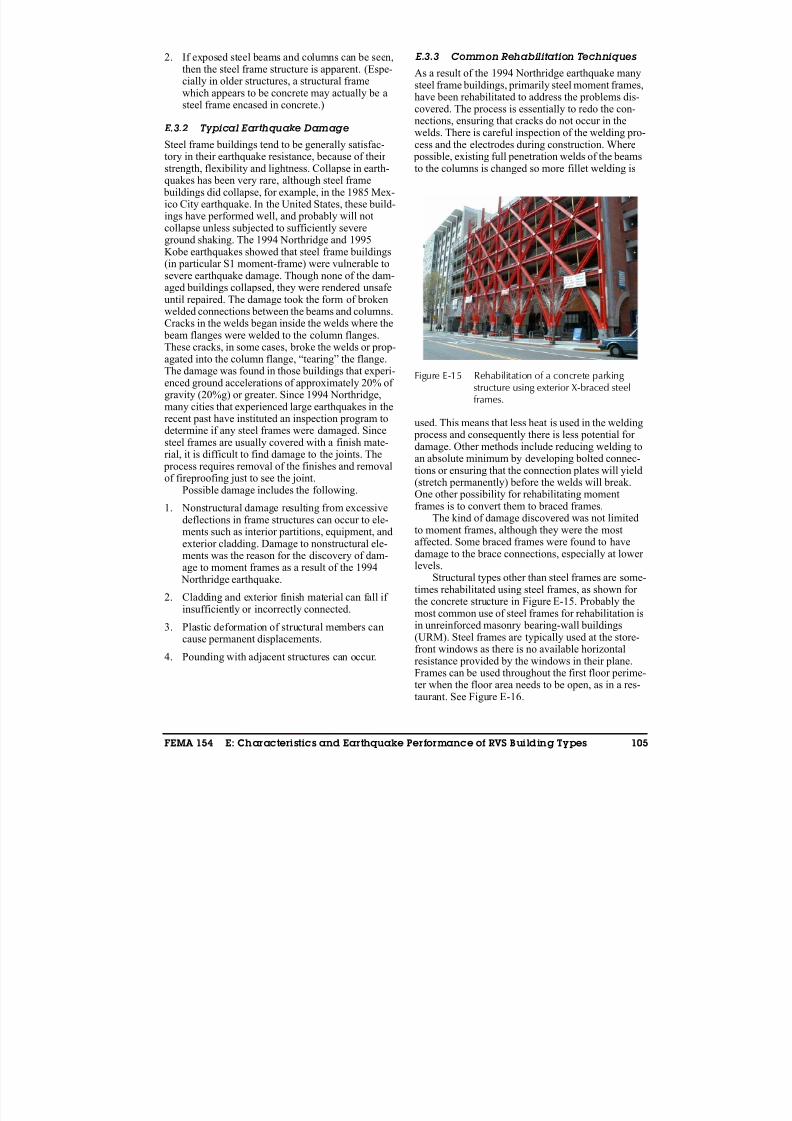
8/3/2019 Statewide Seismic Needs Assessment report
http://slidepdf.com/reader/full/statewide-seismic-needs-assessment-report 306/341
FEMA 154 E: Characteristics and Earthquake Performance of RVS Building Types 105
2. If exposed steel beams and columns can be seen,then the steel frame structure is apparent. (Espe-cially in older structures, a structural framewhich appears to be concrete may actually be asteel frame encased in concrete.)
E.3.2 Typical Earthquake Damage
Steel frame buildings tend to be generally satisfac-tory in their earthquake resistance, because of their strength, flexibility and lightness. Collapse in earth-quakes has been very rare, although steel frame buildings did collapse, for example, in the 1985 Mex-ico City earthquake. In the United States, these build-ings have performed well, and probably will notcollapse unless subjected to sufficiently severeground shaking. The 1994 Northridge and 1995Kobe earthquakes showed that steel frame buildings(in particular S1 moment-frame) were vulnerable tosevere earthquake damage. Though none of the dam-aged buildings collapsed, they were rendered unsafe
until repaired. The damage took the form of brokenwelded connections between the beams and columns.Cracks in the welds began inside the welds where the beam flanges were welded to the column flanges.These cracks, in some cases, broke the welds or prop-agated into the column flange, “tearing” the flange.The damage was found in those buildings that experi-enced ground accelerations of approximately 20% of gravity (20%g) or greater. Since 1994 Northridge,many cities that experienced large earthquakes in therecent past have instituted an inspection program todetermine if any steel frames were damaged. Sincesteel frames are usually covered with a finish mate-
rial, it is difficult to find damage to the joints. The process requires removal of the finishes and removalof fireproofing just to see the joint.
Possible damage includes the following.
1. Nonstructural damage resulting from excessivedeflections in frame structures can occur to ele-ments such as interior partitions, equipment, andexterior cladding. Damage to nonstructural ele-ments was the reason for the discovery of dam-age to moment frames as a result of the 1994 Northridge earthquake.
2. Cladding and exterior finish material can fall if
insufficiently or incorrectly connected.
3. Plastic deformation of structural members cancause permanent displacements.
4. Pounding with adjacent structures can occur.
E.3.3 Common Rehabilitation Techniques
As a result of the 1994 Northridge earthquake manysteel frame buildings, primarily steel moment frames,have been rehabilitated to address the problems dis-covered. The process is essentially to redo the con-nections, ensuring that cracks do not occur in thewelds. There is careful inspection of the welding pro-cess and the electrodes during construction. Where possible, existing full penetration welds of the beamsto the columns is changed so more fillet welding is
used. This means that less heat is used in the welding process and consequently there is less potential for damage. Other methods include reducing welding toan absolute minimum by developing bolted connec-tions or ensuring that the connection plates will yield(stretch permanently) before the welds will break.One other possibility for rehabilitating momentframes is to convert them to braced frames.
The kind of damage discovered was not limitedto moment frames, although they were the mostaffected. Some braced frames were found to havedamage to the brace connections, especially at lower levels.
Structural types other than steel frames are some-times rehabilitated using steel frames, as shown for
the concrete structure in Figure E-15. Probably themost common use of steel frames for rehabilitation isin unreinforced masonry bearing-wall buildings(URM). Steel frames are typically used at the store-front windows as there is no available horizontalresistance provided by the windows in their plane.Frames can be used throughout the first floor perime-ter when the floor area needs to be open, as in a res-taurant. See Figure E-16.
Figure E-15 Rehabilitation of a concrete parking structure using exterior X-braced steelframes.

8/3/2019 Statewide Seismic Needs Assessment report
http://slidepdf.com/reader/full/statewide-seismic-needs-assessment-report 307/341
106 E: Characteristics and Earthquake Performance of RVS Building Types FEMA 154
When a building is encountered with this type of rehabilitation scheme, the building should be consid-ered a frame type building S1 or S2.
E.4 Light Metal (S3)
E.4.1 Characteristics
Most light metal buildings existing today were builtafter 1950 (Figure E-17).They are used for agricul-tural structures, industrial factories, and warehouses.They are typically one story in height, sometimeswithout interior columns, and often enclose a largefloor area. Construction is typically of steel framesspanning the short dimension of the building, resist-ing lateral forces as moment frames. Forces in thelong direction are usually resisted by diagonal steelrod bracing. These buildings are usually clad withlightweight metal or asbestos-reinforced concretesiding, often corrugated.
To identify this construction type, the screener
should look for the following characteristics: Figure E-16 Use of a braced frame to rehabilitate anunreinforced masonry building.
Figure E-17 Drawing of light metal construction.
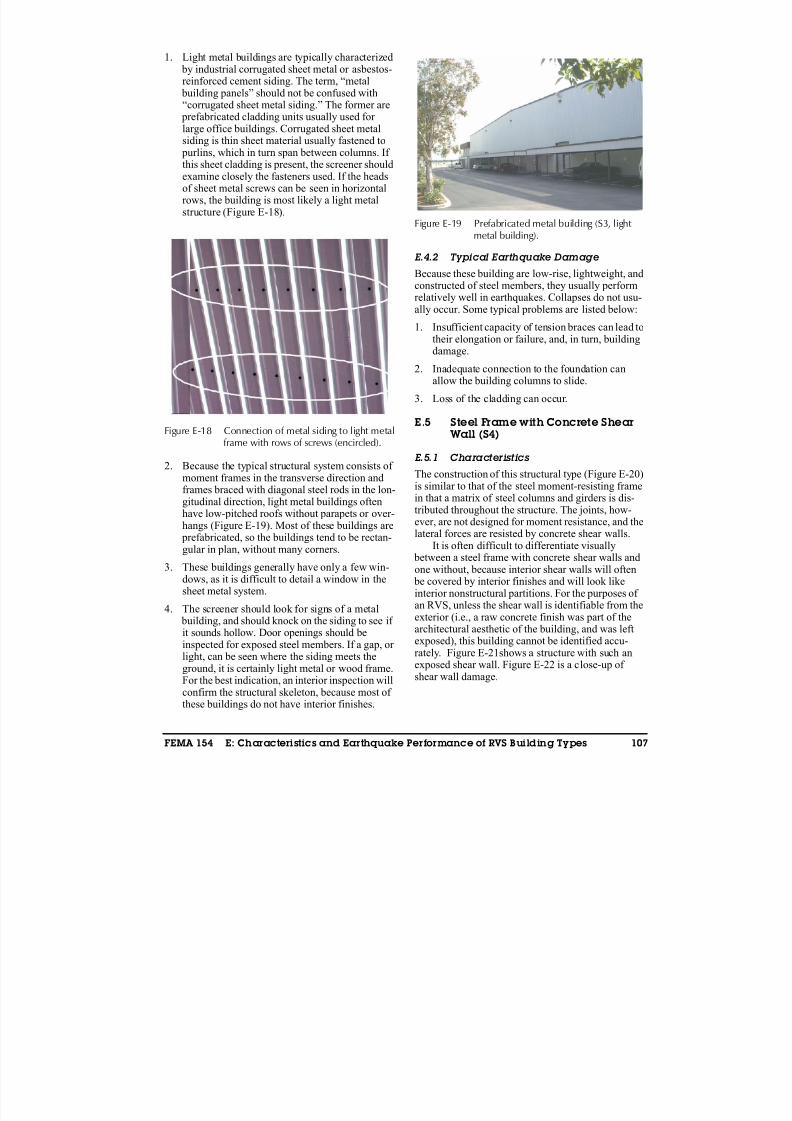
8/3/2019 Statewide Seismic Needs Assessment report
http://slidepdf.com/reader/full/statewide-seismic-needs-assessment-report 308/341
FEMA 154 E: Characteristics and Earthquake Performance of RVS Building Types 107
1. Light metal buildings are typically characterized by industrial corrugated sheet metal or asbestos-reinforced cement siding. The term, “metal building panels” should not be confused with“corrugated sheet metal siding.” The former are prefabricated cladding units usually used for large office buildings. Corrugated sheet metalsiding is thin sheet material usually fastened to
purlins, which in turn span between columns. If this sheet cladding is present, the screener shouldexamine closely the fasteners used. If the headsof sheet metal screws can be seen in horizontalrows, the building is most likely a light metalstructure (Figure E-18).
2. Because the typical structural system consists of moment frames in the transverse direction andframes braced with diagonal steel rods in the lon-gitudinal direction, light metal buildings oftenhave low-pitched roofs without parapets or over-hangs (Figure E-19). Most of these buildings are prefabricated, so the buildings tend to be rectan-gular in plan, without many corners.
3. These buildings generally have only a few win-dows, as it is difficult to detail a window in thesheet metal system.
4. The screener should look for signs of a metal building, and should knock on the siding to see if it sounds hollow. Door openings should beinspected for exposed steel members. If a gap, or light, can be seen where the siding meets theground, it is certainly light metal or wood frame.For the best indication, an interior inspection willconfirm the structural skeleton, because most of these buildings do not have interior finishes.
E.4.2 Typical Earthquake Damage
Because these building are low-rise, lightweight, andconstructed of steel members, they usually performrelatively well in earthquakes. Collapses do not usu-ally occur. Some typical problems are listed below:
1. Insufficient capacity of tension braces can lead totheir elongation or failure, and, in turn, buildingdamage.
2. Inadequate connection to the foundation canallow the building columns to slide.
3. Loss of the cladding can occur.
E.5 Steel Frame with Concrete Shear Wall (S4)
E.5.1 Characteristics
The construction of this structural type (Figure E-20)is similar to that of the steel moment-resisting framein that a matrix of steel columns and girders is dis-tributed throughout the structure. The joints, how-ever, are not designed for moment resistance, and thelateral forces are resisted by concrete shear walls.
It is often difficult to differentiate visually between a steel frame with concrete shear walls andone without, because interior shear walls will often be covered by interior finishes and will look likeinterior nonstructural partitions. For the purposes of
an RVS, unless the shear wall is identifiable from theexterior (i.e., a raw concrete finish was part of thearchitectural aesthetic of the building, and was leftexposed), this building cannot be identified accu-rately. Figure E-21shows a structure with such anexposed shear wall. Figure E-22 is a close-up of shear wall damage.
Figure E-18 Connection of metal siding to light metalframe with rows of screws (encircled).
Figure E-19 Prefabricated metal building (S3, light metal building).
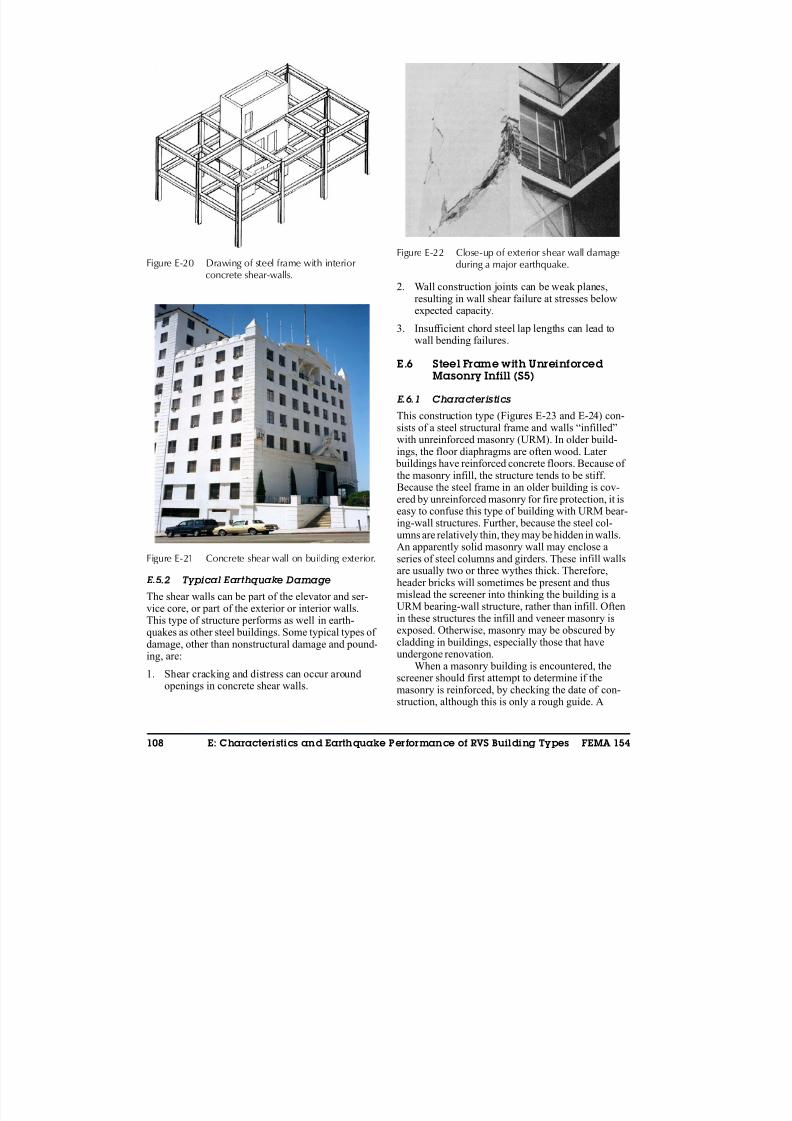
8/3/2019 Statewide Seismic Needs Assessment report
http://slidepdf.com/reader/full/statewide-seismic-needs-assessment-report 309/341
108 E: Characteristics and Earthquake Performance of RVS Building Types FEMA 154
E.5.2 Typical Earthquake Damage
The shear walls can be part of the elevator and ser-
vice core, or part of the exterior or interior walls.This type of structure performs as well in earth-quakes as other steel buildings. Some typical types of damage, other than nonstructural damage and pound-ing, are:
1. Shear cracking and distress can occur aroundopenings in concrete shear walls.
2. Wall construction joints can be weak planes,
resulting in wall shear failure at stresses belowexpected capacity.
3. Insufficient chord steel lap lengths can lead towall bending failures.
E.6 Steel Frame with UnreinforcedMasonry Infill (S5)
E.6.1 Characteristics
This construction type (Figures E-23 and E-24) con-sists of a steel structural frame and walls “infilled”with unreinforced masonry (URM). In older build-
ings, the floor diaphragms are often wood. Later buildings have reinforced concrete floors. Because of the masonry infill, the structure tends to be stiff.Because the steel frame in an older building is cov-ered by unreinforced masonry for fire protection, it iseasy to confuse this type of building with URM bear-ing-wall structures. Further, because the steel col-umns are relatively thin, they may be hidden in walls.An apparently solid masonry wall may enclose aseries of steel columns and girders. These infill wallsare usually two or three wythes thick. Therefore,header bricks will sometimes be present and thusmislead the screener into thinking the building is a
URM bearing-wall structure, rather than infill. Oftenin these structures the infill and veneer masonry isexposed. Otherwise, masonry may be obscured bycladding in buildings, especially those that haveundergone renovation.
When a masonry building is encountered, thescreener should first attempt to determine if themasonry is reinforced, by checking the date of con-struction, although this is only a rough guide. A
Figure E-20 Drawing of steel frame with interiorconcrete shear-walls.
Figure E-21 Concrete shear wall on building exterior.
Figure E-22 Close-up of exterior shear wall damageduring a major earthquake.
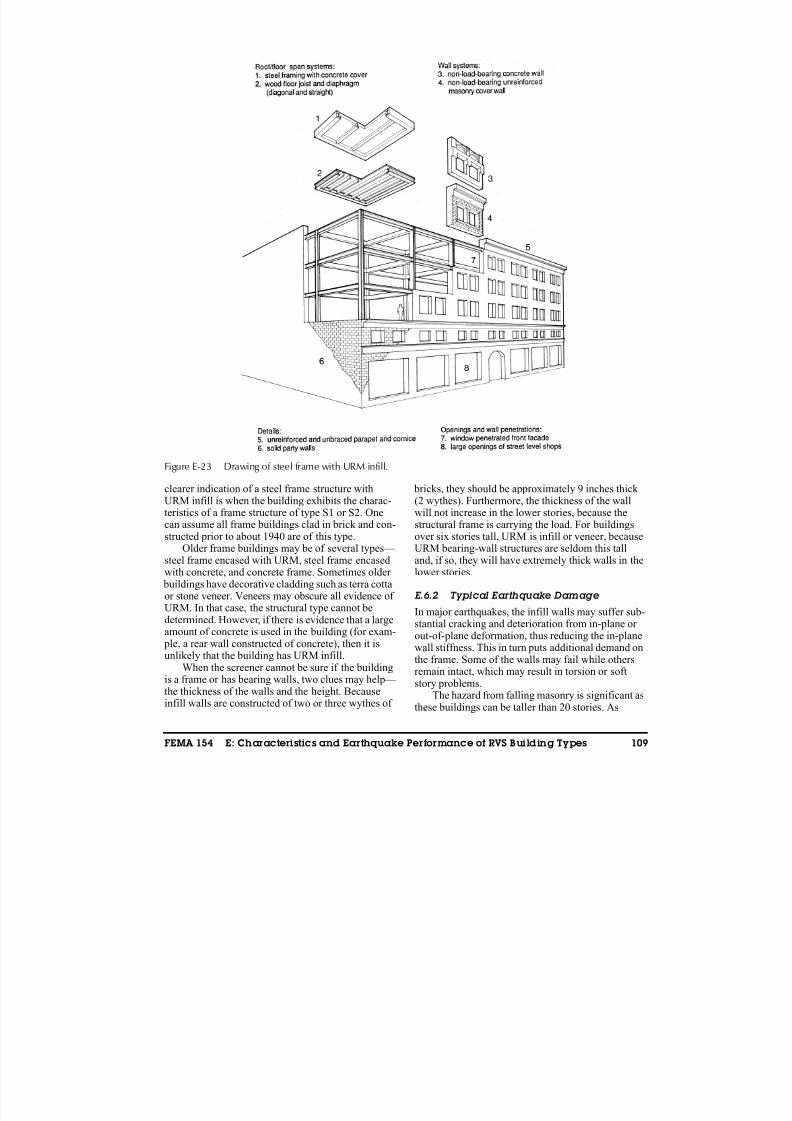
8/3/2019 Statewide Seismic Needs Assessment report
http://slidepdf.com/reader/full/statewide-seismic-needs-assessment-report 310/341
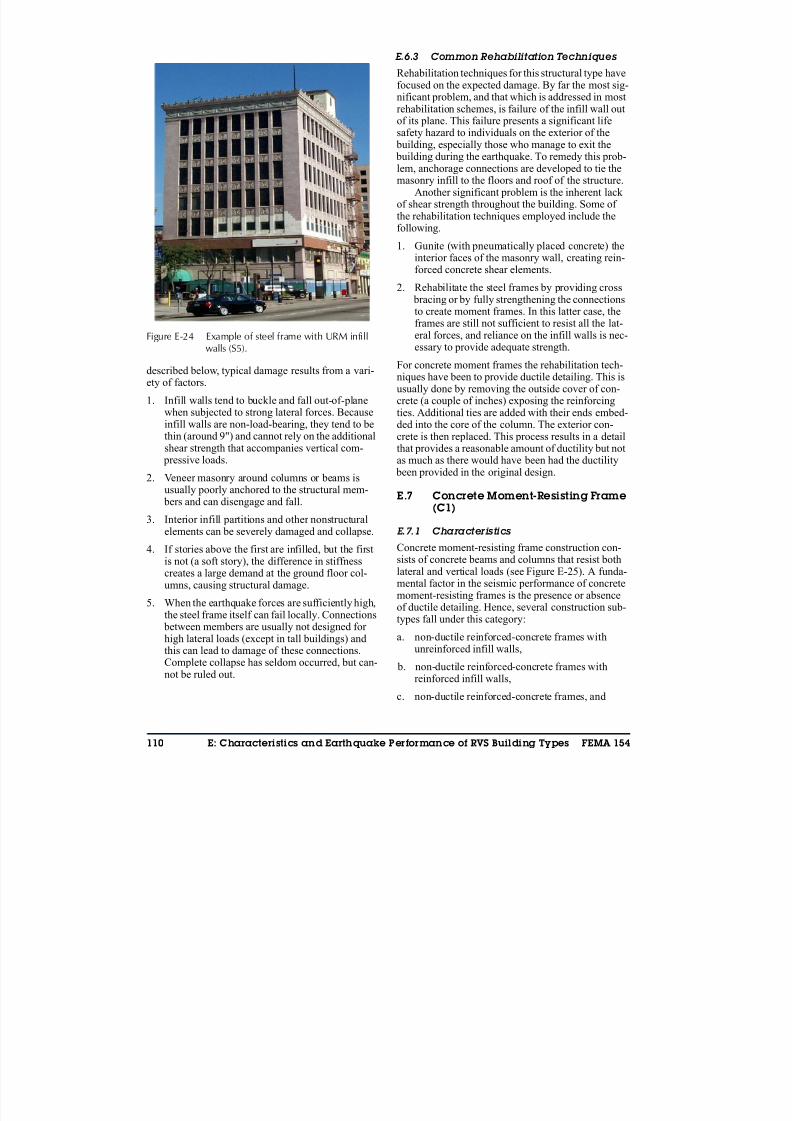
8/3/2019 Statewide Seismic Needs Assessment report
http://slidepdf.com/reader/full/statewide-seismic-needs-assessment-report 311/341
110 E: Characteristics and Earthquake Performance of RVS Building Types FEMA 154
described below, typical damage results from a vari-ety of factors.
1. Infill walls tend to buckle and fall out-of-planewhen subjected to strong lateral forces. Becauseinfill walls are non-load-bearing, they tend to bethin (around 9") and cannot rely on the additionalshear strength that accompanies vertical com- pressive loads.
2. Veneer masonry around columns or beams isusually poorly anchored to the structural mem- bers and can disengage and fall.
3. Interior infill partitions and other nonstructuralelements can be severely damaged and collapse.
4. If stories above the first are infilled, but the firstis not (a soft story), the difference in stiffnesscreates a large demand at the ground floor col-umns, causing structural damage.
5. When the earthquake forces are sufficiently high,the steel frame itself can fail locally. Connections between members are usually not designed for high lateral loads (except in tall buildings) andthis can lead to damage of these connections.Complete collapse has seldom occurred, but can-not be ruled out.
E.6.3 Common Rehabilitation Techniques
Rehabilitation techniques for this structural type havefocused on the expected damage. By far the most sig-nificant problem, and that which is addressed in mostrehabilitation schemes, is failure of the infill wall outof its plane. This failure presents a significant lifesafety hazard to individuals on the exterior of the building, especially those who manage to exit the building during the earthquake. To remedy this prob-lem, anchorage connections are developed to tie themasonry infill to the floors and roof of the structure.
Another significant problem is the inherent lack of shear strength throughout the building. Some of the rehabilitation techniques employed include thefollowing.
1. Gunite (with pneumatically placed concrete) theinterior faces of the masonry wall, creating rein-forced concrete shear elements.
2. Rehabilitate the steel frames by providing cross
bracing or by fully strengthening the connectionsto create moment frames. In this latter case, theframes are still not sufficient to resist all the lat-eral forces, and reliance on the infill walls is nec-essary to provide adequate strength.
For concrete moment frames the rehabilitation tech-niques have been to provide ductile detailing. This isusually done by removing the outside cover of con-crete (a couple of inches) exposing the reinforcingties. Additional ties are added with their ends embed-ded into the core of the column. The exterior con-crete is then replaced. This process results in a detailthat provides a reasonable amount of ductility but notas much as there would have been had the ductility been provided in the original design.
E.7 Concrete Moment-Resisting Frame(C1)
E.7.1 Characteristics
Concrete moment-resisting frame construction con-sists of concrete beams and columns that resist bothlateral and vertical loads (see Figure E-25). A funda-mental factor in the seismic performance of concretemoment-resisting frames is the presence or absence
of ductile detailing. Hence, several construction sub-types fall under this category:
a. non-ductile reinforced-concrete frames withunreinforced infill walls,
b. non-ductile reinforced-concrete frames withreinforced infill walls,
c. non-ductile reinforced-concrete frames, and
Figure E-24 Example of steel frame with URM infillwalls (S5).
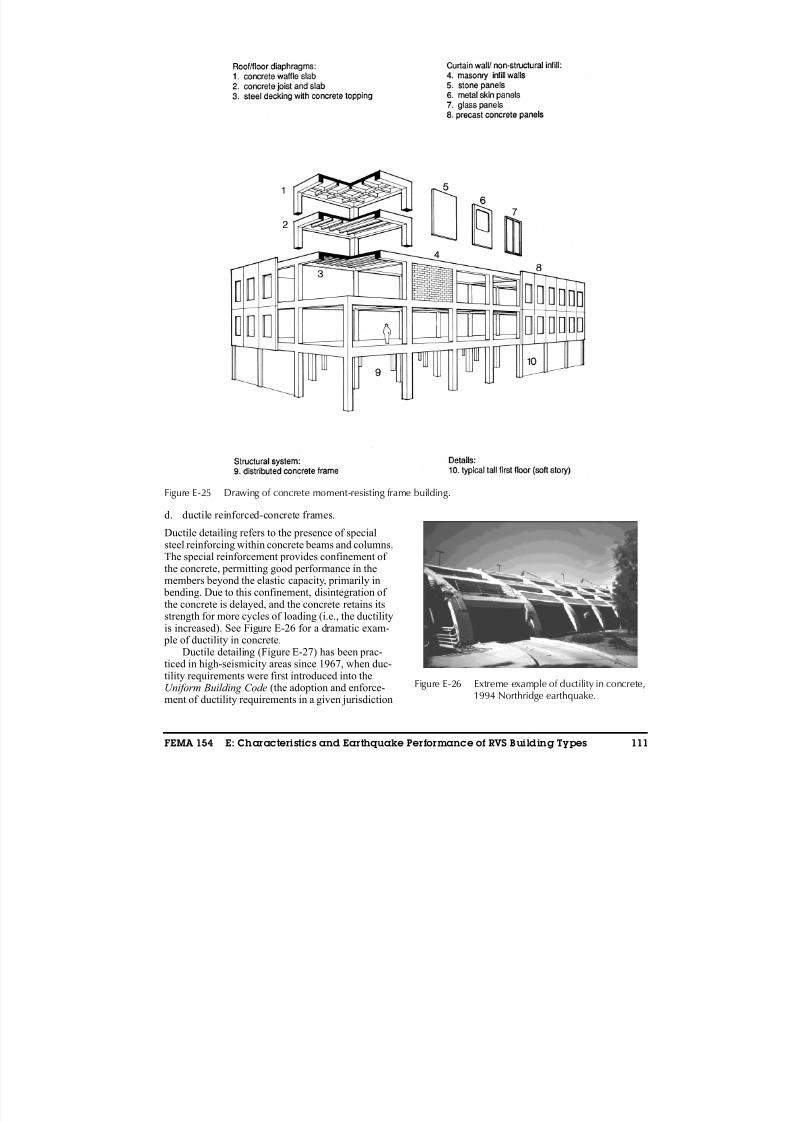
8/3/2019 Statewide Seismic Needs Assessment report
http://slidepdf.com/reader/full/statewide-seismic-needs-assessment-report 312/341
FEMA 154 E: Characteristics and Earthquake Performance of RVS Building Types 111
d. ductile reinforced-concrete frames.
Ductile detailing refers to the presence of specialsteel reinforcing within concrete beams and columns.The special reinforcement provides confinement of the concrete, permitting good performance in themembers beyond the elastic capacity, primarily in bending. Due to this confinement, disintegration of
the concrete is delayed, and the concrete retains itsstrength for more cycles of loading (i.e., the ductilityis increased). See Figure E-26 for a dramatic exam- ple of ductility in concrete.
Ductile detailing (Figure E-27) has been prac-ticed in high-seismicity areas since 1967, when duc-tility requirements were first introduced into theUniform Building Code (the adoption and enforce-ment of ductility requirements in a given jurisdiction
Figure E-25 Drawing of concrete moment-resisting frame building.
Figure E-26 Extreme example of ductility in concrete,1994 Northridge earthquake.
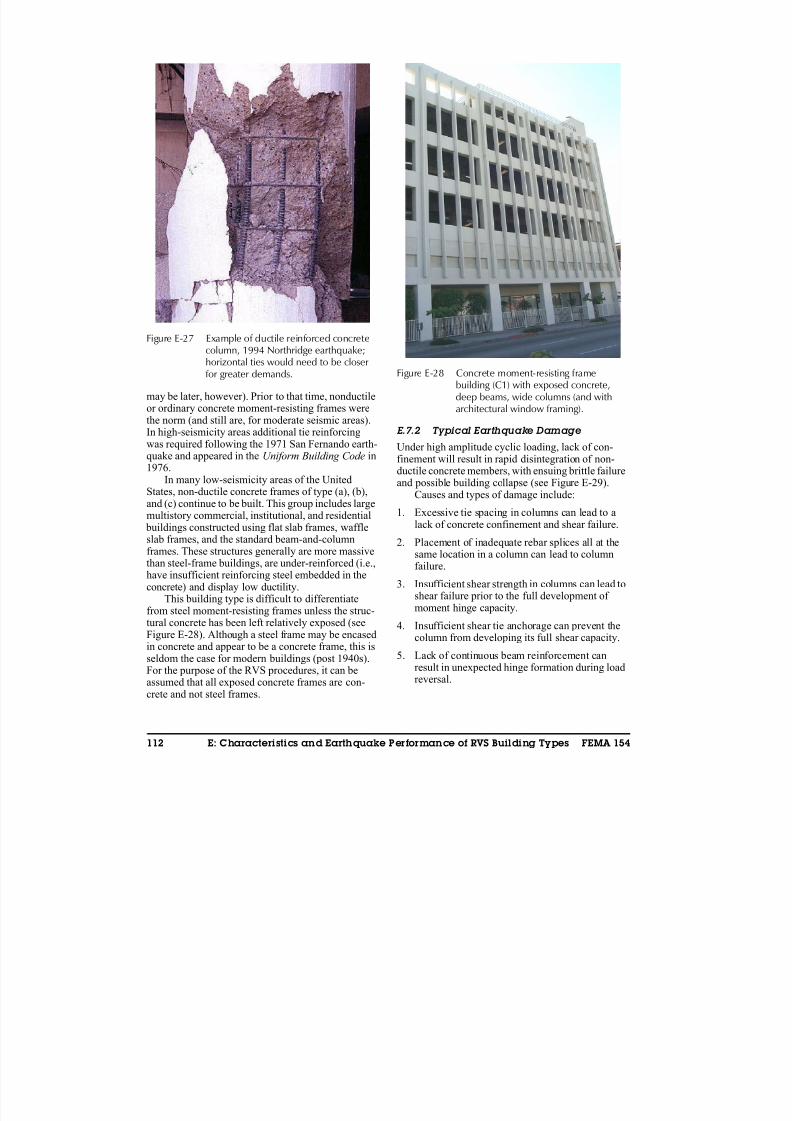
8/3/2019 Statewide Seismic Needs Assessment report
http://slidepdf.com/reader/full/statewide-seismic-needs-assessment-report 313/341
112 E: Characteristics and Earthquake Performance of RVS Building Types FEMA 154
may be later, however). Prior to that time, nonductileor ordinary concrete moment-resisting frames werethe norm (and still are, for moderate seismic areas).In high-seismicity areas additional tie reinforcingwas required following the 1971 San Fernando earth-
quake and appeared in the Uniform Building Code in1976.
In many low-seismicity areas of the UnitedStates, non-ductile concrete frames of type (a), (b),and (c) continue to be built. This group includes largemultistory commercial, institutional, and residential buildings constructed using flat slab frames, waffleslab frames, and the standard beam-and-columnframes. These structures generally are more massivethan steel-frame buildings, are under-reinforced (i.e.,have insufficient reinforcing steel embedded in theconcrete) and display low ductility.
This building type is difficult to differentiatefrom steel moment-resisting frames unless the struc-tural concrete has been left relatively exposed (seeFigure E-28). Although a steel frame may be encasedin concrete and appear to be a concrete frame, this isseldom the case for modern buildings (post 1940s).For the purpose of the RVS procedures, it can beassumed that all exposed concrete frames are con-crete and not steel frames.
E.7.2 Typical Earthquake Damage
Under high amplitude cyclic loading, lack of con-finement will result in rapid disintegration of non-ductile concrete members, with ensuing brittle failureand possible building collapse (see Figure E-29).
Causes and types of damage include:
1. Excessive tie spacing in columns can lead to alack of concrete confinement and shear failure.
2. Placement of inadequate rebar splices all at thesame location in a column can lead to columnfailure.
3. Insufficient shear strength in columns can lead toshear failure prior to the full development of
moment hinge capacity.
4. Insufficient shear tie anchorage can prevent thecolumn from developing its full shear capacity.
5. Lack of continuous beam reinforcement canresult in unexpected hinge formation during loadreversal.
Figure E-27 Example of ductile reinforced concretecolumn, 1994 Northridge earthquake;horizontal ties would need to be closerfor greater demands. Figure E-28 Concrete moment-resisting frame
building (C1) with exposed concrete,deep beams, wide columns (and witharchitectural window framing).
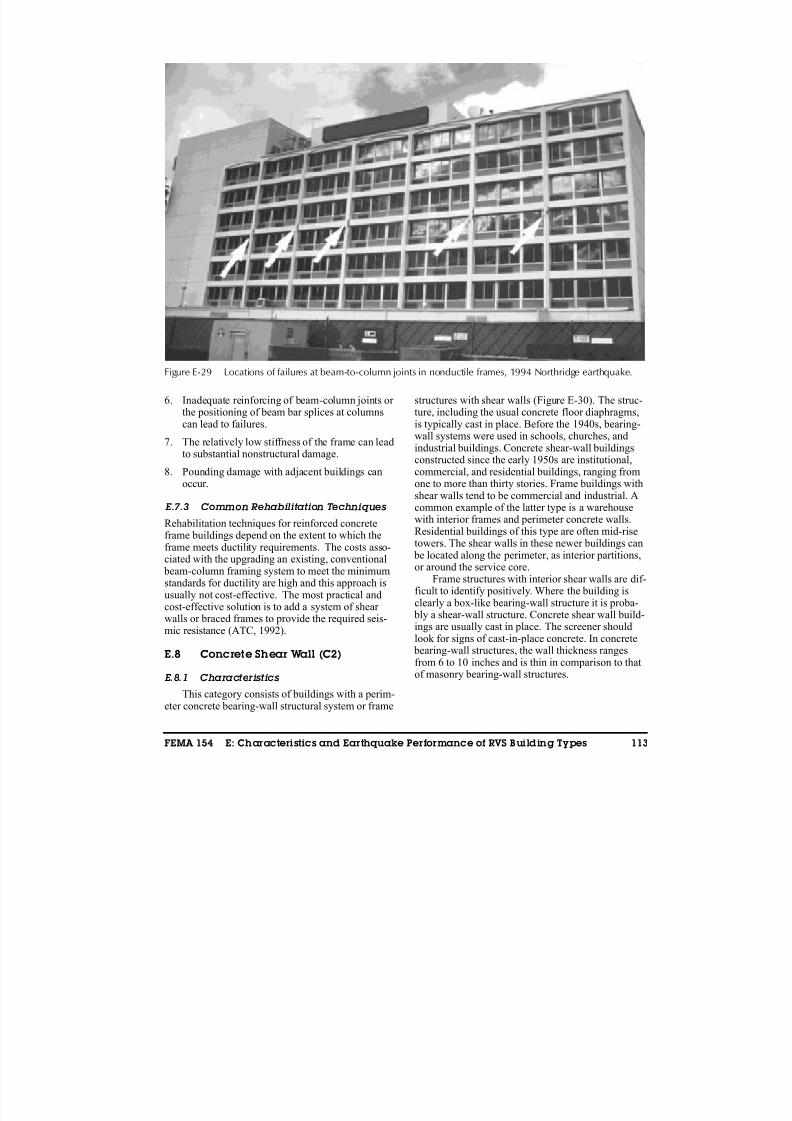
8/3/2019 Statewide Seismic Needs Assessment report
http://slidepdf.com/reader/full/statewide-seismic-needs-assessment-report 314/341
FEMA 154 E: Characteristics and Earthquake Performance of RVS Building Types 113
6. Inadequate reinforcing of beam-column joints or the positioning of beam bar splices at columnscan lead to failures.
7. The relatively low stiffness of the frame can lead
to substantial nonstructural damage.
8. Pounding damage with adjacent buildings canoccur.
E.7.3 Common Rehabilitation Techniques
Rehabilitation techniques for reinforced concreteframe buildings depend on the extent to which theframe meets ductility requirements. The costs asso-ciated with the upgrading an existing, conventional beam-column framing system to meet the minimumstandards for ductility are high and this approach isusually not cost-effective. The most practical and
cost-effective solution is to add a system of shear walls or braced frames to provide the required seis-mic resistance (ATC, 1992).
E.8 Concrete Shear Wall (C2)
E.8.1 Characteristics
This category consists of buildings with a perim-eter concrete bearing-wall structural system or frame
structures with shear walls (Figure E-30). The struc-ture, including the usual concrete floor diaphragms,is typically cast in place. Before the 1940s, bearing-wall systems were used in schools, churches, andindustrial buildings. Concrete shear-wall buildingsconstructed since the early 1950s are institutional,commercial, and residential buildings, ranging fromone to more than thirty stories. Frame buildings withshear walls tend to be commercial and industrial. Acommon example of the latter type is a warehousewith interior frames and perimeter concrete walls.Residential buildings of this type are often mid-risetowers. The shear walls in these newer buildings can be located along the perimeter, as interior partitions,or around the service core.
Frame structures with interior shear walls are dif-ficult to identify positively. Where the building is
clearly a box-like bearing-wall structure it is proba- bly a shear-wall structure. Concrete shear wall build-ings are usually cast in place. The screener shouldlook for signs of cast-in-place concrete. In concrete bearing-wall structures, the wall thickness rangesfrom 6 to 10 inches and is thin in comparison to thatof masonry bearing-wall structures.
Figure E-29 Locations of failures at beam-to-column joints in nonductile frames, 1994 Northridge earthquake.

8/3/2019 Statewide Seismic Needs Assessment report
http://slidepdf.com/reader/full/statewide-seismic-needs-assessment-report 315/341
114 E: Characteristics and Earthquake Performance of RVS Building Types FEMA 154
E.8.2 Typical Types of Earthquake Damage
This building type generally performs better thanconcrete frame buildings. The buildings are heavycompared with steel frame buildings, but they are
also stiff due to the presence of the shear walls. Dam-age commonly observed in taller buildings is caused by vertical discontinuities, pounding, and irregular configuration. Other damage specific to this buildingtype includes the following.
1. During large seismic events, shear cracking anddistress can occur around openings in concreteshear walls and in spandrel beams and link beams between shear walls (See Figures E-31and E-32.)
2. Shear failure can occur at wall construction joints usually at a load level below the expected
capacity.
3. Bending failures can result from insufficient ver-tical chord steel and insufficient lap lengths atthe ends of the walls.
E.8.3 Common Rehabilitation
Reinforced concrete shear-wall buildings can berehabilitated in a variety of ways. Techniques
include: (1) reinforcing existing walls in shear byapplying a layer of shotcrete or poured concrete; (2)where feasible, filling existing window or door open-ings with concrete to add shear strength and elimi-
nate critical bending stresses at the edge of openings;and (3) reinforcing narrow overstressed shear panelsin in-plane bending by adding reinforced boundaryelements (ATC, 1992).
E.9 Concrete Frame with UnreinforcedMasonry Infill (C3)
E.9.1 Characteristics
These buildings (Figures E-33 and E-34) have been,and continue to be, built in regions where unrein-forced masonry (URM) has not been eliminated bycode. These buildings were generally built before
1940 in high-seismicity regions and may continue to be built in other regions.
The first step in identification is to determine if the structure is old enough to contain URM. In con-trast to steel frames with URM infill, concrete frameswith URM infill usually show clear evidence of theconcrete frames. This is particularly true for indus-trial buildings and can usually be observed at the sideor rear of commercial buildings. The concrete col-
Figure E-30 Drawing of concrete shear-wall building.
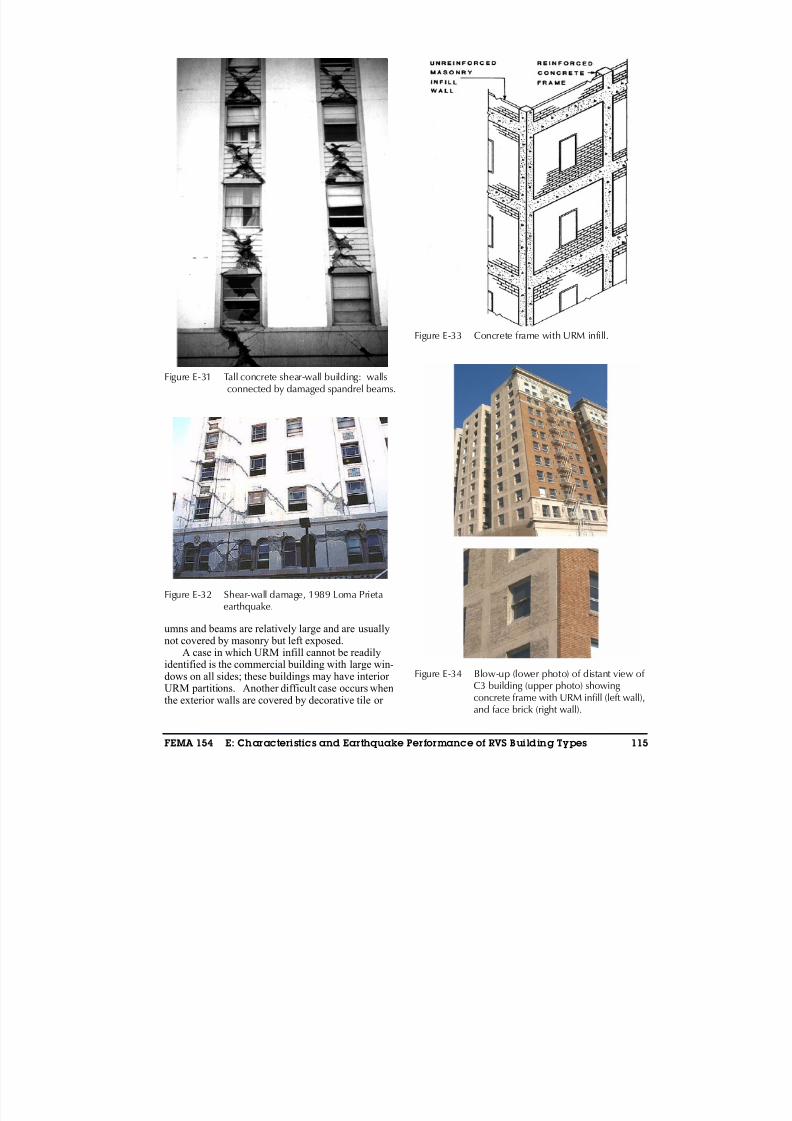
8/3/2019 Statewide Seismic Needs Assessment report
http://slidepdf.com/reader/full/statewide-seismic-needs-assessment-report 316/341
FEMA 154 E: Characteristics and Earthquake Performance of RVS Building Types 115
umns and beams are relatively large and are usuallynot covered by masonry but left exposed.
A case in which URM infill cannot be readilyidentified is the commercial building with large win-dows on all sides; these buildings may have interior URM partitions. Another difficult case occurs whenthe exterior walls are covered by decorative tile or
Figure E-31 Tall concrete shear-wall building: wallsconnected by damaged spandrel beams.
Figure E-32 Shear-wall damage, 1989 Loma Prieta
earthquake.
Figure E-33 Concrete frame with URM infill.
Figure E-34 Blow-up (lower photo) of distant view of C3 building (upper photo) showing concrete frame with URM infill (left wall),and face brick (right wall).
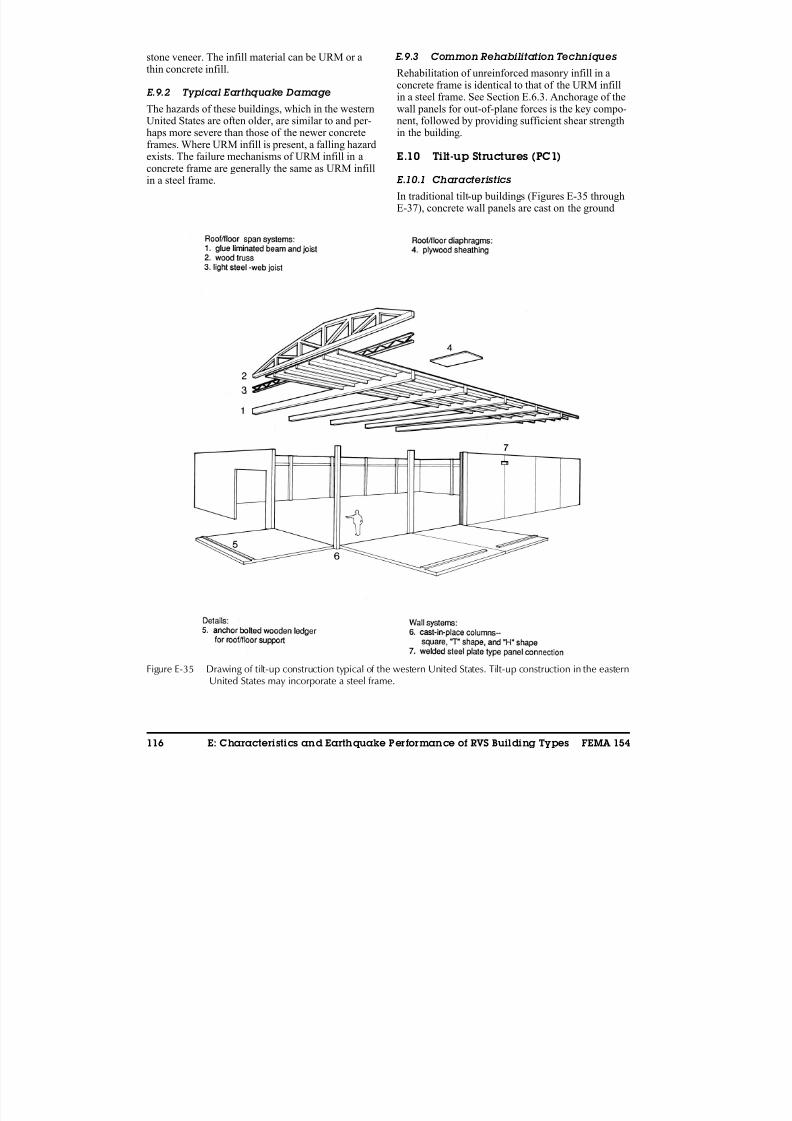
8/3/2019 Statewide Seismic Needs Assessment report
http://slidepdf.com/reader/full/statewide-seismic-needs-assessment-report 317/341
116 E: Characteristics and Earthquake Performance of RVS Building Types FEMA 154
stone veneer. The infill material can be URM or athin concrete infill.
E.9.2 Typical Earthquake Damage
The hazards of these buildings, which in the westernUnited States are often older, are similar to and per-haps more severe than those of the newer concreteframes. Where URM infill is present, a falling hazardexists. The failure mechanisms of URM infill in aconcrete frame are generally the same as URM infillin a steel frame.
E.9.3 Common Rehabilitation Techniques
Rehabilitation of unreinforced masonry infill in aconcrete frame is identical to that of the URM infillin a steel frame. See Section E.6.3. Anchorage of thewall panels for out-of-plane forces is the key compo-nent, followed by providing sufficient shear strengthin the building.
E.10 Tilt-up Structures (PC1)
E.10.1 Characteristics
In traditional tilt-up buildings (Figures E-35 throughE-37), concrete wall panels are cast on the ground
Figure E-35 Drawing of tilt-up construction typical of the western United States. Tilt-up construction in the easternUnited States may incorporate a steel frame.
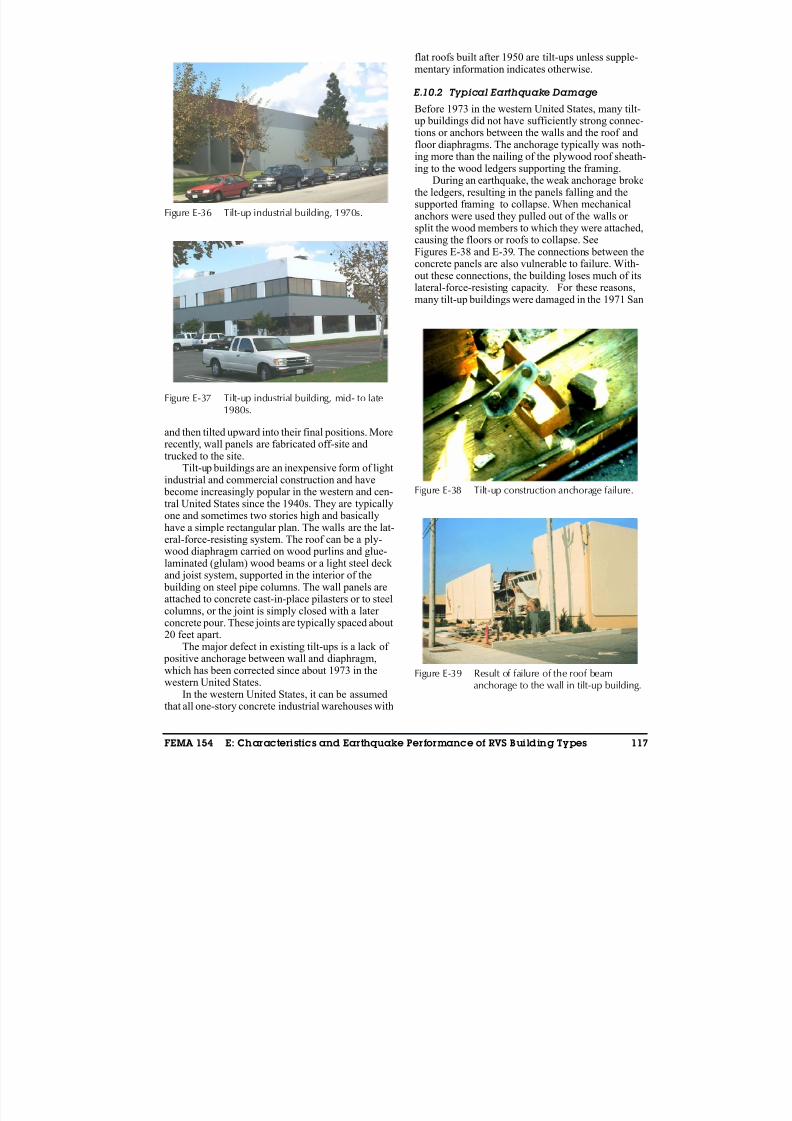
8/3/2019 Statewide Seismic Needs Assessment report
http://slidepdf.com/reader/full/statewide-seismic-needs-assessment-report 318/341
FEMA 154 E: Characteristics and Earthquake Performance of RVS Building Types 117
and then tilted upward into their final positions. Morerecently, wall panels are fabricated off-site and
trucked to the site.Tilt-up buildings are an inexpensive form of light
industrial and commercial construction and have become increasingly popular in the western and cen-tral United States since the 1940s. They are typicallyone and sometimes two stories high and basicallyhave a simple rectangular plan. The walls are the lat-eral-force-resisting system. The roof can be a ply-wood diaphragm carried on wood purlins and glue-laminated (glulam) wood beams or a light steel deck and joist system, supported in the interior of the building on steel pipe columns. The wall panels areattached to concrete cast-in-place pilasters or to steelcolumns, or the joint is simply closed with a later concrete pour. These joints are typically spaced about20 feet apart.
The major defect in existing tilt-ups is a lack of positive anchorage between wall and diaphragm,which has been corrected since about 1973 in thewestern United States.
In the western United States, it can be assumedthat all one-story concrete industrial warehouses with
flat roofs built after 1950 are tilt-ups unless supple-mentary information indicates otherwise.
E.10.2 Typical Earthquake Damage
Before 1973 in the western United States, many tilt-up buildings did not have sufficiently strong connec-tions or anchors between the walls and the roof andfloor diaphragms. The anchorage typically was noth-ing more than the nailing of the plywood roof sheath-ing to the wood ledgers supporting the framing.
During an earthquake, the weak anchorage brokethe ledgers, resulting in the panels falling and thesupported framing to collapse. When mechanicalanchors were used they pulled out of the walls or split the wood members to which they were attached,causing the floors or roofs to collapse. SeeFigures E-38 and E-39. The connections between theconcrete panels are also vulnerable to failure. With-out these connections, the building loses much of itslateral-force-resisting capacity. For these reasons,
many tilt-up buildings were damaged in the 1971 San
Figure E-36 Tilt-up industrial building, 1970s.
Figure E-37 Tilt-up industrial building, mid- to late1980s.
Figure E-38 Tilt-up construction anchorage failure.
Figure E-39 Result of failure of the roof beamanchorage to the wall in tilt-up building.
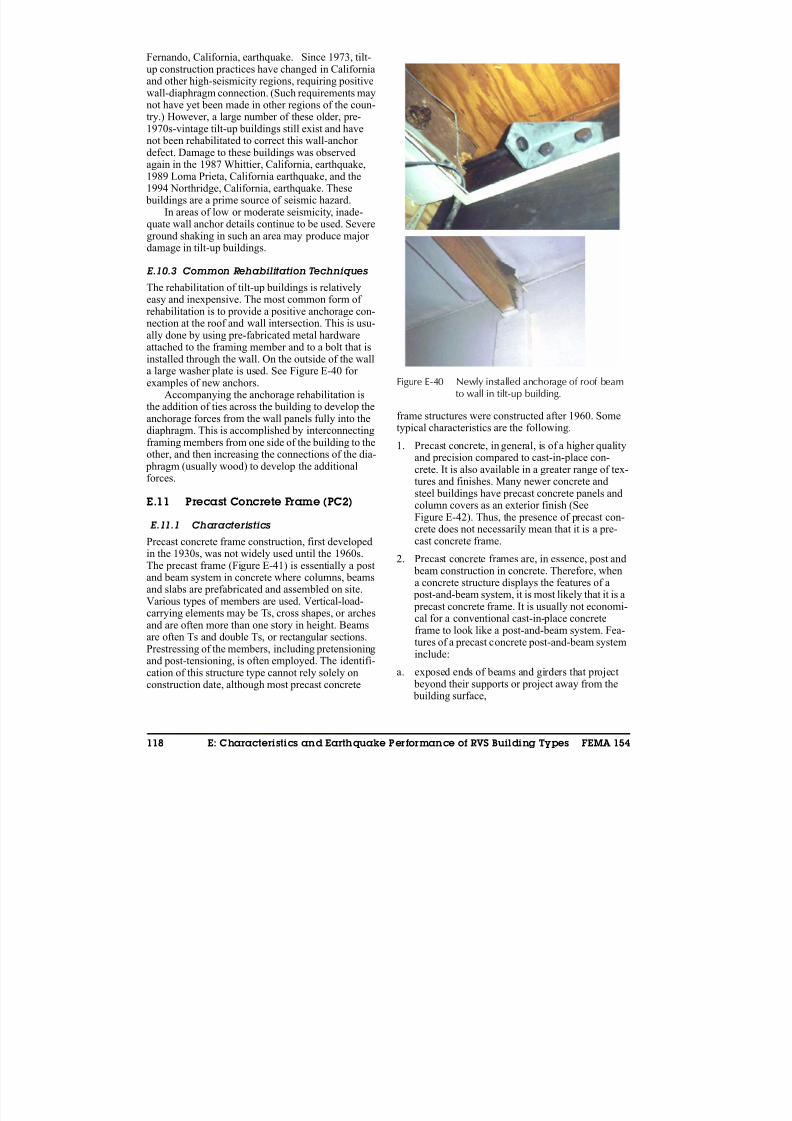
8/3/2019 Statewide Seismic Needs Assessment report
http://slidepdf.com/reader/full/statewide-seismic-needs-assessment-report 319/341
118 E: Characteristics and Earthquake Performance of RVS Building Types FEMA 154
Fernando, California, earthquake. Since 1973, tilt-up construction practices have changed in Californiaand other high-seismicity regions, requiring positivewall-diaphragm connection. (Such requirements maynot have yet been made in other regions of the coun-try.) However, a large number of these older, pre-1970s-vintage tilt-up buildings still exist and havenot been rehabilitated to correct this wall-anchor
defect. Damage to these buildings was observedagain in the 1987 Whittier, California, earthquake,1989 Loma Prieta, California earthquake, and the1994 Northridge, California, earthquake. These buildings are a prime source of seismic hazard.
In areas of low or moderate seismicity, inade-quate wall anchor details continue to be used. Severeground shaking in such an area may produce major damage in tilt-up buildings.
E.10.3 Common Rehabilitation Techniques
The rehabilitation of tilt-up buildings is relatively
easy and inexpensive. The most common form of rehabilitation is to provide a positive anchorage con-nection at the roof and wall intersection. This is usu-ally done by using pre-fabricated metal hardwareattached to the framing member and to a bolt that isinstalled through the wall. On the outside of the walla large washer plate is used. See Figure E-40 for examples of new anchors.
Accompanying the anchorage rehabilitation isthe addition of ties across the building to develop theanchorage forces from the wall panels fully into thediaphragm. This is accomplished by interconnectingframing members from one side of the building to the
other, and then increasing the connections of the dia- phragm (usually wood) to develop the additionalforces.
E.11 Precast Concrete Frame (PC2)
E.11.1 Characteristics
Precast concrete frame construction, first developedin the 1930s, was not widely used until the 1960s.The precast frame (Figure E-41) is essentially a postand beam system in concrete where columns, beamsand slabs are prefabricated and assembled on site.
Various types of members are used. Vertical-load-carrying elements may be Ts, cross shapes, or archesand are often more than one story in height. Beamsare often Ts and double Ts, or rectangular sections.Prestressing of the members, including pretensioningand post-tensioning, is often employed. The identifi-cation of this structure type cannot rely solely onconstruction date, although most precast concrete
frame structures were constructed after 1960. Sometypical characteristics are the following.
1. Precast concrete, in general, is of a higher quality
and precision compared to cast-in-place con-crete. It is also available in a greater range of tex-tures and finishes. Many newer concrete andsteel buildings have precast concrete panels andcolumn covers as an exterior finish (SeeFigure E-42). Thus, the presence of precast con-crete does not necessarily mean that it is a pre-cast concrete frame.
2. Precast concrete frames are, in essence, post and beam construction in concrete. Therefore, whena concrete structure displays the features of a post-and-beam system, it is most likely that it is a
precast concrete frame. It is usually not economi-cal for a conventional cast-in-place concreteframe to look like a post-and-beam system. Fea-tures of a precast concrete post-and-beam systeminclude:
a. exposed ends of beams and girders that project beyond their supports or project away from the building surface,
Figure E-40 Newly installed anchorage of roof beamto wall in tilt-up building.
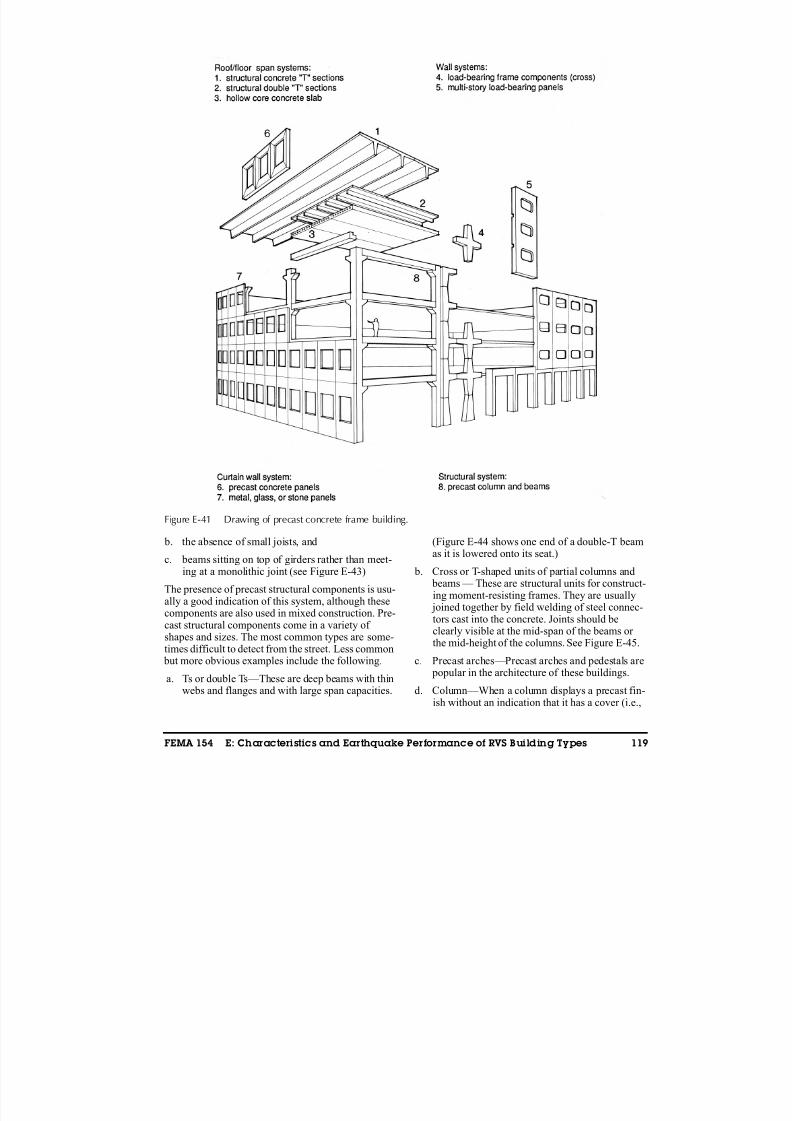
8/3/2019 Statewide Seismic Needs Assessment report
http://slidepdf.com/reader/full/statewide-seismic-needs-assessment-report 320/341
FEMA 154 E: Characteristics and Earthquake Performance of RVS Building Types 119
b. the absence of small joists, and
c. beams sitting on top of girders rather than meet-ing at a monolithic joint (see Figure E-43)
The presence of precast structural components is usu-
ally a good indication of this system, although thesecomponents are also used in mixed construction. Pre-cast structural components come in a variety of shapes and sizes. The most common types are some-times difficult to detect from the street. Less common but more obvious examples include the following.
a. Ts or double Ts—These are deep beams with thinwebs and flanges and with large span capacities.
(Figure E-44 shows one end of a double-T beamas it is lowered onto its seat.)
b. Cross or T-shaped units of partial columns and beams — These are structural units for construct-ing moment-resisting frames. They are usually
joined together by field welding of steel connec-tors cast into the concrete. Joints should beclearly visible at the mid-span of the beams or the mid-height of the columns. See Figure E-45.
c. Precast arches—Precast arches and pedestals are popular in the architecture of these buildings.
d. Column—When a column displays a precast fin-ish without an indication that it has a cover (i.e.,
Figure E-41 Drawing of precast concrete frame building.

8/3/2019 Statewide Seismic Needs Assessment report
http://slidepdf.com/reader/full/statewide-seismic-needs-assessment-report 321/341
120 E: Characteristics and Earthquake Performance of RVS Building Types FEMA 154
no vertical seam can be found), the column islikely to be a precast structural column.
It is possible that a precast concrete frame may notshow any of the above features, however.
E.11.2 Typical Earthquake Damage
The earthquake performance of this structural typevaries widely and is sometimes poor. This type of building can perform well if the detailing used toconnect the structural elements have sufficientstrength and ductility (toughness). Because structuresof this type often employ cast-in-place concrete or reinforced masonry (brick or block) shear walls for lateral-load resistance, they experience the sametypes of damage as other shear-wall building types.
Some of the problem areas specific to precast framesare listed below.
1. Poorly designed connections between prefabri-cated elements can fail.
2. Accumulated stresses can result due to shrinkageand creep and due to stresses incurred in trans- portation.
3. Loss of vertical support can occur due to inade-quate bearing area and insufficient connection between floor elements and columns.
4. Corrosion of the metal connectors between pre-
fabricated elements can occur.
E.11.3 Common Rehabilitation Techniques
Seismic rehabilitation techniques for precast concreteframe buildings are varied, depending on the ele-ments being strengthened. Inadequate shear capacityof floor diaphragms can be addressed by adding rein-forced concrete topping to an untopped system when
Figure E-42 Typical precast column cover on a steelor concrete moment frame.
Figure E-43 Exposed precast double-T sections andoverlapping beams are indicative of
precast frames.
Figure E-44 Example of precast double-T sectionduring installation.
Figure E-45 Precast structural cross; installation jointsare at sections where bending isminimum during high seismic demand.

8/3/2019 Statewide Seismic Needs Assessment report
http://slidepdf.com/reader/full/statewide-seismic-needs-assessment-report 322/341
FEMA 154 E: Characteristics and Earthquake Performance of RVS Building Types 121
possible, or adding new shear walls to reduce theseismic shear forces in the diaphragm. Corbels withinadequate vertical shear or bending strength can bestrengthened by adding epoxied horizontal shear dowels through the corbel and into the column.Alternatively, vertical shear capacity can beincreased by adding a structural steel bolster under the corbel, bolted to the column, or a new steel col-
umn or reinforced concrete column can be added(ATC, 1992).
E.12 Reinforced Masonry (RM1 andRM2)
E.12.1 Characteristics
Reinforced masonry buildings are mostly low-risestructures with perimeter bearing walls, often withwood diaphragms (RM1 buildings) although precastconcrete is sometimes used (RM2 buildings). Floor and roof assemblies usually consist of timber joists
and beams, glued-laminated beams, or light steel joists. The bearing walls consist of grouted and rein-forced hollow or solid masonry units. Interior sup- ports, if any, are often wood or steel columns, woodstud frames, or masonry walls. Occupancy varies
from small commercial buildings to residential and industrial buildings. Generally, they are less than fivestories in height although many taller masonry build-ings exist. Reinforced masonry structures are usually basically rectangular structures (See Figure E-46).
To identify reinforced masonry, one must deter-mine separately if the building is masonry and if it isreinforced. To obtain information on how to recog-nize a masonry structure, see Appendix D, whichdescribes the characteristics of construction materi-als. The best way of assessing the reinforcement con-dition is to compare the date of construction with thedate of code requirement for the reinforcement of masonry in the local jurisdiction.
The screener also needs to determine if the build-ing is veneered with masonry or is a masonry build-ing. Wood siding is seldom applied over masonry. If the front facade appears to be reinforced masonrywhereas the side has wood siding, it is probably awood frame that has undergone facade renovation.The back of the building should be checked for signsof the original construction type.
If it can be determined that the bearing walls areconstructed of concrete blocks, they may be rein-forced. Load-bearing structures using these blocksare probably reinforced if the local code required it.Concrete blocks come in a variety of sizes and tex-tures. The most common size is 8 inches wide by 16inches long by 8 inches high. Their presence is obvi-ous if the concrete blocks are left as the finish sur-face.
E.12.2 Typical Earthquake Damage
Reinforced masonry buildings can perform well in
moderate earthquakes if they are adequately rein-forced and grouted, and if sufficient diaphragmanchorage exists. A major problem is control of theworkmanship during construction. Poor construc-tion practice can result in ungrouted and unreinforcedwalls. Even where construction practice is adequate,insufficient reinforcement in the design can beresponsible for heavy damage of the walls. The lack of positive connection of the floor and roof dia- phragms to the wall is also a problem.
E.12.3 Common Rehabilitation Techniques
Techniques for seismic rehabilitation of reinforced
masonry bearing wall buildings are varied, depend-ing on the element being rehabilitated. Techniquesfor rehabilitating masonry walls include: (1) applyinga layer of concrete or shotcrete to the existing walls;(2) adding vertical reinforcing and grouting intoungrouted block walls; and (3) filling in large or crit-ical openings with reinforced concrete or masonrydowelled to the surrounding wall. Wood or steeldeck diaphragms in RM1 buildings can be rehabili-tated by adding an additional layer of plywood tostrengthen and stiffen an existing wood diaphragm, by shear welding between sections of an existing
steel deck or adding flat sheet steel reinforcement, or by adding additional vertical elements (for example,shear walls or braced frames) to decrease diaphragmspans and stresses. Precast floor diaphragms in RM2 buildings can be strengthen by adding a layer of con-crete topping reinforced with mesh (if the supportingstructure has the capacity to carry the additional ver-tical dead load), or by adding new shear walls toreduce the diaphragm span (ATC, 1992).
Figure E-46 Modern reinforced brick masonry.

8/3/2019 Statewide Seismic Needs Assessment report
http://slidepdf.com/reader/full/statewide-seismic-needs-assessment-report 323/341
122 E: Characteristics and Earthquake Performance of RVS Building Types FEMA 154
E.13 Unreinforced Masonry (URM)
E.13.1 Characteristics
Most unreinforced masonry (URM) bearing-wallstructures in the western United States (Figures E-47through E-51) were built before 1934, although thisconstruction type was permitted in some jurisdictions
having moderate or high seismicity until the late1940s or early 1950s (in some jurisdictions URMmay still be a common type of construction, eventoday). These buildings usually range from one to sixstories in height and function as commercial, residen-tial, or industrial buildings. The construction variesaccording to the type of use, although wood floor androof diaphragms are common. Smaller commercialand residential buildings usually have light wood
floor joists and roof joists supported on the typical perimeter URM wall and interior, wood, load-bear-ing partitions. Larger buildings, such as industrialwarehouses, have heavier floors and interior col-umns, usually of wood. The bearing walls of theseindustrial buildings tend to be thick, often as much as24 inches or more at the base. Wall thickness of resi-
dential, commercial, and office buildings range from9 inches at upper floors to 18 inches a lower floors.
The first step in identifying buildings of this typeis to determine if the structure has bearing walls. Sec-ond, the screener should determine the approximateage of the building. Some indications of unreinforcedmasonry are listed below.
1. Weak mortar was used to bond the masonry unitstogether in much of the early unreinforced
Figure E-47 Drawing of unreinforced masonry bearing-wall building, 2-story.
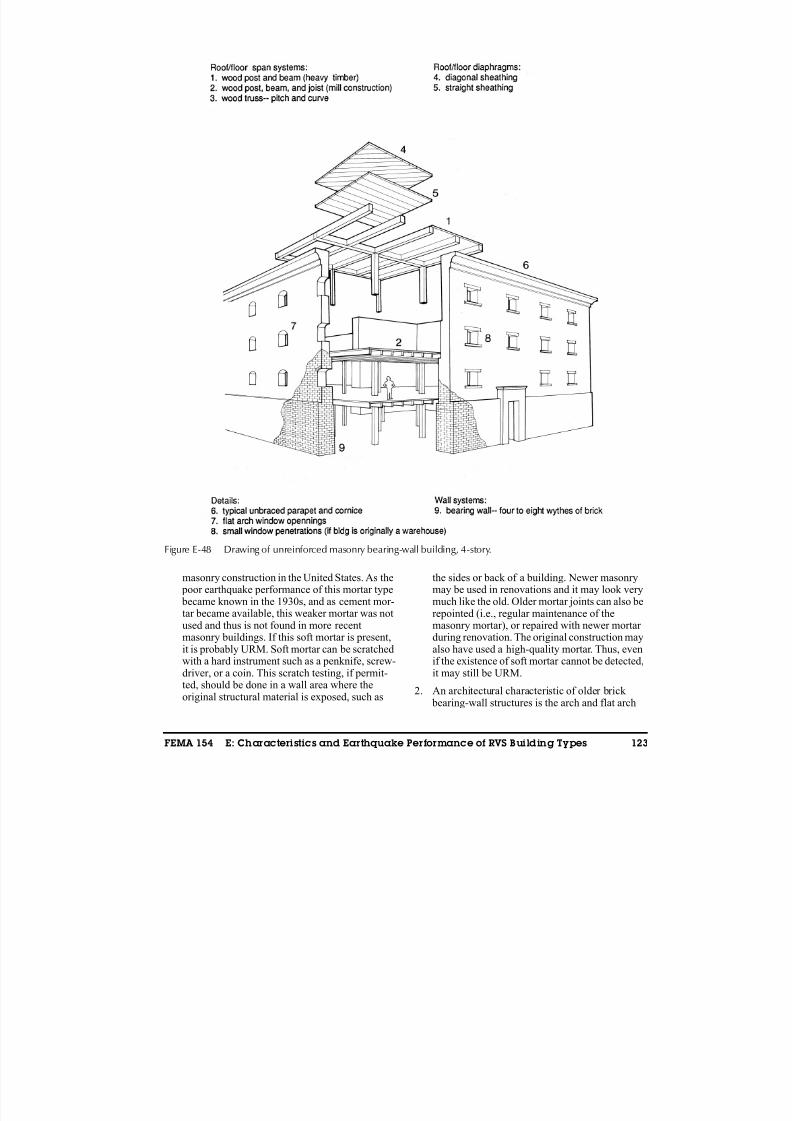
8/3/2019 Statewide Seismic Needs Assessment report
http://slidepdf.com/reader/full/statewide-seismic-needs-assessment-report 324/341
FEMA 154 E: Characteristics and Earthquake Performance of RVS Building Types 123
masonry construction in the United States. As the poor earthquake performance of this mortar type
became known in the 1930s, and as cement mor-tar became available, this weaker mortar was notused and thus is not found in more recentmasonry buildings. If this soft mortar is present,it is probably URM. Soft mortar can be scratchedwith a hard instrument such as a penknife, screw-driver, or a coin. This scratch testing, if permit-ted, should be done in a wall area where theoriginal structural material is exposed, such as
the sides or back of a building. Newer masonrymay be used in renovations and it may look very
much like the old. Older mortar joints can also berepointed (i.e., regular maintenance of themasonry mortar), or repaired with newer mortar during renovation. The original construction mayalso have used a high-quality mortar. Thus, evenif the existence of soft mortar cannot be detected,it may still be URM.
2. An architectural characteristic of older brick bearing-wall structures is the arch and flat arch
Figure E-48 Drawing of unreinforced masonry bearing-wall building, 4-story.

8/3/2019 Statewide Seismic Needs Assessment report
http://slidepdf.com/reader/full/statewide-seismic-needs-assessment-report 325/341
124 E: Characteristics and Earthquake Performance of RVS Building Types FEMA 154
Figure E-49 Drawing of unreinforced masonry bearing-wall building, 6-story.
Figure E-50 East coast URM bearing-wall building. Figure E-51 West coast URM bearing-wall building.
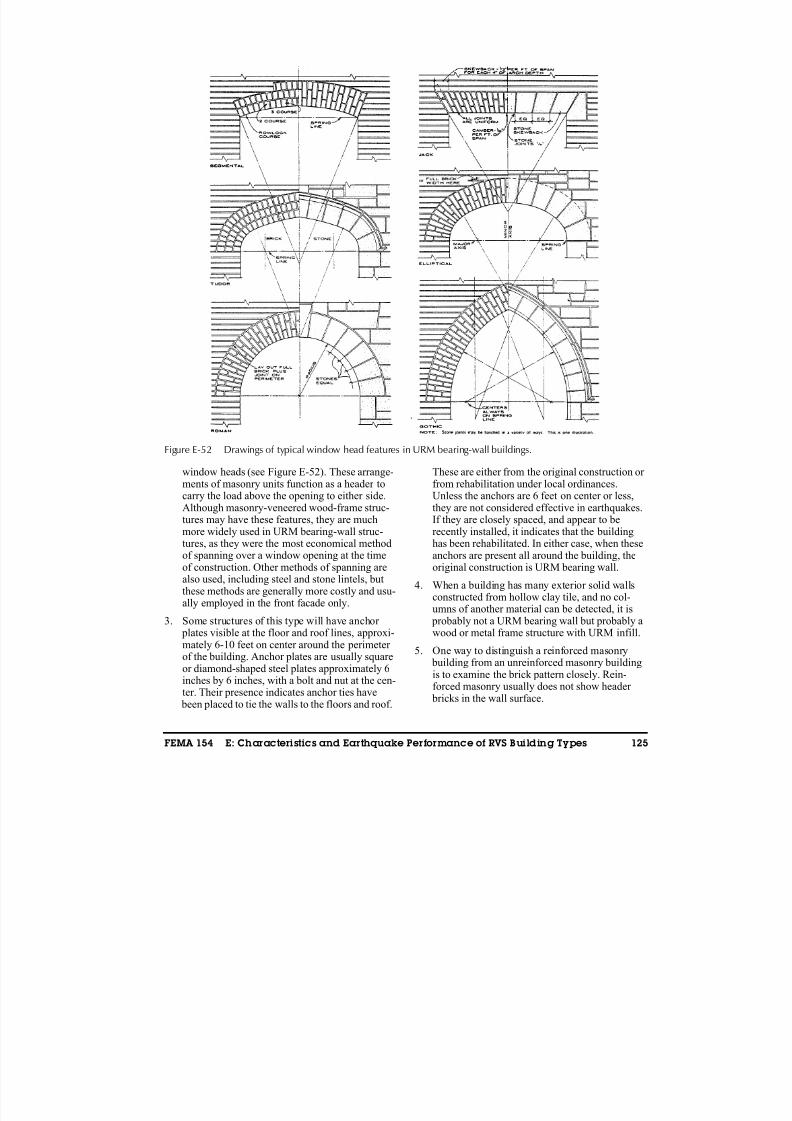
8/3/2019 Statewide Seismic Needs Assessment report
http://slidepdf.com/reader/full/statewide-seismic-needs-assessment-report 326/341
FEMA 154 E: Characteristics and Earthquake Performance of RVS Building Types 125
window heads (see Figure E-52). These arrange-ments of masonry units function as a header tocarry the load above the opening to either side.Although masonry-veneered wood-frame struc-tures may have these features, they are muchmore widely used in URM bearing-wall struc-tures, as they were the most economical methodof spanning over a window opening at the timeof construction. Other methods of spanning arealso used, including steel and stone lintels, butthese methods are generally more costly and usu-
ally employed in the front facade only.3. Some structures of this type will have anchor
plates visible at the floor and roof lines, approxi-mately 6-10 feet on center around the perimeter of the building. Anchor plates are usually squareor diamond-shaped steel plates approximately 6inches by 6 inches, with a bolt and nut at the cen-ter. Their presence indicates anchor ties have been placed to tie the walls to the floors and roof.
These are either from the original construction or from rehabilitation under local ordinances.Unless the anchors are 6 feet on center or less,they are not considered effective in earthquakes.If they are closely spaced, and appear to berecently installed, it indicates that the buildinghas been rehabilitated. In either case, when theseanchors are present all around the building, theoriginal construction is URM bearing wall.
4. When a building has many exterior solid wallsconstructed from hollow clay tile, and no col-
umns of another material can be detected, it is probably not a URM bearing wall but probably awood or metal frame structure with URM infill.
5. One way to distinguish a reinforced masonry building from an unreinforced masonry buildingis to examine the brick pattern closely. Rein-forced masonry usually does not show header bricks in the wall surface.
Figure E-52 Drawings of typical window head features in URM bearing-wall buildings.
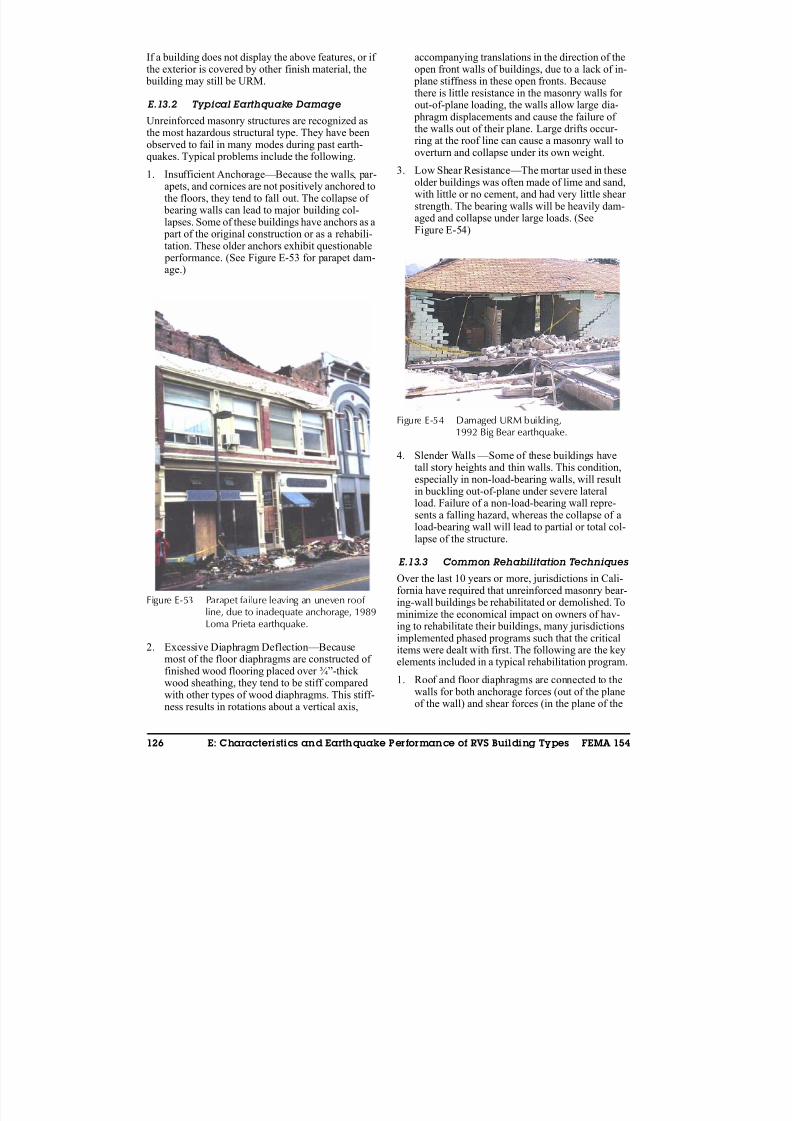
8/3/2019 Statewide Seismic Needs Assessment report
http://slidepdf.com/reader/full/statewide-seismic-needs-assessment-report 327/341
126 E: Characteristics and Earthquake Performance of RVS Building Types FEMA 154
If a building does not display the above features, or if the exterior is covered by other finish material, the building may still be URM.
E.13.2 Typical Earthquake Damage
Unreinforced masonry structures are recognized asthe most hazardous structural type. They have beenobserved to fail in many modes during past earth-quakes. Typical problems include the following.
1. Insufficient Anchorage—Because the walls, par-apets, and cornices are not positively anchored tothe floors, they tend to fall out. The collapse of bearing walls can lead to major building col-lapses. Some of these buildings have anchors as a part of the original construction or as a rehabili-tation. These older anchors exhibit questionable performance. (See Figure E-53 for parapet dam-age.)
2. Excessive Diaphragm Deflection—Becausemost of the floor diaphragms are constructed of finished wood flooring placed over ¾”-thick wood sheathing, they tend to be stiff comparedwith other types of wood diaphragms. This stiff-ness results in rotations about a vertical axis,
accompanying translations in the direction of theopen front walls of buildings, due to a lack of in- plane stiffness in these open fronts. Becausethere is little resistance in the masonry walls for out-of-plane loading, the walls allow large dia- phragm displacements and cause the failure of the walls out of their plane. Large drifts occur-ring at the roof line can cause a masonry wall to
overturn and collapse under its own weight.
3. Low Shear Resistance—The mortar used in theseolder buildings was often made of lime and sand,with little or no cement, and had very little shear strength. The bearing walls will be heavily dam-aged and collapse under large loads. (SeeFigure E-54)
4. Slender Walls —Some of these buildings havetall story heights and thin walls. This condition,especially in non-load-bearing walls, will resultin buckling out-of-plane under severe lateralload. Failure of a non-load-bearing wall repre-sents a falling hazard, whereas the collapse of aload-bearing wall will lead to partial or total col-lapse of the structure.
E.13.3 Common Rehabilitation Techniques
Over the last 10 years or more, jurisdictions in Cali-fornia have required that unreinforced masonry bear-
ing-wall buildings be rehabilitated or demolished. Tominimize the economical impact on owners of hav-ing to rehabilitate their buildings, many jurisdictionsimplemented phased programs such that the criticalitems were dealt with first. The following are the keyelements included in a typical rehabilitation program.
1. Roof and floor diaphragms are connected to thewalls for both anchorage forces (out of the planeof the wall) and shear forces (in the plane of the
Figure E-53 Parapet failure leaving an uneven roof line, due to inadequate anchorage, 1989Loma Prieta earthquake.
Figure E-54 Damaged URM building,1992 Big Bear earthquake.
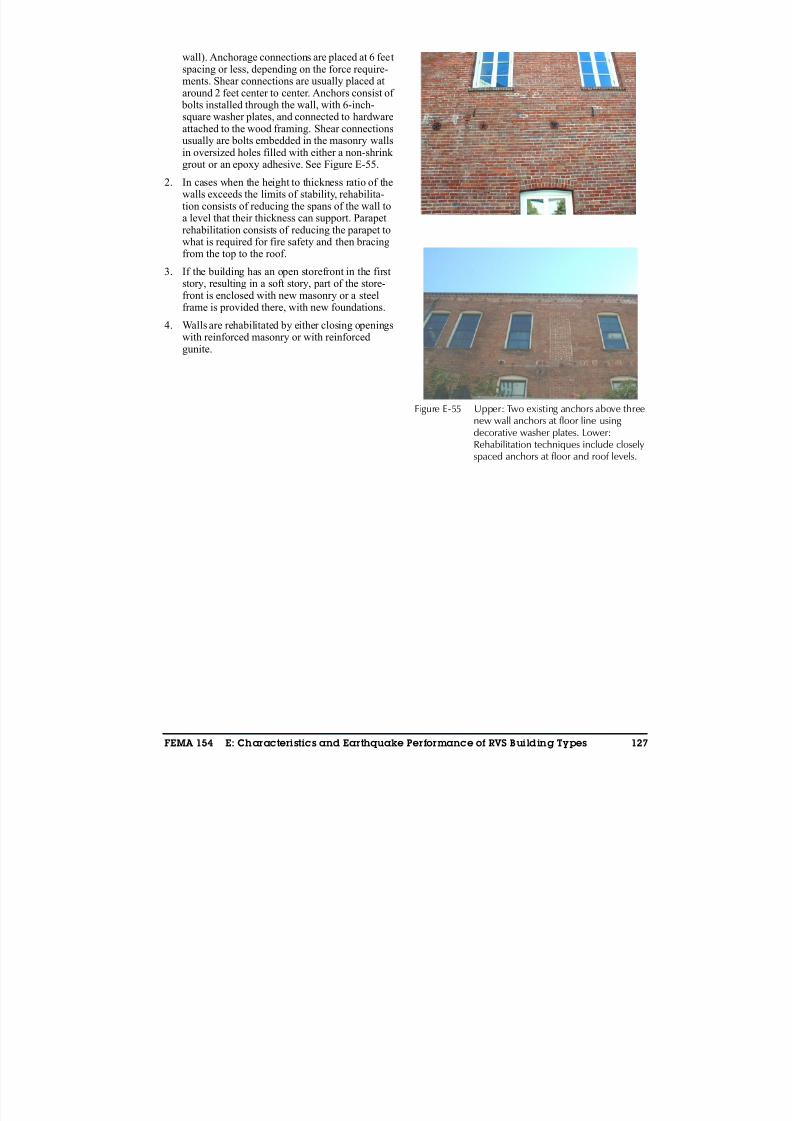
8/3/2019 Statewide Seismic Needs Assessment report
http://slidepdf.com/reader/full/statewide-seismic-needs-assessment-report 328/341
FEMA 154 E: Characteristics and Earthquake Performance of RVS Building Types 127
wall). Anchorage connections are placed at 6 feetspacing or less, depending on the force require-ments. Shear connections are usually placed ataround 2 feet center to center. Anchors consist of bolts installed through the wall, with 6-inch-square washer plates, and connected to hardwareattached to the wood framing. Shear connectionsusually are bolts embedded in the masonry walls
in oversized holes filled with either a non-shrink grout or an epoxy adhesive. See Figure E-55.
2. In cases when the height to thickness ratio of thewalls exceeds the limits of stability, rehabilita-tion consists of reducing the spans of the wall toa level that their thickness can support. Parapetrehabilitation consists of reducing the parapet towhat is required for fire safety and then bracingfrom the top to the roof.
3. If the building has an open storefront in the firststory, resulting in a soft story, part of the store-front is enclosed with new masonry or a steelframe is provided there, with new foundations.
4. Walls are rehabilitated by either closing openingswith reinforced masonry or with reinforcedgunite.
Figure E-55 Upper: Two existing anchors above threenew wall anchors at floor line using decorative washer plates. Lower:Rehabilitation techniques include closely
spaced anchors at floor and roof levels.

8/3/2019 Statewide Seismic Needs Assessment report
http://slidepdf.com/reader/full/statewide-seismic-needs-assessment-report 329/341
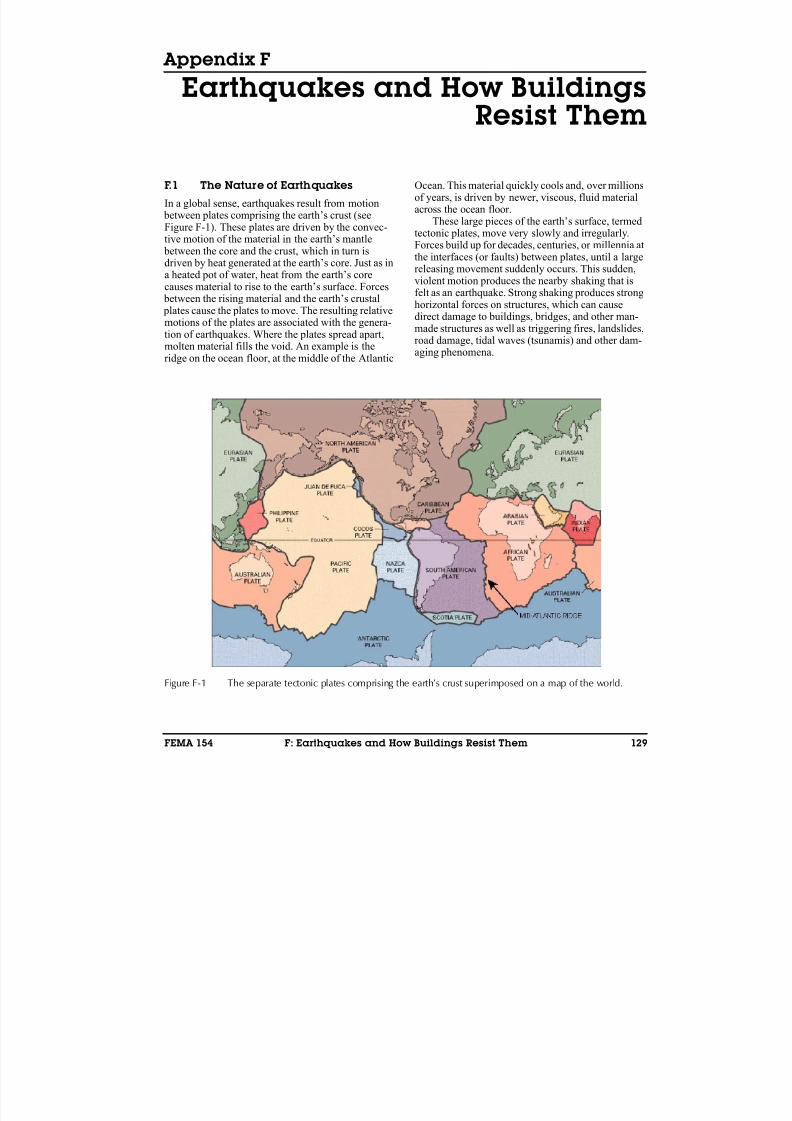
8/3/2019 Statewide Seismic Needs Assessment report
http://slidepdf.com/reader/full/statewide-seismic-needs-assessment-report 330/341
FEMA 154 F: Earthquakes and How Buildings Resist Them 129
Appendix F
Earthquakes and How BuildingsResist Them
F.1 The Nature of Earthquakes
In a global sense, earthquakes result from motion between plates comprising the earth’s crust (seeFigure F-1). These plates are driven by the convec-tive motion of the material in the earth’s mantle between the core and the crust, which in turn isdriven by heat generated at the earth’s core. Just as ina heated pot of water, heat from the earth’s corecauses material to rise to the earth’s surface. Forces
between the rising material and the earth’s crustal plates cause the plates to move. The resulting relativemotions of the plates are associated with the genera-tion of earthquakes. Where the plates spread apart,molten material fills the void. An example is theridge on the ocean floor, at the middle of the Atlantic
Ocean. This material quickly cools and, over millionsof years, is driven by newer, viscous, fluid materialacross the ocean floor.
These large pieces of the earth’s surface, termedtectonic plates, move very slowly and irregularly.Forces build up for decades, centuries, or millennia atthe interfaces (or faults) between plates, until a largereleasing movement suddenly occurs. This sudden,violent motion produces the nearby shaking that isfelt as an earthquake. Strong shaking produces strong
horizontal forces on structures, which can causedirect damage to buildings, bridges, and other man-made structures as well as triggering fires, landslides,road damage, tidal waves (tsunamis) and other dam-aging phenomena.
Figure F-1 The separate tectonic plates comprising the earth’s crust superimposed on a map of the world.
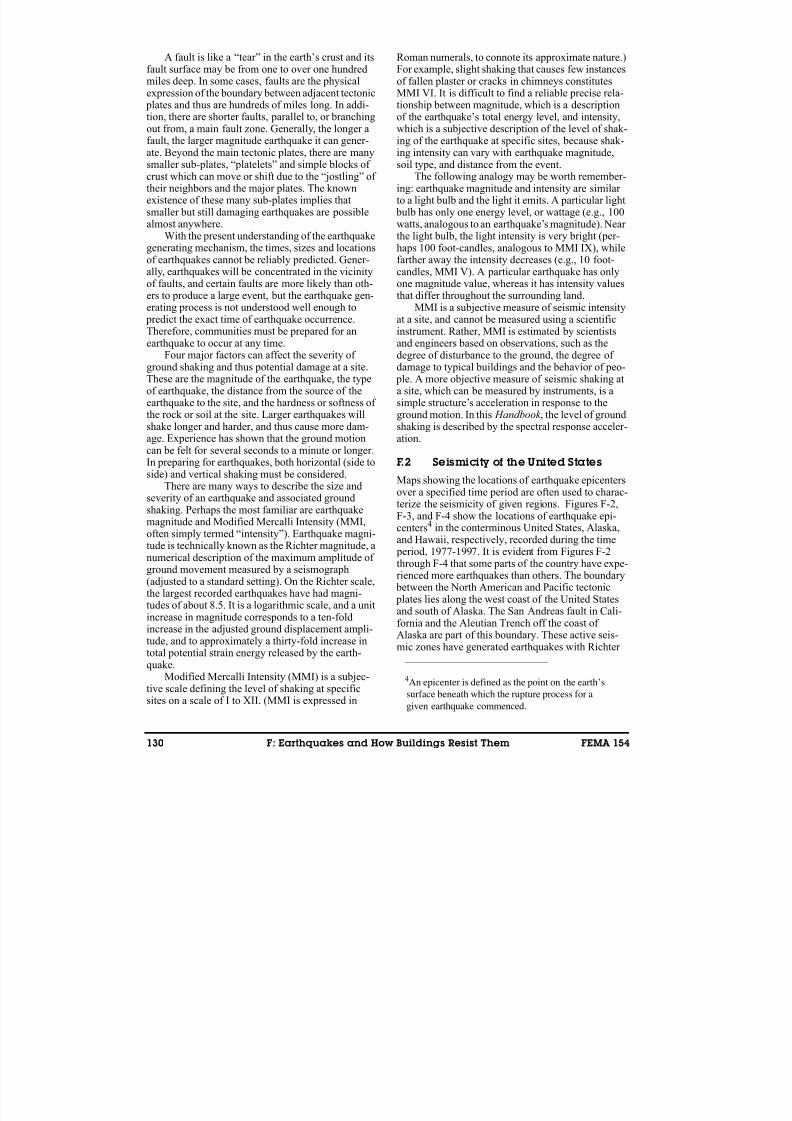
8/3/2019 Statewide Seismic Needs Assessment report
http://slidepdf.com/reader/full/statewide-seismic-needs-assessment-report 331/341
130 F: Earthquakes and How Buildings Resist Them FEMA 154
A fault is like a “tear” in the earth’s crust and itsfault surface may be from one to over one hundredmiles deep. In some cases, faults are the physicalexpression of the boundary between adjacent tectonic plates and thus are hundreds of miles long. In addi-tion, there are shorter faults, parallel to, or branchingout from, a main fault zone. Generally, the longer afault, the larger magnitude earthquake it can gener-
ate. Beyond the main tectonic plates, there are manysmaller sub-plates, “platelets” and simple blocks of crust which can move or shift due to the “jostling” of their neighbors and the major plates. The knownexistence of these many sub-plates implies thatsmaller but still damaging earthquakes are possiblealmost anywhere.
With the present understanding of the earthquakegenerating mechanism, the times, sizes and locationsof earthquakes cannot be reliably predicted. Gener-ally, earthquakes will be concentrated in the vicinityof faults, and certain faults are more likely than oth-ers to produce a large event, but the earthquake gen-erating process is not understood well enough to predict the exact time of earthquake occurrence.Therefore, communities must be prepared for anearthquake to occur at any time.
Four major factors can affect the severity of ground shaking and thus potential damage at a site.These are the magnitude of the earthquake, the typeof earthquake, the distance from the source of theearthquake to the site, and the hardness or softness of the rock or soil at the site. Larger earthquakes willshake longer and harder, and thus cause more dam-age. Experience has shown that the ground motion
can be felt for several seconds to a minute or longer.In preparing for earthquakes, both horizontal (side toside) and vertical shaking must be considered.
There are many ways to describe the size andseverity of an earthquake and associated groundshaking. Perhaps the most familiar are earthquakemagnitude and Modified Mercalli Intensity (MMI,often simply termed “intensity”). Earthquake magni-tude is technically known as the Richter magnitude, anumerical description of the maximum amplitude of ground movement measured by a seismograph(adjusted to a standard setting). On the Richter scale,the largest recorded earthquakes have had magni-
tudes of about 8.5. It is a logarithmic scale, and a unitincrease in magnitude corresponds to a ten-foldincrease in the adjusted ground displacement ampli-tude, and to approximately a thirty-fold increase intotal potential strain energy released by the earth-quake.
Modified Mercalli Intensity (MMI) is a subjec-tive scale defining the level of shaking at specificsites on a scale of I to XII. (MMI is expressed in
Roman numerals, to connote its approximate nature.)For example, slight shaking that causes few instancesof fallen plaster or cracks in chimneys constitutesMMI VI. It is difficult to find a reliable precise rela-tionship between magnitude, which is a descriptionof the earthquake’s total energy level, and intensity,which is a subjective description of the level of shak-ing of the earthquake at specific sites, because shak-
ing intensity can vary with earthquake magnitude,soil type, and distance from the event.
The following analogy may be worth remember-ing: earthquake magnitude and intensity are similar to a light bulb and the light it emits. A particular light bulb has only one energy level, or wattage (e.g., 100watts, analogous to an earthquake’s magnitude). Near the light bulb, the light intensity is very bright (per-haps 100 foot-candles, analogous to MMI IX), whilefarther away the intensity decreases (e.g., 10 foot-candles, MMI V). A particular earthquake has onlyone magnitude value, whereas it has intensity valuesthat differ throughout the surrounding land.
MMI is a subjective measure of seismic intensityat a site, and cannot be measured using a scientificinstrument. Rather, MMI is estimated by scientistsand engineers based on observations, such as thedegree of disturbance to the ground, the degree of damage to typical buildings and the behavior of peo- ple. A more objective measure of seismic shaking ata site, which can be measured by instruments, is asimple structure’s acceleration in response to theground motion. In this Handbook , the level of groundshaking is described by the spectral response acceler-ation.
F.2 Seismicity of the United States
Maps showing the locations of earthquake epicentersover a specified time period are often used to charac-terize the seismicity of given regions. Figures F-2,F-3, and F-4 show the locations of earthquake epi-centers4 in the conterminous United States, Alaska,and Hawaii, respectively, recorded during the time period, 1977-1997. It is evident from Figures F-2through F-4 that some parts of the country have expe-rienced more earthquakes than others. The boundary between the North American and Pacific tectonic plates lies along the west coast of the United Statesand south of Alaska. The San Andreas fault in Cali-fornia and the Aleutian Trench off the coast of Alaska are part of this boundary. These active seis-mic zones have generated earthquakes with Richter
4An epicenter is defined as the point on the earth’s
surface beneath which the rupture process for a
given earthquake commenced.
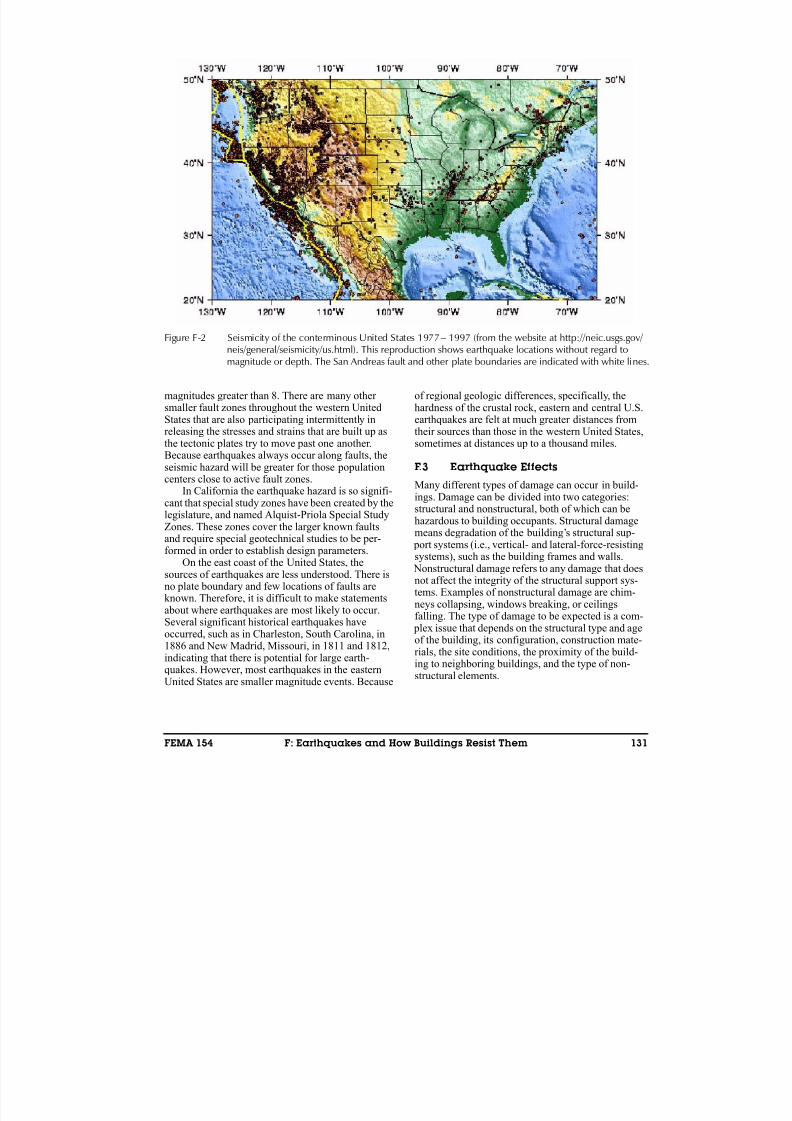
8/3/2019 Statewide Seismic Needs Assessment report
http://slidepdf.com/reader/full/statewide-seismic-needs-assessment-report 332/341
FEMA 154 F: Earthquakes and How Buildings Resist Them 131
magnitudes greater than 8. There are many other smaller fault zones throughout the western UnitedStates that are also participating intermittently inreleasing the stresses and strains that are built up asthe tectonic plates try to move past one another.
Because earthquakes always occur along faults, theseismic hazard will be greater for those populationcenters close to active fault zones.
In California the earthquake hazard is so signifi-cant that special study zones have been created by thelegislature, and named Alquist-Priola Special StudyZones. These zones cover the larger known faultsand require special geotechnical studies to be per-formed in order to establish design parameters.
On the east coast of the United States, thesources of earthquakes are less understood. There isno plate boundary and few locations of faults areknown. Therefore, it is difficult to make statements
about where earthquakes are most likely to occur.Several significant historical earthquakes haveoccurred, such as in Charleston, South Carolina, in1886 and New Madrid, Missouri, in 1811 and 1812,indicating that there is potential for large earth-quakes. However, most earthquakes in the easternUnited States are smaller magnitude events. Because
of regional geologic differences, specifically, thehardness of the crustal rock, eastern and central U.S.earthquakes are felt at much greater distances fromtheir sources than those in the western United States,sometimes at distances up to a thousand miles.
F.3 Earthquake Effects
Many different types of damage can occur in build-ings. Damage can be divided into two categories:structural and nonstructural, both of which can behazardous to building occupants. Structural damagemeans degradation of the building’s structural sup- port systems (i.e., vertical- and lateral-force-resistingsystems), such as the building frames and walls. Nonstructural damage refers to any damage that doesnot affect the integrity of the structural support sys-tems. Examples of nonstructural damage are chim-
neys collapsing, windows breaking, or ceilingsfalling. The type of damage to be expected is a com- plex issue that depends on the structural type and ageof the building, its configuration, construction mate-rials, the site conditions, the proximity of the build-ing to neighboring buildings, and the type of non-structural elements.
Figure F-2 Seismicity of the conterminous United States 1977 − 1997 (from the website at http://neic.usgs.gov/ neis/general/seismicity/us.html). This reproduction shows earthquake locations without regard tomagnitude or depth. The San Andreas fault and other plate boundaries are indicated with white lines.
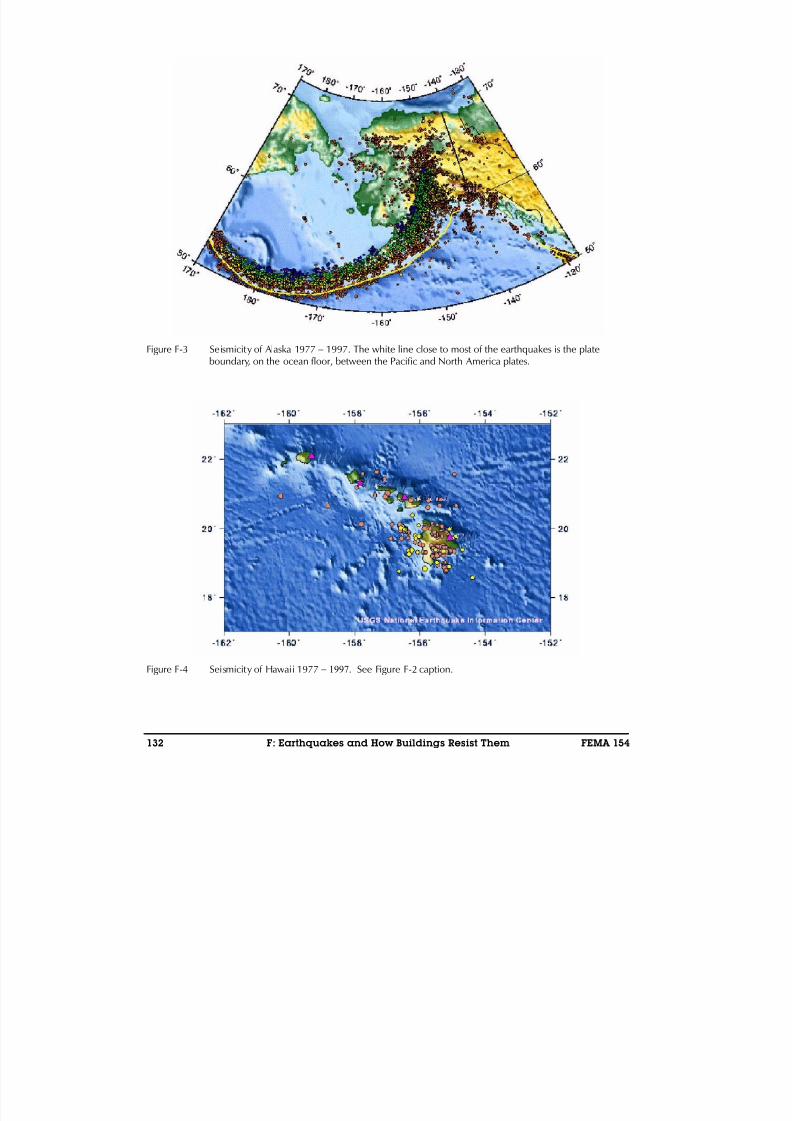
8/3/2019 Statewide Seismic Needs Assessment report
http://slidepdf.com/reader/full/statewide-seismic-needs-assessment-report 333/341
132 F: Earthquakes and How Buildings Resist Them FEMA 154
Figure F-3 Seismicity of Alaska 1977 − 1997. The white line close to most of the earthquakes is the plateboundary, on the ocean floor, between the Pacific and North America plates.
Figure F-4 Seismicity of Hawaii 1977 − 1997. See Figure F-2 caption.
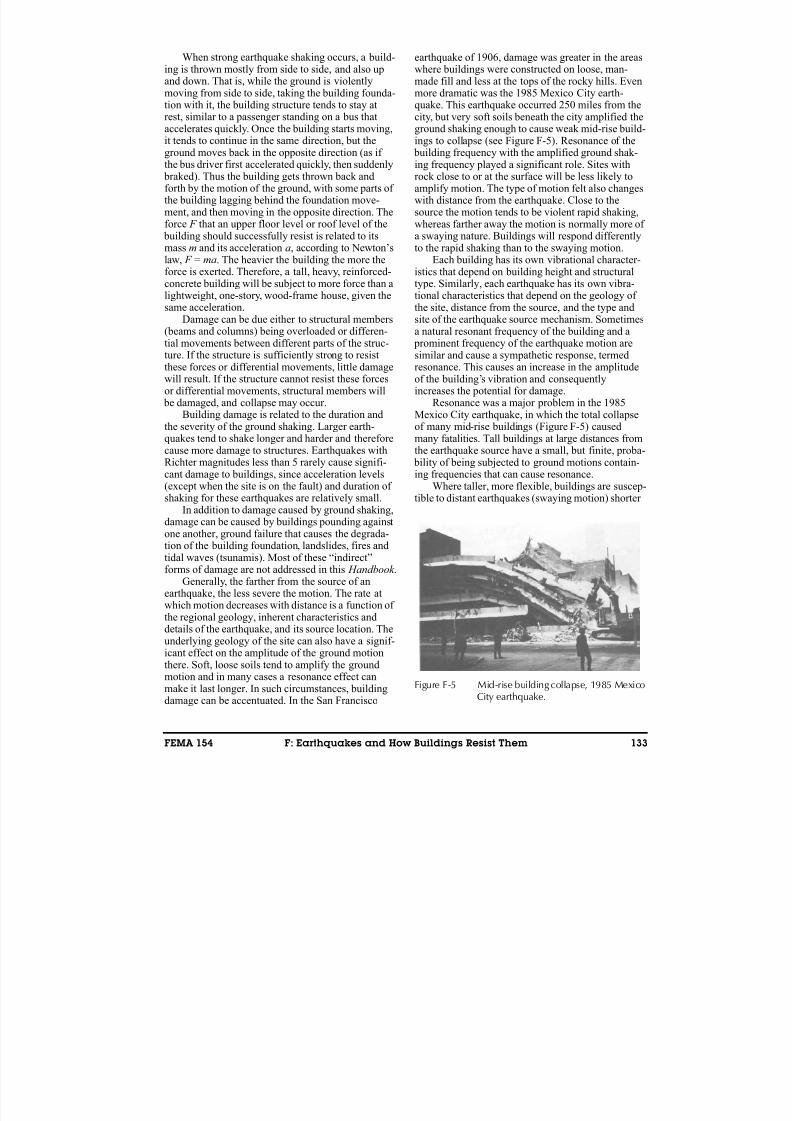
8/3/2019 Statewide Seismic Needs Assessment report
http://slidepdf.com/reader/full/statewide-seismic-needs-assessment-report 334/341
FEMA 154 F: Earthquakes and How Buildings Resist Them 133
When strong earthquake shaking occurs, a build-ing is thrown mostly from side to side, and also upand down. That is, while the ground is violentlymoving from side to side, taking the building founda-tion with it, the building structure tends to stay atrest, similar to a passenger standing on a bus thataccelerates quickly. Once the building starts moving,it tends to continue in the same direction, but the
ground moves back in the opposite direction (as if the bus driver first accelerated quickly, then suddenly braked). Thus the building gets thrown back andforth by the motion of the ground, with some parts of the building lagging behind the foundation move-ment, and then moving in the opposite direction. Theforce F that an upper floor level or roof level of the building should successfully resist is related to itsmass m and its acceleration a, according to Newton’slaw, F = ma. The heavier the building the more theforce is exerted. Therefore, a tall, heavy, reinforced-concrete building will be subject to more force than alightweight, one-story, wood-frame house, given thesame acceleration.
Damage can be due either to structural members(beams and columns) being overloaded or differen-tial movements between different parts of the struc-ture. If the structure is sufficiently strong to resistthese forces or differential movements, little damagewill result. If the structure cannot resist these forcesor differential movements, structural members will be damaged, and collapse may occur.
Building damage is related to the duration andthe severity of the ground shaking. Larger earth-quakes tend to shake longer and harder and therefore
cause more damage to structures. Earthquakes withRichter magnitudes less than 5 rarely cause signifi-cant damage to buildings, since acceleration levels(except when the site is on the fault) and duration of shaking for these earthquakes are relatively small.
In addition to damage caused by ground shaking,damage can be caused by buildings pounding againstone another, ground failure that causes the degrada-tion of the building foundation, landslides, fires andtidal waves (tsunamis). Most of these “indirect”forms of damage are not addressed in this Handbook .
Generally, the farther from the source of anearthquake, the less severe the motion. The rate at
which motion decreases with distance is a function of the regional geology, inherent characteristics anddetails of the earthquake, and its source location. Theunderlying geology of the site can also have a signif-icant effect on the amplitude of the ground motionthere. Soft, loose soils tend to amplify the groundmotion and in many cases a resonance effect canmake it last longer. In such circumstances, buildingdamage can be accentuated. In the San Francisco
earthquake of 1906, damage was greater in the areaswhere buildings were constructed on loose, man-made fill and less at the tops of the rocky hills. Evenmore dramatic was the 1985 Mexico City earth-quake. This earthquake occurred 250 miles from thecity, but very soft soils beneath the city amplified theground shaking enough to cause weak mid-rise build-ings to collapse (see Figure F-5). Resonance of the
building frequency with the amplified ground shak-ing frequency played a significant role. Sites withrock close to or at the surface will be less likely toamplify motion. The type of motion felt also changeswith distance from the earthquake. Close to thesource the motion tends to be violent rapid shaking,whereas farther away the motion is normally more of a swaying nature. Buildings will respond differentlyto the rapid shaking than to the swaying motion.
Each building has its own vibrational character-istics that depend on building height and structuraltype. Similarly, each earthquake has its own vibra-tional characteristics that depend on the geology of the site, distance from the source, and the type andsite of the earthquake source mechanism. Sometimesa natural resonant frequency of the building and a prominent frequency of the earthquake motion aresimilar and cause a sympathetic response, termedresonance. This causes an increase in the amplitudeof the building’s vibration and consequentlyincreases the potential for damage.
Resonance was a major problem in the 1985Mexico City earthquake, in which the total collapseof many mid-rise buildings (Figure F-5) causedmany fatalities. Tall buildings at large distances from
the earthquake source have a small, but finite, proba- bility of being subjected to ground motions contain-ing frequencies that can cause resonance.
Where taller, more flexible, buildings are suscep-tible to distant earthquakes (swaying motion) shorter
Figure F-5 Mid-rise building collapse, 1985 MexicoCity earthquake.
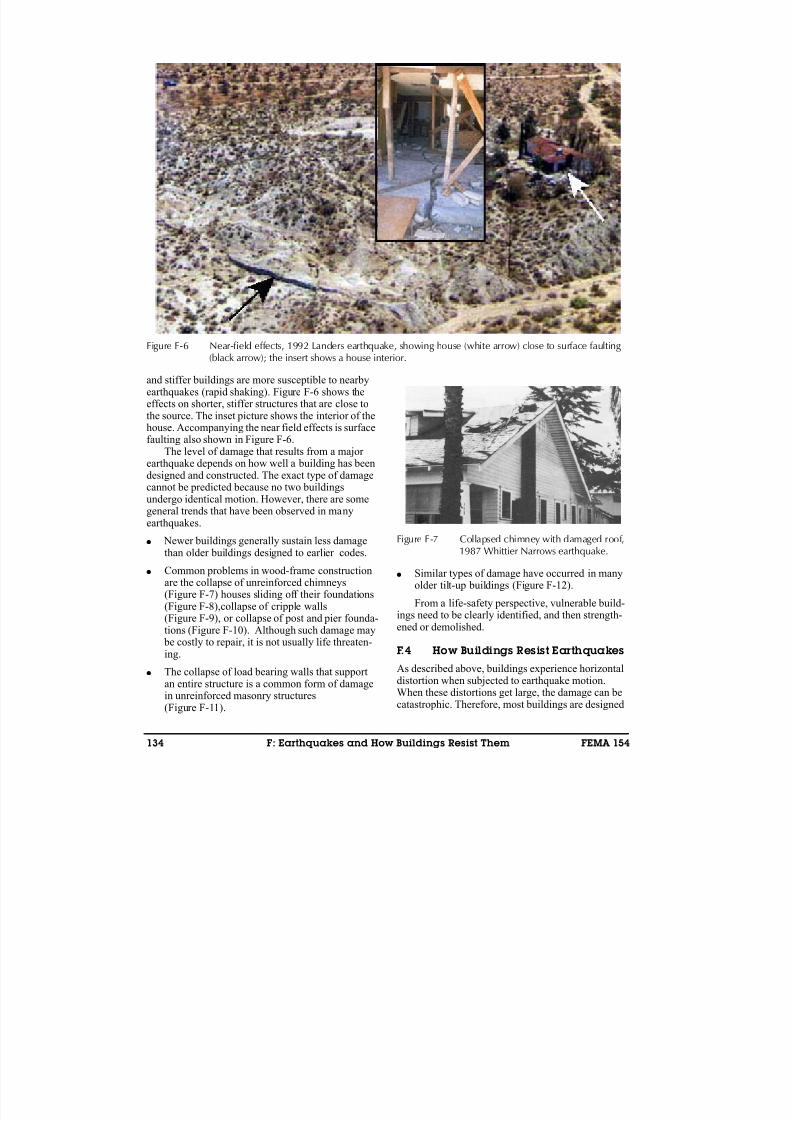
8/3/2019 Statewide Seismic Needs Assessment report
http://slidepdf.com/reader/full/statewide-seismic-needs-assessment-report 335/341
134 F: Earthquakes and How Buildings Resist Them FEMA 154
and stiffer buildings are more susceptible to nearbyearthquakes (rapid shaking). Figure F-6 shows theeffects on shorter, stiffer structures that are close tothe source. The inset picture shows the interior of thehouse. Accompanying the near field effects is surfacefaulting also shown in Figure F-6.
The level of damage that results from a major earthquake depends on how well a building has beendesigned and constructed. The exact type of damagecannot be predicted because no two buildingsundergo identical motion. However, there are somegeneral trends that have been observed in manyearthquakes.
● Newer buildings generally sustain less damagethan older buildings designed to earlier codes.
● Common problems in wood-frame constructionare the collapse of unreinforced chimneys(Figure F-7) houses sliding off their foundations
(Figure F-8),collapse of cripple walls(Figure F-9), or collapse of post and pier founda-tions (Figure F-10). Although such damage may be costly to repair, it is not usually life threaten-ing.
● The collapse of load bearing walls that supportan entire structure is a common form of damagein unreinforced masonry structures(Figure F-11).
● Similar types of damage have occurred in manyolder tilt-up buildings (Figure F-12).
From a life-safety perspective, vulnerable build-ings need to be clearly identified, and then strength-ened or demolished.
F.4 How Buildings Resist Earthquakes
As described above, buildings experience horizontaldistortion when subjected to earthquake motion.When these distortions get large, the damage can becatastrophic. Therefore, most buildings are designed
Figure F-6 Near-field effects, 1992 Landers earthquake, showing house (white arrow) close to surface faulting (black arrow); the insert shows a house interior.
Figure F-7 Collapsed chimney with damaged roof,1987 Whittier Narrows earthquake.
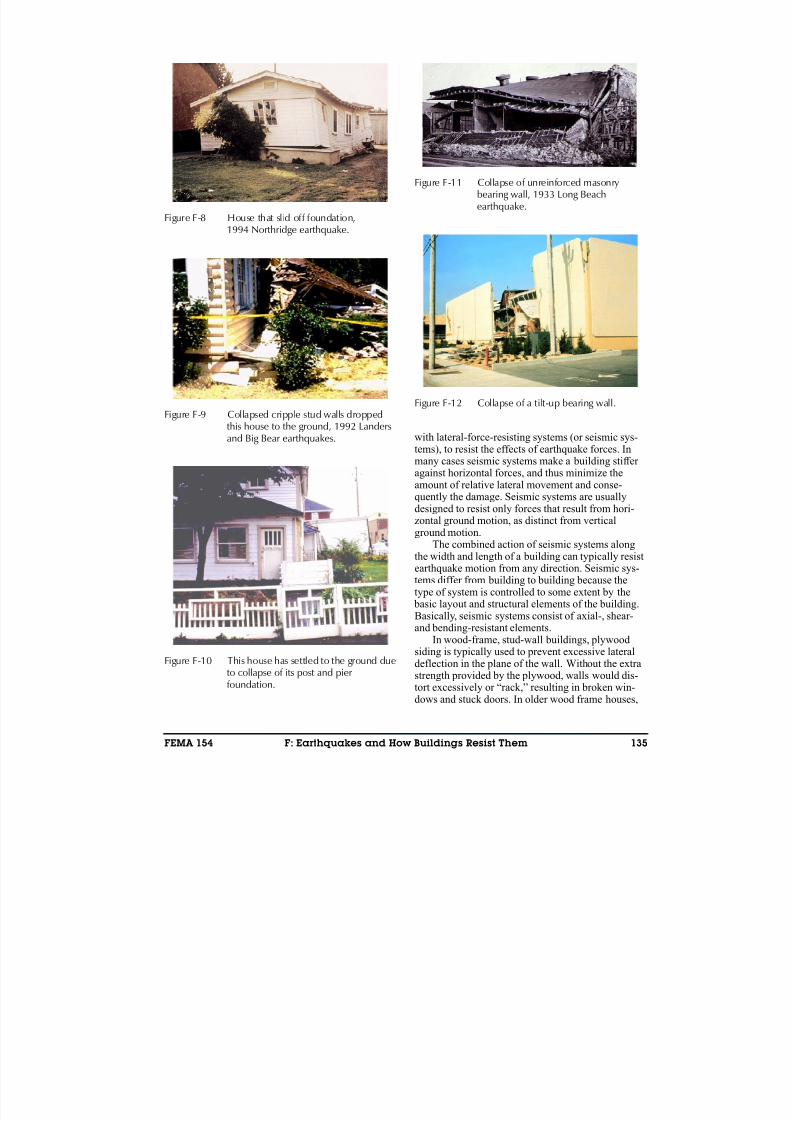
8/3/2019 Statewide Seismic Needs Assessment report
http://slidepdf.com/reader/full/statewide-seismic-needs-assessment-report 336/341
FEMA 154 F: Earthquakes and How Buildings Resist Them 135
with lateral-force-resisting systems (or seismic sys-
tems), to resist the effects of earthquake forces. Inmany cases seismic systems make a building stiffer against horizontal forces, and thus minimize theamount of relative lateral movement and conse-quently the damage. Seismic systems are usuallydesigned to resist only forces that result from hori-zontal ground motion, as distinct from verticalground motion.
The combined action of seismic systems alongthe width and length of a building can typically resistearthquake motion from any direction. Seismic sys-tems differ from building to building because thetype of system is controlled to some extent by the
basic layout and structural elements of the building.Basically, seismic systems consist of axial-, shear-and bending-resistant elements.
In wood-frame, stud-wall buildings, plywoodsiding is typically used to prevent excessive lateraldeflection in the plane of the wall. Without the extrastrength provided by the plywood, walls would dis-tort excessively or “rack,” resulting in broken win-dows and stuck doors. In older wood frame houses,
Figure F-8 House that slid off foundation,1994 Northridge earthquake.
Figure F-9 Collapsed cripple stud walls droppedthis house to the ground, 1992 Landersand Big Bear earthquakes.
Figure F-10 This house has settled to the ground dueto collapse of its post and pierfoundation.
Figure F-11 Collapse of unreinforced masonrybearing wall, 1933 Long Beachearthquake.
Figure F-12 Collapse of a tilt-up bearing wall.
8/3/2019 Statewide Seismic Needs Assessment report
http://slidepdf.com/reader/full/statewide-seismic-needs-assessment-report 337/341
136 F: Earthquakes and How Buildings Resist Them FEMA 154
this resistance to lateral loads is provided by either wood or steel diagonal bracing.
The earthquake-resisting systems in modern steel buildings take many forms. In moment-resisting steelframes, the connections between the beams and thecolumns are designed to resist the rotation of the col-umn relative to the beam. Thus, the beam and thecolumn work together and resist lateral movement
and lateral displacement by bending. Steel framessometimes include diagonal bracing configurations,such as single diagonal braces, cross-bracing and “K- bracing.” In braced frames, horizontal loads areresisted through tension and compression forces inthe braces with resulting changed forces in the beamsand columns. Steel buildings are sometimes con-
structed with moment-resistant frames in one direc-tion and braced frames in the other.
In concrete structures, shear walls are sometimesused to provide lateral resistance in the plane of thewall, in addition to moment-resisting frames. Ideally,these shear walls are continuous reinforced-concretewalls extending from the foundation to the roof of the building. They can be exterior walls or interior
walls. They are interconnected with the rest of theconcrete frame, and thus resist the horizontal motionof one floor relative to another. Shear walls can also be constructed of reinforced masonry, using bricks or concrete blocks.
8/3/2019 Statewide Seismic Needs Assessment report
http://slidepdf.com/reader/full/statewide-seismic-needs-assessment-report 338/341
FEMA-154 References 137
References
ASCE, 1998, Handbook for the Seismic Evaluation of Buildings — A Pre-standard , prepared by the American Society of CivilEngineers for the Federal EmergencyManagement Agency, FEMA 310 Report ,Washington D.C.
ASCE, 2000, Prestandard and Commentary for the Seismic Rehabilitation of Buildings, prepared by the American Society of CivilEngineers for the Federal EmergencyManagement Agency, FEMA 356 Report,Washington, D.C.
ATC, 1987, Evaluating the Seismic Resistance of Existing Buildings , Applied TechnologyCouncil, ATC-14 Report, Redwood City,California.
ATC, 1989, Procedures for Postearthquake Safety Evaluation of Buildings, Applied TechnologyCouncil, ATC-20 Report, Redwood City,California.
ATC, 1992, Procedures for Building Seismic Rehabilitation (Interim), Applied TechnologyCouncil, ATC-26-4 Report, Redwood City,
California
ATC, 1995, Addendum to the ATC-20 Postearthquake Building Safety Procedures Applied Technology Council, ATC-20-2Report, Redwood City, California.
ATC, 1988a, Rapid Visual Screening of Buildings for Potential Seismic Hazards: A Handbook , prepared by the Applied Technology Councilfor the Federal Emergency ManagementAgency, FEMA 154 Report, Washington,D.C.
ATC, 1988b, Rapid Visual Screening of Buildings for Potential Seismic Hazards: Supporting Documentation, prepared by the AppliedTechnology Council for the FederalEmergency Management Agency, FEMA 155Report, Washington, D.C.
ATC, 1997a, NEHRP Guidelines for the Seismic Rehabilitation of Buildings , prepared by theApplied Technology Council for the Building
Seismic Safety Council, published by theFederal Emergency Management Agency,FEMA 273 Report, Washington, D.C.
ATC, 1997b, NEHRP Commentary on theGuidelines for the Seismic Rehabilitation of Buildings, prepared by the AppliedTechnology Council for the Building SeismicSafety Council, published by the FederalEmergency Management Agency, FEMA 274Report, Washington, D.C.
ATC, 2002, Rapid Visual Screening of Buildings
for Potential Seismic Hazards: Supporting Documentation (2nd edition), prepared by theApplied Technology Council for the FederalEmergency Management Agency, FEMA 155Report, Washington, D.C.
BSSC, 1992, NEHRP Handbook for the Seismic Evaluation of Existing Buildings, prepared bythe Building Seismic Safety Council for theFederal Emergency Management Agency,FEMA 178 Report, Washington D.C.
BSSC, 1997, NEHRP Recommended Provisions for the Seismic Regulations for New Buildings
and Other Structures, and Commentary, prepared by the Building Seismic SafetyCouncil for the Federal EmergencyManagement Agency, FEMA 302 and 303Reports, Washington, D.C.
BSSC, 2000, NEHRP Recommended Provisions for the Seismic Regulations for New Buildingsand Other Structures, and Commentary, 2000 Edition, prepared by the Building SeismicSafety Council for the Federal EmergencyManagement Agency, FEMA 368 and 369Reports, Washington, D.C.
EERI, 1998, Seismic Rehabilitation of Buildings:Strategic Plan 2005, prepared by theEarthquake Engineering Research Institute for the Federal Emergency Management Agency,FEMA 315 Report, Washington, D.C.
FEMA, 1995, Typical Costs for Seismic Rehabilitation of Buildings, Second Edition,FEMA 156 and 157 Reports, Federal

8/3/2019 Statewide Seismic Needs Assessment report
http://slidepdf.com/reader/full/statewide-seismic-needs-assessment-report 339/341
138 References FEMA 154
Emergency Management Agency,Washington, D.C.
ICBO, 1973, 1997, Uniform Building Code,International Conference of Building Officials,Whittier, California.
NBS, 1980, Development of a Probability Based Load Criterion for American National
Standard A58.1, NBS Special Publication 577, National Bureau of Standards, Washington,D.C.
NIBS, 1999, Earthquake Loss EstimationMethodology HAZUS, Technical Manual ,Vol. 1, prepared by the National Institute of Building Sciences for the Federal EmergencyManagement Agency, Washington, D.C.
ROA, 1998, Planning for Seismic Rehabilitation:Societal Issues, developed for the BuildingSeismic Safety Council, by Robert Olson
Associates, Inc., for the Federal EmergencyManagement Agency, FEMA-275 Report,Washington, D.C.
SAC, 2000, Recommended Seismic DesignCriteria for New Steel Moment-Frame Buildings, prepared by the SAC Joint Venture,a partnership of the Structural EngineersAssociation of California, the AppliedTechnology Council, and CaliforniaUniversities for Research in EarthquakeEngineering, for the Federal Emergency
Management Agency, FEMA 350 Report,Washington, D.C.
VSP, 1994, Seismic Rehabilitation of Federal Buildings: A Benefit/Cost Model; Volume 1: AUsers Manual and Volume 2: Supporting Documentation; prepared by VSP Associates,Sacramento California, for the FederalEmergency Management Agency, FEMA-255and FEMA-256 Reports, Washington, D.C.
Web pages
Sanborn Map Company
www.sanbornmap.comwww.lib.berkeley.edu/EART/sanborn.html
8/3/2019 Statewide Seismic Needs Assessment report
http://slidepdf.com/reader/full/statewide-seismic-needs-assessment-report 340/341
FEMA-154 Project Participants 139
Project Participants
Project Management
Mr. Christopher Rojahn (Principal Investigator)Applied Technology Council
555 Twin Dolphin Drive, Suite 550
Redwood City, California 94065
Dr. Charles Scawthorn (Co-PrincipalInvestigator and Project Director)
ABS Consulting
1111 Broadway, 10th Floor
Oakland, California 94607
FEMA Management
Mr. Ugo Morelli
Federal Emergency Management Agency
500 C Street, Room 416
Washington, DC 20472
Project Advisory Panel
Prof. Thalia Anagnos
(San Jose State University)
2631 South Court
Palo Alto, California 94306
Mr. John Baals, Seismic Safety Program
Coordinator, U.S. Department of the Interior
Bureau of Reclamation
Denver Federal Center, Building 67
P.O. Box 25007, D-8110
Denver, Colorado 80225-0007
Mr. James Cagley*
Cagley & Associates
6141 Executive Blvd.
Rockville, Maryland 20852
Mr. Melvyn Green
Melvyn Green & Associates
21307 Hawthorne Blvd., Suite 250
Torrance, California 90503
Mr. Terry Hughes, CBOCode Specialist
Hnedak Bobo Group, Inc.
104 South Front Street
Memphis, Tennessee 38103
Prof. Anne S. Kiremidjian
(Stanford University)
1421 Berry Hills Court,
Los Altos, California 94305
Ms. Joan MacQuarrie
Chief Building Official
City of Berkeley
2120 Milvia Street
Berkeley, California 94704
Mr. Chris D. Poland
Degenkolb Engineers
225 Bush Street, Suite 1000
San Francisco, California 94104
Prof. Lawrence D. Reaveley
(University of Utah)
1702 Cannes Way
Salt Lake City, Utah 84121
Mr. Doug Smits
Chief Building/Fire Official
City of Charleston
75 Calhoun Street, Division 320
Charleston, South Carolina 29401
Mr. Ted Winstead
Winstead Engineering, Inc.
2736 Gerald Ford Drive, East
Cordova, Tennessee 38016*ATC Board Contact
8/3/2019 Statewide Seismic Needs Assessment report
http://slidepdf.com/reader/full/statewide-seismic-needs-assessment-report 341/341
Technical Consultants
Mr. Kent David
ABS Consulting
1111 Broadway, 10th Floor
Oakland, California 94607-5500
Dr. Stephanie A. King
Weidlinger Associates
4410 El Camino Real, Suite 110
Los Altos, California 94022
Mr. Vincent Prabis
ABS Consulting
1111 Broadway, 10th Floor
Oakland, California 94607-5500
Mr. Richard Ranous
ABS Consulting
300 Commerce Drive, Suite 200
Irvine, California 92602
Dr. Nilesh Shome
ABS Consulting
1111 Broadway, 10th Floor
Oakland, California 94607-5500
Workshop Consultants
Mr. William Holmes (Facilitator)
Rutherford & Chekene427 Thirteenth Street
Oakland, California 94612
Dr. Keith Porter (Recorder)
California Institute of Technology1200 E. California Blvd., MC 104-44
Pasadena, California 91125
Report Production and Editing
Dr. Gerald Brady
Applied Technology Council
555 Twin Dolphin Drive, Suite 550
Redwood City, California 94065
Mr. Peter Mork
Applied Technology Council
555 Twin Dolphin Drive, Suite 550
Redwood City, California 94065
Ms. Michelle Schwartzbach
Applied Technology Council
555 Twin Dolphin Drive, Suite 550
Redwood City, California 94065