static aerodynamic characteristics of … · static aerodynamic characteristics of a scout fin with...
TRANSCRIPT
STATIC AERODYNAMIC CHARACTERISTICS OF A SCOUT FIN WITH A N ENLARGED TIP CONTROL AT MACH NUMBERS FROM 0.40 TO 4.63
bY Robert J. Keynton Langley Reseurch Center
and
Thomas G. Mnir LTV Aerospace Corporation
N A T I O N A L AERONAUTICS A N D SPACE A D M I N I S T R A T I O N W A S H I N G T O N , D. C. SEPTEMBER 1971
https://ntrs.nasa.gov/search.jsp?R=19710026770 2018-07-15T18:20:10+00:00Z
TECH LIBRARY KAFB, NM
.- . ~~
1. Report No. 2. Government Accession No.
NASA TN D-6397 I 4. Title and Subtitle
STATIC AERODYNAMIC CHARACTERISTICS OF A SCOUT FIN WITH AN ENLARGED TIP CONTROL AT MACH NUMBERS FROM 0.40 TO 4.63
~~
7. Author(s) Robert J. Keynton (Langley Research Center) and Thomas G. Muir (Missiles and Space Division, LTV Aerospace Corporation) -~
9. Performing Organization Name and Address
NASA Langley Research Center Hampton, Va. 23365
2. Sponsoring Agency Name and Address
National Aeronautics and Space Administration Washington, D.C. 20546
5. Supplementary Notes
6. Abstract
IllllllIll11lllll lllll11111Ill1Ill1lllll11111 0132925
3. Recipient u o ~ s v yI.Y.
5. Report Date September 1971
6. Performing Organization Code
8. Performing Organization Report No.
L-7680 10. Work Unit No.
490-03-00-16 11. Contract or Grant No.
13. Type of Report and Period Covered
Technical Note ~~
14. Sponsoring Agency Code
Results are presented of an experimental investigation to determine the static longitudinal aerodynamic character is t ics of a fin with an enlarged t ip control and the hinge-moment coefficients of the enlarged t ip control. The model was tested at angles of attack from -6O to 6O and fin t ip control deflections from -20° to 20°. A 1/8-scale model of the Scout first stage, with a tangent ogive nose, was used fo r these tests. Basic data obtained include the pitching-moment, rolling-moment, and normal-force coefficients of the fin and the hinge-moment coefficient of the enlarged tip control.
17. Key-Words (Suggested by Authoris) ) I 18. Distribution Statement
Aerodynamics Unclassified - Unlimited Fin Fin tip control Static stability and control scout
19. Security Classif. (of this report) 20. Security Classif. (of this page) 21. NO. of Pages 22. Price*
Unclassified Unclassified 52 $3.00
For sale by the National Technical Information Service, Springfield, Virginia 22151
STATIC AERODYNAMIC CHARACTERISTICS O F A SCOUT FIN WITH AN
ENLARGED TIP CONTROL AT MACH NUMBERS FROM 0.40 TO 4.63
By Robert J. Keynton Langley Research Center
and
Thomas G. Muir Missiles and Space Division LTV Aerospace Corporation
SUMMARY
An experimental investigation has been conducted to determine the static longitudinal aerodynamic character is t ics of a fin with an enlarged tip control and the hinge-moment coefficients of the enlarged tip control. Data w e r e obtained at Mach numbers from 0.40 to 4.63 for an angle-of-attack range from -6' to 6' and fin tip control deflections from -2OO to 20'. A 1/8-scale model of the Scout first stage, with a tangent ogive nose, was used for this investigation.
The resul ts indicated linear stability and control characterist ics of the fin. Maximum hinge-moment coefficients fo r the enlarged fin t ip control occurred at Mach numbers of 0.40 and 0.59 and were essentially zero at a Mach number of 1.63 and higher Mach numbers . Results of limited testing at a Mach number of 1.00 indicated no significant effect of rol l orientation.
INTRODUCTION
Increased use of the Scout launch vehicle as the workhorse of the aerospace research has created a demand for heavier and greater payload volume. To meet this demand the Scout Project Office embarked on the following two programs:
(1) Development of a larger first-stage motor
(2) Development of a la rger heat shield
The economics of these developments influenced the configurations to the extent that the new motor and heat shield were to interface with existing transition sections or attach points. To achieve this objective, the new motor was increased in diameter with a conical frustum being placed at the fore and aft ends of the motor to interface with the
I
existing transition sections. Dynamic stability studies showed that the existing aerodynamic control surfaces did not produce sufficient control authority. The obvious solution was to increase the surface area of the t ip control. The location of the aft frustum is very close to the stabilizing fins and, therefore , it is very difficult to evaluate the flow in the vicinity of the fin with accuracy or confidence. Since the Scout vehicle has a marginal static margin at maximum dynamic pressure (M =: 3 .OO), it was mandatory to acquire sufficient data to define with confidence the aerodynamic character is t ics of the proposed configuration.
The purpose of this investigation was to determine experimentally the fin longitudinal stability and control characterist ics in order to define the stability margins for the new Scout configuration. A limited discussion is presented of the tes t results.
SYMBOLS
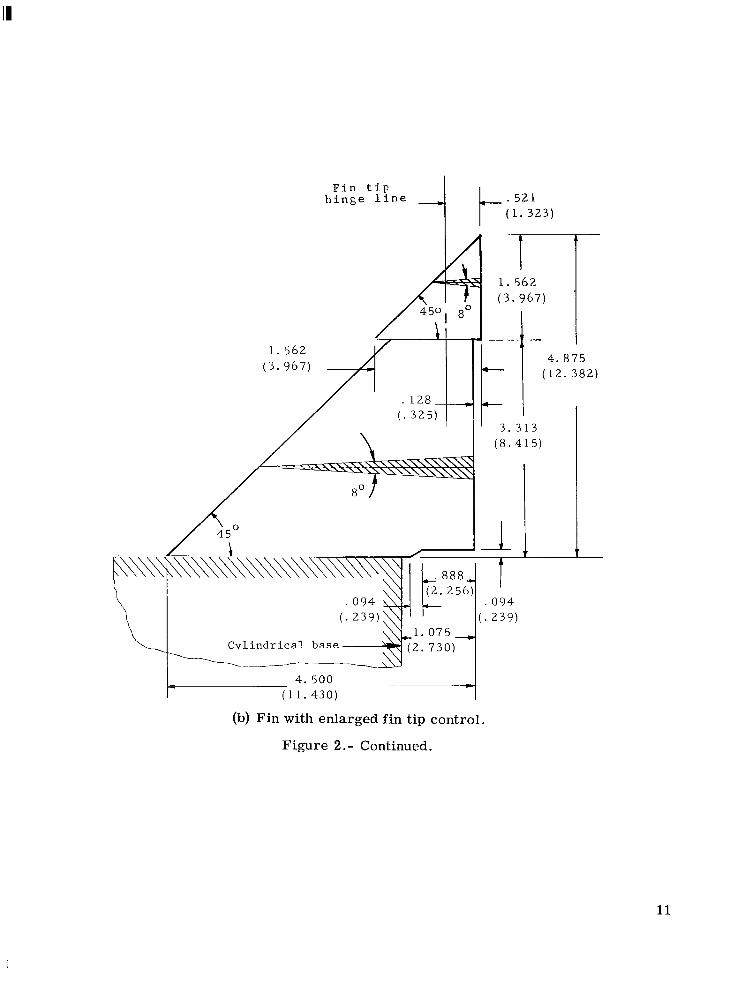
The aerodynamic coefficients a r e referred to the body-axis system illustrated in figure 1. The moment reference center was 14.526 cm (5.719 in.) f rom the cylindrical base. The hinge line was located at two-thirds of the mean aerodynamic chord of the fin tip, 1.32 cm (0.521 in.) f rom the t ip trailing edge. The data a r e given in both SI and U.S. Customary Units. The measurements and calculations were made in U.S.Customary Units.
A reference-body cross-sectional a rea , 0.0076078 meter2 (0.08189 foot2)
b exposed span of two fins with two enlarged fin t ips, 24.78 centimeters (0.813 foot)
~hinge-moment coefficient, Hinge moment qsc
rolling-moment coefficient, Rolling moment qAd
C ra te of change of rolling-moment coefficient with fin t ip control deflection,16 ac
a 6 per degreeA,
pitching-moment coefficient, Pitching moment qAd
slope of pitching-moment curve at a = Oo, -a 0 pe r degree
2
I
CN
CNo!
C
C r
CI.
d
M
S
xCP
YCP
a
P
6
4
rate of change of pitching-moment coefficient with fin t ip control deflection
at o! = Oo, -a6
aCm, per degree
normal-force coefficient, Normal force qA
slope of normal-force curve at a = 00, -a a per degree
rate of change of normal-force coefficient with f in t ip control deflection at o! = Oo, %,per degreea6
average geometric chord of fin t ip control, 0.019571 meter (0.064208 foot)
exposed root chord of fin, 11.430 centimeters (0.375 foot)
root chord of enlarged fin t ip control, 3.967 centimeters (0.130 foot)
reference diameter, 0.09842 meter (0.3229 foot)
f ree-s t ream Mach number
f ree-s t ream dynamic pressure, newtons/meter2 (pounds/foot2)
fin tip control planform area, 0.000786778 meter2 (0.0084688 foot2)
distance aft of leading edge along root chord to center of pressure, centimeters (feet)
spanwise distance from body surface to center of pressure , centimeters (feet)
angle of attack of fin plane of symmetry, degrees
sideslip angle (nose down is +p) , for 4 = 90°, degrees
fin t ip control deflection, positive to provide nose-down pitching moment at $ = Oo (leading edge up), degrees
roll angle, measured between instrumented fin plane of symmetry and horizontal reference plane, positive for clockwise rol l as viewed looking forward, degrees
3

APPARATUS AND TESTS
Test Facilities
This investigation was conducted at two test facilities. The transonic test section of the Vought Aeronautics Company High Speed Wind Tunnel was utilized for testing from M = 0.40 to 1.63. This facility is a blowdown-to-atmosphere, transonic-supersonic, adjustable Mach number installation. The nozzle upstream from the tes t section is a n adjustable contour type and consists of two flexible stainless-steel plates and two fixed walls. The test section is 1.22 m (4 f t ) square. A more detailed description of this facility is presented in reference 1.
The low and high Mach number test sections of the Langley Unitary Plan wind tunnel were utilized for testing from M = 1.90 to 4.63. This tunnel is a variable-pressure, continuous-flow facility. The nozzle upstream from the test section is the asymmetric sliding-block type which permits a Mach number variation from 1.50 to 2.86 in the low Mach number test section and from 2.30 to 4.63 in the high Mach number tes t section. The sliding-block arrangement a lso permits the test-section length and cross-sectional area to remain relatively constant (2.13 m (7 ft) and 1.49 m2 (16 ft2), respectively) throughout the Mach number range.
Model
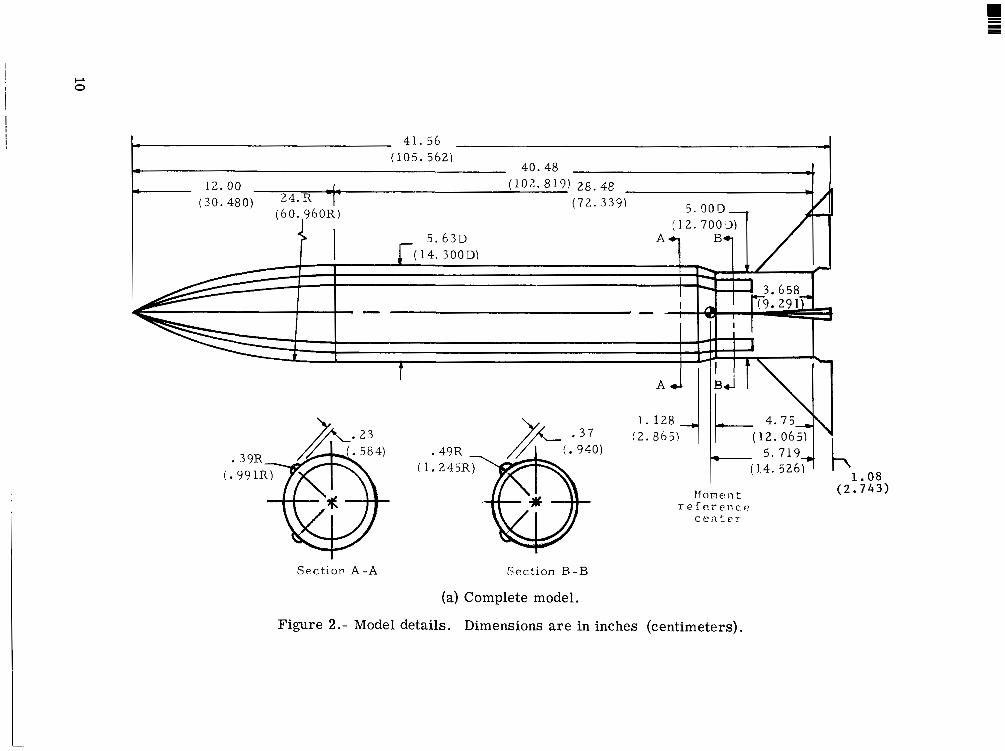
Details of the 1/8-scale model are presented in figure 2. The model consisted of the Scout first stage (Algol-III) with a tangent ogive nose and simulated wiring tunnels. One fin was mounted on a six-component internal strain-gage balance which measured the forces and moments on the exposed fin. Of those six components, only normal force, pitching moment, and rolling moment a r e presented herein. These components a r e used to define magnitude and location of the fin lift and center of pressure for simulating the vehicle flight with a computer program. Fin deflection or rotation due to air loads was not evaluated. This fin contained a n enlarged t ip control mounted on an instrumented shaft. The shaft, and consequently the fin tip, was rotated between tests. The deflection angles were set by means of a locating pin (fig. 2(c)) and a set of precisely located holes at the base of the fin. After the deflection angle was set, the shaft-fin-tip combination was locked in place by two set screws located in the root of the fin. The locating pin was then removed and the test was resumed. The fin area and t ip area were determined by previous wind-tunnel tests and theoretical studies (refs. 2 to 5). The other three f ins were attached directly to the body and had the standard Scout fin configuration. F o r Mach numbers up to and including 1.9, a transition s t r ip of No. 60 carborundum grit embedded in a plastic adhesive 0.16 cm (1/16 in.) wide was applied around the nose 3.05 cm (1.20 in.) aft of the nose apex (measured on the surface) for the purpose of insuring a
4
turbulent boundary layer downstream. Similar transition s t r ips were applied to the fins and fin t ip control 1.016 cm (0.40 in.) aft (streamwise) of the leading edge. For Mach numbers above 1.9,a transition s t r ip of No. 45 carborundum gri t embedded in a plastic adhesive, one granule wide, was applied to the nose at the same location as for the lower Mach numbers. The transition s t r ips on the instrumented fin and fin tip control were also of No. 45 carborundum gri t and were applied at the same locations as for the lower Mach numbers. The s ize and location of the carborundum grit a r e selected as predicted by the unique flow conditions of the individual facility.
Tests
The experimental data were obtained at Mach numbers from 0.40 to 4.63 for an angle-of-attack range from -6' to 6O. Six-component fin force and moment data and fin t ip control hinge-moment data were obtained for fin t ip control deflections from loo to -20° at Mach numbers up to and including 1.63 and from 20' to -20' at Mach numbers above 1.63. The model was tested primarily with the instrumented fin in the horizontal plane ($I = Oo) and selected tes t s were made for $I = 45O and 90° at M = 1.00. Tes t conditions a r e presented in table I.
Measurements
Complete model aerodynamic forces and moments were measured by a six-component internal strain-gage balance. This balance was mounted on a sting which was part of the model support system. The data from this balance were used to evaluate sting deflections due to aerodynamic loads. Actual fin aerodynamic forces and moments, as noted previously, were measured by the fin balance. Hinge-moment gages were installed on the mounting shaft of the enlarged fin tip control. The axis system used is shown in figure 1. When observing that figure, it is important to remember that the fin normal force remains normal to the plane containing the fin and model longitudinal center line. Consequently, when the model is rolled, both the fin and the normal-force vector rotate through the same angle $I.
Corrections
Model angle of attack w a s corrected for tunnel airflow misalinement and deflection of the sting and sting-mounted balance due to aerodynamic loads.
RESULTS AND DISCUSSION
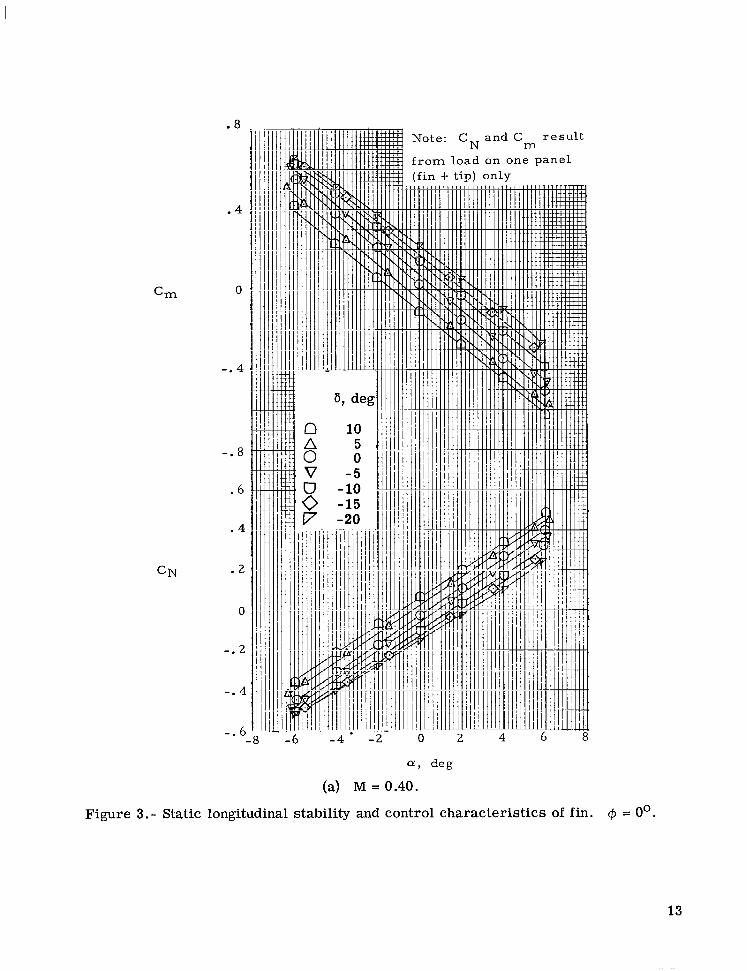
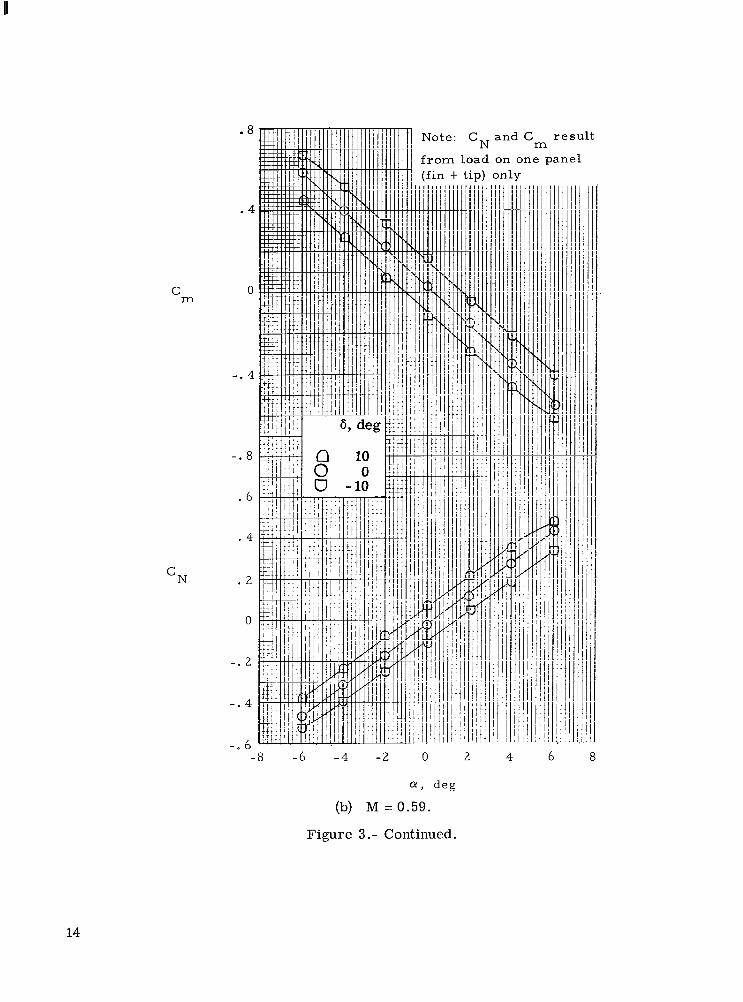
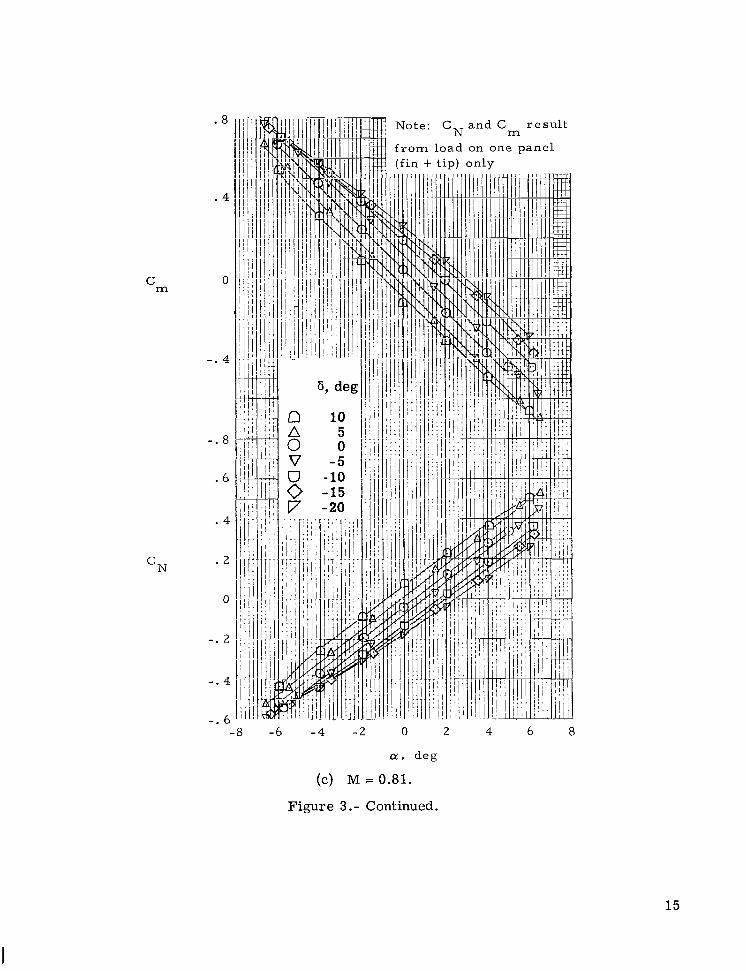
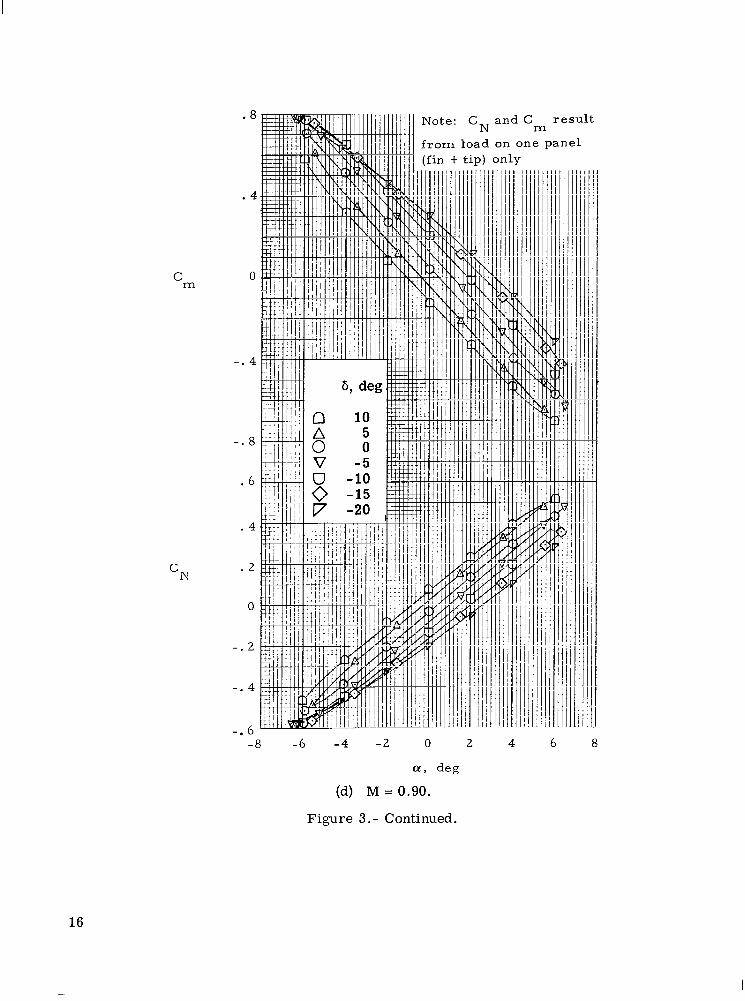
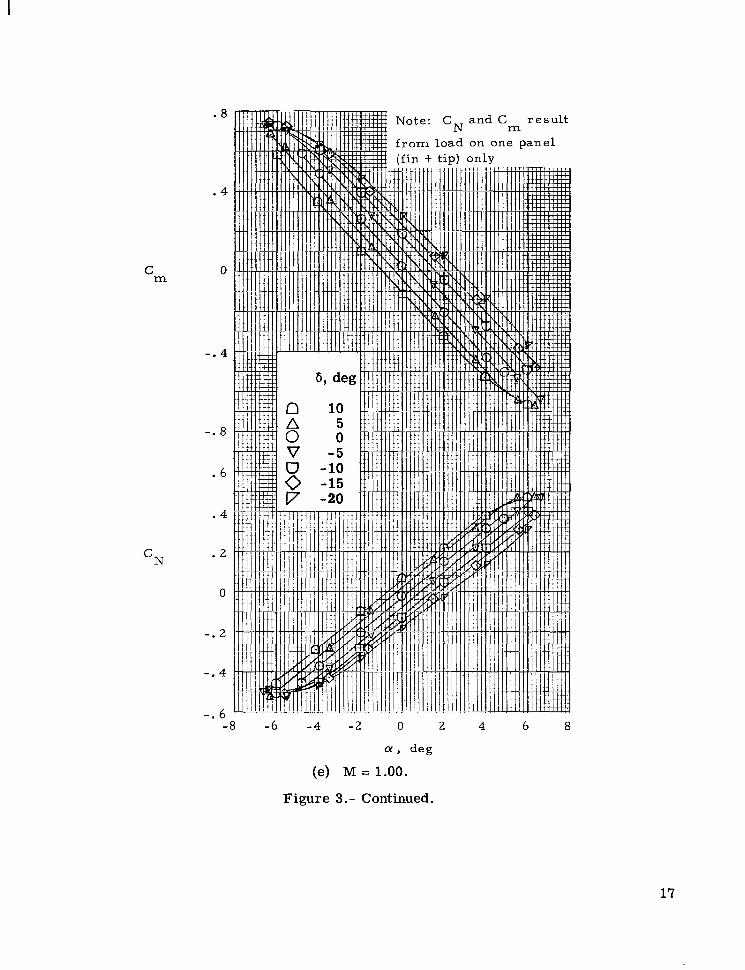
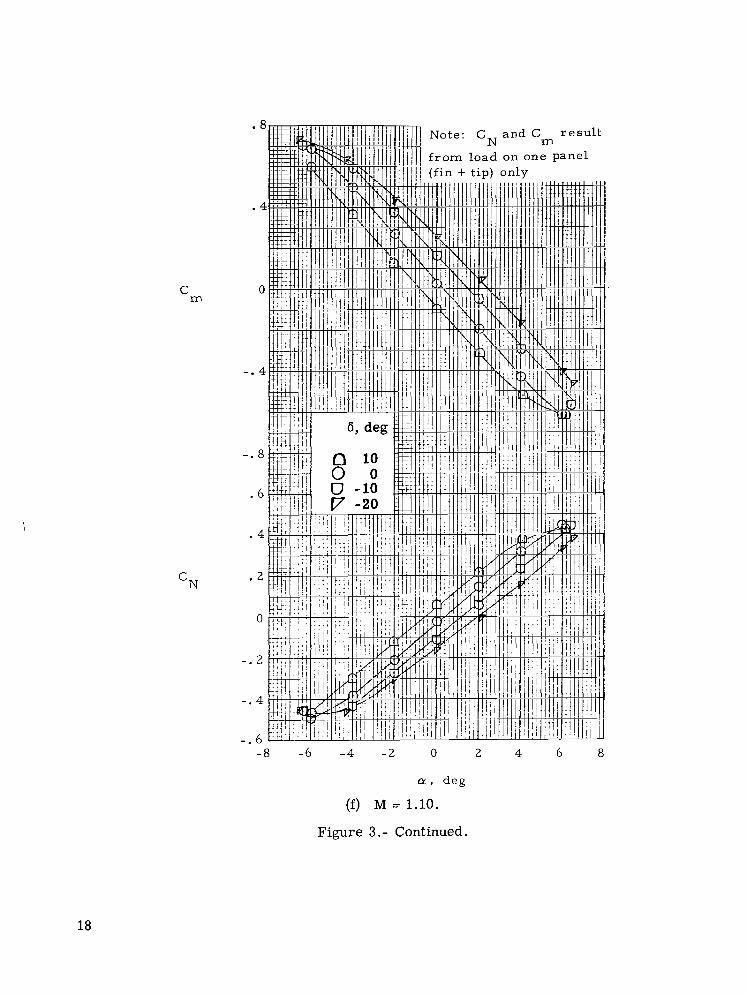
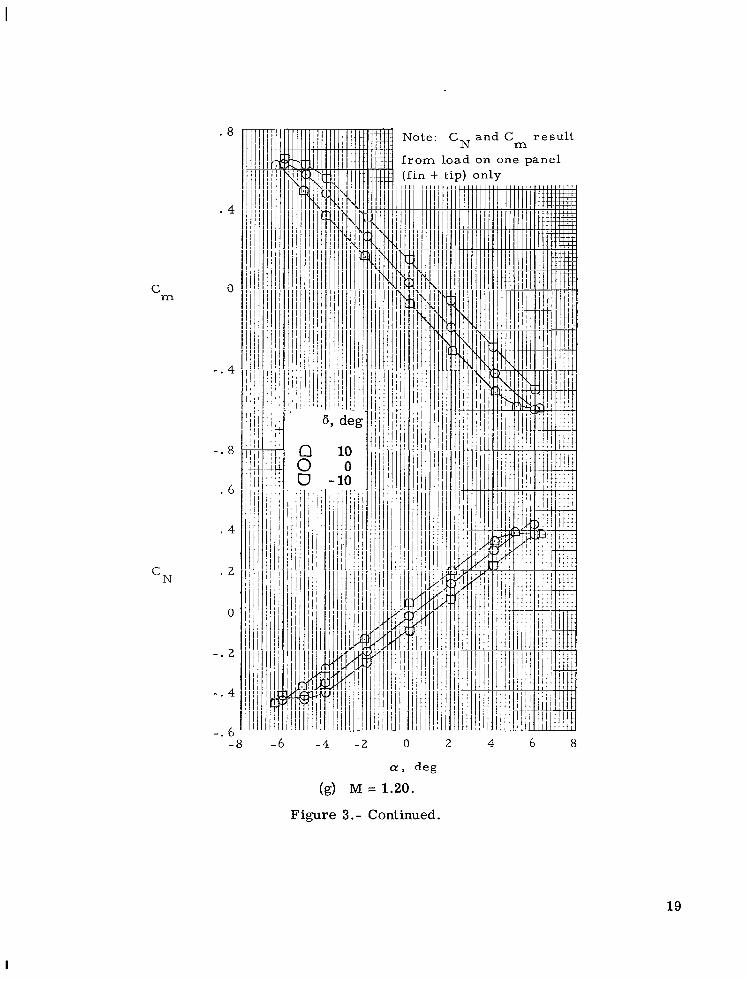
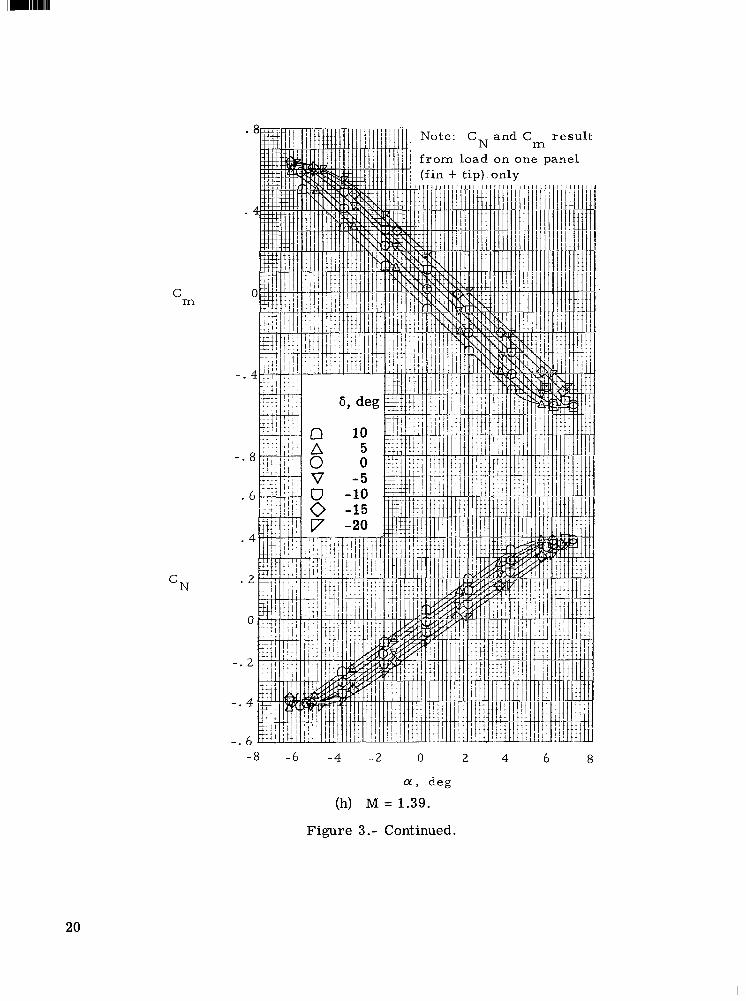
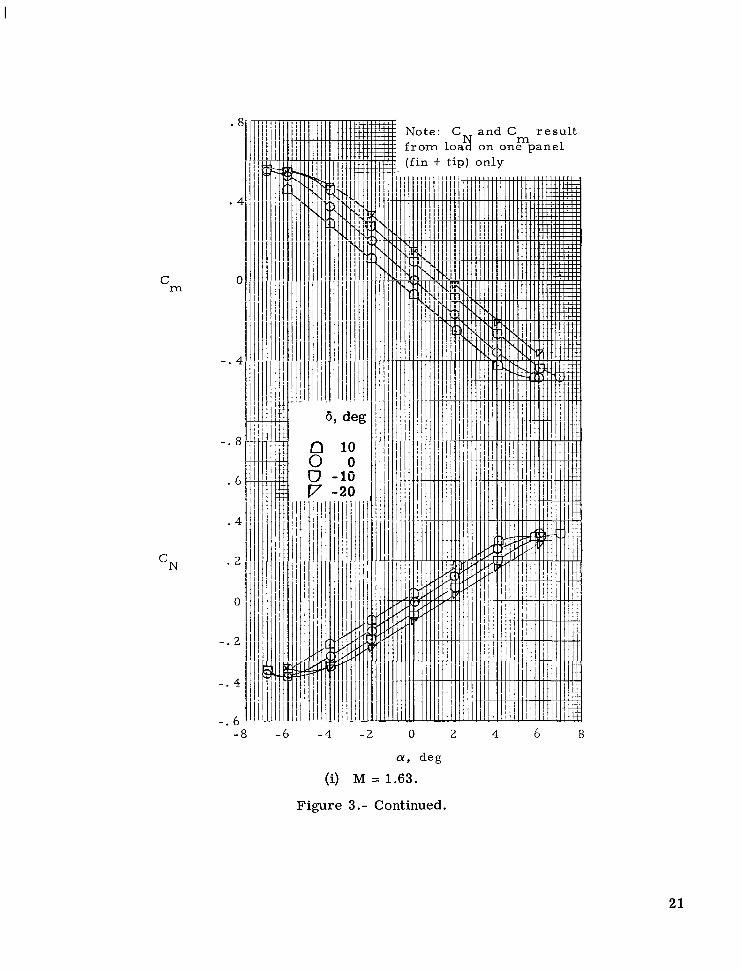
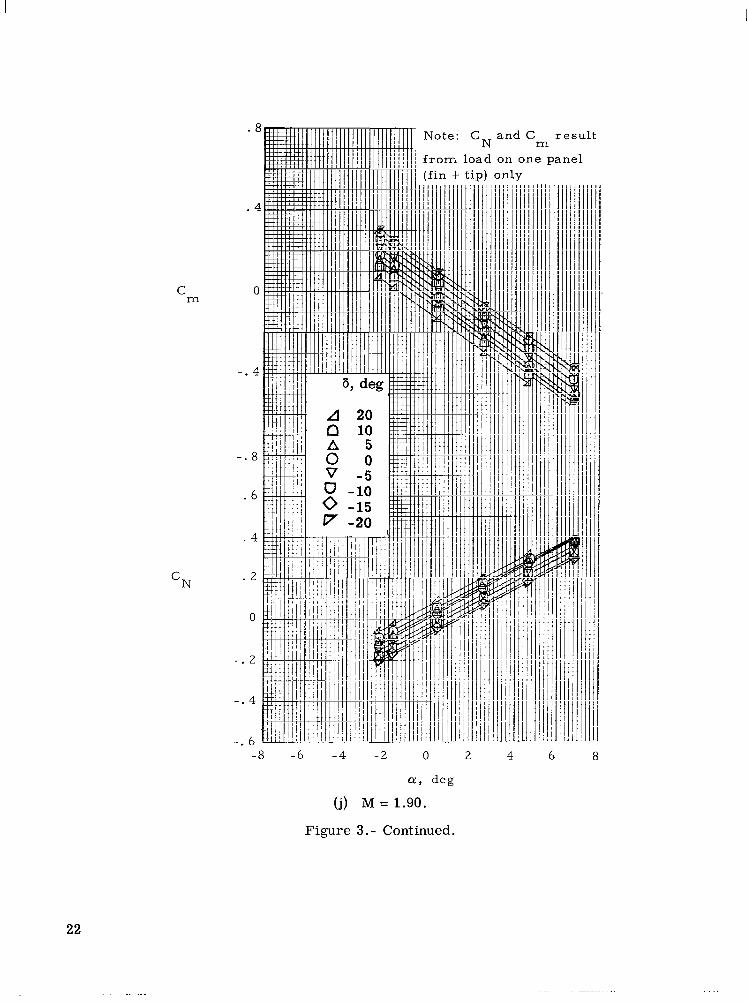
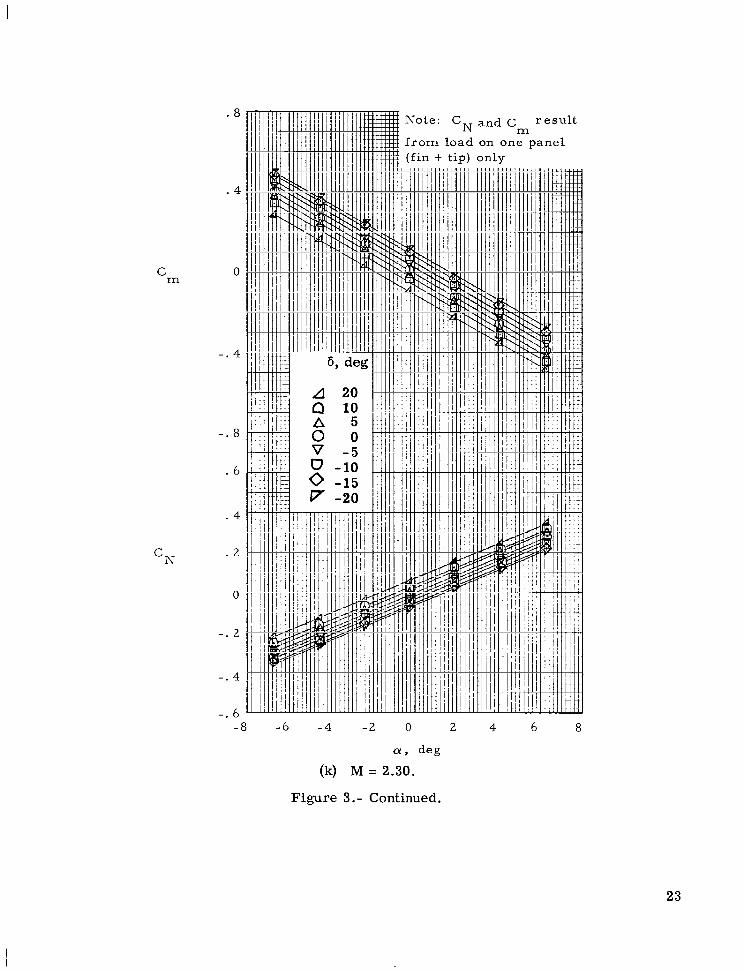
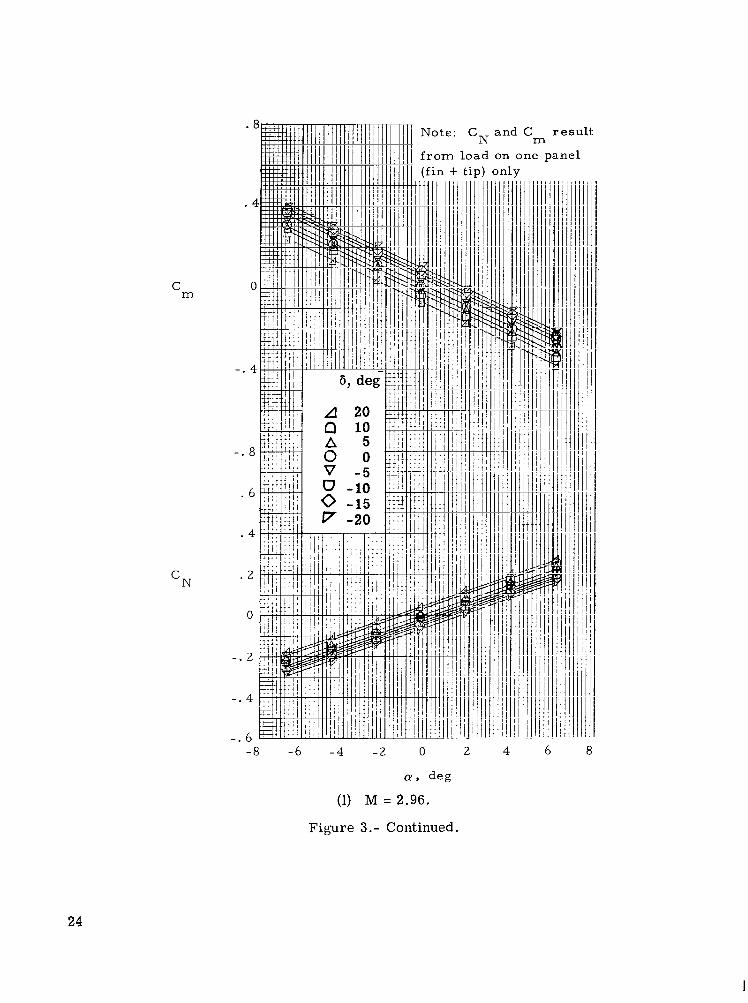
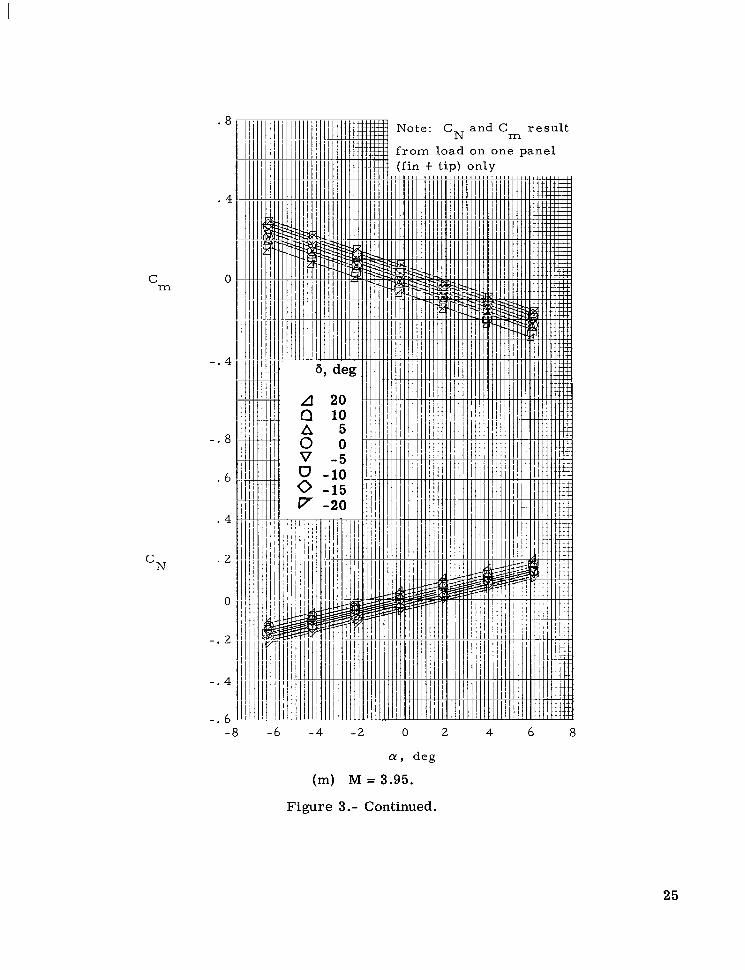
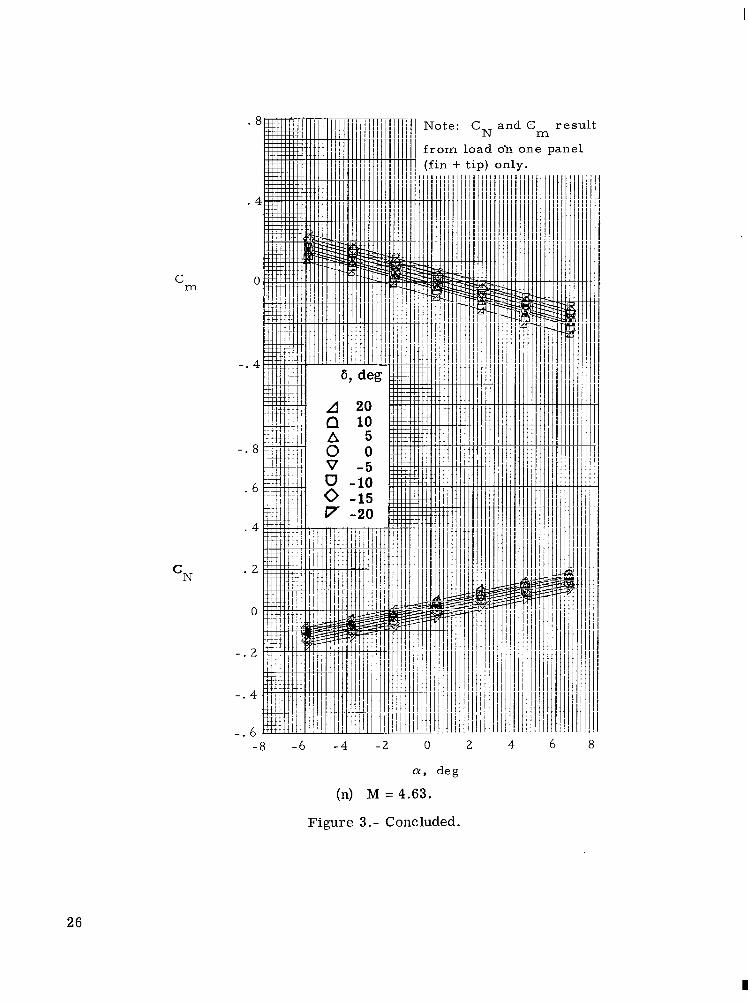
The static longitudinal stability and control characterist ics of the model fin are presented in figure 3. The variations of fin CN and Cm with a! and 6 a r e l inear
5
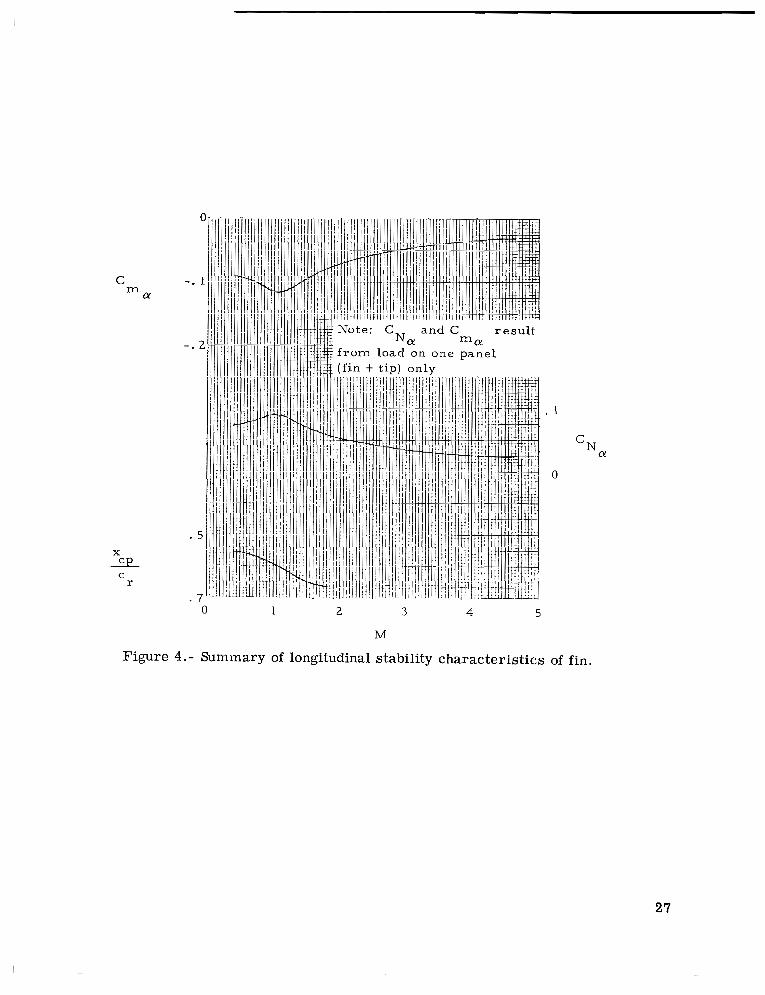
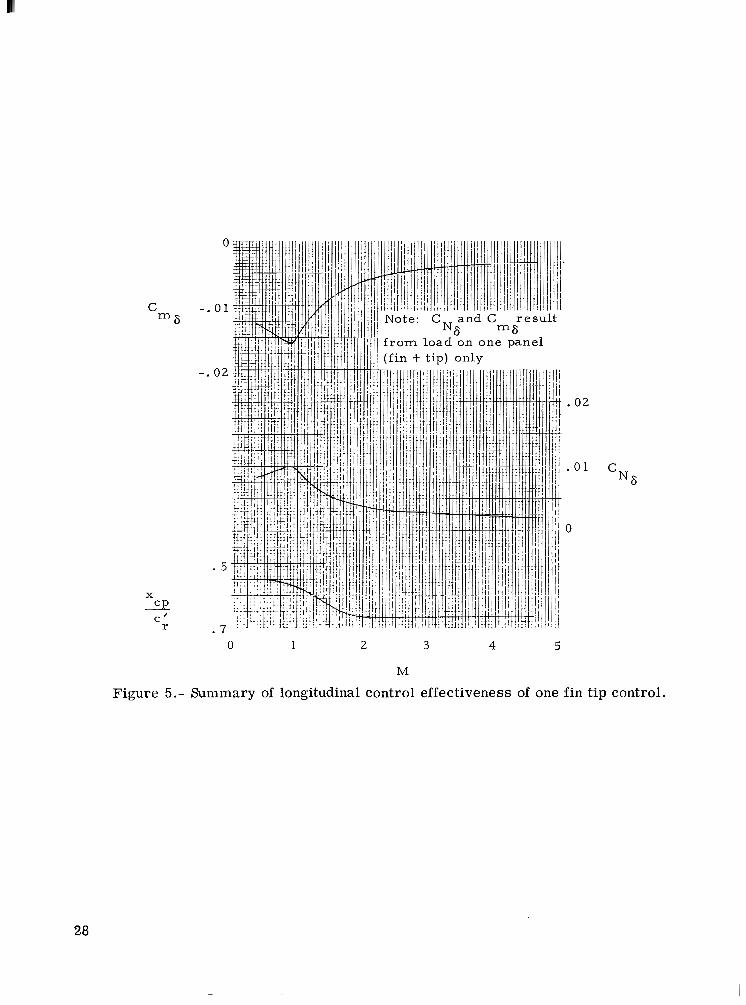
except at combined high angles of attack and fin t ip control deflection at Mach numbers below 0.60. Except at the higher supersonic Mach numbers, the fin t ips appear to stall at these high values of a and 6. The longitudinal stability character is t ics are summarized in figure 4. Correlation of data obtained from the various test facilities is excellent. The longitudinal control effectiveness for one fin t ip control is summarized in figure 5.
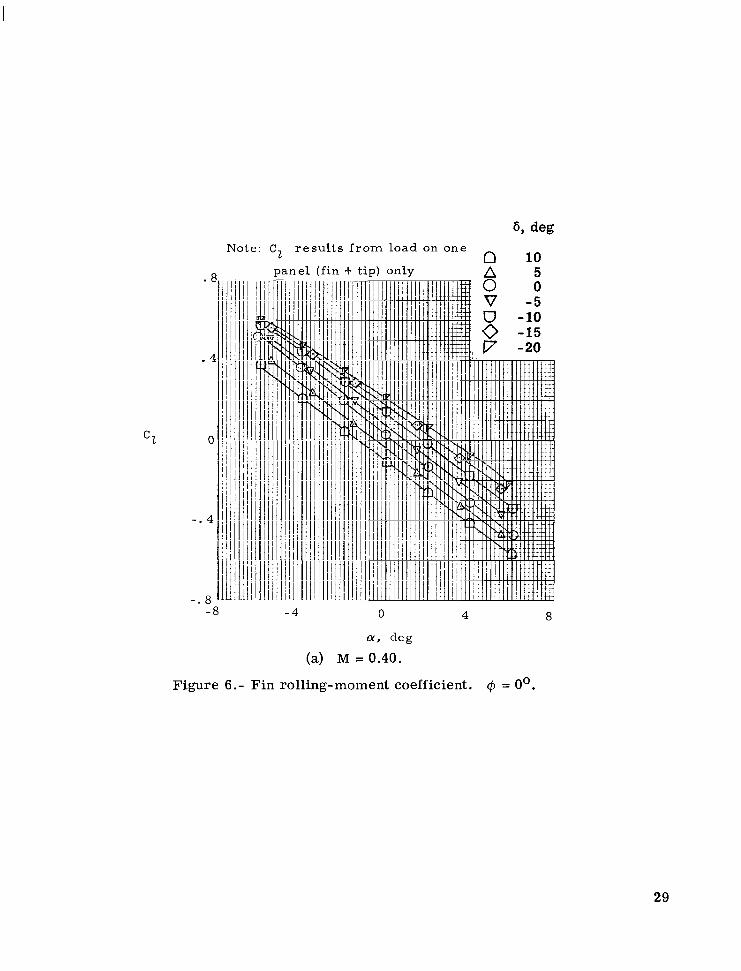
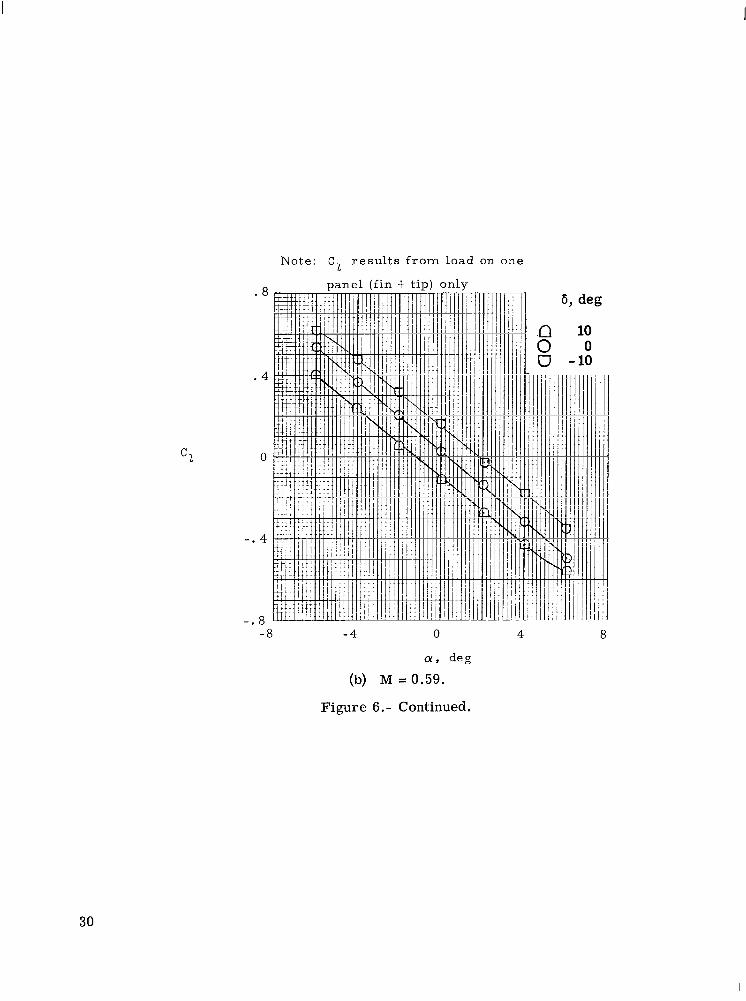
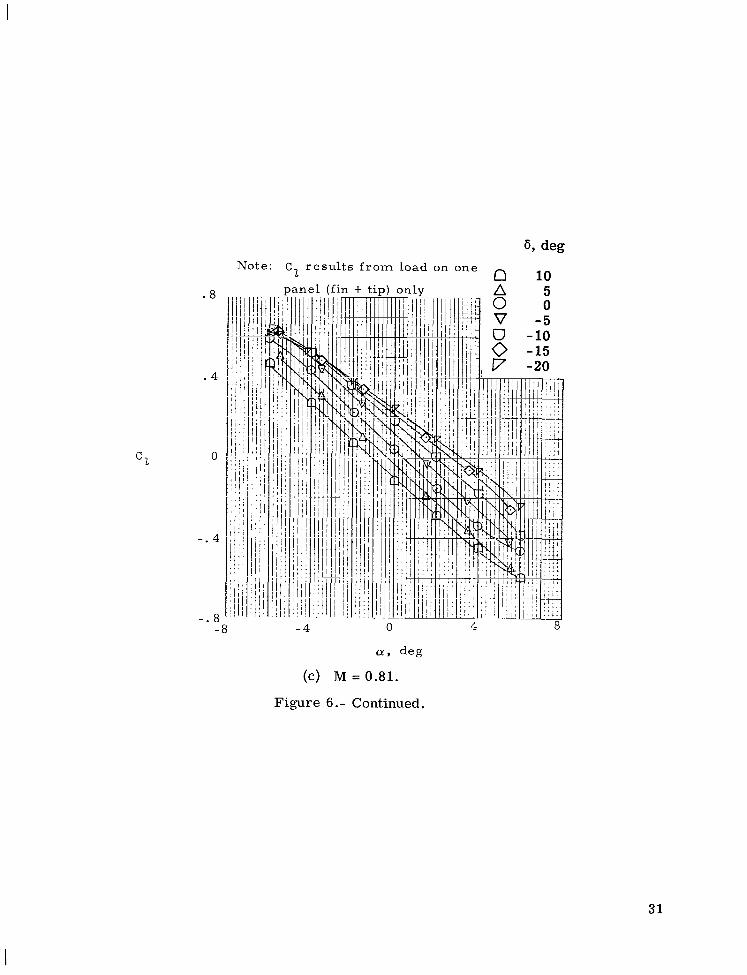
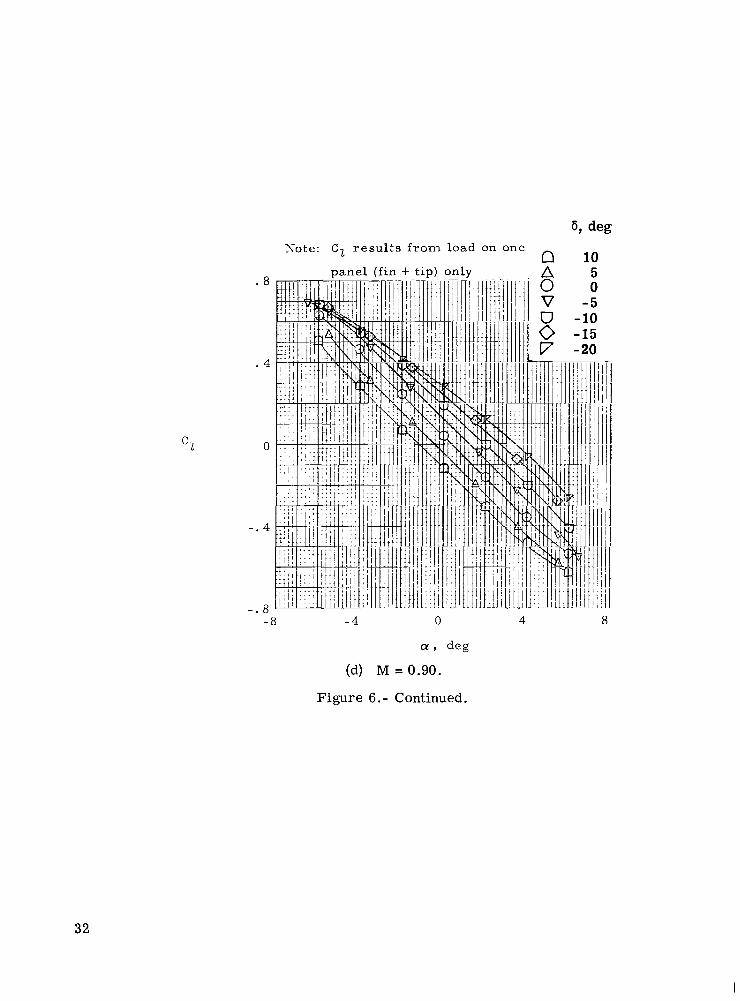
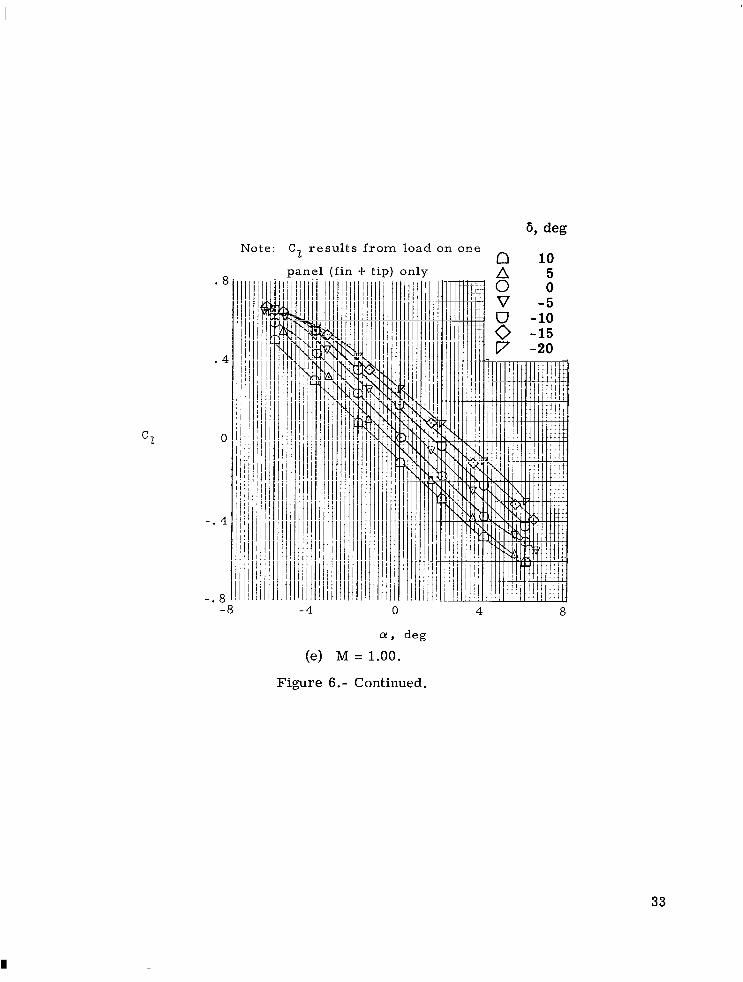
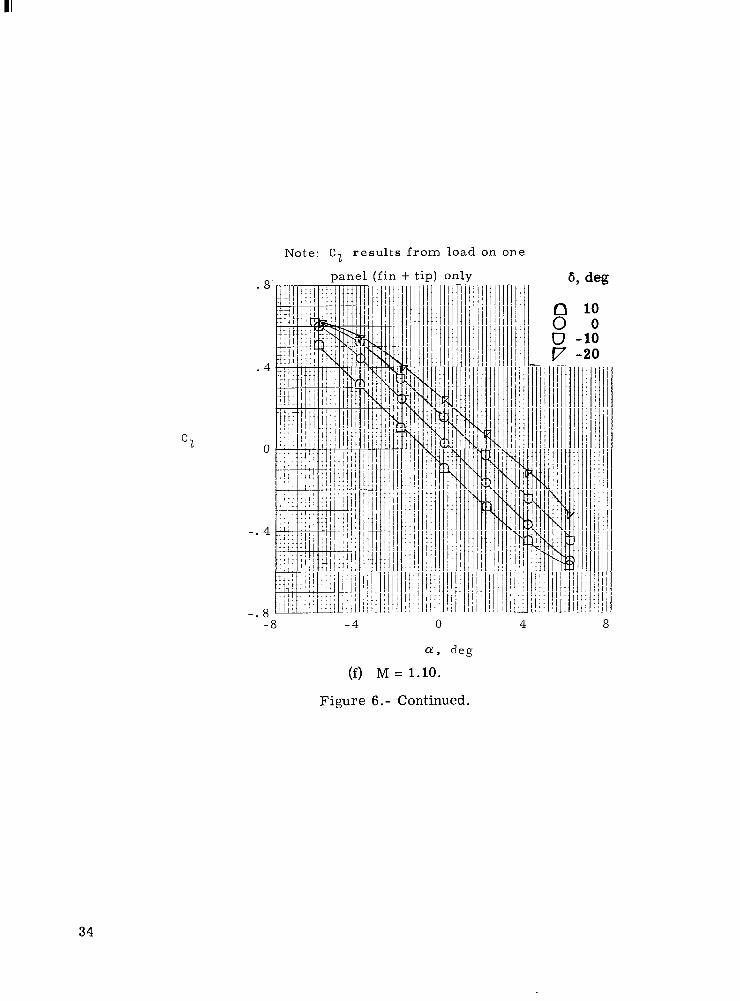
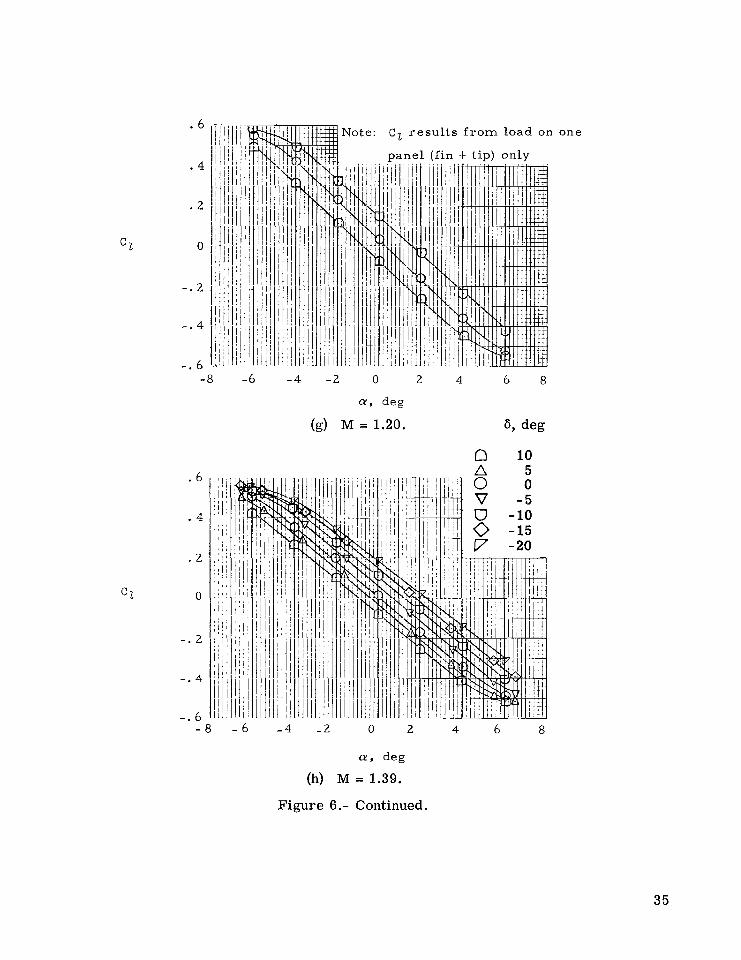
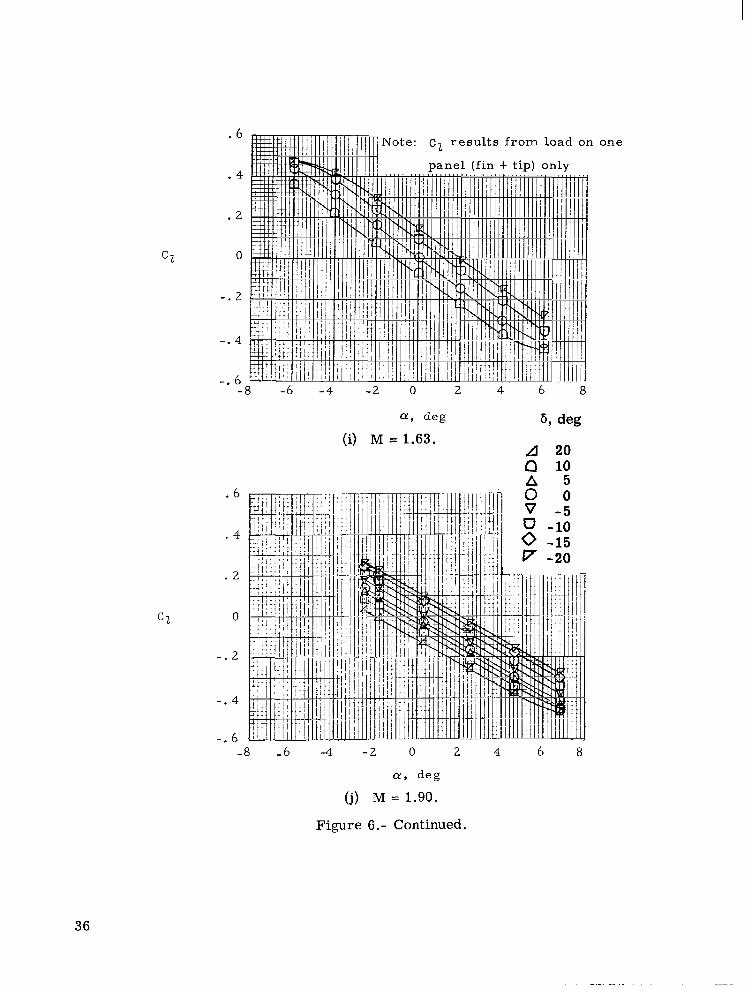
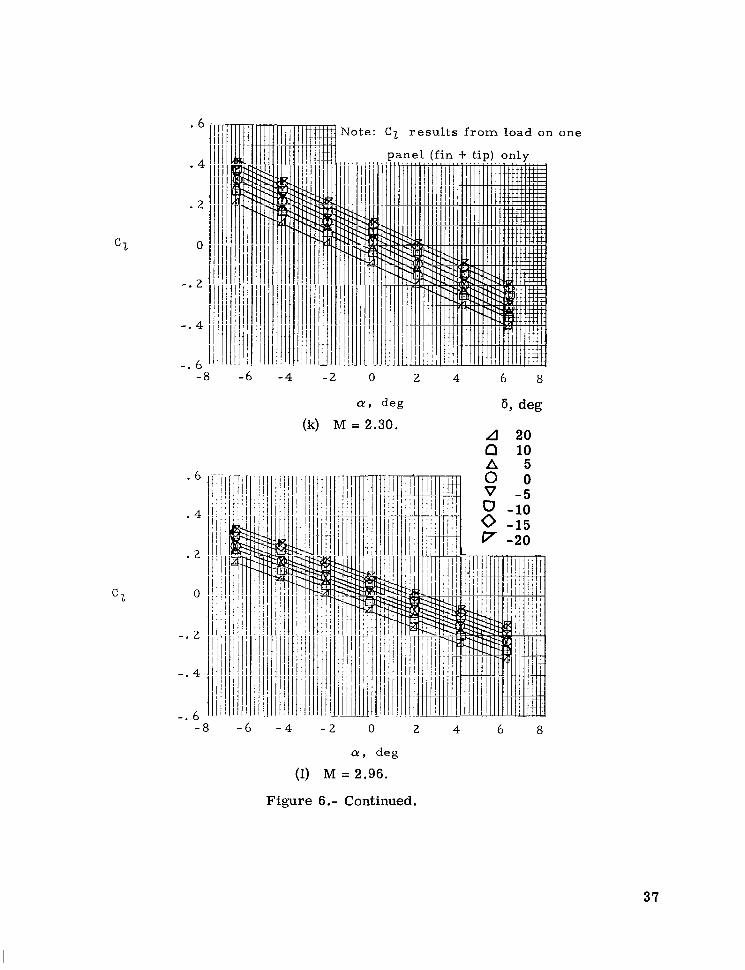
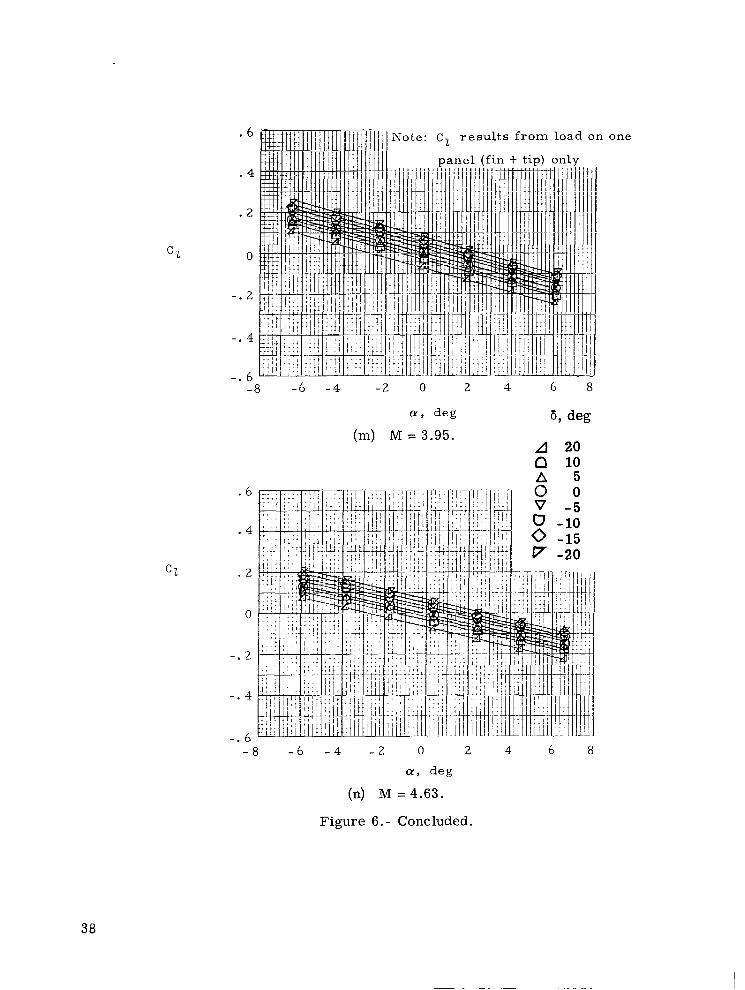
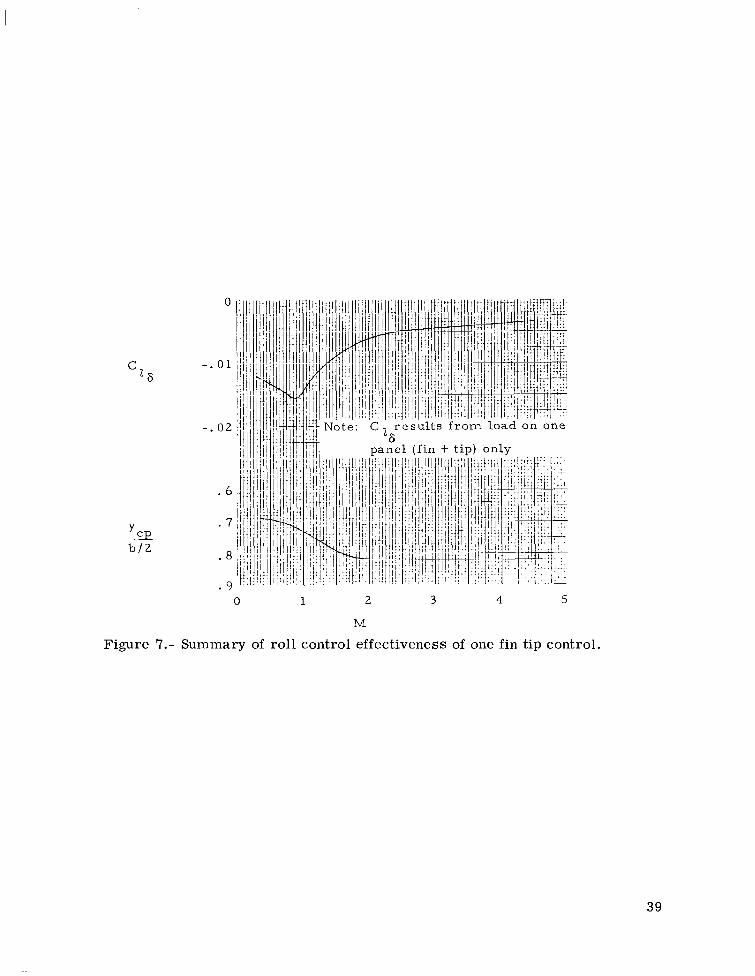
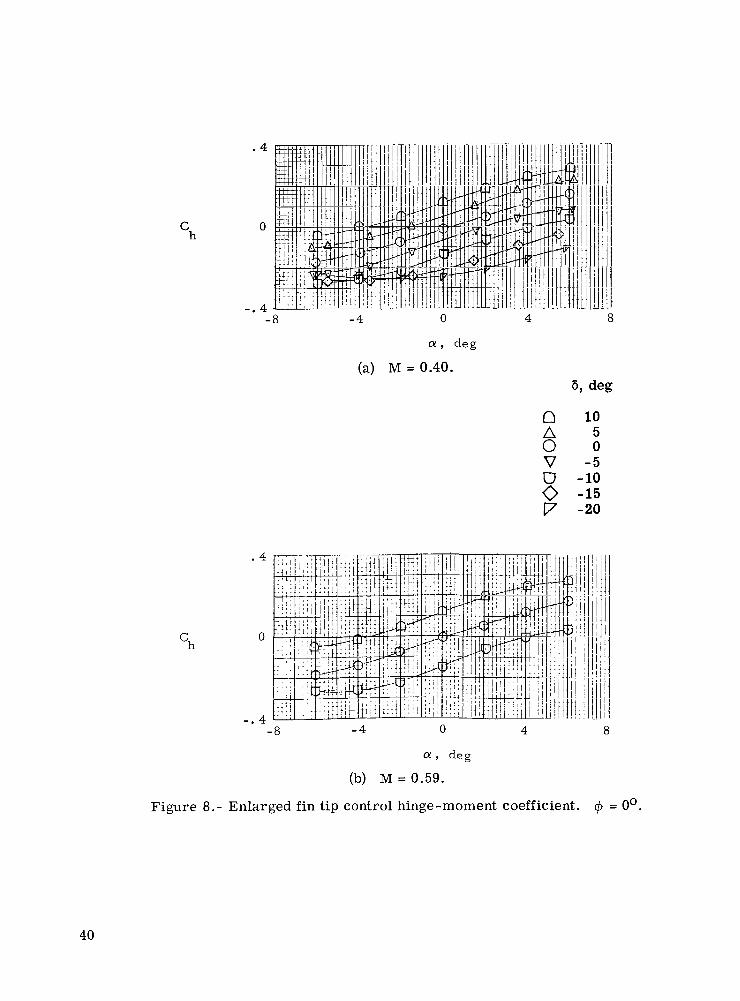
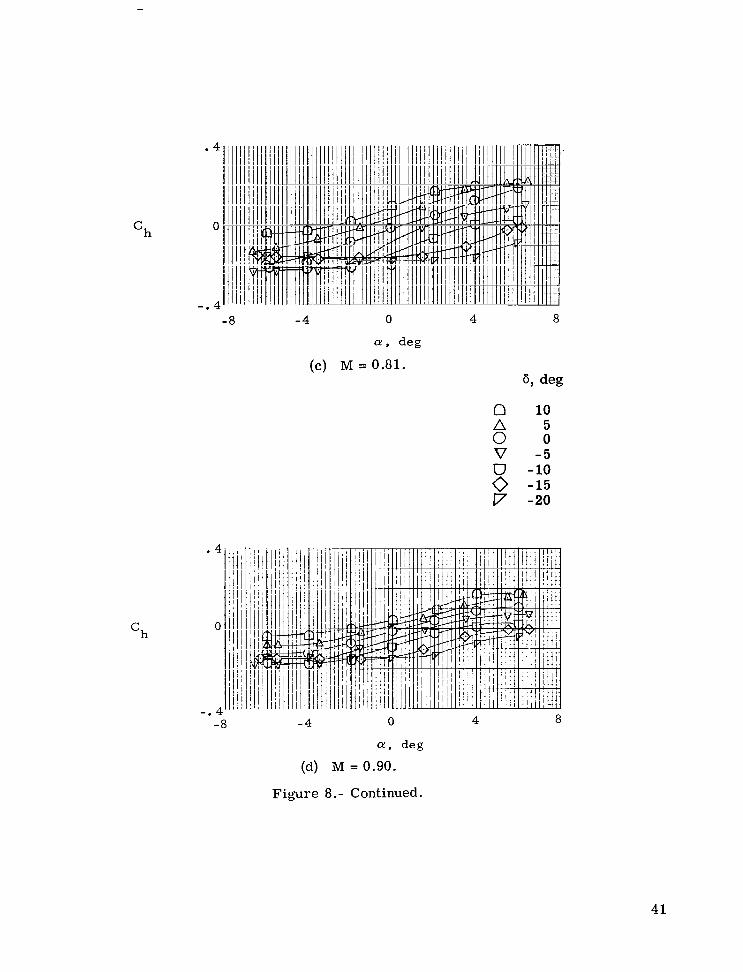
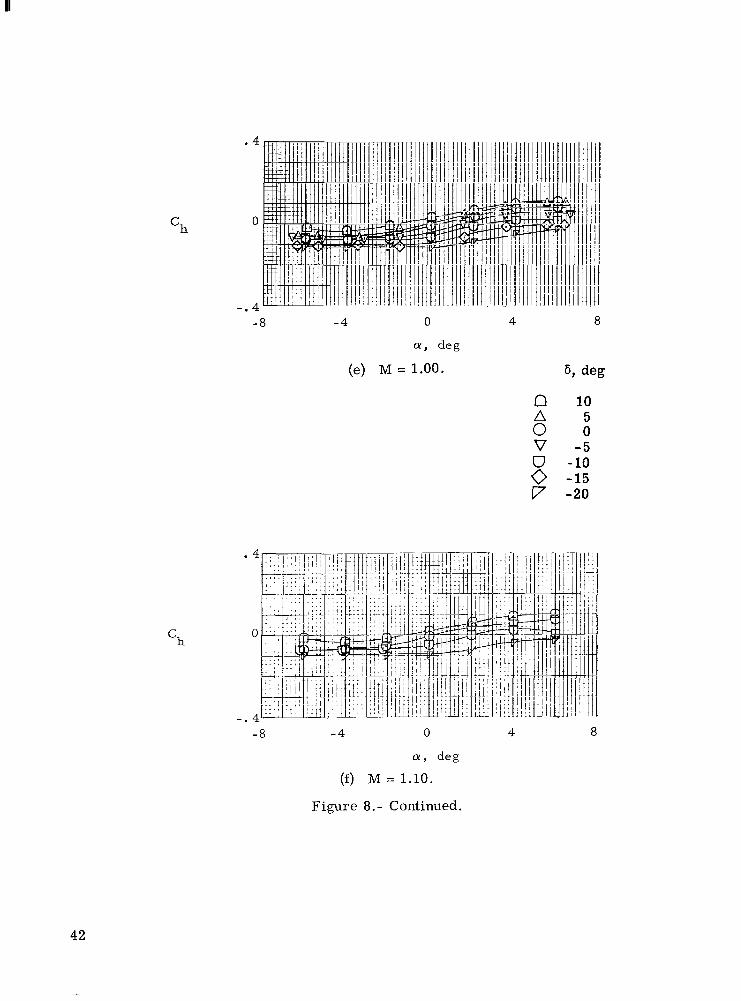
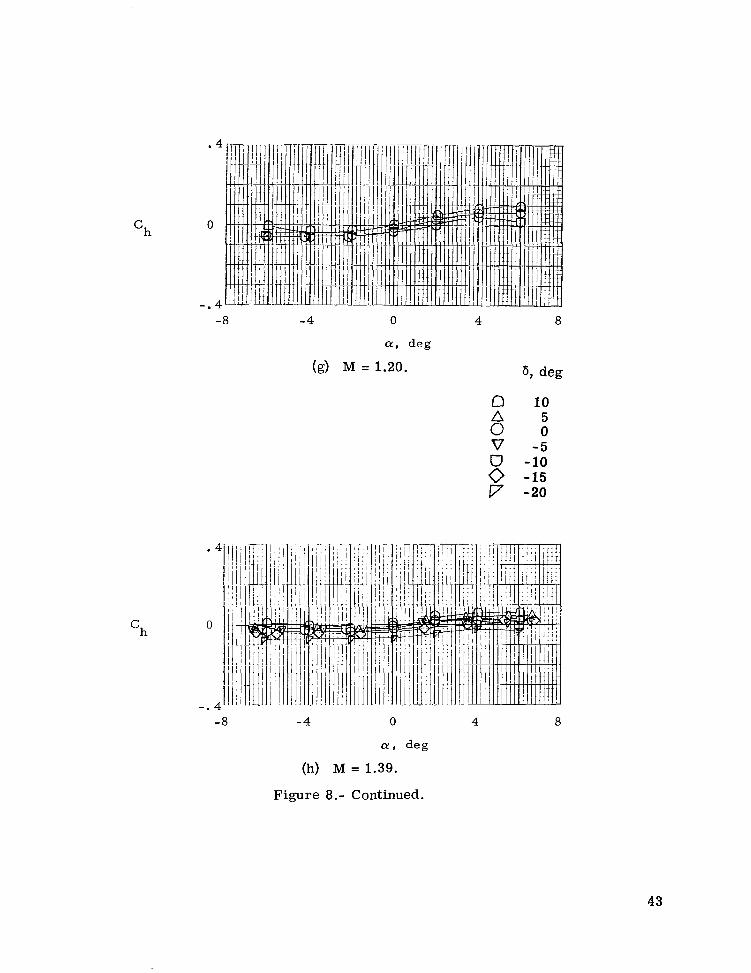
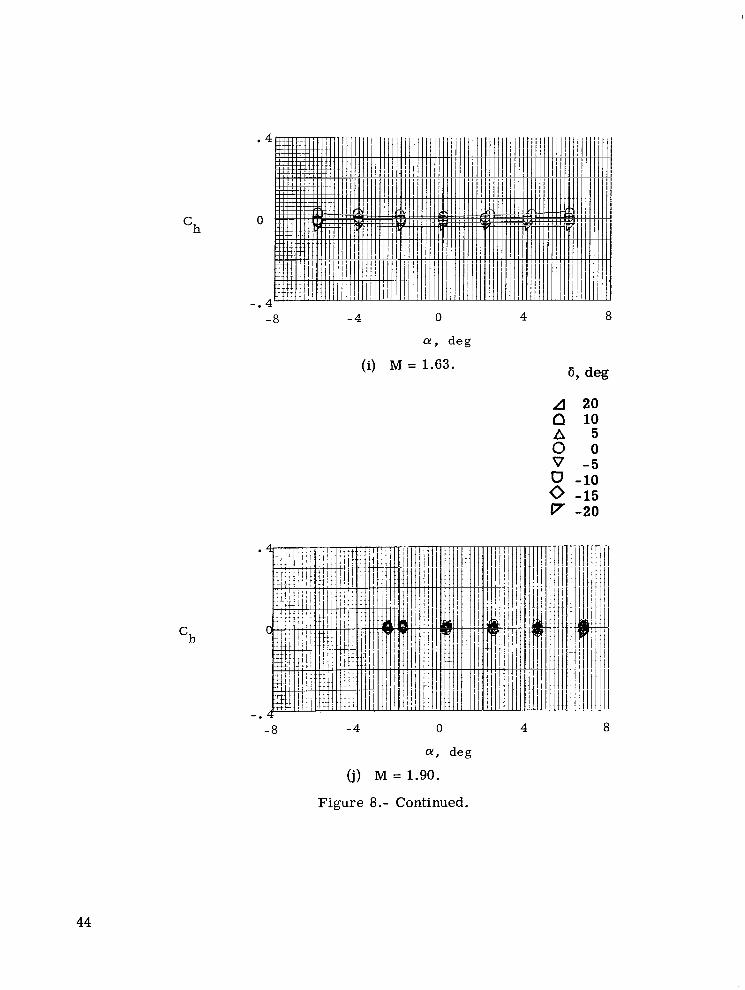
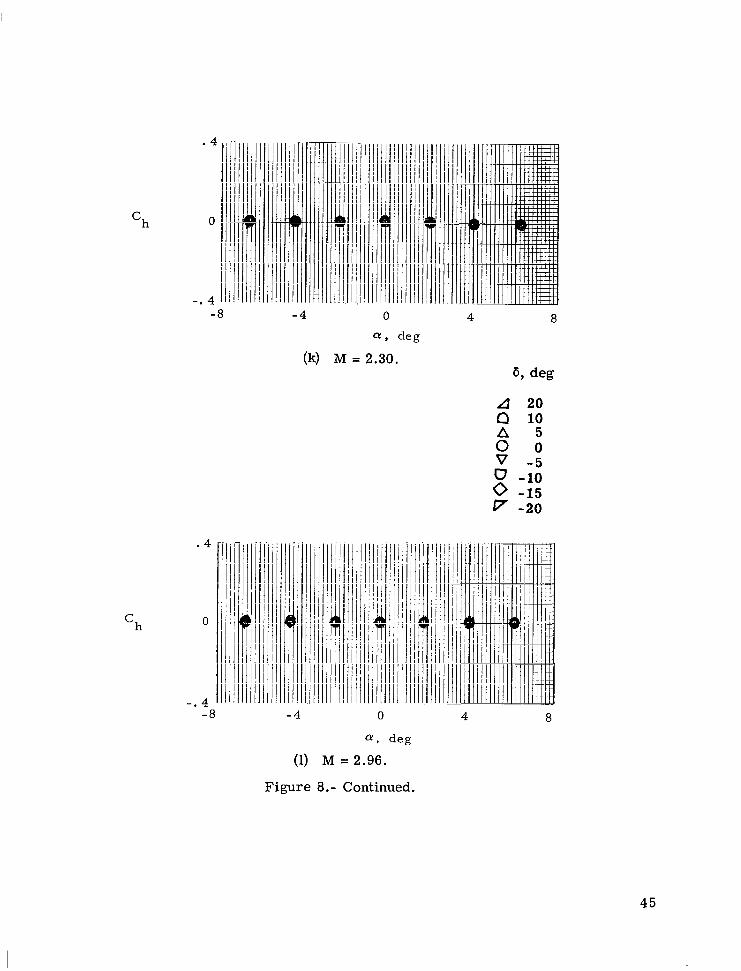
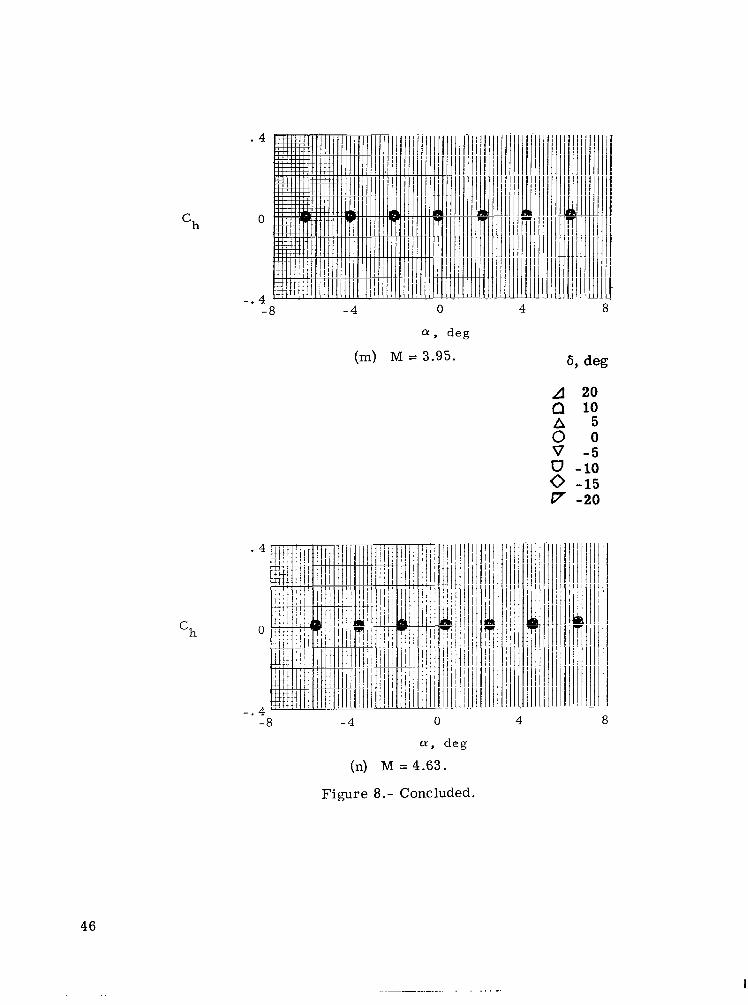
Fin rolling-moment-coefficient data are presented in figure 6; the variation of Cl with angle of attack is linear except at combined high angles of attack and fin t ip control deflection. The rol l control effectiveness for one fin t ip control is summarized in figu r e 7. Hinge-moment-coefficient data for the enlarged fin t ip control are presented in figure 8. Maximum hinge-moment coefficients occur ai M = 0.40 and 0.59; thereafter, the hinge-moment coefficient decreases as Mach number increases up to M = 1.63. At M = 1.63 and higher, the coefficient is essentially ze ro and is relatively invariant at combined high angles of attack and fin t ip control deflection.
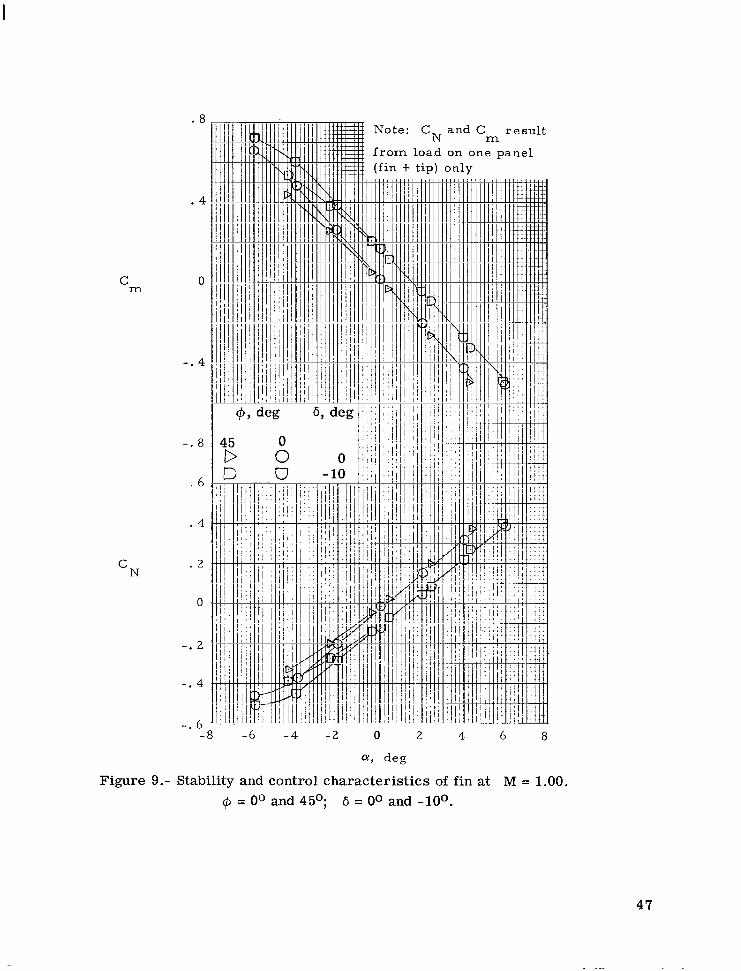
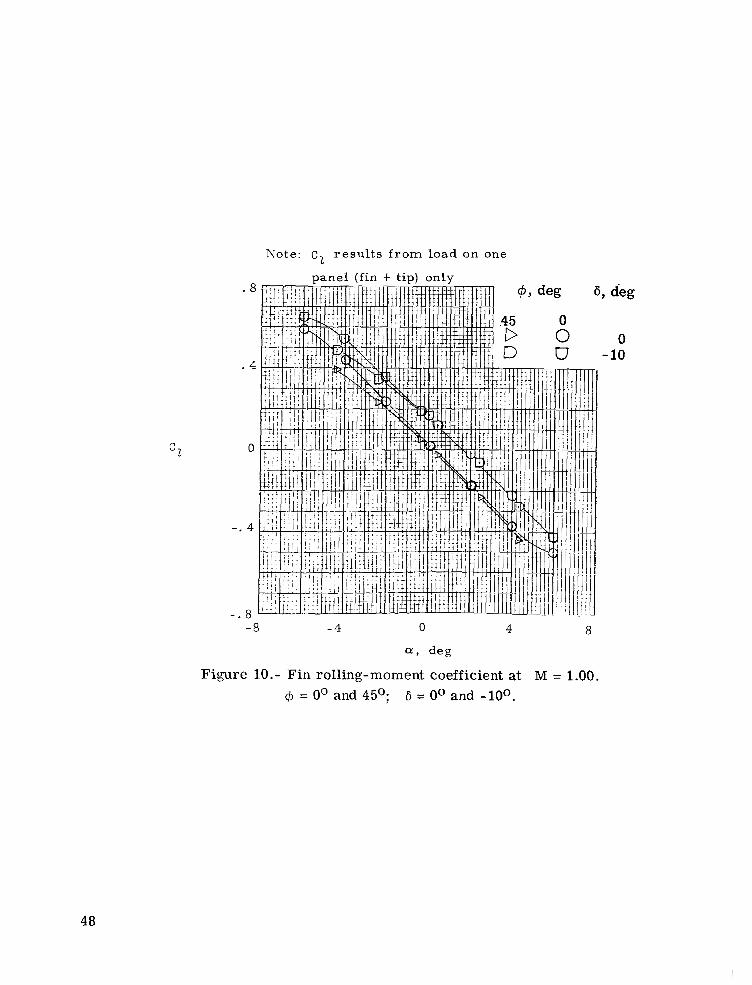
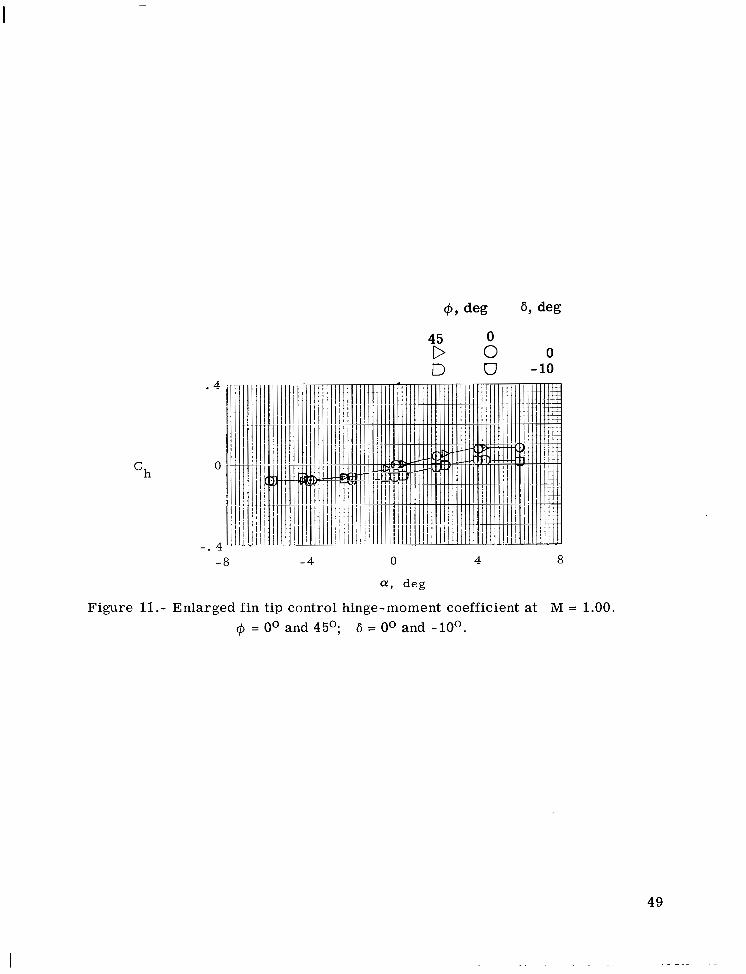
Figures 9 to 11present fin data at M = 1.00 for Cp = 0' and 45O and 6 = Oo and -loo. With Cp = 45O, the instrumented f in is on the windward side of the body at positive angles of attack. In figure 9, the data show that as the instrumented fin is rotated to the leeward side of the body, the increment in fin force resulting from either a! o r 6 is reduced. This reduction is attributed to decreased flow angularity and dynamic pressure on the leeward side of the body. This decrease is not indicated on the windward side between Cp = 0' and 45'.
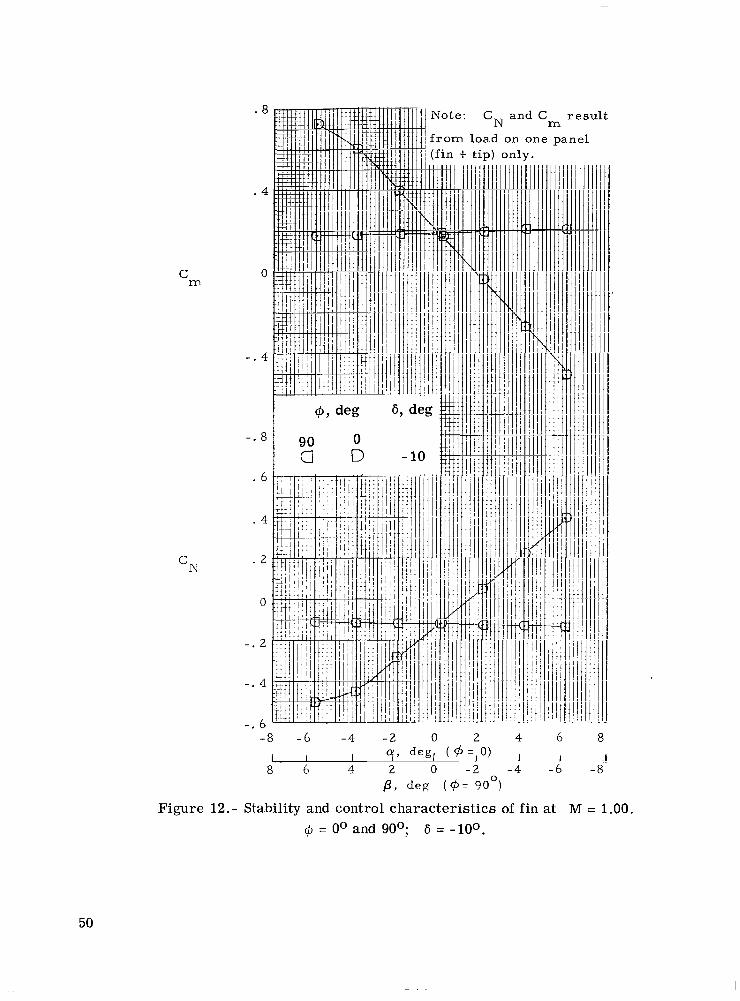
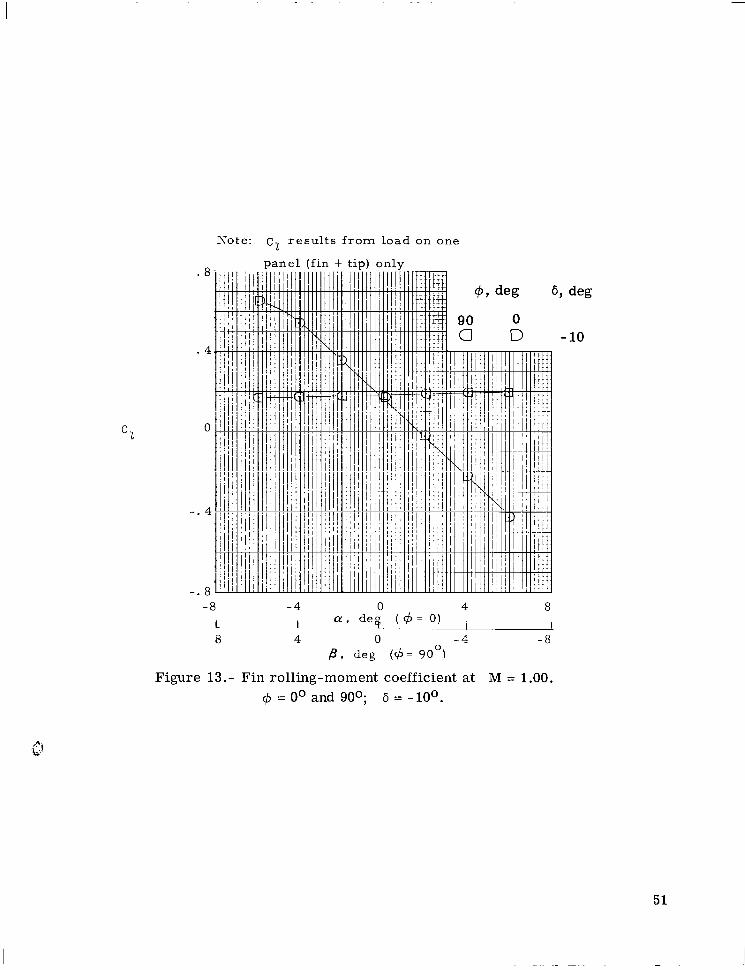
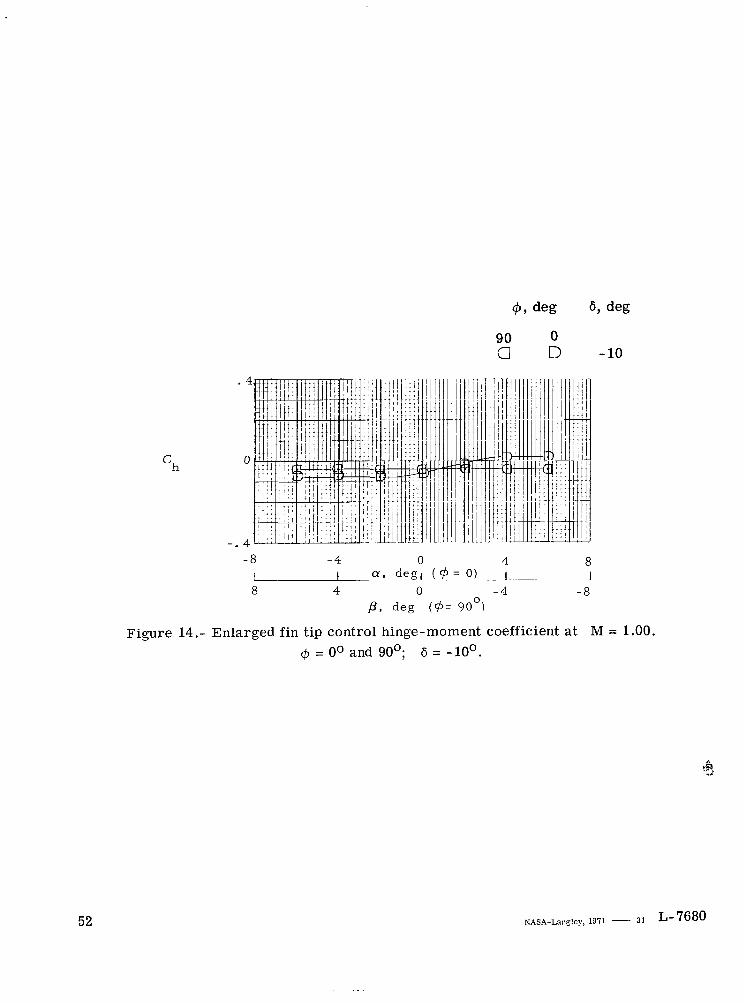
Figures 12 to 14 present fin data at M = 1.00 for Cp = 0' and 90' and 6 = -loo. The 6 = Oo data were omitted at c$ = 90° because the instrumented fin is moving in the vertical plane and, consequently, the measured forces are zero. Fo r Cp = 90°, the model was pitched in the same wind-tunnel plane as for C#J = Oo and 45'; thus, the variable model attitude angle was sideslip angle p instead of angle of attack CY.At a! = p = Oo, the forces and moments on the fin a r e the same for both roll angles with 6 = - loo because the model flow fields are equivalent. The increment in fin force due to a - I O o fin t ip control deflection is less at a! = -6O than it is at a! = 6O. (See fig. 12.)
CONCLUDING REMARKS
Results of an investigation to determine the static longitudinal aerodynamic character is t ics (pitching-moment, rolling-moment, and normal-force coefficients) of a Scout fin and the hinge-moment coefficients of the enlarged fin t ip control indicate that the coefficients are predominately linear throughout the test ranges of Mach number (M = 0.40 to 4.63) and angle of attack (a! = -6O to 6'). Below and including M = 1.90, the pitching-moment, rolling-moment, and normal-force coefficients are linear for a! = -4O to 4O. Above and including M = 2.30, these coefficients are linear for CY = -6O to 60. The
6
hinge-moment coefficient c h is extremely nonlinear through M = 1.39. Above that Mach number, c h not only is linear but is effectively nonexisting.
At low Mach numbers and high angles of attack and t ip control deflection, the data indicate that the fin t ip control has a tendency to stall. Above M = 1.00 the tendency to stall at combined high angles of attack and t ip control deflection continued, but Mach number ceased to be an influencing parameter.
Langley Research Center, National Aeronautics and Space Administration,
Hampton, Va., August 24, 1971.
REFERENCES
1. Arnold, John W.: High Speed Wind Tunnel Facility Handbook. Publ. No. AER-EIR-13552-B, Vought Aeronautics Co., Feb. 1970. (Revised Mar. 1971.)
2. Scout Eng.: Study of Effects of Incorporating a Larger Heatshield on the Scout Vehicle. Rep. No. 23.411 (Contract No. NAS1-6935), Missiles & Space Div., LTV Aerosp. Corp., July 24, 1969. (Available as NASA CR-111947.)
3. Keynton, Robert J.: Longitudinal Stability Characterist ics of Preliminary Configurations for Scout D at Mach Numbers 0.20 to 4.63. NASA TN D-6239, 1971.
4.Yanowitch, S.; and Knauber, R. N.: Scout First Stage Flight Characterist ics. Rep. No. 23.358 (Contract No. NAS1-6020), Missiles & Space Div., LTV Aerosp. Corp., Mar. 15, 1968. (Available as NASA CR-111945.)
5. Brassard, J. A.; Knauber, R. N.; and Melugin, J. E.: Scout First Stage Moment Disturbance Study. Rep. No. 23.287 (Contract No. NAS1-4664-EDJ), LTV Astronaut. Div., July 15, 1966. (Available as NASA CR-111946.)
7
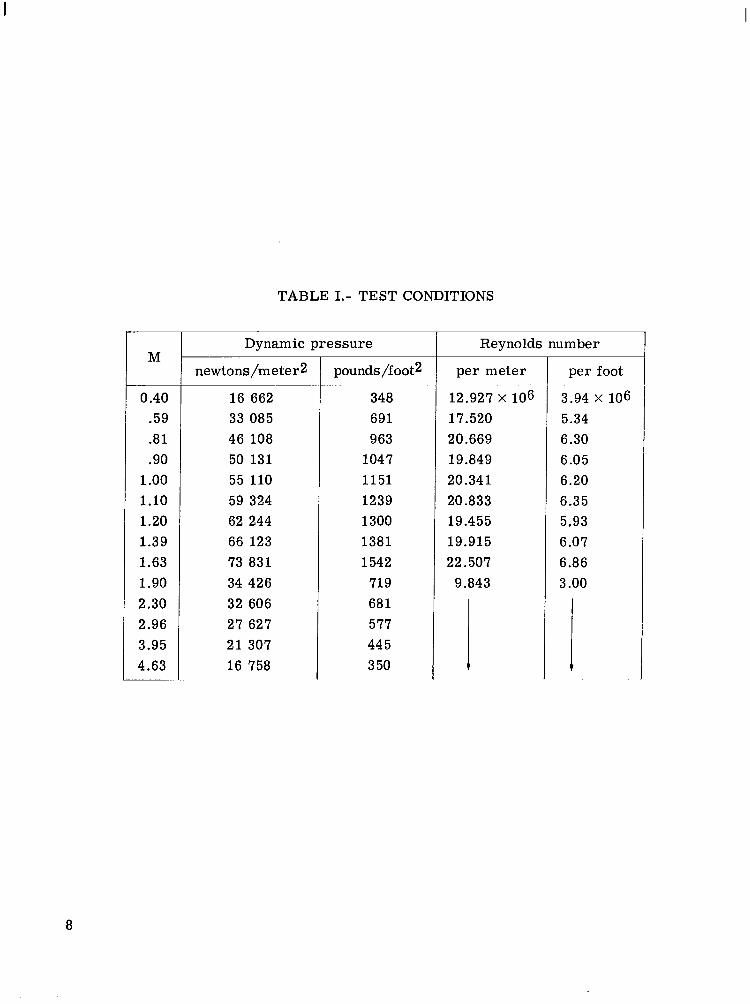
TABLE 1.- TEST CONDITIONS
Dynamic pressure Reynolds number M
newtons/meter2 pounds/foot2 per meter per foot
0.40 16 662 348 12.927 X 10⁶ 3.94 x 10⁶ .59 33 085 691 17.520 5.34 .81 46 108 963 20.669 6.30 .90 50 131 1047 19.849 6.05
1.oo 55 110 1151 20.341 6.20 1.10 59 324 1239 20.833 6.35 1.20 62 244 1300 19.455 5.93 1.39 66 123 1381 19.915 6.07 1.63 73 831 1542 22.507 6.86 1.90 34 426 719 9.843 3.OO 2.30 32 606 681 2.96 27 627 577 3.95 2 1 307 44 5 4.63 16 758 350 7 1
8
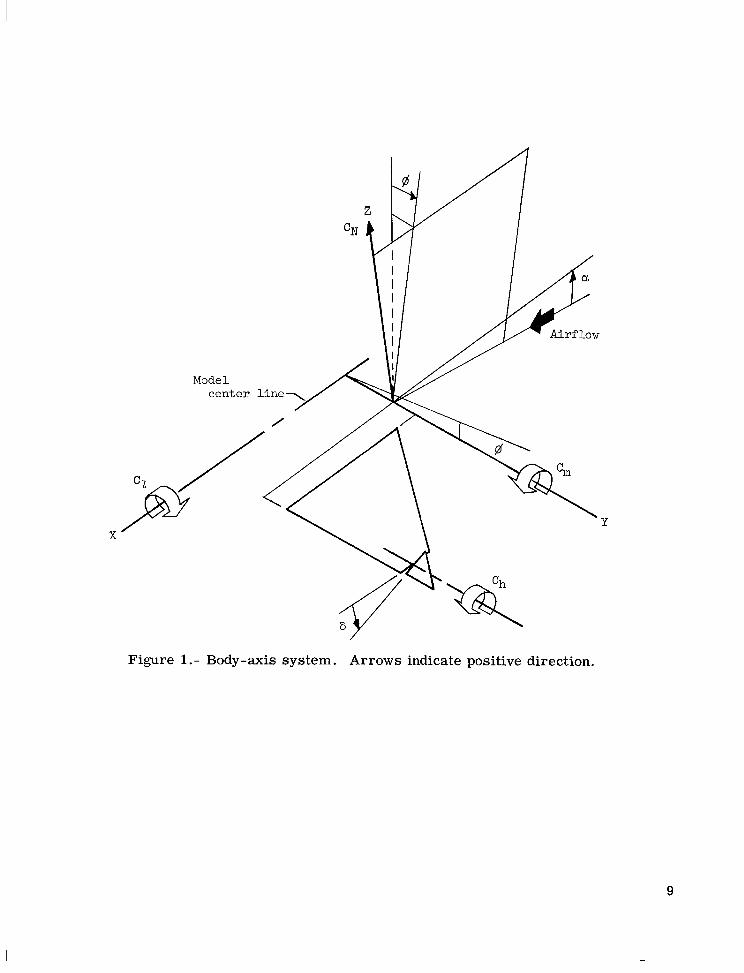
Figure 1.- Body-axis system. Arrows indicate positive direction.
9
1 - 41. 56 L
I (105 . 562) 4 0 . 4 8t 1 2 . 0 0 I
(30.41
t
1 . 128 ( 2 . 865) (12 . 0651
5. 719
f . 991R) (1.245R) 1.08 . 7 4 3 )Morlen t ( 2
r e f e r e 11c f>
c cn t e r
Section A - A Sect ion R - B
(a) Complete model.
Figure 2.- Model details. Dimensions a r e in inches (centimeters).
III
1 / 1 7 1 . 5 6 2 ( 3 . 9 6 7 )
1. 4 . 8 7 5 (3 . (12 . 382)
I ' 3 .313I ( 8 . 4 1 5 )
L L 4. 500 r ( 1 1. 430)
(b) Fin with enlarged fin t ip control.
Figure 2.- Continued.
11
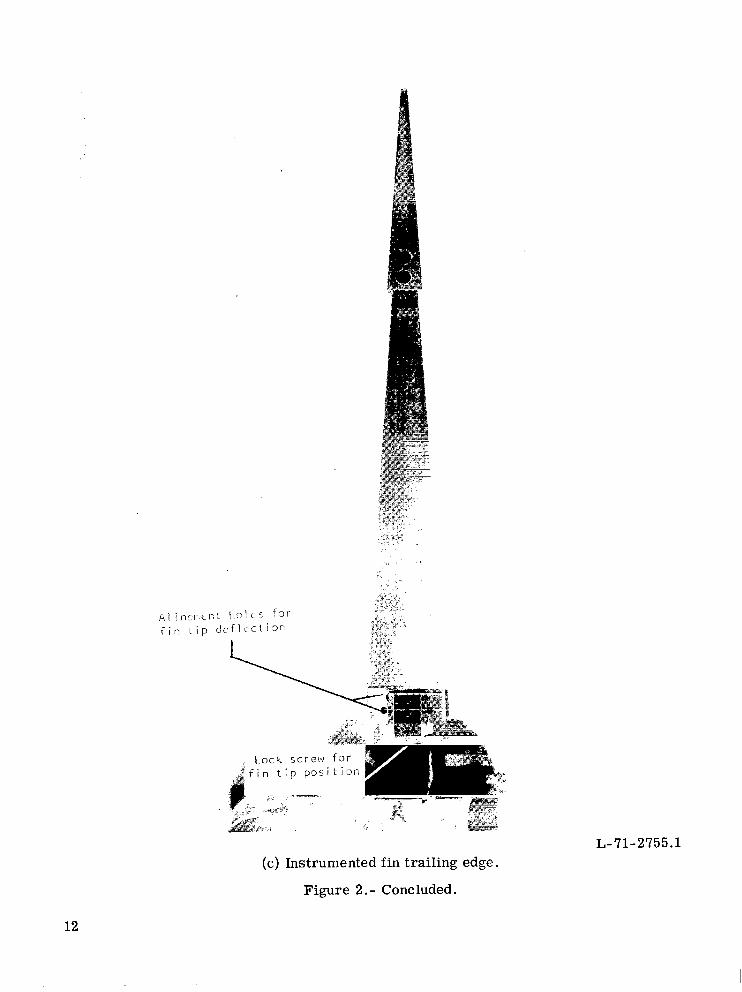
L-71-2755.1 (c) Instrumented fin trailing edge.
Figure 2.- Concluded.
12
.8 Note: C N and Cm r e s u l t
from load on one panel (fin + t ip) only
. 4
0
-.4
-.8
.6
. 4
C N . 2
0
-.2
-.4
-.6-8 -6 -4' - 2 0 2 4 6 8
ff, deg
(a) M = 0.40.
Figure 3.- Static longitudinal stability and control characterist ics of fin. $J = Oo.
13
.8
.4
C 0 m
1 Note: C N and C r e s u l t ! m
i from load on one panel 'in t tip) only
-.4
-.8
. 6
. 4
.2
0
-. 2
-.4
6
cN
- 8 -6 - 4 - 2 0 2 4 6 8
a, deg
(b) M = 0.59.
Figure 3 .- Continued.
14
. 8
.4
0'm
-.4
-. 8
. 6
. 4
. 2 c N
0
-.2
-.4
-.6
Note: C N and C r e s u l tm f r o m load on one panel (fin + t ip) only
0 10 A 50 0 v - 5 u -100 -15v -20
-8 -6 - 4 - 2 0 2 4 6 8
a, deg
(c) M = 0.81.
Figure 3.- Continued.
15
. 8 d C r e s u l t n1
on e panel LY
.4
0 cm
-.4
-.8
. 6
. 4
C N .2
0
-. 2
-.4
I-.0
-8 -6 -4 - 2 0 2 4 6
a, deg
(d) M = 0.90.
Figure 3 . - Continued.
16
m
cN
. 8
. 4
0
-.4
-.8
. 6
.4
. 2
0
-.2
-.4
-.6 -8 -6 -4 - 2 0 2 4 6 8
a , deg
(e) M = 1.00.
Figure 3.- Continued.
17
C
C m
\
cN
. 8
.4
0
-.4
-.8
. 6
. 4
. 2
0
- 0 2
-. 4
-.6 - 8 -6 - 4 - 2 0 2 4 6 8
a , deg
(f) M = 1.10.
Figure 3. - Continued.
18
. 8
.4
C 0 m
-.4
-.8
.6
. 4
cN . 2
0
-. 2
-. 4
-. 6
1 Note : C N a n d C r e s u l t m
f r o m l o a d on one p a n e l ( f i n t t i p ) on ly
- 8 -6 -4 - 2 0 2 4 6 8
a , d e g
(g) M = 1.20.
Figure 3.- Continued.
19
I
C m
- 8 - 6 - 4 - 2 0 2 4 6 8
a , deg
(h) M = 1.39.
Figure 3.- Continued.
20
I
Note: C and C re su l t mfrom loa2 on one panel (fin t t ip) only
C m
cN
- 8 -6 - 4 -2
(i) M = 1.63.
Figure 3.- Continued.
21
r e s u11it n panel
C m
-8 -6 -4 - 2 0 2 4 6 8
a, deg
(j) M = 1.90.
Figure 3. - Continued.
22
... .. . ..
. 8
. 4
0 m
-. 4
-. 8
. 6
. 4
cN . 2
0
-. 2
-.4
-. 6 -8 -6 - 4 - 2 0 2 4 6 8
Q I S deg
(k) M = 2.30.
Figure 3.- Continued.
23
C
and C re su l t m
on one panel only
i
C m
IiIi1
I Ti iiI i;1
cN z I
~
i I
I i Ii i
- 8 - 6 -4 - 2 0 2 4 6 8
a, deg
(1) M = 2.96.
Figure 3. - Continued
24
I
. 8 a n d C re su l tcN m
load on one panel tip) only
. 4
0 m
-.4
-. 8
. 6
. 4
. 2 c N
0
-.2
-. 4
-. 6 -8 4 - 2 0 2 4 6 8
(m) M = 3.95.
Figure 3.- Continued.
25
C
Note: CN and ‘Z m resu l t
f rom load on one panel [fin + tip) only.
C m
cN
-8 -6 -4 - 2 0 2 4 6
a, deg
(n) M =4.63.
Figure 3.- Concluded.
26
I
C m
CY
. 1
0
".p C r
0 1 2 3 4 5
M
Figure 4.-Summary of longitudinal stability character is t ics of fin.
27
0
C -.0 1 m S
-.0 2
. 0 2
. O l c N S
0
. 5
X cp
C ’ r . 7
0 1 2 3 4 5
M
Figure 5.- Summary of longitudinal control effectiveness of one fin t ip control.
28
Note: C 2 r e s u l t s f r o m load on one n i o Dane1 (fin + tip) only A 5
-4 0
a, deg
(a) M = 0.40.
Figure 6.- Fin rolling-moment coefficient. @ = 0'.
29
Note : C l r e s u l t s f r o m l o a d on o n e
Dane1 ( f i n t t i D l o n l v
0
4
8 -8 -4 0 4
at deg
(b) M = 0.59.
Figure 6.- Continued.
30
8
6, deg e : C 2 results from load on one n 10
. 4
0
-.4
-.8-8 - 4 0 4 8
CY, deg
(c) M = 0.81.
Figure 6.- Continued.
31
. 8
- -
. 8
. 4
0
-.4
8 -8 - 4 0 4
a , deg
(d) M = 0.90.
Figure 6.- Continued.
32
8
Note:
. 8
. 4
0
-. 4
-.8 -8
C 2 r e s u l t s f r o m load on one n i o panel (fin + t ip) only n 5
-4 0 4 8
ff,deg
(e) M = 1.00.
Figure 6.- Continued.
33
I
Note: C 2 r e s u l t s f r o m load on one
. 8 panel ( f in + t ip) only
. 4
0
-.4
-. 8 - 8 -4 0 4
a, deg
(f) M = 1.10.
Figure 6.- Continued.
34
8
c2
c2
. 6
.4
. 2
0
-. 2
-.4
-.6 - -6
ifa;lillNote: C 2 results f r o m load on one
- 4 -2 0 2 4 6 8
a , deg
(g) M = 1.20.
n A 5
0 -5
-10 -15 -20
-4 - 2 0 2 4 6 8
a t deg
(h) M = 1.39.
Figure 6. - Continued.
35
. 6 one
. 4
. 2
0
-.2
-.4
-.6-8 -6 -4 -2 0 2 4 6 8
a, d e g
(i) M = 1.63. A 20 Q 10 A 5
. 6
.4
. 2
0
-.2
-.4
-.6 -8 -6 4 - 2 0 2 4 6 8
a, d e g
(j) M = 1.90.
Figure 6.- Continued.
36
.. ...
one
- 8
. 6
.4
. 2
0
-. 2
-.4
-.6 - 8
-6 - 4 - 2 0
(k) M = 2.30. A 20 0 10 A 5 0 0 v -5
-100 -15
-20
- 6 - 4 - 2 0 2 4 6 8
a, deg
(1) M = 2.96.
Figure 6.- Continued.
37
. 6 one
. 4
. 2
0
-.2
-.4
-.6 -8 -6 - 4 - 2 0 2 4 6 8
a, deg 6, deg (m) M = 3.95.
A 20 Q 10 A 5
. 6
. 4
. 2
0
-.2
-.4
-.6 - 8 - 6 - 4 - 2 0 2 4 6 8
a 7 deg
(n) M = 4.63.
Figure 6.- Concluded.
38
6
0 1 2 3 4 5
M
Figure 7.- Summary of roll control effectiveness of one fin t ip control.
39
-8 -4 0 4 8
deg
(a) M = 0.40.
n io A 50 0 v -5 w -100 -15 l7 -20
. 4
0'h
'.4 -8 - 4 0 4 8
a , deg
(b) M = 0.59.
Figure 8.- Enlarged fin t ip control hinge-moment coefficient. C$= Oo.
40
-8
.4
0
-.4 -8
-4 0 4 8
cy9 deg
( c ) M = 0.81.
n 10 A 50 0 V -5
-10B -15V -20
- 4 0 4 8
a, deg
(d) M = 0.90.
Figure 8.- Continued.
41
-8 -4 0 4 8
Q Y deg
(e ) M = 1.00.
a 10 5on 0
V - 5 s -10 -15
[7 -20
.4
0
-.4 -8 -4 0 4 8
deg
(f) M = 1.10.
Figure 8.- Continued.
42
.4
‘h 0
-.41 -8 -4 0 4 8
a, deg
(g) M = 1.20.
A 50 0 v -5-0 -100 -1517 -20
.4
0‘h
-.4 - -4 0 4 8
a, deg
(h) M = 1.39.
Figure 3.- Continued.
43
0‘h
-. -8
A 20 Q 10 A 5 0 0 v -5 CJ -100 -15 l 7 -20
‘h
-8 -4 0
ff, deg
(j) M = 1.90.
Figure 3.- Continued.
44
. 4
'h 0
-.4 -8 - 4 0 4 8
ff,deg
(k) M = 2.30.
d 20 Q 10 A 5 0 0 v - 5 0 -100 -15
-20
'h
- 8 -4 0 4 8
e, deg
(1) M = 2.96.
Figure 8.- Continued.
45
--
. 4
0 ‘h
-.4- 8 - 4 0 4
(m) M = 3.95.
. 4
‘h 0
. ^ -8 - 4 0 4
ff, deg
(n) M = 4.63.
Figure 8.- Concluded.
I l lII!I I!i I!11lliII}8
v - 5 c7 -100 -15 17 -20
46
I
.8 cN and C r e sult m
load on one pa ne1 tip) only
. 4
C 0 m
-.4
-. 8 45 D
. 6 D
. 4
. 2C N
0
-.2
-.4
-.6 - 8 -6 - 4 - 2 0 2 4 6 8
a, deg
Figure 9.- Stability and control character is t ics of fin at M = 1.00. @ = Oo and 45"; 6 = Oo and -loo.
47
Note : c L r e s u l t s f r o m load o n o n e
0 -10
- 8 - 4 0 4 8
a, deg
Figure 10.- Fin rolling-moment coefficient at M = 1.00. Cp = 0' and 45O; 6 = Oo and -loo.
48
. 4
0'h
-. 4 - 8 - 4 0 4 8
a, deg
Figure 11.- Enlarged fin t ip control hinge-moment coefficient at M = 1.00. C$= Oo and 45"; 6 = Oo and -loo.
49
... ...
.8 C r' e s iJlt m ne' Pa 11e1
. 4
C 0 m
-.4
-.8
. 6
. 4
. 2 cN
0
-.2
-. 4
-. 6 4 6 8
1 1 J 8 6 4 2 0 - 2 - 4 - 6 - 8
P , deg ( @ = 90°)
Figure 12.- Stability and control character is t ics of fin at M = 1.00 $I = Oo and 90°; 6 = -loo.
50
Note: c 2 r e su l t s f r o m load on one
. 8
. 4
0
-.4
-.8 -8
L 8
Figure 13.- Fin rolling-moment coefficient at M = 1.00. C#I = 0' and 90°; 6 = -loo.
5 1
. 4
'h 0
-.4
- 8 -4 0 4 8 - 9 degl ( 9 =0 ) 1 8 4 0 -4 - 8
P , deg ($= 90°)
Figure 14.- Enlarged fin t ip control hinge-moment coefficient at M = 1.00. 4 = Oo and 90'; 6 = -10'.
52 NASA-Langley, 1971 - 31 L-7680
- -
. NATIONAL AERONAUTICS AND SPACE ADMISTRATION WASHINGTON. D.C. 20546
POSTAGE AND FEES PAID-NATIONAL AERONAUTICS AND
OFFICIAL BUSINESS FIRST CLASS MAIL. SPACE ADMINISTRATION [S)PENALTY FOR PRIVATE USE 1300 USMAIL
.
011 007 C 1 U 3 1 710902 S00903DSD E P T OF THE A I R FORCE~~
AF SYSTEMS COMMAND AF WEAPONS LAB (WLOL) ATTN: E LO5J BOWPSAVS C H I E F TECH L I B R A R Y K I R T L A N D AFB W M 87117
If Undeliverable (Section 158 Postal Manual) Do Not Recur,
' T h e aeronautical and space activities of the United States shall be conducted so as to conlribute . . . to the expansion of human knowledge of phenqniena in the atmosphere and space. The Administration shall provide {or the widest prncticable and appropriate dissemination of information concerning its activities and the restilts thereof."
-NATIONALAERONAUTICSAND SPACE ACT OF. 1958 . i , . ,,,
y .; . NASA SCIENTIFIC .,'ANDTECHNICAL PUBLICATIONS, I
TECHNICAL REPORTS: Scient-ificand ' . '::
technical information' tonsidered importaqt, .._.\. complete, and a lasting 'cantribution to &&ing
knowledge. " . . . ..~
TECHNICAL NOTES: Information*lqs~,b~qad~ in scope but nevertheless of importance as:. ' , .,
contribution to existing knowledge. ..;
TECHNICAL MEMORANDUMS: Information receiving limited distribution because of preliminary data, security classification, or other reasons.
. . CONTRACTOR REPORTS: Scientifisand technical information generated under a NASA contract or grant and considered an important contribution to existing knowledge. ':
TECHNICAL TRANSLATIONS: Information published in a foreign language considered to merit NASA distribution in English.
SPECIAL PUBLICATIONS: Information .. &rived from or of value to NASA activities. Publications include conference prpceedings, monographs, data compilations, handbooks, sourcebFks, and special bibliographies.
TECHNOLOGY UTILIZATION PUBLICATIONS: Information on technology used by NASA that may be of particular interest in commercial and other non-aerospace applications. Publications include Tech Briefs, Technology Utilization Reports and Technology Surveys.
Details on the availability of these publications may be obtained from:
SCIENTIFIC AND TECHNICAL INFORMATION OFFICE
NATIONAL ~ ~ R O N A U T I C SAND SPACE ADMINISTRATION