statistica 10 featuresfinal - statsoft 10 features.pdf · statistica 10 makes it easier to publish...
TRANSCRIPT
VERSION 10: NEW FEATURES AND ENHANCEMENTS
STATISTICA 10 Copyright © StatSoft, 2011
STATISTICA 10 New Features and Enhancements
Table of Contents
PERFORMANCE................................................................................. 1
INTEGRATION and CONNECTIVITY.................................................... 1 SharePoint (All Products) ............................................................................................................. 1 Office 2010 (All Products) ........................................................................................................... 1 OLAP (All Products) .................................................................................................................... 2 STATISTICA PI Connector (Add-on Product)............................................................................... 3
DATA VISUALIZATION ...................................................................... 3 Overview................................................................................................................................... 3 Interactive Scaling .................................................................................................................... 4 Interactive Panning ................................................................................................................... 4 Transparency............................................................................................................................. 4 Reference Lines ........................................................................................................................ 5 Interactive Text Editing ............................................................................................................ 6
USER INTERFACE, ERGONOMICS...................................................... 6 Overview................................................................................................................................... 6 Ribbon Bars (All Products) .......................................................................................................... 6 Workspace Improvements (STATISTICA Data Miner/STATISTICA Text Miner) ................................. 6 STATISTICA Add-Ins on the Ribbon Bar (All Products) ............................................................. 7
STATISTICS...................................................................................... 7 Design Simulation (All Products except STATISTICA Base).............................................................. 7 Cox Proportional Hazards Models (All Products except STATISTICA Base).................................... 7
DATA MINING ................................................................................... 8 Profit Chart (STATISTICA Data Miner) .......................................................................................... 8 ROC Curve (STATISTICA Data Miner) .......................................................................................... 8 Text Mining (STATISTICA Text Miner) .......................................................................................... 8 Java and C# Deployment (STATISTICA Data Miner – In-Place Database Deployment) ........................ 9

VERSION 10: NEW FEATURES AND ENHANCEMENTS
STATISTICA 10 Copyright © StatSoft, 2011
STATISTICA ENTERPRISE................................................................. 9 Ribbon Bar ................................................................................................................................ 9 Data Configurations ................................................................................................................ 10 Database Migration................................................................................................................. 10 Publish Macros to STATISTICA Enterprise............................................................................ 10 Enterprise Configuration Names ............................................................................................ 10 STATISTICA Enterprise Server: Auto Updating Analysis Configuration Charts .................. 10 STATISTICA Enterprise Server: Quality Control Brushing ................................................... 11
STATISTICA MSPC Online (STATISTICA MSPC Online Product)..................... 11
STATISTICA Web Data Entry (STATISTICA Web Data Entry Product) ............ 12
STATISTICA Live Score (STATISTICA Live Score Product)............................ 12
STATISTICA Scorecard (STATISTICA Scorecard Product) ............................ 13
HELP and DOCUMENTATION (All Products) .......................................... 13 STATISTICA Object Model Examples.................................................................................... 13
VERSION 10: NEW FEATURES AND ENHANCEMENTS
STATISTICA 10 – 1 Copyright © StatSoft, 2011
STATISTICA 10
PERFORMANCE (All Products)
STATISTICA 10 features further, significant performance improvements achieved by automatically taking advantage of the 64-bit CPU technology (if available on the currently used hardware), as well as highly optimized multithreading. Many STATISTICA functions throughout data management and analyses (C&RT, CHAID, General Linear Models, etc.), which operated in a single thread mode in version 9, are now optimized using advanced multithreading technology so that they can take advantage of multiple cores or processors.
INTEGRATION and CONNECTIVITY
SharePoint (All Products)
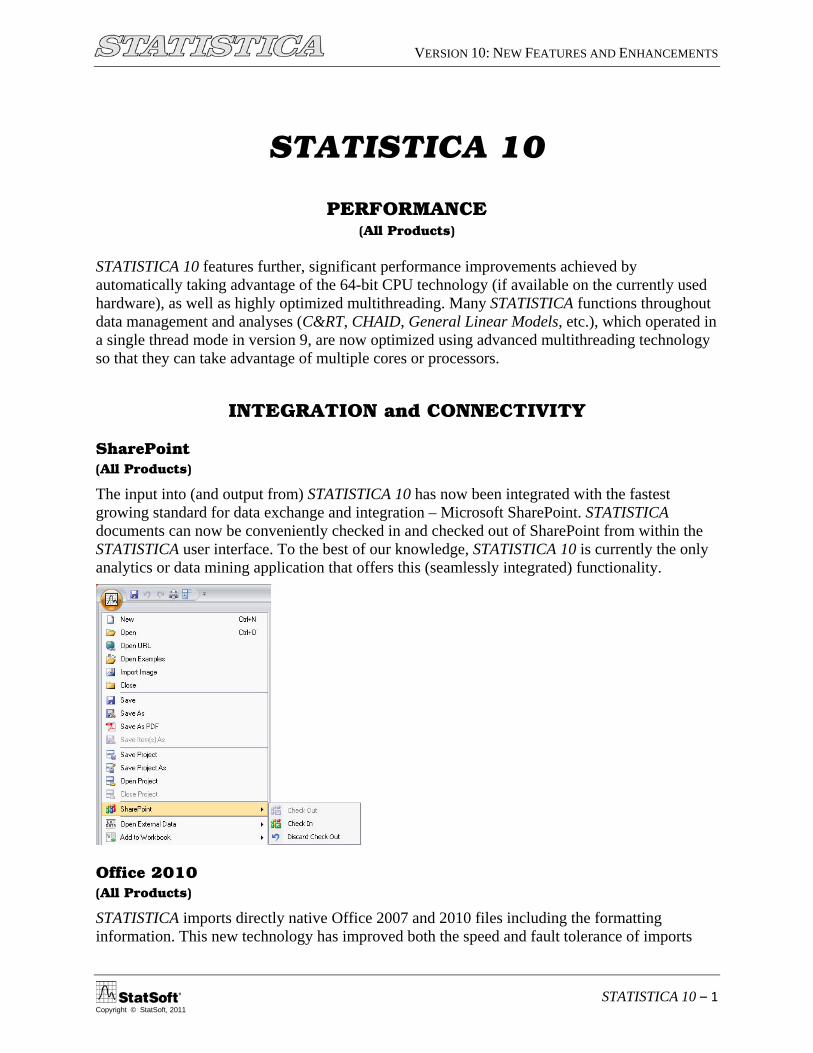
The input into (and output from) STATISTICA 10 has now been integrated with the fastest growing standard for data exchange and integration – Microsoft SharePoint. STATISTICA documents can now be conveniently checked in and checked out of SharePoint from within the STATISTICA user interface. To the best of our knowledge, STATISTICA 10 is currently the only analytics or data mining application that offers this (seamlessly integrated) functionality.
Office 2010 (All Products)
STATISTICA imports directly native Office 2007 and 2010 files including the formatting information. This new technology has improved both the speed and fault tolerance of imports
VERSION 10: NEW FEATURES AND ENHANCEMENTS
2 – STATISTICA 10 Copyright © StatSoft, 2011
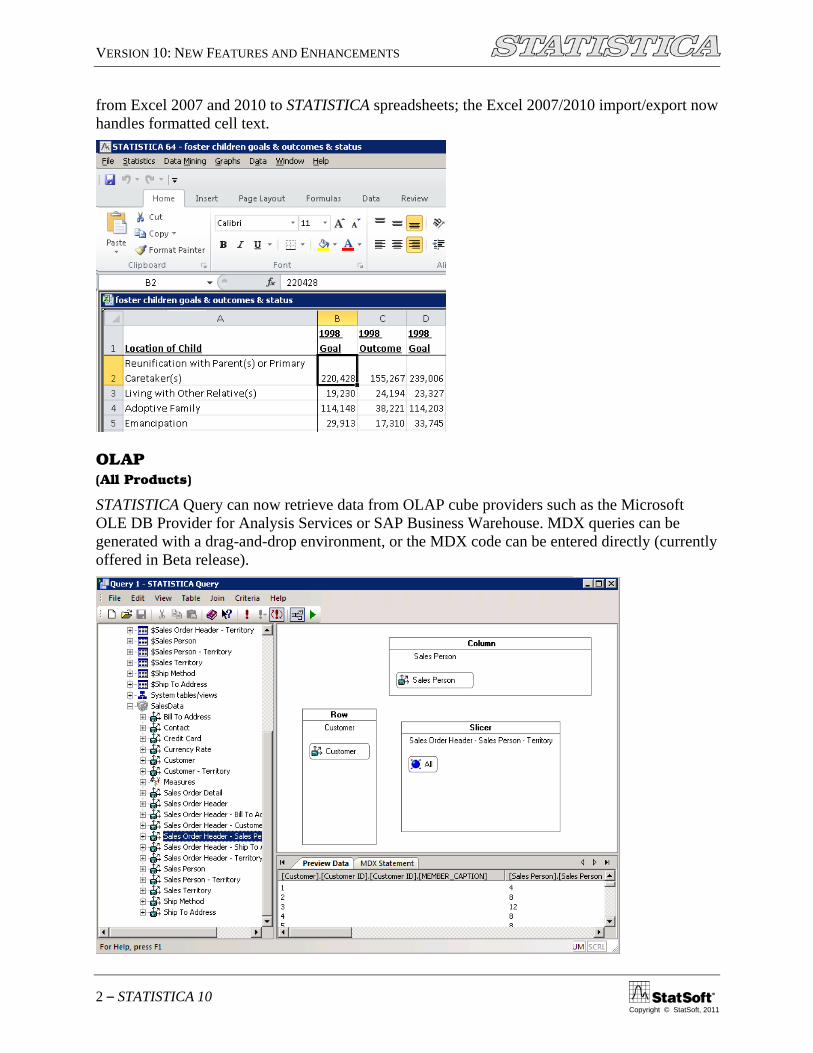
from Excel 2007 and 2010 to STATISTICA spreadsheets; the Excel 2007/2010 import/export now handles formatted cell text.
OLAP (All Products)
STATISTICA Query can now retrieve data from OLAP cube providers such as the Microsoft OLE DB Provider for Analysis Services or SAP Business Warehouse. MDX queries can be generated with a drag-and-drop environment, or the MDX code can be entered directly (currently offered in Beta release).

VERSION 10: NEW FEATURES AND ENHANCEMENTS
STATISTICA 10 – 3 Copyright © StatSoft, 2011
STATISTICA PI Connector (Add-on Product)
It is now easier to install and manage the STATISTICA PI Connector in STATISTICA 10; the PI connector is distributed as part of version 10, and a separate installer is no longer necessary.
DATA VISUALIZATION (All Products)
Overview
The STATISTICA Graph display technology has been substantially upgraded to automatically detect and take advantage of the high-performance hardware acceleration, which is now available not only in the high-end, but also in many mid-range video display controllers available in both desktop and laptop computer workstations.
The resulting output is not only generated faster, but also supports more advanced smoothing and gradient display options. All STATISTICA Graphs have been enhanced with improved appearance, thanks to the new gradient/fill colors and smoother line display procedures (curves, surfaces).
Also, all STATISTICA Graph windows (both stand-alone and integrated into workbooks) now feature interactive graphics controls (a bar with sliders and other controls placed at the bottom of the graph window), which enable you to interactively adjust these new display features. The benefits include not only a vastly improved appearance of all graphs, but also new analytic and exploratory options, such as tools to reveal hidden trends by gradually desaturating dense displays and to rotate 3D graphs vertically and horizontally.
VERSION 10: NEW FEATURES AND ENHANCEMENTS
4 – STATISTICA 10 Copyright © StatSoft, 2011
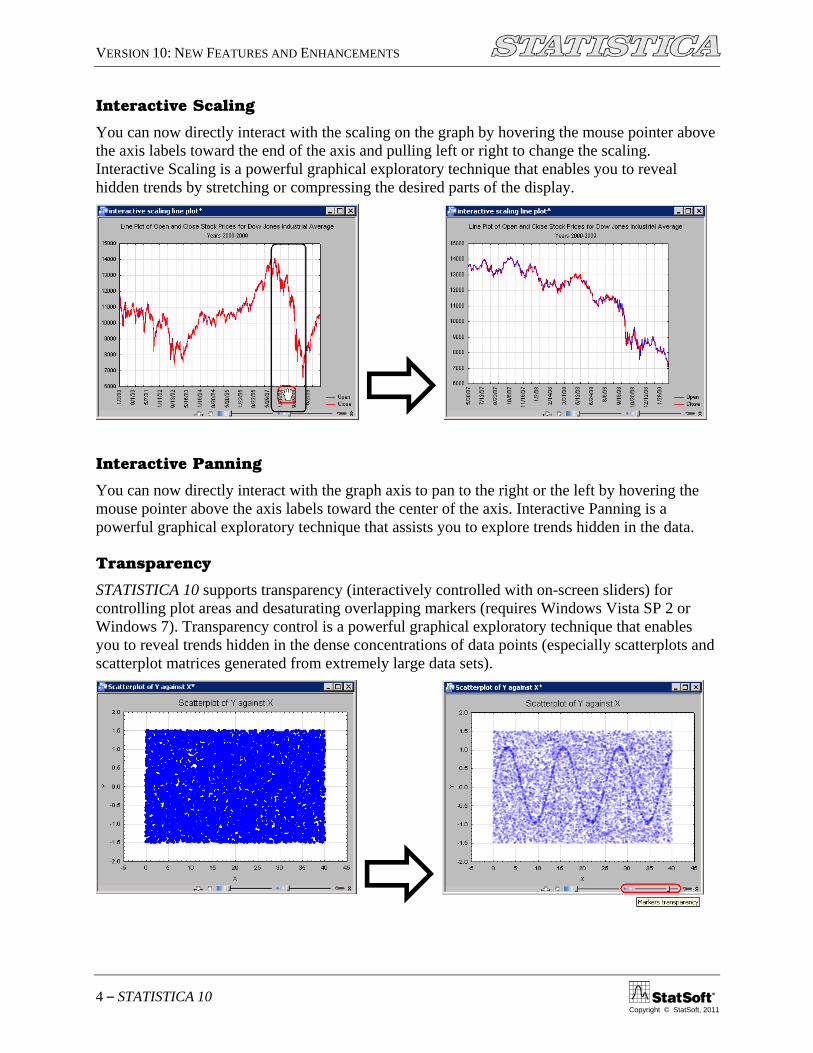
Interactive Scaling
You can now directly interact with the scaling on the graph by hovering the mouse pointer above the axis labels toward the end of the axis and pulling left or right to change the scaling. Interactive Scaling is a powerful graphical exploratory technique that enables you to reveal hidden trends by stretching or compressing the desired parts of the display.
Interactive Panning
You can now directly interact with the graph axis to pan to the right or the left by hovering the mouse pointer above the axis labels toward the center of the axis. Interactive Panning is a powerful graphical exploratory technique that assists you to explore trends hidden in the data.
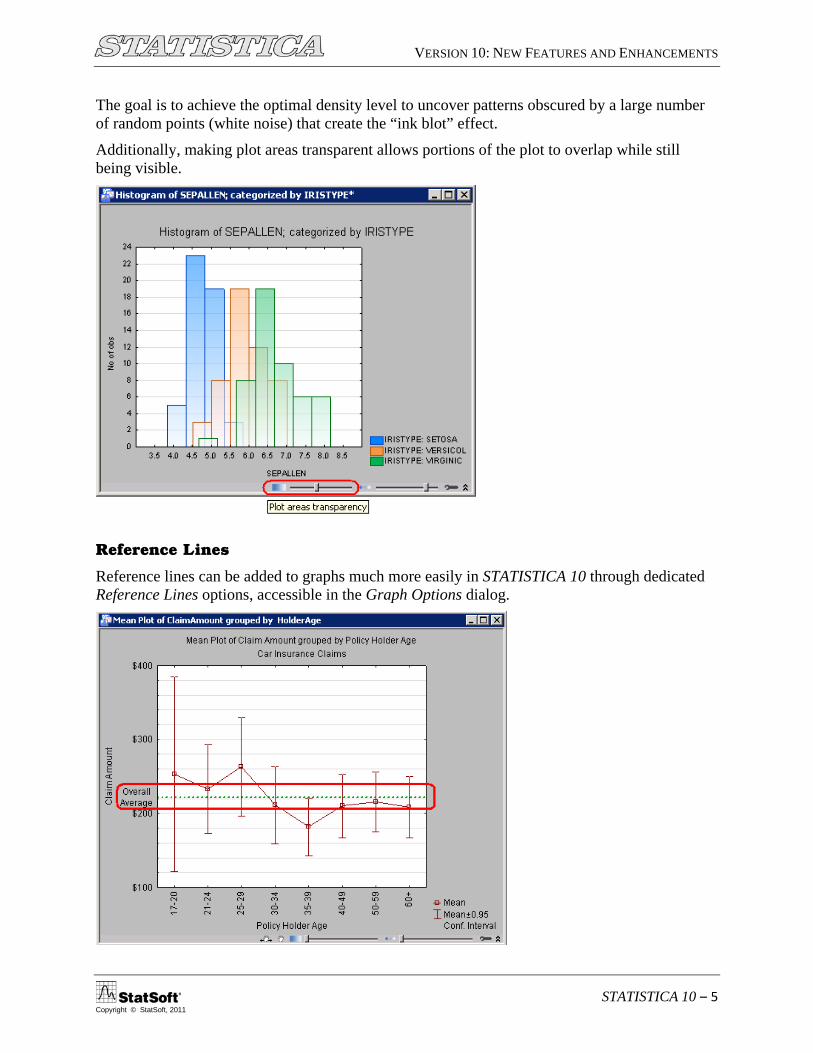
Transparency
STATISTICA 10 supports transparency (interactively controlled with on-screen sliders) for controlling plot areas and desaturating overlapping markers (requires Windows Vista SP 2 or Windows 7). Transparency control is a powerful graphical exploratory technique that enables you to reveal trends hidden in the dense concentrations of data points (especially scatterplots and scatterplot matrices generated from extremely large data sets).
VERSION 10: NEW FEATURES AND ENHANCEMENTS
STATISTICA 10 – 5 Copyright © StatSoft, 2011
The goal is to achieve the optimal density level to uncover patterns obscured by a large number of random points (white noise) that create the “ink blot” effect.
Additionally, making plot areas transparent allows portions of the plot to overlap while still being visible.
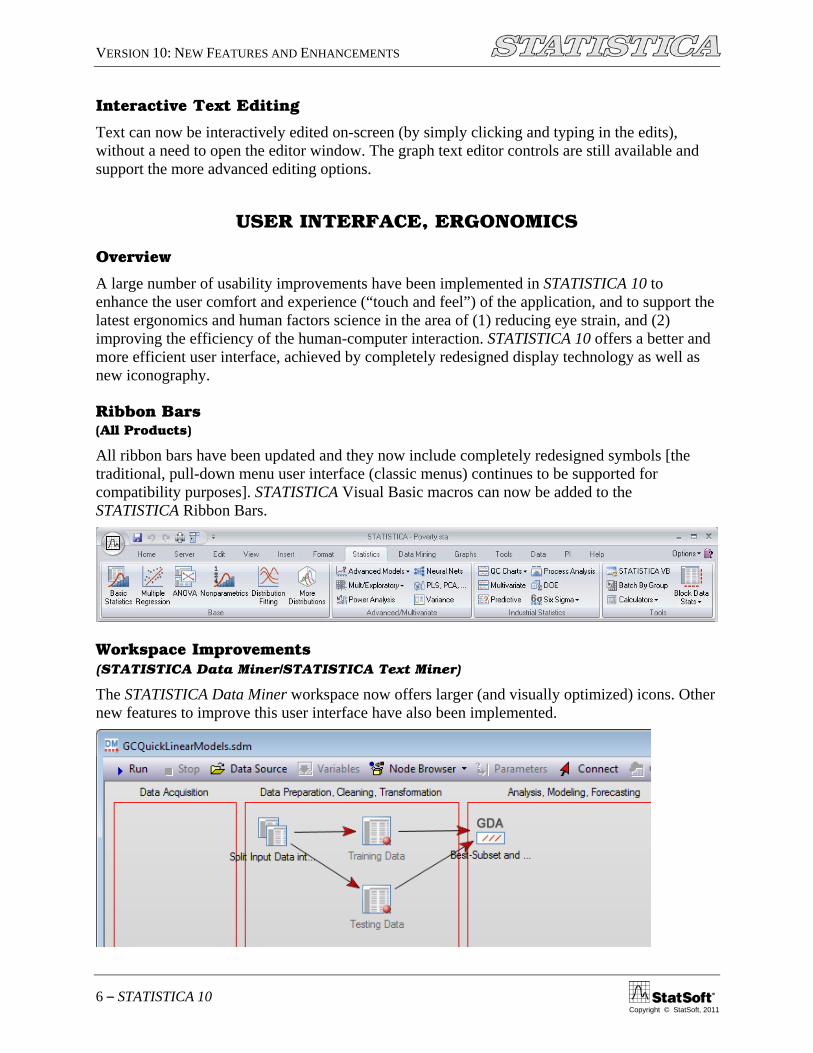
Reference Lines
Reference lines can be added to graphs much more easily in STATISTICA 10 through dedicated Reference Lines options, accessible in the Graph Options dialog.
VERSION 10: NEW FEATURES AND ENHANCEMENTS
6 – STATISTICA 10 Copyright © StatSoft, 2011
Interactive Text Editing
Text can now be interactively edited on-screen (by simply clicking and typing in the edits), without a need to open the editor window. The graph text editor controls are still available and support the more advanced editing options.
USER INTERFACE, ERGONOMICS
Overview
A large number of usability improvements have been implemented in STATISTICA 10 to enhance the user comfort and experience (“touch and feel”) of the application, and to support the latest ergonomics and human factors science in the area of (1) reducing eye strain, and (2) improving the efficiency of the human-computer interaction. STATISTICA 10 offers a better and more efficient user interface, achieved by completely redesigned display technology as well as new iconography.
Ribbon Bars (All Products)
All ribbon bars have been updated and they now include completely redesigned symbols [the traditional, pull-down menu user interface (classic menus) continues to be supported for compatibility purposes]. STATISTICA Visual Basic macros can now be added to the STATISTICA Ribbon Bars.
Workspace Improvements (STATISTICA Data Miner/STATISTICA Text Miner)
The STATISTICA Data Miner workspace now offers larger (and visually optimized) icons. Other new features to improve this user interface have also been implemented.
VERSION 10: NEW FEATURES AND ENHANCEMENTS
STATISTICA 10 – 7 Copyright © StatSoft, 2011
STATISTICA Add-Ins on the Ribbon Bar (All Products)
The STATISTICA Ribbon Bar can now be programmatically controlled. Developers can now customize the ribbon bar through API (Application Programming Interface) calls. This is particularly useful for creating STATISTICA Add-Ins.
STATISTICS
Design Simulation (All Products except STATISTICA Base)
STATISTICA 10 makes it easier to simulate data from a specific distribution with Design Simulation in the Distributions & Simulation module.
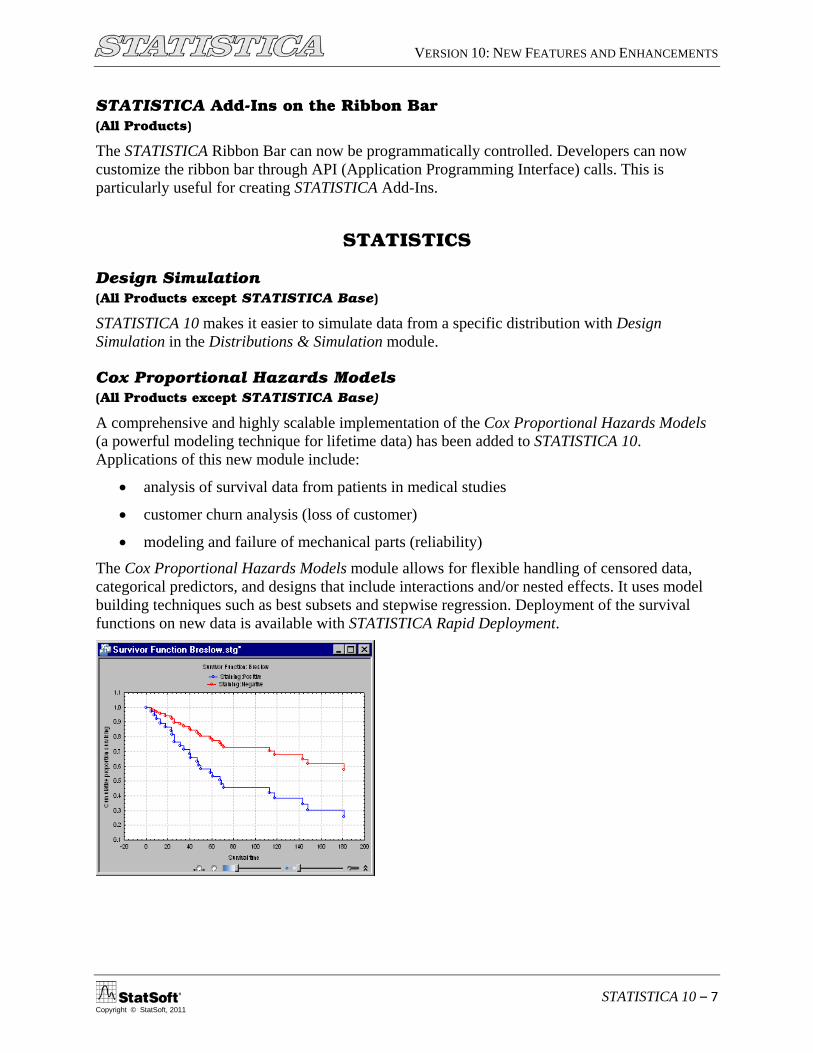
Cox Proportional Hazards Models (All Products except STATISTICA Base)
A comprehensive and highly scalable implementation of the Cox Proportional Hazards Models (a powerful modeling technique for lifetime data) has been added to STATISTICA 10. Applications of this new module include:
• analysis of survival data from patients in medical studies
• customer churn analysis (loss of customer)
• modeling and failure of mechanical parts (reliability)
The Cox Proportional Hazards Models module allows for flexible handling of censored data, categorical predictors, and designs that include interactions and/or nested effects. It uses model building techniques such as best subsets and stepwise regression. Deployment of the survival functions on new data is available with STATISTICA Rapid Deployment.

VERSION 10: NEW FEATURES AND ENHANCEMENTS
8 – STATISTICA 10 Copyright © StatSoft, 2011
DATA MINING
Profit Chart (STATISTICA Data Miner)
Profit charts can now be created with STATISTICA’s Rapid Deployment of Predictive Models. The profit chart summarizes the costs and the estimated profit for the current model, and can be used in a wide variety of data mining application as one of the tools to evaluate the models.
ROC Curve (STATISTICA Data Miner)
ROC curves can now be created with STATISTICA’s Rapid Deployment of Predictive Models. It is another useful tool to evaluate the quality of models by visualizing the “true” positive versus the “false” positive rate. It is useful in many different fields such as medicine, quality control, and psychology.
Side note: Interestingly, the ROC curve method has its roots in early days of radar technology, when it was used during World War II. Radar operators were evaluated on their ability to find “true” signals (airplanes) versus the “false” signals (birds). ROC curves are used today in data mining for similar reasons.
Text Mining (STATISTICA Text Miner)
In response to the recent trends in text mining, where enormously large data sets are being submitted for exploration and modeling, the main computational engine of STATISTICA Text Miner has been substantially redesigned and further optimized to improve its scalability and performance. The internal database handling procedures have been redesigned and the module can now handle extremely large data set very efficiently by extensive use of multithreading.
VERSION 10: NEW FEATURES AND ENHANCEMENTS
STATISTICA 10 – 9 Copyright © StatSoft, 2011
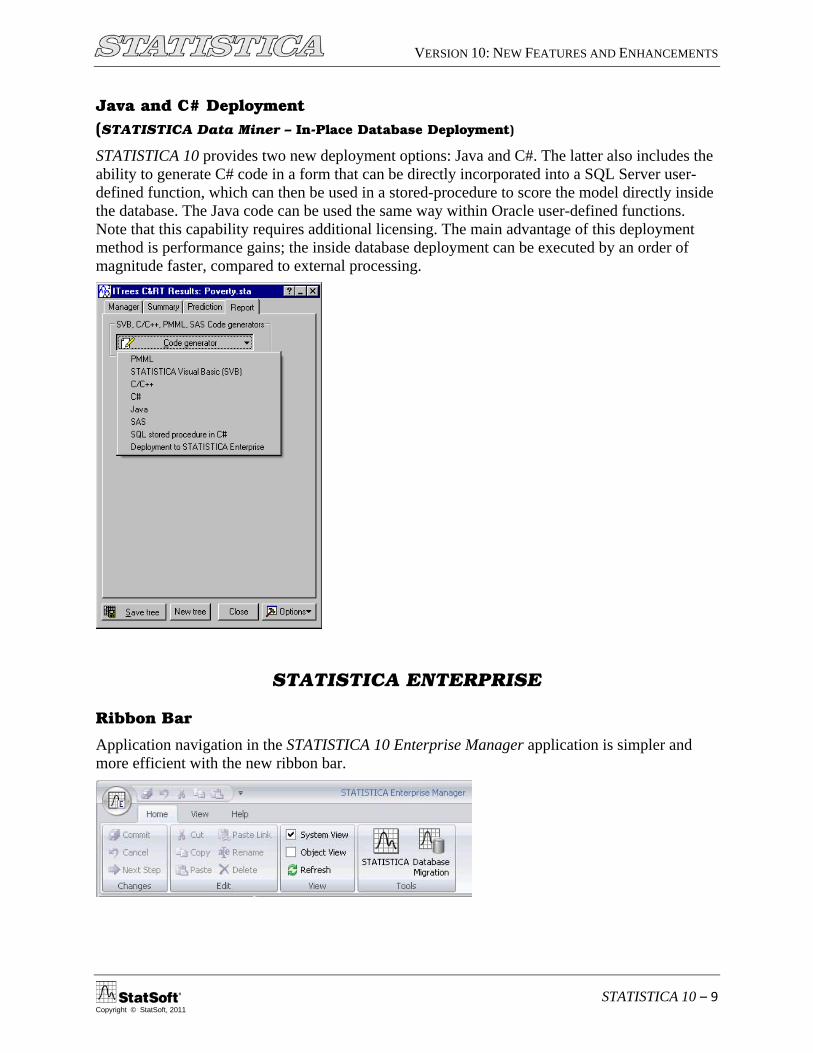
Java and C# Deployment (STATISTICA Data Miner – In-Place Database Deployment)
STATISTICA 10 provides two new deployment options: Java and C#. The latter also includes the ability to generate C# code in a form that can be directly incorporated into a SQL Server user-defined function, which can then be used in a stored-procedure to score the model directly inside the database. The Java code can be used the same way within Oracle user-defined functions. Note that this capability requires additional licensing. The main advantage of this deployment method is performance gains; the inside database deployment can be executed by an order of magnitude faster, compared to external processing.
STATISTICA ENTERPRISE
Ribbon Bar
Application navigation in the STATISTICA 10 Enterprise Manager application is simpler and more efficient with the new ribbon bar.
VERSION 10: NEW FEATURES AND ENHANCEMENTS
10 – STATISTICA 10 Copyright © StatSoft, 2011
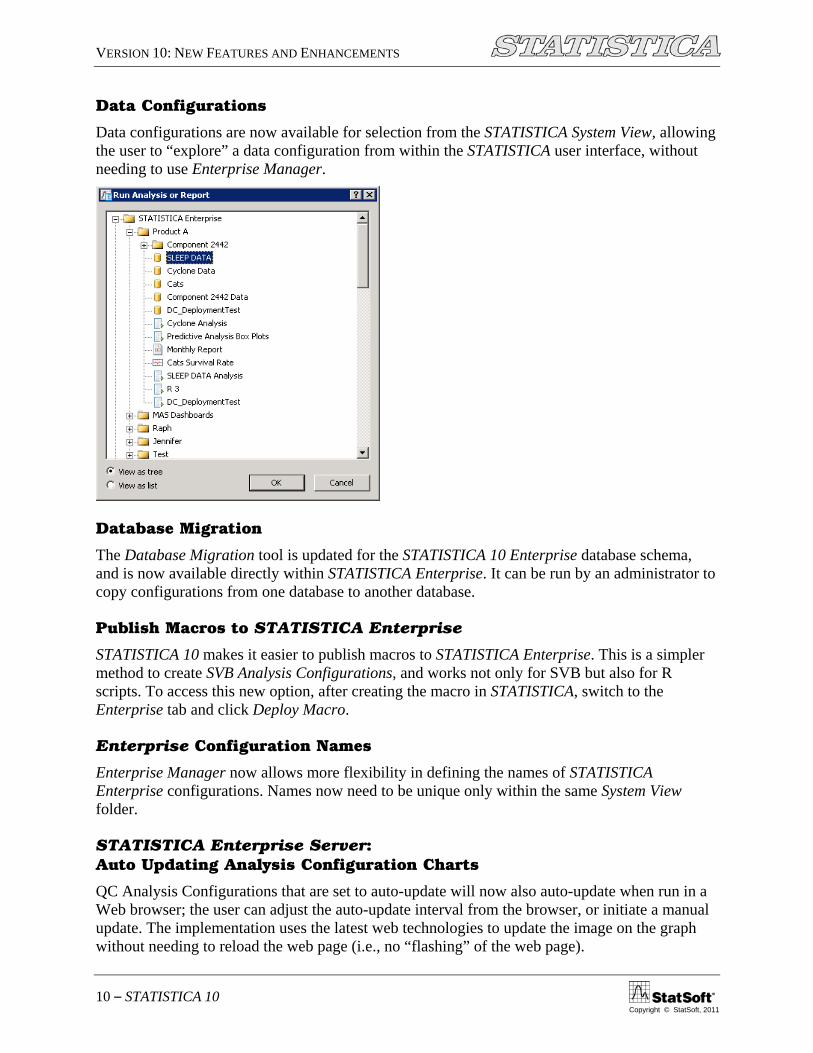
Data Configurations
Data configurations are now available for selection from the STATISTICA System View, allowing the user to “explore” a data configuration from within the STATISTICA user interface, without needing to use Enterprise Manager.
Database Migration
The Database Migration tool is updated for the STATISTICA 10 Enterprise database schema, and is now available directly within STATISTICA Enterprise. It can be run by an administrator to copy configurations from one database to another database.
Publish Macros to STATISTICA Enterprise
STATISTICA 10 makes it easier to publish macros to STATISTICA Enterprise. This is a simpler method to create SVB Analysis Configurations, and works not only for SVB but also for R scripts. To access this new option, after creating the macro in STATISTICA, switch to the Enterprise tab and click Deploy Macro.
Enterprise Configuration Names
Enterprise Manager now allows more flexibility in defining the names of STATISTICA Enterprise configurations. Names now need to be unique only within the same System View folder.
STATISTICA Enterprise Server: Auto Updating Analysis Configuration Charts
QC Analysis Configurations that are set to auto-update will now also auto-update when run in a Web browser; the user can adjust the auto-update interval from the browser, or initiate a manual update. The implementation uses the latest web technologies to update the image on the graph without needing to reload the web page (i.e., no “flashing” of the web page).
VERSION 10: NEW FEATURES AND ENHANCEMENTS
STATISTICA 10 – 11 Copyright © StatSoft, 2011
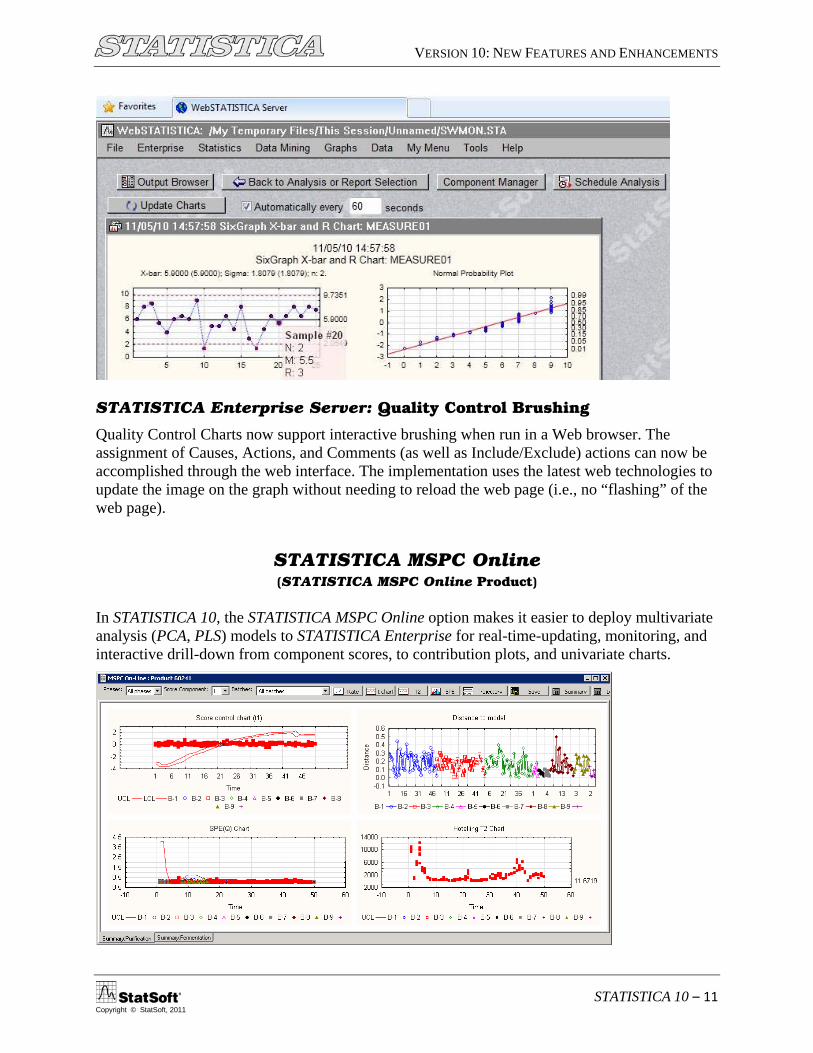
STATISTICA Enterprise Server: Quality Control Brushing
Quality Control Charts now support interactive brushing when run in a Web browser. The assignment of Causes, Actions, and Comments (as well as Include/Exclude) actions can now be accomplished through the web interface. The implementation uses the latest web technologies to update the image on the graph without needing to reload the web page (i.e., no “flashing” of the web page).
STATISTICA MSPC Online (STATISTICA MSPC Online Product)
In STATISTICA 10, the STATISTICA MSPC Online option makes it easier to deploy multivariate analysis (PCA, PLS) models to STATISTICA Enterprise for real-time-updating, monitoring, and interactive drill-down from component scores, to contribution plots, and univariate charts.

VERSION 10: NEW FEATURES AND ENHANCEMENTS
12 – STATISTICA 10 Copyright © StatSoft, 2011
STATISTICA Web Data Entry (STATISTICA Web Data Entry Product)
STATISTICA Web Data Entry enables users to define data entry screens for entering data via Web browsers and storing/managing these data in the STATISTICA Enterprise database.
STATISTICA 10 Web Data Entry includes numerous enhancements, such as:
• Easy to configure “required fields” • Improved navigation • Option to organize the fields into sections for easier data entry • Option to search historical samples using any Sample Label • Improved options for querying the data for use in analyses
STATISTICA Live Score (STATISTICA Live Score Product)
A new and improved version of STATISTICA Live Score is released with STATISTICA 10. STATISTICA Live Score is STATISTICA Server software within the STATISTICA Data Analysis and Data Mining Platform. Data are aggregated and cleaned and models are trained and validated using the STATISTICA Data Miner software. Once the models are validated, they are deployed to the STATISTICA Live Score Server. STATISTICA Live Score provides multi-threaded, efficient, and platform-independent scoring of data from line-of-business applications. Some examples of the use of STATISTICA Live Score include:
• Enabling credit scorecards to customer service applications (e.g., call center systems and Web-based applications)
• Enabling customer segmentation, up-sell-cross-sell, and customer churn identification to customer service and marketing representatives
• Enabling proactive fraud detection alerts to analysts
VERSION 10: NEW FEATURES AND ENHANCEMENTS
STATISTICA 10 – 13 Copyright © StatSoft, 2011
STATISTICA Scorecard (STATISTICA Scorecard Product)
STATISTICA Scorecard is a dedicated solution for development, evaluating, and monitoring Scorecards including steps for Feature Selection, Attribute Building, Scorecard Building, Cutoff Point Selection, Reject Inference, and Population Stability.
HELP and DOCUMENTATION (All Products)
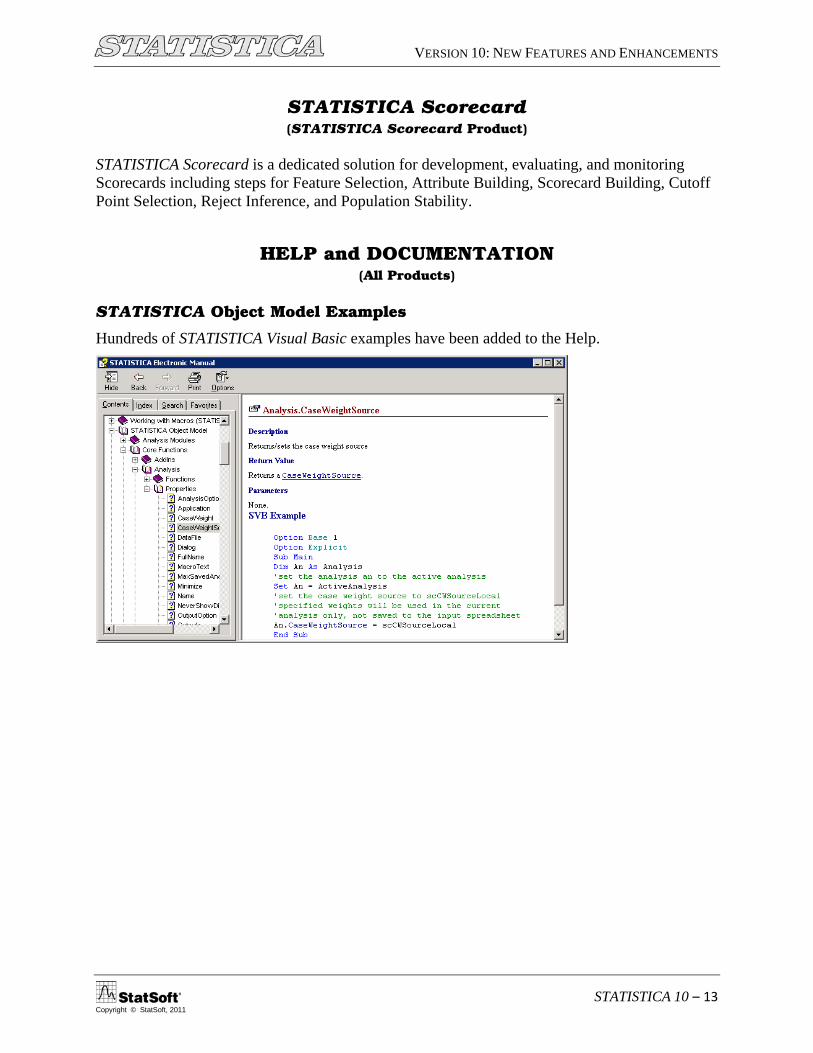
STATISTICA Object Model Examples
Hundreds of STATISTICA Visual Basic examples have been added to the Help.