statistical analysis of 5 year continuous radio flare …
TRANSCRIPT

STATISTICAL ANALYSIS OF 5 YEAR CONTINUOUS RADIO FLARE DATA FROM � PERSEI,V711 TAURI, � LIBRAE, AND UX ARIETIS
Mercedes T. Richards1
Department of Astronomy andAstrophysics, Pennsylvania State University, 525Davey Lab, University Park, PA 16802-6305;[email protected]
Elizabeth B.Waltman
Naval Research Laboratory, Code 7214, 4555 OverlookAvenue SW,Washington, DC 20375-5351, retired;[email protected]
Frank D. Ghigo
National Radio AstronomyObservatory, P.O. Box 2, Green Bank,WV 24944; [email protected]
and
Donald St. P. Richards
Department of Statistics, Pennsylvania State University, 326 Thomas Building, University Park, PA 16802;[email protected]
Received 2002 July 6; accepted 2003 April 15
ABSTRACT
We report on the longest-running continuous radio flare survey of two Algol-type systems (� Per and� Lib) and two RS CVn systems (V711 Tau and UXAri). All four systems have late-type components, and allwere known to display radio flaring activity. The primary aim of the campaign was to determine the time-scales for flaring activity in these systems. The radio continuum flux at 2.3 and 8.3 GHz was monitored withthe NRAO–Green Bank Interferometer from 1995 January to 2000 October. The survey spanned 2096 dayswith interruptions during maintenance runs and temporary closings of the interferometer.Many strong flareswere detected with continuum fluxes at 8.3 GHz as high as 1.17 Jy in � Per, 1.44 Jy in V711 Tau, and 0.82 Jyin UX Ari. Only two flares were detected from � Lib during 1123 days of monitoring, and the continuum fluxreached a maximum of only 0.034 Jy at 8.3 GHz. The independent techniques of Power Spectrum Analysisand Phase Dispersion Minimization were used to determine the periodicity of flaring activity in each binary.The strongest periodicities found were 48:9� 1:7 days for � Per, 120:7� 3:4 days for V711 Tau, and141:4� 4:5 days for UX Ari, with other significant periodicities of 80:8� 2:5 days for V711 Tau and52:6� 0:7 days for UX Ari. In the case of � Lib, the strongest periodicities were related to the duration of thetwo monitoring cycles within the data set and are not real. The continuous survey has demonstrated thatthere are active and quiescent flaring cycles in V711 Tau and � Per. During both of these cycles, � Per hadmore flares than V711 Tau, but its strongest flares were typically weaker than those of V711 Tau.
Subject headings: binaries: close — radio continuum: stars — stars: activity — stars: coronae —stars: flare — stars: individual (V711 Tauri, HR 1099, � Persei, Algol,� Librae, UXArietis)
1. INTRODUCTION
The long-term radio flare survey described in this paperwas originally proposed to identify the timescales of flaringactivity in a sample of Algol-type and RS CVn close binarysystems. Such timescales are of interest because they can beassociated with long-term activity cycles on the Sun such asthe 11.1 yr Schwabe cycle of sunspot numbers, the 22 yrHale cycle of changes in magnetic polarity, the 80–90 yrGleissberg cycle, and the 200 yr cycle of variability in sun-spot activity (Baliunas & Vaughan 1985; Damon & Sonett1991). In the case of flares, Mouradian & Soru-Escaut(1995) found an 11 yr cycle for major flares and an 80 yrcycle for subflares on the Sun.
The primary aim of our survey was to derive reliable esti-mates of the flaring timescales of stars from data collectedcontinuously over a long baseline. Data collected non-continuously would produce larger errors because of the
uncertainty produced by the gaps in the data coverage.Simultaneous radio continuum fluxes were collected at twofrequencies (2.3 and 8.3 GHz), and our 5 yr survey produced14,959 observations of four systems at each frequency. Itrepresents the longest and most extensive survey of theAlgol and RS CVn classes of magnetically active binaries.The nearly 30,000 new observations analyzed in this paperrepresent the average of the left and right circular polariza-tions at each of two wavelengths. A complete polarizationstudy will be discussed in a separate paper since it involvesthe analysis of almost 60,000 observations and would be farmore extensive than the present work. The focus of this firstpaper is the periodogram analysis since that was the primaryaim of the survey.
A flare is an enormous explosion on a star initiated by acatastrophic release of magnetic energy that leads to particleacceleration and electromagnetic radiation. A thoroughreview of this phenomenon is given by Haisch, Strong, &Rodono (1991). Our close-up observations of the Sun dem-onstrate that a flare is the most spectacular component ofsolar magnetic activity (Wilson 1994). Solar flares can be
1 Guest Investigator, NRAO–Green Bank Observatory. NRAO isoperated by AURA, Inc., under cooperative agreement with the NSF.
The Astrophysical Journal Supplement Series, 147:337–361, 2003 August
# 2003. The American Astronomical Society. All rights reserved. Printed in U.S.A.
337

detected over the full range of wavelengths from gammarays to kilometer-wavelength radio emission, but radioemission currently provides the only unambiguous diagnos-tic of particle acceleration in stellar flares. Stellar radio flareemission can be explained by two processes: (i) gyrosynch-rotron emission of mildly relativistic electrons and (ii)coherent emission by instabilities of nonthermal electrons(Benz 1995). The first process is characterized by a broadbandwidth, relatively slow temporal variations, and lowpolarization, while the latter usually has rapid variationsand high circular polarization. Flares usually begin with amassive burst of energy and then decay slowly as the gascools. The light curve of a solar flare typically has threephases (Priest 1995): the ‘‘ preflare phase,’’ the ‘‘ rise phase ’’or eruption phase, and the ‘‘main phase ’’ during which theintensity declines slowly. On the Sun, the first phase lasts forabout 30 minutes, the middle phase lasts from 5 to 60minutes, and the final phase can last from 1 hour to 2 daysat H� or in soft X-rays. The typical energy in a solar flare is1032 ergs, while flares in close binary systems can be asenergetic as 1037 ergs (Kurster 1994).
Radio emission from interacting binaries was firstdetected byWade &Hjellming (1971) in � Per (Algol). Sincethat time, there have been several long-term (i.e., 1 month to5 yr) campaigns to monitor the secular behavior of radioflaring activity from Algol-type and RS CVn binaries. Oursurvey was the first one in which the targets were monitoredcontinuously for many orbital cycles. The surveys that aresimilar to our study include the (i) Gibson (1976) study ofeight Algols and RS CVn binaries, including � Per, b Per,UX Ari, and Ar Lac, at 2.7 and 8.1 GHz with the NRAOGreen Bank Interferometer (GBI) from 1971 to 1975; (ii)Trigilio, Umana, &Migenes (1993) and Umana et al. (1995)studies of V711 Tau at 4.9 GHz with the NOTO VLBI sta-tion from 1990 to 1993; (iii) Trigilio, Leto, & Umana (1998)study of UX Ari at 4.9 GHz with the NOTO VLBI stationfor almost 40 days in January 1993; and (iv) Massi et al.(1998) study of UX Ari at frequencies from 1.4 to 43 GHzwith the Effelsberg 100 m telescope over 965 days from 1992to 1995 (269 observations). This latter study identified activ-ity cycles in UX Ari of 25.5 and 158 days, which could be
equivalent to the 11 and 90 yr solar activity cycles. In con-trast, our longest continuous coverage of UX Ari lasted for968 days from 1997 to 2000, and 2473 observations werecollected. So, our continuous coverage produced more than9 times the number of observations analyzed by Massi et al.(1998), and hence should produce results that are more reli-able. We have used the same two period-finding techniquesused by Massi et al. (1998) to identify activity cycles inUXAri.
The systems monitored in our long-term continuous sur-vey were � Per (Algol, HD 19356), V711 Tau (HR 1099, HD22468), � Lib (HD 132742), and UX Ari (HD 21242). Theirproperties are listed in Table 1, and the geometry of thebinaries is illustrated in Figure 1. By coincidence, all foursystems are triple systems that contain an interacting binarywith a third star, the tertiary, orbiting the inner pair. Thetertiary is not expected to contribute to the flaring activityof the system since its rotational velocity was not increasedby tidal interactions like its companions in the binary. Both� Per and � Lib are classified as Algol-type binaries, whileV711 Tau and UX Ari are RS CVn binaries. The Algols aresemidetached binaries containing a late-type star that is los-ing mass by Roche lobe overflow, while the RS CVns aredetached systems containing two magnetically active stars.Algol binaries contain a hot B to A main-sequence star witha cool F–K subgiant or giant companion. The RS CVnbinaries contain F–G hotter stars with cooler K-type com-panions; both stars are magnetically active but the K star isthe brighter and more active component. The similaritiesbetween the magnetic properties of the cool stars in theAlgols and RS CVn binaries has been discussed by Hall(1989), Richards (1990), and Richards &Albright (1993).
V711 Tau and � Per were selected for our study becausethey were known to have strong radio emission. The non-eclipsing, detached system, V711 Tau, is a well-studiedmember of the RS CVn binaries and contains a K1 IV pri-mary (the more massive star) and a G5 IV secondary (Fekel1983). The eclipsing, semidetached system called � Per is theprototype of the Algols and has been observed extensivelyin every wavelength band; probably more than any otherinteracting binary. This system contains a close binary with
TABLE 1
Properties of V711 Tau, � Per, � Lib, and UX Ari
Property � Per V711 Tau � Lib UXAri
Binary class.................................... Algol-type RSCVn Algol-type RS CVn
HDnumber ................................... 19356 22468 132742 21242
Spectral types:
Primary ...................................... B8 V (7) K1 IV (5) B9.5 V (11) K0 IV (2)
Secondary .................................. K2 IV (7) G5 IV (5) G1 IV G5 V (2)
Tertiary ...................................... F1 IV (7) ADS 2644 (5) G9 V (11) K5 (3)
Porb (days)...................................... 2.867315 (9) 2.83774 (5) 2.327361 (11) 6.43791 (2)
HJDmin. (1995–2000) ................... 2441598.608 (9) 2442766.080 (5) 2442520.834 (11) 2440133.766 (2)
Distance (pc).................................. 28.5� 0.8 (4) 29.0� 0.7 (4) 93� 9 (4) 50� 3 (4)
Mass ratio, q ¼ Ms=Mp ................. 0.22 1.27 0.35 (10) 1.2 (3)
Orbital inclination, i (deg) .............. 81.4� 0.2 (8) 33� 2 (5) 78.6� 0.2 (6) 59.2� 3.3 (3)
Separation (106 km) ....................... 9.77 8.0 (1) 9.57 15.0
Separation (R�) ............................. 14.0 11.5 13.7 32.0
Stellar radius (R�).......................... 2.9, 3.5 (7) 3.9, 1.3 (5) 4.1, 4.2 (10) 5.78, 1.11 (3)
References.—(1) Bopp & Fekel 1976; (2) Carlos & Popper 1971; (3) Duemmler & Aarum 2001; (4) ESA 1997;(5) Fekel 1983; (6) Koch 1962; (7) Richards 1993; (8) Richards et al. 1988; (9) S&T 1993, 86, 79; (10) Tomkin 1978;(11)Worek 2001.
338 RICHARDS ET AL. Vol. 147

a B8 V primary and a K2 IV secondary, as well as an F1 Vtertiary component (Richards 1993). V711 Tau is the closestRS CVn binary and � Per is the closest Algol binary to theSun; with distances of 28.5 and 29.0 pc, respectively (seeTable 1). In addition, � Per and V711 Tau contain a mag-netically active cool K subgiant star, and they have similarorbital periods (2.8–2.9 days). The magnetic activitydetected from these two binaries should also be similar sincethese binaries are synchronized and magnetic activity is cor-related with stellar rotation and age (Skumanich 1972;Noyes, Weiss, & Vaughan 1984; Baliunas & Vaughan 1985;Simon 1990; Haisch & Schmitt 1996). However, the domi-nant source of magnetic activity in an RS CVn binary is theK-type primary, while, in the Algol binaries, the cool secon-dary star is the only member of the binary that is magneti-cally active. Moreover, the K star in � Per is losing mass toits companion by Roche-lobe overflow, while the K star inV711 Tau does not fill its Roche lobe.
The RS CVn binary of UX Ari was chosen because, likeV711 Tau, flaring activity in this system has been docu-mented for several decades. In these studies, both UX Ariand V711 Tau have been characterized as ‘‘ active systems ’’because they exhibit strong flares at X-ray, ultraviolet, andradio wavelengths (Torricelli-Ciamponi et al. 1998). Thetwo binaries have similar components: V711 Tau containsstars of spectral type G5 IV and K1 IV, while those of UXAri are G5 V and K0 IV (Fekel 1983; Carlos & Popper1971). The K star is the more active companion in both sys-tems. The main differences are that V711 Tau has a shorterorbital period than UX Ari (2.84 days vs. 6.44 days), andV711 Tau is closer than UX Ari (29 pc vs. 50 pc). Of thetwo, V711 Tau should be more active since activity is corre-lated with rotation, and it should have more intense flaressince it is closer to the Sun. The classical Algols have notbeen considered to be as active as the RS CVn binaries even
though they contain cool stars that are similar to the moreactive component in the RS CVn binaries. However, studiesof radio flares from Algol systems have shown that theyhave flares that are comparable to those detected from RSCVn binaries (Gibson 1976; Umana, Catalano, & Rodono1991; Umana, Trigilio, & Catalano 1998). The Algol-typesystem of � Lib has binary components of spectral type B9.5V and G1 IV, with a G9 V tertiary (Worek 2001). It wasincluded in the survey because of its close distance (93 pc).
The main reason for pursuing a long-term radio flare sur-vey was to identify the long-term flaring rates for activebinaries like � Per and V711 Tau. It was challenging toderive these rates to any satisfactory level because such asurvey required the use of a dedicated telescope for severalyears. We were also driven by the need to understand thecomplex process of mass transfer in Algol-type binaries asestablished through Doppler tomography. This techniquewas originally used to make reconstructed images of accre-tion disks in cataclysmic variables (Marsh & Horne 1988;Robinson, Marsh, & Smak 1993; Kaitchuck et al. 1994).However, multiple sources of H� emission were identified inthe tomograms of the Algols. These include a gas streamdue to Roche lobe overflow, accretion regions (accretionannulus or disk) around the mass gaining star, and the chro-mosphere of the mass-losing secondary star (Richards,Albright, & Bowles 1995; Richards, Jones, & Swain 1996;Richards & Albright 1996; Albright & Richards 1996;Richards 2001). Tomograms of two Algols (U CrB andU Sge) suggested that the density of the gas distribution wasvariable and could change dramatically from a gas streamdistribution to one resembling an accretion disk (Albright &Richards 1996). The periodicity of these changes is stillunknown. Blondin, Richards, & Malinkowski (1995) andRichards & Ratliff (1998) used two-dimensional hydro-dynamic simulations to show that a significant change in the
Fig. 1.—Roche geometry for two Algol-type binaries (� Per and � Lib) and two RS CVn binaries (V711 Tau and UXAri). The plus sign marks the center ofmass of the binary, and the trajectory marked with small circles is the gravitational path of the gas stream due to Roche lobe overflow. For the Algols, theprimary is the detached component (spectral type B), while for the RS CVns, the primary is the larger, cooler, K-type star. Orbital phase, � ¼ 0:0 occurs whenthe secondary is in front of the primary. For the Algols, the active cool star is toward the observer at � ¼ 0:0, but in the RS CVns, the more active K star istoward the observer at � ¼ 0:5.
No. 2, 2003 CONTINUOUS MONITORING OF RADIO FLARES 339

structure of the accretion region could be initiated by achange in the initial density of the gas stream at theL1 point.Since density changes in the gas stream can be triggered byactivity on the mass-losing star, then there is a possibilitythat flares could effect this change, and therefore the fre-quency of flaring might be correlated with the frequency ofchanges in the accretion structures in some Algols.
The original goal of our radio flare survey was to monitorradio flares in � Per and V711 Tau continuously with theGBI. The other two binaries � Lib and UX Ari were addedlater in the campaign. The Algol-type binaries of U CrB andU Sge could not be included in our study because their largedistances (>180 pc) would have resulted in weak radio con-tinuum fluxes. Richards & Russell (1998) used the Gibson(1976) observations of � Per, b Per, AR Lac, and UX Ari tostudy the dependence of radio flaring activity on orbitalphase. They found that the strongest flares were detectednear phase 0.5. An initial report of our continuous surveybased on data collected from 1995 to 1997 was published byRichards et al. (1998). Mutel et al. (1998) used these datacollected up to 1997 August to describe the radio emissionin terms of a simple double-lobed gyrosynchrotron model.The radio emission at 8.3 GHz is due to gyrosynchrotronemission from optically thin emission regions containingmildly relativistic electrons in a dipolar magnetic field. Theyfound no evidence of highly circularly polarized coherentflares at 8.3 GHz. A thorough discussion of polarizationproperties based on our survey will be presented in a laterpaper.
In this paper, we will describe the statistical properties ofthe radio flares. The data collection procedure is describedin x 2, the results for each system are given in x 3, and the dis-cussion and concluding remarks are in x 4. A summary ofthis work was reported in Richards, Waltman, & Ghigo(2002).
2. DATA COLLECTION
The NRAO–Green Bank Interferometer (GBI) is a two-element system consisting of 85 foot (26 m) paraboloidsdesignated ‘‘ 85-1 ’’ and ‘‘ 85-2.’’ The telescopes can track asource in hour angle for more than 11 hours. The GBI oper-ates currently at two frequencies 2.25 GHz (13.3 cm, Sband) and 8.3 GHz (3.6 cm, X band), with 35 MHz band-width. Data were collected simultaneously at these frequen-cies. The antennas are illuminated by circularly polarizedfeeds, and either left or right polarization can be obtainedfrom each antenna (Hogg et al. 1969). Until 1996 March 31,the GBI was operated by the National Radio AstronomyObservatory (NRAO) for the United States Naval Observa-tory (USNO) and the Naval Research Laboratory (NRL).From 1996 November 22 until it closed in 2000 October, theGBI was operated by NRAO for the NASA High EnergyAstrophysics Program. New cryogenic receivers wereinstalled on the GBI in 1989 to improve the S/N of the fluxdensity measurements. Along with upgrades in the softwareand data reduction procedures, the source detection levelwas reliable down to about 20 mJy (Waltman et al. 1994). Inkeeping with Waltman et al. (1994), we used the flux den-sities measured on the 2.4 km baseline using the average ofthe left-left and right-right circular polarizations. This aver-age is more reliable at 8.3 GHz than at 2.25 GHz because ofsome occasional instability in the right-right correlator. Thelowest flux densities measured with the GBI, based on
approximately 200 blank sky observations, are 3:5� 1:4mJy at 2.25 GHz and 6:0� 3:0 mJy at 8.3 GHz (Waltman etal. 1994). Flux densities determined from blank sky obser-vations are considered to be the base flux detection levels forthe two frequencies. Further details of the instrumentationare given byHogg et al. (1969) andWaltman et al. (1994).
The continuous radio flare monitoring survey began in1995 January and ended in 2000 October. Each object wasobserved 2–6 times per day, with 10–15 minute integrations.The entire survey spanned 2096 days including interruptionsbecause of maintenance runs and temporary closings of theinterferometer that lasted for 398 days. The data were ana-lyzed in three groups (see Table 2). Details of the epochs ofdata collection and maximum fluxes for each system arelisted in Table 3. The first set (Group 1) includes data col-lected from the start of the survey until the GBI was tempo-rarily retired in 1996, i.e., Group 1: 1995 January 10 to 1996March 31 UT (446 days). This data set includes a mainte-nance run from 1995 January 26 to February 23 that lastedfor 27 days. The second set (Group 2) started 8.7 monthslater, i.e., Group 2: 1996 November 22 to 2000 April 30 UT(1255 days). The final set (Group 3) contains data collectedover the entire span of the survey from 1995 January 10 to2000 October 05 (2096 days) and includes data collectedfrom 2000 September 11 to October 05 UT after a hiatus incoverage of 4.4 months. The two primary targets � Per andV711 Tau were monitored during the entire campaign fromJD 2449728.6 to JD 2451824.0. Coverage of � Lib was from1995 May 10 UT to 1999 January 28 UT (JD 2449848.5–JD2451207.9), while UX Ari was observed from 1997September 05 UT until the end of the campaign (JD2450697.9–JD 2451824.0).
The flux density at 2.3 GHz (S2:3) and 8.3 GHz (S8:3) andthe spectral index, � were measured for each system. HereS�2=S�1 ¼ ð�2=�1Þ�. Of the four systems, � Per was observedmost extensively. Over the entire survey, there were 7443observations of � Per, 3125 of V711 Tau, 1859 of � Lib, and2533 of UXAri.
3. RESULTS
Radio flaring activity from two Algols (� Per and � Lib)and two RS CVn binaries (V711 Tau and UX Ari) wasmonitored almost continuously from 1995 January to 2000October. Figure 2 shows the variation of the 8.3 GHz fluxdensity with time for all four systems, and illustrates the dif-ferences between the flaring activity of � Per and V711 Tauas well as the similarities between V711 Tau and UX Ari. Inthis figure, the flux density of � Per, V711 Tau, and UX Ariare on the same scale (0.0–1.6 Jy) for easy comparison. The
TABLE 2
GBI Continuous Observing Cycles
Dates JD�2400000
Number
of Days
Data
Groups
1995 Jan 10–1995 Jan 26....... 49728–49744 16 Group 1
1995 Feb 23–1996Mar 31 .... 49772–50174 402 Group 1
1996Nov 22–2000 Apr 30 .... 50410–51665 1255 Group 2
2000 Sep 11–2000 Oct 05 ...... 51799–51823 25 . . .
1995 Jan 10–2000 Oct 05 ...... 49728–51823 2096 Group 3
340 RICHARDS ET AL. Vol. 147
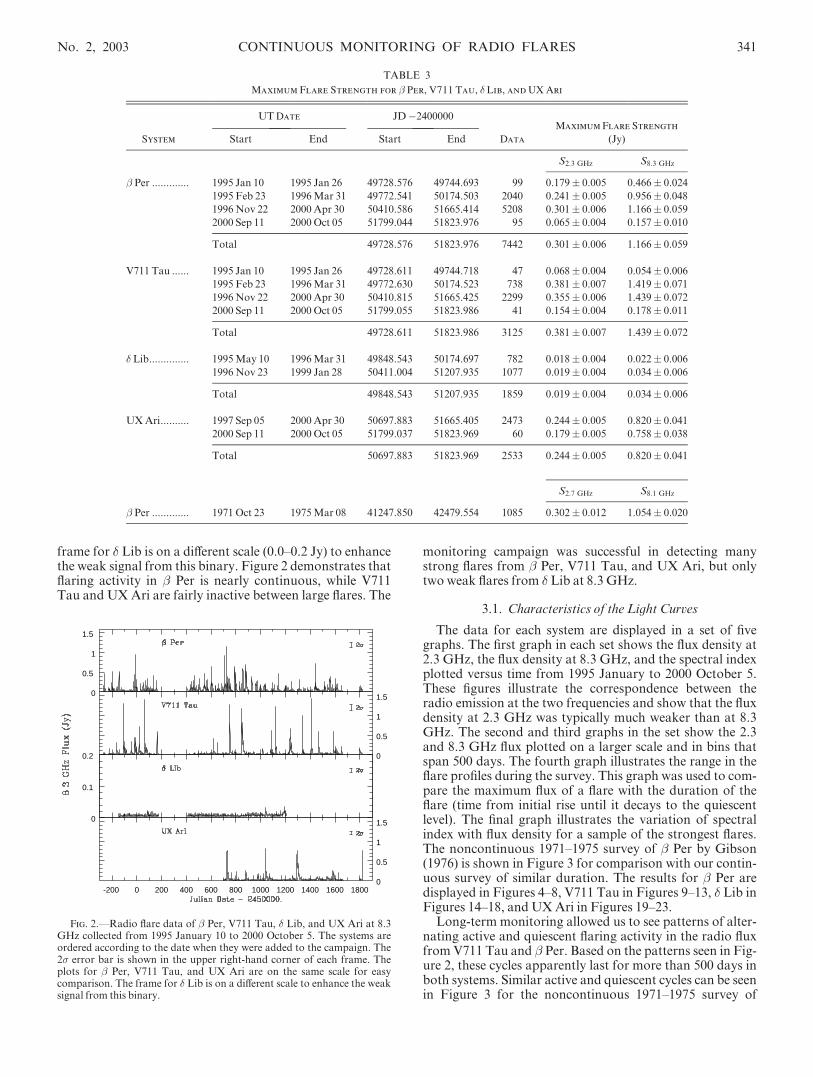
frame for � Lib is on a different scale (0.0–0.2 Jy) to enhancethe weak signal from this binary. Figure 2 demonstrates thatflaring activity in � Per is nearly continuous, while V711Tau and UXAri are fairly inactive between large flares. The
monitoring campaign was successful in detecting manystrong flares from � Per, V711 Tau, and UX Ari, but onlytwo weak flares from � Lib at 8.3 GHz.
3.1. Characteristics of the Light Curves
The data for each system are displayed in a set of fivegraphs. The first graph in each set shows the flux density at2.3 GHz, the flux density at 8.3 GHz, and the spectral indexplotted versus time from 1995 January to 2000 October 5.These figures illustrate the correspondence between theradio emission at the two frequencies and show that the fluxdensity at 2.3 GHz was typically much weaker than at 8.3GHz. The second and third graphs in the set show the 2.3and 8.3 GHz flux plotted on a larger scale and in bins thatspan 500 days. The fourth graph illustrates the range in theflare profiles during the survey. This graph was used to com-pare the maximum flux of a flare with the duration of theflare (time from initial rise until it decays to the quiescentlevel). The final graph illustrates the variation of spectralindex with flux density for a sample of the strongest flares.The noncontinuous 1971–1975 survey of � Per by Gibson(1976) is shown in Figure 3 for comparison with our contin-uous survey of similar duration. The results for � Per aredisplayed in Figures 4–8, V711 Tau in Figures 9–13, � Lib inFigures 14–18, andUXAri in Figures 19–23.
Long-term monitoring allowed us to see patterns of alter-nating active and quiescent flaring activity in the radio fluxfromV711 Tau and � Per. Based on the patterns seen in Fig-ure 2, these cycles apparently last for more than 500 days inboth systems. Similar active and quiescent cycles can be seenin Figure 3 for the noncontinuous 1971–1975 survey of
TABLE 3
Maximum Flare Strength for � Per, V711 Tau, � Lib, and UX Ari
UTDate JD�2400000
System Start End Start End Data
Maximum Flare Strength
(Jy)
S2:3 GHz S8:3 GHz
� Per ............. 1995 Jan 10 1995 Jan 26 49728.576 49744.693 99 0.179� 0.005 0.466� 0.024
1995 Feb 23 1996Mar 31 49772.541 50174.503 2040 0.241� 0.005 0.956� 0.048
1996 Nov 22 2000 Apr 30 50410.586 51665.414 5208 0.301� 0.006 1.166� 0.059
2000 Sep 11 2000 Oct 05 51799.044 51823.976 95 0.065� 0.004 0.157� 0.010
Total 49728.576 51823.976 7442 0.301� 0.006 1.166� 0.059
V711 Tau ...... 1995 Jan 10 1995 Jan 26 49728.611 49744.718 47 0.068� 0.004 0.054� 0.006
1995 Feb 23 1996Mar 31 49772.630 50174.523 738 0.381� 0.007 1.419� 0.071
1996 Nov 22 2000 Apr 30 50410.815 51665.425 2299 0.355� 0.006 1.439� 0.072
2000 Sep 11 2000 Oct 05 51799.055 51823.986 41 0.154� 0.004 0.178� 0.011
Total 49728.611 51823.986 3125 0.381� 0.007 1.439� 0.072
� Lib.............. 1995May 10 1996Mar 31 49848.543 50174.697 782 0.018� 0.004 0.022� 0.006
1996 Nov 23 1999 Jan 28 50411.004 51207.935 1077 0.019� 0.004 0.034� 0.006
Total 49848.543 51207.935 1859 0.019� 0.004 0.034� 0.006
UXAri.......... 1997 Sep 05 2000 Apr 30 50697.883 51665.405 2473 0.244� 0.005 0.820� 0.041
2000 Sep 11 2000 Oct 05 51799.037 51823.969 60 0.179� 0.005 0.758� 0.038
Total 50697.883 51823.969 2533 0.244� 0.005 0.820� 0.041
S2:7 GHz S8:1 GHz
� Per ............. 1971 Oct 23 1975Mar 08 41247.850 42479.554 1085 0.302� 0.012 1.054� 0.020
0
0.5
1
1.5
0
0.5
1
1.5
0
0.1
0.2
-200 0 200 400 600 800 1000 1200 1400 1600 18000
0.5
1
1.5
Fig. 2.—Radio flare data of � Per, V711 Tau, � Lib, and UX Ari at 8.3GHz collected from 1995 January 10 to 2000 October 5. The systems areordered according to the date when they were added to the campaign. The2� error bar is shown in the upper right-hand corner of each frame. Theplots for � Per, V711 Tau, and UX Ari are on the same scale for easycomparison. The frame for � Lib is on a different scale to enhance the weaksignal from this binary.
No. 2, 2003 CONTINUOUS MONITORING OF RADIO FLARES 341

� Per by Gibson (1976). The � Per data show that moreflares were observed when the system was monitored contin-uously (for 1255 days from 1996 November to 2000 April;Fig. 4) than when it was monitored infrequently (for 1200days from 1971 to 1975; Fig. 3). During the Gibson (1976)survey, flares with S� > 200 mJy occurred roughly every100 days compared to roughly every 50 days during the con-tinuous survey. The continuous survey also demonstratedthat during the inactive cycles there was almost no flaringactivity, a fact that would be difficult to confirm from a non-continuous survey. Umana et al. (1995) also found cycles ofactivity and inactivity in V711 Tau from a noncontinuous1991–1992 survey but could not determine the periodicity ofthe variations. Agrawal & Vaidya (1988) noted a pattern ofinfrequent but strong flares or more frequent but weakerflares in observations of X-ray flares from V711 Tau, but
they did not have sufficient data to determine this long-termactivity cycle.
Prior to the initiation of our continuous observingcampaign, we expected to find that V711 Tau would havefrequent and strong flares, while those from � Per would beweaker and less numerous since flaring activity on V711Tau was more widely documented. We have found that thisis not the case. Throughout the campaign, during both theactive and quiescent epochs, � Per displayed flares moreoften than V711 Tau, but its strongest flares were typicallyweaker than those of V711 Tau. Approximately 40 separateflaring events stronger than 200 mJy (or S� > 200 mJy) at8.3 GHz were observed from � Per compared to about 20from V711 Tau. As at the higher frequency, roughly doublethe number of flares were detected with S� > 50 mJy at 2.3GHz from � Per than from V711 Tau. However, the flaresfrom V711 Tau were typically stronger (S� < 1:44 Jy) than
0
0.2
0.4
1200 1400 1600 1800 2000 2200 2400 26000
0.4
0.8
1.2
Fig. 3.—Archival observations of � Per at 2.7 and 8.1 GHz obtainedwith the Green Bank Interferometer collected from 1971 October to 1975March (courtesy: D. Gibson). The larger error bar represents the 2� errorduring the strongest flares, and the smaller error bar represents thequiescent level.
0
0.2
0.4
0
0.4
0.8
1.2
-200 0 200 400 600 800 1000 1200 1400 1600 1800
-3
0
3
Fig. 4.—Flux density at 2.3 and 8.3 GHz, and spectral index for � Perfrom 1995 January 10 to 2000 October 5. The larger error bar represents the2� error during the strongest flares, and the smaller error bar represents thequiescent level. This figure illustrates the correspondence between the radioemission at the two frequencies.
-200 -100 0 100
0.1
0.2
0.3
500 600 700 800
0.1
0.2
0.3
1000 1100 1200 1300
0.1
0.2
0.3
1500 1600 1700 1800
0.1
0.2
0.3
Fig. 5.—Flux density of � Per at 2.3 GHz displayed in 500 dayintervals.
-200 -100 0 100
0.4
0.8
1.2
500 600 700 800
0.4
0.8
1.2
1000 1100 1200 1300
0.4
0.8
1.2
1500 1600 1700 1800
0.4
0.8
1.2
Fig. 6.—Flux density of � Per at 8.3 GHz displayed in 500 dayintervals.
342 RICHARDS ET AL.

Fig. 7.—Enhanced views of the strongest flares on � Per at 2.3 GHz (dashed line) and 8.3 GHz (solid line). This plot illustrates the range of flare profilesdetected during the survey.
0
0.3
0.6
0.9
(a)
-10 0 10 20
-2
0
2
(b)
590 600 610 620
(c)
730 740 750 760
Fig. 8.—Sample of the strongest flares on � Per at 2.3 GHz (dashed line) and 8.3 GHz (cross, solid line). The spectral index, �, is shown in the lower part ofeach frame. Note that � is positive during the most intense part of a flare. Frame (c) is an example of a ‘‘ flare forest.’’

those of � Per (S� < 1:17 Jy) at 8.3 GHz. The maximumflare strength at each frequency is given in Table 3. Com-pared to V711 Tau, UX Ari had weaker flares and amaximum flux of only 0.82 Jy at 8.3 GHz. However, the fluxfrom UX Ari is 1.7 times higher than expected from the dis-tance effect (50 pc for UX Ari vs. 29 pc for V711 Tau). Theweakness of the � Lib signal compared to the other systemscannot be explained by the relative distances of the four sys-tems. Although � Lib is twice as far as UX Ari (93 pc vs. 50pc; see Table 1), its maximum radio flux was only 0.034 Jy at8.3 GHz.
3.1.1. Radio Emission from � Lib
The radio signal from � Lib was much weaker than thatfrom the other three systems (Fig. 2). The strongest radio
signal from � Lib with the GBI was less than 34 mJy at 8.3GHz, with the typical signal less than 20 mJy, over the 4years from 1995 May to 1999 January. Two increases in the8.3 GHz flux were detected between JD 2451030 and2451210, but no significant corresponding increases werefound in the 2.3 GHz data. The two flares detected at 8.3GHz (X-band) are considered to be significant since the fluxwas greater than the base detection level of 22� 3 mJy at8.3 GHz. However, the 2.3 GHz flux remained below thebase detection level of 20� 2 mJy for the entire survey.While we have greater confidence in the X-band data, wecan only report that these were probable flares since thetimes of increased flux density were not correlated at thetwo frequencies (see Fig. 18) as strongly as in � Per andV711 Tau.
There is a possibility that � Lib was in a quiescent phaseduring our survey. Stewart et al. (1989) used the Parkes64 m telescope and detected � Lib 18 out of 33 times with amaximum flux density of 64:4� 7:1 mJy at 8.4 GHz, andwith a median flux density of 16 mJy. The system was notdetected at 4.9 GHz by Umana et al. (1991). Singh, Drake,& White (1995) detected significant intensity variations inthe X-ray emission from � Lib, which could be due to flaringactivity or to modulation of active regions on the magneti-cally active secondary in this system. The tertiary in � Libhas spectral type G9 (Worek 2001), but it is not expected tocontribute to the flaring activity of the system since its rota-tional velocity was not increased by tidal interactions likethe stars in the binary.
The � Lib radio flux must be intrinsically low since correc-tion for the distance effect (d ¼ 93 pc) would enhance theflux by � 10 relative to � Per and V711 Tau (d � 29 pc).This lack of activity in � Lib may be due to the spectral typeof the active star (G1 IV) versus that in Algol (K2 IV). Sinceactivity is primarily related to stellar rotation, then � Lib(Porb ¼ 2:33 days) should be more active than Algol(Porb ¼ 2:87 days) assuming synchronous rotation and aftercorrecting for the distance effect. Given that we see flares on� Per as high as 1.17 Jy at 8.3 GHz, then we should see flar-ing activity on � Lib at the �100 mJy level at that frequency
-200 -100 0 100
0.1
0.2
0.3
500 600 700 800
0.1
0.2
0.3
1000 1100 1200 1300
0.1
0.2
0.3
1500 1600 1700 1800
0.1
0.2
0.3
Fig. 10.—Flux density of V711 Tau at 2.3 GHz displayed in 500 dayintervals.
0
0.2
0.4
0
0.4
0.8
1.2
-200 0 200 400 600 800 1000 1200 1400 1600 1800
-3
0
3
Fig. 9.—Flux density at 2.3 and 8.3 GHz, and spectral index for V711Tau from 1995 January 10 to 2000 October 5. The larger error barrepresents the 2� error during the strongest flares, and the smaller error barrepresents the quiescent level. This figure illustrates the correspondencebetween the radio emission at the two frequencies.
-200 -100 0 100
0.4
0.8
1.2
500 600 700 800
0.4
0.8
1.2
1000 1100 1200 1300
0.4
0.8
1.2
1500 1600 1700 1800
0.4
0.8
1.2
Fig. 11.—Flux density of V711 Tau at 8.3 GHz displayed in 500 dayintervals.
344 RICHARDS ET AL.

Fig. 12.—Enhanced views of the strongest flares onV711 Tau at 2.3GHz (dashed line) and 8.3GHz (solid line) to illustrate the range of flare profiles detectedduring the survey.
0
0.3
0.6
0.9
1.2
1.5 (a)
-110 -100 -90 -80
-2
0
2
(b)
850 860 870 880
(c)
1400 1410 1420 1430
Fig. 13.—Sample of the strongest flares onV711 Tau at 2.3GHz (dashed line) and 8.3GHz (cross, solid line). The spectral index,�, is shown in the lower partof each frame.

if the two systems have comparable intrinsic levels of activ-ity and similar ages. Other parameters that influence theactivity-rotation-age relation (Skumanich 1972) include thedistribution of the magnetic field, the amount of differentialrotation at the boundary between the convective and radia-tive layers, and the change in the stellar rotational rate asthe star loses gas through Roche lobe overflow. Theseparameters may explain why flaring activity from � Lib wasweaker than expected.
3.1.2. Flare Profiles
The exact number of flares stronger than a given flux levelwas difficult to determine since every flare could not bedescribed by the classical sharp rise and exponential decline(e.g., Figs. 7 and 12). Most outbursts or flare events con-tained multiple peaks as though successive flares wereejected in sequence. In these events, the initial peak in a ser-ies was usually the strongest one, and subsequent peaksoften occurred along the exponential tail of the first peakover a period of 10–40 days. Examples of these flare eventsare shown in Figures 7 and 8 for � Per and Figures 12 and13 for V711 Tau.
In the case of � Per, the strong initial peak had a maxi-mum flux, S�ðmaxÞ � 1:17 Jy, while the weaker peaks had
-200 -100 0 100
0.02
0.04
500 600 700 800
0.02
0.04
1000 1100 1200 1300
0.02
0.04
Fig. 16.—Flux density of � Lib at 8.3 GHz displayed in 500 dayintervals.
Fig. 17.—Enhanced views of the strongest signals from � Lib at 2.3 GHz (dashed line) and 8.3 GHz (solid line). The two outer frames show the signals thatwere stronger than the base detection level of 0.022 Jy at 8.3 GHz. These were the only two flares detected during an interval of 1360 days. The middle frameshows a signal that might have been identified as a flare if it had been stronger.
-200 -100 0 100
0.02
0.04
500 600 700 800
0.02
0.04
1000 1100 1200 1300
0.02
0.04
Fig. 15.—Flux density of � Lib at 2.3 GHz displayed in 500 dayintervals.
0
0.03
0.06
0.09
0
0.03
0.06
0.09
-200 0 200 400 600 800 1000 1200 1400 1600 1800
-3
0
3
Fig. 14.—Flux density at 2.3 and 8.3 GHz, and spectral index for � Libfrom 1995 May 10 to 1999 January 28. This figure illustrates thecorrespondence between the radio emission at the two frequencies.
346 RICHARDS ET AL. Vol. 147

fluxes S�ðmaxÞ � 0:52 mJy. For V711 Tau, the strongestcomponent had a flux S�ðmaxÞ � 1:44 Jy, while the weakerpeaks had S�ðmaxÞ � 1:21 mJy. In some cases, the initialpeak was followed by peaks at a nearly constant flux. Theselatter flare events can be termed ‘‘ flare forests.’’ A closerexamination of sustained flare events in � Per, like the onein Figure 8c, shows that the peaks were separated by inter-vals of 2.8–4.1 days. This suggests that the peaks may notrepresent separate flares but may be part of the same eventthat could only be viewed within a restricted range in orbitalphase. Similar behavior was seen for V711 Tau in Figure13c, where the peaks in the flare event were separated by 2–3days, which is comparable to the orbital period of thebinary. Other flare events on � Per and V711 Tau, like thosein Figures 8a, 13a, and 13b, have peaks separated by about1 day, so these may arise from different regions on the star.
Intensity dips were also observed in radio flare lightcurves on V711 Tau by Umana et al. (1995) and Jones et al.(1996). Ottman (1994) and Antunes, Nagase, & White
0
0.02
0.04
0.06
0.08 (a)
-50 -40 -30 -20
-2
0
2
(b)
1030 1040 1050 1060
(c)
1170 1180 1190 1200
Fig. 18.—Variation of spectral index during flares for � Lib. The flux density at 2.3 GHz (dashed line) and 8.3 GHz (cross, solid line) are shown in the upperframes and the spectral index, �, is shown in the lower frames. The signal shown in part (a) shows the variation of � at the quiescent level.
0
0.2
0.4
0
0.4
0.8
1.2
-200 0 200 400 600 800 1000 1200 1400 1600 1800
-3
0
3
Fig. 19.—Flux density at 2.3 and 8.3 GHz, and spectral index for UXAri from 1997 October 5 to 2000 October 5. The larger error bar representsthe 2� error during the strongest flares, and the smaller error bar representsthe quiescent level. This figure illustrates the correspondence between theradio emission at the two frequencies.
500 600 700 800
0.1
0.2
0.3
1000 1100 1200 1300
0.1
0.2
0.3
1500 1600 1700 1800
0.1
0.2
0.3
Fig. 20.—Flux density of UX Ari at 2.3 GHz displayed in 500 dayintervals.
500 600 700 800
0.4
0.8
1.2
1000 1100 1200 1300
0.4
0.8
1.2
1500 1600 1700 1800
0.4
0.8
1.2
Fig. 21.—Flux density of UX Ari at 8.3 GHz displayed in 500 dayintervals.
No. 2, 2003 CONTINUOUS MONITORING OF RADIO FLARES 347

(1994) noticed similar intensity dips in ROSAT and ASCAobservations of flares on � Per. They interpreted these dipsas eclipses of the emitting region and found that the flareswere preferentially seen between phases, � ¼ 0:2 0:7, on theside of the cool star facing its companion. Mutel et al.(1998) found that X-ray emission due to coronal activity onthe cool star in � Per arose from a large region and only asmall part of this region is eclipsed at any one time. Theyconcluded that the X-ray emission, like the radio emission,comes from a region outside the orbital plane.
These results suggest that flare forests may be part of thesame flare event that is eclipsed due to orbital motion. How-ever, there are now several alternative explanations. (i)Intermittent production of nonthermal particles (Tanaka &Zirin 1985), as on the Sun, could cause variations in the flaresource that result in intensity dips like those seen in flarelight curves. (ii) Sympathetic flaring, during which a flare inone active region stimulates a flare in another active regionvia the propagation of Moreton waves has been proposedby Osten & Brown (1999) for extreme ultraviolet flares in
RS CVn systems. (iii) There may also be regions of activestellar longitudes, as suggested by long-term photometricobservations of active stars (Berdyugina & Tuominen1998). If these flare forests are eclipsed flares, then the loca-tion and geometry of the flaring event can be constrained asdone by Favata & Schmitt (1999) in the case of an eclipsedflare on � Per. Our long-term survey can be used to identifypreferred phases for flaring, but the temporal resolutionduring a given flare is insufficient to permit an unambiguousdetermination of the source of flare forests (see x 3.1.4).
3.1.3. Duration of Flares
A large solar flare at H� or in soft X-rays usually riseswithin 5 minutes to an hour and decays over several hours(Priest 1995). Some long-duration solar flares can last for upto two days. However, the flares from � Per, V711 Tau,� Lib, and UXAri took 20–50 hr to rise, with decay times of10–40 days. Figure 24 illustrates how the flux density of thestrongest peak in a flare event varied with the duration of
Fig. 22.—Enhanced views of the strongest flares on UX Ari at 2.3 GHz (dashed line) and 8.3 GHz (solid line). This plot illustrates the range of flare profilesdetected during the survey.
0
0.3
0.6
(a)
720 730 740 750
-2
0
2
(b)
1030 1040 1050 1060
(c)
1290 1300 1310 1320
Fig. 23.—Sample of the strongest flares on UXAri at 2.3 GHz (dashed line) and 8.3 GHz (cross, solid line). The spectral index, �, is shown in the lower partof each frame.
348 RICHARDS ET AL. Vol. 147

the event for all four systems. This figure shows that if weuse the strongest peak as the measure of the strength of theflare we get an unexpected result in the case of V711 Tau,namely that the intensity of a flare is almost unrelated to itsduration. However, if we use the sum of the fluxes of the
peaks as an estimate of the total energy output duringthe flare (Fig. 25), then we get a more consistent result thatthe energy output at a given frequency increases with dura-tion. For all four binaries, the flare events with the greatestenergy output took the longest time to decay.
3.1.4. Variation with Orbital Phase
The location of the strongest flares can be found by exam-ining the orbital positions of the flare peaks. This is illus-trated in Figure 26 for the strongest 8.3 GHz flares. A more
Fig. 24.—Variation of flux density of the strongest peak during a flareevent vs. the duration of the flare event at 2.3 GHz (circles) and 8.3 GHz(crosses). The 2� error bars are shown near each set of data. The least-squares fits are shown for the 2.3 GHz data (dashed line) and 8.3 GHz data(solid line). Note that the � Lib data are displayed on a different scale thanthe other systems.
Fig. 25.—Variation of the sum of the fluxes of the peaks seen during aflare event at 8.3 GHz vs. duration of the event. This sum is related to theenergy output during a flare. The least-squares fit to the data is shown (solidline). The 2� error bars are shown to the right of the data. Note that the� Lib data are displayed on a different scale than the other systems.
Fig. 26.—Variation of the strongest flares at 8.3 GHz with orbital phase,�. These are the flares shown in Figs. 8, 13, 18, and 23. The individual datapoints are marked with crosses. The whole numbers for � represent thenumber of orbital cycles since 1995 January 10. Note that daily sampling isadequate, but not sufficient, for this type of analysis.
No. 2, 2003 CONTINUOUS MONITORING OF RADIO FLARES 349

extensive analysis of the orbital variation will be given in alater paper. The flares shown in Figure 26 are those seen inFigures 8, 13, 18, and 23 for � Per, V711 Tau, � Lib, and UXAri, respectively. The whole numbers given for the orbitalphase, �, represent the number of orbital cycles elapsedsince 1995 January 10. On this enlarged scale, the resolutionof the flare profiles is not as good as that derived from non-continuous flare surveys that focus on individual flareevents. Our continuous survey can be used to study whetherflares occur at preferred phases; however, a sampling pat-tern of a few times per day is adequate, but not sufficient,for this type of analysis. Moreover, the temporal resolutionduring a given flare is insufficient to permit an unambiguousdetermination of the source of flare forests as described inx 3.1.2.
Figure 26 shows that the strongest peak of the � Per flaresoccurred at different phases: 0.5, 0.7, 0.9, while the weakerpeaks occurred at phases around the orbit. For V711 Tau,the strongest peak was seen at phases: 0.5, 0.5, 0.0, while theweaker peaks occurred at phases 0.2–0.3 and 0.7–1.0. ForUX Ari, the strongest peak was seen at phases 0.5, 0.6, 0.9,with weaker peaks at phases around the orbit, but mostly0.2–0.4 and 0.7–1.0. The two � Lib flares occurred at� ¼ 0:0.
This pattern suggests that the strongest flares from the RSCVn binaries tend to occur near � ¼ 0:5 or 1.0, along theline of centers. More of these flares tend to be seen whenthe more active K star was toward the observer (� ¼ 0:5).The flares from the Algols were strongest when the activecooler star was usually toward the observer (� ¼ 0:0). Theseresults are consistent with photometric observations of RSCVn binaries that show the K star to be more active than itsG-type companion. In the Algols, only the late-type star ismagnetically active, so we would expect to see the strongestflares at orbital positions when this star is at its brightest.
3.1.5. Variation of Spectral Index
The spectral index can be used to provide informationabout the geometry of the emitting region. In all four sys-tems, the variability of the spectral index was correlatedwith flaring activity. The spectral index, �, varied over therange �2:1 � � � þ2:5 (see lower frames in Figs. 8, 13, 18,and 23). Figure 27 shows that �2:1 < � < 0 for quiescentemission and rises to as high as 2.5 during flares. The range
0
0.3
0.6
0.9
1.2
1.5
0
0.3
0.6
0.9
1.2
1.5
0
0.3
0.6
0.9
1.2
1.5
0
0.3
0.6
0.9
1.2
1.5
-2 -1 0 1 2
0
0.3
0.6
0.9
1.2
1.5
-2 -1 0 1 2
0
0.3
0.6
0.9
1.2
1.5
Fig. 27.—Variation of flux density with spectral index at 2.3 GHz (leftframes) and 8.3 GHz (right frames) for � Per, V711 Tau, andUXAri.
2 4 6 8 10 12
0
0.4
0.8
1.2
1.6
2 4 6 8 10 12 2 4 6 8 10 12
Fig. 28.—Variation of flux density with frequency during the rising phase of flares on � Per, V711 Tau, and UX Ari. These data correspond to the flares inFigs. 8a, 13c, and 23a. The numbers to the right of the lines give the order in which the spectral index changed, with the value of the index in brackets. The firstobservationmarks the quiescent level. The index typically increased during the outburst.
350 RICHARDS ET AL. Vol. 147

was similar for all four systems: �2:09 � � � þ2:35 for� Per (Fig. 8), �2:07 � � � þ1:48 for V711 Tau (Fig. 13),�2:02 � � � þ2:53 for � Lib (Fig. 18), and �1:86 �� � þ1:92 for UX Ari (Fig. 23). This behavior was detectedby Gibson, Hjellming, & Owen (1975) and Owen & Gibson(1978) and can occur if the flares arise from a partiallyopaque synchrotron source, while the quiescent emissioncomes from an inhomogeneous, optically thin source. Mutelet al. (1987) also found that � becomes more positive asluminosity increases during a flare. The spectral indexincreased at the rising phase of the flare and decreased dur-ing the decay phase. Torricelli-Ciamponi et al. (1998) foundthat the spectral index was always positive during the risingphase in flares of UX Ari. We have confirmed this with ourdata (Fig. 28). The usual explanation for positive spectralindexes in the radio is self-absorbed gyrosynchrotron radia-tion (Mutel et al. 1987). The current model is one in whichthe quiescent emission arises from extended loops attachedto the active star (as in the Algols) or in a double magneto-sphere that connects the two active stars in an RS CVnbinary (Mutel et al. 1987). In this model, the flares wouldarise from the lower corona of the active star.
3.2. Periodicity of Flaring Activity
Two independent methods were used to determine theflaring periodicities. In the first method, we analyzed thepower spectrum obtained by calculating the Fast FourierTransform of the data. The power spectrum will have asharp peak (�-function) at frequencies that correspond totrue periodicities in the data (Press et al. 1986). In the secondmethod, called the Phase Dispersion Minimization (PDM)method (Stellingwerf 1978), a test period was chosen andchecked to determine whether it corresponded to a trueperiodicity in the data. The goodness-of-fit parameter, �,approaches zero when the test period is close to a trueperiodicity in the data.
The Fourier transform, Hð�Þ, of a function hð�Þ isdescribed by Hð�Þ ¼
RhðtÞe2�i�tdt for frequency, �, and
time, t. The Fourier transform converges to finite values atall frequencies except those where the data have a discretesinusoidal component of finite amplitude. It becomes a�-function at those frequencies corresponding to periodici-ties in the data. We used the Lomb-Scargle periodogramanalysis for unevenly spaced data (Press et al. 1986).
0
30
60
90
120
150
0 0.05 0.1 0.15 0.2 0.25 0.3 0.35 0.4
0.96
0.97
0.98
0.99
1
0
30
60
90
120
150
0.96
0.97
0.98
0.99
1
Fig. 29.—Comparison between the power spectrum and� statistic for the entire � Per data at (a) 2.3 GHz and (b) 8.3 GHz. The significant periodicities areidentified on these plots. The results show that there is no significant periodicity associated with the orbital period of this binary (P ¼ 2:8673 days).
No. 2, 2003 CONTINUOUS MONITORING OF RADIO FLARES 351

Phase Dispersion Minimization (PDM) produces betterresults than the FFT in the case of nonsinusoidal data. Firstdivide the data set into M groups or samples. The goodnessof fit between a test period, P, and a true period, Ptrue, isgiven by the statistic,� ¼ s2=�2, where
�2 ¼P
ðxi � �xxÞ2
N � 1; s2 ¼
Pðnj � 1Þs2jPnj �M
;
s2 is the variance of M samples within the data set, xi is adata element (S�), �xx is the mean of the data,N is the numberof total data points, nj is number of data points contained inthe sample M, and sj is the variance of the sample M. If� 6¼ Ptrue, then s2 ¼ �2 and � ¼ 1. However, if � ¼ Ptrue,then� ! 0 (or a local minimum).
Flaring cycles for the four systems were calculated fromthe 2.3 GHz, 8.3 GHz, and spectral index (SpI) data for thethree data groups described in x 2 and Table 2. Flaringcycles were also determined from the 2.7 and 8.1 GHz � Perdata collected from 1971 to 1975. The results are givenfor each system in sets of three figures: Figures 29, 30, and31 for � Per, Figures 32, 33, and 34 for V711 Tau,Figures 35, 36, and 37 for � Lib, and Figures 38, 39, and 40for UXAri.
The first figure in each set shows the power spectrum and� statistic versus flaring frequency at 2.3 and 8.3 GHz (Figs.29, 32, 35, and 38). The frequencies plotted in these figuresinclude those corresponding to the orbital period of eachbinary. A spike at the orbital period suggests that the flaringactivity is related to the orbital period.
The second figure in each set summarizes the resultsfound from the two techniques using all possible data sets(2.3 GHz, 8.3 GHz, SpI) for all the data groups (Figs. 30,33, 36, and 39). These results correspond to the 15 highestfrequencies in the power spectrum and the 15 lowest �-val-ues. The solid vertical line through the graph marks thedominant periodicity. Many periods are shown in this figurebut the only ones considered to be significant were thosethat (i) were identified by both techniques, (ii) were found atmore than one frequency (e.g., the 2.3 GHz, 8.3 GHz, andSpI data), (iii) were found in more than one data group(e.g., Group 1, Group 2), and (iv) had the strongest powersor lowest �-values. The periods that satisfied these four cri-teria were the dominant periodicities. It is conceivable that alonger survey could have resulted in the acceptance of someof the periodicities rejected in this paper.
The final figure in each set shows the variation of 8.3 GHzflux with orbital phase [� ¼ ðJD�HJDminÞ=Porb] for all the
2.7
8.11971-1975
2.3
8.31995-1996
2.3
8.31996-2000
2.3
8.31995-2000
Fig. 30.—Values of the flaring periods for � Per found using FFT (crosses) and PDM (circles) techniques for the epochs listed on the left of the figure. Theresults for the 1971–1975 survey were determined from the 2.7 and 8.1 GHz data, while those for the 1995–2000 survey were obtained from the 2.3 GHz,8.3 GHz, and spectral index (SpI) data. These data sets are identified on the right side of each frame. The flaring periods correspond to the 15 highestfrequencies in the power spectrum and the 15 lowest�-values. The dashed vertical lines show the solutions from the two techniques, and the solid line identifiesthe dominant solution.
352 RICHARDS ET AL.

0
30
60
90
120
0 0.05 0.1 0.15 0.2 0.25 0.3 0.35 0.4
0.92
0.94
0.96
0.98
1
0
30
60
90
120
0.92
0.94
0.96
0.98
1
Fig. 32.—Comparison between the power spectrum and� statistic for the entire V711 Tau data at (a) 2.3 GHz and (b) 8.3 GHz. The significant periodicitiesare identified on these plots. The results show that there is a low-power periodicity associated with the orbital period of this binary (P ¼ 2:8378 days).
Fig. 31.—Variation of flux density at 8.3 GHz vs. phase, �, for � Per. Here � ¼ ðJD�HJDmin=PÞ and the values of P are given to the right of each frame.These include the orbital period of the binary and the periodicities found from the data analysis. Two orbital cycles are shown here to emphasize any cyclicpatterns in the graphs. The second cycle is a repeat of the first one.

2.3
8.31995-1996
2.3
8.31996-2000
2.3
8.31995-2000
Fig. 33.—Values of the flaring periods for V711 Tau found using FFT (crosses) and PDM (circles) techniques for the epochs listed on the left of the figure.The results from the 1995–2000 survey were obtained from the 2.3 GHz, 8.3 GHz, and spectral index (SpI) data. These data sets are identified on the right sideof each frame. The flaring periods correspond to the 15 highest frequencies in the power spectrum and the 15 lowest �-values. The dashed vertical lines showthe solutions from the two techniques, and the solid line identifies the dominant solution.
Fig. 34.—Variation of flux density at 8.3 GHz vs. phase, �, for V711 Tau. Here � ¼ ðJD�HJDmin=PÞ and the values of P are given to the right of eachframe. These include the orbital period of the binary and the periodicities found from the data analysis. Two orbital cycles are shown here to emphasize anycyclic patterns in the graphs. The second cycle is a repeat of the first one.
354

0
20
40
60
80
100
0 0.05 0.1 0.15 0.2 0.25 0.3 0.35 0.4
0.93
0.96
0.99
0
50
100
150
200
0.72
0.84
0.96
Fig. 35.—Comparison between the power spectrum and � statistic for the entire � Lib data at (a) 2.3 GHz and (b) 8.3 GHz. The significantperiodicities are identified on these plots. The results show that there is no significant periodicity associated with the orbital period of this binary(P ¼ 2:3274 days), but there is a significant periodicity of 3 days, which is a consequence of the daily sampling interval.
2.3
8.31995-1996
2.3
8.31996-1999
2.3
8.31995-1999
Fig. 36.—Values of the flaring periods for � Lib found using FFT (crosses) and PDM (circles) techniques for the epochs listed on the left of the figure. Theresults from the 1995–1999 survey were obtained from the 2.3 GHz, 8.3 GHz, and spectral index (SpI) data. These data sets are identified on the right side ofeach frame. The flaring periods correspond to the 15 highest frequencies in the power spectrum and the 15 lowest�-values. The dashed vertical lines show thesolutions from the two techniques.
355

Fig. 37.—Variation of flux density at 8.3 GHz vs. phase, �, for � Lib. Here � ¼ ðJD�HJDmin=PÞ and the values of P are given to the right of each frame.These include the orbital period of the binary and the periodicities found from the data analysis. Two orbital cycles are shown here to emphasize any cyclicpatterns in the graphs. The second cycle is a repeat of the first one.
0
30
60
90
120
150
0 0.05 0.1 0.15 0.2 0.25 0.3 0.35 0.4
0.88
0.92
0.96
1
0
30
60
90
120
150
0.88
0.92
0.96
1
Fig. 38.—Comparison between the power spectrum and � statistic for the entire UX Ari data at (a) 2.3 GHz and (b) 8.3 GHz. The significant periodicitiesare identified on these plots. The results show that there is a low-power significant periodicity associated with the orbital period of this binary(P ¼ 6:4379 days).

dominant periodicities identified by the analysis (Figs. 31,34, 37, and 40). Two orbital cycles are shown here to empha-size any cyclic patterns in the graphs. The second cycle is arepeat of the first one. We have plotted the data in Figures31, 34, 37, and 40 against all periods identified by the powerspectrum andPDManalyses since this is anotherway of vali-dating the arguments given in xx 3.2.1–3.2.5. These figuresprovide an alternative check on the plausibility of the results.
Figures 29–40 demonstrate that the two techniques iden-tify similar periodicities in the data. The derived periodici-ties were checked to see if they were related to the lowestfrequency of the data, fmin [corresponding to the time spanof the data set, dt ¼ ðtmax � tminÞ], the highest frequencyof the data, fmax (corresponding to the sampling interval),the Nyquist frequency [N=ð2� ðtmax � tminÞ], or the maxi-mum test period, Pmax, of 2000 days used by the PDM
2.3
8.31997-2000
2.3
8.31997-2000t
Fig. 39.—Values of the flaring periods for UXAri found using FFT (crosses) and PDM (circles) techniques for the epochs listed on the left of the figure. Theresults from the 1997–2000 survey were obtained from the 2.3 GHz, 8.3 GHz, and spectral index (SpI) data. These data sets are identified on the right side ofeach frame. Here 1997-2000t refers to data collected up to 2000 October. The flaring periods correspond to the 15 highest frequencies in the power spectrumand the 15 lowest�-values. The dashed vertical lines show the solutions from the two techniques, and the solid line identifies the dominant solution.
Fig. 40.—Variation of flux density at 8.3 GHz vs. phase, �, for UXAri. Here � ¼ ðJD�HJDmin=PÞ and the values ofP are given to the right of each frame.These include the orbital period of the binary and the periodicities found from the data analysis. Two orbital cycles are shown here to emphasize any cyclicpatterns in the graphs. The second cycle is a repeat of the first one.
CONTINUOUS MONITORING OF RADIO FLARES 357

routine. The solutions to the period search analysis aregiven in Table 4.
3.2.1. Flaring Cycles on � Per
The flaring frequencies for � Per are illustrated in Figures29 and 30. The strongest frequencies found for � Per were49, 354, 1206, 1416, and 1647 days (Table 4), but the domi-nant periodicity was 48:9� 1:7 days. This periodicity sug-gests that strong flares occur on � Per roughly every 17orbital cycles (Table 4). The long-term periodicities of 1416and 1647 days were independently derived from the 1971–1975 data, as well as the 1995–2000 survey. However, theonly periodicity for � Per that is real is the dominant period-icity. There is less confidence in the other periodicitiesbecause they are related, within the error bars, to dt, thetime span of the data set or to Pmax, the maximum testperiod used in the PDM analysis. For the � Per Group 2data set, dt2 ¼ 1255, dt2=354 ’ 3:5, dt2=1206 ’ 1, anddt2=1647 ’ 3=4. The 1416 day value was discarded becauseit was found only from the PDM analysis and was related toPmax (Pmax=1416 ’ 1:4).
Figure 31 shows the variation of flux density versus �when the data were folded with the dominant periodicitiesderived for � Per. Based on all the data, this figure showsthat the strongest flares occurred near � ¼ 0:1 0:3, 0.5, 0.9when the data were folded with the orbital period. This pat-tern is consistent with Figure 26 and the arguments given inx 3.1.3. There is a slight cyclic pattern when the data arefolded with a period of 48.9 days. The cyclic patterns for1416 days and 1647 days are quite evident, but there can belittle confidence in these long-term cycles because the surveywas not long enough to confirm these cycles with a highdegree of significance.
3.2.2. Flaring Cycles on V711 Tau
Figures 32 and 33 illustrate the solutions to the analysisfor V711 Tau. Periodicities of 57, 81, 96, 121, and 459 dayswere identified for V711 Tau, but the strongest of these was120:7� 3:4 days. A weaker periodicity of 80:8� 2:5 dayswas also found to be significant. The significant periodicitiescorrespond to 42.5 and 28.5 orbital cycles (Table 4). Thereis less confidence in the other solutions because they arerelated to dt. For the V711 Tau Group 2 data set,dt2 ¼ 1255 days, dt2=57 ’ 22, and dt2=96 ’ 13. The 459 dayvalue was discarded because it was found only in the Group1 data.
Figure 34 illustrates how flux density varies with � whenthe data are folded with the dominant periodicities derivedfor V711 Tau. In this case, the strongest flares seemed to
occur at all positions around the orbit when the data arefolded with the orbital period, but mostly around� ¼ ð0:0� 0:2Þ, with a few strong flares near phase 0.5. Thispattern is consistent with Figure 26 and x 3.1.3. Moredistinct patterns are evident in Figure 34 when the data arefolded with periods of 57, 81, 96, and 121 days, but not for459 days.
3.2.3. Flaring Cycles on � Lib
The solutions to the analysis for � Lib are illustrated inFigures 35 and 36. The only solutions that were found incommon with both techniques and all data groups wereperiodicities of 489� 5 days and 793� 13 days. Thesecycles are both related to the time span of the data set. Forthe Group 1 data, dt1 ¼ 326 days and dt1=489 ’ 2=3, whiledt2 ¼ 797 days for the Group 2 data. So both solutions arenot real.
Figure 37 shows that the strongest flux from � Lib wasdetected at phases 0.7, 0.0, and 0.1 when the data are foldedwith the orbital period. The data show beats because thebinary was observed approximately once each day for mostof the survey. This figure also shows that the orbital phases� ¼ 0:7 1:0 were systematically undersampled relative tothe other phases. Observations of this system were collectedup to four times each day for the Group 1 data (326 days)and for the first 232 days of the Group 2 data. The systemwas observed only once each day during the last 565 days ofthe Group 2 data. This represents half of the days in the sur-vey for this system. This change in the sampling interval hada significant effect on the results. Perhaps more flares mighthave been detected if the sampling had been morefrequent in the latter half of the survey.
3.2.4. Flaring Cycles on UXAri
The solutions for UXAri are illustrated in Figures 38 and39. Periodicities of 53, 83, 141, 194, and 286 days were foundfor UX Ari, but the strongest was 141:4� 4:5 days. Aweaker periodicity of 52:6� 0:7 days was found to be sig-nificant. The significant periodicities correspond to 22.0and 8.2 orbital cycles (Table 4). There is less confidence inthe other solutions because they are related to dt. For theUX Ari Group 2 data set, dt2 ¼ 968 days, dt2=83 ’ 12,and dt2=194 ’ 5. For Group 3, dt3 ¼ 1126 days anddt3=286 ’ 4.
Figure 40 illustrates how flux density varies with � whenthe data are folded with the dominant periodicities derivedfor UX Ari. This figure shows that the strongest flux fromUX Ari was detected at most phases around the orbit, witha minimum around � ¼ 0:1 0:2, when the data are folded
TABLE 4
Flaring Cycles in � Per, V711 Tau, � Lib, and UX Ari
Flaring Periodicities,P (days)
Systems Solutions fromFFT and PDMAnalyses Significant P P=Porb
� Per ..................... 48.9� 1.7, 353.5� 6.5, 1206� 39, 1416� 16, 1647� 28 48.9� 1.7 17.1
V711 Tau .............. 56.9� 1.7, 80.8� 2.5, 96.4� 2.0, 120.7� 3.4, 458.9� 1.2 120.7� 3.4, 80.8� 2.5 42.5, 28.5
� Lib...................... 489.4� 4.7, 793� 13 . . . . . .
UXAri.................. 52.59� 0.71, 82.5� 2.0, 141.4� 4.5, 194.40� 0.91, 286� 10 141.4� 4.5, 52.6� 0.7 22.0, 8.2
358 RICHARDS ET AL. Vol. 147

with the orbital period of the binary. The data are clusteredinto more distinct patterns when folded with the other peri-ods. The period of 53 days produced a rectangular patternbetween � ¼ 0:1 0:5, and the 83 day period resulted in asimilar distribution.
3.2.5. Dependence on Orbital Period
The power spectrum and PDM analyses identified a lowpower periodicity associated with the orbital period of thebinary for V711 Tau and UXAri, but not for � Per or � Lib.The significance of these periodicities is illustrated in thepower spectrum and �-statistic variations for V711 Tau(Fig. 32) and UX Ari (Fig. 38). No significant power or �was found at the orbital periods of � Per (Fig. 29) or � Lib(Fig. 35). These results suggest that the radio emission fromV711 Tau and UX Ari is dependent on the orbital period.Moreover, Table 4 shows that the most significant periodici-ties derived from the long-term survey for V711 Tau andUXAri are also dependent on the orbital period.
4. DISCUSSION AND CONCLUSIONS
Continuous, long-term monitoring of radio flares fromtwo Algol-type binaries (� Per and � Lib) and two RS CVnbinaries (V711 Tau and UX Ari) with the Green BankInterferometer has provided a good database for the studyof activity cycles in these systems. The survey spanned 5.7years from 1995 January to 2000 October, with continuousmonitoring for 4.6 years. A similar 8 yr EUVE survey offlares on four of the most active RS CVn binaries includingV711 Tau and UX Ari (Sanz-Forcada, Brickhouse& Dupree 2002) has demonstrated the value of long-termsurveys. Parallel EUVE studies of Algol systems (Stern et al.1995) would provide a good database for comparisons.
The primary aim of our continuous radio campaign was todetermine the periodicity of flaring activity. Along the way,the campaign was successful in detecting many strong flareswith 8.3 GHz continuum fluxes as high as 1.17 Jy in � Per,and 1.44 Jy in V711 Tau, and 0.82 Jy in UX Ari. The fluxfrom � Lib was very weak with a maximum 8.3 GHz flux ofonly 0.034 Jy. Only two flares were observed from � Lib.
The period-finding techniques of Power Spectrum Analy-sis and Phase Dispersion Minimization were used to identifyflaring cycles in each system based on uninterrupted continu-ous strings of data, as well as the entire data set (see Table 2).Significant periodicities were found for � Per, V711 Tau, andUXAri. The results for � Lib were inconclusive.
The main results of the survey are as follows:
1. More flares were detected from � Per when it wasmonitored continuously (1995–2000) than when it wasmonitored infrequently (1971–1975) over similar intervalsof time.2. More flares were detected from � Per than from V711
Tau over the same time interval, but the flares on V711 Tauwere typically stronger than those on � Per.3. Figure 2 shows that both V711 Tau and � Per display
long-term cycles of apparently alternating active and quies-cent flaring activity. These cycles seem to last for more than500 days in both systems. Many flares occurred during theactive cycles, and almost no flares, or very weak flares, wereejected during the inactive cycles.
4. The flaring behavior of UX Ari was similar to that ofV711 Tau, but its flares were weaker than those of V711Tau.5. Flare events had various profiles. Most began with a
strong initial peak, with weaker peaks along the exponentialtail of the event. Other flares had the weaker peaks at nearlyconstant flux.6. The intensity dips in the flare profiles have been associ-
ated with eclipses of the flare source in the case of � Per.Similar dips in light curves of solar flares are thought to bethe result of intermittent production of nonthermal particlesduring the flare event. Perhaps this or other mechanismsdiscussed in x 3.1.2 might also explain the dips in the flareprofiles of active binaries.7. Flares from the four systems took 20–50 hours to rise,
with decay times of 10–40 days, over several orbital cycles.On the Sun, flares take 100 seconds to rise, and they decayover a few hours. The duration of a flare was correlated withthe total energy output during the flare. The most energeticflares took the longest time to decay.8. Plots of the flare profiles versus orbital phase show
that the strongest flares from the RS CVn binaries tend tooccur near � ¼ 0:5 or 1.0, with more flares visible near� ¼ 0:5 when the more active K star is toward the observer.In the Algols, the strongest flares were seen near � ¼ 0:0when the active cooler star was toward the observer.9. For all four systems, the spectral index was negative
for quiescent emission and was positive during flares. Thisbehavior is explained by a two-component model in whichthe quiescent emission arises from an inhomogeneous, opti-cally thin source, while the flares arise from a partially opa-que gyrosynchrotron source.10. Predictable flaring cycles were found for � Per, V711
Tau, and UX Ari. Flares on � Per have a periodicity of48:9� 1:7 days. The significant periodicities were120:7� 3:4 days and 80:8� 2:5 days for V711 Tau, with141:4� 4:5 days and 52:6� 0:7 days for UX Ari. Theanalysis of the � Lib data produced inconclusive results.11. Patterns of alternating active and quiescent flaring
activity similar to that seen on the Sun can be identifiedfrom the radio flux variations observed in this survey anddisplayed in Figure 2. These cycles appear to last for morethan 500 days in V711 Tau and also in � Per (x 3.1). It washoped that our period search analysis would have identifiedthese longer term cycles of active and quiescent flaringactivity; however, the survey was not long enough to yieldsuch results.12. The dominant periodicities found from the analysis
suggest that strong flares occur roughly every 17 orbitalcycles on � Per, every 42.5 orbits on V711 Tau, and every 22orbits on UX Ari (Table 4). These are strong correlationswith the orbital periods of these binaries (see item 8 above).
The results for UX Ari can be compared to thoseobtained by Massi et al. (1998) using data collected non-continuously over 965 days. Their work represents the onlyother radio flare period search analysis of this kind. Ourcoverage of this system lasted for 1126 days, with uninter-rupted monitoring for 968 days. Massi et al. (1998) used thesame two techniques as described in x 3.2 to derive activitycycles of 25.5 days and 158 days for UX Ari. They foundthat the polarization reversed itself during the 25.5 day cycleand returned to its initial value after approximately twoconsecutive cycles of activity. Our analysis provided
No. 2, 2003 CONTINUOUS MONITORING OF RADIO FLARES 359

periodicities of 52.6 days and 141.4 days for this system.These results are based on 9 times more data (2473 observa-tions) than used by Massi et al. (1998) (269 observations)and hence have greater significance. Our 52.6 day cyclewould correspond to two consecutive 25.5 day cycles, or the57 day cycle, reported by Massi et al. (1998), but we foundno dominant 25 day cycle from our analysis. Our value ofthe 141.4 day cycle is close to their 158 day cycle.
The systems of � Per and V711 Tau were chosen for thesurvey because they have magnetically active componentsof similar spectral types, as well as similar orbital periodsand distances from the Sun. V711 Tau and UX Ari havevery similar components but are different distances from theSun. Our long-term continuous radio flare survey hasshown that the Algol-type binary ejects flares morefrequently than the RS CVn binaries, although these lattersystems contain at least two magnetically active stars. In thecase of � Lib, there is substantial evidence that mass transferproduces very little, if any, accretion structures in this sys-tem (Richards & Albright 1999; Richards 2001). Perhapsthe ongoing process of mass transfer in the Algols providesa mechanism for enhancing the flare activity, while produc-ing slightly weaker flares than seen in the RS CVn binaries.This flaring activity could, in turn, influence the mass trans-fer process by supplying periodic injections of hot gas to thehotter companion in the Algols. If we assume that the time-scale for these periodic injections is comparable to the domi-nant flaring periodicity in � Per (� 50 days), then we canbegin to predict changes in the distribution of accretionstructures like those seen by Richards (2001) in the Algolsystems U CrB and U Sge. Continuous monitoring of the
accretion structures in these systems over this time intervalshould provide us with a better understanding of masstransfer in the Algols.
The Guest Observer monitoring program was endedwhen the Green Bank Interferometer (GBI) wastemporarily retired at the end of 1996 March. Themonitoring program was revitalized with funding fromNASA from 1996 November to 2000 October. We thankthe United States Naval Observatory (USNO), the NavalResearch Laboratory (NRL), and the National RadioAstronomy Observatory (NRAO) for their commitmentto this project for such a long time. The GBI is a facilityof the National Science Foundation and was operatedduring the collection of these data by the NRAO withfunding provided by the USNO, NRL, and NASA.M. T. R. is grateful to the Institute for Advanced Studyin Princeton for their support while she was on leavethere during the 2000–2001 academic year. We thankDavid Gibson for the use of his data, Petr Harmanec forthe use of his PDM code, Andrea Dupree for commentson the research, the referee for comments on the manu-script, and Bob Hjellming, posthumously, for his supportof long-term monitoring projects with the GBI. TheSuperMongo plotting program of Lupton & Monger(1977) was used for this research. This work was partiallysupported by Air Force Office of Scientific Researchgrants (AFOSR) F49620-92-J-0024 and F49620-94-1-0351, NSF grants AST-9618461 and AST-0074586, andNASA grant NAG 5-3056 to M. T. R.
REFERENCES
Agrawal, P. C., & Vaidya, J. 1988,MNRAS, 235, 329Albright, G. E., &Richards,M. T. 1996, ApJ, 459, L99Antunes, A., Nagase, F., &White, N. E. 1994, ApJ, 436, L83Baliunas, S. L., & Vaughan, A. H. 1985, ARA&A, 23, 379Benz, A. O. 1995, in IAU Colloq. 151, Flashes and Flares, ed. J. Greiner,H. W. Duerbeck, & R. E. Gershberg (Lecture Notes in Physics 454;Berlin: Springer), 23
Berdyugina, S. V., & Tuominen, I. 1998, A&A, 336, L25Blondin, J.M., Richards,M. T., &Malinkowski, M. 1995, ApJ, 445, 939Bopp, B., & Fekel, F., Jr. 1976, AJ, 81, 771Carlos, R. C., & Popper, D.M. 1971, PASP, 83, 504Damon, P. E., & Sonett, C. P. 1991, in The Sun in Time, ed. C. P. Sonett,M. S. Giampapa, &M. S.Matthews (Tucson: Univ. Arizona Press), 360
Duemmler, R., &Aarum, V. 2001, A&A, 370, 974European Space Agency. 1997, The Hipparcos Catalogue (ESA SP-1200;Paris: ESA)
Favata, F., & Schmitt, J. H.M.M. 1999, A&A, 350, 900Fekel, F. C. 1983, ApJ, 268, 274Gibson, D.M. 1976, Ph.D. thesis, Univ. VirginiaGibson, D.M., Hjellming, R.M., &Owen, F. N. 1975, ApJ, 200, L99Hall, D. S. 1989, Space Sci. Rev., 50, 219Haisch, B., & Schmitt, J. H.M.M. 1996, PASP, 108, 113Haisch, B., Strong, K. T., &Rodono,M. 1991, ARA&A, 29, 275Hogg, D. E., MacDonald, G. H., Conway, R. G., &Wade, C.M. 1969, AJ,74, 1206
Jones, K. L., Brown, A., Stewart, R. T., & Slee, O. B. 1996, MNRAS, 283,1331
Kaitchuck, R. H., Schlegel, E. M., Honeycutt, R. K., Horne, K., Marsh,T. R.,White, J. C., &Mansperger, C. S. 1994, ApJS, 93, 519
Koch, R. H. 1962, AJ, 67, 130Kurster, M. 1994, in ASP Conf. Ser. 64, Cool Stars, Stellar Systems and theSun, ed. J.-P. Caillault (San Francisco: ASP), 104
Lupton, R., &Monger, P. 1977, The SuperMongo ReferenceManualMarsh, T. R., &Horne, K. 1988,MNRAS, 235, 269Massi, M., Neidhofer, J., Torricelli-Ciamponi, G., & Chiuderi-Drago, F.1998, A&A, 332, 149
Mouradian, Z., & Soru-Escaut, I. 1995, Sol. Phys., 159, 173Mutel, R. L., Molnar, L. A., Waltman, E. B., & Ghigo, F. D. 1998, ApJ,507, 371
Mutel, R. L., Morris, D. H., Doiron, D. J., & Lestrade, J.-F. 1987, AJ, 93,1220
Noyes, R.W.,Weiss, N. O., & Vaughan, A. H. 1984, ApJ, 287, 769
Osten, R. A., & Brown, A. 1999, ApJ, 515, 746Ottman, R. 1994, A&A, 286, L27Owen, F. N., &Gibson, D.M. 1978, AJ, 83, 1488Press, W. H., Flannery, B. P., Teukolsky, S. A., & Vetterling, W. T. 1986,Numerical Recipes (Cambridge: CambridgeUniv. Press)
Priest, E. R. 1995, in IAU Colloq. 151, Flares and Flashes, ed. J. Greiner,H. W. Duerbeck, & R. E. Gershberg (Lecture Notes in Physics 454;Berlin: Springer), 3
Richards,M. T. 1990, ApJ, 350, 372———. 1993, ApJS, 86, 255———. 2001, in Astrotomography: Indirect Imaging Methods in Observa-tional Astronomy, ed. H. Boffin, D. Steeghs, & J. Cuypers (LectureNotes in Physics 573; Berlin: Springer), 276
Richards,M. T., &Albright, G. E. 1993, ApJS, 88, 199———. 1996, in Stellar Surface Structure, ed. K. Strassmeier (Dordrecht:Kluwer), 493
———. 1999, ApJS, 123, 537Richards,M. T., Albright, G. E., & Bowles, L.M. 1995, ApJ, 438, L103Richards,M. T., Jones, R. D., & Swain,M. A. 1996, ApJ, 459, 249Richards,M. T.,Mochnacki, S. W., & Bolton, C. T. 1988, AJ, 96, 326Richards,M. T., &Ratliff,M. A. 1998, ApJ, 493, 326Richards, M. T., & Russell, S. E. 1998, in ASP Conf. Ser. 154, TenthCambridge Workshop on Cool Stars, Stellar Systems, and the Sun, ed.R. A. Donahue& J. A. Bookbinder (San Francisco: ASP), 1551
Richards, M. T., Waltman, E. B., Foster, R. S., & Ghigo, F. 1998, in ASPConf. Ser. 154, Tenth Cambridge Workshop on Cool Stars, StellarSystems, and the Sun, ed. R. A. Donahue & J. A. Bookbinder (SanFrancisco: ASP), 1546
Richards,M. T.,Waltman, E. B., &Ghigo, F. 2002, BAAS, 34, 653Robinson, E. L., Marsh, T. R., & Smak, J. I. 1993, in Accretion Disks inCompact Stellar Systems, ed. J. C. Wheeler (Singapore: WorldScientific), 75
Sanz-Forcada, J., Brickhouse, N. S., &Dupree, A. K. 2002, ApJ, 570, 799Simon, T. 1990, ApJ, 359, L51Singh, K. P., Drake, S. A., &White, N. E. 1995, ApJ, 445, 840Skumanich, A. 1972, ApJ, 171, 565Stellingwerf, R. F. 1978, AJ, 224, 953Stern, R. A., Lemen, J. R., Schmitt, J. H. M. M., & Pye, J. P. 1995, ApJ,444, L45
Stewart, R. T., Slee, O. B., White, G. L., Budding, E., Coates, D. W.,Thompson, K., & Bunton, J. D. 1989, ApJ, 342, 463
Tanaka, K., & Zirin, H. 1985, ApJ, 299, 1036
360 RICHARDS ET AL. Vol. 147
Tomkin, J. 1978, ApJ, 221, 608Torricelli-Ciamponi, G., Franciosini, E., Massi, M., & Neidhofer, J. 1998,A&A, 333, 970
Trigilio, C., Leto, P., &Umana, G. 1998, A&A, 330, 1060Trigilio, C., Umana, G., &Migenes, V. 1993,MNRAS, 260, 903Umana, G., Catalano, S., & Rodono,M. 1991, A&A, 249, 217Umana, G., Trigilio, C., & Catalano, S. 1998, A&A, 329, 1010Umana, G., Trigilio, C., Tumino, M., Catalano, S., & Rodono, M. 1995,A&A, 298, 143
Wade, C.M., &Hjellming, R.M. 1971, ApJ, 170, 523Waltman, E. B., Fiedler, R. L., Johnston, K. J., & Ghigo, F. D. 1994, AJ,108, 179
Wilson, P. R. 1994, Solar and Stellar Activity Cycles (Cambridge:Cambridge Univ. Press)
Worek, T. F. 2001, PASP, 113, 964
No. 2, 2003 CONTINUOUS MONITORING OF RADIO FLARES 361