statistical analysis of dns abuse in gtlds final report analysis of dns abuse in gtlds final report...
TRANSCRIPT

Statistical Analysis of DNS Abuse in gTLDsFinal Report
Maciej Korczynski⇤, Maarten Wullink†, Samaneh Tajalizadehkhoob⇤,Giovane C.M. Moura†, Cristian Hesselman†
⇤Delft University of Technology, The Netherlands†SIDN Labs, The Netherlands
{Maciej.Korczynski, S.T.Tajalizadehkhoob}@tudelft.nl{Maarten.Wullink, Giovane.Moura, Cristian.Hesselman}@sidn.nl
Abstract—Commissioned by the Competition, Consumer Trust,and Consumer Choice Review Team with the support of ICANN,this study is focused on measuring rates of common forms ofabusive activities in the domain name system. We conduct acomprehensive study examining malicious behavior in the globalDNS and compare abuse rates in new and legacy gTLDs. Wecombine data sets from many sources, including zone files,domain WHOIS information, data obtained through our activemeasurements, and 11 reputable blacklists representing malware,phishing, and spam. We find that the new gTLDs have impactedspam counts of the legacy gTLDs: abused domains in the newgTLDs do not increase the number of total malicious registrationsbut instead, we observe a decrease in the number of maliciousregistrations in legacy gTLDs. While legacy gTLDs collectivelyhad a spam-domains-per-10,000 rate of 56.9, in the last quarter of2016, the new gTLDs experienced a rate of 526.6–which is almostone order of magnitude higher. In this study, we also analyze therelationship between the collected security indicators and thestructural properties of new gTLDs, and abuse, at the level ofgTLDs. The results indicate that abuse counts primarily correlatewith stricter registration policies. Our findings suggest that somenew gTLDs have become a growing target for malicious actors.While the analysis of spam blacklists reveals that approximatelyone third of the new gTLDs available for registration did notexperience a single incident in the last quarter of 2016, Spamhausblacklisted at least 10% of all registered domains in 15 newgTLDs.
I. INTRODUCTION
As a result of a many-year multi-stakeholder policy devel-opment process, the Internet Corporation for Assigned Namesand Numbers (ICANN) introduced the New Generic Top-Level Domain (gTLD) Program (the Program), which hasenabled hundreds of new gTLDs to enter the domain namesystem (DNS) since the first delegations occurred in October20131. The Program was developed to increase competitionand choice in the domain name space. More than 1,900 ap-plications for new gTLDs were filed after the process openedin 2012. To date, more than 1,200 new gTLDs have beendelegated to the DNS’ root zone. However, while the NewgTLD Program may increase the range of available gTLDsavailable to consumers, it may also create new opportunitiesfor cybercriminals.
1https://gnso.icann.org/en/group-activities/inactive/2007/new-gtld-intro
A number of safeguards were built into the Program thatwere intended to mitigate the rates of abusive, malicious,and criminal activity in these new gTLDs, such as phishing,spam, and malware distribution. ICANN is currently engagedin a review of these safeguards and their effects on rates ofDNS abuse as an aspect of the Competition, Consumer Trust,and Consumer Choice Review2. In this paper, we conduct acomprehensive study examining rates of malicious and abusivebehavior in the global DNS and compare abuse rates innew gTLDs and legacy gTLDs. As the DNS represents alarge ecosystem of registries, registrars, privacy/proxy serviceproviders, etc. the study aims to capture inputs in a represen-tative manner from across the multitude of players relevant toabusive practices.
Previous research studied the impact of the New gTLDProgram on the domain name ecosystem [1]. Halvorson etal. concluded that speculative and defensive registrationsdominate the growth of registrations in new gTLDs. Theyalso found that the new gTLDs have yet to have significantimpact on the legacy gTLDs. Their work, however, providesa very little empirical information about the security of newgTLDs. In this paper, we analyze the impact of the New gTLDProgram on the DNS abuse landscape and assess if legacyand new gTLDs are seen by miscreants as interchangeable.Overall, our main contributions can be summarized as follows:
• We make a comprehensive descriptive statistical compar-ison of rates of DNS abuse in new and legacy gTLDs asthey pertain to spam, phishing, and malware distribution.
• Using regression modelling we perform inferential sta-tistical analysis testing the correlation between passivelyand actively measured properties of new gTLDs as pre-dictors of rates of abuse.
• We analyze proportions of abusive domains across otherrelevant to abusive practices players, i.e. registrars andprivacy/proxy service providers.
Our findings demonstrate a number of notable trends inrelation to the new gTLD landscape and cybercriminal activity.While we find higher concentrations of compromised (hacked)domains in legacy gTLDs, miscreants frequently choose to
2https://newgtlds.icann.org/en/reviews/cct/dns-abuse
1
register domain names using one of the new gTLDs. Wealso find that the new gTLDs have significant impact onabuse counts of the legacy gTLDs. Interestingly, maliciouslyregistered spam domains in the new gTLDs do not increase thenumber of total malicious registrations. Instead, we witness adecrease in the number of malicious registrations in legacygTLDs. An analysis of the Spamhaus blacklist reveals thatin the last quarter of 2016, new gTLDs collectively hadapproximately one order of magnitude higher spam-domains-per-10,000 rate in comparison to legacy gTLDs.
We also systematically analyze how different structural andsecurity-related properties of new gTLD operators influenceabuse counts. Our inferential analysis reveals that abuse countsprimarily correlate with stricter registration policies. Finally,the analysis of proportions of abusive domains across newgTLDs, registrars, and privacy/proxy service providers revealsentities suffering from very high concentrations of abused do-mains. We find new gTLDs and registrars with concentrationsof blacklisted domains above 50%, in particular a registrarwith over 90% of its domains reported as abusive by SURBL.
II. BACKGROUND
ICANN [2] is responsible for maintaining the root names-pace and its expansion with new top-level domains (TLDs),in particular new gTLDs, and delegates the responsibility tomaintain an authoritative source for registered domain nameswithin a TLD to registry operators. ICANN holds registriesresponsible for complying with the terms of a registry agree-ment. Domain registries manage the registration and delegationof domain names within their TLDs.
The DNS represents a large ecosystem and several otherentities play a role for a domain name to be registered,secured and maintained on the Web. Domain registrars managethe registration of Internet domain names. They are gener-ally accredited by TLD registries and may be accredited byICANN. Web hosting providers maintain server infrastructurethat is used to host content for the domain. DNS providersoperate DNS servers that map domain and host names to thecorresponding IP addresses. The WHOIS Privacy and Proxyservice providers conceal certain personal data of domainname registrants. Registrants are individuals or organisationsthat hold or manage domain names. The aim of this study isto capture inputs in a representative manner from across thismultitude of players relevant to abusive practices.
A. Generic TLDs
The first group of generic top-level domains (gTLDs) wasdefined by RFC 920 [3] in October 1984 and introduced afew months later. The initial group of gTLDs (.gov, .edu,.com, .mil, .org, and .net) were distinct from country-codeTLDs (ccTLDs). Until 2012, several gTLDs were approvedand further introduced by ICANN, including a set of sponsoredgTLDs such as .asia, .jobs, .travel, or .mobi. In this paper, werefer to all gTLDs introduced before the New gTLD Programinitiated by ICANN in late 2013 as legacy gTLDs. In thisstudy, we analyze a set of 18 legacy gTLDs (.aero, .asia, .biz,
.cat, .com, .coop, .info, .jobs, .mobi, .museum, .name, .net,
.org, .post, .pro, .tel, .travel, and .xxx) for which we were ableto obtain zone files and WHOIS data. We contrast them withthe new gTLDs.
B. New gTLDs
ICANN’s New gTLD Program started in 2012 and expandedthe root zone by delegating more than 1,200 new gTLDssince October 2013 [4]. To obtain a new gTLD, applicantsare required to undergo an intensive application and evaluationprocess [1] that includes screening the applicants technical andfinancial capabilities for operating a new gTLD.
Ultimately, after a new gTLD is assigned to an applicant,it will then be delegated to the root zone. Following initialdelegation, each new gTLD registry is required to have a“sunrise” period of at least 30 days, during which trademarkholders have an advance opportunity to register domain namescorresponding to their marks before names are generallyavailable to the public.
New gTLDs can be classified into four broad cate-gories [5]3:
• Standard or generic gTLD [7]: is a gTLD that is gen-erally open for public registration, e.g. .movie, .xyz, or.family. While most of these gTLDs are open to publicregistration, some registries may impose restrictions onwho or which entities can register in their domains.
• Community gTLD [8]: this category covers gTLDs thatare restricted to a specific community, such as .thai, .radioor .pharmacy.
• Geographic gTLD [9]: this type of gTLD covers cities,states, or regions, e.g. .amsterdam or .berlin.
• Brand gTLD [10]: for companies seeking to have theirspecific brand as a gTLD, such as .google or .hitachi.
In our study, we analyze new gTLDs that are intended forpublic use. Therefore, we excluded the great majority of brandgTLDs for which domains cannot be registered by regularusers4, in particular for malicious purposes. This study coversnew gTLDs for which registries have submitted their sunrisedate information requested by ICANN. In the first quarter of2014, there were 77 new gTLDs for which the sunrise periodended and domain names were available for public registration.For comparison, by the end of 2016 the group consisted of 522new gTLDs.
C. Safeguards Against DNS Abuse
In preparation for the New gTLD Program, ICANN soughtadvice from different DNS abuse and security experts toexamine the potential for increases in criminal activity inan expanded DNS in order to further determine a numberof possible measures to preemptively mitigate abusive andmalicious activities [11], [12]. As a result of broad discussionwith multiple stakeholders such as Anti Phishing Working
3Note that some gTLDs cross categories. For example, some communitygTLDs such as .madrid are also geographic gTLDs [6].
4With a few exceptions such as .allfinanz or .forex brand gTLDs for whichthe sunrise period has been announced and ended.
2

Group (APWG), Registry Internet Safety Group (RISG), theSecurity and Stability Advisory Committee (SSAC), ComputerEmergency Response Teams (CERTs) and members of thebanking/financial, and Internet security communities, ICANNproposed 9 safeguards that can be summarized under thefollowing four key subject categories [11]:
• How do we ensure that bad actors do not run Registries?• How do we ensure integrity and utility of registry infor-
mation?• How do we ensure more effective effort to combat
identified abuse?• How do we provide an enhanced control framework for
TLDs with intrinsic potential for abuse?In this paper, we conduct a first comprehensive study
examining rates of malicious and abusive behavior in theglobal DNS and compare abuse rates in new and legacygTLDs. We aim to provide research to assess the generaleffectiveness of the proposed safeguards to mitigate DNSabuse that were described in ICANN’s “New gTLD ProgramExplanatory Memorandum: Mitigating Malicious Conduct”released in 2009 [11] and “New gTLD Program SafeguardsAgainst DNS Abuse” [12].
III. DATA COLLECTION
A. Blacklists
To assess the prevalence of maliciously registered5 andcompromised domains6 per gTLD and registrar, we use 11heterogeneous blacklists representing malware, phishing andspam generously provided to us by Spamhaus [13], the Anti-Phishing Working Group (APWG) [14], StopBadware [15],SURBL [16], the Secure Domain Foundation (SDF) [17]and CleanMX [18]. All six organizations provide reputabledomain or URL blacklists used in operational environments.The domain blacklist provided to us by Spamhaus consistof domains with low reputation collected from spam payloadURLs, spam senders and sources, known spammers, phishing,virus and malware-related websites. The list is built mainlyusing spamtraps and by monitoring emails. Spamhaus does anumber of checks to prevent legitimate domains being listed.As it is a near zero false positive list it is safe to use forproduction mail systems [19]. The APWG feed consists ofonline phishing URL block/white lists with accompanyingconfidence level indicators submitted by accredited usersthrough the eCrime Exchange (eCX) platform. Note that start-ing from September 2015 Facebook data, which representeda significant part of URLs, was excluded from the feed andit got a module of its own. The StopBadware Data SharingProgram (DSP) feed consists of URL blacklists shared byESET, Fortinet, and Sophos security companies [20]–[22],Internet Identity, Google’s Safe Browsing appeals results,the StopBadware community, and other contributors [23]. Inour study we also use four domain blacklists generouslyprovided by SURBL. SURBL ph is a phishing domain blacklist
5Domains registered by miscreants for the purpose of malicious activity6Domains hacked by miscreants, exploited through vulnerable web hosting
comprised of data supplied by MailSecurity, PhishTank, OITCphishing, PhishLabs, US DHS, NATO as well as data fromvarious corporations and numerous other sources includingproprietary data as well as information from traps [24]. SURBLjp blacklist contains domains analyzed and categorized asspam (e.g. uncategorized unsolicited) by jwSpamSpy software,traps, and participating mail servers. SURBL ws is similar andcontains mainly spam domains from SpamAssassin, ASSP aswell as information from other data sources including internaland external trap networks. SURBL mw list contains datafrom multiple sources that cover malicious domains used tohost malware websites, payloads or associated redirectors.This feed includes the DNS blackhole malicious site datafrom malwaredomains.com, OITC, Malware Domain List, USDHS, internal and external DGAs, Impact, trap data usingstatic and dynamic filtering and more [24]. The SDF feedcontains domains and URLs classified as phishing or malware.The domain names were queried against the Secure DomainFoundation’s Luminous API which aggregates data from opensource blacklist feeds and registrar suspension lists. At thetime of the queries, the SDF data included suspended domainnames provided by registrars and SDF-vetted data from AlienVault, APWG, Binary Defense Systems, Charles Haley, ChaosReigns, Dragon Research Group, Malwarebytes [25], MalcodeBlock List, MultiProxy, Malware Domain List, OpenBL.org,and pfBlockNG. Note that unlike the other data feeds, SURBLand SDF feeds cover the 2,5-year study period between July2014 and December 2016. Finally, CleanMX provided us threeURL blacklists containing phishing, malware websites, aswell as the “portals” feed that contain defaced, spamvertized,hacked, and other types of abused websites.
Table I shows the number of unique gTLD domain names,fully-qualified domain names (FQDNs)7 and URLs in thesedata feeds for 2014, 2015 and 2016. Notice that we define do-main names as 2nd-level or 3rd-level, or even nth-level domainnames, if a given TLD registry provides such registrations, e.g.*.gov.uk, *.co.uk, *.ac.uk, etc. To extract domain names fromour feeds, we use a modified version of the public suffix listmaintained by Mozilla [26]. Note that new gTLD registriesoffer uniquely 2nd-level domain registrations.
The distinction between different types of blacklists is veryimportant for the registry operators and other intermediariessuch as hosting providers or registrars. As previously ex-plained, StopBadware and APWG provide blacklists that focuson URLs. Some domain names in the URLs are registeredby miscreants for malicious purposes only. The majority ofdomain names in the URLs are however compromised do-mains, i.e. they were registered by legitimate users and hacked(see e.g. global phishing survey reports [27], [28]). From theoperational point of view blocking the domain name elementof a blacklisted URL might harm legitimate operations. Onthe other hand, Spamhaus and other data providers maintain
7FQDN is the name for a specific host that includes both a hostname anda domain name. For example, a FQDN for a hypothetical dns server mightbe ns1.domain.gov.uk, where ns1 is the hostname and domain.gov.uk is thedomain name.
3

3%, 38651
6%, 16956
4%, 16217
6%, 18292
4%, 14089
8%, 32250
64%, 2257450
11%, 36805
6%, 30486
56%, 2515494
0%, 38651
8%, 24251
12%, 47192
8%, 24034
9%, 28294
50%, 199567
0%, 20306
6%, 22201
7%, 32343
1%, 47408
0%, 16956
1%, 24251
15%, 58975
76%, 216851
37%, 109913
7%, 30405
0%, 12458
39%, 126995
1%, 7018
0%, 12905
0%, 16217
3%, 47192
21%, 58975
18%, 53388
39%, 114516
12%, 50211
0%, 15396
25%, 81039
2%, 13640
0%, 22294
0%, 18292
1%, 24034
79%, 216851
13%, 53388
32%, 94861
7%, 29395
0%, 14398
34%, 109909
2%, 10020
0%, 13754
0%, 14089
2%, 28294
40%, 109913
29%, 114516
33%, 94861
11%, 45188
0%, 8281
47%, 151027
1%, 6949
0%, 8581
0%, 32250
16%, 199567
11%, 30405
12%, 50211
10%, 29395
15%, 45188
0%, 34287
11%, 35837
5%, 23012
0%, 37135
37%, 2257450
1%, 20306
4%, 12458
3%, 15396
5%, 14398
2%, 8281
8%, 34287
9%, 31500
8%, 39084
55%, 2461450
0%, 36805
1%, 22201
46%, 126995
20%, 81039
38%, 109909
51%, 151027
9%, 35837
0%, 31500
2%, 13511
0%, 34066
0%, 30486
2%, 32343
2%, 7018
3%, 13640
3%, 10020
2%, 6949
5%, 23012
1%, 39084
4%, 13511
2%, 100450
42%, 2515494
3%, 47408
4%, 12905
5%, 22294
4%, 13754
2%, 8581
9%, 37135
70%, 2461450
10%, 34066
21%, 100450
51%, 3057139
26%, 326099
93%, 254648
49%, 193090
83%, 238393
79%, 231135
72%, 285625
84%, 2958861
80%, 257570
34%, 157179
74%, 3308182
spamhaus sbw apwg cleanMX pt sdf cleanMX ph cleanMX mw surbl ws surbl ph surbl mw surbl jp TOT
spamhaus
sbw
apwg
cleanMX pt
sdf
cleanMX ph
cleanMX mw
surbl ws
surbl ph
surbl mw
surbl jp
Figure 1. Pairwise overlap of feeds with unique domains as unit of abuse (2014-2016)
Table IOVERVIEW OF BLACKLISTS: UNIQUE BLACKLISTED GTLD DOMAIN
NAMES, FQDNS, AND URLS, FOR THE APWG, STOPBADWARE SDP,SPAMHAUS, CLEANMX, SDF AND SURBL DATASETS FOR 2014, 2015,
2016.
Year Dataset # domains # FQDNs # URLs
2014
StopBadware 403,347 728,007 1,522,548APWG 60,681 891,996 4,993,966
Spamhaus 1,901,970 – –SDF 41,094 93,324 723,523
CleanMX ph 68,523 86,838 269,770CleanMX mw 169,237 533,142 2,628,295CleanMX pt 205,051 251,181 526,599SURBL ph 68,208 – –SURBL mw 289,664 – –SURBL ws 1,229,698 – –SURBL jp 1,484,807 – –
2015
StopBadware 501,982 652,549 5,744,669APWG 139,538 1,665,839 20,221,682
Spamhaus 2,505,407 – –SDF 142,285 535,406 4,391,796
CleanMX ph 98,112 150,396 478,259CleanMX mw 117,140 263,218 1,002,658CleanMX pt 124,608 197,703 469,410SURBL ph 134,591 – –SURBL mw 220,073 – –SURBL ws 1,813,858 – –SURBL jp 2,475,745 – –
2016
StopBadware 502,579 586,181 2,998,978APWG 83,215 103,190 230,636
Spamhaus 3,944,684 – –SDF 110,687 122,326 264,465
CleanMX ph 138,869 207,984 738,385CleanMX mw 149,632 203,419 1,076,547CleanMX pt 68,413 108,145 829,533SURBL ph 173,326 – –SURBL mw 106,819 – –SURBL ws 2,023,178 – –SURBL jp 2,442,592 – –
blacklists of domain names and perform extensive checks toprevent legitimate domain names being listed. As a result, the
domain blacklists can be used by production systems to, forexample, block emails that contain malicious domain names.In this paper, we refer to both domains that appear in thedomain blacklists and domain name elements of blacklistedURLs as “abused domains” or “blacklisted domains”. Table IIprovides an overview of the blacklists used in our study andtheir corresponding types.
Table IIOVERVIEW OF BLACKLIST TYPES
StopBadware Malware URLsAPWG Phishing URLsSpamhaus Spam domainsSDF Other URLsCleanMX phishing Phishing URLsCleanMX malware Malware URLsCleanMX portals Other URLsSURBL ph Phishing domainsSURBL mw Malware domainsSURBL ws Spam domainsSURBL jp Spam domains
Figure 1 illustrates pairwise feed intersections as a matrix,with unique domain names as the unit for abuse. Note thatdarker shades of grey represent higher overlaps. For example,the overlap between Spamhaus and SURBL ws indicatesthat they have 2,257,450 domain names in common withinthe observation period. This overlap constitutes 37% of theSpamhaus feed. In comparison, 2,257,450 domain namesrepresent 64% of the SURBL ws feed. This is to be expectedas both blacklists contain the same type of abuse, i.e. spam(see Table II). The rightmost column indicates the absolutenumber and the percentage of samples that the blacklist hasin common with all other feeds combined. For instance theoverlap between Spamhaus and all other blacklists is equal to
4

3,054,837 and indicates that as many as 51% of all domainsblacklisted by Spamhaus are blacklisted by at least one otherblacklist.
B. WHOIS Data
Most of the blacklists used for this study contain no addi-tional domain name attributes such as registrar name or dateof registration. For the purposes of this study, these attributeswere obtained via a WHOIS database provided by a third-partyvendor [29] covering the 3-year study period (2014-2016). Thedatabase contains WHOIS information for the domains of 18legacy gTLDs: .aero, .asia, .biz, .cat, .com, .coop, .info, .jobs,.mobi, .museum, .name, .net, .org, .post, .pro, .tel, .travel, and.xxx. It also contains WHOIS information for the domains of1196 new gTLDs that have been delegated during the studyperiod [30].
The database uses temporal versioning, meaning that everydomain is scanned once in a 3 month period. Each scan periodcorresponds to a database version. For this study, which spans36 months, we have used 12 sequential versions of the WHOISdatabase. Table III lists each database version (Version) andthe number of TLDs (#TLDs) and domains (#Domains) foundin the version. The versioning timestamps are used to mapthe correct version of WHOIS data to a domain name ex-tracted from blacklisted URL. For example, we extract the<domain, registrar name> tuples from the WHOISdata and use these tuples to map the domain name elementfrom a blacklisted URL to a sponsoring registrar. The registrarname is used to determine the amount of abuse related tothe registrar. We also extract the <domain, creationdate> tuples to determine if the domain has been maliciouslyregistered or compromised (see subsection IV-D for moredetails).
During the domain name to WHOIS record mapping processwe found that a significant number of abusive domains couldnot be found in the available WHOIS data. We asked Domain-Tools [31] to provide the WHOIS data for the domains forwhich we did not have WHOIS details. Using the DomainToolsdata we could map an additional 6,081,870 abusive domains.
C. DNS Zone Files
In order to calculate sizes for each gTLD, we processedDNS zone files provided by ICANN and extracted the uniquedomains. The zone files contain data for every delegated newgTLD and for the following legacy gTLDs: .aero, .asia, .biz,.cat, .com, .coop, .info, .jobs, .mobi, .museum, .name, .net,.org, .post, .pro, .tel, .travel, and .xxx. A zone file describesa DNS zone and contains an authoritative list of registeredand delegated domains for the particular zone (gTLD). Sincethe list of domains contained in a zone is usually dynamic(domains are registered, expire, or have their records changed),the respective zone file is also dynamic. Different registriesalso apply different zone publication policies. For example,.com updates its zone every 5 minutes, while .nl updates itszone every 30 minutes.
Table IIIWHOIS DATA OVERVIEW: THE NUMBER OF TLDS (# TLD) AND DOMAIN
NAMES (# DOMAINS) FROM 2014, 2015, AND 2016.
Version #TLDs #Domains7 9 149,391,6358 9 149,994,2949 9 148,048,80610 369 157,677,49411 369 159,494,21412 565 159,254,21313 598 163,348,55614 713 166,608,40615 777 179,238,07416 947 183,951,58517 1,014 190,223,97118 1,191 193,521,942
ICANN has provided us with daily zone files for the 3-yearstudy period. Figure 2 shows a time series of number of dailyzone files we have used for this study. Note that some dropsindicate days when not all zone files were available due tooperational problems.
�
���
���
���
���
����
����
����
��� ����
��� ����
��� ����
��� ����
��� ����
��� ����
��� ����
��� ����
��� ����
��� ����
��� ����
��� ����
��� ����
�����
�����
����
Figure 2. Number of daily zone files obtained for this study.
We also relied upon zone files to determine the number ofDNS Security Extensions (DNSSEC)-signed domains for eachgTLD. One of the New gTLD Program safeguards require thatall new gTLD applicants have a specific plan for DNSSECdeployment [12]. We used this data in the inferential analysisas a proxy for security efforts of registries of new gTLDs.Using regular expressions we matched the DS records in thezone files and counted the distinct number of domains with DSrecords. The DS record is kept in the parent (TLD) zone andis used to prove the validity of cryptographic DNSSEC chain.If there is a DS record then this indicates that the domain hassupport for DNSSEC.
D. Active Web ScanUsing an existing Web crawling platform developed at SIDN
Labs we have crawled each new gTLD domain found in thezone files generated on May 2, 2017 (24,2 million domains).The number of legacy gTLD domains is too large to scanin the time available for this study, therefore we decided tocreate a representative sample of 16,7 million domains (fromthe same date) to scan.
The domains have been extracted from zone files that havebeen published shortly before we started crawling the domains.
5

We could have used the historical zone files to extract thedomains but using older zone files would result in more errordomains because domains could have been deleted in themeantime.
First, the crawler attempts to fetch the main website foreach domain by prepending the ‘www’ label to the domainand crawling the resulting FQDN, e.g. www.example.com. Ifthis results in an NXDOMAIN or another error the crawler willthen try to crawl the apex (naked domain) e.g. example.com.If both variants return an error then the domain is considerednon-responsive. If the crawler detects a redirect in either theretrieved HTML code or the HTTP headers then these redirectsare followed, a hard maximum limit of 5 redirects has beenconfigured. Any domain resulting in a crawl chain of morethan 5 redirects is marked as non-responsive.
The crawler is designed to have a minimal impact on theservers that are crawled. For this reason only the main pageis retrieved instead of the entire website. The data capturedfor each domain includes the HTML code, HTTP headers andstatus codes.
To determine if a domain is parked the HTML code isanalysed using pattern matching to search for strings, whichmight indicate the domain is for sale. The analyzer also looksfor URLs that are linked to known parking services provider.Any redirects to domains belonging to parking providers arealso recognized.
E. Active DNS Scan
During the domain scan process we also query the DNS toretrieve the A, AAAA and SOA records. The DNS crawler sendsqueries to a dedicated instance of the Unbound DNS resolverand analyzes the results. We use the SOA record to determine ifthe primary authoritative name server for the domain is linkedto a known parking services provider.
F. Passive Data for Registries
In this study we analyze new gTLDs whose domain namesbecame available for public registration within the studyperiod. As the time between the delegation of a new gTLDand the end of the sunrise period might take several months8,in our analysis we include new gTLDs after their sunriseperiods. This data has been provided by ICANN via theirpublic portal [30]. It contains 522 new gTLDs with sunriseperiods that ended before the end of the study period.
We also used a list of registry operators, their affiliates,and associated new gTLDs provided to us by ICANN. Wemapped gTLDs to related registry operators regardless of whatname they are operating under. We used the mapping of parentcompanies of registry operators and the corresponding newgTLDs in the inferential analysis as a proxy for registrationpractices.
We relied upon ICANN’s listings of new generic [7],community [8], geographic [9], and brand [10] gTLD registryapplications. We used this data in the inferential analysis as
8E.g. delegation of .zuerich: December 25, 2014 [32], zone file seen forthe first time: January 1, 2015, sunrise period termination: June 5, 2017 [30]
a proxy for restricted registration. We assigned registration“levels” to new gTLDs, from least to most restricted group: 1generic, 2 geographic, 3 community, and 4 brand. Intuitively,while generic gTLDs are normally unrestricted and open forpublic registration, registration policies of community or brandgTLDs are strict and may prevent miscreants from maliciousregistrations.
IV. METHODOLOGY
A. Security Metrics
To determine the distribution of abusive activities across thegTLDs and registrars we build on our previously proposedthree occurrence security metrics [33]. First, we analyze theoccurrence of unique abused domains.
Although, it is the most intuitive metric, it also has itslimitations. It may not give an indication of the amountof abuse coming from a given domain name. For example,modern botnets extensively employ domain generation algo-rithms (DGAs) to generate a daily list of domain namesand register a subset of those generated names as ren-dezvous points between compromised end users’ machines andcommand-and-control servers (e.g. 123.malicious.com, 234.malicious.com, 432.malicious.com) [34]. Or, a single do-main name registered for malicious purposes only (e.g.somedomain.com) may be used in several phishing campaignsagainst, for example, different banks (e.g. bankofamerica.somedomain.com, us.hsbc.com.somedomain.com, connect.secure.wellsfargo.somedomain.com) [28].
In terms of the number of unique domains (somedomain.com), the dynamic reputation system would assign the rep-utation score equal to 1. To overcome this limitation, wefurther analyze a second, complementary metric: the numberof unique fully qualified domain names (FQDNs). In bothexamples, the reputation system based on the number ofFQDNs would assign a score equal to 3 as we would observethree FQDNs generated by the attacker.
We encounter, however, some limitations using the secondapproach as well. A single FQDN of a compromised websitecould be used, for example, to distribute malware configurationand binary files or serve as dropzones, etc. using distinctivepaths (e.g. malicious.com/wp-content/file.php, malicious.com/wp-content/gate.php, etc.) [35].
This is why we analyze a third, complementary abuseoccurrence metric: unique blacklisted URLs aggregated byTLDs. It reveals information that is not captured by other twometrics, namely the amount of abuse associated with uniqueFQDNs. It stems from our previous work with the Dutchnational police [36]. Our analysis of URLs used to distributechild abuse material revealed that some FQDNs are used moreextensively by miscreants. In fact, one FQDN can be used toshare one abusive image, whereas another can distribute tensor hundreds of images. Our manual analysis of other types ofabuse such as malware or phishing confirms this trend.
Reliable reputation metrics have to account for a commonlyobserved trend that larger market players such as broadband orhosting providers tend to experience a larger amount of abuse
6

���������������������������
��� ����
��� ����
��� ����
��� ����
��� ����
��� ����
��� ����
��� ����
��� ����
��� ����
��� ����
��� ����
��� ����
����
����
����������
����
����� ��� ����� ������ �����
Figure 3. Absolute growth of legacy gTLD, new gTLDs and all gTLDs.
[36]. For that reason, each of the previously proposed metricsare normalized by the size of the corresponding gTLDs orregistrars which we discuss in the following section.
B. Size Estimate of TLDs
To obtain a meaningful, quantitative security metric rep-resenting the distribution of domains listed in blacklists pergTLD, we first need to estimate their sizes. The obtainedsizes can be used as a normalization factor for the amountof abuse in each gTLD or as an explanatory factor for theconcentrations of abused domains. Once normalized, gTLDscan be compared in terms of the prevalence of abusivedomains, FQDNs, and URLs.
We calculate the size of each gTLD by counting the numberof 2nd-level domain names present in a zone file of eachgTLD at the end of the observation period. We utilized zonefiles obtained from ICANN as they are the most accurate forgTLD sizes. For example, to calculate abuse rates for the firstquarter of 2014, we used the number of domains present in thezone files on March 31, 2014. An alternative would be to usethe ICANN monthly reports that summarize domain activityfor all registered domains [37]. Some registrants, however,purchase domains and do not associate them with the nameservers. Therefore, they are not present in the zone files but areincluded in the monthly ICANN summaries. As the numberof domains in a TLD registry can be seen as an approximationof the attack “surface size” for cybercriminals [33], [36], [38],the number of domains found in a zone file is more accurate.
Figure 3 shows the absolute growth of legacy and newgTLDs during the 3-year study period between January 2014and December 2016. Starting from the first quarter of 2016 thenumber of domains in new gTLDs grows considerably in com-parison to the legacy gTLDs, for which the size stays relativelyconstant. However, as the gTLD market share remains highlydisproportionate (there are many more legacy gTLD domains,in particular .com domains), one might expect the absolutenumber of abused .com domains to be significantly higherin comparison to the rest of the market. For completeness,Figure 4 shows the absolute growth of the top 5 largest newgTLDs respectively at the end of 2016. We do not present theabsolute growth of the top 5 largest legacy gTLDs (.com, .net,.org, .info, .biz) as they remain stable during the entire study
period (approximately 127M, 15.5M, 10.5M, 5.4M, and 1M,at the end of 2016, respectively).
�
����
����
����
����
����
����
����
��� ����
��� ����
��� ����
��� ����
��� ����
��� ����
��� ����
��� ����
��� ����
��� ����
��� ����
��� ����
��� ����
����
����
�����������
����
���� ��� ���� ��� ���
Figure 4. Absolute growth of top 5 largest new gTLDs as of end of 2016.
The TLD size can also be used as an explanatory factorfor the concentrations of abused domains [33], [36], [38].However, it is unclear what portion of the domains are in useand serve content. Halvorson et al. have shown, for example,that in 2015 there were as many as 16% of domains innew gTLDs with NS records that did not resolve [1]. Usingour Web and DNS crawling platform, we performed a newscan and classified each domain to one of the five groups:i) No DNS domains that do not resolve when queried by ourDNS crawler, ii) Parked domains that are owned by parkingservices, advertisement syndicators, and advertisers. We followthe classification methodology outlined by Vissers et al. [39],iii) HTTP Error domains for which authoritative NS serversreturn valid responses but the corresponding websites do notreturn an HTTP 200, vi) Redirect domains are redirected to adifferent domain, and v) Content domains serve a valid Webcontent to their users.
Figure 5 shows the categorization results for all domains inthe new gTLDs and a random sample of the legacy gTLDs. In-terestingly, we find a significant increase in erroneous domainsin new gTLDs (“No DNS” and “HTTP Error” categories) incomparison to legacy gTLDs. “No DNS” domains accountfor about a quarter of all domains (24.2%), whereas domainsfor which the corresponding websites serve an HTTP erroraccount for another 12.2%.
Note that we use the measurement data in the inferentialanalysis to correct for TLD sizes. Intuitively, only the domainsserving content are exposed to certain types of vulnerabilitiesand can be hacked. On the other hand, parked domains maybe used to scam users or to distribute malware. One mighttherefore expect a positive correlation between the number ofparked domains and maliciously registered domains.
C. Size Estimate of Registrars
We calculate the registrars’ size from the WHOIS data bycounting the number of distinct domain names linked to eachregistrar name. A problem with this method is that the WHOISdata may contain multiple name variants for a registrar, eachof these names may slightly differ. For example, GoDaddyis found as a registrar using 52 distinct name variations,
7

0 20 40 60 80 100
new gTLDs
legacy gTLDs
Redirect Parked HTTP error No DNS Content
Figure 5. Categorization for all domains in the new TLDs and a randomsample of the legacy TLDs.
e.g. “GODADDY.COM, LLC”, “GoDaddy.com, LLC (R91-LROR)” and “GoDaddy.com, Inc.”. This means we needto perform an additional entity resolution step to be ableto group together all the different registrar name variantsas a single registrar. We also used the IANA Registrar IDwhich is assigned to ICANN accredited registrars. The IANAwebsite [40] lists every accredited registrar together with thecorresponding ID.
Using a script, this list of registrar names was automaticallymatched against every registrar name found in the WHOIS data.After this step we still needed to manually map the registrarvariants that could not be mapped automatically.
A limitation of our approach is that the WHOIS databaseonly contains domains for legacy gTLDs and new gTLDs. Thismeans that we are missing registrar information for all ccTLDsneeded to estimate the size of each registrar. Accordingto our previous research, there are at least 139M domainsoperated by registries of ccTLDs [33]. This is, however, justan approximation as the great majority of ccTLD registries donot make their zone files available to third parties. Anotherlimitation is that the “registrarname” attribute in the availableWHOIS data contains an empty string for 0.5% of all records 9.
To determine the amount of abuse related to a registrar,we map each domain found in a blacklist to its respectiveWHOIS record which contains the registrar information. TheWHOIS data uses temporal versioning, which means it maycontain multiple versions of each domain, with each versionauthoritative for a distinct time period. To determine whichversion of a domain we should use, we use the date a domainwas added to the blacklist and try to find the WHOIS versionwith the closest enclosing time-window10.
D. Compromised Versus Maliciously Registered Domains
Distinguishing between compromised and maliciously regis-tered domains is critical because they require different mitiga-tion actions by different intermediaries. For example, hostingproviders have a larger role to play in cleaning up contentof compromised websites whereas domain registrars are moreresponsible for suspending domains registered by miscreants
9The lack of registrar name is due to two reasons: the WHOIS databasecontains domains that are reserved and domains with missing WHOIS recordsdue to the domains having expired.
10We do not differentiate these domains from domains that have been re-registered for malicious purposes (“recidivist”).
for malicious purposes. Note that in practice, many largemarket players play multiple roles. For example, GoDaddyoffers registration, web hosting, and DNS services.
To distinguish between compromised and maliciously regis-tered domains we build on three heuristics previously used indomain abuse surveys (e.g. global phishing survey by Aaronand Rasmussen [41]). More specifically, we label a domain asmaliciously registered if it was involved in criminal activitywithin a relatively short time after its registration or if it con-tains a brand name or a misspelled variant of brand name. Weflag a domain as malicious if it is blacklisted within 3 monthsafter its registration. Aaron and Rasmussen have recentlyexamined the delay between the time when phishing domainswere initially registered and when they were ultimately usedin attacks [41]. Their analysis indicates that miscreants tendto age the malicious domains they register to ensure a higherreputation score from security organizations. They concludedthat the great majority of the domains used for phishingwere maliciously registered within three months before theywere used in an attack. To estimate the time between originalregistration and blacklisting, we analyze domain WHOIS in-formation and extract the domain creation date. According tothe Registrar Accreditation Agreement [42], the creation dateof the domain registration cannot be changed as long as thedomain does not expire.
Furthermore, Aaron and Rasmussen identified 783 uniquephishing target organizations in 2015 and 679 in 2016, amongwhich the most popular ones were PayPal, Yahoo!, Apple,and Taobao [41]. We use this information to create a list ofkeywords that the attackers may incorporate in maliciouslyregistered domain names. As the great majority of phishingattacks target the most popular organizations, we extracted 300keywords of the most popular domains according to the Alexaranking and we labeled each blacklisted domain as maliciouslyregistered if it contains an extracted string or its misspelledversion. For example, 0paypalpayment.com would be labeledas malicious as it contains a string paypal. To test if thedomain contains a misspelled keyword, we first remove alldigits from a domain name and split the resulting string intowords with the “–” character. We compute the Levenshteinedit distances between the predefined keywords and a set ofwords derived from a domain name. If any Levenshtein editdistance is smaller than 2, we label the domain as maliciouslyregistered. We provide a discussion on limitations of theseheuristics later.
Note that from the categorization process we exclude alist of 11,075 domains of legitimate services that tend tobe misused by miscreants. These represent a separate, thirdgroup of domains that are neither maliciously registered norhacked (i.e. third party domains). For example, bit.ly–a domainused by a legitimate URL shortener service–could be usedby an attacker to create a malicious URL (e.g. bit.ly/dcsahy)that may further be used to redirect a legitimate user toa phishing website. In fact, previous research shows thatmiscreants extensively abuse a variety of services with goodreputations, affecting not only the reputation of those services,
8
but of entire TLDs [33]. The list is composed of the 10,000most popular domains according to Alexa [43] and our own,manually maintained lists of domains of legitimate services(332 domains of URL shorteners and 840 domains of freehosting providers). This group includes:
• Free hosting and dynamic DNS (DDNS) services of-fering shared higher-level domains, such as Hostinger, afree hosting provider offering subdomains, or No-IP freeDDNS providing e.g. *.no-ip.net subdomains.
• Content delivery network (CDN) services providingdownloadable content, such as CloudFront offered byAmazon Web Services *.cloudfront.net.
• Cloud-based file sharing services such as Google Drivecloud storage and file backup (googledrive.com/*) orDropbox (dl.dropbox.com/*) and their shortened versionssuch as db.tt/*, or the simple file sharing service providingURL shortening, ge.tt/*.
• Other legitimate applications such as URL shortenerservices like Google’s goo.gl/* or bit.ly/* operated byBitly, or blog post services, etc.
Domain types [%]0 20 40 60 80 100
Year
201420152016
Maliciously registered Compromised Legitimate Unlabelled
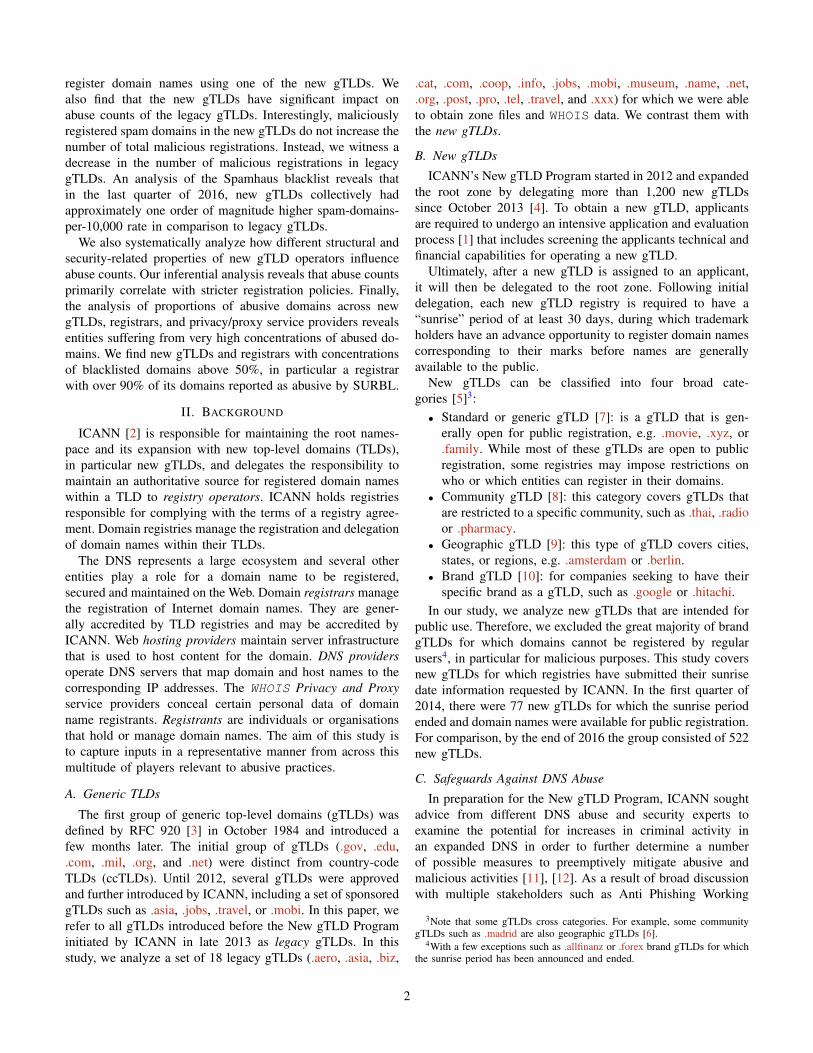
Figure 6. Categorization results: the fraction of maliciously registered,compromised, legitimate, and unlabelled domains for APWG feed in 2014,2015, and 2016.
Domain types [%]0 20 40 60 80 100
Year
201420152016
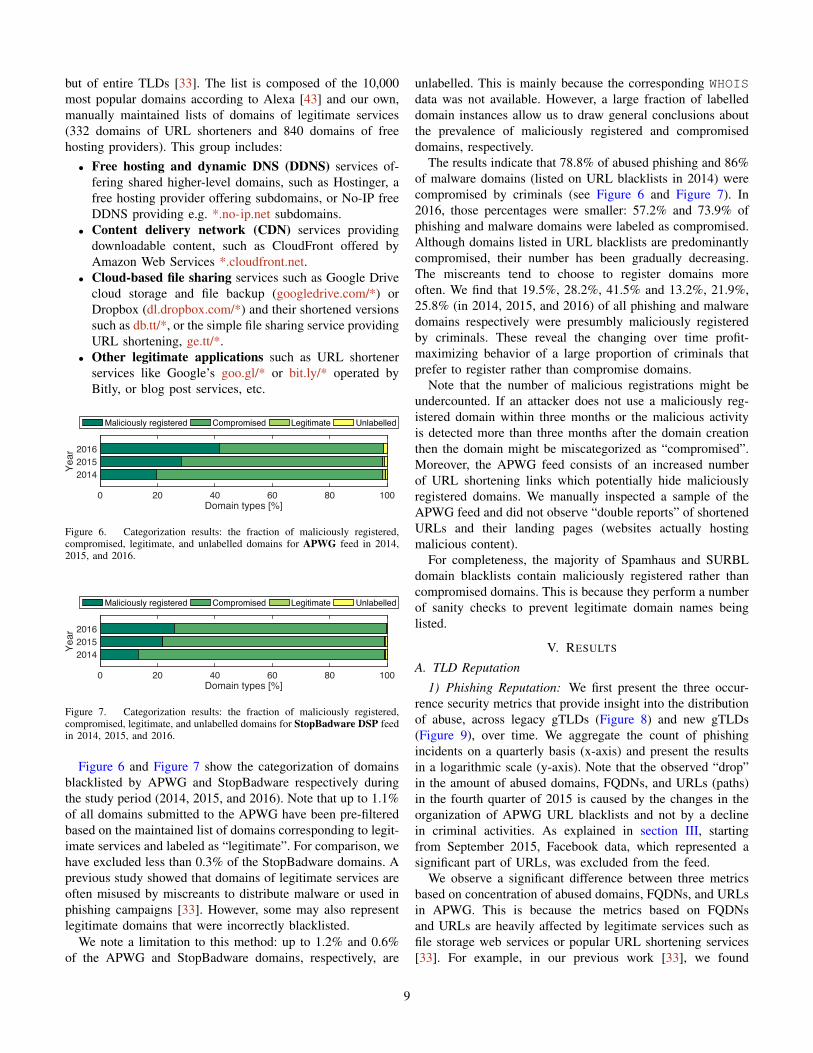
Maliciously registered Compromised Legitimate Unlabelled
Figure 7. Categorization results: the fraction of maliciously registered,compromised, legitimate, and unlabelled domains for StopBadware DSP feedin 2014, 2015, and 2016.
Figure 6 and Figure 7 show the categorization of domainsblacklisted by APWG and StopBadware respectively duringthe study period (2014, 2015, and 2016). Note that up to 1.1%of all domains submitted to the APWG have been pre-filteredbased on the maintained list of domains corresponding to legit-imate services and labeled as “legitimate”. For comparison, wehave excluded less than 0.3% of the StopBadware domains. Aprevious study showed that domains of legitimate services areoften misused by miscreants to distribute malware or used inphishing campaigns [33]. However, some may also representlegitimate domains that were incorrectly blacklisted.
We note a limitation to this method: up to 1.2% and 0.6%of the APWG and StopBadware domains, respectively, are
unlabelled. This is mainly because the corresponding WHOISdata was not available. However, a large fraction of labelleddomain instances allow us to draw general conclusions aboutthe prevalence of maliciously registered and compromiseddomains, respectively.
The results indicate that 78.8% of abused phishing and 86%of malware domains (listed on URL blacklists in 2014) werecompromised by criminals (see Figure 6 and Figure 7). In2016, those percentages were smaller: 57.2% and 73.9% ofphishing and malware domains were labeled as compromised.Although domains listed in URL blacklists are predominantlycompromised, their number has been gradually decreasing.The miscreants tend to choose to register domains moreoften. We find that 19.5%, 28.2%, 41.5% and 13.2%, 21.9%,25.8% (in 2014, 2015, and 2016) of all phishing and malwaredomains respectively were presumbly maliciously registeredby criminals. These reveal the changing over time profit-maximizing behavior of a large proportion of criminals thatprefer to register rather than compromise domains.
Note that the number of malicious registrations might beundercounted. If an attacker does not use a maliciously reg-istered domain within three months or the malicious activityis detected more than three months after the domain creationthen the domain might be miscategorized as “compromised”.Moreover, the APWG feed consists of an increased numberof URL shortening links which potentially hide maliciouslyregistered domains. We manually inspected a sample of theAPWG feed and did not observe “double reports” of shortenedURLs and their landing pages (websites actually hostingmalicious content).
For completeness, the majority of Spamhaus and SURBLdomain blacklists contain maliciously registered rather thancompromised domains. This is because they perform a numberof sanity checks to prevent legitimate domain names beinglisted.
V. RESULTS
A. TLD Reputation
1) Phishing Reputation: We first present the three occur-rence security metrics that provide insight into the distributionof abuse, across legacy gTLDs (Figure 8) and new gTLDs(Figure 9), over time. We aggregate the count of phishingincidents on a quarterly basis (x-axis) and present the resultsin a logarithmic scale (y-axis). Note that the observed “drop”in the amount of abused domains, FQDNs, and URLs (paths)in the fourth quarter of 2015 is caused by the changes in theorganization of APWG URL blacklists and not by a declinein criminal activities. As explained in section III, startingfrom September 2015, Facebook data, which represented asignificant part of URLs, was excluded from the feed.
We observe a significant difference between three metricsbased on concentration of abused domains, FQDNs, and URLsin APWG. This is because the metrics based on FQDNsand URLs are heavily affected by legitimate services such asfile storage web services or popular URL shortening services[33]. For example, in our previous work [33], we found
9

����
�����
������
�����
�����
�����
��� ����
��� ����
��� ����
��� ����
��� ����
��� ����
��� ����
��� ����
��� ����
��� ����
��� ����
��� ����
��� ����
������
����
�������� �������� ������ ��� ���� ��� ������ ����������� ���� ����
Figure 8. Time series of counts of phishing domains, FQDNs, and URLs(paths) in legacy gTLD based on the Anti-Phishing Working Group feed(2014-2016).
�
��
���
����
�����
������
��� ����
��� ����
��� ����
��� ����
��� ����
��� ����
��� ����
��� ����
��� ����
��� ����
��� ����
��� ����
��� ����
������
����
�������� �������� ������ ��� ���� ��� ��� ����������� ���� ����
Figure 9. Time series of counts of phishing domains, FQDNs, and URLs(paths) in new gTLD based on the Anti-Phishing Working Group feed (2014-2016).
44,856 unique *.s3.amazonaws.com FQDNs that correspondto an online file storage web service offered by Amazon WebServices (AWS), or 377,726 unique t.co/* URLs, where t.cois a popular URL shortener operated by Twitter. The resultsconfirm that the two complementary occurrence metrics (num-ber of FQDN and URLs) are useful and reveal informationthat is not captured by the number of unique abused domains.Please compare Figure 8 and Figure 9 with the correspondingFigure 40 and Figure 41 in the Appendix section representingthe CleanMX phishing dataset.
�
��
���
����
�����
������
��� ����
��� ����
��� ����
��� ����
��� ����
��� ����
��� ����
��� ����
��� ����
��� ����
��� ����
��� ����
��� ����
������
����
�������� ������� ��� ��� ��� ������ ���������� ��� ����� ������ �����
Figure 10. Time series of counts of phishing domains in legacy gTLD, newgTLDs, and all gTLDs (Total) based on the Anti-Phishing Working Groupfeed (2014-2016). Please notice y axis in log scale and overlapping lines.
In the remainder of this subsection, we will only focus onthe number of unique abused domains, as our metric. Figure 10presents a time series of total counts of phishing domains, andthose observed in legacy gTLDs and new gTLDs. Similar tobefore, we aggregate the phishing incidents on a quarterlybasis and present the phishing counts using a logarithmicscale. As it is clear from the figure, the pink line overlapslargely with the blue line. That is mainly because the totalnumber of phishing domains (purple line) has been driven byphishing domains in legacy gTLDs due to its disproportionatemarket share. While the number of abused domains remainsapproximately constant in legacy gTLDs, we observe a clearupward trend in the absolute number of phishing domainsin new gTLDs. The trend is confirmed by other phishingdatasets (see Figure 34 for SURBL phishing and Figure 42for CleanMX phishing datasets).
��
���
����
�����
������
��� ����
��� ����
��� ����
��� ����
��� ����
��� ����
��� ����
��� ����
��� ����
��� ����
��� ����
��� ����
��� ����
������
����
�������� ������� ��� ��� � ������ �������� ��� ���� ��� ���
Figure 11. Time series of counts of phishing domains in the top 5 mostabused legacy gTLDs in the last quarter of 2016 based on the Anti-PhishingWorking Group feed (2014-2016).
�
��
���
����
�����
��� ����
��� ����
��� ����
��� ����
��� ����
��� ����
��� ����
��� ����
��� ����
��� ����
��� ����
��� ����
��� ����
������
����
�������� ������� ��� ��� � ��� �������� ������ ��� ���� ���
Figure 12. Time series of counts of phishing domains in the top 5 mostabused new gTLDs in the last quarter of 2016 based on the Anti-PhishingWorking Group feed (2014-2016).
Figure 11 and Figure 12 show the top 5 most abused legacyand new gTLDs with the highest absolute number of uniquephishing domains at the end of 2016, respectively11. Thenumber of abused phishing domains in legacy gTLDs is mainly
11In Figure 12, we see that .top and .xyz, for example, starts at y = 0, while.online starts with y > 0 on its first data point. This is because differentlyfrom the others, .online had a small number of blacklisted URLs after itssunrise period, i.e., right after it became available for public registration. Asimilar behavior can be observed, for example, in Figure 9 and Figure 10.
10

driven by the .com gTLD and at the end of 2016 represents82.5% (15,795 of 19,157) of all abused legacy gTLD domainsconsidered in this study.
In comparison, in the .top TLD–the second largest newgTLD (see Figure 4)–we find the highest concentration ofall phishing domains (21%, which represents 574 out of2,738 new gTLD domains blacklisted by APWG). The upwardtrend in the number of phishing domains in new gTLDs (seeFigure 10) is consistent with the rising trend of the top 5 newgTLDs in terms of the absolute number of abused domainslisted by APWG. In fact, the five new gTLDs suffering fromthe highest concentrations of domain names used in phishingattacks listed on the APWG domain blacklist in the last quarterof 2016 collectively owned 58.7% of all blacklisted domainsin all new gTLDs.
�����
����
����
����
��� ����
��� ����
��� ����
��� ����
��� ����
��� ����
��� ����
��� ����
��� ����
��� ����
��� ����
��� ����
��� ����
����
����
����� �� �������� ������� ��� ��� ��� ������ �������� ����� ������ �����
Figure 13. Time series of abuse rates of phishing domains in legacy gTLDsand new gTLDs based on the Anti-Phishing Working Group feed (2014-2016).Rates are calculated as follows: S = 10, 000 ⇤ #blacklisted domains/
#all domains.
As discussed before, reliable reputation metrics have toaccount for a commonly observed trend of the size that largermarket players experience a larger amount of domain abuse[33], [36], [38]. Figure 13 shows a time series of abuserates of phishing domains of legacy gTLDs and new gTLDsbased on the APWG feed (for comparison, see Figure 43 forabused CleanMX phishing domains and Figure 35 for SURBLphishing domains). The abuse rates are presented in a linearscale. For example, in the second quarter of 2015 the domainabuse rate for legacy gTLDs is equal to 3.82503. This meansthat, on average, legacy gTLDs had 3.8 blacklisted phishingdomains per 10,000. Interestingly, the phishing abuse rates inlegacy and new gTLDs are converging with time and werealmost the same at the end of 2016. In the early stage ofthe New gTLD Program, phishing abuse rates were equal to0.56 and 0.05 for legacy and new gTLDs, respectively (see thesecond quarter of 2014 in Figure 13). We observed 7 abuseddomains out of approximately 1,355,000 domains registeredby the general public. For comparison, in the fourth quarterof 2016, abuse rates were equal to 1.19 and 1.1 for legacy andnew gTLDs, respectively.
Up to this point, our descriptive statistical analysis ofphishing abuse rates in new and legacy gTLDs has conflatedcompromised and maliciously registered domains. Now, wecompare abuse rates for these two types separately. Figure 14
0
0.5
1
1.5
2
2.5
3
Jan 2
014
Apr 20
14
Jul 2
014
Oct 20
14
Jan 2
015
Apr 20
15
Jul 2
015
Oct 20
15
Jan 2
016
Apr 20
16
Jul 2
016
Oct 20
16
Jan 2
017
Rat
e
Date
Rates of compromised phishing domains per new and legacy gTLDs, APWGnew gTLDs legacy gTLDs
Figure 14. Time series of abuse rates of compromised phishing domainsin legacy gTLDs and new gTLDs based on the Anti-Phishing WorkingGroup feed (2014-2016). Rates are calculated as follows: S = 10, 000 ⇤#compromised domains/#all domains.
0 0.2 0.4 0.6 0.8
1 1.2 1.4 1.6
Jan 2
014
Apr 20
14
Jul 2
014
Oct 20
14
Jan 2
015
Apr 20
15
Jul 2
015
Oct 20
15
Jan 2
016
Apr 20
16
Jul 2
016
Oct 20
16
Jan 2
017
Rat
e
Date
Rates of maliciously registered phishing domains pew new and legacy gTLDsnew gTLDs legacy gTLDs
Figure 15. Time series of abuse rates of maliciously registered phishingdomains in legacy gTLDs and new gTLDs based on the Anti-PhishingWorking Group feed (2014-2016). Rates are calculated as follows: S =10, 000 ⇤#maliciously registered domains/#all domains.
shows a time series of abuse rates for compromised phishingdomains of legacy gTLDs and new gTLDs, based on theAPWG feed. The curves corresponding to all blacklistedphishing domains and compromised phishing domains oflegacy gTLDs (compare Figure 13 and Figure 14) followa similar pattern due to a disproportionate concentration ofcompromised domains in legacy gTLDs.
Figure 15 shows a time series of abuse rates for maliciouslyregistered phishing domains in legacy and new gTLDs inAPWG feed. When we compare the rates of all blacklisteddomains of new gTLDs with rates of maliciously registereddomains (compare Figure 13 and Figure 15), we concludethat while there are higher relative concentrations of compro-mised domains in legacy gTLDs, the miscreants frequentlychoose to maliciously register domain names using one of thenew gTLDs.
Moreover, we observe relatively higher rates of maliciouslyregistered new gTLD domains in the first three quarters of2015. By manual analysis of, for example, malicious domainsblacklisted in the third quarter of 2015, we find 7,630 domainsregistered in 75 gTLDs (65 new gTLDs and 10 legacy gTLDs).The majority are .com domains (68.3%). We find 616 abusednew gTLD domains. Interestingly, we observe as many as182 and 111 abused .work and .xyz domains, respectively.
11

The results indicate that the majority of .work domains wereregistered by the same person. 150 domains were registered onthe same day using the same registrant information, the sameregistrar, and the domain names were composed of similarstrings. Note that only 150 abused domains, blacklisted in thethird quarter of 2015, influenced the security reputation of allnew gTLDs (see Figure 15).
Moreover, attackers often seem able to maliciously registerstrings containing trademarked terms. For example, by manualanalysis of maliciously registered domains in the fourth quarterof 2015 we find 88 abused .top domains. 75 out of 88 containthe following strings: Apple, iCloud, iPhone, their combina-tions, or misspelled versions of these strings suggesting thatthey were all used in the same phishing campaign against usersof products of Apple Inc.
�����
������
�����
�����
��� ����
��� ����
��� ����
��� ����
��� ����
��� ����
��� ����
��� ����
��� ����
��� ����
��� ����
��� ����
��� ����
������
����
������� �������� ������ ��� ���� ��� ������ ���������� ���� ����
Figure 16. Time series of counts of malware domains, FQDNs, and URLs(paths) in legacy gTLD based on the StopBadware DSP feed (2014-2016).
�
��
���
����
�����
������
��� ����
��� ����
��� ����
��� ����
��� ����
��� ����
��� ����
��� ����
��� ����
��� ����
��� ����
��� ����
��� ����
������
����
������� �������� ������ ��� ���� ��� ��� ����������� ���� ����
Figure 17. Time series of counts of malware domains, FQDNs, and URLs(paths) in new gTLD based on the StopBadware DSP feed (2014-2016).
2) Malware Reputation: We now analyze the malwareactivity reported by the StopBadware DSP. We refer the readerto Figure 16 and Figure 17 for overall absolute occurrencesecurity metrics (see also Figure 44 and Figure 45 for thecorresponding CleanMX malware datasets). More specifically,we present time series of counts of domains, FQDNs, andURLs (paths) of legacy gTLDs and new gTLD, respectively,aggregated on a quarterly basis. Y-axis are expressed in a log-arithmic scale. Similarly to phishing, we observe a significantdifference between the three occurrence metrics, especiallybetween concentrations of URLs and the other two securitymetrics (domains and FQDNs).
�
��
���
����
�����
������
�����
��� ����
��� ����
��� ����
��� ����
��� ����
��� ����
��� ����
��� ����
��� ����
��� ����
��� ����
��� ����
��� ����
������
����
������� ������� ��� ��� ��� ������ ���������� ��� ����� ������ �����
Figure 18. Time series of counts of malware domains in legacy gTLD,new gTLDs, and all gTLDs (Total) based on the StopBadware DSP feed(2014-2016).
From this point forward, we only consider the number ofunique domains. Figure 18 presents a time series of countsof malware domains in legacy gTLD, new gTLDs, and allgTLDs (Total) based on the StopBadware feed between 2014and 2016. Similar to phishing, the total number of malwareincidents in all gTLDs is mainly driven by incidents in legacygTLDs (88.6%). Again, in legacy gTLDs the number of abuseddomains remains approximately constant, whereas there is anupward trend in the absolute number of malware domains innew gTLDs. Figure 32 and Figure 46 presenting malwaredomains in legacy and new gTLDs for SURBL mw andCleanMX malware datasets confirm this trend.
���
����
�����
������
�����
��� ����
��� ����
��� ����
��� ����
��� ����
��� ����
��� ����
��� ����
��� ����
��� ����
��� ����
��� ����
��� ����
������
����
������� ������� ��� ��� � ������ �������� ��� ���� ��� ���
Figure 19. Time series of counts of malware domains in the top most abused5 legacy gTLDs in the last quarter of 2016 based on the StopBadware DSPfeed (2014-2016).
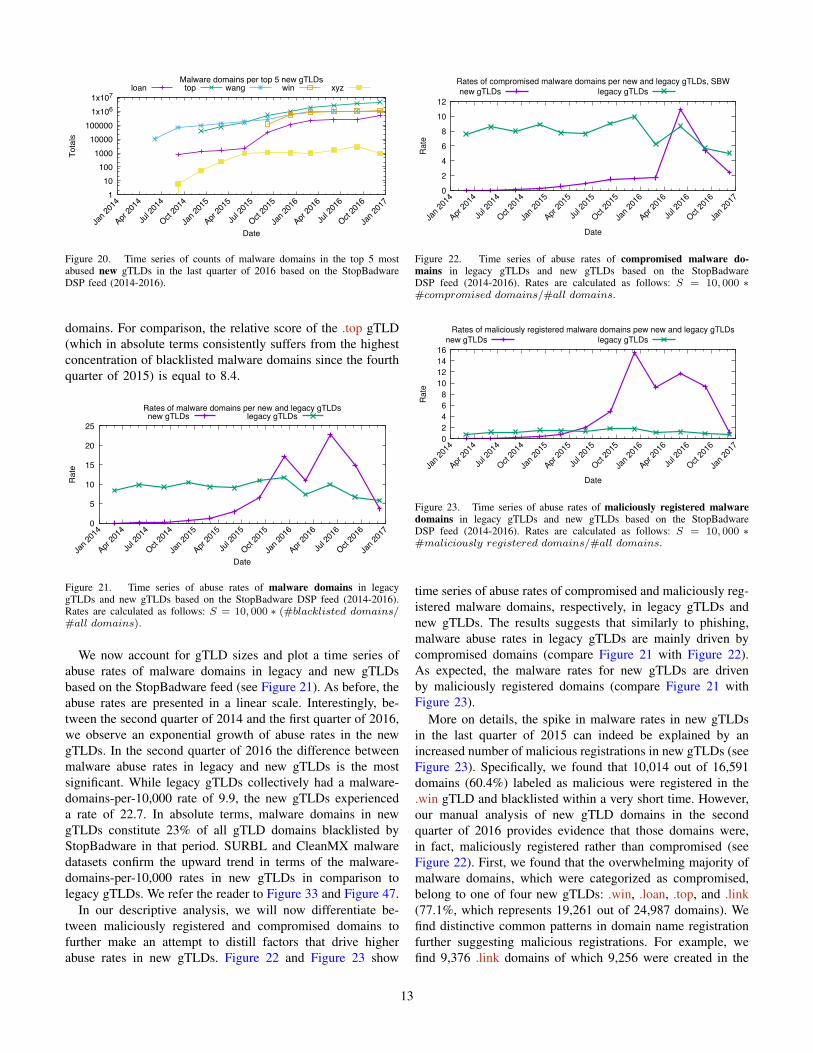
Figure 19 and Figure 20 show the top 5 most abusedlegacy gTLDs and new gTLDs with the highest absolutenumber of unique malware domains at the end of 2016, re-spectively. As the majority of domains are compromised ratherthan maliciously registered (see Figure 7), the distribution ofmalware by legacy gTLDs has very similar gTLD marketshare. The top 5 legacy gTLDs in terms of phishing andmalware domains are the same. While the .xyz TLD is thelargest new gTLD (see Figure 4), the absolute and thereforerelative number of domains listed in blacklists is much lowerin comparison to other new gTLDs depicted in Figure 20.Specifically, in the fourth quarter of 2016, the relative scoreof the .xyz TLD is equal to 1.5 malware domain per 10,000
12
�������������������������������
��� ����
��� ����
��� ����
��� ����
��� ����
��� ����
��� ����
��� ����
��� ����
��� ����
��� ����
��� ����
��� ����
������
����
������� ������� ��� ��� � ��� ��������� ��� ���� ��� ���
Figure 20. Time series of counts of malware domains in the top 5 mostabused new gTLDs in the last quarter of 2016 based on the StopBadwareDSP feed (2014-2016).
domains. For comparison, the relative score of the .top gTLD(which in absolute terms consistently suffers from the highestconcentration of blacklisted malware domains since the fourthquarter of 2015) is equal to 8.4.
�
�
��
��
��
��
��� ����
��� ����
��� ����
��� ����
��� ����
��� ����
��� ����
��� ����
��� ����
��� ����
��� ����
��� ����
��� ����
����
����
����� �� ������� ������� ��� ��� ��� ������ �������� ����� ������ �����
Figure 21. Time series of abuse rates of malware domains in legacygTLDs and new gTLDs based on the StopBadware DSP feed (2014-2016).Rates are calculated as follows: S = 10, 000 ⇤ (#blacklisted domains/
#all domains).
We now account for gTLD sizes and plot a time series ofabuse rates of malware domains in legacy and new gTLDsbased on the StopBadware feed (see Figure 21). As before, theabuse rates are presented in a linear scale. Interestingly, be-tween the second quarter of 2014 and the first quarter of 2016,we observe an exponential growth of abuse rates in the newgTLDs. In the second quarter of 2016 the difference betweenmalware abuse rates in legacy and new gTLDs is the mostsignificant. While legacy gTLDs collectively had a malware-domains-per-10,000 rate of 9.9, the new gTLDs experienceda rate of 22.7. In absolute terms, malware domains in newgTLDs constitute 23% of all gTLD domains blacklisted byStopBadware in that period. SURBL and CleanMX malwaredatasets confirm the upward trend in terms of the malware-domains-per-10,000 rates in new gTLDs in comparison tolegacy gTLDs. We refer the reader to Figure 33 and Figure 47.
In our descriptive analysis, we will now differentiate be-tween maliciously registered and compromised domains tofurther make an attempt to distill factors that drive higherabuse rates in new gTLDs. Figure 22 and Figure 23 show
0
2
4
6
8
10
12
Jan 2
014
Apr 20
14
Jul 2
014
Oct 20
14
Jan 2
015
Apr 20
15
Jul 2
015
Oct 20
15
Jan 2
016
Apr 20
16
Jul 2
016
Oct 20
16
Jan 2
017
Rat
e
Date
Rates of compromised malware domains per new and legacy gTLDs, SBWnew gTLDs legacy gTLDs
Figure 22. Time series of abuse rates of compromised malware do-mains in legacy gTLDs and new gTLDs based on the StopBadwareDSP feed (2014-2016). Rates are calculated as follows: S = 10, 000 ⇤#compromised domains/#all domains.
0 2 4 6 8
10 12 14 16
Jan 2
014
Apr 20
14
Jul 2
014
Oct 20
14
Jan 2
015
Apr 20
15
Jul 2
015
Oct 20
15
Jan 2
016
Apr 20
16
Jul 2
016
Oct 20
16
Jan 2
017
Rat
e
Date
Rates of maliciously registered malware domains pew new and legacy gTLDsnew gTLDs legacy gTLDs
Figure 23. Time series of abuse rates of maliciously registered malwaredomains in legacy gTLDs and new gTLDs based on the StopBadwareDSP feed (2014-2016). Rates are calculated as follows: S = 10, 000 ⇤#maliciously registered domains/#all domains.
time series of abuse rates of compromised and maliciously reg-istered malware domains, respectively, in legacy gTLDs andnew gTLDs. The results suggests that similarly to phishing,malware abuse rates in legacy gTLDs are mainly driven bycompromised domains (compare Figure 21 with Figure 22).As expected, the malware rates for new gTLDs are drivenby maliciously registered domains (compare Figure 21 withFigure 23).
More on details, the spike in malware rates in new gTLDsin the last quarter of 2015 can indeed be explained by anincreased number of malicious registrations in new gTLDs (seeFigure 23). Specifically, we found that 10,014 out of 16,591domains (60.4%) labeled as malicious were registered in the.win gTLD and blacklisted within a very short time. However,our manual analysis of new gTLD domains in the secondquarter of 2016 provides evidence that those domains were,in fact, maliciously registered rather than compromised (seeFigure 22). First, we found that the overwhelming majority ofmalware domains, which were categorized as compromised,belong to one of four new gTLDs: .win, .loan, .top, and .link(77.1%, which represents 19,261 out of 24,987 domains). Wefind distinctive common patterns in domain name registrationfurther suggesting malicious registrations. For example, wefind 9,376 .link domains of which 9,256 were created in the
13

first quarter of 2016 and 9,253 were registered with AlpnamesLimited registrar. 8,381 of all .link domains were registeredusing two registrar names only. Moreover, 8,205 and 1,027were composed of 5 and 6 randomly generated characters,respectively. We created a user account with Alpnames Lim-ited and tested bulk domain registration options. In fact, it ispossible to randomly generate up to 2,000 domains at oncefrom the selection of 27 new gTLDs using different patternslike letters, time, cities, zip codes, etc. Finally, note that theregistries of .win, .loan, .top, and .link new gTLDs compete onprice, and in 2016 their registration prices were occasionallybelow $1, which was lower than the registration fee for a.com domain. Therefore, we conclude that those domains wereeither registered by the attacker(s) earlier for later use orblacklisted after several weeks of being used for maliciouspurposes.
3) Spam Reputation: We briefly discuss the spam activityin the new and legacy gTLDs reported by Spamhaus. Note thatSpamhaus provides domain rather than URL blacklist, whichmeans that the great majority of listed domains are maliciouslyregistered. Figure 24 presents a time series of counts of spamdomains observed in legacy gTLDs, new gTLDs, and the totalnumber of all spam domains. We aggregate the unique spamdomains on a quarterly basis and present the spam counts usinga logarithmic scale. While previously we observed a clearupward trend in the absolute number of phishing and malwaredomains in new gTLDs, alarmingly, we now witness that theabsolute number of malicious spam domains in new gTLDsis actually higher than in legacy gTLDs at the end of 2016.Note that the total number of spam incidents in all gTLDsis approximately constant and in the last quarter of 2016 isdriven by incidents in new gTLDs (58.8%). Figure 36 andFigure 38 presenting spam domains in legacy and new gTLDsfor SURBL jp and SURBL ws spam datasets, respectively,confirm the observed trend. In fact, the results reveal a newtendency: the attackers seems to switch from abusing legacyto new gTLDs.
1 10
100 1000
10000 100000
1x10⁶ 1x10⁷
Jan 2
014
Apr 20
14
Jul 2
014
Oct 20
14
Jan 2
015
Apr 20
15
Jul 2
015
Oct 20
15
Jan 2
016
Apr 20
16
Jul 2
016
Oct 20
16
Jan 2
017
Tota
ls
Date
Spam domains per new and legacy gTLDs, Spamhaus datasetTotal new gTLDs legacy gTLDs
Figure 24. Time series of counts of blacklisted domains in legacy gTLD,new gTLDs, and all gTLDs (Total) based on the spamhaus feed (2014-2016).Please notice y axis in log scale and overlapping lines.
Figure 25 shows a time series of abuse rates of spamdomains of legacy gTLDs and new gTLDs based on theSpamhaus feed. For comparison, see Figure 37 and Figure 39
for spam domains blacklisted by SURBL jp and SURBL ws,respectively. As expected, the difference between spam abuserates in legacy and new gTLDs is very significant. Whilelegacy gTLDs collectively had a spam-domains-per-10,000rate of 56.9, in the last quarter of 2016, the new gTLDsexperienced a rate of 526.6–which is almost one order ofmagnitude higher. When comparing abuse rates of SURBLjp and SURBL ws spam feeds in the same period we observea spam-domains-per-10,000 rates of 46.6 and 26 for legacygTLDs, whereas for new gTLDs a spam-domains-per-10,000rates are 286.3, and 265.2, respectively.
0.01
0.1
1
10
100
1000
Jan 2
014
Apr 20
14
Jul 2
014
Oct 20
14
Jan 2
015
Apr 20
15
Jul 2
015
Oct 20
15
Jan 2
016
Apr 20
16
Jul 2
016
Oct 20
16
Jan 2
017
Rat
eDate
Rates of spam domains per new and legacy gTLDs, Spamhaus datasetnew gTLDs legacy gTLDs
Figure 25. Time series of abuse rates of blacklisted domains in legacy gTLDsand new gTLDs based on the spamhaus feed (2014-2016). Rates are calcu-lated as follows: S = 10, 000 ⇤#blacklisted domains/#all domains.
Table XXIV and Table XXV show top 10 new and legacygTLDs, respectively, with the highest relative concentrationsof blacklisted domains for all feeds in the fourth quarter of2016. For more details we refer the reader to the appendixsection. For example, spam-domains-per-10,000 rates calcu-lated using Spamhaus feed for .science, .stream, and .studyare equal to 5154, 4756 and 3343, respectively. In otherwords, as many as 51.5%, 47.6% and 33.4% of all domains inthe corresponding zones were abused by cybercriminals andblacklisted by Spamhaus. Note that our results clearly indicatethat the problem is not caused by a single or a few abusednew gTLDs. For example, as many as 15 most abused newgTLDs had spam-domains-per-10,000 rates calculated usingSpamhaus feed higher than 1,000 at the end of 2016.
B. Regression Analysis of Abuse in New gTLDs
One of the main goals of this study is to analyze therelationship between the collected security indicators and thestructural properties of new gTLDs, and abuse, at the level ofgTLDs. We use regression analysis to examine the amount ofvariance that those properties can collectively explain, fromthe total observed variance in the abuse counts.
Regression analysis has been used before to study thevariation in phishing abuse across the population of vari-ous intermediaries such as hosting providers [38] and TLDs[33]. The intermediaries can be broken down into differentpotential drivers of variation in abuse counts, such as size,pricing, domain popularity index, or the amount of WordPresssites on phishing abuse [33], [38]. In this paper, we apply
14

Table IVNEGATIVE BINOMIAL GLM FOR COUNT OF ABUSED DOMAINS PER NEW GTLD
Dependent variable:apwg sbw cmx ph cmx pt cmx mw surbl ph surbl mw
(1) (2) (3) (4) (5) (6) (7)New gTLD size 0.00002⇤⇤⇤ 0.00001⇤⇤⇤ 0.00002⇤⇤⇤ 0.00003⇤⇤⇤ 0.00001⇤⇤⇤ 0.00002⇤⇤⇤ 0.00002⇤⇤⇤
(0.00001) (0.00000) (0.00001) (0.00001) (0.00000) (0.00001) (0.00001)
Parked 0.0003⇤⇤⇤ 0.0001⇤⇤⇤ 0.0002⇤⇤⇤ 0.00003 0.0001⇤⇤⇤ 0.0002⇤⇤⇤ 0.00001(0.00004) (0.00003) (0.00003) (0.00004) (0.00003) (0.00004) (0.00004)
DNSSEC 0.00001⇤⇤⇤ 0.00002⇤⇤⇤ 0.00002⇤⇤⇤ 0.00002⇤⇤⇤ 0.00001⇤⇤⇤ 0.00002⇤⇤⇤ 0.00002⇤⇤⇤(0.00000) (0.00000) (0.00000) (0.00000) (0.00000) (0.00000) (0.00000)
No DNS �0.00004⇤⇤⇤ �0.00003⇤⇤⇤ �0.00005⇤⇤⇤ �0.00005⇤⇤⇤ �0.00002⇤⇤⇤ �0.00004⇤⇤⇤ �0.00004⇤⇤⇤(0.00001) (0.00001) (0.00001) (0.00001) (0.00000) (0.00001) (0.00001)
HTTP Error �0.00002 �0.00004⇤⇤⇤ �0.0001⇤⇤⇤ �0.00003⇤ �0.00004⇤⇤⇤ �0.0001⇤⇤⇤ �0.0001⇤⇤⇤(0.00002) (0.00001) (0.00001) (0.00002) (0.00001) (0.00002) (0.00002)
Type �0.540⇤⇤ �0.150 �0.400⇤⇤ �0.120 �0.190 �0.760⇤⇤⇤ �0.170(0.220) (0.120) (0.180) (0.170) (0.160) (0.190) (0.220)
Constant �0.630⇤⇤ �0.390⇤⇤ �0.960⇤⇤⇤ �1.200⇤⇤⇤ �1.600⇤⇤⇤ 0.330 �2.200⇤⇤⇤(0.280) (0.170) (0.230) (0.230) (0.220) (0.230) (0.290)
Observations 521 521 521 521 521 521 521Log Likelihood �566.000 �792.000 �508.000 �546.000 �392.000 �786.000 �284.000✓ 0.140⇤⇤⇤ 0.330⇤⇤⇤ 0.240⇤⇤⇤ 0.200⇤⇤⇤ 0.470⇤⇤⇤ 0.190⇤⇤⇤ 0.240⇤⇤⇤
(0.017) (0.035) (0.034) (0.024) (0.087) (0.019) (0.051)AIC 1,149.000 1,600.000 1,031.000 1,109.000 800.000 1,588.000 583.000
Note: ⇤p<0.1; ⇤⇤p<0.05; ⇤⇤⇤p<0.01Standard errors in brackets
a similar statistical approach in order to analyze how thedifferent properties of new gTLD operators relate to distincttypes of abuse. We model the number of abused domainsas a dependent variable using negative binomial generalizedlinear model (GLM) with a Log link function. We appliedthe negative binomial distribution because the abuse countsaggregated per new gTLDs proved to be overdispersed withrespect to a Poisson distribution, for which the variance isequal to the mean. Note that negative binomial distributionis especially suitable for discrete data over a positive rangewhose sample variance exceeds significantly the sample mean.
Our regression models are built using the datasets explainedin subsection III-A. We define our dependent variable asthe number of abused domains (i.e. blacklisted domains ordomain name elements of blacklisted URLs). Depending onthe model, we use the total number of abused domains or treatmaliciously registered and compromised domains separately(details follow later). The independent variables in the modelsare the following properties of new gTLDs: “new gTLD size”:number of domains in TLD, “Parked”: number of parkeddomains, “No DNS”: number of domains that do not resolve,“HTTP Error”: number of domains for which their websitesreturn an HTTP error, “DNSSEC”: number of DNSSEC-signed domains, “Type”: an integer corresponding to the typeof new gTLD, from least to most restricted group: 1 generic,2 geographic, 3 community, and 4 brand, “Registry”: name of
the registry operator that the TLD is operating under.Table IV and Table V contain the summary of the regression
models, i.e., the estimated coefficients, and their significancelevels together with the goodness-of-fit measures such as themaximum Log likelihood, ✓ values and minimum Akaikeinformation criterion (AIC) value (for more details, we referthe reader to the relevant literature). Table IV illustratesnegative binomial GLMs for number of all abused domains pernew gTLD. Table V illustrates GLM for number of maliciouslyregistered and compromised phishing domains separately pernew gTLD. Note that the presented models are chosen from astepwise addition of the variables into a baseline model witha single explanatory variable.
Table IV indicates a positive and statistically significantcorrelation between new gTLD size and abuse counts. Theresults are very consistent for all the analyzed abuse feeds.The coefficients are, however, very weak. We suspect that thisis because the majority of abused domains in the new gTLDsare maliciously registered rather than compromised.
As expected, two variables indicating the number of do-mains that do not serve valid Web content to their users,i.e. “No DNS” and “HTTP Error” show a weak signifi-cant relationship with abuse counts. That means, the moredomains labelled as “No DNS” and/or “HTTP Error”, theless abused domains. Those two variables also correspond tothe count of compromised domains rather than maliciously
15

Table VNEGATIVE BINOMIAL GLM FOR COUNT OF COMPROMISED ANDMALICIOUSLY REGISTERED PHISHING DOMAINS PER NEW GTLD
Response Variable: Count of domains in APWG dataComp. Mal. Comp. Mal.
(1) (2) (3) (4)gTLD size �0.00001⇤⇤⇤ 0.00000
(0.00000) (0.00001)
Parked 0.0001⇤⇤⇤ 0.0003⇤⇤⇤(0.00003) (0.00005)
HTTP Err. 0.00003⇤⇤⇤ 0.00001(0.00001) (0.00002)
No DNS 0.00000 �0.00002⇤⇤⇤(0.00001) (0.00001)
DNSSEC 0.00001⇤⇤⇤ 0.00001⇤⇤⇤(0.00000) (0.00000)
Type �0.230 �0.780⇤⇤⇤(0.210) (0.280)
Constant �0.610⇤⇤⇤ 1.500⇤⇤⇤ �1.800⇤⇤⇤ �0.190(0.180) (0.220) (0.270) (0.350)
Obs. 521 521 521 521Log Like. �352 �545 �295 �495✓ 0.069⇤⇤⇤ 0.039⇤⇤⇤ 0.240⇤⇤⇤ 0.080⇤⇤⇤
(0.010) (0.005) (0.046) (0.011)AIC 705 1,091 604 1,004
Note: ⇤p<0.1; ⇤⇤p<0.05; ⇤⇤⇤p<0.01Standard errors in brackets
registered counts.Moreover, the number of parked domains in new gTLDs
plays a weak statistically significant role in explaining thevariance in phishing and malware domains. The more parkeddomains in a new gTLD, the more abused domains. This isto be expected as landing pages of parked domains may servemalware on a large scale. Note that the coefficients are verysmall. For example, if we hold the other independent variablesconstant and increase the number of parked domains by oneunit (which is the equivalent to multiplying the number ofparked domains of a gTLD by 10 since it is in the log10 scale),the number of phishing domains in APWG is multiplied bye
0.0003 = 1.0003.Previous research indicates a negative significant relation
between the DNSSEC deployment and the count of phishingdomains [33]. The authors used DNSSEC deployment asa proxy for the security efforts of both ccTLD and gTLDregistries. In our analysis we test the relationship between thenumber of DNSSEC domains and abuse counts from varioustypes of blacklists for new gTLDs. Note that ICANN requireseach new gTLD to demonstrate a plan for DNSSEC deploy-ment to ensure integrity and utility of registry information.Therefore, in our analysis, the number of DNSSEC-signeddomains cannot serve as a proxy for registry efforts and ob-viously it does not prevent phishing attacks. One may suspectthat attackers could be interested in deploying DNSSEC and
signing their maliciously registered domains. Although it is notclear if that is the case, we indeed observe a weak but positiveand statistically significant correlation between the number ofDNNSEC-signed domains and the number of abused domains.
The regression results consistently show a negative correla-tion between the “Type” variable reflecting strict registrationsand count of phishing domains. In fact, in comparison to othervariables, the obtained coefficients indicate the strongest sta-tistically significant negative correlation for APWG, CleanMXphishing, and SURBL phishing datasets: �0.54, �0.4, and�0.76, respectively (see Table IV). Note that for all otherconsidered datasets, in particular malware, we also observenegative but not statistically significant correlations. When weconsider separately maliciously registered and compromiseddomains the “Type” of new gTLD plays a significant rolein explaining phishing abuse counts only for malicious reg-istrations (see Table V). Again, the results are intuitive. Forexample, it is much easier to register domains in the .topstandard gTLD than it is for the .pharmacy community gTLD,for which the registration policy restricts the sale of domainsto legitimate pharmacies only.
We have also considered other models that contain “Reg-istry” as a fixed effect to capture systematic differences inthe policies of registries across new gTLDs such as pricing,bulk registration options, etc. Interestingly, our results indicatethat none of the registry operators have statistically significanteffect on the abuse counts.
C. Privacy and Proxy Services
In this section we present the results of an analysis todetermine if there is a difference in the usage of WHOISPrivacy and Proxy services for abused domains in legacygTLDs and new gTLDs. WHOIS Privacy and Proxy servicesare designed to conceal certain personal data of domain nameregistrants who use them. In practice this works by replacingthe registrant information in WHOIS with the information ofthe WHOIS Privacy and Proxy service.
There are many legitimate reasons why someone may wantto conceal possession of a domain name. The usage of aWHOIS Privacy and Proxy services by itself is, therefore not areliable single indicator of malicious activity. A previous studyby National Physical Laboratories [44], however did find thata significant portion of abusive domains use Privacy and Proxyservices.
There are numerous WHOIS Privacy and Proxy servicesavailable, which can be used by domain owners. To identifythe most commonly used services we used the followingmethodology.
1) Using the WHOIS data, we aggregated all distinct do-mains by "registrant name" and "registrant organization"attributes and created a list with the top 5,000 registrants.
2) A keyword search on the top 5,000 "registrant name" and"registrant organization" attributes, trying to match anyregistrant with keywords such as: "privacy", "proxy","protect", "private", "whois" etc.
16

3) A manual inspection of the suspect "registrant name"and "registrant organization" attributes to decide if theregistrant is a Privacy and Proxy service, when this isnot immediately clear from the name itself we use aninternet search to find additional information.
Using the above described method we identified 570 "regis-trant name" and "registrant organizations" attribute combina-tions used by WHOIS Privacy and Proxy services.
Each blacklist abuse incident contains metadata such as thedate when the domain was added to the blacklist, we usedthis date to identify the correct historical WHOIS record foran abused domain. By comparing the "registrant name" and"registrant organization" attributes from the domain WHOISrecord to the list of known WHOIS Privacy and Proxy services,we are able to correctly identify abusive domains that wereusing a WHOIS Privacy and Proxy service at the time thedomain was added to a blacklist.
To get an indication of how common WHOIS Privacy andProxy service usage is, we aggregated all domains from theWHOIS data by their create date. This shows us the number ofnewly added domains per month for legacy and new gTLDs.After checking how many of these domains were using aPrivacy and Proxy service when the domain was registered,we calculated what percentage of the total number of newlyregistered domains is using a Privacy and Proxy service (seeFigure 26). We find that for legacy gTLDs the usage is stablewith a mean of 24%, and a standard deviation of 1.6. For newgTLDs the usage is generally below that of legacy gTLDswith a mean of 18% and a standard deviation of 9.3, which isvisualized by the larger spikes and the increase to above thelevel of legacy gTLDs near the end of the study period.
�
��
��
��
��
���
��� ����
��� ����
��� ����
��� ����
��� ����
��� ����
��� ����
��� ����
��� ����
��� ����
��� ����
��� ����
��� ����
�������
����
��� ���� ������ ����
Figure 26. Usage percentage of Privacy and Proxy services for newlyregistered domains
Figure 27 shows the percentage of all newly created do-mains using Privacy and Proxy service, that have been reportedto the Spamhaus or SURBL blacklist on or after the registra-tion date. We have chosen to use Spamhaus and SURBL forthis figure because these blacklists mainly contain maliciouslyregistered domains. Here again, just as seen in Figure 26, wefind that the variability for the new gTLDs is higher thancompared to the legacy gTLDs. At the end of 2016 we findthat both the new gTLD and legacy gTLD line show a similarincrease.
�
�
��
��
��
��
��
��� ����
��� ����
��� ����
��� ����
��� ����
��� ����
��� ����
��� ����
��� ����
��� ����
��� ����
��� ����
��� ����
�������
����
��� ���� ������ ����
Figure 27. Percentage of abusive newly registered domains using Privacyand Proxy services
For each blacklist used in this study we analysed theproportion of domains that were using a Privacy and Proxyservice at the time the domain was found to be abusive andincluded in the blacklist. Here again we make a distinctionbetween legacy and new gTLD domains.
When look at two blacklist mainly driven by maliciouslyregistered domains, all SURBL feeds combined (see Fig-ure 28) and Spamhaus (see Figure 29), we find that the usageof Privacy and Proxy services has been increasing from thestart of the New gTLD Program and reached the same levelof usage in late 2015. In 2016 the usage for new gTLDs hasmainly followed the same pattern, but at a lower level, as isseen for legacy gTLDs.
For SURBL in 2016 the mean usage per month of privacyand proxy services by abusive domains in new gTLD observedis 5,874 with a standard deviation of 1,984 (see Figure 28),while for legacy gTLDs the mean usage per month is 21,744with a standard deviation of 9,475. For Spamhaus (see Fig-ure 29) the 2016 new gTLDs mean usage per month is 8,951with a standard deviation of 2,892, while for legacy gTLDsthe mean usage per month is 16,569 with a standard deviationof 3,843.
In the SURBL data we find 2 large peaks (see Figure 28) ofabusive new gTLD domains using Privacy and Proxy services.Both of these peaks are driven by the .xyz, .click and .link newgTLDs. We attempted to find peaks in new registration thatcorrespond to the two peaks seen in Figure 28. In the 7-15day period leading up to a peak we do see an increase in thenumber of new registrations for the .xyz, .click and .link newgTLDs with the same registrar. However, we do not find strongevidence that the malicious registrations belong to a single ormultiple campaigns using WHOIS Privacy and Proxy services.
The analysis of the use of WHOIS Privacy and Proxyservices leads us to conclude that the usage of a WHOISPrivacy and Proxy services by itself is not a reliable indicatorof malicious activity. Apart from the peaks, the usage ofPrivacy and Proxy services for abusive domains is not thathigh (see Figure 28, Figure 29). The usage of Privacy proxyseems to be higher in legacy gTLDs.
17

�
��
��
��
��
��
��
��� ����
��� ����
��� ����
��� ����
��� ����
��� ����
��� ����
��� ����
��� ����
��� ����
��� ����
�������
����
��� ���� ������ ����
Figure 28. Usage of Privacy and Proxy services for abusive domains, reportedby SURBL
�
��
��
��
��
��
��
��� ����
��� ����
��� ����
��� ����
��� ����
��� ����
��� ����
��� ����
��� ����
��� ����
��� ����
��� ����
��� ����
�������
����
��� ���� ������ ����
Figure 29. Usage of Privacy and Proxy services for abusive domains, reportedby Spamhaus
D. Geographic Region
For each blacklist we present a comparison of the geograph-ical locations of abused domains to determine if there is adifference in the location of abuse between legacy gTLD andnew gTLD domain locations. To determine the geographicallocation of an abused domain we use the address of thedomain’s sponsoring registrar. Table VI lists the 10 countrieshosting the most registrars, almost 54% of the identifiedregistrars are located in the United States, which is almost 1order of magnitude more compared to the number of registrarslocated in the second largest country, China. With such a highproportion of registrars located in a single country, the generalhypothesis is that most of the abused domains will probablyalso be located in this country. We find that while this is truefor legacy gTLDs, for new gTLDs however there are a numberof cases where this is not the case. For example, when wetake look at the new gTLD countries for StopBadware andSURBL in Table VIII and Table IX, we find that the UnitedStates occupies the 3rd and 4th place.
Although the majority of the registrars are located in theUnited States, the story might be different when we lookat the number of registered domains. There are a smallnumber of very large registrars and many smaller registrars.These registrars are not uniformly distributed across countries,meaning that a relatively small number of larger registrarslocated outside of the US, may skew results to show manydomains registered outside the US. Table VII lists the countries
where most of the legacy and new gTLD domains are located.The number or registered legacy gTLD domains per countryis heavily influenced by the distribution of registrars acrosscountries. The top countries are an exact match. For legacygTLDs the major player is the Unites States, with 6,5 timesmore domains compared to number 2, China. For new gTLDshowever, we find that the country distribution has changed.Most new gTLD domains are now located in China followedby the US and Gibraltar. The difference between the topcountries is less extreme for new gTLDs than it is for legacygTLDs.
The WHOIS data used for this study contains a "registrarname" attribute for each domain record, however no geograph-ical information for the registrar is available in the WHOISdata. To map each registrar to a geographical location we usedthe following method:
1) Extract every unique "registrar name" attribute from theWHOIS data.
2) Using an automated process combine the extracted"registrar name" attribute with the country informationfor ICANN-Accredited Registrars, available from theICANN website [45].
3) Manually match remaining name variants (the automatedprocess is not able to match every registrar name variantto a country) to their corresponding countries.
This method resulted in a list containing 5,985 registrars(and name variants) with their geographical location. Togetherthese registrars manage over 99.99% of all the domains foundin the WHOIS data.
Table VITOP10 REGISTRAR COUNTRIES
Country #Registrars shareUnited States 2,682 53.88China 281 5.64Germany 201 4.04Canada 177 3.56United Kingdom 160 3.21India 144 2.89France 116 2.33Australia 111 2.23Spain 105 2.11Japan 95 1.91
Table VIITOP10 LOCATIONS OF NEW AND LEGACY GTLD DOMAINS
New #Domains Share Legacy #Domains ShareChina 8,076,776 27.92 US 152,527,872 56.72US 6,283,269 21.72 China 24,098,150 8.96Gibraltar 3,028,035 10.47 Germany 18,044,735 6.71Cayman Is. 2,069,919 7.16 Canada 16,704,693 6.21Singapore 1,870,886 6.47 India 11,135,408 4.14Japan 1,741,228 6.02 Japan 7,935,585 2.95India 1,323,117 4.57 Australia 6,425,896 2.39Germany 1,105,708 3.82 France 4,988,581 1.86Hong Kong 836,069 2.89 UK 4,511,714 1.68France 450,371 1.56 Turkey 2,418,232 0.9
For each blacklist we calculated two abuse metrics, the"percentage" and "rate". The "percentage" is used to indicate
18
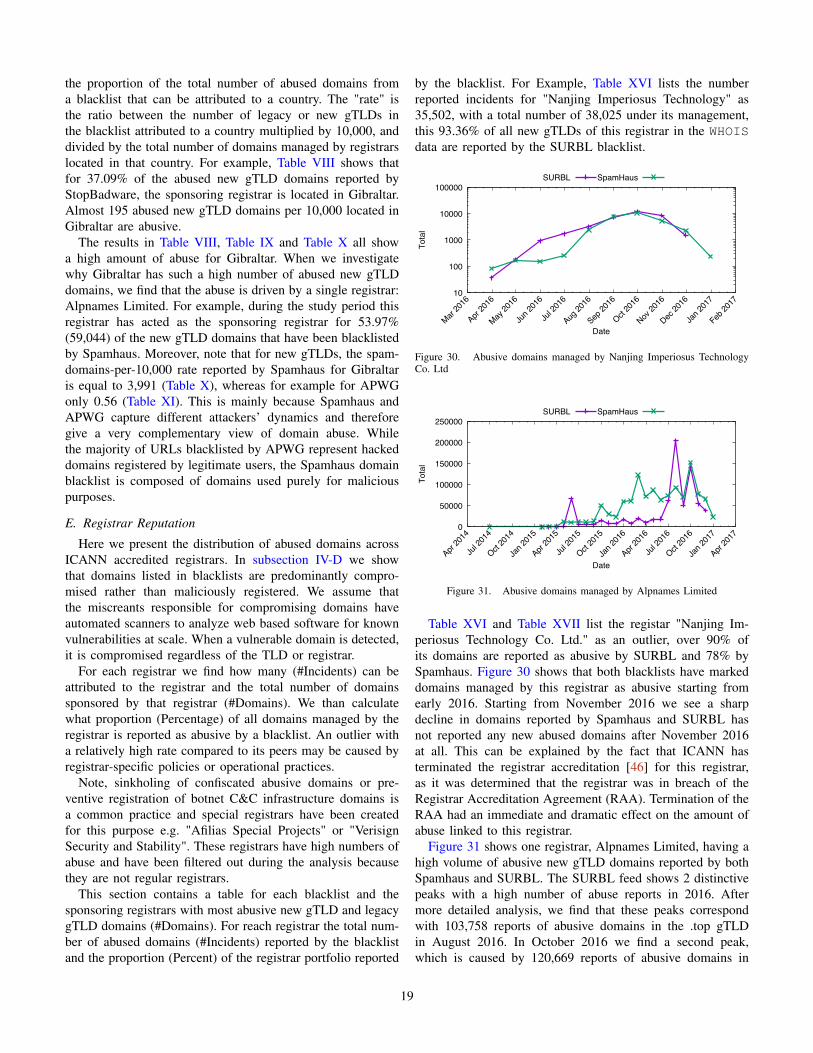
the proportion of the total number of abused domains froma blacklist that can be attributed to a country. The "rate" isthe ratio between the number of legacy or new gTLDs inthe blacklist attributed to a country multiplied by 10,000, anddivided by the total number of domains managed by registrarslocated in that country. For example, Table VIII shows thatfor 37.09% of the abused new gTLD domains reported byStopBadware, the sponsoring registrar is located in Gibraltar.Almost 195 abused new gTLD domains per 10,000 located inGibraltar are abusive.
The results in Table VIII, Table IX and Table X all showa high amount of abuse for Gibraltar. When we investigatewhy Gibraltar has such a high number of abused new gTLDdomains, we find that the abuse is driven by a single registrar:Alpnames Limited. For example, during the study period thisregistrar has acted as the sponsoring registrar for 53.97%(59,044) of the new gTLD domains that have been blacklistedby Spamhaus. Moreover, note that for new gTLDs, the spam-domains-per-10,000 rate reported by Spamhaus for Gibraltaris equal to 3,991 (Table X), whereas for example for APWGonly 0.56 (Table XI). This is mainly because Spamhaus andAPWG capture different attackers’ dynamics and thereforegive a very complementary view of domain abuse. Whilethe majority of URLs blacklisted by APWG represent hackeddomains registered by legitimate users, the Spamhaus domainblacklist is composed of domains used purely for maliciouspurposes.
E. Registrar Reputation
Here we present the distribution of abused domains acrossICANN accredited registrars. In subsection IV-D we showthat domains listed in blacklists are predominantly compro-mised rather than maliciously registered. We assume thatthe miscreants responsible for compromising domains haveautomated scanners to analyze web based software for knownvulnerabilities at scale. When a vulnerable domain is detected,it is compromised regardless of the TLD or registrar.
For each registrar we find how many (#Incidents) can beattributed to the registrar and the total number of domainssponsored by that registrar (#Domains). We than calculatewhat proportion (Percentage) of all domains managed by theregistrar is reported as abusive by a blacklist. An outlier witha relatively high rate compared to its peers may be caused byregistrar-specific policies or operational practices.
Note, sinkholing of confiscated abusive domains or pre-ventive registration of botnet C&C infrastructure domains isa common practice and special registrars have been createdfor this purpose e.g. "Afilias Special Projects" or "VerisignSecurity and Stability". These registrars have high numbers ofabuse and have been filtered out during the analysis becausethey are not regular registrars.
This section contains a table for each blacklist and thesponsoring registrars with most abusive new gTLD and legacygTLD domains (#Domains). For reach registrar the total num-ber of abused domains (#Incidents) reported by the blacklistand the proportion (Percent) of the registrar portfolio reported
by the blacklist. For Example, Table XVI lists the numberreported incidents for "Nanjing Imperiosus Technology" as35,502, with a total number of 38,025 under its management,this 93.36% of all new gTLDs of this registrar in the WHOISdata are reported by the SURBL blacklist.
��
���
����
�����
������
��� ����
��� ����
��� ����
��� ����
��� ����
��� ����
��� ����
��� ����
��� ����
��� ����
��� ����
��� ����
�����
����
����� ��������
Figure 30. Abusive domains managed by Nanjing Imperiosus TechnologyCo. Ltd
�
�����
������
������
������
������
��� ����
��� ����
��� ����
��� ����
��� ����
��� ����
��� ����
��� ����
��� ����
��� ����
��� ����
��� ����
��� ����
�����
����
����� ��������
Figure 31. Abusive domains managed by Alpnames Limited
Table XVI and Table XVII list the registar "Nanjing Im-periosus Technology Co. Ltd." as an outlier, over 90% ofits domains are reported as abusive by SURBL and 78% bySpamhaus. Figure 30 shows that both blacklists have markeddomains managed by this registrar as abusive starting fromearly 2016. Starting from November 2016 we see a sharpdecline in domains reported by Spamhaus and SURBL hasnot reported any new abused domains after November 2016at all. This can be explained by the fact that ICANN hasterminated the registrar accreditation [46] for this registrar,as it was determined that the registrar was in breach of theRegistrar Accreditation Agreement (RAA). Termination of theRAA had an immediate and dramatic effect on the amount ofabuse linked to this registrar.
Figure 31 shows one registrar, Alpnames Limited, having ahigh volume of abusive new gTLD domains reported by bothSpamhaus and SURBL. The SURBL feed shows 2 distinctivepeaks with a high number of abuse reports in 2016. Aftermore detailed analysis, we find that these peaks correspondwith 103,758 reports of abusive domains in the .top gTLDin August 2016. In October 2016 we find a second peak,which is caused by 120,669 reports of abusive domains in
19

Table VIIISTOPBADWARE TOP10 LEGACY GTLD AND NEW GTLD RATE BETWEEN ALL DOMAINS LISTED IN BLACKLIST AND BOTH THE BLACKLIST
(PERCENTAGE) AND REGISTRAR COUNTRY (RATE) TOTAL NUMBER OF DOMAINS.
# New gTLD Country #Incidents Percentage Rate Legacy gTLD Country #Incidents Percentage Rate1 Gibraltar 59,044 37.09 194.99 United States 578,538 51.42 37.932 China 55,957 35.15 184.8 China 198,995 17.69 13.053 Singapore 24,475 15.38 80.83 India 86,293 7.67 5.664 United States 7,786 4.89 25.71 Canada 49,274 4.38 3.235 India 6,969 4.38 23.01 Germany 46,097 4.1 3.026 United Kingdom 915 0.57 3.02 France 20,712 1.84 1.367 Hong Kong 859 0.54 2.84 United Kingdom 16,099 1.43 1.068 Barbados 515 0.32 1.7 Spain 14,317 1.27 0.949 France 420 0.26 1.39 Turkey 14,261 1.27 0.9310 Japan 399 0.25 1.32 Hong Kong 13,174 1.17 0.86
Table IXSURBL TOP10 LEGACY GTLD AND NEW GTLD RATIO BETWEEN ALL DOMAINS LISTED IN BLACKLIST AND BOTH THE BLACKLIST (PERCENTAGE) AND
REGISTRAR COUNTRY (RATE) TOTAL NUMBER OF DOMAINS.
# New gTLD Country #Incidents Percentage Rate Legacy gTLD Country #Incidents Percentage Rate1 Gibraltar 751,748 49.44 2482.63 United States 1,985,574 47.06 130.182 Japan 295,647 19.44 976.37 Japan 1,190,409 28.21 78.053 China 214,332 14.1 707.83 China 319,546 7.57 20.954 United States 109,989 7.23 363.24 India 268,812 6.37 17.625 India 54,782 3.6 180.92 Germany 73,185 1.73 4.86 United Kingdom 24,955 1.64 82.41 Ireland 58,292 1.38 3.827 France 20,121 1.32 66.45 Canada 40,355 0.96 2.658 United Arab Emirates 11,793 0.78 38.95 Australia 33,080 0.78 2.179 Cayman Islands 8,912 0.59 29.43 Turkey 32,266 0.76 2.1210 Canada 6,494 0.43 21.45 Bahamas 28,918 0.69 1.9
Table XSPAMHAUS TOP10 LEGACY GTLD AND NEW GTLD RATE BETWEEN ALL DOMAINS LISTED IN BLACKLIST AND BOTH THE BLACKLIST (PERCENTAGE)
AND REGISTRAR COUNTRY (RATE) TOTAL NUMBER OF DOMAINS.
# New gTLD Country #Incidents Percentage Rate Legacy gTLD Country #Incidents Percentage Rate1 Gibraltar 1,208,509 53.97 3991.07 United States 2,118,994 47.09 138.932 Japan 263,899 11.78 871.52 Japan 1,131,316 25.14 74.173 China 228,728 10.21 755.37 China 390,860 8.69 25.634 United States 221,577 9.89 731.75 India 291,398 6.48 19.15 Singapore 123,290 5.51 407.16 Turkey 92,475 2.06 6.066 India 75,040 3.35 247.82 Germany 74,919 1.66 4.917 United Kingdom 32,352 1.44 106.84 Bahamas 73,290 1.63 4.818 France 25,807 1.15 85.23 Canada 70,700 1.57 4.649 Cayman Islands 17,891 0.8 59.08 Australia 40,620 0.9 2.6610 Hong Kong 7,592 0.34 25.07 United Kingdom 28,631 0.64 1.88
Table XIAPWG TOP10 LEGACY GTLD AND NEW GTLD RATE BETWEEN ALL DOMAINS LISTED IN BLACKLIST AND BOTH THE BLACKLIST (PERCENTAGE) AND
REGISTRAR COUNTRY (RATE) TOTAL NUMBER OF DOMAINS.
# New gTLD Country #Incidents Percentage Rate Legacy gTLD Country #Incidents Percentage Rate1 United States 3,551 36.51 5.65 United States 155,928 60.95 10.222 China 2,673 27.48 4.25 India 27,027 10.56 1.773 India 695 7.15 1.11 Canada 14,096 5.51 0.924 Germany 363 3.73 0.58 Germany 9,174 3.59 0.65 Gibraltar 350 3.6 0.56 China 8,085 3.16 0.536 United Kingdom 297 3.05 0.47 Australia 5,406 2.11 0.357 Canada 291 2.99 0.46 United Kingdom 4,946 1.93 0.328 Singapore 281 2.89 0.45 France 4,056 1.59 0.279 Japan 201 2.07 0.32 Turkey 3,876 1.52 0.2510 Hong Kong 177 1.82 0.28 Bahamas 2,528 0.99 0.17
the .science gTLD. This registrar is known for its very lowpricing or giving domains away for free. In 2016 it did have
promotions for domains using the .science gTLD for US $1or less. We did not find corresponding peaks in the size of the
20
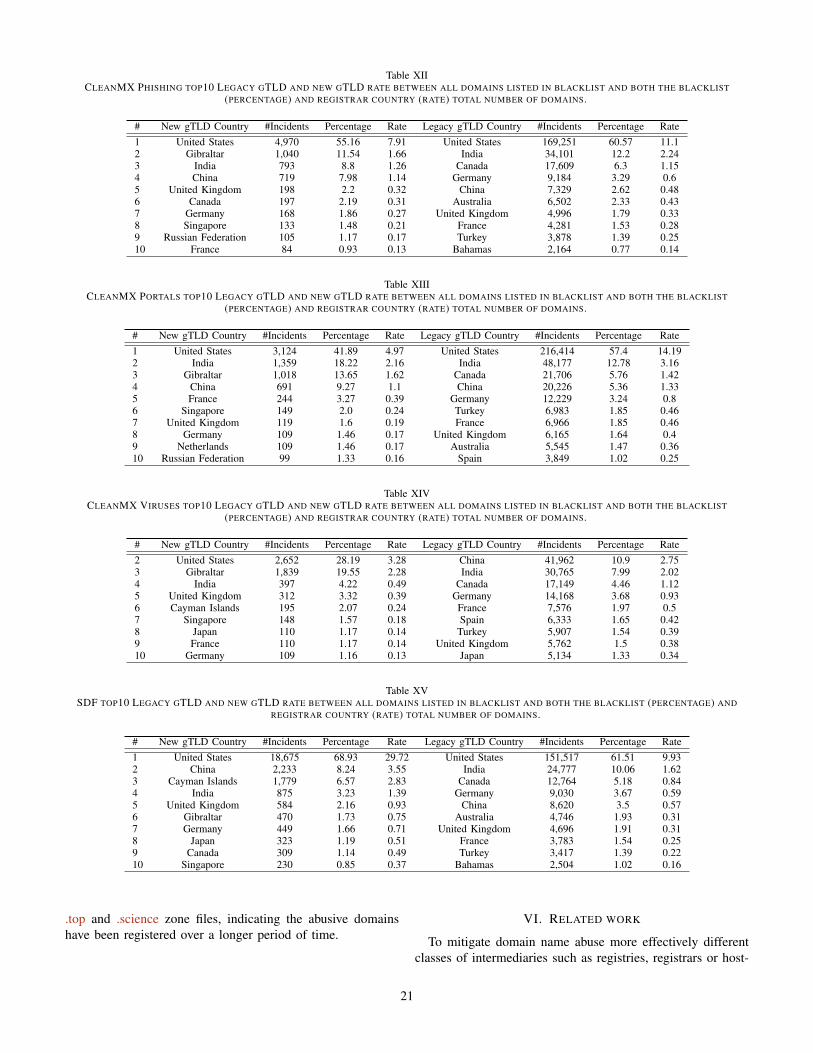
Table XIICLEANMX PHISHING TOP10 LEGACY GTLD AND NEW GTLD RATE BETWEEN ALL DOMAINS LISTED IN BLACKLIST AND BOTH THE BLACKLIST
(PERCENTAGE) AND REGISTRAR COUNTRY (RATE) TOTAL NUMBER OF DOMAINS.
# New gTLD Country #Incidents Percentage Rate Legacy gTLD Country #Incidents Percentage Rate1 United States 4,970 55.16 7.91 United States 169,251 60.57 11.12 Gibraltar 1,040 11.54 1.66 India 34,101 12.2 2.243 India 793 8.8 1.26 Canada 17,609 6.3 1.154 China 719 7.98 1.14 Germany 9,184 3.29 0.65 United Kingdom 198 2.2 0.32 China 7,329 2.62 0.486 Canada 197 2.19 0.31 Australia 6,502 2.33 0.437 Germany 168 1.86 0.27 United Kingdom 4,996 1.79 0.338 Singapore 133 1.48 0.21 France 4,281 1.53 0.289 Russian Federation 105 1.17 0.17 Turkey 3,878 1.39 0.2510 France 84 0.93 0.13 Bahamas 2,164 0.77 0.14
Table XIIICLEANMX PORTALS TOP10 LEGACY GTLD AND NEW GTLD RATE BETWEEN ALL DOMAINS LISTED IN BLACKLIST AND BOTH THE BLACKLIST
(PERCENTAGE) AND REGISTRAR COUNTRY (RATE) TOTAL NUMBER OF DOMAINS.
# New gTLD Country #Incidents Percentage Rate Legacy gTLD Country #Incidents Percentage Rate1 United States 3,124 41.89 4.97 United States 216,414 57.4 14.192 India 1,359 18.22 2.16 India 48,177 12.78 3.163 Gibraltar 1,018 13.65 1.62 Canada 21,706 5.76 1.424 China 691 9.27 1.1 China 20,226 5.36 1.335 France 244 3.27 0.39 Germany 12,229 3.24 0.86 Singapore 149 2.0 0.24 Turkey 6,983 1.85 0.467 United Kingdom 119 1.6 0.19 France 6,966 1.85 0.468 Germany 109 1.46 0.17 United Kingdom 6,165 1.64 0.49 Netherlands 109 1.46 0.17 Australia 5,545 1.47 0.3610 Russian Federation 99 1.33 0.16 Spain 3,849 1.02 0.25
Table XIVCLEANMX VIRUSES TOP10 LEGACY GTLD AND NEW GTLD RATE BETWEEN ALL DOMAINS LISTED IN BLACKLIST AND BOTH THE BLACKLIST
(PERCENTAGE) AND REGISTRAR COUNTRY (RATE) TOTAL NUMBER OF DOMAINS.
# New gTLD Country #Incidents Percentage Rate Legacy gTLD Country #Incidents Percentage Rate2 United States 2,652 28.19 3.28 China 41,962 10.9 2.753 Gibraltar 1,839 19.55 2.28 India 30,765 7.99 2.024 India 397 4.22 0.49 Canada 17,149 4.46 1.125 United Kingdom 312 3.32 0.39 Germany 14,168 3.68 0.936 Cayman Islands 195 2.07 0.24 France 7,576 1.97 0.57 Singapore 148 1.57 0.18 Spain 6,333 1.65 0.428 Japan 110 1.17 0.14 Turkey 5,907 1.54 0.399 France 110 1.17 0.14 United Kingdom 5,762 1.5 0.3810 Germany 109 1.16 0.13 Japan 5,134 1.33 0.34
Table XVSDF TOP10 LEGACY GTLD AND NEW GTLD RATE BETWEEN ALL DOMAINS LISTED IN BLACKLIST AND BOTH THE BLACKLIST (PERCENTAGE) AND
REGISTRAR COUNTRY (RATE) TOTAL NUMBER OF DOMAINS.
# New gTLD Country #Incidents Percentage Rate Legacy gTLD Country #Incidents Percentage Rate1 United States 18,675 68.93 29.72 United States 151,517 61.51 9.932 China 2,233 8.24 3.55 India 24,777 10.06 1.623 Cayman Islands 1,779 6.57 2.83 Canada 12,764 5.18 0.844 India 875 3.23 1.39 Germany 9,030 3.67 0.595 United Kingdom 584 2.16 0.93 China 8,620 3.5 0.576 Gibraltar 470 1.73 0.75 Australia 4,746 1.93 0.317 Germany 449 1.66 0.71 United Kingdom 4,696 1.91 0.318 Japan 323 1.19 0.51 France 3,783 1.54 0.259 Canada 309 1.14 0.49 Turkey 3,417 1.39 0.2210 Singapore 230 0.85 0.37 Bahamas 2,504 1.02 0.16
.top and .science zone files, indicating the abusive domainshave been registered over a longer period of time.
VI. RELATED WORK
To mitigate domain name abuse more effectively differentclasses of intermediaries such as registries, registrars or host-
21

Table XVISURBL TOP10 PERCENTAGE BETWEEN BLACKLISTED NEW AND LEGACY GTLD DOMAINS (#INCIDENTS) AND TOTAL NUMBER OF REGISTRAR GTLD
DOMAINS (#DOMAINS).
# new gTLD registrar #Domains #Incidents Percent Legacy gTLD registrar #Domains #Incidents Percent1 Nanjing Imperiosus Technology 38,025 35,502 93.36 HOAPDI INC. 141 126 89.362 Intracom Middle East FZE 20,640 11,255 54.53 asia registry r2-asia (700000) 1,379 598 43.363 Dot Holding Inc. 153 76 49.67 Nanjing Imperiosus Technology 35,309 10,834 30.684 Alpnames Limited 3,028,011 751,748 24.83 Paknic (Private) Limited 10,525 3,083 29.295 Todaynic.com, Inc. 329,399 69,404 21.07 OwnRegistrar, Inc. 22,188 5,238 23.616 Web Werks India Pvt. Ltd 785 146 18.6 Eranet International Limited 6,109 1,339 21.927 GMO Internet, Inc. d/b/a Onamae.com 1,734,775 295,641 17.04 BR domain Inc. dba namegear.co 847 158 18.658 TLD Registrar Solutions Ltd. 163,988 24,700 15.06 Netlynx Inc. 17,612 3,030 17.29 Xiamen Nawang Technology Co., Ltd 282,925 42,089 14.88 AFRIREGISTER S.A. 1,551 266 17.1510 Instra Corporation Pty Ltd. 77,642 6,200 7.99 GMO Internet, Inc. d/b/a Onamae.com 7,306,312 1,177,886 16.12
Table XVIISPAMHAUS TOP10 RATE BETWEEN BLACKLISTED NEW AND LEGACY GTLD DOMAINS (#INCIDENTS) AND TOTAL NUMBER OF REGISTRAR GTLD
DOMAINS (#DOMAINS).
# new gTLD registrar #Domains #Incidents Percent Legacy gTLD registrar #Domains #Incidents Percent1 Nanjing Imperiosus Technology 38,025 29,682 78.06 ABSYSTEMS INC 688 632 91.862 Alpnames Limited 3,028,011 1,208,509 39.91 Eranet International Limited 6,109 4,074 66.693 Shanghai Best Oray Information S&T 3,600 1,324 36.78 Ednit Software Private Limited 524 285 54.394 Dot Holding Inc. 153 50 32.68 Dynamic Dolphin, Inc. 12,515 5,870 46.95 MAT BAO CORPORATION 3,116 746 23.94 Webair Internet Development, Inc. 19,607 7,484 38.176 NameSilo, LLC 31,084 6,718 21.61 asia registry r2-asia (700000) 1,379 460 33.367 Zhengzhou Century Connect Elec. Tech. Dev. 16,057 3,235 20.15 Nanjing Imperiosus Technology 35,309 11,475 32.58 TLD Registrar Solutions Ltd. 163,988 32,043 19.54 Alpnames Limited 27,558 7,604 27.599 Netowl, Inc. 1,190 206 17.31 GoName-TN.com, Inc. 7,088 1,815 25.6110 GMO Internet, Inc. d/b/a Onamae.com 1,734,775 263,681 15.2 Paknic (Private) Limited 10,525 2,553 24.26
Table XVIIIAPWG TOP10 RATE BETWEEN BLACKLISTED NEW AND LEGACY GTLD DOMAINS (#INCIDENTS) AND TOTAL NUMBER OF REGISTRAR GTLD DOMAINS
(#DOMAINS).
# new gTLD registrar #Domains #Incidents Percent Legacy gTLD registrar #Domains #Incidents Percent1 Key-Systems GmbH 8,078 148 1.83 Minds and Machines LLC 1,115 117 10.492 AB Name ISP 1,074 14 1.3 Tecnologia, Desarrollo Y Mercado S. 2,027 128 6.313 OpenTLD B.V. 793 5 0.63 BR domain Inc. dba namegear.co 847 18 2.134 BigRock Solutions Ltd. 3,465 11 0.32 Abu-Ghazaleh Intellectual Property 1,365 27 1.985 DOTSERVE INC. 10,782 34 0.32 Shinjiru Technology Sdn Bhd 16,134 256 1.596 Shenzhen HuLianXianFeng Technology 6,125 19 0.31 Naugus Limited LLC 7,803 102 1.317 Shanghai Meicheng Technology Inf. Dev. 50,501 151 0.3 Upperlink Limited 4,527 56 1.248 FBS Inc. 56,438 164 0.29 Rethem Hosting LLC 3,841 38 0.999 Paragon Internet Group Ltd 3,645 10 0.27 Eranet International Limited 6,109 45 0.7410 CV. Rumahweb Indonesia 10,822 26 0.24 Danesco Trading Ltd. 186,035 1,214 0.65
Table XIXSTOPBADWARE TOP10 RATE BETWEEN BLACKLISTED NEW AND LEGACY GTLD DOMAINS (#INCIDENTS) AND TOTAL NUMBER OF REGISTRAR GTLD
DOMAINS (#DOMAINS).
# new gTLD registrar #Domains #Incidents Percent Legacy gTLD registrar #Domains #Incidents Percent1 Xiamen Nawang Technology Co., Ltd 282,925 12,427 4.39 Rethem Hosting LLC 3,841 772 20.12 Foshan YiDong Network Co., LTD 45,556 1,698 3.73 0101 Internet, Inc. 8,317 576 6.933 Netowl, Inc. 1,190 43 3.61 Zhengzhou Zitian Network Technology 12,235 555 4.544 Super Registry Ltd 21,322 515 2.42 Xiamen Nawang Technology Co., Ltd 206,700 5,762 2.795 Alpnames Limited 3,028,011 59,044 1.95 Minds and Machines LLC 1,115 26 2.336 Jiangsu Bangning Science & technology 200,323 3,310 1.65 Danesco Trading Ltd. 186,035 4,297 2.317 Todaynic.com, Inc. 329,399 4,999 1.52 In2net Network Inc. 106,992 2,432 2.278 Alibaba Cloud Computing 1,859,602 24,474 1.32 Shanghai Oweb Network Co., Ltd 149 3 2.019 CV. Rumahweb Indonesia 10,822 98 0.91 CyanDomains, Inc. 16,965 337 1.9910 Web Werks India Pvt. Ltd 785 7 0.89 Key-Systems, LLC 161 3 1.86
22

Table XXCLEANMX PHISHING TOP10 RATE BETWEEN BLACKLISTED NEW AND LEGACY GTLD DOMAINS (#INCIDENTS) AND TOTAL NUMBER OF REGISTRAR
GTLD DOMAINS (#DOMAINS).
# new gTLD registrar #Domains #Incidents Percent Legacy gTLD registrar #Domains #Incidents Percent1 OpenTLD B.V. 793 3 0.38 Minds and Machines LLC 1,115 108 9.692 AB Name ISP 1,074 4 0.37 Shinjiru Technology Sdn Bhd 16,134 280 1.743 Web4Africa Inc. 2,445 9 0.37 Upperlink Limited 4,527 74 1.634 CV. Rumahweb Indonesia 10,822 33 0.3 BR domain Inc. dba namegear.co 847 8 0.945 BigRock Solutions Ltd. 3,465 8 0.23 Launchpad.com Inc. 1,110,454 10,069 0.916 DOTSERVE INC. 10,782 24 0.22 Eranet International Limited 6,109 51 0.837 Shenzhen HuLianXianFeng Technology 6,125 10 0.16 Web4Africa Inc. 22,418 187 0.838 10dencehispahard, S.L. 6,455 10 0.15 Rethem Hosting LLC 3,841 32 0.839 Marcaria.com International, Inc. 14,886 23 0.15 Dattatec.com SRL 196,950 1,307 0.6610 ZNet Technologies Pvt Ltd. 1,365 2 0.15 Name121, Inc. 17,626 113 0.64
Table XXICLEANMX VIRUSES TOP10 RATE BETWEEN BLACKLISTED NEW AND LEGACY GTLD DOMAINS (#INCIDENTS) AND TOTAL NUMBER OF REGISTRAR
GTLD DOMAINS (#DOMAINS).
# new gTLD registrar #Domains #Incidents Percent Legacy gTLD registrar #Domains #Incidents Percent1 Danesco Trading Ltd. 137 2 1.46 0101 Internet, Inc. 8,317 262 3.152 Foshan YiDong Network Co., LTD 45,556 209 0.46 Minds and Machines LLC 1,115 26 2.333 Xiamen Nawang Technology Co., Ltd 282,925 899 0.32 Soluciones Corporativas IP, SL 197,864 3,029 1.534 Authentic Web Inc. 1,179 3 0.25 Rethem Hosting LLC 3,841 51 1.335 Netowl, Inc. 1,190 3 0.25 Pheenix 7, LLC 314 4 1.276 TLD Registrar Solutions Ltd. 163,988 289 0.18 Danesco Trading Ltd. 186,035 1,702 0.917 Eranet International Limited 42,154 58 0.14 CloudFlare, Inc. 221 2 0.98 Dynadot, LLC 94,891 125 0.13 Paknic (Private) Limited 10,525 93 0.889 CV. Rumahweb Indonesia 10,822 13 0.12 IPNIC, Inc. 687 6 0.8710 Jiangsu Bangning Science & technology 200,323 145 0.07 UKRNAMES 69,480 558 0.8
Table XXIICLEANMX PORTALS TOP10 RATE BETWEEN BLACKLISTED NEW AND LEGACY GTLD DOMAINS (#INCIDENTS) AND TOTAL NUMBER OF REGISTRAR
GTLD DOMAINS (#DOMAINS).
# new gTLD registrar #Domains #Incidents Percent Legacy gTLD registrar #Domains #Incidents Percent1 Hosting Concepts B.V. d/b/a Openprovider 32,341 105 0.32 Minds and Machines LLC 1,115 65 5.832 Marcaria.com International, Inc. 14,886 19 0.13 0101 Internet, Inc. 8,317 122 1.473 PDR Ltd. d/b/a PublicDomainRegistry.com 1,299,611 1,354 0.1 Shinjiru Technology Sdn Bhd 16,134 164 1.024 NameCheap, Inc. 1,961,146 1,979 0.1 ZNet Technologies Pvt Ltd. 50,396 466 0.925 Gandi SAS 178,282 160 0.09 Name121, Inc. 17,626 151 0.866 BigRock Solutions Ltd. 3,465 3 0.09 Upperlink Limited 4,527 36 0.87 FBS Inc. 56,438 48 0.09 Web Site Source, Inc. 5,528 41 0.748 Register NV dba Register.eu 26,287 22 0.08 Catalog.com 28,738 213 0.749 CV. Rumahweb Indonesia 10,822 9 0.08 OwnRegistrar, Inc. 22,188 161 0.7310 Regtime Ltd. 12,199 10 0.08 Mps Infotecnics Limited 8,352 59 0.71
Table XXIIISDF TOP10 RATE BETWEEN BLACKLISTED NEW AND LEGACY GTLD DOMAINS (#INCIDENTS) AND TOTAL NUMBER OF REGISTRAR GTLD DOMAINS
(#DOMAINS).
# new gTLD registrar #Domains #Incidents Percent Legacy gTLD registrar #Domains #Incidents Percent1 Key-Systems GmbH 8,078 155 1.92 Minds and Machines LLC 1,115 115 10.312 AB Name ISP 1,074 12 1.12 Tecnologia, Desarrollo Y Mercado S. 2,027 123 6.073 OpenTLD B.V. 793 5 0.63 Abu-Ghazaleh Intellectual Property 1,365 30 2.24 NameCheap, Inc. 1,961,146 12,161 0.62 BR domain Inc. dba namegear.co 847 17 2.015 Bizcn.com, Inc. 124,345 464 0.37 Shinjiru Technology Sdn Bhd 16,134 271 1.686 Nanjing Imperiosus Technology 38,025 133 0.35 Eranet International Limited 6,109 91 1.497 BigRock Solutions Ltd. 3,465 11 0.32 Naugus Limited LLC 7,803 105 1.358 TLD Registrar Solutions Ltd. 163,988 476 0.29 Upperlink Limited 4,527 55 1.219 FBS Inc. 56,438 158 0.28 Rethem Hosting LLC 3,841 29 0.7610 Shenzhen HuLianXianFeng Technology 6,125 17 0.28 Paknic (Private) Limited 10,525 74 0.7
23

ing providers should be able to benchmark themselves againsttheir market. Currently, there exists very little empirical infor-mation about the security of TLDs, in particular new gTLDs.However, a number of studies included security metrics as apart of their analysis.
Levchenko et al. found some registrars, ASes and bankswhich are disproportionately popular among criminals, possi-bly due to their security practices [47]. Moore and Edelmanfound a concentration of typosquatted domains on a smallnumber of name servers [48]. Korczynski et al. illuminatedthe problem of non-secure DNS dynamic updates, whichallow a cybercriminal to manipulate DNS entries in zonefiles of authoritative name servers. They found that 66.2% ofvulnerable domains are hosted on the infrastructure of a singlebroadband Internet Service Provider (ISP). Reconfiguring zonefiles of just 10 providers would reduce the prevalence ofthe problem with 88.6% [49]. Ma et al. used name serverand registrar information to distinguish malicious URLs frombenign ones [50]. Hao et al. observed that 46% of the spamdomains come from just two registrars [51]. However, theyconsidered only the .com TLD and did not consider thesize estimate for smaller registrars which might register adisproportionate amount of malicious domains. Antonakakiset al. developed a dynamic reputation system using passiveDNS data to classify legitimate and malicious domains andassign a reputation score to the new domains [52]. Our workdoes not rank individual domains but rather designs reputationmetrics for the legacy and new gTLDs.
Numerous studies attributed security incidents to hostingproviders by equating them with ASes. The number of inci-dents is often normalized by the AS size [36], [53]. Mahjoubinvestigated the concentration of abuse in ASes by analyzinghosted content, AS topology and IP space reservation [54].Noorozian et al. presented a systematic approach for metricsdevelopment and identify the main challenges that plague met-ric design [36]. In the process, they answer an urgent questionposed to them by the Dutch police: “Which are the worsthosting providers under our jurisdiction?”. In their follow-upwork, Noorozian et al. presented a causal model of securityincidents using seven abuse datasets and then proposed a newmodelling approach to enable better measurement of securityperformance from abuse data [55]. Other studies identifiedmalicious ASes using AS topology, BGP-related features andby exploring ASes providing transit for malicious ASes [56]–[58].
Only a few studies on DNS abuse in TLDs have beenconducted. Rasmussen and Aaron regularly release Anti-Phishing Working Group Global Phishing Reports, in whichthey examine phishing datasets collected by APWG andseveral other supplementary phishing feeds. Recently, theyconcluded that phishing in the new gTLDs is rising, but isnot yet as pervasive as it is in the domain space as a whole[41]. Halvorson et al. found that new gTLD domains are morethan twice as likely as legacy TLDs to appear on a domainblacklist within their first month of registration [1]. In the mostsimilar study to our paper, Korczynski et al. designed security
metrics to measure and benchmark entire TLDs against theirmarket [33]. They explicitly distinguished the metrics from theidea of measuring security performance because the measuredvalues of the proposed metrics are driven by multiple factors,not just by the performance of the particular market player.They found that next to TLD size, abuse primarily correlateswith domain pricing (free versus paid registrations), efforts ofintermediaries (measured through the proxy of their DNSSECdeployment rate), and strict registration policies [33]. In thispaper, we extend their methodology and perform the firstcomprehensive statistical comparison of rates of DNS abusein new and legacy gTLDs as they pertain to spam, phishing,and malware distribution.
VII. DISCUSSION AND CONCLUSIONS
The ICANN New gTLD Program enabled hundreds ofnew gTLDs to enter into the DNS since the first delegationsoccurred in late 2013. A number of security measures werebuilt into the Program to preemptively mitigate the rates ofabusive, malicious, and criminal activity in these new gTLDs.In this paper, we performed the first comprehensive studyexamining rates of malicious and abusive behavior in new andlegacy gTLDs to evaluate the effectiveness of the proposedsafeguards. We used data sets from many sources, includingzone files, domain WHOIS information, data obtained throughour active measurements, and 11 heterogeneous domain andURL blacklists representing malware, phishing, and spamgenerously provided to us by five reputable organisations.
We found that the absolute number of phishing domains hasbeen driven by phishing domains in legacy gTLDs (mainly.com domains). While the number of abused domains remainsapproximately constant in legacy gTLDs, we observe a clearupward trend in the absolute number of phishing and malwaredomains in new gTLDs. The phishing and malware abuse ratesin legacy and new gTLDs, however, are converging with timeand are very similar at the end of 2016.
The analysis of spam feeds revealed that the absolutenumber of spam domains in new gTLDs is higher than inlegacy gTLDs at the end of 2016. Interestingly, we find thatthe new gTLDs have impacted spam counts of the legacygTLDs: abused domains in the new gTLDs do not increase thenumber of total malicious registrations. Instead, we observeda decrease in the number of malicious registrations in legacygTLDs. Moreover, while legacy gTLDs collectively had aspam-domains-per-10,000 rate of 56.9, in the last quarter of2016, the new gTLDs experienced a rate of 526.6–which isalmost one order of magnitude higher. The analysis of the threemost abused new gTLDs show that 51.5%, 47.6% and 33.4%of all registered domains were abused by cybercriminals andblacklisted by Spamhaus in the last quarter of 2016.
Does the problem affect all new gTLDs? No. Our analysisof Spamhaus and SURBL blacklists reveals that approximately32% and 36% of all new gTLDs available for registration didnot experience a single incident in the last quarter of 2016.On the other hand, Spamhaus blacklisted at least 10% of all
24

registered domains in as many as 15 new gTLDs at the endof 2016.
While we found higher concentrations of compromiseddomains in legacy gTLDs, miscreants frequently choose tomaliciously register domain names using one of the newgTLDs. The registry operators of the most abused new gTLDscompete on price. We found that their retail registration priceswere occasionally below US $1 or even US $0.50, which waslower than the registration fee for .com domains. It is not clear,however, if pricing is the only factor driving high concentra-tions of maliciously registered domains. We created a useraccount with one registrar suffering from disproportionatelyhigh concentration of abused domains and tested bulk domainregistration options. It is possible, for example, to randomlygenerate up to 2,000 domains at once for a selection of 27 newgTLDs using different patterns including letters, time, cities,zip codes, etc.
We also systematically analyzed how different structural andsecurity-related properties of new gTLD operators influenceabuse counts. As expected, we found that the number ofdomains in new gTLDs, the number of parked domains, orthe number of DNSSEC-signed domains play a statisticallysignificant but very weak role in explaining the differences inabuse counts between different new gTLDs. Our inferentialanalysis revealed that abuse counts primarily correlate withstrict registrations. Miscreants prefer to register, for example,standard new gTLD domain names, which are generally openfor public registration, rather than community new gTLDs forwhich registries may impose restrictions on who or whichentities can register their domains. In our models, we alsoconsidered the name of the registry operators to capturesystematic differences in the policies of registries across newgTLDs such as pricing, bulk registration options, etc. In otherwords, we tested the correlation between registry operators anddomain abuse counts. However, we did not find any statisti-cally significant effects on the abuse counts. In future work,we plan to collect detailed data on registration policies acrossall new gTLDs and perform a more fine-grained analysis onfactors that may also influence abuse counts.
Our findings suggest that some new gTLDs have becomea growing target for malicious actors. Competitive domainregistration prices, unrestrictive registration practices, a vari-ety of other registration options such as available paymentmethods, free services such as DNS or WHOIS privacy, andfinally the increased availability of domain names decreasebarriers to abuse and may make some new gTLDs targets forcybercriminals.
ACKNOWLEDGEMENTS
This study was commissioned by the Competition, Con-sumer Trust, and Consumer Choice Review Team with thesupport of ICANN. We would like to thank ICANN, Domain-Tools, Whois XML API, Spamhaus, SURBL, StopBadware,CleanMX, Secure Domain Foundation, Anti-Phishing WorkingGroup for providing access to their data. Authors also thankRoland van Rijswijk for his help in obtaining additional
domain data and anonymous reviewers for their constructiveand valuable comments.
REFERENCES
[1] T. Halvorson, M. F. Der, I. Foster, S. Savage, L. K. Saul, and G. M.Voelker, “From .Academy to .Zone: An Analysis of the New TLDLand Rush,” in Proceedings of the 2015 ACM Conference on InternetMeasurement Conference, ser. IMC’15. ACM, 2015, pp. 381–394.
[2] “Internet Corporation for Assigned Names and Numbers (ICANN),”https://www.icann.org.
[3] J. Postel and J. Reynolds, “Domain requirements,” Internet Requests forComments, RFC Editor, RFC 920, October 1984.
[4] ICANN, “New gTLD Program,” https://icannwiki.com/New_gTLD_Program, 2017.
[5] ——, “New gTLD Program,” https://icannwiki.org/New_gTLD_Program, February 2017.
[6] ——, “.madrid,” https://icannwiki.org/.madrid, March 2015.[7] ——, “New gTLD Program,” https://icannwiki.org/New_gTLD_
Generic_Applications, February 2017.[8] ——, “New gTLD Program,” https://icannwiki.org/Community_TLD,
February 2017.[9] ——, “New gTLD Program,” https://icannwiki.org/New_gTLD_
Geographic_Applications, February 2017.[10] ——, “New gTLD Program,” https://icannwiki.org/New_gTLD_Brand_
Applications, February 2017.[11] ——, “New gTLD Program Explanatory Memorandum: Mitigat-
ing Malicious Conduct,” https://archive.icann.org/en/topics/new-gtlds/mitigating-malicious-conduct-04oct09-en.pdf, October 2009.
[12] ——, “New gTLD Program Safeguards Against DNSAbuse,” https://newgtlds.icann.org/en/reviews/dns-abuse/safeguards-against-dns-abuse-18jul16-en.pdf, July 2016.
[13] “The Spamhaus Project,” www.spamhaus.org.[14] “Anti-Phishing Working Group (APWG): Cross-industry Global Group
Supporting Tackling the Phishing Menace,” http://www.antiphishing.org.[15] “StopBadware: A Nonprofit Anti-malware Organization.” https://www.
stopbadware.org.[16] “SURBL - URI reputation data,” http://www.surbl.org.[17] “The Secure Domain Foundation,” https://securedomain.org/.[18] “Spam-Filter Anti-Spam Virenschutz,” http://clean-mx.de.[19] “The Domain Block List,” https://www.spamhaus.org/dbl.[20] “ESET: Security Software,” http://www.eset.com.[21] “Fortinet: Network & Computer Security,” http://www.fortinet.com.[22] “Sophos: Computer Security, Antivirus,” http://www.sophos.com.[23] “StopBadware: Data Sharing Program,” https://www.stopbadware.org/
data-sharing.[24] “SURBL Lists,” http://www.surbl.org/lists.[25] “Malwarebytes,” https://www.malwarebytes.com/.[26] “Public Suffix List,” https://publicsuffix.org.[27] G. Aaron and R. Rasmussen, “Anti-Phishing Working Group
(APWG) Global Phishing Survey: Trends and Domain NameUse in 1H2014,” http://docs.apwg.org/reports/APWG_Global_Phishing_Report_1H_2014.pdf.
[28] ——, “Anti-Phishing Working Group (APWG) Global Phishing Survey:Trends and Domain Name Use in 2H2014,” http://docs.apwg.org/reports/APWG_Global_Phishing_Report_2H_2014.pdf, 2015.
[29] “Whois XML API,” https://www.whoisxmlapi.com/.[30] ICANN, “TLD Startup Information,” https://newgtlds.icann.org/en/
program-status/sunrise-claims-periods, Retrieved on February 2017.[31] “DomainTools: Domain Whois Lookup, Whois API & DNS Data
Research,” http://www.domaintools.com.[32] “ICANN: .zuerich TLD,” https://icannwiki.org/.zuerich.[33] M. Korczynski, S. Tajalizadehkhoob, A. Noroozian, M. Wullink, C. Hes-
selman, and M. van Eeten, “Reputation metrics design to improveintermediary incentives for security of tlds,” in 2017 IEEE EuropeanSymposium on Security and Privacy (Euro SP), April 2017.
[34] D. Plohmann, K. Yakdan, M. Klatt, J. Bader, and E. Gerhards-Padilla, “AComprehensive Measurement Study of Domain Generating Malware,”in 25th USENIX Security Symposium (USENIX Security 16). USENIXAssociation, Aug. 2016, pp. 263–278.
[35] “ZeusTracker: A Nonprofit Organization Tracking ZeuS C&C Servers.”https://zeustracker.abuse.ch.
25

[36] A. Noroozian, M. Korczynski, S. Tajalizadehkhoob, and M. van Eeten,“Developing security reputation metrics for hosting providers,” in Pro-ceedings of the 8th USENIX CSET, 2015, pp. 1–8.
[37] ICANN, “Monthly Registry Reports,” https://www.icann.org/resources/pages/registry-reports.
[38] S. Tajalizadehkhoob, R. Böhme, C. Gañán, M. Korczynski, andM. van Eeten, “Rotten Apples or Bad Harvest? What We AreMeasuring When We Are Measuring Abuse,” 2017. [Online]. Available:https://arxiv.org/abs/1702.01624
[39] T. Vissers, W. Joosen, and N. Nikiforakis, “Parking sensors: Analyzingand detecting parked domains.” in Network and Distributed SystemSecurity Symposium (NDSS), 2015.
[40] “IANA: Registrar IDs,” https://www.iana.org/assignments/registrar-ids/registrar-ids.xhtml.
[41] G. Aaron and R. Rasmussen, “Global Phishing Survey: Trends and Do-main Name Use in 2016,” http://docs.apwg.org/reports/APWG_Global_Phishing_Report_2015-2016.pdf.
[42] ICANN, “Registrar Accreditation Agreement,” 2013.[Online]. Available: https://www.icann.org/resources/pages/approved-with-specs-2013-09-17-en#whois-accuracy
[43] “Alexa: Actionable Analytics for the Web,” http://www.alexa.com.[44] “National Physical Laboratory: A Study of Whois Privacy and
Proxy Service Abuse,” https://gnso.icann.org/en/issues/whois/pp-abuse-study-20sep13-en.pdf.
[45] “ICANN: ICANN-Accredited Registrars,” https://www.icann.org/registrar-reports/accredited-list.html.
[46] “ICANN: NOTICE OF TERMINATION OF ACCREDITATIONAGREEMENT,” https://www.icann.org/uploads/compliance_notice/attachment/895/serad-to-hansmann-4jan17.pdf.
[47] K. Levchenko, A. Pitsillidis, N. Chachra, B. Enright, M. Félegyházi,C. Grier, T. Halvorson, C. Kanich, C. Kreibich, H. Liu, D. McCoy,N. Weaver, V. Paxson, G. M. Voelker, and S. Savage, “Click Trajectories:End-to-End Analysis of the Spam Value Chain,” in Proceedings of the2011 IEEE Symposium on Security and Privacy. IEEE ComputerSociety, 2011, pp. 431–446.
[48] T. Moore and B. Edelman, “Measuring the Perpetrators and Fundersof Typosquatting,” in Proceedings of the 14th International Conferenceon Financial Cryptography and Data Security, ser. FC’10. Springer-Verlag, 2010, pp. 175–191.
[49] M. Korczynski, M. Król, and M. van Eeten, “Zone Poisoning: The Howand Where of Non-Secure DNS Dynamic Updates,” in Proceedings ofthe 2016 ACM on Internet Measurement Conference, ser. IMC ’16.ACM, 2016, pp. 271–278.
[50] J. Ma, L. K. Saul, S. Savage, and G. M. Voelker, “Beyond Blacklists:Learning to Detect Malicious Web Sites from Suspicious URLs,” inProceedings of the 15th ACM SIGKDD International Conference onKnowledge Discovery and Data Mining, ser. KDD ’09. ACM, 2009,pp. 1245–1254.
[51] S. Hao, M. Thomas, V. Paxson, N. Feamster, C. Kreibich, C. Grier,and S. Hollenbeck, “Understanding the Domain Registration Behaviorof Spammers,” in Proceedings of the 2013 Conference on InternetMeasurement Conference (IMC’13). ACM, 2013, pp. 63–76.
[52] M. Antonakakis, R. Perdisci, D. Dagon, W. Lee, and N. Feamster,“Building a Dynamic Reputation System for DNS,” in USENIX SecuritySymposium. USENIX Association, 2010, pp. 273–290.
[53] C. A. Shue, A. J. Kalafut, and M. Gupta, “Abnormally MaliciousAutonomous Systems and Their Internet Connectivity,” IEEE/ACMTransactions on Networking, vol. 20, no. 1, pp. 220–230, 2012.
[54] D. Mahjoub, “Sweeping the IP Space: the Hunt for Evil on theInternet.” Virus Bulletin Conference, 2014. [Online]. Available:https://www.virusbtn.com/pdf/conference/vb2014/VB2014-Mahjoub.pdf
[55] A. Noroozian, M. Ciere, M. Korczynski, S. Tajalizadehkhoob, andM. Eeten, “Inferring the Security Performance of Providers from Noisyand Heterogenous Abuse Datasets,” in WEIS 2017, June 2017.
[56] B. Stone-Gross, C. Kruegel, K. Almeroth, A. Moser, and E. Kirda,“FIRE: FInding Rogue nEtworks,” in Proceedings of the 2009 AnnualComputer Security Applications Conference, ser. ACSAC ’09. IEEEComputer Society, 2009, pp. 231–240.
[57] M. Konte, R. Perdisci, and N. Feamster, “ASwatch: An AS ReputationSystem to Expose Bulletproof Hosting ASes,” in Proceedings of the2015 ACM Conference on Special Interest Group on Data Communica-tion. ACM, 2015, pp. 625–638.
[58] C. Wagner, J. François, R. State, A. Dulaunoy, T. Engel, and G. Massen,“ASMATRA: Ranking ASs Providing Transit Service to Malware
Hosters,” in IFIP/IEEE International Symposium on Integrated NetworkManagement. IEEE, 2013, pp. 260–268.
26

APPENDIX
1
10
100
1000
10000
100000
1x10⁶
Jul 2
014
Oct 20
14
Jan 2
015
Apr 20
15
Jul 2
015
Oct 20
15
Jan 2
016
Apr 20
16
Jul 2
016
Oct 20
16
Jan 2
017
Tota
ls
Date
Malware domains per new and legacy gTLDs, SURBL mw datasetTotal new gTLDs legacy gTLDs
Figure 32. Time series of counts of malware domains in legacy gTLD, newgTLDs, and all gTLDs (Total) based on the SURBL mw feed (2014-2016).Please notice y axis in log scale and overlapping lines.
0.001
0.01
0.1
1
10
100
Jul 2
014
Oct 20
14
Jan 2
015
Apr 20
15
Jul 2
015
Oct 20
15
Jan 2
016
Apr 20
16
Jul 2
016
Oct 20
16
Jan 2
017
Rat
e
Date
Rates of malware domains per new and legacy gTLDs, SURBL mw datasetnew gTLDs legacy gTLDs
Figure 33. Time series of abuse rates of malware domains in legacy gTLDsand new gTLDs based on the SURBL mw feed (2014-2016). Rates are cal-culated as follows: S = 10, 000⇤#blacklisted domains/#all domains.
10
100
1000
10000
100000
Jul 2
014
Oct 20
14
Jan 2
015
Apr 20
15
Jul 2
015
Oct 20
15
Jan 2
016
Apr 20
16
Jul 2
016
Oct 20
16
Jan 2
017
Tota
ls
Date
Phishing domains per new and legacy gTLDs, SURBL ph datasetTotal new gTLDs legacy gTLDs
Figure 34. Time series of counts of phishing domains in legacy gTLD, newgTLDs, and all gTLDs (Total) based on the SURBL ph feed (2014-2016).Please notice y axis in log scale and overlapping lines.
0.1
1
10
Jul 2
014
Oct 20
14
Jan 2
015
Apr 20
15
Jul 2
015
Oct 20
15
Jan 2
016
Apr 20
16
Jul 2
016
Oct 20
16
Jan 2
017
Rat
e
Date
Rates of phishing domains per new and legacy gTLDs, SURBL ph datasetnew gTLDs legacy gTLDs
Figure 35. Time series of abuse rates of phishing domains in legacy gTLDsand new gTLDs based on the SURBL ph feed (2014-2016). Rates are calcu-lated as follows: S = 10, 000 ⇤#blacklisted domains/#all domains.
1000
10000
100000
1x10⁶
1x10⁷
Jul 2
014
Oct 20
14
Jan 2
015
Apr 20
15
Jul 2
015
Oct 20
15
Jan 2
016
Apr 20
16
Jul 2
016
Oct 20
16
Jan 2
017
Tota
ls
Date
Blacklisted domains per new and legacy gTLDs, SURBL jp datasetTotal new gTLDs legacy gTLDs
Figure 36. Time series of counts of blacklisted domains in legacy gTLD,new gTLDs, and all gTLDs (Total) based on the SURBL jp feed (2014-2016).Please notice y axis in log scale and overlapping lines.
10
100
1000
Jul 2
014
Oct 20
14
Jan 2
015
Apr 20
15
Jul 2
015
Oct 20
15
Jan 2
016
Apr 20
16
Jul 2
016
Oct 20
16
Jan 2
017
Rat
e
Date
Rates of blacklisted domains per new and legacy gTLDs, SURBL jp datasetnew gTLDs legacy gTLDs
Figure 37. Time series of abuse rates of blacklisted domains in legacy gTLDsand new gTLDs based on the SURBL jp feed (2014-2016). Rates are calcu-lated as follows: S = 10, 000 ⇤#blacklisted domains/#all domains.
27

1000
10000
100000
1x10⁶
1x10⁷
Jul 2
014
Oct 20
14
Jan 2
015
Apr 20
15
Jul 2
015
Oct 20
15
Jan 2
016
Apr 20
16
Jul 2
016
Oct 20
16
Jan 2
017
Tota
ls
Date
Blacklisted domains per new and legacy gTLDs, SURBL ws datasetTotal new gTLDs legacy gTLDs
Figure 38. Time series of counts of blacklisted domains in legacy gTLD, newgTLDs, and all gTLDs (Total) based on the SURBL ws feed (2014-2016).Please notice y axis in log scale and overlapping lines.
10
100
1000
Jul 2
014
Oct 20
14
Jan 2
015
Apr 20
15
Jul 2
015
Oct 20
15
Jan 2
016
Apr 20
16
Jul 2
016
Oct 20
16
Jan 2
017
Rat
e
Date
Rates of blacklisted domains per new and legacy gTLDs, SURBL ws datasetnew gTLDs legacy gTLDs
Figure 39. Time series of abuse rates of blacklisted domains in legacy gTLDsand new gTLDs based on the SURBL ws feed (2014-2016). Rates are calcu-lated as follows: S = 10, 000 ⇤#blacklisted domains/#all domains.
10000
100000
1x10⁶
Jan 2
014
Apr 20
14
Jul 2
014
Oct 20
14
Jan 2
015
Apr 20
15
Jul 2
015
Oct 20
15
Jan 2
016
Apr 20
16
Jul 2
016
Oct 20
16
Jan 2
017
Tota
ls
Date
Phishing domains, FQDNs, and URLs per legacy gTLDs, cleanMX phishingdomain fqdn path
Figure 40. Time series of counts of blacklisted phishing domains, FQDNs,and URLs (paths) in legacy gTLD based on the CleanMX phishing feed(2014-2016). Please notice y axis in log scale and overlapping lines.
10
100
1000
10000
Jan 2
014
Apr 20
14
Jul 2
014
Oct 20
14
Jan 2
015
Apr 20
15
Jul 2
015
Oct 20
15
Jan 2
016
Apr 20
16
Jul 2
016
Oct 20
16
Jan 2
017
Tota
ls
Date
Phishing domains, FQDNs, and URLs per new gTLDs, cleanMX phishing datasetdomain fqdn path
Figure 41. Time series of counts of phishing domains, FQDNs, and URLs(paths) in new gTLD based on the CleanMX phishing feed (2014-2016).Please notice y axis in log scale and overlapping lines.
10
100
1000
10000
100000
Jan 2
014
Apr 20
14
Jul 2
014
Oct 20
14
Jan 2
015
Apr 20
15
Jul 2
015
Oct 20
15
Jan 2
016
Apr 20
16
Jul 2
016
Oct 20
16
Jan 2
017
Tota
ls
Date
Phishing domains per new and legacy gTLDs, cleanMX phishing datasetTotal new gTLDs legacy gTLDs
Figure 42. Time series of counts of blacklisted phishing domains in legacygTLD, new gTLDs, and all gTLDs (Total) based on the CleanMX phishingfeed (2014-2016). Please notice y axis in log scale and overlapping lines.
0.01
0.1
1
10
Jan 2
014
Apr 20
14
Jul 2
014
Oct 20
14
Jan 2
015
Apr 20
15
Jul 2
015
Oct 20
15
Jan 2
016
Apr 20
16
Jul 2
016
Oct 20
16
Jan 2
017
Rat
e
Date
Rates of phishing domains per new and legacy gTLDs, cleanMX phishing datasetnew gTLDs legacy gTLDs
Figure 43. Time series of abuse rates of blacklisted phishing do-mains in legacy gTLDs and new gTLDs based on the CleanMX phish-ing feed (2014-2016). Rates are calculated as follows: S = 10, 000 ⇤#blacklisted domains/#all domains.
1
10
100
1000
10000
Jan 2
014
Apr 20
14
Jul 2
014
Oct 20
14
Jan 2
015
Apr 20
15
Jul 2
015
Oct 20
15
Jan 2
016
Apr 20
16
Jul 2
016
Oct 20
16
Jan 2
017
Tota
ls
Date
Malware domains, FQDNs, and URLs per new gTLDs, cleanMX malware datasetdomain fqdn path
Figure 45. Time series of counts of blacklisted malware domains, FQDNs,and URLs (paths) in new gTLD based on the CleanMX phishing feed (2014-2016). Please notice y axis in log scale and overlapping lines.28

10000
100000
1x10⁶
Jan 2
014
Apr 20
14
Jul 2
014
Oct 20
14
Jan 2
015
Apr 20
15
Jul 2
015
Oct 20
15
Jan 2
016
Apr 20
16
Jul 2
016
Oct 20
16
Jan 2
017
Tota
ls
Date
Malware domains, FQDNs, and URLs per legacy gTLDs, cleanMX malwaredomain fqdn path
Figure 44. Time series of counts of blacklisted malware domains, FQDNs,and URLs (paths) in legacy gTLD based on the CleanMX malware feed(2014-2016). Please notice y axis in log scale and overlapping lines.
1
10
100
1000
10000
100000
Jan 2
014
Apr 20
14
Jul 2
014
Oct 20
14
Jan 2
015
Apr 20
15
Jul 2
015
Oct 20
15
Jan 2
016
Apr 20
16
Jul 2
016
Oct 20
16
Jan 2
017
Tota
ls
Date
Malware domains per new and legacy gTLDs, cleanMX malware datasetTotal new gTLDs legacy gTLDs
Figure 46. Time series of counts of blacklisted malware domains in legacygTLD, new gTLDs, and all gTLDs (Total) based on the CleanMX malwarefeed (2014-2016). Please notice y axis in log scale and overlapping lines.
0.01
0.1
1
10
Jan 2
014
Apr 20
14
Jul 2
014
Oct 20
14
Jan 2
015
Apr 20
15
Jul 2
015
Oct 20
15
Jan 2
016
Apr 20
16
Jul 2
016
Oct 20
16
Jan 2
017
Rat
e
Date
Rates of malware domains per new and legacy gTLDs, cleanMX malware datasetnew gTLDs legacy gTLDs
Figure 47. Time series of abuse rates of blacklisted malware do-mains in legacy gTLDs and new gTLDs based on the CleanMX mal-ware feed (2014-2016). Rates are calculated as follows: S = 10, 000 ⇤#blacklisted domains/#all domains.
10000
100000
1x10⁶
Jan 2
014
Apr 20
14
Jul 2
014
Oct 20
14
Jan 2
015
Apr 20
15
Jul 2
015
Oct 20
15
Jan 2
016
Apr 20
16
Jul 2
016
Oct 20
16
Jan 2
017
Tota
ls
Date
Blacklisted domains, FQDNs, and URLs per legacy gTLDs, cleanMX portals datasetdomain fqdn path
Figure 48. Time series of counts of blacklisted domains, FQDNs, and URLs(paths) in legacy gTLD based on the CleanMX portals feed (2014-2016).Please notice y axis in log scale and overlapping lines.
10
100
1000
10000
Jan 2
014
Apr 20
14
Jul 2
014
Oct 20
14
Jan 2
015
Apr 20
15
Jul 2
015
Oct 20
15
Jan 2
016
Apr 20
16
Jul 2
016
Oct 20
16
Jan 2
017
Tota
ls
Date
Blacklisted domains, FQDNs, and URLs per new gTLDs, cleanMX portals datasetdomain fqdn path
Figure 49. Time series of counts of blacklisted domains, FQDNs, and URLs(paths) in new gTLD based on the CleanMX portals feed (2014-2016). Pleasenotice y axis in log scale and overlapping lines.
10
100
1000
10000
100000
Jan 2
014
Apr 20
14
Jul 2
014
Oct 20
14
Jan 2
015
Apr 20
15
Jul 2
015
Oct 20
15
Jan 2
016
Apr 20
16
Jul 2
016
Oct 20
16
Jan 2
017
Tota
ls
Date
Blacklisted domains per new and legacy gTLDs, cleanMX portals datasetTotal new gTLDs legacy gTLDs
Figure 50. Time series of counts of blacklisted domains in legacy gTLD,new gTLDs, and all gTLDs (Total) based on the CleanMX portals feed(2014-2016). Please notice y axis in log scale and overlapping lines.
29

0.1
1
10
Jan 2
014
Apr 20
14
Jul 2
014
Oct 20
14
Jan 2
015
Apr 20
15
Jul 2
015
Oct 20
15
Jan 2
016
Apr 20
16
Jul 2
016
Oct 20
16
Jan 2
017
Rat
e
Date
Rates of blacklisted domains per new and legacy gTLDs, cleanMX portals datasetnew gTLDs legacy gTLDs
Figure 51. Time series of abuse rates of blacklisted domainsin legacy gTLDs and new gTLDs based on the CleanMX portalsfeed (2014-2016). Rates are calculated as follows: S = 10, 000 ⇤#blacklisted domains/#all domains.
1000
10000
100000
1x10⁶
1x10⁷
Jul 2
014
Oct 20
14
Jan 2
015
Apr 20
15
Jul 2
015
Oct 20
15
Jan 2
016
Apr 20
16
Jul 2
016
Oct 20
16
Jan 2
017
Tota
ls
Date
Blacklisted domains, FQDNs, and URLs per legacy gTLDs, SDF datasetdomain fqdn path
Figure 52. Time series of counts of blacklisted domains, FQDNs, and URLs(paths) in legacy gTLD based on the Secure Domain Foundation feed (2014-2016). Please notice y axis in log scale and overlapping lines.
10
100
1000
10000
100000
Jul 2
014
Oct 20
14
Jan 2
015
Apr 20
15
Jul 2
015
Oct 20
15
Jan 2
016
Apr 20
16
Jul 2
016
Oct 20
16
Jan 2
017
Tota
ls
Date
Blacklisted domains, FQDNs, and URLs per new gTLDs, SDF datasetdomain fqdn path
Figure 53. Time series of counts of blacklisted domains, FQDNs, and URLs(paths) in new gTLD based on the Secure Domain Foundation feed (2014-2016). Please notice y axis in log scale and overlapping lines.
10
100
1000
10000
100000
Jul 2
014
Oct 20
14
Jan 2
015
Apr 20
15
Jul 2
015
Oct 20
15
Jan 2
016
Apr 20
16
Jul 2
016
Oct 20
16
Jan 2
017
Tota
ls
Date
Blacklisted domains per new and legacy gTLDs, SDF datasetTotal new gTLDs legacy gTLDs
Figure 54. Time series of counts of blacklisted domains in legacy gTLD,new gTLDs, and all gTLDs (Total) based on the Secure Domain Foundationfeed (2014-2016). Please notice y axis in log scale and overlapping lines.
0.1
1
10
Jul 2
014
Oct 20
14
Jan 2
015
Apr 20
15
Jul 2
015
Oct 20
15
Jan 2
016
Apr 20
16
Jul 2
016
Oct 20
16
Jan 2
017
Rat
e
Date
Rates of blacklisted domains per new and legacy gTLDs, SDF datasetnew gTLDs legacy gTLDs
Figure 55. Time series of abuse rates of blacklisted domains inlegacy gTLDs and new gTLDs based on the Secure Domain Founda-tion feed (2014-2016). Rates are calculated as follows: S = 10, 000 ⇤#blacklisted domains/#all domains.
30

Table XXIVTOP 10 NEW GTLDS WITH THE HIGHEST RELATIVE CONCENTRATION OF BLACKLISTED DOMAINS FOR STOPBADWARE SDP, APWG, SPAMHAUS,
SECURE DOMAIN FOUNDATION, SURBL, AND CLEANMX DATASETS (FOURTH QUARTER OF 2016). SCORES ARE CALCULATED AS FOLLOWS:S = 10, 000 ⇤#blacklisted domains/#all domains.
StopBadware APWG Spamhaus SDFTLD # Domains Score TLD # Domains Score TLD # Domains Score TLD # Domains ScoreTOYS 32 78 LIMITED 31 66 SCIENCE 117,782 5,154 SUPPORT 510 294TRADE 221 15 SUPPORT 43 24 STREAM 18,543 4,756 TECH 4,409 158TATAR 1 11 CENTER 72 22 STUDY 1,118 3,343 ONLINE 4,179 83WANG 1,086 11 CREDITCARD 1 13 DOWNLOAD 16,399 2,016 LIMITED 15 32JUEGOS 1 9 SERVICES 24 10 CLICK 20,713 1,814 REVIEW 161 24TOP 3,830 8 ONLINE 417 8 TOP 736,339 1,705 CLAIMS 3 19MOE 5 8 MOE 5 8 GDN 45,547 1,602 PRESS 91 19CAB 3 7 HOST 32 7 TRADE 23,581 1,521 FURNITURE 4 18PICS 10 7 LEASE 1 6 REVIEW 9415 1,318 WEBSITE 298 15TATTOO 2 7 REPORT 3 6 ACCOUNTANT 6,722 1,279 CREDITCARD 1 13
SURBL ph SURBL mw SURBL ws SURBL jpTLD # Domains Score TLD # Domains Score TLD # Domains Score TLD # Domains ScoreLIMITED 51 109 FOOTBALL 7 16 RACING 51,443 3,812 SCIENCE 152,719 6,683SUPPORT 82 46 TOP 5,066 11 DOWNLOAD 21,515 2,645 CLICK 27,871 2,441CENTER 93 29 RIP 1 5 ACCOUNTANT 10,543 2,007 GDN 50,940 1,792SERVICES 61 25 BID 200 3 REVIEW 12,615 1,766 STREAM 6,033 1,547CRICKET 57 22 DENTIST 1 3 GDN 49,427 1,739 LINK 39,764 1,238ONLINE 903 16 LGBT 1 3 FAITH 5,540 1,301 REVIEW 8,705 1,219WEBSITE 318 14 ACCOUNTANT 11 2 TRADE 19,330 1,247 CRICKET 2,468 993REPORT 7 14 CAB 1 2 CLICK 13,270 1,162 TRADE 14,535 937HOST 65 13 SUPPORT 5 2 STREAM 4,406 1,130 FAITH 3,130 735CREDITCARD 1 13 POKER 1 2 DATE 1,3851 999 TOP 285,488 661
CleanMX ph CleanMX mw CleanMX ptTLD # Domains Score TLD # Domains Score TLD # Domains ScoreSARL 4 46 RODEO 1 12 QPON 1 20LIMITED 9 19 TATAR 1 11 GRATIS 5 13SUPPORT 19 10 MOE 6 10 CRICKET 32 12ONLINE 493 9 HOW 1 4 TATAR 1 11REPORT 4 8 ONLINE 183 3 DURBAN 2 8MOE 4 6 CASINO 1 3 CLICK 72 6CENTER 21 6 CHEAP 1 3 WEBCAM 18 4REST 1 5 TAX 1 2 TAXI 2 4SERVICES 13 5 CAB 1 2 WEBSITE 105 4LAT 1 4 COMPUTER 1 2 LIMITED 2 4
31

Table XXVTOP 10 LEGACY GTLDS WITH THE HIGHEST RELATIVE CONCENTRATION OF BLACKLISTED DOMAINS FOR STOPBADWARE SDP, APWG, SPAMHAUS,
SECURE DOMAIN FOUNDATION, SURBL, AND CLEANMX DATASETS (FOURTH QUARTER OF 2016). RATES ARE CALCULATED AS FOLLOWS:S = 10, 000 ⇤#blacklisted domains/#all domains.
StopBadware APWG Spamhaus SDFTLD # Domains Score TLD # Domains Score TLD # Domains Score TLD # Domains ScoreCAT 90 8 INFO 884 1 BIZ 57,234 251 INFO 2,317 4MOBI 459 7 ASIA 24 1 NET 172,323 113 COOP 3 3TRAVEL 11 6 CAT 17 1 ASIA 2,192 98 CAT 35 3COM 76,544 6 BIZ 119 1 INFO 26,870 49 BIZ 190 1BIZ 588 5 PRO 46 1 COM 624,852 49 ORG 1,153 1ORG 6,347 5 COM 15,795 1 PRO 1,740 42 NET 2,082 1INFO 2,369 4 COOP 0 0 ORG 30,227 28 PRO 43 1NET 7,123 4 JOBS 0 0 MOBI 849 13 COM 22,226 1COOP 3 3 NAME 8 0 NAME 79 5 JOBS 0 0ASIA 59 2 MUSEUM 0 0 COOP 1 1 NAME 7 0
SURBL ph SURBL mw SURBL ws SURBL jpTLD # Domains Score TLD # Domains Score TLD # Domains Score TLD # Domains ScoreINFO 2,336 4 INFO 31,494 58 BIZ 20,765 91 BIZ 125,286 550COM 41,522 3 ORG 30,298 28 ASIA 1,440 64 INFO 63,062 117ASIA 57 2 COOP 2 2 PRO 1,912 46 NET 152,163 100ORG 2,368 2 ASIA 34 1 NET 60,552 39 ORG 65,365 62NET 3,259 2 NET 2,037 1 COM 299,537 23 COM 342,603 27NAME 21 1 JOBS 0 0 NAME 331 21 NAME 335 21CAT 16 1 NAME 9 0 ORG 22,635 21 MOBI 970 15BIZ 391 1 MUSEUM 0 0 INFO 10,602 19 ASIA 208 9PRO 78 1 AERO 0 0 MOBI 1,160 18 PRO 328 7COOP 0 0 XXX 0 0 COOP 0 0 COOP 2 2
CleanMX ph CleanMX mw CleanMX ptTLD # Domains Score TLD # Domains Score TLD # Domains ScoreCAT 26 2 COOP 2 2 INFO 850 1INFO 1,037 1 TRAVEL 4 2 NAME 21 1COOP 1 1 INFO 1,076 1 CAT 13 1ORG 1,596 1 CAT 17 1 TRAVEL 3 1NET 1,800 1 MOBI 85 1 ORG 1,743 1COM 21,759 1 BIZ 252 1 NET 2,222 1JOBS 1 0 ORG 1,718 1 PRO 62 1NAME 10 0 NET 2,320 1 COM 18,960 1MUSEUM 0 0 COM 22,934 1 COOP 0 0AERO 0 0 JOBS 0 0 JOBS 0 0
32