statistical analysis summary ash pond system … · the laboratory and field data were reviewed...
TRANSCRIPT

STATISTICAL ANALYSIS SUMMARY ASH POND SYSTEM
Conesville Plant Conesville, Ohio
Submitted to
1 Riverside Plaza Columbus, Ohio 43215-2372
Submitted by
941 Chatham Lane
Suite 103 Columbus, Ohio 43221
January 8, 2019
CHA8473

Statistical Analysis January 8, 2019
20190108 Conesville APS Assessment Report i
TABLE OF CONTENTS
SECTION 1 Executive Summary ..................................................................................... 1 SECTION 2 Ash Pond System Evaluation .................................................................... 2-1
2.1 Data Validation & QA/QC ....................................................................... 2-1
2.2 Statistical Analysis .................................................................................... 2-1
2.2.1 Establishment of GWPSs............................................................. 2-1
2.2.2 Evaluation of Potential Appendix IV SSLs ................................. 2-2
2.3 Conclusions ............................................................................................... 2-2
SECTION 3 References ................................................................................................. 3-1
LIST OF TABLES
Table 1 Groundwater Data Summary Table 2 Groundwater Protection Standards
LIST OF ATTACHMENTS
Attachment A Certification by Qualified Professional Engineer Attachment B Statistical Analysis Output

Statistical Analysis January 8, 2019
20190108 Conesville APS Assessment Report ii
LIST OF ACRONYMS AND ABBREVIATIONS
AEP American Electric Power
APS Ash Pond System
ASD Alternative Source Demonstration
CCR Coal Combustion Residuals
CCV Continuing Calibration Verification
CFR Code of Federal Regulations
GWPS Groundwater Protection Standard
LCL Lower Confidence Limit
LFB Laboratory Fortified Blanks
LRB Laboratory Reagent Blanks
MCL Maximum Contaminant Level
NELAP National Environmental Laboratory Accreditation Program
QA Quality Assurance
QC Quality Control
RSL Regional Screening Level
SSI Statistically Significant Increase
SSL Statistically Significant Level
TDS Total Dissolved Solids
UPL Upper Prediction Limit
USEPA United States Environmental Protection Agency
UTL Upper Tolerance Limit

Statistical Analysis January 8, 2019
CHA8473 20190108 Conesville APS Assessment Report ES-1
SECTION 1
EXECUTIVE SUMMARY
In accordance with the United States Environmental Protection Agency’s (USEPA’s) regulations regarding the disposal of coal combustion residuals (CCR) in landfills and surface impoundments (40 CFR 257.90-257.98, “CCR rule”), groundwater monitoring has been conducted at the Ash Pond System (APS), an existing CCR unit at the Conesville Power Plant located in Conesville, Ohio.
Based on detection monitoring conducted in 2017 and 2018, statistically significant increases (SSIs) over background were concluded for boron, chloride, fluoride, and pH at the APS. An alternate source was not identified at the time, so two assessment monitoring events were conducted at the APS in 2018, in accordance with 40 CFR 257.95.
Groundwater data underwent several validation tests, including those for completeness, sample tracking accuracy, transcription errors, and consistent use of measurement units. No data quality issues were identified which would impact the usability of the data.
The monitoring data were submitted to Groundwater Stats Consulting, LLC for statistical analysis. Groundwater protection standards (GWPSs) were established for the Appendix IV parameters. Confidence intervals were calculated for Appendix IV parameters at the compliance wells to assess whether Appendix IV parameters were present at a statistically significant level (SSL) above the GWPS. SSLs were identified for arsenic, lithium, and molybdenum. Thus, either the unit will move to an assessment of corrective measures or an alternative source demonstration (ASD) will be conducted to evaluate if the unit can remain in assessment monitoring. Certification of the selected statistical methods by a qualified professional engineer is documented in Attachment A.

Statistical Analysis January 8, 2019
CHA8473 20190108 Conesville APS Assessment Report 2-1
SECTION 2
ASH POND SYSTEM EVALUATION
2.1 Data Validation & QA/QC
During the assessment monitoring program, two sets of samples were collected for analysis from each upgradient and downgradient well to meet the requirements of 40 CFR 257.95(b) and 257.95(d)(1). Samples from both sampling events were analyzed for the Appendix III and Appendix IV parameters. A summary of data collected during assessment monitoring may be found in Table 1.
Chemical analysis was completed by an analytical laboratory certified by the National Environmental Laboratory Accreditation Program (NELAP). Quality assurance and quality control (QA/QC) samples completed by the analytical laboratory included the use of laboratory reagent blanks (LRBs), continuing calibration verification (CCV) samples, and laboratory fortified blanks (LFBs).
The analytical data were imported into a Microsoft Access database, where checks were completed to assess the accuracy of sample location identification and analyte identification. Where necessary, unit conversions were applied to standardize reported units across all sampling events. Exported data files were created for use with the Sanitas™ v.9.5 statistics software. The export file was checked against the analytical data for transcription errors and completeness. No QA/QC issues were noted which would impact data usability.
2.2 Statistical Analysis
Statistical analyses for the APS were conducted in accordance with the January 2017 Statistical Analysis Plan (AEP, 2017), except where noted below. Time series plots and results for all completed statistical tests are provided in Attachment B.
The data obtained to meet the requirements of 40 CFR 257.95(b) and 257.95(d)(1) were screened for potential outliers. Outliers identified from the background and detection monitoring events conducted through January 2018 were summarized in a previous report (Geosyntec, 2018). The reported chloride concentrations for the August 2017 event (267 mg/L) and the September 2017 event (237 mg/L) at background well MW-1506S were previously identified as outliers but were retained in the dataset during this analysis based on the inclusion of more recent data.
2.2.1 Establishment of GWPSs
A GWPS was established for each Appendix IV parameter in accordance with 40 CFR 257.95(h) and the Statistical Analysis Plan (AEP, 2017). The established GWPS was determined to be the greater value of the background concentration and the maximum contaminant level (MCL) or regional screening level (RSL) for each Appendix IV parameter. To determine background

Statistical Analysis January 8, 2019
CHA8473 20190108 Conesville APS Assessment Report 2-2
concentrations, an upper tolerance limit (UTL) was calculated using pooled data from the background wells collected during the background monitoring and assessment monitoring events. Tolerance limits were calculated parametrically with 95% coverage and 95% confidence for combined radium and molybdenum. Non-parametric tolerance limits were calculated for antimony, arsenic, barium, beryllium, chromium, cobalt, fluoride, lead, lithium, mercury, selenium, and thallium due to apparent non-normal distributions, and for cadmium due to both an apparent non-normal distribution and a high non-detect frequency. Tolerance limits and the final GWPSs are summarized in Table 2.
2.2.2 Evaluation of Potential Appendix IV SSLs
A confidence interval was constructed for each Appendix IV parameter at each compliance well. Confidence limits were generally calculated parametrically (α = 0.01); however, non-parametric confidence limits were calculated in some cases (e.g., when the data did not appear to be normally distributed or when the non-detect frequency was too high). An SSL was concluded if the lower confidence limit (LCL) exceeded the GWPS (i.e., if the entire confidence interval exceeded the GWPS). Calculated confidence limits are shown in Attachment B.
The following SSLs were identified at the Conesville APS:
LCLs for arsenic exceeded the GWPS of 0.016 mg/L at 1502-D (0.02596 mg/L), 1502-I (0.0576 mg/L), 1502-S (0.0581 mg/L), 1503-I (0.0773 mg/L), 1503-S (0.652 mg/L), 1504-D (0.0255 mg/L), 1504-I (0.0467 mg/L).
LCLs for lithium exceeded the GWPS of 0.08 mg/L at 1502-D (0.128 mg/L), 1502-I (0.118 mg/L), 1502-S (0.0958 mg/L), 1503-D (0.0882 mg/L), 1503-I (0.0960 mg/L), 1503-S (0.11 mg/L), 1504-D (0.108 mg/L), 1504-I (0.140 mg/L), 1505-D (0.099 mg/L), 1505-I (0.0976 mg/L), 1505-S (0.106 mg/L)
LCLs for molybdenum exceeded the GWPS of 0.1 mg/L at 1502-D (0.53 mg/L), 1502-I (0.520 mg/L), 1502-S (0.292 mg/L), 1503-D (0.161 mg/L), 1503-I (0.299 mg/L), 1503-S (0.249 mg/L), 1504-D (0.167 mg/L).
As a result, the Conesville APS will either move to an assessment of corrective measures or an alternative source demonstration will be conducted to evaluate if the unit can remain in assessment monitoring.
2.3 Conclusions
Two assessment monitoring events were conducted in 2018 in accordance with the CCR Rule. The laboratory and field data were reviewed prior to statistical analysis, with no QA/QC issues identified that impacted data usability. A review of outliers identified no potential outliers in the 2018 data. GWPSs were established for the Appendix IV parameters. A confidence interval was constructed at each compliance well for each Appendix IV parameter; SSLs were concluded if the

Statistical Analysis January 8, 2019
CHA8473 20190108 Conesville APS Assessment Report 2-3
entire confidence interval exceeded the GWPS. SSLs were identified for arsenic, lithium, and molybdenum.
Based on this evaluation, the Conesville APS CCR unit will either move to an assessment of corrective measures or an ASD will be conducted to evaluate if the unit can remain in assessment monitoring.

Statistical Analysis January 8, 2019
CHA8473 20190108 Conesville APS Assessment Report 3-1
SECTION 3
REFERENCES
American Electric Power (AEP). 2017. Statistical Analysis Plan – Conesville Plant. January 2017.
Geosyntec Consultants (Geosyntec). 2018. Statistical Analysis Summary – Ash Pond System, Conesville Plant, Conesville, Ohio. January 15, 2018.

TABLES

Table 1 – Groundwater Data Summary Conesville – Ash Pond System
Geosyntec Consultants, Inc.
6/13/2018 8/21/2018 6/13/2018 8/21/2018 6/13/2018 8/21/2018 6/13/2018 8/21/2018 6/13/2018 8/21/2018 6/13/2018 8/21/2018 5/31/2018 8/21/2018Antimony µg/L 0.0300 J 0.0200 J 0.0300 J 0.0200 J 0.0300 J 0.0200 J 0.0800 0.100 0.0500 J 0.0200 J 0.0600 0.130 0.05 U 0.05 UArsenic µg/L 39.0 26.3 181 74.1 64.3 62.7 4.52 7.10 53.0 160 138 191 29.1 32.1Barium µg/L 33.8 29.5 31.1 28.8 37.7 26.7 47.7 72.4 41.6 56.2 33.1 50.0 37.9 43.5
Beryllium µg/L 0.0100 J 0.00500 J 0.0100 J 0.00900 J 0.0100 J 0.0100 J 0.0630 0.173 0.0100 J 0.00800 J 0.0240 0.144 0.02 U 0.02 UBoron mg/L 7.56 6.44 7.25 8.09 6.45 6.67 7.20 6.84 3.42 7.24 13.3 13.6 2.98 2.73
Cadmium µg/L 0.02 U 0.02 U 0.02 U 0.02 U 0.02 U 0.02 U 0.0600 0.180 0.02 U 0.02 U 0.02 U 0.0100 J 0.02 U 0.02 UCalcium mg/L 109 117 151 174 138 127 123 122 93.4 171 241 252 95.6 103Chloride mg/L 103 107 110 110 124 86.5 107 109 111 139 186 197 119 97.3
Chromium µg/L 0.192 0.05 U 0.138 0.129 0.177 0.05 U 4.50 7.56 0.294 0.00900 J 0.382 2.36 0.110 0.05 UCobalt µg/L 0.365 0.271 0.373 0.415 0.147 0.119 2.45 7.22 0.275 0.0650 0.166 0.842 0.0410 0.0410
Combined Radium pCi/L 1.99 0.598 1.22 0.793 0.720 0.121 1.67 0.761 1.21 0.864 1.29 1.18 1.35 0.991Fluoride mg/L 0.840 0.840 1.00 0.960 1.45 1.41 0.280 0.230 1.13 1.22 1.39 1.40 0.720 0.650
Lead µg/L 0.247 0.0320 0.204 0.471 0.137 0.102 2.15 5.57 1.59 0.231 0.257 1.67 0.0220 0.00900 JLithium mg/L 0.127 0.132 0.135 0.139 0.113 0.112 0.0930 0.0770 0.0870 0.104 0.115 0.110 0.109 0.103Mercury µg/L 0.005 U 0.005 U 0.00200 J 0.005 U 0.005 U 0.005 U 0.00400 J 0.00500 0.005 U 0.005 U 0.00500 0.0100 0.005 U 0.005 U
Molybdenum µg/L 548 517 669 650 290 280 345 290 332 295 348 381 179 156Selenium µg/L 0.200 0.100 0.300 0.200 0.300 0.200 0.500 1.00 0.0800 J 0.200 0.300 0.500 0.0800 J 0.0600 J
Total Dissolved Solids mg/L 745 746 1020 1050 954 760 776 864 648 1040 1470 1600 648 726Sulfate mg/L 317 311 534 568 464 388 353 369 255 418 737 858 286 337
Thallium µg/L 0.0400 J 0.0300 J 0.440 0.413 0.196 0.189 0.231 0.351 0.0300 J 0.0200 J 0.118 0.462 0.05 U 0.0100 JpH SU 7.47 7.50 7.13 7.28 7.38 7.55 7.29 7.31 7.47 7.25 7.48 7.46 7.33 7.43
Notes:µg/L: micrograms per litermg/L: milligrams per literpCi/L: picocuries per literSU: standard unitU: Parameter was not present in concentrations above the method detection limit and is reported as the reporting limitJ: Estimated value. Parameter was detected in concentrations below the reporting limit
1503-I 1503-S 1504-DParameter Unit
1502-D 1502-I 1502-S 1503-D

Table 1 – Groundwater Data Summary Conesville – Ash Pond System
Geosyntec Consultants, Inc.
Antimony µg/LArsenic µg/LBarium µg/L
Beryllium µg/LBoron mg/L
Cadmium µg/LCalcium mg/LChloride mg/L
Chromium µg/LCobalt µg/L
Combined Radium pCi/LFluoride mg/L
Lead µg/LLithium mg/LMercury µg/L
Molybdenum µg/LSelenium µg/L
Total Dissolved Solids mg/LSulfate mg/L
Thallium µg/LpH SU
Parameter Unit5/31/2018 8/21/2018 6/13/2018 8/27/2018 6/13/2018 8/27/2018 6/13/2018 8/27/2018 5/29/2018 8/27/2018 5/29/2018 8/27/2018 5/29/2018 8/24/2018
0.05 U 0.0200 J 0.130 0.100 0.0600 0.0200 J 0.0200 J 0.0600 0.05 U 0.05 U 0.0900 0.0400 J 0.05 U 0.05 U54.8 61.1 24.2 11.7 18.5 16.5 112 39.8 7.86 6.69 2.67 0.400 0.260 0.17024.6 30.9 50.0 47.9 46.2 50.9 12.9 29.5 27.9 29.2 37.8 22.1 243 260
0.02 U 0.02 U 0.0730 0.0790 0.0330 0.0290 33.6 6.17 0.0710 0.0910 0.131 0.0250 0.0250 0.0100 J2.72 3.19 8.77 2.71 2.89 0.689 3.41 2.90 0.104 0.0870 0.680 0.893 0.127 0.0740
0.02 U 0.02 U 0.0400 0.0400 0.0300 0.00600 J 0.270 0.390 0.02 U 0.02 U 0.160 0.170 0.00500 J 0.0200 J170 159 381 90.3 96.6 103 90.0 106 100 104 268 201 36.6 35.588.3 71.0 90.7 101 125 196 150 121 15.5 17.0 319 231 5.49 5.04
0.0690 0.05 U 1.73 1.78 0.898 0.737 1.64 0.845 0.189 0.115 3.10 0.698 0.122 0.07300.0100 J 0.0210 1.57 1.62 0.421 0.382 10.9 4.15 3.31 3.88 2.19 0.238 0.0200 J 0.0100 J
2.03 0.360 1.52 2.05 1.13 2.78 2.14 2.01 2.62 0.899 0.928 1.06 2.02 1.760.320 0.340 1.25 1.27 0.850 0.790 0.700 0.890 0.100 0.110 0.2 U 0.0600 J 0.210 0.200
0.0200 J 0.0380 4.24 4.20 1.92 1.71 3.24 3.03 0.0310 0.0200 J 2.77 0.270 0.0380 0.03000.158 0.145 0.345 0.0990 0.124 0.0560 0.103 0.0850 0.00900 0.0100 0.00600 0.00500 0.00900 0.00900
0.005 U 0.005 U 0.005 U 0.005 U 0.005 U 0.005 U 0.00200 J 0.00200 J 0.005 U 0.005 U 0.00800 0.00200 J 0.005 U 0.005 U26.2 26.3 107 99.2 74.8 58.0 71.2 93.2 0.880 0.740 0.650 0.630 0.930 0.420
0.0700 J 0.0900 J 0.500 0.500 0.200 0.100 64.8 25.2 1.00 0.800 2.00 0.800 0.0500 J 0.1 U1030 1050 648 628 755 858 915 748 645 668 1440 1120 200 214568 595 272 250 296 305 451 342 378 391 614 568 21.5 15.4
0.05 U 0.0100 J 0.0700 0.0690 0.0530 0.0500 J 0.251 0.125 0.05 U 0.0300 J 0.0580 0.0700 0.05 U 0.05 U7.99 8.01 7.46 7.49 7.53 7.40 6.59 7.20 6.39 6.32 6.16 6.07 7.41 7.37
Notes:µg/L: micrograms per litermg/L: milligrams per literpCi/L: picocuries per literSU: standard unitU: Parameter was not present in concentrations above the method detection limit and is reported as the reporting limitJ: Estimated value. Parameter was detected in concentrations below the reporting limit
1505-S 1506-C 1506-S 1507-C1504-I 1505-D 1505-I

Table 1 – Groundwater Data Summary Conesville – Ash Pond System
Geosyntec Consultants, Inc.
Antimony µg/LArsenic µg/LBarium µg/L
Beryllium µg/LBoron mg/L
Cadmium µg/LCalcium mg/LChloride mg/L
Chromium µg/LCobalt µg/L
Combined Radium pCi/LFluoride mg/L
Lead µg/LLithium mg/LMercury µg/L
Molybdenum µg/LSelenium µg/L
Total Dissolved Solids mg/LSulfate mg/L
Thallium µg/LpH SU
Parameter Unit5/29/2018 8/24/2018 5/30/2018 8/27/2018 5/29/2018 8/23/2018 5/29/2018 8/23/2018 5/30/2018 8/24/20180.0200 J 0.0300 J 0.05 U 0.0100 J 0.0200 J 0.0300 J 0.0800 0.0300 J 0.0600 0.120
2.49 2.20 0.200 0.280 0.510 0.740 2.20 0.600 0.400 0.76013.7 14.2 13.0 14.8 69.2 77.3 59.8 47.3 51.6 87.5
0.608 0.542 0.02 U 0.00500 J 0.00900 J 0.0100 J 0.0350 0.0200 J 0.0100 J 0.04000.101 0.0640 0.0990 0.109 0.128 0.149 0.100 0.154 0.181 0.1950.02 U 0.02 U 0.0900 0.410 0.0100 J 0.0200 J 0.0200 0.0200 J 0.140 0.490
301 296 155 165 123 127 110 84.4 180 15324.4 23.3 33.0 35.8 31.2 37.1 15.6 8.25 193 88.8
0.619 0.178 0.0520 0.140 0.317 0.535 1.94 0.834 0.926 4.7861.4 72.8 0.181 0.224 0.172 0.461 0.888 0.549 0.545 1.06
0.977 2.03 0.835 1.42 0.897 1.05 0.717 1.54 1.01 1.460.480 0.620 0.0800 0.0900 0.120 0.120 0.100 0.100 0.100 0.100 J
0.0630 0.0430 0.0460 0.105 0.238 0.647 1.86 1.16 1.47 0.05600.0770 0.0660 0.00100 0.00300 0.00300 0.00400 0.00100 0.00300 0.001 U 0.002000.005 U 0.005 U 0.005 U 0.005 U 0.005 U 0.00200 J 0.00200 J 0.00300 J 0.005 U 0.00300 J0.360 0.180 0.920 1.37 0.240 0.120 1.47 0.0500 J 0.400 0.0600 J
0.0800 J 0.1 U 0.0600 J 0.0600 J 0.100 0.0700 J 0.400 0.200 0.300 0.6001670 1640 886 906 599 664 452 383 1010 8921090 993 549 567 241 262 154 115 424 365
0.0200 J 0.0200 J 0.0200 J 0.0200 J 0.0200 J 0.0200 J 0.0300 J 0.0300 J 0.0100 J 0.0200 J6.44 6.23 6.39 6.29 7.20 7.18 7.28 7.28 6.29 6.35
Notes:µg/L: micrograms per litermg/L: milligrams per literpCi/L: picocuries per literSU: standard unitU: Parameter was not present in concentrations above the method detection limit and is reported as the reporting limitJ: Estimated value. Parameter was detected in concentrations below the reporting limit
1510-I 1510-S BAP-09011508-C 1509-S

Table 2: Groundwater Protection Standards Conesville Plant - Ash Pond System
Geosyntec Consultants, Inc.
Constituent Name MCL RSL Background LimitAntimony, Total (mg/L) 0.006 0.00063Arsenic, Total (mg/L) 0.01 0.016Barium, Total (mg/L) 2 0.26
Beryllium, Total (mg/L) 0.004 0.00061Cadmium, Total (mg/L) 0.005 0.00043Chromium, Total (mg/L) 0.1 0.0048
Cobalt, Total (mg/L) n/a 0.006 0.073Combined Radium, Total (pCi/L) 5 3.7
Fluoride, Total (mg/L) 4 0.62Lead, Total (mg/L) n/a 0.015 0.012
Lithium, Total (mg/L) n/a 0.04 0.08Mercury, Total (mg/L) 0.002 0.000025
Molybdenum, Total (mg/L) n/a 0.1 0.0032Selenium, Total (mg/L) 0.05 0.002Thallium, Total (mg/L) 0.002 0.00012
Notes:Grey cell indicates calculated UTL is higher than MCL.MCL = Maximum Contaminant LevelRSL = Regional Screening LevelCalculated UTL (Upper Tolerance Limit) represents site-specific background values.The higher of the calculated UTL or MCL/RSL is used as the GWPS.

ATTACHMENT A
Certification by Qualified Professional Engineer


ATTACHMENT B Statistical Analysis Output

Groundwater Stats Consulting ● www.groundwaterstats.com ● 913.829.1470 1
November 17, 2018
Geosyntec Consultants Attn: Ms. Allison Kreinberg 150 E. Wilson Bridge Rd., #232 Worthington, OH 43085
Dear Ms. Kreinberg,
Groundwater Stats Consulting, formerly the statistical consulting division of Sanitas Technologies, is pleased to provide the statistical analysis of the August 2018 data for American Electric Power Company’s Conesville BAP. The analysis complies with the federal rule for the Disposal of Coal Combustion Residuals from Electric Utilities (CCR Rule, 2015) as well as with the USEPA Unified Guidance (2009).
Sampling began at the Conesville BAP for the CCR program in 2016 at each of the groundwater monitoring wells. The monitoring well network, as provided by Geosyntec Consultants, consists of the following: upgradient wells 1506-C, 1506-S, 1507-C, 1508-C, 1509-S, 1510-I, 1510-S; and downgradient wells 1502-D, 1502-I, 1502-S, 1503-D, 1503-I, 1503-S, 1504-D, 1504-I, 1505-D, 1505-I, 1505-S,and BAP-0901.
Data were sent electronically, and the statistical analysis was conducted according to the Statistical Analysis Plan and screening evaluation prepared by GSC and approved by Dr. Kirk Cameron, PhD Statistician with MacStat Consulting, primary author of the USEPA Unified Guidance, and Senior Advisor to GSC.
The CCR program consists of the following constituents:
o Appendix III (Detection Monitoring) - boron, calcium, chloride, fluoride,pH, sulfate, and TDS; and
GROUNDWATER STATS CONSULTING

Groundwater Stats Consulting ● www.groundwaterstats.com ● 913.829.1470
2
o Appendix IV (Assessment Monitoring) – antimony, arsenic, barium, beryllium, cadmium, chromium, cobalt, combined radium 226 + 228, fluoride, lead, lithium, mercury, molybdenum, selenium, and thallium.
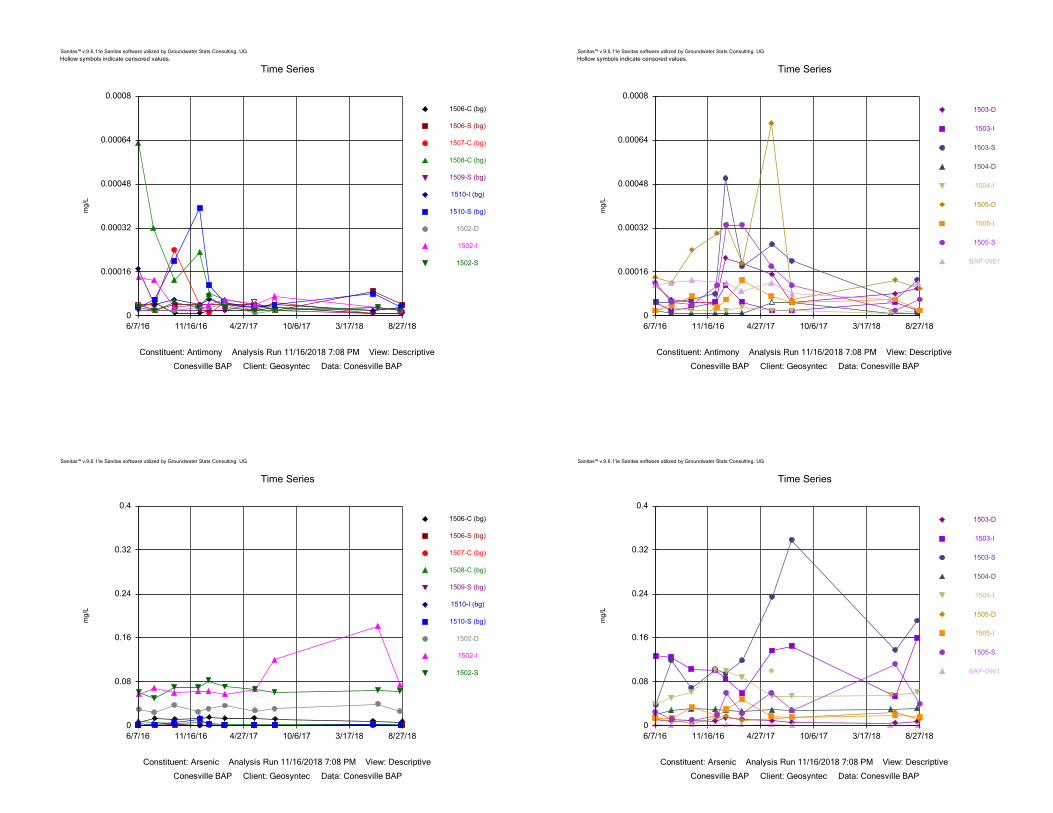
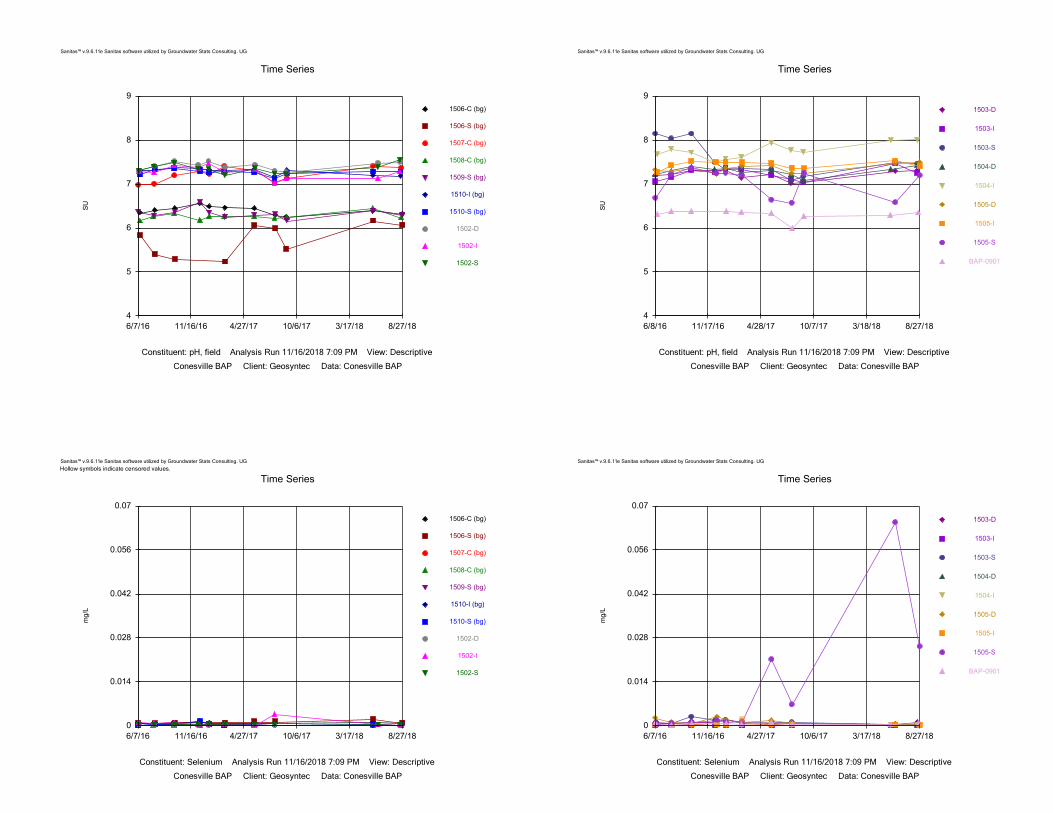
Time series plots for Appendix III and IV parameters are provided for all wells and constituents; and are used to evaluate concentrations over the entire record. Values in background which have previously been flagged as outliers may be seen in a lighter font and disconnected symbol on the graphs. Additionally, a summary of flagged values follows this letter. Note that during the background screening, two high values were flagged as outliers for chloride in upgradient well 1506-S. The two samples collected during 2018, however, are similar in concentration to the flagged values. Therefore, the values originally identified as outliers for chloride in this upgradient well are no longer flagged and deselected in the database; and the interwell prediction limits are constructed utilizing all data from upgradient wells. The current assumption is that the change in concentrations are reflective of natural variation upgradient of the facility; however, a separate study and hydrogeological investigation would be required to fully understand the geochemical conditions and expected groundwater quality for the region. That study and assessment is beyond the scope of services provided by Groundwater Stats Consulting. Evaluation of Appendix III Parameters Interwell prediction limits combined with a 1-of-2 resample plan were constructed for boron, chloride, fluoride and pH; and intrawell prediction limits combined with a 1-of-3 resample plan were constructed for calcium, sulfate and TDS. The statistical method selected for each parameter was determined based on the results of the screening analysis performed in January 2018. In the event of an initial exceedance of compliance well data, the 1-of-2 resample plan allows for collection of one additional sample, while the 1-of-3 resample plan allows up to two resamples, to determine whether the initial exceedance is confirmed. When the resamples confirm the initial exceedance, a statistically significant increase (SSI) is identified and further research would be required to identify the cause of the exceedance (i.e. impact from the site, natural variation, or an off-site source). If any of the resamples fall within the statistical limit, the initial exceedance is considered a false positive result and, therefore, no further action is necessary. SSIs were noted for several of the Appendix III parameters and the results of those findings may be found in the Prediction Limit Summary tables following this letter.

Groundwater Stats Consulting ● www.groundwaterstats.com ● 913.829.1470
3
When a statistically significant increase is identified, the data are further evaluated using the Sen’s Slope/Mann Kendall trend test to determine whether data are statistically increasing, decreasing or stable. A handful of statistically significant decreasing trends were noted for both upgradient and downgradient wells. Two statistically significant increasing trends were noted for calcium and sulfate in upgradient wells, which is an indication that groundwater is changing naturally unrelated to the site. One statistically significant increasing trend was noted in downgradient well 1505-D for fluoride. The Trend Test Summary Table follows this letter. Evaluation of Appendix IV Parameters Parametric tolerance limits were used to calculate background limits from pooled upgradient well data for Appendix IV parameters with a target of 95% confidence and 95% coverage to determine the Alternate Contaminant Level (ACL). The confidence and coverage levels for nonparametric tolerance limits are dependent upon the number of background samples. These limits were compared to the Maximum Contaminant Levels (MCLs) and Regional Screening Levels (RSLs) in the Groundwater Protection Standards (GWPS) table following this letter to determine the highest limit for use as the GWPS in the Confidence Interval comparisons. Confidence intervals were then constructed on downgradient wells for each of the Appendix IV parameters using the highest limit of either the MCL, RSL, or ACL as discussed above. Only when the entire confidence interval is above a GWPS is the well/constituent pair considered to exceed its respective standard. Confidence interval exceedances were noted for arsenic, cobalt, lithium and molybdenum. A summary of the confidence interval results follows this letter.
Thank you for the opportunity to assist you in the statistical analysis of groundwater quality for the Conesville BAP. If you have any questions or comments, please feel free to contact me. For Groundwater Stats Consulting,
Kristina L. Rayner Groundwater Statistician
0
0.00016
0.00032
0.00048
0.00064
0.0008
6/7/16 11/16/16 4/27/17 10/6/17 3/17/18 8/27/18
1506-C (bg)
1506-S (bg)
1507-C (bg)
1508-C (bg)
1509-S (bg)
1510-I (bg)
1510-S (bg)
1502-D
1502-I
1502-S
Time Series
Constituent: Antimony Analysis Run 11/16/2018 7:08 PM View: Descriptive
Conesville BAP Client: Geosyntec Data: Conesville BAP
Sanitas™ v.9.6.11e Sanitas software utilized by Groundwater Stats Consulting. UG
mg
/L
Hollow symbols indicate censored values.
0
0.00016
0.00032
0.00048
0.00064
0.0008
6/7/16 11/16/16 4/27/17 10/6/17 3/17/18 8/27/18
1503-D
1503-I
1503-S
1504-D
1504-I
1505-D
1505-I
1505-S
BAP-0901
Time Series
Constituent: Antimony Analysis Run 11/16/2018 7:08 PM View: Descriptive
Conesville BAP Client: Geosyntec Data: Conesville BAP
Sanitas™ v.9.6.11e Sanitas software utilized by Groundwater Stats Consulting. UG
mg
/L
Hollow symbols indicate censored values.
0
0.08
0.16
0.24
0.32
0.4
6/7/16 11/16/16 4/27/17 10/6/17 3/17/18 8/27/18
1506-C (bg)
1506-S (bg)
1507-C (bg)
1508-C (bg)
1509-S (bg)
1510-I (bg)
1510-S (bg)
1502-D
1502-I
1502-S
Time Series
Constituent: Arsenic Analysis Run 11/16/2018 7:08 PM View: Descriptive
Conesville BAP Client: Geosyntec Data: Conesville BAP
Sanitas™ v.9.6.11e Sanitas software utilized by Groundwater Stats Consulting. UG
mg
/L
0
0.08
0.16
0.24
0.32
0.4
6/7/16 11/16/16 4/27/17 10/6/17 3/17/18 8/27/18
1503-D
1503-I
1503-S
1504-D
1504-I
1505-D
1505-I
1505-S
BAP-0901
Time Series
Constituent: Arsenic Analysis Run 11/16/2018 7:08 PM View: Descriptive
Conesville BAP Client: Geosyntec Data: Conesville BAP
Sanitas™ v.9.6.11e Sanitas software utilized by Groundwater Stats Consulting. UG
mg
/L

0
0.06
0.12
0.18
0.24
0.3
6/7/16 11/16/16 4/27/17 10/6/17 3/17/18 8/27/18
1506-C (bg)
1506-S (bg)
1507-C (bg)
1508-C (bg)
1509-S (bg)
1510-I (bg)
1510-S (bg)
1502-D
1502-I
1502-S
Time Series
Constituent: Barium Analysis Run 11/16/2018 7:08 PM View: Descriptive
Conesville BAP Client: Geosyntec Data: Conesville BAP
Sanitas™ v.9.6.11e Sanitas software utilized by Groundwater Stats Consulting. UG
mg
/L
0
0.06
0.12
0.18
0.24
0.3
6/7/16 11/16/16 4/27/17 10/6/17 3/17/18 8/27/18
1503-D
1503-I
1503-S
1504-D
1504-I
1505-D
1505-I
1505-S
BAP-0901
Time Series
Constituent: Barium Analysis Run 11/16/2018 7:08 PM View: Descriptive
Conesville BAP Client: Geosyntec Data: Conesville BAP
Sanitas™ v.9.6.11e Sanitas software utilized by Groundwater Stats Consulting. UG
mg
/L
0
0.008
0.016
0.024
0.032
0.04
6/7/16 11/16/16 4/27/17 10/6/17 3/17/18 8/27/18
1506-C (bg)
1506-S (bg)
1507-C (bg)
1508-C (bg)
1509-S (bg)
1510-I (bg)
1510-S (bg)
1502-D
1502-I
1502-S
Time Series
Constituent: Beryllium Analysis Run 11/16/2018 7:08 PM View: Descriptive
Conesville BAP Client: Geosyntec Data: Conesville BAP
Sanitas™ v.9.6.11e Sanitas software utilized by Groundwater Stats Consulting. UG
mg
/L
Hollow symbols indicate censored values.
0
0.008
0.016
0.024
0.032
0.04
6/7/16 11/16/16 4/27/17 10/6/17 3/17/18 8/27/18
1503-D
1503-I
1503-S
1504-D
1504-I
1505-D
1505-I
1505-S
BAP-0901
Time Series
Constituent: Beryllium Analysis Run 11/16/2018 7:08 PM View: Descriptive
Conesville BAP Client: Geosyntec Data: Conesville BAP
Sanitas™ v.9.6.11e Sanitas software utilized by Groundwater Stats Consulting. UG
mg
/L
Hollow symbols indicate censored values.

0
4
8
12
16
20
6/7/16 11/16/16 4/27/17 10/6/17 3/17/18 8/27/18
1506-C (bg)
1506-S (bg)
1507-C (bg)
1508-C (bg)
1509-S (bg)
1510-I (bg)
1510-S (bg)
1502-D
1502-I
1502-S
Time Series
Constituent: Boron Analysis Run 11/16/2018 7:08 PM View: Descriptive
Conesville BAP Client: Geosyntec Data: Conesville BAP
Sanitas™ v.9.6.11e Sanitas software utilized by Groundwater Stats Consulting. UG
mg
/L
0
4
8
12
16
20
6/7/16 11/16/16 4/27/17 10/6/17 3/17/18 8/27/18
1503-D
1503-I
1503-S
1504-D
1504-I
1505-D
1505-I
1505-S
BAP-0901
Time Series
Constituent: Boron Analysis Run 11/16/2018 7:08 PM View: Descriptive
Conesville BAP Client: Geosyntec Data: Conesville BAP
Sanitas™ v.9.6.11e Sanitas software utilized by Groundwater Stats Consulting. UG
mg
/L
0
0.0002
0.0004
0.0006
0.0008
0.001
6/7/16 11/16/16 4/27/17 10/6/17 3/17/18 8/27/18
1506-C (bg)
1506-S (bg)
1507-C (bg)
1508-C (bg)
1509-S (bg)
1510-I (bg)
1510-S (bg)
1502-D
1502-I
1502-S
Time Series
Constituent: Cadmium Analysis Run 11/16/2018 7:08 PM View: Descriptive
Conesville BAP Client: Geosyntec Data: Conesville BAP
Sanitas™ v.9.6.11e Sanitas software utilized by Groundwater Stats Consulting. UG
mg
/L
Hollow symbols indicate censored values.
0
0.0002
0.0004
0.0006
0.0008
0.001
6/7/16 11/16/16 4/27/17 10/6/17 3/17/18 8/27/18
1503-D
1503-I
1503-S
1504-D
1504-I
1505-D
1505-I
1505-S
BAP-0901
Time Series
Constituent: Cadmium Analysis Run 11/16/2018 7:08 PM View: Descriptive
Conesville BAP Client: Geosyntec Data: Conesville BAP
Sanitas™ v.9.6.11e Sanitas software utilized by Groundwater Stats Consulting. UG
mg
/L
Hollow symbols indicate censored values.

0
120
240
360
480
600
6/7/16 11/16/16 4/27/17 10/6/17 3/17/18 8/27/18
1506-C (bg)
1506-S (bg)
1507-C (bg)
1508-C (bg)
1509-S (bg)
1510-I (bg)
1510-S (bg)
1502-D
1502-I
1502-S
Time Series
Constituent: Calcium Analysis Run 11/16/2018 7:08 PM View: Descriptive
Conesville BAP Client: Geosyntec Data: Conesville BAP
Sanitas™ v.9.6.11e Sanitas software utilized by Groundwater Stats Consulting. UG
mg
/L
0
120
240
360
480
600
6/7/16 11/16/16 4/27/17 10/6/17 3/17/18 8/27/18
1503-D
1503-I
1503-S
1504-D
1504-I
1505-D
1505-I
1505-S
BAP-0901
Time Series
Constituent: Calcium Analysis Run 11/16/2018 7:08 PM View: Descriptive
Conesville BAP Client: Geosyntec Data: Conesville BAP
Sanitas™ v.9.6.11e Sanitas software utilized by Groundwater Stats Consulting. UG
mg
/L
0
80
160
240
320
400
6/7/16 11/16/16 4/27/17 10/6/17 3/17/18 8/27/18
1506-C (bg)
1506-S (bg)
1507-C (bg)
1508-C (bg)
1509-S (bg)
1510-I (bg)
1510-S (bg)
1502-D
1502-I
1502-S
Time Series
Constituent: Chloride Analysis Run 11/16/2018 7:08 PM View: Descriptive
Conesville BAP Client: Geosyntec Data: Conesville BAP
Sanitas™ v.9.6.11e Sanitas software utilized by Groundwater Stats Consulting. UG
mg
/L
0
80
160
240
320
400
6/7/16 11/16/16 4/27/17 10/6/17 3/17/18 8/27/18
1503-D
1503-I
1503-S
1504-D
1504-I
1505-D
1505-I
1505-S
BAP-0901
Time Series
Constituent: Chloride Analysis Run 11/16/2018 7:08 PM View: Descriptive
Conesville BAP Client: Geosyntec Data: Conesville BAP
Sanitas™ v.9.6.11e Sanitas software utilized by Groundwater Stats Consulting. UG
mg
/L

0
0.006
0.012
0.018
0.024
0.03
6/7/16 11/16/16 4/27/17 10/6/17 3/17/18 8/27/18
1506-C (bg)
1506-S (bg)
1507-C (bg)
1508-C (bg)
1509-S (bg)
1510-I (bg)
1510-S (bg)
1502-D
1502-I
1502-S
Time Series
Constituent: Chromium Analysis Run 11/16/2018 7:08 PM View: Descriptive
Conesville BAP Client: Geosyntec Data: Conesville BAP
Sanitas™ v.9.6.11e Sanitas software utilized by Groundwater Stats Consulting. UG
mg
/L
0
0.006
0.012
0.018
0.024
0.03
6/7/16 11/16/16 4/27/17 10/6/17 3/17/18 8/27/18
1503-D
1503-I
1503-S
1504-D
1504-I
1505-D
1505-I
1505-S
BAP-0901
Time Series
Constituent: Chromium Analysis Run 11/16/2018 7:08 PM View: Descriptive
Conesville BAP Client: Geosyntec Data: Conesville BAP
Sanitas™ v.9.6.11e Sanitas software utilized by Groundwater Stats Consulting. UG
mg
/L
0
0.016
0.032
0.048
0.064
0.08
6/7/16 11/16/16 4/27/17 10/6/17 3/17/18 8/27/18
1506-C (bg)
1506-S (bg)
1507-C (bg)
1508-C (bg)
1509-S (bg)
1510-I (bg)
1510-S (bg)
1502-D
1502-I
1502-S
Time Series
Constituent: Cobalt Analysis Run 11/16/2018 7:08 PM View: Descriptive
Conesville BAP Client: Geosyntec Data: Conesville BAP
Sanitas™ v.9.6.11e Sanitas software utilized by Groundwater Stats Consulting. UG
mg
/L
0
0.016
0.032
0.048
0.064
0.08
6/7/16 11/16/16 4/27/17 10/6/17 3/17/18 8/27/18
1503-D
1503-I
1503-S
1504-D
1504-I
1505-D
1505-I
1505-S
BAP-0901
Time Series
Constituent: Cobalt Analysis Run 11/16/2018 7:09 PM View: Descriptive
Conesville BAP Client: Geosyntec Data: Conesville BAP
Sanitas™ v.9.6.11e Sanitas software utilized by Groundwater Stats Consulting. UG
mg
/L

0
1.6
3.2
4.8
6.4
8
6/7/16 11/16/16 4/27/17 10/6/17 3/17/18 8/27/18
1506-C (bg)
1506-S (bg)
1507-C (bg)
1508-C (bg)
1509-S (bg)
1510-I (bg)
1510-S (bg)
1502-D
1502-I
1502-S
Time Series
Constituent: Combined radium 226 + 228 Analysis Run 11/16/2018 7:09 PM View: Descriptive
Conesville BAP Client: Geosyntec Data: Conesville BAP
Sanitas™ v.9.6.11e Sanitas software utilized by Groundwater Stats Consulting. UG
pC
i/L
0
1.6
3.2
4.8
6.4
8
6/7/16 11/16/16 4/27/17 10/6/17 3/17/18 8/27/18
1503-D
1503-I
1503-S
1504-D
1504-I
1505-D
1505-I
1505-S
BAP-0901
Time Series
Constituent: Combined radium 226 + 228 Analysis Run 11/16/2018 7:09 PM View: Descriptive
Conesville BAP Client: Geosyntec Data: Conesville BAP
Sanitas™ v.9.6.11e Sanitas software utilized by Groundwater Stats Consulting. UG
pC
i/L
0
0.4
0.8
1.2
1.6
2
6/7/16 11/16/16 4/27/17 10/6/17 3/17/18 8/27/18
1506-C (bg)
1506-S (bg)
1507-C (bg)
1508-C (bg)
1509-S (bg)
1510-I (bg)
1510-S (bg)
1502-D
1502-I
1502-S
Time Series
Constituent: Fluoride Analysis Run 11/16/2018 7:09 PM View: Descriptive
Conesville BAP Client: Geosyntec Data: Conesville BAP
Sanitas™ v.9.6.11e Sanitas software utilized by Groundwater Stats Consulting. UG
mg
/L
0
0.4
0.8
1.2
1.6
2
6/7/16 11/16/16 4/27/17 10/6/17 3/17/18 8/27/18
1503-D
1503-I
1503-S
1504-D
1504-I
1505-D
1505-I
1505-S
BAP-0901
Time Series
Constituent: Fluoride Analysis Run 11/16/2018 7:09 PM View: Descriptive
Conesville BAP Client: Geosyntec Data: Conesville BAP
Sanitas™ v.9.6.11e Sanitas software utilized by Groundwater Stats Consulting. UG
mg
/L

0
0.014
0.028
0.042
0.056
0.07
6/7/16 11/16/16 4/27/17 10/6/17 3/17/18 8/27/18
1506-C (bg)
1506-S (bg)
1507-C (bg)
1508-C (bg)
1509-S (bg)
1510-I (bg)
1510-S (bg)
1502-D
1502-I
1502-S
Time Series
Constituent: Lead Analysis Run 11/16/2018 7:09 PM View: Descriptive
Conesville BAP Client: Geosyntec Data: Conesville BAP
Sanitas™ v.9.6.11e Sanitas software utilized by Groundwater Stats Consulting. UG
mg
/L
0
0.014
0.028
0.042
0.056
0.07
6/7/16 11/16/16 4/27/17 10/6/17 3/17/18 8/27/18
1503-D
1503-I
1503-S
1504-D
1504-I
1505-D
1505-I
1505-S
BAP-0901
Time Series
Constituent: Lead Analysis Run 11/16/2018 7:09 PM View: Descriptive
Conesville BAP Client: Geosyntec Data: Conesville BAP
Sanitas™ v.9.6.11e Sanitas software utilized by Groundwater Stats Consulting. UG
mg
/L
Hollow symbols indicate censored values.
0
0.08
0.16
0.24
0.32
0.4
6/7/16 11/16/16 4/27/17 10/6/17 3/17/18 8/27/18
1506-C (bg)
1506-S (bg)
1507-C (bg)
1508-C (bg)
1509-S (bg)
1510-I (bg)
1510-S (bg)
1502-D
1502-I
1502-S
Time Series
Constituent: Lithium Analysis Run 11/16/2018 7:09 PM View: Descriptive
Conesville BAP Client: Geosyntec Data: Conesville BAP
Sanitas™ v.9.6.11e Sanitas software utilized by Groundwater Stats Consulting. UG
mg
/L
Hollow symbols indicate censored values.
0
0.08
0.16
0.24
0.32
0.4
6/7/16 11/16/16 4/27/17 10/6/17 3/17/18 8/27/18
1503-D
1503-I
1503-S
1504-D
1504-I
1505-D
1505-I
1505-S
BAP-0901
Time Series
Constituent: Lithium Analysis Run 11/16/2018 7:09 PM View: Descriptive
Conesville BAP Client: Geosyntec Data: Conesville BAP
Sanitas™ v.9.6.11e Sanitas software utilized by Groundwater Stats Consulting. UG
mg
/L

0
0.00006
0.00012
0.00018
0.00024
0.0003
6/7/16 11/16/16 4/27/17 10/6/17 3/17/18 8/27/18
1506-C (bg)
1506-S (bg)
1507-C (bg)
1508-C (bg)
1509-S (bg)
1510-I (bg)
1510-S (bg)
1502-D
1502-I
1502-S
Time Series
Constituent: Mercury Analysis Run 11/16/2018 7:09 PM View: Descriptive
Conesville BAP Client: Geosyntec Data: Conesville BAP
Sanitas™ v.9.6.11e Sanitas software utilized by Groundwater Stats Consulting. UG
mg
/L
Hollow symbols indicate censored values.
0
0.00006
0.00012
0.00018
0.00024
0.0003
6/7/16 11/16/16 4/27/17 10/6/17 3/17/18 8/27/18
1503-D
1503-I
1503-S
1504-D
1504-I
1505-D
1505-I
1505-S
BAP-0901
Time Series
Constituent: Mercury Analysis Run 11/16/2018 7:09 PM View: Descriptive
Conesville BAP Client: Geosyntec Data: Conesville BAP
Sanitas™ v.9.6.11e Sanitas software utilized by Groundwater Stats Consulting. UG
mg
/L
Hollow symbols indicate censored values.
0
0.14
0.28
0.42
0.56
0.7
6/7/16 11/16/16 4/27/17 10/6/17 3/17/18 8/27/18
1506-C (bg)
1506-S (bg)
1507-C (bg)
1508-C (bg)
1509-S (bg)
1510-I (bg)
1510-S (bg)
1502-D
1502-I
1502-S
Time Series
Constituent: Molybdenum Analysis Run 11/16/2018 7:09 PM View: Descriptive
Conesville BAP Client: Geosyntec Data: Conesville BAP
Sanitas™ v.9.6.11e Sanitas software utilized by Groundwater Stats Consulting. UG
mg
/L
0
0.14
0.28
0.42
0.56
0.7
6/7/16 11/16/16 4/27/17 10/6/17 3/17/18 8/27/18
1503-D
1503-I
1503-S
1504-D
1504-I
1505-D
1505-I
1505-S
BAP-0901
Time Series
Constituent: Molybdenum Analysis Run 11/16/2018 7:09 PM View: Descriptive
Conesville BAP Client: Geosyntec Data: Conesville BAP
Sanitas™ v.9.6.11e Sanitas software utilized by Groundwater Stats Consulting. UG
mg
/L
4
5
6
7
8
9
6/7/16 11/16/16 4/27/17 10/6/17 3/17/18 8/27/18
1506-C (bg)
1506-S (bg)
1507-C (bg)
1508-C (bg)
1509-S (bg)
1510-I (bg)
1510-S (bg)
1502-D
1502-I
1502-S
Time Series
Constituent: pH, field Analysis Run 11/16/2018 7:09 PM View: Descriptive
Conesville BAP Client: Geosyntec Data: Conesville BAP
Sanitas™ v.9.6.11e Sanitas software utilized by Groundwater Stats Consulting. UG
SU
4
5
6
7
8
9
6/8/16 11/17/16 4/28/17 10/7/17 3/18/18 8/27/18
1503-D
1503-I
1503-S
1504-D
1504-I
1505-D
1505-I
1505-S
BAP-0901
Time Series
Constituent: pH, field Analysis Run 11/16/2018 7:09 PM View: Descriptive
Conesville BAP Client: Geosyntec Data: Conesville BAP
Sanitas™ v.9.6.11e Sanitas software utilized by Groundwater Stats Consulting. UG
SU
0
0.014
0.028
0.042
0.056
0.07
6/7/16 11/16/16 4/27/17 10/6/17 3/17/18 8/27/18
1506-C (bg)
1506-S (bg)
1507-C (bg)
1508-C (bg)
1509-S (bg)
1510-I (bg)
1510-S (bg)
1502-D
1502-I
1502-S
Time Series
Constituent: Selenium Analysis Run 11/16/2018 7:09 PM View: Descriptive
Conesville BAP Client: Geosyntec Data: Conesville BAP
Sanitas™ v.9.6.11e Sanitas software utilized by Groundwater Stats Consulting. UG
mg
/L
Hollow symbols indicate censored values.
0
0.014
0.028
0.042
0.056
0.07
6/7/16 11/16/16 4/27/17 10/6/17 3/17/18 8/27/18
1503-D
1503-I
1503-S
1504-D
1504-I
1505-D
1505-I
1505-S
BAP-0901
Time Series
Constituent: Selenium Analysis Run 11/16/2018 7:09 PM View: Descriptive
Conesville BAP Client: Geosyntec Data: Conesville BAP
Sanitas™ v.9.6.11e Sanitas software utilized by Groundwater Stats Consulting. UG
mg
/L

0
400
800
1200
1600
2000
6/7/16 11/16/16 4/27/17 10/6/17 3/17/18 8/27/18
1506-C (bg)
1506-S (bg)
1507-C (bg)
1508-C (bg)
1509-S (bg)
1510-I (bg)
1510-S (bg)
1502-D
1502-I
1502-S
Time Series
Constituent: Sulfate Analysis Run 11/16/2018 7:09 PM View: Descriptive
Conesville BAP Client: Geosyntec Data: Conesville BAP
Sanitas™ v.9.6.11e Sanitas software utilized by Groundwater Stats Consulting. UG
mg
/L
0
400
800
1200
1600
2000
6/7/16 11/16/16 4/27/17 10/6/17 3/17/18 8/27/18
1503-D
1503-I
1503-S
1504-D
1504-I
1505-D
1505-I
1505-S
BAP-0901
Time Series
Constituent: Sulfate Analysis Run 11/16/2018 7:09 PM View: Descriptive
Conesville BAP Client: Geosyntec Data: Conesville BAP
Sanitas™ v.9.6.11e Sanitas software utilized by Groundwater Stats Consulting. UG
mg
/L
0
0.0008
0.0016
0.0024
0.0032
0.004
6/7/16 11/16/16 4/27/17 10/6/17 3/17/18 8/27/18
1506-C (bg)
1506-S (bg)
1507-C (bg)
1508-C (bg)
1509-S (bg)
1510-I (bg)
1510-S (bg)
1502-D
1502-I
1502-S
Time Series
Constituent: Thallium Analysis Run 11/16/2018 7:09 PM View: Descriptive
Conesville BAP Client: Geosyntec Data: Conesville BAP
Sanitas™ v.9.6.11e Sanitas software utilized by Groundwater Stats Consulting. UG
mg
/L
Hollow symbols indicate censored values.
0
0.0008
0.0016
0.0024
0.0032
0.004
6/7/16 11/16/16 4/27/17 10/6/17 3/17/18 8/27/18
1503-D
1503-I
1503-S
1504-D
1504-I
1505-D
1505-I
1505-S
BAP-0901
Time Series
Constituent: Thallium Analysis Run 11/16/2018 7:09 PM View: Descriptive
Conesville BAP Client: Geosyntec Data: Conesville BAP
Sanitas™ v.9.6.11e Sanitas software utilized by Groundwater Stats Consulting. UG
mg
/L
Hollow symbols indicate censored values.

0
800
1600
2400
3200
4000
6/7/16 11/16/16 4/27/17 10/6/17 3/17/18 8/27/18
1506-C (bg)
1506-S (bg)
1507-C (bg)
1508-C (bg)
1509-S (bg)
1510-I (bg)
1510-S (bg)
1502-D
1502-I
1502-S
Time Series
Constituent: Total Dissolved Solids [TDS] Analysis Run 11/16/2018 7:09 PM View: Descriptive
Conesville BAP Client: Geosyntec Data: Conesville BAP
Sanitas™ v.9.6.11e Sanitas software utilized by Groundwater Stats Consulting. UG
mg
/L
0
800
1600
2400
3200
4000
6/7/16 11/16/16 4/27/17 10/6/17 3/17/18 8/27/18
1503-D
1503-I
1503-S
1504-D
1504-I
1505-D
1505-I
1505-S
BAP-0901
Time Series
Constituent: Total Dissolved Solids [TDS] Analysis Run 11/16/2018 7:09 PM View: Descriptive
Conesville BAP Client: Geosyntec Data: Conesville BAP
Sanitas™ v.9.6.11e Sanitas software utilized by Groundwater Stats Consulting. UG
mg
/L

Constituent Well Upper Lim. Lower Lim. Date Observ. Sig. Bg N Bg Mean Std. Dev.%NDs ND Adj.Transform Alpha Method
Boron (mg/L) 1502-D 0.893 n/a 8/21/2018 6.44 Yes 73 n/a n/a 0 n/a n/a 0.0003571 NP Inter (normality) ...
Boron (mg/L) 1502-I 0.893 n/a 8/21/2018 8.09 Yes 73 n/a n/a 0 n/a n/a 0.0003571 NP Inter (normality) ...
Boron (mg/L) 1502-S 0.893 n/a 8/21/2018 6.67 Yes 73 n/a n/a 0 n/a n/a 0.0003571 NP Inter (normality) ...
Boron (mg/L) 1503-D 0.893 n/a 8/21/2018 6.84 Yes 73 n/a n/a 0 n/a n/a 0.0003571 NP Inter (normality) ...
Boron (mg/L) 1503-I 0.893 n/a 8/21/2018 7.24 Yes 73 n/a n/a 0 n/a n/a 0.0003571 NP Inter (normality) ...
Boron (mg/L) 1503-S 0.893 n/a 8/21/2018 13.6 Yes 73 n/a n/a 0 n/a n/a 0.0003571 NP Inter (normality) ...
Boron (mg/L) 1504-D 0.893 n/a 8/21/2018 2.73 Yes 73 n/a n/a 0 n/a n/a 0.0003571 NP Inter (normality) ...
Boron (mg/L) 1504-I 0.893 n/a 8/21/2018 3.19 Yes 73 n/a n/a 0 n/a n/a 0.0003571 NP Inter (normality) ...
Boron (mg/L) 1505-D 0.893 n/a 8/27/2018 2.71 Yes 73 n/a n/a 0 n/a n/a 0.0003571 NP Inter (normality) ...
Boron (mg/L) 1505-S 0.893 n/a 8/27/2018 2.9 Yes 73 n/a n/a 0 n/a n/a 0.0003571 NP Inter (normality) ...
Fluoride (mg/L) 1502-D 0.62 n/a 8/21/2018 0.84 Yes 75 n/a n/a 0 n/a n/a 0.0003397 NP Inter (normality) ...
Fluoride (mg/L) 1502-I 0.62 n/a 8/21/2018 0.96 Yes 75 n/a n/a 0 n/a n/a 0.0003397 NP Inter (normality) ...
Fluoride (mg/L) 1502-S 0.62 n/a 8/21/2018 1.41 Yes 75 n/a n/a 0 n/a n/a 0.0003397 NP Inter (normality) ...
Fluoride (mg/L) 1503-I 0.62 n/a 8/21/2018 1.22 Yes 75 n/a n/a 0 n/a n/a 0.0003397 NP Inter (normality) ...
Fluoride (mg/L) 1503-S 0.62 n/a 8/21/2018 1.4 Yes 75 n/a n/a 0 n/a n/a 0.0003397 NP Inter (normality) ...
Fluoride (mg/L) 1504-D 0.62 n/a 8/21/2018 0.65 Yes 75 n/a n/a 0 n/a n/a 0.0003397 NP Inter (normality) ...
Fluoride (mg/L) 1505-D 0.62 n/a 8/27/2018 1.27 Yes 75 n/a n/a 0 n/a n/a 0.0003397 NP Inter (normality) ...
Fluoride (mg/L) 1505-I 0.62 n/a 8/27/2018 0.79 Yes 75 n/a n/a 0 n/a n/a 0.0003397 NP Inter (normality) ...
Fluoride (mg/L) 1505-S 0.62 n/a 8/27/2018 0.89 Yes 75 n/a n/a 0 n/a n/a 0.0003397 NP Inter (normality) ...
pH, field (SU) 1502-D 7.41 5.23 8/21/2018 7.5 Yes 75 n/a n/a 0 n/a n/a 0.0006795 NP Inter (normality) ...
pH, field (SU) 1502-S 7.41 5.23 8/21/2018 7.55 Yes 75 n/a n/a 0 n/a n/a 0.0006795 NP Inter (normality) ...
pH, field (SU) 1503-S 7.41 5.23 8/21/2018 7.46 Yes 75 n/a n/a 0 n/a n/a 0.0006795 NP Inter (normality) ...
pH, field (SU) 1504-D 7.41 5.23 8/21/2018 7.43 Yes 75 n/a n/a 0 n/a n/a 0.0006795 NP Inter (normality) ...
pH, field (SU) 1504-I 7.41 5.23 8/21/2018 8.01 Yes 75 n/a n/a 0 n/a n/a 0.0006795 NP Inter (normality) ...
pH, field (SU) 1505-D 7.41 5.23 8/27/2018 7.49 Yes 75 n/a n/a 0 n/a n/a 0.0006795 NP Inter (normality) ...
Interwell Prediction Limit Summary Table - Significant ResultsConesville BAP Client: Geosyntec Data: Conesville BAP Printed 11/16/2018, 1:15 PM

Constituent Well Upper Lim. Lower Lim. Date Observ. Sig. Bg N Bg Mean Std. Dev.%NDs ND Adj.Transform Alpha Method
Boron (mg/L) 1502-D 0.893 n/a 8/21/2018 6.44 Yes 73 n/a n/a 0 n/a n/a 0.0003571 NP Inter (normality) ...
Boron (mg/L) 1502-I 0.893 n/a 8/21/2018 8.09 Yes 73 n/a n/a 0 n/a n/a 0.0003571 NP Inter (normality) ...
Boron (mg/L) 1502-S 0.893 n/a 8/21/2018 6.67 Yes 73 n/a n/a 0 n/a n/a 0.0003571 NP Inter (normality) ...
Boron (mg/L) 1503-D 0.893 n/a 8/21/2018 6.84 Yes 73 n/a n/a 0 n/a n/a 0.0003571 NP Inter (normality) ...
Boron (mg/L) 1503-I 0.893 n/a 8/21/2018 7.24 Yes 73 n/a n/a 0 n/a n/a 0.0003571 NP Inter (normality) ...
Boron (mg/L) 1503-S 0.893 n/a 8/21/2018 13.6 Yes 73 n/a n/a 0 n/a n/a 0.0003571 NP Inter (normality) ...
Boron (mg/L) 1504-D 0.893 n/a 8/21/2018 2.73 Yes 73 n/a n/a 0 n/a n/a 0.0003571 NP Inter (normality) ...
Boron (mg/L) 1504-I 0.893 n/a 8/21/2018 3.19 Yes 73 n/a n/a 0 n/a n/a 0.0003571 NP Inter (normality) ...
Boron (mg/L) 1505-D 0.893 n/a 8/27/2018 2.71 Yes 73 n/a n/a 0 n/a n/a 0.0003571 NP Inter (normality) ...
Boron (mg/L) 1505-I 0.893 n/a 8/27/2018 0.689 No 73 n/a n/a 0 n/a n/a 0.0003571 NP Inter (normality) ...
Boron (mg/L) 1505-S 0.893 n/a 8/27/2018 2.9 Yes 73 n/a n/a 0 n/a n/a 0.0003571 NP Inter (normality) ...
Boron (mg/L) BAP-0901 0.893 n/a 8/24/2018 0.195 No 73 n/a n/a 0 n/a n/a 0.0003571 NP Inter (normality) ...
Chloride (mg/L) 1502-D 319 n/a 8/21/2018 107 No 73 n/a n/a 0 n/a n/a 0.0003571 NP Inter (normality) ...
Chloride (mg/L) 1502-I 319 n/a 8/21/2018 110 No 73 n/a n/a 0 n/a n/a 0.0003571 NP Inter (normality) ...
Chloride (mg/L) 1502-S 319 n/a 8/21/2018 86.5 No 73 n/a n/a 0 n/a n/a 0.0003571 NP Inter (normality) ...
Chloride (mg/L) 1503-D 319 n/a 8/21/2018 109 No 73 n/a n/a 0 n/a n/a 0.0003571 NP Inter (normality) ...
Chloride (mg/L) 1503-I 319 n/a 8/21/2018 139 No 73 n/a n/a 0 n/a n/a 0.0003571 NP Inter (normality) ...
Chloride (mg/L) 1503-S 319 n/a 8/21/2018 197 No 73 n/a n/a 0 n/a n/a 0.0003571 NP Inter (normality) ...
Chloride (mg/L) 1504-D 319 n/a 8/21/2018 97.3 No 73 n/a n/a 0 n/a n/a 0.0003571 NP Inter (normality) ...
Chloride (mg/L) 1504-I 319 n/a 8/21/2018 71 No 73 n/a n/a 0 n/a n/a 0.0003571 NP Inter (normality) ...
Chloride (mg/L) 1505-D 319 n/a 8/27/2018 101 No 73 n/a n/a 0 n/a n/a 0.0003571 NP Inter (normality) ...
Chloride (mg/L) 1505-I 319 n/a 8/27/2018 196 No 73 n/a n/a 0 n/a n/a 0.0003571 NP Inter (normality) ...
Chloride (mg/L) 1505-S 319 n/a 8/27/2018 121 No 73 n/a n/a 0 n/a n/a 0.0003571 NP Inter (normality) ...
Chloride (mg/L) BAP-0901 319 n/a 8/24/2018 88.8 No 73 n/a n/a 0 n/a n/a 0.0003571 NP Inter (normality) ...
Fluoride (mg/L) 1502-D 0.62 n/a 8/21/2018 0.84 Yes 75 n/a n/a 0 n/a n/a 0.0003397 NP Inter (normality) ...
Fluoride (mg/L) 1502-I 0.62 n/a 8/21/2018 0.96 Yes 75 n/a n/a 0 n/a n/a 0.0003397 NP Inter (normality) ...
Fluoride (mg/L) 1502-S 0.62 n/a 8/21/2018 1.41 Yes 75 n/a n/a 0 n/a n/a 0.0003397 NP Inter (normality) ...
Fluoride (mg/L) 1503-D 0.62 n/a 8/21/2018 0.23 No 75 n/a n/a 0 n/a n/a 0.0003397 NP Inter (normality) ...
Fluoride (mg/L) 1503-I 0.62 n/a 8/21/2018 1.22 Yes 75 n/a n/a 0 n/a n/a 0.0003397 NP Inter (normality) ...
Fluoride (mg/L) 1503-S 0.62 n/a 8/21/2018 1.4 Yes 75 n/a n/a 0 n/a n/a 0.0003397 NP Inter (normality) ...
Fluoride (mg/L) 1504-D 0.62 n/a 8/21/2018 0.65 Yes 75 n/a n/a 0 n/a n/a 0.0003397 NP Inter (normality) ...
Fluoride (mg/L) 1504-I 0.62 n/a 8/21/2018 0.34 No 75 n/a n/a 0 n/a n/a 0.0003397 NP Inter (normality) ...
Fluoride (mg/L) 1505-D 0.62 n/a 8/27/2018 1.27 Yes 75 n/a n/a 0 n/a n/a 0.0003397 NP Inter (normality) ...
Fluoride (mg/L) 1505-I 0.62 n/a 8/27/2018 0.79 Yes 75 n/a n/a 0 n/a n/a 0.0003397 NP Inter (normality) ...
Fluoride (mg/L) 1505-S 0.62 n/a 8/27/2018 0.89 Yes 75 n/a n/a 0 n/a n/a 0.0003397 NP Inter (normality) ...
Fluoride (mg/L) BAP-0901 0.62 n/a 8/24/2018 0.1 No 75 n/a n/a 0 n/a n/a 0.0003397 NP Inter (normality) ...
pH, field (SU) 1502-D 7.41 5.23 8/21/2018 7.5 Yes 75 n/a n/a 0 n/a n/a 0.0006795 NP Inter (normality) ...
pH, field (SU) 1502-I 7.41 5.23 8/21/2018 7.28 No 75 n/a n/a 0 n/a n/a 0.0006795 NP Inter (normality) ...
pH, field (SU) 1502-S 7.41 5.23 8/21/2018 7.55 Yes 75 n/a n/a 0 n/a n/a 0.0006795 NP Inter (normality) ...
pH, field (SU) 1503-D 7.41 5.23 8/21/2018 7.31 No 75 n/a n/a 0 n/a n/a 0.0006795 NP Inter (normality) ...
pH, field (SU) 1503-I 7.41 5.23 8/21/2018 7.25 No 75 n/a n/a 0 n/a n/a 0.0006795 NP Inter (normality) ...
pH, field (SU) 1503-S 7.41 5.23 8/21/2018 7.46 Yes 75 n/a n/a 0 n/a n/a 0.0006795 NP Inter (normality) ...
pH, field (SU) 1504-D 7.41 5.23 8/21/2018 7.43 Yes 75 n/a n/a 0 n/a n/a 0.0006795 NP Inter (normality) ...
pH, field (SU) 1504-I 7.41 5.23 8/21/2018 8.01 Yes 75 n/a n/a 0 n/a n/a 0.0006795 NP Inter (normality) ...
pH, field (SU) 1505-D 7.41 5.23 8/27/2018 7.49 Yes 75 n/a n/a 0 n/a n/a 0.0006795 NP Inter (normality) ...
pH, field (SU) 1505-I 7.41 5.23 8/27/2018 7.4 No 75 n/a n/a 0 n/a n/a 0.0006795 NP Inter (normality) ...
pH, field (SU) 1505-S 7.41 5.23 8/27/2018 7.2 No 75 n/a n/a 0 n/a n/a 0.0006795 NP Inter (normality) ...
pH, field (SU) BAP-0901 7.41 5.23 8/24/2018 6.35 No 75 n/a n/a 0 n/a n/a 0.0006795 NP Inter (normality) ...
Interwell Prediction Limit Summary Table - All ResultsConesville BAP Client: Geosyntec Data: Conesville BAP Printed 11/16/2018, 1:15 PM

0
4
8
12
16
20
6/7/16 11/16/16 4/27/17 10/6/17 3/17/18 8/27/18
1502-D
1502-I
1502-S
1503-D
1503-I
1503-S
1504-D
1504-I
1505-D
1505-I
1505-S
BAP-0901
Limit = 0.893
Prediction Limit
Interwell Non-parametric
Constituent: Boron Analysis Run 11/16/2018 1:11 PM View: PL's - Interwell
Conesville BAP Client: Geosyntec Data: Conesville BAP
Sanitas™ v.9.6.11e Sanitas software utilized by Groundwater Stats Consulting. UG
mg
/L
Non-parametric test used in lieu of parametric prediction limit because the Shapiro Francia normality test showed the data to be non-normal at the 0.01 alpha level. Limit is highest of 73 background values. Annual per-constituent alpha = 0.008536. Individual comparison alpha = 0.0003571 (1 of 2). Comparing 12 points to limit.
Exceeds Limit: 1502-D, 1502-I, 1502-S, 1503-D, 1503-I, 1503-S, 1504-D,..
0
80
160
240
320
400
6/7/16 11/16/16 4/27/17 10/6/17 3/17/18 8/27/18
1502-D
1502-I
1502-S
1503-D
1503-I
1503-S
1504-D
1504-I
1505-D
1505-I
1505-S
BAP-0901
Limit = 319
Prediction Limit
Interwell Non-parametric
Constituent: Chloride Analysis Run 11/16/2018 1:11 PM View: PL's - Interwell
Conesville BAP Client: Geosyntec Data: Conesville BAP
Sanitas™ v.9.6.11e Sanitas software utilized by Groundwater Stats Consulting. UG
mg
/L
Non-parametric test used in lieu of parametric prediction limit because the Shapiro Francia normality test showed the data to be non-normal at the 0.01 alpha level. Limit is highest of 73 background values. Annual per-constituent alpha = 0.008536. Individual comparison alpha = 0.0003571 (1 of 2). Comparing 12 points to limit.
Within Limit
0
0.4
0.8
1.2
1.6
2
6/7/16 11/16/16 4/27/17 10/6/17 3/17/18 8/27/18
1502-D
1502-I
1502-S
1503-D
1503-I
1503-S
1504-D
1504-I
1505-D
1505-I
1505-S
BAP-0901
Limit = 0.62
Prediction Limit
Interwell Non-parametric
Constituent: Fluoride Analysis Run 11/16/2018 1:11 PM View: PL's - Interwell
Conesville BAP Client: Geosyntec Data: Conesville BAP
Sanitas™ v.9.6.11e Sanitas software utilized by Groundwater Stats Consulting. UG
mg
/L
Non-parametric test used in lieu of parametric prediction limit because the Shapiro Francia normality test showed the data to be non-normal at the 0.01 alpha level. Limit is highest of 75 background values. Annual per-constituent alpha = 0.008122. Individual comparison alpha = 0.0003397 (1 of 2). Comparing 12 points to limit.
Exceeds Limit: 1502-D, 1502-I, 1502-S, 1503-I, 1503-S, 1504-D, 1505-D,..
0
1.8
3.6
5.4
7.2
9
6/8/16 11/17/16 4/28/17 10/7/17 3/18/18 8/27/18
1502-D
1502-I
1502-S
1503-D
1503-I
1503-S
1504-D
1504-I
1505-D
1505-I
1505-S
BAP-0901
Limit = 7.41
Limit = 5.23
Prediction Limit
Interwell Non-parametric
Constituent: pH, field Analysis Run 11/16/2018 1:11 PM View: PL's - Interwell
Conesville BAP Client: Geosyntec Data: Conesville BAP
Sanitas™ v.9.6.11e Sanitas software utilized by Groundwater Stats Consulting. UG
SU
Non-parametric test used in lieu of parametric prediction limit because the Shapiro Francia normality test showed the data to be non-normal at the 0.01 alpha level. Limits are highest and lowest of 75 background values. Annual per-constituent alpha = 0.01624. Individual comparison alpha = 0.0006795 (1 of 2). Comparing 12 points to limit.
Exceeds Limits: 1502-D, 1502-S, 1503-S, 1504-D, 1504-I, 1505-D

Constituent Well Upper Lim. Lower Lim. Date Observ. Sig. Bg N Bg Mean Std. Dev.%NDs ND Adj.Transform Alpha Method
Calcium (mg/L) 1510-I 114.2 n/a 8/23/2018 127 Yes 9 99.71 6.648 0 None No 0.0006269 Param 1 of 3
Sulfate (mg/L) 1510-I 236.3 n/a 8/23/2018 262 Yes 9 174 28.67 0 None No 0.0006269 Param 1 of 3
Total Dissolved Solids [TDS] (mg/L) 1510-I 600.2 n/a 8/23/2018 664 Yes 9 473.9 58.12 0 None No 0.0006269 Param 1 of 3
Intrawell Prediction Limit Summary Table - Significant ResultsConesville BAP Client: Geosyntec Data: Conesville BAP Printed 11/16/2018, 1:49 PM

Constituent Well Upper Lim. Lower Lim. Date Observ. Sig. Bg N Bg Mean Std. Dev.%NDs ND Adj.Transform Alpha Method
Calcium (mg/L) 1506-C 116.2 n/a 8/27/2018 104 No 9 103.9 5.64 0 None No 0.0006269 Param 1 of 3
Calcium (mg/L) 1506-S 306 n/a 8/27/2018 201 No 7 136.3 65.66 0 None No 0.0006269 Param 1 of 3
Calcium (mg/L) 1507-C 126.4 n/a 8/24/2018 35.5 No 9 64.06 28.71 0 None No 0.0006269 Param 1 of 3
Calcium (mg/L) 1508-C 335.2 n/a 8/24/2018 296 No 9 295.1 18.44 0 None No 0.0006269 Param 1 of 3
Calcium (mg/L) 1509-S 170 n/a 8/27/2018 165 No 9 156.7 6.144 0 None No 0.0006269 Param 1 of 3
Calcium (mg/L) 1510-I 114.2 n/a 8/23/2018 127 Yes 9 99.71 6.648 0 None No 0.0006269 Param 1 of 3
Calcium (mg/L) 1510-S 125.6 n/a 8/23/2018 84.4 No 9 103.2 10.29 0 None No 0.0006269 Param 1 of 3
Calcium (mg/L) 1502-D 175.5 n/a 8/21/2018 117 No 9 137.7 17.4 0 None No 0.0006269 Param 1 of 3
Calcium (mg/L) 1502-I 188.1 n/a 8/21/2018 174 No 9 139.2 22.52 0 None No 0.0006269 Param 1 of 3
Calcium (mg/L) 1502-S 138.4 n/a 8/21/2018 127 No 9 118.4 9.18 0 None No 0.0006269 Param 1 of 3
Calcium (mg/L) 1503-D 200.4 n/a 8/21/2018 122 No 9 158.1 19.48 0 None No 0.0006269 Param 1 of 3
Calcium (mg/L) 1503-I 297.7 n/a 8/21/2018 171 No 9 206.1 42.16 0 None No 0.0006269 Param 1 of 3
Calcium (mg/L) 1503-S 554.4 n/a 8/21/2018 252 No 9 388.3 76.42 0 None No 0.0006269 Param 1 of 3
Calcium (mg/L) 1504-D 143.2 n/a 8/21/2018 103 No 9 112.9 13.91 0 None No 0.0006269 Param 1 of 3
Calcium (mg/L) 1504-I 216.3 n/a 8/21/2018 159 No 9 161.3 25.31 0 None No 0.0006269 Param 1 of 3
Calcium (mg/L) 1505-D 431.1 n/a 8/27/2018 90.3 No 9 225.2 94.72 0 None No 0.0006269 Param 1 of 3
Calcium (mg/L) 1505-I 324 n/a 8/27/2018 103 No 9 173.2 69.39 0 None No 0.0006269 Param 1 of 3
Calcium (mg/L) 1505-S 192.5 n/a 8/27/2018 106 No 9 151.9 18.7 0 None No 0.0006269 Param 1 of 3
Calcium (mg/L) BAP-0901 212.7 n/a 8/24/2018 153 No 8 143.4 30.1 0 None No 0.0006269 Param 1 of 3
Sulfate (mg/L) 1506-C 464.7 n/a 8/27/2018 391 No 9 394.9 32.11 0 None No 0.0006269 Param 1 of 3
Sulfate (mg/L) 1506-S 658.8 n/a 8/27/2018 568 No 7 423.1 91.19 0 None No 0.0006269 Param 1 of 3
Sulfate (mg/L) 1507-C 341.8 n/a 8/24/2018 15.4 No 9 120.4 101.9 0 None No 0.0006269 Param 1 of 3
Sulfate (mg/L) 1508-C 1099 n/a 8/24/2018 993 No 9 1019 36.57 0 None No 0.0006269 Param 1 of 3
Sulfate (mg/L) 1509-S 586.2 n/a 8/27/2018 567 No 9 538.2 22.07 0 None No 0.0006269 Param 1 of 3
Sulfate (mg/L) 1510-I 236.3 n/a 8/23/2018 262 Yes 9 174 28.67 0 None No 0.0006269 Param 1 of 3
Sulfate (mg/L) 1510-S 194.7 n/a 8/23/2018 115 No 9 154.7 18.41 0 None No 0.0006269 Param 1 of 3
Sulfate (mg/L) 1502-D 555.7 n/a 8/21/2018 311 No 9 401.6 70.94 0 None No 0.0006269 Param 1 of 3
Sulfate (mg/L) 1502-I 584.4 n/a 8/21/2018 568 No 9 422.9 74.34 0 None No 0.0006269 Param 1 of 3
Sulfate (mg/L) 1502-S 414.5 n/a 8/21/2018 388 No 9 341.9 33.42 0 None No 0.0006269 Param 1 of 3
Sulfate (mg/L) 1503-D 564 n/a 8/21/2018 369 No 9 450.1 52.41 0 None No 0.0006269 Param 1 of 3
Sulfate (mg/L) 1503-I 1027 n/a 8/21/2018 418 No 9 677.6 160.8 0 None No 0.0006269 Param 1 of 3
Sulfate (mg/L) 1503-S 1430 n/a 8/21/2018 858 No 9 1041 178.9 0 None No 0.0006269 Param 1 of 3
Sulfate (mg/L) 1504-D 427.7 n/a 8/21/2018 337 No 9 341.2 39.81 0 None No 0.0006269 Param 1 of 3
Sulfate (mg/L) 1504-I 659.9 n/a 8/21/2018 595 No 9 500.2 73.48 0 None No 0.0006269 Param 1 of 3
Sulfate (mg/L) 1505-D 1856 n/a 8/27/2018 250 No 9 832.4 471.2 0 None No 0.0006269 Param 1 of 3
Sulfate (mg/L) 1505-I 1202 n/a 8/27/2018 305 No 9 562 294.5 0 None No 0.0006269 Param 1 of 3
Sulfate (mg/L) 1505-S 705.2 n/a 8/27/2018 342 No 9 502.9 93.11 0 None No 0.0006269 Param 1 of 3
Sulfate (mg/L) BAP-0901 617.1 n/a 8/24/2018 365 No 8 389.9 98.69 0 None No 0.0006269 Param 1 of 3
Total Dissolved Solids [TDS] (mg/L) 1506-C 759.9 n/a 8/27/2018 668 No 9 672.9 40.03 0 None No 0.0006269 Param 1 of 3
Total Dissolved Solids [TDS] (mg/L) 1506-S 1430 n/a 8/27/2018 1120 No 7 785 249.7 0 None No 0.0006269 Param 1 of 3
Total Dissolved Solids [TDS] (mg/L) 1507-C 743.6 n/a 8/24/2018 214 No 9 381.2 166.8 0 None No 0.0006269 Param 1 of 3
Total Dissolved Solids [TDS] (mg/L) 1508-C 1834 n/a 8/24/2018 1640 No 9 1661 79.76 0 None No 0.0006269 Param 1 of 3
Total Dissolved Solids [TDS] (mg/L) 1509-S 925.3 n/a 8/27/2018 906 No 9 883.4 19.26 0 None No 0.0006269 Param 1 of 3
Total Dissolved Solids [TDS] (mg/L) 1510-I 600.2 n/a 8/23/2018 664 Yes 9 473.9 58.12 0 None No 0.0006269 Param 1 of 3
Total Dissolved Solids [TDS] (mg/L) 1510-S 549.3 n/a 8/23/2018 383 No 9 452.8 44.42 0 None No 0.0006269 Param 1 of 3
Total Dissolved Solids [TDS] (mg/L) 1502-D 1125 n/a 8/21/2018 746 No 9 904.6 101.5 0 None No 0.0006269 Param 1 of 3
Total Dissolved Solids [TDS] (mg/L) 1502-I 1184 n/a 8/21/2018 1050 No 9 918 122.2 0 None No 0.0006269 Param 1 of 3
Total Dissolved Solids [TDS] (mg/L) 1502-S 867.4 n/a 8/21/2018 760 No 9 774 43 0 None No 0.0006269 Param 1 of 3
Total Dissolved Solids [TDS] (mg/L) 1503-D 1185 n/a 8/21/2018 864 No 9 1018 76.9 0 None No 0.0006269 Param 1 of 3
Total Dissolved Solids [TDS] (mg/L) 1503-I 1836 n/a 8/21/2018 1040 No 9 1322 236.6 0 None No 0.0006269 Param 1 of 3
Intrawell Prediction Limit Summary Table - All ResultsConesville BAP Client: Geosyntec Data: Conesville BAP Printed 11/16/2018, 1:49 PM

Constituent Well Upper Lim. Lower Lim. Date Observ. Sig. Bg N Bg Mean Std. Dev.%NDs ND Adj.Transform Alpha Method
Page 2
Total Dissolved Solids [TDS] (mg/L) 1503-S 2946 n/a 8/21/2018 1600 No 9 2032 420.6 0 None No 0.0006269 Param 1 of 3
Total Dissolved Solids [TDS] (mg/L) 1504-D 891.5 n/a 8/21/2018 726 No 9 763.7 58.82 0 None No 0.0006269 Param 1 of 3
Total Dissolved Solids [TDS] (mg/L) 1504-I 1282 n/a 8/21/2018 1050 No 9 937.7 158.3 0 None No 0.0006269 Param 1 of 3
Total Dissolved Solids [TDS] (mg/L) 1505-D 2904 n/a 8/27/2018 628 No 9 1489 651.5 0 None No 0.0006269 Param 1 of 3
Total Dissolved Solids [TDS] (mg/L) 1505-I 1894 n/a 8/27/2018 858 No 9 1093 368.6 0 None No 0.0006269 Param 1 of 3
Total Dissolved Solids [TDS] (mg/L) 1505-S 1225 n/a 8/27/2018 748 No 9 963.8 120 0 None No 0.0006269 Param 1 of 3
Total Dissolved Solids [TDS] (mg/L) BAP-0901 1258 n/a 8/24/2018 892 No 8 853.1 176 0 None No 0.0006269 Param 1 of 3
Intrawell Prediction Limit Summary Table - All ResultsConesville BAP Client: Geosyntec Data: Conesville BAP Printed 11/16/2018, 1:49 PM

0
24
48
72
96
120
6/7/16 11/16/16 4/27/17 10/6/17 3/17/18 8/27/18
1506-C background
1506-C compliance
Limit = 116.2
Prediction Limit
Intrawell Parametric
Constituent: Calcium Analysis Run 11/16/2018 1:42 PM View: PL's - Intrawell
Conesville BAP Client: Geosyntec Data: Conesville BAP
Sanitas™ v.9.6.11e Sanitas software utilized by Groundwater Stats Consulting. UG
mg
/L
Background Data Summary: Mean=103.9, Std. Dev.=5.64, n=9. Normality test: Shapiro Wilk @alpha = 0.01, calculated = 0.8998, critical = 0.764. Kappa = 2.173 (c=7, w=12, 1 of 3, event alpha = 0.05132). Report alpha = 0.0006269.
Within Limit
0
80
160
240
320
400
6/8/16 11/17/16 4/28/17 10/7/17 3/18/18 8/27/18
1506-S background
1506-S compliance
Limit = 306
Prediction Limit
Intrawell Parametric
Constituent: Calcium Analysis Run 11/16/2018 1:42 PM View: PL's - Intrawell
Conesville BAP Client: Geosyntec Data: Conesville BAP
Sanitas™ v.9.6.11e Sanitas software utilized by Groundwater Stats Consulting. UG
mg
/L
Background Data Summary: Mean=136.3, Std. Dev.=65.66, n=7. Normality test: Shapiro Wilk @alpha = 0.01, calculated = 0.8937, critical = 0.73. Kappa = 2.584 (c=7, w=12, 1 of 3, event alpha = 0.05132). Report alpha = 0.0006269.
Within Limit
0
26
52
78
104
130
6/7/16 11/15/16 4/26/17 10/4/17 3/15/18 8/24/18
1507-C background
1507-C compliance
Limit = 126.4
Prediction Limit
Intrawell Parametric
Constituent: Calcium Analysis Run 11/16/2018 1:42 PM View: PL's - Intrawell
Conesville BAP Client: Geosyntec Data: Conesville BAP
Sanitas™ v.9.6.11e Sanitas software utilized by Groundwater Stats Consulting. UG
mg
/L
Background Data Summary: Mean=64.06, Std. Dev.=28.71, n=9. Normality test: Shapiro Wilk @alpha = 0.01, calculated = 0.8178, critical = 0.764. Kappa = 2.173 (c=7, w=12, 1 of 3, event alpha = 0.05132). Report alpha = 0.0006269.
Within Limit
0
68
136
204
272
340
6/7/16 11/15/16 4/26/17 10/4/17 3/15/18 8/24/18
1508-C background
1508-C compliance
Limit = 335.2
Prediction Limit
Intrawell Parametric
Constituent: Calcium Analysis Run 11/16/2018 1:42 PM View: PL's - Intrawell
Conesville BAP Client: Geosyntec Data: Conesville BAP
Sanitas™ v.9.6.11e Sanitas software utilized by Groundwater Stats Consulting. UG
mg
/L
Background Data Summary: Mean=295.1, Std. Dev.=18.44, n=9. Normality test: Shapiro Wilk @alpha = 0.01, calculated = 0.9207, critical = 0.764. Kappa = 2.173 (c=7, w=12, 1 of 3, event alpha = 0.05132). Report alpha = 0.0006269.
Within Limit

0
36
72
108
144
180
6/7/16 11/16/16 4/27/17 10/6/17 3/17/18 8/27/18
1509-S background
1509-S compliance
Limit = 170
Prediction Limit
Intrawell Parametric
Constituent: Calcium Analysis Run 11/16/2018 1:42 PM View: PL's - Intrawell
Conesville BAP Client: Geosyntec Data: Conesville BAP
Sanitas™ v.9.6.11e Sanitas software utilized by Groundwater Stats Consulting. UG
mg
/L
Background Data Summary: Mean=156.7, Std. Dev.=6.144, n=9. Normality test: Shapiro Wilk @alpha = 0.01, calculated = 0.9414, critical = 0.764. Kappa = 2.173 (c=7, w=12, 1 of 3, event alpha = 0.05132). Report alpha = 0.0006269.
Within Limit
0
40
80
120
160
200
6/7/16 11/15/16 4/25/17 10/4/17 3/14/18 8/23/18
1510-I background
1510-I compliance
Limit = 114.2
Prediction Limit
Intrawell Parametric
Constituent: Calcium Analysis Run 11/16/2018 1:42 PM View: PL's - Intrawell
Conesville BAP Client: Geosyntec Data: Conesville BAP
Sanitas™ v.9.6.11e Sanitas software utilized by Groundwater Stats Consulting. UG
mg
/L
Background Data Summary: Mean=99.71, Std. Dev.=6.648, n=9. Normality test: Shapiro Wilk @alpha = 0.01, calculated = 0.7929, critical = 0.764. Kappa = 2.173 (c=7, w=12, 1 of 3, event alpha = 0.05132). Report alpha = 0.0006269.
Exceeds Limit
0
40
80
120
160
200
6/8/16 11/16/16 4/26/17 10/4/17 3/14/18 8/23/18
1510-S background
1510-S compliance
Limit = 125.6
Prediction Limit
Intrawell Parametric
Constituent: Calcium Analysis Run 11/16/2018 1:42 PM View: PL's - Intrawell
Conesville BAP Client: Geosyntec Data: Conesville BAP
Sanitas™ v.9.6.11e Sanitas software utilized by Groundwater Stats Consulting. UG
mg
/L
Background Data Summary: Mean=103.2, Std. Dev.=10.29, n=9. Normality test: Shapiro Wilk @alpha = 0.01, calculated = 0.8608, critical = 0.764. Kappa = 2.173 (c=7, w=12, 1 of 3, event alpha = 0.05132). Report alpha = 0.0006269.
Within Limit
0
36
72
108
144
180
6/9/16 11/16/16 4/26/17 10/3/17 3/13/18 8/21/18
1502-D background
1502-D compliance
Limit = 175.5
Prediction Limit
Intrawell Parametric
Constituent: Calcium Analysis Run 11/16/2018 1:42 PM View: PL's - Intrawell
Conesville BAP Client: Geosyntec Data: Conesville BAP
Sanitas™ v.9.6.11e Sanitas software utilized by Groundwater Stats Consulting. UG
mg
/L
Background Data Summary: Mean=137.7, Std. Dev.=17.4, n=9. Normality test: Shapiro Wilk @alpha = 0.01, calculated = 0.9332, critical = 0.764. Kappa = 2.173 (c=7, w=12, 1 of 3, event alpha = 0.05132). Report alpha = 0.0006269.
Within Limit

0
38
76
114
152
190
6/9/16 11/16/16 4/26/17 10/3/17 3/13/18 8/21/18
1502-I background
1502-I compliance
Limit = 188.1
Prediction Limit
Intrawell Parametric
Constituent: Calcium Analysis Run 11/16/2018 1:42 PM View: PL's - Intrawell
Conesville BAP Client: Geosyntec Data: Conesville BAP
Sanitas™ v.9.6.11e Sanitas software utilized by Groundwater Stats Consulting. UG
mg
/L
Background Data Summary: Mean=139.2, Std. Dev.=22.52, n=9. Normality test: Shapiro Wilk @alpha = 0.01, calculated = 0.9424, critical = 0.764. Kappa = 2.173 (c=7, w=12, 1 of 3, event alpha = 0.05132). Report alpha = 0.0006269.
Within Limit
0
28
56
84
112
140
6/9/16 11/16/16 4/26/17 10/3/17 3/13/18 8/21/18
1502-S background
1502-S compliance
Limit = 138.4
Prediction Limit
Intrawell Parametric
Constituent: Calcium Analysis Run 11/16/2018 1:42 PM View: PL's - Intrawell
Conesville BAP Client: Geosyntec Data: Conesville BAP
Sanitas™ v.9.6.11e Sanitas software utilized by Groundwater Stats Consulting. UG
mg
/L
Background Data Summary: Mean=118.4, Std. Dev.=9.18, n=9. Normality test: Shapiro Wilk @alpha = 0.01, calculated = 0.9641, critical = 0.764. Kappa = 2.173 (c=7, w=12, 1 of 3, event alpha = 0.05132). Report alpha = 0.0006269.
Within Limit
0
42
84
126
168
210
6/9/16 11/16/16 4/26/17 10/3/17 3/13/18 8/21/18
1503-D background
1503-D compliance
Limit = 200.4
Prediction Limit
Intrawell Parametric
Constituent: Calcium Analysis Run 11/16/2018 1:42 PM View: PL's - Intrawell
Conesville BAP Client: Geosyntec Data: Conesville BAP
Sanitas™ v.9.6.11e Sanitas software utilized by Groundwater Stats Consulting. UG
mg
/L
Background Data Summary: Mean=158.1, Std. Dev.=19.48, n=9. Normality test: Shapiro Wilk @alpha = 0.01, calculated = 0.9406, critical = 0.764. Kappa = 2.173 (c=7, w=12, 1 of 3, event alpha = 0.05132). Report alpha = 0.0006269.
Within Limit
0
60
120
180
240
300
6/9/16 11/16/16 4/26/17 10/3/17 3/13/18 8/21/18
1503-I background
1503-I compliance
Limit = 297.7
Prediction Limit
Intrawell Parametric
Constituent: Calcium Analysis Run 11/16/2018 1:42 PM View: PL's - Intrawell
Conesville BAP Client: Geosyntec Data: Conesville BAP
Sanitas™ v.9.6.11e Sanitas software utilized by Groundwater Stats Consulting. UG
mg
/L
Background Data Summary: Mean=206.1, Std. Dev.=42.16, n=9. Normality test: Shapiro Wilk @alpha = 0.01, calculated = 0.8918, critical = 0.764. Kappa = 2.173 (c=7, w=12, 1 of 3, event alpha = 0.05132). Report alpha = 0.0006269.
Within Limit

0
120
240
360
480
600
6/9/16 11/16/16 4/26/17 10/3/17 3/13/18 8/21/18
1503-S background
1503-S compliance
Limit = 554.4
Prediction Limit
Intrawell Parametric
Constituent: Calcium Analysis Run 11/16/2018 1:42 PM View: PL's - Intrawell
Conesville BAP Client: Geosyntec Data: Conesville BAP
Sanitas™ v.9.6.11e Sanitas software utilized by Groundwater Stats Consulting. UG
mg
/L
Background Data Summary: Mean=388.3, Std. Dev.=76.42, n=9. Normality test: Shapiro Wilk @alpha = 0.01, calculated = 0.9456, critical = 0.764. Kappa = 2.173 (c=7, w=12, 1 of 3, event alpha = 0.05132). Report alpha = 0.0006269.
Within Limit
0
30
60
90
120
150
6/7/16 11/15/16 4/25/17 10/3/17 3/13/18 8/21/18
1504-D background
1504-D compliance
Limit = 143.2
Prediction Limit
Intrawell Parametric
Constituent: Calcium Analysis Run 11/16/2018 1:42 PM View: PL's - Intrawell
Conesville BAP Client: Geosyntec Data: Conesville BAP
Sanitas™ v.9.6.11e Sanitas software utilized by Groundwater Stats Consulting. UG
mg
/L
Background Data Summary: Mean=112.9, Std. Dev.=13.91, n=9. Normality test: Shapiro Wilk @alpha = 0.01, calculated = 0.9456, critical = 0.764. Kappa = 2.173 (c=7, w=12, 1 of 3, event alpha = 0.05132). Report alpha = 0.0006269.
Within Limit
0
60
120
180
240
300
6/8/16 11/15/16 4/25/17 10/3/17 3/13/18 8/21/18
1504-I background
1504-I compliance
Limit = 216.3
Prediction Limit
Intrawell Parametric
Constituent: Calcium Analysis Run 11/16/2018 1:42 PM View: PL's - Intrawell
Conesville BAP Client: Geosyntec Data: Conesville BAP
Sanitas™ v.9.6.11e Sanitas software utilized by Groundwater Stats Consulting. UG
mg
/L
Background Data Summary: Mean=161.3, Std. Dev.=25.31, n=9. Normality test: Shapiro Wilk @alpha = 0.01, calculated = 0.9179, critical = 0.764. Kappa = 2.173 (c=7, w=12, 1 of 3, event alpha = 0.05132). Report alpha = 0.0006269.
Within Limit
0
100
200
300
400
500
6/7/16 11/16/16 4/27/17 10/6/17 3/17/18 8/27/18
1505-D background
1505-D compliance
Limit = 431.1
Prediction Limit
Intrawell Parametric
Constituent: Calcium Analysis Run 11/16/2018 1:42 PM View: PL's - Intrawell
Conesville BAP Client: Geosyntec Data: Conesville BAP
Sanitas™ v.9.6.11e Sanitas software utilized by Groundwater Stats Consulting. UG
mg
/L
Background Data Summary: Mean=225.2, Std. Dev.=94.72, n=9. Normality test: Shapiro Wilk @alpha = 0.01, calculated = 0.8568, critical = 0.764. Kappa = 2.173 (c=7, w=12, 1 of 3, event alpha = 0.05132). Report alpha = 0.0006269.
Within Limit

0
80
160
240
320
400
6/8/16 11/17/16 4/28/17 10/7/17 3/18/18 8/27/18
1505-I background
1505-I compliance
Limit = 324
Prediction Limit
Intrawell Parametric
Constituent: Calcium Analysis Run 11/16/2018 1:42 PM View: PL's - Intrawell
Conesville BAP Client: Geosyntec Data: Conesville BAP
Sanitas™ v.9.6.11e Sanitas software utilized by Groundwater Stats Consulting. UG
mg
/L
Background Data Summary: Mean=173.2, Std. Dev.=69.39, n=9. Normality test: Shapiro Wilk @alpha = 0.01, calculated = 0.7935, critical = 0.764. Kappa = 2.173 (c=7, w=12, 1 of 3, event alpha = 0.05132). Report alpha = 0.0006269.
Within Limit
0
40
80
120
160
200
6/8/16 11/17/16 4/28/17 10/7/17 3/18/18 8/27/18
1505-S background
1505-S compliance
Limit = 192.5
Prediction Limit
Intrawell Parametric
Constituent: Calcium Analysis Run 11/16/2018 1:42 PM View: PL's - Intrawell
Conesville BAP Client: Geosyntec Data: Conesville BAP
Sanitas™ v.9.6.11e Sanitas software utilized by Groundwater Stats Consulting. UG
mg
/L
Background Data Summary: Mean=151.9, Std. Dev.=18.7, n=9. Normality test: Shapiro Wilk @alpha = 0.01, calculated = 0.8715, critical = 0.764. Kappa = 2.173 (c=7, w=12, 1 of 3, event alpha = 0.05132). Report alpha = 0.0006269.
Within Limit
0
60
120
180
240
300
6/7/16 11/15/16 4/26/17 10/4/17 3/15/18 8/24/18
BAP-0901 background
BAP-0901 compliance
Limit = 212.7
Prediction Limit
Intrawell Parametric
Constituent: Calcium Analysis Run 11/16/2018 1:42 PM View: PL's - Intrawell
Conesville BAP Client: Geosyntec Data: Conesville BAP
Sanitas™ v.9.6.11e Sanitas software utilized by Groundwater Stats Consulting. UG
mg
/L
Background Data Summary: Mean=143.4, Std. Dev.=30.1, n=8. Normality test: Shapiro Wilk @alpha = 0.01, calculated = 0.9359, critical = 0.749. Kappa = 2.302 (c=7, w=12, 1 of 3, event alpha = 0.05132). Report alpha = 0.0006269.
Within Limit
0
100
200
300
400
500
6/14/16 11/21/16 5/1/17 10/9/17 3/19/18 8/27/18
1506-C background
1506-C compliance
Limit = 464.7
Prediction Limit
Intrawell Parametric
Constituent: Sulfate Analysis Run 11/16/2018 1:42 PM View: PL's - Intrawell
Conesville BAP Client: Geosyntec Data: Conesville BAP
Sanitas™ v.9.6.11e Sanitas software utilized by Groundwater Stats Consulting. UG
mg
/L
Background Data Summary: Mean=394.9, Std. Dev.=32.11, n=9. Normality test: Shapiro Wilk @alpha = 0.01, calculated = 0.9599, critical = 0.764. Kappa = 2.173 (c=7, w=12, 1 of 3, event alpha = 0.05132). Report alpha = 0.0006269.
Within Limit

0
140
280
420
560
700
6/14/16 11/21/16 5/1/17 10/9/17 3/19/18 8/27/18
1506-S background
1506-S compliance
Limit = 658.8
Prediction Limit
Intrawell Parametric
Constituent: Sulfate Analysis Run 11/16/2018 1:42 PM View: PL's - Intrawell
Conesville BAP Client: Geosyntec Data: Conesville BAP
Sanitas™ v.9.6.11e Sanitas software utilized by Groundwater Stats Consulting. UG
mg
/L
Background Data Summary: Mean=423.1, Std. Dev.=91.19, n=7. Normality test: Shapiro Wilk @alpha = 0.01, calculated = 0.9363, critical = 0.73. Kappa = 2.584 (c=7, w=12, 1 of 3, event alpha = 0.05132). Report alpha = 0.0006269.
Within Limit
0
80
160
240
320
400
6/7/16 11/15/16 4/26/17 10/4/17 3/15/18 8/24/18
1507-C background
1507-C compliance
Limit = 341.8
Prediction Limit
Intrawell Parametric
Constituent: Sulfate Analysis Run 11/16/2018 1:42 PM View: PL's - Intrawell
Conesville BAP Client: Geosyntec Data: Conesville BAP
Sanitas™ v.9.6.11e Sanitas software utilized by Groundwater Stats Consulting. UG
mg
/L
Background Data Summary: Mean=120.4, Std. Dev.=101.9, n=9. Normality test: Shapiro Wilk @alpha = 0.01, calculated = 0.8141, critical = 0.764. Kappa = 2.173 (c=7, w=12, 1 of 3, event alpha = 0.05132). Report alpha = 0.0006269.
Within Limit
0
220
440
660
880
1100
6/14/16 11/21/16 4/30/17 10/7/17 3/16/18 8/24/18
1508-C background
1508-C compliance
Limit = 1099
Prediction Limit
Intrawell Parametric
Constituent: Sulfate Analysis Run 11/16/2018 1:42 PM View: PL's - Intrawell
Conesville BAP Client: Geosyntec Data: Conesville BAP
Sanitas™ v.9.6.11e Sanitas software utilized by Groundwater Stats Consulting. UG
mg
/L
Background Data Summary: Mean=1019, Std. Dev.=36.57, n=9. Normality test: Shapiro Wilk @alpha = 0.01, calculated = 0.9411, critical = 0.764. Kappa = 2.173 (c=7, w=12, 1 of 3, event alpha = 0.05132). Report alpha = 0.0006269.
Within Limit
0
118
236
354
472
590
6/7/16 11/16/16 4/27/17 10/6/17 3/17/18 8/27/18
1509-S background
1509-S compliance
Limit = 586.2
Prediction Limit
Intrawell Parametric
Constituent: Sulfate Analysis Run 11/16/2018 1:42 PM View: PL's - Intrawell
Conesville BAP Client: Geosyntec Data: Conesville BAP
Sanitas™ v.9.6.11e Sanitas software utilized by Groundwater Stats Consulting. UG
mg
/L
Background Data Summary: Mean=538.2, Std. Dev.=22.07, n=9. Normality test: Shapiro Wilk @alpha = 0.01, calculated = 0.9635, critical = 0.764. Kappa = 2.173 (c=7, w=12, 1 of 3, event alpha = 0.05132). Report alpha = 0.0006269.
Within Limit

0
60
120
180
240
300
6/14/16 11/21/16 4/30/17 10/7/17 3/16/18 8/23/18
1510-I background
1510-I compliance
Limit = 236.3
Prediction Limit
Intrawell Parametric
Constituent: Sulfate Analysis Run 11/16/2018 1:42 PM View: PL's - Intrawell
Conesville BAP Client: Geosyntec Data: Conesville BAP
Sanitas™ v.9.6.11e Sanitas software utilized by Groundwater Stats Consulting. UG
mg
/L
Background Data Summary: Mean=174, Std. Dev.=28.67, n=9. Normality test: Shapiro Wilk @alpha = 0.01, calculated = 0.8995, critical = 0.764. Kappa = 2.173 (c=7, w=12, 1 of 3, event alpha = 0.05132). Report alpha = 0.0006269.
Exceeds Limit
0
40
80
120
160
200
6/14/16 11/21/16 4/30/17 10/7/17 3/16/18 8/23/18
1510-S background
1510-S compliance
Limit = 194.7
Prediction Limit
Intrawell Parametric
Constituent: Sulfate Analysis Run 11/16/2018 1:42 PM View: PL's - Intrawell
Conesville BAP Client: Geosyntec Data: Conesville BAP
Sanitas™ v.9.6.11e Sanitas software utilized by Groundwater Stats Consulting. UG
mg
/L
Background Data Summary: Mean=154.7, Std. Dev.=18.41, n=9. Normality test: Shapiro Wilk @alpha = 0.01, calculated = 0.9562, critical = 0.764. Kappa = 2.173 (c=7, w=12, 1 of 3, event alpha = 0.05132). Report alpha = 0.0006269.
Within Limit
0
120
240
360
480
600
6/9/16 11/16/16 4/26/17 10/3/17 3/13/18 8/21/18
1502-D background
1502-D compliance
Limit = 555.7
Prediction Limit
Intrawell Parametric
Constituent: Sulfate Analysis Run 11/16/2018 1:42 PM View: PL's - Intrawell
Conesville BAP Client: Geosyntec Data: Conesville BAP
Sanitas™ v.9.6.11e Sanitas software utilized by Groundwater Stats Consulting. UG
mg
/L
Background Data Summary: Mean=401.6, Std. Dev.=70.94, n=9. Normality test: Shapiro Wilk @alpha = 0.01, calculated = 0.9167, critical = 0.764. Kappa = 2.173 (c=7, w=12, 1 of 3, event alpha = 0.05132). Report alpha = 0.0006269.
Within Limit
0
120
240
360
480
600
6/9/16 11/16/16 4/26/17 10/3/17 3/13/18 8/21/18
1502-I background
1502-I compliance
Limit = 584.4
Prediction Limit
Intrawell Parametric
Constituent: Sulfate Analysis Run 11/16/2018 1:42 PM View: PL's - Intrawell
Conesville BAP Client: Geosyntec Data: Conesville BAP
Sanitas™ v.9.6.11e Sanitas software utilized by Groundwater Stats Consulting. UG
mg
/L
Background Data Summary: Mean=422.9, Std. Dev.=74.34, n=9. Normality test: Shapiro Wilk @alpha = 0.01, calculated = 0.9002, critical = 0.764. Kappa = 2.173 (c=7, w=12, 1 of 3, event alpha = 0.05132). Report alpha = 0.0006269.
Within Limit

0
100
200
300
400
500
6/9/16 11/16/16 4/26/17 10/3/17 3/13/18 8/21/18
1502-S background
1502-S compliance
Limit = 414.5
Prediction Limit
Intrawell Parametric
Constituent: Sulfate Analysis Run 11/16/2018 1:42 PM View: PL's - Intrawell
Conesville BAP Client: Geosyntec Data: Conesville BAP
Sanitas™ v.9.6.11e Sanitas software utilized by Groundwater Stats Consulting. UG
mg
/L
Background Data Summary: Mean=341.9, Std. Dev.=33.42, n=9. Normality test: Shapiro Wilk @alpha = 0.01, calculated = 0.8528, critical = 0.764. Kappa = 2.173 (c=7, w=12, 1 of 3, event alpha = 0.05132). Report alpha = 0.0006269.
Within Limit
0
120
240
360
480
600
6/9/16 11/16/16 4/26/17 10/3/17 3/13/18 8/21/18
1503-D background
1503-D compliance
Limit = 564
Prediction Limit
Intrawell Parametric
Constituent: Sulfate Analysis Run 11/16/2018 1:42 PM View: PL's - Intrawell
Conesville BAP Client: Geosyntec Data: Conesville BAP
Sanitas™ v.9.6.11e Sanitas software utilized by Groundwater Stats Consulting. UG
mg
/L
Background Data Summary: Mean=450.1, Std. Dev.=52.41, n=9. Normality test: Shapiro Wilk @alpha = 0.01, calculated = 0.8689, critical = 0.764. Kappa = 2.173 (c=7, w=12, 1 of 3, event alpha = 0.05132). Report alpha = 0.0006269.
Within Limit
0
220
440
660
880
1100
6/9/16 11/16/16 4/26/17 10/3/17 3/13/18 8/21/18
1503-I background
1503-I compliance
Limit = 1027
Prediction Limit
Intrawell Parametric
Constituent: Sulfate Analysis Run 11/16/2018 1:42 PM View: PL's - Intrawell
Conesville BAP Client: Geosyntec Data: Conesville BAP
Sanitas™ v.9.6.11e Sanitas software utilized by Groundwater Stats Consulting. UG
mg
/L
Background Data Summary: Mean=677.6, Std. Dev.=160.8, n=9. Normality test: Shapiro Wilk @alpha = 0.01, calculated = 0.8539, critical = 0.764. Kappa = 2.173 (c=7, w=12, 1 of 3, event alpha = 0.05132). Report alpha = 0.0006269.
Within Limit
0
300
600
900
1200
1500
6/9/16 11/16/16 4/26/17 10/3/17 3/13/18 8/21/18
1503-S background
1503-S compliance
Limit = 1430
Prediction Limit
Intrawell Parametric
Constituent: Sulfate Analysis Run 11/16/2018 1:42 PM View: PL's - Intrawell
Conesville BAP Client: Geosyntec Data: Conesville BAP
Sanitas™ v.9.6.11e Sanitas software utilized by Groundwater Stats Consulting. UG
mg
/L
Background Data Summary: Mean=1041, Std. Dev.=178.9, n=9. Normality test: Shapiro Wilk @alpha = 0.01, calculated = 0.9386, critical = 0.764. Kappa = 2.173 (c=7, w=12, 1 of 3, event alpha = 0.05132). Report alpha = 0.0006269.
Within Limit

0
100
200
300
400
500
6/7/16 11/15/16 4/25/17 10/3/17 3/13/18 8/21/18
1504-D background
1504-D compliance
Limit = 427.7
Prediction Limit
Intrawell Parametric
Constituent: Sulfate Analysis Run 11/16/2018 1:42 PM View: PL's - Intrawell
Conesville BAP Client: Geosyntec Data: Conesville BAP
Sanitas™ v.9.6.11e Sanitas software utilized by Groundwater Stats Consulting. UG
mg
/L
Background Data Summary: Mean=341.2, Std. Dev.=39.81, n=9. Normality test: Shapiro Wilk @alpha = 0.01, calculated = 0.9107, critical = 0.764. Kappa = 2.173 (c=7, w=12, 1 of 3, event alpha = 0.05132). Report alpha = 0.0006269.
Within Limit
0
140
280
420
560
700
6/14/16 11/20/16 4/29/17 10/5/17 3/14/18 8/21/18
1504-I background
1504-I compliance
Limit = 659.9
Prediction Limit
Intrawell Parametric
Constituent: Sulfate Analysis Run 11/16/2018 1:42 PM View: PL's - Intrawell
Conesville BAP Client: Geosyntec Data: Conesville BAP
Sanitas™ v.9.6.11e Sanitas software utilized by Groundwater Stats Consulting. UG
mg
/L
Background Data Summary: Mean=500.2, Std. Dev.=73.48, n=9. Normality test: Shapiro Wilk @alpha = 0.01, calculated = 0.9457, critical = 0.764. Kappa = 2.173 (c=7, w=12, 1 of 3, event alpha = 0.05132). Report alpha = 0.0006269.
Within Limit
0
400
800
1200
1600
2000
6/7/16 11/16/16 4/27/17 10/6/17 3/17/18 8/27/18
1505-D background
1505-D compliance
Limit = 1856
Prediction Limit
Intrawell Parametric
Constituent: Sulfate Analysis Run 11/16/2018 1:42 PM View: PL's - Intrawell
Conesville BAP Client: Geosyntec Data: Conesville BAP
Sanitas™ v.9.6.11e Sanitas software utilized by Groundwater Stats Consulting. UG
mg
/L
Background Data Summary: Mean=832.4, Std. Dev.=471.2, n=9. Normality test: Shapiro Wilk @alpha = 0.01, calculated = 0.8723, critical = 0.764. Kappa = 2.173 (c=7, w=12, 1 of 3, event alpha = 0.05132). Report alpha = 0.0006269.
Within Limit
0
260
520
780
1040
1300
6/14/16 11/21/16 5/1/17 10/9/17 3/19/18 8/27/18
1505-I background
1505-I compliance
Limit = 1202
Prediction Limit
Intrawell Parametric
Constituent: Sulfate Analysis Run 11/16/2018 1:42 PM View: PL's - Intrawell
Conesville BAP Client: Geosyntec Data: Conesville BAP
Sanitas™ v.9.6.11e Sanitas software utilized by Groundwater Stats Consulting. UG
mg
/L
Background Data Summary: Mean=562, Std. Dev.=294.5, n=9. Normality test: Shapiro Wilk @alpha = 0.01, calculated = 0.8066, critical = 0.764. Kappa = 2.173 (c=7, w=12, 1 of 3, event alpha = 0.05132). Report alpha = 0.0006269.
Within Limit

0
160
320
480
640
800
6/8/16 11/17/16 4/28/17 10/7/17 3/18/18 8/27/18
1505-S background
1505-S compliance
Limit = 705.2
Prediction Limit
Intrawell Parametric
Constituent: Sulfate Analysis Run 11/16/2018 1:42 PM View: PL's - Intrawell
Conesville BAP Client: Geosyntec Data: Conesville BAP
Sanitas™ v.9.6.11e Sanitas software utilized by Groundwater Stats Consulting. UG
mg
/L
Background Data Summary: Mean=502.9, Std. Dev.=93.11, n=9. Normality test: Shapiro Wilk @alpha = 0.01, calculated = 0.8988, critical = 0.764. Kappa = 2.173 (c=7, w=12, 1 of 3, event alpha = 0.05132). Report alpha = 0.0006269.
Within Limit
0
140
280
420
560
700
6/14/16 11/21/16 4/30/17 10/7/17 3/16/18 8/24/18
BAP-0901 background
BAP-0901 compliance
Limit = 617.1
Prediction Limit
Intrawell Parametric
Constituent: Sulfate Analysis Run 11/16/2018 1:42 PM View: PL's - Intrawell
Conesville BAP Client: Geosyntec Data: Conesville BAP
Sanitas™ v.9.6.11e Sanitas software utilized by Groundwater Stats Consulting. UG
mg
/L
Background Data Summary: Mean=389.9, Std. Dev.=98.69, n=8. Normality test: Shapiro Wilk @alpha = 0.01, calculated = 0.9081, critical = 0.749. Kappa = 2.302 (c=7, w=12, 1 of 3, event alpha = 0.05132). Report alpha = 0.0006269.
Within Limit
0
160
320
480
640
800
6/14/16 11/21/16 5/1/17 10/9/17 3/19/18 8/27/18
1506-C background
1506-C compliance
Limit = 759.9
Prediction Limit
Intrawell Parametric
Constituent: Total Dissolved Solids [TDS] Analysis Run 11/16/2018 1:42 PM View: PL's - Intrawell
Conesville BAP Client: Geosyntec Data: Conesville BAP
Sanitas™ v.9.6.11e Sanitas software utilized by Groundwater Stats Consulting. UG
mg
/L
Background Data Summary: Mean=672.9, Std. Dev.=40.03, n=9. Normality test: Shapiro Wilk @alpha = 0.01, calculated = 0.967, critical = 0.764. Kappa = 2.173 (c=7, w=12, 1 of 3, event alpha = 0.05132). Report alpha = 0.0006269.
Within Limit
0
400
800
1200
1600
2000
6/14/16 11/21/16 5/1/17 10/9/17 3/19/18 8/27/18
1506-S background
1506-S compliance
Limit = 1430
Prediction Limit
Intrawell Parametric
Constituent: Total Dissolved Solids [TDS] Analysis Run 11/16/2018 1:42 PM View: PL's - Intrawell
Conesville BAP Client: Geosyntec Data: Conesville BAP
Sanitas™ v.9.6.11e Sanitas software utilized by Groundwater Stats Consulting. UG
mg
/L
Background Data Summary: Mean=785, Std. Dev.=249.7, n=7. Normality test: Shapiro Wilk @alpha = 0.01, calculated = 0.8984, critical = 0.73. Kappa = 2.584 (c=7, w=12, 1 of 3, event alpha = 0.05132). Report alpha = 0.0006269.
Within Limit

0
160
320
480
640
800
6/7/16 11/15/16 4/26/17 10/4/17 3/15/18 8/24/18
1507-C background
1507-C compliance
Limit = 743.6
Prediction Limit
Intrawell Parametric
Constituent: Total Dissolved Solids [TDS] Analysis Run 11/16/2018 1:42 PM View: PL's - Intrawell
Conesville BAP Client: Geosyntec Data: Conesville BAP
Sanitas™ v.9.6.11e Sanitas software utilized by Groundwater Stats Consulting. UG
mg
/L
Background Data Summary: Mean=381.2, Std. Dev.=166.8, n=9. Normality test: Shapiro Wilk @alpha = 0.01, calculated = 0.8256, critical = 0.764. Kappa = 2.173 (c=7, w=12, 1 of 3, event alpha = 0.05132). Report alpha = 0.0006269.
Within Limit
0
380
760
1140
1520
1900
6/14/16 11/21/16 4/30/17 10/7/17 3/16/18 8/24/18
1508-C background
1508-C compliance
Limit = 1834
Prediction Limit
Intrawell Parametric
Constituent: Total Dissolved Solids [TDS] Analysis Run 11/16/2018 1:42 PM View: PL's - Intrawell
Conesville BAP Client: Geosyntec Data: Conesville BAP
Sanitas™ v.9.6.11e Sanitas software utilized by Groundwater Stats Consulting. UG
mg
/L
Background Data Summary: Mean=1661, Std. Dev.=79.76, n=9. Normality test: Shapiro Wilk @alpha = 0.01, calculated = 0.8604, critical = 0.764. Kappa = 2.173 (c=7, w=12, 1 of 3, event alpha = 0.05132). Report alpha = 0.0006269.
Within Limit
0
186
372
558
744
930
6/7/16 11/16/16 4/27/17 10/6/17 3/17/18 8/27/18
1509-S background
1509-S compliance
Limit = 925.3
Prediction Limit
Intrawell Parametric
Constituent: Total Dissolved Solids [TDS] Analysis Run 11/16/2018 1:42 PM View: PL's - Intrawell
Conesville BAP Client: Geosyntec Data: Conesville BAP
Sanitas™ v.9.6.11e Sanitas software utilized by Groundwater Stats Consulting. UG
mg
/L
Background Data Summary: Mean=883.4, Std. Dev.=19.26, n=9. Normality test: Shapiro Wilk @alpha = 0.01, calculated = 0.8831, critical = 0.764. Kappa = 2.173 (c=7, w=12, 1 of 3, event alpha = 0.05132). Report alpha = 0.0006269.
Within Limit
0
140
280
420
560
700
6/14/16 11/21/16 4/30/17 10/7/17 3/16/18 8/23/18
1510-I background
1510-I compliance
Limit = 600.2
Prediction Limit
Intrawell Parametric
Constituent: Total Dissolved Solids [TDS] Analysis Run 11/16/2018 1:42 PM View: PL's - Intrawell
Conesville BAP Client: Geosyntec Data: Conesville BAP
Sanitas™ v.9.6.11e Sanitas software utilized by Groundwater Stats Consulting. UG
mg
/L
Background Data Summary: Mean=473.9, Std. Dev.=58.12, n=9. Normality test: Shapiro Wilk @alpha = 0.01, calculated = 0.9358, critical = 0.764. Kappa = 2.173 (c=7, w=12, 1 of 3, event alpha = 0.05132). Report alpha = 0.0006269.
Exceeds Limit

0
120
240
360
480
600
6/14/16 11/21/16 4/30/17 10/7/17 3/16/18 8/23/18
1510-S background
1510-S compliance
Limit = 549.3
Prediction Limit
Intrawell Parametric
Constituent: Total Dissolved Solids [TDS] Analysis Run 11/16/2018 1:42 PM View: PL's - Intrawell
Conesville BAP Client: Geosyntec Data: Conesville BAP
Sanitas™ v.9.6.11e Sanitas software utilized by Groundwater Stats Consulting. UG
mg
/L
Background Data Summary: Mean=452.8, Std. Dev.=44.42, n=9. Normality test: Shapiro Wilk @alpha = 0.01, calculated = 0.8438, critical = 0.764. Kappa = 2.173 (c=7, w=12, 1 of 3, event alpha = 0.05132). Report alpha = 0.0006269.
Within Limit
0
240
480
720
960
1200
6/9/16 11/16/16 4/26/17 10/3/17 3/13/18 8/21/18
1502-D background
1502-D compliance
Limit = 1125
Prediction Limit
Intrawell Parametric
Constituent: Total Dissolved Solids [TDS] Analysis Run 11/16/2018 1:42 PM View: PL's - Intrawell
Conesville BAP Client: Geosyntec Data: Conesville BAP
Sanitas™ v.9.6.11e Sanitas software utilized by Groundwater Stats Consulting. UG
mg
/L
Background Data Summary: Mean=904.6, Std. Dev.=101.5, n=9. Normality test: Shapiro Wilk @alpha = 0.01, calculated = 0.9374, critical = 0.764. Kappa = 2.173 (c=7, w=12, 1 of 3, event alpha = 0.05132). Report alpha = 0.0006269.
Within Limit
0
240
480
720
960
1200
6/9/16 11/16/16 4/26/17 10/3/17 3/13/18 8/21/18
1502-I background
1502-I compliance
Limit = 1184
Prediction Limit
Intrawell Parametric
Constituent: Total Dissolved Solids [TDS] Analysis Run 11/16/2018 1:42 PM View: PL's - Intrawell
Conesville BAP Client: Geosyntec Data: Conesville BAP
Sanitas™ v.9.6.11e Sanitas software utilized by Groundwater Stats Consulting. UG
mg
/L
Background Data Summary: Mean=918, Std. Dev.=122.2, n=9. Normality test: Shapiro Wilk @alpha = 0.01, calculated = 0.8644, critical = 0.764. Kappa = 2.173 (c=7, w=12, 1 of 3, event alpha = 0.05132). Report alpha = 0.0006269.
Within Limit
0
200
400
600
800
1000
6/9/16 11/16/16 4/26/17 10/3/17 3/13/18 8/21/18
1502-S background
1502-S compliance
Limit = 867.4
Prediction Limit
Intrawell Parametric
Constituent: Total Dissolved Solids [TDS] Analysis Run 11/16/2018 1:42 PM View: PL's - Intrawell
Conesville BAP Client: Geosyntec Data: Conesville BAP
Sanitas™ v.9.6.11e Sanitas software utilized by Groundwater Stats Consulting. UG
mg
/L
Background Data Summary: Mean=774, Std. Dev.=43, n=9. Normality test: Shapiro Wilk @alpha = 0.01, calculated = 0.9639, critical = 0.764. Kappa = 2.173 (c=7, w=12, 1 of 3, event alpha = 0.05132). Report alpha = 0.0006269.
Within Limit

0
240
480
720
960
1200
6/9/16 11/16/16 4/26/17 10/3/17 3/13/18 8/21/18
1503-D background
1503-D compliance
Limit = 1185
Prediction Limit
Intrawell Parametric
Constituent: Total Dissolved Solids [TDS] Analysis Run 11/16/2018 1:42 PM View: PL's - Intrawell
Conesville BAP Client: Geosyntec Data: Conesville BAP
Sanitas™ v.9.6.11e Sanitas software utilized by Groundwater Stats Consulting. UG
mg
/L
Background Data Summary: Mean=1018, Std. Dev.=76.9, n=9. Normality test: Shapiro Wilk @alpha = 0.01, calculated = 0.8798, critical = 0.764. Kappa = 2.173 (c=7, w=12, 1 of 3, event alpha = 0.05132). Report alpha = 0.0006269.
Within Limit
0
400
800
1200
1600
2000
6/9/16 11/16/16 4/26/17 10/3/17 3/13/18 8/21/18
1503-I background
1503-I compliance
Limit = 1836
Prediction Limit
Intrawell Parametric
Constituent: Total Dissolved Solids [TDS] Analysis Run 11/16/2018 1:42 PM View: PL's - Intrawell
Conesville BAP Client: Geosyntec Data: Conesville BAP
Sanitas™ v.9.6.11e Sanitas software utilized by Groundwater Stats Consulting. UG
mg
/L
Background Data Summary: Mean=1322, Std. Dev.=236.6, n=9. Normality test: Shapiro Wilk @alpha = 0.01, calculated = 0.8928, critical = 0.764. Kappa = 2.173 (c=7, w=12, 1 of 3, event alpha = 0.05132). Report alpha = 0.0006269.
Within Limit
0
800
1600
2400
3200
4000
6/9/16 11/16/16 4/26/17 10/3/17 3/13/18 8/21/18
1503-S background
1503-S compliance
Limit = 2946
Prediction Limit
Intrawell Parametric
Constituent: Total Dissolved Solids [TDS] Analysis Run 11/16/2018 1:42 PM View: PL's - Intrawell
Conesville BAP Client: Geosyntec Data: Conesville BAP
Sanitas™ v.9.6.11e Sanitas software utilized by Groundwater Stats Consulting. UG
mg
/L
Background Data Summary: Mean=2032, Std. Dev.=420.6, n=9. Normality test: Shapiro Wilk @alpha = 0.01, calculated = 0.84, critical = 0.764. Kappa = 2.173 (c=7, w=12, 1 of 3, event alpha = 0.05132). Report alpha = 0.0006269.
Within Limit
0
180
360
540
720
900
6/7/16 11/15/16 4/25/17 10/3/17 3/13/18 8/21/18
1504-D background
1504-D compliance
Limit = 891.5
Prediction Limit
Intrawell Parametric
Constituent: Total Dissolved Solids [TDS] Analysis Run 11/16/2018 1:42 PM View: PL's - Intrawell
Conesville BAP Client: Geosyntec Data: Conesville BAP
Sanitas™ v.9.6.11e Sanitas software utilized by Groundwater Stats Consulting. UG
mg
/L
Background Data Summary: Mean=763.7, Std. Dev.=58.82, n=9. Normality test: Shapiro Wilk @alpha = 0.01, calculated = 0.9585, critical = 0.764. Kappa = 2.173 (c=7, w=12, 1 of 3, event alpha = 0.05132). Report alpha = 0.0006269.
Within Limit

0
260
520
780
1040
1300
6/14/16 11/20/16 4/29/17 10/5/17 3/14/18 8/21/18
1504-I background
1504-I compliance
Limit = 1282
Prediction Limit
Intrawell Parametric
Constituent: Total Dissolved Solids [TDS] Analysis Run 11/16/2018 1:42 PM View: PL's - Intrawell
Conesville BAP Client: Geosyntec Data: Conesville BAP
Sanitas™ v.9.6.11e Sanitas software utilized by Groundwater Stats Consulting. UG
mg
/L
Background Data Summary: Mean=937.7, Std. Dev.=158.3, n=9. Normality test: Shapiro Wilk @alpha = 0.01, calculated = 0.9367, critical = 0.764. Kappa = 2.173 (c=7, w=12, 1 of 3, event alpha = 0.05132). Report alpha = 0.0006269.
Within Limit
0
600
1200
1800
2400
3000
6/7/16 11/16/16 4/27/17 10/6/17 3/17/18 8/27/18
1505-D background
1505-D compliance
Limit = 2904
Prediction Limit
Intrawell Parametric
Constituent: Total Dissolved Solids [TDS] Analysis Run 11/16/2018 1:42 PM View: PL's - Intrawell
Conesville BAP Client: Geosyntec Data: Conesville BAP
Sanitas™ v.9.6.11e Sanitas software utilized by Groundwater Stats Consulting. UG
mg
/L
Background Data Summary: Mean=1489, Std. Dev.=651.5, n=9. Normality test: Shapiro Wilk @alpha = 0.01, calculated = 0.8666, critical = 0.764. Kappa = 2.173 (c=7, w=12, 1 of 3, event alpha = 0.05132). Report alpha = 0.0006269.
Within Limit
0
400
800
1200
1600
2000
6/14/16 11/21/16 5/1/17 10/9/17 3/19/18 8/27/18
1505-I background
1505-I compliance
Limit = 1894
Prediction Limit
Intrawell Parametric
Constituent: Total Dissolved Solids [TDS] Analysis Run 11/16/2018 1:42 PM View: PL's - Intrawell
Conesville BAP Client: Geosyntec Data: Conesville BAP
Sanitas™ v.9.6.11e Sanitas software utilized by Groundwater Stats Consulting. UG
mg
/L
Background Data Summary: Mean=1093, Std. Dev.=368.6, n=9. Normality test: Shapiro Wilk @alpha = 0.01, calculated = 0.783, critical = 0.764. Kappa = 2.173 (c=7, w=12, 1 of 3, event alpha = 0.05132). Report alpha = 0.0006269.
Within Limit
0
260
520
780
1040
1300
6/8/16 11/17/16 4/28/17 10/7/17 3/18/18 8/27/18
1505-S background
1505-S compliance
Limit = 1225
Prediction Limit
Intrawell Parametric
Constituent: Total Dissolved Solids [TDS] Analysis Run 11/16/2018 1:42 PM View: PL's - Intrawell
Conesville BAP Client: Geosyntec Data: Conesville BAP
Sanitas™ v.9.6.11e Sanitas software utilized by Groundwater Stats Consulting. UG
mg
/L
Background Data Summary: Mean=963.8, Std. Dev.=120, n=9. Normality test: Shapiro Wilk @alpha = 0.01, calculated = 0.9309, critical = 0.764. Kappa = 2.173 (c=7, w=12, 1 of 3, event alpha = 0.05132). Report alpha = 0.0006269.
Within Limit

0
260
520
780
1040
1300
6/14/16 11/21/16 4/30/17 10/7/17 3/16/18 8/24/18
BAP-0901 background
BAP-0901 compliance
Limit = 1258
Prediction Limit
Intrawell Parametric
Constituent: Total Dissolved Solids [TDS] Analysis Run 11/16/2018 1:42 PM View: PL's - Intrawell
Conesville BAP Client: Geosyntec Data: Conesville BAP
Sanitas™ v.9.6.11e Sanitas software utilized by Groundwater Stats Consulting. UG
mg
/L
Background Data Summary: Mean=853.1, Std. Dev.=176, n=8. Normality test: Shapiro Wilk @alpha = 0.01, calculated = 0.8808, critical = 0.749. Kappa = 2.302 (c=7, w=12, 1 of 3, event alpha = 0.05132). Report alpha = 0.0006269.
Within Limit

Constituent Well Slope Calc. Critical Sig. N %NDs Normality Xform Alpha Method
Boron (mg/L) 1502-D -1.558 -47 -34 Yes 11 0 n/a n/a 0.01 NP
Boron (mg/L) 1503-I -4.36 -41 -34 Yes 11 0 n/a n/a 0.01 NP
Calcium (mg/L) 1507-C (bg) -31.02 -53 -34 Yes 11 0 n/a n/a 0.01 NP
Calcium (mg/L) 1510-I (bg) 13.78 36 34 Yes 11 0 n/a n/a 0.01 NP
Fluoride (mg/L) 1505-D 0.2039 41 34 Yes 11 0 n/a n/a 0.01 NP
Sulfate (mg/L) 1507-C (bg) -112.4 -55 -34 Yes 11 0 n/a n/a 0.01 NP
Sulfate (mg/L) 1510-I (bg) 56.37 47 34 Yes 11 0 n/a n/a 0.01 NP
Total Dissolved Solids [TDS] (m... 1507-C (bg) -180.1 -49 -34 Yes 11 0 n/a n/a 0.01 NP
Total Dissolved Solids [TDS] (m... 1510-I (bg) 118.8 53 34 Yes 11 0 n/a n/a 0.01 NP
Trend Test Summary Table - Significant ResultsConesville BAP Client: Geosyntec Data: Conesville BAP Printed 11/16/2018, 6:27 PM

Constituent Well Slope Calc. Critical Sig. N %NDs Normality Xform Alpha Method
Boron (mg/L) 1506-C (bg) 0.006134 26 34 No 11 0 n/a n/a 0.01 NP
Boron (mg/L) 1506-S (bg) 0.3078 10 18 No 7 0 n/a n/a 0.01 NP
Boron (mg/L) 1507-C (bg) 0.0105 8 34 No 11 0 n/a n/a 0.01 NP
Boron (mg/L) 1508-C (bg) 0.01721 17 34 No 11 0 n/a n/a 0.01 NP
Boron (mg/L) 1509-S (bg) 0.01485 24 34 No 11 0 n/a n/a 0.01 NP
Boron (mg/L) 1510-I (bg) 0.0298 32 34 No 11 0 n/a n/a 0.01 NP
Boron (mg/L) 1510-S (bg) 0.02631 24 34 No 11 0 n/a n/a 0.01 NP
Boron (mg/L) 1502-D -1.558 -47 -34 Yes 11 0 n/a n/a 0.01 NP
Boron (mg/L) 1502-I -1.432 -23 -34 No 11 0 n/a n/a 0.01 NP
Boron (mg/L) 1502-S -1.135 -31 -34 No 11 0 n/a n/a 0.01 NP
Boron (mg/L) 1503-D -0.7821 -19 -34 No 11 0 n/a n/a 0.01 NP
Boron (mg/L) 1503-I -4.36 -41 -34 Yes 11 0 n/a n/a 0.01 NP
Boron (mg/L) 1503-S 0 -1 -34 No 11 0 n/a n/a 0.01 NP
Boron (mg/L) 1504-D 0.08816 15 34 No 11 0 n/a n/a 0.01 NP
Boron (mg/L) 1504-I 0.2697 17 34 No 11 0 n/a n/a 0.01 NP
Boron (mg/L) 1505-D -0.9242 -9 -34 No 11 0 n/a n/a 0.01 NP
Boron (mg/L) 1505-S 0.2478 11 34 No 11 0 n/a n/a 0.01 NP
Calcium (mg/L) 1506-C (bg) -3.269 -18 -34 No 11 0 n/a n/a 0.01 NP
Calcium (mg/L) 1506-S (bg) 68.71 20 25 No 9 0 n/a n/a 0.01 NP
Calcium (mg/L) 1507-C (bg) -31.02 -53 -34 Yes 11 0 n/a n/a 0.01 NP
Calcium (mg/L) 1508-C (bg) 6.083 7 34 No 11 0 n/a n/a 0.01 NP
Calcium (mg/L) 1509-S (bg) 3.596 12 34 No 11 0 n/a n/a 0.01 NP
Calcium (mg/L) 1510-I (bg) 13.78 36 34 Yes 11 0 n/a n/a 0.01 NP
Calcium (mg/L) 1510-S (bg) -2.405 -5 -34 No 11 0 n/a n/a 0.01 NP
Fluoride (mg/L) 1506-C (bg) 0 3 34 No 11 0 n/a n/a 0.01 NP
Fluoride (mg/L) 1506-S (bg) 0.00227 10 25 No 9 0 n/a n/a 0.01 NP
Fluoride (mg/L) 1507-C (bg) 0.005993 12 34 No 11 0 n/a n/a 0.01 NP
Fluoride (mg/L) 1508-C (bg) 0.06293 22 34 No 11 0 n/a n/a 0.01 NP
Fluoride (mg/L) 1509-S (bg) 0 16 34 No 11 0 n/a n/a 0.01 NP
Fluoride (mg/L) 1510-I (bg) 0 -8 -34 No 11 0 n/a n/a 0.01 NP
Fluoride (mg/L) 1510-S (bg) 0 -10 -34 No 11 0 n/a n/a 0.01 NP
Fluoride (mg/L) 1502-D 0.02939 13 34 No 11 0 n/a n/a 0.01 NP
Fluoride (mg/L) 1502-I 0.0632 19 34 No 11 0 n/a n/a 0.01 NP
Fluoride (mg/L) 1502-S 0.03182 11 34 No 11 0 n/a n/a 0.01 NP
Fluoride (mg/L) 1503-I 0.09185 24 34 No 11 0 n/a n/a 0.01 NP
Fluoride (mg/L) 1503-S -0.04834 -17 -34 No 11 0 n/a n/a 0.01 NP
Fluoride (mg/L) 1504-D 0.01053 7 34 No 11 0 n/a n/a 0.01 NP
Fluoride (mg/L) 1505-D 0.2039 41 34 Yes 11 0 n/a n/a 0.01 NP
Fluoride (mg/L) 1505-I 0.01344 6 34 No 11 0 n/a n/a 0.01 NP
Fluoride (mg/L) 1505-S 0.09936 19 34 No 11 0 n/a n/a 0.01 NP
pH, field (SU) 1506-C (bg) -0.06531 -17 -34 No 11 0 n/a n/a 0.01 NP
pH, field (SU) 1506-S (bg) 0.1938 14 25 No 9 0 n/a n/a 0.01 NP
pH, field (SU) 1507-C (bg) 0.1257 26 34 No 11 0 n/a n/a 0.01 NP
pH, field (SU) 1508-C (bg) 0 5 34 No 11 0 n/a n/a 0.01 NP
pH, field (SU) 1509-S (bg) -0.0366 -11 -34 No 11 0 n/a n/a 0.01 NP
pH, field (SU) 1510-I (bg) -0.0681 -22 -34 No 11 0 n/a n/a 0.01 NP
pH, field (SU) 1510-S (bg) -0.02724 -11 -34 No 11 0 n/a n/a 0.01 NP
pH, field (SU) 1502-D 0.02086 2 34 No 11 0 n/a n/a 0.01 NP
pH, field (SU) 1502-S 0.02905 3 34 No 11 0 n/a n/a 0.01 NP
pH, field (SU) 1503-S -0.3919 -28 -34 No 11 0 n/a n/a 0.01 NP
pH, field (SU) 1504-D 0.01003 3 34 No 11 0 n/a n/a 0.01 NP
pH, field (SU) 1504-I 0.1631 25 34 No 11 0 n/a n/a 0.01 NP
pH, field (SU) 1505-D 0.06798 21 34 No 11 0 n/a n/a 0.01 NP
Sulfate (mg/L) 1506-C (bg) -19.61 -17 -34 No 11 0 n/a n/a 0.01 NP
Sulfate (mg/L) 1506-S (bg) 130 22 25 No 9 0 n/a n/a 0.01 NP
Trend Test Summary Table - All ResultsConesville BAP Client: Geosyntec Data: Conesville BAP Printed 11/16/2018, 6:27 PM

Constituent Well Slope Calc. Critical Sig. N %NDs Normality Xform Alpha Method
Page 2
Sulfate (mg/L) 1507-C (bg) -112.4 -55 -34 Yes 11 0 n/a n/a 0.01 NP
Sulfate (mg/L) 1508-C (bg) 8.838 3 34 No 11 0 n/a n/a 0.01 NP
Sulfate (mg/L) 1509-S (bg) 20.68 29 34 No 11 0 n/a n/a 0.01 NP
Sulfate (mg/L) 1510-I (bg) 56.37 47 34 Yes 11 0 n/a n/a 0.01 NP
Sulfate (mg/L) 1510-S (bg) -4.813 -3 -34 No 11 0 n/a n/a 0.01 NP
Total Dissolved Solids [TDS] (m... 1506-C (bg) -30.26 -22 -34 No 11 0 n/a n/a 0.01 NP
Total Dissolved Solids [TDS] (m... 1506-S (bg) 327.3 22 25 No 9 0 n/a n/a 0.01 NP
Total Dissolved Solids [TDS] (m... 1507-C (bg) -180.1 -49 -34 Yes 11 0 n/a n/a 0.01 NP
Total Dissolved Solids [TDS] (m... 1508-C (bg) 16.27 17 34 No 11 0 n/a n/a 0.01 NP
Total Dissolved Solids [TDS] (m... 1509-S (bg) -17.36 -13 -34 No 11 0 n/a n/a 0.01 NP
Total Dissolved Solids [TDS] (m... 1510-I (bg) 118.8 53 34 Yes 11 0 n/a n/a 0.01 NP
Total Dissolved Solids [TDS] (m... 1510-S (bg) 4.106 4 34 No 11 0 n/a n/a 0.01 NP
Trend Test Summary Table - All ResultsConesville BAP Client: Geosyntec Data: Conesville BAP Printed 11/16/2018, 6:27 PM

0
0.04
0.08
0.12
0.16
0.2
6/7/16 11/16/16 4/27/17 10/6/17 3/17/18 8/27/18
Sen's Slope Estimator
1506-C (bg)
Constituent: Boron Analysis Run 11/16/2018 6:25 PM View: Trends
Conesville BAP Client: Geosyntec Data: Conesville BAP
Sanitas™ v.9.6.11e Sanitas software utilized by Groundwater Stats Consulting. UG
mg
/L
n = 11
Slope = 0.006134units per year.
Mann-Kendallstatistic = 26critical = 34
Trend not sig-nificant at 99%confidence level(α = 0.005 pertail).
-0.1
0.1
0.3
0.5
0.7
0.9
6/8/16 11/17/16 4/28/17 10/7/17 3/18/18 8/27/18
Sen's Slope Estimator
1506-S (bg)
Constituent: Boron Analysis Run 11/16/2018 6:25 PM View: Trends
Conesville BAP Client: Geosyntec Data: Conesville BAP
Sanitas™ v.9.6.11e Sanitas software utilized by Groundwater Stats Consulting. UG
mg
/L
n = 7
Slope = 0.3078units per year.
Mann-Kendallstatistic = 10critical = 18
Trend not sig-nificant at 99%confidence level(α = 0.005 pertail).
0
0.04
0.08
0.12
0.16
0.2
6/7/16 11/15/16 4/26/17 10/4/17 3/15/18 8/24/18
Sen's Slope Estimator
1507-C (bg)
Constituent: Boron Analysis Run 11/16/2018 6:25 PM View: Trends
Conesville BAP Client: Geosyntec Data: Conesville BAP
Sanitas™ v.9.6.11e Sanitas software utilized by Groundwater Stats Consulting. UG
mg
/L
n = 11
Slope = 0.0105units per year.
Mann-Kendallstatistic = 8critical = 34
Trend not sig-nificant at 99%confidence level(α = 0.005 pertail).
0
0.04
0.08
0.12
0.16
0.2
6/7/16 11/15/16 4/26/17 10/4/17 3/15/18 8/24/18
Sen's Slope Estimator
1508-C (bg)
Constituent: Boron Analysis Run 11/16/2018 6:25 PM View: Trends
Conesville BAP Client: Geosyntec Data: Conesville BAP
Sanitas™ v.9.6.11e Sanitas software utilized by Groundwater Stats Consulting. UG
mg
/L
n = 11
Slope = 0.01721units per year.
Mann-Kendallstatistic = 17critical = 34
Trend not sig-nificant at 99%confidence level(α = 0.005 pertail).

0
0.04
0.08
0.12
0.16
0.2
6/7/16 11/16/16 4/27/17 10/6/17 3/17/18 8/27/18
Sen's Slope Estimator
1509-S (bg)
Constituent: Boron Analysis Run 11/16/2018 6:25 PM View: Trends
Conesville BAP Client: Geosyntec Data: Conesville BAP
Sanitas™ v.9.6.11e Sanitas software utilized by Groundwater Stats Consulting. UG
mg
/L
n = 11
Slope = 0.01485units per year.
Mann-Kendallstatistic = 24critical = 34
Trend not sig-nificant at 99%confidence level(α = 0.005 pertail).
0
0.04
0.08
0.12
0.16
0.2
6/7/16 11/15/16 4/25/17 10/4/17 3/14/18 8/23/18
Sen's Slope Estimator
1510-I (bg)
Constituent: Boron Analysis Run 11/16/2018 6:25 PM View: Trends
Conesville BAP Client: Geosyntec Data: Conesville BAP
Sanitas™ v.9.6.11e Sanitas software utilized by Groundwater Stats Consulting. UG
mg
/L
n = 11
Slope = 0.0298units per year.
Mann-Kendallstatistic = 32critical = 34
Trend not sig-nificant at 99%confidence level(α = 0.005 pertail).
0
0.04
0.08
0.12
0.16
0.2
6/8/16 11/16/16 4/26/17 10/4/17 3/14/18 8/23/18
Sen's Slope Estimator
1510-S (bg)
Constituent: Boron Analysis Run 11/16/2018 6:25 PM View: Trends
Conesville BAP Client: Geosyntec Data: Conesville BAP
Sanitas™ v.9.6.11e Sanitas software utilized by Groundwater Stats Consulting. UG
mg
/L
n = 11
Slope = 0.02631units per year.
Mann-Kendallstatistic = 24critical = 34
Trend not sig-nificant at 99%confidence level(α = 0.005 pertail).
0
2.2
4.4
6.6
8.8
11
6/9/16 11/16/16 4/26/17 10/3/17 3/13/18 8/21/18
Sen's Slope Estimator
1502-D
Constituent: Boron Analysis Run 11/16/2018 6:25 PM View: Trends
Conesville BAP Client: Geosyntec Data: Conesville BAP
Sanitas™ v.9.6.11e Sanitas software utilized by Groundwater Stats Consulting. UG
mg
/L
n = 11
Slope = -1.558units per year.
Mann-Kendallstatistic = -47critical = -34
Decreasing trendsignificant at 99%confidence level(α = 0.005 pertail).

0
4
8
12
16
20
6/9/16 11/16/16 4/26/17 10/3/17 3/13/18 8/21/18
Sen's Slope Estimator
1502-I
Constituent: Boron Analysis Run 11/16/2018 6:25 PM View: Trends
Conesville BAP Client: Geosyntec Data: Conesville BAP
Sanitas™ v.9.6.11e Sanitas software utilized by Groundwater Stats Consulting. UG
mg
/L
n = 11
Slope = -1.432units per year.
Mann-Kendallstatistic = -23critical = -34
Trend not sig-nificant at 99%confidence level(α = 0.005 pertail).
0
1.8
3.6
5.4
7.2
9
6/9/16 11/16/16 4/26/17 10/3/17 3/13/18 8/21/18
Sen's Slope Estimator
1502-S
Constituent: Boron Analysis Run 11/16/2018 6:25 PM View: Trends
Conesville BAP Client: Geosyntec Data: Conesville BAP
Sanitas™ v.9.6.11e Sanitas software utilized by Groundwater Stats Consulting. UG
mg
/L
n = 11
Slope = -1.135units per year.
Mann-Kendallstatistic = -31critical = -34
Trend not sig-nificant at 99%confidence level(α = 0.005 pertail).
0
2
4
6
8
10
6/9/16 11/16/16 4/26/17 10/3/17 3/13/18 8/21/18
Sen's Slope Estimator
1503-D
Constituent: Boron Analysis Run 11/16/2018 6:25 PM View: Trends
Conesville BAP Client: Geosyntec Data: Conesville BAP
Sanitas™ v.9.6.11e Sanitas software utilized by Groundwater Stats Consulting. UG
mg
/L
n = 11
Slope = -0.7821units per year.
Mann-Kendallstatistic = -19critical = -34
Trend not sig-nificant at 99%confidence level(α = 0.005 pertail).
0
4
8
12
16
20
6/9/16 11/16/16 4/26/17 10/3/17 3/13/18 8/21/18
Sen's Slope Estimator
1503-I
Constituent: Boron Analysis Run 11/16/2018 6:25 PM View: Trends
Conesville BAP Client: Geosyntec Data: Conesville BAP
Sanitas™ v.9.6.11e Sanitas software utilized by Groundwater Stats Consulting. UG
mg
/L
n = 11
Slope = -4.36units per year.
Mann-Kendallstatistic = -41critical = -34
Decreasing trendsignificant at 99%confidence level(α = 0.005 pertail).

0
4
8
12
16
20
6/9/16 11/16/16 4/26/17 10/3/17 3/13/18 8/21/18
Sen's Slope Estimator
1503-S
Constituent: Boron Analysis Run 11/16/2018 6:25 PM View: Trends
Conesville BAP Client: Geosyntec Data: Conesville BAP
Sanitas™ v.9.6.11e Sanitas software utilized by Groundwater Stats Consulting. UG
mg
/L
n = 11
Slope = 0units per year.
Mann-Kendallstatistic = -1critical = -34
Trend not sig-nificant at 99%confidence level(α = 0.005 pertail).
0
0.6
1.2
1.8
2.4
3
6/7/16 11/15/16 4/25/17 10/3/17 3/13/18 8/21/18
Sen's Slope Estimator
1504-D
Constituent: Boron Analysis Run 11/16/2018 6:25 PM View: Trends
Conesville BAP Client: Geosyntec Data: Conesville BAP
Sanitas™ v.9.6.11e Sanitas software utilized by Groundwater Stats Consulting. UG
mg
/L
n = 11
Slope = 0.08816units per year.
Mann-Kendallstatistic = 15critical = 34
Trend not sig-nificant at 99%confidence level(α = 0.005 pertail).
0
0.8
1.6
2.4
3.2
4
6/8/16 11/15/16 4/25/17 10/3/17 3/13/18 8/21/18
Sen's Slope Estimator
1504-I
Constituent: Boron Analysis Run 11/16/2018 6:25 PM View: Trends
Conesville BAP Client: Geosyntec Data: Conesville BAP
Sanitas™ v.9.6.11e Sanitas software utilized by Groundwater Stats Consulting. UG
mg
/L
n = 11
Slope = 0.2697units per year.
Mann-Kendallstatistic = 17critical = 34
Trend not sig-nificant at 99%confidence level(α = 0.005 pertail).
0
1.8
3.6
5.4
7.2
9
6/7/16 11/16/16 4/27/17 10/6/17 3/17/18 8/27/18
Sen's Slope Estimator
1505-D
Constituent: Boron Analysis Run 11/16/2018 6:25 PM View: Trends
Conesville BAP Client: Geosyntec Data: Conesville BAP
Sanitas™ v.9.6.11e Sanitas software utilized by Groundwater Stats Consulting. UG
mg
/L
n = 11
Slope = -0.9242units per year.
Mann-Kendallstatistic = -9critical = -34
Trend not sig-nificant at 99%confidence level(α = 0.005 pertail).

0
1.2
2.4
3.6
4.8
6
6/8/16 11/17/16 4/28/17 10/7/17 3/18/18 8/27/18
Sen's Slope Estimator
1505-S
Constituent: Boron Analysis Run 11/16/2018 6:25 PM View: Trends
Conesville BAP Client: Geosyntec Data: Conesville BAP
Sanitas™ v.9.6.11e Sanitas software utilized by Groundwater Stats Consulting. UG
mg
/L
n = 11
Slope = 0.2478units per year.
Mann-Kendallstatistic = 11critical = 34
Trend not sig-nificant at 99%confidence level(α = 0.005 pertail).
0
40
80
120
160
200
6/7/16 11/16/16 4/27/17 10/6/17 3/17/18 8/27/18
Sen's Slope Estimator
1506-C (bg)
Constituent: Calcium Analysis Run 11/16/2018 6:25 PM View: Trends
Conesville BAP Client: Geosyntec Data: Conesville BAP
Sanitas™ v.9.6.11e Sanitas software utilized by Groundwater Stats Consulting. UG
mg
/L
n = 11
Slope = -3.269units per year.
Mann-Kendallstatistic = -18critical = -34
Trend not sig-nificant at 99%confidence level(α = 0.005 pertail).
0
60
120
180
240
300
6/8/16 11/17/16 4/28/17 10/7/17 3/18/18 8/27/18
Sen's Slope Estimator
1506-S (bg)
Constituent: Calcium Analysis Run 11/16/2018 6:25 PM View: Trends
Conesville BAP Client: Geosyntec Data: Conesville BAP
Sanitas™ v.9.6.11e Sanitas software utilized by Groundwater Stats Consulting. UG
mg
/L
n = 9
Slope = 68.71units per year.
Mann-Kendallstatistic = 20critical = 25
Trend not sig-nificant at 99%confidence level(α = 0.005 pertail).
0
40
80
120
160
200
6/7/16 11/15/16 4/26/17 10/4/17 3/15/18 8/24/18
Sen's Slope Estimator
1507-C (bg)
Constituent: Calcium Analysis Run 11/16/2018 6:25 PM View: Trends
Conesville BAP Client: Geosyntec Data: Conesville BAP
Sanitas™ v.9.6.11e Sanitas software utilized by Groundwater Stats Consulting. UG
mg
/L
n = 11
Slope = -31.02units per year.
Mann-Kendallstatistic = -53critical = -34
Decreasing trendsignificant at 99%confidence level(α = 0.005 pertail).

0
80
160
240
320
400
6/7/16 11/15/16 4/26/17 10/4/17 3/15/18 8/24/18
Sen's Slope Estimator
1508-C (bg)
Constituent: Calcium Analysis Run 11/16/2018 6:25 PM View: Trends
Conesville BAP Client: Geosyntec Data: Conesville BAP
Sanitas™ v.9.6.11e Sanitas software utilized by Groundwater Stats Consulting. UG
mg
/L
n = 11
Slope = 6.083units per year.
Mann-Kendallstatistic = 7critical = 34
Trend not sig-nificant at 99%confidence level(α = 0.005 pertail).
0
40
80
120
160
200
6/7/16 11/16/16 4/27/17 10/6/17 3/17/18 8/27/18
Sen's Slope Estimator
1509-S (bg)
Constituent: Calcium Analysis Run 11/16/2018 6:25 PM View: Trends
Conesville BAP Client: Geosyntec Data: Conesville BAP
Sanitas™ v.9.6.11e Sanitas software utilized by Groundwater Stats Consulting. UG
mg
/L
n = 11
Slope = 3.596units per year.
Mann-Kendallstatistic = 12critical = 34
Trend not sig-nificant at 99%confidence level(α = 0.005 pertail).
0
40
80
120
160
200
6/7/16 11/15/16 4/25/17 10/4/17 3/14/18 8/23/18
Sen's Slope Estimator
1510-I (bg)
Constituent: Calcium Analysis Run 11/16/2018 6:25 PM View: Trends
Conesville BAP Client: Geosyntec Data: Conesville BAP
Sanitas™ v.9.6.11e Sanitas software utilized by Groundwater Stats Consulting. UG
mg
/L
n = 11
Slope = 13.78units per year.
Mann-Kendallstatistic = 36critical = 34
Increasing trendsignificant at 99%confidence level(α = 0.005 pertail).
0
40
80
120
160
200
6/8/16 11/16/16 4/26/17 10/4/17 3/14/18 8/23/18
Sen's Slope Estimator
1510-S (bg)
Constituent: Calcium Analysis Run 11/16/2018 6:25 PM View: Trends
Conesville BAP Client: Geosyntec Data: Conesville BAP
Sanitas™ v.9.6.11e Sanitas software utilized by Groundwater Stats Consulting. UG
mg
/L
n = 11
Slope = -2.405units per year.
Mann-Kendallstatistic = -5critical = -34
Trend not sig-nificant at 99%confidence level(α = 0.005 pertail).

0
0.04
0.08
0.12
0.16
0.2
6/14/16 11/21/16 5/1/17 10/9/17 3/19/18 8/27/18
Sen's Slope Estimator
1506-C (bg)
Constituent: Fluoride Analysis Run 11/16/2018 6:25 PM View: Trends
Conesville BAP Client: Geosyntec Data: Conesville BAP
Sanitas™ v.9.6.11e Sanitas software utilized by Groundwater Stats Consulting. UG
mg
/L
n = 11
Slope = 0units per year.
Mann-Kendallstatistic = 3critical = 34
Trend not sig-nificant at 99%confidence level(α = 0.005 pertail).
0
0.012
0.024
0.036
0.048
0.06
6/14/16 11/21/16 5/1/17 10/9/17 3/19/18 8/27/18
Sen's Slope Estimator
1506-S (bg)
Constituent: Fluoride Analysis Run 11/16/2018 6:25 PM View: Trends
Conesville BAP Client: Geosyntec Data: Conesville BAP
Sanitas™ v.9.6.11e Sanitas software utilized by Groundwater Stats Consulting. UG
mg
/L
n = 9
Slope = 0.00227units per year.
Mann-Kendallstatistic = 10critical = 25
Trend not sig-nificant at 99%confidence level(α = 0.005 pertail).
0
0.06
0.12
0.18
0.24
0.3
6/7/16 11/15/16 4/26/17 10/4/17 3/15/18 8/24/18
Sen's Slope Estimator
1507-C (bg)
Constituent: Fluoride Analysis Run 11/16/2018 6:25 PM View: Trends
Conesville BAP Client: Geosyntec Data: Conesville BAP
Sanitas™ v.9.6.11e Sanitas software utilized by Groundwater Stats Consulting. UG
mg
/L
n = 11
Slope = 0.005993units per year.
Mann-Kendallstatistic = 12critical = 34
Trend not sig-nificant at 99%confidence level(α = 0.005 pertail).
0
0.14
0.28
0.42
0.56
0.7
6/14/16 11/21/16 4/30/17 10/7/17 3/16/18 8/24/18
Sen's Slope Estimator
1508-C (bg)
Constituent: Fluoride Analysis Run 11/16/2018 6:25 PM View: Trends
Conesville BAP Client: Geosyntec Data: Conesville BAP
Sanitas™ v.9.6.11e Sanitas software utilized by Groundwater Stats Consulting. UG
mg
/L
n = 11
Slope = 0.06293units per year.
Mann-Kendallstatistic = 22critical = 34
Trend not sig-nificant at 99%confidence level(α = 0.005 pertail).

0
0.018
0.036
0.054
0.072
0.09
6/7/16 11/16/16 4/27/17 10/6/17 3/17/18 8/27/18
Sen's Slope Estimator
1509-S (bg)
Constituent: Fluoride Analysis Run 11/16/2018 6:25 PM View: Trends
Conesville BAP Client: Geosyntec Data: Conesville BAP
Sanitas™ v.9.6.11e Sanitas software utilized by Groundwater Stats Consulting. UG
mg
/L
n = 11
Slope = 0units per year.
Mann-Kendallstatistic = 16critical = 34
Trend not sig-nificant at 99%confidence level(α = 0.005 pertail).
0
0.04
0.08
0.12
0.16
0.2
6/14/16 11/21/16 4/30/17 10/7/17 3/16/18 8/23/18
Sen's Slope Estimator
1510-I (bg)
Constituent: Fluoride Analysis Run 11/16/2018 6:25 PM View: Trends
Conesville BAP Client: Geosyntec Data: Conesville BAP
Sanitas™ v.9.6.11e Sanitas software utilized by Groundwater Stats Consulting. UG
mg
/L
n = 11
Slope = 0units per year.
Mann-Kendallstatistic = -8critical = -34
Trend not sig-nificant at 99%confidence level(α = 0.005 pertail).
0
0.04
0.08
0.12
0.16
0.2
6/14/16 11/21/16 4/30/17 10/7/17 3/16/18 8/23/18
Sen's Slope Estimator
1510-S (bg)
Constituent: Fluoride Analysis Run 11/16/2018 6:25 PM View: Trends
Conesville BAP Client: Geosyntec Data: Conesville BAP
Sanitas™ v.9.6.11e Sanitas software utilized by Groundwater Stats Consulting. UG
mg
/L
n = 11
Slope = 0units per year.
Mann-Kendallstatistic = -10critical = -34
Trend not sig-nificant at 99%confidence level(α = 0.005 pertail).
0
0.18
0.36
0.54
0.72
0.9
6/9/16 11/16/16 4/26/17 10/3/17 3/13/18 8/21/18
Sen's Slope Estimator
1502-D
Constituent: Fluoride Analysis Run 11/16/2018 6:25 PM View: Trends
Conesville BAP Client: Geosyntec Data: Conesville BAP
Sanitas™ v.9.6.11e Sanitas software utilized by Groundwater Stats Consulting. UG
mg
/L
n = 11
Slope = 0.02939units per year.
Mann-Kendallstatistic = 13critical = 34
Trend not sig-nificant at 99%confidence level(α = 0.005 pertail).

0
0.22
0.44
0.66
0.88
1.1
6/9/16 11/16/16 4/26/17 10/3/17 3/13/18 8/21/18
Sen's Slope Estimator
1502-I
Constituent: Fluoride Analysis Run 11/16/2018 6:25 PM View: Trends
Conesville BAP Client: Geosyntec Data: Conesville BAP
Sanitas™ v.9.6.11e Sanitas software utilized by Groundwater Stats Consulting. UG
mg
/L
n = 11
Slope = 0.0632units per year.
Mann-Kendallstatistic = 19critical = 34
Trend not sig-nificant at 99%confidence level(α = 0.005 pertail).
0
0.4
0.8
1.2
1.6
2
6/9/16 11/16/16 4/26/17 10/3/17 3/13/18 8/21/18
Sen's Slope Estimator
1502-S
Constituent: Fluoride Analysis Run 11/16/2018 6:25 PM View: Trends
Conesville BAP Client: Geosyntec Data: Conesville BAP
Sanitas™ v.9.6.11e Sanitas software utilized by Groundwater Stats Consulting. UG
mg
/L
n = 11
Slope = 0.03182units per year.
Mann-Kendallstatistic = 11critical = 34
Trend not sig-nificant at 99%confidence level(α = 0.005 pertail).
0
0.4
0.8
1.2
1.6
2
6/9/16 11/16/16 4/26/17 10/3/17 3/13/18 8/21/18
Sen's Slope Estimator
1503-I
Constituent: Fluoride Analysis Run 11/16/2018 6:25 PM View: Trends
Conesville BAP Client: Geosyntec Data: Conesville BAP
Sanitas™ v.9.6.11e Sanitas software utilized by Groundwater Stats Consulting. UG
mg
/L
n = 11
Slope = 0.09185units per year.
Mann-Kendallstatistic = 24critical = 34
Trend not sig-nificant at 99%confidence level(α = 0.005 pertail).
0
0.4
0.8
1.2
1.6
2
6/9/16 11/16/16 4/26/17 10/3/17 3/13/18 8/21/18
Sen's Slope Estimator
1503-S
Constituent: Fluoride Analysis Run 11/16/2018 6:25 PM View: Trends
Conesville BAP Client: Geosyntec Data: Conesville BAP
Sanitas™ v.9.6.11e Sanitas software utilized by Groundwater Stats Consulting. UG
mg
/L
n = 11
Slope = -0.04834units per year.
Mann-Kendallstatistic = -17critical = -34
Trend not sig-nificant at 99%confidence level(α = 0.005 pertail).

0
0.16
0.32
0.48
0.64
0.8
6/7/16 11/15/16 4/25/17 10/3/17 3/13/18 8/21/18
Sen's Slope Estimator
1504-D
Constituent: Fluoride Analysis Run 11/16/2018 6:25 PM View: Trends
Conesville BAP Client: Geosyntec Data: Conesville BAP
Sanitas™ v.9.6.11e Sanitas software utilized by Groundwater Stats Consulting. UG
mg
/L
n = 11
Slope = 0.01053units per year.
Mann-Kendallstatistic = 7critical = 34
Trend not sig-nificant at 99%confidence level(α = 0.005 pertail).
0
0.4
0.8
1.2
1.6
2
6/7/16 11/16/16 4/27/17 10/6/17 3/17/18 8/27/18
Sen's Slope Estimator
1505-D
Constituent: Fluoride Analysis Run 11/16/2018 6:25 PM View: Trends
Conesville BAP Client: Geosyntec Data: Conesville BAP
Sanitas™ v.9.6.11e Sanitas software utilized by Groundwater Stats Consulting. UG
mg
/L
n = 11
Slope = 0.2039units per year.
Mann-Kendallstatistic = 41critical = 34
Increasing trendsignificant at 99%confidence level(α = 0.005 pertail).
0
0.18
0.36
0.54
0.72
0.9
6/14/16 11/21/16 5/1/17 10/9/17 3/19/18 8/27/18
Sen's Slope Estimator
1505-I
Constituent: Fluoride Analysis Run 11/16/2018 6:25 PM View: Trends
Conesville BAP Client: Geosyntec Data: Conesville BAP
Sanitas™ v.9.6.11e Sanitas software utilized by Groundwater Stats Consulting. UG
mg
/L
n = 11
Slope = 0.01344units per year.
Mann-Kendallstatistic = 6critical = 34
Trend not sig-nificant at 99%confidence level(α = 0.005 pertail).
0
0.4
0.8
1.2
1.6
2
6/8/16 11/17/16 4/28/17 10/7/17 3/18/18 8/27/18
Sen's Slope Estimator
1505-S
Constituent: Fluoride Analysis Run 11/16/2018 6:25 PM View: Trends
Conesville BAP Client: Geosyntec Data: Conesville BAP
Sanitas™ v.9.6.11e Sanitas software utilized by Groundwater Stats Consulting. UG
mg
/L
n = 11
Slope = 0.09936units per year.
Mann-Kendallstatistic = 19critical = 34
Trend not sig-nificant at 99%confidence level(α = 0.005 pertail).

0
1.4
2.8
4.2
5.6
7
6/14/16 11/21/16 5/1/17 10/9/17 3/19/18 8/27/18
Sen's Slope Estimator
1506-C (bg)
Constituent: pH, field Analysis Run 11/16/2018 6:25 PM View: Trends
Conesville BAP Client: Geosyntec Data: Conesville BAP
Sanitas™ v.9.6.11e Sanitas software utilized by Groundwater Stats Consulting. UG
SU
n = 11
Slope = -0.06531units per year.
Mann-Kendallstatistic = -17critical = -34
Trend not sig-nificant at 99%confidence level(α = 0.005 pertail).
0
1.4
2.8
4.2
5.6
7
6/14/16 11/21/16 5/1/17 10/9/17 3/19/18 8/27/18
Sen's Slope Estimator
1506-S (bg)
Constituent: pH, field Analysis Run 11/16/2018 6:25 PM View: Trends
Conesville BAP Client: Geosyntec Data: Conesville BAP
Sanitas™ v.9.6.11e Sanitas software utilized by Groundwater Stats Consulting. UG
SU
n = 9
Slope = 0.1938units per year.
Mann-Kendallstatistic = 14critical = 25
Trend not sig-nificant at 99%confidence level(α = 0.005 pertail).
0
1.6
3.2
4.8
6.4
8
6/7/16 11/15/16 4/26/17 10/4/17 3/15/18 8/24/18
Sen's Slope Estimator
1507-C (bg)
Constituent: pH, field Analysis Run 11/16/2018 6:25 PM View: Trends
Conesville BAP Client: Geosyntec Data: Conesville BAP
Sanitas™ v.9.6.11e Sanitas software utilized by Groundwater Stats Consulting. UG
SU
n = 11
Slope = 0.1257units per year.
Mann-Kendallstatistic = 26critical = 34
Trend not sig-nificant at 99%confidence level(α = 0.005 pertail).
0
1.4
2.8
4.2
5.6
7
6/14/16 11/21/16 4/30/17 10/7/17 3/16/18 8/24/18
Sen's Slope Estimator
1508-C (bg)
Constituent: pH, field Analysis Run 11/16/2018 6:25 PM View: Trends
Conesville BAP Client: Geosyntec Data: Conesville BAP
Sanitas™ v.9.6.11e Sanitas software utilized by Groundwater Stats Consulting. UG
SU
n = 11
Slope = 0units per year.
Mann-Kendallstatistic = 5critical = 34
Trend not sig-nificant at 99%confidence level(α = 0.005 pertail).

0
1.4
2.8
4.2
5.6
7
6/7/16 11/16/16 4/27/17 10/6/17 3/17/18 8/27/18
Sen's Slope Estimator
1509-S (bg)
Constituent: pH, field Analysis Run 11/16/2018 6:25 PM View: Trends
Conesville BAP Client: Geosyntec Data: Conesville BAP
Sanitas™ v.9.6.11e Sanitas software utilized by Groundwater Stats Consulting. UG
SU
n = 11
Slope = -0.0366units per year.
Mann-Kendallstatistic = -11critical = -34
Trend not sig-nificant at 99%confidence level(α = 0.005 pertail).
0
1.6
3.2
4.8
6.4
8
6/14/16 11/21/16 4/30/17 10/7/17 3/16/18 8/23/18
Sen's Slope Estimator
1510-I (bg)
Constituent: pH, field Analysis Run 11/16/2018 6:25 PM View: Trends
Conesville BAP Client: Geosyntec Data: Conesville BAP
Sanitas™ v.9.6.11e Sanitas software utilized by Groundwater Stats Consulting. UG
SU
n = 11
Slope = -0.0681units per year.
Mann-Kendallstatistic = -22critical = -34
Trend not sig-nificant at 99%confidence level(α = 0.005 pertail).
0
1.6
3.2
4.8
6.4
8
6/14/16 11/21/16 4/30/17 10/7/17 3/16/18 8/23/18
Sen's Slope Estimator
1510-S (bg)
Constituent: pH, field Analysis Run 11/16/2018 6:25 PM View: Trends
Conesville BAP Client: Geosyntec Data: Conesville BAP
Sanitas™ v.9.6.11e Sanitas software utilized by Groundwater Stats Consulting. UG
SU
n = 11
Slope = -0.02724units per year.
Mann-Kendallstatistic = -11critical = -34
Trend not sig-nificant at 99%confidence level(α = 0.005 pertail).
0
1.6
3.2
4.8
6.4
8
6/9/16 11/16/16 4/26/17 10/3/17 3/13/18 8/21/18
Sen's Slope Estimator
1502-D
Constituent: pH, field Analysis Run 11/16/2018 6:25 PM View: Trends
Conesville BAP Client: Geosyntec Data: Conesville BAP
Sanitas™ v.9.6.11e Sanitas software utilized by Groundwater Stats Consulting. UG
SU
n = 11
Slope = 0.02086units per year.
Mann-Kendallstatistic = 2critical = 34
Trend not sig-nificant at 99%confidence level(α = 0.005 pertail).

0
1.6
3.2
4.8
6.4
8
6/9/16 11/16/16 4/26/17 10/3/17 3/13/18 8/21/18
Sen's Slope Estimator
1502-S
Constituent: pH, field Analysis Run 11/16/2018 6:26 PM View: Trends
Conesville BAP Client: Geosyntec Data: Conesville BAP
Sanitas™ v.9.6.11e Sanitas software utilized by Groundwater Stats Consulting. UG
SU
n = 11
Slope = 0.02905units per year.
Mann-Kendallstatistic = 3critical = 34
Trend not sig-nificant at 99%confidence level(α = 0.005 pertail).
0
1.8
3.6
5.4
7.2
9
6/9/16 11/16/16 4/26/17 10/3/17 3/13/18 8/21/18
Sen's Slope Estimator
1503-S
Constituent: pH, field Analysis Run 11/16/2018 6:26 PM View: Trends
Conesville BAP Client: Geosyntec Data: Conesville BAP
Sanitas™ v.9.6.11e Sanitas software utilized by Groundwater Stats Consulting. UG
SU
n = 11
Slope = -0.3919units per year.
Mann-Kendallstatistic = -28critical = -34
Trend not sig-nificant at 99%confidence level(α = 0.005 pertail).
0
1.6
3.2
4.8
6.4
8
6/8/16 11/15/16 4/25/17 10/3/17 3/13/18 8/21/18
Sen's Slope Estimator
1504-D
Constituent: pH, field Analysis Run 11/16/2018 6:26 PM View: Trends
Conesville BAP Client: Geosyntec Data: Conesville BAP
Sanitas™ v.9.6.11e Sanitas software utilized by Groundwater Stats Consulting. UG
SU
n = 11
Slope = 0.01003units per year.
Mann-Kendallstatistic = 3critical = 34
Trend not sig-nificant at 99%confidence level(α = 0.005 pertail).
0
1.8
3.6
5.4
7.2
9
6/14/16 11/20/16 4/29/17 10/5/17 3/14/18 8/21/18
Sen's Slope Estimator
1504-I
Constituent: pH, field Analysis Run 11/16/2018 6:26 PM View: Trends
Conesville BAP Client: Geosyntec Data: Conesville BAP
Sanitas™ v.9.6.11e Sanitas software utilized by Groundwater Stats Consulting. UG
SU
n = 11
Slope = 0.1631units per year.
Mann-Kendallstatistic = 25critical = 34
Trend not sig-nificant at 99%confidence level(α = 0.005 pertail).

0
1.6
3.2
4.8
6.4
8
6/8/16 11/17/16 4/28/17 10/7/17 3/18/18 8/27/18
Sen's Slope Estimator
1505-D
Constituent: pH, field Analysis Run 11/16/2018 6:26 PM View: Trends
Conesville BAP Client: Geosyntec Data: Conesville BAP
Sanitas™ v.9.6.11e Sanitas software utilized by Groundwater Stats Consulting. UG
SU
n = 11
Slope = 0.06798units per year.
Mann-Kendallstatistic = 21critical = 34
Trend not sig-nificant at 99%confidence level(α = 0.005 pertail).
0
100
200
300
400
500
6/14/16 11/21/16 5/1/17 10/9/17 3/19/18 8/27/18
Sen's Slope Estimator
1506-C (bg)
Constituent: Sulfate Analysis Run 11/16/2018 6:26 PM View: Trends
Conesville BAP Client: Geosyntec Data: Conesville BAP
Sanitas™ v.9.6.11e Sanitas software utilized by Groundwater Stats Consulting. UG
mg
/L
n = 11
Slope = -19.61units per year.
Mann-Kendallstatistic = -17critical = -34
Trend not sig-nificant at 99%confidence level(α = 0.005 pertail).
0
140
280
420
560
700
6/14/16 11/21/16 5/1/17 10/9/17 3/19/18 8/27/18
Sen's Slope Estimator
1506-S (bg)
Constituent: Sulfate Analysis Run 11/16/2018 6:26 PM View: Trends
Conesville BAP Client: Geosyntec Data: Conesville BAP
Sanitas™ v.9.6.11e Sanitas software utilized by Groundwater Stats Consulting. UG
mg
/L
n = 9
Slope = 130units per year.
Mann-Kendallstatistic = 22critical = 25
Trend not sig-nificant at 99%confidence level(α = 0.005 pertail).
-200
-80
40
160
280
400
6/7/16 11/15/16 4/26/17 10/4/17 3/15/18 8/24/18
Sen's Slope Estimator
1507-C (bg)
Constituent: Sulfate Analysis Run 11/16/2018 6:26 PM View: Trends
Conesville BAP Client: Geosyntec Data: Conesville BAP
Sanitas™ v.9.6.11e Sanitas software utilized by Groundwater Stats Consulting. UG
mg
/L
n = 11
Slope = -112.4units per year.
Mann-Kendallstatistic = -55critical = -34
Decreasing trendsignificant at 99%confidence level(α = 0.005 pertail).

0
400
800
1200
1600
2000
6/14/16 11/21/16 4/30/17 10/7/17 3/16/18 8/24/18
Sen's Slope Estimator
1508-C (bg)
Constituent: Sulfate Analysis Run 11/16/2018 6:26 PM View: Trends
Conesville BAP Client: Geosyntec Data: Conesville BAP
Sanitas™ v.9.6.11e Sanitas software utilized by Groundwater Stats Consulting. UG
mg
/L
n = 11
Slope = 8.838units per year.
Mann-Kendallstatistic = 3critical = 34
Trend not sig-nificant at 99%confidence level(α = 0.005 pertail).
0
120
240
360
480
600
6/7/16 11/16/16 4/27/17 10/6/17 3/17/18 8/27/18
Sen's Slope Estimator
1509-S (bg)
Constituent: Sulfate Analysis Run 11/16/2018 6:26 PM View: Trends
Conesville BAP Client: Geosyntec Data: Conesville BAP
Sanitas™ v.9.6.11e Sanitas software utilized by Groundwater Stats Consulting. UG
mg
/L
n = 11
Slope = 20.68units per year.
Mann-Kendallstatistic = 29critical = 34
Trend not sig-nificant at 99%confidence level(α = 0.005 pertail).
0
60
120
180
240
300
6/14/16 11/21/16 4/30/17 10/7/17 3/16/18 8/23/18
Sen's Slope Estimator
1510-I (bg)
Constituent: Sulfate Analysis Run 11/16/2018 6:26 PM View: Trends
Conesville BAP Client: Geosyntec Data: Conesville BAP
Sanitas™ v.9.6.11e Sanitas software utilized by Groundwater Stats Consulting. UG
mg
/L
n = 11
Slope = 56.37units per year.
Mann-Kendallstatistic = 47critical = 34
Increasing trendsignificant at 99%confidence level(α = 0.005 pertail).
0
40
80
120
160
200
6/14/16 11/21/16 4/30/17 10/7/17 3/16/18 8/23/18
Sen's Slope Estimator
1510-S (bg)
Constituent: Sulfate Analysis Run 11/16/2018 6:26 PM View: Trends
Conesville BAP Client: Geosyntec Data: Conesville BAP
Sanitas™ v.9.6.11e Sanitas software utilized by Groundwater Stats Consulting. UG
mg
/L
n = 11
Slope = -4.813units per year.
Mann-Kendallstatistic = -3critical = -34
Trend not sig-nificant at 99%confidence level(α = 0.005 pertail).

0
160
320
480
640
800
6/14/16 11/21/16 5/1/17 10/9/17 3/19/18 8/27/18
Sen's Slope Estimator
1506-C (bg)
Constituent: Total Dissolved Solids [TDS] Analysis Run 11/16/2018 6:26 PM View: Trends
Conesville BAP Client: Geosyntec Data: Conesville BAP
Sanitas™ v.9.6.11e Sanitas software utilized by Groundwater Stats Consulting. UG
mg
/L
n = 11
Slope = -30.26units per year.
Mann-Kendallstatistic = -22critical = -34
Trend not sig-nificant at 99%confidence level(α = 0.005 pertail).
0
400
800
1200
1600
2000
6/14/16 11/21/16 5/1/17 10/9/17 3/19/18 8/27/18
Sen's Slope Estimator
1506-S (bg)
Constituent: Total Dissolved Solids [TDS] Analysis Run 11/16/2018 6:26 PM View: Trends
Conesville BAP Client: Geosyntec Data: Conesville BAP
Sanitas™ v.9.6.11e Sanitas software utilized by Groundwater Stats Consulting. UG
mg
/L
n = 9
Slope = 327.3units per year.
Mann-Kendallstatistic = 22critical = 25
Trend not sig-nificant at 99%confidence level(α = 0.005 pertail).
0
160
320
480
640
800
6/7/16 11/15/16 4/26/17 10/4/17 3/15/18 8/24/18
Sen's Slope Estimator
1507-C (bg)
Constituent: Total Dissolved Solids [TDS] Analysis Run 11/16/2018 6:26 PM View: Trends
Conesville BAP Client: Geosyntec Data: Conesville BAP
Sanitas™ v.9.6.11e Sanitas software utilized by Groundwater Stats Consulting. UG
mg
/L
n = 11
Slope = -180.1units per year.
Mann-Kendallstatistic = -49critical = -34
Decreasing trendsignificant at 99%confidence level(α = 0.005 pertail).
0
400
800
1200
1600
2000
6/14/16 11/21/16 4/30/17 10/7/17 3/16/18 8/24/18
Sen's Slope Estimator
1508-C (bg)
Constituent: Total Dissolved Solids [TDS] Analysis Run 11/16/2018 6:26 PM View: Trends
Conesville BAP Client: Geosyntec Data: Conesville BAP
Sanitas™ v.9.6.11e Sanitas software utilized by Groundwater Stats Consulting. UG
mg
/L
n = 11
Slope = 16.27units per year.
Mann-Kendallstatistic = 17critical = 34
Trend not sig-nificant at 99%confidence level(α = 0.005 pertail).

0
200
400
600
800
1000
6/7/16 11/16/16 4/27/17 10/6/17 3/17/18 8/27/18
Sen's Slope Estimator
1509-S (bg)
Constituent: Total Dissolved Solids [TDS] Analysis Run 11/16/2018 6:26 PM View: Trends
Conesville BAP Client: Geosyntec Data: Conesville BAP
Sanitas™ v.9.6.11e Sanitas software utilized by Groundwater Stats Consulting. UG
mg
/L
n = 11
Slope = -17.36units per year.
Mann-Kendallstatistic = -13critical = -34
Trend not sig-nificant at 99%confidence level(α = 0.005 pertail).
0
140
280
420
560
700
6/14/16 11/21/16 4/30/17 10/7/17 3/16/18 8/23/18
Sen's Slope Estimator
1510-I (bg)
Constituent: Total Dissolved Solids [TDS] Analysis Run 11/16/2018 6:26 PM View: Trends
Conesville BAP Client: Geosyntec Data: Conesville BAP
Sanitas™ v.9.6.11e Sanitas software utilized by Groundwater Stats Consulting. UG
mg
/L
n = 11
Slope = 118.8units per year.
Mann-Kendallstatistic = 53critical = 34
Increasing trendsignificant at 99%confidence level(α = 0.005 pertail).
0
100
200
300
400
500
6/14/16 11/21/16 4/30/17 10/7/17 3/16/18 8/23/18
Sen's Slope Estimator
1510-S (bg)
Constituent: Total Dissolved Solids [TDS] Analysis Run 11/16/2018 6:26 PM View: Trends
Conesville BAP Client: Geosyntec Data: Conesville BAP
Sanitas™ v.9.6.11e Sanitas software utilized by Groundwater Stats Consulting. UG
mg
/L
n = 11
Slope = 4.106units per year.
Mann-Kendallstatistic = 4critical = 34
Trend not sig-nificant at 99%confidence level(α = 0.005 pertail).

Constituent Upper Lim. Bg N Bg Mean Std. Dev. %NDs ND Adj. Transform Alpha Method
Antimony (mg/L) 0.00063 68 n/a n/a 4.412 n/a n/a 0.03056 NP Inter(normality)
Arsenic (mg/L) 0.0155 68 n/a n/a 0 n/a n/a 0.03056 NP Inter(normality)
Barium (mg/L) 0.26 68 n/a n/a 0 n/a n/a 0.03056 NP Inter(normality)
Beryllium (mg/L) 0.000608 68 n/a n/a 10.29 n/a n/a 0.03056 NP Inter(normality)
Cadmium (mg/L) 0.00043 68 n/a n/a 17.65 n/a n/a 0.03056 NP Inter(Cohens/xform)
Chromium (mg/L) 0.00484 68 n/a n/a 0 n/a n/a 0.03056 NP Inter
Cobalt (mg/L) 0.0728 68 n/a n/a 0 n/a n/a 0.03056 NP Inter(normality)
Combined radium 226 + 228 (pCi/L) 3.696 68 0.05836 0.627 0 None ln(x) 0.05 Inter
Fluoride (mg/L) 0.62 75 n/a n/a 0 n/a n/a 0.02134 NP Inter(normality)
Lead (mg/L) 0.0117 68 n/a n/a 0 n/a n/a 0.03056 NP Inter
Lithium (mg/L) 0.077 68 n/a n/a 2.941 n/a n/a 0.03056 NP Inter
Mercury (mg/L) 0.000025 68 n/a n/a 33.82 n/a n/a 0.03056 NP Inter(normality)
Molybdenum (mg/L) 0.003242 68 0.03028 0.01338 0 None sqrt(x) 0.05 Inter
Selenium (mg/L) 0.002 68 n/a n/a 7.353 n/a n/a 0.03056 NP Inter
Thallium (mg/L) 0.00012 68 n/a n/a 8.824 n/a n/a 0.03056 NP Inter(normality)
Upper Tolerance LimitsConesville BAP Client: Geosyntec Data: Conesville BAP Printed 11/16/2018, 11:51 AM

Constituent Well Upper Lim. Lower Lim. Compliance Sig. N %NDs Transform Alpha Method
Arsenic (mg/L) 1502-D 0.03526 0.02596 0.016 Yes 10 0 No 0.01 Param.
Arsenic (mg/L) 1502-I 0.12 0.0576 0.016 Yes 10 0 No 0.011 NP (normality)
Arsenic (mg/L) 1502-S 0.07313 0.05809 0.016 Yes 10 0 No 0.01 Param.
Arsenic (mg/L) 1503-I 0.1415 0.07734 0.016 Yes 10 0 No 0.01 Param.
Arsenic (mg/L) 1503-S 0.2233 0.06524 0.016 Yes 10 0 No 0.01 Param.
Arsenic (mg/L) 1504-D 0.03069 0.02547 0.016 Yes 10 0 x^2 0.01 Param.
Arsenic (mg/L) 1504-I 0.08545 0.04673 0.016 Yes 10 0 No 0.01 Param.
Lithium (mg/L) 1502-D 0.1504 0.128 0.08 Yes 10 0 No 0.01 Param.
Lithium (mg/L) 1502-I 0.1386 0.1176 0.08 Yes 10 0 x^2 0.01 Param.
Lithium (mg/L) 1502-S 0.117 0.09578 0.08 Yes 10 0 No 0.01 Param.
Lithium (mg/L) 1503-D 0.1034 0.0882 0.08 Yes 10 0 No 0.01 Param.
Lithium (mg/L) 1503-I 0.122 0.09602 0.08 Yes 10 0 No 0.01 Param.
Lithium (mg/L) 1503-S 0.123 0.11 0.08 Yes 10 0 No 0.011 NP (normality)
Lithium (mg/L) 1504-D 0.1254 0.1084 0.08 Yes 10 0 No 0.01 Param.
Lithium (mg/L) 1504-I 0.1828 0.1402 0.08 Yes 10 0 No 0.01 Param.
Lithium (mg/L) 1505-D 0.167 0.099 0.08 Yes 10 0 No 0.011 NP (normality)
Lithium (mg/L) 1505-I 0.1504 0.09759 0.08 Yes 10 0 No 0.01 Param.
Lithium (mg/L) 1505-S 0.174 0.1056 0.08 Yes 10 0 No 0.01 Param.
Molybdenum (mg/L) 1502-D 0.6184 0.53 0.1 Yes 10 0 No 0.01 Param.
Molybdenum (mg/L) 1502-I 0.6572 0.5198 0.1 Yes 10 0 No 0.01 Param.
Molybdenum (mg/L) 1502-S 0.413 0.292 0.1 Yes 10 0 No 0.01 Param.
Molybdenum (mg/L) 1503-D 0.2851 0.1611 0.1 Yes 10 0 No 0.01 Param.
Molybdenum (mg/L) 1503-I 0.3931 0.2989 0.1 Yes 10 0 No 0.01 Param.
Molybdenum (mg/L) 1503-S 0.4419 0.2491 0.1 Yes 10 0 x^2 0.01 Param.
Molybdenum (mg/L) 1504-D 0.2034 0.1696 0.1 Yes 10 0 No 0.01 Param.
Confidence Intervals - Significant ResultsConesville BAP Client: Geosyntec Data: Conesville BAP Printed 11/16/2018, 12:04 PM

Constituent Well Upper Lim. Lower Lim. Compliance Sig. N %NDs Transform Alpha Method
Antimony (mg/L) 1502-D 0.00003462 0.00001738 0.006 No 10 0 No 0.01 Param.
Antimony (mg/L) 1502-I 0.00009222 0.00002648 0.006 No 10 0 sqrt(x) 0.01 Param.
Antimony (mg/L) 1502-S 0.00005 0.00002 0.006 No 10 0 No 0.011 NP (normality)
Antimony (mg/L) 1503-D 0.0001582 0.00005176 0.006 No 10 0 No 0.01 Param.
Antimony (mg/L) 1503-I 0.00005 0.00002 0.006 No 10 0 No 0.011 NP (normality)
Antimony (mg/L) 1503-S 0.0002577 0.00005116 0.006 No 10 0 sqrt(x) 0.01 Param.
Antimony (mg/L) 1504-D 0.00005 0.00001 0.006 No 10 20 No 0.011 NP (normality)
Antimony (mg/L) 1504-I 0.00003 0.00001 0.006 No 10 0 No 0.011 NP (normality)
Antimony (mg/L) 1505-D 0.0003655 0.00009051 0.006 No 10 0 sqrt(x) 0.01 Param.
Antimony (mg/L) 1505-I 0.00008391 0.00002609 0.006 No 10 0 No 0.01 Param.
Antimony (mg/L) 1505-S 0.0002227 0.00004271 0.006 No 10 0 sqrt(x) 0.01 Param.
Antimony (mg/L) BAP-0901 0.0001265 0.0000853 0.006 No 9 0 x^2 0.01 Param.
Arsenic (mg/L) 1502-D 0.03526 0.02596 0.016 Yes 10 0 No 0.01 Param.
Arsenic (mg/L) 1502-I 0.12 0.0576 0.016 Yes 10 0 No 0.011 NP (normality)
Arsenic (mg/L) 1502-S 0.07313 0.05809 0.016 Yes 10 0 No 0.01 Param.
Arsenic (mg/L) 1503-D 0.01144 0.006408 0.016 No 10 0 No 0.01 Param.
Arsenic (mg/L) 1503-I 0.1415 0.07734 0.016 Yes 10 0 No 0.01 Param.
Arsenic (mg/L) 1503-S 0.2233 0.06524 0.016 Yes 10 0 No 0.01 Param.
Arsenic (mg/L) 1504-D 0.03069 0.02547 0.016 Yes 10 0 x^2 0.01 Param.
Arsenic (mg/L) 1504-I 0.08545 0.04673 0.016 Yes 10 0 No 0.01 Param.
Arsenic (mg/L) 1505-D 0.01849 0.007566 0.016 No 9 0 No 0.01 Param.
Arsenic (mg/L) 1505-I 0.03101 0.01343 0.016 No 10 0 sqrt(x) 0.01 Param.
Arsenic (mg/L) 1505-S 0.06184 0.0142 0.016 No 10 0 sqrt(x) 0.01 Param.
Arsenic (mg/L) BAP-0901 0.001865 0.0005752 0.016 No 9 0 No 0.01 Param.
Barium (mg/L) 1502-D 0.03555 0.02837 2 No 10 0 No 0.01 Param.
Barium (mg/L) 1502-I 0.05157 0.03087 2 No 10 0 No 0.01 Param.
Barium (mg/L) 1502-S 0.04269 0.02498 2 No 10 0 ln(x) 0.01 Param.
Barium (mg/L) 1503-D 0.1048 0.05161 2 No 10 0 No 0.01 Param.
Barium (mg/L) 1503-I 0.07261 0.05183 2 No 10 0 No 0.01 Param.
Barium (mg/L) 1503-S 0.07696 0.04706 2 No 10 0 No 0.01 Param.
Barium (mg/L) 1504-D 0.04661 0.03883 2 No 10 0 No 0.01 Param.
Barium (mg/L) 1504-I 0.03337 0.02255 2 No 10 0 No 0.01 Param.
Barium (mg/L) 1505-D 0.1003 0.04386 2 No 10 0 No 0.01 Param.
Barium (mg/L) 1505-I 0.0558 0.0427 2 No 10 0 No 0.011 NP (normality)
Barium (mg/L) 1505-S 0.06292 0.0291 2 No 10 0 No 0.01 Param.
Barium (mg/L) BAP-0901 0.0769 0.0441 2 No 9 0 No 0.01 Param.
Beryllium (mg/L) 1502-D 0.00002384 0.000005169 0.004 No 10 10 ln(x) 0.01 Param.
Beryllium (mg/L) 1502-I 0.000114 0.0000136 0.004 No 10 0 sqrt(x) 0.01 Param.
Beryllium (mg/L) 1502-S 0.00004246 0.00001004 0.004 No 10 0 ln(x) 0.01 Param.
Beryllium (mg/L) 1503-D 0.0002856 0.0001458 0.004 No 10 0 No 0.01 Param.
Beryllium (mg/L) 1503-I 0.00001428 0.000006745 0.004 No 10 0 ln(x) 0.01 Param.
Beryllium (mg/L) 1503-S 0.0008509 0.00007034 0.004 No 10 0 No 0.01 Param.
Beryllium (mg/L) 1504-D 0.00002 0.000004 0.004 No 10 40 No 0.011 NP (normality)
Beryllium (mg/L) 1504-I 0.00002 0.000004 0.004 No 10 70 No 0.011 NP (normality)
Beryllium (mg/L) 1505-D 0.0003946 0.0001054 0.004 No 10 0 No 0.01 Param.
Beryllium (mg/L) 1505-I 0.00005295 0.00002149 0.004 No 9 0 No 0.01 Param.
Beryllium (mg/L) 1505-S 0.00617 0.000081 0.004 No 10 0 No 0.011 NP (normality)
Beryllium (mg/L) BAP-0901 0.00008395 0.00002183 0.004 No 9 11.11 No 0.01 Param.
Cadmium (mg/L) 1502-D 0.00002 0.000004 0.005 No 10 50 No 0.011 NP (normality)
Cadmium (mg/L) 1502-I 0.0003089 0.000009651 0.005 No 10 0 x^(1/3) 0.01 Param.
Cadmium (mg/L) 1502-S 0.00002 0.000005 0.005 No 10 40 No 0.011 NP (normality)
Cadmium (mg/L) 1503-D 0.0002781 0.0001439 0.005 No 10 0 No 0.01 Param.
Cadmium (mg/L) 1503-I 0.00002 0.000004 0.005 No 10 40 No 0.011 NP (normality)
Cadmium (mg/L) 1503-S 0.0001679 0.00002306 0.005 No 10 10 No 0.01 Param.
Cadmium (mg/L) 1504-D 0.00002 0.000004 0.005 No 10 50 No 0.011 NP (normality)
Confidence Intervals - All ResultsConesville BAP Client: Geosyntec Data: Conesville BAP Printed 11/16/2018, 12:04 PM

Constituent Well Upper Lim. Lower Lim. Compliance Sig. N %NDs Transform Alpha Method
Page 2
Cadmium (mg/L) 1504-I 0.00002 0.000004 0.005 No 10 50 No 0.011 NP (normality)
Cadmium (mg/L) 1505-D 0.0003283 0.00006372 0.005 No 10 0 No 0.01 Param.
Cadmium (mg/L) 1505-I 0.00002262 0.000006265 0.005 No 9 11.11 No 0.01 Param.
Cadmium (mg/L) 1505-S 0.0002839 0.0001261 0.005 No 10 0 No 0.01 Param.
Cadmium (mg/L) BAP-0901 0.0005 0.0002 0.005 No 9 0 No 0.01 Param.
Chromium (mg/L) 1502-D 0.0004024 0.00007479 0.1 No 10 0 No 0.01 Param.
Chromium (mg/L) 1502-I 0.001512 0.0002249 0.1 No 10 0 sqrt(x) 0.01 Param.
Chromium (mg/L) 1502-S 0.0008035 0.00008715 0.1 No 10 0 sqrt(x) 0.01 Param.
Chromium (mg/L) 1503-D 0.01307 0.006944 0.1 No 10 0 No 0.01 Param.
Chromium (mg/L) 1503-I 0.0004954 0.0001474 0.1 No 10 0 No 0.01 Param.
Chromium (mg/L) 1503-S 0.0184 0.001304 0.1 No 10 0 No 0.01 Param.
Chromium (mg/L) 1504-D 0.0002549 0.00009402 0.1 No 9 0 No 0.01 Param.
Chromium (mg/L) 1504-I 0.000182 0.000007 0.1 No 10 0 No 0.011 NP (normality)
Chromium (mg/L) 1505-D 0.01243 0.003488 0.1 No 10 0 No 0.01 Param.
Chromium (mg/L) 1505-I 0.001425 0.0005756 0.1 No 9 0 No 0.01 Param.
Chromium (mg/L) 1505-S 0.003251 0.001256 0.1 No 10 0 No 0.01 Param.
Chromium (mg/L) BAP-0901 0.003153 0.0005017 0.1 No 9 0 No 0.01 Param.
Cobalt (mg/L) 1502-D 0.0004798 0.0002882 0.073 No 10 0 No 0.01 Param.
Cobalt (mg/L) 1502-I 0.001172 0.0002879 0.073 No 10 0 sqrt(x) 0.01 Param.
Cobalt (mg/L) 1502-S 0.000392 0.000119 0.073 No 10 0 No 0.011 NP (normality)
Cobalt (mg/L) 1503-D 0.0104 0.005665 0.073 No 10 0 No 0.01 Param.
Cobalt (mg/L) 1503-I 0.0003117 0.00006886 0.073 No 10 0 No 0.01 Param.
Cobalt (mg/L) 1503-S 0.003654 0.0005332 0.073 No 10 0 No 0.01 Param.
Cobalt (mg/L) 1504-D 0.000152 0.000037 0.073 No 10 0 No 0.011 NP (normality)
Cobalt (mg/L) 1504-I 0.00006233 0.00001647 0.073 No 10 0 No 0.01 Param.
Cobalt (mg/L) 1505-D 0.008055 0.002679 0.073 No 10 0 No 0.01 Param.
Cobalt (mg/L) 1505-I 0.000789 0.000214 0.073 No 10 0 No 0.011 NP (normality)
Cobalt (mg/L) 1505-S 0.02109 0.003102 0.073 No 10 0 ln(x) 0.01 Param.
Cobalt (mg/L) BAP-0901 0.002205 0.0007967 0.073 No 9 0 No 0.01 Param.
Combined radium 226 + 228 (pCi/L) 1502-D 1.565 0.58 5 No 10 0 No 0.01 Param.
Combined radium 226 + 228 (pCi/L) 1502-I 1.871 0.793 5 No 10 0 No 0.011 NP (normality)
Combined radium 226 + 228 (pCi/L) 1502-S 0.9946 0.2052 5 No 10 0 No 0.01 Param.
Combined radium 226 + 228 (pCi/L) 1503-D 1.928 0.7632 5 No 10 0 No 0.01 Param.
Combined radium 226 + 228 (pCi/L) 1503-I 2.2 1.131 5 No 10 0 No 0.01 Param.
Combined radium 226 + 228 (pCi/L) 1503-S 1.938 0.4578 5 No 10 0 sqrt(x) 0.01 Param.
Combined radium 226 + 228 (pCi/L) 1504-D 1.696 0.7446 5 No 10 0 No 0.01 Param.
Combined radium 226 + 228 (pCi/L) 1504-I 1.318 0.3995 5 No 10 0 No 0.01 Param.
Combined radium 226 + 228 (pCi/L) 1505-D 2.213 1.223 5 No 10 0 No 0.01 Param.
Combined radium 226 + 228 (pCi/L) 1505-I 2.939 1.187 5 No 10 0 No 0.01 Param.
Combined radium 226 + 228 (pCi/L) 1505-S 1.943 1.205 5 No 10 0 No 0.01 Param.
Combined radium 226 + 228 (pCi/L) BAP-0901 1.889 1.04 5 No 9 0 No 0.01 Param.
Fluoride (mg/L) 1502-D 0.814 0.7241 4 No 11 0 No 0.01 Param.
Fluoride (mg/L) 1502-I 0.9741 0.8423 4 No 11 0 No 0.01 Param.
Fluoride (mg/L) 1502-S 1.428 1.316 4 No 11 0 No 0.01 Param.
Fluoride (mg/L) 1503-D 0.2486 0.2132 4 No 11 0 No 0.01 Param.
Fluoride (mg/L) 1503-I 1.144 0.9539 4 No 11 0 No 0.01 Param.
Fluoride (mg/L) 1503-S 1.473 1.308 4 No 11 0 No 0.01 Param.
Fluoride (mg/L) 1504-D 0.6779 0.5857 4 No 11 0 No 0.01 Param.
Fluoride (mg/L) 1504-I 0.6037 0.3782 4 No 11 0 No 0.01 Param.
Fluoride (mg/L) 1505-D 1.104 0.8328 4 No 11 0 No 0.01 Param.
Fluoride (mg/L) 1505-I 0.8202 0.6998 4 No 11 0 No 0.01 Param.
Fluoride (mg/L) 1505-S 1.1 0.65 4 No 11 0 No 0.006 NP (normality)
Fluoride (mg/L) BAP-0901 0.17 0.1 4 No 10 0 No 0.011 NP (normality)
Lead (mg/L) 1502-D 0.0003319 0.00004797 0.015 No 10 0 sqrt(x) 0.01 Param.
Lead (mg/L) 1502-I 0.003392 0.0003931 0.015 No 10 0 sqrt(x) 0.01 Param.
Confidence Intervals - All ResultsConesville BAP Client: Geosyntec Data: Conesville BAP Printed 11/16/2018, 12:04 PM

Constituent Well Upper Lim. Lower Lim. Compliance Sig. N %NDs Transform Alpha Method
Page 3
Lead (mg/L) 1502-S 0.0005909 0.0001018 0.015 No 10 0 x^(1/3) 0.01 Param.
Lead (mg/L) 1503-D 0.009892 0.005028 0.015 No 10 0 No 0.01 Param.
Lead (mg/L) 1503-I 0.001962 0.00013 0.015 No 10 0 No 0.01 Param.
Lead (mg/L) 1503-S 0.008371 0.001186 0.015 No 10 0 No 0.01 Param.
Lead (mg/L) 1504-D 0.0001135 0.00001529 0.015 No 10 10 sqrt(x) 0.01 Param.
Lead (mg/L) 1504-I 0.0001172 0.00001571 0.015 No 10 0 sqrt(x) 0.01 Param.
Lead (mg/L) 1505-D 0.02843 0.005279 0.015 No 10 0 No 0.01 Param.
Lead (mg/L) 1505-I 0.00249 0.0008969 0.015 No 9 0 No 0.01 Param.
Lead (mg/L) 1505-S 0.0111 0.00303 0.015 No 10 0 No 0.011 NP (normality)
Lead (mg/L) BAP-0901 0.001718 0.0003334 0.015 No 9 0 No 0.01 Param.
Lithium (mg/L) 1502-D 0.1504 0.128 0.08 Yes 10 0 No 0.01 Param.
Lithium (mg/L) 1502-I 0.1386 0.1176 0.08 Yes 10 0 x^2 0.01 Param.
Lithium (mg/L) 1502-S 0.117 0.09578 0.08 Yes 10 0 No 0.01 Param.
Lithium (mg/L) 1503-D 0.1034 0.0882 0.08 Yes 10 0 No 0.01 Param.
Lithium (mg/L) 1503-I 0.122 0.09602 0.08 Yes 10 0 No 0.01 Param.
Lithium (mg/L) 1503-S 0.123 0.11 0.08 Yes 10 0 No 0.011 NP (normality)
Lithium (mg/L) 1504-D 0.1254 0.1084 0.08 Yes 10 0 No 0.01 Param.
Lithium (mg/L) 1504-I 0.1828 0.1402 0.08 Yes 10 0 No 0.01 Param.
Lithium (mg/L) 1505-D 0.167 0.099 0.08 Yes 10 0 No 0.011 NP (normality)
Lithium (mg/L) 1505-I 0.1504 0.09759 0.08 Yes 10 0 No 0.01 Param.
Lithium (mg/L) 1505-S 0.174 0.1056 0.08 Yes 10 0 No 0.01 Param.
Lithium (mg/L) BAP-0901 0.004364 0.0006587 0.08 No 9 0 No 0.01 Param.
Mercury (mg/L) 1502-D 0.000005 0.000002 0.002 No 10 20 No 0.011 NP (normality)
Mercury (mg/L) 1502-I 0.00001408 0.000002178 0.002 No 10 10 sqrt(x) 0.01 Param.
Mercury (mg/L) 1502-S 0.000005 0.000002 0.002 No 10 30 No 0.011 NP (normality)
Mercury (mg/L) 1503-D 0.00003534 0.00001286 0.002 No 10 0 No 0.01 Param.
Mercury (mg/L) 1503-I 0.000005 0.000002 0.002 No 9 55.56 No 0.002 NP (normality)
Mercury (mg/L) 1503-S 0.0001094 0.000006038 0.002 No 10 10 x^(1/3) 0.01 Param.
Mercury (mg/L) 1504-D 0.000005 0.000002 0.002 No 10 50 No 0.011 NP (normality)
Mercury (mg/L) 1504-I 0.000005 0.000002 0.002 No 10 40 No 0.011 NP (normality)
Mercury (mg/L) 1505-D 0.0000305 0.000003712 0.002 No 10 0 x^(1/3) 0.01 Param.
Mercury (mg/L) 1505-I 0.000005824 0.000002196 0.002 No 9 11.11 sqrt(x) 0.01 Param.
Mercury (mg/L) 1505-S 0.000011 0.000002 0.002 No 10 0 No 0.011 NP (normality)
Mercury (mg/L) BAP-0901 0.000006806 0.000002113 0.002 No 9 0 sqrt(x) 0.01 Param.
Molybdenum (mg/L) 1502-D 0.6184 0.53 0.1 Yes 10 0 No 0.01 Param.
Molybdenum (mg/L) 1502-I 0.6572 0.5198 0.1 Yes 10 0 No 0.01 Param.
Molybdenum (mg/L) 1502-S 0.413 0.292 0.1 Yes 10 0 No 0.01 Param.
Molybdenum (mg/L) 1503-D 0.2851 0.1611 0.1 Yes 10 0 No 0.01 Param.
Molybdenum (mg/L) 1503-I 0.3931 0.2989 0.1 Yes 10 0 No 0.01 Param.
Molybdenum (mg/L) 1503-S 0.4419 0.2491 0.1 Yes 10 0 x^2 0.01 Param.
Molybdenum (mg/L) 1504-D 0.2034 0.1696 0.1 Yes 10 0 No 0.01 Param.
Molybdenum (mg/L) 1504-I 0.0421 0.028 0.1 No 10 0 No 0.01 Param.
Molybdenum (mg/L) 1505-D 0.1165 0.0665 0.1 No 10 0 No 0.01 Param.
Molybdenum (mg/L) 1505-I 0.09849 0.06635 0.1 No 10 0 No 0.01 Param.
Molybdenum (mg/L) 1505-S 0.07608 0.04442 0.1 No 10 0 No 0.01 Param.
Molybdenum (mg/L) BAP-0901 0.001205 0.0002129 0.1 No 9 0 No 0.01 Param.
Selenium (mg/L) 1502-D 0.0002 0.00009 0.05 No 10 0 No 0.011 NP (normality)
Selenium (mg/L) 1502-I 0.001209 0.0002506 0.05 No 10 0 ln(x) 0.01 Param.
Selenium (mg/L) 1502-S 0.0003 0.0002 0.05 No 10 0 No 0.011 NP (normality)
Selenium (mg/L) 1503-D 0.001361 0.0006788 0.05 No 10 0 No 0.01 Param.
Selenium (mg/L) 1503-I 0.000277 0.000139 0.05 No 10 0 No 0.01 Param.
Selenium (mg/L) 1503-S 0.001818 0.0004215 0.05 No 10 0 No 0.01 Param.
Selenium (mg/L) 1504-D 0.00008729 0.00006471 0.05 No 10 0 No 0.01 Param.
Selenium (mg/L) 1504-I 0.0001 0.00007 0.05 No 9 0 No 0.002 NP (normality)
Selenium (mg/L) 1505-D 0.002072 0.0005678 0.05 No 10 0 No 0.01 Param.
Confidence Intervals - All ResultsConesville BAP Client: Geosyntec Data: Conesville BAP Printed 11/16/2018, 12:04 PM

Constituent Well Upper Lim. Lower Lim. Compliance Sig. N %NDs Transform Alpha Method
Page 4
Selenium (mg/L) 1505-I 0.0003 0.0001 0.05 No 9 0 No 0.002 NP (normality)
Selenium (mg/L) 1505-S 0.01581 0.000704 0.05 No 10 0 ln(x) 0.01 Param.
Selenium (mg/L) BAP-0901 0.0007933 0.0002734 0.05 No 9 0 No 0.01 Param.
Thallium (mg/L) 1502-D 0.00005622 0.00001898 0.002 No 10 0 No 0.01 Param.
Thallium (mg/L) 1502-I 0.0004872 0.000152 0.002 No 10 0 No 0.01 Param.
Thallium (mg/L) 1502-S 0.0003058 0.0001516 0.002 No 10 0 No 0.01 Param.
Thallium (mg/L) 1503-D 0.0006683 0.0003611 0.002 No 10 0 No 0.01 Param.
Thallium (mg/L) 1503-I 0.00003676 0.00001124 0.002 No 10 10 No 0.01 Param.
Thallium (mg/L) 1503-S 0.00222 0.000279 0.002 No 10 0 sqrt(x) 0.01 Param.
Thallium (mg/L) 1504-D 0.00005 0.00001 0.002 No 10 30 No 0.011 NP (normality)
Thallium (mg/L) 1504-I 0.00005 0.00001 0.002 No 10 40 No 0.011 NP (normality)
Thallium (mg/L) 1505-D 0.0002851 0.0001017 0.002 No 10 0 No 0.01 Param.
Thallium (mg/L) 1505-I 0.0002401 0.00003338 0.002 No 10 0 ln(x) 0.01 Param.
Thallium (mg/L) 1505-S 0.0003643 0.0001979 0.002 No 10 0 No 0.01 Param.
Thallium (mg/L) BAP-0901 0.00004067 0.00001511 0.002 No 9 0 No 0.01 Param.
Confidence Intervals - All ResultsConesville BAP Client: Geosyntec Data: Conesville BAP Printed 11/16/2018, 12:04 PM

0
0.0014
0.0028
0.0042
0.0056
0.007
Parametric and Non-Parametric (NP) Confidence Interval
Compliance Limit is not exceeded. Per-well alpha = 0.01 except as noted. Normality Test: Shapiro Wilk, alpha based on n.
Constituent: Antimony Analysis Run 11/16/2018 12:01 PM View: Confidence Intervals - App IV
Conesville BAP Client: Geosyntec Data: Conesville BAP
Sanitas™ v.9.6.11e Sanitas software utilized by Groundwater Stats Consulting. UG
mg
/L
1502-D
n=101502-I
n=10 sqrt(x)
1502-Sn=10 NP(norm
ality) α=0.011
1503-D
n=101503-I
n=10 NP(normality) α=0.011
1503-Sn=10 sqrt(x)
1504-Dn=10 NP(norm
ality) α=0.011
1504-I
n=10 NP(normality) α=0.011
1505-Dn=10 sqrt(x)
1505-I
n=101505-S
n=10 sqrt(x)
BAP-0901
n=9 x^2
————————————————————————————————————————————————————————————————Limit = 0.006
0
0.08
0.16
0.24
0.32
0.4
Parametric and Non-Parametric (NP) Confidence Interval
Compliance limit is exceeded.* Per-well alpha = 0.01 except as noted. Normality Test: Shapiro Wilk, alpha based on n.
Constituent: Arsenic Analysis Run 11/16/2018 12:02 PM View: Confidence Intervals - App IV
Conesville BAP Client: Geosyntec Data: Conesville BAP
Sanitas™ v.9.6.11e Sanitas software utilized by Groundwater Stats Consulting. UG
mg
/L
n=10n=10 NP(norm
ality) α=0.011
n=101503-D
n=10n=10
n=10n=10 x^2
n=101505-D
n=91505-I
n=10 sqrt(x)
1505-Sn=10 sqrt(x)
BAP-0901
n=9
————————————————————————————————————————————————————————————————Limit = 0.016
0
0.6
1.2
1.8
2.4
3
Parametric and Non-Parametric (NP) Confidence Interval
Compliance Limit is not exceeded. Per-well alpha = 0.01 except as noted. Normality Test: Shapiro Wilk, alpha based on n.
Constituent: Barium Analysis Run 11/16/2018 12:02 PM View: Confidence Intervals - App IV
Conesville BAP Client: Geosyntec Data: Conesville BAP
Sanitas™ v.9.6.11e Sanitas software utilized by Groundwater Stats Consulting. UG
mg
/L
1502-D
n=101502-I
n=101502-S
n=10 ln(x)
1503-D
n=101503-I
n=101503-S
n=101504-D
n=101504-I
n=101505-D
n=101505-I
n=10 NP(normality) α=0.011
1505-S
n=10BAP-0901
n=9
————————————————————————————————————————————————————————————————Limit = 2
0
0.0016
0.0032
0.0048
0.0064
0.008
Parametric and Non-Parametric (NP) Confidence Interval
Compliance Limit is not exceeded. Per-well alpha = 0.01 except as noted. Normality Test: Shapiro Wilk, alpha based on n.
Constituent: Beryllium Analysis Run 11/16/2018 12:02 PM View: Confidence Intervals - App IV
Conesville BAP Client: Geosyntec Data: Conesville BAP
Sanitas™ v.9.6.11e Sanitas software utilized by Groundwater Stats Consulting. UG
mg
/L
1502-D
n=10 ln(x)
1502-I
n=10 sqrt(x)
1502-S
n=10 ln(x)
1503-D
n=101503-I
n=10 ln(x)
1503-S
n=101504-D
n=10 NP(normality) α=0.011
1504-I
n=10 NP(normality) α=0.011
1505-D
n=101505-I
n=91505-S
n=10 NP(normality) α=0.011
BAP-0901
n=9
————————————————————————————————————————————————————————————————Limit = 0.004

0
0.0012
0.0024
0.0036
0.0048
0.006
Parametric and Non-Parametric (NP) Confidence Interval
Compliance Limit is not exceeded. Per-well alpha = 0.01 except as noted. Normality Test: Shapiro Wilk, alpha based on n.
Constituent: Cadmium Analysis Run 11/16/2018 12:02 PM View: Confidence Intervals - App IV
Conesville BAP Client: Geosyntec Data: Conesville BAP
Sanitas™ v.9.6.11e Sanitas software utilized by Groundwater Stats Consulting. UG
mg
/L
1502-Dn=10 NP(norm
ality) α=0.011
1502-I
n=10 x^(1/3)
1502-Sn=10 NP(norm
ality) α=0.011
1503-D
n=101503-I
n=10 NP(normality) α=0.011
1503-S
n=101504-D
n=10 NP(normality) α=0.011
1504-I
n=10 NP(normality) α=0.011
1505-D
n=101505-I
n=91505-S
n=10BAP-0901
n=9
————————————————————————————————————————————————————————————————Limit = 0.005
0
0.03
0.06
0.09
0.12
0.15
Parametric and Non-Parametric (NP) Confidence Interval
Compliance Limit is not exceeded. Per-well alpha = 0.01 except as noted. Normality Test: Shapiro Wilk, alpha based on n.
Constituent: Chromium Analysis Run 11/16/2018 12:02 PM View: Confidence Intervals - App IV
Conesville BAP Client: Geosyntec Data: Conesville BAP
Sanitas™ v.9.6.11e Sanitas software utilized by Groundwater Stats Consulting. UG
mg
/L
1502-D
n=101502-I
n=10 sqrt(x)
1502-Sn=10 sqrt(x)
1503-D
n=101503-I
n=101503-S
n=101504-D
n=91504-I
n=10 NP(normality) α=0.011
1505-D
n=101505-I
n=91505-S
n=10BAP-0901
n=9
————————————————————————————————————————————————————————————————Limit = 0.1
0
0.016
0.032
0.048
0.064
0.08
Parametric and Non-Parametric (NP) Confidence Interval
Compliance Limit is not exceeded. Per-well alpha = 0.01 except as noted. Normality Test: Shapiro Wilk, alpha based on n.
Constituent: Cobalt Analysis Run 11/16/2018 12:02 PM View: Confidence Intervals - App IV
Conesville BAP Client: Geosyntec Data: Conesville BAP
Sanitas™ v.9.6.11e Sanitas software utilized by Groundwater Stats Consulting. UG
mg
/L
1502-D
n=101502-I
n=10 sqrt(x)
1502-Sn=10 NP(norm
ality) α=0.011
1503-D
n=101503-I
n=101503-S
n=101504-D
n=10 NP(normality) α=0.011
1504-I
n=101505-D
n=101505-I
n=10 NP(normality) α=0.011
1505-S
n=10 ln(x)
BAP-0901
n=9
————————————————————————————————————————————————————————————————Limit = 0.073
0
1.2
2.4
3.6
4.8
6
Parametric and Non-Parametric (NP) Confidence Interval
Compliance Limit is not exceeded. Per-well alpha = 0.01 except as noted. Normality Test: Shapiro Wilk, alpha based on n.
Constituent: Combined radium 226 + 228 Analysis Run 11/16/2018 12:02 PM View: Confidence Intervals -
Conesville BAP Client: Geosyntec Data: Conesville BAP
Sanitas™ v.9.6.11e Sanitas software utilized by Groundwater Stats Consulting. UG
pC
i/L
1502-D
n=101502-I
n=10 NP(normality) α=0.011
1502-S
n=101503-D
n=101503-I
n=101503-S
n=10 sqrt(x)
1504-D
n=101504-I
n=101505-D
n=101505-I
n=101505-S
n=10BAP-0901
n=9
————————————————————————————————————————————————————————————————Limit = 5

0
1
2
3
4
5
Parametric and Non-Parametric (NP) Confidence Interval
Compliance Limit is not exceeded. Per-well alpha = 0.01 except as noted. Normality Test: Shapiro Wilk, alpha based on n.
Constituent: Fluoride Analysis Run 11/16/2018 12:02 PM View: Confidence Intervals - App IV
Conesville BAP Client: Geosyntec Data: Conesville BAP
Sanitas™ v.9.6.11e Sanitas software utilized by Groundwater Stats Consulting. UG
mg
/L
1502-D
n=111502-I
n=111502-S
n=111503-D
n=111503-I
n=111503-S
n=111504-D
n=111504-I
n=111505-D
n=111505-I
n=111505-S
n=11 NP(normality) α=0.006
BAP-0901
n=10 NP(normality) α=0.011
————————————————————————————————————————————————————————————————Limit = 4
0
0.008
0.016
0.024
0.032
0.04
Parametric and Non-Parametric (NP) Confidence Interval
Compliance Limit is not exceeded. Per-well alpha = 0.01 except as noted. Normality Test: Shapiro Wilk, alpha based on n.
Constituent: Lead Analysis Run 11/16/2018 12:02 PM View: Confidence Intervals - App IV
Conesville BAP Client: Geosyntec Data: Conesville BAP
Sanitas™ v.9.6.11e Sanitas software utilized by Groundwater Stats Consulting. UG
mg
/L
1502-Dn=10 sqrt(x)
1502-I
n=10 sqrt(x)
1502-S
n=10 x^(1/3)
1503-D
n=101503-I
n=101503-S
n=101504-D
n=10 sqrt(x)
1504-I
n=10 sqrt(x)
1505-D
n=101505-I
n=91505-S
n=10 NP(normality) α=0.011
BAP-0901
n=9
————————————————————————————————————————————————————————————————Limit = 0.015
0
0.06
0.12
0.18
0.24
0.3
Parametric and Non-Parametric (NP) Confidence Interval
Compliance limit is exceeded.* Per-well alpha = 0.01 except as noted. Normality Test: Shapiro Wilk, alpha based on n.
Constituent: Lithium Analysis Run 11/16/2018 12:02 PM View: Confidence Intervals - App IV
Conesville BAP Client: Geosyntec Data: Conesville BAP
Sanitas™ v.9.6.11e Sanitas software utilized by Groundwater Stats Consulting. UG
mg
/L
n=10n=10 x^2
n=10n=10
n=10n=10 NP(norm
ality) α=0.011
n=10n=10
n=10 NP(normality) α=0.011
n=10n=10
BAP-0901
n=9
————————————————————————————————————————————————————————————————Limit = 0.08
0
0.0006
0.0012
0.0018
0.0024
0.003
Parametric and Non-Parametric (NP) Confidence Interval
Compliance Limit is not exceeded. Per-well alpha = 0.01 except as noted. Normality Test: Shapiro Wilk, alpha based on n.
Constituent: Mercury Analysis Run 11/16/2018 12:02 PM View: Confidence Intervals - App IV
Conesville BAP Client: Geosyntec Data: Conesville BAP
Sanitas™ v.9.6.11e Sanitas software utilized by Groundwater Stats Consulting. UG
mg
/L
1502-Dn=10 NP(norm
ality) α=0.011
1502-I
n=10 sqrt(x)
1502-Sn=10 NP(norm
ality) α=0.011
1503-D
n=101503-I
n=9 NP(normality) α=0.002
1503-S
n=10 x^(1/3)
1504-Dn=10 NP(norm
ality) α=0.011
1504-I
n=10 NP(normality) α=0.011
1505-Dn=10 x^(1/3)
1505-I
n=9 sqrt(x)
1505-Sn=10 NP(norm
ality) α=0.011
BAP-0901
n=9 sqrt(x)
————————————————————————————————————————————————————————————————Limit = 0.002

0
0.16
0.32
0.48
0.64
0.8
Parametric Confidence Interval
Compliance limit is exceeded.* Per-well alpha = 0.01. Normality Test: Shapiro Wilk, alpha based on n.
Constituent: Molybdenum Analysis Run 11/16/2018 12:02 PM View: Confidence Intervals - App IV
Conesville BAP Client: Geosyntec Data: Conesville BAP
Sanitas™ v.9.6.11e Sanitas software utilized by Groundwater Stats Consulting. UG
mg
/L
n=10n=10
n=10n=10
n=10n=10 x^2
n=101504-I
n=101505-D
n=101505-I
n=101505-S
n=10BAP-0901
n=9
————————————————————————————————————————————————————————————————Limit = 0.1
0
0.012
0.024
0.036
0.048
0.06
Parametric and Non-Parametric (NP) Confidence Interval
Compliance Limit is not exceeded. Per-well alpha = 0.01 except as noted. Normality Test: Shapiro Wilk, alpha based on n.
Constituent: Selenium Analysis Run 11/16/2018 12:02 PM View: Confidence Intervals - App IV
Conesville BAP Client: Geosyntec Data: Conesville BAP
Sanitas™ v.9.6.11e Sanitas software utilized by Groundwater Stats Consulting. UG
mg
/L
1502-Dn=10 NP(norm
ality) α=0.011
1502-I
n=10 ln(x)
1502-Sn=10 NP(norm
ality) α=0.011
1503-D
n=101503-I
n=101503-S
n=101504-D
n=101504-I
n=9 NP(normality) α=0.002
1505-D
n=101505-I
n=9 NP(normality) α=0.002
1505-S
n=10 ln(x)
BAP-0901
n=9
————————————————————————————————————————————————————————————————Limit = 0.05
0
0.0008
0.0016
0.0024
0.0032
0.004
Parametric and Non-Parametric (NP) Confidence Interval
Compliance Limit is not exceeded. Per-well alpha = 0.01 except as noted. Normality Test: Shapiro Wilk, alpha based on n.
Constituent: Thallium Analysis Run 11/16/2018 12:02 PM View: Confidence Intervals - App IV
Conesville BAP Client: Geosyntec Data: Conesville BAP
Sanitas™ v.9.6.11e Sanitas software utilized by Groundwater Stats Consulting. UG
mg
/L
1502-D
n=101502-I
n=101502-S
n=101503-D
n=101503-I
n=101503-S
n=10 sqrt(x)
1504-Dn=10 NP(norm
ality) α=0.011
1504-I
n=10 NP(normality) α=0.011
1505-D
n=101505-I
n=10 ln(x)
1505-S
n=10BAP-0901
n=9
————————————————————————————————————————————————————————————————Limit = 0.002