statistical appendix - unece.org · statistical appendix_____117 appendix table a.1 real gdp in...
TRANSCRIPT

_________________________________________________________________________________________________ 115
STATISTICAL APPENDIX
For the user’s convenience, as well as to lighten the text, the Economic Survey of Europe includes a set of appendix tables showing time series for main economic indicators over a longer period. The data are presented in two sections: Appendix A provides macroeconomic indicators for the market economies in western Europe and the 10 new EU member states, which joined the European Union at the beginning of May 2004, as well as North America and Japan. Appendix B provides comparative macroeconomic indicators for the south-east European countries and the Commonwealth of Independent States. For all countries, national accounts data for more recent years may be subject to revision as more comprehensive benchmark figures become available.
Data were compiled from international and national statistical sources. Regional aggregates are UNECE secretariat calculations using PPPs. Greece, which became a member of the euro area at the beginning of 2001, has been included in the euro area aggregates for all years shown in the appendix tables in order to ensure continuity of time series.
The figures for 2004 are based on data available in mid-December 2004.


Statistical Appendix_________________________________________________________________________________ 117
APPENDIX TABLE A.1
Real GDP in Europe, North America and Japan, 1989-2003 (Percentage change over the preceding year)
1989 1990 1991 1992 1993 1994 1995 1996 1997 1998 1999 2000 2001 2002 2003
France ..................................... 4.2 2.6 1.0 1.5 -0.9 2.1 1.7 1.1 1.9 3.4 3.2 3.8 2.1 1.2 0.5 Germany a ............................... 3.9 5.7 5.1 2.2 -1.1 2.3 1.7 0.8 1.4 2.0 2.0 2.9 0.8 0.1 -0.1 Italy ......................................... 2.9 2.0 1.4 0.8 -0.9 2.2 2.9 1.1 2.0 1.8 1.7 3.0 1.8 0.4 0.3 Austria ..................................... 3.5 4.6 3.6 2.4 0.3 2.7 1.9 2.6 1.8 3.6 3.3 3.4 0.7 1.2 0.8 Belgium ................................... 3.5 3.1 1.8 1.5 -1.0 3.2 2.4 1.2 3.5 2.0 3.2 3.9 0.7 0.9 1.3 Finland .................................... 4.8 -0.3 -6.4 -3.8 -1.2 3.9 3.4 3.9 6.3 5.0 3.4 5.1 1.1 2.3 1.9 Greece .................................... 3.8 – 3.1 0.7 -1.6 2.0 2.1 2.4 3.6 3.4 3.4 4.5 4.3 3.6 4.5 Ireland ..................................... 5.8 8.5 1.9 3.3 2.7 5.8 9.8 8.1 10.8 8.9 11.1 9.9 6.0 6.1 3.7 Luxembourg ............................ 9.8 5.3 8.6 1.8 4.2 3.8 1.4 3.3 8.3 6.9 7.8 9.0 1.5 2.5 2.9 Netherlands ............................. 4.8 4.1 2.4 1.5 0.7 2.9 3.0 3.0 3.8 4.3 4.0 3.5 1.4 0.6 -0.9 Portugal ................................... 6.4 4.0 4.4 1.1 -2.0 1.0 4.3 3.5 4.0 4.6 3.8 3.4 1.7 0.4 -1.2 Spain ....................................... 4.8 3.8 2.5 0.9 -1.0 2.4 2.8 2.4 4.0 4.3 4.2 4.4 2.8 2.2 2.5 Euro area ............................... 4.0 3.6 2.6 1.4 -0.8 2.4 2.3 1.5 2.4 2.9 2.9 3.5 1.7 0.9 0.6
United Kingdom ...................... 2.2 0.8 -1.4 0.2 2.3 4.4 2.9 2.8 3.3 3.1 2.9 3.9 2.3 1.8 2.2 Denmark ................................. 0.2 1.0 1.1 0.6 – 5.5 2.8 2.5 3.0 2.5 2.6 2.8 1.6 1.0 0.5 Sweden ................................... 2.7 1.0 -1.1 -1.2 -2.0 4.2 4.1 1.3 2.4 3.6 4.6 4.3 1.0 2.0 1.5
EU-15 ...................................... 3.6 3.0 1.9 1.2 -0.4 2.8 2.5 1.7 2.6 2.9 2.9 3.6 1.8 1.1 0.9
Cyprus ..................................... 7.9 7.4 0.6 9.8 0.7 5.9 6.1 1.8 2.3 5.0 4.8 5.0 4.1 2.1 1.9 Czech Republic ....................... .. .. -11.6 -0.5 0.1 2.2 5.9 4.2 -0.7 -1.1 1.2 3.9 2.6 1.5 3.7 Estonia .................................... .. .. -10.0 -14.1 -8.5 -1.6 4.5 4.5 10.5 5.2 -0.1 7.8 6.4 7.2 5.1 Hungary .................................. .. .. -11.9 -3.1 -0.6 2.9 1.5 1.3 4.6 4.9 4.2 5.2 3.8 3.5 3.0 Latvia ...................................... .. .. -12.6 -32.1 -11.4 2.2 -0.9 3.8 8.3 4.7 3.3 6.9 8.0 6.4 7.5 Lithuania ................................. .. .. -5.7 -21.3 -16.2 -9.8 5.2 4.7 7.0 7.3 -1.7 3.9 6.4 6.8 9.7 Malta ....................................... 8.2 6.3 6.3 4.7 4.5 5.7 6.2 3.9 4.9 3.4 4.0 6.4 -2.4 2.6 -0.3 Poland ..................................... .. .. -7.0 2.6 3.8 5.2 7.0 6.0 6.8 4.8 4.1 4.0 1.0 1.4 3.8 Slovakia .................................. .. .. -14.6 -6.4 -3.7 6.2 5.8 6.1 4.6 4.2 1.5 2.0 3.8 4.6 4.5 Slovenia .................................. .. .. -8.9 -5.5 2.8 5.3 4.1 3.6 4.8 3.6 5.6 3.9 2.7 3.3 2.5 New EU members-10 ............ .. .. -9.6 -2.8 0.2 3.6 5.5 4.7 4.7 3.6 3.1 4.1 2.4 2.4 4.0
EU-25 ...................................... .. .. 0.9 0.9 -0.3 2.8 2.7 2.0 2.8 3.0 2.9 3.6 1.8 1.2 1.2
Iceland .................................... 0.3 1.2 0.1 -3.3 0.8 4.0 0.1 5.2 4.7 5.6 4.2 5.6 2.7 -0.5 4.0 Israel ....................................... 1.4 6.6 6.1 7.2 3.8 7.0 6.5 5.3 3.0 3.3 2.6 7.5 -0.3 -0.7 1.3 Norway .................................... 1.2 2.0 3.6 3.3 2.7 5.3 4.4 5.3 5.2 2.6 2.1 2.8 2.7 1.4 0.4 Switzerland ............................. 4.3 3.7 -0.8 – -0.2 1.1 0.4 0.5 1.9 2.8 1.3 3.6 1.0 0.3 -0.4
WECEE ................................... .. .. 0.9 0.9 -0.3 2.8 2.7 2.0 2.8 3.0 2.9 3.6 1.8 1.2 1.1
Canada ................................... 2.6 0.2 -2.1 0.9 2.3 4.8 2.8 1.6 4.2 4.1 5.5 5.2 1.8 3.4 2.0 United States .......................... 3.5 1.8 -0.2 3.3 2.7 4.0 2.5 3.7 4.5 4.2 4.4 3.7 0.8 1.9 3.0 North America ....................... 3.4 1.6 -0.3 3.1 2.6 4.1 2.5 3.5 4.5 4.2 4.5 3.8 0.8 2.0 3.0
Japan ...................................... 5.3 5.2 3.4 1.0 0.2 1.1 2.0 3.4 1.8 -1.0 -0.1 2.4 0.2 -0.3 1.3
Europe, North America and Japan .................................... .. .. 0.7 1.8 1.0 3.1 2.5 2.8 3.3 2.9 3.2 3.5 1.2 1.3 1.9
Memorandum items: EU-8 b ..................................... .. .. -9.7 -2.9 0.2 3.5 5.5 4.7 4.7 3.6 3.1 4.1 2.4 2.4 4.0 Western Europe .................... 3.6 3.0 1.8 1.2 -0.3 2.8 2.4 1.8 2.6 2.9 2.9 3.6 1.8 1.1 0.9 Western Europe and North America ................................ 3.5 2.3 0.7 2.1 1.2 3.4 2.5 2.7 3.6 3.6 3.7 3.7 1.3 1.6 2.0
Source: Eurostat, NewCronos Database; OECD, National Accounts (Paris), various issues; national statistics. Note: Excluding south-east Europe and the European CIS countries. The same proviso applies through appendix table A.11. Statistical data for south-east Europe
and the CIS are provided in the second part of this appendix. All aggregates exclude Israel. Growth rates of regional aggregates have been calculated from national data at constant prices of 2000 converted into dollars using purchasing power parities.
a West Germany, 1989-1991. b Czech Republic, Estonia, Hungary, Latvia, Lithuania, Poland, Slovakia and Slovenia.
118 ________________________________________________________________ Economic Survey of Europe, 2005 No. 1
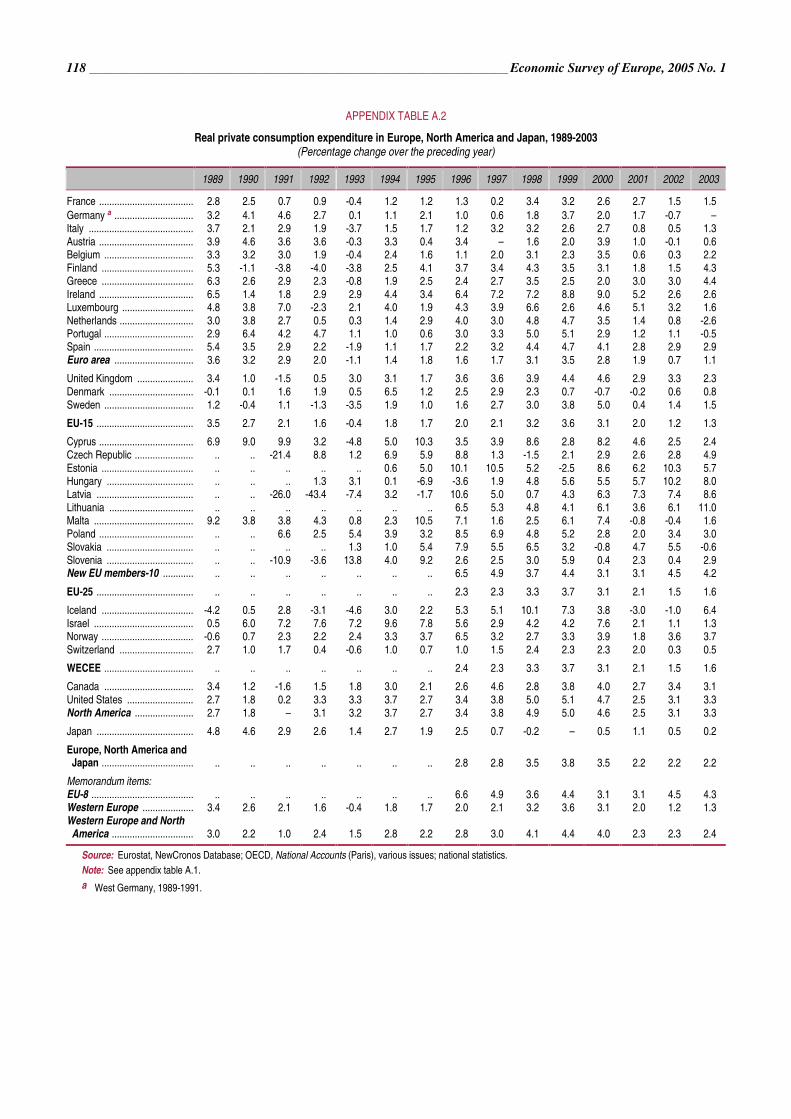
APPENDIX TABLE A.2
Real private consumption expenditure in Europe, North America and Japan, 1989-2003 (Percentage change over the preceding year)
1989 1990 1991 1992 1993 1994 1995 1996 1997 1998 1999 2000 2001 2002 2003
France ..................................... 2.8 2.5 0.7 0.9 -0.4 1.2 1.2 1.3 0.2 3.4 3.2 2.6 2.7 1.5 1.5 Germany a ............................... 3.2 4.1 4.6 2.7 0.1 1.1 2.1 1.0 0.6 1.8 3.7 2.0 1.7 -0.7 – Italy ......................................... 3.7 2.1 2.9 1.9 -3.7 1.5 1.7 1.2 3.2 3.2 2.6 2.7 0.8 0.5 1.3 Austria ..................................... 3.9 4.6 3.6 3.6 -0.3 3.3 0.4 3.4 – 1.6 2.0 3.9 1.0 -0.1 0.6 Belgium ................................... 3.3 3.2 3.0 1.9 -0.4 2.4 1.6 1.1 2.0 3.1 2.3 3.5 0.6 0.3 2.2 Finland .................................... 5.3 -1.1 -3.8 -4.0 -3.8 2.5 4.1 3.7 3.4 4.3 3.5 3.1 1.8 1.5 4.3 Greece .................................... 6.3 2.6 2.9 2.3 -0.8 1.9 2.5 2.4 2.7 3.5 2.5 2.0 3.0 3.0 4.4 Ireland ..................................... 6.5 1.4 1.8 2.9 2.9 4.4 3.4 6.4 7.2 7.2 8.8 9.0 5.2 2.6 2.6 Luxembourg ............................ 4.8 3.8 7.0 -2.3 2.1 4.0 1.9 4.3 3.9 6.6 2.6 4.6 5.1 3.2 1.6 Netherlands ............................. 3.0 3.8 2.7 0.5 0.3 1.4 2.9 4.0 3.0 4.8 4.7 3.5 1.4 0.8 -2.6 Portugal ................................... 2.9 6.4 4.2 4.7 1.1 1.0 0.6 3.0 3.3 5.0 5.1 2.9 1.2 1.1 -0.5 Spain ....................................... 5.4 3.5 2.9 2.2 -1.9 1.1 1.7 2.2 3.2 4.4 4.7 4.1 2.8 2.9 2.9 Euro area ............................... 3.6 3.2 2.9 2.0 -1.1 1.4 1.8 1.6 1.7 3.1 3.5 2.8 1.9 0.7 1.1
United Kingdom ...................... 3.4 1.0 -1.5 0.5 3.0 3.1 1.7 3.6 3.6 3.9 4.4 4.6 2.9 3.3 2.3 Denmark ................................. -0.1 0.1 1.6 1.9 0.5 6.5 1.2 2.5 2.9 2.3 0.7 -0.7 -0.2 0.6 0.8 Sweden ................................... 1.2 -0.4 1.1 -1.3 -3.5 1.9 1.0 1.6 2.7 3.0 3.8 5.0 0.4 1.4 1.5
EU-15 ...................................... 3.5 2.7 2.1 1.6 -0.4 1.8 1.7 2.0 2.1 3.2 3.6 3.1 2.0 1.2 1.3
Cyprus ..................................... 6.9 9.0 9.9 3.2 -4.8 5.0 10.3 3.5 3.9 8.6 2.8 8.2 4.6 2.5 2.4 Czech Republic ....................... .. .. -21.4 8.8 1.2 6.9 5.9 8.8 1.3 -1.5 2.1 2.9 2.6 2.8 4.9 Estonia .................................... .. .. .. .. .. 0.6 5.0 10.1 10.5 5.2 -2.5 8.6 6.2 10.3 5.7 Hungary .................................. .. .. .. 1.3 3.1 0.1 -6.9 -3.6 1.9 4.8 5.6 5.5 5.7 10.2 8.0 Latvia ...................................... .. .. -26.0 -43.4 -7.4 3.2 -1.7 10.6 5.0 0.7 4.3 6.3 7.3 7.4 8.6 Lithuania ................................. .. .. .. .. .. .. .. 6.5 5.3 4.8 4.1 6.1 3.6 6.1 11.0 Malta ....................................... 9.2 3.8 3.8 4.3 0.8 2.3 10.5 7.1 1.6 2.5 6.1 7.4 -0.8 -0.4 1.6 Poland ..................................... .. .. 6.6 2.5 5.4 3.9 3.2 8.5 6.9 4.8 5.2 2.8 2.0 3.4 3.0 Slovakia .................................. .. .. .. .. 1.3 1.0 5.4 7.9 5.5 6.5 3.2 -0.8 4.7 5.5 -0.6 Slovenia .................................. .. .. -10.9 -3.6 13.8 4.0 9.2 2.6 2.5 3.0 5.9 0.4 2.3 0.4 2.9 New EU members-10 ............ .. .. .. .. .. .. .. 6.5 4.9 3.7 4.4 3.1 3.1 4.5 4.2
EU-25 ...................................... .. .. .. .. .. .. .. 2.3 2.3 3.3 3.7 3.1 2.1 1.5 1.6
Iceland .................................... -4.2 0.5 2.8 -3.1 -4.6 3.0 2.2 5.3 5.1 10.1 7.3 3.8 -3.0 -1.0 6.4 Israel ....................................... 0.5 6.0 7.2 7.6 7.2 9.6 7.8 5.6 2.9 4.2 4.2 7.6 2.1 1.1 1.3 Norway .................................... -0.6 0.7 2.3 2.2 2.4 3.3 3.7 6.5 3.2 2.7 3.3 3.9 1.8 3.6 3.7 Switzerland ............................. 2.7 1.0 1.7 0.4 -0.6 1.0 0.7 1.0 1.5 2.4 2.3 2.3 2.0 0.3 0.5
WECEE ................................... .. .. .. .. .. .. .. 2.4 2.3 3.3 3.7 3.1 2.1 1.5 1.6
Canada ................................... 3.4 1.2 -1.6 1.5 1.8 3.0 2.1 2.6 4.6 2.8 3.8 4.0 2.7 3.4 3.1 United States .......................... 2.7 1.8 0.2 3.3 3.3 3.7 2.7 3.4 3.8 5.0 5.1 4.7 2.5 3.1 3.3 North America ....................... 2.7 1.8 – 3.1 3.2 3.7 2.7 3.4 3.8 4.9 5.0 4.6 2.5 3.1 3.3
Japan ...................................... 4.8 4.6 2.9 2.6 1.4 2.7 1.9 2.5 0.7 -0.2 – 0.5 1.1 0.5 0.2
Europe, North America and Japan .................................... .. .. .. .. .. .. .. 2.8 2.8 3.5 3.8 3.5 2.2 2.2 2.2
Memorandum items: EU-8 ........................................ .. .. .. .. .. .. .. 6.6 4.9 3.6 4.4 3.1 3.1 4.5 4.3 Western Europe .................... 3.4 2.6 2.1 1.6 -0.4 1.8 1.7 2.0 2.1 3.2 3.6 3.1 2.0 1.2 1.3 Western Europe and North America ................................ 3.0 2.2 1.0 2.4 1.5 2.8 2.2 2.8 3.0 4.1 4.4 4.0 2.3 2.3 2.4
Source: Eurostat, NewCronos Database; OECD, National Accounts (Paris), various issues; national statistics. Note: See appendix table A.1. a West Germany, 1989-1991.
Statistical Appendix_________________________________________________________________________________ 119
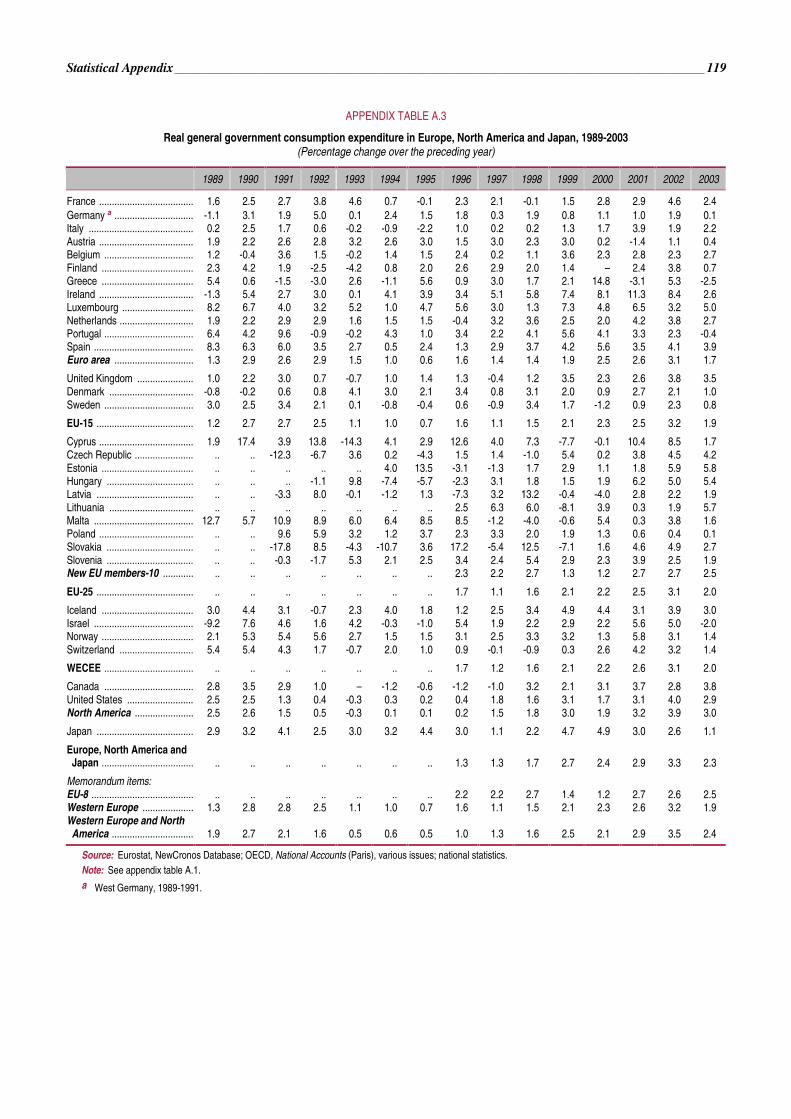
APPENDIX TABLE A.3
Real general government consumption expenditure in Europe, North America and Japan, 1989-2003 (Percentage change over the preceding year)
1989 1990 1991 1992 1993 1994 1995 1996 1997 1998 1999 2000 2001 2002 2003
France ..................................... 1.6 2.5 2.7 3.8 4.6 0.7 -0.1 2.3 2.1 -0.1 1.5 2.8 2.9 4.6 2.4 Germany a ............................... -1.1 3.1 1.9 5.0 0.1 2.4 1.5 1.8 0.3 1.9 0.8 1.1 1.0 1.9 0.1 Italy ......................................... 0.2 2.5 1.7 0.6 -0.2 -0.9 -2.2 1.0 0.2 0.2 1.3 1.7 3.9 1.9 2.2 Austria ..................................... 1.9 2.2 2.6 2.8 3.2 2.6 3.0 1.5 3.0 2.3 3.0 0.2 -1.4 1.1 0.4 Belgium ................................... 1.2 -0.4 3.6 1.5 -0.2 1.4 1.5 2.4 0.2 1.1 3.6 2.3 2.8 2.3 2.7 Finland .................................... 2.3 4.2 1.9 -2.5 -4.2 0.8 2.0 2.6 2.9 2.0 1.4 – 2.4 3.8 0.7 Greece .................................... 5.4 0.6 -1.5 -3.0 2.6 -1.1 5.6 0.9 3.0 1.7 2.1 14.8 -3.1 5.3 -2.5 Ireland ..................................... -1.3 5.4 2.7 3.0 0.1 4.1 3.9 3.4 5.1 5.8 7.4 8.1 11.3 8.4 2.6 Luxembourg ............................ 8.2 6.7 4.0 3.2 5.2 1.0 4.7 5.6 3.0 1.3 7.3 4.8 6.5 3.2 5.0 Netherlands ............................. 1.9 2.2 2.9 2.9 1.6 1.5 1.5 -0.4 3.2 3.6 2.5 2.0 4.2 3.8 2.7 Portugal ................................... 6.4 4.2 9.6 -0.9 -0.2 4.3 1.0 3.4 2.2 4.1 5.6 4.1 3.3 2.3 -0.4 Spain ....................................... 8.3 6.3 6.0 3.5 2.7 0.5 2.4 1.3 2.9 3.7 4.2 5.6 3.5 4.1 3.9 Euro area ............................... 1.3 2.9 2.6 2.9 1.5 1.0 0.6 1.6 1.4 1.4 1.9 2.5 2.6 3.1 1.7
United Kingdom ...................... 1.0 2.2 3.0 0.7 -0.7 1.0 1.4 1.3 -0.4 1.2 3.5 2.3 2.6 3.8 3.5 Denmark ................................. -0.8 -0.2 0.6 0.8 4.1 3.0 2.1 3.4 0.8 3.1 2.0 0.9 2.7 2.1 1.0 Sweden ................................... 3.0 2.5 3.4 2.1 0.1 -0.8 -0.4 0.6 -0.9 3.4 1.7 -1.2 0.9 2.3 0.8
EU-15 ...................................... 1.2 2.7 2.7 2.5 1.1 1.0 0.7 1.6 1.1 1.5 2.1 2.3 2.5 3.2 1.9
Cyprus ..................................... 1.9 17.4 3.9 13.8 -14.3 4.1 2.9 12.6 4.0 7.3 -7.7 -0.1 10.4 8.5 1.7 Czech Republic ....................... .. .. -12.3 -6.7 3.6 0.2 -4.3 1.5 1.4 -1.0 5.4 0.2 3.8 4.5 4.2 Estonia .................................... .. .. .. .. .. 4.0 13.5 -3.1 -1.3 1.7 2.9 1.1 1.8 5.9 5.8 Hungary .................................. .. .. .. -1.1 9.8 -7.4 -5.7 -2.3 3.1 1.8 1.5 1.9 6.2 5.0 5.4 Latvia ...................................... .. .. -3.3 8.0 -0.1 -1.2 1.3 -7.3 3.2 13.2 -0.4 -4.0 2.8 2.2 1.9 Lithuania ................................. .. .. .. .. .. .. .. 2.5 6.3 6.0 -8.1 3.9 0.3 1.9 5.7 Malta ....................................... 12.7 5.7 10.9 8.9 6.0 6.4 8.5 8.5 -1.2 -4.0 -0.6 5.4 0.3 3.8 1.6 Poland ..................................... .. .. 9.6 5.9 3.2 1.2 3.7 2.3 3.3 2.0 1.9 1.3 0.6 0.4 0.1 Slovakia .................................. .. .. -17.8 8.5 -4.3 -10.7 3.6 17.2 -5.4 12.5 -7.1 1.6 4.6 4.9 2.7 Slovenia .................................. .. .. -0.3 -1.7 5.3 2.1 2.5 3.4 2.4 5.4 2.9 2.3 3.9 2.5 1.9 New EU members-10 ............ .. .. .. .. .. .. .. 2.3 2.2 2.7 1.3 1.2 2.7 2.7 2.5
EU-25 ...................................... .. .. .. .. .. .. .. 1.7 1.1 1.6 2.1 2.2 2.5 3.1 2.0
Iceland .................................... 3.0 4.4 3.1 -0.7 2.3 4.0 1.8 1.2 2.5 3.4 4.9 4.4 3.1 3.9 3.0 Israel ....................................... -9.2 7.6 4.6 1.6 4.2 -0.3 -1.0 5.4 1.9 2.2 2.9 2.2 5.6 5.0 -2.0 Norway .................................... 2.1 5.3 5.4 5.6 2.7 1.5 1.5 3.1 2.5 3.3 3.2 1.3 5.8 3.1 1.4 Switzerland ............................. 5.4 5.4 4.3 1.7 -0.7 2.0 1.0 0.9 -0.1 -0.9 0.3 2.6 4.2 3.2 1.4
WECEE ................................... .. .. .. .. .. .. .. 1.7 1.2 1.6 2.1 2.2 2.6 3.1 2.0
Canada ................................... 2.8 3.5 2.9 1.0 – -1.2 -0.6 -1.2 -1.0 3.2 2.1 3.1 3.7 2.8 3.8 United States .......................... 2.5 2.5 1.3 0.4 -0.3 0.3 0.2 0.4 1.8 1.6 3.1 1.7 3.1 4.0 2.9 North America ....................... 2.5 2.6 1.5 0.5 -0.3 0.1 0.1 0.2 1.5 1.8 3.0 1.9 3.2 3.9 3.0
Japan ...................................... 2.9 3.2 4.1 2.5 3.0 3.2 4.4 3.0 1.1 2.2 4.7 4.9 3.0 2.6 1.1
Europe, North America and Japan .................................... .. .. .. .. .. .. .. 1.3 1.3 1.7 2.7 2.4 2.9 3.3 2.3
Memorandum items: EU-8 ........................................ .. .. .. .. .. .. .. 2.2 2.2 2.7 1.4 1.2 2.7 2.6 2.5 Western Europe .................... 1.3 2.8 2.8 2.5 1.1 1.0 0.7 1.6 1.1 1.5 2.1 2.3 2.6 3.2 1.9 Western Europe and North America ................................ 1.9 2.7 2.1 1.6 0.5 0.6 0.5 1.0 1.3 1.6 2.5 2.1 2.9 3.5 2.4
Source: Eurostat, NewCronos Database; OECD, National Accounts (Paris), various issues; national statistics. Note: See appendix table A.1. a West Germany, 1989-1991.

120 ________________________________________________________________ Economic Survey of Europe, 2005 No. 1
APPENDIX TABLE A.4
Real gross domestic fixed capital formation in Europe, North America and Japan, 1989-2003 (Percentage change over the preceding year)
1989 1990 1991 1992 1993 1994 1995 1996 1997 1998 1999 2000 2001 2002 2003
France ..................................... 7.3 3.3 -1.5 -1.6 -6.4 1.5 2.0 – -0.1 7.0 8.3 7.8 1.9 -1.6 -0.2 Germany a ............................... 6.7 7.7 5.2 4.5 -4.4 4.0 -0.6 -0.8 0.6 3.0 4.1 2.7 -4.2 -6.4 -2.2 Italy ......................................... 4.2 4.0 1.0 -1.4 -10.9 0.1 6.0 3.6 2.1 4.0 5.0 6.9 1.9 1.2 -2.1 Austria ..................................... 4.2 5.2 8.1 0.2 -1.2 5.2 -1.0 2.6 1.4 3.5 2.3 6.5 -2.1 -3.4 6.2 Belgium ................................... 11.8 8.6 -4.1 1.1 -2.5 0.4 3.4 0.9 7.1 3.3 4.4 4.4 0.3 -3.7 -0.9 Finland .................................... 12.5 -4.6 -18.5 -16.4 -15.2 -3.6 11.2 6.7 13.8 8.4 2.5 4.1 3.9 -3.1 -2.3 Greece .................................... 6.1 4.5 4.2 -3.5 -4.0 -3.1 4.1 8.4 6.8 10.6 11.0 8.0 6.5 5.7 13.7 Ireland ..................................... 10.1 13.4 -7.0 – -5.1 11.8 15.8 17.4 18.0 15.5 15.1 7.6 -1.5 2.8 3.6 Luxembourg ............................ 6.9 3.4 15.8 -15.1 20.6 – -1.5 3.8 12.7 11.8 14.6 -3.5 10.0 -1.1 -6.3 Netherlands ............................. 5.2 2.6 0.3 0.7 -3.2 2.1 4.1 6.3 6.6 4.2 7.8 1.4 -0.1 -4.5 -3.2 Portugal ................................... 3.7 7.6 3.3 4.5 -5.5 2.7 6.6 5.7 13.9 11.5 6.4 3.8 0.8 -5.1 -9.8 Spain ....................................... 12.0 6.5 1.7 -4.1 -8.9 1.9 7.7 2.1 5.0 10.0 8.8 5.7 3.0 1.7 3.2 Euro area ............................... 7.0 5.3 1.4 – -6.4 2.1 2.9 1.7 2.8 5.6 6.2 5.1 0.1 -2.1 -0.4
United Kingdom ...................... 6.0 -2.6 -8.2 -0.9 0.3 4.7 3.1 5.7 6.8 12.7 1.6 3.6 2.6 2.7 2.2 Denmark ................................. -0.6 -2.2 -3.4 -2.1 -3.8 7.7 11.6 3.9 10.9 10.0 1.4 7.1 4.9 4.5 0.1 Sweden ................................... 12.1 0.2 -8.5 -11.3 -14.6 6.6 9.9 4.5 -0.3 7.8 8.2 5.7 -1.0 -2.6 -1.5
EU-15 ...................................... 6.9 4.0 -0.1 -0.4 -5.8 2.6 3.2 2.3 3.3 6.6 5.6 5.0 0.5 -1.4 -0.1
Cyprus ..................................... 20.0 -2.8 -1.6 16.2 -12.8 -2.5 -1.7 7.2 -4.1 7.9 -1.0 3.8 3.2 8.0 -3.4 Czech Republic ....................... .. .. -27.3 16.5 0.2 9.1 19.8 7.6 -3.4 -1.1 -3.5 4.9 5.4 3.4 4.8 Estonia .................................... .. .. .. .. .. 9.2 5.6 9.6 19.9 14.0 -15.6 14.3 13.0 17.2 5.4 Hungary .................................. .. .. -10.5 -2.6 2.0 12.5 -4.3 6.7 9.2 13.2 5.9 7.7 5.0 8.0 3.4 Latvia ...................................... .. .. -63.9 -28.7 -15.8 0.8 8.7 22.3 20.7 61.4 -6.8 10.2 11.4 13.0 10.9 Lithuania ................................. .. .. .. .. .. .. .. 15.2 24.5 21.8 -6.1 -9.0 13.5 11.1 11.4 Malta ....................................... 1.0 17.9 – -0.2 11.1 8.5 17.8 -8.4 -4.5 -3.4 4.0 17.5 -8.5 -29.6 41.4 Poland ..................................... .. .. -4.4 2.3 2.9 9.2 16.5 19.7 21.7 14.2 6.8 2.7 -8.8 -5.8 -0.5 Slovakia .................................. .. .. -25.2 -4.4 -4.2 -2.5 0.6 29.1 15.0 11.0 -19.6 -7.2 13.9 -0.6 -1.5 Slovenia .................................. .. .. -11.5 -12.9 10.7 14.1 16.8 11.3 13.5 9.9 21.0 0.6 4.1 2.6 5.4 New EU members-10 ............ .. .. .. .. .. .. .. 14.3 11.7 10.7 0.9 2.9 – 0.5 2.4
EU-25 ...................................... .. .. .. .. .. .. .. 3.3 4.1 7.0 5.1 4.8 0.4 -1.2 0.2
Iceland .................................... -7.9 3.0 3.3 -11.1 -10.7 0.6 -1.1 25.7 10.0 32.8 -3.0 14.8 -7.6 -15.1 19.0 Israel ....................................... -2.2 25.3 41.9 5.2 5.3 8.4 6.6 9.1 -1.0 -3.8 0.1 1.7 -3.1 -7.0 -4.9 Norway .................................... -6.9 -10.8 -3.0 -1.1 6.5 5.3 3.9 10.3 15.5 13.1 -5.6 -3.6 -0.7 -3.4 -3.7 Switzerland ............................. 5.3 3.8 -2.2 -8.0 -2.9 6.5 4.4 -1.7 2.0 6.5 1.2 4.3 -3.1 0.3 -0.3
WECEE ................................... .. .. .. .. .. .. .. 3.3 4.2 7.1 4.8 4.7 0.3 -1.2 0.1
Canada ................................... 5.6 -4.0 -5.5 -2.7 -2.0 7.5 -2.1 4.4 15.2 2.4 7.3 4.7 4.1 2.4 4.9 United States .......................... 2.9 -0.2 -5.1 4.8 6.0 7.3 5.7 8.1 8.0 9.1 8.2 6.1 -1.7 -3.1 4.5 North America ....................... 3.2 -0.6 -5.1 4.1 5.2 7.3 5.0 7.8 8.6 8.5 8.1 5.9 -1.3 -2.7 4.6
Japan ...................................... 8.5 7.9 2.3 -2.4 -2.8 -1.5 0.8 6.5 0.5 -3.8 -1.1 1.9 -1.4 -5.8 0.8
Europe, North America and Japan .................................... .. .. .. .. .. .. .. 5.6 5.1 5.5 5.0 4.7 -0.6 -2.6 2.0
Memorandum items: EU-8 ........................................ .. .. .. .. .. .. .. 14.6 11.9 10.7 0.9 2.9 – 0.6 2.5 Western Europe .................... 6.6 3.8 -0.2 -0.6 -5.6 2.7 3.2 2.3 3.5 6.7 5.2 4.8 0.4 -1.4 -0.1 Western Europe and North America ................................ 5.1 1.8 -2.4 1.4 -0.9 4.9 4.1 4.9 6.0 7.6 6.7 5.4 -0.5 -2.0 2.3
Source: Eurostat, NewCronos Database; OECD, National Accounts (Paris), various issues; national statistics. Note: See appendix table A.1. a West Germany, 1989-1991.

Statistical Appendix_________________________________________________________________________________ 121
APPENDIX TABLE A.5
Real total domestic expenditures in Europe, North America and Japan, 1989-2003 (Percentage change over the preceding year)
1989 1990 1991 1992 1993 1994 1995 1996 1997 1998 1999 2000 2001 2002 2003
France ..................................... 3.9 2.8 0.5 0.8 -1.6 2.1 1.6 0.7 0.7 4.0 3.6 4.1 2.0 1.5 1.2 Germany a ............................... 3.2 4.7 4.4 2.8 -1.1 2.3 1.7 0.3 0.6 2.4 2.8 1.9 -0.8 -1.9 0.5 Italy ......................................... 3.1 2.7 2.1 0.9 -5.1 1.7 2.0 0.9 2.7 3.1 3.2 2.3 1.4 1.3 1.2 Austria ..................................... 3.3 4.4 4.2 2.4 -0.4 4.1 1.8 2.7 0.6 2.3 3.0 3.0 -0.3 -0.8 2.3 Belgium ................................... 4.1 3.3 1.7 1.7 -0.9 2.4 2.1 0.9 2.7 2.7 2.5 3.7 0.4 0.5 1.7 Finland .................................... 6.3 -0.8 -7.8 -6.1 -5.4 3.0 2.7 3.8 4.8 4.2 2.0 2.5 1.8 0.6 1.8 Greece .................................... 5.3 2.2 3.5 -0.5 -1.0 1.1 3.5 3.3 3.5 4.6 3.8 5.6 2.4 4.2 5.3 Ireland ..................................... 6.9 6.3 0.2 -0.1 1.0 5.1 6.5 7.8 9.4 10.3 7.6 9.0 3.7 3.6 3.0 Luxembourg ............................ 6.4 4.7 8.6 -4.1 4.6 2.4 0.7 5.0 6.5 7.3 6.6 5.2 4.3 -0.1 2.8 Netherlands ............................. 4.8 3.2 2.0 1.3 -1.6 2.3 3.5 2.8 3.9 4.8 4.3 2.5 1.8 0.5 -0.5 Portugal ................................... 4.9 5.3 6.1 3.4 -2.1 1.5 4.1 3.0 5.1 6.7 5.9 2.9 1.6 -0.3 -2.7 Spain ....................................... 7.3 4.6 3.0 1.0 -3.3 1.5 3.1 1.9 3.5 5.7 5.6 4.6 2.9 2.8 3.2 Euro area ............................... 4.0 3.6 2.5 1.4 -2.3 2.1 2.1 1.2 1.9 3.7 3.6 3.1 1.1 0.5 1.2
United Kingdom ...................... 3.0 -0.3 -2.5 0.9 2.1 3.6 1.9 3.2 3.7 5.2 4.1 4.0 3.1 3.1 2.5 Denmark ................................. -0.1 -0.7 -0.1 0.9 -0.3 7.0 4.2 2.2 4.9 4.0 0.1 2.4 1.0 1.9 0.3 Sweden ................................... 4.0 0.7 -2.0 -1.4 -5.2 3.2 2.2 0.9 1.1 4.3 3.3 3.6 -0.3 0.7 0.9
EU-15 ...................................... 3.8 2.8 1.5 1.3 -1.7 2.4 2.1 1.5 2.2 3.9 3.6 3.2 1.4 1.0 1.4
Cyprus ..................................... 9.7 6.3 5.1 9.3 -9.5 7.4 7.8 4.1 1.1 5.6 2.1 6.1 3.2 4.7 2.3 Czech Republic ....................... .. .. -21.1 4.6 2.2 8.4 8.2 7.7 -1.0 -1.7 1.0 3.9 3.9 3.4 4.2 Estonia .................................... .. .. .. .. .. 2.0 7.3 7.0 11.8 4.5 -5.1 10.5 7.1 12.2 5.3 Hungary .................................. .. .. .. -2.8 9.0 1.3 -3.8 0.3 4.9 8.2 5.1 4.8 1.9 5.4 5.4 Latvia ...................................... .. .. -21.6 -33.1 -22.5 3.9 -1.7 7.6 5.7 11.4 2.9 3.5 11.2 6.0 11.0 Lithuania ................................. .. .. .. .. .. .. .. 6.5 10.3 8.0 -0.3 2.0 5.5 6.5 10.4 Malta ....................................... 8.1 8.2 4.8 -0.7 5.3 6.4 9.5 2.9 -0.5 -0.2 4.5 9.4 -6.1 -5.3 9.9 Poland ..................................... .. .. 0.3 0.5 6.0 4.6 6.8 9.4 9.1 6.3 4.8 2.8 -1.6 0.8 2.5 Slovakia .................................. .. .. -24.6 -4.5 -3.8 -4.5 9.9 18.2 3.7 7.2 -6.3 0.1 7.4 4.6 -2.5 Slovenia .................................. .. .. -9.5 -3.2 12.9 5.5 10.2 3.3 4.7 5.1 8.7 1.3 0.9 2.3 4.2 New EU members-10 ............ .. .. .. .. .. .. .. 7.9 5.6 5.1 3.0 3.2 1.4 2.8 3.5
EU-25 ...................................... .. .. .. .. .. .. .. 2.0 2.5 4.0 3.6 3.2 1.4 1.2 1.6
Iceland .................................... -4.2 1.5 3.8 -4.4 -3.7 2.2 2.2 6.9 5.4 13.2 4.4 6.6 -3.6 -2.7 7.9 Israel ....................................... -3.3 9.4 12.3 5.5 6.2 6.4 5.6 6.1 1.6 1.8 4.4 3.9 2.4 -0.7 -1.7 Norway .................................... -1.4 – 1.7 2.2 3.2 4.2 4.6 4.4 6.7 5.7 0.3 2.3 1.1 2.3 0.7 Switzerland ............................. 4.3 3.8 -1.1 -2.3 -0.8 2.8 1.6 0.2 0.5 4.0 0.3 2.1 2.3 -0.8 0.2
WECEE ................................... .. .. .. .. .. .. .. 2.0 2.5 4.1 3.5 3.2 1.4 1.1 1.6
Canada ................................... 4.1 -0.3 -1.9 0.5 1.5 3.3 1.8 1.3 6.1 2.5 4.2 4.7 1.3 3.7 4.6 United States .......................... 2.8 1.4 -0.7 3.3 3.2 4.3 2.4 3.7 4.7 5.3 5.3 4.4 0.9 2.5 3.3 North America ....................... 2.9 1.3 -0.8 3.0 3.1 4.2 2.3 3.5 4.8 5.0 5.2 4.4 0.9 2.6 3.4
Japan ...................................... 5.7 5.3 3.0 0.6 0.2 1.3 2.6 3.9 0.7 -1.5 – 1.9 0.8 -0.9 0.7
Europe, North America and Japan .................................... .. .. .. .. .. .. .. 2.9 3.2 3.7 3.8 3.6 1.1 1.5 2.3
Memorandum items: EU-8 ........................................ .. .. .. .. .. .. .. 7.9 5.7 5.1 3.0 3.1 1.4 2.9 3.5 Western Europe .................... 3.7 2.8 1.5 1.2 -1.6 2.5 2.2 1.5 2.3 4.0 3.5 3.2 1.4 1.0 1.4 Western Europe and North America ................................ 3.3 2.0 0.3 2.1 0.7 3.4 2.2 2.5 3.6 4.5 4.4 3.9 1.2 1.8 2.5
Source: Eurostat, NewCronos Database; OECD, National Accounts (Paris), various issues; national statistics. Note: See appendix table A.1. a West Germany, 1989-1991.

122 ________________________________________________________________ Economic Survey of Europe, 2005 No. 1
APPENDIX TABLE A.6
Real exports of goods and services in Europe, North America and Japan, 1989-2003 (Percentage change over the preceding year)
1989 1990 1991 1992 1993 1994 1995 1996 1997 1998 1999 2000 2001 2002 2003
France ..................................... 10.0 4.8 5.9 5.4 – 7.7 7.7 3.5 11.8 8.3 4.3 12.6 1.6 1.9 -2.5 Germany a ............................... 10.3 13.2 12.9 -0.8 -5.5 7.6 5.7 5.1 11.2 7.0 5.5 13.5 5.7 4.1 1.8 Italy ......................................... 7.8 7.5 -1.4 7.3 9.0 9.8 12.6 0.6 6.4 3.4 0.1 9.7 1.6 -3.4 -3.9 Austria ..................................... 10.1 8.2 3.0 1.5 -2.6 5.5 6.3 4.8 11.4 8.6 5.7 10.5 6.8 3.8 1.4 Belgium ................................... 8.2 4.6 3.1 3.7 -0.4 8.3 5.0 3.0 5.9 6.0 5.1 8.4 1.3 1.5 1.7 Finland .................................... 3.0 1.5 -7.4 10.1 16.3 13.6 8.5 5.7 13.7 9.2 6.5 19.3 -0.8 5.1 1.3 Greece .................................... 1.9 -3.5 4.1 10.0 -2.6 7.4 3.0 3.5 20.0 5.3 18.1 14.1 -1.1 -7.7 1.0 Ireland ..................................... 10.3 8.7 5.7 13.9 9.7 15.1 20.0 12.2 17.4 22.0 15.2 20.4 8.4 5.7 -0.8 Luxembourg ............................ 12.6 5.6 9.2 2.7 4.8 7.7 4.6 5.8 14.7 14.1 14.8 17.3 1.8 -0.6 1.8 Netherlands ............................. 7.5 5.6 5.6 1.8 4.8 9.7 8.8 4.6 8.8 7.4 5.1 11.3 1.6 0.8 – Portugal ................................... 12.2 9.5 1.2 3.2 -3.3 8.4 8.8 7.1 7.1 9.1 2.9 7.8 1.4 2.0 4.0 Spain ....................................... 1.4 4.7 8.2 7.5 7.8 16.7 9.4 10.4 15.3 8.2 7.7 10.1 3.6 1.2 2.6 Euro area ............................... 8.4 7.6 6.0 3.5 1.2 9.2 8.2 4.4 10.4 7.3 5.1 11.9 3.2 1.6 0.1
United Kingdom ...................... 4.5 5.5 -0.1 4.3 4.4 9.2 9.3 8.6 8.4 2.8 4.3 9.4 2.9 0.1 0.1 Denmark ................................. 4.2 6.2 6.1 -0.9 -1.5 7.0 2.7 4.3 4.2 4.3 12.3 13.5 4.4 4.7 – Sweden ................................... 3.2 1.8 -1.9 2.2 8.3 14.1 11.5 3.7 13.8 8.6 7.4 11.5 0.5 1.2 5.0
EU-15 ...................................... 7.6 7.1 4.9 3.5 1.7 9.3 8.3 4.9 10.1 6.7 5.2 11.6 3.1 1.5 0.3
Cyprus ..................................... 16.8 7.9 -8.4 18.7 -1.3 7.9 4.6 3.5 3.1 1.0 8.5 10.6 6.3 -5.2 -1.4 Czech Republic ....................... .. .. -6.0 9.5 15.8 1.7 16.7 5.5 8.4 10.5 5.5 16.5 11.5 2.1 7.3 Estonia .................................... .. .. .. .. .. 3.5 5.3 2.8 28.9 12.0 0.7 28.3 -0.2 0.9 5.7 Hungary .................................. .. .. .. 2.1 -10.1 13.7 13.4 12.1 22.3 17.6 12.2 21.0 7.8 3.7 7.6 Latvia ...................................... .. .. -32.2 14.9 -22.4 -8.4 4.3 20.2 13.1 4.9 -6.4 11.4 7.5 5.2 5.0 Lithuania ................................. .. .. .. .. .. .. .. 19.3 18.7 4.6 -16.8 9.8 21.2 19.5 6.0 Malta ....................................... 10.7 13.3 7.5 9.7 5.3 7.1 5.4 -6.0 4.0 8.2 8.2 5.6 -4.9 6.6 -3.8 Poland ..................................... .. .. -1.7 10.8 3.2 13.1 22.8 12.0 12.2 14.3 -2.6 23.2 3.1 4.8 14.7 Slovakia .................................. .. .. 33.4 47.5 -0.2 14.8 4.5 -1.1 17.6 12.8 5.0 13.7 6.3 5.6 22.5 Slovenia .................................. .. .. -20.1 -23.5 0.6 12.3 1.1 2.8 11.3 7.4 1.6 13.0 6.3 6.8 3.1 New EU members-10 ............ .. .. .. .. .. .. .. 8.0 14.0 12.5 3.1 18.5 7.2 4.4 10.4
EU-25 ...................................... .. .. .. .. .. .. .. 5.2 10.5 7.3 5.0 12.3 3.5 1.8 1.4
Iceland .................................... 2.9 – -5.9 -2.0 6.5 9.5 -2.3 9.9 5.3 2.2 4.0 5.0 7.7 3.6 -0.7 Israel ....................................... 4.1 2.0 -2.8 13.9 – 12.9 10.0 5.7 8.6 6.4 12.0 24.0 -12.3 -2.4 6.2 Norway .................................... 11.0 8.6 6.1 4.7 3.2 8.4 4.9 10.2 7.7 0.6 2.8 4.0 5.0 0.1 1.2 Switzerland ............................. 6.9 2.6 -1.3 3.1 1.3 1.9 0.5 3.6 11.1 3.9 6.5 12.2 0.2 -0.2 –
WECEE ................................... .. .. .. .. .. .. .. 5.3 10.4 7.0 5.0 12.2 3.5 1.7 1.4
Canada ................................... 1.0 4.7 1.8 7.2 10.8 12.7 8.5 5.6 8.3 9.1 10.7 8.9 -2.8 1.1 -2.4 United States .......................... 11.8 8.7 6.6 6.9 3.2 8.7 10.1 8.4 11.9 2.4 4.3 8.7 -5.4 -2.4 1.9 North America ....................... 8.8 7.7 5.4 7.0 5.1 9.7 9.7 7.7 11.0 4.1 6.0 8.8 -4.7 -1.4 0.7
Japan ...................................... 9.3 6.7 4.1 3.9 -0.1 3.6 4.3 6.2 11.3 -2.4 1.5 12.1 -6.0 7.3 9.1
Europe, North America and Japan .................................... .. .. .. .. .. .. .. 6.0 10.6 5.6 5.0 11.3 0.7 1.3 1.7
Memorandum items: EU-8 ........................................ .. .. .. .. .. .. .. 8.2 14.3 12.7 3.0 18.8 7.4 4.5 10.7 Western Europe .................... 7.7 7.0 4.7 3.5 1.8 9.0 8.0 5.0 10.0 6.4 5.2 11.5 3.0 1.4 0.3 Western Europe and North America ................................ 8.0 7.2 4.9 4.5 2.7 9.2 8.5 5.8 10.3 5.7 5.4 10.6 0.7 0.6 0.4
Source: Eurostat, NewCronos Database; OECD, National Accounts (Paris), various issues; national statistics. Note: See appendix table A.1. a West Germany, 1989-1991.

Statistical Appendix_________________________________________________________________________________ 123
APPENDIX TABLE A.7
Real imports of goods and services in Europe, North America and Japan, 1989-2003 (Percentage change over the preceding year)
1989 1990 1991 1992 1993 1994 1995 1996 1997 1998 1999 2000 2001 2002 2003
France ..................................... 8.0 5.5 3.1 1.8 -3.7 8.2 8.0 1.6 6.9 11.6 6.2 14.6 1.3 2.9 -0.1 Germany a ............................... 8.5 10.7 12.2 1.5 -5.5 7.4 5.6 3.1 8.3 9.1 8.4 10.6 1.0 -1.6 4.0 Italy ......................................... 8.9 11.5 2.3 7.4 -10.9 8.1 9.7 -0.3 10.1 8.9 5.6 7.1 0.5 -0.2 -0.6 Austria ..................................... 9.6 7.6 4.6 1.6 -4.8 10.2 6.0 5.0 7.8 5.6 5.0 10.1 5.0 -0.2 4.8 Belgium ................................... 9.7 4.9 2.9 4.1 -0.4 7.3 4.7 2.6 5.1 7.3 4.2 8.5 1.0 1.0 2.3 Finland .................................... 9.1 -0.6 -12.9 0.5 1.5 12.4 7.4 5.9 11.2 7.9 3.5 16.9 0.2 1.9 0.9 Greece .................................... 10.5 8.4 5.8 1.1 0.6 1.5 8.9 7.0 14.2 9.2 15.0 15.1 -5.2 -2.9 4.8 Ireland ..................................... 13.5 5.1 2.4 8.2 7.5 15.5 16.4 12.5 16.7 26.0 12.1 21.3 6.7 3.3 -2.3 Luxembourg ............................ 9.1 5.0 9.1 -3.1 5.2 6.7 4.2 7.6 13.9 15.3 14.6 15.4 3.7 -2.6 1.6 Netherlands ............................. 7.7 3.8 4.9 1.5 0.3 9.4 10.5 4.4 9.5 8.5 5.8 10.5 2.2 0.8 0.6 Portugal ................................... 5.9 14.5 7.2 10.7 -3.3 8.8 7.4 4.9 10.0 14.2 8.5 5.5 1.1 -0.2 -0.9 Spain ....................................... 17.7 9.6 10.3 6.8 -5.2 11.4 11.1 8.0 13.2 13.2 12.6 10.5 3.9 3.1 4.8 Euro area ............................... 9.3 8.1 6.0 3.5 -4.5 8.4 7.8 3.3 9.1 10.1 7.5 10.9 1.6 0.5 1.9
United Kingdom ...................... 7.4 0.5 -4.5 6.8 3.3 5.8 5.6 9.7 9.8 9.3 7.9 9.1 4.9 4.1 1.3 Denmark ................................. 4.1 1.2 3.0 -0.4 -2.7 12.3 7.2 3.6 10.0 8.9 5.5 13.5 3.5 7.3 -0.6 Sweden ................................... 7.7 0.7 -4.9 1.5 -2.2 12.2 7.2 3.0 12.5 11.3 4.9 11.3 -2.6 -1.9 4.9
EU-15 ...................................... 8.9 6.7 4.2 3.8 -3.4 8.2 7.5 4.2 9.3 10.0 7.4 10.7 2.0 1.1 1.8
Cyprus ..................................... 20.4 5.8 2.2 18.2 -18.1 8.2 11.5 8.0 0.8 2.3 2.9 12.9 4.7 -0.5 -0.4 Czech Republic ....................... .. .. -32.8 29.7 23.7 14.7 21.2 12.1 6.9 8.4 5.0 16.3 13.0 4.9 7.9 Estonia .................................... .. .. .. .. .. 11.1 6.4 7.5 29.3 12.3 -5.2 28.3 2.1 3.7 11.0 Hungary .................................. .. .. .. 0.2 20.2 8.8 -0.7 9.4 23.1 23.8 13.3 19.4 5.1 6.2 10.4 Latvia ...................................... .. .. -43.9 8.0 -39.8 -0.7 1.4 28.5 6.8 19.0 -5.2 3.1 14.5 4.6 13.0 Lithuania ................................. .. .. .. .. .. .. .. 23.3 25.0 6.2 -12.4 4.7 17.7 17.6 8.8 Malta ....................................... 11.1 15.7 5.4 3.0 5.9 7.5 10.0 -5.9 -1.6 2.5 10.2 10.4 -8.6 -2.4 7.1 Poland ..................................... .. .. 29.6 1.7 13.2 11.3 24.3 28.0 21.4 18.5 1.0 15.6 -5.3 2.6 9.3 Slovakia .................................. .. .. -14.7 47.1 -0.7 -4.7 11.6 19.7 14.2 16.5 -6.7 10.5 11.0 5.5 13.6 Slovenia .................................. .. .. -22.4 -22.9 17.6 13.1 11.3 2.3 11.5 10.3 8.0 7.6 3.0 4.8 6.4 New EU members-10 ............ .. .. .. .. .. .. .. 16.4 15.9 15.3 2.9 15.2 4.7 4.9 9.5
EU-25 ...................................... .. .. .. .. .. .. .. 5.4 10.0 10.6 6.9 11.2 2.3 1.6 2.8
Iceland .................................... -10.3 1.0 5.3 -6.0 -7.8 4.1 3.9 16.5 7.7 23.4 4.2 8.0 -9.0 -2.6 9.7 Israel ....................................... -5.1 9.5 15.8 8.4 14.1 10.8 7.7 7.7 3.3 1.7 14.9 12.2 -4.6 -2.1 -1.8 Norway .................................... 2.2 2.5 0.5 1.6 4.9 5.8 5.7 8.8 12.4 8.5 -1.8 2.7 0.9 2.3 2.2 Switzerland ............................. 6.6 2.8 -1.9 -3.8 -0.1 7.7 4.3 3.2 8.3 7.5 4.3 9.6 3.2 -2.8 1.4
WECEE ................................... .. .. .. .. .. .. .. 5.4 10.0 10.5 6.7 11.1 2.3 1.5 2.8
Canada ................................... 5.9 2.0 2.5 4.7 7.4 8.0 5.7 5.1 14.2 5.1 7.8 8.1 -5.0 1.4 3.8 United States .......................... 3.9 3.8 -0.6 6.9 8.8 11.9 8.0 8.7 13.6 11.6 11.5 13.1 -2.7 3.4 4.4 North America ....................... 4.4 3.4 0.1 6.4 8.4 11.0 7.5 7.9 13.7 10.2 10.7 12.1 -3.2 3.0 4.3
Japan ...................................... 16.9 7.8 -1.1 -0.7 -1.4 7.9 13.3 12.9 0.7 -6.7 3.7 8.5 -0.7 1.3 3.9
Europe, North America and Japan .................................... .. .. .. .. .. .. .. 6.6 10.4 9.3 7.7 11.3 0.5 1.9 3.3
Memorandum items: EU-8 ........................................ .. .. .. .. .. .. .. 16.9 16.3 15.6 2.8 15.2 4.8 5.0 9.6 Western Europe .................... 8.7 6.5 3.9 3.5 -3.2 8.2 7.4 4.2 9.3 9.9 7.2 10.6 2.0 1.0 1.8 Western Europe and North America ................................ 7.3 5.5 2.8 4.3 0.2 9.1 7.4 5.4 10.7 10.0 8.4 11.1 0.2 1.7 2.7
Source: Eurostat, NewCronos Database; OECD, National Accounts (Paris), various issues; national statistics. Note: See appendix table A.1. a West Germany, 1989-1991.

124 ________________________________________________________________ Economic Survey of Europe, 2005 No. 1
APPENDIX TABLE A.8
Industrial output in Europe, North America and Japan, 1989-2003 (Percentage change over the preceding year)
1989 1990 1991 1992 1993 1994 1995 1996 1997 1998 1999 2000 2001 2002 2003
France ..................................... 3.5 1.4 -0.5 -1.5 -3.9 3.8 1.9 -0.1 4.1 3.6 2.4 3.8 1.1 -1.6 -0.2 Germany a ............................... 4.9 5.2 2.9 -2.3 -7.5 2.9 0.6 0.2 3.2 3.7 1.1 5.6 0.2 -1.0 0.4 Italy ......................................... 3.9 -0.6 -0.9 -1.0 -2.2 5.9 5.8 -1.7 3.8 1.2 -0.1 4.1 -1.0 -1.6 -0.6 Austria ..................................... 6.0 7.1 1.7 -1.2 -1.6 4.0 5.1 1.0 6.4 8.2 6.0 9.0 2.8 0.8 2.0 Belgium ................................... 3.4 3.8 -1.9 -0.4 -5.1 2.1 6.5 0.5 4.7 3.4 0.9 5.4 -1.0 1.3 0.7 Finland .................................... 2.4 0.4 -8.7 0.8 5.6 11.3 6.2 2.9 8.6 9.3 5.7 11.8 0.1 2.1 0.8 Greece .................................... 1.8 -2.4 -1.0 -1.1 -2.9 1.3 1.8 1.2 1.3 7.1 3.9 0.5 1.4 0.4 1.3 Ireland ..................................... 11.6 4.7 3.3 9.1 5.6 11.9 20.5 8.1 17.5 19.8 14.8 15.4 10.2 7.5 5.0 Luxembourg ............................ 7.8 -0.5 0.3 -0.8 -4.3 5.9 1.4 0.1 5.8 -0.1 11.5 4.3 1.8 1.0 2.6 Netherlands ............................. 5.3 2.4 1.7 -0.2 -1.1 4.9 2.9 2.4 0.2 2.2 1.4 3.5 0.4 -0.3 -2.4 Portugal ................................... 6.7 9.0 – -2.3 -4.8 -0.2 4.7 5.3 2.6 5.7 3.0 0.5 3.1 -0.5 -0.1 Spain ....................................... 5.1 -0.4 -0.6 -3.1 -4.7 7.8 4.9 -1.2 7.0 5.4 2.7 4.4 -1.4 0.1 1.4 Euro area ............................... 4.7 4.0 1.4 -1.7 -4.7 4.4 3.3 0.1 4.1 3.8 1.8 5.2 0.4 -0.5 0.4
United Kingdom ...................... 2.1 -0.3 -3.4 0.3 2.2 5.4 1.8 1.4 1.4 1.0 1.2 1.9 -1.6 -2.5 -0.1 Denmark ................................. 0.4 0.8 0.3 3.0 -3.7 10.3 4.0 1.4 4.9 2.9 0.2 5.4 1.6 1.4 0.2 Sweden ................................... 3.7 6.9 -5.2 -2.3 -1.0 11.8 9.5 – 4.9 4.0 2.6 6.4 -1.3 0.1 1.7
EU-15 ...................................... 4.1 2.4 0.3 -1.3 -3.3 4.9 3.2 0.3 3.7 3.3 1.6 4.7 – -0.8 0.3
Cyprus ..................................... .. .. .. .. .. .. .. .. .. .. .. 4.5 1.9 4.3 2.3 Czech Republic ....................... .. .. -21.9 -8.0 -5.3 2.1 8.7 2.0 4.5 1.6 -3.2 5.4 6.5 9.5 5.8 Estonia .................................... .. .. .. .. .. .. .. .. .. .. -3.9 15.0 8.5 8.5 10.3 Hungary .................................. -5.1 -9.3 -18.3 -9.8 4.0 9.7 4.6 3.4 11.1 12.5 10.3 18.2 3.6 2.7 6.4 Latvia ...................................... .. .. .. .. .. .. .. .. 6.1 1.8 -9.0 3.9 6.9 6.4 6.9 Lithuania ................................. .. .. .. .. .. .. .. .. .. .. -9.9 2.2 16.0 3.1 16.1 Malta ....................................... .. .. .. .. .. .. .. .. .. .. .. .. .. .. .. Poland ..................................... -2.8 -25.4 -16.0 4.0 4.8 13.1 10.3 9.4 11.3 4.7 4.8 7.5 0.4 1.4 8.8 Slovakia .................................. .. -4.5 -19.3 -9.7 -3.7 4.9 8.3 2.4 1.4 5.4 -2.0 8.5 7.4 6.7 5.4 Slovenia .................................. .. .. .. .. .. .. .. .. .. .. -0.8 8.7 2.0 2.1 -1.9 New EU members-10 b .......... .. .. .. .. .. .. .. .. .. .. .. 8.4 3.6 4.2 7.1
EU-25 ...................................... .. .. 0.3 -1.3 -3.3 4.9 3.2 0.5 3.9 3.3 1.7 4.8 0.2 -0.6 0.7
Iceland .................................... .. .. .. .. .. .. .. .. .. .. .. .. .. .. .. Israel ....................................... -1.6 8.0 6.8 8.2 6.9 7.4 8.4 5.4 1.8 2.8 1.4 10.1 -5.5 -1.5 -0.5 Norway .................................... 9.1 3.4 1.7 5.6 3.9 7.0 5.8 5.2 3.6 -1.2 -0.2 2.9 -1.3 1.0 -4.1 Switzerland ............................. 1.5 2.6 0.5 -1.0 -1.8 4.3 2.0 – 4.7 3.6 3.5 8.4 -0.7 -5.1 –
WECEE c ................................ .. .. .. .. .. .. .. .. .. .. .. 5.0 0.3 -0.4 0.9
Canada ................................... -0.3 -2.8 -3.6 1.3 4.8 6.3 4.6 1.2 5.6 3.5 5.9 8.6 -3.9 1.5 0.8 United States .......................... 0.9 0.9 -1.5 2.8 3.3 5.4 4.8 4.3 7.4 5.9 4.4 4.4 -3.4 -0.6 0.3 North America ....................... 0.7 0.4 -1.8 2.7 3.5 5.5 4.8 4.0 7.2 5.7 4.6 4.9 -3.5 -0.3 0.4
Japan ...................................... 5.8 4.2 1.9 -5.7 -3.5 1.3 3.3 2.3 3.5 -6.6 0.3 5.4 -6.3 -1.1 3.0
Europe, North America and Japan c ................................. .. .. .. .. .. .. .. .. .. .. .. 5.0 -2.3 -0.5 1.0
Memorandum items: EU-8 ........................................ .. .. .. .. .. .. .. .. .. .. 1.8 8.5 3.6 4.2 7.1 Western Europe .................... 4.2 2.5 0.3 -1.2 -3.0 4.9 3.3 0.4 3.7 3.1 1.6 4.7 – -0.9 0.2 Western Europe and North America ................................ 2.6 1.6 -0.6 0.5 -0.1 5.2 4.0 2.1 5.4 4.4 3.1 4.8 -1.7 -0.6 0.3
Source: National statistics; Eurostat; OECD, Main Economic Indicators (Paris), latest issues. Note: All aggregates exclude Israel. Except for the European Union member countries, industrial output indices for regional aggregates have been calculated as
weighted averages of the indices of the constituent countries; the European Union member countries’ aggregates are provided by Eurostat. Weights were derived from 2000 value added originating in industry converted from national currency units into dollars using 2000 GDP purchasing power parities.
a West Germany, 1989-1991. b Computed as a weighted average, excluding Malta. c Excluding Malta and Iceland.

Statistical Appendix_________________________________________________________________________________ 125
APPENDIX TABLE A.9
Total employment in Europe, North America and Japan, 1989-2003 (Percentage change over the preceding year)
1989 1990 1991 1992 1993 1994 1995 1996 1997 1998 1999 2000 2001 2002 2003
France ..................................... 1.7 0.8 0.1 -0.6 -1.3 0.1 0.9 0.4 0.4 1.5 2.0 2.7 1.7 0.7 0.2 Germany a ............................... 1.8 3.1 2.5 -1.5 -1.4 -0.2 0.2 -0.3 -0.2 1.1 1.2 1.8 0.4 -0.6 -1.0 Italy ......................................... 0.7 1.6 1.9 -0.5 -2.5 -1.5 -0.1 0.6 0.4 1.0 1.1 1.9 2.0 1.8 1.2 Austria ..................................... 1.1 1.8 1.3 0.5 -0.5 0.1 -0.2 0.3 0.9 1.3 1.8 1.0 0.6 -0.1 0.1 Belgium ................................... 1.2 0.9 0.1 -0.5 -0.8 -0.4 4.1 0.3 0.9 1.8 1.4 1.9 1.5 -0.3 – Finland .................................... 0.9 -0.4 -5.6 -7.0 -6.0 -1.4 1.8 1.4 3.4 2.0 2.5 2.3 1.5 0.9 – Greece .................................... 0.4 1.3 -1.7 1.4 0.8 1.9 0.9 -0.5 -2.2 7.5 0.1 0.3 -0.3 0.1 1.4 Ireland ..................................... – 4.4 -0.3 0.3 1.4 3.2 4.4 3.6 5.6 8.6 6.0 4.7 3.0 1.3 2.0 Luxembourg ............................ 3.4 3.9 4.3 2.6 2.0 2.4 2.9 2.3 3.2 4.8 5.0 5.6 5.7 2.9 1.7 Netherlands ............................. 2.6 3.0 1.9 1.3 0.3 0.6 2.3 2.3 3.2 2.6 2.6 2.2 2.1 0.4 -0.4 Portugal ................................... 2.3 2.2 2.8 -1.6 -2.0 -1.0 -0.2 -5.9 1.7 2.7 1.8 2.3 1.5 0.3 -0.4 Spain ....................................... 3.6 3.8 1.2 -1.4 -2.8 -0.5 1.9 1.3 2.9 3.9 3.5 3.5 2.4 1.5 1.8 Euro area ............................... 1.7 2.2 1.4 -0.9 -1.6 -0.3 0.8 0.2 0.8 2.0 1.8 2.2 1.4 0.5 0.2
United Kingdom ...................... 2.8 0.5 -2.9 -2.2 -0.7 0.8 1.2 0.9 1.8 1.0 1.3 1.1 0.8 0.7 0.9 Denmark ................................. -0.6 -0.7 -0.6 -0.8 -1.7 2.0 0.9 0.4 0.8 1.6 2.1 0.3 0.3 -0.4 -0.9 Sweden ................................... 1.5 0.9 -1.5 -4.4 -5.2 -0.9 1.5 -0.9 -1.3 1.5 2.1 2.4 1.9 0.2 -0.3
EU-15 ...................................... 1.9 1.8 0.5 -1.2 -1.5 -0.1 0.9 0.3 0.9 1.8 1.7 2.0 1.3 0.5 0.3
Cyprus ..................................... 3.9 2.7 0.3 4.5 -0.1 2.8 4.3 0.4 0.2 1.4 1.8 2.3 2.0 1.3 1.0 Czech Republic ....................... 0.6 -0.9 -5.5 -2.6 -1.6 0.8 2.6 0.7 -1.9 -1.3 -2.5 -0.2 0.3 -0.4 -0.7 Estonia .................................... 2.4 -1.4 -2.3 -5.6 -8.2 -3.4 -6.2 -2.2 -0.3 -1.7 -4.5 -1.2 0.9 1.4 1.5 Hungary .................................. -0.7 -3.3 -10.3 -10.0 -6.3 -2.0 -1.9 -0.8 – 1.4 3.1 1.0 0.5 0.1 1.3 Latvia ...................................... -0.5 0.1 -0.8 -7.3 -6.9 -10.1 -3.5 -2.6 4.3 -0.4 -1.8 -2.8 2.2 2.8 1.8 Lithuania ................................. 0.2 -2.7 2.4 -2.2 -4.2 -5.8 -1.9 0.9 0.6 -0.8 -2.2 -4.0 -3.3 4.0 2.3 Malta ....................................... 0.9 0.8 1.8 1.5 -0.4 1.8 3.4 0.9 -0.5 0.5 0.8 1.9 2.1 -0.7 -0.7 Poland ..................................... -0.1 -4.2 -5.9 -4.2 -2.4 1.0 1.8 1.9 2.8 2.3 -2.7 -2.3 -0.6 -2.2 -0.7 Slovakia .................................. 0.2 -1.8 -12.5 1.1 -2.6 -4.2 2.1 3.3 -0.5 -0.3 -3.0 -1.4 1.0 0.2 1.8 Slovenia .................................. -1.3 -3.9 -7.8 -5.5 -2.9 -2.5 -0.2 -0.5 -0.2 0.2 1.8 1.3 1.4 0.6 -0.8 New EU members-10 ............ – -3.0 -6.2 -4.4 -3.2 -0.8 0.9 1.1 1.2 1.1 -1.8 -1.4 -0.1 -0.8 –
EU-25 ...................................... 1.5 0.9 -0.7 -1.7 -1.8 -0.2 0.9 0.4 0.9 1.7 1.2 1.5 1.1 0.3 0.3
Iceland .................................... -1.6 0.1 – -1.6 -0.8 0.8 0.8 2.4 1.6 3.1 2.3 2.2 2.2 -1.4 1.4 Israel ....................................... 0.5 2.1 6.1 4.2 6.1 6.9 5.2 2.4 1.4 1.6 3.1 4.0 2.0 0.9 2.0 Norway .................................... -2.8 -0.8 -0.9 -0.2 0.5 1.4 2.1 2.0 3.0 2.5 0.8 0.4 0.3 0.3 -0.6 Switzerland ............................. 2.7 3.2 1.9 -1.5 -0.8 -0.7 – – 0.1 1.4 0.8 1.0 1.6 0.6 -0.1
WECEE ................................... 1.5 0.9 -0.6 -1.7 -1.8 -0.2 0.9 0.4 1.0 1.7 1.1 1.4 1.1 0.3 0.2
Canada ................................... 2.4 0.6 -1.8 -0.7 1.1 1.8 1.7 0.9 2.1 2.4 2.8 2.4 0.8 2.3 1.9 United States .......................... 2.3 1.3 -1.0 0.1 2.0 2.3 2.2 1.7 2.3 1.7 2.0 2.0 -0.2 -0.9 – North America ....................... 2.3 1.2 -1.1 – 1.9 2.3 2.1 1.7 2.3 1.7 2.1 2.0 -0.1 -0.6 0.2
Japan ...................................... 1.5 1.7 2.0 1.1 0.4 0.1 0.1 0.4 1.0 -0.7 -0.8 -0.1 -0.6 -1.4 -0.2
Europe, North America and Japan .................................... 1.8 1.1 -0.4 -0.6 -0.1 0.7 1.2 0.9 1.5 1.3 1.2 1.4 0.4 -0.3 0.2
Memorandum items: EU-8 ........................................ – -3.1 -6.3 -4.5 -3.2 -0.8 0.9 1.1 1.2 1.1 -1.9 -1.5 -0.2 -0.9 – Western Europe .................... 1.8 1.8 0.5 -1.2 -1.5 -0.1 0.9 0.3 0.9 1.8 1.7 1.9 1.3 0.5 0.3 Western Europe and North America ................................ 2.0 1.5 -0.2 -0.6 0.1 1.0 1.5 1.0 1.6 1.8 1.9 2.0 0.6 – 0.2
Source: Eurostat, NewCronos Database; OECD, National Accounts and Economic Outlook, latest issues; national statistics; UNECE secretariat estimates. Note: All aggregates exclude Israel. Total employment is defined as the number of persons engaged in some productive activity within resident production units
(national accounts concept). The labour force survey concept (based on resident household surveys) is used for Iceland, Malta and the United Kingdom (up to 1989), Germany (up to 1990).
a West Germany, 1989-1991.

126 ________________________________________________________________ Economic Survey of Europe, 2005 No. 1
APPENDIX TABLE A.10
Standardized unemployment rates a in Europe, North America and Japan, 1989-2003 (Per cent of civilian labour force)
1989 1990 1991 1992 1993 1994 1995 1996 1997 1998 1999 2000 2001 2002 2003
France ..................................... 8.9 8.5 9.0 9.9 11.1 11.7 11.1 11.6 11.5 11.1 10.5 9.1 8.4 8.9 9.4 Germany b ............................... 5.6 4.8 4.2 6.4 7.7 8.2 8.0 8.7 9.7 9.1 8.4 7.8 7.8 8.7 9.6 Italy ......................................... 9.7 8.9 8.5 8.7 10.1 11.0 11.5 11.5 11.6 11.7 11.3 10.4 9.4 9.0 8.6 Austria ..................................... 3.1 3.2 3.5 3.6 4.0 3.8 3.9 4.4 4.4 4.5 3.9 3.7 3.6 4.2 4.3 Belgium ................................... 7.4 6.6 6.4 7.1 8.6 9.8 9.7 9.5 9.2 9.3 8.6 6.9 6.7 7.3 8.0 Finland .................................... 3.1 3.2 6.6 11.7 16.3 16.6 15.4 14.6 12.7 11.4 10.2 9.8 9.1 9.1 9.0 Greece .................................... 6.7 6.4 7.1 7.9 8.6 8.9 9.2 9.6 9.8 10.9 11.8 11.0 10.4 10.0 9.3 Ireland ..................................... 14.7 13.4 14.7 15.4 15.6 14.3 12.3 11.7 9.9 7.5 5.6 4.3 3.9 4.3 4.6 Luxembourg ............................ 1.8 1.7 1.6 2.1 2.6 3.2 2.9 2.9 2.7 2.7 2.4 2.3 2.1 2.8 3.7 Netherlands ............................. 6.6 5.8 5.5 5.3 6.2 6.8 6.6 6.0 4.9 3.8 3.2 2.9 2.5 2.7 3.8 Portugal ................................... 5.2 4.8 4.2 4.3 5.6 6.9 7.3 7.3 6.8 5.1 4.5 4.1 4.0 5.0 6.3 Spain ....................................... 13.9 13.1 13.2 14.9 18.6 19.8 18.8 18.1 17.0 15.2 12.8 11.3 10.6 11.3 11.3 Euro area ............................... 8.2 7.6 7.3 8.5 10.1 10.8 10.5 10.7 10.8 10.2 9.4 8.5 8.0 8.4 8.8
United Kingdom ...................... 7.1 6.9 8.6 9.8 10.0 9.3 8.5 8.0 6.9 6.2 5.9 5.4 5.0 5.1 4.9 Denmark ................................. 6.8 7.2 7.9 8.6 9.6 7.7 6.7 6.3 5.2 4.9 4.8 4.4 4.3 4.6 5.6 Sweden ................................... 1.6 1.7 3.1 5.6 9.1 9.4 8.8 9.6 9.9 8.2 6.7 5.6 4.9 4.9 5.6
EU-15 ...................................... 7.8 7.3 7.4 8.7 10.0 10.4 10.1 10.2 10.0 9.4 8.7 7.8 7.4 7.7 8.1
Cyprus ..................................... 2.3 1.8 3.0 1.8 2.6 4.1 4.0 4.7 5.2 5.2 5.5 5.2 4.4 3.9 4.5 Czech Republic ....................... .. .. .. .. 4.4 4.4 4.1 3.9 4.8 6.3 8.6 8.6 8.0 7.3 7.8 Estonia .................................... .. .. .. .. .. .. .. .. 9.6 9.2 11.3 12.5 11.8 9.5 10.2 Hungary .................................. 5.3 5.5 6.7 7.4 6.8 6.1 5.6 9.6 9.0 8.4 6.9 6.3 5.6 5.6 5.8 Latvia ...................................... .. .. .. .. .. .. .. .. .. 14.3 14.0 13.7 12.9 12.6 10.4 Lithuania ................................. .. .. .. .. .. .. .. .. .. 13.2 13.7 16.4 16.4 13.5 12.7 Malta ....................................... 5.6 5.8 5.6 6.1 7.1 6.5 5.7 6.8 7.5 7.6 7.9 6.8 7.7 7.7 8.0 Poland ..................................... .. .. .. .. 14.0 14.4 13.3 12.3 10.9 10.2 13.4 16.4 18.5 19.8 19.2 Slovakia .................................. .. .. .. .. .. 13.7 13.1 11.3 11.9 12.6 16.7 18.7 19.4 18.7 17.5 Slovenia .................................. .. .. .. .. .. .. .. 6.9 6.9 7.4 7.2 6.6 5.8 6.1 6.5 New EU members-10 ............ .. .. .. .. .. .. .. .. .. 9.7 11.8 13.6 14.5 14.7 14.3
EU-25 ...................................... .. .. .. .. .. .. .. .. .. 9.4 9.2 8.7 8.5 8.8 9.0
Iceland .................................... 1.6 1.8 2.6 4.3 5.3 5.4 4.9 3.8 3.9 2.7 2.1 2.3 2.3 3.2 3.4 Israel c ..................................... 8.9 9.6 10.6 11.2 10.0 7.8 6.9 6.7 7.7 8.5 8.9 8.8 9.4 10.3 10.7 Norway .................................... 4.9 5.2 5.5 5.9 6.0 5.4 4.9 4.7 4.0 3.2 3.2 3.4 3.6 3.9 4.5 Switzerland ............................. 0.5 0.5 1.9 3.0 3.9 3.9 3.5 3.9 4.2 3.6 3.0 2.7 2.6 3.2 4.2
WECEE ................................... .. .. .. .. .. .. .. .. .. 9.3 9.0 8.6 8.3 8.7 8.9
Canada ................................... 7.6 8.1 10.3 11.2 11.4 10.4 9.4 9.6 9.1 8.3 7.6 6.8 7.2 7.7 7.6 United States .......................... 5.3 5.5 6.7 7.4 6.8 6.1 5.6 5.4 4.9 4.5 4.2 4.0 4.8 5.8 6.0 North America ....................... 5.5 5.8 7.1 7.8 7.3 6.5 6.0 5.8 5.3 4.9 4.5 4.3 5.0 6.0 6.2
Japan ...................................... 2.3 2.1 2.1 2.2 2.5 2.9 3.1 3.4 3.4 4.1 4.7 4.7 5.0 5.4 5.3
Europe, North America and Japan .................................... .. .. .. .. .. .. .. .. .. 6.9 6.8 6.5 6.7 7.2 7.4
Memorandum items: EU-8 ........................................ .. .. .. .. .. .. .. .. .. 9.7 11.9 13.7 14.6 14.9 14.4 Western Europe .................... 7.6 7.1 7.2 8.5 9.8 10.2 9.9 10.0 9.8 9.2 8.5 7.6 7.2 7.6 7.9 Western Europe and North America ................................ 6.7 6.5 7.2 8.2 8.7 8.6 8.1 8.1 7.8 7.2 6.7 6.1 6.2 6.9 7.1
Source: OECD, Main Economic Indicators and Quarterly Labour Force Statistics (Paris), latest issues; Eurostat, NewCronos Database; national statistics. Note: All aggregates exclude Israel. Comparisons with previous years are limited by changes in methodology in Austria (1993), Cyprus (2000), Iceland (1991), Israel
(1995), Malta (2000), Norway (1989), and Switzerland (1991). a Eurostat-OECD definition except for Iceland and Switzerland (1989-1990), Austria (1989-1992), Israel (1989-1995), Cyprus and Malta (1989-1999). b West Germany, 1989-1991. c Definitions comply with ILO guidelines but do not follow the Eurostat-OECD standards.

Statistical Appendix_________________________________________________________________________________ 127
APPENDIX TABLE A.11
Consumer prices in Europe, North America and Japan, 1989-2003 (Percentage change over the preceding year)
1989 1990 1991 1992 1993 1994 1995 1996 1997 1998 1999 2000 2001 2002 2003
France ..................................... 3.5 3.2 3.2 2.4 2.1 1.7 1.8 2.0 1.2 0.6 0.5 1.7 1.6 1.9 2.1 Germany a ............................... 2.8 2.7 4.1 5.1 4.4 2.7 1.7 1.4 1.9 0.9 0.6 1.5 2.0 1.4 1.0 Italy ......................................... 6.3 6.4 6.3 5.3 4.6 4.1 5.2 4.0 2.0 2.0 1.7 2.5 2.8 2.5 2.7 Austria ..................................... 2.6 3.3 3.3 4.0 3.6 2.9 2.2 1.9 1.3 0.9 0.6 2.3 2.7 1.8 1.4 Belgium ................................... 3.1 3.4 3.2 2.4 2.8 2.4 1.5 2.1 1.6 1.0 1.1 2.5 2.5 1.6 1.6 Finland .................................... 6.6 6.2 4.3 2.9 2.2 1.1 0.8 0.6 1.2 1.4 1.2 3.0 2.6 1.6 0.9 Greece .................................... 13.7 20.4 19.5 15.9 14.4 10.9 8.9 8.2 5.5 4.8 2.6 3.1 3.4 3.6 3.6 Ireland ..................................... 4.1 3.3 3.2 3.1 1.4 2.3 2.5 1.7 1.6 2.4 1.6 5.6 4.9 4.7 3.5 Luxembourg ............................ 3.4 3.3 3.1 3.2 3.6 2.2 1.9 1.3 1.4 1.0 1.0 3.1 2.7 2.1 2.1 Netherlands ............................. 1.1 2.5 3.2 3.2 2.6 2.8 1.9 2.0 2.2 2.0 2.2 2.4 4.2 3.3 2.1 Portugal ................................... 12.6 13.4 10.5 9.4 6.7 5.4 4.2 3.1 2.3 2.8 2.3 2.9 4.3 3.6 3.3 Spain ....................................... 6.8 6.7 5.9 5.9 4.6 4.7 4.7 3.6 2.0 1.8 2.3 3.4 3.6 3.1 3.0 Euro area ............................... 4.3 4.5 4.8 4.6 4.0 3.2 3.0 2.6 1.9 1.4 1.2 2.2 2.6 2.2 2.1
United Kingdom ...................... 7.8 9.5 5.9 3.7 1.6 2.5 3.4 2.5 3.1 3.4 1.6 2.9 1.8 1.6 2.9 Denmark ................................. 4.8 2.6 2.4 2.1 1.3 2.0 2.1 2.1 2.2 1.8 2.5 2.9 2.3 2.4 2.1 Sweden ................................... 6.6 10.4 9.7 2.6 4.7 2.4 2.9 0.8 0.9 0.4 0.3 1.3 2.6 2.4 2.1
EU-15 ...................................... 4.9 5.4 5.0 4.4 3.5 3.0 3.0 2.5 2.1 1.7 1.3 2.3 2.4 2.1 2.2
Cyprus ..................................... 3.8 4.5 5.0 6.5 4.9 4.7 2.6 2.9 3.6 2.2 1.7 4.3 2.0 2.8 4.1 Czech Republic ....................... .. 9.9 56.7 11.1 20.8 10.0 9.1 8.8 8.5 10.7 2.1 3.9 4.7 1.8 0.2 Estonia .................................... .. 18.0 202.0 1 076.0 89.8 47.7 29.0 23.1 11.2 8.2 3.3 4.0 5.8 3.6 1.1 Hungary .................................. .. 28.9 35.0 23.0 22.5 18.8 28.2 23.6 18.3 14.3 10.0 9.8 9.2 5.3 4.9 Latvia ...................................... .. 10.9 172.2 951.2 109.2 35.9 25.0 17.6 8.4 4.7 2.4 2.6 2.5 1.9 3.0 Lithuania ................................. .. 9.1 216.4 1 020.8 410.2 72.2 39.6 24.6 8.9 5.1 0.8 1.0 1.3 0.3 -1.2 Malta ....................................... 0.9 3.0 2.5 1.6 4.1 4.1 4.0 2.0 3.3 2.2 2.1 2.4 2.9 2.2 0.7 Poland ..................................... .. 585.8 70.3 43.0 35.3 32.2 27.8 19.9 14.9 11.8 7.3 10.1 5.5 1.8 0.7 Slovakia .................................. .. 10.4 61.2 10.0 23.2 13.4 9.9 5.8 6.1 6.7 10.6 12.0 7.1 3.3 8.5 Slovenia .................................. .. 551.6 115.0 207.3 32.9 21.0 13.5 9.9 8.4 7.9 6.1 8.9 8.4 7.5 5.7 New EU members-10 ............ .. .. .. .. 31.9 23.8 21.2 16.3 12.5 10.6 6.4 8.4 5.8 2.7 2.0
EU-25 ...................................... .. .. .. .. 4.5 3.9 3.9 3.3 2.7 2.4 1.7 2.8 2.7 2.1 2.2
Iceland .................................... 20.8 15.5 6.8 4.0 4.0 1.6 1.6 2.3 1.8 1.7 3.2 5.1 6.4 5.2 2.1 Israel ....................................... 20.2 17.2 19.0 12.0 11.0 12.3 10.1 11.3 9.0 5.4 5.2 1.1 1.1 5.7 0.7 Norway .................................... 4.5 4.1 3.4 2.4 2.3 1.4 2.4 1.2 2.6 2.3 2.3 3.1 3.0 1.3 2.5 Switzerland ............................. 3.1 5.4 5.9 4.0 3.3 0.9 1.8 0.8 0.5 – 0.8 1.6 1.0 0.6 0.6
WECEE ................................... .. .. .. .. 4.4 3.8 3.9 3.2 2.7 2.3 1.6 2.8 2.7 2.1 2.2
Canada ................................... 5.0 4.8 5.6 1.5 1.9 0.2 2.2 1.6 1.6 1.0 1.7 2.7 2.5 2.3 2.8 United States .......................... 4.8 5.4 4.2 3.0 2.9 2.6 2.8 2.9 2.3 1.6 2.1 3.4 2.8 1.7 2.2 North America ....................... 4.8 5.4 4.3 2.9 2.9 2.4 2.7 2.8 2.3 1.6 2.1 3.4 2.8 1.7 2.2
Japan ...................................... 2.3 3.1 3.2 1.7 1.3 0.7 -0.1 0.1 1.7 0.7 -0.3 -0.7 -0.7 -0.9 -0.3
Europe, North America and Japan .................................... .. .. .. .. 3.2 2.7 2.8 2.6 2.4 1.8 1.6 2.6 2.3 1.6 1.9
Memorandum items: EU-8 ........................................ .. 66.6 60.2 32.9 32.6 24.0 21.8 16.6 12.7 10.8 6.5 8.5 5.9 2.7 2.0 Western Europe .................... 4.9 5.4 5.0 4.3 3.5 2.9 3.0 2.4 2.0 1.7 1.3 2.3 2.4 2.1 2.2 Western Europe and North America ................................ 4.8 5.4 4.6 3.5 3.1 2.7 2.9 2.7 2.2 1.6 1.7 2.9 2.6 1.9 2.2
Source: National statistics. Note: All aggregates exclude Israel. Consumer price indexes for regional aggregates have been calculated as weighted averages of constituent country indices.
Weights were derived from 2000 private final consumption expenditure converted from national currency units into dollars using 2000 purchasing power parities. a West Germany, 1989-1991.

128 ________________________________________________________________ Economic Survey of Europe, 2005 No. 1
APPENDIX TABLE B.1
Real GDP in south-east Europe and the CIS, 1990-2003 (Percentage change over the preceding year)
1990 1991 1992 1993 1994 1995 1996 1997 1998 1999 2000 2001 2002 2003
2003 over
1989 a
South-east Europe b ............................ -0.1 -6.5 -3.1 2.1 -1.7 7.4 5.2 3.4 1.7 -3.6 5.9 -2.6 6.5 5.1 20.1 Albania .................................................. -10.0 -28.0 -7.2 9.6 8.3 13.3 9.1 -10.2 12.7 10.1 7.3 7.2 3.4 6.0 24.0 Bosnia and Herzegovina ..................... .. .. .. .. .. .. 54.2 36.6 16.6 9.5 5.4 4.5 3.7 3.2 217.2c Bulgaria ................................................. -9.1 -8.4 -7.3 -1.5 1.8 2.9 -9.4 -5.6 4.0 2.3 5.4 4.1 4.9 4.3 -13.0 Croatia ................................................... -7.1 -21.1 -11.7 -8.0 5.9 6.8 5.9 6.8 2.5 -0.9 2.9 4.4 5.2 4.3 -8.8 Romania ................................................ -5.6 -12.9 -8.8 1.5 3.9 7.1 3.9 -6.1 -4.8 -1.2 2.1 5.7 5.0 4.9 -7.4 Serbia and Montenegro d ...................... -7.9 -11.6 -27.9 -30.8 2.5 6.1 5.9 7.4 2.5 -17.7 6.4 5.5 3.8 1.5 -49.9 The former Yugoslav Republic of Macedonia ...................... -10.2 -6.2 -6.6 -7.5 -1.8 -1.1 1.2 1.4 3.4 4.3 4.5 -4.5 0.9 3.4 -18.4 Turkey ................................................... 9.3 0.9 6.0 8.0 -5.5 7.2 7.0 7.5 3.1 -4.7 7.4 -7.5 7.9 5.8 64.0
CIS ......................................................... -3.1 -6.1 -14.0 -9.8 -14.4 -5.7 -3.5 1.4 -3.2 5.1 8.9 6.1 5.2 7.7 -25.8 Armenia ................................................. -5.5 -11.7 -41.8 -8.8 5.4 6.9 5.9 3.3 7.3 3.3 5.9 9.6 15.1 13.9 -7.9 Azerbaijan ............................................. -11.7 -0.7 -22.6 -23.1 -19.7 -11.8 1.3 5.8 10.0 7.4 11.1 9.9 10.6 11.2 -29.8 Belarus .................................................. -1.9 -1.4 -9.6 -7.6 -11.7 -10.4 2.8 11.4 8.4 3.4 5.8 4.7 5.0 6.8 2.0 Georgia ................................................. -15.1 -21.1 -44.9 -29.3 -10.4 2.6 11.2 10.5 3.1 2.9 1.8 4.8 5.5 11.1 -60.9 Kazakhstan ........................................... -1.0 -11.0 -5.3 -9.2 -12.6 -8.2 0.5 1.7 -1.9 2.7 9.8 13.5 9.8 9.3 -6.3 Kyrgyzstan ............................................ 4.8 -7.9 -13.8 -15.5 -20.1 -5.4 7.1 9.9 2.1 3.7 5.4 5.3 0.0 6.7 -21.6 Republic of Moldova e ............................ -2.4 -17.5 -29.0 -1.2 -30.9 -1.4 -5.9 1.6 -6.5 -3.4 2.1 6.1 7.8 6.3 -58.7 Russian Federation ............................. -3.0 -5.0 -14.5 -8.7 -12.7 -4.1 -3.6 1.4 -5.3 6.4 10.0 5.1 4.7 7.3 -23.0 Tajikistan ............................................... 0.2 -8.5 -32.3 -16.3 -21.3 -12.4 -16.7 1.7 5.3 3.7 8.3 10.2 9.5 10.2 -52.3 Turkmenistan ........................................ 1.8 -4.7 -15.0 1.5 -17.3 -7.2 6.7 -11.4 7.1 16.5 6.1 4.1 1.8 6.8 -9.1 Ukraine .................................................. -3.6 -8.7 -9.9 -14.2 -22.9 -12.2 -10.0 -3.0 -1.9 -0.2 5.9 9.2 5.2 9.4 -47.6 Uzbekistan ............................................ -0.8 -0.5 -11.1 -2.3 -5.2 -0.9 1.7 5.2 4.4 4.4 4.0 4.5 4.2 4.4 11.0
Total above b .......................................... -2.5 -6.2 -11.7 -7.0 -11.1 -2.0 -0.8 2.1 -1.5 2.1 7.9 3.3 5.6 6.9 -16.2
Memorandum items: South-east Europe without Turkey b .............................................. -7.1 -13.1 -12.5 -5.4 3.5 7.6 2.9 -2.1 -0.3 -1.9 3.7 5.0 4.6 4.2 -12.9 CIS without Russian Federation .... -3.4 -8.1 -12.9 -11.8 -17.7 -9.1 -3.3 1.5 1.5 2.6 6.4 8.3 6.2 8.5 -30.9 Low-income CIS ................................. -5.7 -8.3 -24.6 -12.2 -12.9 -3.0 1.6 5.7 4.3 4.0 5.2 6.2 6.3 7.7 -28.0 Caucasian CIS .................................... -12.3 -11.4 -34.3 -23.1 -12.7 -3.7 5.5 6.9 7.0 4.9 6.9 8.2 9.9 11.7 -40.7 Central Asian CIS .............................. -0.2 -7.4 -10.6 -7.2 -12.1 -6.0 1.2 1.8 1.5 4.8 7.2 8.9 6.6 7.5 -7.1 European CIS ...................................... -3.3 -7.9 -10.6 -12.6 -21.1 -11.5 -7.2 0.6 0.6 0.8 5.7 7.8 5.3 8.6 -40.0 EU-8 ...................................................... -6.3 -9.7 -2.9 0.2 3.5 5.5 4.7 4.7 3.6 3.1 4.1 2.4 2.4 4.0 19.6
Source: UNECE Common Database; national statistics; CIS Statistical Committee. Note: Regional aggregates: low-income CIS – Armenia, Azerbaijan, Georgia, Kyrgyzstan, Republic of Moldova, Tajikistan, Uzbekistan; Caucasian CIS – Armenia,
Azerbaijan, Georgia; central Asian CIS – Kazakhstan, Kyrgyzstan, Tajikistan, Turkmenistan, Uzbekistan; European CIS – Belarus, Republic of Moldova, Ukraine; EU-8 – Czech Republic, Estonia, Hungary, Latvia, Lithuania, Poland, Slovakia, Slovenia. Aggregation is performed using weights based on purchasing power parities.
a Cumulative change for the period. b Excluding Bosnia and Herzegovina for 1990-1995. c 1995=100. d Excluding Kosovo and Metohia since 1999. e Excluding Transdniestria since 1993.

Statistical Appendix_________________________________________________________________________________ 129
APPENDIX TABLE B.2
Real total consumption expenditure in south-east Europe and the CIS, 1990-2003 (Percentage change over the preceding year)
1990 1991 1992 1993 1994 1995 1996 1997 1998 1999 2000 2001 2002 2003
South-east Europe a .......................... .. .. -0.8 5.2 -2.4 6.2 6.1 3.5 1.4 -1.1 5.0 -4.3 2.7 .. Bulgaria ................................................ 0.6 -7.7 -3.1 -3.6 -4.5 -1.9 -8.2 -9.6 4.0 8.8 5.7 4.4 3.6 6.6 Croatia ................................................. .. .. -12.8 -2.2 7.9 15.9 -0.1 10.0 0.2 -1.1 2.3 1.2 4.9 3.0 Romania ............................................... 8.9 -11.8 -5.6 1.2 3.8 10.8 7.0 -4.3 1.1 -2.5 1.5 6.3 2.4 6.9 The former Yugoslav Republic of Macedonia ...................... .. -6.1 -10.3 6.5 6.9 -1.7 2.4 2.0 3.4 3.7 8.0 -3.5 6.3 .. Turkey .................................................. 12.6 2.8 3.3 8.6 -5.4 5.0 8.5 8.0 1.3 -1.7 6.3 -9.1 2.5 5.6
CIS b ..................................................... .. .. .. .. -6.4 -4.3 -3.1 2.4 -0.8 -0.8 5.1 7.7 7.2 8.4 Armenia ................................................ .. -2.6 -12.8 -21.8 3.8 8.0 3.2 6.3 4.6 1.4 7.7 7.1 8.2 9.0 Azerbaijan ............................................ .. .. .. -22.6 -19.7 -2.8 8.1 10.5 11.4 9.6 8.6 8.6 9.2 11.7 Belarus ................................................. .. -6.5 -10.0 -6.3 -11.2 -9.4 3.7 10.0 11.8 8.4 7.4 13.7 8.1 5.3 Kazakhstan .......................................... .. -3.2 -0.7 -11.7 -20.2 -18.8 -6.7 1.0 -2.8 1.4 3.1 9.6 9.1 19.8 Kyrgyzstan ........................................... .. -16.5 -12.8 -11.6 -19.6 -16.1 6.3 -8.1 15.1 0.9 -2.9 1.4 3.7 8.5 Republic of Moldova ............................ .. .. .. .. -17.4 9.4 10.4 11.8 -2.0 -15.8 17.2 4.4 9.7 13.4 Russian Federation .............................. .. -6.1 -5.2 -1.0 -3.1 -2.7 -2.6 2.8 -2.1 -1.2 5.6 6.8 7.3 6.6 Ukraine ................................................. .. -5.3 -6.3 -18.7 -9.7 -3.6 -8.4 -1.8 -0.1 -3.7 2.0 9.3 5.0 12.8
Memorandum items: South-east Europe without Turkey a ................................................ .. .. -6.4 – 2.4 7.8 2.7 -3.2 1.6 – 2.7 4.7 3.1 .. CIS without Russian Federation b .... .. .. .. .. -13.0 -7.8 -4.2 1.7 2.5 0.3 4.0 9.7 6.8 12.5 European CIS ..................................... .. .. .. .. -10.2 -4.6 -5.0 1.5 2.8 -0.9 4.1 10.4 6.0 10.6 EU-8 ............................................................ .. .. .. .. .. .. 5.4 4.2 3.4 3.6 2.6 3.0 4.0 3.8
Source: UNECE Common Database; national statistics; CIS Statistical Committee. a Excluding Albania, Bosnia and Herzegovina, and Serbia and Montenegro. b Excluding Georgia, Tajikistan, Turkmenistan and Uzbekistan.
APPENDIX TABLE B.3
Real gross domestic fixed capital formation in south-east Europe and the CIS, 1990-2003 (Percentage change over the preceding year)
1990 1991 1992 1993 1994 1995 1996 1997 1998 1999 2000 2001 2002 2003
South-east Europe a .......................... .. .. 5.0 18.4 -7.8 9.2 10.7 10.5 -2.8 -11.6 13.2 -18.7 3.0 10.5 Bulgaria ............................................... .. -20.0 -7.3 -17.5 1.1 16.1 -21.2 -20.9 35.2 20.8 15.4 23.3 8.5 13.8 Croatia ................................................ .. .. -11.5 6.8 -1.0 15.6 37.6 26.4 2.5 -3.9 -3.8 7.1 12.0 16.8 Romania .............................................. -35.6 -31.6 11.0 8.3 20.7 6.9 5.7 1.7 -5.7 -4.8 5.5 10.1 8.2 9.2 The former Yugoslav Republic of Macedonia ..................... .. -4.2 -16.6 -7.9 -8.6 10.2 6.5 -4.3 -2.6 -1.4 -3.2 -8.6 17.6 10.0 Turkey ................................................. 15.9 0.4 6.4 26.4 -16.0 9.1 14.1 14.8 -3.9 -15.7 16.9 -31.5 -1.1 10.0
CIS b .................................................... .. .. .. .. -25.6 -14.7 -19.7 -4.7 -7.4 5.0 14.2 10.2 5.7 14.2 Armenia ............................................... .. -33.0 -87.2 -7.8 45.0 -17.3 10.3 2.1 12.0 0.6 16.2 5.3 33.1 33.7 Azerbaijan ........................................... .. .. .. -39.0 89.0 -18.0 111.4 67.0 23.0 -2.0 2.6 20.6 84.0 61.5 Belarus ................................................ .. 4.2 -18.7 -7.6 -13.7 -29.6 -3.1 21.7 10.1 -4.0 2.3 -2.3 6.7 17.7 Kazakhstan ......................................... .. -25.8 -16.6 -28.5 -11.4 -37.9 -23.9 3.3 -7.2 0.5 16.1 25.3 10.2 8.9 Kyrgyzstan .......................................... .. -10.6 -29.3 -21.8 -28.9 60.7 -13.0 -29.6 -1.6 28.1 26.9 -1.9 -7.4 -1.4 Republic of Moldova ........................... .. .. .. .. -43.5 -10.0 25.6 -5.3 9.2 -23.1 -8.7 17.3 5.7 13.3 Russian Federation ............................. .. -15.5 -41.5 -25.8 -26.0 -7.5 -21.9 -9.6 -12.4 8.1 16.6 10.9 3.5 12.2 Ukraine ................................................ .. -20.9 -14.9 -30.5 -41.0 -30.8 -22.7 2.1 2.6 0.1 12.4 6.2 3.4 15.8
Memorandum items: South-east Europe without Turkey a ................................................ .. .. 2.4 2.3 13.8 9.3 4.4 1.9 -0.1 -0.9 5.1 11.1 9.2 11.3 CIS without Russian Federation b .... .. .. .. .. -24.9 -29.9 -14.5 8.5 4.5 -1.0 9.8 8.5 10.9 18.4 European CIS .................................... .. .. .. .. -34.3 -30.0 -17.2 6.6 5.2 -2.1 8.2 3.5 4.5 16.3 EU-8 ............................................................ .. .. .. .. .. .. 14.6 11.9 10.7 0.9 2.9 – 0.6 2.5
Source: UNECE Common Database; national statistics; CIS Statistical Committee. a Excluding Albania, Bosnia and Herzegovina, and Serbia and Montenegro. b Excluding Georgia, Tajikistan, Turkmenistan and Uzbekistan.

130 ________________________________________________________________ Economic Survey of Europe, 2005 No. 1
APPENDIX TABLE B.4
Real gross industrial output in south-east Europe and the CIS, 1990-2003 (Percentage change over the preceding year)
1990 1991 1992 1993 1994 1995 1996 1997 1998 1999 2000 2001 2002 2003
2003 over
1989 a
South-east Europe ............................ -9.3 -14.1 -14.9 -4.2 -2.3 7.5 5.9 3.3 -2.7 -5.3 6.1 -3.1 7.5 6.3 -20.9 Albania b ................................................ -13.3 -41.9 -30.1 -10.0 -18.6 -7.2 -24.4 2.8 21.8 15.2 12.0 -20.0 11.0 8.0 -72.0 Bosnia and Herzegovina c .................. 1.8 -24.5 -66.8 -92.2 -12.6 59.1 87.6 35.7 23.8 10.6 8.8 12.2 9.2 4.8 -86.5 Bulgaria ................................................. -16.8 -20.2 -18.4 -9.8 10.6 4.5 5.1 -18.4 -8.5 -8.0 8.3 1.6 6.5 8.3 -48.3 Croatia ................................................... -11.3 -28.5 -14.6 -5.9 -2.7 0.3 3.1 6.8 3.7 -1.4 1.7 6.0 5.4 4.1 -33.8 Romania ................................................ -23.7 -23.0 -25.3 0.7 3.1 9.4 6.3 -7.2 -13.8 -2.4 7.1 8.4 6.0 3.2 -47.4 Serbia and Montenegro ...................... -12.0 -17.6 -21.4 -37.3 1.3 3.8 7.5 9.5 3.6 -23.1 11.2 – 1.7 -2.7 -61.2 The former Yugoslav Republic of Macedonia ...................... -10.6 -17.2 -15.8 -13.9 -10.5 -10.7 3.2 1.6 4.5 -2.6 3.5 -3.1 -5.3 4.7 -54.5 Turkey ................................................... 10.0 3.1 5.2 5.9 -6.3 8.5 5.9 10.7 0.9 -5.0 5.4 -8.8 9.2 8.5 64.4
CIS ......................................................... -0.4 -7.0 -17.0 -13.1 -22.2 -5.7 -3.2 2.2 -3.2 9.1 12.0 6.8 4.7 8.4 -30.6 Armenia ................................................. -7.5 -7.7 -48.2 -10.7 5.3 1.5 1.4 1.0 -2.1 5.3 6.4 5.3 14.6 14.9 -34.3 Azerbaijan ............................................. -6.3 -8.9 -30.4 -19.7 -24.7 -21.4 -6.7 0.3 2.2 3.6 6.9 5.1 3.6 6.1 -65.4 Belarus .................................................. 2.1 -1.0 -9.2 -9.4 -14.6 -11.7 3.5 18.8 12.4 10.3 7.8 5.9 4.5 7.1 22.1 Georgia ................................................. -5.7 -22.6 -45.8 -36.7 -39.1 -13.5 6.8 8.2 -1.5 4.8 6.1 -1.1 4.9 10.6 -80.8 Kazakhstan ........................................... -0.8 -0.9 -13.8 -14.8 -28.1 -8.2 0.3 4.0 -2.4 2.7 15.5 13.8 10.5 8.8 -21.3 Kyrgyzstan ............................................ -0.6 -0.3 -25.8 -23.5 -36.9 -24.7 3.9 39.7 5.3 -4.3 6.0 5.4 -10.9 17.0 -54.5 Republic of Moldova d ......................... 3.2 -11.1 -27.1 0.3 -27.7 -3.9 -6.5 – -15.0 -11.6 7.7 13.7 10.6 13.6 -49.6 Russian Federation .............................. -0.1 -8.0 -18.0 -14.1 -20.9 -3.3 -4.0 2.0 -5.2 11.0 11.9 4.9 3.7 7.0 -33.5 Tajikistan ............................................... 1.2 -3.6 -24.3 -7.8 -25.4 -13.6 -23.9 -2.0 8.2 5.6 9.9 14.8 8.2 10.2 -43.7 Turkmenistan ........................................ 3.2 4.8 -14.9 4.0 -24.7 -6.4 20.0 -22.0 2.0 15.0 26.0 9.0 5.0 8.0 15.4 Ukraine .................................................. -0.1 -4.8 -6.4 -8.0 -27.3 -12.0 -5.1 -0.3 -1.0 4.0 13.2 14.2 7.0 15.8 -18.2 Uzbekistan ............................................ 1.8 1.5 -6.7 3.6 1.6 0.1 2.6 4.1 3.6 5.7 5.9 7.6 8.5 6.2 56.0
Total above .......................................... -2.6 -8.6 -16.6 -11.2 -17.5 -2.0 -0.4 2.6 -3.1 4.3 10.2 3.9 5.5 7.8 -28.2
Memorandum items: South-east Europe without Turkey ................................................ -16.8 -22.9 -28.6 -14.4 2.5 6.4 6.0 -5.2 -7.5 -5.7 7.2 5.3 5.3 3.5 -53.8 CIS without Russian Federation .... -1.0 -4.6 -14.9 -11.0 -25.0 -11.0 -1.3 2.8 1.2 4.9 12.1 11.0 6.9 11.4 -23.8 Low-income CIS ................................. -3.9 -9.6 -30.7 -16.7 -21.6 -12.4 -2.7 5.7 1.5 2.7 6.6 6.3 5.1 9.1 -52.0 Caucasian CIS .................................... -6.2 -13.4 -36.9 -23.4 -24.9 -16.9 -2.9 2.0 0.7 4.1 6.6 3.9 5.7 8.6 -67.6 Central Asian CIS ............................... – -0.1 -15.0 -11.2 -24.9 -8.0 2.6 1.3 0.1 4.4 14.5 11.5 8.0 8.7 -15.3 European CIS ...................................... 0.4 -4.3 -7.5 -8.1 -25.1 -11.7 -3.4 3.9 2.0 5.4 11.6 11.9 6.4 13.5 -12.2 EU-8 ...................................................... -11.3 -14.1 -9.1 -3.1 5.5 7.8 4.9 7.9 4.4 1.4 7.0 4.7 3.0 7.1 12.9
Source: UNECE Common Database; national statistics; CIS Statistical Committee. Note: Aggregation was performed using PPP-based value added weights. a Cumulative change for the period. b Public sector only. c Excluding Republika Srpska. d Excluding Transdniestria since 1993.

Statistical Appendix_________________________________________________________________________________ 131
APPENDIX TABLE B.5
Total employment in south-east Europe and the CIS, 1990-2003 (Percentage change over the preceding year)
1990 1991 1992 1993 1994 1995 1996 1997 1998 1999 2000 2001 2002 2003
2003 over
1989 a
South-east Europe b ............................ -0.6 -0.3 -3.5 -4.7 3.4 – 0.6 -1.1 0.6 – -1.0 -1.4 -1.6 -0.5 -8.5 Albania ................................................... -0.8 -1.7 -22.0 -4.4 11.0 -0.3 -3.6 -0.7 -2.0 -1.8 0.3 -13.8 – 0.7 -35.7 Bosnia and Herzegovina c .................... .. .. -62.0 -55.4 -7.5 10.8 123.0 52.7 5.9 3.1 0.7 -0.9 -3.2 -1.7 -38.6 Bulgaria ................................................... -6.1 -13.0 -8.1 -1.6 0.6 1.3 0.1 -3.9 -0.2 -2.1 -3.5 -0.4 0.4 1.4 -30.8 Croatia ..................................................... -2.9 -8.2 -11.2 -3.4 -2.3 -1.2 -0.1 -0.7 -1.0 -1.1 -1.7 0.5 0.8 2.5 -26.7 Romania d................................................ -1.0 -0.5 -3.0 -4.7 -1.5 -6.3 -2.3 – -3.1 -1.8 -1.3 -1.9 -4.2 -0.1 -27.7 Serbia and Montenegro ........................ -3.0 -3.0 -3.4 -2.8 -2.1 -1.6 -0.4 6.0 -0.1 -8.2 -2.6 0.2 -1.6 -1.3 -21.9 The former Yugoslav Republic of Macedonia ........................ -1.8 -7.7 -4.8 -5.6 -6.0 -9.9 -4.7 -6.0 -2.9 1.8 -1.3 -4.5 -6.0 -4.4 -48.2 Turkey ..................................................... 1.7 3.9 0.9 -4.8 7.9 3.7 2.1 -2.5 2.8 2.1 -0.4 -1.0 -0.8 -1.0 15.0
CIS ........................................................... 0.2 -1.4 -2.3 -2.5 -3.0 -1.3 -0.8 -1.4 -1.2 -0.4 0.1 0.8 1.1 0.3 -11.2 Armenia e ................................................. 1.6 1.7 -6.5 -3.1 -4.6 -1.7 -3.9 -5.7 -3.8 -4.3 -2.9 -2.3 – 0.1 -30.4 Azerbaijan ............................................... 0.9 0.8 -0.3 -0.2 -2.2 -0.5 2.0 0.2 0.2 – – 0.3 0.3 0.6 2.1 Belarus .................................................... -0.9 -2.5 -2.6 -1.3 -2.6 -6.2 -1.0 0.1 1.1 0.6 – -0.5 -0.8 -0.9 -16.5 Georgia ................................................... 2.3 -8.9 -21.2 -9.6 -2.4 -1.2 2.7 0.2 -6.3 0.1 6.2 2.1 -2.1 -1.3 -35.3 Kazakhstan ............................................. 1.3 -1.1 -1.9 -8.5 -5.0 -0.5 -0.5 -0.7 -5.3 -0.4 1.6 8.0 0.2 4.1 -9.4 Kyrgyzstan .............................................. 0.5 -1.0 6.0 -8.5 -2.1 -0.2 0.6 2.3 0.9 3.5 0.2 1.1 1.2 0.9 4.9 Republic of Moldova f ............................ -0.9 -0.1 -1.0 -0.8 -0.4 -0.5 -0.8 -0.8 -0.2 -9.0 1.3 -1.1 0.4 -9.9 -35.1 Russian Federation ............................... -0.4 -2.0 -2.4 -1.7 -3.3 -3.0 -0.7 -1.9 -1.4 0.2 0.6 0.6 1.0 -0.2 -13.7 Tajikistan ................................................. 3.2 1.7 -3.2 -2.8 – -0.1 -6.6 3.5 0.3 -3.3 0.5 4.8 1.5 1.5 0.3 Turkmenistan .......................................... 3.4 3.5 3.3 3.2 3.9 3.4 1.8 2.0 1.3 0.7 3.0 2.0 2.5 2.2 42.8 Ukraine .................................................... – -1.7 -2.0 -2.3 -3.8 3.0 -2.1 -2.7 -1.1 -2.3 -2.5 -1.2 1.7 0.3 -15.6 Uzbekistan .............................................. 4.2 4.0 0.2 -0.1 1.4 0.8 1.3 1.4 1.4 1.0 1.1 1.7 2.1 2.8 25.8
Total above b ......................................... – -1.2 -2.6 -3.0 -1.5 -1.0 -0.4 -1.3 -0.7 -0.3 -0.1 0.2 0.4 0.1 -10.6
Memorandum items: South-east Europe without Turkey b ................................................ -2.3 -3.8 -7.3 -4.5 -0.8 -3.8 -0.9 0.5 -1.8 -2.5 -1.7 -1.9 -2.6 0.1 -26.8 CIS without Russian Federation ...... 1.0 -0.7 -2.2 -3.4 -2.5 0.8 -0.9 -0.9 -1.0 -1.1 -0.4 1.0 1.1 0.9 -8.2 Low-income CIS ................................... 2.3 0.6 -2.9 -3.9 -0.6 – 0.3 0.7 -0.1 -0.5 1.0 1.3 1.1 0.7 -0.4 Caucasian CIS ...................................... 1.5 -2.4 -8.4 -3.5 -2.8 -0.9 1.0 -1.0 -2.3 -0.7 1.1 0.3 -0.4 – -17.3 Central Asian CIS ................................ 2.6 1.4 -0.2 -3.9 -1.0 0.5 – 1.0 -0.9 0.4 1.3 3.8 1.4 2.9 9.6 European CIS ....................................... -0.2 -1.7 -2.0 -3.1 -3.5 1.4 -1.9 -2.2 -0.7 -2.3 -1.9 -1.1 1.2 -0.4 -17.0 EU-8 ....................................................... -3.1 -6.3 -4.5 -3.2 -0.8 0.9 1.1 1.2 1.1 -1.9 -1.5 -0.2 -0.9 – -16.9
Source: UNECE Common Database; national statistics; CIS Statistical Committee. Note: Establishment-based data for all countries except Romania and Turkey, for which labour force survey (LFS) data have been used. a Cumulative change for the period. b Excluding Bosnia and Herzegovina through 1991. c Excluding Republika Srpska. d Original LFS data are available from 1996 onwards. For earlier years the LFS data have been retropolated using the movement in the reported establishments-
based data. The whole time series has then been benchmarked to the 1992 and 2002 census results. e Data have been benchmarked to the 1989 and 2001 census results. f Excluding Transdniestria since 1993.

132 ________________________________________________________________ Economic Survey of Europe, 2005 No. 1
APPENDIX TABLE B.6
Employment in industry in south-east Europe and the CIS, 1990-2003 (Percentage change over the preceding year)
1990 1991 1992 1993 1994 1995 1996 1997 1998 1999 2000 2001 2002 2003
2003 over
1989 a
South-east Europe b ............................ -2.8 -5.8 -8.2 -7.4 0.9 -4.5 2.1 0.6 -1.9 -7.4 2.3 -1.4 2.6 -1.7 -26.5 Albania ................................................... .. .. .. .. .. -14.4 -10.1 3.8 -4.9 -2.3 -28.7 20.2 -0.5 -4.0 -39.2 Bosnia and Herzegovina c .................... .. .. -61.3 -64.6 11.0 104.2 17.4 21.9 7.6 0.2 – -4.8 -2.2 -4.5 -57.4 Bulgaria ................................................... -9.0 -17.9 -13.2 -8.3 -3.7 -2.2 -1.2 -4.4 -4.0 -9.2 -5.7 -1.4 0.3 0.4 -56.8 Croatia ..................................................... 2.4 -17.2 -17.1 0.2 -4.5 -11.6 -0.9 -4.0 5.9 -2.8 -2.2 -0.6 -1.0 1.3 -43.2 Romania d................................................ -3.5 -5.0 -13.2 -8.7 -5.5 -6.5 0.4 -3.2 -6.1 -7.4 -7.4 -2.6 4.8 0.6 -48.5 Serbia and Montenegro ........................ 0.9 -8.7 -5.3 -2.5 -2.7 -3.5 -1.8 -3.3 2.6 -9.4 -4.9 -2.8 -7.8 -6.3 -43.7 The former Yugoslav Republic of Macedonia ........................ -4.7 -8.4 -6.5 -5.1 -5.9 -13.4 -6.6 -7.8 -3.4 5.5 -4.5 7.1 -9.5 -3.8 -50.7 Turkey ..................................................... -0.3 2.8 6.2 -6.3 11.7 -3.3 6.3 6.3 -0.2 -7.8 14.4 -0.9 4.8 -2.8 32.3
CIS ........................................................... – -1.7 -5.0 -4.2 -10.0 -7.7 -5.1 -8.0 -3.7 -1.5 -0.4 -0.3 -1.1 -1.8 -40.7 Armenia e ................................................. 2.2 -7.8 -12.1 -11.1 -2.6 -15.6 -17.0 -11.5 -9.9 -8.3 -9.7 -7.4 -3.4 -3.0 -71.2 Azerbaijan ............................................... -2.9 -2.3 -6.3 -8.8 -4.6 -5.8 -19.7 -14.5 3.8 3.1 -3.7 -1.0 1.9 0.2 -47.8 Belarus .................................................... -1.4 -1.7 -4.9 -3.9 -4.6 -10.9 -1.2 0.2 1.4 0.8 -0.3 -1.2 -3.4 -1.0 -28.3 Georgia ................................................... 4.2 -11.2 -28.7 -14.4 -8.6 -9.4 -1.0 -0.5 -9.3 -8.3 5.9 -5.2 -3.3 -2.7 -63.8 Kazakhstan ............................................. -1.5 1.4 -3.7 -13.1 -8.0 -9.4 -3.9 -11.8 -2.0 0.1 -5.5 -2.9 -0.8 3.8 -45.3 Kyrgyzstan .............................................. -0.1 -4.7 -6.0 -10.0 -10.5 -15.0 -10.8 -6.1 -2.2 -7.6 -10.6 -0.4 -0.8 1.4 -58.5 Republic of Moldova f ............................ 2.4 -7.1 -2.1 -28.9 -5.3 -14.2 -2.0 -2.1 -4.7 -12.1 4.4 -1.2 3.6 -4.1 -63.2 Russian Federation ............................... 0.7 -1.8 -4.8 -2.4 -10.7 -7.6 -4.6 -8.9 -5.0 1.0 1.7 1.0 -1.1 -2.7 -37.6 Tajikistan ................................................. 2.5 -1.6 -2.6 -12.3 -4.9 -12.1 -1.1 -12.2 -3.8 -13.3 -8.6 1.2 -0.7 -5.9 -54.9 Turkmenistan .......................................... 4.2 -3.3 0.2 9.5 -0.1 4.4 3.9 10.9 13.0 1.8 5.9 5.7 5.0 2.4 84.1 Ukraine .................................................... -1.9 -0.8 -4.7 -5.2 -11.0 -7.8 -7.4 -8.5 -3.1 -8.3 -5.6 -3.9 -2.2 -1.8 -52.6 Uzbekistan .............................................. 1.5 -1.9 -2.7 1.7 -8.6 2.5 1.3 0.2 0.5 0.9 1.9 1.3 2.2 2.8 2.9
Total above b ......................................... -0.6 -2.6 -5.7 -4.9 -7.8 -7.0 -3.4 -5.9 -3.2 -3.1 0.3 -0.6 -0.2 -1.8 -37.4
Memorandum items: South-east Europe without Turkey b ................................................ -3.6 -9.1 -14.0 -8.0 -4.6 -5.1 -0.4 -3.0 -3.1 -7.2 -6.4 -1.8 0.7 -0.8 -46.8 CIS without Russian Federation ...... -1.0 -1.6 -5.1 -6.8 -9.0 -7.8 -5.8 -6.6 -1.8 -5.0 -3.6 -2.3 -1.2 -0.4 -45.1 Low-income CIS ................................... 1.3 -4.6 -7.2 -10.3 -6.9 -6.1 -5.4 -4.5 -1.8 -3.0 -0.9 -0.4 1.1 0.6 -39.2 Caucasian CIS ...................................... 0.9 -6.8 -14.4 -10.9 -4.7 -10.3 -14.8 -10.1 -4.4 -3.5 -3.3 -3.9 -1.0 -1.4 -60.7 Central Asian CIS ................................ 0.2 -0.7 -3.3 -6.7 -7.8 -4.9 -1.7 -5.0 0.1 -0.7 -1.7 0.2 1.2 2.6 -25.3 European CIS ....................................... -1.7 -1.2 -4.7 -6.4 -9.9 -8.5 -6.3 -6.9 -2.3 -6.7 -4.4 -3.2 -2.3 -1.7 -49.5 EU-8 ....................................................... -4.9 -7.1 -9.5 -6.3 -4.1 0.4 -1.0 -0.2 -0.7 -4.8 -3.7 -1.3 -2.5 -1.2 -38.4
Source: UNECE Common Database; national statistics; CIS Statistical Committee. Note: Establishment-based data for all countries except Romania and Turkey, for which labour force survey (LFS) data have been used. a Cumulative change for the period. b Excluding Albania through 1994 and Bosnia and Herzegovina through 1991. c Excluding Republika Srpska. d Original LFS data are available from 1996 onwards. For earlier years the LFS data have been retropolated using the movement in the reported establishments-
based data. The whole time series has then been benchmarked to the 1992 and 2002 census results. e Data have been benchmarked to the 1989 and 2001 census results. f Excluding Transdniestria since 1993.

Statistical Appendix_________________________________________________________________________________ 133
APPENDIX TABLE B.7
Registered unemployment in south-east Europe and the CIS, 1990-2003 (Per cent of labour force, end of period)
1990 1991 1992 1993 1994 1995 1996 1997 1998 1999 2000 2001 2002 2003
South-east Europe a ............................ .. 8.4 11.0 11.4 11.3 10.1 9.3 10.5 11.1 12.3 11.8 12.4 13.4 13.0 Albania .................................................... 9.5 9.2 27.0 22.0 18.0 13.1 12.4 14.9 17.7 18.4 16.8 16.4 15.8 15.0 Bosnia and Herzegovina ....................... .. .. .. .. .. .. .. 39.0 38.7 39.0 39.4 39.9 42.7 44.0 Bulgaria ................................................... 1.8 11.1 15.3 16.4 12.8 11.1 12.5 13.7 12.2 16.0 17.9 17.9 16.3 13.5 Croatia ..................................................... .. 14.1 17.8 16.6 17.3 17.6 15.9 17.6 18.1 20.4 22.3 22.8 21.3 18.7 Romania .................................................. 1.3 3.0 8.2 10.4 10.9 9.5 6.6 8.8 10.3 11.5 10.5 8.8 8.4 7.2 Serbia and Montenegro b ...................... .. 21.0 24.6 24.0 23.9 24.7 26.1 25.6 27.2 27.4 26.6 28* 26* 28* The former Yugoslav Republic of Macedonia ............................................ .. 24.5 26.2 27.7 30.0 36.6 38.8 41.7 32.3 44.0 45.1 41.8 45.3 45.3 Turkey c ................................................... 8.2 7.9 7.9 7.6 8.1 6.9 6.1 6.4 6.8 7.6 6.5 8.3 10.3 10.5
CIS ........................................................... .. .. 0.6 1.0 1.5 2.5 2.9 2.8 2.9 2.4 2.3 2.2 2.3 2.4 Armenia ................................................... .. .. 3.5 6.3 6.0 8.1 9.7 11.0 8.9 11.5 10.9 9.8 9.1 9.8 Azerbaijan ............................................... .. .. 0.2 0.7 0.9 1.1 1.1 1.3 1.4 1.2 1.2 1.3 1.3 1.4 Belarus .................................................... .. .. 0.5 1.3 2.1 2.7 4.0 2.8 2.3 2.0 2.1 2.3 3.0 3.1 Georgia ................................................... .. .. 0.3 2.0 3.8 3.4 3.2 8.0 4.2 5.6 6.0 5.0 4.0 2.5* Kazakhstan ............................................. .. .. 0.4 0.6 1.0 2.1 4.1 3.9 3.7 3.9 3.7 2.8 2.6 1.8 Kyrgyzstan .............................................. .. .. 0.1 0.2 0.8 3.0 4.5 3.1 3.1 3.0 3.1 3.1 3.1 3.0 Republic of Moldova .............................. .. .. 0.7 0.7 1.0 1.4 1.5 1.7 1.9 2.1 1.8 1.7 1.5 1.2 Russian Federation ............................... .. .. 0.8 1.1 2.1 3.2 3.4 2.8 2.7 1.7 1.4 1.6 1.8 2.3 Tajikistan ................................................. .. .. 0.4 1.1 1.8 1.8 2.4 2.8 2.9 3.1 3.0 2.6 2.7 2.4 Turkmenistan .......................................... .. .. .. .. .. .. .. .. .. .. .. .. .. .. Ukraine .................................................... .. .. 0.3 0.4 0.3 0.6 1.5 2.8 4.3 4.3 4.2 3.7 3.8 3.6 Uzbekistan .............................................. .. .. 0.1 0.2 0.3 0.3 0.3 0.3 0.4 0.4 0.4 0.4 0.4 0.3
Total above ............................................ .. .. 3.3 3.7 4.1 4.4 4.5 4.8 5.1 4.9 4.7 4.8 5.2 5.1
Memorandum items: South-east Europe without Turkey a ................................................ .. .. 14.2 15.0 14.6 13.6 12.8 15.0 15.9 17.8 17.8 17.3 17.0 15.9 CIS without Russian Federation ...... .. .. 0.4 0.8 0.9 1.4 2.2 2.8 3.3 3.3 3.3 2.9 3.0 2.6 Low-income CIS ................................... .. .. 0.5 1.2 1.5 1.8 2.0 2.4 2.2 2.3 2.3 2.1 2.0 1.6 Caucasian CIS ...................................... .. .. 1.0 2.5 3.1 3.7 3.9 5.6 4.0 4.5 4.5 4.0 3.5 3.2 Central Asian CIS ................................ .. .. 0.2 0.5 0.8 1.3 2.2 2.0 2.1 2.0 2.0 1.7 1.7 1.2 European CIS ........................................ .. .. 0.4 0.6 0.6 1.0 1.9 2.7 3.9 3.9 3.8 3.4 3.6 3.4 Russian Federation d .......................... .. .. 5.2 6.1 7.8 9.0 10.0 11.2 13.3 12.2 9.8 8.7 8.8 8.2
Source: UNECE Common Database; national statistics; CIS Statistical Committee. a Excluding Bosnia and Herzegovina through 1996. b Since 1999, excluding Kosovo and Metohia. c Annual average, labour force survey data. d Based on Rosstat’s monthly estimates according to the ILO definition, i.e. including all persons not having employment but actively seeking work.

134 ________________________________________________________________ Economic Survey of Europe, 2005 No. 1
APPENDIX TABLE B.8
Consumer prices in south-east Europe and the CIS, 1990-2003 (Percentage change over preceding year)
1990 1991 1992 1993 1994 1995 1996 1997 1998 1999 2000 2001 2002 2003
South-east Europe ........................ .. 69.2 143.4 251.9 120.3 25.3 34.1 82.5 50.3 43.1 44.6 45.0 35.0 21.0 Albania ............................................ .. 35.5 226.0 85.0 22.5 8.0 12.7 33.1 20.3 -0.1 – 3.1 5.3 2.5 Bosnia and Herzegovina ............... 594.0 116.2 83 327.6 32 662.0 581.6 -12.1 -21.2 11.8 4.9 -0.6 1.7 1.8 0.9 0.2 Bulgaria ........................................... 23.8 338.5 79.4 56.1 87.1 62.1 121.6 1 058.4 18.7 2.6 10.3 7.4 5.8 2.3 Croatia ............................................. 597.1 124.2 634.0 1 486.3 107.2 2.0 3.6 3.7 5.2 3.5 5.4 4.7 1.8 2.2 Romania .......................................... 5.1 170.2 210.4 256.1 136.7 32.2 38.8 154.9 59.3 45.9 45.7 34.5 22.5 15.4 Serbia and Montenegro ................. 580.0 122.0 8 926.0 2.2E+14 3.3 71.8 90.5 23.2 30.4 44.1 77.5 90.4 19.3 9.6 The former Yugoslav Republic of Macedonia ................ 596.6 110.8 1 511.3 362.0 128.3 16.4 2.5 0.9 -1.4 -1.3 6.6 5.2 2.3 1.1 Turkey ............................................. 60.3 66.0 70.1 66.1 105.2 92.3 82.7 85.4 84.6 65.0 55.2 54.3 44.9 25.4
CIS ................................................... 5.3 148.9 2 237.2 897.1 341.5 215.2 48.6 16.8 19.3 57.6 24.3 20.9 15.0 13.3 Armenia ........................................... 6.9 174.1 728.7 3 731.8 4 962.3 175.5 18.7 13.8 8.7 0.7 -0.8 3.2 1.0 4.7 Azerbaijan ....................................... 6.1 106.6 912.3 1 129.1 1 663.5 411.5 19.8 3.6 -0.8 -8.6 1.8 1.5 2.8 2.1 Belarus ............................................ 4.7 94.1 970.8 1 190.2 2 221.0 709.3 52.7 63.9 73.2 293.7 168.9 61.4 42.8 28.5 Georgia ........................................... 4.2 78.7 1 176.9 4 084.9 22 470.0 261.4 39.4 7.1 3.5 19.3 4.2 4.6 5.7 4.9 Kazakhstan ..................................... 5.6 114.5 1 514.8 1 658.4 1 877.4 176.3 39.2 17.5 7.3 8.4 13.4 8.5 6.0 6.6 Kyrgyzstan ...................................... 5.5 113.9 854.6 1 208.7 278.1 43.5 32.0 23.4 10.5 35.9 18.7 6.9 2.1 3.1 Republic of Moldova ...................... 5.7 101.1 1 108.7 1 183.7 486.8 29.9 23.5 11.8 7.7 39.3 31.3 9.8 5.3 11.7 Russian Federation ....................... 5.2 160.0 2 510.0 840.0 220.0 197.4 47.8 14.7 27.8 85.7 20.8 21.6 16.0 13.6 Tajikistan ......................................... 5.9 112.9 906.8 2 136.1 239.4 682.1 422.4 85.4 43.1 27.5 32.9 38.6 12.2 16.3 Turkmenistan .................................. .. .. .. .. .. .. .. .. .. .. .. .. .. .. Ukraine ............................................ 5.4 94.0 1 527.0 4 734.9 891.2 376.7 80.2 15.9 10.6 22.7 28.2 12.0 0.8 5.2 Uzbekistan ...................................... 5.8 97.3 414.5 1 231.8 1 550.0 76.5 54.0 58.8 17.7 29.0 24.9 .. .. ..
Memorandum items: South-east Europe without Turkey .......................................... .. 75.3 274.9 402.9 124.4 9.5 14.0 80.7 26.9 21.4 30.4 30.2 16.2 10.7 CIS without Russian Federation ................................... 5.7 105.6 886.7 1 644.3 1 199.3 237.7 49.5 19.2 10.3 23.2 30.7 19.8 13.1 12.6 Low-income CIS ........................... 5.7 105.3 753.7 1 245.7 1 098.5 211.3 33.5 22.4 9.6 16.7 15.0 .. .. .. Caucasian CIS .............................. 6.1 112.1 895.7 1 447.2 3 728.4 285.1 24.9 7.1 2.9 2.5 2.0 3.1 3.4 3.8 Central Asian CIS ........................ 5.6 106.9 785.6 1 361.6 1 143.5 176.4 44.2 29.1 11.6 17.3 18.6 .. .. .. European CIS ................................ 5.6 99.1 1 216.7 2 335.8 756.8 298.3 74.9 16.9 12.8 39.0 51.1 26.1 16.4 16.0 EU-8 ...............................................- 66.6 60.2 32.9 32.6 24.0 21.8 16.6 12.7 10.8 6.5 8.5 5.9 2.7 2.0
Source: UNECE Common Database; national statistics; CIS Statistical Committee. Note: Based on annual data reported by national statistical offices for 1990-1994 and monthly statistics from 1995 onwards. All CIS aggregates exclude
Turkmenistan. Data for regional aggregates, in some cases, are estimated from partial regional totals.

Statistical Appendix_________________________________________________________________________________ 135
APPENDIX TABLE B.9
Producer prices in industry a in south-east Europe and the CIS, 1990-2003 (Percentage change over preceding year)
1990 1991 1992 1993 1994 1995 1996 1997 1998 1999 2000 2001 2002 2003
South-east Europe b .................. .. .. .. .. .. 37.2 40.7 84.1 42.2 38.7 46.9 50.5 37.9 22.2 Albania .......................................... .. .. .. .. .. .. .. .. .. .. 4.9 -5.4 6.4 6.2 Bosnia and Herzegovina ............. .. 129.5 68 034.0 9 254.5 1 203.3 68.7 -4.8 3.2 3.6 4.3 0.9 2.3 0.7 2.6 Bulgaria ......................................... 14.7 296.4 56.1 28.3 75.7 50.7 132.7 971.0 16.6 3.3 17.0 3.6 1.3 4.9 Croatia ........................................... 455.3 146.3 825.2 1 512.4 77.6 0.8 1.3 3.7 -1.5 2.5 9.6 3.4 -0.5 1.9 Romania ........................................ 26.9 220.1 184.8 165.0 140.5 35.3 50.0 144.0 33.2 41.2 53.4 41.0 24.6 21.1 Serbia and Montenegro .............. 468.0 124.0 8 993.0 1.4E+13 7.6 75.7 88.8 20.6 25.9 43.3 105.4 84.4 10.9 5.8 The former Yugoslav Republic of Macedonia .............. 394.0 112.0 2 198.2 258.3 88.9 4.7 – 4.0 3.5 – 9.1 2.7 -0.6 – Turkey c ......................................... .. .. .. .. .. 86.0 75.9 81.8 71.8 53.1 51.4 61.6 50.1 25.6
CIS ................................................. 3.8 229.1 3 182.5 989.4 333.0 250.5 49.0 14.6 7.7 49.7 44.0 18.8 12.1 16.2 Armenia ......................................... 2.0 120.0 947.0 892.0 4 714.0 187.8 36.3 21.7 6.0 4.1 -0.4 1.1 3.6 3.7 Azerbaijan ..................................... .. 179.5 7 453.6 1 974.0 3 779.0 1 340.1 70.6 11.4 -5.5 -1.3 9.4 -2.6 3.3 18.6 Belarus .......................................... 2.1 151.1 1 939.2 1 536.3 2 171.0 538.6 35.7 89.4 72.8 355.7 185.6 71.7 40.6 37.4 Georgia ......................................... .. .. .. .. .. .. .. .. 2.2 15.5 5.8 3.6 6.0 2.6 Kazakhstan ................................... .. 193.0 2 465.1 1 042.8 2 920.4 139.7 23.8 15.6 0.8 19.0 38.0 0.4 0.3 9.5 Kyrgyzstan .................................... .. 160.0 1 664.0 831.0 228.0 15.8 28.4 23.4 8.9 51.1 29.6 9.6 5.5 7.5 Republic of Moldova .................... .. 130.0 1 210.9 1 078.5 893.7 52.2 30.2 14.9 9.7 47.1 33.6 12.6 8.0 8.3 Russian Federation ..................... 3.9 240.0 3 280.0 900.0 230.0 237.6 50.8 15.0 7.0 59.1 46.5 19.1 11.8 15.6 Tajikistan ....................................... .. 163.0 1 316.5 1 080.0 327.8 351.7 340.7 103.7 28.4 45.6 39.0 25.1 9.1 15.3 Turkmenistan ................................ .. .. .. .. .. .. .. .. .. .. .. .. .. .. Ukraine .......................................... .. 163.4 4 128.5 9 667.5 774.0 488.9 52.1 7.8 13.2 31.1 20.8 8.6 3.1 7.8 Uzbekistan .................................... .. 147.0 1 296.0 1 119.0 1 066.0 792.5 128.5 53.9 40.0 38.0 61.1 .. .. ..
Memorandum items: South-east Europe without Turkey c ...................................... 46.1 217.4 316.9 543.7 102.7 19.9 21.4 85.9 19.1 22.7 40.8 34.1 16.3 14.7 CIS without Russian Federation ................................. .. 154.3 2 109.1 2 700.1 1 036.0 277.6 45.6 13.8 9.1 32.1 38.6 18.2 13.0 18.0 Low-income CIS ......................... .. 153.3 1 613.0 916.3 762.2 296.5 66.1 21.9 6.8 17.7 25.2 .. .. .. Caucasian CIS ............................ .. 117.0 2 088.7 1 547.7 3 998.5 658.7 62.9 13.3 -2.2 2.8 6.9 -0.7 4.0 12.5 Central Asian CIS ...................... .. 167.6 1 904.3 927.4 1 491.1 132.6 31.3 21.1 6.8 25.1 41.3 9.1 4.3 9.6 European CIS .............................. .. 113.5 3 043.5 7 999.6 781.2 456.4 51.3 9.3 14.9 45.9 44.1 26.2 17.3 21.2 EU-8 .............................................. 52.6 55.4 24.3 22.2 15.7 18.2 11.0 10.1 6.4 3.8 7.9 3.2 0.5 1.7
Source: UNECE Common Database; national statistics; CIS Statistical Committee. Note: Based on annual data reported by national statistical offices for 1990-1994 and monthly statistics from 1995 onwards. All CIS aggregates exclude
Turkmenistan. Data for regional aggregates, in some cases, are estimated from partial regional totals. a Industry = mining + manufacturing + utilities. b Excluding Albania. c Wholesale price index.

136 ________________________________________________________________ Economic Survey of Europe, 2005 No. 1
APPENDIX TABLE B.10
Nominal gross wages per employee in industry a in south-east Europe and the CIS, 1990-2003 (Percentage change over preceding year)
1990 1991 1992 1993 1994 1995 1996 1997 1998 1999 2000 2001 2002 2003
South-east Europe b ..................... 58.6 104.1 156.9 100.4 92.0 32.1 43.4 84.9 51.1 48.8 48.7 37.5 28.8 .. Albania ........................................... .. .. .. .. .. .. .. .. .. .. .. .. .. .. Bosnia and Herzegovina .............. .. .. .. .. .. .. 247.3 30.6 34.9 10.5 12.1 .. .. .. Bulgaria .......................................... 20.8 175.5 132.8 55.1 53.9 57.7 90.4 882.9 34.5 5.8 12.4 0.2 4.1 7.2 Croatia ............................................ .. .. .. .. .. 31.7 14.2 10.7 10.0 5.8 6.0 7.9 6.7 5.3 Romania ......................................... 6.4 138.6 178.3 210.7 139.4 55.3 56.7 99.5 49.3 40.7 48.9 48.2 23.2 .. Serbia and Montenegro c ............... 400.0 100.6 4 886.4 -62.5 229.6 74.1 74.5 41.7 39.6 24.6 115.2 110.5 .. .. The former Yugoslav Republic of Macedonia c .............. 433.6 79.2 1 083.7 454.0 105.8 11.1 3.6 2.3 3.1 1.5 7.0 0.5 4.4 2.0 Turkey d .............................................. 83.2 93.1 58.8 82.6 53.1 65.2 73.6 100.9 77.5 78.5 56.8 37.5 37.4 21.2
CIS .................................................. 12.6 91.4 1 039.8 793.4 310.2 138.0 58.4 22.4 14.9 51.2 52.3 48.4 31.8 20.9 Armenia .......................................... 5.9 31.8 352.3 739.1 3 640.2 210.9 62.3 41.7 20.5 15.2 19.5 22.3 12.6 31.8 Azerbaijan ...................................... 4.4 82.9 870.4 700.8 575.7 354.8 53.0 58.2 19.8 18.1 33.3 14.6 13.6 20.2 Belarus ........................................... 14.1 112.1 910.9 1 073.8 69.6 618.7 58.5 96.8 109.4 323.9 197.1 101.8 48.5 35.8 Georgia .......................................... 6.0 33.9 457.3 2 117.2 23 300.5 112.6 145.4 12.7 26.8 23.2 33.8 19.6 14.2 .. Kazakhstan .................................... 11.0 80.5 1 053.1 993.1 1 542.5 178.2 30.9 22.5 7.8 21.6 26.1 15.3 10.4 12.6 Kyrgyzstan ..................................... 0.5 62.1 773.1 615.1 176.3 54.8 29.1 60.3 20.0 43.2 0.9 18.1 20.7 12.1 Republic of Moldova ..................... 14.2 90.1 815.0 773.0 284.4 43.8 32.2 24.9 16.6 22.5 31.8 20.9 21.2 26.8 Russian Federation ...................... 13.0 94.9 1 065.7 798.2 260.2 131.4 64.3 21.6 14.3 52.2 48.8 46.8 27.7 29.2 Tajikistan ........................................ 8.0 76.2 550.2 917.5 142.2 145.2 425.3 71.9 96.4 26.4 31.5 51.1 29.7 .. Turkmenistan ................................. .. 83.8 1 010.1 1 467.7 622.2 686.2 915.3 121.5 27.1 28.6 75.7 53.0 .. .. Ukraine ........................................... 39.0 107.9 1 419.0 2 286.1 737.8 408.5 71.5 13.5 7.1 18.3 37.3 34.4 19.5 21.9 Uzbekistan ..................................... .. 82.3 706.1 1 159.3 806.8 278.4 99.8 76.3 60.3 50.0 .. .. .. ..
Memorandum items: South-east Europe without Turkey b ........................................... 19.1 117.7 383.7 118.9 113.9 23.1 32.2 78.6 34.9 23.9 37.5 39.6 15.4 .. CIS without Russian Federation .................................. .. 71.9 867.1 689.9 778.4 164.4 39.1 25.1 16.5 48.3 67.1 55.3 33.8 28.9 Low-income CIS .......................... 4.7 73.8 841.2 623.2 355.3 119.1 58.5 43.1 24.2 24.5 22.9 21.4 18.7 .. Caucasian CIS ............................. 2.8 67.7 787.6 736.7 1 587.0 229.6 73.9 40.8 22.6 19.2 29.3 18.1 15.1 24.0 Central Asian CIS ....................... 4.0 63.5 854.8 786.6 873.6 164.2 32.4 25.4 10.5 24.0 23.3 16.7 12.3 16.0 European CIS ............................... .. 82.2 836.7 491.5 305.8 83.4 39.4 48.0 56.2 206.5 174.4 95.9 46.4 35.8 EU-8 ............................................... .. .. .. 26.2 30.6 24.6 22.0 17.0 12.8 9.0 9.3 8.2 2.8 5.2
Source: UNECE Common Database; national statistics; CIS Statistical Committee. Note: The aggregates are calculated from average wage per employee in dollars, converted from national currencies at PPP for 2000. Data for regional aggregates,
in some cases, are estimated from partial regional totals. a Industry = mining + manufacturing + utilities. b Excluding Albania. c 1990-1998 – estimates on the basis of net wages in industry. d Average compensation per employee in industry.

Statistical Appendix_________________________________________________________________________________ 137
APPENDIX TABLE B.11
Merchandise exports of eastern Europe and the CIS, 1993-2003 (Billion dollars)
1993 1994 1995 1996 1997 1998 1999 2000 2001 2002 2003
New EU members ............................... 55.549 64.224 86.419 89.460 96.741 108.773 108.156 121.682 134.764 152.923 197.458 Cyprus ................................................... 0.868 0.967 1.229 1.393 1.246 1.064 1.000 0.951 0.978 0.843 0.921 Czech Republic ..................................... 14.463 15.882 21.273 22.180 22.779 26.351 26.265 29.052 33.397 38.488 48.723 Estonia .................................................. 0.802 1.305 1.838 2.079 2.934 3.236 2.938 3.174 3.309 3.428 4.511 Hungary ................................................ 8.921 10.701 12.867 15.704 19.100 23.005 25.012 28.092 30.498 34.337 42.480 Latvia .................................................... 1.401 0.988 1.304 1.443 1.673 1.812 1.723 1.865 2.001 2.279 2.877 Lithuania ............................................... 1.994 2.031 2.705 3.355 3.860 3.711 3.004 3.809 4.583 5.519 7.212 Malta ..................................................... 1.357 1.567 5.416 1.734 1.385 1.540 1.983 2.447 1.957 2.215 2.461 Poland ................................................... 14.202 17.240 22.887 24.440 25.756 28.229 27.407 31.651 36.085 41.010 53.577 Slovakia ................................................ 5.458 6.714 8.585 8.822 9.640 10.775 10.277 11.908 12.704 14.478 21.960 Slovenia ................................................ 6.083 6.828 8.316 8.310 8.369 9.050 8.546 8.732 9.252 10.326 12.737 South-east Europe .............................. .. .. 42.485 43.975 48.046 48.738 47.173 51.770 57.055 65.245 83.800 Albania .................................................. 0.123 0.139 0.202 0.213 0.137 0.207 0.352 0.261 0.305 0.330 0.446 Bosnia and Herzegovina ....................... .. .. 0.024 0.058 0.193 0.352 0.750 1.069 1.027 1.001 1.355 Bulgaria ................................................. 3.769 3.935 5.345 4.890 4.940 4.194 4.006 4.825 5.113 5.692 7.439 Croatia .................................................. 3.709 4.260 4.633 4.512 4.171 4.541 4.302 4.432 4.666 4.904 6.164 Romania ................................................ 4.892 6.151 7.910 8.085 8.431 8.302 8.487 10.367 11.385 13.869 17.618 Serbia and Montenegro ........................ .. .. 1.531 1.846 2.677 2.858 1.498 1.723 1.903 2.275 2.537 The former Yugoslav Republic of Macedonia .......................................... 1.055 1.086 1.204 1.147 1.237 1.311 1.191 1.319 1.323 1.116 1.363 Turkey ................................................... 15.345 18.106 21.637 23.224 26.261 26.974 26.587 27.775 31.334 36.059 46.878 CIS total ............................................... .. 90.929 113.172 125.647 123.181 106.160 106.030 145.928 144.248 152.864 193.016 of which: non-CIS ................................. 52.547 61.751 79.800 88.922 86.539 76.657 83.146 116.681 113.768 122.470 154.126
Armenia .............................................. 0.156 0.216 0.271 0.290 0.233 0.221 0.232 0.301 0.342 0.505 0.678 Non-CIS .......................................... 0.029 0.058 0.101 0.162 0.138 0.140 0.175 0.227 0.253 0.409 0.551
Azerbaijan .......................................... 0.725 0.653 0.637 0.631 0.781 0.606 0.929 1.745 2.314 2.168 2.592 Non-CIS .......................................... 0.351 0.378 0.352 0.341 0.403 0.374 0.718 1.510 2.091 1.924 2.258
Belarus ............................................... .. 2.510 4.707 5.652 7.301 7.070 5.909 7.331 7.448 8.021 9.964 Non-CIS .......................................... 0.789 1.031 1.777 1.888 1.922 1.910 2.287 2.927 2.957 3.637 4.511
Georgia .............................................. .. 0.156 0.154 0.199 0.240 0.193 0.238 0.330 0.320 0.348 0.482 Non-CIS .......................................... 0.069 0.039 0.057 0.070 0.102 0.085 0.131 0.198 0.176 0.179 0.242
Kazakhstan ........................................ .. 3.231 5.250 5.911 6.497 5.436 5.592 9.126 8.639 9.670 12.900 Non-CIS .......................................... 1.501 1.357 2.366 2.732 3.515 3.266 4.100 6.750 5.995 7.476 9.946
Kyrgyzstan ......................................... 0.396 0.340 0.409 0.505 0.604 0.514 0.454 0.505 0.476 0.486 0.582 Non-CIS .......................................... 0.112 0.117 0.140 0.112 0.285 0.283 0.271 0.297 0.308 0.317 0.380
Republic of Moldova .......................... 0.483 0.565 0.746 0.795 0.875 0.632 0.464 0.472 0.568 0.644 0.790 Non-CIS .......................................... 0.178 0.159 0.279 0.252 0.267 0.203 0.211 0.196 0.222 0.293 0.367
Russian Federation a ........................... .. 67.800 82.419 90.600 86.895 74.444 75.551 105.033 101.900 107.200 134.800 Non-CIS .......................................... 44.297 52.100 65.400 72.000 67.800 58.700 63.600 90.800 86.600 91.000 114.000
Tajikistan ............................................ 0.350 0.492 0.749 0.770 0.746 0.597 0.689 0.784 0.652 0.737 0.798 Non-CIS .......................................... 0.227 0.399 0.497 0.439 0.473 0.394 0.374 0.411 0.440 0.549 0.659
Turkmenistan ..................................... .. 2.145 1.881 1.682 0.751 0.594 1.190 2.500 2.620 2.616 3.160 Non-CIS .......................................... 1.049 0.494 0.951 0.610 0.300 0.442 0.700 1.200 1.170 1.178 1.710
Ukraine ............................................... 7.817 10.272 13.128 14.401 14.232 12.637 11.582 14.573 16.265 17.957 23.080 Non-CIS .......................................... 3.223 4.653 6.168 6.996 8.646 8.435 8.329 10.075 11.589 13.580 17.032
Uzbekistan b ....................................... .. 2.549 2.821 4.211 4.026 3.218 3.200 3.230 2.704 2.513 3.189 Non-CIS .......................................... 0.721 0.966 1.712 3.321 2.689 2.425 2.250 2.090 1.968 1.930 2.469
Total above .......................................... .. .. 242.076 259.081 267.968 263.671 261.359 319.380 336.067 371.031 474.273 Memorandum items: Baltic states ......................................... 4.197 4.324 5.846 6.877 8.467 8.759 7.665 8.848 9.893 11.226 14.599 Central Europe .................................... 49.127 57.365 73.928 79.456 85.644 97.410 97.508 109.436 121.937 138.638 179.476 South-east Europe without Turkey ... .. .. 20.848 20.751 21.785 21.764 20.586 23.995 25.721 29.186 36.922 CIS without Russian Federation ....... .. 23.129 30.753 35.047 36.286 31.716 30.479 40.895 42.348 45.664 58.216 Caucasian CIS ..................................... .. 1.025 1.062 1.120 1.253 1.019 1.399 2.376 2.976 3.021 3.752 Central Asian CIS ................................ .. 8.757 11.110 13.079 12.625 10.358 11.125 16.145 15.091 16.022 20.629 European CIS ...................................... .. 13.347 18.581 20.848 22.408 20.339 17.955 22.375 24.281 26.622 33.835
Source: UNECE secretariat calculations, based on national statistics and direct communications from national statistical offices. Note: Changes in the method of recording trade are reflected from 1993 in data for the Czech Republic (inclusion of OPT transactions, etc.), from 1995 in Latvia (imports
registered c.i.f.) and Lithuania (change from special to general system), from 1996 in Hungary (inclusion of trade flows of free trade zones), from 1997 in Slovakia (inclusion of OPT transactions, etc.) and from 2000 in Estonia (change from general to special trade system). All trade values are expressed in dollars at prevailing market exchange rates.
a Russian Federal State Statistics Service (Rosstat) data including trade flows not crossing the Russian borders such as off-board fish sales and estimates of value of goods exported or imported by individuals within an approved duty-free quota.
b National data adjusted for trade in services: from 2001 by UNECE secretariat, for previous years by the CIS Statistical Committee.

138 ________________________________________________________________ Economic Survey of Europe, 2005 No. 1
APPENDIX TABLE B.12
Merchandise imports of eastern Europe and the CIS, 1993-2003 (Billion dollars)
1993 1994 1995 1996 1997 1998 1999 2000 2001 2002 2003
New EU members ................................ 67.780 78.180 102.684 120.628 131.154 144.766 141.759 155.908 166.086 184.484 232.689 Cyprus .................................................... 2.648 3.013 3.696 3.986 3.695 3.677 3.630 3.627 3.944 4.072 4.472 Czech Republic ...................................... 14.617 17.427 25.265 27.919 27.563 28.789 28.126 32.183 36.472 40.736 51.306 Estonia ................................................... 0.896 1.659 2.540 3.231 4.441 4.786 4.108 4.252 4.294 4.780 6.471 Hungary ................................................. 12.648 14.554 15.466 18.144 21.234 25.706 28.008 32.080 33.682 37.612 47.526 Latvia ..................................................... 0.961 1.240 1.818 2.320 2.724 3.189 2.946 3.189 3.507 4.040 5.210 Lithuania ................................................ 2.244 2.352 3.649 4.559 5.644 5.794 4.834 5.457 6.353 7.769 9.894 Malta ...................................................... 2.175 2.431 2.940 2.799 2.550 2.667 2.847 3.405 2.722 2.831 3.391 Poland .................................................... 18.758 21.566 29.043 37.137 42.314 47.054 45.911 48.940 50.275 55.113 68.004 Slovakia ................................................. 6.332 6.634 8.777 11.112 11.622 13.006 11.265 12.660 14.689 16.629 22.604 Slovenia ................................................. 6.501 7.304 9.492 9.421 9.367 10.098 10.083 10.116 10.148 10.902 13.811
South-east Europe ............................... .. .. 64.693 75.780 82.654 80.759 73.813 91.923 84.846 101.580 133.904 Albania ................................................... 0.421 0.549 0.650 0.913 0.620 0.795 0.903 1.070 1.317 1.488 1.848 Bosnia and Herzegovina ........................ .. .. 0.524 1.204 1.555 2.120 3.297 3.106 3.240 3.741 4.568 Bulgaria .................................................. 5.120 4.272 5.638 5.074 4.932 4.957 5.515 6.507 7.261 7.903 10.742 Croatia ................................................... 4.166 5.229 7.510 7.788 9.104 8.383 7.799 7.887 9.147 10.722 14.199 Romania ................................................. 6.522 7.109 10.278 11.435 11.280 11.838 10.557 13.055 15.552 17.857 24.003 Serbia and Montenegro ......................... .. .. 2.665 4.113 4.826 4.830 3.296 3.711 4.837 6.320 7.510 The former Yugoslav Republic of Macedonia ........................................... 1.199 1.484 1.719 1.627 1.779 1.915 1.776 2.085 2.094 1.995 2.300 Turkey .................................................... 29.428 23.270 35.709 43.627 48.559 45.921 40.671 54.503 41.399 51.554 68.734
CIS: total ............................................... .. 74.976 95.470 107.587 112.731 95.162 70.542 81.786 94.365 103.664 131.497 of which: non-CIS .................................. 33.696 44.899 56.861 63.607 71.815 61.760 44.571 47.881 59.443 68.985 87.449
Armenia ............................................... 0.255 0.394 0.674 0.856 0.892 0.902 0.811 0.885 0.877 0.987 1.269 Non-CIS ........................................... 0.087 0.188 0.340 0.578 0.593 0.672 0.624 0.711 0.659 0.685 0.960
Azerbaijan ........................................... 0.629 0.778 0.668 0.961 0.794 1.077 1.036 1.172 1.431 1.666 2.626 Non-CIS ........................................... 0.241 0.292 0.440 0.621 0.443 0.673 0.711 0.797 0.986 1.015 1.775
Belarus ................................................ .. 3.066 5.564 6.939 8.689 8.549 6.674 8.574 8.178 9.092 11.505 Non-CIS ........................................... 1.119 0.974 1.887 2.369 2.872 2.995 2.385 2.551 2.512 2.797 3.499
Georgia ............................................... .. 0.338 0.385 0.687 0.944 0.884 0.602 0.651 0.685 0.731 1.144 Non-CIS ........................................... 0.167 0.066 0.231 0.417 0.603 0.617 0.377 0.423 0.428 0.441 0.778
Kazakhstan ......................................... .. 3.561 3.807 4.241 4.301 4.350 3.687 5.051 6.446 6.584 8.327 Non-CIS ........................................... 0.494 1.384 1.154 1.295 1.969 2.290 2.089 2.295 3.137 3.541 4.407
Kyrgyzstan .......................................... 0.448 0.317 0.522 0.838 0.709 0.842 0.600 0.554 0.467 0.587 0.717 Non-CIS ........................................... 0.112 0.107 0.168 0.351 0.273 0.401 0.341 0.256 0.210 0.264 0.307
Republic of Moldova ........................... 0.628 0.659 0.841 1.072 1.172 1.024 0.587 0.776 0.893 1.039 1.403 Non-CIS ........................................... 0.184 0.183 0.272 0.420 0.567 0.584 0.345 0.517 0.552 0.630 0.809
Russian Federation a ............................... .. 50.500 62.603 68.000 71.983 58.015 39.537 44.862 53.764 61.000 75.700 Non-CIS ........................................... 26.807 36.500 44.300 47.200 53.400 43.700 29.200 31.400 40.700 48.800 60.000
Tajikistan ............................................. 0.630 0.547 0.810 0.668 0.750 0.711 0.663 0.675 0.688 0.721 0.881 Non-CIS ........................................... 0.374 0.314 0.332 0.285 0.268 0.265 0.148 0.115 0.150 0.173 0.282
Turkmenistan ...................................... .. 1.468 1.364 1.011 1.183 1.008 1.500 1.780 2.349 1.857 2.242 Non-CIS ........................................... 0.501 0.782 0.619 0.450 0.531 0.530 1.000 1.100 1.146 1.103 1.492
Ukraine ................................................ 9.533 10.745 15.484 17.603 17.128 14.676 11.846 13.956 15.775 16.977 23.021 Non-CIS ........................................... 2.652 2.907 5.488 6.427 7.249 6.779 5.103 5.916 6.943 8.009 11.512
Uzbekistan b ........................................ .. 2.603 2.748 4.712 4.186 3.125 3.000 2.850 2.812 2.425 2.662 Non-CIS ........................................... 0.958 1.202 1.630 3.195 3.047 2.256 2.250 1.800 2.021 1.527 1.628
Total above ........................................... .. .. 262.847 303.996 326.538 320.686 286.114 329.618 345.297 389.728 498.090
Memorandum items: Baltic states .......................................... 4.101 5.251 8.006 10.110 12.809 13.768 11.888 12.897 14.154 16.590 21.575 Central Europe ..................................... 58.856 67.485 88.043 103.733 112.100 124.653 123.393 135.979 145.266 160.991 203.251 South-east Europe without Turkey .... .. .. 28.984 32.154 34.095 34.838 33.142 37.420 43.447 50.026 65.170 CIS without Russian Federation ........ .. 24.476 32.867 39.587 40.748 37.147 31.005 36.924 40.601 42.664 55.797 Caucasian CIS ...................................... .. 1.510 1.727 2.503 2.630 2.864 2.449 2.708 2.994 3.384 5.040 Central Asian CIS ................................. .. 8.496 9.251 11.470 11.129 10.034 9.449 10.910 12.762 12.172 14.829 European CIS ....................................... .. 14.470 21.889 25.614 26.989 24.249 19.107 23.307 24.846 27.108 35.928
Source: UNECE secretariat calculations, based on national statistics and direct communications from national statistical offices. Note: See appendix table B.11. a Rosstat data including trade flows not crossing the Russian borders such as off-board fish sales and estimates of value of goods exported or imported by individuals within an
approved duty-free quota. b National data adjusted for trade in services: from 2001 by UNECE secretariat, for previous years by the CIS Statistical Committee .

Statistical Appendix_________________________________________________________________________________ 139
APPENDIX TABLE B.13
Balance of merchandise trade of eastern Europe and the CIS, 1993-2003 (Billion dollars)
1993 1994 1995 1996 1997 1998 1999 2000 2001 2002 2003
New EU members ................................ -12.231 -13.955 -16.266 -31.168 -34.413 -35.993 -33.603 -34.226 -31.322 -31.561 -35.232 Cyprus .................................................... -1.780 -2.045 -2.467 -2.593 -2.450 -2.613 -2.630 -2.676 -2.967 -3.229 -3.551 Czech Republic ...................................... -0.154 -1.545 -3.992 -5.739 -4.784 -2.438 -1.861 -3.131 -3.075 -2.248 -2.583 Estonia ................................................... -0.094 -0.353 -0.702 -1.152 -1.507 -1.550 -1.170 -1.078 -0.985 -1.352 -1.960 Hungary ................................................. -3.727 -3.853 -2.599 -2.440 -2.134 -2.701 -2.996 -3.988 -3.184 -3.275 -5.047 Latvia ..................................................... 0.440 -0.252 -0.515 -0.877 -1.051 -1.377 -1.223 -1.323 -1.506 -1.761 -2.333 Lithuania ................................................ -0.250 -0.322 -0.944 -1.204 -1.784 -2.083 -1.831 -1.647 -1.770 -2.250 -2.682 Malta ...................................................... -0.818 -0.863 2.476 -1.066 -1.165 -1.128 -0.864 -0.958 -0.765 -0.615 -0.930 Poland .................................................... -4.555 -4.326 -6.156 -12.697 -16.558 -18.825 -18.504 -17.289 -14.190 -14.103 -14.427 Slovakia ................................................. -0.874 0.080 -0.192 -2.290 -1.983 -2.231 -0.988 -0.752 -1.985 -2.151 -0.644 Slovenia ................................................. -0.418 -0.476 -1.176 -1.111 -0.998 -1.048 -1.537 -1.384 -0.895 -0.576 -1.074
South-east Europe ............................... .. .. -22.208 -31.806 -34.609 -32.021 -26.640 -40.153 -27.791 -36.335 -50.104 Albania ................................................... -0.298 -0.410 -0.448 -0.701 -0.483 -0.589 -0.551 -0.809 -1.012 -1.158 -1.402 Bosnia and Herzegovina ........................ .. .. -0.500 -1.146 -1.362 -1.768 -2.547 -2.038 -2.213 -2.740 -3.213 Bulgaria .................................................. -1.352 -0.336 -0.294 -0.184 0.008 -0.763 -1.509 -1.683 -2.148 -2.211 -3.304 Croatia ................................................... -0.457 -0.969 -2.877 -3.276 -4.933 -3.842 -3.496 -3.455 -4.481 -5.818 -8.035 Romania ................................................. -1.630 -0.958 -2.368 -3.351 -2.849 -3.536 -2.070 -2.688 -4.167 -3.988 -6.385 Serbia and Montenegro ......................... .. .. -1.134 -2.267 -2.149 -1.972 -1.798 -1.988 -2.934 -4.045 -4.973 The former Yugoslav Republic of Macedonia ........................................... -0.144 -0.398 -0.515 -0.480 -0.542 -0.604 -0.585 -0.766 -0.771 -0.880 -0.937 Turkey .................................................... -14.083 -5.164 -14.072 -20.403 -22.298 -18.947 -14.084 -26.728 -10.065 -15.495 -21.856
CIS: total ............................................... .. 15.953 17.702 18.059 10.450 10.999 35.488 64.142 49.882 49.200 61.519 of which: non-CIS .................................. 18.851 16.852 22.939 25.315 14.725 14.897 38.575 68.800 54.325 53.485 66.677
Armenia ............................................... -0.099 -0.178 -0.403 -0.566 -0.660 -0.682 -0.580 -0.584 -0.536 -0.482 -0.591 Non-CIS ........................................... -0.058 -0.130 -0.239 -0.416 -0.455 -0.532 -0.449 -0.484 -0.406 -0.277 -0.408
Azerbaijan ........................................... 0.096 -0.125 -0.031 -0.330 -0.013 -0.471 -0.107 0.573 0.883 0.502 -0.034 Non-CIS ........................................... 0.110 0.086 -0.088 -0.280 -0.040 -0.299 0.007 0.713 1.106 0.909 0.483
Belarus ................................................ .. -0.556 -0.857 -1.287 -1.388 -1.480 -0.765 -1.244 -0.730 -1.071 -1.541 Non-CIS ........................................... -0.330 0.057 -0.110 -0.481 -0.950 -1.085 -0.098 0.376 0.445 0.839 1.012
Georgia ............................................... .. -0.182 -0.231 -0.488 -0.704 -0.692 -0.364 -0.321 -0.365 -0.384 -0.662 Non-CIS ........................................... -0.098 -0.027 -0.174 -0.347 -0.501 -0.532 -0.246 -0.226 -0.252 -0.263 -0.537
Kazakhstan ......................................... .. -0.330 1.443 1.670 2.196 1.086 1.906 4.075 2.193 3.086 4.574 Non-CIS ........................................... 1.007 -0.027 1.212 1.437 1.547 0.976 2.011 4.456 2.858 3.935 5.539
Kyrgyzstan .......................................... -0.052 0.023 -0.113 -0.333 -0.105 -0.328 -0.146 -0.050 0.009 -0.101 -0.135 Non-CIS ........................................... 0.000 0.010 -0.028 -0.239 0.012 -0.118 -0.070 0.041 0.097 0.053 0.074
Republic of Moldova ........................... -0.145 -0.094 -0.095 -0.277 -0.297 -0.392 -0.123 -0.305 -0.325 -0.395 -0.612 Non-CIS ........................................... -0.006 -0.024 0.007 -0.168 -0.300 -0.381 -0.134 -0.321 -0.331 -0.336 -0.443
Russian Federation a ............................... .. 17.300 19.816 22.600 14.912 16.429 36.014 60.171 48.136 46.200 59.100 Non-CIS ........................................... 17.490 15.600 21.100 24.800 14.400 15.000 34.400 59.400 45.900 42.200 54.000
Tajikistan ............................................. -0.280 -0.055 -0.061 0.102 -0.004 -0.114 0.026 0.109 -0.036 0.017 -0.083 Non-CIS ........................................... -0.147 0.085 0.165 0.154 0.205 0.129 0.225 0.295 0.290 0.376 0.377
Turkmenistan ...................................... .. 0.677 0.517 0.670 -0.432 -0.414 -0.310 0.720 0.271 0.759 0.918 Non-CIS ........................................... 0.548 -0.288 0.332 0.160 -0.231 -0.088 -0.300 0.100 0.024 0.075 0.218
Ukraine ................................................ -1.716 -0.473 -2.356 -3.202 -2.896 -2.038 -0.265 0.617 0.490 0.980 0.059 Non-CIS ........................................... 0.571 1.746 0.680 0.569 1.397 1.657 3.227 4.159 4.646 5.571 5.519
Uzbekistan b ........................................ .. -0.054 0.073 -0.501 -0.159 0.093 0.200 0.380 -0.108 0.089 0.527 Non-CIS ........................................... -0.237 -0.236 0.082 0.126 -0.358 0.169 – 0.290 -0.053 0.403 0.842
Total above ........................................... .. .. -20.771 -44.914 -58.571 -57.015 -24.755 -10.238 -9.230 -18.696 -23.817
Memorandum items: Baltic states .......................................... 0.096 -0.927 -2.160 -3.232 -4.343 -5.009 -4.224 -4.049 -4.261 -5.363 -6.976 Central Europe ..................................... -9.729 -10.120 -14.115 -24.277 -26.456 -27.243 -25.885 -26.543 -23.329 -22.354 -23.775 South-east Europe without Turkey .... .. .. -8.136 -11.403 -12.311 -13.074 -12.556 -13.426 -17.726 -20.840 -28.248 CIS without Russian Federation ........ .. -1.347 -2.114 -4.541 -4.462 -5.430 -0.526 3.971 1.746 3.000 2.419 Caucasian CIS ...................................... .. -0.485 -0.665 -1.383 -1.377 -1.845 -1.050 -0.332 -0.017 -0.364 -1.287 Central Asian CIS ................................. .. 0.261 1.859 1.608 1.496 0.324 1.675 5.235 2.329 3.849 5.800 European CIS ....................................... .. -1.123 -3.308 -4.766 -4.581 -3.909 -1.152 -0.932 -0.565 -0.486 -2.094
Source: UNECE secretariat calculations, based on national statistics and direct communications from national statistical offices. Note: See appendix table B.11. a Rosstat data including trade flows not crossing the Russian borders such as off-board fish sales and estimates of value of goods exported or imported by individuals within an
approved duty-free quota. b National data adjusted for trade in services: from 2001 by UNECE secretariat, for previous years by the CIS Statistical Committee .

140 ________________________________________________________________ Economic Survey of Europe, 2005 No. 1
APPENDIX TABLE B.14
Merchandise trade of eastern Europe and the Russian Federation, by direction, 1980, 1990, 1992-2003 (Shares in total trade, per cent)
1980 1990 1992 1993 1994 1995 1996 1997 1998 1999 2000 2001 2002 2003
Eastern Europe, to and from:
Exports World ................................................ 100.0 100.0 100.0 100.0 100.0 100.0 100.0 100.0 100.0 100.0 100.0 100.0 100.0 100.0
Eastern Europe and the CIS ......... 48.5 38.1 23.0 30.7 28.5 28.6 28.5 28.6 24.7 20.8 20.7 21.4 21.2 21.6 CIS ............................................. 27.1 22.3 12.4 11.4 10.0 9.8 10.0 10.6 7.4 4.2 4.1 4.7 4.5 4.4 Eastern Europe .......................... 21.4 15.8 10.7 19.3 18.5 18.7 18.5 18.0 17.3 16.6 16.6 16.7 16.7 17.2
Developed market economies ...... 35.7 49.5 63.0 57.5 61.9 62.6 63.5 63.6 68.3 73.4 73.1 72.9 72.7 72.8 Developing economies ................. 15.8 12.4 14.0 11.8 9.6 8.8 8.0 7.8 7.0 5.8 6.2 5.7 6.1 5.6
Imports World ................................................ 100.0 100.0 100.0 100.0 100.0 100.0 100.0 100.0 100.0 100.0 100.0 100.0 100.0 100.0
Eastern Europe and the CIS ......... 42.0 26.6 24.7 29.9 26.2 25.8 24.7 23.1 20.0 20.6 23.6 23.2 22.5 22.8 CIS ............................................. 26.8 18.3 17.9 16.5 14.0 13.0 12.0 11.0 8.6 8.5 11.4 10.8 9.9 9.7 Eastern Europe .......................... 18.8 14.3 6.8 13.4 12.2 12.9 12.7 12.1 11.4 12.1 12.2 12.4 12.6 13.1
Developed market economies ...... 38.7 53.3 64.4 61.2 65.2 65.6 66.2 66.7 70.2 69.7 66.7 66.2 65.3 64.4 Developing economies ................. 19.3 20.1 10.9 8.9 8.6 8.5 9.1 10.2 9.8 9.7 9.7 10.6 12.2 12.8
Former Soviet Union/Russian Federation, to and from: Exports World ................................................ 100.0 100.0 100.0 100.0 100.0 100.0 100.0 100.0 100.0 100.0 100.0 100.0 100.0 100.0
Eastern Europe ............................. 34.5 21.8 22.3 18.1 15.1 16.8 18.2 19.5 18.1 17.8 20.0 19.3 17.5 17.0 Developed market economies ...... 42.2 49.5 57.9 59.7 66.6 60.6 58.1 58.6 60.0 57.8 55.6 55.0 55.6 53.3 Developing economies ................. 23.3 28.7 19.8 22.2 18.3 22.6 23.7 21.9 21.9 24.4 24.4 25.7 26.9 29.7
Imports World ................................................ 100.0 100.0 100.0 100.0 100.0 100.0 100.0 100.0 100.0 100.0 100.0 100.0 100.0 100.0
Eastern Europe ............................. 31.5 24.7 15.9 10.6 14.1 15.5 12.6 13.7 12.0 9.6 10.9 10.1 10.3 10.9 Developed market economies ...... 46.4 52.9 62.4 60.6 70.3 69.5 67.8 68.3 68.2 68.3 69.3 67.8 65.7 64.8 Developing economies ................. 22.1 22.4 21.7 28.8 15.6 15.0 19.6 18.0 19.8 22.1 19.8 22.1 24.0 24.3
Source: UNECE Common Database, derived from national statistics. Note: Data for 1980-1990 refer to the east European CMEA countries (Bulgaria, Czechoslovakia, German Democratic Republic, Hungary, Poland and Romania) and
to the former Soviet Union. Trade data in national currencies were revalued at consistent rouble/dollar cross-rates (see the note to appendix table B.11). As from 1991, the second panel reflects non-CIS trade of the Russian Federation only. In the first panel, reporting group “eastern Europe” covers Bulgaria, former Czechoslovakia, Hungary, Poland and Romania in 1992; in 1993-1995 it covers Albania, Bulgaria, Croatia, the Czech Republic, Estonia, Hungary, Latvia, Lithuania, Poland, Romania, Slovakia, Slovenia and The Former Yugoslav Republic of Macedonia while Bosnia and Herzegovina and Serbia and Montenegro are included only from 1996.

Statistical Appendix_________________________________________________________________________________ 141
APPENDIX TABLE B.15
Exchange rates of eastern Europe and the CIS, 1990, 1993-2004 (Annual averages, national currency units per dollar)
Unit a 1990 1993 1994 1995 1996 1997 1998 1999 2000 2001 2002 2003 2004
Albania ................................... lek 8.90 102.06 94.62 92.70 104.50 148.93 150.63 137.69 143.71 143.48 139.93 121.87 102.77 Bosnia and Herzegovina ...... con. marka b .. .. .. 1.43 1.50 1.73 1.76 1.84 2.12 2.19 2.08 1.73 1.58 Bulgaria .................................. leva c 2.36 27.85 54.13 67.08 177.88 1 681.87 1 760.37 1.84 2.12 2.18 2.08 1.73 1.58 Croatia .................................... kuna d 11.00 3 577.42 6.03 5.23 5.43 6.10 6.36 7.11 8.28 8.34 7.87 6.70 6.05 Czech Republic ..................... koruna 18.56 29.15 28.79 26.54 27.14 31.70 32.28 34.57 38.60 38.04 32.74 28.21 25.70 Estonia ................................... kroon e .. 13.22 12.99 11.46 12.03 13.88 14.07 14.69 16.98 17.49 16.63 13.86 12.60 Hungary .................................. forint 63.21 91.93 105.16 125.68 152.65 186.79 214.40 237.15 282.18 286.49 257.89 225.14 202.75 Latvia ...................................... lats f .. 0.67 0.56 0.53 0.55 0.58 0.59 0.59 0.61 0.63 0.62 0.57 0.54 Lithuania ................................. litas g .. 4.34 3.98 4.00 4.00 4.00 4.00 4.00 4.00 4.00 3.68 3.06 2.78 Poland .................................... zloty h 9 500 18 136 22 723 2.42 2.70 3.28 3.49 3.96 4.35 4.09 4.08 3.89 3.66 Romania ................................. leu 22.43 760.05 1 655 2 033 3 084 7 168 8 876 15 333 21 709 29 061 33 055 33 200 32 637 Serbia and Montenegro ....... dinar i 10.65 .. 1.55 4.74 4.96 5.70 11.07 22.84 54.74 67.67 64.19 57.41 58.69 Slovakia .................................. koruna 18.56 30.77 32.05 29.72 30.66 33.62 35.23 41.36 46.04 48.35 45.33 36.77 32.26 Slovenia ................................. tolar 11.32 113.24 128.81 118.52 135.37 159.69 166.13 181.77 222.66 242.75 240.25 207.11 192.83 The former Yugoslav Republic of Macedonia ...... denar j 11.32 23.26 43.26 37.88 39.98 50.00 54.46 56.90 65.90 68.04 64.82 54.32 49.43
Armenia .................................. dram .. 9.11 288.65 405.91 414.04 490.77 504.92 535.06 539.53 555.08 573.35 578.76 534.82 Azerbaijan .............................. manat .. 102.33 1 739 4 414 4 301 3 985 3 869 4 120 4 474 4 657 4 861 4 911 4 914 Belarus ................................... rouble k .. 3 160 4 652 11 538 13 472 26 729 58 971 274 512 882 1 390 1 785 2 054 2 160 Georgia ................................... lari l .. .. 1.66 1.29 1.26 1.30 1.39 2.03 1.98 2.07 2.20 2.14 1.92 Kazakhstan ............................ tenge .. .. 35.54 60.95 67.30 75.44 78.30 119.52 142.13 146.74 153.30 149.71 136.10 Kyrgyzstan ............................. som .. .. 10.86 10.82 12.81 17.36 20.84 39.01 47.70 48.38 46.94 43.61 42.67 Republic of Moldova ............. leu .. 1.58 4.08 4.50 4.60 4.62 5.37 10.52 12.43 12.87 13.57 13.95 12.33 Russian Federation .............. rouble m 0.59 993.00 2 204 4 559 5 121 5 785 9.71 24.62 28.13 29.17 31.35 30.69 28.87 Tajikistan ................................ samoni n .. .. .. 107.59 293.82 560.64 778.30 1 225.96 1.83 2.39 2.76 3.06 2.97 Turkmenistan ......................... manat .. .. 14.08 116.67 3 595 4 143 4 592 5 200 5 200 5 200 5 200 5 202 5 220 Ukraine ................................... hryvnia o .. 4 796 3 170 14 728 1.83 1.86 2.45 4.13 5.44 5.37 5.33 5.33 5.32 Uzbekistan ............................. sum p .. .. 10.69 30.12 40.66 66.02 94.79 124.64 236.58 423.08 771.42 971.35 1 019.94
Source: UNECE Common Database, derived from national, IMF and CIS statistics. Annual averages are unweighted arithmetic averages of monthly values. Change or redenomination of currency is indicated by a vertical bar.
a Currency unit of the last period shown. For prior periods, see footnotes. b BAM (convertible marka), the official rate is pegged to the euro. Prior to January 1999, the official rate was pegged to the deutsche mark at a 1:1 rate. c The leva was redenominated at 1:1,000 from 5 July 1999. d The kuna replaced the Croat dinar on 3 May 1994 at 1:1,000; the 1994 average is shown in kuna terms. e The kroon replaced the Soviet rouble in June 1992 with a peg to the deutsche mark (8:1); the average shown for 1992 refers to June-December. f The lats replaced an earlier Latvian rouble at 1:200 on 18 October 1993; the 1993 average is shown in lats terms. g The litas replaced the earlier talonas at 1:100 on 1 June 1993; the 1993 average is shown in litas terms. h The zloty was redenominated at 1:10,000 from 1 January 1995. i The dinar was further redenominated on 1 July 1992 (1:10), 1 October 1993 (1:1 million), 1 January 1994 (1:1 billion) and 24 January 1994 (1:13 million). Average
annual exchange rates not available for 1993. Estimated market exchange rates for 1998-2000. j The denar (which had replaced the Yugoslav dinar 1:1 on 26 April 1992) was redenominated 1:100 on 1 May 1993; the 1993 average is shown in terms of that unit. k The Belarus rouble was redenominated 1:10 on 10 August 1994; the 1994 average here assumes this applied to the entire year. The Belarus rouble was further
redenominated at 1:1,000 since January 2000. Annual averages were calculated from end-of-period monthly rates, and the period average since January 1999. l The lari replaced the lari-kupon on 25 September 1995; the annual average for 1994 is shown in million lari-kupon, and the average for 1995 in lari. m 1980-1991: Soviet rouble/dollar rate used in the conversion of foreign trade data for statistical purposes. The rouble was redenominated at 1:1,000 from 1 January 1998. n A new currency, the samoni, was put into circulation on 30 October 2000 replacing the Tajik rouble at 1:1,000. The average for 2000 is shown in samoni terms. o The hryvnia replaced the former karbovanets on 2 September 1996 at 1:100,000; the average for 1996 is shown in hryvnia terms. p The sum replaced the sum-kupon in June 1994 (1:1,000).

142 ________________________________________________________________ Economic Survey of Europe, 2005 No. 1
APPENDIX TABLE B.16
Current account balances of eastern Europe and the CIS, 1990-2003 (Million dollars)
1990 1991 1992 1993 1994 1995 1996 1997 1998 1999 2000 2001 2002 2003
Eastern Europe ................................... .. .. .. .. -3 027 -7 377 -18 284 -21 499 -22 312 -26 984 -23 462 -21 376 -26 096 -33 012 Albania ................................................... -118 -168 -51 19 31 37 -62 -254 -65 -133 -163 -218 -421 -407 Bosnia and Herzegovina ...................... .. .. .. .. -177 -193 -748 -1 060 -813 -1 122 -1 033 -1 202 -1 693 -2 038 Bulgaria .................................................. -1 710 -77 -360 -1 098 -32 -198 164 1 046 -61 -652 -704 -984 -827 -1 676 Croatia a ..................................................... -621 -589 329 637 711 -1 407 -956 -2 512 -1 453 -1 397 -461 -725 -1 918 -2 085 Czech Republic ..................................... -122 1 708 -456 456 -787 -1 369 -4 121 -3 564 -1 255 -1 462 -2 718 -3 273 -4 166 -5 570 Estonia ................................................... .. .. 36 22 -167 -158 -398 -563 -478 -247 -294 -339 -716 -1 199 Hungary b .................................................. 123 267 325 -3 455 -3 911 -1 638 -1 764 -2 076 -3 390 -3 773 -4 034 -3 237 -4 745 -7 446 Latvia ...................................................... .. .. 191 417 201 -16 -279 -345 -650 -654 -355 -626 -621 -917 Lithuania ................................................. .. .. 321 -86 -94 -614 -723 -981 -1 298 -1 194 -675 -574 -734 -1 218 Poland c ..................................................... 3 067 -2 146 -3 104 -5 788 954 854 -3 264 -5 744 -6 901 -12 487 -9 980 -5 372 -5 007 -4 603 Romania ................................................. -3 337 -1 012 -1 564 -1 174 -428 -1 774 -2 571 -2 104 -2 917 -1 437 -1 374 -2 228 -1 535 -3 254 Serbia and Montenegro d ...................... .. .. .. .. -400 -1 037 -1 317 -1 279 -660 -716 -350 -648 -1 731 -1 928 Slovakia .................................................. -767 -786 173 -532 759 511 -1 960 -1 827 -1 982 -980 -702 -1 746 -1 939 -280 Slovenia a .................................................. 518 129 926 192 575 -75 56 51 -118 -698 -548 37 314 -114 The former Yugoslav Republic of Macedonia a ...................................... -409 -259 -19 -83 -263 -299 -340 -286 -270 -32 -72 -244 -358 -279
CIS e............................................................ .. .. -538 10 266 4 696 3 741 4 934 -6 448 -7 229 23 460 48 177 32 931 30 377 36 989 Armenia .................................................. .. .. -50 -67 -104 -218 -291 -307 -403 -307 -278 -200 -148 -191 Azerbaijan .............................................. .. 153 488 -160 -121 -401 -931 -916 -1 365 -600 -168 -52 -768 -2 021 Belarus ................................................... .. .. 131 -435 -444 -458 -516 -859 -1 017 -194 -338 -394 -311 -527 Georgia .................................................. .. .. -248 -354 -277 -363 -570 -514 -276 -200 -269 -211 -231 -398 Kazakhstan ............................................ .. -1 300 -1 900 -641 -905 -213 -751 -799 -1 236 -236 563 -1 203 -843 -39 Kyrgyzstan ............................................. .. .. -61 -88 -84 -235 -425 -138 -364 -184 -78 -17 -25 -24 Republic of Moldova ............................. .. .. -152 -155 -82 -95 -192 -275 -335 -68 -116 -68 -52 -142 Russian Federation f ............................... -6 300 2 500 1 142 12 792 7 844 6 963 10 847 -80 219 24 616 46 839 33 935 29 116 35 845 Tajikistan ................................................ .. .. -53 -208 -170 -89 -75 -61 -120 -36 -62 -74 -15 -5 Turkmenistan ......................................... -308 447 926 776 84 24 2 -580 -935 .. .. .. .. .. Ukraine ................................................... .. .. -526 -765 -1 163 -1 152 -1 185 -1 335 -1 296 1 658 1 481 1 402 3 173 2 891 Uzbekistan ............................................. .. .. -236 -429 118 -21 -980 -584 -103 -126 216 -113 .. ..
Total above e............................................ .. .. .. .. 1 669 -3 636 -13 350 -27 946 -29 540 -3 524 24 715 11 555 4 281 3 977
Memorandum items: Central Europe .................................... 2 820 -828 -2 137 -9 127 -2 410 -1 717 -11 053 -13 160 -13 646 -19 400 -17 981 -13 590 -15 543 -18 013 South-east Europe without Turkey ................................................. .. .. .. .. -557 -4 871 -5 830 -6 449 -6 239 -5 489 -4 157 -6 248 -8 482 -11 666 Baltic states ......................................... .. .. 548 353 -59 -788 -1 400 -1 890 -2 426 -2 095 -1 324 -1 538 -2 072 -3 333 EU-8 ....................................................... .. .. -1 589 -8 774 -2 469 -2 506 -12 454 -15 050 -16 072 -21 495 -19 305 -15 128 -17 614 -21 346 CIS without Russian Federation e .. .. .. -1 680 -2 526 -3 148 -3 222 -5 913 -6 368 -7 448 -1 156 1 338 -1 005 1 262 1 145 European CIS ....................................... .. .. -547 -1 355 -1 689 -1 705 -1 893 -2 469 -2 647 1 396 1 027 939 2 810 2 222 Caucasian CIS ..................................... .. .. 190 -581 -502 -983 -1 791 -1 736 -2 043 -1 106 -715 -464 -1 147 -2 609 Central Asian CIS e .............................. .. .. -1 324 -590 -957 -534 -2 229 -2 162 -2 757 -1 446 1 025 -1 481 -402 1 532 Caucasian and central Asian CIS e .. .. .. -1 133 -1 170 -1 459 -1 517 -4 020 -3 899 -4 800 -2 552 311 -1 944 -1 549 -1 077 Low-income CIS e ................................. .. .. -312 -1 461 -720 -1 422 -3 463 -2 794 -2 965 -1 520 -754 -736 -1 017 -1 980
Source: National balance of payments statistics; IMF, Balance of Payments Statistics (Washington, D.C.) and IMF country studies; UNECE secretariat estimates. a Excludes transactions with the republics of the former SFR of Yugoslavia: Croatia (1990-1992), Slovenia (1990-1991) and The former Yugoslav Republic of
Macedonia (1990-1992). b Methodological changes (mainly regarding treatment of reinvested earnings) were introduced in 2003 and 2004; 1995-2003 results have been revised accordingly.
For 1990-1994, balance of payments data in convertible currencies only.
c National Bank of Poland started publishing balance of payments results on a transaction basis in 2004; the data have been revised accordingly back to 1990. Balance of payments data published in previous issues of this Survey until 2004 No. 1 were reported on a cash basis.
d Excludes Kosovo from 1999; 2003 data for Serbia only. e Totals include estimates for Turkmenistan and Uzbekistan. f 1990-1992 exclude transactions with the Baltic and CIS countries.

Statistical Appendix_________________________________________________________________________________ 143
APPENDIX TABLE B.17
Inflows of foreign direct investment a in eastern Europe and the CIS, 1990-2003 (Million dollars)
1990 1991 1992 1993 1994 1995 1996 1997 1998 1999 2000 2001 2002 2003
Eastern Europe ....................................... .. .. .. .. .. .. 11 413 15 142 20 043 22 231 23 987 22 835 26 692 18 600 Albania b .................................................... – – 20 68 53 70 90 48 45 41 143 207 135 178 Bosnia and Herzegovina b ...................... .. .. .. .. – – – – 67 177 146 119 268 382 Bulgaria b ................................................... 4 56 41 40 105 90 109 505 537 819 1 002 813 905 1 419 Croatia ....................................................... – – 16 120 117 114 511 533 932 1 467 1 089 1 559 1 124 1 998 Czech Republic c ..................................... 132 513 1 004 654 869 2 562 1 428 1 300 3 718 6 324 4 986 5 641 8 483 2 583 Estonia ...................................................... .. .. 82 162 215 202 151 267 581 305 387 542 284 891 Hungary d .................................................. 311 1 459 1 471 2 339 1 146 4 741 3 291 4 166 3 344 3 311 2 777 3 949 3 021 2 340 Latvia ......................................................... .. .. 29 45 214 180 382 521 357 347 413 132 254 300 Lithuania .................................................... .. .. 8 30 31 73 152 355 926 486 379 446 732 179 Poland ....................................................... 89 291 678 1 715 1 875 3 659 4 498 4 908 6 365 7 270 9 343 5 714 4 131 4 124 Romania .................................................... – 40 77 94 341 419 263 1 215 2 031 1 041 1 037 1 157 1 146 1 840 Serbia and Montenegro b e ...................... .. .. .. .. .. .. – 740 113 112 50 165 475 1 360 Slovakia ..................................................... 18 82 100 195 269 308 353 220 684 390 1 925 1 579 4 012 571 Slovenia .................................................... 4 65 111 113 117 151 174 334 216 107 136 370 1 645 339 The former Yugoslav Republic of Macedonia b ....................................... – – – – 24 9 11 30 128 33 175 442 78 95
CIS f............................................................ .. .. 1 777 1 876 1 770 4 064 5 313 9 035 6 780 6 749 5 439 7 290 8 982 15 712 Armenia b ................................................... .. .. – 1 8 25 18 52 221 122 104 70 111 121 Azerbaijan b ............................................... .. .. – 60 22 330 627 1 125 1 023 510 130 227 1 392 3 285 Belarus b .................................................... .. .. 7 18 11 15 105 352 203 444 119 96 247 172 Georgia b.................................................... .. .. – – 8 6 40 243 265 82 131 110 165 338 Kazakhstan b ............................................ .. .. 100 228 635 964 1 137 1 321 1 152 1 472 1 283 2 835 2 590 2 088 Kyrgyzstan b ............................................. .. .. – 10 38 96 47 83 109 44 -2 5 5 46 Republic of Moldova b .............................. .. 25 17 14 12 67 24 79 76 38 136 146 117 58 Russian Federation ................................. – 100 1 454 1 211 690 2 065 2 579 4 865 2 761 3 309 2 714 2 748 3 461 7 958 Tajikistan b ................................................. .. .. 9 9 12 20 18 18 25 21 24 9 36 32 Turkmenistan b ......................................... – – 11 79 103 233 108 108 62 .. .. .. .. .. Ukraine b ................................................... .. .. 170 198 159 267 521 623 743 496 595 792 693 1 424 Uzbekistan b .............................................. .. .. 9 48 73 -24 90 167 140 121 75 83 .. ..
Total above f ............................................ .. .. .. .. .. .. 16 726 24 176 26 823 28 979 29 426 30 125 35 674 34 311
Memorandum items: Central Europe ....................................... 555 2 410 3 364 5 015 4 275 11 420 9 744 10 929 14 327 17 402 19 167 17 254 21 292 9 957 South-east Europe without Turkey .... .. .. .. .. .. .. 984 3 070 3 853 3 690 3 642 4 461 4 130 7 272 Baltic states ............................................ .. .. 119 238 460 454 685 1 142 1 863 1 139 1 178 1 120 1 270 1 370 EU-8 .......................................................... .. .. 3 483 5 253 4 736 11 874 10 429 12 071 16 190 18 541 20 346 18 374 22 562 11 327 CIS without Russian Federation f ....... .. .. 323 665 1 080 1 999 2 734 4 170 4 019 3 439 2 725 4 542 5 521 7 754 European CIS .......................................... .. .. 194 229 181 349 649 1 053 1 022 978 850 1 034 1 057 1 654 Caucasian CIS ........................................ .. .. – 61 38 361 685 1 419 1 509 715 365 406 1 669 3 744 Central Asian CIS f ................................... .. .. 129 374 861 1 289 1 400 1 697 1 488 1 747 1 510 3 102 2 796 2 356 Caucasian and central Asian CIS f ..... .. .. 129 435 899 1 651 2 085 3 116 2 997 2 461 1 875 3 508 4 464 6 099 Low-income CIS f ................................... .. .. 35 142 173 520 863 1 766 1 859 939 598 649 1 891 3 990
Source: National balance of payments statistics; IMF, Balance of Payments Statistics (Washington, D.C.) and IMF country studies; UNECE secretariat estimates. a Inflows into the reporting country. b Net of residents’ investments abroad. Bulgaria, 1990-1994; The former Yugoslav Republic of Macedonia, 1994-1996; Armenia, 1993-2002; Azerbaijan, 1993-1999;
Belarus, 1992-1996; Georgia, 1994-1998; Kazakhstan, 1992-1996; Kyrgyzstan, 1993-1997; Republic of Moldova, 1991-1994; Ukraine, 1992-1993. c Excludes re-invested earnings and inter-company loans 1990-1997. d Excludes re-invested earnings 1990-1994. e Excludes Kosovo from 1999; 2003 data for Serbia only. f Totals include estimates for Turkmenistan and Uzbekistan.