statistical approaches to analyzing trends and differences...
TRANSCRIPT

Statistical Approaches to
Analyzing Trends and
Differences in Trends:
Cancer Data from Windsor-Essex
Clifford Ekwempe
Ali Artaman
Liz Haugh

Outline
• Introduction
• Joinpoint Regression Model
• JoinPoint Regression Program
• Difference in Trends• Difference in Trends

Trend• A time series is a collection of observations of
well-defined data items obtained through repeated measurements over time.
• An observed time series can be decomposed into three components: into three components:
– seasonal (systematic, calendar related movements)
– irregular (unsystematic, short term fluctuations)
– trend (long term direction)


Trend Analysis
Joinpoint RegressionJoinpoint Regression
and Software

Joinpoint Regression Model
• Piecewise regression
• Change point regression
• Segmented regression
• Broken line regression• Broken line regression
• Multiphase regression

regressions coefficients
unknown joinpoints (or break points)
++ −++−++= )(...)(]|[ 1110 kk xxxxyE τδτδββ
nnn xxwhereyxyx ≤≤ ...),,(),...,,( 111
kτ
10 , ββ
differences in slopekδ
otherwise
xifxx kkk
,0
0)()()(
=
>−−=− + τττ

• Joinpoint selects the final model using two different methods:
• Permutation Test (PT)
• Bayesian Information Criterion (BIC)
• The PT approach controls the error probability of selecting the wrong model at a certain level (i.e. 0.05). It works well for cancer incidence and mortality data.
• The BIC approach finds the model with the best fit by penalizing the cost of extra parameters.
• The models picked by BIC tend to fit the data well but are less parsimonious.

Permutation Test:
• H0: number of joinpoints = ka
Ha: number of joinpoints= kb
• The procedure begins with ka = MIN and kb = MAX. If the null is rejected, then increase ka by 1; otherwise, decrease kb by 1. 1; otherwise, decrease kb by 1.
• The procedure continues until ka = kb and the final value of is the selected number of joinpoints.

Linear or Log-linear
• Purpose of log transformation: Cancer rates
arise from a Poisson distribution which is
skewed especially when the cancer is rare or the
rates come from a small population.
• Rates for common cancers or which come from
a large population can be approximated as
arising from a normal distribution without a
transformation.

Annual Percentage Change
• To determine significance of trends: APC
For x1,…,xn representing years
y1,…, yn representing log of the observed rate
The APC between two joinpoints is given by:1+jj and ττ
• Positive value of APC suggests an increasing trend
• Negative value of APC suggests a decreasing trend
)1(*100...
211 −=++++ jeAPC
δδδβ

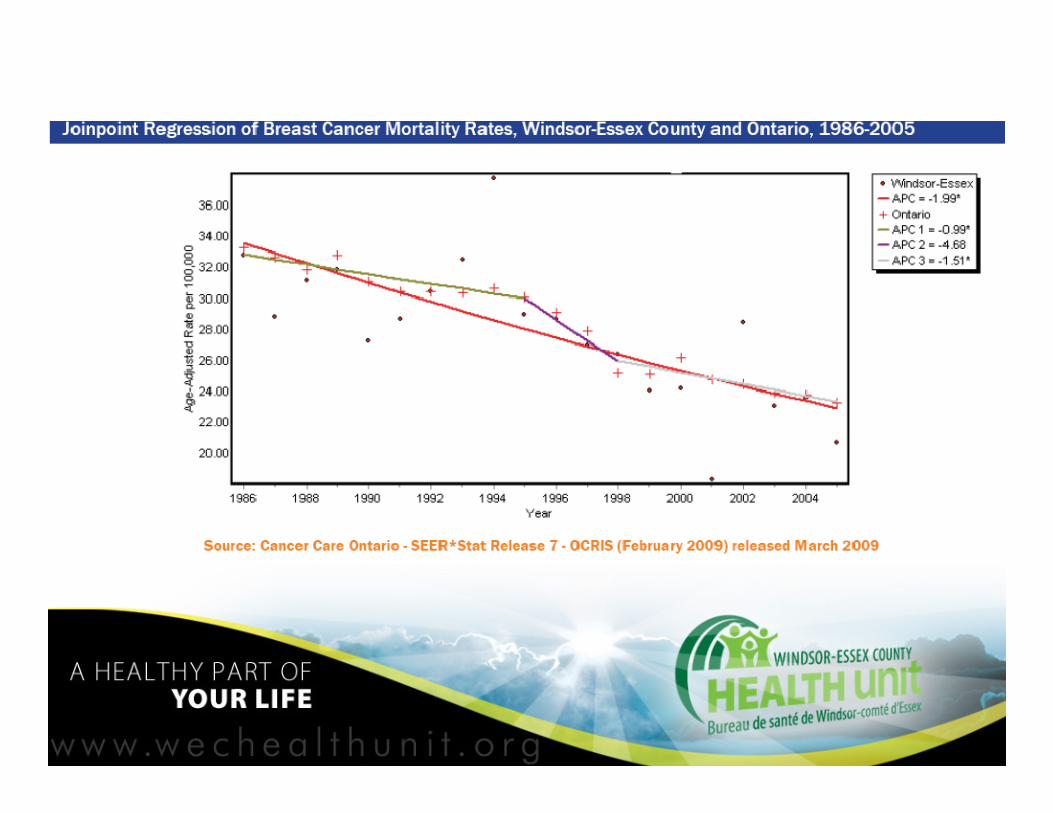
Cancer Data
Essex County vs. OntarioEssex County vs. Ontario

Graphs
No Joinpoint!No Joinpoint!


Graphs
JoinpointsJoinpoints


Non-Significant Change in Slopes
The permutation test procedure does not require the asymptotic normality and maintains the correct Type I error maintains the correct Type I error probability level.


Difference in Trends• Previous question:
– Is there a statistically significant increase/decrease of
incidence/mortality rates in a single geographic region
(WEC, Ontario)?
• To test whether there are statistically significant • To test whether there are statistically significant
differences in time trends in incidence and
mortality rates between WEC and Ontario as
well as between males and females within WEC,
negative binomial regression was performed.


Poisson Regression
• For continuous outcome: simple regression
• Response variable in the form of a count: Poisson regression
• In Poisson distribution, mean and variance are equal.
• Data that have greater variance than the mean are termed as • Data that have greater variance than the mean are termed as Poisson overdispersed
• The Poisson goodness-of-fit was performed (through poisgofcommand in stata). The test showed that Poisson regression was not a good choice.

Negative Binomial Regression
• To capture any statistically significant difference in trend, that is, to allow slopes of the rates to vary by region (WEC vs. Ontario) as time evolves:
– An interaction term consisted of region and time variables (regtime) was included in the model.
– An interaction term for sex and time (sextime) was included.
• A p-value of regtime or sextime less than 0.05 suggests that the slopes differ significantly over time.

Difference in trends
• In WEC for the period 1986-2005:
– significant difference in incidence rate trends
of lung and oral cancers between males and
females.
– significant difference in the trends of mortality
rates for all cancers combined and lung
cancer.

Acknowledgement
• Dr. Hyune-Ju Kim (Syracuse University)
• Joinpoint Development Team (IMS, Inc.)
• Dr. Eric Holowaty (Cancer Care Ontario)
• Ms. Beth Theis (Cancer Care Ontario)• Ms. Beth Theis (Cancer Care Ontario)
• Mr. Enayetur Raheem (WEC Health Unit)

Additional Technical Information >>>
Select ReferencesMethod:
• Kim HJ, Fay MP, Feuer EJ, Midthune DN. "Permutation tests for joinpoint regression with applications to cancer rates" Statistics in Medicine 2000; 19:335-351: (correction: 2001;20:655).
Software:Software:
• Jiang Z, Qiu Z, Hatcher J, “Joinpoint trend analysis of cancer incidence and mortality using Alberta data” Alberta Health Services, available at:
http://www.cancerview.ca/idc/groups/public/documents/webcontent/csen_cproj_fy0910q3_joinpoint.pdf


Joinpoint APCs not matching SEER*Stat APCs
The Joinpoint model assumes that the trend is continuous at the joinpoint, whereas the APC for the corresponding segment calculated by SEER*Stat does not impose calculated by SEER*Stat does not impose the continuity constraint with the consecutive segment.

Joinpoint v. 3.5
• Released in April 2011. Important Changes included:
• The Autocorrelated Errors Options were re-enabled,
• The confidence intervals for the AAPC were modified to follow the t-distribution, and be identical to the CIs for the APC
• A statistical test was added for the comparison of AAPCs between 2 • A statistical test was added for the comparison of AAPCs between 2 groups when the pairwise differences option is selected.
• In versions prior to 3.5, the default for the maximum number of joinpoints Modified BIC was added as a 3rd option for the Model Selection Method.

Joinpoint v. 3.4• Version 3.4.2 was released October 2009.
• Version 3.4.3 released in April 2010. The changes Included:
• An error was corrected in the p-values for the comparison test when the two groups being compared were exactly identical. This error did not affect any comparisons in which the two groups varied, even slightly. slightly.
• An error was corrected that occurred when reading in SEER*Stat export files with the missing value set to zero.
• An error was corrected that could occur when exportingdata.