statistical calibration of ms/ms spectrum library search scores
DESCRIPTION
Statistical calibration of MS/MS spectrum library search scores. Barbara Frewen January 10, 2011 University of Washington. Protein identification. Peptides EYWDYEAHMIEWGQIDDYQLVR GGTNIITLLDVVK VVVFLFDLLYFNGEPLV YQTTGQVQYSCLVR LIVVNSEDQLR HPLISLLLLIAFYSTSSEAFVPK …. Protein Mixture. - PowerPoint PPT PresentationTRANSCRIPT

Statistical calibration of MS/MS spectrum library search scores
Barbara FrewenJanuary 10, 2011
University of Washington

Protein identification
ProteinsB0205.7 casein kinaseC29A12.3a lig-1 DNA ligaseC29E6.1a mucin like protein…
Protein Mixture
Digestion to Peptides
PeptidesEYWDYEAHMIEWGQIDDYQLVRGGTNIITLLDVVKVVVFLFDLLYFNGEPLVYQTTGQVQYSCLVRLIVVNSEDQLRHPLISLLLLIAFYSTSSEAFVPK…

Acquiring MS/MS spectra
200 400 600 800 1000 12000
20
40
60
80
100
Re
lative
Ab
ud
an
ce
m/z
RT: 0.00 - 120.04
0 10 20 30 40 50 60 70 80 90 100 110 120Time (min)
0
5
10
15
20
25
30
35
40
45
50
55
60
65
70
75
80
85
90
95
100
Re
lative
Ab
un
da
nce
30.7933.70
34.49
46.8046.31
37.2747.31
29.7544.78
44.64 49.4129.29
51.1513.96
71.9919.61 39.2424.01
72.1656.7697.16
96.6065.30 75.799.7298.028.06 64.83
78.22 98.2061.7983.826.34 93.83
85.6898.7999.263.80
103.52 110.00
NL: 3.90E7Base Peak F: ITMS + c ESI Full ms [ 400.00-1400.00] MS 061704-worm-trizol-urea-15n-H-04
200 400 600 800 1000 12000
20
40
60
80
100
Re
lative
Ab
ud
an
ce
m/z
200 400 600 800 1000 12000
20
40
60
80
100
Re
lative
Ab
ud
an
ce
m/z200 400 600 800 1000 1200
0
20
40
60
80
100
Rela
tive A
bud
ance
m/z
µLC/µLC
MS/MS
MS
Digest to Peptides
Isolate Proteins Cell lysis
Load onto column

Which proteins are in my sample?
ProteinsB0205.7 casein kinaseC29A12.3a lig-1 DNA ligaseC29E6.1a mucin like protein…
Protein Mixture
Digestion to Peptides
PeptidesEYWDYEAHMIEWGQIDDYQLVRGGTNIITLLDVVKVVVFLFDLLYFNGEPLVYQTTGQVQYSCLVRLIVVNSEDQLRHPLISLLLLIAFYSTSSEAFVPK…
200 400 600 800 1000 12000
20
40
60
80
100
Re
lative
Ab
ud
an
ce
m/z

Matching a spectrum to a peptide sequence
• De novoInfer peptide sequence from m/z of observed peaks
• Database searchCompare observed peaks to predict peaks for each peptide from a list of candidate sequences
• Library searchCompare observed peaks to known spectra

Building a spectrum library
• Ideally, infuse synthesized peptides – ISB has gold standard spectra from five peptides
per protein in human– University of Washington (MacCoss) will have spectra
from 790 transcription factors and 350 kinases
• Alternatively, use high-quality peptide-spectrum matches from shotgun proteomics experiments– BiblioSpec now parses search results from SEQUEST,
Mascot, X! Tandem, ProteinPilot, Scaffold

Library file formats
BiblioSpecbinary SQTLite
compact fast flexible/extensible accessible

Using a spectrum library
Spectrum identification via library searching
Resource for designing SRM directed experiments
Compact, unified format for compiling results and sharing between labs

Searching a spectrum library
SEQUESTPeptide ID list
Ab
un
da
nce
m/z
Ab
un
da
nce
m/z
Ab
un
da
nce
m/z
Ab
un
da
nce
m/z
Ab
un
da
nce
m/z
Ab
un
da
nce
m/z
MS/MS query spectra
Scan1 0.7 EGSSDEEVP…Scan1 0.3 TFAEILNPI…Scan1 0.2 ARFDLNNHD…-------------------Scan2 0.5 EDEESIRAV…Scan2 0.2 WLGDDCFMV…Scan2 0.1 IDRAAWKAV…-------------------Scan3 0.2 EITTRDMGN…Scan3 0.1 GRNMCTAKL…
BiblioSpec
Ab
un
da
nce
m/z
Ab
un
da
nce
m/z
Ab
un
da
nce
m/z
Ab
un
da
nce
m/z
Ab
un
da
nce
m/z
Ab
un
da
nce
m/z
3 NGISLTIVR
3 QWDKEPPR
2 FMACSDEK
Ab
un
da
nce
m/z
Ab
un
da
nce
m/z
Ab
un
da
nce
m/z
Ab
un
da
nce
m/z
1 CGCCLYNT
2 GDTIENFK
Library of identified spectra765.1
940.4
593.9
300.4
522.3
m/z 594.2
score = 0.2

Comparing library and database search
• Created a large library of spectra from worm peptides
• Identified a different set of spectra using both library and database search
• Compared BiblioSpec results with SEQUEST results to evaluate performancespectrum score library SEQUEST agree?34 0.l7 AFEQWK LVVAMK NO False
positive35 0.83 DLAVER DLAVER YES True
positive36 …

Similarity score discriminates between correct and incorrect matches
insert hist/roc
Histogram of search scores ROC and 1% ROC curve
AUC = 0.978
disagree
agree

BiblioSpec and SEQUEST results agree
• BiblioSpec found 91% of SEQUEST IDs• Two reasons BiblioSpec and SEQUEST disagree:
– Query ion not in library– BiblioSpec found a different peptide to be
more similar
• Only 7% of query spectra not correctly identified were in library. Most disagreed because the correct match was not in library.

Compute p-values to evaluate results
• The BiblioSpec search score provides good discrimination
• But it’s unclear where to place a threshold between correct and incorrect matches
• Use statistical methods to estimate the probability that a match is incorrect and to estimate the fraction of incorrect matches above a score threshold.

How likely is the match incorrect?
distribution of scores for a spectrum vs all possible incorrect matches
score
low scorelarge area to right
p-value = 0.4
high scoresmall area to right
p-value = 0.01

Estimating the null distribution
• Representative sample of scores from incorrect matches
• Guarantee they are incorrect by using decoys• In database searching, scores from
decoy peptides are used to estimate the null distribution
• How can we create decoy spectra?

Generate decoy spectra by shifting the m/z of the peaks
Requirements:•fast to generate•sequence agnostic•representative scoresEvaluation:•score distributions mimic real spectra•generate a data set of incorrect matches to real spectra
decoy spectrum
real spectrum

Circularly shifted peaks are similar to real spectra
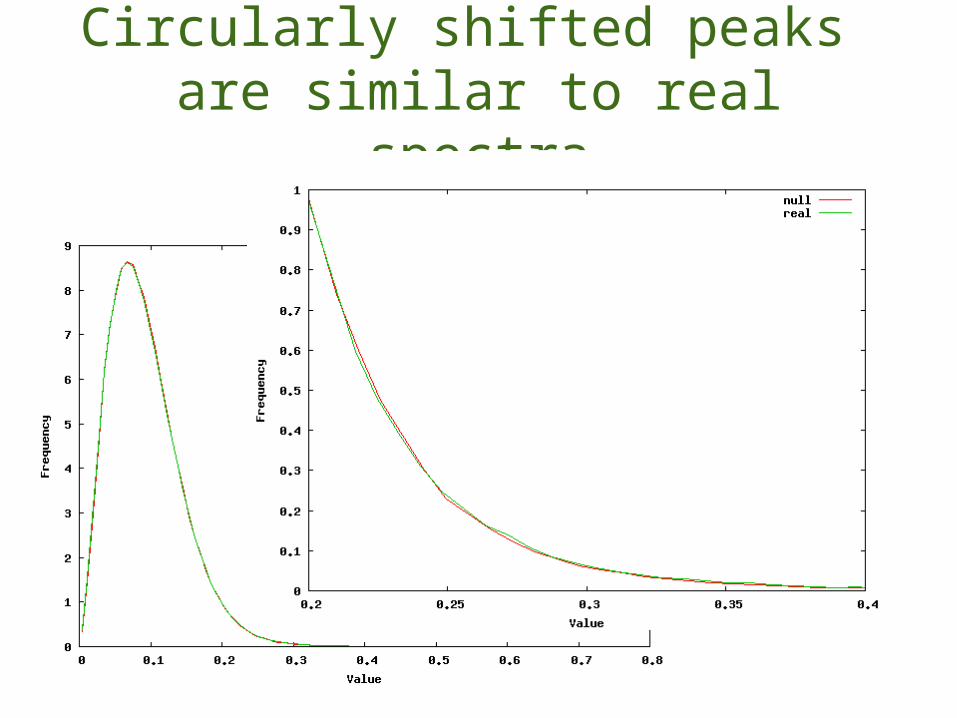
Circularly shifted peaks are similar to real spectra

Percolator computes p-values
Semi–supervised machine learning to classify correct verses incorrect matches
• Trains with high-scoring real matches vs decoy matches
• Classifies all real matches using that model
http://per-colator.comKäll et al. 2007 Nature MethodsKäll et al. 2008 Bioinformatics

Evaluate p-values
• Compute p-values for incorrect matches to real spectra
• Percolator p-values should correspond with rank-based p-values
ID Percolator rank rank/n745AF_8518 0.000230787 1 1/n691AF_10025 0.000461467 2 2/n691AF_10107 0.000692201 3 3/n691AF_10301 0.000922934 4 4/n... ... ... ...691AF_5048 0.001153669 12 12/n... ... ... ...

Calibrating p-values
Rank p-value
Calc
ulat
ed p
-val
ue

Better discrimination with p-values
Percolator combines:•search score•delta m/z•delta search score•charge •petpide length•candidates •copies in library
recall (tp / tp + fn)
prec
isio
n (t
p /
tp +
fp)

Better discrimination with p-values

p-values distinguish between correct and incorrect matches
recall (tp / tp + fn)
prec
isio
n (t
p /
tp +
fp)

p-values distinguish between correct and incorrect matches

p-values provide a universal metric for comparing to other search results
SpectraSpectra
Compiled results
library search
database search
high scoring matches
high scoring matches
low scoring spectra
low scoring spectra
high scoring matches
high scoring matches

AcknowledgementsMacCoss labJesse CanterburyMichael BeremanJarrett EgertsonGreg FinneyEileen HeimerEdward HsiehAlana KilleenBrendan MacLeanGennifer MerrihewDaniela Tomazela
Mike MacCossBill Noble

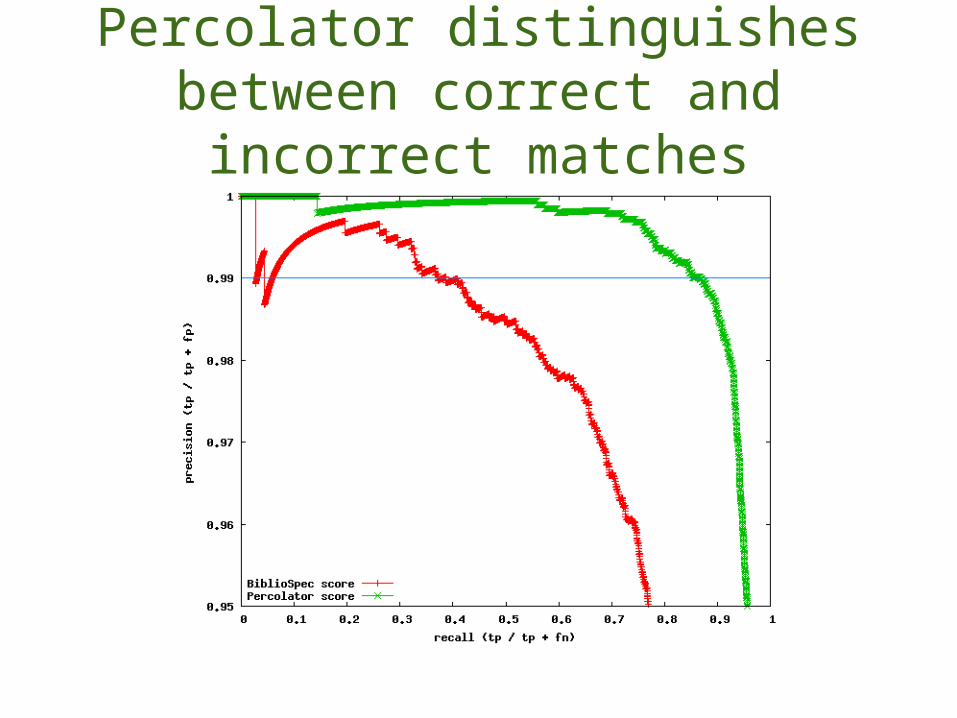
Percolator distinguishes between correct and incorrect matches

Spectrum-sequence assignments
spectrum score library SEQUEST agree?34 0.l7 AFEQWK LVVAMK NO False
positive35 0.83 DLAVER DLAVER YES True
positive36 …

Test procedure MS/MS spectra whole worm lysate 4 fractionation methods 31 MuDPITs, 6,634,874 spectra
SEQUESTDTASelect
BlibFilter
List of spectrum-sequence pairs 366,400 spectra estimated 51 false positives
Ab
un
da
nc
e
m /z
Ab
un
da
nc
e
m /z
Ab
un
da
nc
e
m/z
Ab
un
da
nc
e
m/z
Ab
un
da
nc
e
m /z
Ab
un
da
nc
e
m /z
file scan seqrun1.ms2 404 DALLQW…run1.ms2 651 PJAMVM…run5.ms2 924 SAITTY……
BlibBuild
Library
Multiple spectra per peptide
Library
Scan1 0.7 EGSSDEEVP…Scan1 0.3 TFAEILNPI…Scan1 0.2 ARFDLNNHD…-------------------Scan2 0.5 EDEESIRAV…Scan2 0.2 WLGDDCFMV…Scan2 0.1 IDRAAWKAV…-------------------Scan3 0.2 EITTRDMGN…Scan3 0.1 GRNMCTAKL…
BlibSearch
Peptide ID List
Filtered Library Statistics 26,708 spectra 21,264 sequences 3,573 proteins
Query Spectraunfractionated worm one MuDPIT, 220,845 spectrasimilar DTASelect criteria14,926 spectra 5,358 ions
Ab
un
da
nc
e
m/z
Ab
un
da
nc
e
m/z
Ab
un
da
nc
e
m/z
Ab
un
da
nc
e
m/z
Ab
un
da
nc
e
m/z
Ab
un
da
nc
e
m/z

Optimize processing parameters
• Noise removal– a fixed number of peaks– a fixed fraction of the total intensity– all peaks above a defined noise level
• Intensity normalization– log transform– bin peaks, divide by base peak in each bin– square root of intensity– square root weighted by peak m/z
100
Uses of Spectrum Libraries
• A basis for spectrum identification via spectrum-spectrum searches
• A reference for designing SRM experiments– Skyline
• A repository for spectrum identifications– A unified format for consolidating results, sharing
with other labs

Spectrum shuffling techniques
• Blindly shuffle peaks• Shuffle blocks of peaks• Shift peaks circularly• Identify fragment ions from peptides, shuffle
sequence and move peaks accordingly

Parameter Test Results
Intensity Adjustments:BIN bin peaks, divide by max per binMZ weight peak intensity by m/zSQ square root of intensity
Noise Reduction: T top n peaks usedC top 50% of peak intensity
Processing Order:N noise firstI intensity first
Intensity Noise Order ScoreMZ TOPN 50 I 0.9918MZ TOPN 100 N 0.9915MZ HALF I 0.9887MZ TOPN 200 N 0.9882BIN TOPN 100 N 0.9881MZ TOPN 100 I 0.9873MZ TOPN 200 I 0.9861MZ TOPN 50 N 0.9859MZ TOPN 300 N 0.9856BIN TOPN 200 N 0.9853MZ TOPN 300 I 0.9838BIN TOPN 50 I 0.9825BIN HALF I 0.9811
Intensity Noise Order ScoreSQ TOPN 50 N 0.9807BIN TOPN 100 I 0.9803BIN TOPN 300 I 0.9788SQ TOPN 100 N 0.9787BIN TOPN 200 I 0.9777BIN TOPN 50 N 0.9769BIN TOPN 300 N 0.9766SQ TOPN 300 N 0.9761SQ HALF I 0.9756SQ TOPN 200 N 0.9751BIN HALF N 0.9635MZ HALF N 0.9465SQ HALF N 0.9442