statistical considerations for phase ii trials and ... · statistical considerations for phase ii...
TRANSCRIPT
Statistical Considerations for Phase II Trials and Adaptive
Designs
J. Jack Lee, Ph.D., D.D.S.Department of BiostatisticsUniversity of Texas M. D. Anderson Cancer Center
Objectives of Phase II Trials• Initial assessment of drug’s efficacy (IIA)• Refine drug’s toxicity profile• Compare efficacy among active agents and send the
most promising one(s) to Phase III trials (IIB)
Key Elements of Phase II Trials• Patient Population
– More homogeneous group with specific disease site, histology, and stage than Phase I trials
• Dose Level– At MTD or RPTD or OBD from Phase I trials– Dose adjustment may be needed
• Endpoints– Short term efficacy endpoint
• Response categories: CR, PR, NC, PD at, say, 4 wks• Response rate: proportion in CR + PR• Disease control rate: proportion in CR + PR + SD
(for targeted agents)• Disease-free survival or progression-free survival at, say, 3 or 6
months
Available Phase II Designs• Phase IIA Trials
– Gehan’s design (J. Chron. Dis. 1961)– Simon’s two-stage designs (Contr. Clin. Trials, 1989)– Other multi-stage designs– Predictive probability design (Clin. Trials, 2008)
• Phase IIB Trials– Simon et al.’s ranking and selection randomized phase II
design (Cancer Treat. Rep. 1985)– Randomized discontinuation design (JCO 2002)– Other randomized phase II designs– (Bayesian) Adaptive designs
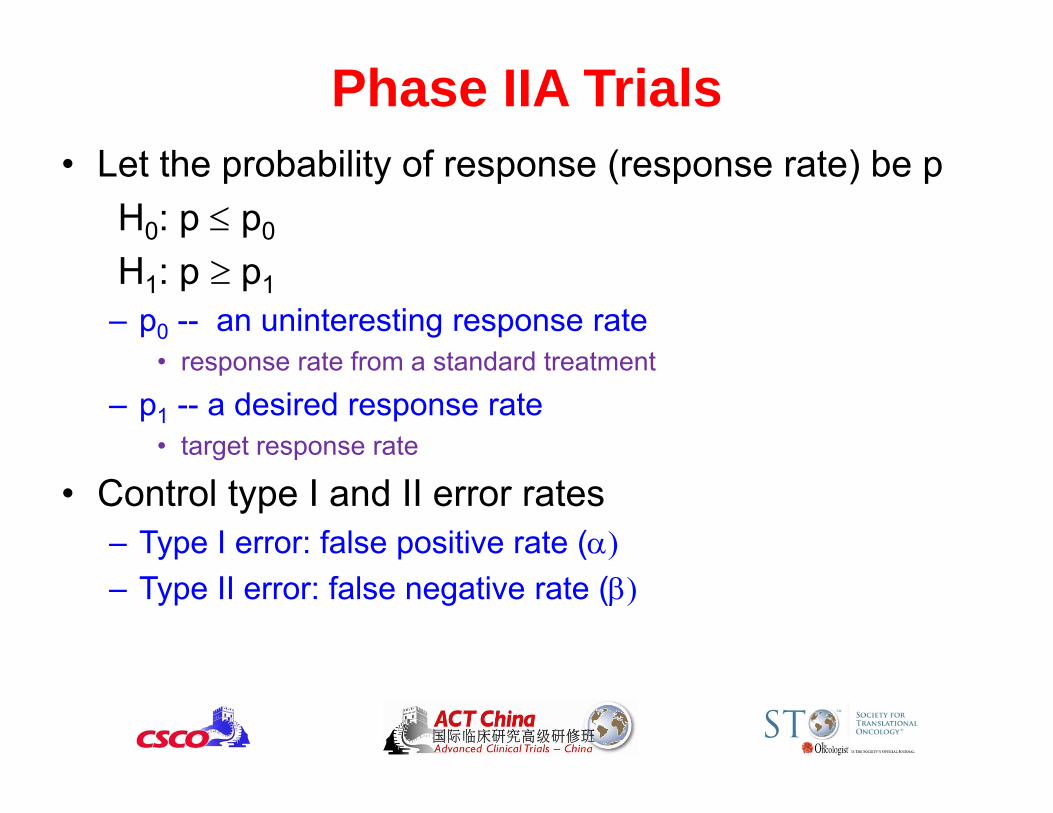
Phase IIA Trials• Let the probability of response (response rate) be p
H0: p p0
H1: p p1– p0 -- an uninteresting response rate
• response rate from a standard treatment
– p1 -- a desired response rate• target response rate
• Control type I and II error rates– Type I error: false positive rate (– Type II error: false negative rate (
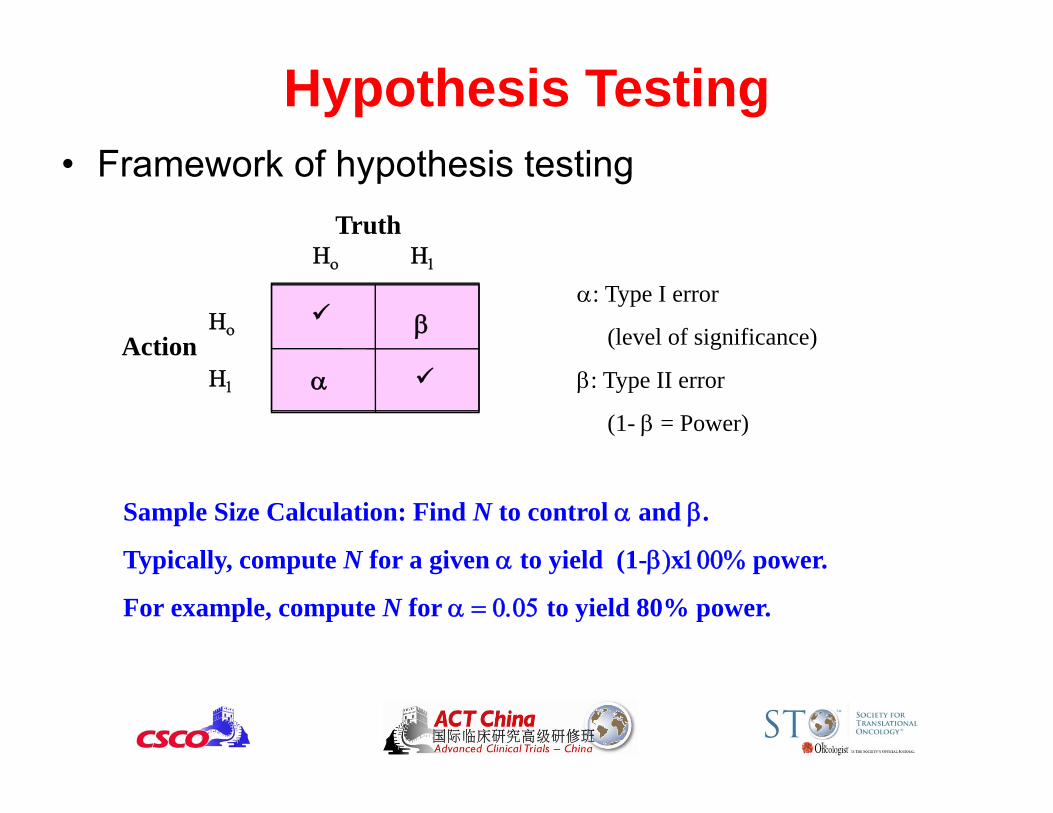
Hypothesis Testing• Framework of hypothesis testing
Action
Truth
: Type I error
(level of significance)
: Type II error
(1- = Power)
Sample Size Calculation: Find N to control and .
Typically, compute N for a given to yield (1-x power.
For example, compute N for to yield 80% power.
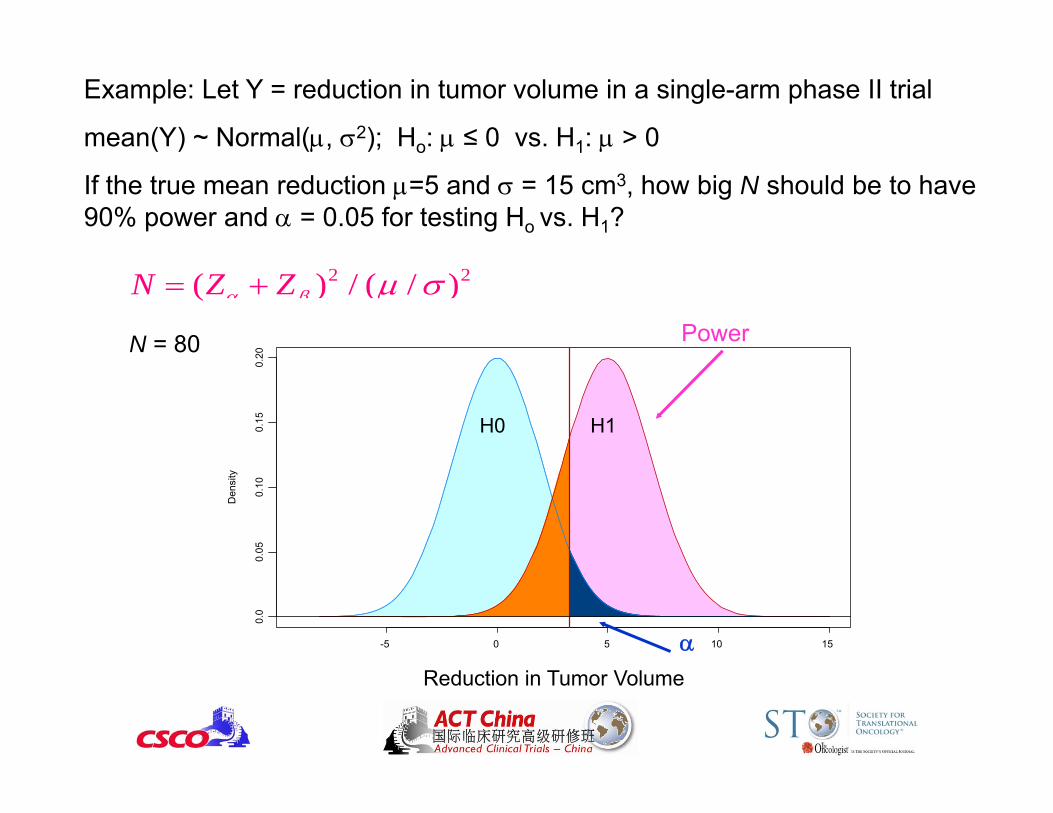
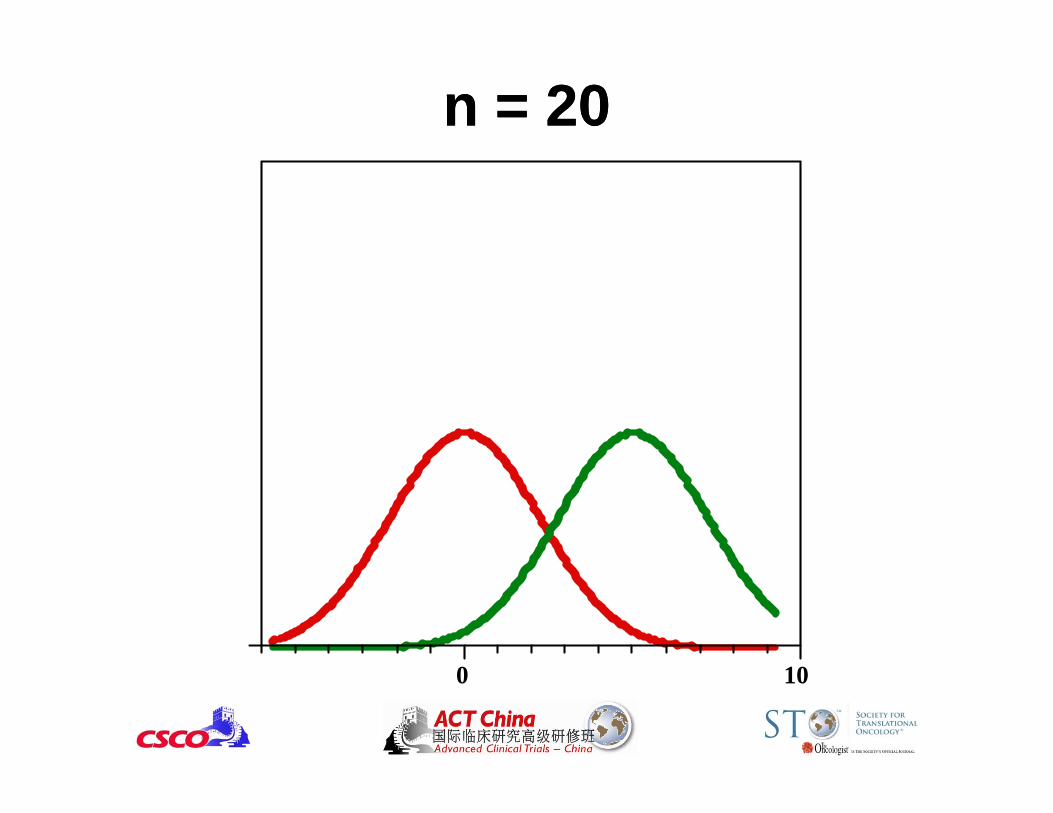
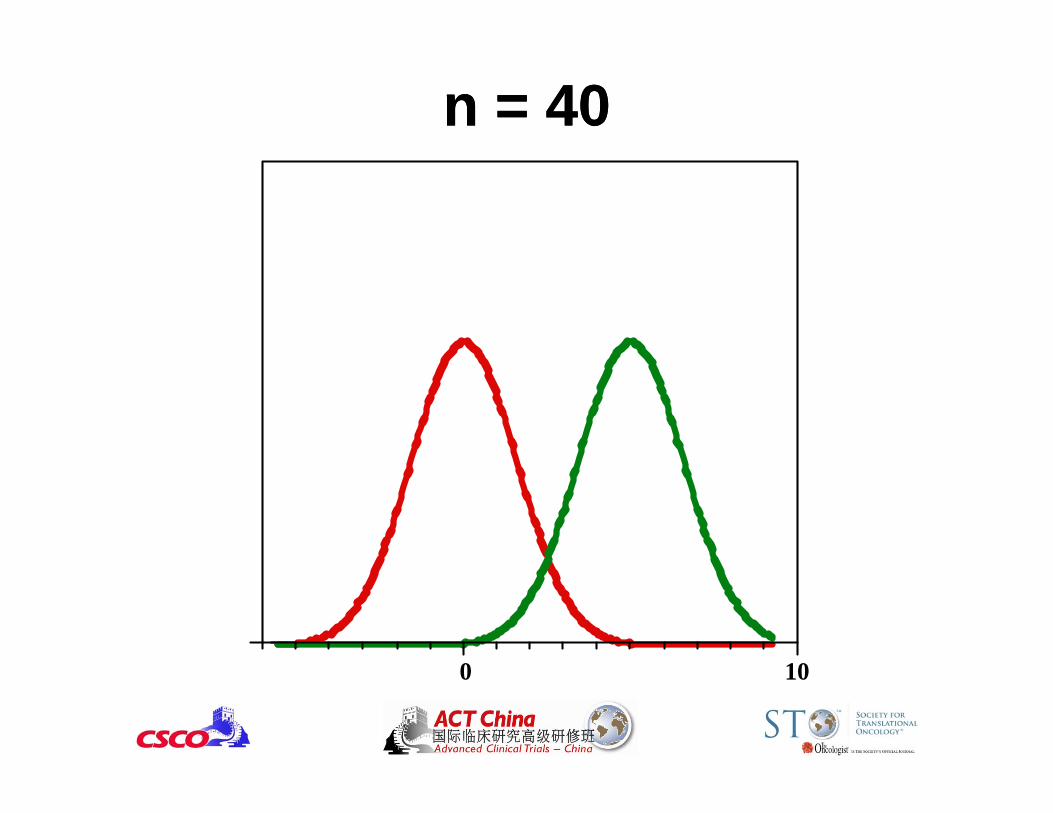
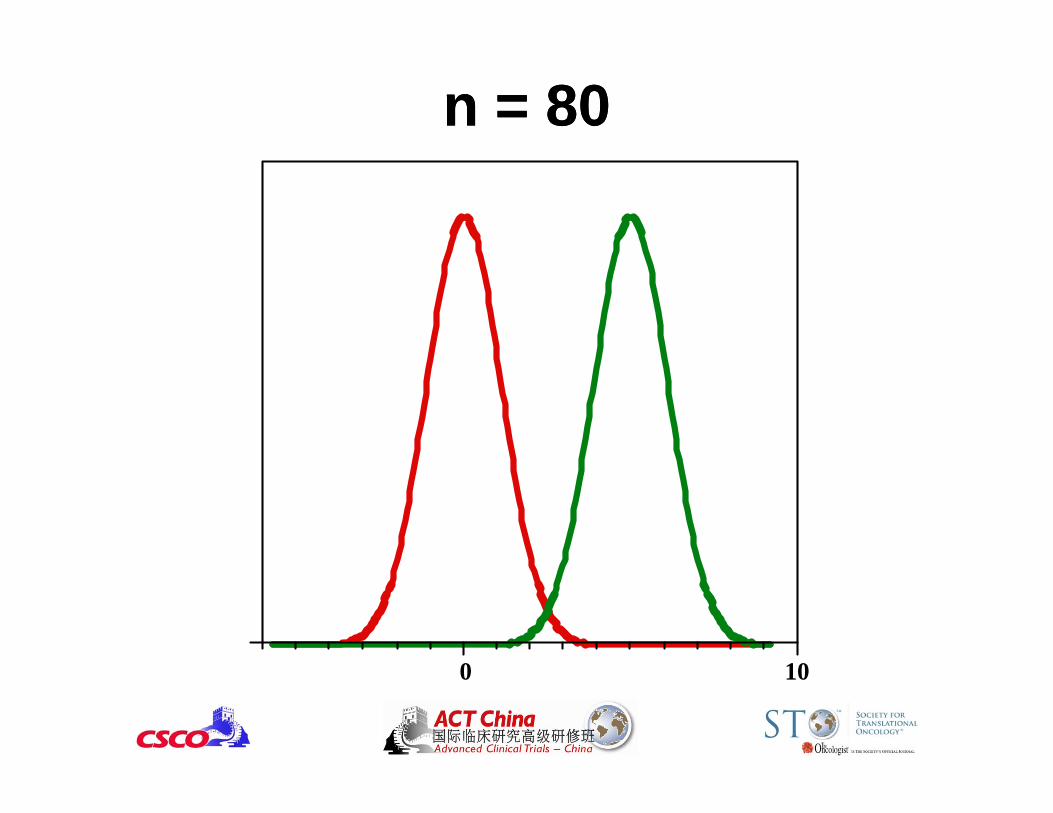
Example: Let Y = reduction in tumor volume in a single-arm phase II trial
mean(Y) ~ Normal(, 2); Ho: ≤ 0 vs. H1: > 0
If the true mean reduction =5 and = 15 cm3, how big N should be to have 90% power and = 0.05 for testing Ho vs. H1?
2 2( ) / ( / )N Z Z
N = 80
Blood Pressure Reduction
Den
sity
-5 0 5 10 15
0.0
0.05
0.10
0.15
0.20
H0 H1
Power
Reduction in Tumor Volume
0 10
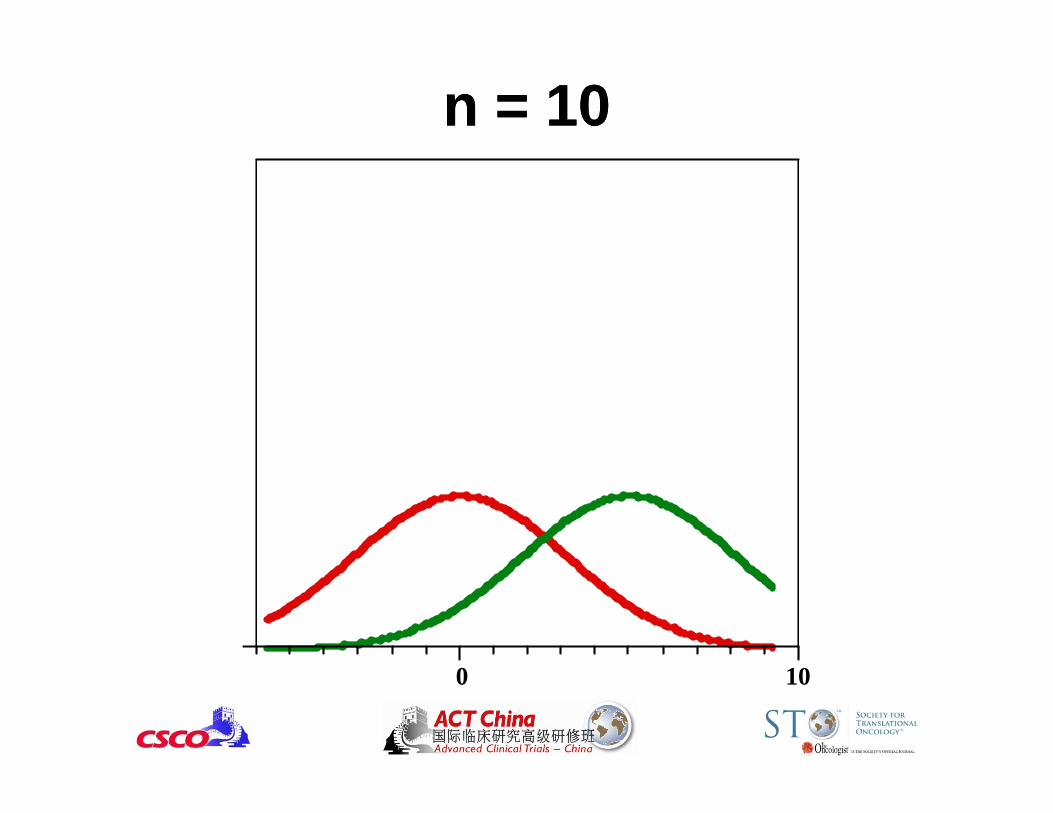
n = 10n = 10
0 10
n = 20n = 20
0 10
n = 40n = 40
0 10
n = 80n = 80
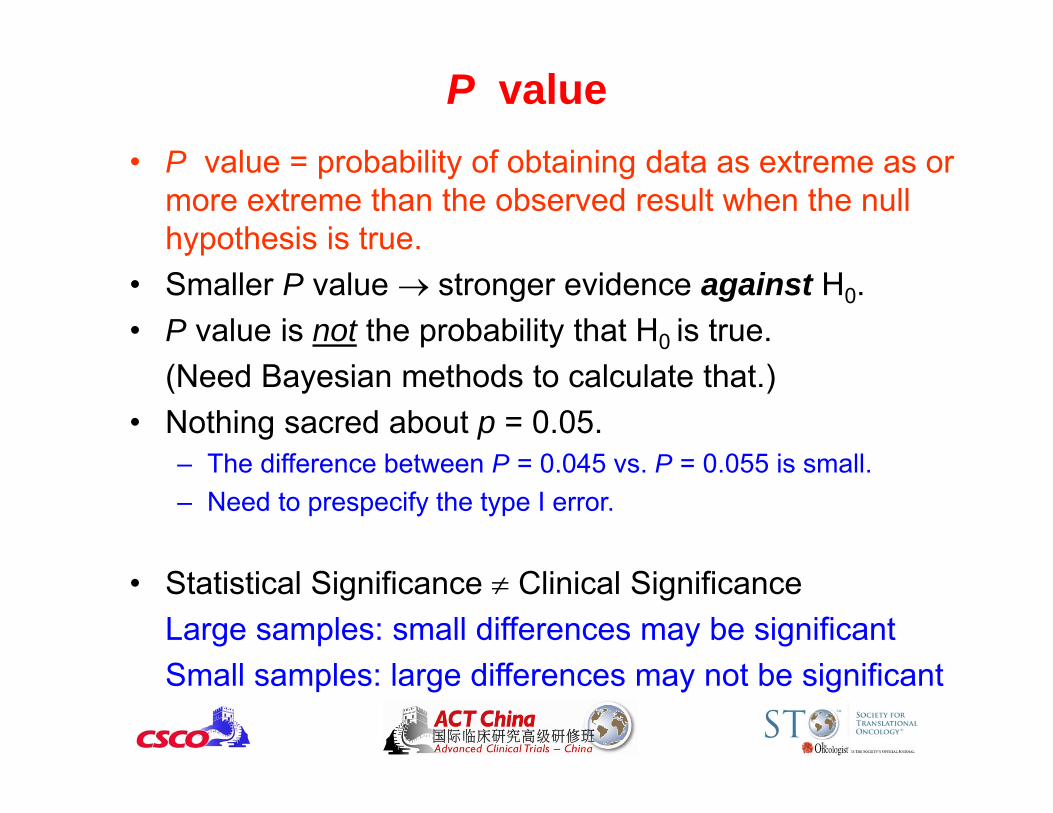
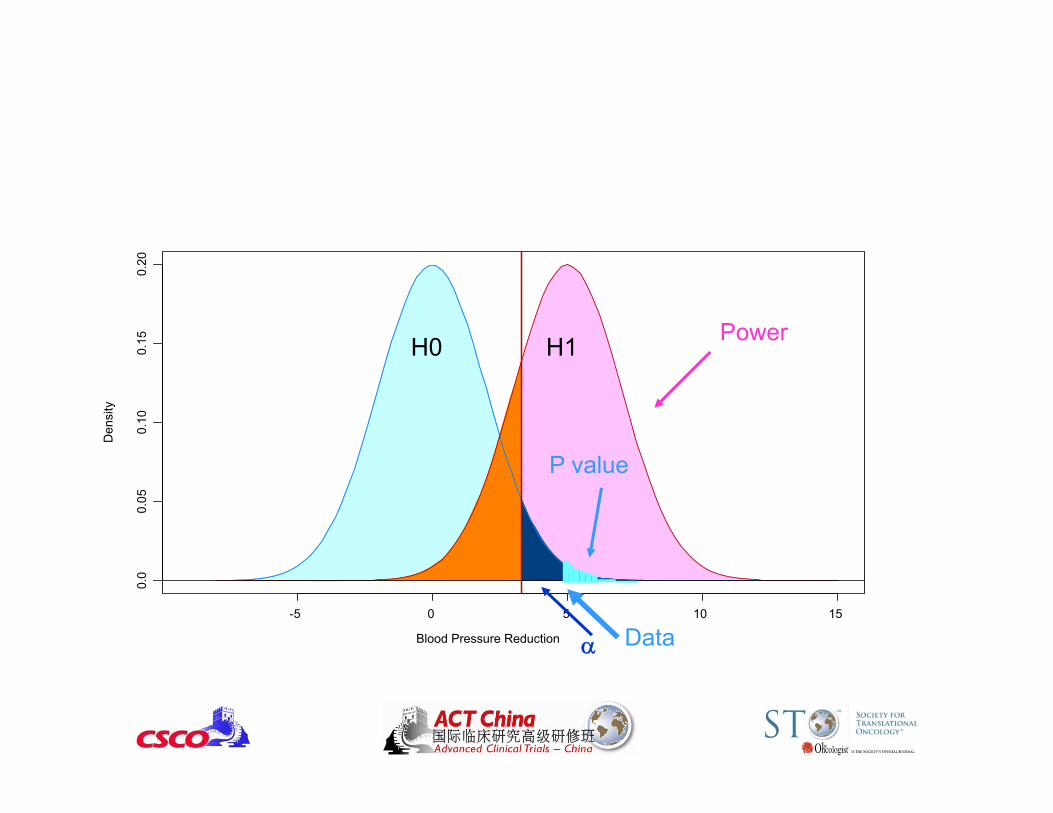
P value• P value = probability of obtaining data as extreme as or
more extreme than the observed result when the null hypothesis is true.
• Smaller P value stronger evidence against H0.• P value is not the probability that H0 is true.
(Need Bayesian methods to calculate that.) • Nothing sacred about p = 0.05.
– The difference between P = 0.045 vs. P = 0.055 is small.– Need to prespecify the type I error.
• Statistical Significance Clinical SignificanceLarge samples: small differences may be significantSmall samples: large differences may not be significant
Blood Pressure Reduction
Den
sity
-5 0 5 10 15
0.0
0.05
0.10
0.15
0.20
H0 H1
P value
Power
Data
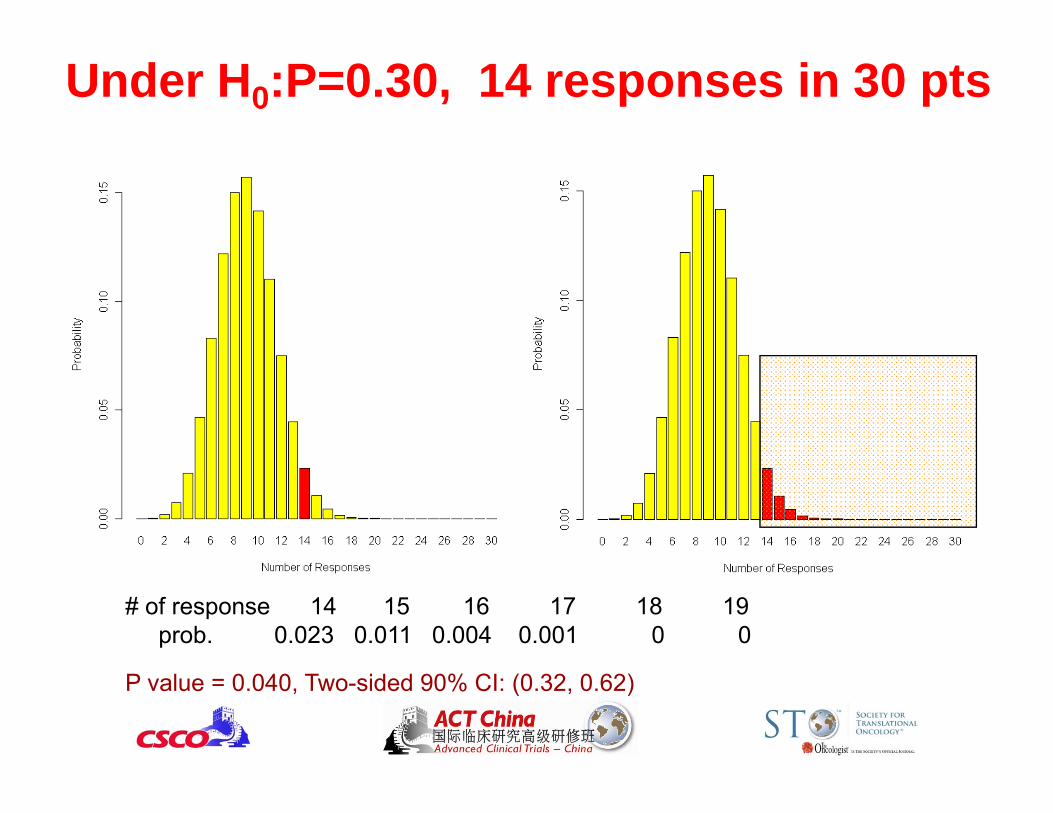
Under H0:P=0.30, 14 responses in 30 pts
# of response 14 15 16 17 18 19prob. 0.023 0.011 0.004 0.001 0 0
P value = 0.040, Two-sided 90% CI: (0.32, 0.62)
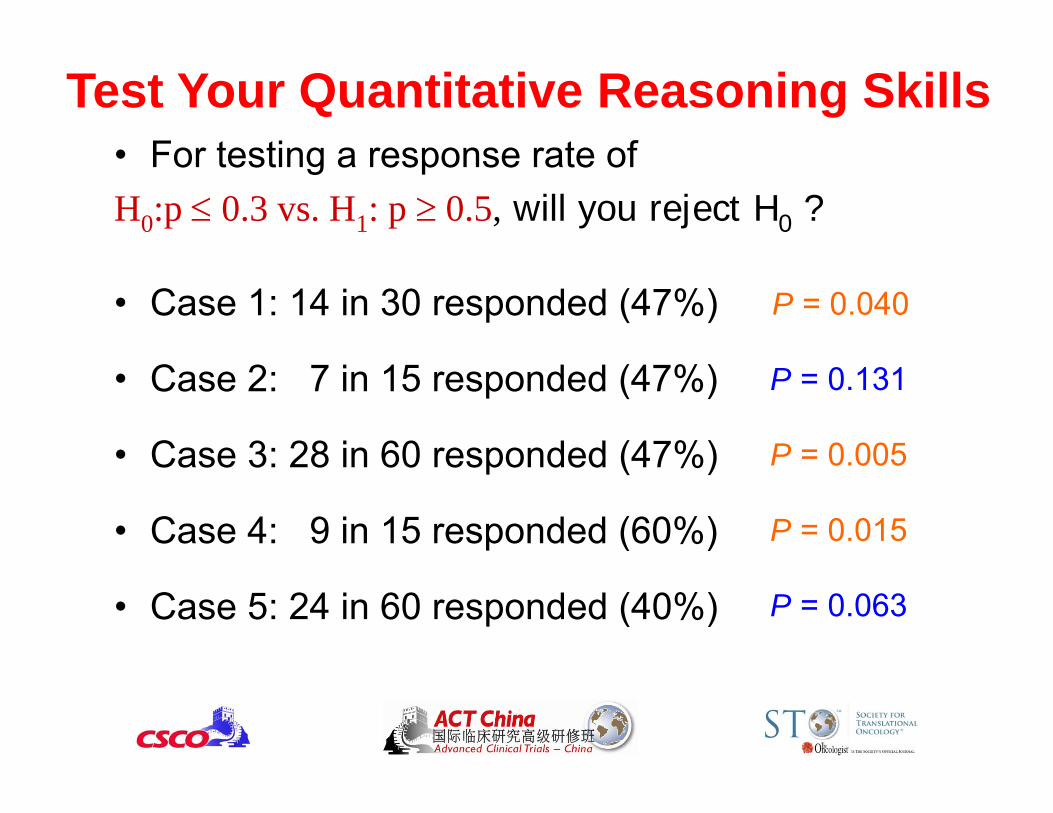
Test Your Quantitative Reasoning Skills• For testing a response rate ofH0:p 0.3 vs. H1: p 0.5, will you reject H0 ?
• Case 1: 14 in 30 responded (47%)
• Case 2: 7 in 15 responded (47%)
• Case 3: 28 in 60 responded (47%)
• Case 4: 9 in 15 responded (60%)
• Case 5: 24 in 60 responded (40%)
P = 0.040
P = 0.131
P = 0.005
P = 0.015
P = 0.063
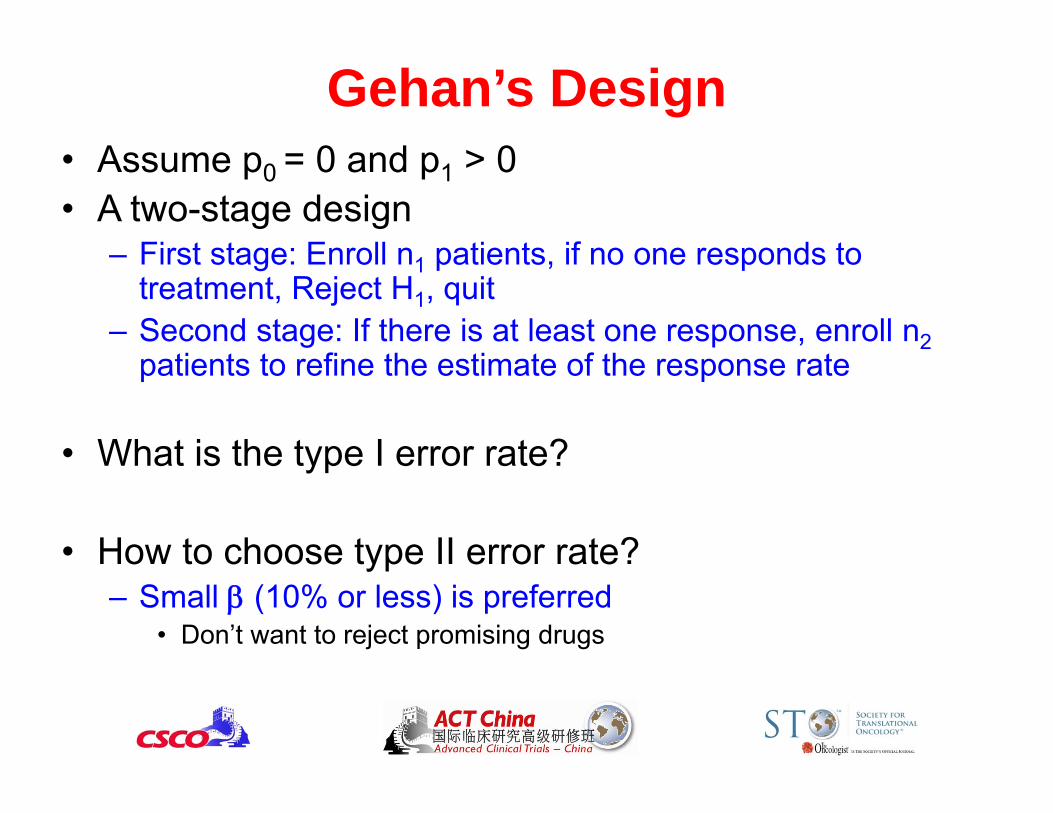
Gehan’s Design• Assume p0 = 0 and p1 > 0• A two-stage design
– First stage: Enroll n1 patients, if no one responds to treatment, Reject H1, quit
– Second stage: If there is at least one response, enroll n2patients to refine the estimate of the response rate
• What is the type I error rate?
• How to choose type II error rate?– Small (10% or less) is preferred
• Don’t want to reject promising drugs
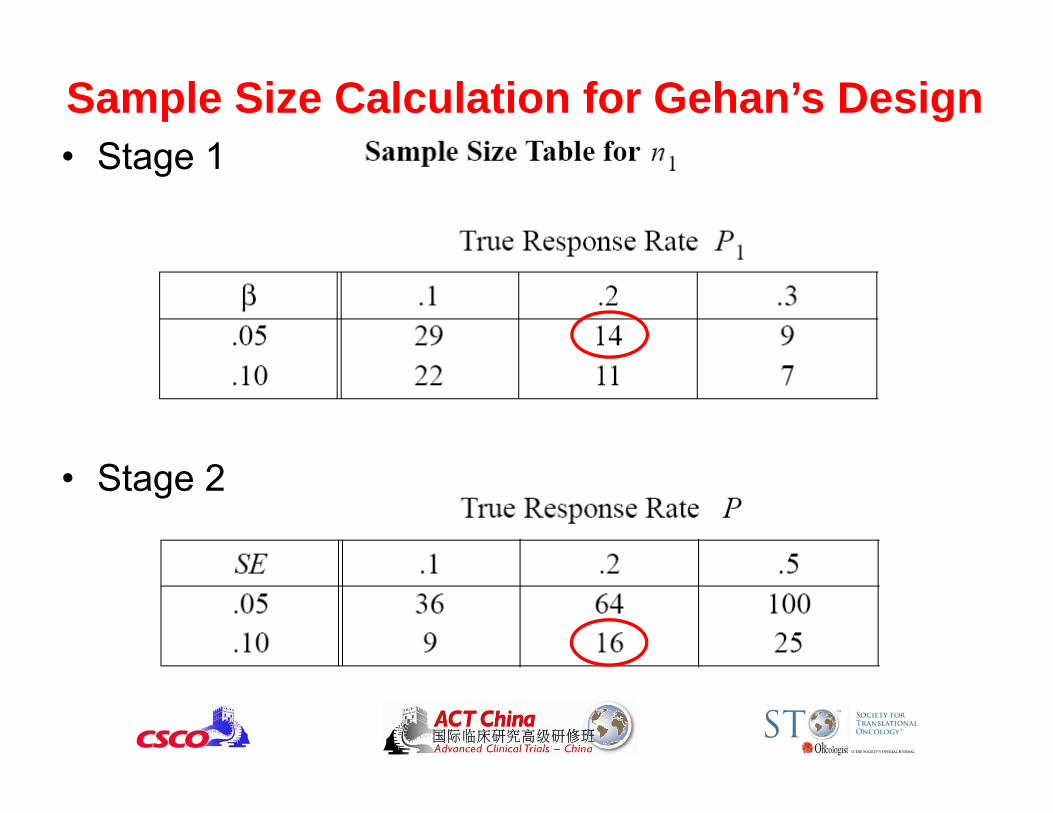
Sample Size Calculation for Gehan’s Design• Stage 1
• Stage 2
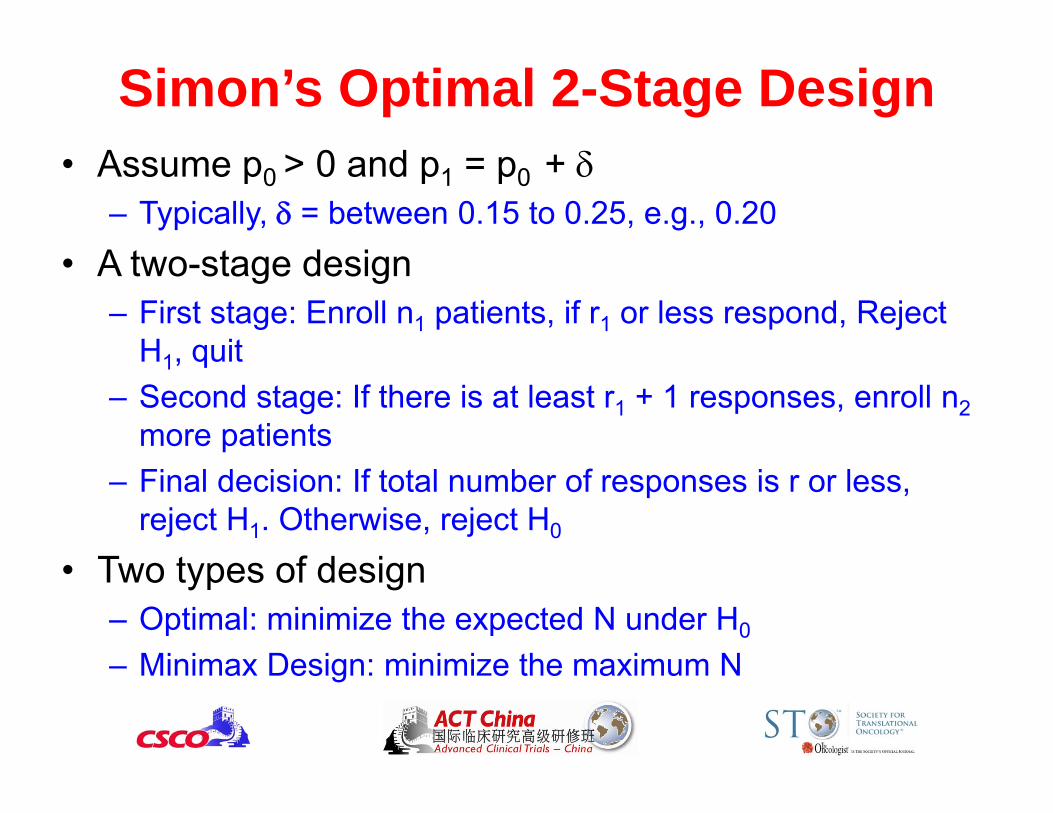
Simon’s Optimal 2-Stage Design• Assume p0 > 0 and p1 = p0 +
– Typically, = between 0.15 to 0.25, e.g., 0.20• A two-stage design
– First stage: Enroll n1 patients, if r1 or less respond, Reject H1, quit
– Second stage: If there is at least r1 + 1 responses, enroll n2more patients
– Final decision: If total number of responses is r or less, reject H1. Otherwise, reject H0
• Two types of design– Optimal: minimize the expected N under H0
– Minimax Design: minimize the maximum N
Simon’s Optimal 2-Stage Design
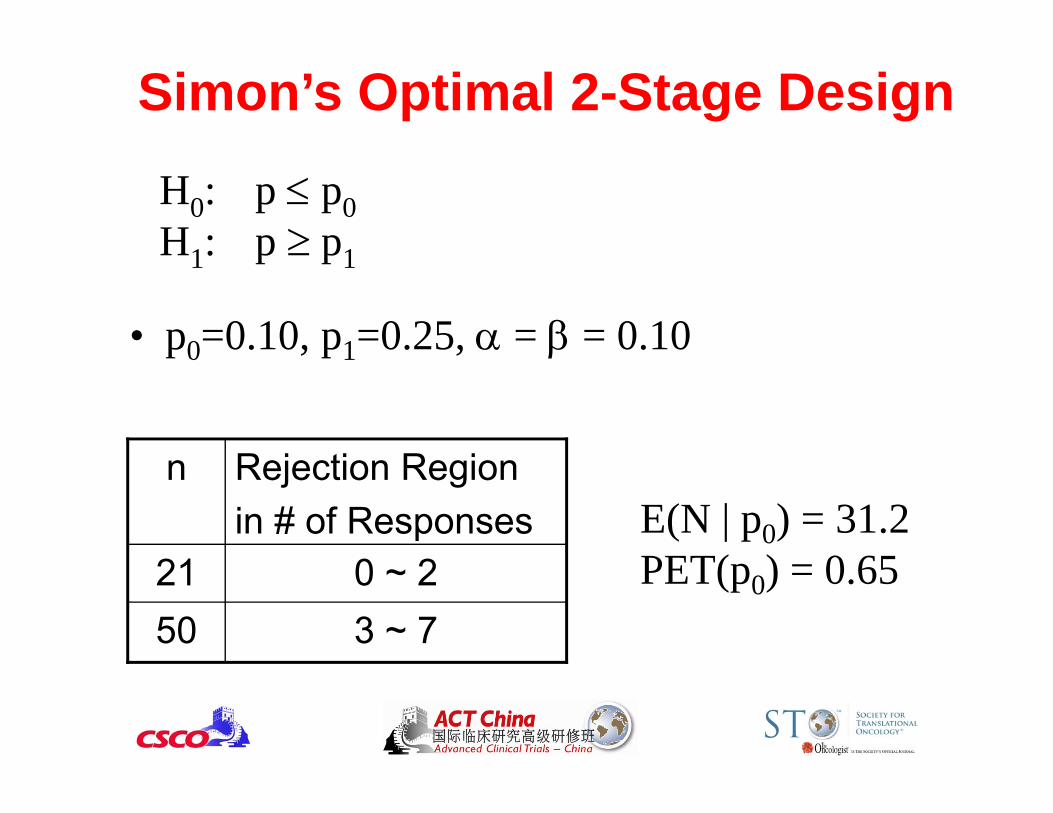
H0: p p0H1: p p1
• p0=0.10, p1=0.25, = = 0.10
3 ~ 7500 ~ 221
Rejection Regionin # of Responses
nE(N | p0) = 31.2PET(p0) = 0.65
Comments on Simon’s Design• Suitable for p0 > 0• Allow stopping early due to futility: Good• Does not allow stopping early due to initial efficacy:
Good• Drawback:
– No early stopping when a long string of failures are observed
– Similar to all frequentist designs, when the study conduct deviates from the design, all statistical properties no longer hold
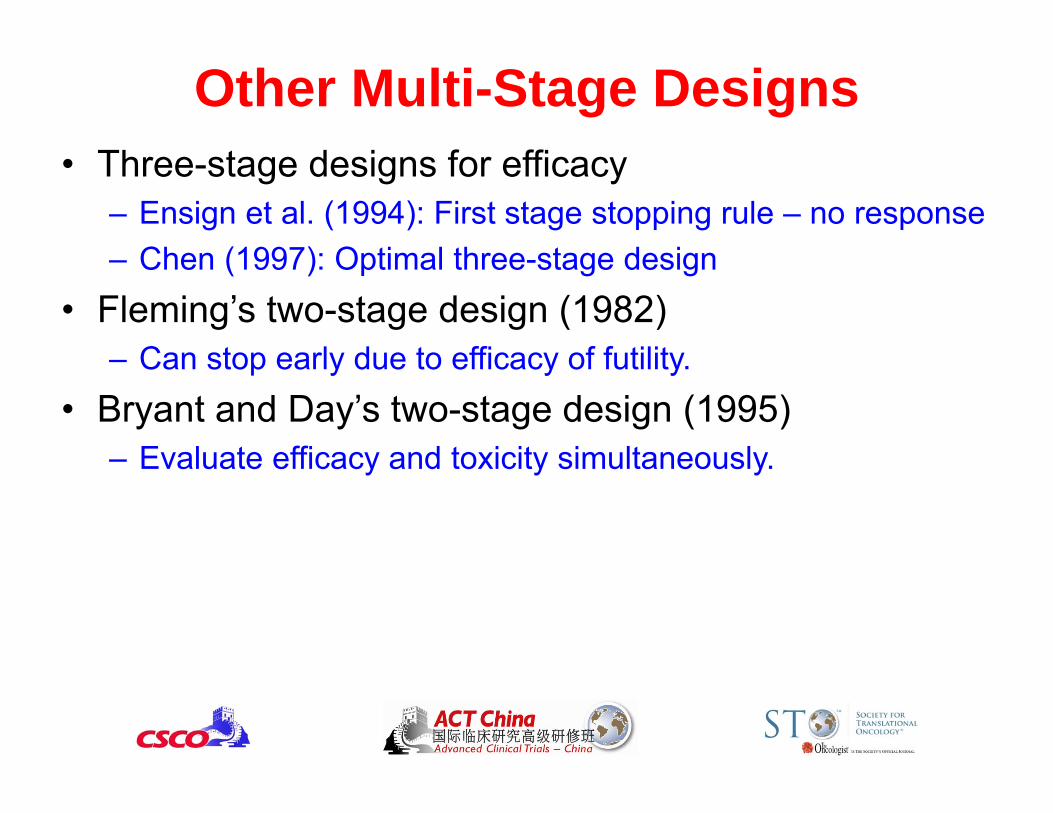
Other Multi-Stage Designs• Three-stage designs for efficacy
– Ensign et al. (1994): First stage stopping rule – no response – Chen (1997): Optimal three-stage design
• Fleming’s two-stage design (1982)– Can stop early due to efficacy of futility.
• Bryant and Day’s two-stage design (1995)– Evaluate efficacy and toxicity simultaneously.
Prediction Is Hard, Especially About The Future.
an Approach– Assume data is fixed and parameter is random– Make inference based on p( | data)– Apply Bayes theorem for computation
p( datan, datan+1) p( datan ) x L (datan+1 |)posterior prob(ORR) prior prob(ORR) x data likelihood
Bayesian 1-2-3: Prior, Data, Posterior
• Adaptive in nature– Bayesian method continues to learn. The posterior
information is an outcome of learning by synthesizing prior information and observed data
Bayesian Paradigm
Ideal for clinical trials!
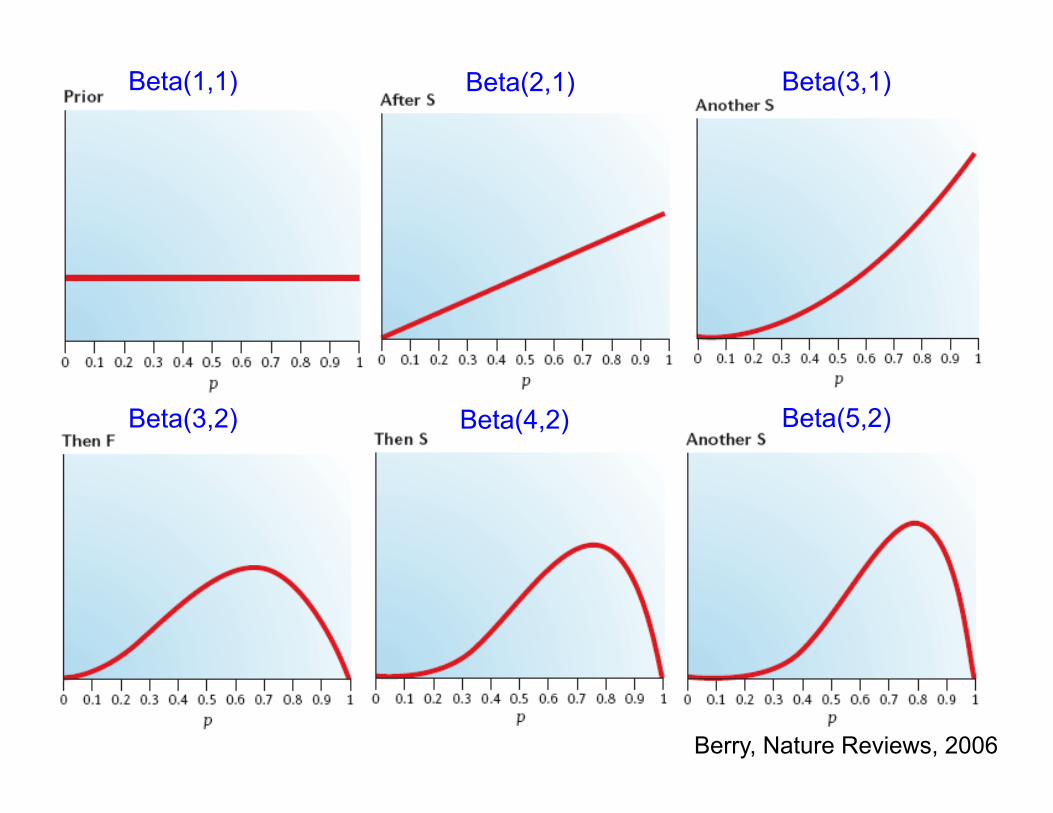
Beta(1,1)
Berry, Nature Reviews, 2006
Beta(2,1) Beta(3,1)
Beta(3,2) Beta(4,2) Beta(5,2)
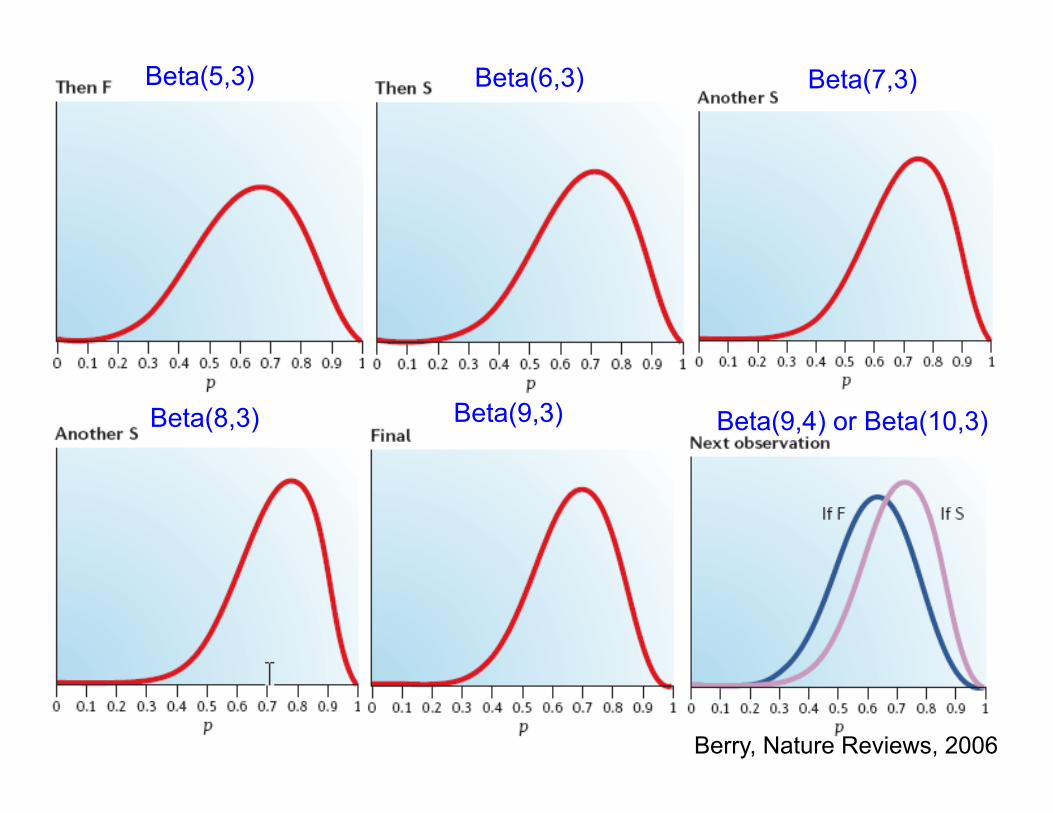
Beta(5,3) Beta(6,3) Beta(7,3)
Beta(8,3) Beta(9,3) Beta(9,4) or Beta(10,3)
Berry, Nature Reviews, 2006
Predictive Probability (PP) Design• PP is the probability of rejecting H0 at the end of study should the current trend continue, i.e., given the current data, the chance of declaring a “positive” result at the end of study.
• If PP is very large or very small, essentially we know the answer can stop the trial now and draw a conclusion.
• In a phase IIA trial, we typically don’t want to stop early due to efficacy; can treat more patients and learn more about the treatment’s efficacy and toxicity.
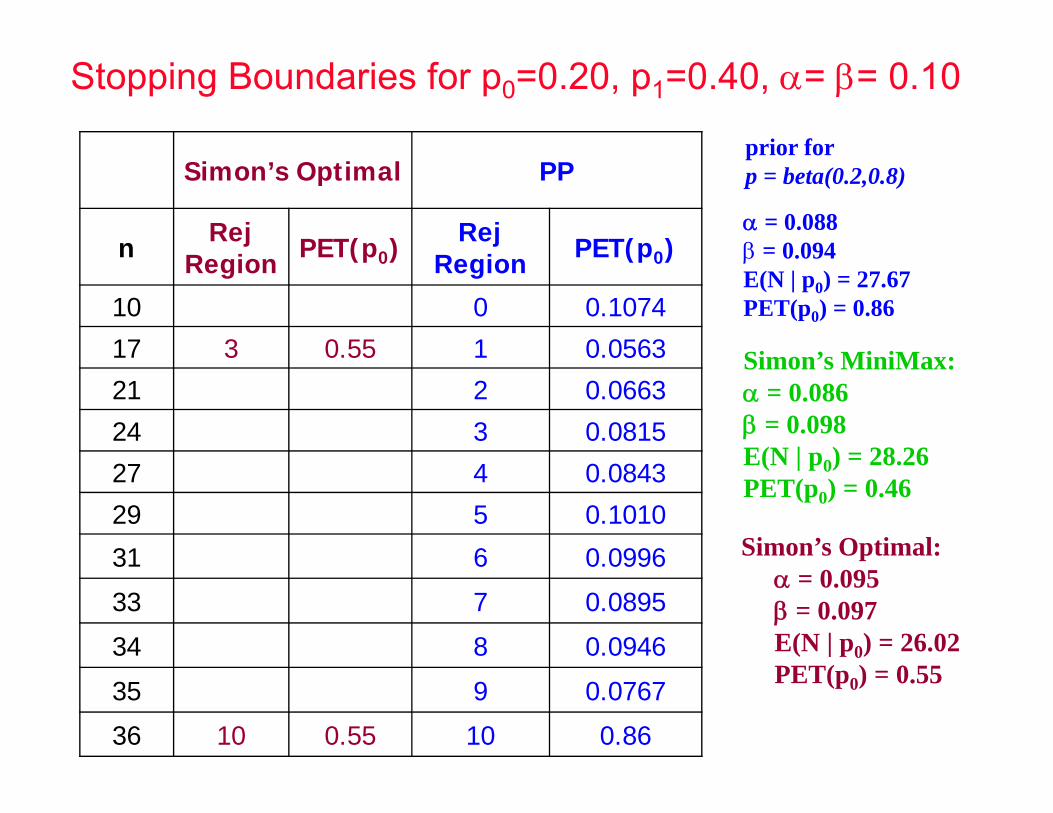
prior for p = beta(0.2,0.8) Simon’s Optimal PP
n Rej Region PET(p0) Rej
Region PET(p0)
10 0 0.1074
17 3 0.55 1 0.0563
21 2 0.0663
24 3 0.0815
27 4 0.0843
29 5 0.1010
31 6 0.0996
33 7 0.0895
34 8 0.0946
35 9 0.0767
36 10 0.55 10 0.86
= 0.088 = 0.094E(N | p0) = 27.67PET(p0) = 0.86
Simon’s Optimal: = 0.095 = 0.097E(N | p0) = 26.02PET(p0) = 0.55
Simon’s MiniMax: = 0.086 = 0.098E(N | p0) = 28.26PET(p0) = 0.46
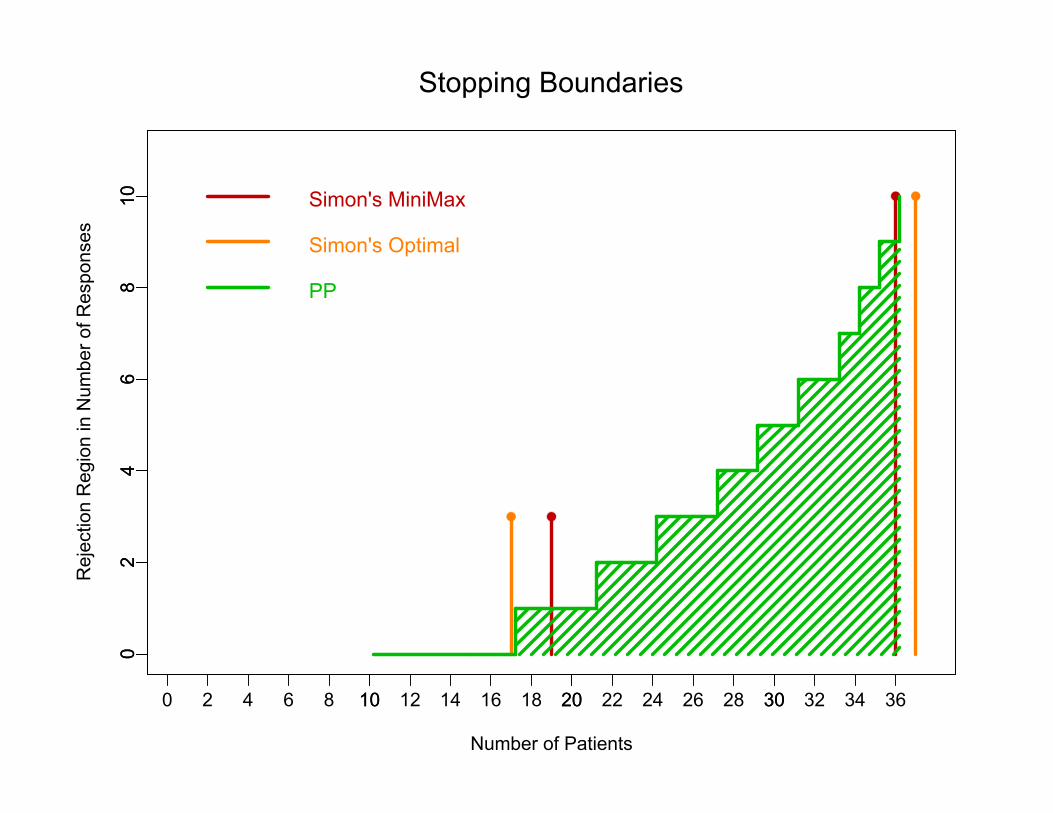
Stopping Boundaries for p0=0.20, p1=0.40, = = 0.10
Number of Patients
Rej
ectio
n R
egio
n in
Num
ber o
f Res
pons
es
0 10 20 30
02
46
810
2 4 6 8 10 12 14 16 18 20 22 24 26 28 30 32 34 36
02
46
810 Simon's MiniMax
Stopping Boundaries
Simon's Optimal
PP
http://biostatistics.mdanderson.org/SoftwareDownload
A Windows executable version is also available.
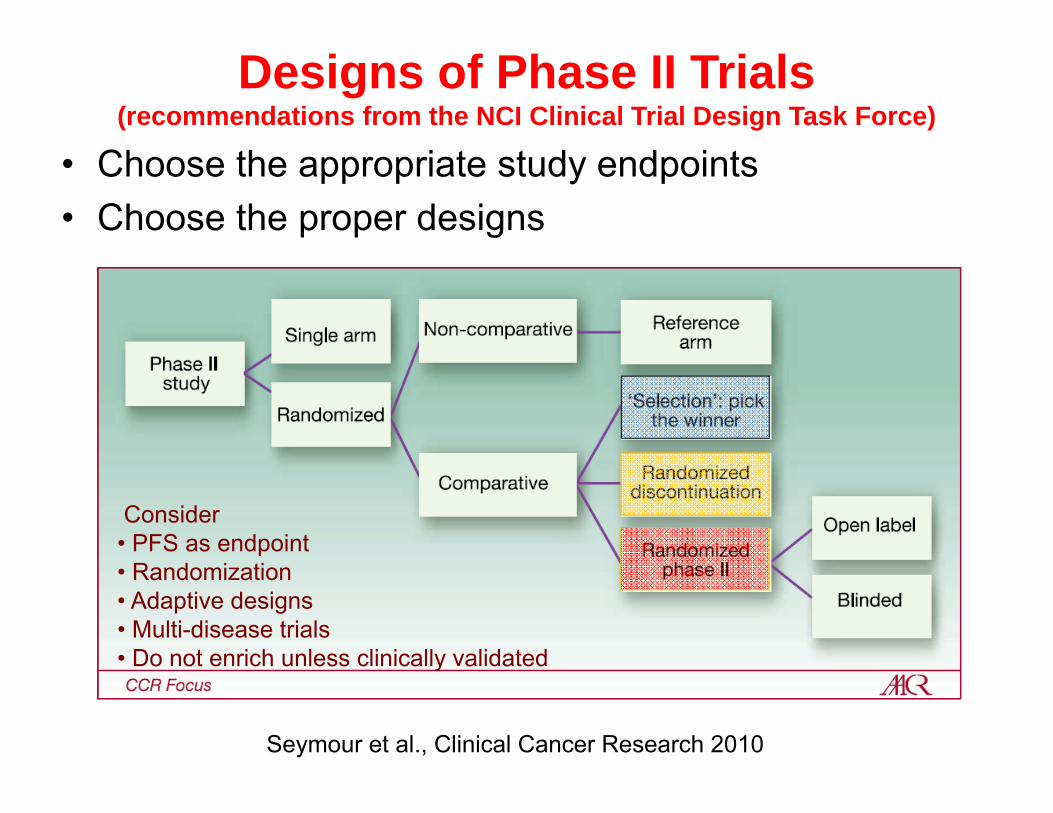
Designs of Phase II Trials(recommendations from the NCI Clinical Trial Design Task Force)
• Choose the appropriate study endpoints• Choose the proper designs
Seymour et al., Clinical Cancer Research 2010
Consider • PFS as endpoint• Randomization• Adaptive designs• Multi-disease trials• Do not enrich unless clinically validated
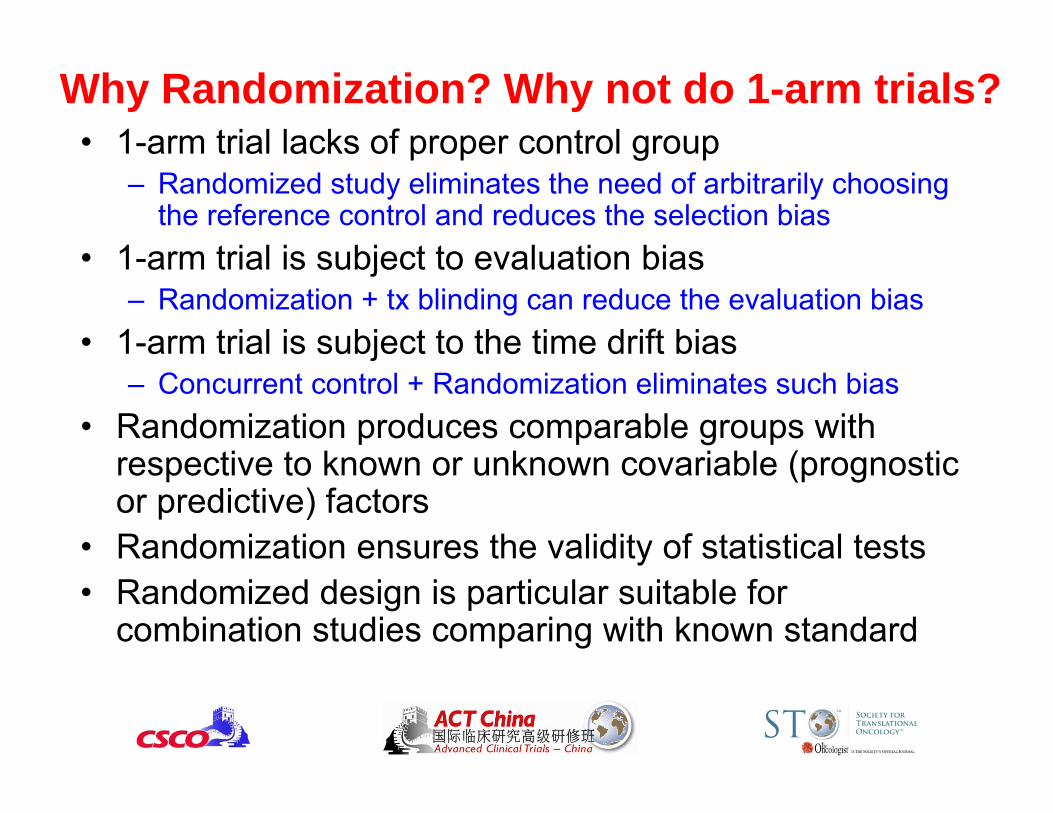
Why Randomization? Why not do 1-arm trials?• 1-arm trial lacks of proper control group
– Randomized study eliminates the need of arbitrarily choosing the reference control and reduces the selection bias
• 1-arm trial is subject to evaluation bias– Randomization + tx blinding can reduce the evaluation bias
• 1-arm trial is subject to the time drift bias– Concurrent control + Randomization eliminates such bias
• Randomization produces comparable groups with respective to known or unknown covariable (prognostic or predictive) factors
• Randomization ensures the validity of statistical tests• Randomized design is particular suitable for
combination studies comparing with known standard
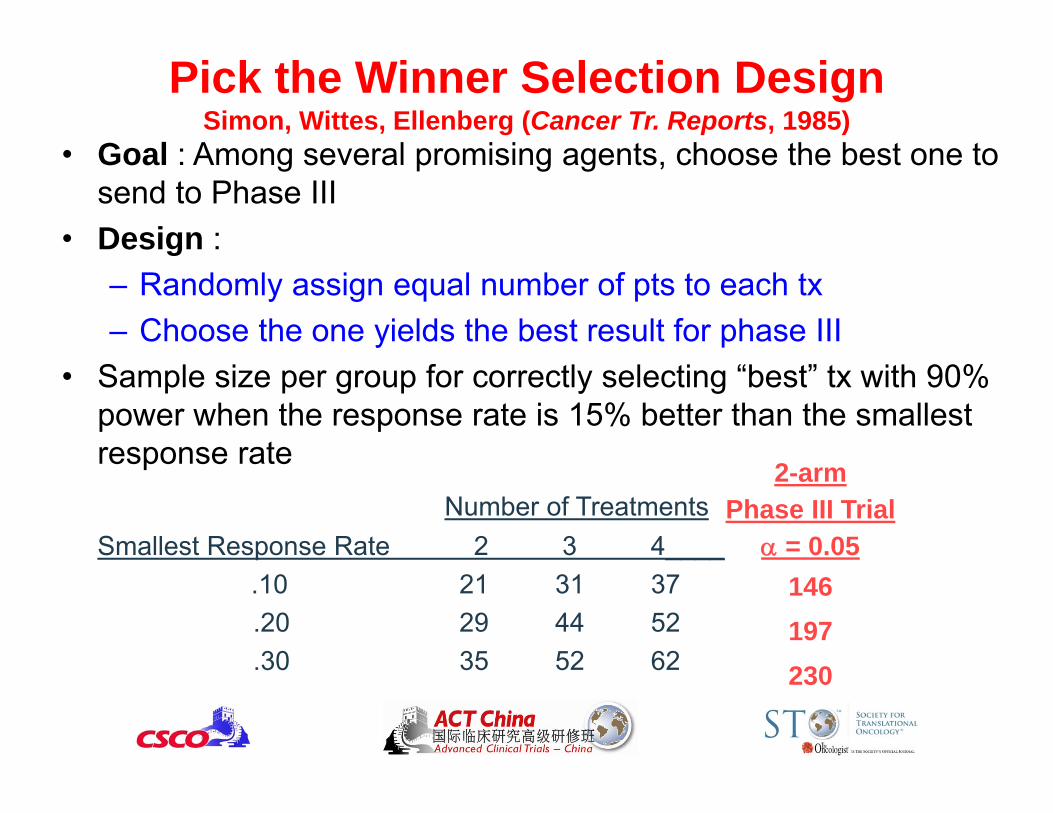
Pick the Winner Selection DesignSimon, Wittes, Ellenberg (Cancer Tr. Reports, 1985)
• Goal : Among several promising agents, choose the best one to send to Phase III
• Design :– Randomly assign equal number of pts to each tx– Choose the one yields the best result for phase III
• Sample size per group for correctly selecting “best” tx with 90% power when the response rate is 15% better than the smallest response rate
Number of TreatmentsSmallest Response Rate 2 3 4____
.10 21 31 37.20 29 44 52.30 35 52 62
2-armPhase III Trial
= 0.05146197230
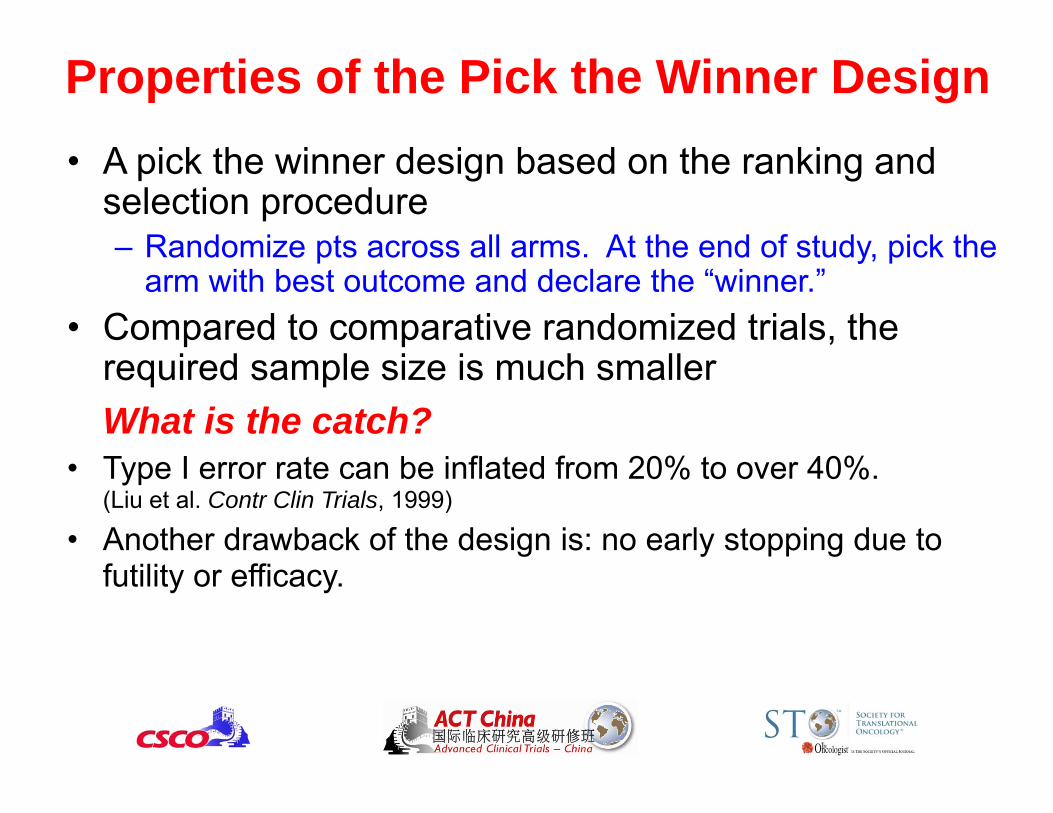
Properties of the Pick the Winner Design• A pick the winner design based on the ranking and
selection procedure– Randomize pts across all arms. At the end of study, pick the
arm with best outcome and declare the “winner.”• Compared to comparative randomized trials, the
required sample size is much smallerWhat is the catch?
• Type I error rate can be inflated from 20% to over 40%. (Liu et al. Contr Clin Trials, 1999)
• Another drawback of the design is: no early stopping due to futility or efficacy.
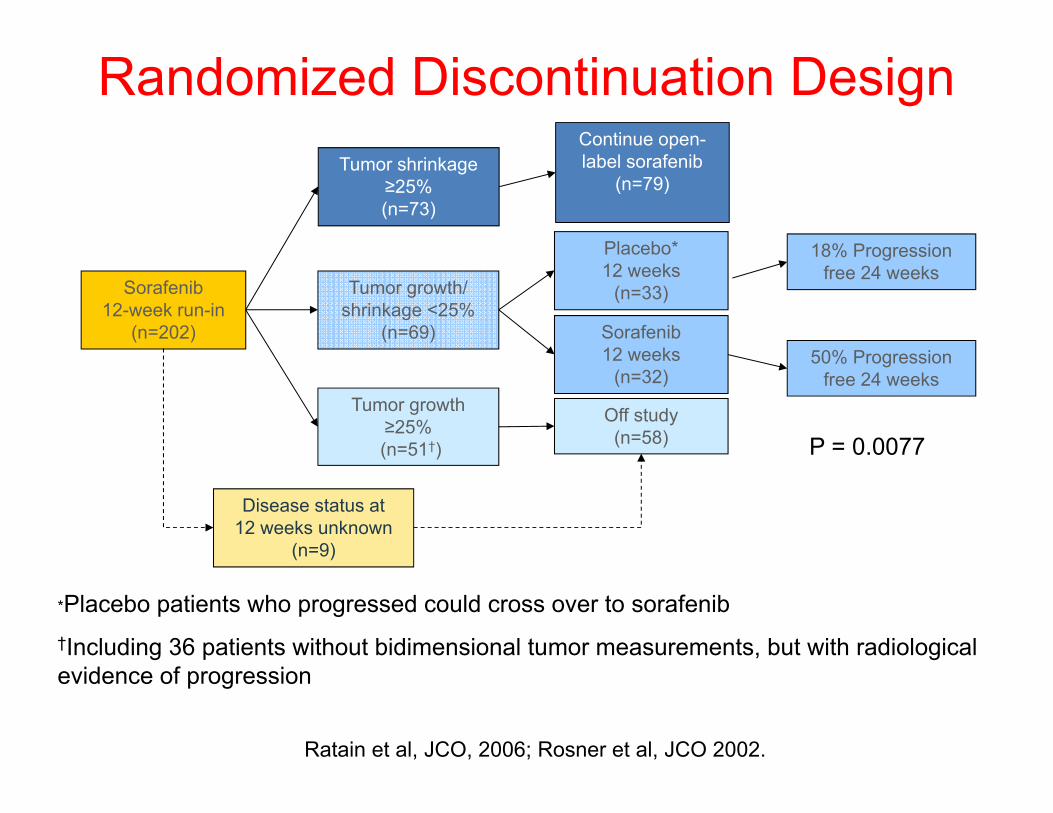
*Placebo patients who progressed could cross over to sorafenib†Including 36 patients without bidimensional tumor measurements, but with radiological evidence of progression
Sorafenib 12-week run-in
(n=202)
Tumor shrinkage ≥25%(n=73)
Tumor growth/ shrinkage <25%
(n=69)
Tumor growth ≥25%(n=51†)
Off study(n=58)
Sorafenib 12 weeks
(n=32)
Placebo* 12 weeks
(n=33)
Continue open-label sorafenib
(n=79)
18% Progression free 24 weeks
Disease status at 12 weeks unknown
(n=9)
50% Progression free 24 weeks
Ratain et al, JCO, 2006; Rosner et al, JCO 2002.
Randomized Discontinuation Design
P = 0.0077
Randomized Discontinuation vs. Standard Randomized Designs
• Randomized Discontinuation Design– Advantage
• Select a more homogeneous study population, hence, provide smaller bias without pre-specified markers
• All patients are treated with new treatment up front– Disadvantage
• Loss (considerable) power in most settings• Ethical concerns to stop “effective” tx.
• Standard Randomized Design should be used with more carefully selected eligibility criteria
• Reference– Parcey et al., Investigational New Drugs 2011– Stadler et al. Journal of Clinical Oncology, 2005– Capra WB. Comparing the power of the discontinuation design to that of the
classic randomized design on time-to-event endpoints. Controlled Clinical Trials 25: 168–177, 2004
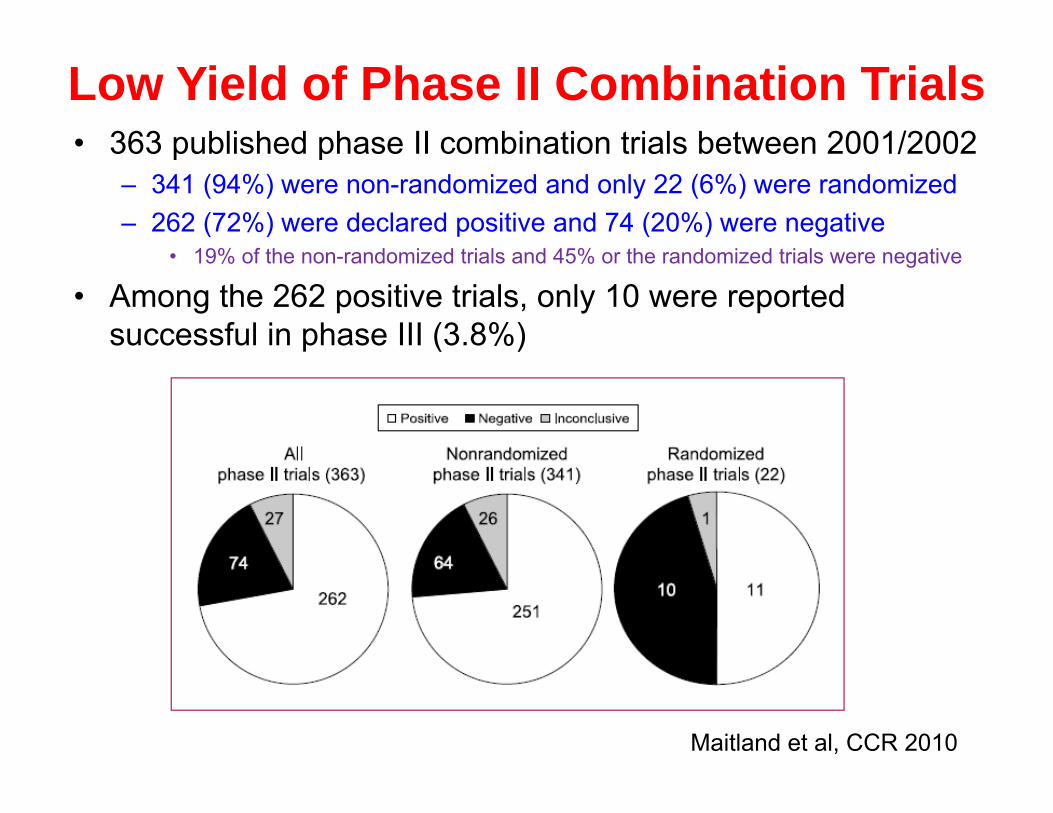
Low Yield of Phase II Combination Trials• 363 published phase II combination trials between 2001/2002
– 341 (94%) were non-randomized and only 22 (6%) were randomized– 262 (72%) were declared positive and 74 (20%) were negative
• 19% of the non-randomized trials and 45% or the randomized trials were negative
• Among the 262 positive trials, only 10 were reported successful in phase III (3.8%)
Maitland et al, CCR 2010
How Can We Do Better?• Adaptive Designs
– Early stopping due to efficacy or futility– Outcome-based adaptive randomization– Selecting and validating predictive markers– Seamless Phase II/III designs
• Bayesian Paradigm– Learn as we go
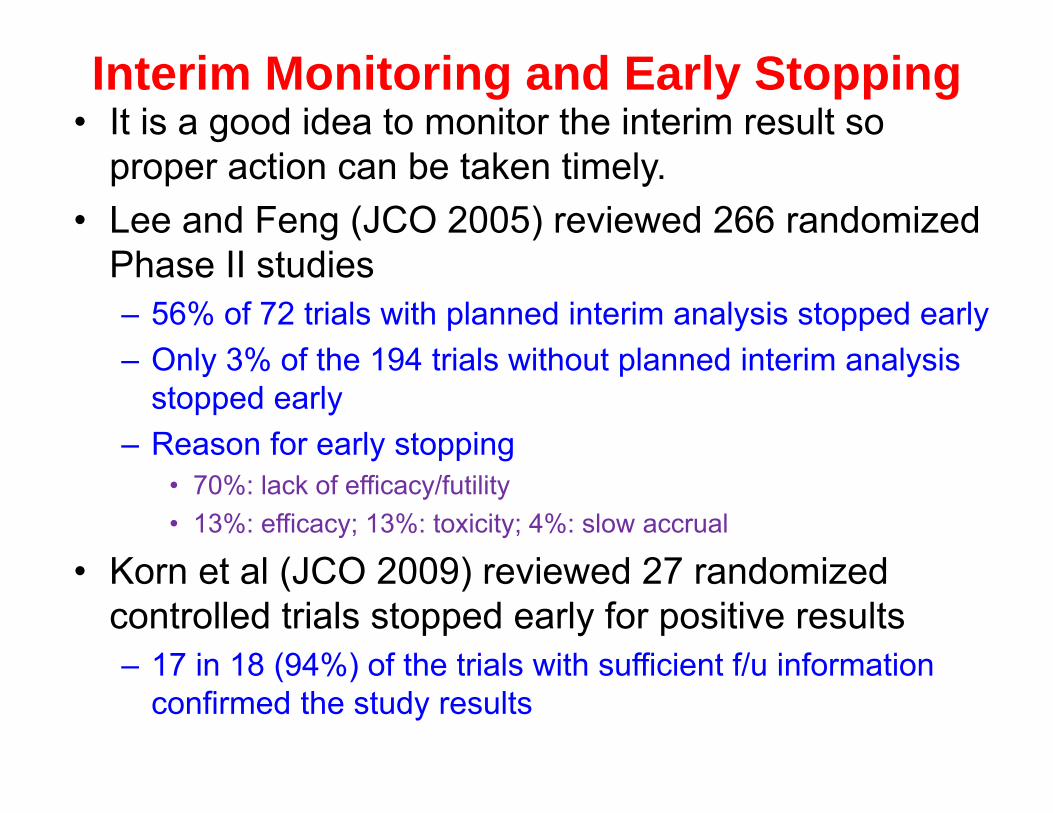
Interim Monitoring and Early Stopping• It is a good idea to monitor the interim result so
proper action can be taken timely.• Lee and Feng (JCO 2005) reviewed 266 randomized
Phase II studies– 56% of 72 trials with planned interim analysis stopped early– Only 3% of the 194 trials without planned interim analysis
stopped early– Reason for early stopping
• 70%: lack of efficacy/futility• 13%: efficacy; 13%: toxicity; 4%: slow accrual
• Korn et al (JCO 2009) reviewed 27 randomized controlled trials stopped early for positive results– 17 in 18 (94%) of the trials with sufficient f/u information
confirmed the study results
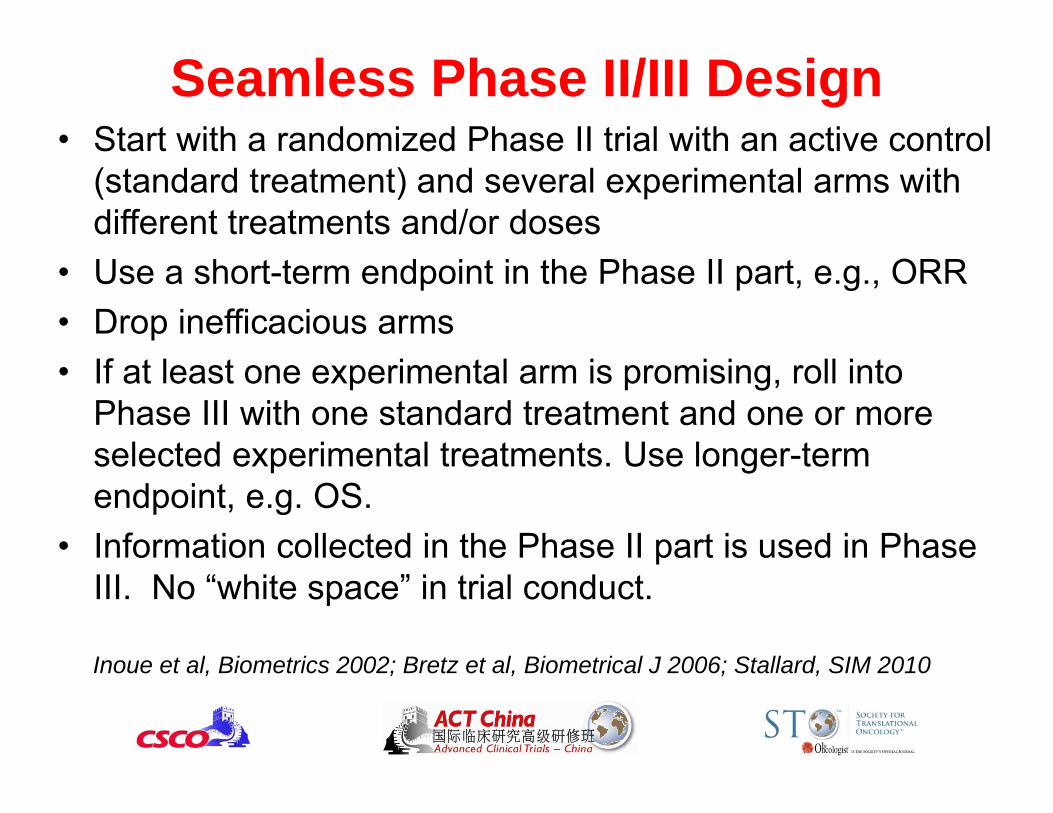
Seamless Phase II/III Design• Start with a randomized Phase II trial with an active control
(standard treatment) and several experimental arms with different treatments and/or doses
• Use a short-term endpoint in the Phase II part, e.g., ORR• Drop inefficacious arms• If at least one experimental arm is promising, roll into
Phase III with one standard treatment and one or more selected experimental treatments. Use longer-term endpoint, e.g. OS.
• Information collected in the Phase II part is used in Phase III. No “white space” in trial conduct.
Inoue et al, Biometrics 2002; Bretz et al, Biometrical J 2006; Stallard, SIM 2010
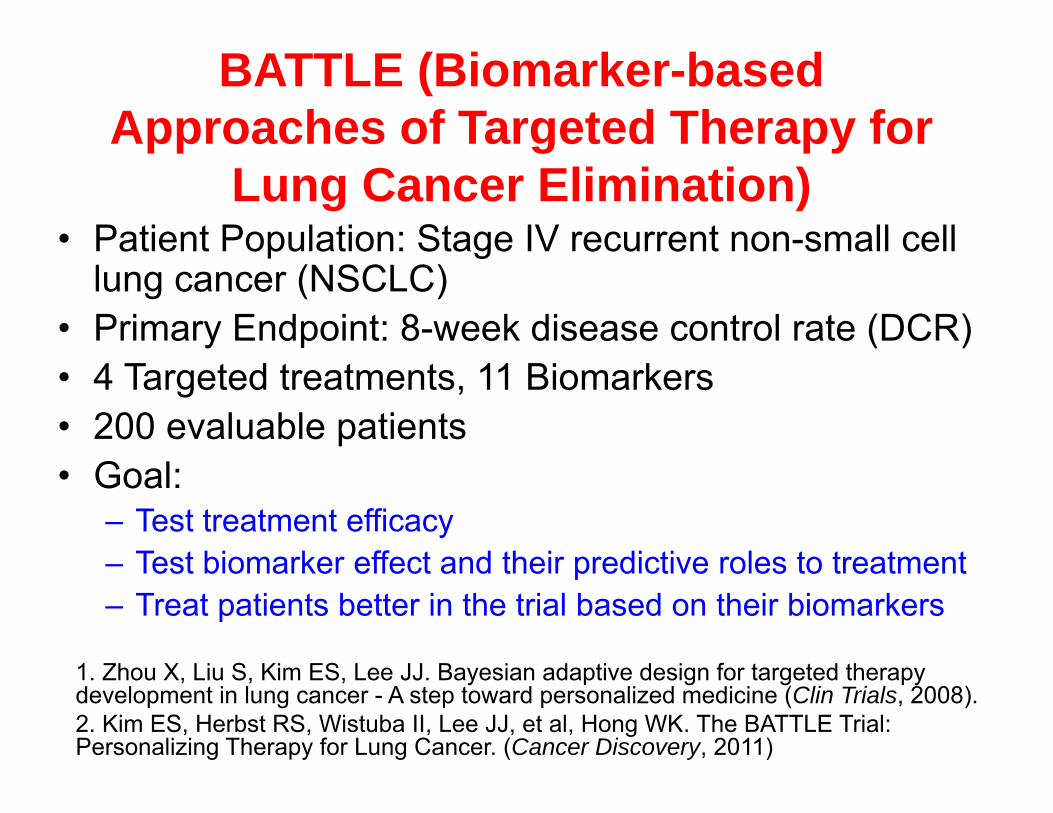
BATTLE (Biomarker-based Approaches of Targeted Therapy for
Lung Cancer Elimination) • Patient Population: Stage IV recurrent non-small cell
lung cancer (NSCLC) • Primary Endpoint: 8-week disease control rate (DCR) • 4 Targeted treatments, 11 Biomarkers• 200 evaluable patients• Goal:
– Test treatment efficacy– Test biomarker effect and their predictive roles to treatment– Treat patients better in the trial based on their biomarkers
1. Zhou X, Liu S, Kim ES, Lee JJ. Bayesian adaptive design for targeted therapy development in lung cancer - A step toward personalized medicine (Clin Trials, 2008).2. Kim ES, Herbst RS, Wistuba II, Lee JJ, et al, Hong WK. The BATTLE Trial: Personalizing Therapy for Lung Cancer. (Cancer Discovery, 2011)
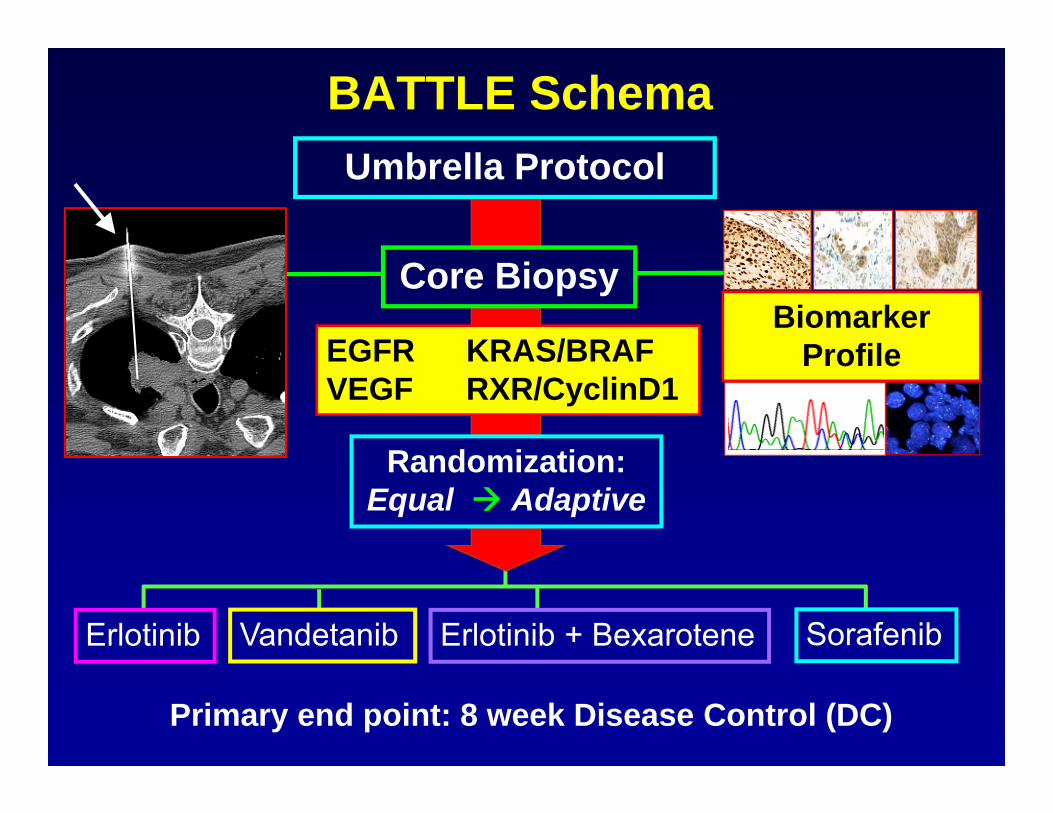
BATTLE Schema
Erlotinib SorafenibVandetanib Erlotinib + Bexarotene
Randomization:Equal Adaptive
Primary end point: 8 week Disease Control (DC)
Umbrella Protocol
EGFR KRAS/BRAF VEGF RXR/CyclinD1
Core BiopsyBiomarker
Profile
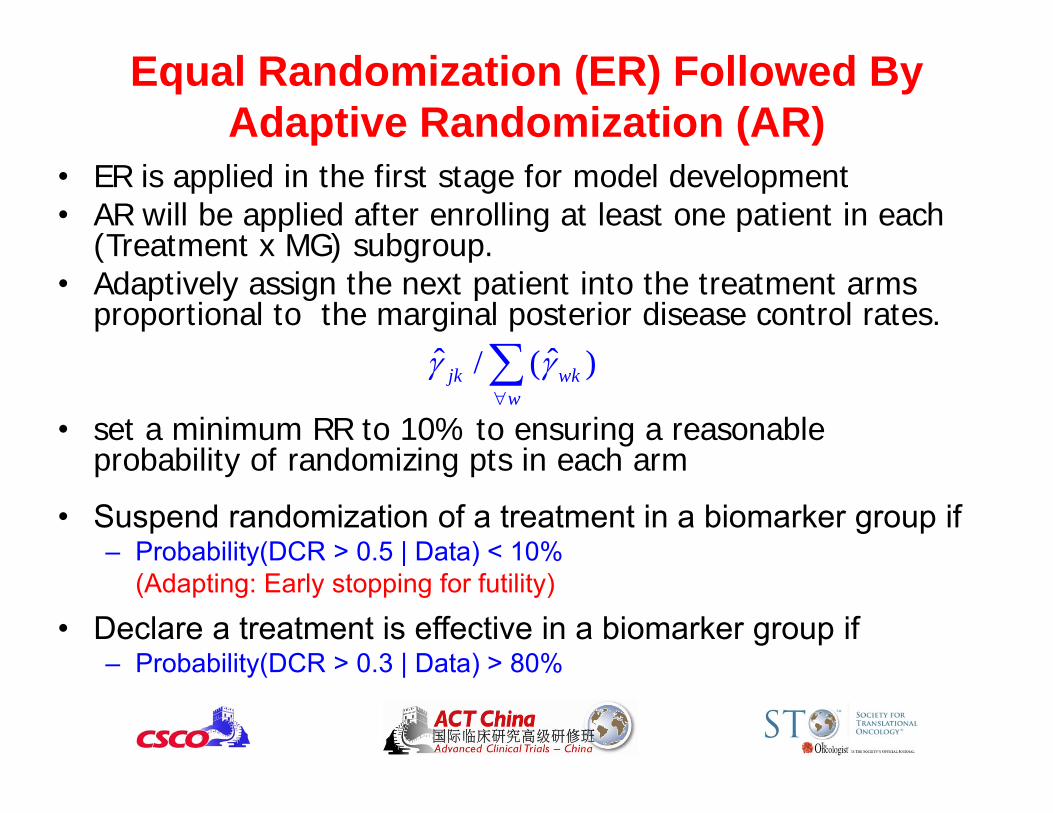
• ER is applied in the first stage for model development• AR will be applied after enrolling at least one patient in each
(Treatment x MG) subgroup.• Adaptively assign the next patient into the treatment arms
proportional to the marginal posterior disease control rates.
• set a minimum RR to 10% to ensuring a reasonable probability of randomizing pts in each arm
• Suspend randomization of a treatment in a biomarker group if – Probability(DCR > 0.5 | Data) < 10%
(Adapting: Early stopping for futility)
• Declare a treatment is effective in a biomarker group if – Probability(DCR > 0.3 | Data) > 80%
ˆ ˆ/ ( )jk wkw
Equal Randomization (ER) Followed By Adaptive Randomization (AR)
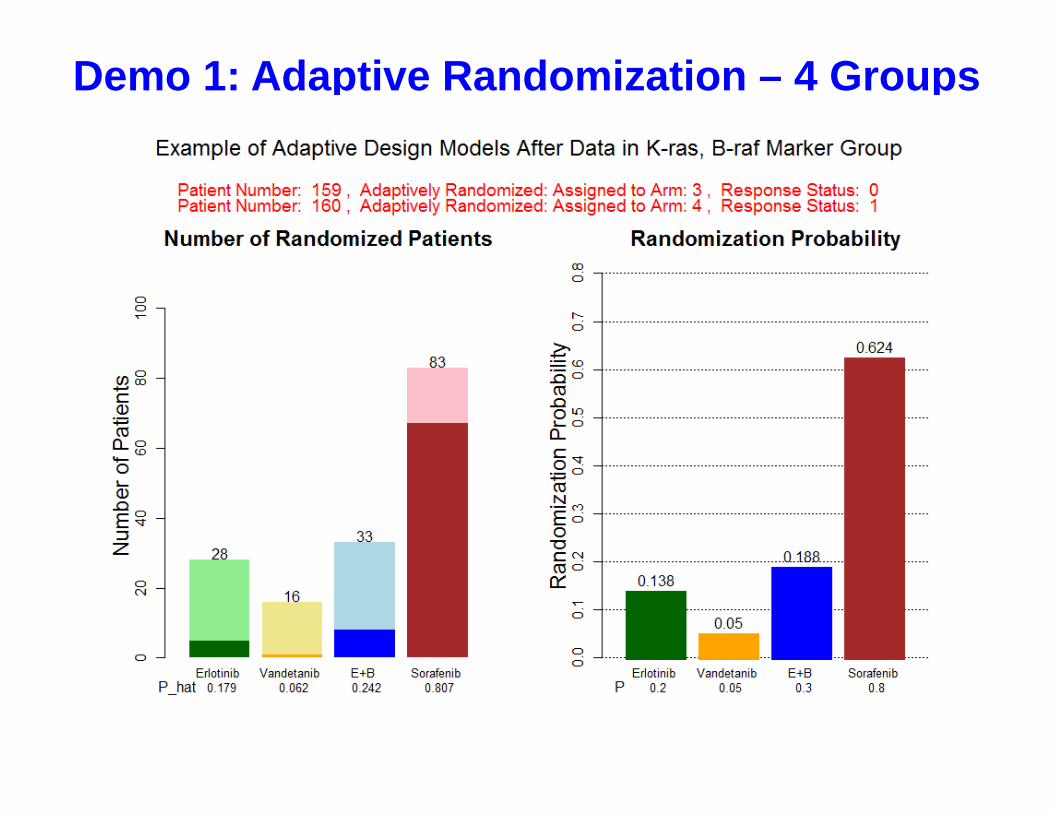
Demo 1: Adaptive Randomization – 4 Groups
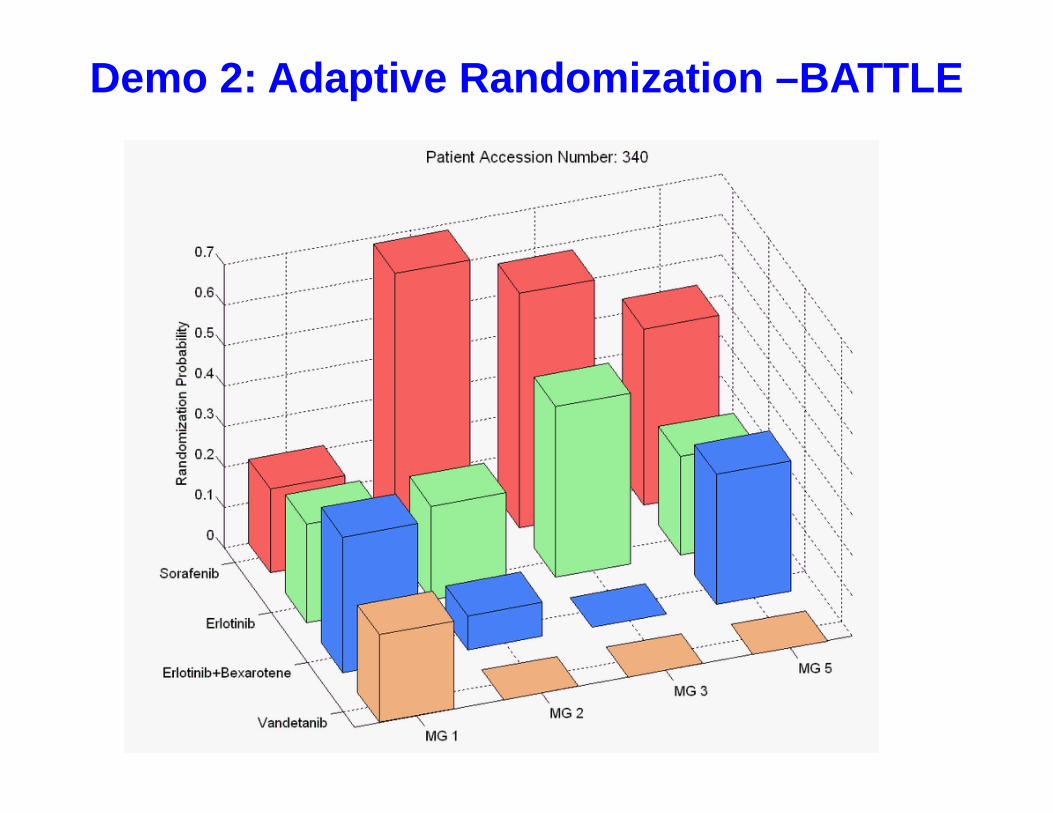
Demo 2: Adaptive Randomization –BATTLE
45
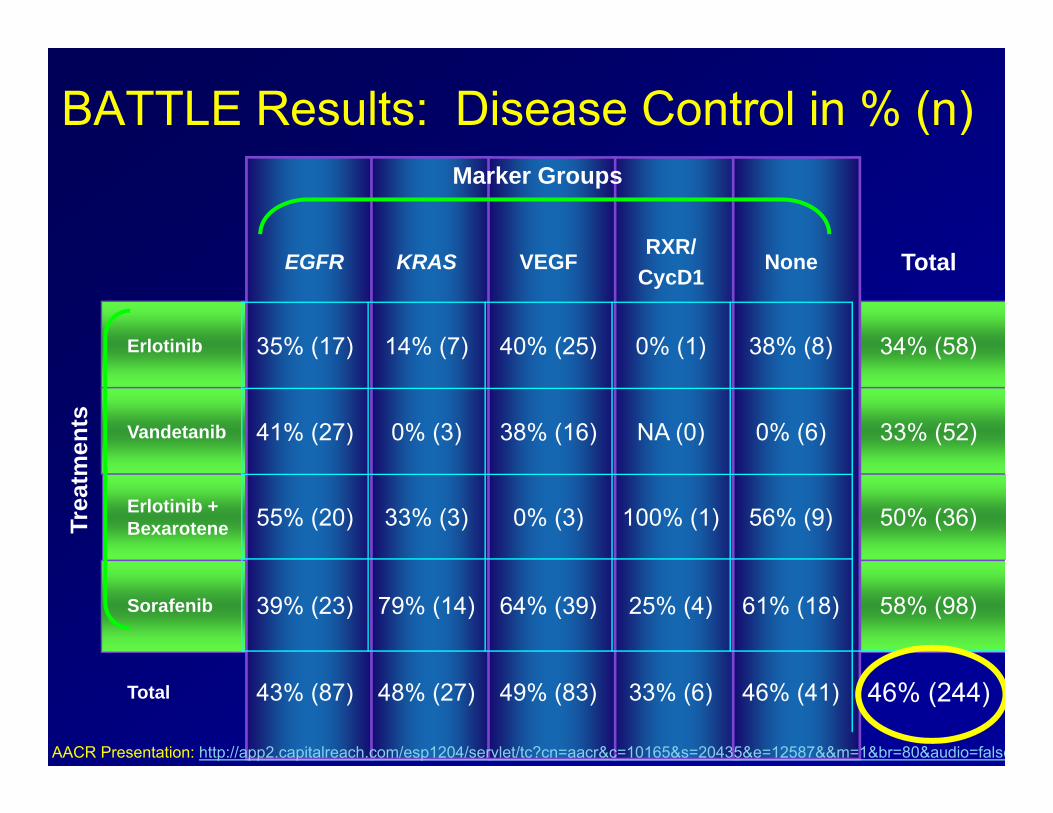
BATTLE Results: Disease Control in % (n)
EGFR KRAS VEGFRXR/
CycD1None Total
Erlotinib 35% (17) 14% (7) 40% (25) 0% (1) 38% (8) 34% (58)
Vandetanib 41% (27) 0% (3) 38% (16) NA (0) 0% (6) 33% (52)
Erlotinib + Bexarotene 55% (20) 33% (3) 0% (3) 100% (1) 56% (9) 50% (36)
Sorafenib 39% (23) 79% (14) 64% (39) 25% (4) 61% (18) 58% (98)
Total 43% (87) 48% (27) 49% (83) 33% (6) 46% (41) 46% (244)
Trea
tmen
ts
Marker Groups
AACR Presentation: http://app2.capitalreach.com/esp1204/servlet/tc?cn=aacr&c=10165&s=20435&e=12587&&m=1&br=80&audio=false
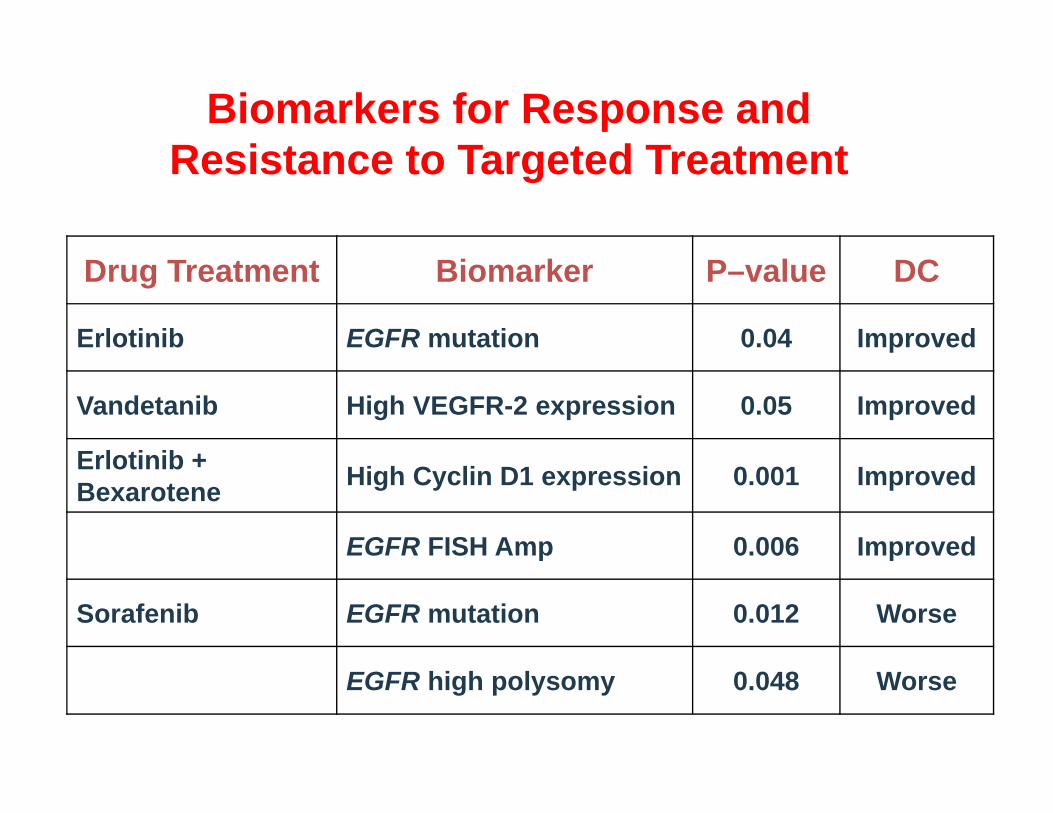
Biomarkers for Response and Resistance to Targeted Treatment
Drug Treatment Biomarker P–value DC
Erlotinib EGFR mutation 0.04 Improved
Vandetanib High VEGFR-2 expression 0.05 Improved
Erlotinib + Bexarotene High Cyclin D1 expression 0.001 Improved
EGFR FISH Amp 0.006 Improved
Sorafenib EGFR mutation 0.012 Worse
EGFR high polysomy 0.048 Worse
Lessons Learned from BATTLE?• Biomarker-based adaptive design is doable! It is well
received by clinicians and patients.• Treatment effect & predictive markers are efficiently
assessed. • Early stopping due to futility works will.• But AR works only moderately well.• AR works well only when we have good drugs and
good predictive markers.
• Findings from the phase II studies need to be validated by future phase II or phase III studies.
Take Home Message• Single-arm Phase IIA trials provide an effective way to assess
the initial efficacy of new treatments.• Multi-stage designs increase the study efficiency while the
predictive probability design is more flexible.• Pick the winner designs do not control type I error.• Interim monitoring and early stopping for futility of efficacy is
desirable.• Adaptive randomization enhances the study’s individual ethics.• Bayesian adaptive design – learn as we go – is sensible and
ideal for clinical trials. • More randomized Phase II trials need to be conducted to
screen out non-promising drugs/markers before launching Phase III trials to maximize the success rate.