statistical hand book assam - des.assam.gov.in · district-wise number and area under fisheries in...
TRANSCRIPT

STATISTICAL HAND BOOKASSAM
2013
DIRECTORATE OF ECONOMICS AND STATISTICSGOVERNMENT OF ASSAM, GUWAHATI-28

FOREWORD
The current issue of the “Statistical Hand Book, Assam,2013” is the 45th in the series.
Keeping in view of the importance of data needs, intensive
efforts have been made by this Directorate to incorporate the
latest & updated information of different socio-economic aspects
of Assam covering upto 2012-2013 in the current issue of this
statistical publication. Besides incorporation of comparative
statistics with other states and the country as a whole, information
of inter-district, inter-regional disparities have also been included
in this Hand Book. However, due to non-availability of latest data
in a few cases, last year published data have been repeated.
This Directorate wishes to keep in record the continued
and generous co-operation extended by various Departments and
Organizations in bringing out this statistical publication and
acknowledged with gratitude.
The efforts put in by the officers and staff associated in
compiling this voluminous publication is sincerely appreciated.
This Directorate is constantly endeavouring to improve
the quality of the publication. Comments/suggestions for further
improvement in the content and quality of the publication would
be highly appreciated.
July, 2014 (P. K. Bhattacharjya)
Director of Economics and Statistics, Assam. Guwahati-28

OFFICERS AND STAFF OF THE DIRECTORATEASSOCIATED WITH THE PUBLICATION
* * * * * *Joint Director
Bimal Kumar PhookanNirupama Talukdar
Statistical OfficerCharu Mohan Kalita
Utpal MedhiMukul Sarma
Inspector of StatisticsRenu Bala Rabha
Champak Kumar SarmaLabanya Kalita Talukdar
Sub-Inspector of StatisticsPromod Das
Dhrubajyoti KalitaAmar Jyoti Medhi
ComputorAftab HussainAbdul Ahmed
Biswajit Goswami
Field AssistantBabita Barman
Sr. ArtistBharat Ch. Laskar

ROAD DISTANCE FROM GUWAHATI (in Kms.)PLACES OF ASSAM
AbhayapuriBarpetaBongaigaonBokakhatBiswanath CharialiBadarpurDhekiajuliDhemajiDoomdoomaDigboiDuliajanDergaonDibrugarhDiphuDhubriGoalparaGossaigaonGolaghatHamrenHaflongHojaiHailakandiHowraghatJogighopaJonaiJorhatKazirangaKarimganj
AgartalaAizawlBomdilaCherapunjeeDimapurImphal
KokrajharLumding
LedoManas
MankacharMangaldoiMorigaonMaibong
MargheritaMoranNalbari
N. LakhimpurNagaonNazira
NarayanpurNamrup
NaharkatiaPatacharkuchi
RangiyaSilghat
SibsagarSilapathar
SonariSilchar
SaikhowaghatTezpurTitabar
TinsukiaUdalguri
ItanagarKohima
ParasuramkundaShillong
TuraZero
SOME IMPORTANT PLACES OF N.E. STATES
Source :- ASSAM STATE TRANSPORT CORPORATION
GUWAHATI
201140210240248312136462515527523280443271287150277307247325177341187212554308225335
597538342154280487
2362245401762696878379538404713901233783444585769752185363493409343537174333491126
420342613103284480

CONVERSION TABLE
GrainGram
OuncePoundSeerKilogramTonne (Matric Ton)
Imperial (long) Ton
American (short ) Ton
Bale of Cotton Lint (932 lbs)Bale of Jute (400 lbs)
CentimetreInch
Feet
MetreYardMileKilometre
11
11111
1
1
11
11
1
1111
====================
=========
0.065 Grams0.035270 Ounce0.085735 Tola28.350 Grams.0.4536 Kilograms.0.9331 Kilograms.2.20462 Pounds.1000Kilograms.1.10231 (short) Tons0.984207 (long) Tons5.624 bales of Cotton5.5166 bales of Jute2240 Pounds1.01605 Tonnes1.12(short) Tons2000 Pounds0.97185 Tonnes0.892857 (long) Tons0.1778 Tonne0.181436 Tonne
0.393701 Inches.25.4 Millimetres.0.0254 Metres.0.3048 Metres.30.48 Centimetres.1.09361 Yards0.9144 Metres1.609344 Kilometres0.62137 Miles
WEIGHTS
LENGTH

1 Gallon (Imperial)1 Gallon (U.S)
1 Litre1 Cubic feet
1 Cubic metre1 Cubic yard
1 Square inch1 Square feet1 Square yard1 Square metre
1 Acre
.1 Square mile
1 Square kilometre
1 Hectare
1 Bigha
========
==================
4.546 Litres3.78533 Litres0.83268 Gallons (Imperial)0.219967 Gallons (Imperial)28.3168 Cubic Decimetres0.028 Cubic metres1.30795 Cubic yards0.76455 Cubic metres
6.4516 Square centimetres0.092903 Sq. Metres0.836131 Sq. Metres1.19599 Square Yards10.7639 Squre feet0.404686 Hectares.3.025 Bighas4840 Sq. Yards.2.58999 Sq. Kilometres.640 Acres.100 Hectares.247 Acres.0.386101 Square Miles.10000 Square Metres7.45993 Bighas.2.47105 Acres.0.13387 Hectres.0.33058 Acres.
CAPACITY AND VOLUME
AREA

CONTENTSPAGES
2
3-5
6-7
8-9
10-18
19
20
21
22-23
24
25-27
28
29
30-31
32
32
1. POPULATION
District-wise Area, Sub-divisions, Towns, Villages, Blocks andGaon Panchayats in Assam, 2011.
Population in the State as per Census, 2011.
Growth of Population in the State since 1901.
Decadal Percentage Variation in Population Since 1901.
Population and Literacy Rate in Different Towns in Assam,2011.
Child (0-6 Years) Population in Assam, Census 2011.
Literacy Rate by Sex in Assam.
Total Households and Amenities(%) as per Census 2011.
Distribution of Main Workers and Marginal Workers in Assam,2011.
Distribution of SC and ST Population in Assam, 2011.
Disabled Popualtion by Type of Disability, 2011.
Area and Households in Assam, 2011.
Trends in Census Population in India, 1901-2011.
Trends in Population in Assam and India 1901-2011.
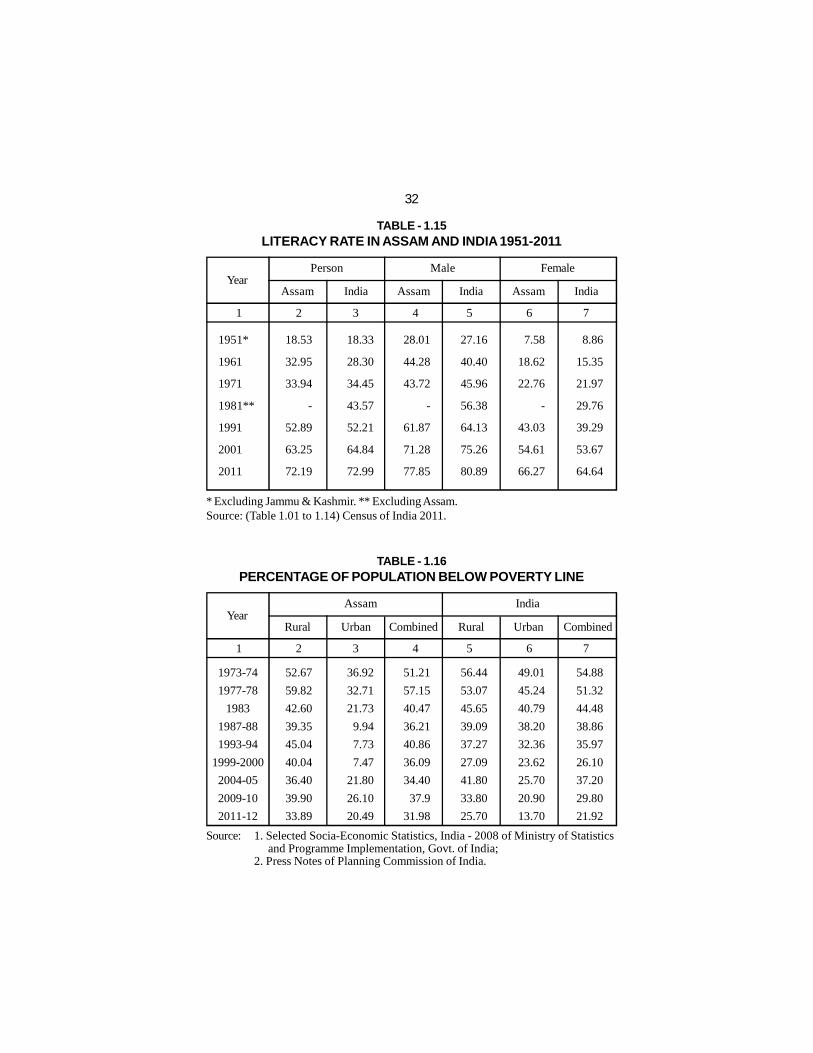
Literacy Rate in Assam and India 1951-2011.
Percentage of Population Below Poverty Line.
TABLE
1.01
1.02
1.03
1.04
1.05
1.06
1.07
1.08
1.09
1.10
1.11
1.12
1.13
1.14
1.15
1.16

(ii)
TABLE
2.01
2.02
2.03
2.04
2.05
2.06
2.07
2.08
2.09
2.10
2.11
3.01
3.02
3.03
PAGES
34-37
38-41
42
43
44-45
46
47
48
48
49
50-51
53
54-55
56-57
2. STATE INCOME & PUBLIC FINANCE
Gross State Domestic Product (GSDP) at Factor Cost byIndustry of Origin, Assam.
Net State Domestic Product (NSDP) at Factor Cost byIndustry of Origin, Assam.
Movement of State Domestic Product, Assam.
The Budget At A Glance.
Revenue Receipt of the Government of Assam.
Revenue Expenditure of the Government of Assam.
Capital Outlay of the Government of Assam.
Public Debt of the Government of Assam.
Loans and Advances by the Government of Assam.
Act-wise Revenue Receipt in Assam.
District-wise Collection of Land Revenue in Plain Districts ofAssam.
3. PLANNING
State Plan Outlay and Expenditure in Assam.
Sector-wise Outlay and Expenditure of Annual and TwelfthFive Year Plan, Assam.
Annual Plan Allocation of Assam, 1990-91 to 2012-13
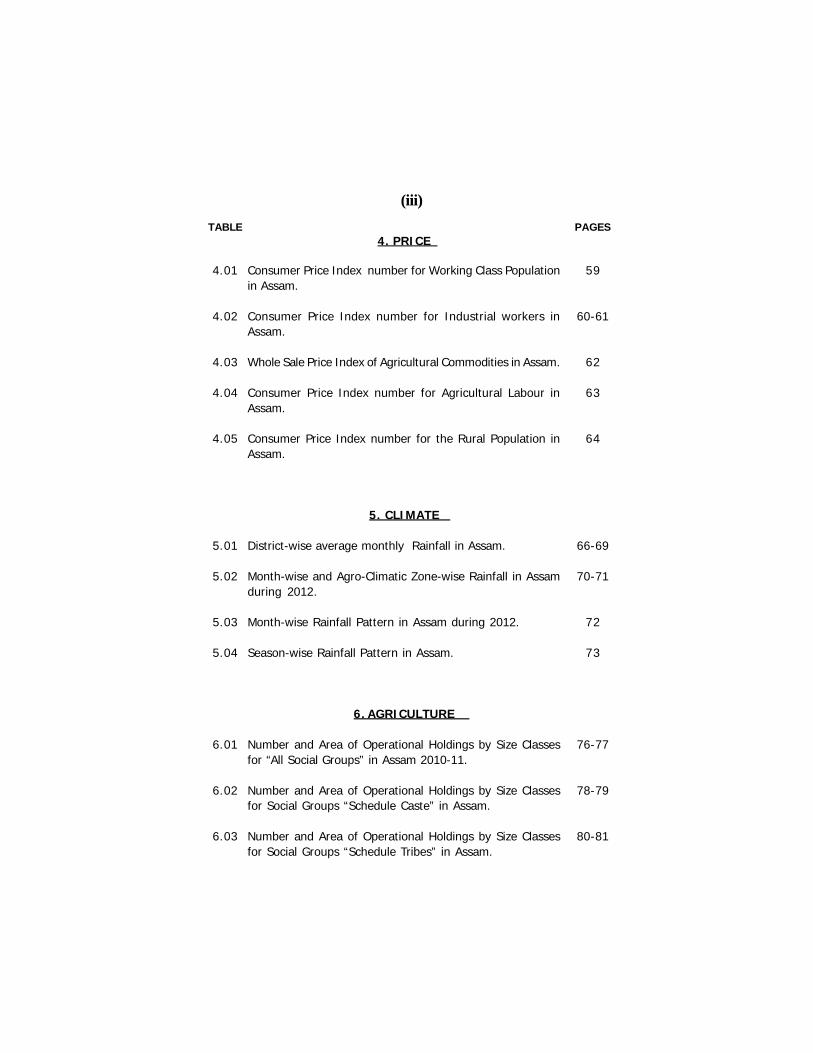
4. PRICE
Consumer Price Index number for Working Class Populationin Assam.
Consumer Price Index number for Industrial workers inAssam.
Whole Sale Price Index of Agricultural Commodities in Assam.
Consumer Price Index number for Agricultural Labour inAssam.
Consumer Price Index number for the Rural Population inAssam.
5. CLIMATE
District-wise average monthly Rainfall in Assam.
Month-wise and Agro-Climatic Zone-wise Rainfall in Assamduring 2012.
Month-wise Rainfall Pattern in Assam during 2012.
Season-wise Rainfall Pattern in Assam.
6. AGRICULTURE
Number and Area of Operational Holdings by Size Classesfor “All Social Groups” in Assam 2010-11.
Number and Area of Operational Holdings by Size Classesfor Social Groups “Schedule Caste” in Assam.
Number and Area of Operational Holdings by Size Classesfor Social Groups “Schedule Tribes” in Assam.
TABLE
4.01
4.02
4.03
4.04
4.05
5.01
5.02
5.03
5.04
6.01
6.02
6.03
PAGES
59
60-61
62
63
64
66-69
70-71
72
73
76-77
78-79
80-81
(iii)

(iv)
TABLE
6.04
6.05
6.06
6.07
6.08
6.09
6.10
6.11
6.12
6.13
6.14
6.15
6.16
PAGES
82-83
84
85
86-89
90-91
92-93
94-95
96-97
98
99
100
101
102
Number and Area of Operational Holdings by Size Classesfor “Others” in Assam.
Number and Area of Operational Holdings by Size Classesfor “Institutional Groups” in Assam.
Index number of Area, Production and Productivity for Foodgrains, Non-food grains and All commodities in Assam & India.
Total Area and Classification of Area in Assam, 2010-11.
Crop-wise Index number of Area, Production andProductivity in Assam, 2012-13.
Area under Food and Non-food Crops covered by CropForecast in Assam.
Production of Food and Non-food Crops covered by CropForecast in Assam.
Yield of Food and Non-food Crops covered by Crop Forecastin Assam.
Area under High Yielding Variety of Rice in Assam, 2012-13.
Area and Yield of High Yielding Variety of Rice in Assam.
District-wise Fertilizer consumption in Assam, 2012-13.
District-wise and Season-wise consumption of Fertilizer inAssam, 2012-13.
Area, Production and Average yield of some majorHorticultural crops of Assam.

(v)
TABLE
7.01
7.02
7.03
7.04
7.05
7.06
7.07
7.08
7.09
8.01
8.02
8.03
8.04
8.05
PAGES
104
105
106
107
108-109
110
111-112
113
114
116-117
118
119
120
121
7. IRRIGATION & WATER RESOURCES
Gross Area Irrigated under Government Irrigation facilitiesin Assam.
Sector-wise Irrigation Potential created in Assam, 2012-13.
Target and Achievement of additional Irrigation Potentialcreated in Assam.
District-wise and Crop-season-wise Area Irrigated in Assam.
Crop & Season wise Area Irrigated in Assam, 2011-12.
District-wise Net Area Irrigated in Assam.
District-wise Damage of Flood Management structures(Embankments and others) in Assam during the Flood of2012.
Achievements of Water Resources Department in Assam.
Statistics on Damages caused by Flood in Assam.
8. LIVESTOCK AND VETERINARY
Total Livestock and Poultry Population of Assam as per 18thLivestock Census, 2007.
Estimated Livestock and Poultry population in Assam,2012-2013 (Sample Survey).
Production of Milk, Egg and Meat in Assam.
District-wise Veterinary Facilities in Assam, 2012.
Performance of Veterinary Hospitals and Dispensaries inAssam, 2012.

TABLE
9.01
9.02
9.03
9.04
10.01
10.02
10.03
10.04
10.05
10.06
10.07
10.08
11.01
11.02
11.03
PAGES
123
124-125
126
127
129-130
131
132
132
133-134
135
136-137
138-139
141
142-143
144-145
9. FISHERY
District-wise production of Fish seed and Fish in Assam.
District-wise Number and Area under Fisheries in Assam.
Statistics of Fisheries on Inland water bodies in Assam.
District-wise number of Eco-Hatcheries in Assam.
10. FOREST
Forest Division Wise Area under Forest in Assam.
Out turn of Timber, Fuel-Wood and Minor Forest Productsin Assam, 2012-13.
Revenue Earned by the Forest Department in Assam.
Statistics on Forest Roads in Assam.
National Parks and Wild life Sanctuaries in Assam.
Census of Wildlife in Assam.
District-wise Physical Achievement under various schemesof Social Forestry in Assam.
District-wise Target and Achievement of Social Forestry inAssam.
11. INDUSTRY
Annual Survey of Industries (summary results) in Assam.
Index of Industrial Production in Assam.
Production of some selected Industries in Assam.
(vi)

TABLE
11.04
11.05
11.06
11.07
11.08
11.09
11.10
12.01
12.02
12.03
13.01
13.02
13.03
PAGES
146-147
148-152
153-155
155
156-163
164
165
167
168-169
170-171
173
174
175
Number of Registered MSME units, Investment in Plant &Machinery and Workers under the Commissionerate ofIndustries and Commerce, Assam.
Industrial Estates and other Infrastructure in Assam.
Growth Centre, Industrial Growth Centre, Border TradeCentre & Plastic Park in Assam, 2012-13.
Statistics on Industrial Disputes in Assam.
District-wise distribution of Registered Factories and Workersin Assam, 2012.
Industry wise distribution of Accidents in Assam.
Cause wise distribution of Accidents in Assam.
12. SERICULTURE
Reeling Units in Assam, 2012-13.
Sericulture Activities in Assam, 2012-2013.
Sericulture Farms and Grainages in Assam, 2012-13.
13. HANDLOOM AND TEXTILES
Statistics of Handloom and Textile in Assam.
Statistics of Handloom Demonstration Circle & WeavingActivity in Assam, 2012-13.
Achievements in Handloom and Textiles in Assam underCentrally Sponsored and Central Sector Schemes.
(vii)

TABLE
14.01
14.02
14.03
15.01
15.02
15.03
15.04
15.05
15.06
15.07
PAGES
177
178
179
181
182
183
184-185
186
186
187
14. KHADI AND VILLAGE INDUSTRIES
Industry-wise Production and Employment in Khadi andVillage Industries Board in Assam.
Achievements of Khadi and Village Industries undertakingKhadi and Village Industries Board in Assam.
Achievements of Khadi and Village Industries in AsssamDuring 2011-12.
15. PLANTATION CROPS
District-wise Area, Production and Average Yield of Tea inAssam.
Number of Tea Gardens, Area and Production of Teaaccording to Size of the Gardens in Assam.
Month-wise Sale and Price of Tea at Guwahati Tea AuctionCentre.
Quantity and Average Price of Tea sold in Guwahati TeaAuction Centre.
Area, Production, Price and Employment Genaration ofCoffee in Assam.
Area, Production and Price of Rubber in Assam.
District-wise Area and Production of Rubber in Assam during2012-13.
(viii)

TABLE
16.01
16.02
16.03
16.04
17.01
17.02
17.03
17.04
17.05
17.06
18.01
18.02
18.03
18.04
PAGES
189
189
190
191
193
194
195
196
197
198
200
201
202
203
16. MINERAL
Mineral Production in Assam.
Index of Mineral Production in Assam.
Colliery-wise Production of Coal in Assam.
Gross production of Natural Gas and quantity of Gas flaredin Assam.
17. POWER
Installed Capacity and Generation of Electricity in Assam.
Requirement and Shortage of Electricity in Assam.
Transmission, Distribution and Commercial Losses in Assam.
District-wise Number of Consumers in Assam.
Sale of Electricity by type of Consumption in Assam.
District-wise Number of Villages Electrified in Assam.
18. ROADS
District-wise and Category-wise Length of Roads underP.W.D. in Assam.
Length of Roads according to Type in Assam.
Length of Roads per lakh of population & per ‘00 sq. km.of Geographical area in Assam.
District-wise Habitation connectivity status from Phase-Ito Phase-VI under PMGSY.
(ix)

TABLE
19.01
19.02
19.03
19.04
19.05
19.06
19.07
19.08
19.09
19.10
19.11
19.12
PAGES
205
206-207
208-209
210-211
212
213
214-216
217
218-219
220
221
222
19. TRANSPORT AND COMMUNICATION
Statistics of Assam State Transport Corporation.
Number of Motor Vehicles on Road in Assam during the
year, 2012-13.
Number of Motor Vehicles registered in Assam during
2012-13.
Number of Motor Vehicles registered in Assam upto 31st
March, 2013.
Revenue Collection under Commissionerate of Transport,
Assam.
Railway Route Length of Assam and N.F. Railway.
Passenger and Goods carried by Inland Water Transport
Vessels, Assam.
Statistics of Telecommunication in Assam.
District-wise number of Post Offices and Letter Boxes in
Assam.
Information of News Paper/Periodicals published in Assam.
Passenger Traffic Handled at various Air-ports of Assam.
Summary of Airport Statistics of Assam.
(x)

PAGES
224-225
226
227
228
229
230
231
232
233
234
236-237
238-243
244
245
20. BANKING AND INSURANCE
Bank group-wise distribution of Deposit and Cridit of AllScheduled Commercial Banks in Assam.
District-wise distribution of Aggregate Deposit and GrossBank Credit of All Scheduled Commercial Banks in Assam.
District-wise distribution of Aggregate Deposit and GrossBank Credit of Regional Rural Banks in Assam.
Agency-wise, Purpose-wise and Activity-wise disbursementsmade by NABARD in Assam.
Finance by NEDFi in Assam.
Statistics of Small Savings in Assam, (Scheme-wise)
Statistics of Small Savings in Assam (Month-wise)
Business of Postal Life Insurance in Assam.
Performance of the Life Insurance Corporation of India inAssam.
Activities of United India Insurance Company Ltd. andNational Insurance Company in Assam, 2012-13.
21. SOCIAL WELFARE
Statistics of Social Welfare in Assam, 2012-13.
Scheme Implemented Under Social Welfare in Assam.
Institutions run by NGOs receiving recurring Grant-in-Aidfrom Social Welfare Department, Assam.
Statistics of Institution for Deaf and Dumb, Blind and JuvenileReforms, 2012-13.
TABLE
20.01
20.02
20.03
20.04
20.05
20.06
20.07
20.08
20.09
20.10
21.01
21.02
20.03
20.04
(xi)

TABLE
22.01
22.02
22.03
22.04
22.05
22.06
22.07
22.08
22.09
22.10
22.11
22.12
22.13
22.14
22.15
22.16
PAGES
247
248
249
250
251
251
252
253
254
254
255
256
257
258
259
260-261
22. MEDICAL AND PUBLIC HEALTH
Number of State Govt. Hospitals, Primary Health Centres,First Referral Units, CHCs etc. in Assam, 2012.
Number of Private Hospitals and Registered DiagnosticCentres in Assam, 2012.
Achievements of some of the Special Health Programmesin Assam, 2012.
Number of Beds in Different Type of Health Institutions inAssam, 2012.
Number of Medical and Paramedical Staffs in Assam, 2012.
Medical and Paramedical Personnel Registered in Assam.
District-wise Births and Deaths registered during 2012.
Estimated Birth Rate, Death Rate and Infant Mortality Ratein Assam.
Child and Infant Mortality Indicators in Assam.
Fertility Indicators in Assam.
Achievements in Family Welfare Programmes in Assam.
District-wise Immunization Programme in Assam.
District-wise number of Habitations/Villages providing withDrinking water facilities in Assam.
Physical Target and Achievement Under National RuralDrinking Water Supply Programme (NRDWP).
Physical Target and Achievement under Total SanitationCampaign(TSC).
Financial Performance under Total Sanitation Campaign(TSC).
(xii)

PAGES
263
264-265
266-267
268
269
270
271
272
273
275
276
277
278
279
23. EDUCATION
Enrolment and Teacher in Lower Primary Schools in Assam,2012-13.
Enrolment and Teacher in Upper Primary Schools in Assam,2012-13.
Enrolment and Teacher in High, Higher Secondary Schoolsand Junior Colleges in Assam.
Class-wise Enrolment in Assam, 2012-13.
District-wise GER, NER and Drop Out Rate in Govt./Provincialised Primary & Upper Primary Schools.
Status of Classrooms in Govt./Provincialised Primary andUpper Primary Schools.
Government and Provincialised Primary & Upper PrimarySchools having various facilities.
Enrolment by courses in Degree standard and above.
Performance of Candidates in High School Leaving CertificateExamination, 2013.
24. PANCHAYAT AND RURAL DEVELOPMENT
District-wise Physical achivements under SGSY in Assam,2012-13.
District-wise Financial Performance under SGSY in Assam,2012-13.
District-wise Physical achivements under MGNREGA inAssam, 2012-13.
District-wise Financial performance under MGNREGA inAssam, 2012-13.
District-wise Job Cards issued and Employment providedin Assam, 2012-13.
TABLE
23.01
23.02
23.03
23.04
23.05
23.06
23.07
23.08
23.09
24.01
24.02
24.03
24.04
24.05
(xiii)

TABLE
24.06
24.07
24.08
24.09
24.10(1)
24.10(2)
25.01
25.02
25.03
25.04
PAGES
280
281
282-284
285-287
289
290
292-293
294-295
296
297
District-wise Target and Physical Achievement under IAYin Assam, 2012-13.
District-wise Financial performance under IAY in Assam.
District-wise Target and Physical Achievement under NationalSocial Assistance Procramme in Assam, 2012-13.
District-wise Financial Progress under National SocialAssistance Programme in Assam, 2012-13.
ELECTION(Panchayat Election, 2013)
Results of Panchayat Election in Assam, 2013.
Results of Panchayat Election in Assam, 2013.
25. CRIME AND JUDICIARY
Statistics on Cognizable Crimes in Assam.
District-wise Incidents of Crime under IPC in Assam, 2012.
Number of Police Stations, Railway Police Stations and RiverPolice Stations in Assam, 2013.
Motor vehicle Accidents, Persons Killed and Injured due toRoad Accidents (Registered by Police) in Assam.
(xiv)

TABLE
25.05
25.06
25.07
25.08
25.09
25.10
25.11
25.12
25.13
25.14
26.01
26.02
26.03
26.04
26.05
PAGES
298
298
299
299
300
300
301
302
303
303
305-306
307
308
309
310
Incidence of Crimes committed against Women andChildren in Assam.
Witch Hunting cases in Assam.
Prison Population of Assam.
Number of Convicts, Admitted and Discharged during theyear 2012.
Convicts Admitted by Nature of Sentences, 2012.
Health and Mortality status among Prisoners during theyear 2012.
Convicts and Undertrials admited by Religion, Age andEducational Level.
Number of Judicial staff in Assam.
Number of Cases Instituted, Disposed off and Pending inthe Gauhati High Court, Assam.
Number of Cases Instituted, Disposed off and Pending inthe Sub-ordinate Courts of Assam, for the year 2011.
26. CO-OPERATION
Number of different types of Co-operative Societies inAssam.
Performance of the Primary Credit Societies in Assam.
Performance of the Consumer Co-operative Societies inAssam.
Performance of State Level Non-credit Co-operativeSocieties in Assam.
Performence of Assam Co-operative Apex Bank, Urban Bankand ASCARD Bank in Assam.
(xv)
PAGES
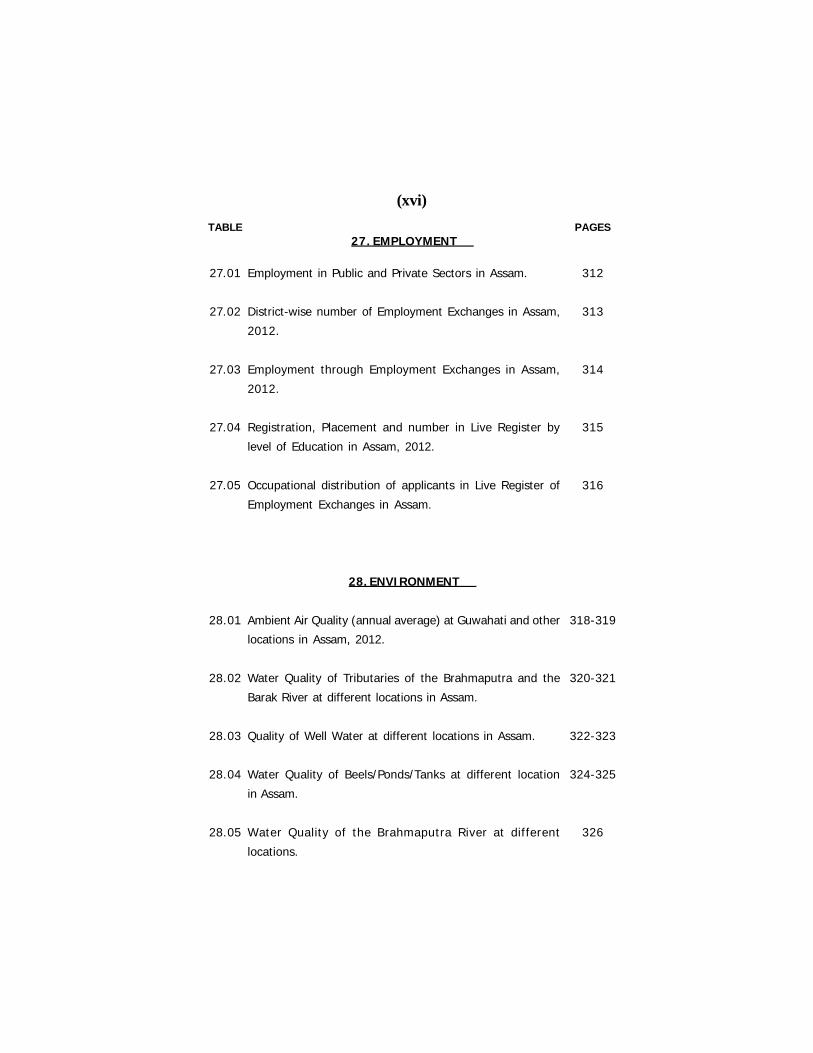
312
313
314
315
316
318-319
320-321
322-323
324-325
326
27. EMPLOYMENT
Employment in Public and Private Sectors in Assam.
District-wise number of Employment Exchanges in Assam,
2012.
Employment through Employment Exchanges in Assam,
2012.
Registration, Placement and number in Live Register by
level of Education in Assam, 2012.
Occupational distribution of applicants in Live Register of
Employment Exchanges in Assam.
28. ENVIRONMENT
Ambient Air Quality (annual average) at Guwahati and other
locations in Assam, 2012.
Water Quality of Tributaries of the Brahmaputra and the
Barak River at different locations in Assam.
Quality of Well Water at different locations in Assam.
Water Quality of Beels/Ponds/Tanks at different location
in Assam.
Water Quality of the Brahmaputra River at different
locations.
TABLE
27.01
27.02
27.03
27.04
27.05
28.01
28.02
28.03
28.04
28.05
(xvi)

TABLE
29.01
29.02
29.03
29.04
29.05
29.06
29.07
29.08
29.09
30.01
31.01
PAGES
328
329
330
330
331
332
333
334
335-336
338-355
357-361
29. MISCELLANEOUS
Composite Index of Backwardness of the districts of Assam.
Revenue Collection regarding arrival of Tourists in NationalParks in Assam.
Indian and Foreign Tourists to Assam and Revenue Earnedfrom the Tourists.
Collection of Revenue by the Controller of Legal Metrologyin Assam.
Requirement, Allocation and Release of PDS Items in Assam,2013.
District-wise Fair Price Shops and AAY/BPL Card Holders inAssam, 2012-13.
District-wise number of Fire Service Stations and FireAccidents in Assam, 2012.
District-wise Statistics of Warehousing Centres in Assam,2012-13.
Statistics of Public Libraries in Assam.
30. INTER STATE COMPARISON
Selected Indicators of different States/Union Territories ofIndia.
31. KEY STATISTICS
Some Key Statistics of India.
(xvii)
######
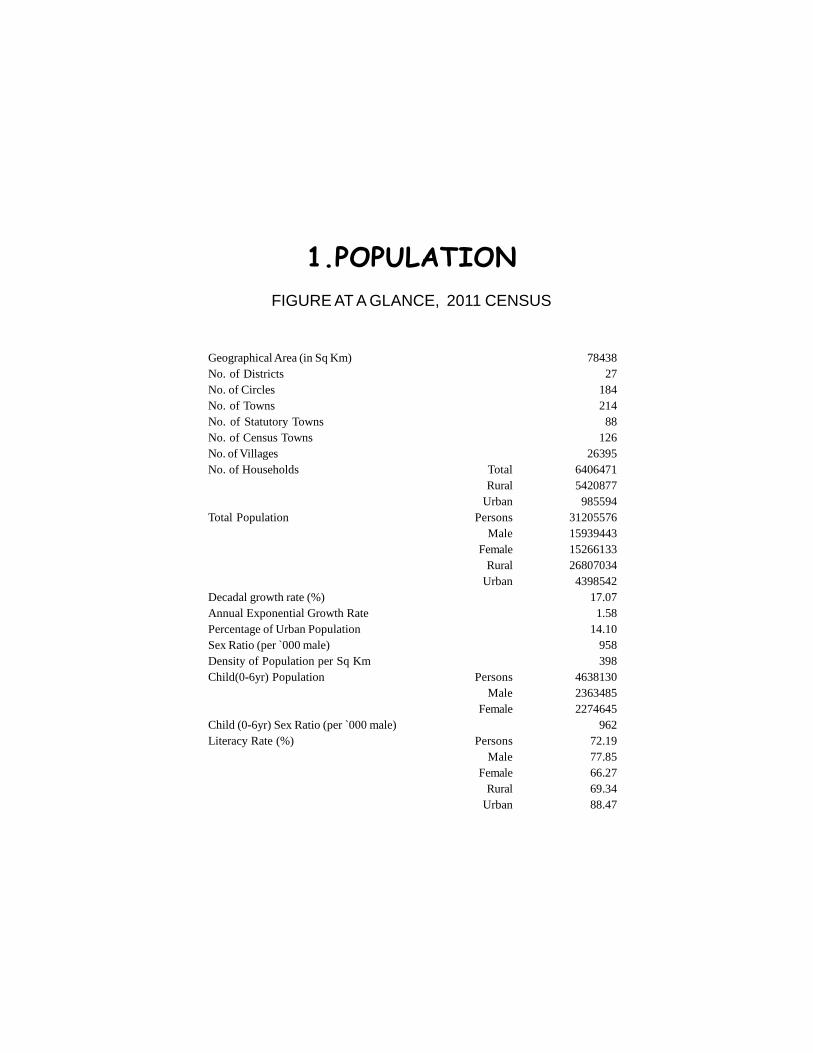
1.POPULATIONFIGURE AT A GLANCE, 2011 CENSUS
Geographical Area (in Sq Km)No. of DistrictsNo. of CirclesNo. of TownsNo. of Statutory TownsNo. of Census TownsNo. of VillagesNo. of Households
Total Population
Decadal growth rate (%)Annual Exponential Growth RatePercentage of Urban PopulationSex Ratio (per ̀ 000 male)Density of Population per Sq KmChild(0-6yr) Population
Child (0-6yr) Sex Ratio (per `000 male)Literacy Rate (%)
TotalRural
UrbanPersons
MaleFemale
RuralUrban
PersonsMale
Female
PersonsMale
FemaleRural
Urban
7843827
184214
88126
2639564064715420877
985594312055761593944315266133268070344398542
17.071.58
14.10958398
463813023634852274645
96272.1977.8566.2769.3488.47

TABLE - 1.01DISTRICT WISE AREA, SUB-DIVISIONS, TOWNS, VILLAGES,
BLOCKS AND GAON PANCHAYATS IN ASSAM, 2011
2
1 2 3 4 5 6 7 8 9
District
CensusCode
Name
KokrajharDhubriGoalparaBarpetaMorigaonNagaonSonitpurLakhimpurDhemajiTinsukiaDibrugarhSivasagarJorhatGolaghatKarbi AnglongDima HasaoCacharKarimganjHailakandiBongaigaonChirangKamrupKamrup MetroNalbariBaksaDarrangUdalguri
Assam
010203040506070809101112131415161718192021222324252627
32962176182422821551397352042277323737903381266828513502
104344888378618091327109319233105955
1052245715852012
78438
Are
a in
Sq.
Km
.
Tow
ns(S
tatu
tory
+C
ensu
s)
Sub-
Div
isio
n
No.
of
Vill
ages
*Gao
nP
anch
ayat
CD
Blo
cks
331213322313333221122211312
56
49
1196
17844
1397
11774
197353
161211
233
214
10681091
829835632
141218761184131911681348
875848
11252921
6951040
936331563508
1068216456690561800
26395
514
812
51814
9577988
115
157552
1437556
219
-168
81129
85239158
81658693
118110102
--
163966265
-146
1465
-76
-
2202
Rev
enue
Cir
cle
99595
10776476664455456
1269
1369
184
* Gazette Notification on March, 2007.Area, Circle, Village and Towns as per Census 2011.

TABLE - 1.02POPULATION IN THE STATE AS PER CENSUS, 2011
3
1 2 3 4 5 6 7
District
KokrajharDhubriGoalparaBarpetaMorigaonNagaonSonitpurLakhimpurDhemajiTinsukiaDibrugarhSivasagarJorhatGolaghatKarbi AnglongDima HasaoCacharKarimganjHailakandiBongaigaonChirangKamrupKamrup MetroNalbariBaksaDarrangUdalguri
Assam
887142194925810081831693622
957423282376819241101042137
68613313279291326335115105010922561066888
956313214102
17366171228686
659296738804482162
15175421253938
771639950075928500831668
31205576
2011
Dec
adal
Gro
wth
Rat
e20
01-1
1
% s
hare
toto
tal
Pop
ula-
tion
, 201
1
2001
2011
2.846.253.235.433.079.056.173.342.204.264.253.693.503.423.060.695.563.942.112.371.544.864.022.473.042.982.66
100
5.2124.4422.6421.4323.3422.0015.5517.2219.9715.4711.92
9.449.31
12.7517.5813.8420.1921.9021.4520.5911.3415.6918.3411.9910.7422.19
9.61
17.07
2669414515215005833153901773033513943502707838
382557409355219377
1689683427411453
340
2698965537426177113704582123503924313833059244
459679497676251489
1313733387586413
398
8432431566396
8220351394755
77625623146291665125
889010571944
115006211850721051736
999221946279813311188079
14449211007976
542872612665433061
13116981059578
689053857947759858758746
26655528
2001
Total Population Population Density
Contd...

(...Contd) TABLE - 1.02
4
1 8 9 10 11 12 13 14 15
District
KokrajharDhubriGoalparaBarpetaMorigaonNagaonSonitpurLakhimpurDhemajiTinsukiaDibrugarhSivasagarJorhatGolaghatKarbi AnglongDima HasaoCacharKarimganjHailakandiBongaigaonChirangKamrupKamrup MetroNalbariBaksaDarrangUdalguri
Assam
959953964953967962956968953952961954962964951932959963951966969949936949974954973
958
2011
2001
D.G
.R.
2001
-11
2011
2001
D.G
.R.
2001
-11
433360804999420251720069398926
119095086329845569129464360109961355554547651701549028642225099822
743042517680280513315537222364678310571774356730438345392362388690
13777037
452905997848513292867004486651
1439112983904529674351249680231676434589216556805543161490167110802886284625864337890375818244860778461647585396006481330475273421617
15939443
4.5123.9622.1420.4121.9920.8413.9716.2419.2113.1610.25
8.027.70
10.7816.0811.0019.2820.9020.4519.1010.1214.7613.2611.01
9.8121.13
8.47
15.70
409883761397401784674686377330
1123679801827433319277301548963571517506260482206455993391061
88257701879490296262359297128210697633388487804332323419602367496370056
12878491
434237951410494891826618470772
1384656940206512463334884647698649901561834535451523727466146103300850333602822321406362986237302739081606353375633468745453227410051
15266133
2011
5.9424.9623.1722.5224.7623.2317.2618.2620.7717.9913.7210.9811.0414.8519.2017.0421.1522.9522.5122.1612.6316.6924.3013.0311.7123.3310.81
18.54
943947956941946944929951941913931928933930926884945947935945948901853939957944952
935
2001
Sex RatioMale Population Female Population
D.G.R.- Decadal Growth Rate Contd...

(...Contd) TABLE - 1.02
5
1 16 17 18 19 20 21 22 23
District
KokrajharDhubriGoalparaBarpetaMorigaonNagaonSonitpurLakhimpurDhemajiTinsukiaDibrugarhSivasagarJorhatGolaghatKarbi AnglongDima HasaoCacharKarimganjHailakandiBongaigaonChirangKamrupKamrup MetroNalbariBaksaDarrangUdalguri
Assam
8322011745557
8701211546269
88412524542341750265
950804637848
106318610826051040954
871722969152843347151613
14211531118986
611156628994446825
1375148216927688909937833873006794094
26807034
2011
D.G
.R.
2001
-11
%20
11*
2001 %
2011
**
2011
93.8189.5586.3191.3092.3486.9190.9691.2492.9680.0681.6290.4479.8190.8488.1970.8181.8391.0792.7085.1492.6790.6217.3089.2898.7194.0295.48
85.90
5.1127.0515.2321.9619.7620.5217.5215.4119.6514.8013.17
9.055.29
12.0216.9117.8514.2819.7922.5322.03
9.509.693.574.139.31
21.569.44
15.47
5150119244366902
12686837988
2782871757946515338832
22395722843897179
171320811389193059435
2013877385044085972142500858081
85013627486
04170333125
3439240
54941203701138062147353
73298369534173845
9133348285
264743243730110096220534
97736112966
62489315464109700
48140109810
353371423941037011
82730122425549437574
4398542
6.1910.4513.698.707.66
13.099.048.767.04
19.9418.389.56
20.199.16
11.8129.1918.178.937.30
14.867.339.38
82.7010.721.295.984.52
14.10
D.G
.R.
2001
-11
6.685.85
106.3616.1592.9532.79- 1.1140.1824.3418.216.69
13.2928.7320.4622.885.14
56.6548.549.20
12.9641.30
145.1621.98
200.99--
33.0713.43
27.89
7917421373953
7551331267887
73826820363421489331
823857533112926105956634954557827901865141721381128644
1243534934126498787515451408053
1253617209442661567857947718155725621
23216288
2001
Rural Population Urban Population
* Percentage of Rural Population; ** Percentage of Urban Population.
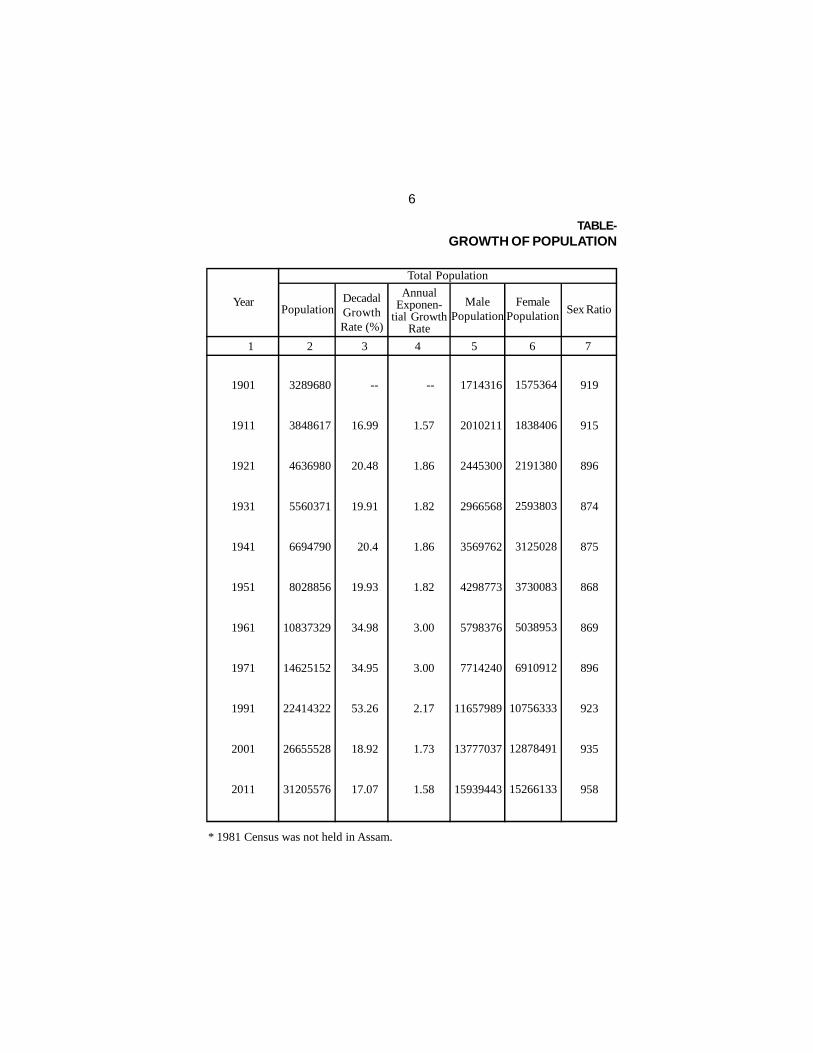
TABLE-GROWTH OF POPULATION
6
1 2 3 4 5 6 7
Year
1901
1911
1921
1931
1941
1951
1961
1971
1991
2001
2011
--
16.99
20.48
19.91
20.4
19.93
34.98
34.95
53.26
18.92
17.07
1714316
2010211
2445300
2966568
3569762
4298773
5798376
7714240
11657989
13777037
15939443
1575364
1838406
2191380
2593803
3125028
3730083
5038953
6910912
10756333
12878491
15266133
919
915
896
874
875
868
869
896
923
935
958
3289680
3848617
4636980
5560371
6694790
8028856
10837329
14625152
22414322
26655528
31205576
PopulationDecadalGrowthRate (%)
Sex RatioMale
PopulationFemale
Population
* 1981 Census was not held in Assam.
Total Population
AnnualExponen-
tial GrowthRate
--
1.57
1.86
1.82
1.86
1.82
3.00
3.00
2.17
1.73
1.58

1.03IN THE STATE SINCE 1901
7
8 9 10 11 12 13 14
Population
97.66
97.59
97.26
97.08
96.89
95.71
92.79
91.18
88.9
87.10
85.90
--
16.91
20.08
19.70
20.16
18.46
30.87
32.62
49.42
16.51
15.47
77074
92916
127107
162166
208067
344831
781288
1289222
2487795
3439240
4398542
2.34
2.41
2.74
2.92
3.11
4.29
7.21
8.82
11.10
12.90
14.10
--
20.55
36.80
27.58
28.30
65.73
126.57
65.01
92.97
38.24
27.89
3212606
3755701
4509873
5398205
6486723
7684025
10056041
13335930
19926527
23216288
26807034
Rural Population Urban Population
as % tototal
population
% DecadalGrowth
Populationas % to
totalpopulation
% DecadalGrowth
Density ofPopulation(per Sq. Km)
42
49
59
71
85
102
138
186
286
340
398

TABLE-DECADAL PERCENTAGE VARIATION IN
8
* Due to creation of 4 new districts the rates have been affected in 12 districts.
*Kokrajhar*DhubriGoalpara*BarpetaMorigaonNagaon*SonitpurLakhimpurDhemajiTinsukiaDibrugarhSivasagarJorhatGolaghatKarbi AnglongDima HasaoCacharKarimganjHailakandi*Bongaigaon*Chirang*Kamrup*Kamrup Metro*Nalbari*Baksa*Darrang*Udalguri
Assam
DistrictSl.No.
123456789101112131415161718192021222324252627
1 2 3 4 5 6
28.7328.7329.9718.6515.8415.8423.6726.2926.2926.2926.2913.4116.9016.55
--(-)33.12
12.3312.9416.0928.695.02
10.016.59
15.2418.3622.7245.60
16.99
27.4927.4926.9234.4931.9431.9441.6934.0734.0734.0734.0720.4617.2619.83
--5.925.983.197.59
27.518.097.365.51
14.5617.2256.3432.20
20.48
18.0118.0115.7672.2941.3541.3523.0223.9123.9223.9223.9114.44
8.8818.29
--13.60
7.605.917.08
18.1911.4711.42
6.7626.9730.9138.3034.10
19.91
17.6917.6914.8347.6415.3715.3722.9722.7022.6922.7022.7015.6415.271.27
--13.7513.089.52
10.2917.8414.1322.117.05
42.8625.1329.4050.57
20.40
1901-1911 1911-1921 1921-1931 1931-1941

1.04POPULATION IN ASSAM SINCE 1901
9
Sl.No.
123456789101112131415161718192021222324252627
7 8 9 10 11 12 1
17.1112.74
9.2516.6236.6536.6522.0217.9417.9417.9417.9415.9814.8719.7630.96
6.1623.9229.8717.4812.8818.1817.01
2.3935.1533.6818.5829.13
19.93
55.4143.7437.1034.3937.8935.9141.9950.4675.2135.9230.6423.3624.1726.0479.2136.9522.6022.9627.2336.2740.3245.1213.3033.5660.5240.9454.04
34.98
54.8943.2645.8833.9137.5138.9933.1743.39
103.4231.0222.9319.4717.4730.8568.2840.0023.9625.1323.6135.8157.3744.4819.9931.7966.6736.0537.85
34.95
61.9645.6554.1240.9750.9051.2668.0856.29
107.5047.0337.7838.7633.1058.1274.7298.3047.5942.0845.9438.77
103.3381.5320.7775.7873.6589.7743.03
53.26
14.4922.9723.0319.6221.3522.2618.1118.3019.4519.5113.6815.8314.6914.2722.7224.7218.8921.8720.8922.09
(-)0.0814.9745.9114.2112.5122.1810.02
18.92
5.2124.4422.6421.4323.3422.0015.5517.2219.9715.4711.92
9.449.31
12.7517.5813.8420.1921.9021.4520.5911.3415.6918.3411.9910.7422.19
9.61
17.07
1941-1951 1951-1961 1961-1971 1971-1991 1991-2001 2001-2011
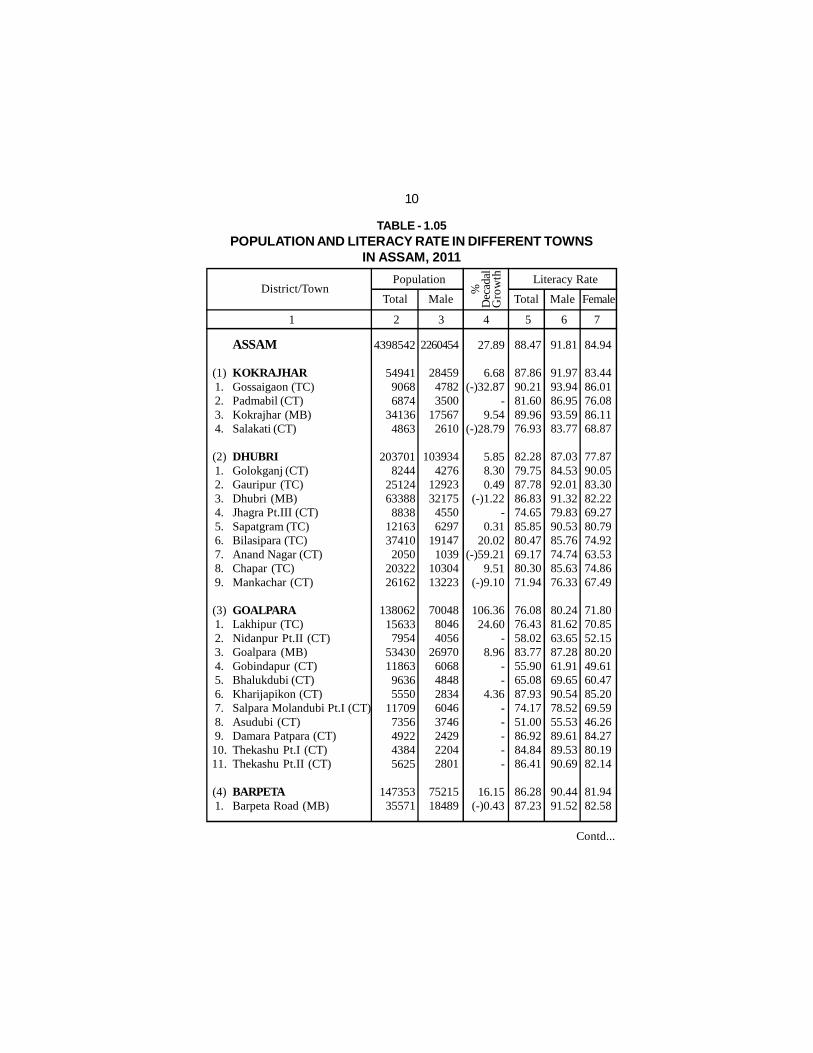
TABLE - 1.05POPULATION AND LITERACY RATE IN DIFFERENT TOWNS
IN ASSAM, 2011
10
(1)1.2.3.4.
(2)1.2.3.4.5.6.7.8.9.
(3)1.2.3.4.5.6.7.8.9.10.11.
(4)1.
ASSAM
KOKRAJHARGossaigaon (TC)Padmabil (CT)Kokrajhar (MB)Salakati (CT)
DHUBRIGolokganj (CT)Gauripur (TC)Dhubri (MB)Jhagra Pt.III (CT)Sapatgram (TC)Bilasipara (TC)Anand Nagar (CT)Chapar (TC)Mankachar (CT)
GOALPARALakhipur (TC)Nidanpur Pt.II (CT)Goalpara (MB)Gobindapur (CT)Bhalukdubi (CT)Kharijapikon (CT)Salpara Molandubi Pt.I (CT)Asudubi (CT)Damara Patpara (CT)Thekashu Pt.I (CT)Thekashu Pt.II (CT)
BARPETABarpeta Road (MB)
District/Town %D
ecad
alG
row
th
4398542
5494190686874
341364863
2037018244
25124633888838
12163374102050
2032226162
138062156337954
534301186396365550
117097356492243845625
14735335571
Population Literacy Rate
Total Male FemaleTotal Male
1 2 3 4 5 6 7
2260454
2845947823500
175672610
1039344276
1292332175
45506297
191471039
1030413223
7004880464056
2697060684848283460463746242922042801
7521518489
27.89
6.68(-)32.87
-9.54
(-)28.79
5.858.300.49
(-)1.22-
0.3120.02
(-)59.219.51
(-)9.10
106.3624.60
-8.96
--
4.36-----
16.15(-)0.43
88.47
87.8690.2181.6089.9676.93
82.2879.7587.7886.8374.6585.8580.4769.1780.3071.94
76.0876.4358.0283.7755.9065.0887.9374.1751.0086.9284.8486.41
86.2887.23
91.81
91.9793.9486.9593.5983.77
87.0384.5392.0191.3279.8390.5385.7674.7485.6376.33
80.2481.6263.6587.2861.9169.6590.5478.5255.5389.6189.5390.69
90.4491.52
84.94
83.4486.0176.0886.1168.87
77.8790.0583.3082.2269.2780.7974.9263.5374.8667.49
71.8070.8552.1580.2049.6160.4785.2069.5946.2684.2780.1982.14
81.9482.58
Contd...

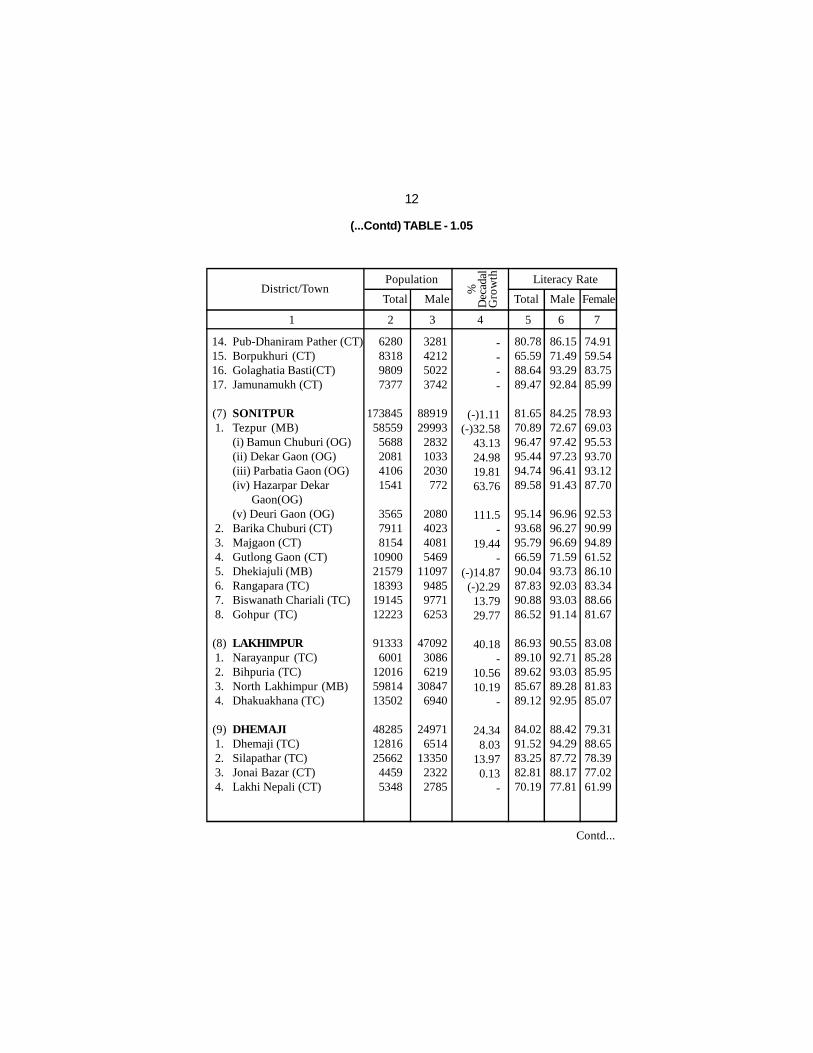
(...Contd) TABLE - 1.05
11
2.3.4.5.6.7.8.9.
(5)1.2.3.4.5.6.
(6)1.
2.3.4.5.6.7.8.9.10.11.12.13.
Sarbhog (TC)Utta Athiabari (CT)Khaira Bari (CT)Bohari (CT)Barpeta (MB)Howli (TC)Sarthebari (TC)Pathsala (TC)
MORIGAONJagiroad (CT)Tegheria (CT)Nakhula Grant (CT)Bhuragaon (Rev.) Town (CT)Mairabari Town (CT)Marigaon (MB)
NAGAONNagaon (MB)(i) Nartam Gaon(OG)(ii) Kachalukhowa (OG)Dimaruguri (CT)Chota Haibor (CT)Morongial (CT)Lumding (MB)Lumding Rly Col. (CT)Dhing (TC)Raha (TC)Kampur Town (TC)Hojai (MB)Doboka (TC)Lanka (MB)Rupahi Town (CT)
District/Town %D
ecad
alG
row
thPopulation Literacy Rate
Total Male FemaleTotal Male
1 2 3 4 5 6 7
81126091
102108264
4264918301
691311242
7329817739
5567380698457177
29164
369534117722
9892917
102356315
103183134722658192351103010371366381311836805
8052
4080317053294245
21241939534425824
3752892382848193950313679
14793
18812759651
4981493525532245304
1590911517
994655265230
187626675
188304050
5.53--
2.203.939.39
(-)9.3712.71
92.953.27
----
40.14
32.799.34
242.21251.4510.9820.13
-24.38
(-)10.687.80
-91.74
2.5818.63
6.92-
88.0582.6071.3978.6890.7779.1791.7992.80
84.1787.2391.1768.8773.2870.8089.42
86.3486.3996.7575.5882.0278.6778.8491.9290.2187.3587.9588.2890.6676.7386.8578.80
91.5986.2276.1885.1594.8683.7896.3995.25
88.0791.1194.1976.8978.6673.1792.95
89.6789.1498.6879.2185.3482.4881.8294.4593.7090.7791.4691.2893.7781.3891.2082.26
84.4978.5966.1971.8986.7374.2587.2090.17
80.0983.0187.9960.3767.6768.2785.82
82.8983.5594.8971.8578.5574.7275.6689.3186.6283.6984.4785.2687.3971.8682.2875.31
Contd...
(...Contd) TABLE - 1.05
12
14.15.16.17.
(7)1.
2.3.4.5.6.7.8.
(8)1.2.3.4.
(9)1.2.3.4.
Pub-Dhaniram Pather (CT)Borpukhuri (CT)Golaghatia Basti(CT)Jamunamukh (CT)
SONITPURTezpur (MB)(i) Bamun Chuburi (OG)(ii) Dekar Gaon (OG)(iii) Parbatia Gaon (OG)(iv) Hazarpar Dekar Gaon(OG)(v) Deuri Gaon (OG)Barika Chuburi (CT)Majgaon (CT)Gutlong Gaon (CT)Dhekiajuli (MB)Rangapara (TC)Biswanath Chariali (TC)Gohpur (TC)
LAKHIMPURNarayanpur (TC)Bihpuria (TC)North Lakhimpur (MB)Dhakuakhana (TC)
DHEMAJIDhemaji (TC)Silapathar (TC)Jonai Bazar (CT)Lakhi Nepali (CT)
District/Town %D
ecad
alG
row
thPopulation Literacy Rate
Total Male FemaleTotal Male
1 2 3 4 5 6 7
6280831898097377
173845585595688208141061541
356579118154
1090021579183931914512223
913336001
120165981413502
48285128162566244595348
3281421250223742
8891929993
283210332030772
2080402340815469
11097948597716253
4709230866219
308476940
249716514
1335023222785
----
(-)1.11 (-)32.58
43.1324.9819.8163.76
111.5-
19.44-
(-)14.87(-)2.29
13.7929.77
40.18-
10.5610.19
-
24.348.03
13.970.13
-
80.7865.5988.6489.47
81.6570.8996.4795.4494.7489.58
95.1493.6895.7966.5990.0487.8390.8886.52
86.9389.1089.6285.6789.12
84.0291.5283.2582.8170.19
86.1571.4993.2992.84
84.2572.6797.4297.2396.4191.43
96.9696.2796.6971.5993.7392.0393.0391.14
90.5592.7193.0389.2892.95
88.4294.2987.7288.1777.81
74.9159.5483.7585.99
78.9369.0395.5393.7093.1287.70
92.5390.9994.8961.5286.1083.3488.6681.67
83.0885.2885.9581.8385.07
79.3188.6578.3977.0261.99
Contd...

(...Contd) TABLE - 1.05
13
(10)1.
2.3.4.5.6.7.8.9.
10.11.12.13.
(11)1.
2.3.4.5.6.7.8.9.
TINSUKIATinsukia (MB)(i) Lahari Kachari Gaon (OG)(ii) Hengaluguri Gaon (OG)(iii) Bajatoli Gaon (OG)(iv) Hijuguri Gaon (OG)(v) Bordoloinagar (OG)Kachujan Gaon (CT)Bahbari Gaon (CT)Digboi (TC)Digboi Oil Town (CT)Chapakhowa Town (CT)Doom Dooma (TC)Makum (TC)Forest Vill. Lakhipathar (CT)Margherita (TC)Borgolai Grant No.II (CT)Ledo Town (CT)Ledo Tikok (CT)
DIBRUGARHDibrugarh (MB)(i) Mahpowalimara Gohain Gaon (OG)(ii) Tekela Chiring Gaon (OG)Niz-Mankata (CT)Barbari (AMC AREA) (CT)Chabua (TC)Sarupathar Bengali (CT)Duliajan Oil Town (CT)Moran Town (CT)Naharkatia (TC)Namrup (CT)
District/Town %D
ecad
alG
row
thPopulation Literacy Rate
Total Male FemaleTotal Male
1 2 3 4 5 6 7
264743994483304132549785125214232466821
21736127261030521572169236129
269145241
117175091
243730139565
1425
44985924288489668752
286268434
1893715719
138836534891694
67625982748109816103491
1096467535327
1147687703086
13777266960282582
12613572384
711
22232981145845934547
14898436397908187
18.2116.2316.7925.7128.5336.56
-(-)33.55
10.625.76
(-)23.29-
8.9211.94
-11.9119.5836.71
(-)24.73
6.698.32
44.52
20.36-
(-)29.49(-)48.57
32.4320.4623.5621.99
(-)17.36
82.0876.2586.5491.4591.4478.8895.5195.1891.6392.0890.7785.0985.5279.2585.4287.7073.4181.5076.15
88.0085.8569.63
93.3187.3884.4288.9891.4893.9894.6687.2992.88
85.5678.8191.9895.7094.9084.3697.0897.2094.6195.0994.5089.8289.3884.1692.0791.5783.0287.2882.20
90.9088.5775.98
95.7990.2389.8184.0095.2096.5796.8091.2394.85
78.2373.2980.8586.8887.6772.5693.9093.1788.5489.0286.5080.0681.1574.0478.8383.6463.4875.4069.88
84.9082.9263.30
90.9084.5178.7783.7087.4791.1692.4183.0890.75
Contd...

(...Contd) TABLE - 1.05
14
(12)1.2.3.4.5.6.7.
(13)1.
2.3.4.5.6.7.8.9.
10.11.
SIVASAGARSivasagar (MB)Amguri (MB)Nazira (MB)Simaluguri (TC)Sonari (MB)Moranhat (TC)Sepon (CT)
JORHATJorhat (MB)(i) Chengeli Gaon (OG)(ii) Gohain Tekela Gaon (OG)(iii) Duliagaon (OG)(iv) Cinnamara Grant (OG)(v) Toklai Cha Bagicha (OG)(vi)Sarbaibandha (OG)(vii) Chowdang No.1 (OG)(viii) Bohotia Gaon (OG)(ix) Sonari Gaon (OG)(x) Kamalabaria Gaon (OG)(xi) Nakari Bamun Gaon(OG)(xii) Barbheta Chapari (OG)Kamalabaria N.C. (CT)Kumar Kaibarta Gaon (CT)Chekonidhara (CT)Naubaisa Gaon (CT)Dhekorgorha (CT)Charingia Gaon (CT)Nowsolia Gaon (CT)Teok (TC)Titabor Town (TC)Mariani (TC)
District/Town %D
ecad
alG
row
thPopulation Literacy Rate
Total Male FemaleTotal Male
1 2 3 4 5 6 7
11009650781
800213304
828619810
56794234
22053471782
319129801739
1313151236936718453993915251510771764
100718056902650154708509443128795
1792020801
5793026925426968854438
1038128922140
1138373747416311498
8886824257534833647280119761269
555868
547840974510253823732615214545119300
10781
9.14(-)5.7114.36
1.97-
13.19(-)1.73
-
31.57(-)5.5212.8832.15
(-)7.7911.1145.0596.0437.2658.4231.73
(-)13.60(-)54.35
3.89-
26.9322.72
-----
137.51(-)0.93
90.9291.8291.7192.5891.0990.2991.2495.42
72.5052.3695.6993.0291.0566.2484.2393.4489.1093.2995.1094.2095.2279.2394.5192.0295.5894.2394.3388.4188.4992.0992.2689.91
92.8692.7593.8694.9493.7792.8794.4181.40
74.7053.7297.1795.4393.9575.3888.4695.7692.0894.9596.1795.8096.1786.3994.8795.4896.9496.9397.0392.0593.3794.6794.4392.80
88.7690.7789.2290.0387.9687.4488.0069.24
70.1650.8994.1690.5588.0356.3379.8891.0786.0291.5094.0392.6294.2272.3594.0888.4194.2491.4991.5684.5783.7889.3689.9286.79
Contd...
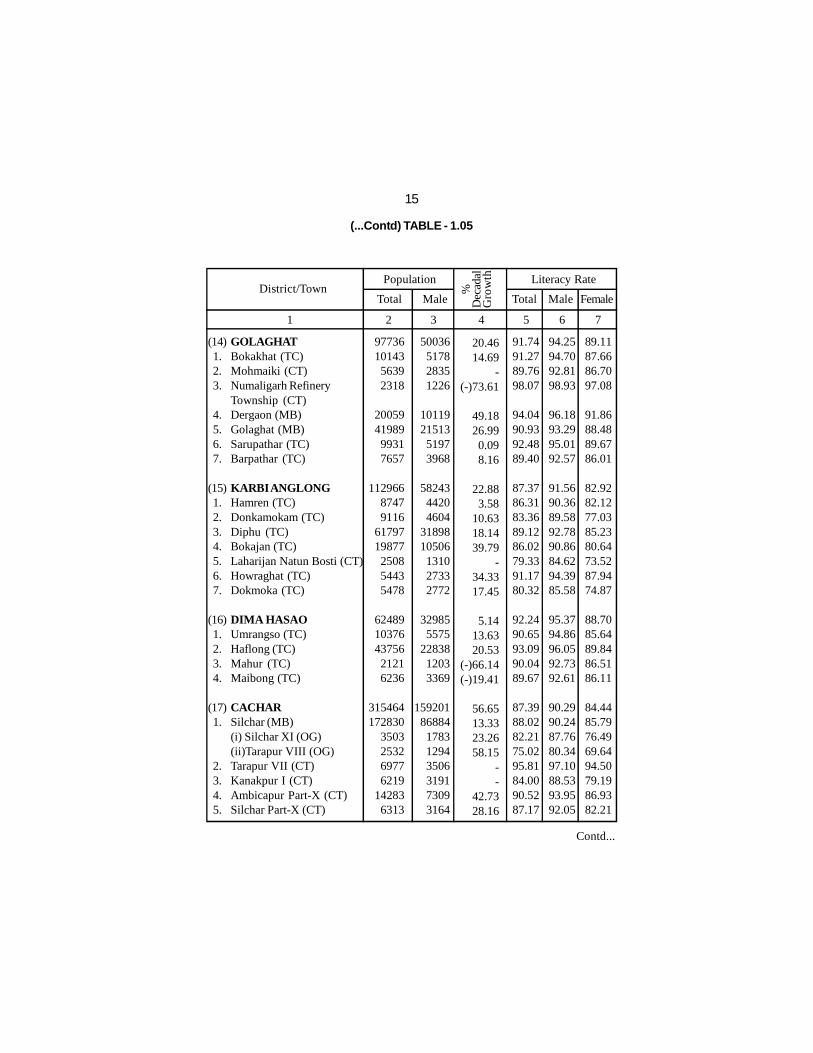
(...Contd) TABLE - 1.05
15
(14)1.2.3.
4.5.6.7.
(15)1.2.3.4.5.6.7.
(16)1.2.3.4.
(17)1.
2.3.4.5.
GOLAGHATBokakhat (TC)Mohmaiki (CT)Numaligarh RefineryTownship (CT)Dergaon (MB)Golaghat (MB)Sarupathar (TC)Barpathar (TC)
KARBI ANGLONGHamren (TC)Donkamokam (TC)Diphu (TC)Bokajan (TC)Laharijan Natun Bosti (CT)Howraghat (TC)Dokmoka (TC)
DIMA HASAOUmrangso (TC)Haflong (TC)Mahur (TC)Maibong (TC)
CACHARSilchar (MB)(i) Silchar XI (OG)(ii)Tarapur VIII (OG)Tarapur VII (CT)Kanakpur I (CT)Ambicapur Part-X (CT)Silchar Part-X (CT)
District/Town %D
ecad
alG
row
thPopulation Literacy Rate
Total Male FemaleTotal Male
1 2 3 4 5 6 7
977361014356392318
200594198999317657
11296687479116
6179719877250854435478
62489103764375621216236
315464172830
3503253269776219
142836313
50036517828351226
101192151351973968
5824344204604
3189810506131027332772
329855575
2283812033369
15920186884178312943506319173093164
20.4614.69
-(-)73.61
49.1826.990.098.16
22.883.58
10.6318.1439.79
-34.3317.45
5.1413.6320.53
(-)66.14(-)19.41
56.6513.3323.2658.15
--
42.7328.16
91.7491.2789.7698.07
94.0490.9392.4889.40
87.3786.3183.3689.1286.0279.3391.1780.32
92.2490.6593.0990.0489.67
87.3988.0282.2175.0295.8184.0090.5287.17
94.2594.7092.8198.93
96.1893.2995.0192.57
91.5690.3689.5892.7890.8684.6294.3985.58
95.3794.8696.0592.7392.61
90.2990.2487.7680.3497.1088.5393.9592.05
89.1187.6686.7097.08
91.8688.4889.6786.01
82.9282.1277.0385.2380.6473.5287.9474.87
88.7085.6489.8486.5186.11
84.4485.7976.4969.6494.5079.1986.9382.21
Contd...

(...Contd) TABLE - 1.05
16
6.7.8.9.10.11.12.13.14.15.16.17.18.19.
(18)1.2.3.4.5.6.7.
(19)1.2.3.
(20)1.2.
3.
Uttar Krishnapur Part-I (CT)Kanakpur Part-II (CT)Niz Katigorah Pt. III (CT)Katirail T.E. (CT)Tupkhana Pt.I (CT)Tarapur Pt.VI (CT)Dudhpatil Pt.VI (CT)Dudhpatil Pt.V (CT)Ambicapur Pt.VIII (CT)Ambicapur Pt.VI (CT)Uttar Krishnapur Pt.III (CT)Irongmara (CT)Durga Nagar Pt.V (CT)Lakhipur (MB)
KARIMGANJKarimganj (MB)Batarashi (CT)Kanisail Pt.I (CT)Badarpur (TC)Badarpur Rly. Town (CT)Mosli Pt.I (CT)Chapra (CT)
HAILAKANDIH.P.C. Township (CT)Hailakandi (MB)Lala (TC)
BONGAIGAONBongaigaon (MB)New Bongaigaon Rly. Colony(CT)Chalantapara Pt.IV (CT)
District/Town %D
ecad
alG
row
thPopulation Literacy Rate
Total Male FemaleTotal Male
1 2 3 4 5 6 7
69609519568761824640875350834121
116917971518776859051
10277
10970056854
70017358
1329888825087
11220
481402732
3363711771
1098106732214896
5744
35494817291231192369439225732092586640702657396445225168
5535428473
356037766738447725775753
241431473
168435827
5603234401
7578
2931
35.6534.20
----------
21.004.85
48.548.06
--
17.71(-)10.64
--
9.20(-)32.97
13.1114.62
12.9611.60
(-)4.52
-
86.1788.9589.5987.4486.78
85.4683.6193.7174.8884.6786.5576.9192.7490.97
92.8294.5878.9789.6095.4092.2586.9793.47
92.9397.3592.0894.30
87.3788.1883.05
62.49
90.2691.9992.8889.6091.4789.2787.8496.1180.0589.6791.2282.6893.9794.62
95.2896.3984.7192.9397.2594.5891.1497.14
95.3198.9994.6196.38
91.4292.3088.76
67.26
81.8985.8286.1285.2481.7981.6679.3191.2769.6879.4081.6870.7491.5287.29
90.3392.7773.0286.0893.5189.8982.6989.62
90.5495.4289.5592.27
83.1783.8777.11
57.68
Contd...

(...Contd) TABLE - 1.05
17
4.5.
(21)1.2.3.
(22)1.2.3.4.5.6.7.8.9.10.11.12.13.14.15.16.
(23)1.2.3.4.5.6.7.
Abhayapuri (TC)B.R.P.L. Township (CT)
CHIRANGBasugaon (TC)Bijni (TC)Chatibor Gaon (CT)
KAMRUPRangia (MB)Udiana (CT)Sualkuchi (CT)Bamun Sualkuchi (CT)Niz-Hajo (CT)Majarkuri (CT)Palasbari (MB)Kochpara (CT)Nahira (CT)Uparhali (CT)Dahali (CT)Sarpara (CT)Parlli Part (CT)Sanpara (CT)Changsari (CT)Jalah (CT)
KAMRUP METROPOLITANGuwahati (M. Corp)Narengi (OG)Azara (CT)Garal (CT)Majir Gaon (CT)North Guwahati(TC)Amingaon (CT)
District/Town %D
ecad
alG
row
thPopulation Literacy Rate
Total Male FemaleTotal Male
1 2 3 4 5 6 7
158476001
353371384913257
8231
14239427889
464413898
762815188
472749257540
117907095839765295788453453546468
1037011957352
4982878044004774
103288855
79363186
17965712666824157
7232114466245168093746767123852469384060833682426633192825233826883283
536523495362
308844542239244050884561
8.00(-)9.25
41.3011.335.48
-
145.1610.89
-(-)1.66
6.51--
(-)11.3323.99
--------
21.9818.21
(-)44.11---
(-)36.58-
91.5098.60
81.2884.5889.3760.72
87.8988.9286.8692.9988.8187.0188.7291.9692.2282.0587.3984.9085.1987.8986.3988.9282.85
90.7791.0197.2188.5689.6290.8693.6880.33
94.5199.47
86.5689.5293.6568.23
92.5092.4791.5796.7192.7292.7993.7395.7896.0688.9691.7589.9689.7093.2792.7993.6587.37
93.5593.6799.0992.5194.5294.4496.5186.27
88.5097.63
75.8379.3385.0153.12
83.1485.0981.5089.4385.0581.0983.6588.1488.2774.7182.7979.6780.6082.6479.5984.2178.19
87.7888.1594.0784.4784.6887.1490.9774.11
Contd...

(...Contd) TABLE - 1.05
18
6.7.8.
9.10.11.
(24)1.2.3.4.5.6.7.8.9.
10.11.
(25)1.2.
(26)1.2.3.
(27)1.2.3.
Kahi Kuchi (CT)Dharapur (CT)Digaru Gaon (DigarubarGaon) (CT)Barua Bari Gaon (CT)Sonapur Gaon (CT)Chandrapur Baghicha (CT)
NALBARITihu (TC)Rupiabathan (CT)Belsor (CT)Kakaya (CT)Pipalibari (CT)Bangaon (CT)Marowa (CT)Nalbari (MB)Bali Koria (CT)Digheli (CT)Niz-Bahjani (CT)
BAKSATakhlibilar Pathar (CT)No.2 Goreswar (CT)
DARRANGMangaldoi (MB)Gerimari Chapori (CT)Kharupatia (TC)
UDALGURIKalaigaon Town (Part) (CT)Tangla (TC)Udalguri (TC)
District/Town %D
ecad
alG
row
thPopulation Literacy Rate
Total Male FemaleTotal Male
1 2 3 4 5 6 7
991780953207
544457715106
827304599498185235550453458734004
27839635952855183
1224266115631
55494259891100418501
375745112
1718315279
513041171639
274630252634
423292337251843512720229429841985
14425330526962714
630334192884
2881313362
56879764
19175258088837712
-5.57
-
--
(-)30.75
200.996.88-
----------
---
33.078.65
-4.04
13.43-
(-)5.732.56
89.4389.4078.47
85.9981.3382.23
89.8992.8187.9092.1884.2387.3590.0688.1590.1794.9491.1785.83
74.5463.9186.40
85.9291.8975.0683.66
85.1472.0186.1688.33
93.1694.0284.53
89.2987.2087.90
93.7295.0191.7095.5990.4493.7694.6294.2093.0197.3894.9491.39
80.4369.9192.31
89.9394.4780.6588.87
89.0876.4289.7992.49
85.5284.6772.06
82.6474.6476.16
85.8890.4984.0388.6678.3080.8885.2882.1587.1092.3287.2779.82
68.2857.4580.20
81.6089.1769.0777.78
81.0367.4082.2884.09
Note: M.Corp-Municipal Corporation; TC-Town Committee; CT-Census Town;MB - Municipal Board; OG - Out Growth.

TABLE - 1.06CHILD (0 - 6 YEARS) POPULATION IN ASSAM, CENSUS 2011
19
District
Percentage to totalpopulation Sex Ratio
2001#
20112001 2011
1 2 3 4 5 6 7
*Kokrajhar*DhubriGoalpara*BarpetaMorigaonNagaon*SonitpurLakhimpurDhemajiTinsukiaDibrugarhSivasagarJorhatGolaghatKarbi AnglongDima HasaoCacharKarimganjHailakandi*Bongaigaon*Chirang*Kamrup*Kamrup Metro*Nalbari*Baksa*Darrang*Udalguri
Assam
2001 2011
15136632675415913326514614875842628027041915031299545
18484517263114909813388814297015023030807
22921917743110097611083579037
20475712503397847
138906146808125044
4498075
136924368262171657287829163819459940277862156739104247181826163210139380124594134793151681
32414256774211960111278116392
73215200061125386
95333122872156408113274
4638130
17.9520.8619.3619.0119.1618.4216.2416.9117.4016.0714.5714.1813.4015.1118.4716.3815.8617.6018.6018.0918.2515.6111.8014.2016.1919.3216.48
16.87
15.4318.8917.0316.9917.1116.2914.4415.0415.1913.6912.3112.1111.4112.6315.8615.1414.7917.2516.8815.7515.1813.1810.0012.3512.9316.8513.62
14.86
947965974960965975973966970957962967967963973955960965926972
957
958
975
965
954968963961956964966959950960962960964963959967954969954969968967946967966969973
962
* Due to creation of 4 new districts the rates for 2001 have been affected in 12 districts.# Child population of Census 2001 for these 12 districts are calculated by this Director-ate on the basis of ‘Percentage of Child Populaiton’ released by the RGI.

TABLE - 1.07LITERACY RATE BY SEX IN ASSAM
20
KokrajharDhubriGoalparaBarpetaMorigaonNagaonSonitpurLakhimpurDhemajiTinsukiaDibrugarhSivasagarJorhatGolaghatKarbi AnglongDima HasaoCacharKarimganjHailakandiBongaigaonChirangKamrupKamrup MetroNalbariBaksaDarrangUdalguri
Assam
65.2258.3467.3763.8168.0372.3767.3477.2072.7069.6676.0580.4182.1577.4369.2577.5479.3478.2274.3369.7463.5575.5588.7178.6369.2563.0865.41
72.19
71.8963.1071.4669.2971.9076.5173.6583.5279.8477.1982.8285.8487.6383.5676.1483.2984.7884.1280.7474.8770.2481.3092.1384.3677.0367.8772.58
77.85
58.2753.3363.1358.0664.0468.0760.7370.6765.2161.7368.9974.7176.4571.0962.0071.3373.6872.0967.6064.4356.6569.4785.0772.5761.2758.0458.05
66.27
63.6355.2565.9361.4766.6069.9664.9876.2271.8165.0572.7579.2780.0175.9466.6971.1377.0876.6672.7366.4262.0874.2176.4577.2269.1861.5064.43
69.34
87.8682.2876.0886.2884.1786.3481.6586.9384.0282.0888.0090.9272.5091.7487.3792.2487.3992.8292.9387.3781.2887.8990.7789.8974.5485.9285.14
88.47
8.539.778.448.507.986.825.937.479.117.725.954.105.175.148.646.675.964.954.778.25
10.739.365.997.84
12.158.338.05
6.87
1 2 3 4 5 6 7 8 9
District2011 Census
Total Male
Male-Female LiteracyGap 2011
Female Rural Urban Total Rural Urban
13.629.778.33
11.237.868.44
12.9212.8514.6315.4613.8311.1311.1812.4714.1411.9611.1012.0313.1410.4413.5911.83
7.0611.7915.76
9.8314.53
11.58
13.929.818.33
11.537.838.70
13.6613.3615.0417.2015.5511.8212.6613.2214.9013.8412.3712.8413.9410.8313.8312.1412.1412.2915.809.89
14.83
12.37

TABLE - 1.08TOTAL HOUSEHOLDS AND AMENITIES (%)
AS PER CENSUS 2011
21
1 2 3 4 5 6
District
KokrajharDhubriGoalparaBarpetaMorigaonNagaonSonitpurLakhimpurDhemajiTinsukiaDibrugarhSivasagarJorhatGolaghatKarbi AnglongDima HasaoCacharKarimganjHailakandiBongaigaonChirangKamrupKamrup MetroNalbariBaksaDarrangUdalguri
Assam
57.565.258.665.069.464.653.756.954.966.267.649.744.946.135.217.821.817.910.769.152.864.876.770.556.358.752.6
54.8
23.919.622.322.118.419.927.025.629.425.925.635.235.128.633.435.746.248.852.318.824.820.211.018.722.323.125.5
26.7
23.017.439.825.128.234.934.529.721.860.350.150.052.436.630.545.238.128.730.733.223.140.086.444.023.324.231.8
37.0
29.243.365.571.960.175.359.258.044.881.178.774.266.768.454.869.481.085.083.156.428.759.292.366.739.450.643.9
64.9
181081414674198454337929184602559340392919204307129869268598276867248367236262227197177646
42252379955247714143350150018
97395311114293112155248191701187783168717
6406471
TotalHouseholds
Drinkingwater within
premises
Latrinefacilitieswithin
premises
DrinkingWater nearpremises
Electricityas source of
lighting

TABLE -DISTRIBUTION OF MAIN WORKERS AND
22
1 2 3 4 5 6 7
District
KokrajharDhubriGoalparaBarpetaMorigaonNagaonSonitpurLakhimpurDhemajiTinsukiaDibrugarhSivasagarJorhatGolaghatKarbi AnglongDima HasaoCacharKarimganjHailakandiBongaigaonChirangKamrupKamrup MetroNalbariBaksaDarrangUdalguri
Assam
25311050499826637643945326096873499355832528353320136441018839159731895033863533121026048268297
471259293392165193191671139027421244413154196773278297241456253178
8687123
Tota
l
Agr
icul
tura
lla
bour
ers
Cul
tivat
ors
Hou
seho
ldin
dust
ry
Oth
er
128150179873108908184770134827287452196296148850145889102840
860827025598667
133659163800
35375104295
80088561446676766774
1497382067751345
124450107473105110
3138554
29518107424375095693240019
1076495100716154
4791194832179214008201762508620595
1833372043661817718249141589642121
825919603444474641836120
903294
7337160197710
164996598
201301380947143109646165286143
1443277785085
750112268181326447564241
2945279738578
1043346066259
242071
88105201682112249181252
79524319762297213113815
47575281404277195228544205360164687
7100230339
318534168505
880679523452116
199933376245117247
9896782959
105689
4403204
34113166981936257356182435114897999877060642999531680055719656055748571749861847992838344185028
608062399171214240255806193894628954490932267623406756324843345030
11969690
Tota
lW
orke
r
Main Workers

1.09MARGINAL WORKERS IN ASSAM, 2011
23
KokrajharDhubriGoalparaBarpetaMorigaonNagaonSonitpurLakhimpurDhemajiTinsukiaDibrugarhSivasagarJorhatGolaghatKarbi AnglongDima HasaoCacharKarimganjHailakandiBongaigaonChirangKamrupKamrup MetroNalbariBaksaDarrangUdalguri
Assam
286032543217641204892278558671528279052786048466424911267845472185693159220
91051606114260
9529166751355436065
45736725
248382198319714
923073
2681263692383194201435965885256385827768143902827339417344603297741530403572985
3146030415135302249219328574018736
15381501443519936624
942052
508611803
663613843
77481799211910
62694115678078348389
1711172904776742
132409254404947293431
396544490
10724987759365542
249250
275206389433601460252368279817836862189810883653137259756073626774296718606
38997604251850219392023918554745905997938020436002026929972
1168192
8802116482196197
12237190180
24500521228114646211543614700816896016676715998314871812295916731
136803105779490476413554867
2077107777870850
1284598338791852
3282567
8 9 10 11 12 1
Tota
l
Agr
icul
tura
lla
bour
ers
Cul
tivat
ors
Hou
seho
ldin
dust
ry
Oth
er
Marginal Workers
District

TABLE - 1.10DISTRIBUTION OF SC AND ST POPULATION IN ASSAM, 2011
24
1 2 3 4 5 6 7
District
KokrajharDhubriGoalparaBarpetaMorigaonNagaonSonitpurLakhimpurDhemajiTinsukiaDibrugarhSivasagarJorhatGolaghatKarbi AnglongDima HasaoCacharKarimganjHailakandiBongaigaonChirangKamrupKamrup MetroNalbariBaksaDarrangUdalguri
Assam
1538636359229994916560194
1364735581741689230061944330517215684519431807234362340
13605181384363694251318105552375210630654375342056619402
1145314
Mal
e
Tota
l
Fem
ale
Mal
e
Fem
ale
1418434036220954615557647
129877533134015121219182452835920779434713049121525
1997128846
76506342904027117030525904968329562355491969418442
1086007
2786656332
23157027344
136777115153232207249426325560
82066102871
49039139971111765538738151843
175691940
69118835
178688182038
7512123364
3310078419
267372
3884371
1395793198
116013135306838257759
117685126716165449
4176951835249897079556420
272460765208736
994354
937789273920943790211692
1656344300
133550
1957005
1390863134
115557138146839557394
114522122710160111
4029751036240506917655345
266278753238833
946337
945889415899443721911672
1653734119
133822
1927366
29570703954509495320
1178412663501091308184044225376885887642347886656229844961
4337264897157890706598278435135
10782710178960216730834026037844
2231321
Tota
l
Schedule Castes Schedule Tribes

TABLE - 1.11DISABLED POPULATION BY TYPE OF DISABILITY, 2011
25
1 2 3 4 5 6 7 8
District
KokrajharDhubriGoalparaBarpetaMorigaonNagaonSonitpurLakhimpurDhemajiTinsukiaDibrugarhSivasagarJorhatGolaghatKarbi AnglongDima HasaoCacharKarimganjHailakandiBongaigaonChirangKamrupKamrup MetroNalbariBaksaDarrangUdalguri
Assam
644717054
745712882
89662379416034
748045039706
1068210494
9732829369681395
1479910300
529450754316
1305310847
6576810388798256
257385
Mal
e
Fem
ale
Mal
e
Fem
ale
5214156646656
109478370
2133113500659438118509919491108349695561031027
126588532442944673785
1123894095199678976277213
222680
7543797130218831486364725121082
631171817751804144011401432
186250016671022
823579
177814511058120212491134
41052
177925401337210919184706325214691106194921962623240915761399
36929602123
723896
1023286321261128188116541668
51782
13482622130422091961497229531477
980183920772380218114651318
23929701940
689902960
28592359
979179015731449
49795
1166132718141132382917336451252953414074
8314182151987619604180811524813071
24222745718832
972395428101
242912025611775148921650615469
480065
Tota
l
No.of Disabled Persons In Seeing In Hearing
Mal
e
Fem
ale
7093646130617581436355623001029574
159716921800144711661322184
236416251012871578
19151234931
109512681086
39501
Contd...

(...Contd) TABLE - 1.11
26
1 9 10 11 12 13 14
District
KokrajharDhubriGoalparaBarpetaMorigaonNagaonSonitpurLakhimpurDhemajiTinsukiaDibrugarhSivasagarJorhatGolaghatKarbi AnglongDima HasaoCacharKarimganjHailakandiBongaigaonChirangKamrupKamrup MetroNalbariBaksaDarrangUdalguri
Assam
4391005426874507
17211250668302753644685632639336
91857652330385369915656538629738824
17865
Fem
ale
Fem
ale
Mal
e
Mal
e
Fem
ale
9763103141826441467455627191541780
17381798181115441737990241
22741870887
1038687
238412531306130016701367
45099
6292395107117751110341118371141533
12441300116810261168651152
13981222587715447
1502769819789
1109940
30908
3971117505812464
1505929306212572596468435423444
79914662338384277712622337436447471
14864
310890398606425
1183690251170421473354324357364
55672476279257220501444252389395354
11510
5301195
5401097
59020831421
751402890833857806821403115
1039830461448394
1159875695727979944
21885
Mal
e
In Speech Mental RetardationIn Movement
Contd...

(...Contd) TABLE - 1.11
27
1 15 16 17 18 19 20
District
KokrajharDhubriGoalparaBarpetaMorigaonNagaonSonitpurLakhimpurDhemajiTinsukiaDibrugarhSivasagarJorhatGolaghatKarbi AnglongDima HasaoCacharKarimganjHailakandiBongaigaonChirangKamrupKamrup MetroNalbariBaksaDarrangUdalguri
Assam
178665242378314897530194101289342323292268138
48528359186207121359229198247327234
8194
Fem
ale
Fem
ale
Mal
e
Mal
e
Fem
ale
12722575129623531762348028961268
821155821471480180113001492
232327917631187
667840
231734821026141813321481
46525
11522442118719801535291924501068757
149118751403163611541375175
28281462979595773
19343107843
116811521496
40936
4981977
7351463
95227281489
811418921958
1053894906615104
1192929455553348
1339700721807
1129858
25553
4491999722
1367108226721490766394875791997811738599
831041796367535317
1253611639682
1065830
23971
241750324521327
108981625213336037939840339019369
641456221266168501338305332419333
10625
Mal
e
Mental Illness Multiple DisabilityAny Other
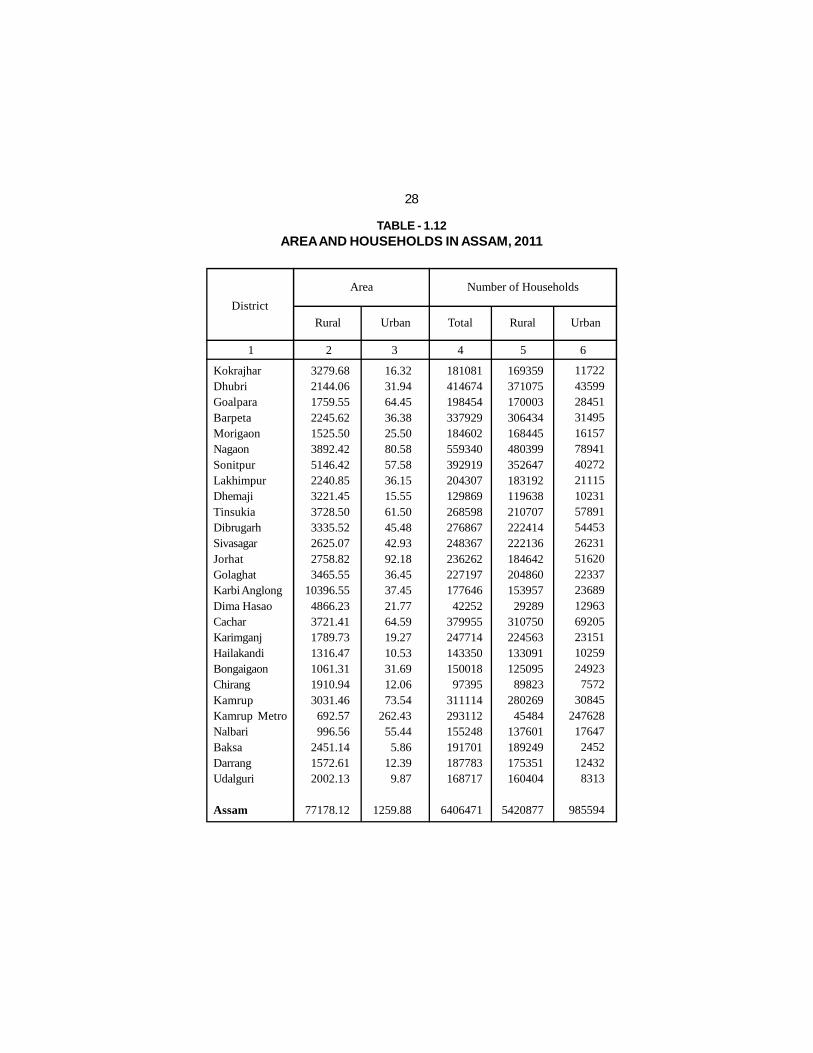
TABLE - 1.12AREA AND HOUSEHOLDS IN ASSAM, 2011
28
1 2 3 4 5 6
District
KokrajharDhubriGoalparaBarpetaMorigaonNagaonSonitpurLakhimpurDhemajiTinsukiaDibrugarhSivasagarJorhatGolaghatKarbi AnglongDima HasaoCacharKarimganjHailakandiBongaigaonChirangKamrupKamrup MetroNalbariBaksaDarrangUdalguri
Assam
18108141467419845433792918460255934039291920430712986926859827686724836723626222719717764642252
37995524771414335015001897395
311114293112155248191701187783168717
6406471
169359371075170003306434168445480399352647183192119638210707222414222136184642204860153957
29289310750224563133091125095
89823280269
45484137601189249175351160404
5420877
1172243599284513149516157789414027221115102315789154453262315162022337236891296369205231511025924923
757230845
24762817647
245212432
8313
985594
Total
Number of Households
Rural UrbanRural Urban
Area
3279.682144.061759.552245.621525.503892.425146.422240.853221.453728.503335.522625.072758.823465.55
10396.554866.233721.411789.731316.471061.311910.943031.46
692.57996.56
2451.141572.612002.13
77178.12
16.3231.9464.4536.3825.5080.5857.5836.1515.5561.5045.4842.9392.1836.4537.4521.7764.5919.2710.5331.6912.0673.54
262.4355.445.86
12.399.87
1259.88

1 2 3 4 5 6 7 8 9
TABLE - 1.13TRENDS IN CENSUS POPULATION IN INDIA 1901-2011
29
1901
1911
1921
1931
1941
1951
1961
1971
1981
1991
2001
2011
1207.9
1283.9
1285.5
1429.3
1636.9
1855.3
2262.9
2840.5
3533.7
4393.6
5321.6
6231.2
1173.6
1237.1
1227.7
1357.9
1546.9
1755.6
2129.4
2641.1
3299.5
4070.6
4964.5
5874.5
2384.0*
2520.9
2513.2
2789.8*
3186.6*
3610.9
4392.3
5481.6
6833.3
8464.2
10286.1
12105.7
972
964
955
950
945
946
941
930
934
926
933
943
77
82
81
90
103
117
142
177
216
267
325
382
N.A.
5.75
(-)0.31
11.00
14.22
13.31
21.64
24.80
24.66
23.87
21.54
17.68
N.A.
0.56
(-)0.03
1.04
1.33
1.25
1.96
2.22
2.20
2.14
1.95
1.62
10.85
10.29
11.18
11.99
13.86
17.29
17.97
19.91
23.33
25.70
27.82
31.15
Year
Total Population (in Lakh)
Sex
Rat
ioF
emal
es/ 1
000
Mal
es
Den
sity
of
Pop
ulat
ion/
Squ
are
K.M
.
Dec
enni
alC
hang
e (%
)
Ave
rage
Ann
ual
Exp
onen
tial
Gro
wth
Rat
e
% o
f U
rban
Pop
ulat
ion
toTo
tal
Pop
ulat
ion
Male Female Total
* The distribution of population by Sex of Pondicherry for 1901(2,46,354),1931(2,58,628) & 1941(2,85,011) is not available. The figures of these years are there-fore, exclusive of these population so far distribution of Sex is concerned.

1 2 3 4 5 6 7 8
TABLE-TRENDS IN POPULATION IN
30
1901
1911
1921
1931
1941
1951
1961
1971
1981*
1991
2001
2011
17.14
20.10
24.46
29.66
35.70
42.99
57.98
77.14
--
116.58
137.77
159.40
15.76
18.39
21.91
25.94
31.25
37.30
50.39
69.11
--
107.56
128.79
152.66
32.90
38.49
46.37
55.60
66.95
80.29
108.37
146.25
--
224.14
266.56
312.06
32.13
37.56
45.10
53.98
64.87
76.84
100.56
133.36
--
199.26
232.17
268.07
0.77
0.93
1.27
1.62
2.08
3.45
7.81
12.89
--
24.88
34.39
43.99
919
915
896
874
875
868
869
896
--
923
935
958
2.34
2.41
2.74
2.92
3.11
4.29
7.21
8.82
--
11.10
12.90
14.10
Year
Total Population (in Lakh)
Sex
Rat
io(F
emal
es/1
000
Mal
es)
Urb
anP
opul
atio
n (%
)
Male Female Total Rural Urban
Population(in Lakh)
ASSAM
* 1981 Census was not held in Assam.Source: Census of India.

1 2 3 4 5 6 7 8
1.14ASSAM AND INDIA 1901-2011
31
1901
1911
1921
1931
1941
1951
1961
1971
1981
1991
2001
2011
1207.91
1283.85
1285.50
1429.30
1636.90
1855.28
2262.90
2840.49
3533.70
4393.58
5321.61
6231.22
1173.59
1237.08
1227.70
1357.89
1546.90
1755.60
2129.42
2641.10
3299.55
4070.63
4964.50
5874.48
2383.96*
2520.93
2513.21
2789.77*
3186.61*
3610.88
4392.35
5481.60
6833.29
8464.21
10286.11
12105.70
2125.44
2261.52
2232.35
2455.21
2745.07
2986.44
3602.98
4390.46
5238.67
6286.92
7424.91
8334.64
258.52
259.42
280.86
334.56
441.53
624.44
789.37
1091.14
1594.63
2176.11
2861.20
3771.06
972
964
955
950
945
946
941
930
934
926
933
943
10.8
10.3
11.2
12.0
13.9
17.3
18.0
19.9
23.3
25.7
27.8
31.2
Year
Total Population (in Lakh)
Sex
Rat
io(F
emal
es/1
000
Mal
es)
Urb
anP
opul
atio
n (%
)
Male Female Total Rural Urban
Population(in Lakh)
INDIA
* The distribution of population by Sex of Pondicherry for 1901(2,46,354),1931(2,58,628) & 1941(2,85,011) is not available. The figures of these years are there-fore, exclusive of these population so far distribution of Sex is concerned.
* Excluding Jammu & Kashmir. ** Excluding Assam.Source: (Table 1.01 to 1.14) Census of India 2011.
TABLE - 1.15LITERACY RATE IN ASSAM AND INDIA 1951-2011
1951*
1961
1971
1981**
1991
2001
2011
18.53
32.95
33.94
-
52.89
63.25
72.19
18.33
28.30
34.45
43.57
52.21
64.84
72.99
28.01
44.28
43.72
-
61.87
71.28
77.85
27.16
40.40
45.96
56.38
64.13
75.26
80.89
7.58
18.62
22.76
-
43.03
54.61
66.27
8.86
15.35
21.97
29.76
39.29
53.67
64.64
1 2 3 4 5 6 7
Person Male FemaleYear
Assam India Assam India Assam India
32
Source: 1. Selected Socia-Economic Statistics, India - 2008 of Ministry of Statistics and Programme Implementation, Govt. of India;2. Press Notes of Planning Commission of India.
TABLE - 1.16PERCENTAGE OF POPULATION BELOW POVERTY LINE
1973-74
1977-78
1983
1987-88
1993-94
1999-2000
2004-05
2009-10
2011-12
52.67
59.82
42.60
39.35
45.04
40.04
36.40
39.90
33.89
36.92
32.71
21.73
9.94
7.73
7.47
21.80
26.10
20.49
51.21
57.15
40.47
36.21
40.86
36.09
34.40
37.9
31.98
56.44
53.07
45.65
39.09
37.27
27.09
41.80
33.80
25.70
49.01
45.24
40.79
38.20
32.36
23.62
25.70
20.90
13.70
54.88
51.32
44.48
38.86
35.97
26.10
37.20
29.80
21.92
1 2 3 4 5 6 7
Assam IndiaYear
Rural Urban Combined Rural Urban Combined
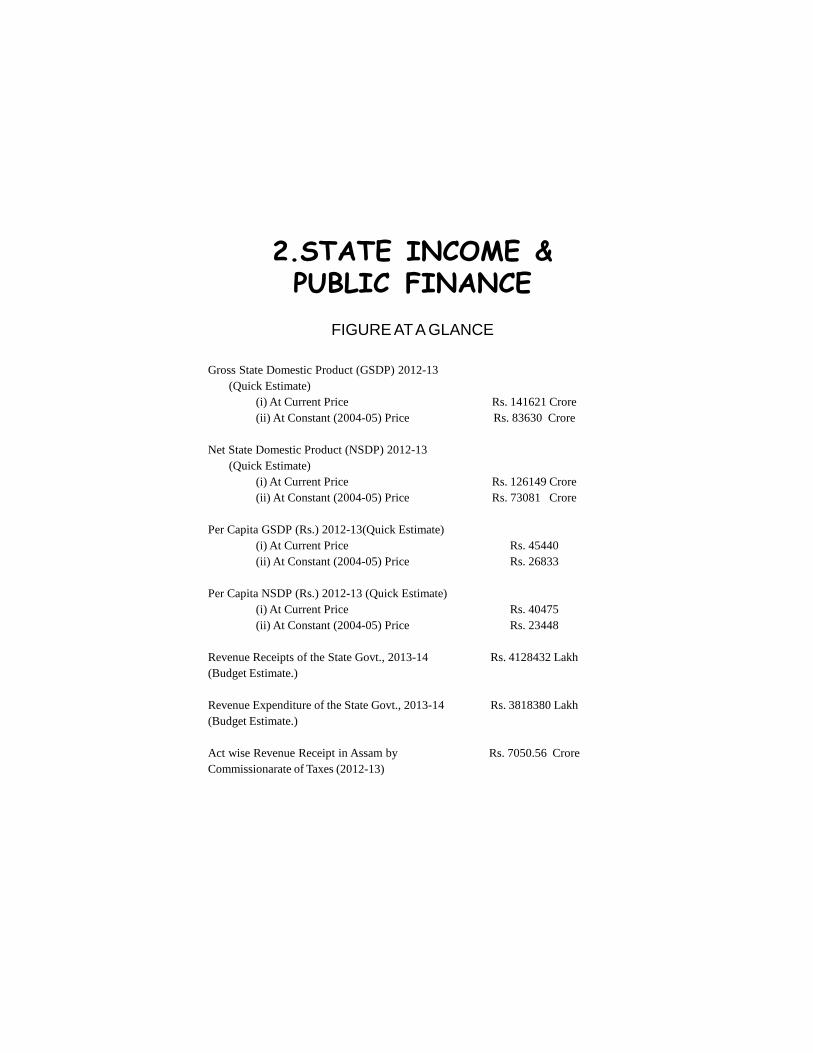
2.STATE INCOME &PUBLIC FINANCE
FIGURE AT A GLANCE
Gross State Domestic Product (GSDP) 2012-13 (Quick Estimate)
(i) At Current Price(ii) At Constant (2004-05) Price
Net State Domestic Product (NSDP) 2012-13 (Quick Estimate)
(i) At Current Price(ii) At Constant (2004-05) Price
Per Capita GSDP (Rs.) 2012-13(Quick Estimate)(i) At Current Price(ii) At Constant (2004-05) Price
Per Capita NSDP (Rs.) 2012-13 (Quick Estimate)(i) At Current Price(ii) At Constant (2004-05) Price
Revenue Receipts of the State Govt., 2013-14(Budget Estimate.)
Revenue Expenditure of the State Govt., 2013-14(Budget Estimate.)
Act wise Revenue Receipt in Assam byCommissionarate of Taxes (2012-13)
Rs. 141621 CroreRs. 83630 Crore
Rs. 126149 CroreRs. 73081 Crore
Rs. 45440Rs. 26833
Rs. 40475Rs. 23448
Rs. 4128432 Lakh
Rs. 3818380 Lakh
Rs. 7050.56 Crore
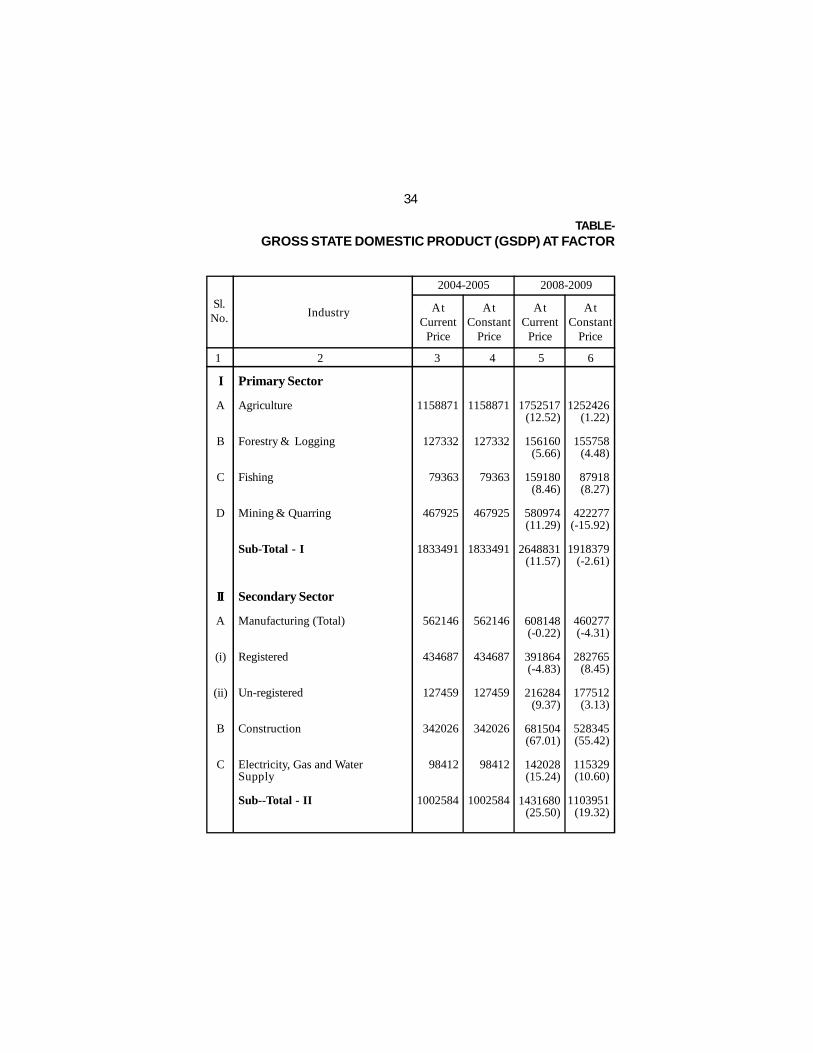
34
TABLE-GROSS STATE DOMESTIC PRODUCT (GSDP) AT FACTOR
Primary Sector
Agriculture
Forestry & Logging
Fishing
Mining & Quarring
Sub-Total - I
Secondary Sector
Manufacturing (Total)
Registered
Un-registered
Construction
Electricity, Gas and WaterSupply
Sub--Total - II
I
A
B
C
D
II
A
(i)
(ii)
B
C
Industry
2008-20092004-2005
AtCurrent
Price
AtConstant
Price
AtCurrent
Price
AtConstant
Price
Sl.No.
1 2 3 4 5 6
1158871
127332
79363
467925
1833491
562146
434687
127459
342026
98412
1002584
1158871
127332
79363
467925
1833491
562146
434687
127459
342026
98412
1002584
1752517(12.52)
156160(5.66)
159180(8.46)
580974(11.29)
2648831(11.57)
608148(-0.22)
391864(-4.83)
216284(9.37)
681504(67.01)
142028(15.24)
1431680(25.50)
1252426(1.22)
155758(4.48)
87918(8.27)
422277(-15.92)
1918379(-2.61)
460277(-4.31)
282765(8.45)
177512(3.13)
528345(55.42)
115329(10.60)
1103951(19.32)

35
2.01COST BY INDUSTRY OF ORIGIN, ASSAM. (at 2004-05 price)
Contd...
(Rs. in Lakh)
2009-2010 2011-2012(P)2010-2011
AtCurrent
Price
AtConstant
Price
AtCurrent
Price
AtConstant
Price
AtCurrent
Price
AtConstant
Price
AtCurrent
Price
AtConstant
Price
Sl.No.
7 8 9 10 11 12 13 14 1
2127696(21.41)
166935(6.90)
184205(15.72)
677976(16.70)
3156812(19.18)
772464(27.02)
552955(41.11)
219509(1.49)
751883(10.33)
128998(-9.17)
1653345(15.48)
1333637(6.48)
163520(4.98)
102063(16.09)
434048(2.79)
2033268(5.99)
561978(22.10)
373008(31.91)
188970(6.45)
572695(8.39)
92166(-20.08)
1226839(11.13)
2455091(15.39)
179330(7.43)
238814(29.65)
711900(5.00)
3585135(13.57)
1021453(32.23)
771439(39.51)
250014(13.90)
980372(30.39)
133359(3.38)
2135184(29.14)
1377576(3.29)
168421(3.00)
97471(-4.50)
424741(-2.14)
2068209(1.72)
593442(5.60)
396030(6.17)
197412(4.47)
581954(1.62)
87531(-5.03)
1262927(2.94)
---
I
A
B
C
D
II
A
(i)
(ii)
B
C
2012-2013(Q)
2754071(12.18)
210807(17.55)
253142(6.00)
794448(11.6)
4012468(11.92)
1156878(13.26)
874684(13.38)
282194(12.87)
1062999(8.43)
142459(6.82)
2362336(10.64)
1443503(4.79)
177871(5.61)
104077(6.78)
435102(2.44)
2160553(4.46)
616168(3.83)
407504(2.90)
208664(5.70)
607797(4.44)
88245(0.82)
1312210(3.90)
3063098(11.22)
224784(6.63)
281761(11.31)
885980(11.52)
4455623(11.04)
1251775(8.20)
931479(6.49)
320296(13.50)
1150365(8.22)
150150(5.40)
2552290(8.04)
1506310(4.35)
183292(3.05)
110634(6.30)
444901(2.25)
2245137(3.91)
636092(3.23)
422595(3.70)
213497(2.32)
635252(4.52)
89401(1.31)
1360745(3.70)
P - Provisional; Q - Quick Estimate.

36
(...Contd) TABLE-
Tertiary Sector
Transport, Storage and Communi-cation (Total)
Railways
Storage
Transport by other mean
Communication
Trade, Hotels & Restaurants
Banking & Insurance
Real Estate, ownership of Dwelling& Business Services
Public Administration
Other Services
Sub-Total - III
TOTAL GSDP
PER CAPITA GSDP (Rs.)
III
A
(i)
(ii)
(iii)
(iv)
B
C
D
E
F
Industry
2008-20092004-2005
AtCurrent
Price
AtConstant
Price
AtCurrent
Price
AtConstant
Price
Sl.No.
1 2 3 4 5 6
329700
89783
2509
157887
79521
752981
162017
146463
342066
770469
2503696
5339771
18993
329700
89783
2509
157887
79521
752981
162017
146463
342066
770469
2503696
5339771
18993
566604(10.09)
155787(-6.44)
4057(7.7)
263950(17.27)
142810(19.67)
1274253(12.53)
243984(8.07)
219899(12.41)
528644(17.82)
1193472(10.96)
4026856(12.08)
8107367(14.07)
27334(12.61)
541826(10.59)
159456(9.38)
2771(2.55)
196935(5.47)
182664(18.04)
1005185(4.92)
281457(11.63)
175240(3.46)
432499(12.93)
944719(3.91)
3380926(6.93)
6403256(5.72)
21589(4.38)

37
2.01
2009-2010 2012-2013(Q)2011-2012(P)2010-2011
AtCurrent
Price
AtConstant
Price
AtCurrent
Price
AtConstant
Price
AtCurrent
Price
AtConstant
Price
AtCurrent
Price
AtConstant
Price
Sl.No.
7 8 9 10 11 12 13 14 1
III
A
(i)
(ii)
(iii)
(iv)
B
C
D
E
F
751081(11.82)
175189(9.16)
6014(18.01)
398500(21.53)
171378(-3.84)
1491371(5.83)
383776(29.36)
276627(12.83)
712501(1.65)
1933121(32.08)
5548477(15.90)
11268796(17.41)
37053(15.96)
786621(28.43)
146012(17.61)
3355(16.05)
234359(7.94)
402895(50.16)
1031174(-3.41)
380224(20.11)
203173(8.24)
521863(2.52)
1231855(20.07)
4154910(11.71)
7486046(7.26)
24615(5.93)
817724(8.87)
176030(0.48)
6644(10.48)
435448(9.27)
199602(16.47)
1659783(11.29)
464795(21.11)
299671(8.33)
767025(7.65)
2198205(13.71)
6207203(11.87)
12582007(11.65)
40863(10.28)
838459(6.59)
150263(2.91)
3491(4.05)
247536(5.62)
437169(8.51)
1060710(2.86)
445841(17.26)
215262(5.95)
539119(3.31)
1312955(6.58)
4412346(6.20)
7885109(5.33)
25608(4.03)
92907813.62)
190597(8.28)
7825(17.78)
500983(15.05)
229673(15.07)
1767597(6.5)
556823(19.80)
329909(10.09)
898682(17.16)
2672132(21.56)
7154221(15.26)
14162134(12.56)
45440(11.20)
884657(5.51)
157267(4.66)
3634(4.10)
263890(6.61)
459866(5.19)
1100743(3.77)
514932(15.50)
228379(6.09)
568345(5.42)
1460085(11.21)
4757141(7.81)
8363023(6.06)
26833(4.78)
671704(18.55)
160486(3.02)
5096(25.61)
327903(24.23)
178219(24.79)
1409263(10.60)
296680(21.60)
245164(11.49)
700902(32.58)
1463587(22.63)
4787300(18.88)
9597457(18.38)
31952(16.89)
612470(13.04)
124152(-22.14)
2891(4.35)
217120(10.25)
268307(46.89)
1067608(6.21)
316556(12.47)
187699(7.11)
509041(17.70)
1025908(8.59)
3719282(10.01)
6979389(9.00)
23236(7.63)
P - Provisional; Q - Quick Estimate.
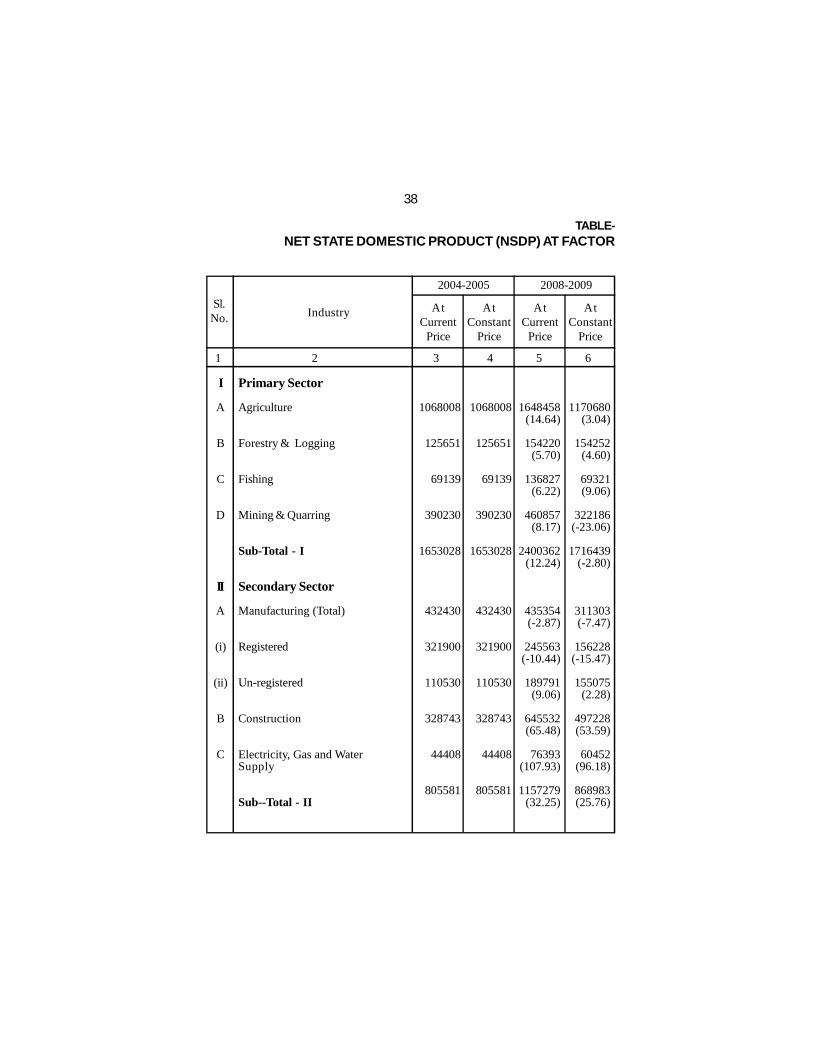
38
TABLE-NET STATE DOMESTIC PRODUCT (NSDP) AT FACTOR
Primary Sector
Agriculture
Forestry & Logging
Fishing
Mining & Quarring
Sub-Total - I
Secondary Sector
Manufacturing (Total)
Registered
Un-registered
Construction
Electricity, Gas and WaterSupply
Sub--Total - II
I
A
B
C
D
II
A
(i)
(ii)
B
C
Industry
2008-20092004-2005
AtCurrent
Price
AtConstant
Price
AtCurrent
Price
AtConstant
Price
Sl.No.
1 2 3 4 5 6
1068008
125651
69139
390230
1653028
432430
321900
110530
328743
44408
805581
1068008
125651
69139
390230
1653028
432430
321900
110530
328743
44408
805581
1648458(14.64)
154220(5.70)
136827(6.22)
460857(8.17)
2400362(12.24)
435354(-2.87)
245563(-10.44)
189791(9.06)
645532(65.48)
76393(107.93)
1157279(32.25)
1170680(3.04)
154252(4.60)
69321(9.06)
322186(-23.06)
1716439(-2.80)
311303(-7.47)
156228(-15.47)
155075(2.28)
497228(53.59)
60452(96.18)
868983(25.76)

39
2.02COST BY INDUSTRY OF ORIGIN, ASSAM. (at 2004-05 price)
Contd...
(Rs. in Lakh)
2009-2010 2012-2013(Q)2011-2012(P)2010-2011
AtCurrent
Price
AtConstant
Price
AtCurrent
Price
AtConstant
Price
AtCurrent
Price
AtConstant
Price
AtCurrent
Price
AtConstant
Price
Sl.No.
7 8 9 10 11 12 13 14 1
2586052(12.34)
208495(17.71)
207402(2.63)
638108(11.68)
3640057(11.91)
960743(14.78)
715246(15.39)
245497(13.05)
997255(7.31)
84036(9.79)
2042034(10.81)
1340981(4.59)
176132(5.59)
78471(6.55)
290957(0.12)
1886541(4.04)
452733(2.58)
272673(0.78)
180060(5.42)
570074(4.25)
35717(-7.59)
10585243.08)
2878592(11.31)
222363(6.65)
224800(8.39)
712020(11.58)
4037775(10.93)
1043087(8.57)
763784(6.79)
279303(13.77)
1065746(6.87)
83701(-0.4)
2192534(7.37)
1396135(4.11)
181423(3.00)
83117(5.92)
289997(-0.33)
1950672(3.40)
460458(1.71)
277700(1.84)
182758(1.50)
594713(4.32)
32952(-7.74)
10881232.80)
I
A
B
C
D
II
A
(i)
(ii)
B
C
2002319(21.47)
164761(6.84)
156525(14.40)
520609(12.97)
2844214(18.49)
602884(38.48)
413577(68.42)
189307(-0.25)
712545(10.38)
70978(-7.09)
1386407(19.80)
1244862(6.34)
162014(5.03)
79891(15.25)
309232(-4.02)
1795999(4.64)
420459(35.06)
256257(64.03)
164202(5.89)
540030(8.61)
46682(-22.78)
1007171(15.90)
2302085(14.97)
177123(7.50)
202084(29.11)
571395(9.76)
3252687(14.36)
837014(38.83)
619851(49.88)
217163(14.71)
929293(30.42)
76545(7.84)
184285232.92)
1282175(3.00)
166803(2.96)
73644(-7.82)
290608(-6.02)
1813230(0.96)
441359(4.97)
270564(5.58)
170795(4.02)
546851(1.26)
38652(-17.2)
1026862(1.96)
P - Provisional; Q - Quick Estimate.

40
(...Contd) TABLE-
Tertiary Sector
Transport, Storage and Communi-cation (Total)
Railways
Storage
Transport by other means
Communication
Trade, Hotels & Restaurants
Banking & Insurance
Real Estate, ownership ofDwelling & Business Services
Public Administration
Other Services
Sub-Total - III
TOTAL NSDP
PER CAPITA NSDP (Rs.)
III
A
(i)
(ii)
(iii)
(iv)
B
C
D
E
F
Industry
2008-20092004-2005
AtCurrent
Price
AtConstant
Price
AtCurrent
Price
AtConstant
Price
Sl.No.
1 2 3 4 5 6
264518
54980
2371
140400
66767
730861
158850
103593
275000
726643
2259465
4718074
16782
264518
54980
2371
140400
66767
730861
158850
103593
275000
726643
2259465
4718074
16782
451961(7.05)
100273(-15.14)
3692(6.37)
231874(15.78)
116122(15.82)
1223220(11.79)
240116(8.25)
138530(7.84)
437967(23.34)
1098376(9.98)
3590170(11.48)
7147811(14.66)
24099(13.19)
447026(9.30)
115411(10.75)
2486(0.20)
168976(2.99)
160153(15.85)
964412(4.26)
278135(11.88)
113444(-0.30)
358359(18.70)
865498(2.84)
3026874(6.58)
5612296(5.96)
18922(4.61)
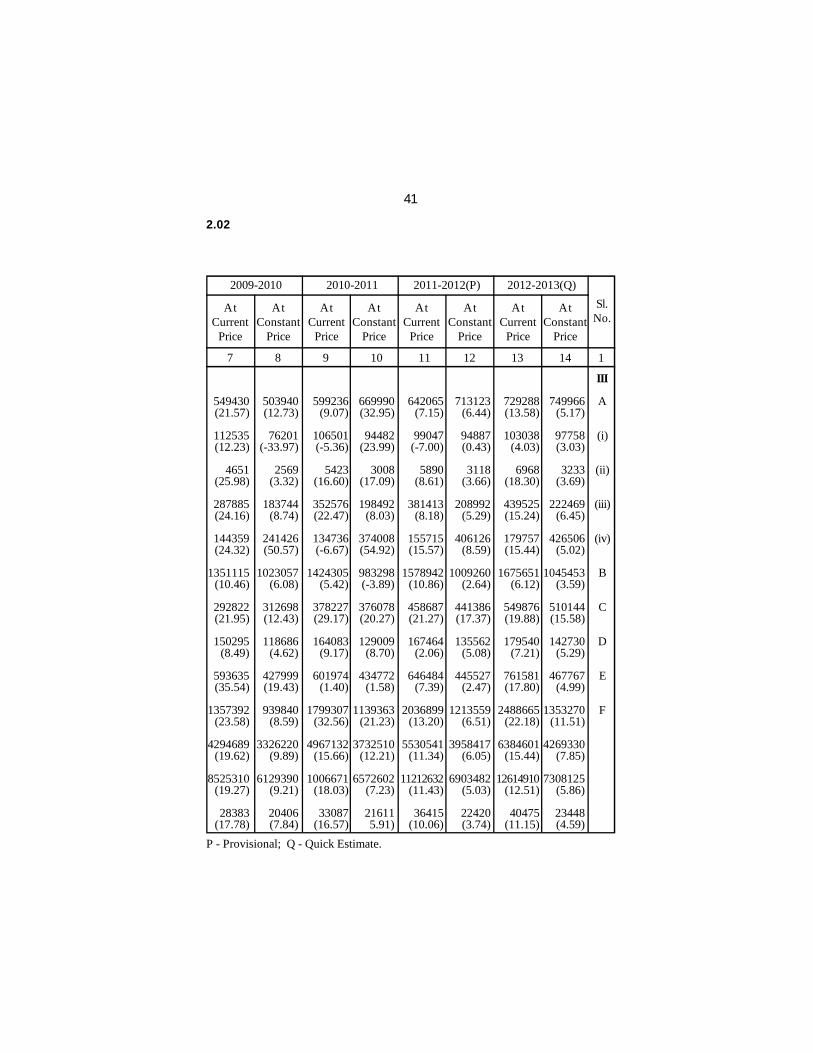
41
2.02
2009-2010 2012-2013(Q)2011-2012(P)2010-2011
AtCurrent
Price
AtConstant
Price
AtCurrent
Price
AtConstant
Price
AtCurrent
Price
AtConstant
Price
AtCurrent
Price
AtConstant
Price
Sl.No.
7 8 9 10 11 12 13 14 1
549430(21.57)
112535(12.23)
4651(25.98)
287885(24.16)
144359(24.32)
1351115(10.46)
292822(21.95)
150295(8.49)
593635(35.54)
1357392(23.58)
4294689(19.62)
8525310(19.27)
28383(17.78)
503940(12.73)
76201(-33.97)
2569(3.32)
183744(8.74)
241426(50.57)
1023057(6.08)
312698(12.43)
118686(4.62)
427999(19.43)
939840(8.59)
3326220(9.89)
6129390(9.21)
20406(7.84)
599236(9.07)
106501(-5.36)
5423(16.60)
352576(22.47)
134736(-6.67)
1424305(5.42)
378227(29.17)
164083(9.17)
601974(1.40)
1799307(32.56)
4967132(15.66)
1006671(18.03)
33087(16.57)
729288(13.58)
103038(4.03)
6968(18.30)
439525(15.24)
179757(15.44)
1675651(6.12)
549876(19.88)
179540(7.21)
761581(17.80)
2488665(22.18)
6384601(15.44)
12614910(12.51)
40475(11.15)
III
A
(i)
(ii)
(iii)
(iv)
B
C
D
E
F
642065(7.15)
99047(-7.00)
5890(8.61)
381413(8.18)
155715(15.57)
1578942(10.86)
458687(21.27)
167464(2.06)
646484(7.39)
2036899(13.20)
5530541(11.34)
11212632(11.43)
36415(10.06)
669990(32.95)
94482(23.99)
3008(17.09)
198492(8.03)
374008(54.92)
983298(-3.89)
376078(20.27)
129009(8.70)
434772(1.58)
1139363(21.23)
3732510(12.21)
6572602(7.23)
216115.91)
713123(6.44)
94887(0.43)
3118(3.66)
208992(5.29)
406126(8.59)
1009260(2.64)
441386(17.37)
135562(5.08)
445527(2.47)
1213559(6.51)
3958417(6.05)
6903482(5.03)
22420(3.74)
749966(5.17)
97758(3.03)
3233(3.69)
222469(6.45)
426506(5.02)
1045453(3.59)
510144(15.58)
142730(5.29)
467767(4.99)
1353270(11.51)
4269330(7.85)
7308125(5.86)
23448(4.59)
P - Provisional; Q - Quick Estimate.

TABLE - 2.03MOVEMENT OF STATE DOMESTIC PRODUCT, ASSAM
AT (2004-05) PRICE
42
Gross State Domestic ProductGSDP (Rs. in Crore)
(i) At Current Price
(ii) At Constant Price
Net State Domestic ProductNSDP (Rs. in Crore)
(i) At Current Price
(ii) At Constant Price
Per Capita GSDP (Rs.)
(i) At Current Price
(ii) At Constant Price
Per Capita NSDP (Rs.)
(i) At Current Price
(ii) At Constant Price
A.
B.
C.
D.
GSDP/NSDP
2004
-05
2009
-10
2010
-11
2011
-12(
P)
2012
-13(
Q)
95975
69794
85253
61294
31952
23236
28383
20406
1 2 3 4 5 6
53398
53398
47181
47181
18993
18993
16782
16782
112688
74860
100627
65726
37053
24615
33087
21611
125820
78851
112126
69035
40863
25608
36415
22420
141621
83630
126149
73081
45440
26833
40475
23448
Source: (Table 2.01 & 2.03) Directorate of Economics and Statistics, Assam.Note:- Figures in brackets shows the growth rate over the previous year.

TABLE - 2.04THE BUDGET AT A GLANCE
43
R. E. = Revised Estimates, B.E. = Budget Estimates.
(Rs. in Lakh)
Receipts
Consolidated Fund
Revenue Account
Capital Account
Total (I)
Contingency Fund Accounts
Public Accounts
Total (II + III)
Total Receipts (A)
Expenditure
Consolidated Fund
Revenue Account
Capital Account
Total (I)
Contingency Fund Account
Public Account
Total (II + III)
Total Expenditure (B)
Transactions during the year (A-B)
Surplus ( + )
Deficit ( - )
Opening balance
Surplus ( + )
Deficit ( - )
Closing balance (C + D)
Surplus ( + )
Deficit ( - )
2012-2013 1(R.E.) 2013-2014 (B.E.)
A.
I.
II.
III.
B.
I.
II.
III.
C.
D.
E.
1 2 3 4
ItemSl.
No.
4583455
4128432
455023
4583455
5000
25529557
25534557
30118012
4855364
3818380
1036984
4855364
5000
25339839
25344839
30200203
(-)82191
(-)53067
(-)135258
4310511
3828635
481876
4310511
30000
23238854
23268854
27579365
4464917
3740100
724817
4464917
30000
23038602
23068602
27533519
45846
(-)98913
(-)53067

TABLE - 2.05REVENUE RECEIPT OF THE GOVERNMENT OF ASSAM
44
(Rs. in Lakh)
2013-14(B.E.)
1
1.1
1.2
1.3
1.4
1.5
1.6
2
2.1
2.2
2.3
2.4
2.5
2.6
2.7
2.8
2.9
2.10
SHARE OF CENTRAL TAXES
Corporation Tax
Income Taxe
Taxes on Wealth
Customs
Union Excise Duties
Service Tax
STATE TAXES
Agricultural Income Tax
Other Taxes on Income & Expenditure
Land Revenue
Stamps & Registration
State Excise
Sales Tax
Taxes on Motor Vehicles
Taxes on Goods & Passengers
Taxes & Duties on Electricity
Other Taxes and Duties on Commodities andServices
2012-13(R.E.)
2011-12(A)
Principal Head
1 2 3 4
Contd...
928353
365412
185613
1410
160962
104157
110799
763823
8327
16427
13971
17515
50335
569396
29370
53639
3667
1176
1069155
386586
228943
996
179231
121522
151877
825031
7000
17247
13215
19267
55368
623814
32307
45873
4779
6161
1262076
436860
270409
1092
203944
143593
206178
898376
7350
18108
14034
21194
60905
683505
36537
48211
4924
3608
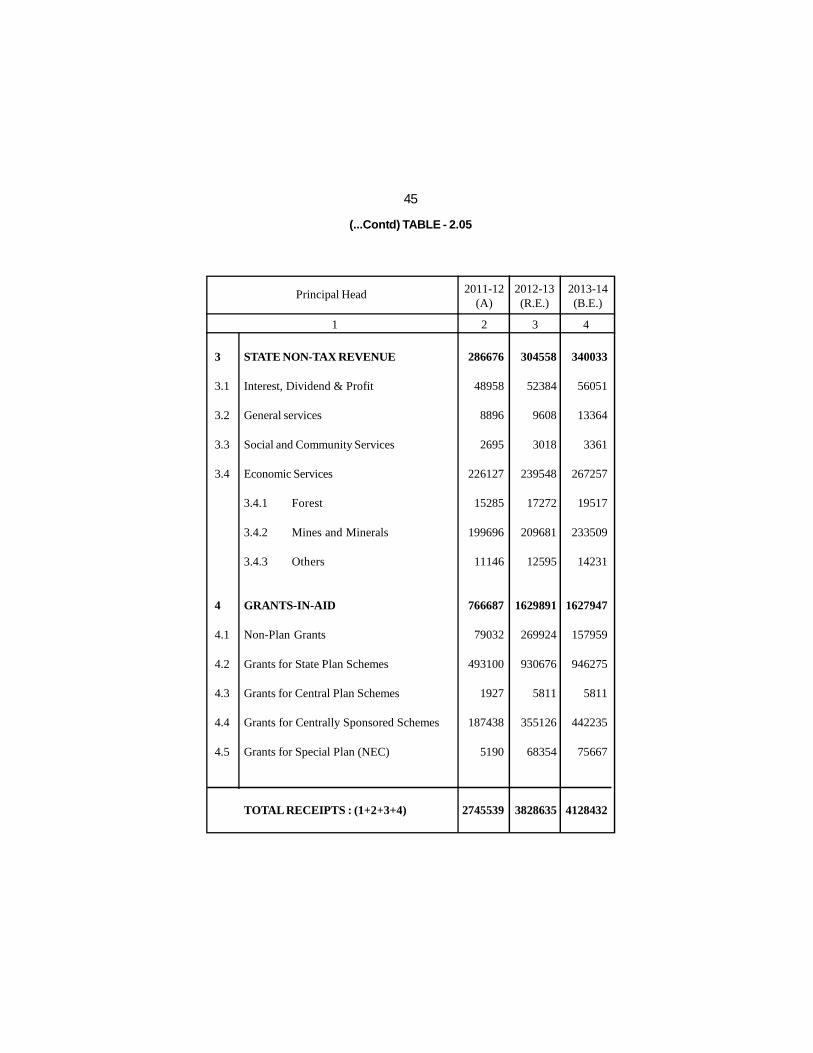
(...Contd) TABLE - 2.05
45
2013-14(B.E.)
3
3.1
3.2
3.3
3.4
4
4.1
4.2
4.3
4.4
4.5
STATE NON-TAX REVENUE
Interest, Dividend & Profit
General services
Social and Community Services
Economic Services
3.4.1 Forest
3.4.2 Mines and Minerals
3.4.3 Others
GRANTS-IN-AID
Non-Plan Grants
Grants for State Plan Schemes
Grants for Central Plan Schemes
Grants for Centrally Sponsored Schemes
Grants for Special Plan (NEC)
TOTAL RECEIPTS : (1+2+3+4)
2012-13(R.E.)
2011-12(A)
Principal Head
1 2 3 4
286676
48958
8896
2695
226127
15285
199696
11146
766687
79032
493100
1927
187438
5190
2745539
304558
52384
9608
3018
239548
17272
209681
12595
1629891
269924
930676
5811
355126
68354
3828635
340033
56051
13364
3361
267257
19517
233509
14231
1627947
157959
946275
5811
442235
75667
4128432

TABLE - 2.06REVENUE EXPENDITURE OF THE GOVERNMENT OF ASSAM
46
(Rs. in Lakh)
2013-14(B.E)
1
1.1
1.2
1.3
1.4
1.5
2
2.1
2.2
2.3
3
3.1
3.2
3.3
3.4
3.5
3.6
4
GENERAL SERVICES
Organs of State
Fiscal Services
Interest, Payments & Servicing of Debts.
Administrative Services
Pension & Miscellaneous services
SOCIAL AND COMMUNITY SERVICES
Education, Sports, Art & Culture
Medical, Family Planning, Public Health &
Sanitation
Others
ECONOMIC SERVICES
General Economic Services
Agriculture and Allied Services
Industry and Minerals
Water and Power Development
Transpot and Communication
Other Economic Services
GRANTS-IN-AID & CONTRIBUTION
TOTAL EXPENDITURE (1+2+3+4)
2012-13(R.E)
2011-12(A)
Principal Heads
1 2 3 4
970773
24801
25932
220750
360061
339229
1027717
613264
412213
2240
409811
25639
119182
31909
59426
72606
101049
244554
2652855
1066355
36019
37990
231563
451736
309047
1557500
914301
640482
2717
714668
64746
226281
42374
76625
92372
212270
401577
3740100
1081022
41920
40522
240691
441064
316825
1593232
952009
637835
3388
730589
70700
226282
55721
86385
100588
190913
413537
3818380
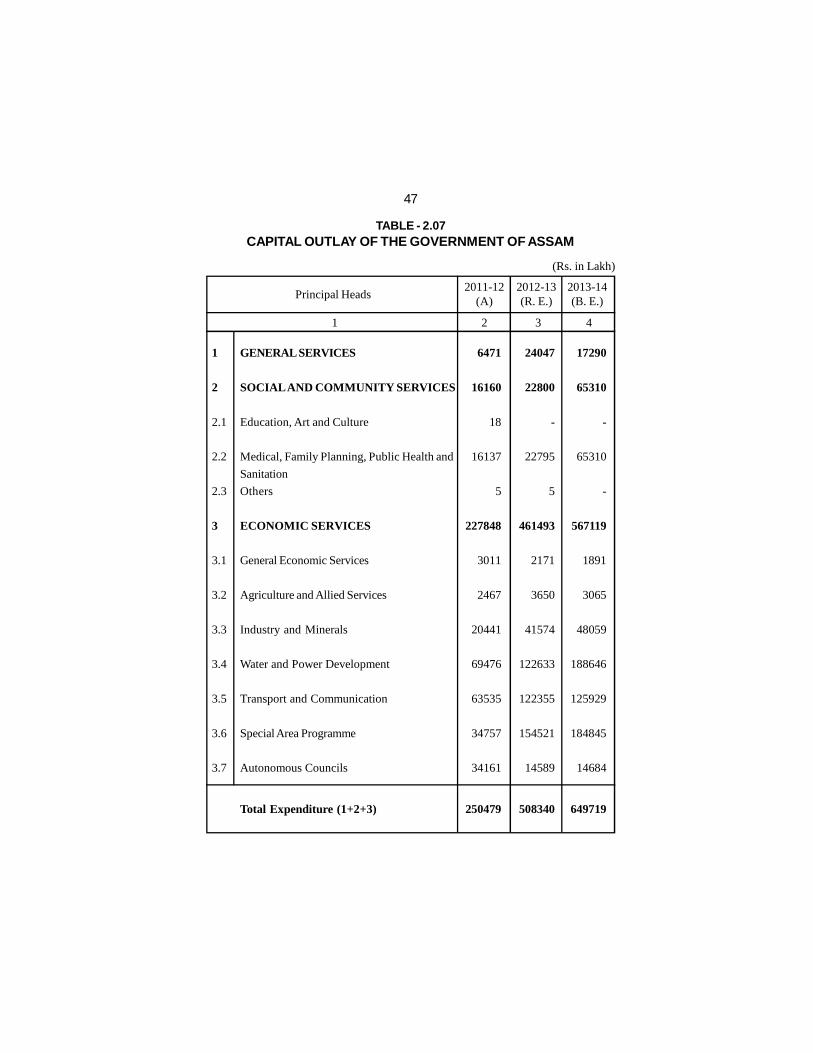
TABLE - 2.07CAPITAL OUTLAY OF THE GOVERNMENT OF ASSAM
47
(Rs. in Lakh)
2013-14(B. E.)
1
2
2.1
2.2
2.3
3
3.1
3.2
3.3
3.4
3.5
3.6
3.7
GENERAL SERVICES
SOCIAL AND COMMUNITY SERVICES
Education, Art and Culture
Medical, Family Planning, Public Health and
Sanitation
Others
ECONOMIC SERVICES
General Economic Services
Agriculture and Allied Services
Industry and Minerals
Water and Power Development
Transport and Communication
Special Area Programme
Autonomous Councils
Total Expenditure (1+2+3)
2012-13(R. E.)
2011-12(A)
Principal Heads
1 2 3 4
6471
16160
18
16137
5
227848
3011
2467
20441
69476
63535
34757
34161
250479
24047
22800
-
22795
5
461493
2171
3650
41574
122633
122355
154521
14589
508340
17290
65310
-
65310
-
567119
1891
3065
48059
188646
125929
184845
14684
649719
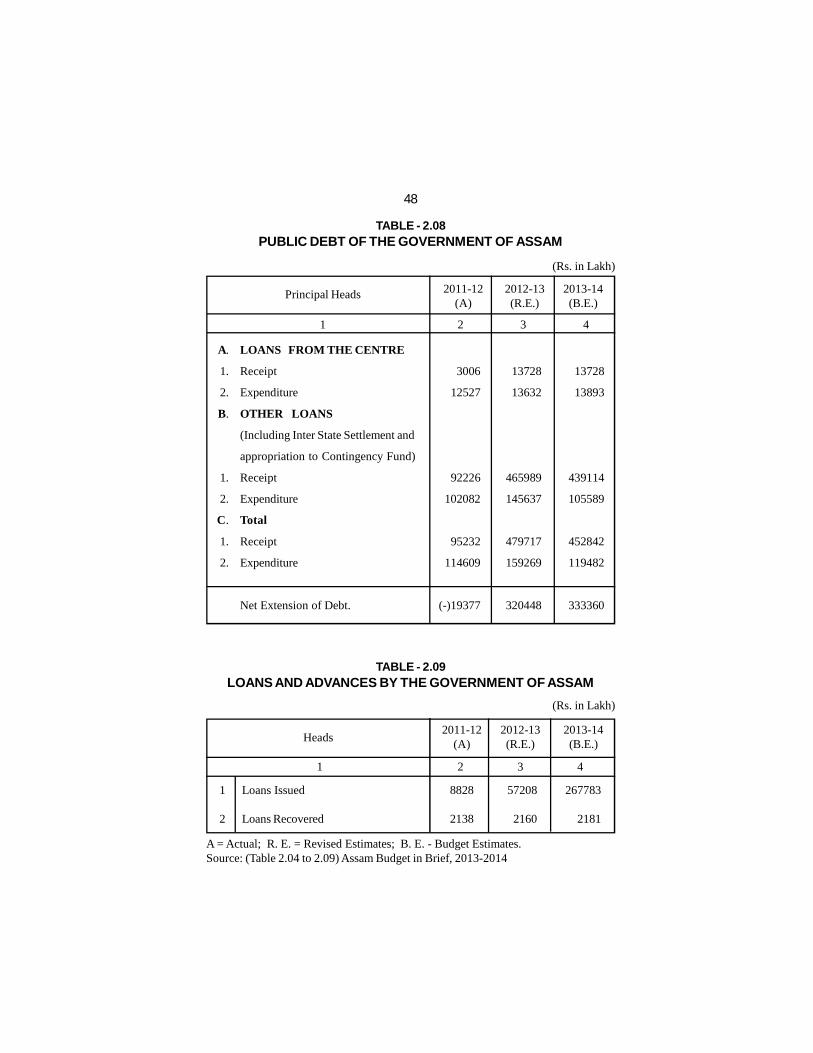
TABLE - 2.08PUBLIC DEBT OF THE GOVERNMENT OF ASSAM
48
A = Actual; R. E. = Revised Estimates; B. E. - Budget Estimates.Source: (Table 2.04 to 2.09) Assam Budget in Brief, 2013-2014
(Rs. in Lakh)
TABLE - 2.09LOANS AND ADVANCES BY THE GOVERNMENT OF ASSAM
(Rs. in Lakh)
2013-14(B.E.)
A.
1.
2.
B.
1.
2.
C.
1.
2.
LOANS FROM THE CENTRE
Receipt
Expenditure
OTHER LOANS
(Including Inter State Settlement and
appropriation to Contingency Fund)
Receipt
Expenditure
Total
Receipt
Expenditure
Net Extension of Debt.
2012-13(R.E.)
2011-12(A)
Principal Heads
2013-14(B.E.)
1
2
Loans Issued
Loans Recovered
2012-13(R.E.)
2011-12(A)
Heads
1 2 3 4
1 2 3 4
3006
12527
92226
102082
95232
114609
(-)19377
13728
13632
465989
145637
479717
159269
320448
13728
13893
439114
105589
452842
119482
333360
8828
2138
57208
2160
267783
2181

TABLE - 2.10ACTWISE REVENUE RECEIPT IN ASSAM
Figure in bracket shows the percentage share to the total tax Revenue.Source: Commissionerate of Taxes, Assam.
(Rs. in Crore)
2011-12
5181.44(78.46)
512.51(7.76)
164.27(2.49)
5.87 (0.09)
5.89
(0.09)
518.75(7.85)
36.67
(0.55)
83.27(1.26)
95.64
(1.45)
6604.31(100.00)
1
2
3
4
5
6
7
8
9
The Assam Value Added Tax Act. 2003
The Central Sales Tax Act. 1956
The Assam Professions, Trades, Calling andEmployments Taxation Act. 1947
The Assam Amusement & Betting Tax Act. 1939
The Assam Taxation on Luxuries (Hotel & Lodging
House) Act. 1989
The Assam Entry Tax, 2008 (w.e.f. 1.6.2008)
The Assam Electricity Duty Act. 1964
The Assam Agricultural Income Tax Act, 1939
The Assam Taxation (On Specified Lands) Act, 1990
Taxation Acts
1 2 3
Total
2012-13
5689.88(80.70)
533.25
(7.56)
168.31(2.39)
63.07
(0.90)
8.04(0.11)
364.14
(5.17)
41.82(0.59)
82.33
(1.17)
99.72(1.41)
7050.56
(100.00)
49
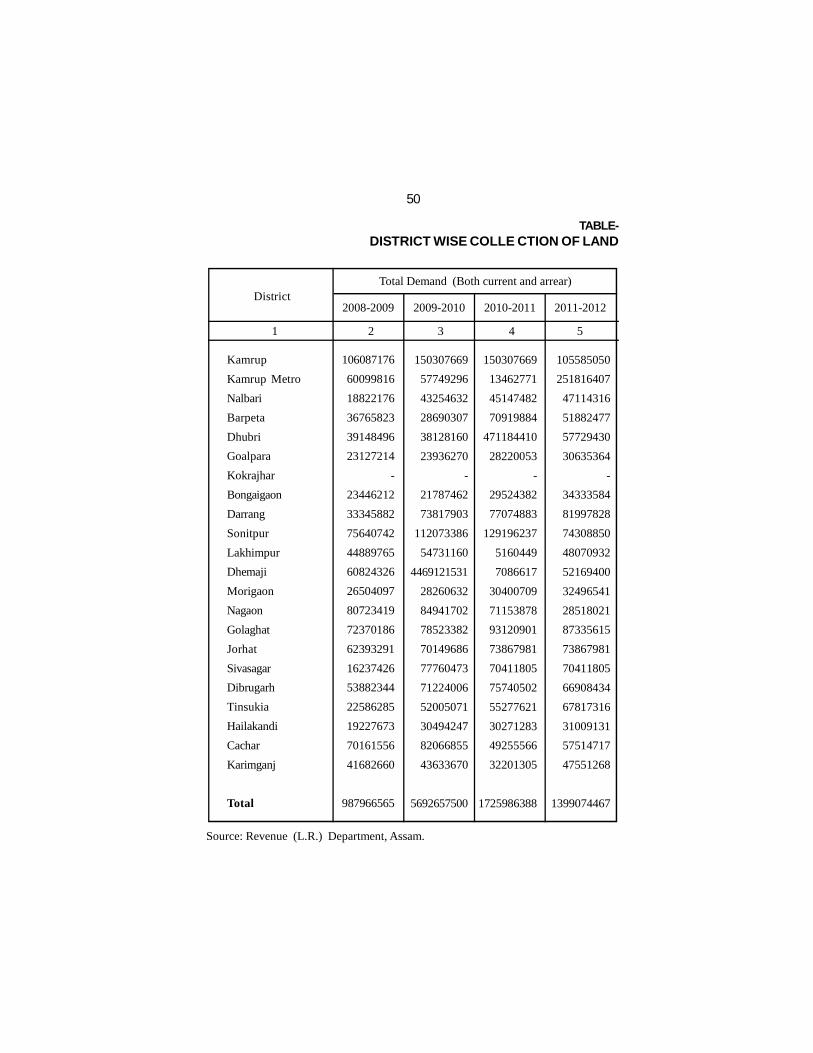
TABLE-DISTRICT WISE COLLE CTION OF LAND
50
Source: Revenue (L.R.) Department, Assam.
Kamrup
Kamrup Metro
Nalbari
Barpeta
Dhubri
Goalpara
Kokrajhar
Bongaigaon
Darrang
Sonitpur
Lakhimpur
Dhemaji
Morigaon
Nagaon
Golaghat
Jorhat
Sivasagar
Dibrugarh
Tinsukia
Hailakandi
Cachar
Karimganj
Total
District
1 2 3 4 5
106087176
60099816
18822176
36765823
39148496
23127214
-
23446212
33345882
75640742
44889765
60824326
26504097
80723419
72370186
62393291
16237426
53882344
22586285
19227673
70161556
41682660
987966565
150307669
57749296
43254632
28690307
38128160
23936270
-
21787462
73817903
112073386
54731160
4469121531
28260632
84941702
78523382
70149686
77760473
71224006
52005071
30494247
82066855
43633670
5692657500
150307669
13462771
45147482
70919884
471184410
28220053
-
29524382
77074883
129196237
5160449
7086617
30400709
71153878
93120901
73867981
70411805
75740502
55277621
30271283
49255566
32201305
1725986388
105585050
251816407
47114316
51882477
57729430
30635364
-
34333584
81997828
74308850
48070932
52169400
32496541
28518021
87335615
73867981
70411805
66908434
67817316
31009131
57514717
47551268
1399074467
2008-2009 2009-2010 2010-2011 2011-2012
Total Demand (Both current and arrear)

2.11REVENUE IN PLAIN DISTRICTS OF ASSAM
51
Kamrup
Kamrup Metro
Nalbari
Barpeta
Dhubri
Goalpara
Kokrajhar
Bongaigaon
Darrang
Sonitpur
Lakhimpur
Dhemaji
Morigaon
Nagaon
Golaghat
Jorhat
Sivasagar
Dibrugarh
Tinsukia
Hailakandi
Cachar
Karimganj
Total
District
6 7 8 9 1
57156523
76254893
3445705
3132850
5607160
768937
-
3463426
4044677
11448856
3609498
22398638
3883995
19063897
3815880
9679423
2771116
9853484
5627553
2624969
10344095
3092229
262087804
5224994
4384138
4653530
3570910
6509597
3432938
-
2990482
46373631
36428576
12275925
8225604
3745493
15687996
9747070
12106957
18994759
25683747
6666593
5617685
13628035
3166421
249115027
5224994
65182006
2704115
17455237
7910252
2870223
-
4420354
50397333
31329322
6023412
3843681
3664682
12607120
12695384
17414302
17486821
21393659
6447170
4656872
16486746
1559867
311773552
23633188
63687233
3370602
5702339
8126421
4234703
-
4773784
57115755
16312142
6003237
4282455
4472514
6568709
6992229
17414302
17486821
23922788
6987984
5815089
11052101
3457619
301412015
2008-2009 2009-2010 2010-2011 2011-2012
Total collection (Both current and arrear)
(Rs. in Lakh)

3.PLANNINGFIGURE AT A GLANCE
Revised Outlay for Annual Plan, 2012-13
Approved Outlay for Annual Plan, 2013-14
Projected Outlay for Twelfth Five Year Plan, 2012-17
Expenditure for Annual Plan (Eleventh Plan) 2011-12
Expenditure for Annual Plan (Twelfth Plan) 2012-13
Rs.10500Crore
Rs. 12500 Crore
Rs. 98672 Crore
Rs.6350.41 Crore
Rs. 7239.14 Crore

TABLE - 3.01STATE PLAN OUTLAY AND EXPENDITURE IN ASSAM
53
(Rs. in Crore)
First Plan
Second Plan
Third Plan
Three Annual Plans
Fourth Plan
Fifth Plan
Annual Plan
Sixth Plan
Seventh Plan
Annual Plan
Annual Plan
Eight Plan
Ninth Plan
Tenth Plan
*Annual Plan
*Annual Plan
*Annual Plan
*Annual Plan
*Annual Plan
**Annual Plan
**Annual Plan
Plan Ref. YearCentral
AssistanceActual
ExpenditureApproved
Outlay
1951-56
1956-61
1961-66
1966-69
1969-74
1974-79
1979-80
1980-85
1985-90
1990-91
1991-92
1992-97
1997-02
2002-07
2007-08
2008-09
2009-10
2010-11
2011-12
2012-13
2013-14
21.67
57.94
120.00
89.25
223.75
473.84
155.00
1115.00
2100.00
675.00
800.00
4672.00
8245.28
10927.53
3496.24
5318.66
6207.31
7799.68
9000.00
10500.00
12500.00
28.00
63.13
132.24
87.12
198.41
428.63
159.73
1279.79
2489.57
596.62
695.50
4968.64
5934.78
9816.18
2451.62
3734.34
5023.09
6860.31
6350.41
7239.14
--
22.00
30.59
99.87
84.22
173.47
242.16
112.76
1225.67
2065.08
N.A.
N.A.
N.A.
N.A.
N.A.
--
--
--
--
--
--
--
1 2 3 4 5
* Eleventh Five Year Plan.** Twelfth Five Year Plan

TABLE - 3.02SECTOR-WISE OUTLAY AND EXPENDITURE OF ANNUAL AND
TWELFTH FIVE YEAR PLAN, ASSAM
54
(Rs. in Lakh)
Contd...
Agriculture and
Allied Service
Rural Develop-
ment
Special Area pro-
gramme(includes
other areas Plan)
Irrigation and
Flood Control
Energy
Industry &
Minerals
Transport
Heads of DevelopmentSector Revised
Outlay
Outlay forAnnual Plan
2013-14Expenditure
G
H
T
G
H
T
G
H
T
G
H
T
G
H
T
G
H
T
G
H
T
1 2 3 4 5
1.
2.
3.
4.
5.
6.
7.
Annual Plan 2012-13 Outlay for12th FiveYear Plan
2012-17(P)
84213.14
11654.41
95867.55
82266.88
2351.71
84618.59
143317.70
33.30
143351.00
163556.04
6068.26
169624.30
41648.76
15.54
41664.30
16281.45
1957.55
18239.00
105171.45
7546.45
112717.90
70909.42
11654.41
82563.83
55948.19
880.71
56828.90
126513.03
33.30
126546.33
41898.08
4178.26
46076.34
28047.77
-
28047.77
13673.66
1956.96
15630.62
73083.74
7525.36
80609.10
106717.98
13483.00
120200.98
83489.00
2589.00
86078.00
166594.00
439.00
167033.00
151603.57
6464.00
158067.57
66449.86
18.00
66467.86
19648.00
2340.00
21988.00
124165.43
8330.40
132495.83
498211.35
83814.00
582025.35
633809.00
19716.00
653525.00
1905527.00
7337.00
1912864.00
1387991.48
43798.00
1431789.48
783877.00
125.00
784002.00
192685.86
15377.00
208062.86
872352.00
67692.00
940044.00

(...Contd) TABLE - 3.02
55
G = General Area; H = Hill Area; T = Total, P= ProjectedSource: (Table 3.01 and 3.02) (i) Planning and Development Department, Assam. (ii) Development Commissioner for Hill areas, Assam.
Communication
Science Technol-
ogy and Environ-
ment
General Eco-
nomic Service
Social Service
General Service
Heads of DevelopmentSector
G
H
T
G
H
T
G
H
T
G
H
T
G
H
T
G
H
T
1 2 3 4 5
8.
9.
10.
11.
12.
GRAND
TOTAL
RevisedOutlay
Expenditure
Annual Plan 2012-13 Outlay forAnnual Plan
2013-14
Outlay for12th FiveYear Plan
2012-17(P)
5372.00
-
5372.00
1420.90
11.10
1432.00
27461.45
1123.55
28585.00
274578.69
12370.47
286949.16
59204.54
2374.66
61579.20
1004493.00
45507.00
1050000.00
3575.68
-
3575.68
1323.46
-
1323.46
25435.64
835.05
26270.69
191950.05
12174.42
204124.47
51942.37
374.66
52317.03
684301.09
39613.13
723914.22
6719.00
-
6719.00
1419.00
13.00
1432.00
43783.73
1235.00
45018.73
305570.32
14261.60
319831.92
122231.11
2436.00
124667.11
1198391.00
51609.00
1250000.00
90775.00
-
90775.00
109407.90
87.00
109494.90
392649.50
9196.00
401845.50
2263468.93
114368.00
2377836.93
371911.00
3012.00
374923.00
9502666.02
364522.00
9867188.02

TABLE - 3.03ANNUAL PLAN ALLOCATION OF ASSAM, 1990-91 to 2012-13
56
Ref. Year% of Actual
Expenditure toApproved Outlay
Actual Expenditure(Rs. in Crore)
Approved Outlay(Rs. in Crore)
1990-1991
1991-1992
1992-1993
1993-1994
1994-1995
1995-1996
1996-1997
1997-1998
1998-1999
1999-2000
2000-2001
2001-2002
675.00
(6.4)
805.00
(6.8)
960.00
(7.4)
1027.00
(6.8)
1051.00
(6.0)
1418.32
(7.3)
1434.00
(6.8)
1510.28
(6.6)
1650.00
(6.5)
1750.00
(5.0)
1520.00
(4.1)
1710.00
(4.5)
596.57
695.50
655.44
862.19
1042.82
1203.98
1101.62
1283.18
1293.67
1404.59
1481.38
1628.21
88.40
86.40
68.30
84.00
99.20
84.90
76.80
85.00
78.40
80.30
97.50
95.20
1 2 3 4
NB: Figures in bracket shows the percentage of GSDP (at Current price) Contd...

(...Contd) TABLE - 3.0357
Ref. YearActual Expenditure
(Rs. in Crore)Approved Outlay
(Rs. in Crore)
2002-2003
2003-2004
2004-2005
2005-2006
2006-2007
2007-2008
2008-2009
2009-2010
2010-2011
2011-2012
2012-2013
1750.00
(4.0)
1780.00
(3.8)
2175.00
(4.1)
3000.00
(5.1)
3798.00
(5.9)
3800.00
(5.3)
5011.51
(6.2)
6000.00
(6.3)
7645.00
(6.8)
9000.00
(7.2)
10500.00
(7.4)
1422.17
1456.34
1796.01
1868.70
2758.48
2669.28
3593.78
5023.09
6883.09
9000(A)
--
81.30
81.80
82.60
62.30
72.60
70.20
71.70
83.70
90.00
100.00(A)
N.A.
1 2 3 4
% of ActualExpenditure to
Approved Outlay
A - Anticipated.Source: Planning Commission of India.

4.PRICEFIGURE AT A GLANCE, 2012-13
Wholesale Price Index for Agricultural Commodities
(Base 1993-94=100)
C P I for Industrial Workers
(Base 2001=100)
C P I for Working Class Population
(Base 2001=100)
C P I for Agricultural Labour (General)
(Base 1986-87=100)
C P I for Rural Population
(Base 1999-2000=100)
296
198
197
682
243

(Base 1982=100) (Base 2001=100)
748
808
883
950
926
912
917
917
926
936
946
970
979
994
1008
998
648
678
719
786
745
745
748
745
759
770
774
788
821
850
872
854
644
687
735
789
772
772
772
764
764
768
780
800
808
824
844
824
686
732
789
822
826
820
823
819
827
835
844
864
879
898
916
901
TABLE- 4.01CONSUMER PRICE INDEX NUMBER FOR WORKING CLASS
POPULATION IN ASSAM
59
Source: Directorate of Economics & Statistics, Assam.
Year/Month
2010 (Annual Average)
2011 (Annual Average)
2012 (Annual Average)
2013 (Annual Average)
Jan’13
Feb’13
Mar’13
Apr’13
May’13
Jun’13
Jul’13
Aug’13
Sep’13
Oct’13
Nov’13
Dec’13
Guwah
atiSi
lchar
Tinsu
kia
Ass
am
1 2 3 4 5 6 7 8 9
Guwah
atiSi
lchar
Tinsu
kia
Ass
am
156
168
184
193
193
190
191
191
193
195
197
202
204
207
210
208
178
186
197
208
204
204
205
204
208
211
212
216
225
233
239
234
160
170
182
190
191
191
191
189
189
190
193
198
200
204
209
204
164
174
188
197
196
195
195
194
196
198
200
205
209
214
219
215
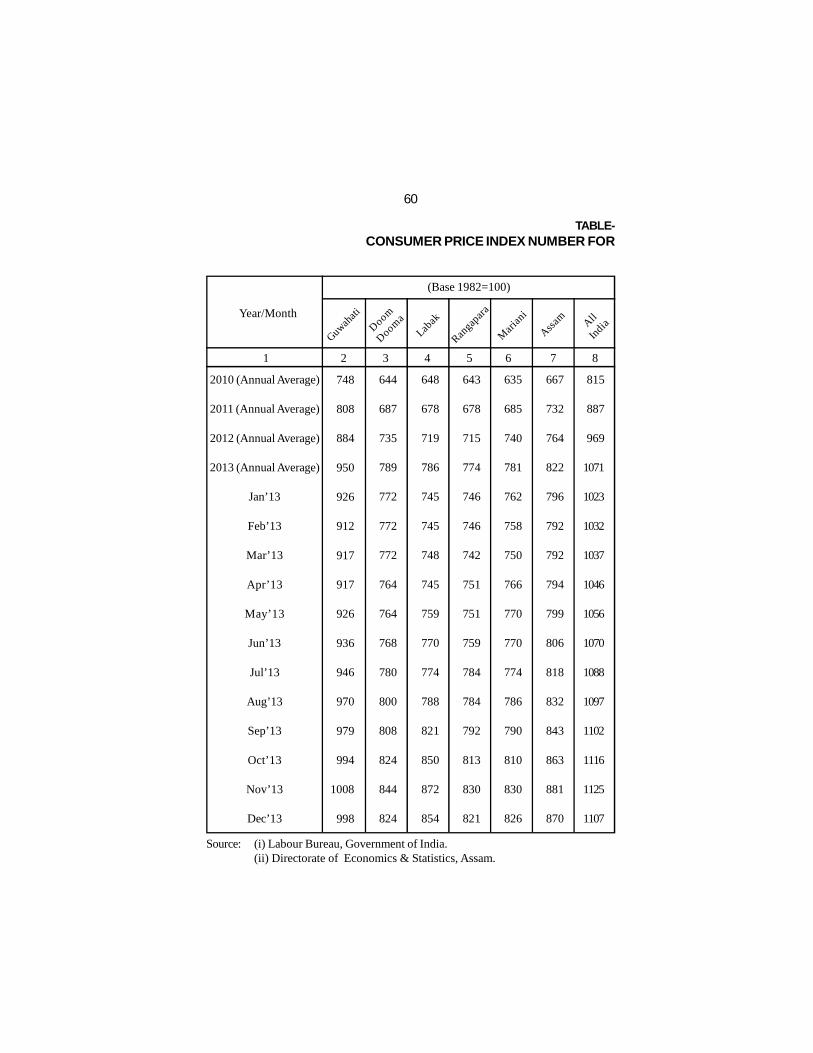
TABLE-CONSUMER PRICE INDEX NUMBER FOR
60
Source: (i) Labour Bureau, Government of India.(ii) Directorate of Economics & Statistics, Assam.
Year/Month
2010 (Annual Average)
2011 (Annual Average)
2012 (Annual Average)
2013 (Annual Average)
Jan’13
Feb’13
Mar’13
Apr’13
May’13
Jun’13
Jul’13
Aug’13
Sep’13
Oct’13
Nov’13
Dec’13
(Base 1982=100)
Guwah
ati
Doom
Dooma
Labak
Ranga
para
748
808
884
950
926
912
917
917
926
936
946
970
979
994
1008
998
643
678
715
774
746
746
742
751
751
759
784
784
792
813
830
821
635
685
740
781
762
758
750
766
770
770
774
786
790
810
830
826
815
887
969
1071
1023
1032
1037
1046
1056
1070
1088
1097
1102
1116
1125
1107
Mar
iani
Assam All
India
644
687
735
789
772
772
772
764
764
768
780
800
808
824
844
824
648
678
719
786
745
745
748
745
759
770
774
788
821
850
872
854
667
732
764
822
796
792
792
794
799
806
818
832
843
863
881
870
1 2 3 4 5 6 7 8

4.02INDUSTRIAL WORKERS IN ASSAM
61
(Base 2001=100)
Ranga
para
Mari
ani
Assam
All Ind
ia
158
171
185
195
190
189
187
191
192
192
193
196
197
202
207
206
161
174
184
198
192
191
191
191
193
194
197
200
203
208
213
210
176
192
209
232
221
223
224
226
228
231
235
237
238
241
243
239
Guwah
ati
Doom
Dooma
Labak
156
168
184
198
193
190
191
191
193
195
197
202
204
207
210
208
160
170
182
196
191
191
191
189
189
190
193
198
200
204
209
204
178
186
197
216
204
204
205
204
208
211
212
216
225
233
239
234
154
163
171
186
179
179
178
180
180
182
188
188
190
195
199
197
9 10 11 12 13 14 15

TABLE - 4.03WHOLE SALE PRICE INDEX OF AGRICULTURAL COMMODITIES
IN ASSAM
62
Source: Directorate of Economics & Statistics, Assam.
(Base 1993-94=100)
April
May
June
July
August
September
October
November
December
January
February
March
AnnualAverage
Period 2012-132011-122010-11
262
263
266
269
270
273
275
275
276
277
278
281
272
286
288
290
295
296
292
283
281
282
282
281
283
287
1 2 3 4
284
285
288
292
295
296
298
300
300
301
303
307
296
(MONTHLY AVERAGE)

TABLE - 4.04CONSUMER PRICE INDEX NUMBER FOR AGRICULTURAL
LABOUR IN ASSAM
63
Source: Labour Bureau, Government of India.
(Base 1986-87=100)
July
August
September
October
November
December
January
February
March
April
May
June
Annual Average
Month(Agricultural year)
Food Group General Index
2010-11 2011-12 2012-13 2010-11 2011-12 2012-13
555
570
581
589
596
598
595
586
586
588
594
600
587
602
612
616
621
617
611
609
611
617
635
644
650
620
550
561
570
577
583
586
585
581
584
588
595
600
580
602
610
614
618
615
611
613
617
623
638
648
652
622
1 2 3 4 5 6 7
666
673
678
685
686
681
689
691
684
678
685
685
682
665
670
674
681
682
681
688
691
688
686
692
691
682

64
Source: Directorate of Economics & Statistics, Assam.
TABLE - 4.05CONSUMER PRICE INDEX NUMBER FOR THE RURAL
POPULATION IN ASSAM
(Base 1999-2000=100)
April
May
June
July
August
September
October
November
December
January
February
March
AnnualAverage
Period20
09-1
0
2012
-13
2011
-12
2010
-11
188
190
189
191
191
192
196
197
198
198
199
200
194
201
201
202
204
204
205
206
207
204
208
206
207
205
209
211
212
216
218
220
223
225
225
226
227
229
220
1 2 3 4 5
231
234
236
238
240
243
245
248
249
250
252
254
243

5.CLIMATEFIGURE AT A GLANCE, 2012
Seasonwise Rainfall (all seasons)ActualNormalDeparture from NormalStatus
Winter SeasonActualNormalDeparture from Normal
Summer SeasonActualNormalDeparture from Normal
Monsoon SeasonActualNormalDeparture from Normal
Post MonsoonActualNormalDeparture from Normal
2151.8mm2295.8mm(-)6.27%Normal
14.5mm48.2mm
(-)69.92%
420.4mm455.2mm(-)7.64%
1555.0mm1523.9mm
2.04%
161.9mm168.5mm(-)2.00%

TABLE-DISTRICT-WISE AVERAGE MONTHLY
66
(-) Not reported by IMD.
District
KokrajharDhubriGoalparaBarpetaMorigaonNagaonSonitpurLakhimpurDhemajiTinsukiaDibrugarhSivasagarJorhatGolaghatKarbi AnglongDima HasaoCacharKarimganjHailakandiBongaigaonChirangKamrupKamrup MetroNalbariBaksaDarrangUdalguri
State Average
January
Normal Actual Normal Actual
1 2 3 4 5 6 7 8
Normal Actual
February MarchSl.No.
123456789101112131415161718192021222324252627
10.910.312.710.318.712.019.427.727.726.630.620.122.216.912.816.713.313.2
7.310.010.012.012.014.910.313.113.1
16.2
3.16.06.08.1
23.99.56.3
11.40.0
23.115.622.79.7
17.83.03.1
18.16.5
12.83.8
10.85.2
13.31.60.00.00.0
8.3
27.911.720.426.924.422.523.148.648.658.453.133.236.729.524.147.550.235.242.031.231.220.820.818.626.921.421.4
32.0
19.514.812.015.9
0.00.03.33.2
-6.85.44.15.2
10.10.00.08.11.08.8
22.812.0
7.60.99.8
--
1.2
6.2
45.846.651.154.051.648.150.076.776.7
131.2119.878.380.165.253.8
158.9168.3169.7123.857.557.558.658.656.754.053.553.5
78.1
4.40.52.73.0
14.812.428.629.932.029.941.737.812.410.6
0.130.5
121.935.033.0
0.71.4
23.32.9
12.013.9
-29.2
22.2

5.01RAINFALL IN ASSAM, 2012
67
Contd...
(In mm)
9 10 11 12 13 14 1
Normal Actual Normal Actual Normal Actual
April May June
123456789
101112131415161718192021222324252627
Sl.No.
216.4147.5196.6175.7116.8128.9144.3165.5165.5215.9229.9126.5204.6135.9106.3207.9262.5340.4239.0183.4183.4151.7151.7184.6175.7168.8168.8
172.9
238.4138.2130.7288.5182.3107.5254.5243.2
43.0319.0322.1346.4255.0213.7111.7
76.9589.7309.1336.2373.7340.6382.2177.2268.9268.3
0.0247.6
234.1
461.1391.6399.8391.5169.1171.3284.1331.9331.9272.7292.4257.1277.4245.6139.4308.0386.4604.0416.2442.0442.0293.4293.4380.7391.5320.0320.0
304.2
321.9199.2154.9211.7106.6
80.7216.1301.9423.0235.7261.5175.1127.1153.2
68.042.6
251.6281.8129.5269.5253.8147.1182.9199.3205.5
24.0215.4
164.1
822.2603.0567.8694.3310.1285.9363.1528.3528.3388.3401.0255.5288.8254.2224.9328.1532.1645.2470.4626.3626.3365.5365.5551.2694.3419.7419.7
427.3
1545.31040.3772.1
1107.9256.4184.6571.9575.2338.0410.8421.8208.2209.7273.4240.4169.6646.0788.9315.1
1256.91430.5564.2396.4991.7955.9381.0228.0
528.8

(...Contd) TABLE-
68
District
KokrajharDhubriGoalparaBarpetaMorigaonNagaonSonitpurLakhimpurDhemajiTinsukiaDibrugarhSivasagarJorhatGolaghatKarbi AnglongDima HasaoCacharKarimganjHailakandiBongaigaonChirangKamrupKamrup MetroNalbariBaksaDarrangUdalguri
State Average
July
Normal Actual Normal Actual Normal Actual
August SeptemberSl.No.
123456789101112131415161718192021222324252627
1 2 3 4 5 6 7 8
864.2554.7502.8757.3374.8326.3384.2605.2605.2515.3519.4374.8390.7314.7238.7270.3526.2646.0426.8776.6776.6345.1345.1470.9757.3345.8345.8
454.2
632.1360.0396.7496.7284.4232.5295.0538.1576.0494.7471.2324.3394.7202.3152.8
2049.4397.3428.9171.8764.8785.5422.2286.9231.3536.6
96.0897.7
471.6
677.1418.7334.6527.3309.2294.1337.9467.6467.6387.2405.1342.3346.9271.4220.5201.3470.8438.0406.9486.8486.8248.7248.7322.0527.3272.1272.1
356.7
262.1282.4109.9225.7241.2190.5256.8369.0366.0327.6283.8281.9242.9268.8199.8
77.9481.9494.6329.5211.5182.3294.4166.0156.9146.1
42.0387.4
248.9
462.9340.1304.9462.1221.4218.6229.2424.1424.1327.0325.9196.9272.7209.3182.9189.1360.8418.7317.0406.4406.4188.4188.4220.2462.1221.5221.5
285.7
631.3467.2336.2443.9250.8280.6253.9453.4587.0556.2407.2208.7225.8244.455.6
262.5327.5295.0307.9564.1586.7184.890.4
265.6400.521.0
518.0
305.7

5.01
69
(In mm)
Normal Actual Normal Actual Normal Actual
October November December
123456789
101112131415161718192021222324252627
Sl.No.
9 10 11 12 13 14 1
0.00.00.00.70.00.01.5
14.514.017.813.04.47.41.50.00.00.00.00.00.01.00.04.71.3
19.20.03.2
3.7
159.5155.1157.7142.1119.3120.0109.7140.3140.3118.7136.996.3
121.7103.7100.1196.4182.4240.4150.6168.2168.2106.6106.6110.4142.195.495.4
131.8
237.4222.9211.5179.056.4
141.1163.5190.7115.0182.8119.745.363.860.6
134.5250.9140.4242.0190.0224.5154.257.777.175.9
187.881.0
195.4
147.9
18.119.221.720.419.921.620.923.023.025.124.020.325.619.626.342.134.886.836.518.718.715.115.121.620.417.217.2
24.9
0.00.00.00.00.05.25.8
11.04.06.26.60.11.10.03.7
47.374.631.731.42.40.70.20.00.3
15.20.09.8
10.3
6.14.15.2
12.78.2
10.812.620.420.418.918.510.315.614.711.211.211.413.29.1
11.611.67.57.54.8
12.79.39.3
11.8

TABLE-MONTH-WISE & AGRO CLIMATIC ZONE WISE
70
Lower
Brahmaputra
North Bank
Plain Zone
Central
Brahmaputra
Upper
Brahmaputra
Barak Valley
Zone
Hills Zone
State Average
Actual
Normal
Deviation (%)
Actual
Normal
Deviation (%)
Actual
Normal
Deviation (%)
Actual
Normal
Deviation (%)
Actual
Normal
Deviation (%)
Actual
Normal
Deviation (%)
Actual
Normal
Deviation (%)
Agro-Climatic Zone
Janu
ary
Feb
ruar
y
Mar
ch
Apr
il
May
June
1 2 3 4 5 6 7
57.90
113.4
(-)48.94
17.70
101.00
(-)82.48
33.40
30.70
8.79
86.7
130.1
(-)33.36
37.4
33.8
10.65
6.1
29.5
(-)79.32
39.87
73.08
(-)45.44
115.30
236.40
(-)51.75
7.70
163.10
(-)95.28
0.00
46.90
(-)100
31.60
210.90
(-)85.02
17.90
127.40
(-)85.95
0.0
71.60
(-)100
43.13
142.72
(-)69.78
64.80
540.4
(-)88.01
119.7
310.4
(-)61.44
27.20
99.70
(-)72.72
132.4
474.6
(-)72.06
189.91
461.8
(-)58.88
30.6
212.7
(-)85.61
94.10
349.93
(-)73.11
2606.7
1766.7
47.55
788.3
812.9
(-)3.03
289.8
245.7
17.95
1456.2
912.8
59.53
1235.0
841.9
46.69
188.6
314.2
(-)39.97
1094.1
815.7
34.13
10061.2
5916.4
70.06
2094.1
2259.1
-7.30
411.00
596.00
-31.04
1523.9
1587.8
-4.02
1750.00
1647.7
6.21
410.00
553.00
-25.86
2708.37
2093.33
29.38
1766.7
2145.8
(-)17.67
1180.4
1587.9
(-)25.66
187.3
340.4
(-)44.98
952.6
1345.2
(-)29.19
662.9
1406.6
(-)52.87
110.6
447.4
(-)75.28
810.08
1212.22
(-)33.17

5.02RAINFALL IN ASSAM DURING 2012
71
(In mm)
July
Aug
ust
Sep
tem
ber
Oct
ober
Nov
embe
r
Dec
embe
r
Lower
Brahmaputra
North Bank
Plain Zone
Central
Brahmaputra
Upper
Brahmaputra
Barak Valley
Zone
Hills Zone
State Average
Actual
Normal
Deviation (%)
Actual
Normal
Deviation (%)
Actual
Normal
Deviation (%)
Actual
Normal
Deviation (%)
Actual
Normal
Deviation (%)
Actual
Normal
Deviation (%)
Actual
Normal
Deviation (%)
Agro-Climatic Zone
8 9 10 11 12 13 1
4912.80
6150.60
-20.12
2402.8
2286.2
5.10
516.9
701.1
-26.27
1887.2
2109.9
-10.56
998.0
1599.0
-37.59
2202.2
509.0
332.65
2153.32
2225.97
-3.26
2037.3
7188.2
-71.66
1421.2
1817.3
-21.80
431.7
603.3
-28.44
1405.0
1752.9
-19.85
1306.0
1315.7
-0.74
277.7
421.8
-34.16
1146.48
2183.2
-47.49
3970.7
3441.9
15.36
1833.3
1510.4
21.38
531.4
440.0
20.77
1642.3
1331.8
23.31
930.4
1096.5
-15.15
318.1
372.0
-14.49
1537.7
1365.43
12.62
1628.0
1414.5
14.93
745.6
561.1
32.88
197.4
239.3
-1751
472.2
577.3
-18.21
572.4
573.4
-0.17
385.4
296.5
29.85
666.83
610.35
9.25
18.8
189.0
-90.05
30.6
101.3
-69.79
5.2
41.5
(-)87.47
14.0
114.6
-87.78
137.7
158.1
-12.90
51.0
68.4
-25.44
42.88
112.15
-61.76
26.9
83.8
(-)64.32
34.2
155.7
(-)78.03
0.0
19.0
(-)100
44.1
78.0
(-)43.46
0.0
33.7
(-)100
0.0
22.4
(-)100
35.07
65.43
(-)46.40

TABLE - 5.03MONTH-WISE RAINFALL PATTERN IN ASSAM DURING 2012
72
(In mm)
January
February
March
April
May
June
July
August
September
October
November
December
Total:
Month Actual
1 2 3 4 5
NormalDeparture
from Normal(%)
Status
8.3
6.2
22.2
234.1
164.1
528.8
471.6
248.9
305.7
147.9
10.3
3.7
2151.8
16.2
32.0
78.1
172.9
304.2
427.3
454.2
356.7
285.7
131.8
24.9
11.8
2295.8
(-)48.77
(-)80.63
(-)71.57
35.40
(-)46.06
23.75
3.83
(-)30.22
7.00
12.22
(-)58.63
(-)68.64
(-)6.27
Deficient
Scanty
Scanty
Excessive
Deficient
Excessive
Normal
Deficient
Normal
Normal
Deficient
Scanty
Normal

TABLE - 5.04SEASON-WISE RAINFALL PATTERN IN ASSAM
PERIOD 2010 TO 2012
73
(In mm)
Winter (Jan. - Feb.)
Summer (March-May)
Monsoon (June-Sept.)
Post Monsoon (Oct.-Dec.)
All Seasons (Jan.-Dec.)
Season
1 2 3 4
2010
Actual
Normal
Deviation (%)
Actual
Normal
Deviation (%)
Actual
Normal
Deviation (%)
Actual
Normal
Deviation (%)
Actual
Normal
Deviation (%)
2.6
45.8
(-)94
776.8
593.9
31
1376.7
1461.2
(-)6
99.2
181.3
(-)45
2255.3
2282.2
(-)1.0
20.4
48.7
(-)58
391.1
555.2
(-)30
1110.0
1523.9
(-)27
45.1
168.5
(-)73
1566.6
2296.3
(-)32.0
Source: (Table 5.01 to 5.04) RMC.IMD, LGBI Airport, Guwahati, through Directorate of Agriculture, Assam.
2011 2012
14.5
48.2
(-)69.92
420.4
555.2
(-)24.28
1555.0
1523.9
2.04
161.9
168.5
(-)3.92
2151.8
2295.8
(-)6.27

6.AGRICULTUREFIGURE AT A GLANCE
Total Operational Holdings, 2010-11 Agricultural Census
Area under Operational Holdings
Average Size of Operational Holding
Operational Holdings (SC)
Area
Average Size
Operational Holding (ST)
Area
Average Size
Total Cropped Area, 2010-11
Net Area Shown
Area under non-agricultural uses
Fallow land
Index number (Base triennium ending 2007-08=100) 2012-13
(i) Area
(ii) Production
(iii) Productivity
2720223 nos.
2999069.95 hect.
1.07 hect.
141279 nos.
151487.74 hect.
1.07 hect.
438160 nos.
516596.57 hect.
1.18 hect.
4159977 hect.
2810597 hect.
2625545 hect.
128164 hect.
107.99
135.70
125.66

Area under Rice, 2012-13
Production of Rice
Average Yield of Rice
Area under Pulses, 2012-13
Production of Pulses
Average Yield of Pulses
Area under Total Foodgrains, 2012-13
Production of Total Foodgrains
Area under Total oilseeds, 2012-13
Production of oil seeds (excluding coconut)
Average Yield of oil seeds
Area under Total Fibres, 2012-13
Production of Fibres
Area under Fruits and Vegetables, 2011-12
Production of Fruits
Consumption of Fertilizer (NPK), 2012-13
Per capita consumption, 2012-13
Contd...
2488 in ‘000 hect.
5128 in ‘000 tonne.
2090 kg./hect.
142 in ‘000 hect.
84 in ‘000 tonne.
597 kg./hect.
2692 ‘000 hect.
5279 in ‘000 tonne.
326 in ‘000 hect.
187 in ‘000 tonne.
610 kg./hect.
71 in ‘000 hect.
584 in ‘000 tonne.
197 in ‘000 hect.
2126 in ‘000 tonne.
216107.73 in tonne.
58.47 kg./hect.

76
TABLE-NUMBER AND AREA OF OPERATIONAL HOLDINGS BY SIZE
Below 0.5
(0.5-1.0)
Marginal
(1.0-2.0)
Small
(2.0-3.0)
(3.0-4.0)
Semi Medium
(4.0-5.0)
(5.0-7.5)
(7.5-10.0)
Medium
(10.0-20.0)
(20.0 & Above)
Large
All Classes
1276931
549149
1826080
492765
492765
201076
98499
299575
48074
30361
4247
82682
1295
219
1514
2702616
1772
2029
3801
3371
3371
2288
1278
3566
735
704
219
1658
138
25
163
12559
832
402
1234
438
438
232
155
387
140
215
174
529
428
2032
2460
5048
1279535
551580
1831115
496574
496574
203596
99932
303528
48949
31280
4640
84869
1861
2276
4137
2720223
Size Class(in Ha.)
No. of Operational Holdings
Individual Joint Institutional Total
1 2 3 4 5
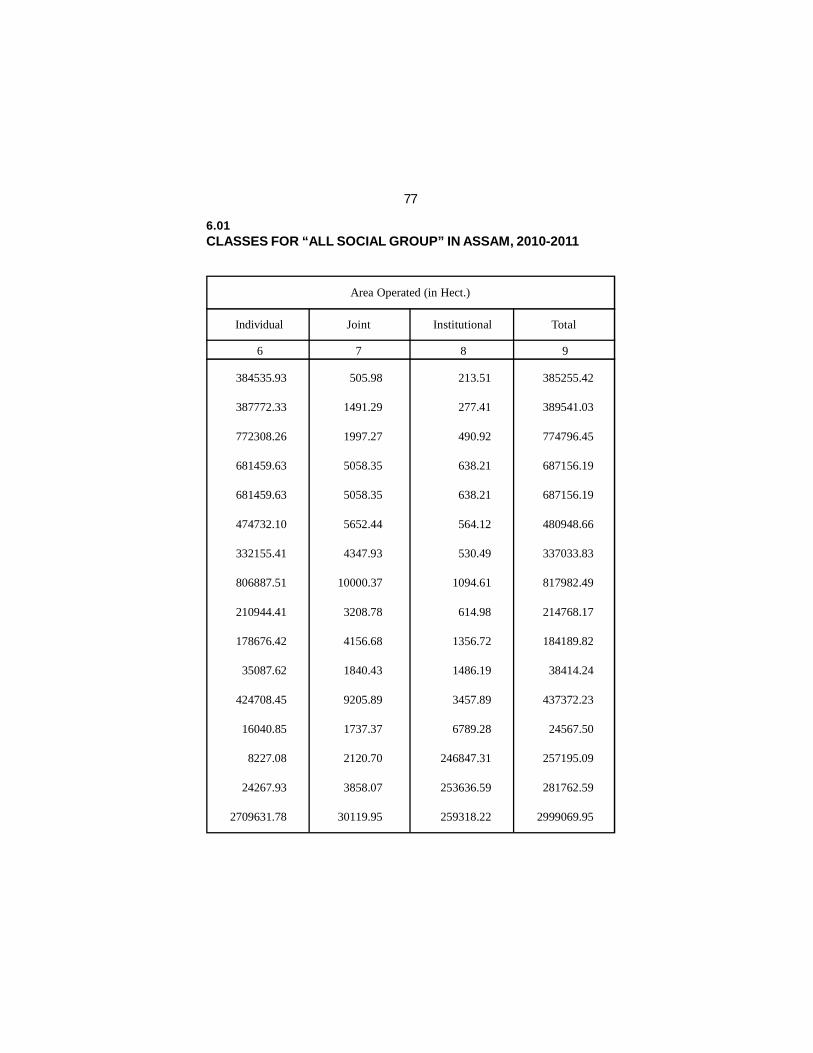
77
6.01CLASSES FOR “ALL SOCIAL GROUP” IN ASSAM, 2010-2011
213.51
277.41
490.92
638.21
638.21
564.12
530.49
1094.61
614.98
1356.72
1486.19
3457.89
6789.28
246847.31
253636.59
259318.22
385255.42
389541.03
774796.45
687156.19
687156.19
480948.66
337033.83
817982.49
214768.17
184189.82
38414.24
437372.23
24567.50
257195.09
281762.59
2999069.95
384535.93
387772.33
772308.26
681459.63
681459.63
474732.10
332155.41
806887.51
210944.41
178676.42
35087.62
424708.45
16040.85
8227.08
24267.93
2709631.78
505.98
1491.29
1997.27
5058.35
5058.35
5652.44
4347.93
10000.37
3208.78
4156.68
1840.43
9205.89
1737.37
2120.70
3858.07
30119.95
Area Operated (in Hect.)
Institutional Total
6 7 8 9
Individual Joint
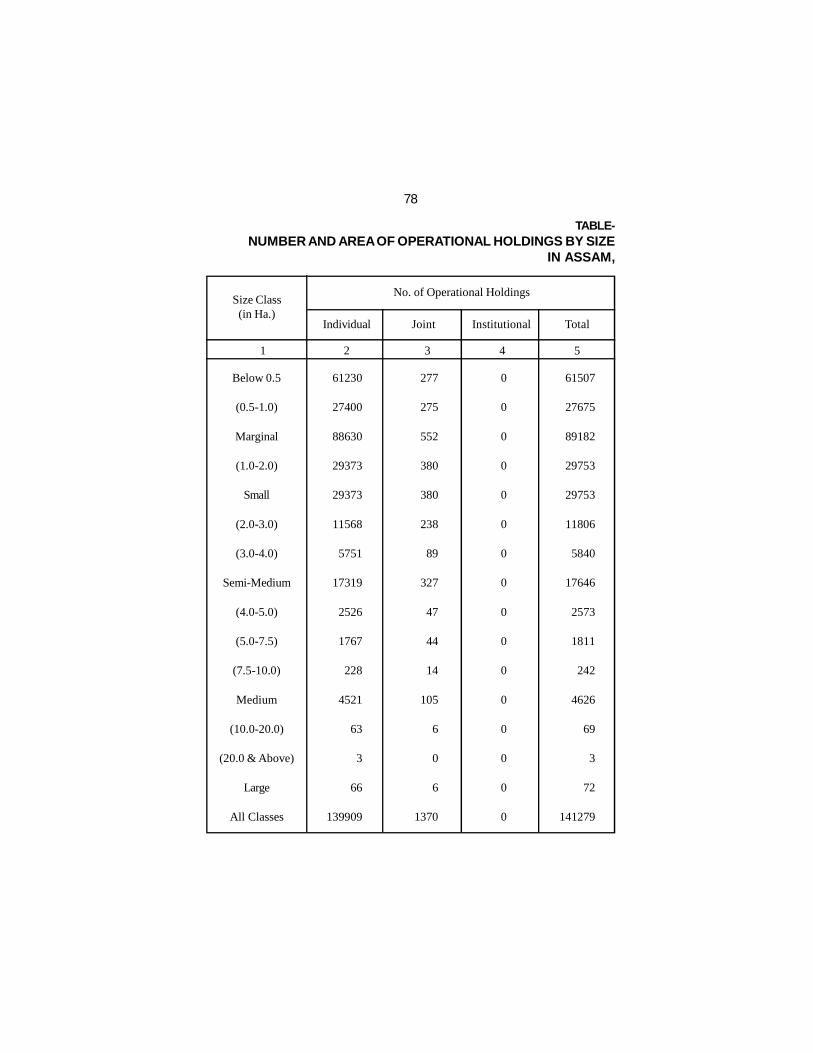
TABLE-NUMBER AND AREA OF OPERATIONAL HOLDINGS BY SIZE
IN ASSAM,
78
Below 0.5
(0.5-1.0)
Marginal
(1.0-2.0)
Small
(2.0-3.0)
(3.0-4.0)
Semi-Medium
(4.0-5.0)
(5.0-7.5)
(7.5-10.0)
Medium
(10.0-20.0)
(20.0 & Above)
Large
All Classes
61230
27400
88630
29373
29373
11568
5751
17319
2526
1767
228
4521
63
3
66
139909
277
275
552
380
380
238
89
327
47
44
14
105
6
0
6
1370
0
0
0
0
0
0
0
0
0
0
0
0
0
0
0
0
61507
27675
89182
29753
29753
11806
5840
17646
2573
1811
242
4626
69
3
72
141279
Size Class(in Ha.)
No. of Operational Holdings
Individual Joint Institutional Total
1 2 3 4 5

6.02CLASSES FOR SOCIAL GROUP “SCHEDULED CASTES”2010-2011
79
0.00
0.00
0.00
0.00
0.00
0.00
0.00
0.00
0.00
0.00
0.00
0.00
0.00
0.00
0.00
0.00
18113.32
19701.80
37815.12
40690.54
40690.54
28296.42
19830.41
48126.83
11317.76
10526.86
2052.19
23896.81
879.79
78.65
958.44
151487.74
18039.26
19499.16
37538.42
40111.46
40111.46
27711.12
19523.22
47234.34
11114.15
10269.16
1941.72
23325.03
796.65
78.65
875.30
149084.55
74.06
202.64
276.70
579.08
579.08
585.30
307.19
892.49
203.61
257.70
110.47
571.78
83.14
0.00
83.14
2403.19
Area Operated (in Hect.)
Institutional Total
6 7 8 9
Individual Joint

80
TABLE-NUMBER AND AREA OF OPERATIONAL HOLDINGS BY SIZE
IN ASSAM,
Below 0.5
(0.5-1.0)
Marginal
(1.0-2.0)
Small
(2.0-3.0)
(3.0-4.0)
Semi-Medium
(4.0-5.0)
(5.0-7.5)
(7.5-10.0)
Medium
(10.0-20.0)
(20.0 & Above)
Large
All Classes
160735
97822
258557
96820
96820
42887
19632
62519
10091
5894
819
16804
285
39
324
435024
547
580
1127
865
865
446
246
692
158
171
64
393
49
10
59
3136
0
0
0
0
0
0
0
0
0
0
0
0
0
0
0
0
161282
98402
259684
97685
97685
43333
19878
63211
10249
6065
883
17197
334
49
383
438160
Size Class(in Ha.)
No. of Operational Holdings
Individual Joint Institutional Total
1 2 3 4 5

81
6.03CLASSES FOR SOCIAL GROUP “SCHEDULED TRIBES”2010-2011
0.00
0.00
0.00
0.00
0.00
0.00
0.00
0.00
0.00
0.00
0.00
0.00
0.00
0.00
0.00
0.00
44669.36
71174.28
115843.64
135586.95
135586.95
103959.55
67377.03
171336.58
45135.58
35553.97
7267.73
87957.28
4194.93
1677.19
5872.12
516596.57
44515.71
70755.91
115272.62
134299.14
134299.14
102879.52
66550.39
169429.91
44441.55
34543.02
6742.86
85727.43
3581.82
1257.04
4838.86
509566.96
153.65
418.37
572.02
1287.81
1287.81
1080.03
826.64
1906.67
694.03
1010.95
524.87
2229.85
613.11
420.15
1033.26
7029.61
Area Operated (in Hect.)
Institutional Total
6 7 8 9
Individual Joint

82
TABLE-NUMBER AND AREA OF OPERATIONAL HOLDINGS BY
Below 0.5
(0.5-1.0)
Marginal
(1.0-2.0)
Small
(2.0-3.0)
(3.0-4.0)
Semi-Medium
(4.0-5.0)
(5.0-7.5)
(7.5-10.0)
Medium
(10.0-20.0)
(20.0 & Above)
Large
All Classes
1054966
423927
1478893
366572
366572
146621
73116
219737
35457
22700
3200
61357
947
177
1124
2127683
948
1174
2122
2126
2126
1604
943
2547
530
489
141
1160
83
15
98
8053
0
0
0
0
0
0
0
0
0
0
0
0
0
0
0
0
1055914
425101
1481015
368698
368698
148225
74059
222284
35987
23189
3341
62517
1030
192
1222
2135736
Size Class(in Ha.)
No. of Operational Holdings
Individual Joint Institutional Total
1 2 3 4 5

83
6.04SIZE CLASSES FOR “OTHERS” IN ASSAM, 2010-2011
0.00
0.00
0.00
0.00
0.00
0.00
0.00
0.00
0.00
0.00
0.00
0.00
0.00
0.00
0.00
0.00
322259.23
298387.54
620646.77
510240.49
510240.49
348128.57
249295.90
597424.47
157699.85
136752.27
27608.13
322060.25
12703.50
8591.94
21295.44
2071667.42
321980.96
297517.26
619498.22
507049.03
507049.03
344141.46
246081.80
590223.26
155388.71
13386.24
26403.04
315655.99
11662.38
6891.39
18553.77
2050980.27
278.27
870.28
1148.55
3191.46
3191.46
3987.11
3214.10
7201.21
2311.14
2888.03
1205.09
6404.26
1041.12
1700.55
2741.67
20687.15
Area Operated (in Hect.)
Institutional Total
6 7 8 9
Individual Joint

TABLE - 6.05NUMBER AND AREA OF OPERATIONAL HOLDINGS BY SIZE
CLASSES FOR “INSTITUTIONAL GROUP” IN ASSAM, 2010-2011
84
Size Class(in Ha.)
Below 0.5
(0.5-1.0)
Marginal
(1.0-2.0)
Small
(2.0-3.0)
(3.0-4.0)
Semi-Medium
(4.0-5.0)
(5.0-7.5)
(7.5-10.0)
Medium
(10.0-20.0)
(20.0 & Above)
Large
All Classes
No. of OperationalHoldings
832
402
1234
438
438
232
155
387
140
215
174
529
428
2032
2460
5048
Area Operated(in Hect.)
213.51
277.41
490.92
638.21
638.21
564.12
530.49
1094.61
614.98
1356.72
1486.19
3457.89
6789.28
246847.31
253636.59
259318.22
1 2 3
Source: Table (6.01 to 6.05) State Report on Agricultural Census, 2010-11. Directorate of Economics and Statistics, Assam.

85
(Base triennium ending 2007- 08 =100)
All
Com
mod
itie
s
Non
-Foo
dG
rain
s
Foo
dG
rain
sType of IndexYear
Area
ProductionAverage Yield
AreaProductionAverage Yield
AreaProductionAverage Yield
Area
ProductionAverage Yield
AreaProductionAverage Yield
AreaProductionAverage Yield
Assam India
All
Com
mod
itie
s
Non
-Foo
dG
rain
s
Foo
dG
rain
s
1 2 3 4 5 6 7 8
101.00
144.80130.7
107.10174.30
146.9
108.69131.43120.93
109.79
149.34136.02
108.7140.08128.87
106.36152.29143.18
116.4
160.50106.20
117.20166.60101.10
105.71107.00101.22
106.4
106.43100.03
111.85109.4297.83
112.07115.01102.63
110.10
152.90115.90
115.30170.30126.10
106.36120.57113.36
107.12
130.25121.60
107.55126.44117.56
107.99135.70125.66
101.2
105.4104.2
100.9106.5105.5
100.0100.6100.6
104.4
114.3109.5
104.0119.5114.8
102.1118.5
88.1
103.2
108.6105.2
106.1107.6101.4
104.3105.0100.6
114.0
128.1112.3
116.5131.3112.7
115.3127.2110.3
102.2
107.0104.7
103.5107.0103.4
102.1102.8100.6
109.1
121.1111.0
110.2125.3113.7
108.6122.8113.0
TABLE - 6.06INDEX NUMBER OF AREA, PRODUCTION AND PRODUCTIVITY
FOR FOOD GRAINS, NON-FOOD GRAINS AND ALL COMMODITIESIN ASSAM & INDIA
2007
-08
2008
-09
2009
-10
2010
-11
2011
-12
2012
-13

TABLE-TOTAL AREA AND CLASSIFICATION
86
The area under newly created districts namely - Chirang, Kamrup Metro, Baksa, Udalguriare estimated.
Sl.No.
2009-102010-11
KokrajharDhubriGoalparaBarpetaMorigaonNagaonSonitpurLakhimpurDhemajiTinsukiaDibrugarhSivasagarJorhatGolaghatKarbi AnglongDima HasaoCacharKarimganjHailakandiBongaigaonChirangKamrupKamrup MetroNalbariBaksaDarrangUdalguri
Total Geographical area according to
District ProfessionalSurvey
Village Papers(Reported area)
Forest
1 2 3 4 5
78500057850005
312900266601184262264510158765411030532298235024323700379000338782260290285100354070
1033400488800377610180900132587151999109985308684115013100483196108180707167393
18532601853260
1611952915529683480131320788024
1478432937959355
131595233413046521904
156905319294
67277138409
5599562420
44410377088522140
083019
27622400
123456789
101112131415161718192021222324252627
78500057850005
312900266601184262264510158765411030532298235024323700379000338782260290285100354070
1033400488800377610180900132587151999109985308684115013100483196108180707167393

6.07OF AREA IN ASSAM, 2010-11
87
Contd...
(Area in Hect.)
6 7 8 9 10 11 12 1
Sl.No.
123456789101112131415161718192021222324252627
Not available for Cultivation (Area under non-agricultural uses)
Land underStill Water
WaterLoggedLand
SocialForestry
Barren andUncultura-ble Land
3923539235
332282281
10001583870461570128
1050
31117154525
BB
140007403
406146
140120470
96400102
1281612816
1630529405
4300579966333390830485508340323
BB
829930740174
811370686
459
167154
138916138916
20528338776591008971
1435986267679505334015611457570693258
BB
95896844342429441298201719965055150160502343
10265361026536
196345491021276170001731327073
163092487918191773845
122844406218210038650
BB
3702916242
67473331015901181342083614396175891640020886
12175031217503
236486405929727271042816742881
173145573738748878086
128990488159666142756
00
6144731419109513648917326216612363819925192452301723485
14080421408042
19810140663253812340
3537216592135336988494753679713498
733613906
847658770739335227701
70993441
282261235
1001064016400
1758120165
6945
26255452625545
434587812562265394443170464540
19449894361
13696311488314248856151
11056751232
5877073933528914838518143926471518561316713003926325368264318230430
OtherLand
Total (col.6 to col.9)
Total(col.10 &col.11)
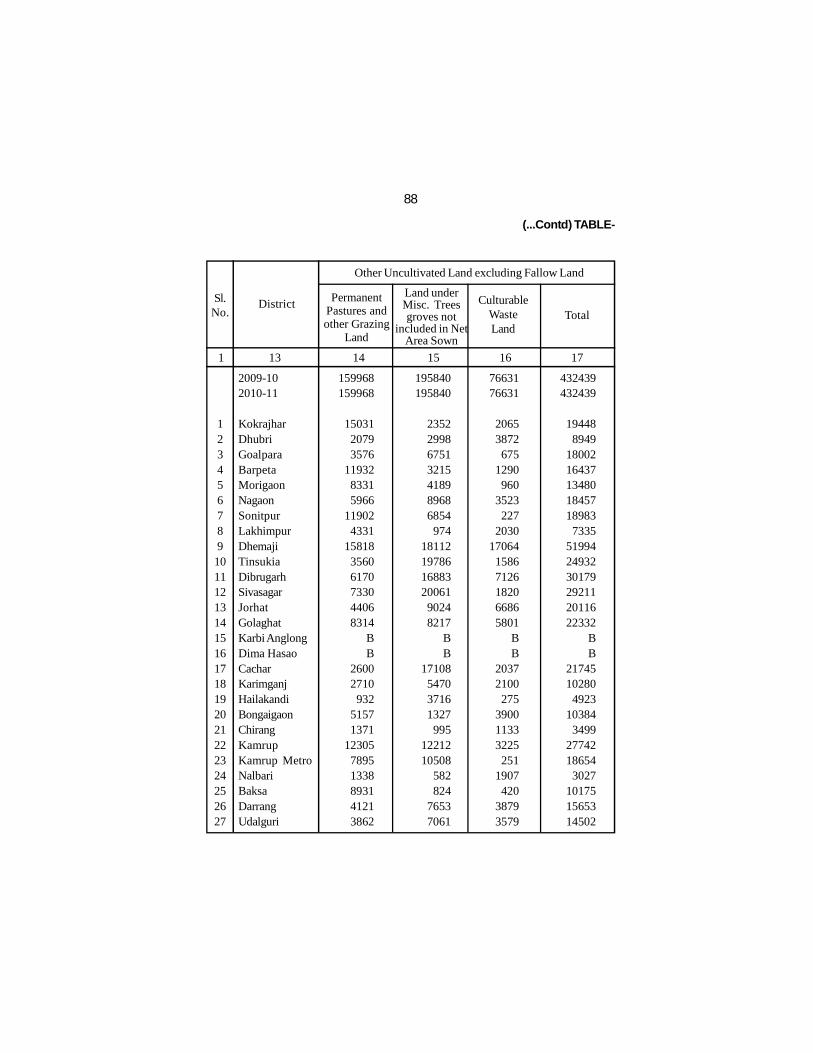
(...Contd) TABLE-
88
Sl.No.
2009-102010-11
KokrajharDhubriGoalparaBarpetaMorigaonNagaonSonitpurLakhimpurDhemajiTinsukiaDibrugarhSivasagarJorhatGolaghatKarbi AnglongDima HasaoCacharKarimganjHailakandiBongaigaonChirangKamrupKamrup MetroNalbariBaksaDarrangUdalguri
Other Uncultivated Land excluding Fallow Land
District PermanentPastures andother Grazing
Land
Land underMisc. Treesgroves not
included in NetArea Sown
Total
1 13 14 15 16 17
159968159968
1503120793576
1193283315966
119024331
1581835606170733044068314
BB
26002710
93251571371
1230578951338893141213862
195840195840
2352299867513215418989686854
9741811219786168832006190248217
BB
17108547037161327
9951221210508
582824
76537061
432439432439
194488949
1800216437134801845718983
7335519942493230179292112011622332
BB
2174510280
492310384
34992774218654
3027101751565314502
123456789
101112131415161718192021222324252627
CulturableWasteLand
7663176631
20653872675
1290960
3523227
203017064
15867126182066865801
BB
20372100275
390011333225251
1907420
38793579
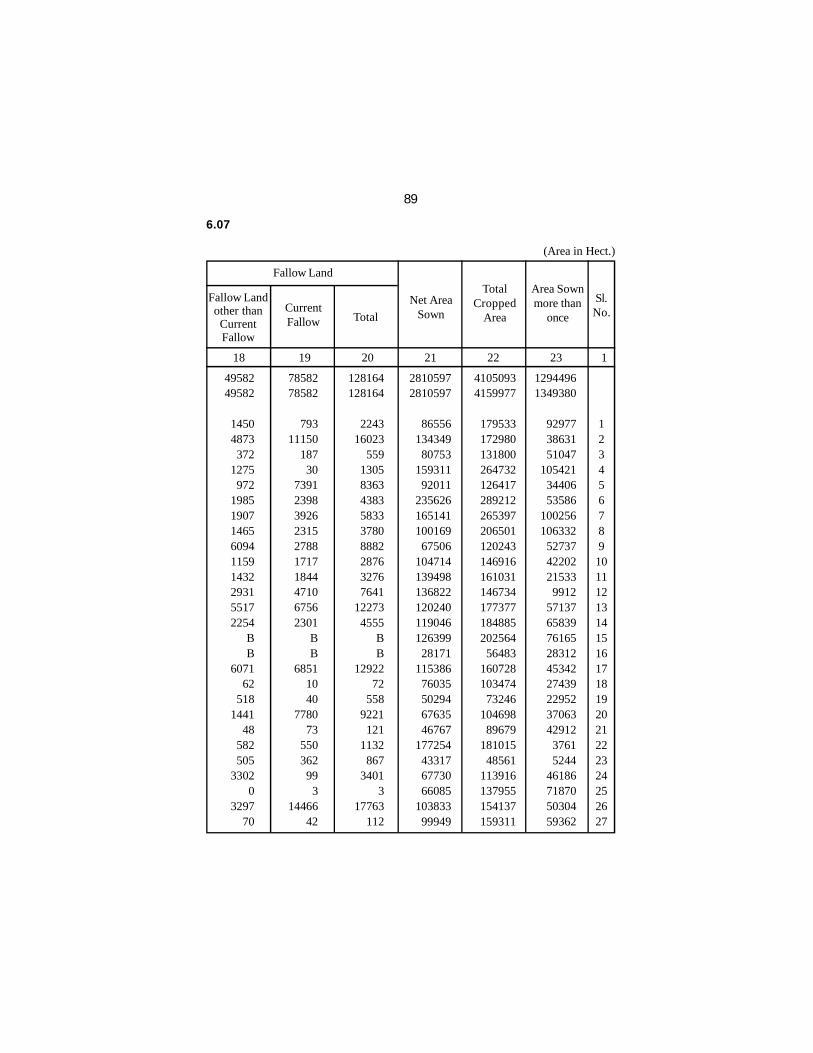
6.07
89
(Area in Hect.)
18 19 20 21 22 23 1
Sl.No.
123456789
101112131415161718192021222324252627
Fallow Land
Total
Fallow Landother thanCurrentFallow
CurrentFallow
TotalCropped
Area
4958249582
14504873372
1275972
198519071465609411591432293155172254
BB
607162
5181441
48582505
33020
329770
7858278582
79311150
18730
7391239839262315278817171844471067562301
BB
68511040
778073
55036299
314466
42
128164128164
224316023
559130583634383583337808882287632767641
122734555
BB
1292272
5589221
1211132
8673401
317763
112
28105972810597
8655613434980753
15931192011
23562616514110016967506
10471413949813682212024011904612639928171
11538676035502946763546767
177254433176773066085
10383399949
41050934159977
17953317298013180026473212641728921226539720650112024314691616103114673417737718488520256456483
16072810347473246
10469889679
18101548561
113916137955154137159311
12944961349380
929773863151047
1054213440653586
100256106332
5273742202215339912
57137658397616528312453422743922952370634291237615244
46186718705030459362
Net AreaSown
Area Sownmore than
once

TABLE - 6.08CROP-WISE INDEX NUMBER OF AREA, PRODUCTION AND
PRODUCTIVITY IN ASSAM, 2012-13
90
Contd...
(Base triennium ending 2007-08=100)
1
2
3
Total Rice
4
5
6
Total Cereals
7
8
9
Total Pulses
Total Food Grains
10
11
12
13
14
Total Oil Seeds
Sl.No.
Name of Crops
1 2 3 4 5
ProductivityProductionArea
Autumn Rice
Winter Rice
Summer Rice
Maize
Wheat
Other Cereals and Small Millets
Gram
Tur (Arahar)
Other Rabi Pulses
Linseed
Castor
Sesamum
Rape and Mustard
Coconut
67.26
112.78
121.60
109.94
129.04
60.61
63.83
106.14
93.11
101.10
126.83
124.30
106.36
84.72
75.61
89.91
119.03
110.09
113.04
88.72
163.28
159.09
154.53
159.63
62.42
62.48
152.55
102.12
116.71
140.10
137.66
152.29
98.48
94.50
110.69
138.64
119.40
127.22
131.91
144.78
130.83
140.55
123.70
102.98
97.89
143.72
109.68
115.44
110.47
110.75
143.18
116.24
124.99
123.12
116.47
108.46
112.55

(...Contd) TABLE - 6.08
91
15
16
17
Total Fibres
18
19
20
21
Total Condiment & Spices
22
23
Total Fruits & Vegetables
24
25
Tota Miscellaneous Crops
Total Non-Food Grains
All Commodities
Sl.No.
Name of Crops
1 2 3 4 5
ProductivityProductionArea
Jute
Cotton
Mesta
Plantation Crops (Tea)
Chillies
Turmeric
Arecanut
Potato
Banana
Sugarcane
Tobacco
108.77
132.60
85.27
107.87
100.21
117.84
130.17
103.72
108.65
126.91
106.96
116.18
112.19
55.49
111.82
112.07
107.99
84.95
135.59
93.30
85.33
114.90
145.70
180.59
106.02
119.89
136.06
125.79
130.53
104.94
55.85
104.62
115.01
135.70
78.10
102.26
109.43
79.10
114.65
123.64
138.73
102.22
110.35
107.20
117.60
112.36
93.54
100.65
93.56
102.63
125.66

TABLE - 6.09AREA UNDER FOOD AND NON-FOOD CROPS COVERED BY
CROP FORECAST IN ASSAM
92
Contd...
(In `000 Hect.)
Name of Crops
1 2 3 4 5 6
2010-112008-09
Autumn Rice
Winter Rice
Summer Rice
Total Rice
Maize
Wheat
Other Cereals and Small Milletes
Total Cereals
Gram
Tur (Arahar)
Rabi Pulses
Total Pulses
Total Food Grains
Sesamum
Rape and Mustard
Linseed
Castor
Nizer
Coconut
Total Oil Seeds
351
1773
360
2484
17
50
5
2556
2
5
107
114
2670
12
226
7
1
7
19
272
346
1789
394
2529
19
60
6
2614
2
6
111
119
2733
12
249
7
1
8
19
296
2009-10
313
1859
399
2571
20
45
5
2641
2
7
117
126
2767
12
244
7
1
8
20
292
2011-12 2012-13
276
1876
394
2646
21
40
4
2611
2
6
124
132
2743
12
248
7
1
8
19
295
238
1857
393
2488
24
34
4
2550
2
6
134
142
2692
11
279
6
1
8
21
326
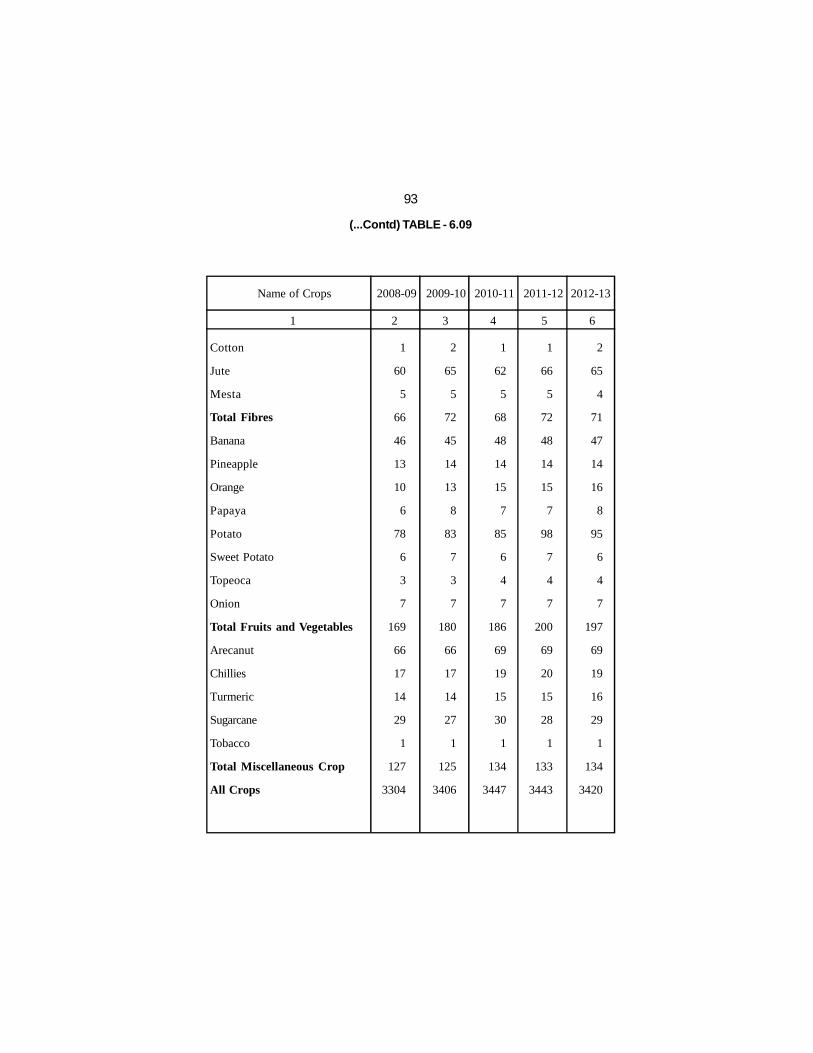
(...Contd) TABLE - 6.09
93
Cotton
Jute
Mesta
Total Fibres
Banana
Pineapple
Orange
Papaya
Potato
Sweet Potato
Topeoca
Onion
Total Fruits and Vegetables
Arecanut
Chillies
Turmeric
Sugarcane
Tobacco
Total Miscellaneous Crop
All Crops
Name of Crops
1 2 3 4 5 6
2010-112008-09 2009-10 2011-12 2012-13
1
60
5
66
46
13
10
6
78
6
3
7
169
66
17
14
29
1
127
3304
2
65
5
72
45
14
13
8
83
7
3
7
180
66
17
14
27
1
125
3406
1
62
5
68
48
14
15
7
85
6
4
7
186
69
19
15
30
1
134
3447
1
66
5
72
48
14
15
7
98
7
4
7
200
69
20
15
28
1
133
3443
2
65
4
71
47
14
16
8
95
6
4
7
197
69
19
16
29
1
134
3420

TABLE - 6.10PRODUCTION OF FOOD AND NON-FOOD CROPS COVERED BY
CROP FORECAST IN ASSAM
94
Contd...
(In `000 Tonnes)
Autumn Rice
Winter Rice
Summer Rice
Total Rice
Maize
Wheat
Other Cereals and Small Milletes
Total Cereals
Gram
Tur (Arahar)
Rabi Pulses
Total Pulses
Total Food Grains
Sesamum
Rape and Mustard
Linseed
Castor
Nizer
Coconut (a)
Total Oil Seeds (Excluding
Coconut)
Name of Crops
1 2 3 4 5 6
2010-112008-09 2009-10 2011-12 2012-13
374
2866
769
4009
13
55
3
4080
1
4
57
62
4142
7
125
4
1
4
180
141
335
3214
860
4409
14
65
3
4491
1
4
61
66
4557
7
131
4
1
4
180
147
356
3649
1028
5033
14
56
3
5106
1
5
66
72
5178
7
143
4
1
4
186
159
338
3298
1080
4716
17
49
2
4784
1
4
68
73
4857
8
139
4
1
4
159
156
309
3655
1164
5128
21
44
2
5195
1
5
78
84
5279
8
170
4
1
4
176
187

(...Contd) TABLE - 6.10
95
N. B. (a) in terms of million nuts (b) ‘000’ bales of each 170 kg. (c) ‘000’ bales of each 180 kg. (d) in terms of dry cured nuts.
Cotton (b)
Jute (c)
Mesta (c)
Total Fibres
Banana
Pineapple
Orange
Papaya
Potato
Sweet Potato
Tapeoca
Onion
Total Fruits and Vegetables
Arecant (d)
Chillies
Turmeric
Sugarcane (Cane)
Tobacco
Total Miscellaneous Crops
Name of Crops
1 2 3 4 5 6
2010-112008-09 2009-10 2011-12 2012-13
1
647
27
675
629
195
108
92
516
22
14
17
1593
64
11
10
1100
1
1186
1
713
25
739
622
210
136
122
600
24
15
16
1745
64
12
10
1062
1
1149
1
626
26
653
654
215
156
138
658
21
20
15
1877
69
12
11
1076
1
1169
1
608
28
637
729
224
173
145
683
26
28
23
2031
64
13
13
1053
1
1144
1
558
25
584
763
234
180
157
709
26
31
26
2126
60
15
16
1028
1
1120

TABLE - 6.11YIELD OF FOOD AND NON-FOOD CROPS COVERED BY
CROP FORECAST IN ASSAM
96
Contd...
(Kg. per Hect.)
Autumn Rice
Winter Rice
Summer Rice
Total Rice
Maize
Wheat
Other Cereals and Small Milletes
Total Cereals
Gram
Tur (Arahar)
Rabi Pulses
Total Pulses
Total Food Grains
Sesamum
Rape and Mustard
Linseed
Castor
Nizer
Coconut(a)
Total Oil Seeds (Excluding
Coconut)
Name of Crops
1 2 3 4 5 6
2010-112008-09 2009-10 2011-12 2012-13
1084
1641
2133
1634
726
1090
511
1615
510
710
559
545
1569
563
551
514
422
510
76
549
982
1824
2180
1765
718
1087
515
1738
513
712
550
558
1686
567
529
511
424
512
76
529
1155
1993
2577
1982
714
1256
501
1957
508
714
564
572
1894
568
585
535
427
514
73
580
1242
1785
2744
1876
802
1209
510
1855
524
785
550
560
1792
674
559
566
524
519
63
563
1317
1998
2965
2090
897
1300
496
2063
554
828
588
597
1986
702
610
592
546
529
64
610

(...Contd) TABLE - 6.11
97
N. B. (a) nuts per bearing tree.Source: (Table 6.06 to 6.11) (i) Directorate of Economics and Statistics, Assam.
(ii) Ministry of Agriculture, Govt. of India.
Cotton
Jute
Mesta
Total Fibres
Banana
Pineapple
Orange
Papaya
Potato
Sweet Potato
Tapeoca
Onion
Arecanut (a)
Chillies
Turmeric
Sugarcane (Cane)
Tobacco
Name of Crops
1 2 3 4 5 6
2010-112008-09 2009-10 2011-12 2012-13
80
1939
913
1820
13801
15369
11073
15171
6585
3525
4728
2415
152
640
726
38387
534
81
1967
916
1850
13823
15463
10586
15315
7263
3521
7524
2329
152
646
700
39110
535
80
1808
940
1710
13721
15337
10520
18783
7735
3455
4766
2231
153
651
710
36196
513
80
1669
1023
1598
15523
15795
11548
20515
6978
3930
7294
3052
138
673
868
37055
549
81
1543
989
1471
16217
16514
10921
19987
7425
4135
8098
3647
133
778
955
35612
528

TABLE - 6.12AREA UNDER HIGH YIELDING VARIETY OF RICE IN ASSAM,
2012-2013
98
(Area in Hect.)
1 2 3 4 5
KokrajharDhubri
GoalparaBarpetaMorigaonNagaonSonitpurLakhimpur
DhemajiTinsukiaDibrugarhSivasagarJorhatGolaghat
Karbi AnglongDima HasaoCacharKarimganjHailakandiBongaigaon
ChirangKamrupKamrup MetroNalbariBaksaDarrang
Udalguri
Assam
District Autumn Rice Summer Rice TotalWinter Rice
127382698
3079461226119300
1667210718
64994053
20093
23431533
670046905500161925079827
93508524
746278858396338
18004
159581
4061422072
295204262226683880738182068882
428433392248442640084686074039
709606076
56066425372547222637
227904014612819378165129130749
40408
1170167
1970149863
196134757935462318771780618208
2740226390161
46564061
144600
693961153075
10095
306934652
755710171
226618252
5250
361230
7305374633
522129481364756
12925011629897808
520823820149032642625385979633
791061076668505502713105442559
352098332221122507755939655339
63662
1690978

TABLE - 6.13AREA AND YIELD OF HIGH YIELDING VARIETY OF RICE
IN ASSAM
99
(Area: Lakh Hect., Yield: K.g./Hect.)
1 2 3 4 5 6 7
2000-2001
2001-2002
2002-2003
2003-2004
2004-2005
2005-2006
2006-2007
2007-2008
2008-2009
2009-2010
2010-2011
2011-2012
2012-2013
2154
2357
2281
2282
2303
2281
1990
2152
2256
2345
2551
2590
2860
2.59
2.59
2.45
2.21
2.34
2.66
2.62
2.78
3.14
3.41
3.54
3.51
3.61
2459
2383
2364
2317
2296
2192
2228
2509
2371
2554
2819
2825
3280
PeriodArea Area YieldYieldArea Yield
Winter SummerAutumn
2.52
2.50
2.53
2.16
2.22
2.35
2.02
2.23
2.24
2.29
2.13
1.86
1.60
1804
2006
1842
1642
1851
1866
1686
1858
1959
1683
1465
1470
1558
9.72
9.20
9.37
9.29
8.63
9050
8.37
8.94
9.75
10.20
11.34
11.61
11.70

TABLE - 6.14DISTRICT-WISE FERTILIZER CONSUMPTION IN ASSAM, 2012-13
100
(In Tonnes)
1 2 3 4 5 6
District Nitrogen (N) Murate ofPotash (K)
Total(N+P+K)
Phosphorous(P)
KokrajharDhubriGoalparaBarpetaMorigaonNagaonSonitpurLakhimpurDhemajiTinsukiaDibrugarhSivasagarJorhatGolaghatKarbi AnglongDima HasaoCacharKarimganjHailakandiBongaigaonChirangKamrupKamrup MetroNalbariBaksaDarrangUdalguri
Assam
Per Hectconsumption
(Kg)
4526.45 10965.81
5869.1212542.31
4472.3517835.67
2294.014816.13487.47
2213.083683.682990.782595.661791.343441.01270.05
3547.652471.981474.385403.69664.98
14900.74
9118.891087.10
14733.091128.75
135326.17
1048.003503.641421.643800.48
914.245888.56
992.82431.68663.00
1000.381000.52
894.48 925.60786.68269.12162.36685.92383.32232.20
1026.40219.00
4091.49
1253.68293.20
3683.52389.76
35961.69
766.263886.74838.56
7606.02746.98
9318.08277.10177.71965.06406.02710.84716.86409.64114.46
61.4538.55
716.86445.78189.16962.66
78.318618.08
1003.62106.03
5534.94124.10
44819.87
6340.7118356.19
8129.3223948.81
6133.5733042.31
3563.935425.522115.533619.485395.044602.123930.902692.483771.58470.96
4950.433301.081895.747392.75962.29
27610.31
11376.191486.33
23951.551642.61
216107.73
49.0678.0771.1298.0041.5398.0723.0856.5515.0424.1054.8636.9018.2120.3321.1916.7134.9436.5034.3290.6218.17
111.11
73.6415.25
160.4016.74
58.47

TABLE - 6.15DISTRICT-WISE AND SEASON-WISE CONSUMPTION OF
FERTILIZER IN ASSAM, 2012-13
101
Source: (Table 6.12 & 6.15) Directorate of Agriculture, Assam.
(In Tonne.)
1 2 3 4 5 6 7 8 9
Kokrajhar
Dhubri
Goalpara
Barpeta
Morigaon
Nagaon
Sonitpur
Lakhimpur
Dhemaji
Tinsukia
Dibrugarh
Sivasagar
Jorhat
Golaghat
Karbi Anglong
Dima Hasao
Cachar
Karimganj
Hailakandi
Bongaigaon
Chirang
Kamrup(R+M)
Nalbari
Baksa
Darrang
Udalguri
Assam
DistrictK K TotalTotalN P
RabiKharif
N P
2281.20
5957.33
2872.35
6517.70
2188.94
9752.44
1103.13
425.35
221.11
1228.29
2147.37
1835.48
1561.84
866.27
394.47
137.33
2001.01
1276.77
753.55
2506.45
347.93
7531.71
4469.12
534.10
8657.79
606.08
68175.11
581.28
2183.26
426.66
2273.60
517.24
3379.16
577.74
229.96
571.68
523.52
625.50
574.42
609.06
531.18
133.60
86.62
293.88
149.06
93.70
551.60
111.58
2653.03
755.32
126.92
2153.64
147.00
20860.21
383.13
2033.73
328.92
1995.78
373.49
2851.81
138.55
22.29
512.65
203.01
355.42
358.43
174.70
57.23
36.75
13.25
358.43
222.89
94.58
481.33
33.13
2501.81
501.81
59.04
2767.47
62.05
16921.68
3245.61
10174.32
3627.93
10787.08
3079.67
15983.41
1819.42
677.60
1305.44
1954.82
3128.29
2768.33
2345.60
1454.68
564.82
237.20
2653.32
1648.72
941.83
3539.38
492.64
12686.55
5726.25
720.06
13578.90
815.13
105957.00
2245.25
5008.48
2996.77
6024.61
2283.41
8083.23
1190.88
4390.78
266.36
984.79
1536.31
1155.30
1033.82
925.07
3046.54
132.72
1546.64
1195.21
720.83
2897.24
317.05
7369.03
4649.77
553.00
6075.30
522.67
67151.06
466.72
1320.38
994.98
1526.88
397.00
2509.40
415.08
201.72
91.32
476.86
375.02
320.06
316.54
255.50
135.52
75.74
392.04
234.26
138.50
474.80
107.42
1438.46
498.36
166.28
1529.88
242.76
15101.48
383.13
1853.01
509.64
5610.24
373.49
6466.27
138.55
155.42
452.41
203.01
355.42
358.43
234.94
57.23
24.70
25.30
358.43
222.89
94.58
481.33
45.18
6116.27
501.81
46.99
2767.47
62.05
27898.19
3095.10
8181.87
4501.39
13161.73
3053.90
17058.90
1744.51
4747.92
810.09
1664.66
2266.75
1833.79
1585.30
1237.80
3206.76
233.76
2297.11
1652.36
953.91
3853.37
469.65
14923.76
5649.94
766.27
10372.65
827.48
110150.73

TABLE - 6.16AREA, PRODUCTION AND AVERAGE YIELD OF SOME MAJOR
HORTICULTURAL CROPS OF ASSAM
102
Source: Directorate of Horticulture & Food Processing, Assam.
1 2 3 4 5 6 7
BananaPineapplePapayaOrangeGuava
Assam LemonLitchiJackfruitMangoOther fruitsTotal FruitsPotatoSweet potatoTapiocaTotal tuber cropsChilliesTurmeric
OnionGingerCorianderGarlicBlack PepperOther spices
Total SpicesKharif. vegetablesRabi. vegetablesTotal vegetables
Name of Crops
Ave
rage
yiel
d in
Kg/
Hec
t.
2012-20132011-2012
Pro
duct
ion
in M
.T.
Are
a in
Hec
tare
Ave
rage
yiel
d in
Kg/
Hec
t.
Pro
duct
ion
in M
. T.
Are
a in
Hec
tare
47563141587321
149384544
128055231
2219348634115
1377319781665583875
1082491952615447
73721633826966968736474828
10381178786
178857257643
72910222362414545117250190676
10046341436
1925264845930426
17746646825962576928281
7366461287113442
225951213693195743707
51984694
255833133274431812054513949
1552315795205151154819955
78457921867599657394
128856978393072946805673868
30527429118545121492972
2464169161778517520
51509162358736
158485265
142095628
2353353924352
1507079977296184475
1138652059416241
85251783928286997737205142
11032483731
188744272475
837021268819174589195818105826
12589249639
2241515526836796
20738199752714097238306
10545491596015429
309031368254950067793
60245203
327637144520035342314979431
1625016558199851235620100
886088209525
102508455
1376 09775426085609261775950
362576701750679516201012
2970172601872518275

7.IRRIGATION &WATER RESOURCES
FIGURE AT A GLANCE, 2012-13
Gross Area Irrigated
Net Area Irrigated
Irrigation potential created through Govt. Irrigation Schemes
176738 hect
151914 hect
682782 hect

TABLE - 7.01GROSS AREA IRRIGATED UNDER GOVERNMENT IRRIGATION
FACILITIES IN ASSAM
104
P = Provisional.
(Area in Hect.)
1 2 3 4 5
110514.77
68594.78
60182.34
66437.71
121409.41
86522.53
94137.67
162090.00
127222.00
152642.00
171440.00
113479.63
69397.28
60762.37
67139.16
126455.82
89269.99
95670.69
168854.00
130217.00
157685.00
176738.00
Tube Wells
--
--
--
--
--
--
--
--
--
--
--
TanksCanalsYear
2001-2002
2003-2004
2004-2005
2005-2006
2006-2007
2007-2008
2008-2009
2009-2010
2010-2011
2011-2012
2012-2013(P)
2964.86
802.50
580.03
701.45
5046.41
2747.46
1533.02
6764.00
2995.00
5043.00
5298.00
Total

TABLE - 7.02SECTOR WISE IRRIGATION POTENTIAL CREATED IN ASSAM,
2012-13 (CUMULATIVE)
105
(Area in Hect.)
1 2 3 4 5 6
KokrajharDhubriGoalparaBarpetaMorigaonNagaonSonitpurLakhimpurDhemajiTinsukiaDibrugarhSivasagarJorhatGolaghatKarbi AnglongDima HasaoCacharKarimganjHailakandiBongaigaonChirangKamrupKamrup MetroNalbariBaksaDarrangUdalguri
Assam
District Minor Irrigation TotalMajor/Medium
Irrigation
174291726913011149531694318088297181192175466585
13198162401194617198591127242
11761284241217677
133172265938507450
187341015547475
428440
14822--
30741-
8584232655
---
4152---
9637---------
28235-
48258
254342
3225117269130114569416943
1039306237311921
75466585
1735016240119461719868749
724211761
284241217677
1331722659
38507450
469691015595733
682782
ThroughASM I DC
(STW/LIPS)
GrandTotal
4776919827219186
153369696
179436657340280439489883884218412
-----
1137
11304
5184
9462
149205
3702726467157325488032279
113626803161857810948146282683925078203672561068749
724211761
28424121
22131
37813
59603
115350
831987
Through Govt. Irrigation Schemes

TABLE - 7.03TARGET AND ACHIEVEMENT OF ADDITIONAL IRRIGATION
POTENTIAL CREATED IN ASSAM, 2012-13
106
(Area in Hect.)
1 2 3 4 5 6 7 8 9
KokrajharDhubriGoalparaBarpetaMorigaonNagaonSonitpurLakhimpurDhemajiTinsukiaDibrugarhSivasagarJorhatGolaghatKarbi AnglongDima HasaoCacharKarimganjHailakandiBongaigaonChirangKamrupKamrup MetroNalbariBaksaDarrangUdalguri
Assam
District
Min
or Ir
riga
tion
Tota
l
Maj
or/M
ediu
mIr
riga
tion
Target
Min
or Ir
riga
tion
Maj
or/M
ediu
mIr
riga
tion
Tota
l M
.I.
&M
/MIr
riga
tion
Rev
ival
of
lost
pote
ntia
l
Tota
l(
AP
+ R
LP
)
88662960293437904360166534702257
564 1292
44212425485
500925110
1130734712
1370850
116392833
875500
266013060
77.225
5348--
5668------
255-------------
10262-
34694
56.227
142142960293494584360166534702257564
1292697
12425485500925110
1130734712
1370850
116392833875
107622660
47754
133452
----
1000---
120-
3537
435-
45940
-----
463---
206876
9485
86661636204414903950
40024701082
120-
35137435
-45940
390734712520
-38131837
577-
187011936
45353
86661636204414902950
40024701082
---
100----
390734712520
-33501837
577-
18505060
35868
----
1000---
120-
3537
435-
45940
-----
463---
206876
9485
---------------------------
-
Achievement
N B.= A =Additional, P = Potential, R =Revival, L=Lost,

TABLE - 7.04DISTRICT-WISE AND CROP-SEASON-WISE AREA IRRIGATED
IN ASSAM
107
(Area in Hect.)
1 2 3 4 5 6 7
KokrajharDhubriGoalparaBarpetaMorigaonNagaonSonitpurLakhimpurDhemajiTinsukiaDibrugarhSivasagarJorhatGolaghatKarbi AnglongDima HasaoCacharKarimganjHailakandiBongaigaonChirangKamrupKamrup MetroNalbariBaksaDarrangUdalguri
Assam
DistrictKharif
2012-13(P)
Total
2011-122012-13
(P)2011-12
2012-13(P)2011-12
Rabi & Pre-Kharif
13378199
14024298245
2009211097
426475743
1237951
55224
1567938191130
501055
48747827021137451
158964047
24364
132678
657844
23381837
225295499185
505415698
2290322784163
32179387511301305
925351
5646290
482164
124854333
27830
150167
175475734256874
433024
4586058
-29
87067
3457-
196120090276
974444
2148100
2625800
2910
25007
90263647174818
422531
415-
17120
21394
-5658
-1766
65805216
1376589
299262
111413403373
26571
13553674
213645541119
2442211121
884535801
1237980925291
1913638193091
2501957
124845231463285
551185214847
27274
157685
6668307
298520111043
337749216920415715
2410343
1178163
378373875289613701730567
7022879
7813126
135995673
31203
176738

TABLE-CROP & SEASON WISE AREA IRRIGATED
108
1 2 3 4 5 6 7 8 9 10 11
KokrajharDhubriGoalparaBarpetaMorigaonNagaonSonitpurLakhimpurDhemajiTinsukiaDibrugarhSivasagarJorhatGolaghatKarbi AnglongDima HasaoCacharKarimganjHailakandiBongaigaonChirangKamrupKamrup MetroNalbariBaksaDarrangUdalguri
Assam
District
Kharif Crop Season
Jute
Mai
ze
-----5---------------------
5
--------------------------
30
30
-------------------------
50
50
Bao
Pad
dy
Sail
HY
V
Sail
Tra
diti
onal
Reg
ular
Ahu
To
tal
Oth
ers
Suga
rca
ne
-------
34--------5--------
-
39
--------------------------
30
30
Sl.No.
123456789
101112131415161718192021222324252627
--6-----------
2687
185--8
127019
----
20
4195
13378199
13963678
2459069
11097392360738
123792413
21011033819
94050
105540
620822141137
45178814047
21854
93735
---
620-
11018--
1155-
274214
11889-----
469--
8015-
2380
34594
13378199
14024298
2452009211097
426475743
123795155
2241567938191130
501055
48747827021137
451158964047
24364
132678

7.05IN ASSAM 2011-2012
109
(Area in Hect.)
Ear
lyA
hu
Rabi & Pre Kharif Crop Season
Suga
rca
ne
Pul
ses
-10
5--
72----------
10-
9022--
15---
310
1326
-2-
22----------
70----
1118
-16
--
370
509
--------
10-----
190----1----
310--
511
Oil
-se
eds
Bor
oP
addy
Wh
eat
Ahu
HY
V
Gra
ndT
ota
l
To
tal
Oth
ers
---------1---------
1298
----
10-
121
Sl.No.
123456789
101112131415161718192021222324252627
12 13 14 15 16 17 18 19 20 21 1
-1-
13-
3000-
2524530
------
135--
128015
-5
300--
3888
175475734256874
433024
45860580
29870
673457
01961200902
76974444
2148100
2625800
2910
25007
13553674
213645541119
2442211121
884535801
1237980925291
1913638193091
2501957
124845231463285
551185214847
27274
157685
175462
5198
-1204
17255
17-
29870
673133
-440
--
38427270104
79710
502205
10530
--
7248
874547
166--------
1376200
--
184159
2013-
10740
-
6515
---
15----
15-
10----
64----
167--
161295
-25
1607

TABLE - 7.06DISTRICT-WISE NET AREA IRRIGATED IN ASSAM
110
(Area in Hect.)
1 2 3
KokrajharDhubriGoalparaBarpeta
MorigaonNagaonSonitpurLakhimpurDhemajiTinsukia
DibrugarhSivasagarJorhatGolaghatKarbi Anglong
Dima HasaoCacharKarimganjHailakandiBongaigaonChirang
KamrupKamrup MetroNalbariBaksaDarrangUdalguri
Assam
District 2011-2012 2012-2013(P)
.P = Provisional.Source: (Table 7.01 to 7.06) Irrigation Department, Assam.
13378475
14024298
8742009211097
458475743
1237951870224
15679
38191961200
105576
7478
27022148451
158964047
24364
136450
6578263
23381837
818295499185
505415698
2290322784163
32179
387517661305
925351
5646
5894821
64124854333
27830
151914

TABLE - 7.07DISTRICT-WISE DAMAGE OF FLOOD MANAGEMENT
STRUCTURES (EMBANKMENTS AND OTHERS) IN ASSAMDURING THE FLOOD OF 2012
111
1 2 3 4 5
Kokrajhar
Dhubri
Goalpara
Barpeta
Morigaon
Nagaon
Sonitpur
Lakhimpur
Dhemaji
Tinsukia
Dibrugarh
Sibsagar
Jorhat
Golaghat
Type of embank-ment
(Dyke)
TributaryBrahmaputraTributaryBrahmaputraTributary
BrahmaputraTributaryBrahmaputraTributaryBrahmaputra
TributaryBrahmaputraTributaryBrahmaputraTributaryBrahmaputra
TributaryBrahmaputraTributaryBrahmaputraTributaryBrahmaputra
TributaryBrahmaputraTributaryBrahmaputraTributaryBrahmaputra
DistrictNo. of
embankmentbreached
No. ofbreaches in
the embank-ment
Length ofbreach
(in metre)
Contd...
-----
-11-1-
-6----
-----1
-----
-----
-11-1-
-6----
-----1
-----
-----
-15 M
150 M-
140 M-
-239 M
----
-----
15 M
-----

(...Contd) TABLE - 7.07
112
1 2 3 4 5
Karbi Anglong
Dima Hasao
Cachar
Karimganj
Hailakandi
Bongaigaon
Chirang
Kamrup
Kamrup Metro
Nalbari
Baksa
Darrang
Udalguri
Assam
Type of embank-ment
(Dyke)
Tributary
BrahmaputraTributaryBrahmaputraTributaryBarakTributary
BarakTributaryBarakTributaryBrahmaputraTributary
BrahmaputraTributaryBrahmaputraTributaryBrahmaputra
TributaryBrahmaputraTributaryBrahmaputraTributaryBrahmaputra
TributaryBrahmaputraTributary(Brahm.)Tributary (Barak)BrahmaputraBarak
Total-
DistrictNo. of
embankmentbreached
No. ofbreaches in
the embank-ment
Length ofbreach
(in metre)
-
-----2
-9----
-----
7-----
-
15 Nos.11 Nos.2 Nos.
-
28 Nos.
-
-----2
-9----
-----
7-----
-
15 Nos.11 Nos.2 Nos.
-
28 Nos.
-
-----
80 M
-711 M
----
-----
210 M-----
-
499 M.790 M.290 M.
-
1579 M

TABLE - 7.08ACHIEVEMENT OF WATER RESOURCES DEPARTMENT IN ASSAM
113
1 2 3 4 5
Embankment including retirement
and raising and strengthening
Drainage Channel
Protection and anti-erosion
Major Sluices
Benefited Area
Unit 2010-11Item 2012-132011-12
Km
Km
No.
No.
Lakh Hact.
4473.82
874.76
884.00
94
461902
4473.82
874.77
884
94
61426
4473.82
874.966
893
94
--

TABLE - 7.09STATISTICS ON DAMAGES CAUSED BY FLOODS IN ASSAM
114
N.B. Information for 2009, 2011 and 2012 have not been received from the Revenue Deptt.Source: (Table 7.07 to 7.09) Office of the Chief Engineer, Water Resourses Deptt. and
State Revenue & Disester Management Department Assam.
1 2 3 4 5
Area affected(in Hectares)
No. of Villagesaffected
Crop area affected(in Hectares)
Value of crop lost(Rs. in Lakh)
Population affected(in `000)
Value of Housesdamaged(Rs. In Lakh)
No. of cattle lost
Houses damaged(Fully)
Houses damaged(Partially)
No. of Human LifeLost
Item 2008
416000
3019
314000
329.00
2906
29335.00
8002
30315
26235
40
2007 2010
1504146
10295
674671
N.A.
10868
N.A.
N.A.
15846
N.A.
134
N.A.
3630
147038
3678.87
2546
1099.60
3754
4864
49638
17
-
1,592
71213.79
-
848
-
1,81,114
44
547
Nil
2013(Upto 15/10/2013)

8.LIVESTOCK ANDVETERINARYFIGURE AT A GLANCE
Total Cattle as per Live Stock Census, 2007 (in nos.)
Total Buffalo as per Live Stock Census, 2007 (in nos.)
Total Livestock as per Live Stock Census, 2007 (in nos.)
Total Poultry as per Live Stock Census, 2007 (in nos.)
Total Cattle as per Sample Survey, 2012-13 (in nos.)
Total Buffaloes as per Sample Survey, 2012-13 (in nos.)
Total Poultry as per Sample Survey, 2012-13 (in nos.)
Production of Milk (in million litres) 2012-13
Production of Egg (in million nos.) 2012-13
Production of Meat (in `000 tonne) 2012-13
No. of Veterinary Hospitals, 2012
No. of Dispensaries, 2012
No. of Sub Centre/ FAC/SMC,2012
No. of Key Village Centre,2012
Total Livestock Vaccinated, 2012 (in nos.)
Total Poultry Vaccinated, 2012 (in nos.)
10365583
525835
17772331
39119732
9563231
535317
15291335
845
471
37.00
22
346
739
38
808461
227139

TABLETOTAL LIVESTOCK AND POULTRY POPULATION
116
KokrajharDhubriGoalparaBarpetaMorigaon
NagaonSonitpurLakhimpurDhemajiTinsukiaDibrugarh
SivasagarJorhatGolaghatKarbi AnglongDima HasaoCachar
KarimganjHailakandiBongaigaonChirangKamrupNalbari
BaksaDarrangUdalguri
Assam
District Cattle Buffaloes Goats
1 2 3 4 5
415491484440230235
470456311953848171731134512218431925
321189519585413355508094464093
40042940363
353890307068151474245213
277399675291222283336456294965398413
10365583
1898025779
8331
153491427612338200861502815833
2359124662254223111127522
1486733302660274853034973
2660
11554712847032997
154935293
525835
188636343224792
30839116421009412562
908319
078
111310
443700
12363159151411230432
67662890719948
949338299
9330
360379
18512422086194269
234130123467361987330197168252135645
130754220493172055182395211725
17655040433
1574911219296218491589
57157281578127569161544160349166423
4376150
Sheep

8.01OF ASSAM AS PER 18th LIVE STOCK CENSUS, 2007
117
TotalLivestock Fowls Ducks
Horse andPonies
Pigs
49708932
438213
1814211
20102044
99510323770397
3135346018
5
1930
1830
137
10953
933731254258558
122562996360367
108754142586177749
810843258857971490396
120650
1684318091228341
425125406947
13171568455
528312295413985
105740
2133431
6 7 8 9 10
731881807762417117
763468491514
12947711202944841002763515
5567171091213690980812797824387
760751195745618146497753265301376846
4846101061389379969633444523104685206
17772331
705941874930675210
1176228482723
1338726843509403337398575
6113282117197692688451614601277
3952628150066
1094920985335412924467694
394750779266303070448420
4883430685295
25931081
141739311066120189
532895305530
5776473388077269490286679
127766638610314754686953549884
32519314035
240553198640178031115075
110756490150303954265021265228224361
13181102

TABLE - 8.02ESTIMATED LIVESTOCK AND POULTRY POPULATION
IN ASSAM, 2012-13 (Sample Survey)
118
KokrajharDhubri
GoalparaBarpetaMorigaonNagaonSonitpurLakhimpur
DhemajiTinsukiaDibrugarhSivasagarJorhat
GolaghatKarbi AnglongDima HasaoCacharKarimganjHailakandi
BongaigaonChirangKamrupKamrup MetroNalbariBaksa
DarrangUdalguri
Assam
DistrictIndigeneous
Cattle
CrossedBreedCattle
Buffaloes Goats Fowls Ducks
1 2 3 4 5 6 7
394492437130259703416777
271370450272539300383636331809436589
413608372621378358432097488414127996
489255348071168155313499
-450425
307187233968420949227703
9093384
6635137838248
31552
16542279242377891795111
14893
21464151324055615847204576173
19842137749135
17629-
70910
198365984
279297534
469847
22509328211776722979
165882369426369224732180321747
253312359727347241572343818104
30398269572557014521
-19352
116737279
1713011713
535317
132136186658102409154888
8983920427920618210504098185
117167
16209312241811690714096515863550859
1082479057660902
104449-
175323
10023399078
131405110141
3129014
266781295276348635330999
309804418119433775284033256046367555
363694337168315057265374431497247321
309627310573240379347907
-336437
296059234237383624212840
7942817
108945126637107964128439
81467151569251226134995124887147494
15067512322410683014106323807159463
112449966978115280942
-163892
7313376495
138114100313
3106136

TABLE - 8.03PRODUCTION OF MILK, EGG AND MEAT IN ASSAM
119
2001-2002
2002-2003
2003-2004
2004-2005
2005-2006
2006-2007
2007-2008
2008-2009
2009-2010
2010-2011
2011-2012
2012-2013
Year
750
773
796
812
821
823
824
827
830
832
838
845
Milk(Million Litres)
507
509
513
522
536
535
490
466
468
470
471
471
Egg(Million Nos.)
Meat(`000 tonne)
19.48
20.94
22.35
24.70
25.60
28.80
29.00
30.70
31.59
34.00
34.19
37.00
1 2 3 4
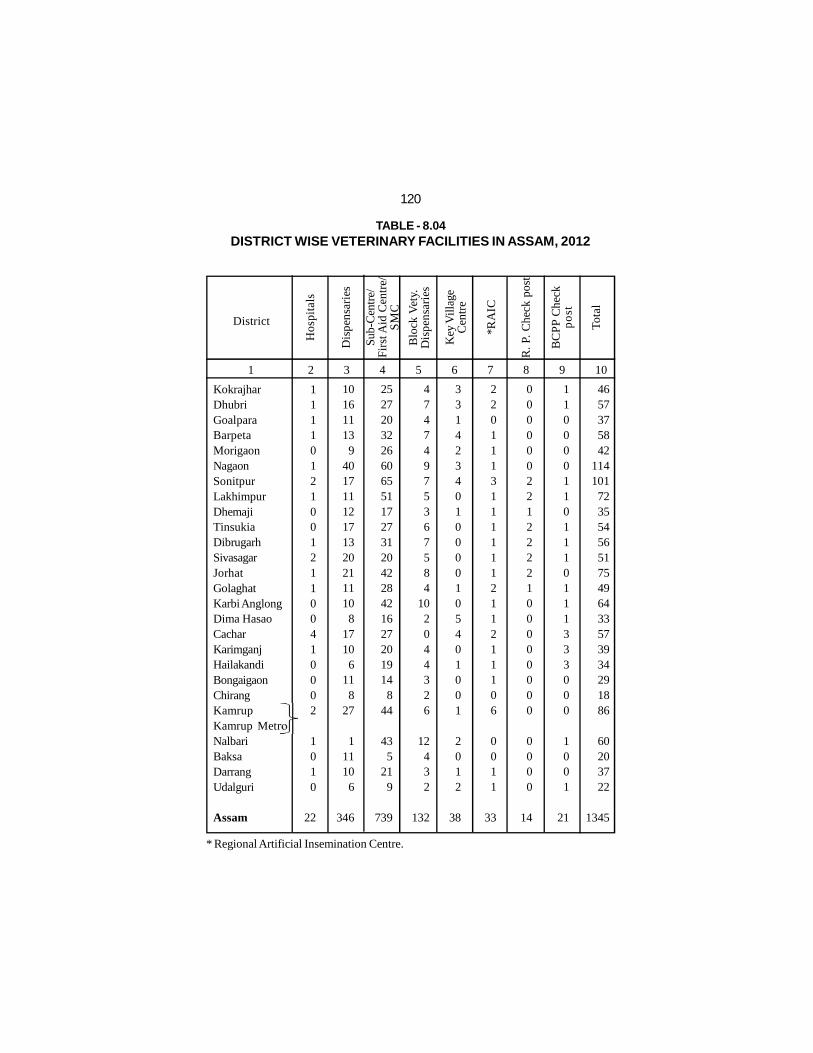
TABLE - 8.04DISTRICT WISE VETERINARY FACILITIES IN ASSAM, 2012
120
KokrajharDhubriGoalparaBarpetaMorigaonNagaonSonitpurLakhimpurDhemajiTinsukiaDibrugarhSivasagarJorhatGolaghatKarbi AnglongDima HasaoCacharKarimganjHailakandiBongaigaonChirangKamrupKamrup MetroNalbariBaksaDarrangUdalguri
Assam
DistrictH
ospi
tals
Dis
pens
arie
s
Sub-
Cen
tre/
Fir
st A
id C
entr
e/S
MC
Key
Vill
age
Cen
tre
*RA
IC
Blo
ck V
ety.
Dis
pens
arie
s
1111012100121100410002
1010
22
101611139
401711121713202111108
17106
118
27
111106
346
47474975367584
102044326
12432
132
25272032266065511727312042284216272019148
44
435
219
739
3314234010000105401001
2012
38
2201113111111211211106
0011
33
1 2 3 4 5 6 7 8 9 10
BC
PP
Che
ckp
ost
Tota
l
4657375842
114101
723554565175496433573934291886
60203722
1345
1100001101110111333000
1001
21
0000002212222100000000
0000
14
R. P
. Che
ck p
ost
* Regional Artificial Insemination Centre.

TABLE - 8.05PERFORMANCE OF VETERINARY HOSPITALS AND
DISPENSARIES IN ASSAM, 2012
121
Source: (Table 8.01 to 8.05) Directorate of Animal Husbandry and Veterinary Deptt.,Assam.
KokrajharDhubriGoalparaBarpetaMorigaonNagaonSonitpurLakhimpurDhemajiTinsukiaDibrugarhSivasagarJorhatGolaghatKarbi AnglongDima HasaoCacharKarimganjHailakandiBongaigaonChirangKamrupKamrup MetroNalbariBaksaDarrangUdalguri
Assam
District
1 2 3 4 5 6 7 8
Con
tagi
ous
Non
-con
tagi
ous
Non
-con
tagi
ous
Liv
esto
ckC
astr
ate
Liv
esto
ck
Con
tagi
ous
Pou
ltry
TreatedVaccinated
Live Stock Poultry
570
380990
91251172888
17194
00
1784145
1282500
1460
3520000
3410
72540
74793
2749316447
10097215773577621
1329628314056215
9210
7002116313512172435136517773
0119592
067262
69123177928627073069421
04525851463
1917980
00
487390
538508
1330901278
00
19320000
1880
2490000
10920
1570
55912
103373627
1271109202028450546392507319165
100
684166345127920
2496706559
037252
061819
21812755642153514423048
02940040779
1081077
2136734
471874158
10158113961801915721
1930
14145193901325488385088
03972
03988
1692491619342074233
029579426
208053
1313325040543826544546360409482275749998
00
3686584996917864408211732
028082
013492
12711959476343019221186
01860449661
808461
11922
10994885
126264400
194229380
00
38613180096502
149869089
04923
0000
300221977512220
0170
13200
227139

9.FISHERYFIGURE AT A GLANCE 2012-13
No. of Registered Beel Fisheries
Area under Registered Beel Fisheries (Hect.)
Ponds and Tanks (Nos.)
Area under Ponds and Tanks (Hect.)
Area under River Fisheries (Km.)
Area under Forest Fisheries (Hect.)
Area under Derelict Water Bodies/ Swamps (Hect.)
Reservoir Fisheries (Hect.)
Production of Fish Seeds (Million Nos.)
Production of Fish (Tonne)
430
60215
366656
59707
4820
5017
116444
1713
4364
254270

TABLE - 9.01DISTRICT-WISE PRODUCTION OF FISH SEED AND FISH
IN ASSAM
123
Kokrajhar
DhubriGoalparaBarpetaMorigaonNagaonSonitpur
LakhimpurDhemajiTinsukiaDibrugarhSibsagar
JorhatGolaghatKarbi AnglongDima HasaoCacharKarimganj
HailakandiBongaigaonChirangKamrup(M+R)NalbariBaksa
DarrangUdalguri
Assam
District
1 2 3 4 5
Production of fish seed(in Million Nos.)
Production of fish(in Tonne)
60
5020
172347
10029
208
231944
1229
--
701021
1448
93164625
1-
4490
3193
165987334
1563510990242627002
121405096660775609610
1301085782200
2801815014304
935858001943
1939290265296
75472958
243869
2012-132011-12 2012-132011-12
66
1427
183337
60148
228
2019
6
1130
00
101716
4801395
27
32
66110
4364
3761
133507650
1641611250261847205
123155100668978609800
1320087502260
7501892017710
1005360701925
19729102004150
112731700
254270

TABLE -DISTRICT WISE NUMBER AND AREA UNDER
124
KokrajharDhubriGoalparaBarpeta
MorigaonNagaonSonitpurLakhimpurDhemajiTinsukia
DibrugarhSivasagarJorhatGolaghatKarbi AnglongDima Hasao
CacharKarimganjHailakandiBongaigaonChirangKamrup
Kamrup MetroNalbariBaksaDarrangUdalguri
Assam
District
1 2 3 4 5
14156
572384
1346020
16363866
124
1519
1753735
471659
1918
271
1197
Beel Fisheries Ponds & Tanks
9556999
682062998299991970326499
45752957528938786298
260060
3335934591241
4348145
1418
2248151
59595
100815
750021587
88102398010755409321435510557
38687919637890316309
72757942
619366432156634394
67302973
21642
225058873
2341895
366656
10122802
155538401671627016821725
4141503
7511150
983
9511418
111637338236617
970342
3005
26601781
627523
59707
Nos. Area Nos. Area

9.02FISHERIES IN ASSAM, 2012-2013
125
Derelict Water Bodies/Swamps
6 7 8 9 10 11
163283
70160163143132
68
160126115216245
102106
13437
52225
7016
116-
51593
7820
3887
Reservoir Fisheries Forest Fisheries
10298280
67761191583
23578461
4273
731394310
71297592
557332
51004931240
2343
160660
322-
3645326
371390
116444
--
------
-----
--1---
------
--
1
--
------
-----
--
1713---
------
--
1713
2-
-11
986-
8533-
12-----
2-2---
--
71
35-
-131955410270
-
900240
4692
-
1720-----
51-
167---
--
5017
Nos. Area Nos. Area Nos. Area
(Area in Hect.)

TABLE - 9.03STATISTICS OF FISHERIES ON INLAND WATER BODIES IN
ASSAM
126
River Fisheries
Main River
Tributories
Beels/OX-bow Lakes
Registered Beel
Un-registered Beel
Forest Fisheries
Derelict Water Bodies/Swamp
Reservoir Fisheries
Ponds and Tank
TypeNumber
Water Spread Area(in Hect.)
2011-12 2012-13 2011-12 2012-13
1.
2.
3.
4.
5.
6.
2
53
430
767
71
3887
1
359354
*4820
60215
40600
5017
116444
1713
58510
(i)
(ii)
(i)
(ii)
1 2 3 4 5
2
53
430
767
71
3887
1
366656
*4820
60215
40600
5017
116444
1713
59707
*Area in Km.

TABLE - 9.04DISTRICT WISE NUMBER OF ECO-HATCHERIES IN ASSAM
127
Kokrajhar
Dhubri
Goalpara
Barpeta
Morigaon
Nagaon
Sonitpur
Lakhimpur
Dhemaji
Tinsukia
Dibrugarh
Sivasagar
Jorhat
Golaghat
Karbi Anglong
Dima Hasao
Cachar
Karimganj
Hailakandi
Bongaigaon
Chirang
Kamrup(R+M)
Nalbari
Baksa
Darrang
Udalguri
Assam
District
1 2 3
No. of Eco-Hatcheries
2011-2012
1
10
3
11
7
109
4
11
7
3
6
4
7
3
-
-
6
13
1
1
-
6
9
5
14
2
243
2012-2013
Source: (Table: 9.01 to 9.04) Directorate of Fisheries, Assam.
4
10
9
43
31
126
8
10
8
12
9
4
7
9
6
0
13
25
4
6
1
13
12
6
13
2
391

10.FORESTFIGURE AT A GLANCE
Total Forest Area as on 31-03-2013(Excluding unclassed State Forest)
Reserved Forest Area
Proposed Reserves Forest Area
Protected Area Network
National Park, 2012-13
Wildlife Santuaries, 2012-13
Proposed Wildlife Sanctuaries, 2012-13
Forest Road (Motorable), 2013
Forest Road (Non-motorable), 2013
Forest Revenue, 2013
No. of seedlings planted under Social Forestry Scheme, 2012-13
1935173.324 hect.
1397315.873 hect.
175741.670 hect.
362115.781 hect.
5 Nos.
18 Nos.
2 Nos.
6235.357 Km
4437.29 Km
3350.15 Lakh
4534th Nos.

TABLE - 10.01FOREST DIVISION WISE AREA UNDER FOREST IN ASSAM
(As on 30-01-2013)
129
Contd...
(Area in Hect.)
Goalpara
Kamrup East
Kamrup West
North Kamrup
Dibrugarh
Digboi
Doom Dooma
Golaghat
Jorhat
Sivasagar
Hamren
Karbi-Anglong East
Karbi-Anglong West
Dima Hasao
Baksa
Lakhimpur
Dhemaji
Nagaon
Nagaon South
Sonitpur East
Sonitpur West
Silchar (Cachar)
Sl.No.
1 2 3 4 5 6
1
2
3
4
5
6
7
8
9
10
11
12
13
14
15
16
17
18
19
20
21
22
ForestDivision
ReservedForest
ProposedReserved
Forest
ProtectedArea
Total Forest(Excludingunclassed
State Forest)
22946.563
37052.356
75549.276
4412.197
20728.678
49598.074
29404.176
80154.089
26096.841
24092.903
27454.539
61995.937
109282.007
63776.154
13542.551
31097.441
42468.430
35310.086
64873.521
73927.302
44129.201
34199.791
11387.510
11596.460
568.850
1141.400
-
5479.150
4252.750
133.450
-
-
-
84089.600
3525.000
-
-
-
9400.000
3573.000
-
-
910.000
-
-
-
-
-
11119.420
8712.000
-
9715.000
2098.621
3393.000
-
34042.000
451.000
-
-
-
1121.800
-
-
-
-
7386.900
34334.073
48648.816
76118.126
5553.597
31848.098
63789.224
33656.926
90002.539
28195.462
27485.903
27454.539
180127.537
113258.007
63776.154
13542.551
31097.441
52990.230
38883.086
64873.521
73927.302
45039.201
41586.691

(...Contd) TABLE - 10.01
130
(Area in Hect.)
Hailakandi
Karimganj
Aie-Valley
Dhubri
Haltugaon
Kachugaon
Dhansiri
Parbatjhora
Chirang
West Assam W.L.
Tinsukia W.L.
Nagaon W.L.
Mangaldoi W.L.
Assam State Zoo
Kokrajhar W.L.
Manas Tiger Project
East Assam W.L.
Bokakhat.
Guwahati W.L.
Assam Total
23
24
25
26
27
28
29
30
31
32
33
34
35
36
37
38
39
40
Sl.No.
1 2 3 4 5 6
ForestDivision
ReservedForest
ProposedReserved
Forest
ProtectedArea
Total Forest(Excludingunclassed
State Forest)
78145.833
48057.303
6144.969
6082.060
63806.919
82199.117
17812.765
28041.484
55957.550
-
32677.785
2155.000
-
175.000
-
2837.120
1130.855
-
1397315.873
170.000
6489.090
5901.730
865.770
2949.000
213.000
3963.000
17732.910
1400.000
-
-
-
-
-
-
-
-
-
175741.670
-
32625.000
-
-
-
-
2822.000
-
-
42000.000
34722.000
11417.040
7881.000
-
4556.000
50000.000
85898.00
12155.000
362115.781
78315.833
87171.393
12046.699
6947.830
66755.919
82412.117
24597.765
45774.394
57357.550
42000.000
67399.785
13572.040
7881.000
175.000
4556.000
52837.120
87028.855
12155.000
1935173.324

TABLE - 10.02OUT TURN OF TIMBER, FUEL-WOOD AND MINOR FOREST
PRODUCTS IN ASSAM, 2012-13
131
Kamrup WestKamrup EastNorth KamrupGoalparaSonitpur EastSonitpur WestNagaonLakhimpurDhemajiNagaon SouthAie ValleyDhubriGolaghatDibrugarhDoomdoomaJorhatSivasagarDigboiHailakandiKarimganjCacharDhanshreeHaltugaonKachugaonParbotjhoraChirangKarbi-Anglong EastKarbi-AnglongWestHamrenDimaHasaoF.U.O.GuwahatiBaska
Assam
1 2 3 4 5 6 7
Forest DivisionIn
dust
rial
Tim
ber
(m3 )
Fuel
-Woo
d(m
3 )
Minor Forest Products (m3)
SandGravel/Stone
Silt/Clay Others
846.02438.06171.62
40.75112.21
35.65935.34
1207.9545.06
4856.25580.13408.96
37.1231.9214.51
7.41334.04424.05
80.0983.3279.43
------------------
15.84--
10803.73
------
5.49--
74.47----------------
377.673.33
--------------------------------
460.96
6283.93132846.7336809.72
6464.847977.096547.26
402356.7921.45
24031.9898374.64
6264.0132789.95
4321.6821262.89
1764.444968.08
15873.534748.038110.16
52021.74140148.01
----------------------
1009241.92
7395.70156350.3943322.21
7608.629388.427705.62
473542.9925.25
28283.79115779.38
7372.2638591.24
5086.2825024.78
2076.615847.05
18681.925588.079545.04
61225.58164943.42
----------------------
1193384.62
----
573.3735023.0016070.75
--95000.00
520.59--
39000.00--
51237.00----
500.00------------------------------
10201.75
248126.46
12511.11101770.20121987.64
18488.0422462.8012998.80
200622.2054890.2013874.9634192.0814729.1234839.7662872.6060403.4084486.4852553.2829656.4445848.7240456.9212458.9219464.88
------------------
2710.64--
1051568.55
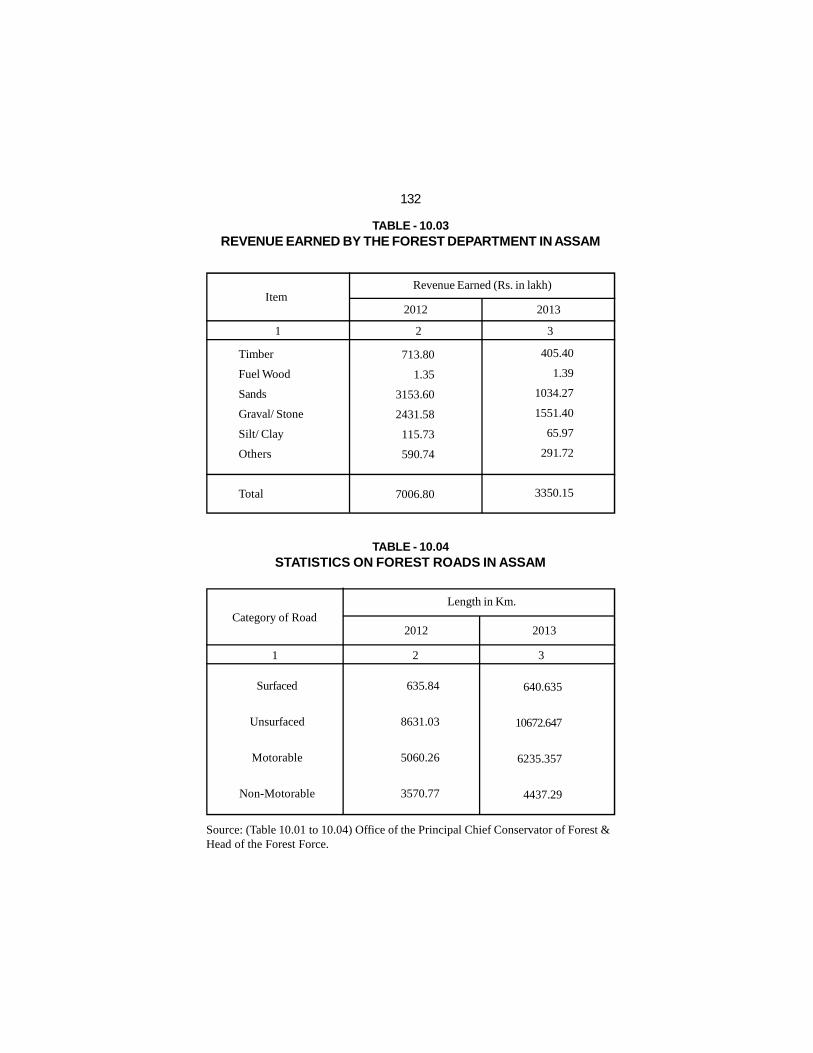
132
TABLE - 10.03REVENUE EARNED BY THE FOREST DEPARTMENT IN ASSAM
TABLE - 10.04STATISTICS ON FOREST ROADS IN ASSAM
Timber
Fuel Wood
Sands
Graval/ Stone
Silt/ Clay
Others
Total
ItemRevenue Earned (Rs. in lakh)
Category of RoadLength in Km.
1 2 3
Surfaced
Unsurfaced
Motorable
Non-Motorable
2012
635.84
8631.03
5060.26
3570.77
2013
1 2 3
Source: (Table 10.01 to 10.04) Office of the Principal Chief Conservator of Forest &Head of the Forest Force.
2012 2013
713.80
1.35
3153.60
2431.58
115.73
590.74
7006.80
405.40
1.39
1034.27
1551.40
65.97
291.72
3350.15
640.635
10672.647
6235.357
4437.29

TABLE - 10.05NATIONAL PARKS AND WILDLIFE SANCTUARIES IN ASSAM,
2012-13
133
National Parks
Kaziranga
Manas
Nameri
Dibru Saikhowa
Orang
Name of the Wildlife Sanctuaries
Chakrasila
Amchang
Deepar Beel
Barnadi
Burachapori
Sonai Rupai
Pobitora
Laokhowa
858.98
500.00
200.00
340.00
78.81
45.56
78.64
4.14
26.22
44.06
220.00
38.80
70.13
National Parks/Wildlife Sanctuaries
Golaghat, Nagaon
& Sonitpur
Chirang & Baksa
Sonitpur
Dibrugarh & Tinsukia
Udalguri and Sonitpur
Kokrajhar
Kamrup Metro
Kamrup Metro
Udalguri
Sonitpur
Sonitpur
Morigaon
Nagaon
Location (District)
1 2 3
Area in(Sq. Km.)
A
1.
2.
3.
4.
5.
B
1.
2.
3.
4.
5.
6.
7.
8.
Contd...

(...Contd) TABLE - 10.05
134
Nambor (Doigurung)
Gibbon
Panidehing
Dehing Patkai
Bherjan Borajan Podumoni
Garampani
Nambor
East Karbi-Anglong
Marat Longri
Borail
Proposed Wildlife Sanctuaries
Bordoibum Beelmukh
North Karbi-Anglong
97.15
20.98
33.93
111.19
7.22
6.05
37.00
221.81
451.00
326.25
11.25
96.00
National Parks/Wildlife Sanctuaries
Golaghat
Jorhat
Sibsagar
Dibrugarh & Tinsukia
Tinsukia
Karbi-Anglong
Karbi-Anglong
Karbi-Anglong
Karbi-Anglong
Cachar
Lakhimpur
Karbi-Anglong
Location (District)
1 2 3
Area in(Sq. Km.)
9.
10.
11.
12.
13.
14.
15.
16.
17.
18.
C
1.
2.

TABLE - 10.06CENSUS OF WILDLIFE IN ASSAM
135
Source: (Table 10.05 & 10.06) Office of the Principal Chief Conservator of Forest(Wildlife), Assam.
1. ELEPHANT 2002 2008 2009
2. TIGER 1997 2000 2009
3. RHINO 2006 2009 2011
20134. LEOPARD
1993 2000
PRIMATE CENSUS DURING 2009
Rhesus MacaqueAssamese MacaquePig tailed MacaqueStumptailed MacaqueSlow LorisCapped LangurGolden LangurPhayre’s leaf Monkey/Spectacled LangurHoolock Gibbon
1 2
524652815620
458354143
2006220125032544
239248
7267430866
649648431
178132772132
1517
Year of Census Numbers

TABLE-DISTRICT-WISE PHYSICAL ACHIEVEMENT UNDER
136
KokrajharDhubriGoalparaBarpetaMorigaonNagaonSonitpurLakhimpurDhemajiTinsukiaDibrugarhSivasagarJorhatGolaghatKarbi AnglongDima HasaoCacharKarimganjHailakandiBongaigaonChirangKamrupKamrup MetroNalbariBaksaDarrangUdalguri
Assam
1 2 3 4 5 6 7
District
Tribal Sub-Plan(TSP)
Social ForestryGeneral (SFG)
Rural Fuel Wood(RFW)
2010-11 2011-12 2010-11 2011-12 2010-11 2011-12
--
1.51.50.5
111-
0.50.5
10.50.5
--1111-111-
0.5-
17
--
5.52.5
14-2--12
0.51--11-7-523-
0.5-
39
---------------------------
-
-----
1.001.001.00
-----------
1.00-------
4.00
--
0.250.250.500.500.250.29
--
0.500.500.250.25
--
0.250.500.250.50
-0.500.500.25
-0.25
-
6.54
--
0.25--
0.26----
0.500.25
-0.26
--
0.500.50
-2.00
-2.500.300.50
---
7.82

10.07VARIOUS SCHEMES OF SOCIAL FORESTRY IN ASSAM
137
* Central Scheme.
(Area in Hect.)
KokrajharDhubriGoalparaBarpetaMorigaonNagaonSonitpurLakhimpurDhemajiTinsukiaDibrugarhSivasagarJorhatGolaghatKarbi AnglongDima HasaoCacharKarimganjHailakandiBongaigaonChirangKamrupKamrup MetroNalbariBaksaDarrangUdalguri
Assam
8 9 10 11 1
District
--
1.001.001.001.001.001.001.001.001.001.001.001.00
1.001.001.001.00
-1.001.001.00
-1.00
-
20.00
--
2.00--------
1.00----
1.001.00
-1.50
--
167.00----
173.50
50-
150-
10017520040
-200
-150
--
1150400300200500600
-450600100
---
5365
500-
550-
375250500405
-850190475300345
46002600700700
1200600
-850
1100475
-350
-
179151
2010-2011 2011-2012 2010-2011 2011-2012
Mukhya Mantrir Assam BikashYojona (MMABY)
National AfforestationProgramme
(NAP)*

TABLE -DISTRICT-WISE TARGET AND ACHIEVEMENT
138
KokrajharDhubriGoalparaBarpetaMorigaonNagaonSonitpurLakhimpurDhemajiTinsukiaDibrugarhSivasagarJorhatGolaghatKarbi AnglongDima HasaoCacharKarimganjHailakandiBongaigaonChirangKamrupKamrup MetroNalbariBaksaDarrangUdalguri
Assam
1 2 3 4 5
District
Target
2011-2012
500
125.52.5
24
2033.5
12021.5
153.51.51.5
400400302
203.5501.5
20-
6053.5
010
31697
019202023252719192120202021
00
21212021
0-
6821
019
0
446
00
5.52.5
15130012
0.5100110805230
0.50
43
019202023252719192120202021
00
21212021
068
021
019
0
446
2010-2011
Area in hect. No. of SchoolNo. of School Area in hect.
Source: (Table 10.07 & 10.08) Office of the Chief Conservator of Forest (Social Forestry), Assam.

139
6 7 8 9 10 11
500
125.52.5
24
2033.5
12021.5
153.51.51.5400400302
203.5501.5
20-
6053.5
010
3197
019202023252719192120202021
00
21212021
0-
6821
019
0
446
00
5.52.5
15130012
0.5100110805230
0.50
43
019202023252719192120202021
00
21212021
068
021
019
0
446
2010-2011 2011-2012
2010-2011 2011-2012
Achivements No. of SeedlingsPlanted
(in thousand Nos.)
No.of SchoolNo.of SchoolArea in hect. Area in hect.
556
8218563477246485561214252166452162164444
416417417486
00
430749
0145
0
8994
06
556256307508108206
66
10620656
10600
106106
6806
0520200306
056
0
4534
10.08OF SOCIAL FORESTRY IN ASSAM

11.INDUSTRYFIGURE AT A GLANCE, 2012-13
Production of Tea (`000 tonne)
Production of Fertiliser ,,
Production of Jute ,,
Production of Wheat flour ,,
Production of Cement ,,
General Index of Industrial Production(Base: 2004-05=100)
Registered MSME units (nos.)
Workers in MSME units (nos.)
Area under Industrial Estate (in Sq. mtr)
Unit functioning (nos.)
Area under Industrial Area (in Sq. mtr)
Unit functioning (nos.)
Area under Mini Industrial Estate (in sq. mtr)
Unit functioning (nos.)
Area under Integrated Infrustructure Dev. Project (in sq. mtr)
Unit functioning (nos.)
Area under Growth Centre (in sq. mtr)
Unit functioning (nos.)
Area under Industrial Growth Centre (in sq. mtr)
Unit functioning (nos.)
Area under Border Trade Centre (in sq. mtr)
Area under Plastic Park (in sq. mtr)
Registered Factories, (nos.) 2012
Workers in the Factories, (nos.) 2012
588
514
23
898
1181
135.06 (P)
1451
11671
1846505.80
296
2108019.30
191
53176.65
51
1617254.76
38
161163.97
22
5130886.00
28
290303.7
2006707.70
4895
185243

TABLE - 11.01ANNUAL SURVEY OF INDUSTRIES (SUMMARY RESULTS)
IN ASSAM
141
Source: Central Statistics Office (Industrial Statistics Wing), Ministry of Statistics &Programme Implementation, Government of India.
1.
2.
3.
4.
5.
6.
7.
8.
9.
10.
11.
12.
13.
14.
15.
16.
1 2 3 4 5 6
Item Unit
Number
Rs.in Lakh
do
do
do
do
Number
do
Rs. in Lakh
do
do
do
do
do
do
do
2795
1074713
665211
716304
1739924
510120
141274
166657
88639
209009
3470513
3886280
4236700
98838
667349
608348
1859
891081
410884
346159
1301965
245789
113132
134284
42729
92125
2705324
2779940
3104360
71563
327473
284121
2211
940427
421501
335954
1361928
374052
126338
149256
54440
124530
3297786
3244850
3676790
77614
301389
251007
2247
980140
486634
519604
1466773
360552
125759
148731
62040
156016
3090111
3329994
3667156
70833
506212
462096
2010-112007-08 2008-09 2009-10
Factories
Fixed Capital
Physical Working
Capital
Working Capital
Invested Capital
Outstanding Loan
Total Workers
Total Persons
Engaged (Workers,
Employees etc.)
Wages of workers
Total Emoluments
Total Input
Value of Products &
By Products
Value of Output
Depreciation
Net Value Added
Net Income

TABLE-INDEX OF INDUSTRIAL
( Base:
142
Source: Directorate of Economics and Statistics, Assam.NIC: National Industrial Classification; P: Provisional.
1 2
NIC2004
15
16
17
21
22
23
24
25
26
27
28
29
31
32
33
34
36
15-36
10-14
15-36
40
Industry Division
Manufacturing of food products & beverages.
Manufacturing of tobacco products
Manufacturing of Textiles
Manufacturing of Paper & paper products
Publishing, Printing & reproduction of recorded media.
Manufacturing of Coke, Refined Petroleum products & Nuclear fuel.
Manufacturing of Chemical & Chemical products.
Manufacturing of Rubber & Plastic products
Manufacturing of other non-metallic mineral products.
Manufacturing of basic metals.
Manufacturing of fabricated metal products, except machinery &
equipments.
Manufacturing of machinery & equipments N.E.C.
Manufacturing of electrical machinery and apparatus N.E.C.
Manufacturing of radio, television and communication equipments
and apparatus
Manufacturing of medical, precision and optical instruments,
watches and clocks
Manufacturing of motor vehicles, trailers and semi-trailers
Manufacturing of furniture, manufacturing N.E.C.
TOTAL MANUFACTURING
MINING AND QUARRYING
MANUFACTURING
ELECTRICITY
GENERAL INDEX

61.2047
14.6099
1.4629
20.7821
1.0568
231.3258
72.0573
4.8761
16.2439
4.4177
0.3781
3.7769
2.283
1.4032
0.0361
0.0907
0.4049
436.9213
487.1405
436.9213
75.9382
1000
3 4 5 6 7 8 9
Weight 2007-08 2008-09 2009-10 2010-11 2011-12 2012-13(P)
106.13
145.95
148.08
106.47
166.73
133.77
138.02
112.50
112.50
137.20
135.90
142.55
170.25
114.47
128.08
125.81
111.35
129.14
101.05
129.14
121.85
114.90
110.68
147.36
147.61
109.61
198.65
144.99
169.75
140.93
113.76
143.32
142.28
173.07
179.33
117.67
125.79
126.24
120.38
141.95
102.86
141.95
132.13
122.16
114.18
150.25
150.40
110.61
206.59
151.46
171.91
142.24
120.87
145.92
142.91
176.45
180.14
118.45
126.24
127.31
123.58
146.74
103.73
146.74
124.11
124.07
115.47
155.81
152.17
115.56
216.25
149.01
174.94
187.38
140.54
146.00
155.97
191.23
215.41
121.18
134.83
129.68
129.93
148.17
103.08
148.17
126.83
124.58
117.47
176.66
158.59
117.84
221.94
166.56
178.52
188.65
146.30
148.99
171.01
202.03
236.24
126.48
143.22
133.55
134.58
159.67
108.35
159.67
133.42
132.68
136.70
193.53
178.21
135.63
254.69
161.95
217.53
211.37
175.88
196.32
208.45
258.55
256.36
134.61
164.86
223.66
156.95
170.48
105.15
170.48
123.09
135.06
143
11.02PRODUCTION IN ASSAM2004-2005=100 )
P: Provisional.

TABLE-PRODUCTION OF SOME SELECTED
144
Source: (i) Estimated data from registered Selected Industries related to I.I.P.
Tea(Tonnes)
Coal(`000 Tonnes)
Fertilizer(Tonnes)
April
May
June
July
August
September
October
November
December
January
February
March
Total
37025
30968
62824
76311
84080
66962
70470
37100
15820
1960
70
17830
501420
36050
53640
72740
77290
92440
88500
75620
59040
22510
800
130
9380
588140
70
50
40
11
5
22
22
20
50
50
90
160
590
31
64
26
18
28
18
28
72
90
36
80
114
605
20390
19893
23570
20179
24840
45454
45516
28819
40325
41669
39491
43788
393934
33534
30606
33128
30934
34392
48412
47148
55565
47635
50965
48639
52984
513942
2011-12 2012-13 2011-12 2012-13 2011-12 2012-13
Month
1 2 3 4 5 6 7

11.03INDUSTRIES IN ASSAM
145
(ii) Data of tea from the Tea Board of India and (iii) Coal & Petroleum Crude from I.B.M., Nagpur.
Jute(Tonnes)
Petroleum Crude(`000 Tonnes)
Wheat Flour(`000 Tonnes)
Cement(`000 Tonnes)
2011-12 2012-13 2011-12 2012-13 2011-12 2012-13 2011-12 2012-13
1819
1933
1940
1938
1898
1901
1851
1932
1920
1910
1835
1840
22717
1237
1898
1482
1584
1800
1262
1644
1847
1698
1961
1708
1835
19956
409
412
404
427
425
405
411
396
404
389
360
419
4861
416
423
412
426
428
415
423
408
419
423
399
431
5023
81
84
79
64
72
61
63
81
74
84
73
82
898
118
99
63
57
83
65
46
67
69
57
72
70
866
117
108
96
97
98
90
99
91
92
91
99
103
1181
78
76
79
79
78
80
83
84
86
86
87
88
984
8 9 10 11 12 13 14 15

TABLE-NUMBER OF REGISTERED MSME UNITS, INVESTMENT IN PLANT
OF INDUSTRIES AND
146
P & M = Plant and Machinery.
KokrajharDhubriGoalparaBarpetaMorigaonNagaonSonitpurLakhimpurDhemajiTinsukiaDibrugarhSivasagarJorhatGolaghatKarbi AnglongDima HasaoCacharKarimganjHailakandiBongaigaonChirangKamrup &Kamrup MetroNalbariBaksaDarrangUdalguri
Assam
1 2 3 4 5 6 7 8 9
District
Unit Registered during the year
Micro Small Medium Total
103233312467821740444927605642
5722234920
244
686
5611
1134
-31217711297962-51-41
64
211-
137
---------1-1--------1
10
----
13
1035343325748918414758356962
62
6223235322
318
707
5711
1284
Micro Small Medium Total
1254264837
11347222773
11375733833
382137478
225
88103813
1289
12-6-
1071-745943-
114-12
69
1141
153
---------111----1---13
--1-
9
1356265437
12354232781
118818242
63
5025374811
297
89114314
1451
2011-12 2012-13

11.04& MACHINERY AND WORKERS UNDER THE COMMISSIONERATECOMMERCE, ASSAM
147
KokrajharDhubriGoalparaBarpetaMorigaonNagaonSonitpurLakhimpurDhemajiTinsukiaDibrugarhSivasagarJorhatGolaghatKarbi AnglongDima HasaoCacharKarimganjHailakandiBongaigaonChirangKamrup &Kamrup MetroNalbariBaksaDarrangUdalguri
Assam
10 11 12 13 1
District
Investmentin P&M
(Rs. in Lakh)
No. ofWorkers
58.69278.3669.27
289.60152.58922.16891.1385.98
158.841113.87
927.572343.311314.91
788.08347.15
2.10533.86112.4144.45
808.59594.91
15381.56
191.9882.42
272.1610.21
27776.15
7225119824014360360887
209336625
26469853906921
524132100396208
4274
39944
25373
13886
2011-12 2012-13 2011-12 2012-13
349.34239.92
31.28382.39
56.601174.93855.49
64.8138.98
1211.04818.73
1838.831535.36518.47183.40
4.402336.24188.16
21.02191.54
1124.9912026.38
156.07250.24
1611.10187.76
27397.47
106314139555189718319141104473470760565245
7636
1802133155258
803051
439134310
99
11671
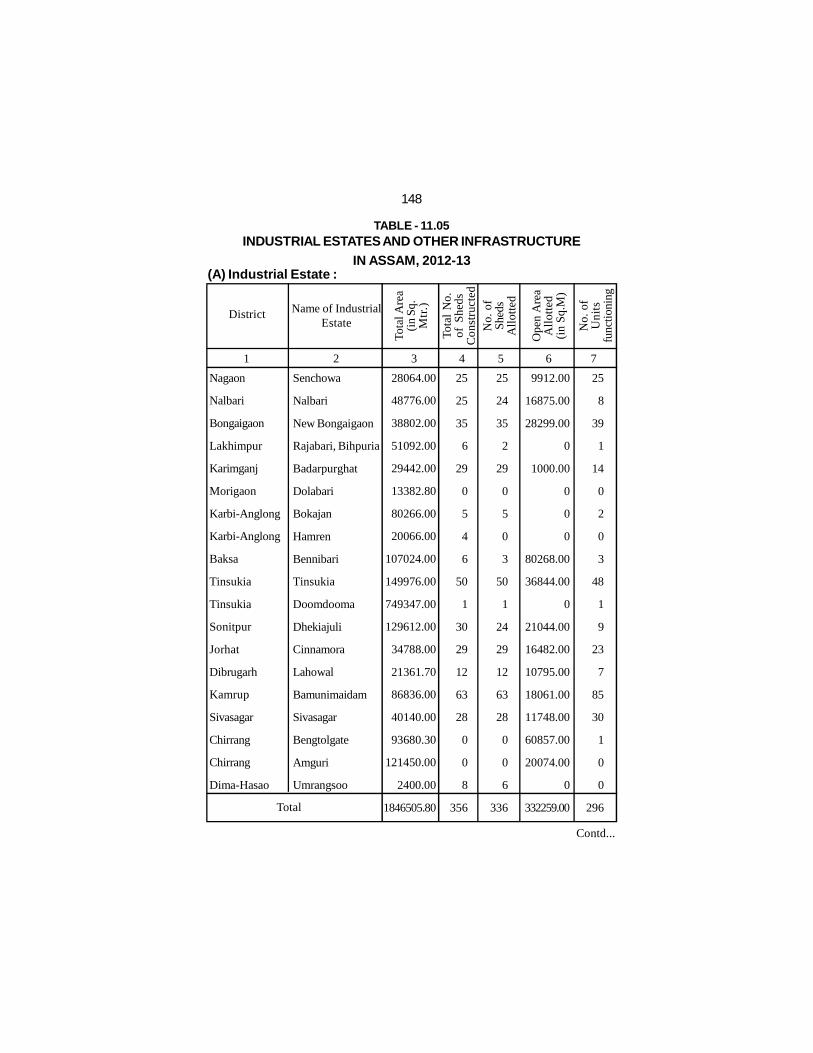
TABLE - 11.05INDUSTRIAL ESTATES AND OTHER INFRASTRUCTURE
IN ASSAM, 2012-13
148
Contd...
(A) Industrial Estate :
Name of IndustrialEstate
Tota
l Are
a(i
n Sq
.M
tr.)
Tota
l N
o.of
She
dsC
onst
ruct
ed
District
Nagaon
Nalbari
Bongaigaon
Lakhimpur
Karimganj
Morigaon
Karbi-Anglong
Karbi-Anglong
Baksa
Tinsukia
Tinsukia
Sonitpur
Jorhat
Dibrugarh
Kamrup
Sivasagar
Chirrang
Chirrang
Dima-Hasao
Ope
n A
rea
All
otte
d(i
n S
q.M
)
No.
of
Uni
tsfu
nctio
ning
Senchowa
Nalbari
New Bongaigaon
Rajabari, Bihpuria
Badarpurghat
Dolabari
Bokajan
Hamren
Bennibari
Tinsukia
Doomdooma
Dhekiajuli
Cinnamora
Lahowal
Bamunimaidam
Sivasagar
Bengtolgate
Amguri
Umrangsoo
28064.00
48776.00
38802.00
51092.00
29442.00
13382.80
80266.00
20066.00
107024.00
149976.00
749347.00
129612.00
34788.00
21361.70
86836.00
40140.00
93680.30
121450.00
2400.00
1846505.80
25
25
35
6
29
0
5
4
6
50
1
30
29
12
63
28
0
0
8
356
25
24
35
2
29
0
5
0
3
50
1
24
29
12
63
28
0
0
6
336
9912.00
16875.00
28299.00
0
1000.00
0
0
0
80268.00
36844.00
0
21044.00
16482.00
10795.00
18061.00
11748.00
60857.00
20074.00
0
332259.00
25
8
39
1
14
0
2
0
3
48
1
9
23
7
85
30
1
0
0
296
1 2 3 4 5 6 7
No.
of
Shed
sA
llot
ted
Total

(...Contd) TABLE - 11.05
149
(B) Industrial Area :
Name of IndustrialArea
Tota
l A
rea
(in
Sq.
Mtr
.)
Tota
l N
o.of
She
dsC
onst
ruct
ed
District
Dhubri
Golaghat
Tinsukia
Sonitpur
Sonitpur
Sonitpur
Sonitpur
Sonitpur
Darrang
Darrang
Dibrugarh
Kamrup
Kamrup
Dima Hasao
Cachar
Kamrup
Kamrup
Ope
n A
rea
All
otte
d(i
n S
q.M
)
No.
of
Uni
tsfu
nctio
ning
Gauripur
Jonaki Nagar
Buraburi, Sadiya
Dolabari
Dhekiajuli
Kundarbari
Gotlong
Biswanath Chariali
Mangaldoi
Dalgaon
Beheating
Kalapahar
Rani
Umrangsu
Malinibeel
Bamunimaidam
Bonda
5
7
0
8
0
5
0
5
20
0
12
13
40
0
3
31
30
179
0
1
0
8
0
5
0
5
19
0
12
13
29
0
3
31
30
156
0
0
0
26634.00
0
51398.00
25971.00
25769.00
42688.00
0
16967.00
6404.00
20397.00
0
39044.00
25789.00
7198.00
288259.00
1
11
0
8
0
4
4
2
18
0
11
28
24
0
14
35
31
191
13591.64
77445.00
267600.00
61470.00
31728.00
158049.00
30732.00
52683.00
63345.00
29324.66
32269.00
14049.00
82974.00
960000.00
40044.00
160595.00
32120.00
2108019.30
No.
of
Shed
sA
llot
ted
1 2 3 4 5 6 7
Total
Contd...

Contd...
Name ofExport
PromotionIndustrial Park
District
Kamrup Amingaon 275628.0
275628.0
3
3
3
3
185000.0
185000.0
38
38
(C) Export Promotion Industrial Park :
Tota
lA
rea
(in
Sq.
Mtr
.)
Tota
l N
o.of
She
dsC
onst
ruct
ed
Ope
nA
rea
All
otte
d(i
n S
q.M
)
No.
of
Uni
tsfu
nctio
ning
No.
of
Shed
sA
llot
ted
1 2 3 4 5 6 7
Total
(D) Food Processing Industrial Park :
Name of FoodProcessing
Industrial Park
Tota
l A
rea
(in
Sq.
Mtr
.)
Tota
l N
o.of
She
dsC
onst
ruct
ed
Districts
Ope
n A
rea
All
otte
d(i
n S
q.M
)
No.
of
Uni
tsfu
nctio
ning
Kamrup Chaygaon 160608.0
160608.0
0
0
0
0
73378.0
73378.0
1
1
No.
of
Shed
sA
llot
ted
Total
1 2 3 4 5 6 7
(...Contd) TABLE - 11.05
150

(E) Integrated Infrastructure Development (IID) Projects:
Name of IIDDistrict
Darrang
Nagaon
Cachar
Dhemaji
Jorhat
Nalbari
Sivasagar
Kokrajhar
Kamrup
Lakhimpur
Tinsukia
140469.00
164539.40
120402.00
140469.00
160536.00
232400.00
123078.00
108140.00
162805.36
120420.00
143996.00
1617254.76
Dalgaon
Bhomoraguri,
Naltali
Malinibeel
Silapathar
Titabor
Nalbari
Demow
Serfanguri
Rangia
Bandardewa
Parbotipur
0
0
0
0
0
0
4
0
0
0
0
4
0
0
0
0
0
0
2
0
0
0
0
2
86090.00
42076.00
30150.00
0
13750.00
214055.00
25625.00
0
144618.00
55188.00
12454.00
624006.00
8
3
6
0
1
0
3
0
13
4
0
38
Tota
l A
rea
(in
Sq.
Mtr
.)
Tota
l N
o.of
She
dsC
onst
ruct
ed
Ope
n A
rea
All
otte
d(i
n S
q.M
)
No.
of
Uni
tsfu
nctio
ning
No.
of
Shed
sA
llot
ted
Total
1 2 3 4 5 6 7
Contd...
(...Contd) TABLE - 11.05
151

(...Contd) TABLE - 11.05
152
Name of MiniIndustrial Estate
Tota
l N
o. o
fSh
eds
Con
stru
cted
No.
of
She
ds A
llot
ted
District
Ope
n A
rea
All
otte
d(i
n S
q.M
)
No.
of
Uni
tsfu
nctio
ning
Dibrugarh
KamrupMetro
Dima Hasao
Sonitpur
Lakhimpur
Sivasagar
Golaghat
Barpeta
5334.00
12310.00
4800.00
18732.00
3061.00
1619.00
4015.00
3305.65
53176.65
Moran
Kalapahar
Haflong
Biswanath Chariali
North Lakhimpur
Sivasagar
Bokakhat
Bichankuchi
0
43
8
4
6
8
8
3
80
0
43
8
4
0
6
8
0
69
3381.00
2013.00
0
15483.00
0
0
0
0
20877.00
0
32
0
5
0
6
8
0
51
(F) Mini Industrial Estate :
Total
Tota
l A
rea
(in
Sq.
Mtr
.)
1 2 3 4 5 6 7
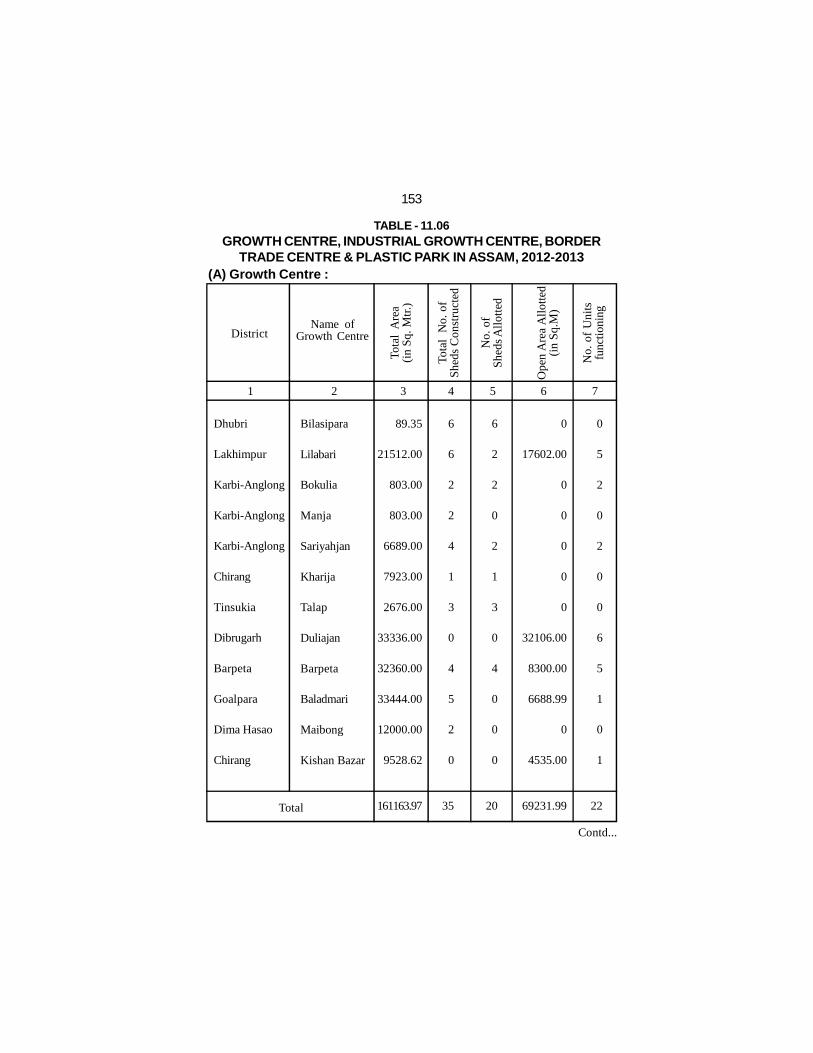
TABLE - 11.06GROWTH CENTRE, INDUSTRIAL GROWTH CENTRE, BORDER
TRADE CENTRE & PLASTIC PARK IN ASSAM, 2012-2013
153
(A) Growth Centre :
Name ofGrowth Centre
Tota
l A
rea
(in
Sq.
Mtr
.)
Tota
l N
o. o
fS
heds
Con
stru
cted
No.
of
She
ds A
llot
ted
District
Dhubri
Lakhimpur
Karbi-Anglong
Karbi-Anglong
Karbi-Anglong
Chirang
Tinsukia
Dibrugarh
Barpeta
Goalpara
Dima Hasao
Chirang
Ope
n A
rea
All
otte
d(i
n S
q.M
)
No.
of
Uni
tsfu
nctio
ning
Bilasipara
Lilabari
Bokulia
Manja
Sariyahjan
Kharija
Talap
Duliajan
Barpeta
Baladmari
Maibong
Kishan Bazar
89.35
21512.00
803.00
803.00
6689.00
7923.00
2676.00
33336.00
32360.00
33444.00
12000.00
9528.62
161163.97
6
6
2
2
4
1
3
0
4
5
2
0
35
6
2
2
0
2
1
3
0
4
0
0
0
20
0
5
2
0
2
0
0
6
5
1
0
1
22
0
17602.00
0
0
0
0
0
32106.00
8300.00
6688.99
0
4535.00
69231.99Total
1 2 3 4 5 6 7
Contd...

(B) Industrial Growth Centre :
Name ofIndustrialGrowthCentre To
tal A
rea
(in
Sq.
Mtr
)
Tota
l N
o.of
She
dsC
onst
ruct
ed
No.
of
Shed
sA
llot
ted
District
Ope
n A
rea
All
otte
d(i
n S
q.M
)
No.
of
Uni
tsfu
nctio
ning
Goalpara
Sonitpur
Kamrup
Matia
Balipara
ChaygaonPatgaon
2236800
2007000(468300 Ph-I)
887086
5130886
0
0
6
6
0
0
6
6
816800
36200
639106
1492106
0
0
28
28Total
1 2 3 4 5 6 7
154
(...Contd) TABLE - 11.06
(C) Border Trade Centre (BTC) :
Name ofBTC A
rea
(in
Sq.
M)
Pro
ject
Cos
t(R
s. in
Lak
h)
Sta
teG
ovt.District
Karimganj
Dhubri
Dhubri
Baksa
Tinsukia
Cen
tral
Gov
t.
Tota
l
Sutarkandi
Mancachar
Golokganj
Darranga
Jagun
156523.2
9364.6
26756.1
46823.2
50836.6
290303.7
2563.0
466.0
1341.0
1433.9
598.0
6401.9
163.0
85.2
0
0
0
248.2
2521.2
465.8
1341.0
105.0
432.6
4865.6
2358.2
380.8
1341.0
105.0
432.6
4617.6Total
1 2 3 4 5 6 7 8 9
2400.0
380.8
1341.0
1433.9
598.0
6153.7
163.0
85.0
0
0
0
248.0
Sta
teG
ovt.
Cen
tral
Gov
t.
Funding Pattern(Rs. in Lakh)
Amount Released as on31-03-2013 (Rs. in Lakh)
Contd...

(D) Plastic Park :
Location Are
a(i
n S
q.M
)
Pro
ject
Cos
t(R
s. in
Lak
h)
Sta
teG
ovt.
Districts
Tinsukia
Cen
tral
Gov
t.
Tota
l
Gelapukhuri 2006707.7
2006707.7
9031.0
9031.0
5031.0
5031.0
2587.0
2587.0
0
0
1 2 3 4 5 6 7 8 9
4000.0
4000.0
2587.0
2587.0S
tate
Gov
t.
Cen
tral
Gov
t.
Funding Pattern(Rs. in Lakh)
Amount Released as on31-03-2013
(Rs. in Lakh)
TABLE - 11.07STATISTICS ON INDUSTRIAL DISPUTES IN ASSAM
Item 2012
Industrial Units involved
Mandays Lost
Wages Lost
Production Lost
28
49077
243.35
35496.64
Unit
No.
No.
Rs. (in lakh)
Rs. (in lakh)
2010
19
48534
34.82
1168.50
2011
31
118120
156.53
4275.00
Source: Office of the Labour Commissioner, Govt. of Assam.
1 2 3 4 5
(...Contd) TABLE - 11.06
155
Total
Source: (Table 11.04 to 11.06) Commissionerate of Industries and Commerce, Assam.

TABLE-DISTRICT-WISE DISTRIBUTION OF REGISTERED FACTORIES
156
Agriculture, Hunting and related Service ActivitiesMining of Coal and Lignite, Extraction of PeatManufacturing of Food Products and BeveragesManufacturing of Tobacco ProductsManufacturing of TextilesManufacturing of wearing apparel, dressing and dyeing of FurTanning and dressing of leather Manf. of luggage, handbags, saddlery harness andfootwear.Manufacturing of Wood and products of wood and cork, except furniture; manf.of articles of straw and plaiting materials.Manufacturing of Paper and Paper Products.Publishing, Printing and reproduction of recorded mediaMfg. of Coke, refined Petroleum products and natural fuelMfg. of chemicals and chemical productsMfg. of Rubber and Plastic ProductsMfg. of other non-metalic mineral productsMfg. of basic metalsMfg. of fabricated metal products(except machinery & equipments)Manufacturing of machinery and equipments, N.E.C.Manufacturing of office accounting and computing machinery.Manufacturing of Electrical machinery and apparatus N.E.C.Mfg. of Radio,Television & Communication equipments and apparatus.Mfg. of Medical,precision and optical instruments,watches & clocksManufacturing of Motor Vehicles,Trailors & Semi Trailors etcManufacturing of other Transport Equipments.Manufacturing of Furniture, Manufacturing of N.E.C.Electricity, Gas, Stream and Hot Water supplyCollection, Purification and distribution of Water.Sale, Maintainance and Repair of Motor Vehicles and Motor Cycles; retail sales ofautomotive fuelWholesale Trade and Commission Trade, exceptof Motor vehicles and Motor CyclesRetail Trade, except of motor vehicles and motorcyle repair of personal andhousehold goods.Land Transport, transport of via pipelinesSupporting and auxiliary transport activities; activities of travel agencies(including Storage and Warehousing)Post and TelecommunicationsOther business activitiesEducation Services
NIC Type of Industry
01101516171819
20
21222324252627282930313233343536404150
5152
6063
647480
Total
Factory = Nos. of Factories, Worker = Nos. of Workers.
1 2

11.08AND WORKERS IN ASSAM, 2012 (AS PER NIC, 2004)
157
Contd...
NIC
01101516171819
20
21222324252627282930313233343536404150
5152
6063
647480
342
16004958
31
412
794668
165196
1551135114
502
650
112
11274212
109
114
527
022
4895
33110
73017815
39172937
12
9768
41951132578392933725
5127036371551
62810
13330
22732
367717472940
3242324
082
83435
080
185243
--
132---
14
-----8----1--------
--
--
---
38
--
58920
---
92
-----
720----
18--------
--
--
---
1439
17-
123---
15
1--5-
27-1----------1
--
--
---
82
0-
39343
---
103
16--
83-
1397-
10----------
20
--
--
---
2065
ASSAMFactory Worker Factory Worker Factory Worker
Kokrajhar Dhubri
3 4 5 6 7 8 1

(...Contd) TABLE-
158N
IC
01101516171819
20
21222324252627282930313233343536404150
5152
6063
647480Total
Goalpara Barpeta Morigaon NagaonFactory Worker Factory Worker Factory Worker Factory Worker
7------
5
---1---------------
--
--
---
13
144------
38
---0---------------
--
--
---
182
--
171--1
19
--11-8-------------
--
--
---
48
--
8745
--
12
92
--0
10-
191-------------
--
--
---
437
--8-2--
1
2--2-
38-------------
--
--
---
53
--
193-0--
6
850--
50-
935-------------
--
--
---
2034
--
102-9--
10
1---3
16944--2-----1-4
--
-2
---
311
--
3321-
1133--
70
10---
469502
8456
--
290-----
19-
120
--
-36
---
14687
1 9 10 11 12 13 14 15 16

11.08
159
Contd...
NIC
01101516171819
20
21222324252627282930313233343536404150
5152
6063
647480
1-
11841--
23
921-3
257335-------29
--
3-
---
444
10-
82790
492--
100
1653650
-46
82644565
-------
46286
--
46-
---
17930
--
31----
-
---2-
2111-----------
--
--
---
56
--
1597----
-
---
10-
3121812
-----------
--
--
---
1949
--3----
-
-----1-------------
--
--
---
4
--
53----
-
-----
10-------------
--
--
---
63
-2
227-3--
100
526
1021
109162621
-6----263
15
-3
-5
---
588
-10
12629-
40--
5946
7240
662701815
1893403323429
-65
----
1158338
368
-36
-118
---
24786
SonitpurFactory Worker Factory Worker Factory Worker Factory Worker
Lakhimpur Dhemaji Tinsukia
17 18 19 20 21 22 23 24 1

(...Contd) TABLE-
160N
IC
01101516171819
20
21222324252627282930313233343536404150
5152
6063
647480Total
Dibrugarh Sivasagar Jorhat GolaghatFactory Worker Factory Worker Factory Worker Factory Worker
--
197-7--
23
-3-97
136796-3---146-
17
-5
-2
---
442
--
10002-
302--
1160
-16
-1917
994830
2654265
-90
---
121712311747
-239
-22
-22
---
23266
--
1271---
3
12-38
131241-2-----4-6
--
--
---
295
--
853920
---
9
5017
-4182
23443551
0-
30-----
114-
91
--
--
---
11423
--
1582---
11
24-66
573-2-7-----2-
10
--
-5
--2
277
--
469810
---
45
0108
-12
1511390
25-
20-
47-----
10-
199
--
-41
--0
6756
--
161-1--
16
--1-6
9012--2-------4
--
-1
---
285
--
5149-0--
107
--
252-
801569
4033
--
30-------
51
--
-10
---
7321
1 25 26 27 28 29 30 31 32

11.08
161
Contd...
NIC
01101516171819
20
21222324252627282930313233343536404150
5152
6063
647480
--
19----
9
---1-71------------
--
--
---
37
--
398----
377
---0-
24850
------------
--
--
---
1073
--4----
20
-----9--1-------4--
--
--
---
38
--
105----
44
-----
358--0-------
163--
--
--
---
670
--
822---
9
23245
1277
171----1--2-
10
-3
-4
---
281
--
414750
---
35
2544
10246
1043773
113224
20----
15--
18-
152
-8
-75
---
8951
5-
16----
8
---65
54----------2--
--
-1
---
97
101-
1036----
51
---
4934
1396----------
106--
--
-0
---
2773
Karbi-AnglongFactory Worker Factory Worker Factory Worker Factory Worker
Dima Hasao Cachar Karimganj
33 34 35 36 37 38 39 40 1

(...Contd) TABLE-
162N
IC
01101516171819
20
21222324252627282930313233343536404150
5152
6063
647480Total
Hailakandi Bongaigaon Kamrup*Factory Worker Factory Worker Factory Worker
--
23----
3
1----8-------------
--
--
---
35
--
996----
24
1329----
415-------------
--
--
---
2764
--541--
4
1-426
2612------313--
--
--
---
63
--
110146
0--
112
383-
888
361690
457
------
22148
338--
--
--
---
5194
3-
1823031
3-
107
523050
110125225
874413
241
-11
17
209-
42
13
17
-2-
1239
76-
5824481
18552937
-
1306
1263871
36386279222295992440
6199410
753-
22717
246393270
-1084
016
19133
-8-
42680
1 41 42 43 44 45 46 47 48Factory Worker
* including Kamrup Metro.
Chirang
1-3----
4
--2--51---------1--
--
1-
---
18
0-
64----
19
--
991--
68100
---------
26--
--
18-
---
1286

11.08
163
--7----
-
--13-4-1-----------
--
--
---
16
--
69----
-
--0
87-
95-
59-----------
--
--
---
310
--5----
1
-------------------
--
--
---
6
--
433----
0
-------------------
--
--
---
433
--
33-3--
-
2---1
261---1--------
--
--
---
67
--
1114-
95--
-
32---
10172
15---
10--------
--
--
---
1448
--
47----
7
----
8-------------
--
--
---
62
--
3192----
32
-----
99-------------
--
--
---
3323
NIC
01101516171819
20
21222324252627282930313233343536404150
5152
6063
647480
NalbariFactory Worker Factory Worker Factory Worker Factory Worker
Baksa Darrang Udalguri
49 50 51 52 53 54 55 56 1

164
TABLE - 11.09INDUSTRY WISE DISTRIBUTION OF ACCIDENTS IN ASSAM
Mfg. of food & Beverage
Mfg. of Tobacco products
Mfg. of wood corks etc
Mfg. of Paper & Paper products
Mfg. of coke, refined petroleum products
Mfg. of chemical & chemical products
Mfg. of non-matelic mineral products
Mfg. of basic metal
Mfg. of fabricated metal products,except machinery and equipments
Mfg. of machinery and equipments NEC
Mfg. of other transport equipments
Electricity, Gas, Steam and hotwater supply
Storage & warehousing
TOTAL
Nature of Industries
7
-
-
-
-
1
-
-
-
-
-
-
-
8
50
2
-
8
-
4
2
1
-
1
-
1
-
69
4
-
-
-
1
-
1
1
-
-
1
-
-
8
42
2
-
10
2
6
5
2
1
-
-
-
-
70
1
-
-
1
-
1
1
1
-
-
-
-
1
6
29
7
-
3
-
2
3
2
-
-
-
-
-
46
2010 2011 2012
FatalNon-Fatal
FatalNon-Fatal
FatalNon-Fatal
1 2 3 4 5 6 7

165
TABLE - 11.10CAUSE WISE DISTRIBUTION OF ACCIDENTS IN ASSAM
Mining and agglomeration of hard coal
Machinery moved by machine power
Machinery not moved by mechinepower.
Transport
Electricity
Fire, Explosion, Gassing
Molten Metal
Use of Hand Tools
Struck by falling body
Falling from height
Falling on the flat
Falling into pits excavation
Stepping or striking against objects
Handling goods & Articles
Others
TOTAL
Cause of Accident
-
1
-
-
2
-
-
-
-
1
-
1
-
-
1
6
-
16
-
1
7
-
-
2
4
2
8
-
-
2
4
46
-
1
-
1
1
-
-
-
1
2
-
1
1
-
-
8
1
17
1
2
2
1
1
1
5
3
9
-
1
2
13
59
-
3
-
-
-
2
-
-
-
2
-
1
-
-
-
8
-
36
-
-
3
2
3
5
1
4
3
2
2
2
7
70
2010 2011 2012
FatalNon-Fatal
FatalNon-Fatal
FatalNon-Fatal
1 2 3 4 5 6 7
Source: (Table 11.08 to 11.10) Office of the Chief Inspector of Factories, Assam.

12.SERICULTUREFIGURE AT A GLANCE 2012-13
Sericulture Villages
Families engaged in Sericulture(i) Eri(ii) Muga(iii) Mulberry
Area under Silk worm food plants(i) Eri(ii) Muga(iii) Mulberry
Yield of Cocoons(i) Eri Cut Cocoon(ii) Muga Cocoon(iii) Mulberry reeling cocoon
Production of Silk Yarn(i) Eri Raw Silk(ii) Muga Raw Silk(iii) Mulberry Raw Silk
Number of Spinning Charkhas
10746 nos.
199763 nos.59874 nos.31955 nos.
9172.5 hect.10230 hect.7424 hect.
2514.16 MT5450 Lakh nos.
225 MT
1934 MT109 MT25 MT
4082 Nos

TABLE - 12.01REELING UNITS IN ASSAM, 2012-13
167
District
No. ofReelingUnits
Mul
berr
y
Number ofImproved
basin
1 2 3 4 5 6 7 8 9
Mug
a
Quantity ofCocoons Reeled
Quantity of RawSilk produced in
Reeling Units
Mug
a
Mul
berr
y(i
n K
g.)
Mug
a(L
akh
No.
)
Mul
berr
y(i
n K
g.)
Mug
a(i
n K
g.)
Mul
berr
y
KokrajharDhubriGoalparaBarpetaMorigaonNagaon
SonitpurLakhimpurDhemajiTinsukiaDibrugarhSivasagar
JorhatGolaghatKarbi AnglongDima HasaoCacharKarimganj
HailakandiBongaigaonKamrupNalbariDarrang
Assam
3-111-
31-324
1---2-
---11
24
2-2---
-31-12
-1----
--2--
14
2-8882
1373782
234452
233-
10
106
68-
3518
817
62525152250
2015
224-
15
1452020
523
12.510
15.4161415
16.5506.4
13.516.519.5
2022
56
1112
10.512.6
155
50
374.4
100080
1350600651700
68023501250640
1150850
880850970300480280
305340550350
1395
18001
4500150
10560810960855
20601689011680
39707060
13660
971012200
2015
2500210
51020
13460600160
112560
3500.5
5504250
45.5
1101000685200
500.5882
555.2709.5
8050
250.515
2515
105032
3275.5
10473.2

TABLE-SERICULTURE ACTIVITIES
168
DistrictN
o. o
fSe
ricu
lture
Vill
ages No. of Families Engaged
Eri Muga
Total Area under SilkWorm Food Plants
(in Hect.)
Kokrajhar
Dhubri
Goalpara
Barpeta
Morigaon
Nagaon
Sonitpur
Lakhimpur
Dhemaji
Tinsukia
Dibrugarh
Sivasagar
Jorhat
Golaghat
Karbi Anglong
Dima Hasao
Cachar
Karimganj
Hailakandi
Bongaigaon
Kamrup
Nalbari
Darrang
Assam
1 2 3 4 5 6 7 8 9Mulberry
Eri MugaMulberry
1
2
3
4
5
6
7
8
9
10
11
12
13
14
15
16
17
18
19
20
21
22
23
Sl.No.
1336
190
301
140
172
1185
420
861
652
284
430
716
540
175
1262
145
182
143
245
156
551
185
475
10746
37100
835
13095
2951
6898
7043
5133
15125
10220
5500
13100
12850
9400
10500
9940
5045
6545
991
2950
2996
10829
4180
6537
199763
1500
130
2557
250
3400
420
368
11050
2550
4200
3650
3533
2900
5223
109
115
2780
60
258
840
8484
150
5347
59874
1200
147
112
154
763
1544
1829
5220
4069
1392
3207
2547
4450
631
137
46
949
181
98
59
1850
60
1310
31955
777.78
198.73
587.98
67.42
485.68
496.65
398.58
687.47
480.54
189.75
379.65
545.56
298.95
288.78
687.65
358.75
584.85
195.65
179.98
198.56
489.56
196.53
397.45
9172.5
550
28
865
210
215
265
340
1193
995
347
640
659
426
543
147
178
487
183
243
259
868
235
354
10230
290
185
300
246
310
365
315
558
457
275
346
354
376
258
455
285
375
210
205
265
350
283
361
7424

12.02IN ASSAM, 2012-13
169
Yield of Cocoons Production of Silk Yarn
EriCocoons(in MT)
Eri RawSilk
(in MT)
SpinningCharkha(in Nos.)
10 11 12 13 14 15 16 1
MulberryReeling
Cocoons(in MT)
MugaRaw Silk(in MT)
MulberryRaw Silk(in MT)
MugaCocoons
(Lakh Nos)
1
2
3
4
5
6
7
8
9
10
11
12
13
14
15
16
17
18
19
20
21
22
23
Sl.No.
400
70
210
100
95
120
105
110
252
300
225
175
210
235
200
210
115
55
65
110
310
145
265
4082
4.50
0.24
0.50
0.55
0.50
0.90
0.95
2.60
2.00
0.50
0.90
1.50
2.00
1.00
0.48
0.12
0.69
0.40
0.45
0.75
0.40
0.65
2.42
25.00
16.00
0.10
9.50
0.80
1.00
0.85
1.50
12.80
5.00
3.95
8.55
13.15
8.00
12.00
0.25
0.90
1.60
0.05
0.20
0.40
10.00
0.50
1.90
109.00
389.50
3.00
38.00
128.00
40.00
45.80
60.48
76.00
55.65
45.26
35.70
200.00
60.25
185.00
246.90
90.23
15.40
28.20
25.95
33.15
90.14
20.80
20.60
1934.00
40.50
2.16
4.50
4.95
4.52
8.10
8.55
23.40
18.00
4.50
8.10
13.50
18.00
9.00
4.35
1.04
6.21
3.60
4.05
6.75
3.60
5.85
21.78
225.00
506.35
3.9
49.4
166.40
52
59.5
78.62
98.8
72.35
58.96
46.41
260
78.59
240.5
319.8
117.68
20.02
36.79
33.74
43.36
117.18
27.04
26.78
2514.16
800.00
5.00
475.00
40.00
50.00
42.50
75.00
640.00
250.00
197.50
427.50
657.50
400.00
600.00
12.50
45.00
80.00
2.50
10.00
20.00
500.00
25.00
95.00
5450.00

TABLE-SERICULTURE FARMS AND
170
District
Eri Seed Grainages
Total Area(in Hect.)
Mulberry Farms
1 2 3 4 5 6
Area underPlantation(in Hect.)
Total Area(in Hect)
Area underPlantation(in Hect.)
Kokrajhar
Dhubri
Goalpara
Barpeta
Morigaon
Nagaon
Sonitpur
Lakhimpur
Dhemaji
Tinsukia
Dibrugarh
Sivasagar
Jorhat
Golaghat
Karbi Anglong
Dima Hasao
Cachar
Karimganj
Hailakandi
Bongaigaon
Kamrup
Nalbari
Darrang
Assam
1
2
3
4
5
6
7
8
9
10
11
12
13
14
15
16
17
18
19
20
21
22
23
Sl.No.
Source: Table (12.01 to 12.03) Directorate of Sericulture, Assam.
3.40
-
9.00
-
6.50
3.40
8.60
7.50
14.00
26.71
4.20
1.04
-
4.00
26.05
6.67
8.09
6.40
-
-
25.50
-
17.03
178.09
3.00
-
5.83
-
4.30
0.20
6.92
5.55
13.10
18.25
3.16
1.05
-
3.22
13.10
4.10
8.05
5.02
-
-
12.95
-
13.05
120.85
-
-
12.40
13.50
-
8.83
-
11.75
-
-
9.10
15.30
9.18
-
16.00
8.00
8.12
-
-
-
-
-
17.33
129.51
-
-
9.22
11.06
-
2.95
-
9.52
-
-
1.21
9.32
4.40
-
7.05
1.61
6.72
-
-
-
-
-
13.72
76.78

12.03GRAINAGES IN ASSAM, 2012-13
171
Basic Muga Seed Farms Eri Concentration Centre
7 8 9 10 11 12 1
Productionof MugaCocoons(in Nos.)
Total Area(in Hect.)
Area underPlantation(in Hect.)
Productionof Eri
Cocoons(in Kg.)
Total Area(in Hect.)
Area underPlantation(in Hect.)
1
2
3
4
5
6
7
8
9
10
11
12
13
14
15
16
17
18
19
20
21
22
23
Sl.No.
12.70
-
32.40
13.50
-
-
-
48.40
-
-
22.40
52.38
21.18
-
26.50
-
8.12
-
-
-
86.12
-
17.32
341.02
10.00
-
21.42
6.42
-
-
-
42.62
-
-
9.12
35.85
17.05
-
12.82
-
4.28
-
-
-
60.25
-
13.52
233.35
50000
-
60000
15000
-
-
-
10000
-
-
40000
95500
50000
-
50000
-
25000
-
-
-
75000
-
45000
515500
54.94
-
24.49
-
41.60
35.89
60.50
7.50
-
4.25
-
1.14
2.00
-
147.09
60.90
26.26
23.00
41.90
-
22.90
-
32.88
587.24
20.00
-
13.54
-
15.05
30.02
29.05
7.50
-
6.05
2.55
1.14
1.70
-
5.10
30.55
15.10
7.10
7.06
-
11.06
-
29.07
231.64
200.00
-
60.00
-
350.00
1230.00
90.00
25.00
-
30.00
-
40.00
100.00
-
300.00
400.00
1000.00
90.00
90.00
-
350.00
-
75.00
4430.00
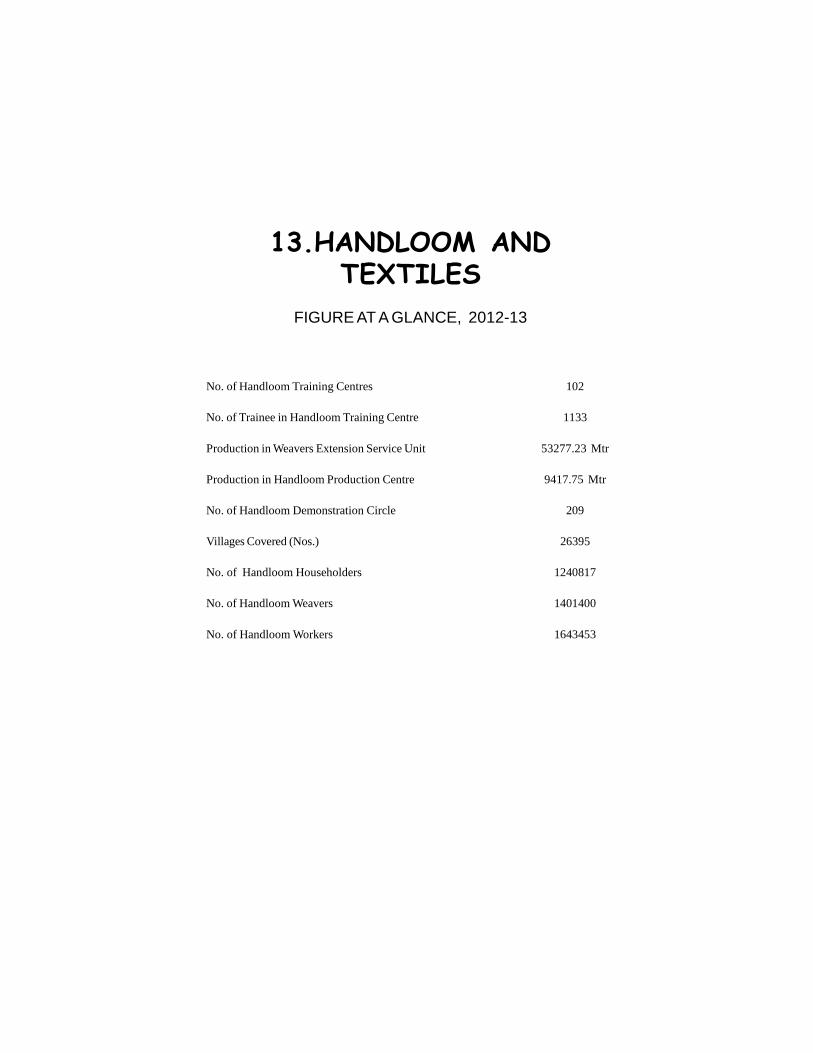
13.HANDLOOM ANDTEXTILES
FIGURE AT A GLANCE, 2012-13
No. of Handloom Training Centres
No. of Trainee in Handloom Training Centre
Production in Weavers Extension Service Unit
Production in Handloom Production Centre
No. of Handloom Demonstration Circle
Villages Covered (Nos.)
No. of Handloom Householders
No. of Handloom Weavers
No. of Handloom Workers
102
1133
53277.23 Mtr
9417.75 Mtr
209
26395
1240817
1401400
1643453
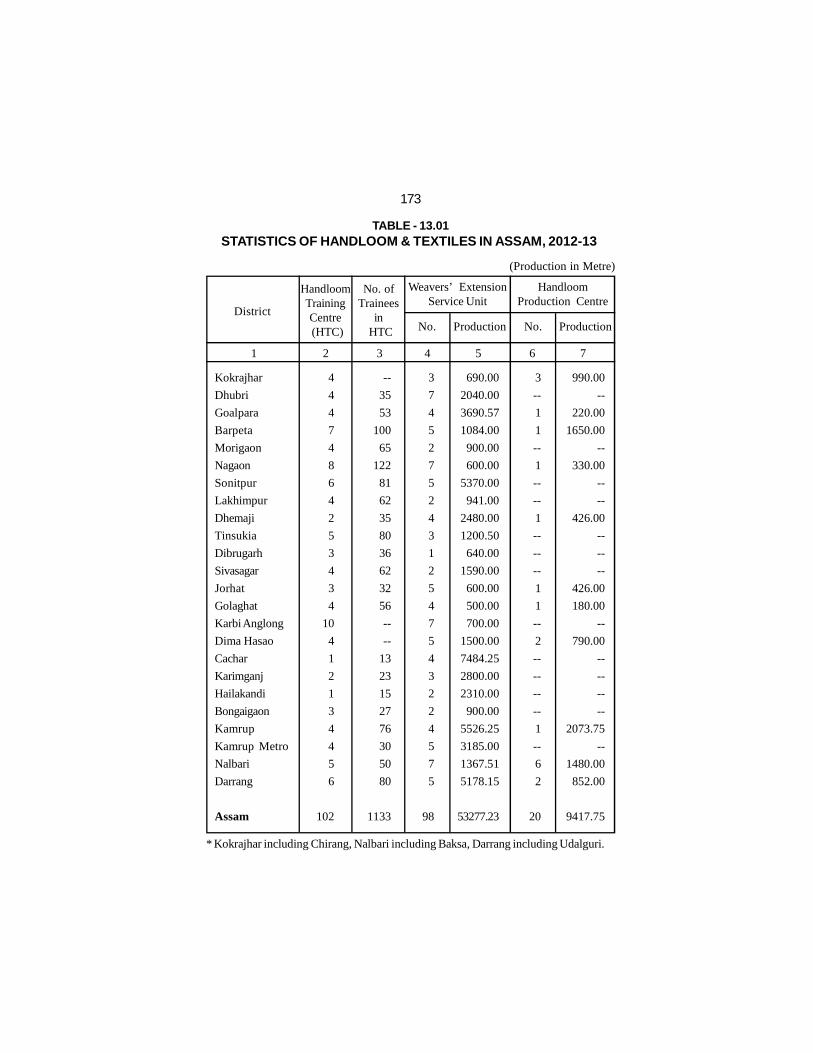
TABLE - 13.01STATISTICS OF HANDLOOM & TEXTILES IN ASSAM, 2012-13
173
* Kokrajhar including Chirang, Nalbari including Baksa, Darrang including Udalguri.
District
HandloomTrainingCentre (HTC)
Kokrajhar
Dhubri
Goalpara
Barpeta
Morigaon
Nagaon
Sonitpur
Lakhimpur
Dhemaji
Tinsukia
Dibrugarh
Sivasagar
Jorhat
Golaghat
Karbi Anglong
Dima Hasao
Cachar
Karimganj
Hailakandi
Bongaigaon
Kamrup
Kamrup Metro
Nalbari
Darrang
Assam
1 2 3 4 5 6 7
No. ofTrainees
in HTC
Weavers’ ExtensionService Unit
HandloomProduction Centre
ProductionNo. ProductionNo.
(Production in Metre)
4
4
4
7
4
8
6
4
2
5
3
4
3
4
10
4
1
2
1
3
4
4
5
6
102
--
35
53
100
65
122
81
62
35
80
36
62
32
56
--
--
13
23
15
27
76
30
50
80
1133
3
7
4
5
2
7
5
2
4
3
1
2
5
4
7
5
4
3
2
2
4
5
7
5
98
690.00
2040.00
3690.57
1084.00
900.00
600.00
5370.00
941.00
2480.00
1200.50
640.00
1590.00
600.00
500.00
700.00
1500.00
7484.25
2800.00
2310.00
900.00
5526.25
3185.00
1367.51
5178.15
53277.23
3
--
1
1
--
1
--
--
1
--
--
--
1
1
--
2
--
--
--
--
1
--
6
2
20
990.00
--
220.00
1650.00
--
330.00
--
--
426.00
--
--
--
426.00
180.00
--
790.00
--
--
--
--
2073.75
--
1480.00
852.00
9417.75

TABLE - 13.02STATISTICS OF HANDLOOM DEMONSTRATION CIRCLE &
WEAVING ACTIVITY IN ASSAM, 2012-13
174
* Kokrajhar including Chirang, Nalbari including Baksa, Darrang including Udalguri.** including Dima Hasao, # including Kamrup Metro.
22681
20188
40593
91999
45061
65775
66708
73505
71815
42142
47874
81661
71818
73311
**3283
23050
9935
5015
21659
#131691
138060
92993
1240817
23577
19072
43980
109328
48395
73417
74420
89349
88738
47392
56094
88125
87448
86664
**3911
32515
10201
5962
24926
#144510
148534
94842
1401400
28194
24286
49607
127183
54734
83888
87652
104345
109569
52981
64098
101660
105362
104235
**4520
35988
11431
7228
28766
#172532
177681
107513
1643453
1576
1091
829
835
632
1412
1876
1184
1319
1168
1348
875
848
1125
2921
695
1040
936
331
563
1068
216
1146
1361
26395
DistrictNo. of
DemonstratorsCircles
No. ofVillagescovered
Kokrajhar
Dhubri
Goalpara
Barpeta
Morigaon
Nagaon
Sonitpur
Lakhimpur
Dhemaji
Tinsukia
Dibrugarh
Sivasagar
Jorhat
Golaghat
Karbi Anglong
Dima Hasao
Cachar
Karimganj
Hailakandi
Bongaigaon
Kamrup
Kamrup Metro
Nalbari
Darrang
Assam
1 2 3 4 5 6
Weavers Statistics as per NationalHandloom Census 2009-10
No. ofHandloomHousholds
No. ofHandloomweavers
No. ofHandloomworkers
7
7
8
12
7
17
14
8
2
6
16
15
7
9
5
11
10
9
5
5
11
4
10
4
209

TABLE - 13.03ACHIEVEMENTS IN HANDLOOM AND TEXTILES IN ASSAM UNDER
CENTRALLY SPONSORED AND CENTRAL SECTOR SCHEMES
175
Sl.No.
Health Insurance Scheme (no. covered):MaleFemaleTotal
Mahatma Gandhi Bunkar Bima Yojana (no.):FemaleTotal
Integrated Handloom Development Scheme(Including ARTFED) Clusters
GroupsNo. of Benificiaries Male
FemaleTotal
District Level Fairs (Nos.)
Special Handloom Expo (nos.)
National Handloom Expo (nos.)
Production of Handloom Fabric(20 point)
(A)
(B)
(C)
(D)
(E)
(F)
(G)
Name of Schemes
--387563387563
5759957599
2434280
76007880
60
23
6
215(millionmetre)
1 2 3 4
2011-12 2012-13
Source: (Table 13.01 to 13.03) Directorate of Handloom & Textiles, Assam.
--387563387563
5907859078
2434--
78807880
3
10
2
2.90(million sq.
metre)

14.KHADI & VILLAGEINDUSTRIES
FIGURE AT A GLANCE
Working Centre under Khadi & Village Industry Board, 2012-13
Value of Production, 2011-12
Value of Sales, 2011-12
Employment, 2011-12
Wages, 2011-12
3996 nos
Rs.58529.43 in Lakh.
78252.40 in Lakh.
413164 nos.
Rs.33689.18 in Lakh.

TABLE - 14.01INDUSTRY WISE PRODUCTION AND EMPLOYMENT INKHADI AND VILLAGE INDUSTRIES BOARD IN ASSAM
177
Type of IndustryNo. of
Centresworking
TotalEmployment
(Nos.)
200
521
202
308
1283
94
586
20
-
10
124
3
508
68
25
6
37
1
3996
Value ofProduction
(Rs. in Lakh)
Bee Keeping Industry.
Village Oil Industry.
Pottery Industry.
Processing of Cereals and Pulses.
Gur & Khandsari.
Khadi (Cotton & Silk).
Carpentry & Blacksmithy.
Non-Edible Oil & Soap Industry.
Cottage Match Industry.
Agarbatti Industry.
Village Leather Industry.
Hand Made Paper Industry.
Cane & Bamboo Industry.
Lime Industry.
Fibre Industry.
Medicinal Plant Industry.
Fruit Preservation.
Dyeing & Printing.
22486
3160
28503
1461
6208
4280
5383
373
-
28
607
30
4987
450
113
319
212
4
78604
43.44
579.74
94.08
323.10
340.00
56.00
149.31
20.00
-
9.67
72.30
4.98
80.50
19.01
5.17
9.30
73.20
0.58
1880..38
1.
2.
3.
4.
5.
6.
7.
8.
9.
10.
11.
12.
13.
14.
15.
16.
17.
18.
TOTAL
1 2 3 4 5 6
2011-12 2012-13 2011-12 2012-13
22486
3160
28503
1461
6208
4280
5383
373
-
28
607
30
4987
450
113
319
212
4
78604
84.23
576.44
170.33
311.00
332.20
-
255.28
40.07
16.98
73.41
9.09
160.40
33.10
8.91
17.30
74.60
0.58
2163.92
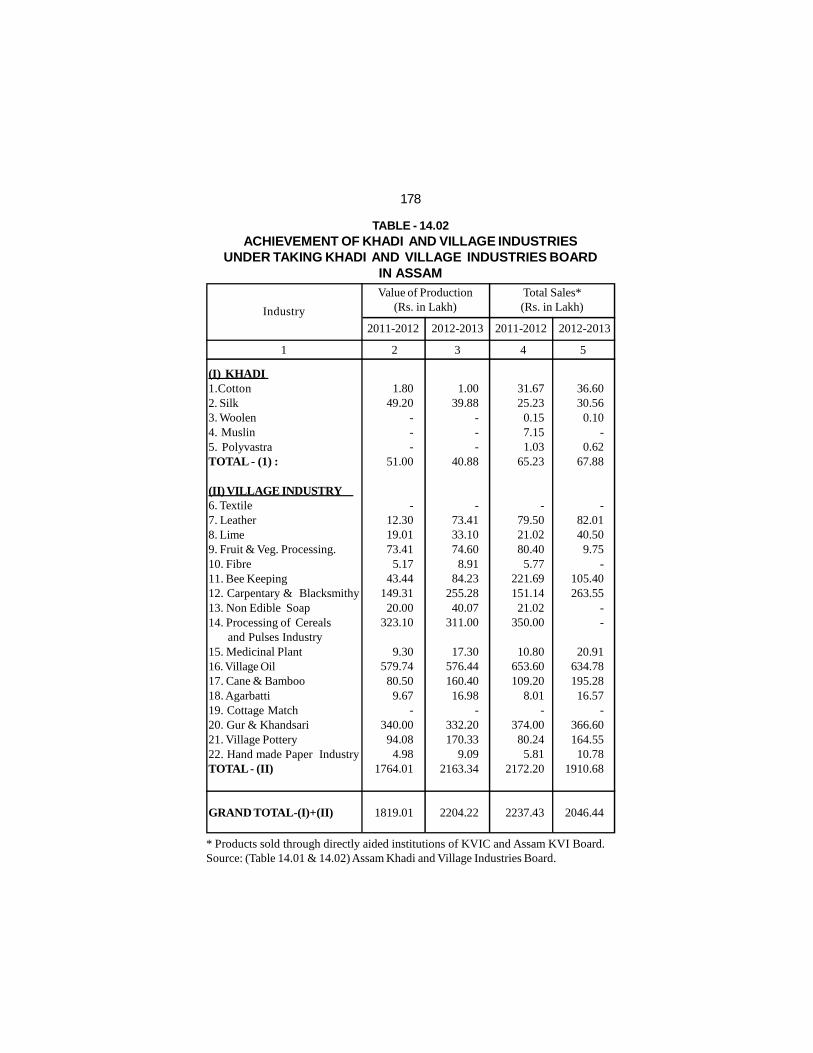
TABLE - 14.02ACHIEVEMENT OF KHADI AND VILLAGE INDUSTRIES
UNDER TAKING KHADI AND VILLAGE INDUSTRIES BOARDIN ASSAM
178
* Products sold through directly aided institutions of KVIC and Assam KVI Board.Source: (Table 14.01 & 14.02) Assam Khadi and Village Industries Board.
Industry
2011-2012
Value of Production(Rs. in Lakh)
(I) KHADI1.Cotton2. Silk3. Woolen4. Muslin5. PolyvastraTOTAL - (1) :
(II) VILLAGE INDUSTRY6. Textile7. Leather8. Lime9. Fruit & Veg. Processing.10. Fibre11. Bee Keeping12. Carpentary & Blacksmithy13. Non Edible Soap14. Processing of Cereals and Pulses Industry15. Medicinal Plant16. Village Oil17. Cane & Bamboo18. Agarbatti19. Cottage Match20. Gur & Khandsari21. Village Pottery22. Hand made Paper IndustryTOTAL - (II)
GRAND TOTAL-(I)+(II)
2012-2013 2011-2012
Total Sales*(Rs. in Lakh)
2012-2013
1.8049.20
---
51.00
-12.3019.0173.41
5.1743.44
149.3120.00
323.10
9.30579.7480.50
9.67-
340.0094.08
4.981764.01
1819.01
31.6725.23
0.157.151.03
65.23
-79.5021.0280.40
5.77221.69151.1421.02
350.00
10.80653.60109.20
8.01-
374.0080.24
5.812172.20
2237.43
1 2 3 4 5
1.0039.88
---
40.88
-73.4133.1074.60
8.9184.23
255.2840.07
311.00
17.30576.44160.4016.98
-332.20170.33
9.092163.34
2204.22
36.6030.56
0.10-
0.6267.88
-82.0140.50
9.75-
105.40263.55
--
20.91634.78195.2816.57
-366.60164.5510.78
1910.68
2046.44

TABLE - 14.03ACHIEVEMENT OF KHADI AND VILLAGE INDUSTRIES*
IN ASSAM DURING 2011-2012
179
* Figures include performance of the Assam Khadi and V. I. Board also.Source: Khadi and Village Industries Commission, Assam.
IndustryValue of
Production(Rs. in Lakh)
Sales(Rs. in Lakh)
Employment(in Nos.)
Wages(Rs. in Lakh)
A. KHADI AND POLY
VASTRA
1. Cotton
2. Silk
3. Woolen
4. Polyvastra
TOTAL - A
B. VILLAGE INDUSTRY
1. Mineral Based
2. Forest Based
3. Agro Based and Food
Processi ng
4. Polymer & Chemical
Based
5. Handmade paper & Fiber
6. Services
7. Rural Engineering & Bio-
Technology
TOTAL - B
GRAND TOTAL - (A + B)
1 2 3 4 5
57.19
935.64
-
29.09
1021.92
10978.05
4324.67
19347.27
7077.92
2762.56
1779.82
11237.22
57507.51
58529.43
59.38
824.63
2.30
27.97
914.28
12282.30
5027.50
20621.08
6761.68
1635.68
19519.17
11490.71
77338.12
78252.40
3000
15000
-
164
18164
79000
30000
129000
15000
18000
73000
51000
395000
413164
38.55
480.62
-
12.79
531.96
5637.56
2296.53
10851.66
1606.61
793.66
6286.86
5684.34
33157.22
33689.18

15.PLANTATION CROPSFIGURE AT A GLANCE
Number of Small Tea Growers (upto 10.12 hect.), 2007
Number of Big Growers (above 10.12 hect.), 2011
Area under Small Growers, 2012
Area under Big Growers, 2012
Production of Tea under Small Growers, 2007(in ̀ 000 Kg)
Production of Tea under Big Growers, 2012(in ̀ 000 Kg)
Tea sold in Guwahati Tea Auction Centres, 2012(i) Quantity: (in million Kg) Leaf
Dust
(ii) Average Price per Kg.: (Rs.) LeafDust
Area under Coffee plantation, 2012-13
Production of Coffee, 2012-13
Area under Rubber plantation, 2012-13
Production of Rubber, 2012-13
64597
765
88674 hect
233536 hect
106881
588270
71.3930.97
138.46143.17
952.74 hect
60.72 MT
34537.62 hect
11053.78 MT

181
15.01DISTRICT-WISE AREA, PRODUCTION AND AVERAGE
YIELD OF TEA IN ASSAM
Area under Teacultivation (in hect.)
Darrang
Goalpara
Kamrup
Lakhimpur
Dibrugarh
Nagaon
Sivasagar
Cachar
Karbi Anglong
Dima Hasao
Assam
1 2 3 4 5 6 7 8 9 10
2009
2010
2011
2009
2010
2011
2009
2010
41923
4451
3953
6828
122965
8014
94934
32745
4524
1350
321687
41805
4451
3450
6984
122623
8024
94921
34380
4222
1350
322210
80474
5855
5003
9701
178352
14073
118324
53722
6521
1878
473903
82995
6045
4813
9708
197476
13084
106305
54562
7489
1776
484253
100477
6267
4845
10984
250356
16045
140721
50290
7503
1622
589110
1949
1662
1516
2008
1674
1756
1587
1694
1441
937
1554
2007
1716
1458
1969
1682
1594
1552
1710
1645
929
1492
District
Production(in ̀ 000 Kg.)
Average Yield(Kg. per hect.)
2011
1679
1700
1377
2003
2109
1707
1547
1731
1639
899
1830
42139
4451
3953
7253
122845
8209
95056
32413
4553
1350
322222

182
Small Growers(Upto 10.12 hect.)
2007
2008
2009
2010
2011
2012
1 2 3 4 5 6 7 8 9 10
No.
of
Gar
dens
Are
a(H
a)
Prod
uctio
n(`
000
kg)
No.
of
Gar
dens
Are
a(H
a)
Prod
uctio
n(`
000
kg)
No.
of
Gar
dens
Are
a(H
a)
64597
N.A.
-
-
78091
78091
88674
88674
88674
88674
88674
88674
106881
N.A.
N.A.
N.A.
N.A.
N.A.
825
760
760
760
765
765
232645
230113
230060
229790
229140
233536
405004
437810
451970
450100
476767
588270
65422
760
760
760
78856
78856
321319
321437
321687
322222
322210
322210
Year
Big Growers(above 10.12 hect.) Total
Prod
uctio
n(`
000
kg)
511885
487497
499997
480286
589110
590120
Source: (Table-15.01 to 15.02) Tea Board of India, Regional Office, Guwahati. AssamNote:- Number of Small tea growers and the district-wise details are not available asthe part of Survey on Small growers by Assam is awaited.Big growers data is based on the Base Line Survey, 2010.Figure of 2007 at Col.3 repeated for the years 2008 to 2012.No. of Tea Gardens shown in col.8 for the years 2008 to 2010 refers to only TeaGardens having area above 10.12 hectors excluding Small Tea Growers.
15.02NUMBER OF TEA GARDENS, AREA AND PRODUCTION OF TEA
ACCORDING TO SIZE OF THE GARDENS IN ASSAM(Production in `000 Kg.)

183
TABLE - 15.03MONTH-WISE SALE AND PRICE OF TEA AT
GUWAHATI TEA AUCTION CENTRE
Month2012
2013(Upto July)
20122013
(Upto July)
January
February
March
April
May
June
July
August
September
October
November
December
TOTAL(Auction Centre)
Private Sale
Grand Total
14.3
4.6
1.6
1.3
6.8
8.0
15.6
12.2
13.2
15.5
15.0
14.8
122.9
36.8
159.7
Sale (Million Kg.) Price (Rs. Per Kg.)
14.1
4.1
0.9
2.6
7.3
8.0
15.0
52.0
-
88.93
84.26
83.28
149.99
158.40
156.71
144.29
141.50
136.70
130.34
133.64
134.60
131.10
141.85
133.58
122.39
120.29
123.59
154.76
142.81
143.07
144.88
1 2 3 4 5

TABLE - 15.04QUANTITY AND AVERAGE PRICE OF TEA SOLD IN GUWAHATI
TEA AUCTION CENTRE
Contd...
Type /Centre
LEAF
(a) C.T.C.
Assam
Cachar
Arunachal
Meghalaya
Nagaland
Tripura
TOTAL : CTC.
(b) ORTHODOX
Assam
Cachar
Tripura
Green tea
Nagaland
Arunachal
TOTAL(ORTHODOX)
TOTAL: LEAF TEA
Quantity(Million Kg.)
Average Price(Rs. Per Kg.)
Quantity(Million Kg.)
Average Price(Rs. Per Kg.)
61.13
5.85
2.18
0.06
0.002
1.62
70.84
0.55
0
0
0
0
0.004
0.55
71.39
2012 2013 (Upto July)
142.15
113.58
119.50
129.26
91.89
106.75
138.27
162.07
0
0
0
0
295.53
163.07
138.46
62.24
6.88
2.57
0.07
0
1.82
73.58
0.84
0
0
0
0
0
0.84
74.42
137.00
103.13
106.82
111.73
0
93.65
131.68
170.56
0
0
0
0
0
170.56
132.12
1 2 3 4 5
184

(...Contd) TABLE - 15.04
Source: Table (15.03 and 15.04) Guwahati Tea Auction Centre.
Type /Centre
Quantity(Million Kg.)
Average Price(Rs. Per Kg.)
Quantity(Million Kg.)
Average Price(Rs. Per Kg.)
2012 2013
DUST
(a) C.T.C.
Assam
Cachar
Arunachal
Meghalaya
Nagaland
Tripura
TOTAL : CTC.
(b) ORTHODOX
Assam
Cachar
Tripura
Green tea
Arunachal
TOTAL(ORTHODOX)
TOTAL: DUST TEA
ALL TEAS
28.64
0.96
1.09
0.04
0.001
0.235
30.97
0
0
0
0
0
0
30.97
102.36
145.13
108.27
132.72
113.76
92.70
101.33
143.17
0
0
0
0
0
0
143.17
139.88
30.66
0.99
1.07
0.06
0
0.26
33.05
0
0
0
0
0
0
33.05
107.47
141.88
101.16
127.7
105.81
0
90.02
139.72
0
0
0
0
0
0
139.72
134.46
1 2 3 4 5
185

186
TABLE - 15.05AREA, PRODUCTION, PRICE AND EMPLOYMENT GENERATION
OF COFFEE IN ASSAM
TABLE - 15.06AREA, PRODUCTION AND PRICES OF RUBBER IN ASSAM
N.A. - Not Available.Source: Coffee Board, N.E. Region, Guwahati.
Year
2011-2012
2012-2013
1 2 3 4 5
Are
a(i
n H
ecta
re)
Pro
duct
ion
(in
M.T
.)
Pri
ces
(Rs.
/kg)
Em
ploy
men
tG
ener
atio
n(N
os.)
909.49
952.74
42.61
60.72
98.02
141.15
N.A.
N.A
Year
2011-2012
2012-2013
1 2 3 4 5 6
Tapping Area(in hect.)
Area(in hect.)
30790.70
34537.62
8607.96
N.A
189600
168000
Production(in MT)
Prices(Rs./ MT)
Total Value(in crores)
10436.50
11053.78
197.87
185.70

187
TABLE - 15.07DISTRICT-WISE AREA AND PRODUCTION OF RUBBER IN ASSAM
DURING 2012-13
DistrictArea
(In Hectare)Production(in MT)
KokrajharDhubriGoalparaBarpetaMorigaonNagaon
SonitpurLakhimpurDhemajiTinsukiaDibrugarhSivasagar
JorhatGolaghatKarbi AnglongDima HasaoCacharKarimganj
HailakandiBongaigaonChirangKamrupKamrup MetroNalbari
BaksaDarrangUdalguri
Assam
1 2 3 4
Tapping Area(in Hect.) 2011-12
1792.87903.67
7640.1422.54
267.84181.83
198.7117.6969.66
139.8670.6077.02
33.08447.09
6542.36293.71
1535.006240.00
2385.002083.51
761.452125.85
-11.45
67.87165.21463.61
34537.62
340.70240.68
2625.8016.91
106.00176.00
186.00-
22.0021.0016.0015.00
14.00110.00
3519.8540.00
460.001500.00
500.00475.9088.14
544.20-0
025.5010.10
11053.78
138.4160.4155812.5
30130
132.412
22.783227
15.38
16.6676
2355.6182.1685
1452.18
610350.328.25
450185
0
102511
8607.96
Source: (Table 15.06 & 15.07) Rubber Board, Zonal Office ,Guwahati-6

16.MINERALFIGURE AT A GLANCE, 2012-13
Production of Coal
Production of Crude Oil
Production of (Utilised) Natural Gas
Production of Limestone
Index of Mineral Production (all)(Base: 2004-05=100)
605 ‘000 MT
4861 ‘000 MT
2681 MillionCubic Metre
292 ‘000 MT
105.15
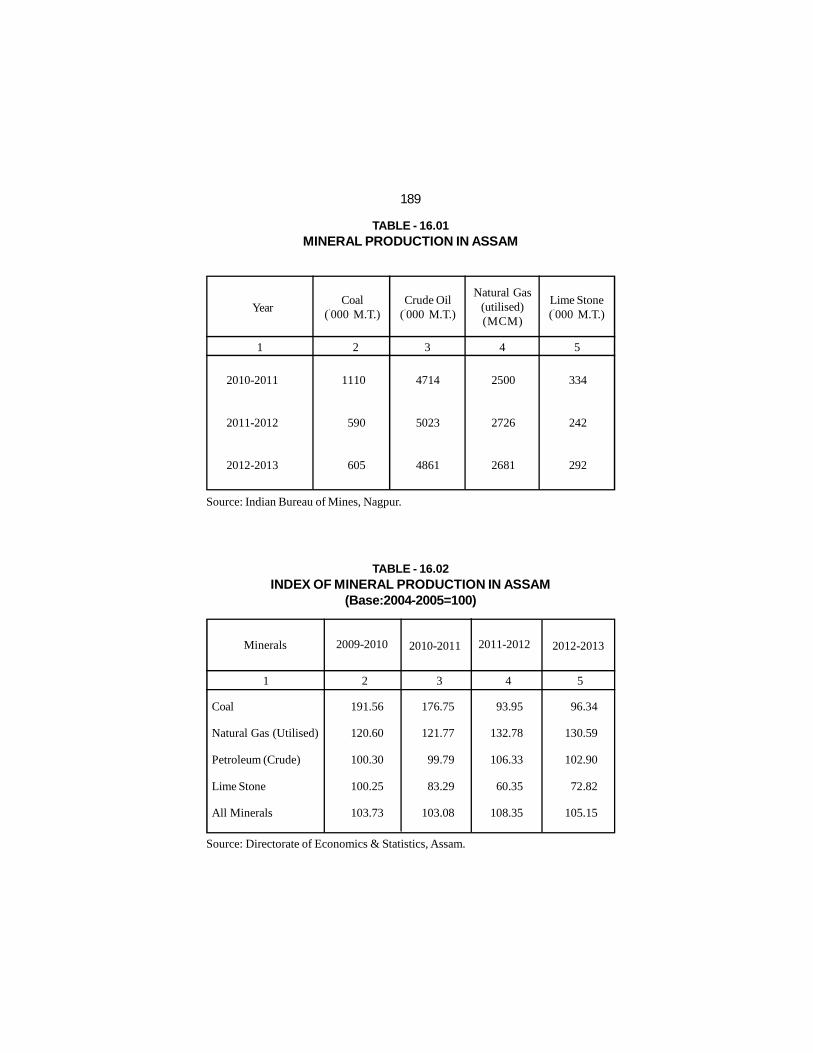
TABLE - 16.01MINERAL PRODUCTION IN ASSAM
189
Source: Directorate of Economics & Statistics, Assam.
TABLE - 16.02INDEX OF MINERAL PRODUCTION IN ASSAM
(Base:2004-2005=100)
Year
2010-2011
2011-2012
2012-2013
1 2 3 4 5
1110
590
605
4714
5023
4861
2500
2726
2681
334
242
292
Coal(`000 M.T.)
Crude Oil(`000 M.T.)
Natural Gas(utilised)(MCM)
Lime Stone(`000 M.T.)
Minerals
Coal
Natural Gas (Utilised)
Petroleum (Crude)
Lime Stone
All Minerals
1 2 3 4 5
2009-2010 2011-2012
96.34
130.59
102.90
72.82
105.15
176.75
121.77
99.79
83.29
103.08
Source: Indian Bureau of Mines, Nagpur.
2010-2011 2012-2013
191.56
120.60
100.30
100.25
103.73
93.95
132.78
106.33
60.35
108.35

TABLE - 16.03COLLIERY-WISE PRODUCTION OF COAL IN ASSAM
190
(In `000 M.T.)
Ledo
Ledo O.C.P.
Borgolai
Tirap
Tipong
Jaypur
Tikok
Khota Ardha
Garampani
DistrictColliery
1 2 3 4 5
2012-20132010-2011
Tinsukia
-do-
- do -
- do -
-do-
Dibrugarh
Tinsukia
Dima Hassao
- do -
NIL
127
NIL
291
3
NIL
183
27
48
679
Nil
114
Nil
530
2
Nil
455
9
29
1139
2011-2012
Nil
127
Nil
196
3
Nil
276
27
42
671Total
Source: Directorate of Geology and Mining, Assam.

TABLE - 16.04GROSS PRODUCTION OF NATURAL GAS AND QUANTITY OF GAS
FLARED IN ASSAM
191
Source: (16.03 & 16.04) Directorate of Geology and Mining, Assam.
(In Million Cubic Metre)
2010-2011
2011-2012
2012-13
YearG
ross
Pro
duct
ion
1 2 3 4 5 6 7 8U
navo
idab
le L
oss
(Gas
flar
ed)
Per
cent
age
of G
asfl
ared
ove
r G
ross
prod
ucti
on.
Gas
ret
urne
dto
Nat
ural
rese
rve.
Gas
use
d fo
rpe
trol
eum
min
ing
oper
atio
n.
Net
prod
ucti
on
2178.07
462.24
41.43
268174
2390.98
504.12
0
2895.10
2424.64
485.14
0
2909.78
158.89
30.79
1.70
191.38
144.96
40.32
0
185.28
165.85
42.98
0
208.83
7.29
6.66
4.1
7.13
6.06
7.99
0
6.39
6.84
8.85
0
7.17
0
0
0
0
0
0
0
0
0
0
0
0
291.72
169.53
0.60
461.85
284.64
192.72
0
477.36
286.07
192.00
0
478.07
1727.46
261.92
39.13
2028.51
1961.38
271.08
0
2232.46
1972.72
250.16
0
2222.88
OIL
ONGC
C.R.L
Total
OIL
ONGC
C.R.L
Total
OIL
ONGC
C.R.L
Total
Cat
egor
y

17.POWERFIGURE AT A GLANCE, 2012-13
Installed Capacity of Generating Plant (MW)
Gross Unit Generation (MU)
Energy Requirment (MU)
Peak Demand (MW)
Peak Demand Met (MW)
Shortage (%)
No. of Consumers
Domestic
Commercial
Consumption of Electricity (MU)
No. of Villages Electrified
376.7
1765.3
6392
1286
1068
16.95
2130992
181781
4206
22520

193
10012097
37.222.5
376.7
454.9751.7565.7
1772.3
2.371.926.1
100.3
452.7679.7539.6
1672
TABLE - 17.01INSTALLED CAPACITY AND GENERATION OF ELECTRICITY
IN ASSAM
Source: Assam Power Generation Corporation Limited.
Type 2010-11 2011-12 2012-13
A. Installed Capacity of Generating Plant(M.W.)Hydel KLHEPGas LTPS
NTPSWaste Heat LTPS WHRURecovery Unit NTPS WHRU
Total
B. Gross Unit Generation (MU)Hydel KLHEPGas LTPS
NTPS
Total
C . AUX Consumption (MU)Hydel KLHEPGas LTPS
NTPS
Total
D. Net Unit Generation (MU)Hydel KLHEPGas LTPS
NTPS
Total
100120
97-
22.5
339.5
409.5767.8530.5
1707.7
2.166.923.8
92.8
407.4700.9506.7
1615
1 2 3 4
100120
9737.222.5
376.7
344.0888.1533.2
1765.3
1.7101.9
30.0
133.6
342.3786.2503.2
1631.7

194
5877
5700
177
3.02
1135
1060
75
6.61
TABLE - 17.02REQUIREMENT AND SHORTAGE OF ELECTRICITY IN ASSAM
Item 2010-11 2011-12 2012-13
Energy Requirement (MU)
Availability (MU)
Shortage (M.U)
Shortage (In Percentage)
Peak Demand (MW)
Peak Demand Met (MW)
Shortage (M.W.)
Shortage (In Percentage)
5403
5031
372
6.89
1065
947
118
11.08
1 2 3 4
6392
5895
497
7.78
1286
1068
218
16.95

TABLE - 17.03TRANSMISSION, DISTRIBUTION AND COMMERCIAL LOSSES
IN ASSAM
195
Energy Input(MU)
Energy Billed (MU)
T & D Losses (MU)
T & D Losses (%)
Amount Billed (Rs. in lakh)
Amount Realised (Rs. in lakh)
Collection Efficiency (%)
Overall Efficiency (%)
Aggregate Transmission and
Commercial Losses (%)
Item 2010-11 2011-12
4972
3535
1437
28.90
158457
148942
94.00
70.09
29.91
5684
3969
1715
30.17
201265
190666
94.73
69.52
30.48
1.
2.
3.
4.
5.
6.
7.
8.
9.
1 2 3 4
2012-13
5871
4205
1666
28.38
227501
218035
95.84
71.06
28.94

TABLE - 17.04DISTRICT-WISE NUMBER OF CONSUMERS IN ASSAM
2011-12
District
1 2 3 4 5 6
Circle
Kokrajhar
Bongaigaon
RangiaBarpetaGEC-IGEC-IIMangaldoi
TezpurLakhimpur
Nagaon
Jorhat
SivasagarDibrugarhTinsukiaKaanch
Cachar
Total
Domestic
82511
121122
2520630
1454589948081258
13007693752
215218
178559
96237479729164213587
162194
1811129
8370
8064
139210
2503963865143
109106534
16850
12767
88817437
140275536
22445
172310
2012-13(P)
Domestic
Commercial
Commercial
98711
119950
155742138149154887124819108146
155114106396
231557
217330
10483661883
10026767411
185794
2130992
8625
8511
64468493
2609376315784
117467194
17178
13718
94268182
141185134
23502
181781
DhubriKokrajharBaksaChirangBongaigaonGoalparaNalbariBarpetaKamrup (M)KamrupDarrangUdalguriSonitpurLakhimpurDhemajiMorigaonNagaonGolaghatJorhatSivasagarDibrugarhTinsukiaKarbi-AnglongDima-HasaoKarimganjHailakandiCachar
196
P - Provisional.
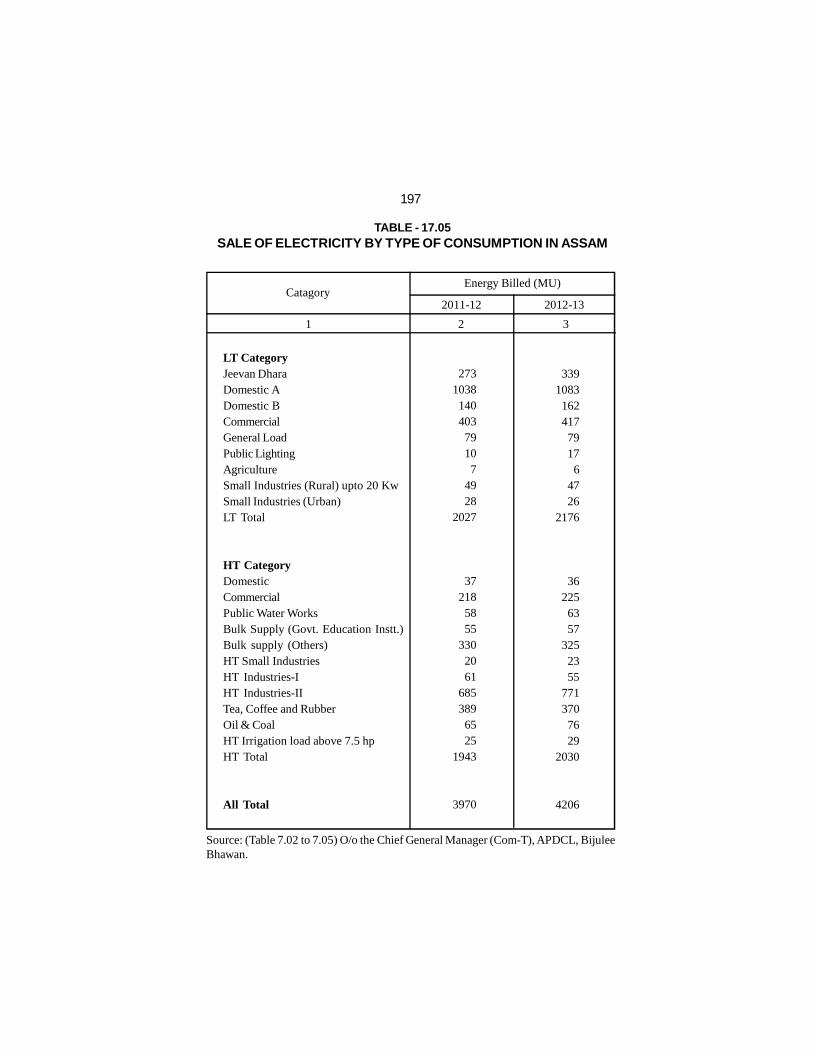
197
TABLE - 17.05SALE OF ELECTRICITY BY TYPE OF CONSUMPTION IN ASSAM
LT CategoryJeevan DharaDomestic ADomestic BCommercialGeneral LoadPublic LightingAgricultureSmall Industries (Rural) upto 20 KwSmall Industries (Urban)LT Total
HT CategoryDomesticCommercialPublic Water WorksBulk Supply (Govt. Education Instt.)Bulk supply (Others)HT Small IndustriesHT Industries-IHT Industries-IITea, Coffee and RubberOil & CoalHT Irrigation load above 7.5 hpHT Total
All Total
CatagoryEnergy Billed (MU)
1 2 3
Source: (Table 7.02 to 7.05) O/o the Chief General Manager (Com-T), APDCL, BijuleeBhawan.
2011-12
2731038140403
79107
4928
2027
37218
5855
3302061
685389
6525
1943
3970
2012-13
3391083
1624177917
64726
2176
362256357
3252355
7713707629
2030
4206

TABLE - 17.06DISTRICT-WISE NUMBER OF VILLAGES ELECTRIFIED IN ASSAM
(RGGVY only)
N.B:- *Baksa included in Nalbari District, **Chirang included in Bongaigaon District, ***Udalguriinlcuded in Darrang District and **** Kamrup (M) included in Kamrup District.
Source: O/o the Chief General Manager (Rural Electrification), APDCL Bijulee Bhawan.
KokrajharDhubriGoalparaBarpetaMorigaonNagaonSonitpurLakhimpurDhemajiTinsukiaDibrugarhSivasagarJorhatGolaghatKarbi AnglongDima HasaoCacharKarimganjHailakandiBongaigaonChirang**KamrupKamrup (M)****
NalbariBaksa*DarrangUdalguri***
Assam
DistrictNo. of inhabited
villages 2011Census
No. of villages Electrified(Cumulative)
2011-12 2012-13
7541226
741998468
131715421082102310751035
452769
10322211
445890749313836
1292
739
1305
22294
1 2 3 4
10681091829835632
141218761184131911681348875848
11252921695
1040936331
1071-
1284-
1146-
1361-
26395
8061226741998474
132715421087102710751035452769
10322252482890758313838
-1293
-798
-1305
-
22520
198

18.ROADSFIGURE AT A GLANCE, 2012-13
PWD Road Length (Total)
Surfaced (Black topped)
Unsurfaced
National Highway (N.H.)
Total Road Length including N.H.
Road Length per lakh of population
Road length per `00 sq. km. of Geographical Area
45500 Km.
22700 Km.
22800 Km.
3069.22 Km.
48569.22 Km.
145.98 Km.
58.01 Km.

TABLE - 18.01DISTRICT-WISE AND CATEGORY-WISE LENGTH OF ROADS
UNDER P.W.D IN ASSAM, AS ON 31-03-2013
200
(In Km.)
DistrictState
Highway
MajorDistrictRoad
RuralRoad
UrbanRoad
KokrajharDhubriGoalparaBarpetaMorigaonNagaonSonitpurLakhimpurDhemajiTinsukiaDibrugarhSivasagarJorhatGolaghatKarbi AnglongDima HasaoCacharKarimganjHailakandiBongaigaonChirangKamrupKamrup MetroNalbariBaksaDarrangUdalguri
Assam
Total
1 2 3 4 5 6
6156
13715814229755
1214563
155100162160337380107351741
089
011997
14356
3134
1315348
17186
326402
9742
171163310
89157561199165342
9916
223230
04543
119125
4413
1632100713541463909
24092133828
11681479135724251714213133411237848539351712429
29160
779961785
1639
36544
1638103113885944865263408633706042196
3680
457220
209
1409
18411154155018241150312026481091134017651738287420512480430918761163936473805660
3235457965
110110661828
45500

TABLE - 18.02LENGTH OF ROADS ACCORDING TO TYPE IN ASSAM
201
(In Km.)
District
National Highways, 2013-14
Total
KokrajharDhubriGoalparaBarpetaMorigaonNagaonSonitpurLakhimpurDhemajiTinsukiaDibrugarhSivasagarJorhatGolaghatKarbi AnglongDima HasaoCacharKarimganjHailakandiBongaigaonChirangKamrupKamrup MetroNalbariBaksaDarrangUdalguri
Assam
1 2 3 4 5 6 7 8
P.W.D. Road, March’2013
Earthen/Gravel
BlackToppedTotal
Newlydeclared
NH
NationalHighway
Source: Office of the Chief Engineer, P.W.D (NH) and Office of the Chief Engineer,P.W.D (Roads), Assam.
64.00111.45
98.7072.0036.00
237.39213.89101.00129.00169.14
76.0083.4550.03
127.52169.61161.34189.77
96.1699.8673.6628.20
119.8071.0037.2024.0059.0021.00
2720.17
----------------
15.7936.2462.5714.60
------------------------------
129.20
9.0061.00
--------------
61.85--------------------
40.009.20
----
38.80----
219.85
737802704988510
19271044640585986
10471108908
12611320816745481299532434
2076423656491660520
22700
1104352846836640
11931604451755779691
17661143121929891060418455174273226
115934
309610406
1308
22800
18411154155018241150312026481091134017651738287420512480430918761163936473805660
3235457965
110110661828
45500
UnderConstrn.
73.00172.45
98.7072.0036.00
237.39213.89101.00144.79267.23138.57
98.0550.03
127.52169.61161.34189.77
96.1699.8673.6668.20
129.0071.0037.2062.8059.0021.00
3069.22

TABLE - 18.03LENGTH OF ROADS PER LAKH OF POPULATION & PER
`00 SQ. KM. OF GEOGRAPHICAL AREA IN ASSAM, 31-03-2013
202
District Total RoadLength
Road Length PerLakh of Population
Road Length per`00 Sq. Km. of
Geographical Area
KokrajharDhubriGoalparaBarpetaMorigaonNagaonSonitpurLakhimpurDhemajiTinsukiaDibrugarhSivasagarJorhatGolaghatKarbi AnglongDima HasaoCacharKarimganjHailakandiBongaigaonChirangKamrupKamrup MetroNalbariBaksaDarrangUdalguri
Assam
1 2 3 4
18411154155018241150312026481091134017651738287420512480430918761163936473805660
3235457965
110110661828
45500
207.5559.22
153.62107.73120.06110.40137.49104.84194.75134.02130.90249.86187.94234.26446.40878.5766.9876.9171.75
109.88136.98213.2236.26
125.34115.44117.39219.51
145.98
58.1669.3584.9868.1374.1578.5350.1547.9141.4046.5751.40
107.7271.9470.8241.3038.3830.7251.7435.6446.6633.4292.8672.8795.5954.8457.60
109.20
58.01

TABLE - 18.04DISTRICT-WISE HABITATION CONNECTIVITY STATUS FROM
PHASE-I TO PHASE-VI UNDER PMGSY AS ON 31ST MARCH, 2013
203
Source: (Table 18.01, 18.03 & 18.04) Office of the Chief Engineer, P.W.D (Roads),Assam.
District(1000+)
Total(2+3+4)
No. of Villages
(500+) (250+ )
KokrajharDhubriGoalparaBarpetaMorigaonNagaonSonitpurLakhimpurDhemajiTinsukiaDibrugarhSivsagarJorhatGolaghatKarbi AnglongDima HasaoCacharKarimganjHailakandiBongaigaonChirangKamrupKamrup MetroNalbariBaksaDarrangUdalguri
Assam
1 2 3 4 5
19031414240121555835014119913520520421418136
721914910015595
444City Area
15418019871
5257
1185147504652
1121077673926847665745645939485095
City Area61647256
1715
64292959364240837357684961807650454348392266
City Area20203722
1258
372394218510297652502331348265365321322327169102328251187242167605
City Area235264307149
8230

19.TRANSPORT ANDCOMMUNICATION
FIGURE AT A GLANCE, 2012-13
No. of Vehicles on RoadNo. of Vehicle registered during the year
Revenue Collection under Commissionerate of Transportduring the year (Rs. in crore)
Railway Route length in Assam (Km.)(i) Broad Gauge(ii) Metre Gauge
Village covered by Public Telephone (VPTs), as on December, 2012
Total Telephones, as on December, 2012
Tele Density (%), as on December, 2012
No. of Post Offices
No. of Letter Boxes
No. of Daily News Paper published
1725222227367
344.38
1470.06988.87
24676 Nos.
1422194 Nos.
4.56
4013
16386
46

TABLE - 19.01STATISTICS ON ASSAM STATE TRANSPORT CORPORATION
Source: Assam State Transport Corporation, Guwahati
Particulars Unit
Average No. of Vehicles held
Average No. of Vehicles on Road
Fleet Utilisation
Total K. M. Operated
Monthly average Gross Income of own Buses
Monthly average Net Income of own Buses
Earning per K.M.
Cost per kilometre (other than pay &allowance Depriciation & interest)
Load factor i.c. Occupancy Ratio
Kilometre per Litre (KPL)
Total No. of Staff (excluding Trainee Driver)
No. of employees on VRS
Staff Bus Ratio (excluding Trainee Driver)
Average monthly Salary
Progress in Guwahati, Jorhat and SilcharISBT
Progress in Guwahati Jatri Niwas
No. of Private Buses Operated under ASTC
Monthly Average earning from Private Buses
No. of Stations and Sub-Stations
1 2 3 4
No
No
Percent
Lakh K.M.
Rs. in Lakhs
Rs. in Lakhs
Rs.
Rs.
Percent
KM/Ltr.
No
No.
-
Rs. in Lakhs
-
-
No
Rs. in Lakhs
No
2011-12 2012-13
538
441
82
222.36
384.86
123.61
20.77
14.10
84.04
3.61
2197
--
5:01
461.54
Operated
Operated
1170
92.25
133
665
540
81
248.48
450.43
136.64
21.75
15.15
78.24
3.68
2153
--
4:01
450.79
Operated
Operated
1344
76.31
133
205

TABLE-NUMBER OF MOTOR VEHICLES ON ROAD
LMV = Light Motor Vehicle Goods Carriers.
1 2 3 4 5 6 7 8 9 10
District
KokrajharDhubriGoalparaBarpeta
MorigaonNagaonSonitpurLakhimpurDhemajiTinsukia
DibrugarhSivasagarJorhatGolaghatKarbi AnglongDima Hasao
CacharKarimganjHailakandiBongaigaonChirangKamrup
Kamrup MetroNalbariBaksaDarrangUdalguri
Assam
Mul
tiA
xle
Art
icu-
late
d
Tru
ck
1234
56789
10
111213141516
171819202122
2324252627
LM
V
Bus
Om
niB
us
Min
iB
us
Taxi
Sl.No.
--1-
----
2712
3736
--
18-
------
372----
503
--7
29
--
66-
23120
10216
5---
914---
678----
1168
177126029221460
3322959272
1919360
6849
30386405403925272446
95
3424526
25821140229496
60716524
551724515
108991
254530
1618369
1091299414061923489
1290
3412281756221421485
66
6364860645496260922
28266517160
22794-
87071
25410381279
4349
-22428
290
5001390
81122127612
1437850982166
58826115
33013
11957
-10
-14
--
1013
10
1710
--
48-
22-
10---
691----
846
-29533
3--1
2554
40115
24194
96
1104615
---
9647---
1698
532422
1009481
5871537
6851260
4341236
146835662029
72915230
3155876
1002735288911
10133323708
1002303
35593
206

19.02IN ASSAM DURING THE YEAR, 2012-13
A/R = Auto Rickshaw.
11 12 13 14 15 16 17 18 19 20 1
A/R
Tw
oW
heel
er
Tra
ctor
1234
56789
10
111213141516
171819202122
2324252627
Tra
ilor
Cra
ne
Oth
ers
TotalSl.
No. Car
Jeep
Gov
t.V
ehic
le
10556240113643954651
205979840622387635831761577753
10841997800
15887419769219635416
6265716611154774471190969359
645131329346412
3454910046
1725222
41208211
37
21329
373093
298
292298191291
6513
1065-
447
397
319311
-1582
6
8787
13917
-117
-351
17400
1837
42162390
151321696
394143
--
176
136986019
-32
18091
44-3
--
1045
100
60157
37473
121-5
1214
72625--
1175
4601
19666
-352675538509
1662
2432780
210864
1815
230264
44392
17
1115196100
1417145
14282
28066
1981349
2431124173
1400465653
2293715
2811192
4413
69091
125498
8319
2905558350
20323
17906
-364921
-150
--
39202
422660
259018
297183
618
--6-
59035---
10605
1150262238673011
-12606
259610130
431318512
307941608435754
24121325333
104474045199522691262165
170866321200
1182463
338724
7350162952410245722
177597023815683441931051344233
6233161940982421160512522
2386
3008880437247
3631158035547
32455128833
400042978065
1007899
600150120021090
5764417
7571560
2712195
123124494221
7627671575
7457185217983071
791499
144721516
800201181
59926
207

TABLE-NUMBER OF MOTOR VEHICLES
LMV = Light Motor Vehicle Goods Carriers.
1 2 3 4 5 6 7 8 9 10
District
Mul
tiA
xle
Art
icu-
late
d
Tru
ck
1234
56789
10
111213141516
171819202122
2324252627
LM
V
Bus
Om
niB
us
Min
iB
us
Taxi
Sl.No.
KokrajharDhubriGoalparaBarpeta
MorigaonNagaonSonitpurLakhimpurDhemajiTinsukia
DibrugarhSivasagarJorhatGolaghatKarbi AnglongDima Hasao
CacharKarimganjHailakandiBongaigaonChirangKamrup
Kamrup MetroNalbariBaksaDarrangUdalguri
Assam
--1-
----5-
6-----
------
4----
16
----
--
18--
20
10-----
-1----
-----
49
3274
1326-
5281
110330
711544
13335
138356979
13
224944
183223
75
1774255
98194
7966
136-
34-
-704699
79130
52
503606881
11200
-
834159139305
66847
29799665
-65
9590
15102615
230
-111086
410191126
-
389
1452
30
32881
164
730
----
------
------
------
2----
2
----
3-
316---
212---1
--
13---
-3---
359
246368401349
290403333169185238
420472138187
45-
670365221154114502
1020114237139122
7902
208

19.03REGISTERED IN ASSAM DURING 2012-13
A/R = Auto Rickshaw.
11 12 13 14 15 16 17 18 19 20 1
A/R
Tw
oW
heel
er
Tra
ctor
12345
6789
1011
1213141516
171819202122
2324252627
Tra
ilor
Cra
ne
Oth
ers
TotalSl.
No. Car
Jeep
Gov
t.V
ehic
le
160233432192
92
467373202
90198310
818421
45524
1558391130382141491
961216157
4313
7897
28814369608465952569
953573054979287862978650
7963920531832248211
440310711236603012594166
311913571112842001803
145010
367294
1043669208
218111671151
54024822602
20462517
82732535
157259727989823994
1890515388
254120
41653
-----
------
---
2723
------
6----
56
141194154247158
27470
261757376
18102
5610
-
205
1994
168232
213102113120
57
3052
213
-61
-
233075853823
7501392
-
22331
14
292829
13620
1058
21---
--5-26
4428-
41---1
5-27-
54
41-
23--
161-11
514
-4626
23----1
55762-2
756
1719
3-1
915
2151517
1901430
-16
18--61
82
6641-
82-
1217
40405575952781283375
136871074272654084
1104612782
114391316646974461
349
916426502098806022146535
586384323182750952400
227367
209

TABLE-NUMBER OF MOTOR VEHICLES REGISTERED
LMV = Light Motor Vehicle Goods Carriers.
1 2 3 4 5 6 7 8 9 10
District
Mul
tiA
xle
Art
icu-
late
d
Tru
ck
LM
V
Bus
Om
niB
us
Min
iB
us
Taxi
Sl.No.
123456
789
1011
121314151617
181920212223
24252627
KokrajharDhubriGoalparaBarpetaMorigaonNagaon
SonitpurLakhimpurDhemajiTinsukiaDibrugarh
SivasagarJorhatGolaghatKarbi AnglongDima HasaoCachar
KarimganjHailakandiBongaigaonChirangKamrupKamrup Metro
NalbariBaksaDarrangUdalguri
Assam
--1-
28-
--
123941
47--
32--
-----
372
----
572
--7-
1510
90-6
19563
3345-1-
23
15---
687
48-
114-
1604
17125642952901
13276215
34412945411
79835189
10599416428705221388
4252
128026281140676496
60803
131259
3663523
134173
366389
13981194
903774
28101926
29020512327
17155667
651696100
8154
118769995977
92228319
808179419
-
67167
42416399294215433
612553
52538
1350
1647843361381
24532
28659
1201766
5895
13919
77014
16077
-92
142
79
301-
3916
34-
2443
-152
7114
---
691
2-6-
1229
-3059
34-
3271-
116703
1582433
422
362
5316
---
964
13-
10-
2902
5181288864563919
2149
16281534802
19611690
43842102721277
414484
10781021768377911
10169
376799
1099304
42827
210

19.04IN ASSAM UPTO 31ST MARCH, 2013
A/R = Auto Rickshaw.
11 12 13 14 15 16 17 18 19 20 1
A/R
Tw
oW
heel
er
Tra
ctor
Tra
ilor
Cra
ne
Oth
ers
TotalSl.
No. Car
Jeep
Gov
t.V
ehic
le
123456
789
1011
121314151617
181920212223
24252627
759125920231283
6415787
15311563
25128951655
24764288
10849702276
10395
279718123228
928499
14475
21461072
335181
71633
94762135119547523201967385208
67135442678324
6107461615
1101859834515630170612717
42163
102267247
3663269615547
324873
383194754
521788067
1230895
13502463299236802002
14461
1176510138
6552600933793
3156735833
33472342847
12862
4048200323711485165
173109
1111279
2581471
383729
-190
662122
700
7891-
678563
321625901743476396802
66--2-
5913
27-
360-
18621
382278257
1596293
1880
19361053208
1071355
10072816232
8630
1050
91130502
7319
2910
594127
2421324
21955
6553
27727127431
3332538241
18062859
972117253449
5812
264-
55417
1115
301426
1341145
18309
21-32-
44-
1602234
1923718143
25
1-5
1014
728
27
27-
3493
101272108114
35474
194434
20108
51
68390
391089733508
149--
136
13698
79196832
18802
82199863742
1524
2854233
320498
45361955439942
651
5-
507
3973223
221
103956
23320
1325531262307886275025437
123125
959096500011305
107043115002
172262159416
26573332417624
87227
213651563845775111149359
647944
452997741
7578710067
2057308
211

TABLE -19.05REVENUE COLLECTION UNDER COMMISSIONERATE OF
TRANSPORT, ASSAM
Source: (Table: 19-02 to 19.05) Office of the Commissionerate of Transport, Assam.
District AuthorityRevenue Collection (Rs. in Crore)
Kamrup (R & L)Kamrup (R.T.A.)Kamrup (Enforecement)Kamrup (Rural)BarpetaNalbariGoalparaDhubriSonitpurMangaldoiLakhimpurDibrugarhTinsukiaDhemajiSivasagarJorhatGolaghatNagaonMorigaonDima HasaoKarbi-AnglongKarimganjHailakandiSilcharBoxirhat, M.V. CheckgateSrirampur, M.V. CheckgateKokrajharBongaigaonS. T. A.Digharkhal, M.V. CheckgateUdalguriChirangBaksa
Total
1 2 3
2011-12 2012-13
94.190.992.042.417.093.815.986.32
12.323.827.62
18.7415.72
3.4314.1014.73
5.8314.80
3.720.854.403.303.06
13.474.051.855.807.82
22.381.082.262.371.77
312.12
102.080.701.825.887.374.526.626.95
14.004.108.54
18.7417.173.08
16.7816.966.63
15.974.670.874.743.983.22
15.353.573.155.899.09
24.231.002.282.551.88
344.38
212

TABLE -19.06RAILWAY ROUTE LENGTH OF ASSAM AND N. F. RAILWAY
Source: N.F. Railway, Maligaon, Guwahati, Assam.
(In Km.)
Particulars
(i) Route Kilometre Broad Gauge
Metre Gauge Narrow Gauge Total(ii) Running Kilometre Broad Gauge Metre Gauge
Narrow Gauge Total
(i) Route Kilometre
Broad Gauge Metre Gauge Total(ii) Running Kilometre Broad Gauge Metre Gauge
Total(i) Accidents Occured at unmaned level crossing No. of accidents Person killed Person Injured(ii) Accidents due to derailed
No. of accidents Person killed Person Injured
1 2 3
2012-132011-12
N. F. RAILWAY
ASSAMA.
B.
2656.011221.36
87.48
3964.85
3036.431221.36
87.484345.27
1470.06988.87
2458.93
1582.07988.87
2570.94
2
624
5--
18
2656.011221.36
87.48
3964.85
3036.431221.36
87.484345.27
1470.06988.87
2458.93
1582.07988.87
2570.94
--
----
------
213

TABLE -19.07PASSENGER AND GOODS CARRIED BY INLAND WATER
TRANSPORT VESSELS, ASSAM, 2012-13
Contd...
Name of the Ferry servicePassengers (in Nos.)
GUWAHATI DIVISIONNagarbara - Alopotty - Majorchar
Bumundi - Sialmari - Guimari
Baghbor - Goalpara
Guwahati - Kurua
Borchala - Mairabari
Dhing - Singri
Larkuchi - Majorchur - Kalarchar
Hohuwa - Somaria - Bhogdia - Directory
Palashbari - Sualkuchi
Dukuchi - Bhokuradia - Rameswar - Pizupara
Sunari - Dudhnath
Lowkhowa - Tezpur
Sunsali Kurua - Guwahati
Auniati - Silsako - Guwahati
Majortoop (Alikash) - Bhagnamari
Buragaon - Gadlichar Pakatari - Malahu
Kasikhowa - Kalichar, Magurmari, Chitalmari
& Karikhowa
Gumaghat
Adabari - Salmari - Kurihamari
Simlabari Ghat
Kurihamari - Guwahati, via Sualkuchi
Sontoli - Bohari - Alikash
Burikhamar
Guwahati - Madhyamkhanda (Deptt. Vessel)
Guwahati - Madhyamkhanda
1 2 3 4
1
2
3
4
5
6
7
8
9
10
11
12
13
14
15
16
17
18
19
20
21
22
23
24
Sl.No.
Goods (in QTs)
124850
15610
10955
70753
6982
16431
63988
25368
5412
264341
31487
18446
32240
7515
23213
6519
29988
20540
20267
3812
81237
12984
137460
268601
--
4030
1893
--
3378
17886
3773
174
1066
--
74
--
2338
333
941
--
--
472
--
4226
19046
--
352
1150
214

(...Contd) TABLE - 19.07
Guwahati - Rajaduar (Deptt. Vessel)
Mukalmua - Bhagonmari
Borghola - Kahibari Borghola - Talpakhuri
Guwahati - Kachamari
Guwahati - Kirakara
Chaparmukh - Kachuwa
Dhubri - Fakirganj
Phulbari - Dhubri
Chutiagaon - Dimburchar
Lengthesinga - Sontoshpur and Bartari
Joleswar - Dhubri
Guwahati - North Guwahati
SILCHAR DIVISION
Fulertol
Silghat
Sonai
Bagpur
Sonabari
Gangapur
Berenga
Badri
Gandhighat
Chotto-Dudhpatil
Boro-Dudhpatil
Annapurna
25
26
27
28
29
30
31
32
33
34
35
36
37
38
39
40
41
42
43
44
45
46
47
48
Name of the Ferry servicePassengers (in Nos.)
1 2 3 4
Sl.No.
Goods (in QTs)
850915
10370
61330
1993
31941
20667
194674
76093
1366
47157
84237
635198
155626
177607
223755
17457
178072
141593
172036
110616
683511
161775
20115
344531
--
74
--
10005
8126
--
122030
52162
1283
--
11360
--
--
--
--
--
176
--
400
--
239
--
--
--
215
Contd...

(...Contd) TABLE - 19.07
Massimpur
Jatinga
Rajnagar
Dhaleswari
Siddheswari
Narayanpur
Ratanpur
Lalacherra
DIBRUGARH DIVISION
Cinatoli-Bogoriguri-Neamati
Neamati-Kamalabari
Desangmukh-Matmora
Sikari-Jamuguri-Karatipara
Dikhow-Phulani-Salmora
Sikari-Mamul-Dikhowmukh
Aphalamuikh-Neamati
Sadia-Saikhowa
Bogibeel-Karengbali
Dibrugarh-Majorbasri
Dibru-Kachari-Oriumghat
49
50
51
52
53
54
55
56
57
58
59
60
61
62
63
64
65
66
67
Name of the Ferry servicePassengers (in Nos.)
1 2 3 4
Sl.No.
Goods (in QTs)
Source: Directorate of Inland Water Transport, Assam.
3302
192984
174440
4711
55322
33117
5107
124826
26965
555995
43012
17758
3722
4396
19418
112625
343362
86061
22709
--
--
566
--
--
1
1019
374
5670
8605
4139
686
595
--
--
65946
--
455
7377
216

TABLE - 19.08STATISTICS ON TELECOMMUNICATION IN ASSAM
Source: Bharat Sanchar Nigam Limited.
Items
Number of Telephone Exchanges
Direct Exchange lines (Fixed+W L L+M T S)
Rural Telephone Connection
Village Covered by public telephone (V P T s)
P. C. O. (Local +STD+Highways)
Wireline Phones (Fixed D E L s)
Total
Private
Wireless Phones (G S M + C D M A)
Total
Private
Total Telephones
Overall
Rural
Urban
Tele-Density % (Telephone per 100 population)
Overall
Rural
Urban
As onDec, 2011
As onDec, 2012
1.
2.
3.
4.
5.
6.
7.
8.
9.
1 2 3
597
1827575
619730
24330
23271
229088
--
1598487
--
1827575
619730
1207845
5.86
2.28
30.46
585
1422194
443253
24676
11957
193952
--
1228242
--
1422194
443253
978941
4.56
1.63
24.69
217

TABLE -DISTRICT-WISE NUMBER OF POST OFFICES
1 2 3 4 5 6 7 8
District
KokrajharDhubriGoalparaBarpetaMorigaonNagaonSonitpurLakhimpurDhemajiTinsukiaDibrugarhSivasagarJorhatGolaghatKarbi AnglongDima HasaoCacharKarimganjHailakandiBongaigaonChirangKamrupKamrup MetroNalbariBaksaDarrangUdalguri
Assam
No. of Post OfficesArea served per
Post office(in sq. Km.)
Population servedper Post Office
Rural Urban Total Rural Urban Rural Urban
104138102156100262204172
80124192251203143124
63215138160
8147
21017
140129
71100
3726
493
101
20994
21241015786
2010331
16617033
287
10814710516610128221318184
14521626121815013269
2351481638448
22678
14712974
103
4013
18.1522.3519.3052.8014.4714.46
6.2033.9587.0420.3036.0510.4313.5823.9324.5872.7113.3610.9610.5220.5016.5020.5313.5252.8052.8012.93
0
726.67
21.6023.6520.5030.00
8.962.69
18.7417.1266.96
6.2543.90
3.795.254.50
43.9863.3015.4822.7130.5522.8018.30
8.629.05
30.0030.0038.8013.42
642.25
8001126498530711089319403835142955941
10246330635403592532175441515119086608016776595079757
1071869306245
105157468
195046
1373522633450208613
3664917597354356667617
133137647
160731843324888171121680129258383510
36603353371163
144589537
017181718
371393
Source: Chief Post Master General, Assam Circle.
218

19.09AND LETTER BOXES IN ASSAM, 2012-13
9 10 11 12 13 14 1
No. of letter BoxesAvailability of
Post BoxesRented by
Public 2012Rural Urban TotalMod
erni
sed
Pos
t O
ffic
e20
12 (
in N
o.)
Com
pute
rise
dP
ost
Off
ice
2012
(in
No.
)
District
KokrajharDhubriGoalparaBarpetaMorigaonNagaonSonitpurLakhimpurDhemajiTinsukiaDibrugarhSivasagarJorhatGolaghatKarbi AnglongDima HasaoCacharKarimganjHailakandiBongaigaonChirangKamrupKamrup MetroNalbariBaksaDarrangUdalguri
Assam
14181323
00
4794
1123
13106
45262411
762
297
1313
356
14181224
9374726
9373134352113
746282211
6433935
41313
634
662867650550176685816
1313262
1162430252204145359128992716383526299409223710630743641
14933
511173650459359531096923328455020
11093503814409435
04853
1453
713984686600221778875
1366272
1258522285232190409148
1102809433564313449317745630791694
16386
220008
6318
032
1008
503362
7701000
4620041
860
219

TABLE - 19.10INFORMATION OF NEWS PAPER/ PERIODICALS
PUBLISHED IN ASSAM
Source: Directorate of Information and Public Relations, Assam.
1 2 3 4
Category LanguageNumber of Publication
AssameseEnglishBengaliHindiBodo
Karbi
AssameseBengaliMulti Language
AssameseBengaliHindiEnglishManipuri (Bishnu priya)
AssameseBengali
AssameseManipuri
Assamese
Assamese
Assamese
177
1143
2
211
2318
231
21
71
2
3
0
2012 2013
Daily
Bi-Weekly
Weekly
Forthnighly
Monthly
Bi-Monthly
Quarterly
Yearly
197
1043
3
312
2318231
21
81
2
3
0
220

TABLE - 19.11PASSENGER TRAFFIC HANDLED AT VARIOUS AIR PORTS
OF ASSAM
Airport AircraftMovement
L.G.B. International AirportGuwahati(Domestic + International)
Mohanbari (Dibrugarh)
Kumbhigram (Silchar)
Lilabari (Lakhimpur)
Saloni (Tezpur)
Rowriah (Jorhat)
Total
1 2 3 4 5
26251269412808826938
3751328221442163
3740442647904434
N.A.N.A.N.A.N.A.
N.A.N.A.N.A.N.A.
N.A.N.A.N.A.N.A.
33742346493502233535
Passengers(Number)
Freight(Tonne)
Year
2009-102010-112011-122012-13
2009-102010-112011-122012-13
2009-102010-112011-122012-13
2009-102010-112011-122012-13
2009-102010-112011-122012-13
2009-102010-112011-122012-13
2009-102010-112011-122012-13
1590257193475022446842076938
182505233038231870230761
151871158354209317218735
N.A.N.A.N.A.N.A.
N.A.N.A.N.A.N.A.
N.A.N.A.N.A.N.A.
1924633232614226858712526434
5276852077616013
331322343309
342480497346
N.A.N.A.N.A.N.A.
N.A.N.A.N.A.N.A.
N.A.N.A.N.A.N.A.
5949932286016668
221
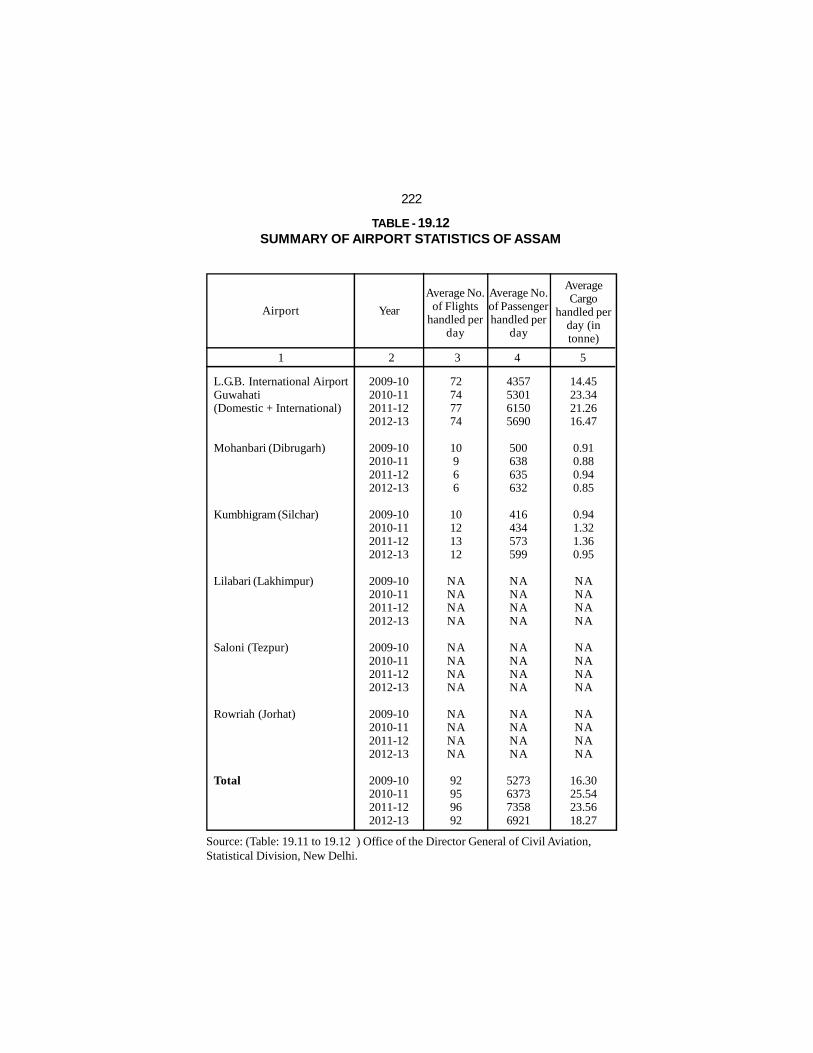
TABLE - 19.12SUMMARY OF AIRPORT STATISTICS OF ASSAM
Source: (Table: 19.11 to 19.12 ) Office of the Director General of Civil Aviation,Statistical Division, New Delhi.
Airport
Average No.of Flights
handled perday
L.G.B. International AirportGuwahati(Domestic + International)
Mohanbari (Dibrugarh)
Kumbhigram (Silchar)
Lilabari (Lakhimpur)
Saloni (Tezpur)
Rowriah (Jorhat)
Total
1 2 3 4 5
72747774
10966
10121312
NANANANA
NANANANA
NANANANA
92959692
Average No.of Passengerhandled per
day
AverageCargo
handled perday (intonne)
Year
2009-102010-112011-122012-13
2009-102010-112011-122012-13
2009-102010-112011-122012-13
2009-102010-112011-122012-13
2009-102010-112011-122012-13
2009-102010-112011-122012-13
2009-102010-112011-122012-13
4357530161505690
500638635632
416434573599
NANANANA
NANANANA
NANANANA
5273637373586921
14.4523.3421.2616.47
0.910.880.940.85
0.941.321.360.95
NANANANA
NANANANA
NANANANA
16.3025.5423.5618.27
222
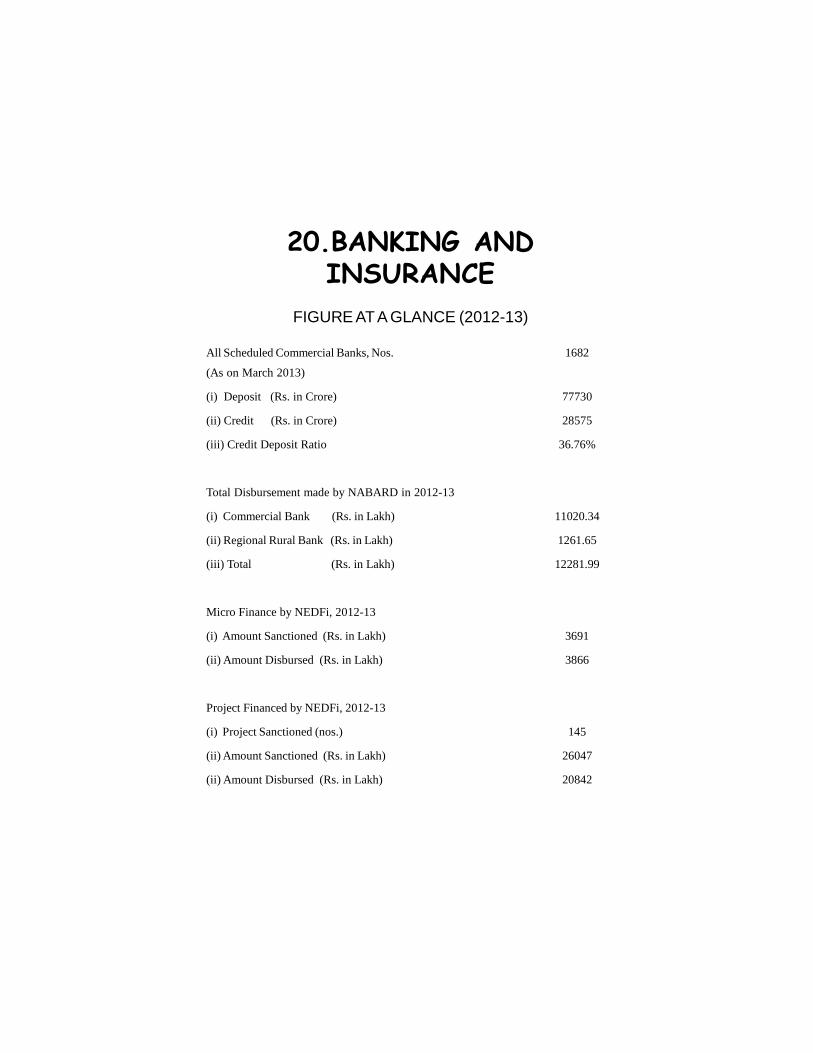
20.BANKING ANDINSURANCE
FIGURE AT A GLANCE (2012-13)
All Scheduled Commercial Banks, Nos.
(As on March 2013)
(i) Deposit (Rs. in Crore)
(ii) Credit (Rs. in Crore)
(iii) Credit Deposit Ratio
Total Disbursement made by NABARD in 2012-13
(i) Commercial Bank (Rs. in Lakh)
(ii) Regional Rural Bank (Rs. in Lakh)
(iii) Total (Rs. in Lakh)
Micro Finance by NEDFi, 2012-13
(i) Amount Sanctioned (Rs. in Lakh)
(ii) Amount Disbursed (Rs. in Lakh)
Project Financed by NEDFi, 2012-13
(i) Project Sanctioned (nos.)
(ii) Amount Sanctioned (Rs. in Lakh)
(ii) Amount Disbursed (Rs. in Lakh)
1682
77730
28575
36.76%
11020.34
1261.65
12281.99
3691
3866
145
26047
20842

TABLE-BANK GROUP-WISE DISTRIBUTION OF
COMMERCIAL BANKS
224
1 2 3 4 5
As on March, 2011
Bank Group
1. State Bank of India and its
Associates
2. Nationalised Banks
3. Foreign Banks
4. Regional Rural Banks
5. Other Scheduled Commercial
(i) Old Private Sector
(ii) New Private Sector
All Scheduled Commercial Banks
No. ofReporting
Offices
Deposit CreditCredit
DepositRatio(%)
265
734
2
409
94
10
84
1504
24556
26974
109
4650
2813
629
2184
59102
8766
8612
48
2230
1397
216
1181
21053
35.70
31.93
44.03
48.00
49.66
34.34
54.08
35.62

20.01DEPOSIT AND CREDIT OF ALL SCHEDULEDIN ASSAM
225
(Rs. in Crore)
As on March 2012
6 7 8 9 10 11 12 13
As on March,2013
No. ofReporting
Offices
Deposit CreditCredit
DepositRatio(%)
No. ofReporting
Offices
Deposit CreditCredit
DepositRatio(%)
270
786
2
407
109
14
95
1574
28172
30332
195
5168
3587
818
2769
67454
10116
10114
93
2777
2071
244
1827
25171
35.91
33.34
47.61
53.74
57.74
29.82
65.98
37.32
289
849
2
408
134
16
118
1682
31535
35425
224
5832
4714
875
3839
77730
10882
11621
82
3286
2704
269
2435
28575
34.50
32.80
36.60
56.34
57.36
30.74
63.42
36.76
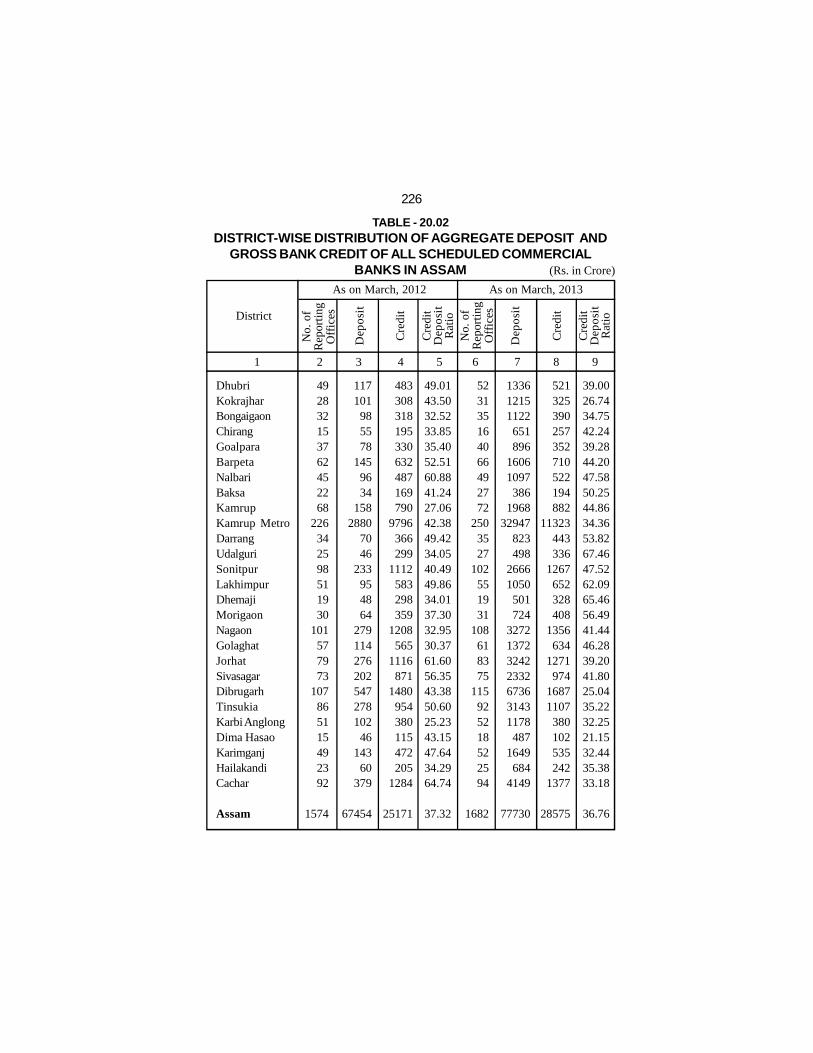
TABLE - 20.02DISTRICT-WISE DISTRIBUTION OF AGGREGATE DEPOSIT AND
GROSS BANK CREDIT OF ALL SCHEDULED COMMERCIALBANKS IN ASSAM
226
(Rs. in Crore)
District
As on March, 2012
DhubriKokrajharBongaigaonChirangGoalparaBarpetaNalbariBaksaKamrupKamrup MetroDarrangUdalguriSonitpurLakhimpurDhemajiMorigaonNagaonGolaghatJorhatSivasagarDibrugarhTinsukiaKarbi AnglongDima HasaoKarimganjHailakandiCachar
Assam
1 2 3 4 5 6 7 8 9
492832153762452268
226342598511930
101577973
107865115492392
1574
117101
985578
1459634
1582880
7046
233954864
279114276202547278102
46143
60379
67454
483308318195330632487169790
9796366299
1112583298359
1208565
1116871
1480954380115472205
1284
25171
As on March, 2013N
o. o
fR
epor
ting
Off
ices
Dep
osit
Cre
dit
No.
of
Rep
orti
ngO
ffic
es
Dep
osit
Cre
dit
Cre
dit
Dep
osit
Rat
io
Cre
dit
Dep
osit
Rat
io
49.0143.5032.5233.8535.4052.5160.8841.2427.0642.3849.4234.0540.4949.8634.0137.3032.9530.3761.6056.3543.3850.6025.2343.1547.6434.2964.74
37.32
523135164066492772
2503527
102551931
108618375
115925218522594
1682
39.0026.7434.7542.2439.2844.2047.5850.2544.8634.3653.8267.4647.5262.0965.4656.4941.4446.2839.2041.8025.0435.2232.2521.1532.4435.3833.18
36.76
521325390257352710522194882
11323443336
1267652328408
1356634
1271974
16871107380102535242
1377
28575
133612151122651896
16061097386
196832947
823498
26661050501724
3272137232422332673631431178487
1649684
4149
77730
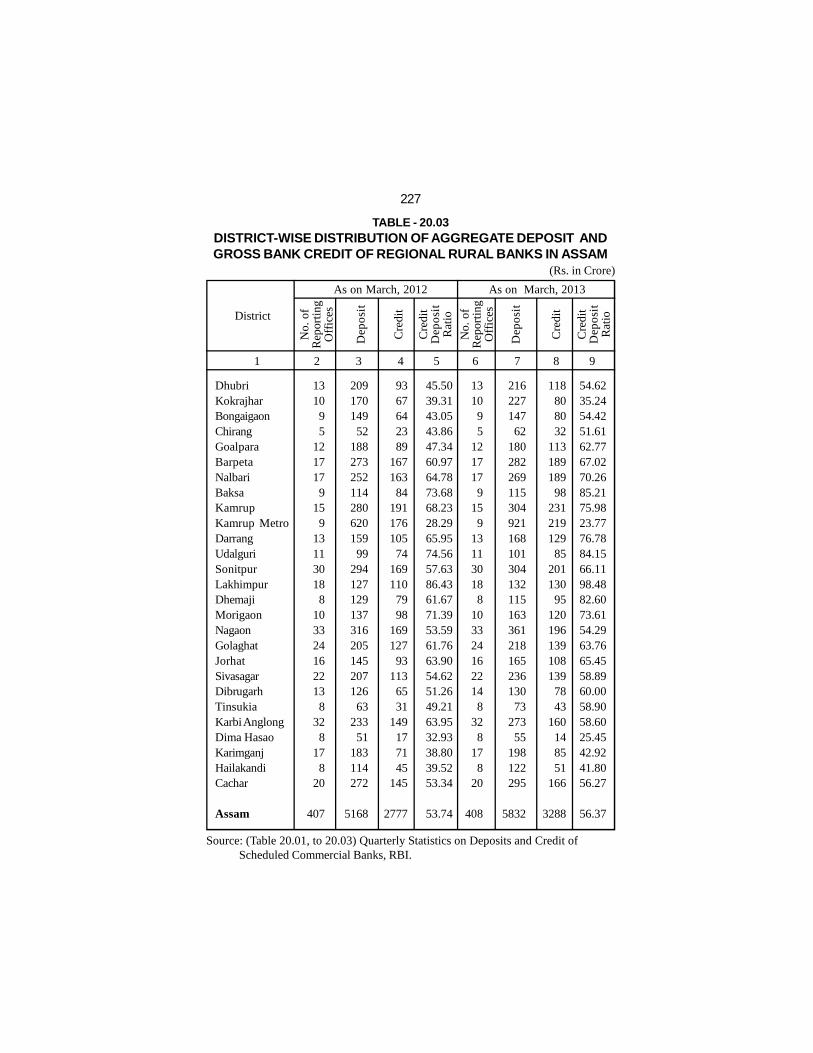
TABLE - 20.03DISTRICT-WISE DISTRIBUTION OF AGGREGATE DEPOSIT ANDGROSS BANK CREDIT OF REGIONAL RURAL BANKS IN ASSAM
227
Source: (Table 20.01, to 20.03) Quarterly Statistics on Deposits and Credit of Scheduled Commercial Banks, RBI.
(Rs. in Crore)
District
As on March, 2012
DhubriKokrajharBongaigaonChirangGoalparaBarpetaNalbariBaksaKamrupKamrup MetroDarrangUdalguriSonitpurLakhimpurDhemajiMorigaonNagaonGolaghatJorhatSivasagarDibrugarhTinsukiaKarbi AnglongDima HasaoKarimganjHailakandiCachar
Assam
1 2 3 4 5 6 7 8 9
131095
1217179
159
131130188
1033241622138
328
178
20
407
209170149
52188273252114280620159
99294127129137316205145207126
63233
51183114272
5168
9367642389
167163
84191176105
74169110
7998
169127
93113
6531
149177145
145
2777
As on March, 2013N
o. o
fR
epor
ting
Off
ices
Dep
osit
Cre
dit
No.
of
Rep
orti
ngO
ffic
es
Dep
osit
Cre
dit
45.5039.3143.0543.8647.3460.9764.7873.6868.2328.2965.9574.5657.6386.4361.6771.3953.5961.7663.9054.6251.2649.2163.9532.9338.8039.5253.34
53.74
Cre
dit
Dep
osit
Rat
io
Cre
dit
Dep
osit
Rat
io
131095
1217179
159
131130188
1033241622148
328
178
20
408
21622714762
18028226911530492116810130413211516336121816523613073
27355
198122295
5832
118808032
113189189
98231219129
85201130
95120196139108139
7843
160148551
166
3288
54.6235.2454.4251.6162.7767.0270.2685.2175.9823.7776.7884.1566.1198.4882.6073.6154.2963.7665.4558.8960.0058.9058.6025.4542.9241.8056.27
56.37

TABLE - 20.04AGENCY-WISE, PURPOSE-WISE AND ACTIVITY-WISE
DISBURSEMENT MADE BY NABARD IN ASSAM
228
CBs = Commercial Banks; RRBs = Regional Rural Banks.Source: NABARD (Regional Office) Assam.
(Rs. in Lakh)
1.
2.3.
4.
5.
6.7.
8.
9.10.11.12.
13.
14.15.16.
Minor IrrigationLand Dev.FarmMechanisationPlantation &
HorticultureAnimal Husbandary(Dairy, Poultry,Sheep, Goat &Piggery)
FishariesForestryMarket Yard &GodownsIRDP/SGSY
BiogasRNFSAgro ProcessingSC/ST ActionPlanPMRY
SHGOthers (i/c SHG,SRTO-Truck,2Wheelers)
Grand Total
Purpose2011-12 2012-13
CBs RRBs Total CBs RRBs Total
-
-28.30
100.41
400.82
--
-
1041.82-
10207.621.50
-
1708.47
1638.38
15127.32
13.66
1186.24
12.45
286.57
---
-
-167.72
12.89-
-
29.66
1709.19
13.66
-1214.54
112.86
687.39
--
-
1041.82-
10375.3414.39
-
1708.47
1668.04
16836.51
1 2 3 4 5 6 7
34.17
243.67
10742.50
11020.34
0.75
17.75705.89
19.89517.370
1261.65
0.75
17.75705.89
0.00
34.17
0.000.00
243.67
10762.39517.37
0.00
0.000.000.00
12281.99
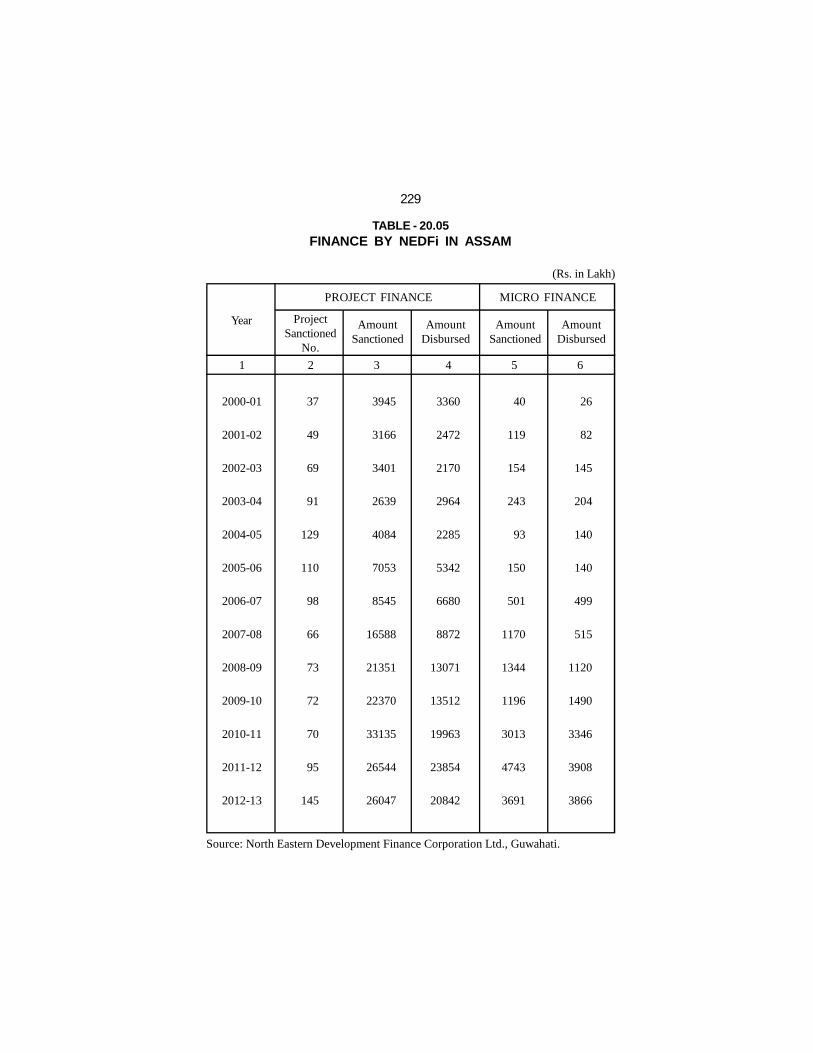
TABLE - 20.05FINANCE BY NEDFi IN ASSAM
229
Source: North Eastern Development Finance Corporation Ltd., Guwahati.
(Rs. in Lakh)
ProjectSanctioned
No.
AmountSanctioned
Year
1 2 3 4 5 6
2000-01
2001-02
2002-03
2003-04
2004-05
2005-06
2006-07
2007-08
2008-09
2009-10
2010-11
2011-12
2012-13
PROJECT FINANCE MICRO FINANCE
AmountDisbursed
AmountSanctioned
AmountDisbursed
37
49
69
91
129
110
98
66
73
72
70
95
145
3945
3166
3401
2639
4084
7053
8545
16588
21351
22370
33135
26544
26047
3360
2472
2170
2964
2285
5342
6680
8872
13071
13512
19963
23854
20842
40
119
154
243
93
150
501
1170
1344
1196
3013
4743
3691
26
82
145
204
140
140
499
515
1120
1490
3346
3908
3866

TABLE - 20.06STATISTICS OF SMALL SAVINGS IN ASSAM
(Scheme Wise Deposit)
230
(Rs. in Crore)
1 2 3 4 5
2011-2012 2012-2013
392.62
1409.73
171.78
8.74
22.01
15.55
611.41
22.70
75.94
189.42
277.50
-
Name of Scheme NetDeposit
Monthly Income Scheme
Savings Bank Account
1 year Time Deposit
2 year Time Deposit
3 year Time Deposit
5 year Time Deposit
Five year Post Office Recurring
Deposit
Senior Citizen Saving Scheme
Fifteen year Public Provident Fund
Kishan Bikash Patra
yr National Savings Certificate
(VIII Issue)
10 year National Savings
Certificate(ix issue)
GrossDeposit
NetDeposit
GrossDeposit
94.66
119.09
26.45
1.27
7.14
307.61
63.57
(-)6.20
47.89
18.20
53.97
-
1.
2.
3.
4.
5.
6.
7.
8.5
9.
326.45
1617.64
215.87
15.78
28.89
26.53
673.12
12.74
86.51
--
440.20
0.68
118.83
130.84
72.16
6.98
4.83
21.15
106.67
(-)5.37
59.89
--
440.20
0.68
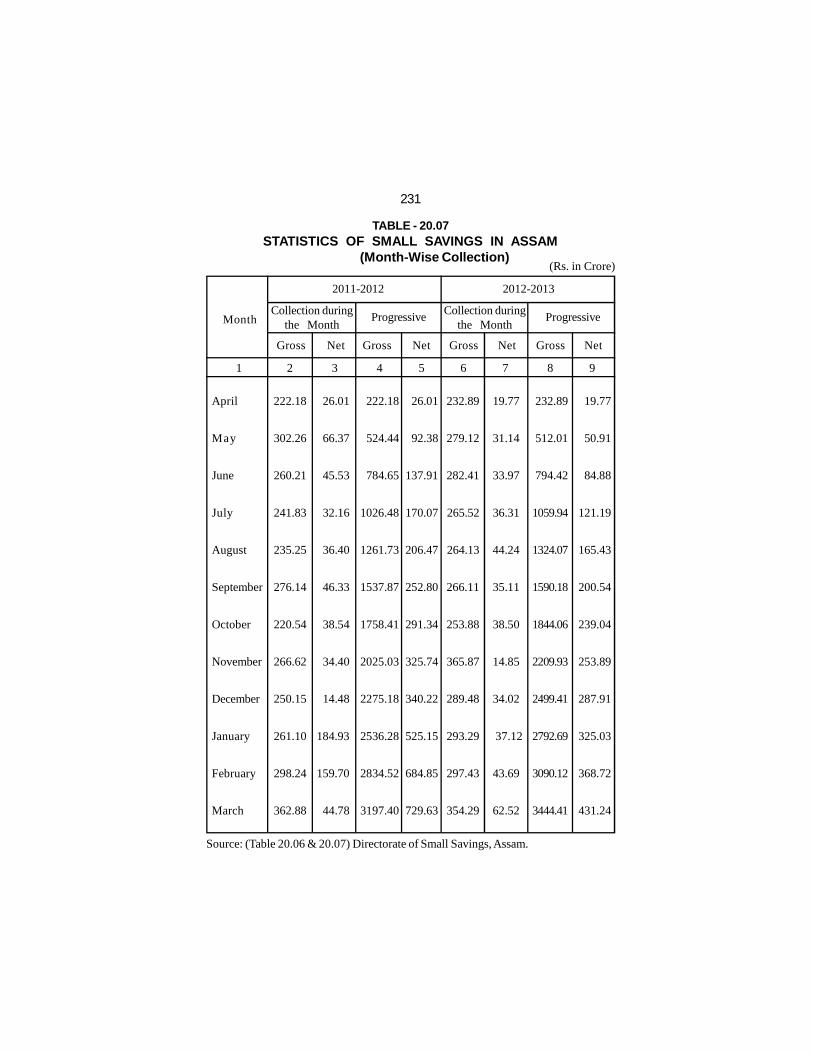
TABLE - 20.07STATISTICS OF SMALL SAVINGS IN ASSAM
(Month-Wise Collection)
231
Source: (Table 20.06 & 20.07) Directorate of Small Savings, Assam.
(Rs. in Crore)
2012-2013
Progressive
2011-2012
MonthCollection during
the MonthProgressive
Collection duringthe Month
1 2 3 4 5 6 7 8 9
Gross
April
May
June
July
August
September
October
November
December
January
February
March
Net
222.18
302.26
260.21
241.83
235.25
276.14
220.54
266.62
250.15
261.10
298.24
362.88
Gross Net Gross Net Gross Net
26.01
66.37
45.53
32.16
36.40
46.33
38.54
34.40
14.48
184.93
159.70
44.78
222.18
524.44
784.65
1026.48
1261.73
1537.87
1758.41
2025.03
2275.18
2536.28
2834.52
3197.40
26.01
92.38
137.91
170.07
206.47
252.80
291.34
325.74
340.22
525.15
684.85
729.63
232.89
279.12
282.41
265.52
264.13
266.11
253.88
365.87
289.48
293.29
297.43
354.29
232.89
512.01
794.42
1059.94
1324.07
1590.18
1844.06
2209.93
2499.41
2792.69
3090.12
3444.41
19.77
50.91
84.88
121.19
165.43
200.54
239.04
253.89
287.91
325.03
368.72
431.24
19.77
31.14
33.97
36.31
44.24
35.11
38.50
14.85
34.02
37.12
43.69
62.52

TABLE - 20.08BUSINESS OF POSTAL LIFE INSURANCE IN ASSAM 2012-13
232
1 2 3
Category Number of Policies(in `000)
Sum Assured(Rs. in Lakhs)
Bank
Central Govt. (Civil)
State Govt. Undertakings
Postal
Railways
State Civil
Telecommunication
Central Undertakings
Source: Chief Post Master General, Assam Circle.
116
623
7454
1309
141
25
160
22
499.20
2761.30
22053.00
3295.90
572.40
83.00
817.20
81.00

TABLE - 20.09PERFORMANCE OF THE LIFE INSURANCE CORPORATION
OF INDIA AND ASSAM
233
Source: LICI, Guwahati Division.
(Rs. in Lakh)
1 2 3 4 5
2011-2012 2012-2013
306900
283855
220814
131311
942880
Name of Division
Jorhat
Guwahati
Silchar
Bongaigaon
Total
FirstPremium
Nos. ofPolicies
24415.32
27208.87
21380.43
12490.82
85495.44
FirstPremium
Nos. ofPolicies
303919
287246
225565
127379
944109
27382.79
31880.83
21985.58
11824.15
93073.35

TABLE - 20.10ACTIVITIES OF UNITED INDIA INSURANCE COMPANY LTD. AND
NATIONAL INSURANCE COMPANY IN ASSAM, 2012-13
234
Source: United India Insurance Company Ltd. and National Insurance Company.
Office/RegionNationalInsurance
Uniter IndiaInsurance
Offices (Nos.)
(a) Regional Offices
(b) Divisional Offices
(c) Branch Offices
(d) Micro Offices
Agents (Nos.)
Individual Business (Rs. in Crore)
Policies Issued (Nos.)
Rural
Urban
Total
Gross premium (Rs. in Crore)
Rural
Urban
Total
1 2 3
01
10
34
16
-
-
-
20284
565140
585424
136.61
6.87
143.48
01
08
23
12
573
35.00
178901
-
-
-
-
-
170.44

21.SOCIAL WELFAREFIGURE AT A GLANCE, 2012-13
No. of State HomeTotal nos. of Inmates
No. of Destitute HomeTotal nos. of Inmates(i) Female(ii) Total
No. of Children HomeNo. of Inmates(i) Total(ii) Female
No. of Bal BhawanNo. of Attendent (Guwahati only)(i) Total(ii) Female
334
6
111154
3
106102
2
27844

TABLE - 21.01STATISTICS OF SOCIAL WELFARE IN ASSAM, 2012-13
236
1 2 3
Item
STATE HOME
1. State Home for rescued women, Jalukbari
2. State Home for Male Ex-Convicts, Silchar
3. State Home for Women, Nagaon
DESTITUTE HOME
1. Destitute Home for Women, Jalukbari
2. Destitute Home for Women, Nagaon
3. Home for Destitute and Helpless Widows, Boko
4. Central Destitute Home, Meherpur
5. Destitute home for Women, Dighaltari
6. Permanent Liability home, Bamunigaon, Boko
CHILDREN HOME
1. Home for Orphan and Destitute Children, Nagaon
2. Home for Destitute and Vagrant Children,
Lakhimpur
3. Jalukbari Children Home
VAGRANTS HOME
1. Vagrants home (Beggars) Fatasil, Guwahati
OBSERVATION HOME
1. Observation Home, Lichubari, Jorhat
2. Observation home, Boko
Female
18
-
16
11
10
21
-
19
93
55
-
51
68
20
38
18
-
16
11
10
21
-
19
50
51
-
51
-
-
-
Total
No. of Attendent
(A)
(B)
(C)
(D)
(E)
Contd...

(...Contd) TABLE - 21.01
237
1 2 3
Item
BAL BHAWAN
1. Guwahati
2. Dibrugarh
OTHERS
1. Vocational Training for Rehabilitation Centre,
Beltola
2. Vocational Training for Rehabilitation Centre,
Barama (ST)
3. Vocational Training for Rehabilitation Centre,
Kachukata
4. Vocational Training for Rehabilitation Centre,
Morigaon (SC)
5. Training cum Production Centre for Disabled
Person, Haflong
6. Training cum Production Centre for Women,
Maibong
7. School for hearing inpaired, Jorhat
8. Blind School, Jorhat
Total
234
-
-
N. A.
N. A.
-
-
-
28
20
278
-
37
N. A.
N. A.
22
-
-
28
30
Male
(F)
(G)
No. of Attendent

238
Contd...
Govt. B. D. S. Deef & DumbSchool, GuwahatiJorhat Blind SchoolSheltered Workshop for Blind,NagaonScholarship to PhysicallyHandicapped StudentsRehabilitation Grant tophysically Handicapped(NPRPD)Real home for Persons withSpecial NeedSrimanta Sankar Mission,Nagaon Assam Andha SishuVidyalaya, BihpuriaSociety for Welfare of Blind,GuwahatiJanamangal Adarsha AndhaSishu Vidyalaya, MoranhatMental Welfare Soceity,GuwahatiVocational TrainingBraille Press, GuwahatiSurvey of Disabled PersonsUn-employment Allowancesto the disabled persons and Allowances to family withdisabled children
TABLE - 21.02SCHEME IMPLEMENTED UNDER SOCIAL WELFARE IN ASSAM
1 2 3 4 5
1.
2.3.
4.
5.
6.
7.
8.
9.
10.
11.
12.13.14.15.
24.00
10.003.00
48.00
60.00
-
3.00
3.00
5.00
3.00
3.00
-30.00
-390.00
24.00
10.003.00
48.00
60.00
-
3.00
3.00
5.00
3.00
3.00
-30.00
-390.00
45.00
10.00-
30.00
20.00
15.00
3.30
3.30
7.00
3.30
3.30
5.0032.0010.00
396.00
45.00
10.00-
30.00
20.00
15.00
3.30
3.30
7.00
3.30
3.30
5.0032.0010.00
396.00
Scheme2011-12 2012-13
Sanctioned Released Sanctioned Released
(Rs. in Lakh)

239
(...Contd) TABLE - 21.02
1 2 3 4 5
16.
17.
18.
19.
20.21.
22.
23.
24.
25.26.
27.
-
-
-
10.00
50.0030.00
-
50.00
30.00
10.0041346.18
424.84
-
-
-
10.00
50.0030.00
-
50.00
30.00
10.0041346.18
210.40
50.00
51.54
25.00
50.00
10.0050.00
8.00
5.70
50.00
5.0040.00
305.00
50.00
51.54
25.00
50.00
-50.00
5.00
5.70
50.00
-40.00
305.00
Vocational Training in allInstituion of Disabled Sectorfor skill upgradation (4 nos.)&including V. I. adjoining withJBI, Jorhat
Engagement of Care givers to100 % Persons with Disabil-ity .
Assistance to VolunteeryOrganisation namely SishuSarathi/Perona/Ashadeep &Student Welfare Mission atPathsala
School for Hearing Impaired,JorhatImplementation of P. D. ActSetting up of Spl. School forHearing & Visually impired.Bal Bhawan, Ghy &DibrugarghHome for destitute Women,DighaltariState Commission for ChildRightChild Development councilIntegrated Child DevelopmentService (ICDS)Implementation of JJ Act(ICPS)
Scheme2011-12 2012-13
Sanctioned Released Sanctioned Released
(Rs. in Lakh)
Contd...

240
(...Contd) TABLE - 21.02
1 2 3 4 5
28.
29.
30.
31.
32.
33.
34.
35.
36.
37.
38.
10.00
200.00
-
-
10.00
100.00
5.00
-
-
22.00
60.00
10.00
200.00
-
-
10.00
100.00
5.00
-
-
22.00
60.00
10.00
1099.92
10.00
1.00
10.00
100.00
5.00
105.07
25.50
9.00
40.00
10.00
1099.92
10.00
-
10.00
100.00
5.00
105.07
25.00
9.00
40.00
Financial Incentive to Girls of
BPL Family
Joyful Education for Pre-
School kids (Assam Vikash
Jojana)
Rahibilitation Grant to Grow-
up inmates of Children home/
Women Home
National Mission for Empow-
erment of Women
Rehabilitation Grant to
Destitute Women/ Women in
Distressed
Financial Assistance to
unemployed unmarried
Women & widow
Women development Council
State Home for Women,
Nagaon
Training-cum-Production
Centre, Jalukbari & Nagaon
VTRC for Women, Guwahati
Assam State Commission for
Women, Guwahati
Scheme2011-12 2012-13
Sanctioned Released Sanctioned Released
Contd...
(Rs. in Lakh)

(...Contd) TABLE - 21.02
241
1 2 3 4 5
Implementation of Rajiv
Gandhi Scheme for Empow-
erment of Adolscent Girls
(RGSEAG) SABLA
Women and Child Commis-
sion to Improve basic health
parameters including MMR,
IMR & MalNutrition etc.
New Social Security Scheme
for Widows and the Aged
Women Club covering one in
each block of Assam
Welfare of Old Citizens
(Health Care for the Aged)
Maintenance and Welfare of
Parent and Senior Citizen
Act
Infrastructure Development
of Old Age home (State
Specific Scheme), Bharasha
Briddhabash
Setting up of Old age home
for Women and Spl School
for Education and Welfare of
Orphan
1940.00
100.00
-
25.00
400.00
30.00
-
109.77
39.
40.
41.
42.
43.
44.
45.
46.
Scheme2012-132011-12
Sanctioned Released Sanctioned Released
1940.00
100.00
500.00
25.00
400.00
30.00
5.00
109.77
1592.98
-
-
-
400.00
15.00
-
60.00
(Rs. in Lakh)
1592.98
-
-
-
400.00
15.00
-
60.00
Contd...

(...Contd) TABLE - 21.02
242
1 2 3 4 5
--
150.00
1.50
-
-
-
20.00
48.00
-
-
-
47.
48.
49.
50.
51.
52.
53.
54.
55.
56.
57.
Ambikagiri Memorial Trust
(Aamar Ghar)
Assistance to Voluntary
Organisation
Pension to Social Worker
Sitting of District Medical
Board
Rehabilitation Grant to
Disabled Children
Refresher Training Coursefor
Teaching and Managarial Staff
of Special institution for
Hearing and Visually impired
Community Education / Govt.
Sales/ Publications
Scholarship to physically
Handicapped Students
VTRC for Physically Handi-
capped Persons
VTRC, Morigaon
Rehabilitation Grant to
Physically handicapped
Persons (SCCP)
Scheme2012-132011-12
Sanctioned Released Sanctioned Released
-
122.00
-
3.24
-
5.45
30.00
27.50
5.00
6.41
18.00
10.00
122.00
3.00
3.24
20.00
5.45
30.00
27.50
5.00
6.41
18.00
--
150.00
1.50
-
-
-
20.00
48.00
-
-
-
(Rs. in Lakh)
Contd...

(...Contd) TABLE - 21.02
243
1 2 3 4 5
--
--
--
200.00
500.00
855.50
5.00
3100.00
8.00
10.00
4450.00
58.
59.
60.
61.
62.
63.
64.
65.
66.
67.
68.
New Subscription based
Insurance Policy giving
Medical & Death Coverage to
AWWs
Repair of AWC
Socio-Economic and Cultural
upliftment of Harijan Commu-
nity of Nagaon District
Free Umbrella to AWW/
Helper under ICD SProject
(State specific scheme)
Mukhya Mantrir Jivan Jyoti
Bima Achoni
Mukhya Mantrir Mahila
Samridhi Achoni
Scheme for Protection of
Women from Domestic
Violance
AWW & Helper enhanced
wages
Construction of Night Shelter
Homes
Kasturba Gandhi National
Memorial Trust
Suplementary Nutrition
Programme (SNP)
Scheme2012-132011-12
Sanctioned Released Sanctioned Released
1.00
50.00
--
200.00
550.00
385.00
54.00
3100.00
150.00
11.00
4895.00
1.00
50.00
11.00
200.00
550.00
385.00
54.00
3100.00
150.00
11.00
4895.00
--
--
--
200.00
500.00
855.50
5.00
3100.00
8.00
10.00
4450.00
(Rs. in Lakh)

TABLE - 21.03INSTITUTIONS RUN BY NGOs RECEIVING RECURRING
GRANT-IN-AID FROM SOCIAL WELFARE DEPARTMENT, ASSAM
244
1 2 3
Name of N.G..O.
Assam Andha Sishu Bidyalaya, Bihpuria
Shrimanta Sankar Mission Blind School, Nagaon
Janamangal Adarsha Andha Vidyalaya, Moranhat
Mental Welfare Society, Guwahati
Blind School, Basistha, Guwahati
Destination, Bhagaduttapur, Kahilipara
Ashadeep, Lachitnagar, Guwahati
Prataya, Lakhimpur
Dhula Regional Physically Handicapped Develop-
ment Association, Dhula, Darrang.
SCORPION, Panbazar, Guwahati.
Navajiban Welfare Society, Bamunimaidam
Digbijay Production, Rajgarh Link Road, Guwahati
Sadaou Asom Maina Parijat, Silpukhuri, Guwahati
Adarsha, Beltola, Guwahati
Sishukalyan Sadan, Jalukbari, Guwahati
Gandhi Smarak Nidhi, Guwahati
Assam Association for Deaf, Birubari, Guwahati
Prerona Pratibandhi Sishu Unnayan Kendra, Jorhat
Women Welfare Society, Beltola, Guwahati
3.30
3.30
3.30
3.30
7.00
15.00
7.50
-
-
-
3.00
-
-
-
0.10
0.10
5.00
-
10.00
3.00
3.00
3.00
3.00
5.10
-
-
-
0.25
-
3.00
-
-
-
5.00
2.00
3.00
2.00
5.00
2012-13
1.
2.
3.
4.
5.
6.
7.
8.
9.
10.
11.
12.
13.
14.
15.
16.
17.
18.
19.
2011-12
Grant-in-aid (Rs. in Lakh)

Source: (Table No. 21.01 to 21.04) Directorate of Social Welfare, Assam.
TABLE - 21.04STATISTICS OF INSTITUTION FOR DEAF AND DUMB, BLIND AND
JUVENILE REFORMS, 2012-13
1 2 3 4 5 6 7
Name of Institution
1
2
4
Enrolment
Num
ber
ofIn
stit
utio
n
Blind School
Deaf & Dumb School and
School for Hearing Impaired
Juvenile Reformatories
49
339
200
19
212
167
24
127
4
11
5
-
6
12
-
No. of Teacher
Inta
keC
apac
ity
Mal
e
Fem
ale
Mal
e
Fem
ale
245
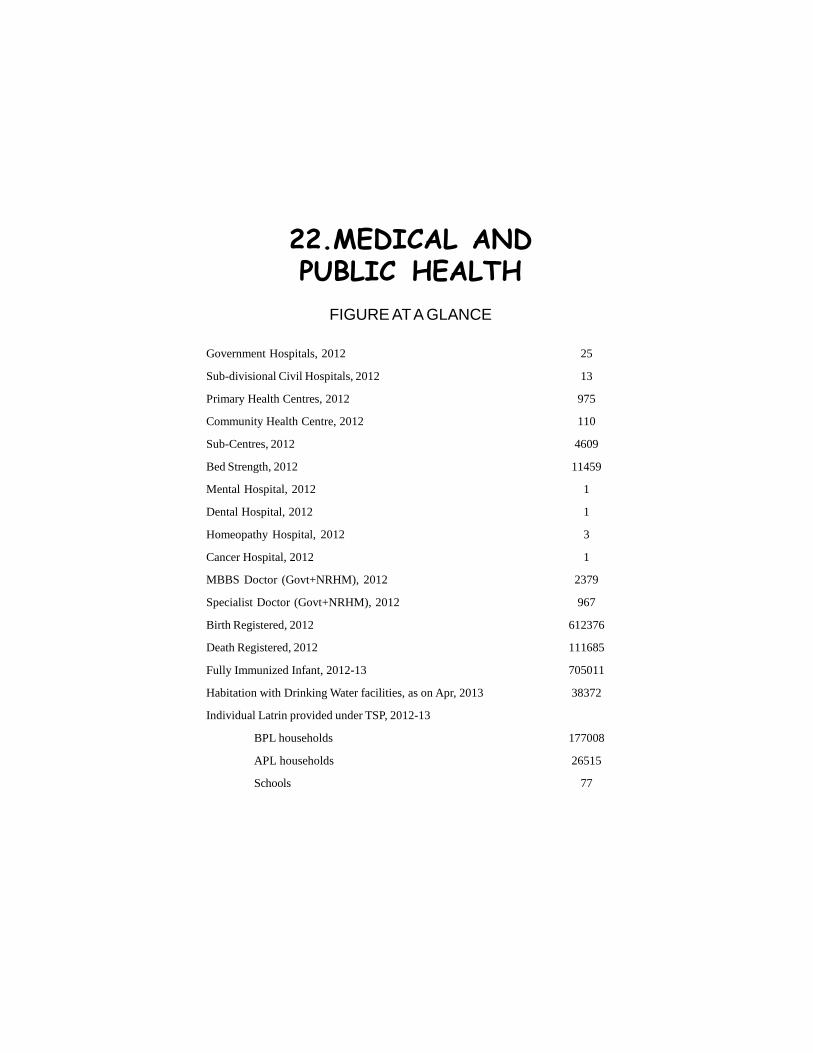
22.MEDICAL ANDPUBLIC HEALTH
FIGURE AT A GLANCE
Government Hospitals, 2012
Sub-divisional Civil Hospitals, 2012
Primary Health Centres, 2012
Community Health Centre, 2012
Sub-Centres, 2012
Bed Strength, 2012
Mental Hospital, 2012
Dental Hospital, 2012
Homeopathy Hospital, 2012
Cancer Hospital, 2012
MBBS Doctor (Govt+NRHM), 2012
Specialist Doctor (Govt+NRHM), 2012
Birth Registered, 2012
Death Registered, 2012
Fully Immunized Infant, 2012-13
Habitation with Drinking Water facilities, as on Apr, 2013
Individual Latrin provided under TSP, 2012-13
BPL households
APL households
Schools
25
13
975
110
4609
11459
1
1
3
1
2379
967
612376
111685
705011
38372
177008
26515
77

TABLE - 22.01 NUMBER OF STATE GOVT. HOSPITALS, PRIMARY HEALTHCENTRES, FIRST REFERRAL UNITS, C. H. C.s etc. IN ASSAM,
2012
247
N.B.: S.D.C.H. = Sub Divisional Civil Hospital, P.H.C. = Primary Health Centre, F.R.U. = First Referral Units, C.H.C. = Community Health Centres.
DistrictCivil
Hospital
1 2 3 4 5 6 7
KokrajharDhubriGoalparaBarpetaMorigaonNagaon
SonitpurLakhimpurDhemajiTinsukiaDibrugarhSivasagar
JorhatGolaghatKarbi AnglongDima HasaoCacharKarimganj
HailakandiBongaigaonChirangKamrupKamrup MetroNalbari
BaksaDarrangUdalguri
Assam
111111
111101
111111
111101
111
25
111216
210323
310000
020512
010
38
551729
453552
555241
242916
533
110
110100
210002
211000
000100
000
13
384039512564
472821212942
413951103221
134423215467
444723
975
P.H.C. F.R.U. C.H.C.Sub-
CentresS.D.C.H.
159246151264123354
274155
98164231219
144144145
65270217
1057686
28051
121
157163147
4609

TABLE - 22.02NUMBER OF PRIVATE HOSPITALS AND REGISTERED
DIAGNOSTIC CENTRES IN ASSAM, 2012
248
DistrictPoly Clinic/
NursingHome
1 2 3
KokrajharDhubriGoalpara
BarpetaMorigaonNagaonSonitpurLakhimpurDhemaji
TinsukiaDibrugarhSivasagarJorhatGolaghat
Karbi AnglongDima HasaoCacharKarimganjHailakandiBongaigaon
ChirangKamrup(R+M)NalbariBaksaDarrangUdalguri
Assam
126
61
1416
62
2127
922
6
11
15505
173
9040
253
183
41
341884
1226161611
11
1830
16
0802093
295
No. ofDiagnostic
Centres

TABLE - 22.03ACHIEVEMENTS OF SOME OF THE SPECIAL HEALTH
PROGRAMMES IN ASSAM, 2012
249
Items
1 2
Tuberculosis Hospital
District T. B. Centre
T.B. Wards attached to General Hospital
Bed
No. of New Cases detected during the year 2012
No. of Patients treated at the end of the year 2012
Leprosy Hospital
Leprosy Control Units
S.E.T. Centres
Leprosy Colonies
Leprosy treatment Centres
Bed
No. of New Cases detected during the year 2012
Total No. of Cases at the end of the year 2012
Cancer Hospital
Ward attached to General hospital
No. of Redium/Cobalt Units
No. of Deep X-Ray Units
Bed
108 (Mritunjoy) Emergency Response Service.
Performance of Boat Clinic
No. of Boat Clinic
No. of Patient Treated
3
23
20
656
29280
35788
3
7
268
8
56
131
78
1562
1
23
6
2
234
379
50
684668
Particulars(in Nos.)
A.
B.
C.
D.
E.
(i)
(ii)

TABLE - 22.04NUMBER OF BEDS IN DIFFERENT TYPE OF HEALTH
INSTITUTIONS IN ASSAM, 2012
250
9015030
21060
27012015090
15015060
15015015060
1203060
12060
27030
1801509090
3240
475564346582266742634424284342278494628466520206314224220458302680248562476392332
11459
District
1 2 3 4 5 6 7
KokrajharDhubriGoalparaBarpetaMorigaonNagaonSonitpurLakhimpurDhemajiTinsukiaDibrugarhSivasagarJorhatGolaghatKarbi AnglongDima HasaoCacharKarimganjHailakandiBongaigaonChirangKamrupKamrup MetroNalbariBaksaDarrangUdalguri
Assam
150200150100100190190100100100
0150200100100100
50100100150150200
0100150100150
3280
No. of Beds
CH BPHC MPHC CHC SDCHTotal
2442305418664836302436484230481848302436
078
642
042
0
900
136132136168
88216156
88646892
136136136172
28966436
1529232
212240176160
92
3304
7540
030
00
12050
00
1001005050
0000000
10000000
715
N.B.: CH=Civil Hospital, BPHC = Block Primary Health Centre, MPHC = MiniPrimary Health Centre.

TABLE - 22.05NUMBER OF MEDICAL & PARAMEDICAL STAFFS IN ASSAM, 2012
251
TABLE - 22.06MEDICAL & PARAMEDICAL PERSONNEL REGISTERED IN ASSAM
DURING 2012
Post
1 2 3 4
Government
MBBS Doctors
Specialist Doctor
Ayurvedic Doctor
Dental Surgeon
Homeopathic Doctors
MBBS Doctors for 1 year rural posting
ANM
GNM
Pharmacists
Laboratory Technician
Radiographer
Rural Health Practioner
1492
842
322
44
61
0
5146
2153
1110
707
91
0
887
125
405
50
0
808
4878
2826
247
641
41
354
2379
967
727
94
61
808
10024
4959
1457
1348
132
354
Position
Allopathic Practitioners
Pharmacists
General Nurses Mid Wives (GNM)
Auxiliary Nurses Mid Wives (ANM)
B Sc Nurse
Item
1 2
Particulars (In Nos)
NRHM Total
486
323
394
407
191

TABLE - 22.07DISTRICT WISE BIRTHS & DEATHS REGISTERED DURING 2012
252
Source: (Table-22.01 to 22.07) Directorate of Health Services, Assam.
172416821596590262284112286917021662204
1906806
24621464882
130428641866762
1986188210022042706
370212061806
56329
District
1 2 3 4 5 6 7
KokrajharDhubriGoalparaBarpetaMorigaonNagaonSonitpurLakhimpurDhemajiTinsukiaDibrugarhSivasagarJorhatGolaghatKarbi AnglongDima HasaoCacharKarimganjHailakandiBongaigaonChirangKamrupKamrup MetroNalbariBaksaDarrangUdalguri
Assam
16291369682119445359166585278029006142659288
1768622453160822344817159134522537
30329236241038792549503
253502859815330166021695415490
556047
Birth Death Birth Death Birth
Total
409182
86387211996508219205
821882222378206240
39502
1462211269196382397289392486322
11160
34706572325164043170
10724526137503220458047164121648828813501552
65774456228029921519398452092918286934402780
111685
306163903165601729599728475335313015449828343899611026753261513
60752994206927231323360248122629247729542458
100525
1801538650227905126122886568923187515967109501789024359168882591018623143343841
3319325490111491124011385263523064016036203041816017296
612376
Current YearRegistration
DelayedRegistration
Death

TABLE - 22.08ESTIMATED BIRTH RATE, DEATH RATE & INFANT MORTALITY
RATE IN ASSAM
253
1 2 3 4 5 6 7 8 9 10
1971
1981
1991
2001
2003
2004
2005
2006
2007
2008
2009
2010
2011
2012
39.3
33.8
31.7
27.9
27.2
27.0
26.6
30.7
25.7
25.3
24.9
24.4
24.0
23.7
31.0
23.2
21.3
18.6
18.0
14.3
15.3
23.0
15.5
15.7
15.9
15.8
15.5
15.6
38.5
33.0
30.9
27.0
26.3
25.1
25.0
24.6
24.3
23.9
23.6
23.2
22.8
22.5
18.7
13.0
11.8
9.9
9.5
9.3
9.2
9.2
9.1
9.0
8.8
8.6
8.4
8.3
9.5
8.0
6.9
6.6
5.9
5.5
5.6
5.8
5.7
5.6
5.9
5.8
5.6
5.6
17.8
12.6
11.5
9.6
9.1
8.8
8.7
8.7
8.6
8.6
8.4
8.2
8.0
7.9
144
107
83
77
70
69
71
70
68
66
64
60
58
58
73
76
42
34
35
38
39
42
41
39
37
36
34
33
139
106
81
74
67
66
68
67
66
64
61
58
55
55
Rural Urban Total Rural Urban Total Rural Urban TotalYear
Birth Rate Death Rate Infant Mortality Rate

TABLE - 22.09CHILD AND INFANT MORTALITY INDICATORS IN ASSAM
254
Source: (Table-22.08 to 22.10) Sample Registration System Statistical Reports, RGI.
TABLE - 22.10FERTILITY INDICATORS IN ASSAM
1 2 3 4 5 6 7 8 9 10
18.1
835832
27
369
Child Mortality Rate(0-4 yr.)Under Five Mortality RateInfant Mortality RateNeo-natal Mortality Rate(less 29 days)Early Neo-natal MortalityRatePeri-Natal Mortality RateStill Birth Rate
7.9
393410
10
189
17.0
785530
25
349
Indicators2012
Urban Total
5.74.13.53.0
3.02.92.92.92.72.7
2.62.62.52.4
189.6133.0123.4105.4
103.599.8
109.3106.5103.299.5
96.394.291.088.8
143.588.376.563.3
62.460.451.253.753.452.6
52.653.652.851.3
185.9129.4119.7100.7
99.095.699.897.995.191.9
89.387.784.982.8
5.84.23.63.2
3.13.03.23.13.02.9
2.82.82.72.6
4.32.62.11.8
1.81.81.51.61.61.5
1.51.61.61.5
1 2 3 4 5 6 7
YearRural Urban Total Rural Urban Total
General Fertility Rate(GFR) Total Fertility Rate(TFR)
1971198119912001
200220032004200520062007
2008200920102011
8.4
423613
11
209
17.9
835833
27
359
19.0
886036
28
37 9
2010
Rural Urban Total
2011
Rural Urban Total Rural
17.6
805831
25
338
7.5
373310
6
148
16.5
755529
23
318

TABLE - 22.11ACHIEVEMENTS IN FAMILY WELFARE PROGRAMMES IN ASSAM
2012-13
255
District
Sterilization
1 2 3 4 5 6 7 8 9
KokrajharDhubriGoalparaBarpetaMorigaonNagaonSonitpurLakhimpurDhemajiTinsukiaDibrugarhSivasagarJorhatGolaghatKarbi AnglongDima HasaoCacharKarimganjHailakandiBongaigaonChirangKamrupKamrup MetroNalbariBaksaDarrangUdalguri
Assam
70.82113.02103.38120.2074.9346.0982.5563.7922.8222.93
101.3597.92
119.22154.61148.0031.21
119.04113.02266.5959.0940.84
129.2045.3178.24
123.0876.6356.00
92.72
322049003080518033005770538035502380374038003950341033902940940
48203020220021101200461030003230180032801800
90000
120.43142.94128.89180.06155.5940.30
219.98112.7187.4692.39
164.44121.4683.68
190.39122.1150.7188.2387.2185.05
155.4759.95
133.6259.5690.95
248.17102.72156.50
120.77
31.1627.6819.2650.6646.8753.8683.7076.2896.1456.1845.7592.5196.7177.8712.7116.8060.9556.2329.0536.7452.2751.2452.9529.4160.3630.35
163.50
56.88
280047003700490029005300420034002800335034003700370033002800140048003050220032001900500036003700120032001800
90000
C.C.Users
280047003700490029005300420034002800335034003700370033002800140048003050220032001900500036003700120032001800
90000
O.P.Users I.U.D.
Targ
et
Per
cent
age
ofac
hiev
emen
t
Targ
et
Targ
et
Targ
et
Per
cent
age
ofac
hiev
emen
t
Per
cent
age
ofac
hiev
emen
t
215031003400410031008000500063504300840087604300425053501550
5007800310031502150
44048508000320011003400
200
110000
Per
cent
age
ofac
hiev
emen
t
72.7052.2986.3033.5384.0659.3830.5247.24
118.9955.4870.3244.3363.2350.0089.6946.8141.1080.33
113.5062.4681.2571.76
272.2338.5467.1129.7947.83
66.74

TABLE - 22.12DISTRICT WISE IMMUNIZATION PROGRAMME IN ASSAM,
2012-13
256
PW = Pregnant Women.Source: (Table 22.11 & 22.12) Directorate of Health Services (FW) Assam.
District
1 2 3 4 5 6 7 8
KokrajharDhubriGoalparaBarpetaMorigaonNagaonSonitpurLakhimpurDhemajiTinsukiaDibrugarhSivasagarJorhatGolaghatKarbi AnglongDima HasaoCacharKarimganjHailakandiBongaigaonChirangKamrup (R)Kamrup MetroNalbariBaksaDarrangUdalguri
Assam
163884394919945319912174956986375541970413953230032339320440186861807619996
409637102246471619814293
8728311652373013998152322015714000
609159
179024977522784329772249363208411572167815547254582704323309187262023919761
474742896297951735614954
9449323692879815580150742403313450
670558
1823750824243003301923693625913876120683145572431624251197121941618746198195174
368792985816987146419835
310142557312925161382016514921
647035
2301455258262024413524848737145028127011179163406934291297682810627339249915523
4554631545181781906312435393273277719878247612356821461
815005
1738941566209653349721618591673714619790138452312923734197041832217578190383613
365422462115616142348470
310442541313014150841936013730
607229
1649643839210903472821390576323791119828141562386423843197561868117813201544135
369032520315809142938698
311742401613810159861968414151
615043
PerformanceTarget
Infant PW BCG DPT-3 OPV-3 MLSTT(PW)
2+B
1970949300227693779622456631264305923132153432919829365254932406923412214024757
4002527596167751632510649336782806917023212052090218378
705011

TABLE - 22.13DISTRICT WISE NUMBER OF HABITATIONS/ VILLAGES
PROVIDING WITH DRINKING WATER FACILITIES IN ASSAM
257
District
1 2 3 4 5 6 7 8 9
KokrajharDhubriGoalparaBarpetaMorigaonNagaonSonitpurLakhimpurDhemajiTinsukiaDibrugarhSivasagarJorhatGolaghatKarbi AnglongDima HasaoCacharKarimganjHailakandiBongaigaonChirangKamrup(R+M)NalbariBaksaDarrangUdalguri
Assam
40304375269832802192565852982538220232846941491935784256353011122689261916732313210452282456327324322298
86976
21563242
99419711288204710091074
753115425491256
52813941812
775517672473
219616262296
8361924
7381357
36637
75266
14128
300383136143129357145436247
2209
6574430
140169
6468
111
3335
157139
5670
12397916750
186688211181187157
10241120
8261
139255
91139119
58
3775
305135262400125
11861595314902823787692708804177
07
2384315
335853180461696836
12879
164191122211151397474203193315
104535661743417910
250185156104139395260203187169
7110
Tota
l H
abit
atio
nas
on
1.4.
2012
Un-
Cov
ered
Hab
itat
ion
Qua
lity
Aff
ecte
dH
abit
atio
n
Ful
ly C
over
edH
abit
atio
n
Qua
lity
Aff
ecte
dH
abit
atio
n
Un-
Cov
ered
Hab
itat
ion
Ful
ly C
over
edH
abit
atio
n
1866740
1442942824
242327401194698
129736052966234720681541370
246217091157153219
20951457926940191
38372
Habitations covered duringthe 2012-13
Habitation as on01-04-2013
Hab
itat
ion
wit
hfu
nctio
ning
dri
nkin
gw
ater
sup
ply
faci
lity
as o
n 01
.04.
13
1866740
1442942824
242327401194
698129736052966234720681541
370246217091157
153219
20951457
926940191
38372

TABLE - 22.14PHYSICAL TARGET AND ACHIEVEMENT UNDER NATIONALRURAL DRINKING WATER SUPPLY PROGRAMME (NRDWP)
258
1 2 3 4 5 6 7 8
KokrajharDhubriGoalparaBarpetaMorigaonNagaonSonitpurLakhimpurDhemajiTinsukiaDibrugarhSivasagarJorhatGolaghatKarbi AnglongDima HasaoCacharKarimganjHailakandiBongaigaonChirangKamrup(R+M)NalbariBaksaDarrangUdalguri
Assam
43274117269833132237565653442582235332746941491435834266353011452986261916732364218052442473331123742384
87888
5321
00
690
1420
2035
0124283162
00
186152
0294290
0461
00
1869
192300122259149442445204193308
104432848040817828
246189156118234377300200180150
7230
5118
572321237760
13170
17294
0138234
01708
17101
32121
1276
10437219128024950949614422922820347131449212442
19138321389
24723035923817132
6601
164191122211151397474203193315
104535661743417910
250185156104139395260203187169
7110
District
Tot
al h
abit
atio
nas
on
01-0
4-20
13
Ful
ly C
over
ed(2
011-
12)
Targ
et f
or(2
012-
13)
Ach
ieve
men
t(2
012-
13)
Targ
et f
or(2
012-
13)
Ful
ly C
over
ed(2
011-
12)
Schools Covered
Ach
ieve
men
t(2
012-
13)
5118
5723
1222377
60
1335
017
294142175335
022
07426
10132
121
1755
Habitations Covered
(In Nos.)

TABLE - 22.15PHYSICAL TARGET AND ACHIEVEMENT UNDER TOTAL
SANITATION CAMPAIGN (T.S.C.) DURING 2012-13
259
District
KokrajharDhubriGoalparaBarpetaMorigaonNagaonSonitpurLakhimpurDhemajiTinsukiaDibrugarhSivasagarJorhatGolaghatKarbi-AnglongDima-HasaoCacharKarimganjHailakandiBongaigaonChirangKamrup (M+R)
NalbariBaksaDarrangUdalguri
Assam
* Sanctioned Project Target.
(In Nos.)
8483020532465070
15074760770
168391120048732248085468774776067468665070797436095321328
119931789924983751929299568578588093856978662885751
2220017
2000000030
400
1200
200000000000
77
1157101618401806
326246819511432
871870969
2135184012483304
8101839105111401222
778521282
1789673
1434
34772
35087420522174793069
105564608509303222938185462981445384523672174727031192931102
462931540912445396542089952723
127387637852563367169
1161020
Individual Households providedwith Latrine
*Target
Ach
ieve
men
t
SchoolToilets
*Tar
get
1461902
951175797621607276230623900935951119
1406194
1697912355938
153171069
539396
16819
0500000
420
1000000000
140
151000
152530
211
BPL APL
Achievement
BPL APL
40592936323089056
4143162911533
0590170181542786176484548
00
138435823
0376
2062466647454475
134574681
177008
1256710255
1435120014973119
0118
420021204174600705
00
20180
663171126
13460
378425
0
26515
AnganwadiToilets
CommunityToilets
*Tar
get
*Tar
get
Ach
ieve
men
t
Ach
ieve
men
t
0000000000000000000000600
70
76
00000000300000000000000305
11
1 2 3 4 5 6 7 8 9 10 11
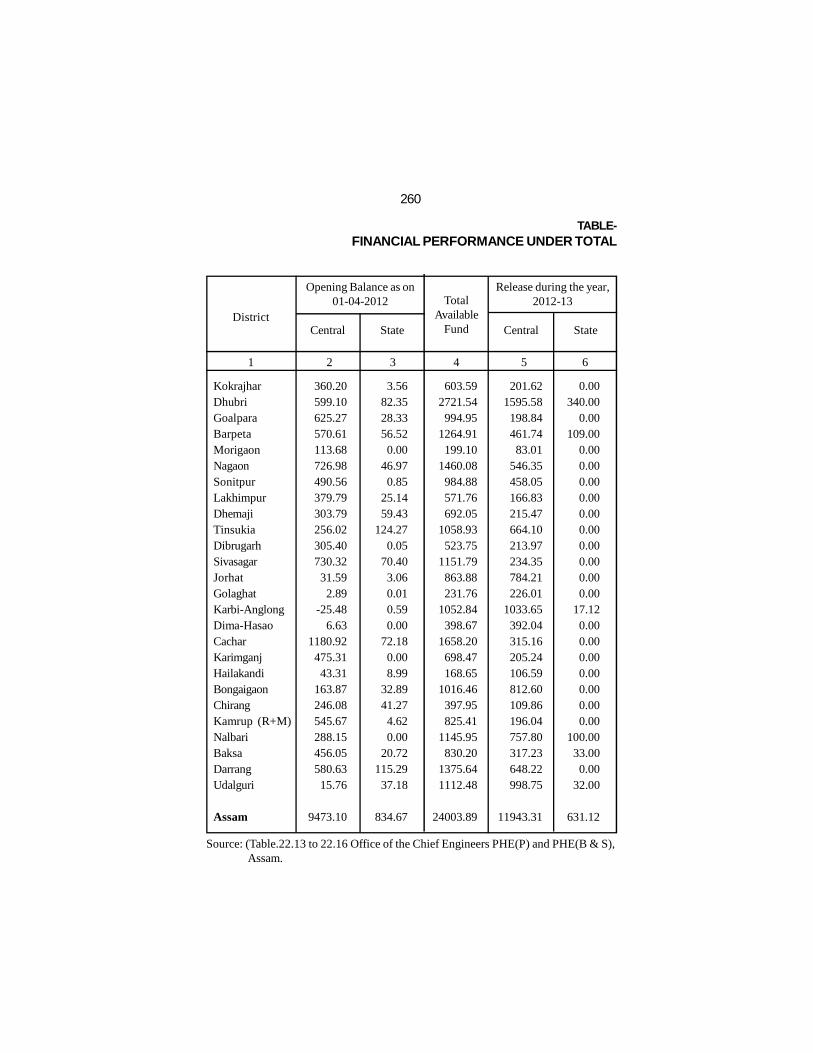
260
TABLE-FINANCIAL PERFORMANCE UNDER TOTAL
1 2 3 4 5 6
KokrajharDhubriGoalparaBarpetaMorigaonNagaonSonitpurLakhimpurDhemajiTinsukiaDibrugarhSivasagarJorhatGolaghatKarbi-AnglongDima-HasaoCacharKarimganjHailakandiBongaigaonChirangKamrup (R+M)NalbariBaksaDarrangUdalguri
Assam
360.20599.10625.27570.61113.68726.98490.56379.79303.79256.02305.40730.3231.59
2.89-25.48
6.631180.92
475.3143.31
163.87246.08545.67288.15456.05580.6315.76
9473.10
0.00340.00
0.00109.00
0.000.000.000.000.000.000.000.000.000.00
17.120.000.000.000.000.000.000.00
100.0033.000.00
32.00
631.12
3.5682.3528.3356.520.00
46.970.85
25.1459.43
124.270.05
70.403.060.010.590.00
72.180.008.99
32.8941.274.620.00
20.72115.29
37.18
834.67
201.621595.58
198.84461.7483.01
546.35458.05166.83215.47664.10213.97234.35784.21226.01
1033.65392.04315.16205.24106.59812.60109.86196.04757.80317.23648.22998.75
11943.31
District
Source: (Table.22.13 to 22.16 Office of the Chief Engineers PHE(P) and PHE(B & S), Assam.
Opening Balance as on01-04-2012
Central State
Release during the year,2012-13
Central State
TotalAvailable
Fund
603.592721.54994.95
1264.91199.10
1460.08984.88571.76692.05
1058.93523.75
1151.79863.88231.76
1052.84398.67
1658.20698.47168.65
1016.46397.95825.41
1145.95830.20
1375.641112.48
24003.89

261
22.16SANITATION CAMPAIGN (TSC) DURING 2012-13
7 8 9 10 1
KokrajharDhubriGoalparaBarpetaMorigaonNagaonSonitpurLakhimpurDhemajiTinsukiaDibrugarhSivasagarJorhatGolaghatKarbi-AnglongDima-HasaoCacharKarimganjHailakandiBongaigaonChirangKamrup (R+M)NalbariBaksaDarrangUdalguri
Assam
District
(Rs. in Lakh)
Total Central State
Expenditure Incurred
433.691109.62
416.91566.39128.36719.82776.99307.99338.12326.14309.08757.73481.03123.8319.95
0.00818.26452.6483.5211.22
136.88657.2250.37
614.98724.57272.63
10637.94
433.69728.87388.58418.60128.36674.82776.49298.66278.69221.78309.08687.33477.97123.82
2.390.00
746.08452.6474.54
0.00100.36652.6450.37
594.98616.25222.18
9459.17
0.00380.7528.33
147.790.00
45.000.509.33
59.43104.36
0.0070.40
3.060.01
17.560.00
72.180.008.98
11.2236.52
4.580.00
20.00108.3250.45
1178.77
Beneficiary(Nos.)
0.0088.03
141.5467.040.12
36.7735.420.00
113.3612.540.00
116.4235.162.330.000.00
64.2117.929.667.100.02
37.970.003.20
31.5028.79
849.10
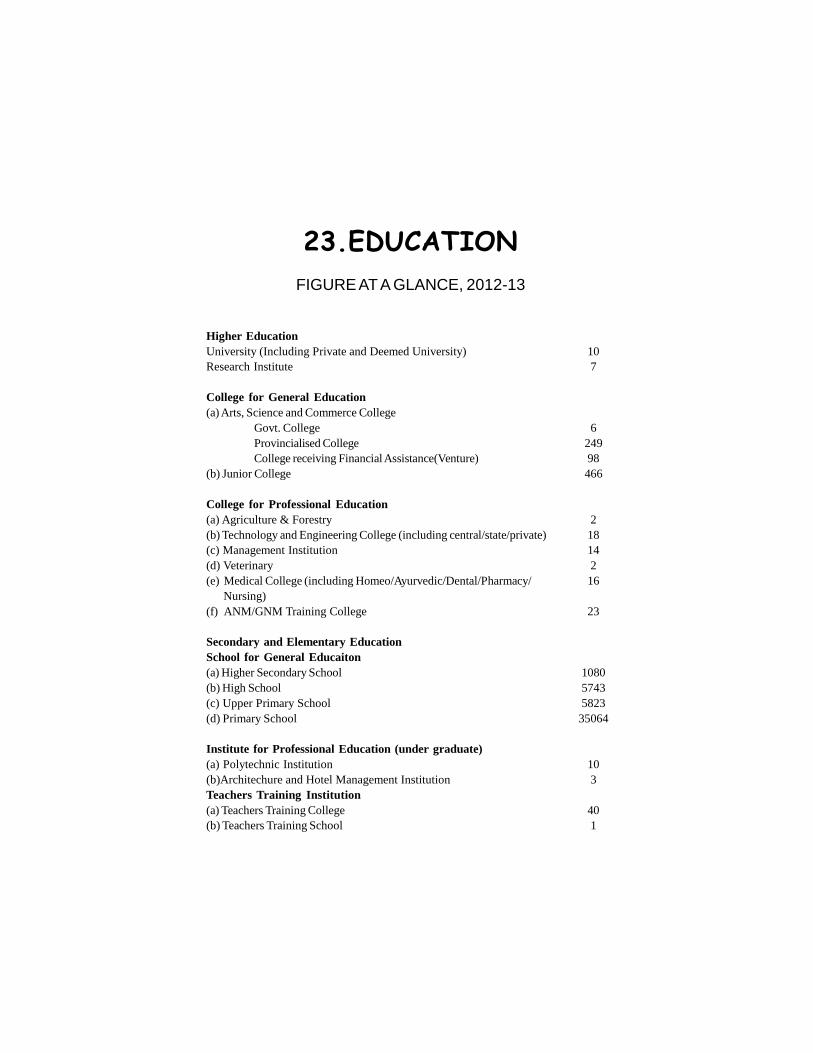
23.EDUCATIONFIGURE AT A GLANCE, 2012-13
Higher EducationUniversity (Including Private and Deemed University)Research Institute
College for General Education(a) Arts, Science and Commerce College
Govt. CollegeProvincialised CollegeCollege receiving Financial Assistance(Venture)
(b) Junior College
College for Professional Education(a) Agriculture & Forestry(b) Technology and Engineering College (including central/state/private)(c) Management Institution(d) Veterinary(e) Medical College (including Homeo/Ayurvedic/Dental/Pharmacy/ Nursing)(f) ANM/GNM Training College
Secondary and Elementary EducationSchool for General Educaiton(a) Higher Secondary School(b) High School(c) Upper Primary School(d) Primary School
Institute for Professional Education (under graduate)(a) Polytechnic Institution(b)Architechure and Hotel Management InstitutionTeachers Training Institution(a) Teachers Training College(b) Teachers Training School
107
624998466
218142
16
23
108057435823
35064
103
401
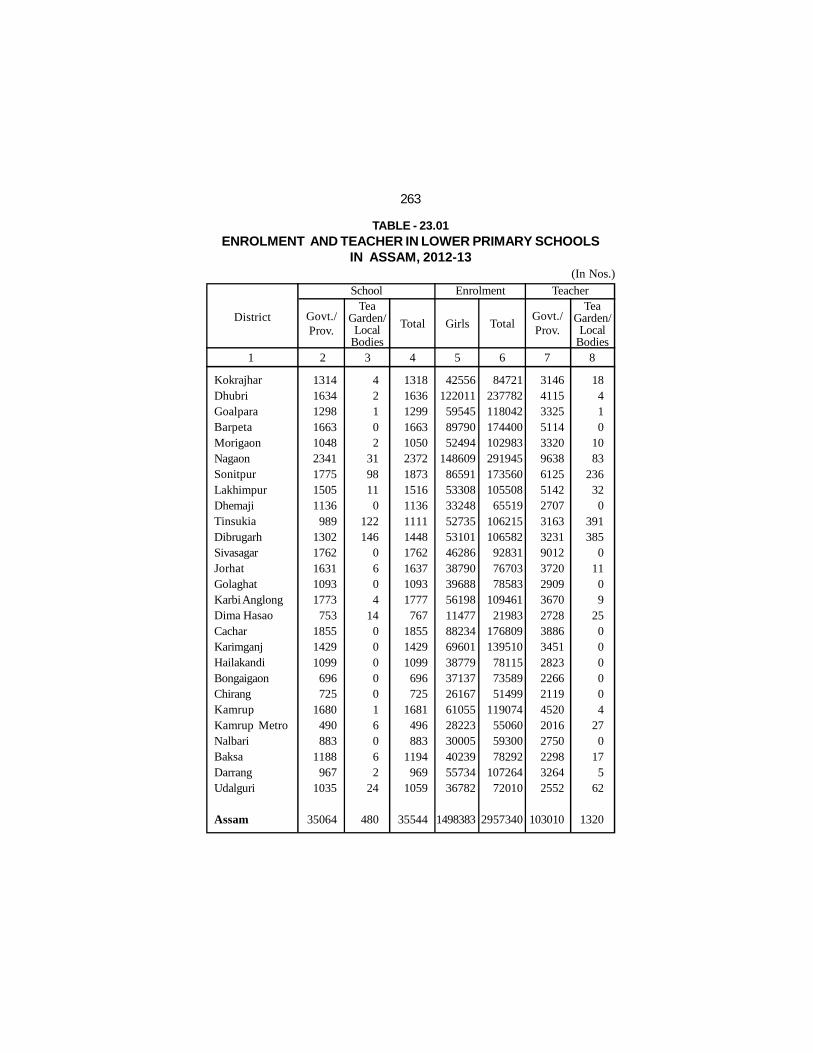
TABLE - 23.01ENROLMENT AND TEACHER IN LOWER PRIMARY SCHOOLS
IN ASSAM, 2012-13
263
KokrajharDhubriGoalparaBarpetaMorigaonNagaonSonitpurLakhimpurDhemajiTinsukiaDibrugarhSivasagarJorhatGolaghatKarbi AnglongDima HasaoCacharKarimganjHailakandiBongaigaonChirangKamrupKamrup MetroNalbariBaksaDarrangUdalguri
Assam
District
School
Govt./Prov.
TeaGarden/Local
Bodies
Total Girls
1 2 3 4 5 6 7 8
131416341298166310482341177515051136
98913021762163110931773
753185514291099
696725
1680490883
1188967
1035
35064
42102
319811
0122146
0604
140000016062
24
480
131816361299166310502372187315161136111114481762163710931777767
185514291099696725
1681496883
1194969
1059
35544
Enrolment Teacher
TotalGovt./Prov.
TeaGarden/Local
Bodies
42556122011595458979052494
148609865915330833248527355310146286387903968856198114778823469601387793713726167610552822330005402395573436782
1498383
84721237782118042174400102983291945173560105508
65519106215106582
928317670378583
10946121983
176809139510
781157358951499
119074550605930078292
10726472010
2957340
314641153325511433209638612551422707316332319012372029093670272838863451282322662119452020162750229832642552
103010
18410
1083
236320
391385
01109
25000004
270
175
62
1320
(In Nos.)

TABLE- ENROLMENT AND TEACHER IN UPPER
264
KokrajharDhubriGoalparaBarpetaMorigaonNagaonSonitpurLakhimpurDhemajiTinsukiaDibrugarhSivasagarJorhatGolaghatKarbi AnglongDima HasaoCacharKarimganjHailakandiBongaigaonChirangKamrupKamrup MetroNalbariBaksaDarrangUdalguri
Assam
District
School
Govt./ Prov. RecognisedTea Garden/Local Bodies
UPUP
withHS
UPUP
withHS
UPUP
withHS
1 2 3 4 5 6 7 8 9
139346213297178437202338168154237319322235185105299240238136
67304101154201
98110
5823
155030
11430
1107991183251
109834983196039311911
1145773365624
1483
213551235366214380193417290
70105
89154176149
68163140241166
92267
54130264151125
5463
000000000000000000000000000
0
22213285
165
411564
13134
1588
211941
1787313
302
200000000061000000000050000
14
352897448663392817395755458224342408476411334173462380479302159571155284465249235
11286
197243
14235
12684
132333861
123965398276860502312
1317080395727
1799
Total
UPUP
withHS
UP = Upper Primary; HS = High School.Source: (Table 23.01 to 23.02) Assam Sarba Sikhsha Abhijan Mission (A.S.S.A.M).

Girls Total Govt./ Prov. Recognised Tea Gardens/Local Bodies
10 11 12 13 14 15
264106864031504523962907882640423993424523592245072594024790241282585224334
63974474537350228362127914320402061711819848283892427519857
837075
52321125829
572069752252329
148855841466756445930492775284150371491665176248001123558904170739458854027828157778153349939121554804430138799
1608590
113021831518206712633516165925401452124915913422179414721116
6472200172517821201
4902381
92613151472
854886
43851
154038081528263515692910117134132464419597613
1006956
1077496
1369130318621029639
1908340840
1855988854
39189
20000000000
5880000000000
350000
121
269059913046470228326426283059533916166822464043280024282193114335693028364422301129428913012155332718421740
83161
Total
23.02PRIMARY SCHOOLS IN ASSAM, 2012-13
265
TeacherEnrolment
(In Nos.)
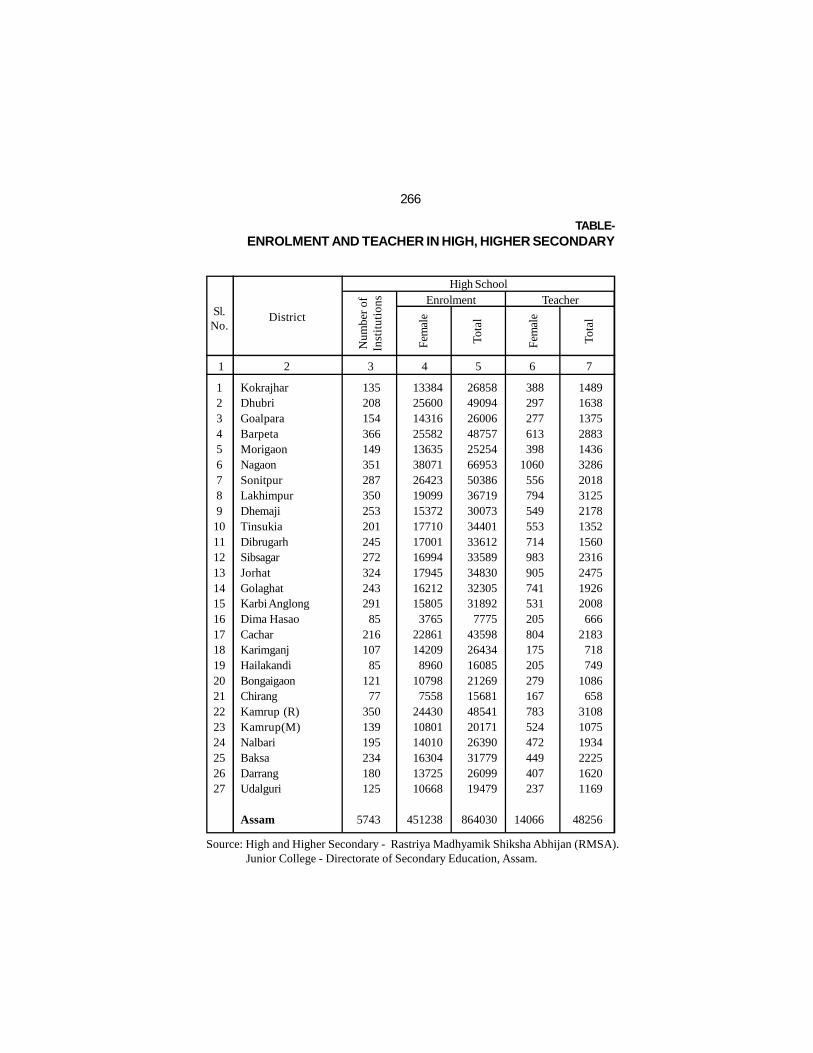
TABLE-ENROLMENT AND TEACHER IN HIGH, HIGHER SECONDARY
266
Source: High and Higher Secondary - Rastriya Madhyamik Shiksha Abhijan (RMSA). Junior College - Directorate of Secondary Education, Assam.
KokrajharDhubriGoalparaBarpetaMorigaonNagaonSonitpurLakhimpurDhemajiTinsukiaDibrugarhSibsagarJorhatGolaghatKarbi AnglongDima HasaoCacharKarimganjHailakandiBongaigaonChirangKamrup (R)Kamrup(M)NalbariBaksaDarrangUdalguri
Assam
Enrolment TeacherHigh School
DistrictSl.No.
123456789
101112131415161718192021222324252627
135208154366149351287350253201245272324243291
85216107
85121
77350139195234180125
5743
1338425600143162558213635380712642319099153721771017001169941794516212158053765
22861142098960
107987558
244301080114010163041372510668
451238
268584909426006487572525466953503863671930073344013361233589348303230531892
77754359826434160852126915681485412017126390317792609919479
864030
388297277613398
1060556794549553714983905741531205804175205279167783524472449407237
14066
148916381375288314363286201831252178135215602316247519262008666
2183718749
1086658
310810751934222516201169
48256
Num
ber
ofIn
stit
utio
ns
Fem
ale
Tota
l
Fem
ale
Tota
l
1 2 3 4 5 6 7

23.03SCHOOLS AND JUNIOR COLLEGES IN ASSAM, 2012-13
267
Fem
ale
Tota
l
Fem
ale
Tota
l
Enrolment Teacher Enrolment TeacherHigher Secondary Junior College
19107
287636734062152655543830209
6163141711673848154315
1080
197963571543426424544952448447191599254634863871364027692457713
38212791202818581231463417462558201526431238
78396
4305133223507894644939398905395743501505567207844710954855349155876895677405841012700
1070335385588422253422192
161029
165270
76160133459181315120190304410258266127
83369182
728359
205367116
56165
68
5259
5861540
340849415
1289570851355353603906656529367180973856313327223809519591280612271
16163
1523352616192233451
21382120124
273544
127
1511225
466
344235035609336120042366391747356055201
27203993237740562999663
4233786897
13601051257215402896252226681322
73848
77208121
1106771823810439083649644
11977336
59127260469982137442131585911376162126212399532733125335539060712604
152099
Fem
ale
Tota
l
Fem
ale
Tota
l
Num
ber
ofIn
stit
utio
ns
Num
ber
ofIn
stit
utio
ns
864773719571
116152122
69995
15313310337
1042730392743495036
10417
1985
315319388334296222359495391
921621735732223192
25162
10711085
11112815914437650
6146
8 9 10 11 12 13 14 15 16 17
(In Nos.)

TABLE - 23.04CLASS-WISE ENROLMENT IN ASSAM, 2012-13
268
Source: Class-I to Class-VIII - A.S.S.A.M;Class-IX ,X, Jr.College(XI , XII) -R.M.S.A. (UDISE-2012-13)
Clases
1 2 3 4 5 6 7 8 9 10
Class-I
Class-II
Class-III
Class-IV
Class-V
Class-VI
Class-VII
Class-VIII
Class-IX
Class-X
Class-XI
Class-XII
Jr. College
Class-XI
Class-XII
485276
420655
384701
353997
326296
296863
292811
277690
239190
173602
44304
38329
41236
37015
468487
412791
381204
354752
327632
313707
309430
297752
263278
187960
41835
36561
38380
35468
953763
833446
765905
708749
653928
610570
602241
575442
502468
361562
86139
74890
79616
72483
29078
27509
26969
26391
25658
26640
27291
26273
24266
16340
3676
3176
3680
3189
28798
27210
27141
26327
25441
27150
28328
27767
27486
17984
3335
2950
3169
2777
57876
54719
54110
52718
51099
53790
55619
54040
51752
34324
7011
6126
6849
5966
50697
42385
40035
37796
34752
40662
42135
40732
42707
32599
6222
5114
9453
8742
52069
44068
41253
38658
35683
41879
42648
41693
43848
33537
5633
5025
8654
8037
102766
86453
81288
76454
70435
82541
84783
82425
86555
66136
11855
10139
18107
16779
Total Enrolment Scheduled Castes Scheduled Tribes
Boys Girls Total Boys Girls Total Boys Girls Total

TABLE - 23.05DISTRICT-WISE GER, NER AND DROP OUT RATE IN GOVT./
PROVINCIALISED PRIMARY & UPPER PRIMARY SCHOOLS, 2012-13
269
*PTR-Only for Govt./Prov. schools under Deptt. of Elementary Education.GER-Gross Enrolment Ratio; NER-Net Enrolment Ratio; PTR-Pupil Teacher Ratio
District
1 2 3 4 5 6 7 8 9
KokrajharDhubriGoalparaBarpetaMorigaonNagaonSonitpurLakhimpurDhemajiTinsukiaDibrugarhSibsagarJorhatGolaghatKarbi AnglongDima HasaoCacharKarimganjHailakandiBongaigaonChirangKamrupKamrup MetroNalbariBaksaDarrangUdalguri
Assam
106.0105.2103.7100.8
97.699.1
105.3101.6101.6104.8104.6102.1102.3104.3108.1123.0104.6103.4100.4108.9110.8
98.398.1
102.7104.6104.4
99.2
103.1
96.795.194.795.496.894.496.495.299.293.497.096.894.898.996.595.895.596.192.896.996.493.590.097.991.095.195.5
95.4
83.787.485.190.493.088.986.893.797.680.989.394.496.194.182.875.389.190.091.886.983.095.889.494.092.988.488.1
89.5
9.817.917.710.317.513.7
8.710.710.1
8.38.42.56.87.7
11.05.0
13.722.522.2
3.45.32.03.43.55.7
10.110.1
10.4
22.023.718.720.221.221.523.711.414.625.019.0
7.914.119.117.6
7.423.423.912.616.630.114.116.610.716.719.321.3
17.7
Lower Primary (LP) Upper Primary (UP) PTR*
GER NER Dropout GER NER Dropout LP UP
(In %.)
90.2100.195.6
100.194.298.594.4
101.098.891.194.498.6
105.697.588.986.2
101.0100.6108.394.791.0
108.8105.097.3
109.094.4
100.2
98.4
11.212.215.5
8.915.2
9.611.1
4.710.513.4
8.02.77.55.9
11.913.312.411.314.610.112.3
8.14.66.0
12.715.315.3
9.7
26.757.735.534.031.029.925.820.224.227.126.310.320.627.029.77.3
45.540.427.632.524.326.326.621.633.632.727.1
28.0

TABLE - 23.06STATUS OF CLASSROOMS IN GOVT./PROVINCIALISED PRIMARY
AND UPPER PRIMARY SCHOOLS, 2012-13
270
Districts
1 2 3 4 5 6 7
KokrajharDhubriGoalparaBarpetaMorigaonNagaonSonitpurLakhimpurDhemajiTinsukiaDibrugarhSibsagarJorhatGolaghatKarbi AnglongDima HasaoCacharKarimganjHailakandiBongaigaonChirangKamrupKamrup MetroNalbariBaksaDarrangUdalguri
Assam
131416341298166310482341177515051136989
13021762163110931773753
185514291099696725
1680490883
1188967
1035
35064
Average StudentClass-room ratio
No.
of
Pri
mar
y S
choo
ls
Ave
rage
No.
of
clas
sroo
m in
Pri
mar
y S
choo
l
No.
of
Upp
erP
rim
ary
Sch
ool
Ave
rage
No.
of
clas
sroo
min
U.P
.S
3.03.82.83.12.93.43.32.82.73.82.92.82.53.12.72.42.52.52.02.72.74.03.13.22.73.12.9
2.9
139346213297178437202338168154237319322235185105299240238136
67304101154201
98110
5823
5.65.24.24.34.84.75.54.04.85.84.43.94.24.44.03.44.34.03.34.15.54.54.64.84.65.15.5
4.5
21.638.432.733.834.236.727.424.521.722.522.318.918.723.522.711.337.839.235.839.426.527.423.120.824.535.523.0
28.1
31.728.932.133.131.536.735.121.626.535.028.921.418.627.426.613.640.642.929.135.439.834.024.119.326.733.231.1
29.8
Pri
mar
y
Upp
erP
rim
ary

TABLE - 23.07GOVERNMENT AND PROVINCIALISED PRIMARY & UPPERPRIMARY SCHOOLS HAVING VARIOUS FACILITIES, 2012-13
271
Source: (Table 23.05 to 23.07) Assam Sarbasiksha Abhijan Mission.
District
1 2 3 4 5 6 7 8 9
KokrajharDhubriGoalparaBarpetaMorigaonNagaonSonitpurLakhimpurDhemajiTinsukiaDibrugarhSibsagarJorhatGolaghatKarbi AnglongDima HasaoCacharKarimganjHailakandiBongaigaonChirangKamrupKamrup MetroNalbariBaksaDarrangUdalguri
Assam
12834521329217843419833716815423631931623416030
21616613813466
29291
15419693
110
5398
13534421228317842719532816615222731932123417610327222721211867
30010114820091
110
5646
130415991288141010322268149414601120
98012101759161610701745
73616361159
897436721
1660489784
1158821
1034
32886
139346213297178437202338168154237319322235185105299240238136
67304101154201
98110
5823
911119112851096904
15751564922775792
10171514120410231122146
1048659687341401
1407402586
1075697974
25318
117016241290162810312323164715021131989
12801760161510871216257
1295948517633690
1616458881
1132815925
31460
131416341298166310482341177515051136
98913021762163110931773
753185514291099
696725
1680490883
1188967
1035
35064
Primary School Upper Primary School
No.
of
Scho
ols
Dri
nkin
gw
ater
Com
mon
Toil
et
Gir
lsTo
ilet
No.
of
scho
ols
11424621322014422716317196
11518328524120810035
1661271655735
2218498
17539
105
4033
Dri
nkin
gw
ater
Com
mon
Toil
et
Gir
lsTo
ilet
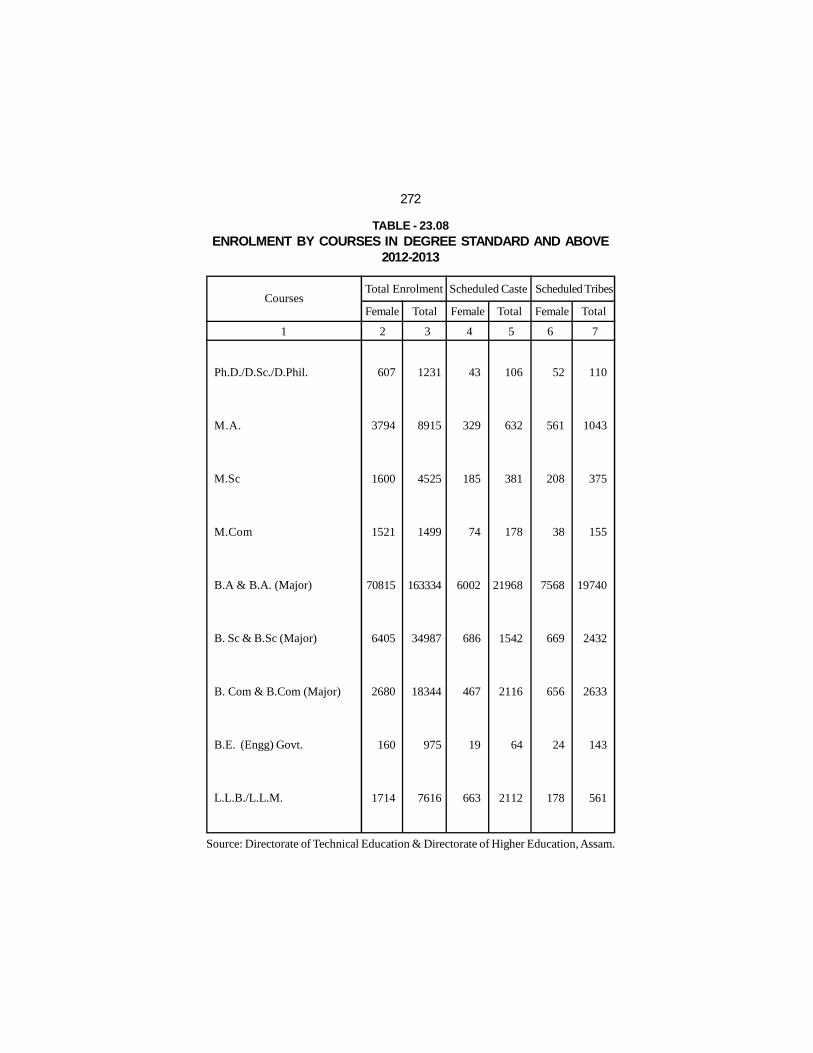
TABLE - 23.08ENROLMENT BY COURSES IN DEGREE STANDARD AND ABOVE
2012-2013
272
Source: Directorate of Technical Education & Directorate of Higher Education, Assam.
Courses
1 2 3 4 5 6 7
Ph.D./D.Sc./D.Phil.
M.A.
M.Sc
M.Com
B.A & B.A. (Major)
B. Sc & B.Sc (Major)
B. Com & B.Com (Major)
B.E. (Engg) Govt.
L.L.B./L.L.M.
Total Enrolment Scheduled Caste Scheduled Tribes
607
3794
1600
1521
70815
6405
2680
160
1714
1231
8915
4525
1499
163334
34987
18344
975
7616
43
329
185
74
6002
686
467
19
663
106
632
381
178
21968
1542
2116
64
2112
52
561
208
38
7568
669
656
24
178
110
1043
375
155
19740
2432
2633
143
561
Female Total Female Female TotalTotal

TABLE - 23.09PERFORMANCE OF CANDIDATES IN HIGH SCHOOL LEAVING
CERTIFICATE EXAMINATION, 2013
273
Source: Board of Secondary Education, Assam.
Caste/ CategoryRegular
61828
68252
130080
6636
7209
13845
46689
47373
94062
16886
17584
34470
6674
6625
13299
31100
31933
63033
8662
9024
17686
178476
188000
366476
48337
49703
98040
4858
4983
9841
35576
34017
69593
11896
11384
23280
3940
3282
7222
21580
20614
42194
4655
4323
8978
130843
128306
259149
78.18
72.82
75.37
73.21
69.12
71.08
76.2
71.81
73.99
70.45
64.74
67.54
59.04
49.54
54.3
69.39
64.55
66.94
53.74
47.91
50.76
73.31
68.25
70.71
N
O
T
A
V
A
I
L
A
B
L
E
1739
1364
3103
Appeared Passed Pass % Appeared PassedSex
Private
Pass %
1 2 3 4 5 6 7 8
Male
Female
Total
Male
Female
Total
Male
Female
Total
Male
Female
Total
Male
Female
Total
Male
Female
Total
Male
Female
Total
Male
Female
Total
General
MOBC
OBC
SC
ST(H)
ST(P)
Tea Garden
All Total
4729
3762
8491
36.77
36.26
36.54

24.PANCHAYAT AND RURALDEVELOPMENT
FIGURE AT A GLANCE, 2012-13
No. of Self Help Groups (SHGs) formed
No. of SHGs taken up Economic Activity
No. of Women SHGs taken up Economic Activity
No. of IAY House completed
Total no. of Job Card issued
No. of Households provided employment
No. of Households provided 100 Days Employment
Benificiaries covered under Indira Gandhi National Old Age
Pension Scheme
Benificiaries covered under National Family Benefit Schemes
275119
105169
1106
98900
3985156
1234827
9807
785836
20180

TABLE - 24.01DISTRICT - WISE PHYSICAL ACHIVEMENTS UNDER SGSY
IN ASSAM, 2012-13
District
1 2 3 4 5 6 7 8
KokrajharDhubriGoalparaBarpetaMorigaonNagaonSonitpurLakhimpurDhemajiTinsukiaDibrugarhSivasagarJorhatGolaghatKarbi AnglongDima HasaoCacharKarimganjHailakandiBongaigaonChirangKamrupKamrup MetroNalbariBaksaDarrangUdalguri
Assam
WomenSHGs Formed
Wom
en S
HG
sTa
kenu
p E
cono
mic
Act
ivit
ies
Tota
lSi
nce
1-4-
99
SHGsFormed
SHGstaken up
Economic Activity
Tota
lSi
nce
1-4-
99
Cur
rent
Yea
r
Cur
rent
Yea
r
Tota
lSi
nce
1-4-
99
Cur
rent
Yea
r
275
(In Nos.)
563915164
739815837
9880244022408614042
94807310
118229972
1240579425904124399179429491968073805
1285522119831
103381198310498
275119
-135
---
2828-
120-
34426
38119
---
43--
88-
15--
274-
1735
196763472733532041168140
1216721307579296933607310309426172710531
350835561645270915834567363
1034123978724003
105169
-40
--
232
14973
101128200206766
96
22479
-121
-1517459442
-
1521
42817576517080095880
147221743511308
85114833
106608917
1116849515430678
49604544201135503076927318907821784453387101
186937
-62
---
1683
87120
-122
517119
---
33--
88-
1160
-67
-
1016
----
132
14946
10111877206553
94
17128
-69
-1116459415
-
1106

TABLE - 24.02DISTRICT WISE FINANCIAL PERFORMANCE UNDER SGSY
IN ASSAM, 2012-13(Rs. in Lakh)
District
1 2 3 4 5 6 7
Centralfund
Received
State fundReceived
Misc/Other
Receipts
Total FundAvailable
Openingbalance ason 1-4-12
TotalExpendi-
ture
KokrajharDhubriGoalparaBarpetaMorigaonNagaonSonitpurLakhimpurDhemajiTinsukiaDibrugarhSivasagarJorhatGolaghatKarbi AnglongDima HasaoCacharKarimganjHailakandiBongaigaonChirangKamrupKamrup MetroNalbariBaksaDarrangUdalguri
Assam
276
39.3935.74
4.80338.6144.6678.8213.19
119.01168.13257.3914.9641.23
2.99253.3013.8412.27
841.90438.0722.70
185.6854.3059.71
8.921023.00
26.3031.3333.07
4163.31
-------
215.18-------------------
215.18
9.4130.53
--
23.2316.07
--
8.12------------
7.11-----
94.47
5.5415.00
-7.49
-13.93
103.87---
8.0327.44
146.2817.2316.4614.44
--
10.5611.236.98
15.0022.25
-13.208.989.06
472.97
54.3481.27
4.80346.1067.89
108.82117.06334.19176.25257.3922.9968.67
149.27270.5330.3026.71
841.90438.0733.26
196.9161.2881.8231.17
1023.0039.5040.3142.13
4945.93
0.2066.41
4.60161.0563.9998.56
116.56202.18134.91257.0818.8221.20
131.83111.9024.8821.82
677.75303.10
6.40191.2848.9458.5024.25
223.2119.9928.8041.63
3059.84

277
TABLE - 24.03DISTRICT WISE PHYSICAL ACHIEVEMENTS UNDER MGNREGA
IN ASSAM, 2012-13
District
KokrajharDhubriGoalparaBarpetaMorigaonNagaonSonitpurLakhimpurDhemajiTinsukiaDibrugarhSibvaagarJorhatGolaghatKarbi AnglongDima HasaoCacharKarimganjHailakandiBongaigaonChirangKamrupKamrup MetroNalbariBaksaDarrangUdalguri
Assam
1 2 3 4 5 6
Employment Generated (Mandays)
SCs STs Others Total Women
61691161826119915796
305377249329139783
34304308171071535451637415529417615287582473
7184331044562203938159293544832365326222
3060872734056052
1880143
11636531470
3330269775
42902213693720019824778235729955707
12186676720
13180438603
572413103850
66982731
1370311138
360120649304171112146
15829711719
418042
6496034
13209741083289
897792521491
223241527149711794489
612704956544651142
10169781706203
63049133418816485910013
67080915532452809269304033541064059588297
4407881693709
539036532282
22965925
254631811009411292017
547062296681431012372134470
8947901344660
71756411742951846664
817589390406766030116336749350189099598015743559754823760008153661479156
3582767568095
1006376
31342102
998260302903437227162245402960477297659175206887424160169814337178446678127539
90427245491
38537112862
21166104705260028298412134722
6241355317
126494080066
226673
8148082

278TABLE - 24.04
DISTRICT-WISE FINANCIAL PERFORMANCE UNDER MGNREGAIN ASSAM, 2012-13
(Rs. in Lakh)
1 2 3 4 5 6 7 8
KokrajharDhubriGoalparaBarpetaMorigaonNagaonSonitpurLakhimpurDhemajiTinsukiaDibrugarhSivasagarJorhatGolaghatKarbi AnglongDima HasaoCacharKarimganjHailakandiBongaigaonChirangKamrupKamrup MetroNalbariBaksaDarrangUdalguriAssam
District
OpeningBalance
as on01-04-12 State
Misc/other
receiptCentral
Fund received Expenditureincurred on
Wages Materials
Totalfund
available
109.9948.66
161.34460.83
1257.1990.52
169.84352.83822.8865.57
133.0123.3477.25
283.73355.7046.2345.14
298.931064.19641.57568.28785.17235.71194.16121.76375.91425.10
9214.83
5644.082061.522526.34
854.885071.735678.244077.241612.002655.051452.572290.913505.271500.36
526.911445.44
340.581293.76
324.63187.53
1064.411160.861089.28
202.84810.94
3214.57984.89
1868.8453445.67
483.37217.36176.24186.26503.78406.16184.14216.72117.64
88.496.43
377.59148.64
63.62250.01
30.2988.4259.8520.8496.6564.16
131.6525.04
101.21240.87188.42146.10
4709.86
38.5034.56
185.0618.89
250.45875.39240.37
24.7389.5875.9454.29
107.4570.736.44
48.159.33
197.4418.15
135.3746.4483.9116.082.770.00
115.716.31
203.112955.15
6275.942362.103048.981520.867083.157050.314671.592206.283685.151682.482574.644013.651796.98880.70
2099.30426.43
1624.76701.56
1407.931849.071877.212022.18466.36
1106.313692.911555.532643.1570325.51
3463.811498.921760.12
664.083971.184217.962903.70
1219.11843.82
975.891601.532512.361111.96
532.631098.94
159.881143.79
254.86823.41
1008.121031.201041.74
207.60658.35
2175.79768.64
1368.5240017.90
2137.70491.31
1007.97453.33
2342.692259.98
863.50521.33816.79509.64800.44
1332.58411.85210.04616.5575.24
203.66230.16338.87478.19626.01267.20127.28215.81
1225.39503.35725.86
19792.72

279
TABLE - 24.05DISTRICT-WISE JOB CARDS ISSUED AND EMPLOYMENT
PROVIDED IN ASSAM, 2012-13
1 2 3 4 5 6
KokrajharDhubriGoalparaBarpetaMorigaonNagaonSonitpurLakhimpurDhemajiTinsukiaDibrugarhSivasagarJorhatGolaghatKarbi AnglongDima HasaoCacharKarimganjHailakandiBongaigaonChirangKamrupKamrup MetroNalbariBaksaDarrangUdalguri
Assam
DistrictJo
b C
ard
issu
ed
Hou
seho
ldde
man
ded
empl
oym
ent
Hou
seho
ldpr
ovid
edem
ploy
men
t
Hou
seho
ldpr
ovid
ed 1
00da
ys e
mpl
oy-
men
t
Dis
able
dpe
rson
spr
ovid
edem
ploy
men
t
(In Nos.)
180440193494146465249263142682213209230112164304116028117408131023121954106508129908205940
39902195116174769118462114970107951196462
37332104139178633150215118467
3985156
599205050063890219418419695522
1166893189645842345666009865290452872699273491
8495382471222838272336412986229928
750717799935892079641023
1247507
595505041263370215268365095234
11313631798453833456559825650374143426411732958484
3807812173380453363129800298497466
17639934432065440939
1234827
66100
8836
11523456
61256
28407309
1604512930
350
49134562
675855
106117
123
9807
1469
302432453
773619122
156116
92114
114
414952133
04
2442615
2239
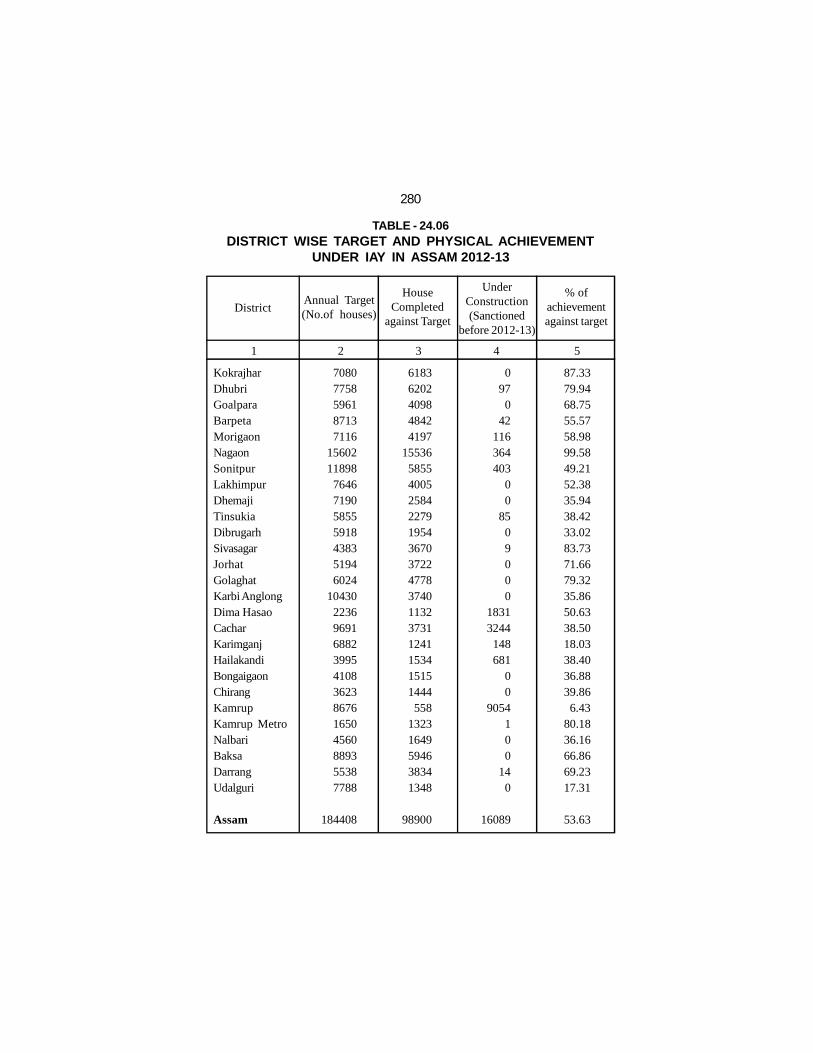
280
TABLE - 24.06DISTRICT WISE TARGET AND PHYSICAL ACHIEVEMENT
UNDER IAY IN ASSAM 2012-13
District
KokrajharDhubriGoalparaBarpetaMorigaonNagaonSonitpurLakhimpurDhemajiTinsukiaDibrugarhSivasagarJorhatGolaghatKarbi AnglongDima HasaoCacharKarimganjHailakandiBongaigaonChirangKamrupKamrup MetroNalbariBaksaDarrangUdalguri
Assam
Annual Target(No.of houses)
1 2 3 4 5
HouseCompleted
against Target
UnderConstruction(Sanctioned
before 2012-13)
% ofachievementagainst target
70807758596187137116
1560211898
7646719058555918438351946024
10430223696916882399541083623867616504560889355387788
184408
61836202409848424197
15536585540052584227919543670372247783740113237311241153415151444558
13231649594638341348
98900
097
042
116364403
00
8509000
18313244
148681
00
9054100
140
16089
87.3379.9468.7555.5758.9899.5849.2152.3835.9438.4233.0283.7371.6679.3235.8650.6338.5018.0338.4036.8839.866.43
80.1836.1666.8669.2317.31
53.63

281
TABLE - 24.07DISTRICT-WISE FINANCIAL PERFORMANCE UNDER IAY
IN ASSAM, 2012-13
District
Fund received
Central State Mis
c./
Oth
erre
ceip
t
Tota
lav
aila
bilit
yof
fun
d
Tota
lE
xpen
ditu
re
Ope
ning
Bal
ance
as o
n01
-04-
12 1 2 3 4 5 6 7
KokrajharDhubriGoalparaBarpetaMorigaonNagaonSonitpurLakhimpurDhemajiTinsukiaDibrugarhSivasagarJorhatGolaghatKarbi AnglongDima HasaoCacharKarimganjHailakandiBongaigaonChirangKamrupKamrup MetroNalbariBaksaDarrangUdalguri
Assam
(Rs. in Lakh)
490.78893.36
1102.02250.66125.46
1683.01156.65879.52537.60
1213.491900.46
57.781262.93816.91636.90128.33913.82
77.261061.571425.35368.38187.67
62.652.32
130.77152.76
90.26
16608.67
2017.782993.452275.783803.433106.103405.152596.691668.723092.601756.392417.281913.061133.521314.842276.26958.52
2114.972004.911598.96896.66790.76
1893.62360.19
1990.522622.441291.643399.40
55693.64
371.00251.88305.36255.29208.47872.30427.30376.95255.96141.99172.32140.53290.40188.63534.48
61.16501.99352.65196.97
99.63159.66
082.94
202.40260.53179.18237.14
7127.11
1937.56839.62
0638.71
0.004939.501582.361347.99
0.000.00
438.820.000.00
567.522242.86
104.382996.96
312.510.000.00
691.580.00
390.34414.14643.89448.96573.07
21110.77
4817.124978.313683.164948.093440.03
10899.964763.004273.183886.163111.874928.882111.372686.852887.905690.501252.396527.742747.332857.502421.642010.382081.29896.12
2609.383657.632072.544299.87
100540.19
2998.883259.202420.334225.812151.649056.003884.403487.822073.621632.393293.271811.432219.541799.253751.71875.90
5430.742180.61808.13
1942.911588.77187.67574.72
1311.302931.211722.833587.80
71207.88

282
TABLE - 24.08DISTRICT-WISE TARGET AND PHYSICAL ACHIEVEMENT UNDER
NATIONAL SOCIAL ASSISTANCE PROGRAMME IN ASSAM, 2012-13
District
KokrajharDh ubriGoalparaBarpetaMorigaonNagaonSonitpurLakhimpurDhemajiTinsukiaDibrugarhSivasagarJorhatGolaghatKarbi AnglongDima HasaoCacharKarimganjHailakandiBongaigaonChirangKamrupKamrup MetroNalbariBaksaDarrangUdalguri
Assam
Indira Gandhi National WidowPension Scheme
1 2 3 4 5
National Family BenefitScheme
Target Achievement Target Achievement
187239221969342318595543402721291370275428332519239322661918
4513461241413001424
959312525071650214317881791
63810
187239221969342318595543402721291370275428332519239322661918451
3461241413001424959
312525071650214317881791
63810
975750650750625950650680650665754650850700900700750656650650850850650675800800950
20180
975750650750625950650680650665754650850700900700750656650650850850650675800800950
20180
Contd...

283
(...Contd) TABLE - 24.08
District
KokrajharDhubriGoalparaBarpetaMorigaonNagaonSonitpurLakhimpurDhemajiTinsukiaDibrugarhSivasagarJorhatGolaghatKarbi AnglongDima HasaoCacharKarimganjHailakandiBongaigaonChirangKamrupKamrup MetroNalbariBaksaDarrangUdalguri
Assam
Indira Gandhi NationalDisability Pension Scheme
1 6 7 8 9
Annapurna
Target AchievementTarget Achievement
7141496
7511305
70921141536
812522
10511081
960913865743172
1319921496543366
1229954629817682683
24383
7141496751
1305709
21141536812522
10511081960913865743172
1319921496543366
1229954629817682683
24383
6691716794
1205760
171816982028569
1276150612131038984
1053279
14451115533666711
1390328436841
1007662
27640
6691716794
1205760
171816982028569
1276150612131038984
1053279
14451115533666711
1390328436841
1007662
27640
Contd...

284
District
KokrajharDhubriGoalparaBarpetaMorigaonNagaonSonitpurLakhimpurDhemajiTinsukiaDibrugarhSivasagarJorhatGolaghatKarbi AnglongDima HasaoCacharKarimganjHailakandiBongaigaonChirangKamrupKamrup MetroNalbariBaksaDarrangUdalguri
Assam
Age Group of 60-79 Year
1 10 11 12 13
Age Group of 80 Years and above
Target Achievement Target Achievement
264833179321960193072700282631532792609317031238082240330637419972205724572
951129263211221995514119
7500605681647533752261181849014928
742854
264833179321960193072700282631532792609317031238082240330637419972205724572
951129263211221995514119
7500605681647533752261181849014928
742854
15892814148222041575407826441556108816971433205313941339987265
2463168710101057803
1839323
1345157713401340
42982
15892814148222041575407826441556108816971433205313941339
987265
2463168710101057
8031839
3231345157713401340
42982
Indira Gandhi National Old age Pension Scheme
(...Contd) TABLE - 24.08
Source: (Table 24.01 to 24.10 ) Directorate of Panchayat and Rural Development, Assam.

285
TABLE - 24.09DISTRICT-WISE FINANCIAL PROGRESS UNDER NATIONALSOCIAL ASSISTANCE PROGRAMME IN ASSAM, 2012-13
(Rs. in Lakh)
District
1 2 3 4 5 6 7 8 9
Indira Gandhi National WidowPension Scheme
National Family Benifit SchemeC
entr
alR
elea
se
Cen
tral
Rel
ease
Sta
tere
leas
e
Fun
dA
vaila
ble
Sta
tere
leas
e
Fun
dA
vaila
ble
Exp
.In
curr
ed
Exp
.In
curr
ed
KokrajharDhubriGoalparaBarpetaMorigaonNagaonSonitpurLakhimpurDhemajiTinsukiaDibrugarhSivasagarJorhatGolaghatKarbi AnglongDima HasaoCacharKarimganjHailakandiBongaigaonChirangKamrupKamrup MetroNalbariBaksaDarrangUdalguri
Assam
51.12134.6469.4264.4825.94
193.4454.3031.6148.5085.8775.1849.6762.8668.8653.75
-54.2481.4647.0436.6235.7071.8337.3723.1526.8663.1863.20
1610.29
51.12134.6469.4264.4825.94
193.4454.3031.6148.5085.8775.1849.6762.8668.8653.75
-54.2481.4647.0436.6235.7071.8337.3723.1526.8663.1863.20
1610.29
57.0056.0054.5054.50 43.2061.0056.3054.5054.5054.5054.5055.0056.5054.5081.78
1.6955.5054.5054.5054.0054.0059.0047.0052.4055.0055.5045.00
1436.37
---------------------------
-
57.0056.0054.5054.5043.2061.0056.3054.5054.5054.5054.5055.0056.5054.5081.78
1.6955.5054.5054.5054.0054.0059.0047.0052.4055.0055.5045.00
1436.37
57.0056.0054.5054.5043.2061.0056.3054.5054.5054.5054.5055.0056.5054.5039.900.50
55.5054.5054.5054.0054.0059.0047.0052.4055.0055.5045.00
1393.30
51.12134.6469.4264.4825.94
193.4454.3031.6148.5085.8775.1849.6762.8668.8653.75
-54.2481.4647.0436.6235.7071.8337.3723.1526.8663.18 63.20
1610.29
---------------------------
-
Contd...

286
(...Contd) TABLE - 24.09
District
1 10 11 12 13 14 15 16 17
AnnapurnaIndira Gandhi National Disability
Pension Scheme
Cen
tral
Rel
ease
Cen
tral
Rel
ease
Sta
tere
leas
e
Fun
dA
vaila
ble
Sta
tere
leas
e
Fun
dA
vaila
ble
Exp
.In
curr
ed
Exp
.In
curr
ed
KokrajharDhubriGoalparaBarpetaMorigaonNagaonSonitpurLakhimpurDhemajiTinsukiaDibrugarhSivasagarJorhatGolaghatKarbi AnglongDima HasaoCacharKarimganjHailakandiBongaigaonChirangKamrupKamrup MetroNalbariBaksaDarrangUdalguri
Assam
---------------------------
-
2.476.332.934.452.806.346.273.792.104.715.564.483.833.63
--
5.334.111.972.462.625.131.211.613.103.722.44
93.39
2.476.332.934.452.806.346.273.792.104.715.564.483.833.63
--
5.334.111.972.462.625.131.211.613.103.722.44
93.39
16.7918.9212.4816.98
9.5860.5619.6311.8819.2026.4414.0618.6021.4919.3115.90
-18.5431.10
7.946.52
10.1216.3811.77
7.559.80
22.0122.50
466.05
---------------------------
-
16.7918.9212.4816.989.58
60.5619.6311.8819.2026.4414.0618.6021.4919.3115.90
-18.5431.107.946.52
10.1216.3811.777.559.80
22.0122.50
466.05
16.7918.9212.4816.98
9.5860.5619.6311.8819.2026.4414.0618.6021.4919.31
1.17-
18.5431.10
7.946.52
10.1216.3811.77
7.559.80
22.0122.50
451.32
2.476.332.934.452.806.346.273.792.104.715.564.483.833.63
--
5.334.111.972.462.625.131.211.613.103.722.44
93.39
Contd...

287
(...Contd) TABLE - 24.09
District
1 18 19 20 21 22 23 24 25
Age Group of 60-79 Years Age Group of 80 Years and above
Cen
tral
Rel
ease
Cen
tral
Rel
ease
Sta
tere
leas
e
Fun
dA
vaila
ble
Sta
tere
leas
e
Fun
dA
vaila
ble
Exp
.In
curr
ed
Exp
.In
curr
ed
KokrajharDhubriGoalparaBarpetaMorigaonNagaonSonitpurLakhimpurDhemajiTinsukiaDibrugarhSivasagarJorhatGolaghatKarbi AnglongDima HasaoCacharKarimganjHailakandiBongaigaonChirangKamrupKamrup MetroNalbariBaksaDarrangUdalguri
Assam
26.4847.6932.9428.9640.50
123.9574.9239.1425.5535.7133.6045.9563.0033.0824.579.51
43.8921.1229.9321.187.50
90.8524.7150.6313.0627.7414.93
1031.09
397.24492.79340.38299.26418.53
1280.78820.83404.44263.98369.02347.24474.87734.95341.88199.7529.65
453.57316.83309.30218.84112.50
1059.94255.36523.16378.71323.58223.92
11391.30
397.24492.79340.38299.26418.531280.78820.83404.44263.98369.02347.24474.87734.95341.88199.75
29.65453.57316.83309.30218.84112.501059.94255.36523.16378.71323.58223.92
11391.30
55.6198.4951.8777.1455.13
142.7392.5454.4638.0859.4050.1571.8548.7946.8625.55
6.7186.2159.0435.3537.0028.1164.3611.3147.0855.2046.9046.90
1492.82
1.594.222.223.312.366.123.972.331.632.542.153.082.092.010.990.273.691.671.521.580.802.760.482.025.122.011.34
63.87
57.20102.71
54.0980.4557.49
148.8596.5156.7939.7161.9452.3074.9350.8848.8726.546.98
89.9060.7136.8738.5828.9167.1211.7949.1060.3248.9148.24
1556.69
57.20102.7154.0980.4557.49
148.8596.5156.7939.7161.9452.3074.9350.8848.8726.54
6.9889.9060.7136.8738.5828.9167.1211.7949.1060.3248.9148.24
1556.69
370.76445.10307.44270.30378.031156.83745.91365.30238.43333.31313.64 428.92671.95308.80175.1820.14
409.68295.71279.37197.66105.00969.09230.65472.53365.65295.84208.99
10360.21
Indira Gandhi National Old Age Pension Scheme

TABLE - 24.10
ELECTION(Panchayat Election, 2013)
FIGURE AT A GLANCE
Panchayat District in Assam
Zilla Parishad Constituency Seats
Zilla Parishad Election held / Results declared
Anchalik Panchayat Member Seats
Anchalik Panchayat Election held / Results declared
Anchalik Panchayat Member (Poll Pending)
Gaon Panchayat President Seats
Gaon Panchayat President Election held / Results declared
Gaon Panchayat President (Poll Pending)
Gaon Panchayat Member Seats
Election held / Results declared for Gaon Panchayat Member
Gaon Panchayat Member (Poll Pending)
21
420
420
2200
2190
10
2200
2189
11
22000
21726
274

District
1 2 3 4 5
29
16
12
29
13
6
26
14
32
17
7
23
20
24
23
17
41
13
27
11
20
420
Election held/Results
Declared
29
16
12
29
13
6
26
14
32
17
7
23
20
24
23
17
41
13
27
11
20
420
TABLE - 24.10 (1)RESULTS OF PANCHAYAT ELECTION IN ASSAM, 2013
289
Dhubri
Goalpara
Bongaigaon
Barpeta
Nalbari
Kamrup Metro
Kamrup
Darrang
Sonitpur
Lakhimpur
Dhemaji
Dibrugarh
Tinsukia
Sivasagar
Jorhat
Golaghat
Nagaon
Morigaon
Cachar
Hailakandi
Karimganj
Assam
Zilla Parishad constituency Anchalik Panchayat Member *
Election held/Results
DeclaredTotal Seats
168
81
65
129
65
21
139
75
158
81
65
93
85
118
110
102
239
85
163
62
96
2200
168
76
65
129
65
21
134
75
158
81
65
93
85
118
110
102
239
85
163
62
96
2190
* Anchalik Panchayat Member, Poll Pending:- Goalpara 5 Seats, Kamrup 5 Seats.
Total Seats

District
1 2 3 4 5 6
168
81
65
129
65
21
139
75
158
81
65
93
85
118
110
102
239
85
163
62
96
2200
TotalSeats
Election held/ResultsDeclared
168
75
65
129
65
21
134
75
158
81
65
93
85
118
110
102
239
85
163
62
96
2189
TABLE - 24.10 (2)RESULTS OF PANCHAYAT ELECTION IN ASSAM, 2013
290
Dhubri
Goalpara
Bongaigaon
Barpeta
Nalbari
Kamrup Metro
Kamrup
Darrang
Sonitpur
Lakhimpur
Dhemaji
Dibrugarh
Tinsukia
Sivasagar
Jorhat
Golaghat
Nagaon
Morigaon
Cachar
Hailakandi
Karimganj
Assam
Gaon Panchayat President
Election held/ResultsDeclared
TotalSeats
1680
810
650
1290
650
210
1390
750
1580
810
650
930
850
1180
1100
1020
2390
850
1630
620
960
22000
1677
701
648
1287
647
210
1254
750
1578
810
648
930
850
1180
1100
1020
2379
850
1627
620
960
21726
Gaon Panchayat Member
PollPending
3
109
2
3
3
-
136
-
2
-
2
-
-
-
-
-
11
-
3
-
-
274
Gaon Panchayat President, Poll Pending:- Goalpara 6 Seats, Kamrup 5 Seats.Source- (Table 24.11) The Deputy Secretary Assam State Election Commission.

25.CRIME AND JUDICIARYFIGURE AT A GLANCE
No. of Police Stations , March,2013
No. of Police Out Posts , March,2013
Total Incidents of Crime under IPC , 2012
No. of Motor Vahicle Accidents Registered by Police, 2012-13
Persons killed due to accident, 2012-13
Persons injured due to accident , 2012-13
Total Incidents of Crime against women, 2012
Total Incidents of crime against children , 2012
Witch Hunting cases, 2012
Prison population, 2012
Children of Prisons , 2012
No. of cases pending in Hon’ble Gauhati High Court upto December2013
No. of cases pending in Subordinate Courts upto December 2012
No. of Cognizable Cases pending for trial at Court as on December2012
310
196
77682
6562
2252
6472
13996
392
113
8309
38
260970
228319
106431

292
ParticularsNumber of Cases
2012
A.
1.
2.
3.
4.
5.
6.
7.
8.
9.
10.
11.
12.
13.
InvestigationStage
Trial Stage
TABLE - 25.01STATISTICS OF COGNIZABLE CRIMES IN ASSAM
(As on 31st December)
Contd...
Sl.No.
2011
Classes (I to VI including Abatement and Criminal
Conspiracy
Number of cases pending investigation from
previous year
Number of cases reported during the year
Number of cases not investigated or in which
investigation was refused
Number of cases declared false/mistake of fact or
law non-cognizable
Cases in which charge sheets were laid down during
the year
Cases in which charge sheets were not laid down
but investigation was completed and final reports
submitted during the year
Cases pending investigation at the end of the year
Cases pending trial at court from previous year
Cases sent to court for during the year
Cases compounded/withdrawn or otherwise
disposed
Cases acquitted
Cases Convicted
Cases pending trial at court at the end of the year
1 2 3 4
76109
66714
1097
6404
27920
23471
83931
95679
27920
3646
19132
4744
96077
83932
77682
-
3479
31237
26465
100432
96077
31237
639
18090
2154
106431

6424
1608
61
108
719
652
6492
8387
719
18
773
75
8240
ParticularsNumber of Cases
2012
B.
1.
2.
3.
4.
5.
6.
7.
8.
9.
10.
11.
12.
13.
InvestigationStage
Trial Stage
(...Contd) TABLE - 25.01
Sl.No.
2011
Part - II Offences under Special and Local Laws
Number of cases pending investigation from
previous year
Number of cases reported during the year
Number of cases not investigated or in which
investigation was refused
Number of cases declared false/mistake of fact or
law non-cognizable
Cases in which charge sheet were laid down during
the year
Cases in which charge sheet were not laid down but
investigation was completed and final reports
submitted during the year
Cases pending investigation at the end of the year
Cases pending trial at court from previous year
Cases sent to court for during the year
Cases compounded/withdrawn or otherwise
disposed
Cases acquitted
Cases Convicted
Cases pending trial at court at the end of the year
1 2 3 4
293
6493
1974
25
40
978
499
6925
8240
978
-
895
115
8208

TABLE-DISTRICT-WISE INCIDENTS OF CRIME
294
Source: (Table 25.01 & 25.02) Office of the Addl. Director General of Police (C.I.D.), Assam.
KokrajharDhubriGoalparaBarpetaMorigaonNagaonSonitpurLakhimpurDhemajiTinsukiaDibrugarhSibsagarJorhatGolaghatKarbi AnglongDima HasaoCacharKarimganjHailakandiBongaigaonChirangKamrupKamrup MetroNalbariBaksaDarrangUdalguri
Assam
110655534207491372486817136584415723624174048
10122383633
1368
6203242139334151561253241548-
139656
22291
2514169
907
90315
84225
88351241123
87160134168106181
7423
17585967340
121355101
62191
58
3812
7718913416558
33722010540
1281171451241005316
264122336359
12582811022
16031
3825
District
Mur
der
Dac
oity
Rap
e
4122018
53914
65585384-
131511
95
1420
7592
266
Kid
napp
ing
Rob
bery
Bur
glar
y
Sl.No.
123456789101112131415161718192021222324252627
1 2 3 4 5 6 7 8
27159659858
173976274645078426031
59432565024548534338823
1716

25.02UNDER I.P.C. IN ASSAM, 2012
295
29121
-164
1894651013696826459
242
513114251249
202346
8314
1278
3050277315683406930
398426361348705
14321894160916501466493135
31021593717913439
410644801216363
1719503
48273
220254293214
98540464184101496560427435231213
35573197149147
63361
2589177104160109
9394
64594633241547641449598039801968110725442997268626122245974249
4658221013221381718
502294221801664
2607815
77682
28144
568350
109981232323398
117581110752940216
61376
47149720
1705
Rio
t
Cri
min
albr
each
Tru
st
The
ft
-9-122---13324-1-2-413
221---
61
Che
atin
g
Cou
nter
feiti
ng
Oth
er
Tota
l
2818572108314109184721811102424111619
722659
1765423587327
34813
5077
Sl.No.
123456789101112131415161718192021222324252627
9 10 11 12 13 14 15 1
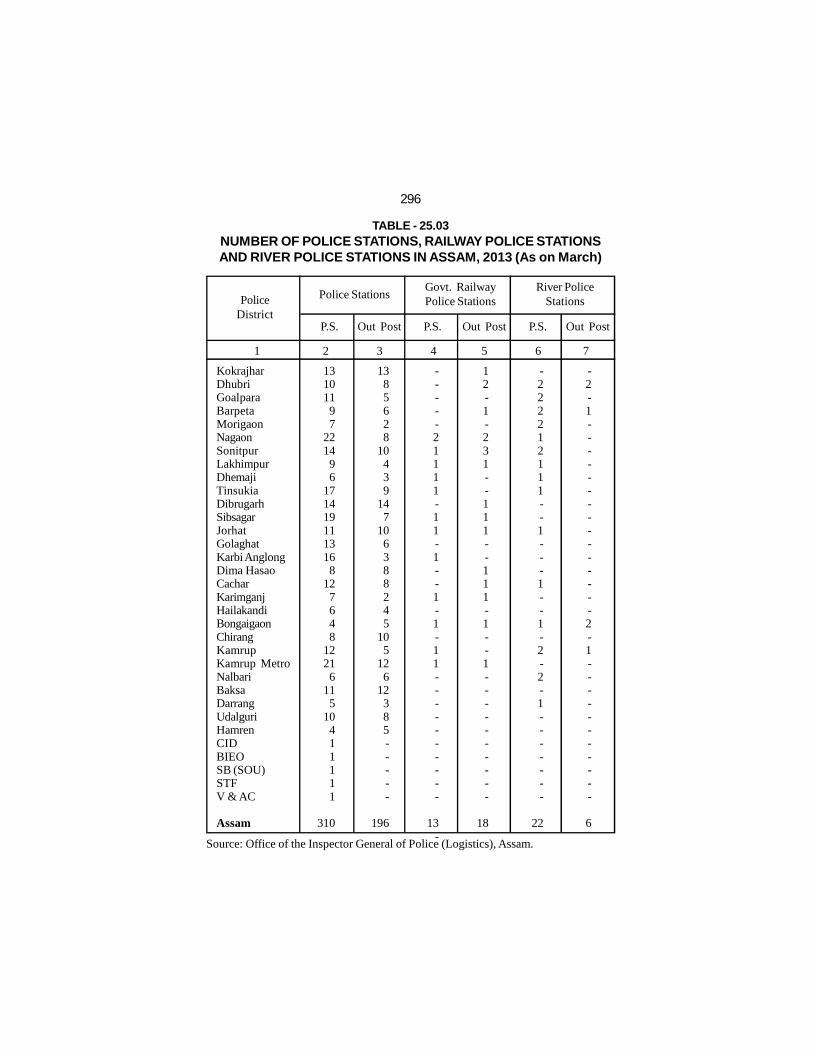
TABLE - 25.03NUMBER OF POLICE STATIONS, RAILWAY POLICE STATIONSAND RIVER POLICE STATIONS IN ASSAM, 2013 (As on March)
296
Source: Office of the Inspector General of Police (Logistics), Assam.
1 2 3 4 5 6 7
KokrajharDhubriGoalparaBarpetaMorigaonNagaonSonitpurLakhimpurDhemajiTinsukiaDibrugarhSibsagarJorhatGolaghatKarbi AnglongDima HasaoCacharKarimganjHailakandiBongaigaonChirangKamrupKamrup MetroNalbariBaksaDarrangUdalguriHamrenCIDBIEOSB (SOU)STFV & AC
Assam
-222212111--1---1--1-2-2-1-------
22
-----21111-11-1--1-1-11----------
13-
-2-1---------------2-1-----------
6
12-1-231--111--111-1--1----------
18
PoliceDistrict
Police StationsGovt. RailwayPolice Stations
River PoliceStations
P.S. Out Post P.S. P.S.
13101197
221496
1714191113168
127648
12216
115
10411111
310
1385628
10439
147
106388245
105
126
12385-----
196
Out Post Out Post
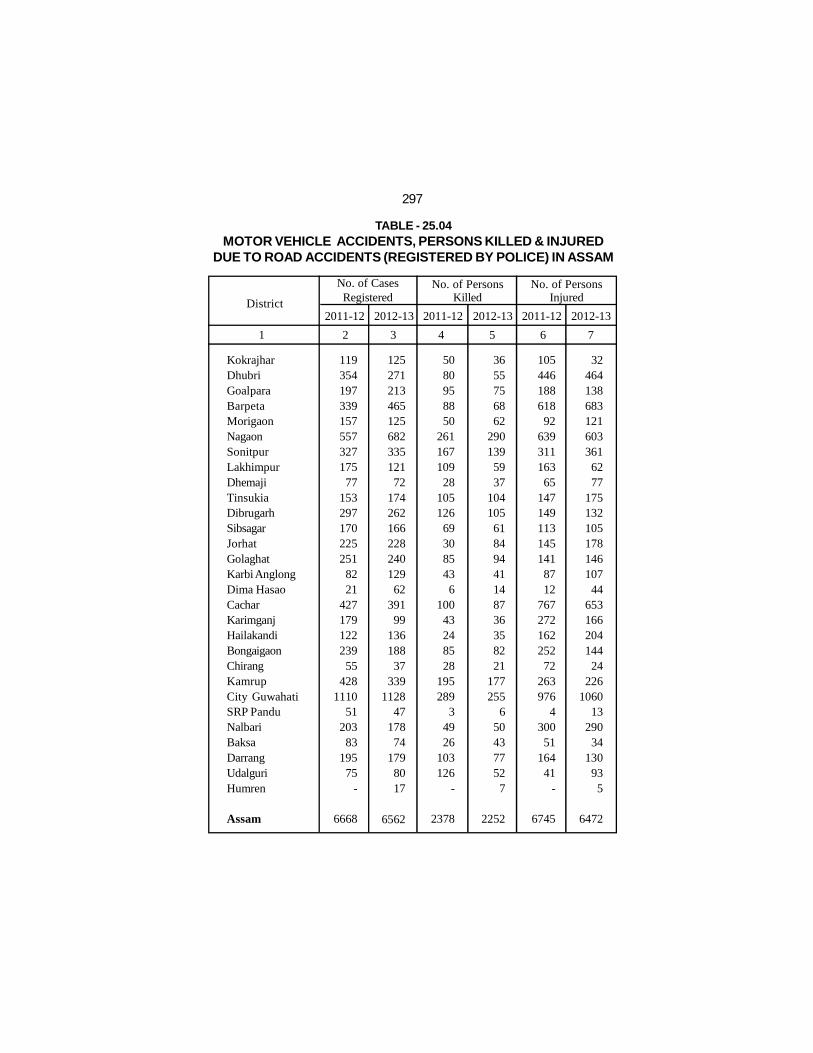
TABLE - 25.04MOTOR VEHICLE ACCIDENTS, PERSONS KILLED & INJURED
DUE TO ROAD ACCIDENTS (REGISTERED BY POLICE) IN ASSAM
297
KokrajharDhubriGoalparaBarpetaMorigaonNagaonSonitpurLakhimpurDhemajiTinsukiaDibrugarhSibsagarJorhatGolaghatKarbi AnglongDima HasaoCacharKarimganjHailakandiBongaigaonChirangKamrupCity GuwahatiSRP PanduNalbariBaksaDarrangUdalguriHumren
Assam
119354197339157557327175
77153297170225251
8221
427179122239
55428
111051
20383
19575
-
6668
10544618861892
63931116365
1471491131451418712
76727216225272
263976
430051
16441
-
6745
5080958850
261167109
28105126
693085436
10043248528
195289
34926
103126
-
2378
32464138683121603361
6277
175132105178146107
44653166204144
24226
106013
29034
130935
6472
12527121346512568233512172
17426216622824012962
39199
13618837
3391128
4717874
1798017
6562
District2011-12
No. of PersonsKilled
3655756862
2901395937
10410561849441148736358221
177255
650437752
7
2252
No. of PersonsInjured
No. of CasesRegistered
2012-13 2011-12 2012-13 2011-12 2012-13
1 2 3 4 5 6 7

TABLE - 25.05INCIDENCE OF CRIMES COMMITTED AGAINST WOMEN
AND CHILDREN IN ASSAM
298
Source: (Table 25.04 to 25.06) Office of the Addl. Director General of Police, C.I.D,Assam.
Sl. No. 20122011
1 2 3 4
Heads
A. (1) (2) (3) (4) (5) (6) (7) (8) (9) (10) B.
(1) (2) (3) (4) (5) (6)
CRIME AGAINST WOMANRapeKidnapping and AbductionDowry DeathCruelty by HusbandMolestationSexual HarassmentImportation of GirlsImmoral Traffic Prevention Act.Indecent Representation of WomanDowry Prohibition Act.CRIME AGAINST CHILDRENMurderRapeKidnapping and Abduction (Children)Procuration of Minor GirisSelling of Girls for ProstitutionOthers
17163812140
64071840
52
303
41
15156
68122
-31
17003192
12152461193
82
211
19
84029
142-
17
TABLE - 25.06WITCH HUNTING CASES IN ASSAM
2010 2011 2012
1.2.3.4.5.
No of cases Registered .Charge SheetFinal ReportPending InvestigationPersons Arrested
11920
52
292144
149
14815
113
Item
1 2 3 4

TABLE - 25.08NUMBER OF CONVICTS ADMITTED AND DISCHARGED
DURING THE YEAR 2012
Male
No. of Convicts
Female Total
A. Admitted1.
B. Discharged1.2.
3.4.5.6.7.8.9.10.11.
12.
Imprisoned during the year
On Appeal and Bail etcOn Expiry of Sentence(including remission erned)Under remission ruleBy order of GovernmentOther groundsTransfer to hospitalsReleased on paroleReleased on licenceEscapedDiedTransfer to other prisons(of other States)Transfer Enroute prisoners to other prisons
Total
2126
7101173
44
173139
-142920
-
4428
26
4419
-
-4-1--
-
94
2152
7541192
44
173143
-152920
-
4522
Item
1 2 3 4
299
TABLE - 25.07PRISON POPULATION OF ASSAM (As on 31st Dec.)
Registered CapacityActual PopulationConvictUnder TrialDetenu (NSA)CivilDetenu(other than NSA)Criminal LunaticChildren of Prisoners
563311108183
-----
20
508326
91207
----------
28
47531898
175------
--16
7485825831375066
----------
55
7978830931705098
3----
38
HeadFemale
2010
6832805532644655
3----
--38
2011 2012
Total Female Total Female Total
1 2 3 4 5 6 7
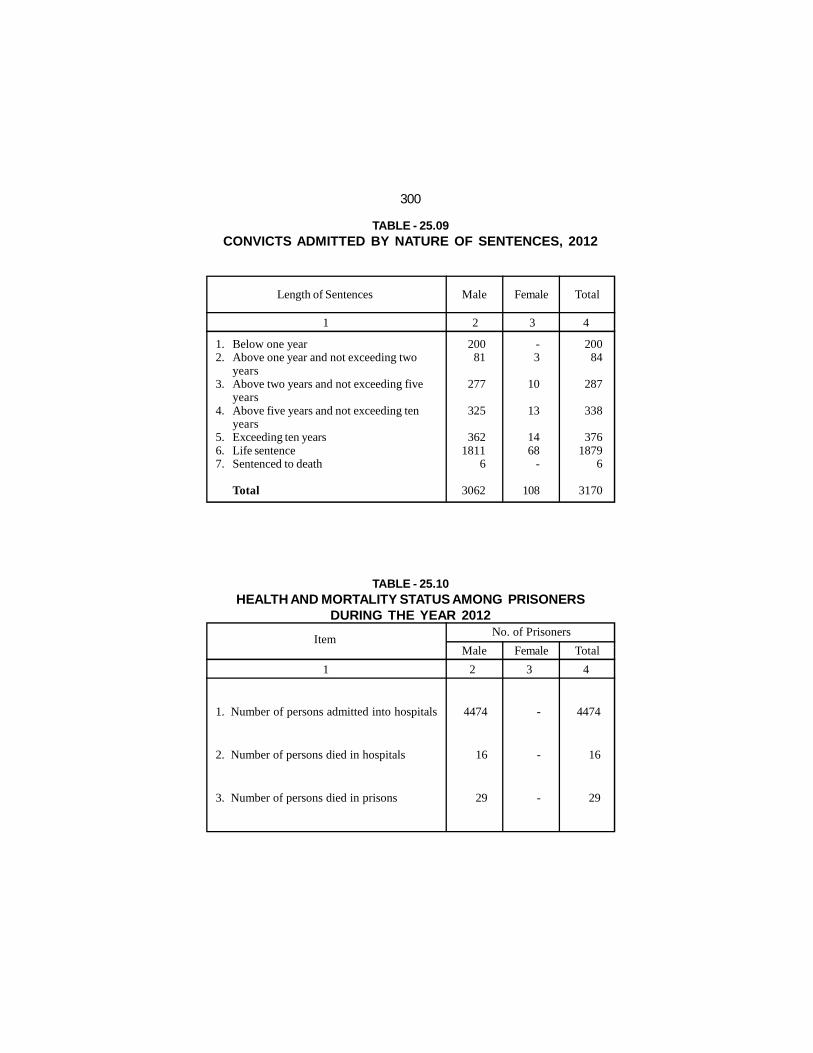
300
TABLE - 25.09CONVICTS ADMITTED BY NATURE OF SENTENCES, 2012
Male Female Total
1.2.
3.
4.
5.6.7.
Below one yearAbove one year and not exceeding twoyearsAbove two years and not exceeding fiveyearsAbove five years and not exceeding tenyearsExceeding ten yearsLife sentenceSentenced to death
Total
20081
277
325
3621811
6
3062
-3
10
13
1468
-
108
20084
287
338
3761879
6
3170
Length of Sentences
1 2 3 4
TABLE - 25.10HEALTH AND MORTALITY STATUS AMONG PRISONERS
DURING THE YEAR 2012
Male
No. of Prisoners
Female Total
1.
2.
3.
Number of persons admitted into hospitals
Number of persons died in hospitals
Number of persons died in prisons
4474
16
29
-
-
-
4474
16
29
Item
1 2 3 4

TABLE - 25.11CONVICTS AND UNDERTRIALS ADMITTED BY RELIGION, AGE
AND EDUCATIONAL LEVEL AS ON 31-12-2012
Source: (Table 25.07 to 25.11) Inspector General of Prisons, Assam.
301
Male Female Total
I.
II.
III.
Religion:
1. Hindu
2. Muslims
3. Sikh
4. Christians
5. Others
Total
Age Group
1. Under 21 years
2. 21-40 years
3. 41-59 years
4. Above 60 years
Total
Educational Level
1. Literates
2. Illiterates
Total
Description
1 2 3 4 5 6 7
Male Female Total
No. of convicts Under Trial
1870
902
26
192
72
3062
910
1631
521
-
3062
2213
849
3062
62
38
-
8
-
108
36
60
12
-
108
68
40
108
1932
940
26
200
72
3170
946
1691
533
-
3170
2281
889
3170
2606
1781
35
351
142
4915
2323
2061
531
-
4915
3045
1870
4915
90
70
-
16
7
183
89
75
19
-
183
101
82
183
2696
1851
35
367
149
5098
2412
2136
550
-
5098
3146
1952
5098

302
TABLE - 25.12NUMBER OF JUDICIAL STAFF IN ASSAM
Category
District & Sess. Judges
Addl. Dist. & Sess. Judges
(Including FTC)
Sr. Civil Judges & Asstt. Sess.
Judges
Chief Judicial Magistrates
Addl. Chief Judl.Magistrates
Judicial Magistrates(Class-I)
Judicial Magistrates (Class-II)
Spl. Judl.Magistrate (1st Class)
Spl. Rly. Magistrate (1st Class)
Munsiffs
SDJMs
Ad-hoc Addl. Sess.Judges
Staff in position (No.)
2013
Male Female Male Female
21
14
14
20
15
23
-
0
01
27
11
-
01
10
09
02
06
18
-
0
0
15
09
-
17
12
12
20
16
20
-
0
01
27
18
-
03
09
10
02
08
11
-
01
0
15
10
-
1 2 3 4 5
2012

303
TABLE - 25.13NUMBER OF CASES INSTITUTED, DISPOSED OFF AND PENDING
IN THE GAUHATI HIGH COURT, ASSAM
Source: (Table 25.12 to 25.14) Gauhati High Court, Assam.
TABLE - 25.14NUMBER OF CASES INSTITUTED, DISPOSED OFF AND PENDING
IN THE SUB-ORDINATE COURTS OF ASSAM,FOR THE YEAR 2012
Nature ofCases
1 2 3 4 5 6 7 8 9
Civil
Criminal
Total
61754
399704
461458
90245
250723
340968
62057
404375
466432
48751
286693
335444
89942
246052
335944
74580
192203
266783
47340
282291
329631
73169
187801
260970
Pending as on1st January
Instituted duringthe year
Disposedduring the year
Pending as on31st December
Nature ofCases
1 2 3 4 5 6 7 8 9
Civil
Criminal
Total
10203
40804
51007
18300
70036
88336
30137
161563
221700
51878
184826
236704
33848
196237
230085
5685
19016
24701
Pen
ding
at t
hebe
gini
ng o
f the
year
201
2.
Inst
itut
eddu
ring
the
year
Dis
pose
d of
f Pending at the end of the year (31st Dec.2012)(Period-wise break-up)
Upto 1year
More than 1Yr and lessthan 2 years
Morethan 2
yrs
Morethan 5years
Total
48167
180152
228319
20132012 20132012 20132012 20132012
13979
50296
64275

26.CO-OPERATIONFIGURE AT A GLANCE
Number of Societies, 2011-12
Membership (`000 nos.) 2011-12
Share Capital 2011-12
Working Capital 2011-12
Non-Credit Co-operative Societies: 2012-13(i) Assam Co-operative Jute Mill Ltd.:
(a) Membership(b) Paid up Capital(c) Working Capital
(ii) Fishfed:(a) Membership(b) Paid up Capital(c) Working Capital
(iii) Housefed:(a) Membership*(b) Paid up Capital(c) Working Capital
(iii) Eastern Agro processing & Tea Warehousing:(a) Membership(b) Paid up Capital(c) Working Capital
(iv) Assam Polyester Co-operative Society Ltd.:(a) Membership(b) Paid up Capital(c) Working Capital
8006
4600
Rs.98.35 crore
Rs.2806.09 crore
1826 nos.Rs.325.79 lakh
Rs.1119.86 lakh
225 nos.Rs.287.99 lakhRs.342.52 lakh
418 nos.Rs.1647.00 lakh
Rs.14882.00 lakh
492 nos.Rs.97.98 lakh
Rs.3071.45 lakh
4618 Nos.Rs.1628.05 lakhRs.248.36 lakh
* Member Society.

Type
Apex Bank
Urban Bank
ASCARD Bank
Thrift and Credit
Co-operative
GPSS
LAMPS
Primary Marketing
Sugar Mills
Jute Mills
Spinning Mills
Rice Mills
Cotton Ginning Mills
Agro Industry (Solvent
Extraction plant)
Milk Union
Primary Milk Societies
Dairy Co-operatives
Poultry, Milk Societies
Piggery Co-operatives
Firming Co-operatives
Fishfed
No. of Societies
(1)
(2)
(3)
(4)
(5)
(6)
(7)
(8)
(9)
(10)
(11)
(12)
(13)
(14)
(15)
(16)
(17)
(18)
(19)
(20)
1 2 3 4 5 6
1
8
1
670
704
63
83
-
1
1
-
1
2
3
209
121
146
298
265
1
TotalFunct-ioning
Member-ship
(Nos.)
WorkingCapital(Rs. inLakhs)
ShareCapital(Rs. inLakhs)
1
8
1
787
714
65
86
-
1
2
-
1
8
3
239
257
228
414
359
1
81859
29221
39106
80003
3048786
53965
8809
-
1816
37178
-
296
1349
136
13905
12854
10814
35340
25454
225
883.77
565.36
633.75
332.98
1688.88
171.79
55.31
-
333.02
1641.11
-
29.60
132.55
132.78
17.62
8.57
8.72
3.21
101.03
287.99
177740.10
57416.09
1641.63
2787.35
12325.56
1547.85
236.02
-
1006.80
1269.40
-
78.00
2236.14
1625.42
149.22
87.08
17.25
27.40
267.91
342.52
TABLE - 26.01NUMBER OF DIFFERENT TYPES OF CO-OPERATIVE SOCIETIES
IN ASSAM, 2011-12
305
Contd...

Type
No. of Societies
1 2 3 4 5 6
Funct-ioning
Total
Member-ship
(Nos.)
ShareCapital(Rs. inLakhs)
WorkingCapital(Rs. inLakhs)
Primary Fisheries
Pisiculture Co-operatives
Wholesale Consumers
Primary Consumers
Housefed
Primary Housing Co-
operatives
Industrial Co-operatives
Transport Co-operatives
Labour Contract
Construction
State Co-operative
Union
District Co-operative
Union
Cadre Management Co-
operative
Women Co-operatives
Processing Co-operative
Fruit Growers Co-
operatives
School Co-operatives
College Co-operatives
Others
Total -
(21)
(22)
(23)
(24)
(25)
(26)
(27)
(28)
(29)
(30)
(31)
(32)
(33)
(34)
(35)
(36)
(37)
(38)
315
90
35
237
1
140
193
31
68
1
25
1
2015
19
2
43
1
380
6175
380
116
36
314
1
266
342
48
178
1
25
1
2316
23
13
105
2
664
8006
65406
11871
41209
129868
41612
13514
36047
10474
7697
-
1968
-
681372
1779
616
25786
178
49678
4600191
400.82
131.44
2376.42
1216.49
13152.31
669.10
494.12
18.51
92.93
29.61
-
125.51
704.29
85.95
13.24
43.18
1.50
252.44
280609.60
48.81
36.12
293.51
215.78
1547.84
154.68
68.87
12.67
32.28
-
-
0.10
188.46
24.43
7.46
6.35
0.02
169.82
9835.24
(...Contd) TABLE - 26.01
306

TABLE - 26.02PERFORMANCE OF THE PRIMARY CREDIT SOCIETIES IN
ASSAM
307
Item
Gaon Panchayat LevelSamabai Samity (GPSS)
Number of Societies
Membership
(Nos.)
Paid up share Capital
(Rs. in lakh)
Deposits
(Rs. in lakh)
Working Capital
(Rs. in lakh)
Loan issued during the year
(Rs. in lakh)
Short term
Medium term
) Others
Outstanding Loan
(Rs. in lakh)
Sales Turnover
(Rs. in lakh)
Agriculture produce
Consumer Goods
Others
65
55760
171.79
-
1538.86
Nil
Nil
-
55.39
428.44
489.15
428.44
Large Area Multi-purpose Co-operativeSocieties (LAMPS)
2010-11 2011-12 2010-11 2011-12
1 2 3 4 5
714
3050920
1629.14
-
11777.56
143.08
28.20
130.64
2141.271
299.77
52783.10
4812.97
714
3048786
1688.88
1829.62
12325.56
176.85
28.20
130.64
2051.14
277.25
50105.54
2455.29
65
53965
171.79
12..00
1547.85
Nil
Nil
Nil
55.39
428.44
489.15
428.44
1
2.
3.
4.
5.
6.
(a)
(b)
(c)
7.
8.
(a)
(b)
(c)

TABLE - 26.03PERFORMANCE OF THE CONSUMER CO-OPERATIVE SOCIETIES
IN ASSAM
308
Item
Whole Sale Store
Number of Store
Total No. of Membership
Paid up share Capital
(Rs. in lakh)
Total
Government
Borrowing
(Rs. in lakh)
Working Capital
(Rs. in lakh)
Value of fixed assets
(Rs. in lakh)
Value of Purposed good
(Rs. in lakh)
Whole sale produce
Retail sale
Sale of controlled cloth
284
128691
200.67
49.32
10.49
1206.77
354.84
421.87
636.85
14.97
Primary Consumers
2010-11 2011-12 2010-11 2011-12
1 2 3 4 5
36
42518
295.58
148.01
329.49
2321.95
357.22
6976.57
775.98
1.71
36
41209
293.51
148.97
387.29
2376.42
361.48
7046.19
560.75
1.71
314
129868
215.78
54.69
11.76
1216.49
347.28
420.79
597.43
45.35
1.
2.
3.
(a)
(b)
4.
5.
6.
7.
(a)
(b)
(c)
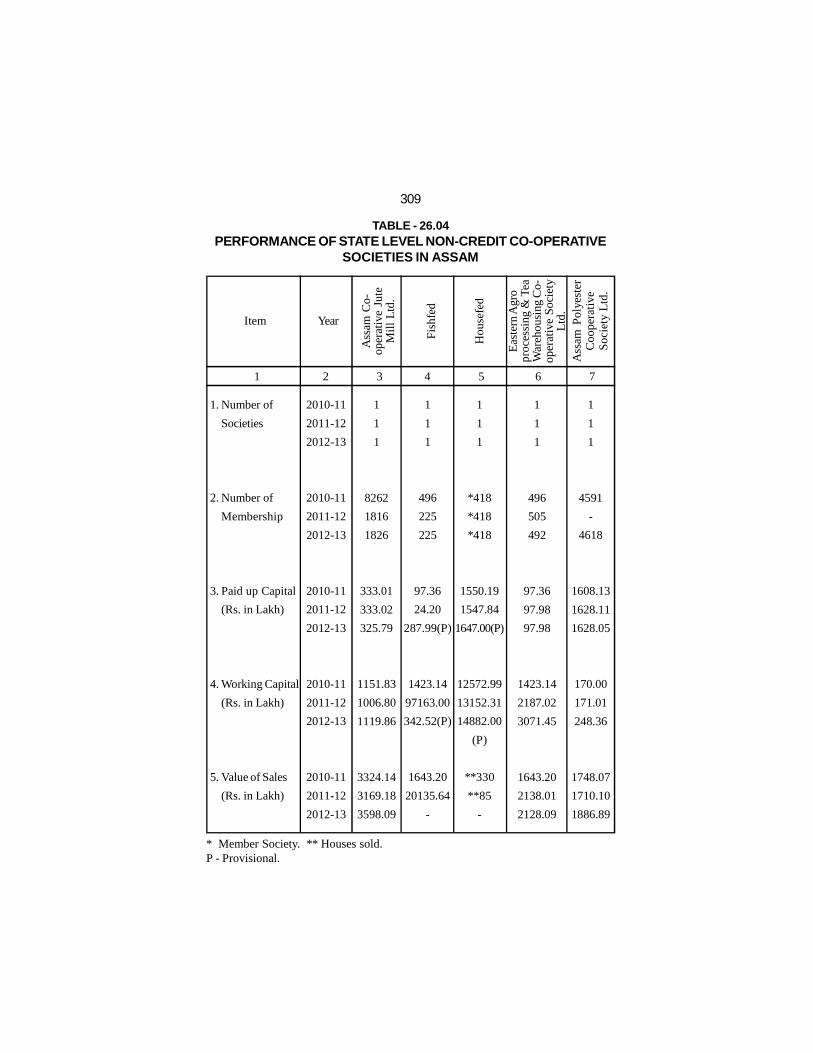
TABLE - 26.04PERFORMANCE OF STATE LEVEL NON-CREDIT CO-OPERATIVE
SOCIETIES IN ASSAM
309
* Member Society. ** Houses sold.P - Provisional.
Item
Number of
Societies
Number of
Membership
Paid up Capital
(Rs. in Lakh)
Working Capital
(Rs. in Lakh)
Value of Sales
(Rs. in Lakh)
2010-11
2011-12
2012-13
2010-11
2011-12
2012-13
2010-11
2011-12
2012-13
2010-11
2011-12
2012-13
2010-11
2011-12
2012-13
1
1
1
*418
*418
*418
1550.19
1547.84
1647.00(P)
12572.99
13152.31
14882.00
(P)
**330
**85
-
1
1
1
496
505
492
97.36
97.98
97.98
1423.14
2187.02
3071.45
1643.20
2138.01
2128.09
Year
1 2 3 4 5 6 7
1
1
1
8262
1816
1826
333.01
333.02
325.79
1151.83
1006.80
1119.86
3324.14
3169.18
3598.09
1
1
1
496
225
225
97.36
24.20
287.99(P)
1423.14
97163.00
342.52(P)
1643.20
20135.64
-
1
1
1
4591
-
4618
1608.13
1628.11
1628.05
170.00
171.01
248.36
1748.07
1710.10
1886.89
Ass
am C
o-op
erat
ive
Jute
Mil
l L
td.
Fis
hfed
Hou
sefe
d
Eas
tern
Agr
opr
oces
sing
& T
eaW
areh
ousi
ng C
o-op
erat
ive
Soc
iety
Ltd
.A
ssam
Pol
yest
erC
oope
rati
veS
ocie
ty L
td.
1.
2.
3.
4.
5.

TABLE - 26.05PERFORMANCE OF ASSAM CO-OPERATIVE APEX BANK,
URBAN BANK, AND ASCARD BANK IN ASSAM
310
Source: (Table 26.01 to 26.05) Registrar, Co-operative Societies, Assam.
Item
Bank Branches
(Nos)
Membership
(Unit.000)
Paid up
ShareCapital
(Rs.In crore)
Reserve
(Rs.In crore)
Deposit
(Rs.In crore)
Working Capital
(Rs.In crore)
Borrowing
Outstanding
(Rs.In crore)
Investment
(Rs.Incrore)
Loan Advance
(Rs.In crore)
Loan Outstanding
(Rs.In crore)
Loan overdue
(Rs.In crore)
67
91
9.13
33.69
1500.63
1687.60
6.45
987.10
125.29
483.71
98.38
67
82
8.84
22.15
1559.47
1777.40
7.0
1019.56
419.58
504.84
98.98
1 2 3 4 5 6 7
23
29
6.53
-
522.49
595.15
-
-
199.59
239.45
13.89
28
44
6.34
-
0.19
13.23
-
-
0.19
8.42
-
2012-20132011-2012
ApexBank
UrbanBank
AscardBank
ApexBank
AscardBank
28
39
6.34
-
0.21
16.42
-
-
0.04
8.78
-
1.
2.
3.
4.
5.
6.
7.
8.
9.
10.
11.
UrbanBank
23
29
5.65
-
492.28
574.16
-
-
307.38
223.98
16.80

27.EMPLOYMENTFIGURE AT A GLANCE, 2012
Employment in Organised Sector:
1. Public Sector
2. Private Sector
3. Total
No. of Employment Exchanges (including EI & AB)
Total Unemployed in the Live Register
Total Educated Unemployed in Live Register
Educated Unemployed Registered during the year
535717
584767
1120484
82
1622729
1411949
150627

TABLE - 27.01EMPLOYMENT IN PUBLIC AND PRIVATE SECTORS
IN ASSAM
312
Sector
1 2 3 4 5 6 7
Men Women
2012 2012 2012
Total
Public Sector (Total)
Central Government
State Government
Central Quasi Govern-
ment
State Quasi Govern-
ment
Local Bodies
Private Sector (Total)
Large Establishments
(Act)
Small Establishments
(Non-Act)
Grand Total (A+B)
445230
62249
260027
72208
42861
7885
304263
295622
8641
749493
90487
4607
54336
19501
10925
1118
280504
279293
1211
370991
535717
66856
314363
91709
53786
9003
584767
574915
9852
1120484
A.
1.
2.
3.
4.
5.
B.
1.
2.
2011 2011 2011
447915
62379
261477
72612
42290
9157
303612
295062
8550
751527
89129
4547
53948
19680
9718
1236
279897
278821
1076
369026
537044
66926
315425
92292
52008
10393
583509
573883
9626
1120553

TABLE - 27.02DISTRICT-WISE NUMBER OF EMPLOYMENT EXCHANGES
IN ASSAM, 2012
313
N.B.: No Employment Exchange in Baksa and Chirang district.
1 2 3 4 5 6
----------1----------------
1
----------1-1--------1-----
3
District
22112321243422321211-5-1-11
49
General Special
EmploymentInformation& Guidance
Bureau(E.I.& G.B.)
EmploymentInformation& Assistance
Bureau(E.I.& A.B.)
11111112--12222321-1-1-2-1-
29
33223433246654553312-7-3-21
82
Total
KokrajharDhubriGoalparaBarpetaMorigaonNagaonSonitpurLakhimpurDhemajiTinsukiaDibrugarhSivasagarJorhatGolaghatKarbi AnglongDima HasaoCacharKarimganjHailakandiBongaigaonChirangKamrupKamrup MetroNalbariBaksaDarrangUdalguri
Assam

TABLE - 27.03EMPLOYMENT THROUGH EMPLOYMENT EXCHANGES
IN ASSAM, 2012
314
N.B.: No separate data available for Baksa and Chirang district.
1 2 3 4 5
District
46548170480699714003
1115275327180391293055692
1013710050
65104382939
7951411535654109
--3222010709
--63051860
179229
No. in LiveRegister
No.ofRegistration
No.ofVacanciesNotified
No. ofPlacement
4270874711394488050435409
1259157082237171365085305993341982138670864017424702601066134295602158634529
--323899
72760--
3450232745
1622729
4--5
106
66901215
160104137873328
932
1198
59--
161912--
17--
2632
--116--6
23--
2468302916
81525
7841--
1045--
13--
394
KokrajharDhubriGoalparaBarpetaMorigaonNagaonSonitpurLakhimpurDhemajiTinsukiaDibrugarhSivasagarJorhatGolaghatKarbi AnglongDima HasaoCacharKarimganjHailakandiBongaigaonChirangKamrup (Ghy)NalbariBaksaDarrangUdalguri
Assam

TABLE - 27.04REGISTRATION, PLACEMENT AND NUMBER IN LIVE
REGISTER BY LEVEL OF EDUCATION IN ASSAM, 2012
315
Engineering Graduates
Medical Graduates
Agriculture Graduates
Veterinary Graduates
Passed out I.T.I. Trainees (Total)
Engineering Trade
Non Engineering Trade
Post Graduates
Graduates
H.S.S.L.C./P.U.
H.S.L.C./Metric
Diploma Holders (Engineering)
Others
Total
Level of EducationNo.of
RegistrationNo. of
Placement
744
201
18
30
1998
--
--
1615
28274
62077
41557
3589
10524
150627
18
1
0
0
3
--
--
22
85
90
58
32
16
325
3656
546
897
301
16009
--
--
14489
272154
492854
545858
18174
47011
1411949
1 2 3 4
No. in LiveRegister
1.
2.
3.
4.
5.
(a)
(b)
6.
7.
8.
9.
10.
11.

TABLE - 27.05OCCUPATIONAL DISTRIBUTION OF APPLICANTS IN LIVE
REGISTER OF EMPLOYMENT EXCHANGES IN ASSAM
316
* Sales workers with Service.Source: (Table 27.01 to 27.05) Directorate of Employment & Craftsmen Training, Assam.
Professional and Technical
Administrative and Executive
Clerical and related Workers
Sales Workers
Service
Farmers, Fishermean, Hunting, Loggers and
Related Workers
Transport and Equipments Production and
Process Workers
Workers not Classified
Total
Applicants
35259
2136
13682
265
3461
106
31041
1643106
1729056
22060
4719
14064
5617*
--
42
21068
1555159
1622729
1 2 3
2011 2012
1.
2.
3.
4.
5.
6.
7.
8.

28.ENVIRONMENT

TABLE-AMBIENT AIR QUALITY (ANNUAL AVERAGE) AT GUWAHATI
(Based on 16th hrs. Daily Averge data under
1 2 3 4
BamunimaidanKhanapara, Central DairyITI Building, Gopinath NagarSantipur (Near Pragjyotish College)Boragaon (IASST campus)Gauhati University(Deptt of EnvSc campus)
Dibrugarh (Board's Office Building)Golaghat (Board's Office Building)Sivasagar (Board'soffice building)Tezpur (Board's Office Building)Silchar (Board's Office Building)Barpeta (Board's Office Building)Bongaigaon (Campus of Oil India Office)Darranga(BTAD,Near Sandoop Jhankar,Bhutan.Margherita (Coal India Complex Tinsukia)North Lakhimpur (Bazar Patti)Nagaon (WRD Campus, Christain Patty.)Usha Lodge (Near ONGC Colony, Sivasagar)Janiganj (Silchar)Digboi Carbon Factory Campus, Tinsukia.Shreepuria (Borguri, Tinsukia)Nalbari (PWD Rural Div Office Complex
National Standard for Residential areas
260246263259103124
10293
10310291
1001038096
10394
101949795
104
Station/Location
No.
of
obse
rvat
ion
(In
days
)
1.2.3.4.5.6.
1.2.3.4.5.6.7.8.9.10.11.12.13.14.15.16.
SO2
Range(Min-Max)
Mean
3.30-13.503.00-13.502.00-14.503.00-11.803.00-18.303.30-10.50
3.30-17.502.00-14.004.80-26.503.30-8.502.80-8.50
3.50-10.003.30-12.502.80-7.30
4.50-10.803.00-12.003.50-17.303.30-12.304.30-10.003.30-7.503.80-8.30
2.80-11.00
6.306.106.306.006.005.70
5.806.307.506.005.606.605.605.306.305.706.206.006.005.005.406.00
GUWAHATI
OTHER LOCATIONS
80
318
Parameters

28.01AND OTHER LOCATIONS IN ASSAM, 2012 (Jan to Dec)National Air Monitoring Programme)
(Figure in )μgm-3
5 6 7 8 9 10
106.3093.70
104.3094.0068.9084.00
56.1055.30
114.9069.3081.9044.7046.5056.5054.2071.5079.10
103.1099.4060.4052.9082.10
NO2
Range(Min-Max)
Mean
RSPM SPMRange
(Min-Max)Range
(Min-Max)MeanMean
14.7013.4015.2013.7014.0013.30
13.0013.8016.2013.3014.2014.7012.6013.2014.5014.2013.3013.0014.5011.6012.9015.00
68.00-714.0044.00-568.0052.50-718.0049.00-568.5038.50-315.0033.00-372.00
36.00-270.5026.00-334.0074.00-452.5038.00-405.0054.00-478.0027.00-112.5031.50-122.0037.30-417.7035.00-276.0035.00-333.5037.50-451.0052.50-607.5042.00-614.5034.50-241.0035.00-313.5041.00-411.50
210.00190.70211.00187.70130.90150.40
104.60117.70225.30142.90155.00
69.2072.40
110.80102.30137.30157.20214.20173.30113.10106.50160.50
80 100 200
28.00-396.0016.00-353.5016.50-346.5016.50-307.0015.50-183.5016.50-335.00
12.00-173.5012.00-147.5037.00-287.0010.50-203.0021.00-259.5020.00-67.5024.00-63.50
16.70-207.0015.50-180.5011.50-185.0020.00-228.5022.00-300.0020.50-400.0017.50-172.0017.50-172.5021.50-229.50
8.30-23.507.00-20.005.60-23.007.30-22.507.50-22.008.00-22.50
7.30-21.305.60-21.30
12.50-27.009.40-21.507.50-19.504.50-28.006.80-29.309.80-18.809.00-21.00
10.80-22.0011.30-22.508.90-24.809.10-21.309.50-14.509.80-18.809.40-23.30
319
Parameters

TABLE-WATER QUALITY OF THE TRIBUTARIES OF THE BRAHAMAPUTRA
(FROM JAN, 2012(Based on Quarterly
Station
Jhanji River at JorhatDhansiri River at GolaghatSubansiri River at GerukamukhDisang River at GudamghatBuridihing at MargheritaBhogdoi River at JorhatBharalu River at GuwahatiDigboi River at Lakhi-pathar Reserve ForestMora Bharali at TazpurDisang Bharali at DillighatKolong River at MorigaonManas River at NH-31 crossing BarpetaKharsang River before confluence withBuridihing near KharsangBuridihing near Duliajan at TinsukiaJia Bharali River near Biswanath CharialiPagladia River near Nalbari TownBorak River at PanchgramU/s of Kathakalat Matijuri HailakandiKundi River at SapakhowaBuridihing River at DuliajanDikhow River at Dikhow Bridge SivasagarKohora River at NH CrossingBoginadi River near Bridge at NH-52Ranga Nadi D/Sof Hydel ProjectPanchnai at NH-52, OrangKapili at Dharamtul BridgeKalongat D/S of ADP BridgeBeki at NH-37 cross at BarpetaSonkosh River at DhubriBorak at D/S of SilcharSonai River at SonaiKushiara at Karimganj
1 2 3
7.0-7.46.8-7.36.2-7.16.2-7.76.7-7.76.9-7.56.8-7.26.6-7.16.7-7.56.0-7.06.5-8.67.1-8.26.4-7.4
6.9-7.76.7-7.37.0-7.86.9-7.06.7-7.36.9-7.26.7-7.76.8-7.56.5-7.26.5-8.36.5-7.07.0-7.46.5-7.16.5-7.46.8-7.87.0-7.76.8-7.36.7-7.77.0-7.7
P HConductance( )
50-16489-21346-98
44-196114-26255-199
568-79994-33199-23687-19366-116
156-449111-228
89-26352-94
190-24551-16871-18087-19288-26369-24624-20163-10161-13180-13381-117
128-239102-171
43-8952-14829-13855-170
μm ho/cm
320
1.2.3.4.5.6.7.8.9.10.11.12.13.
14.15.16.17.18.19.20.21.22.23.24.25.26.27.28.29.30.31.32.
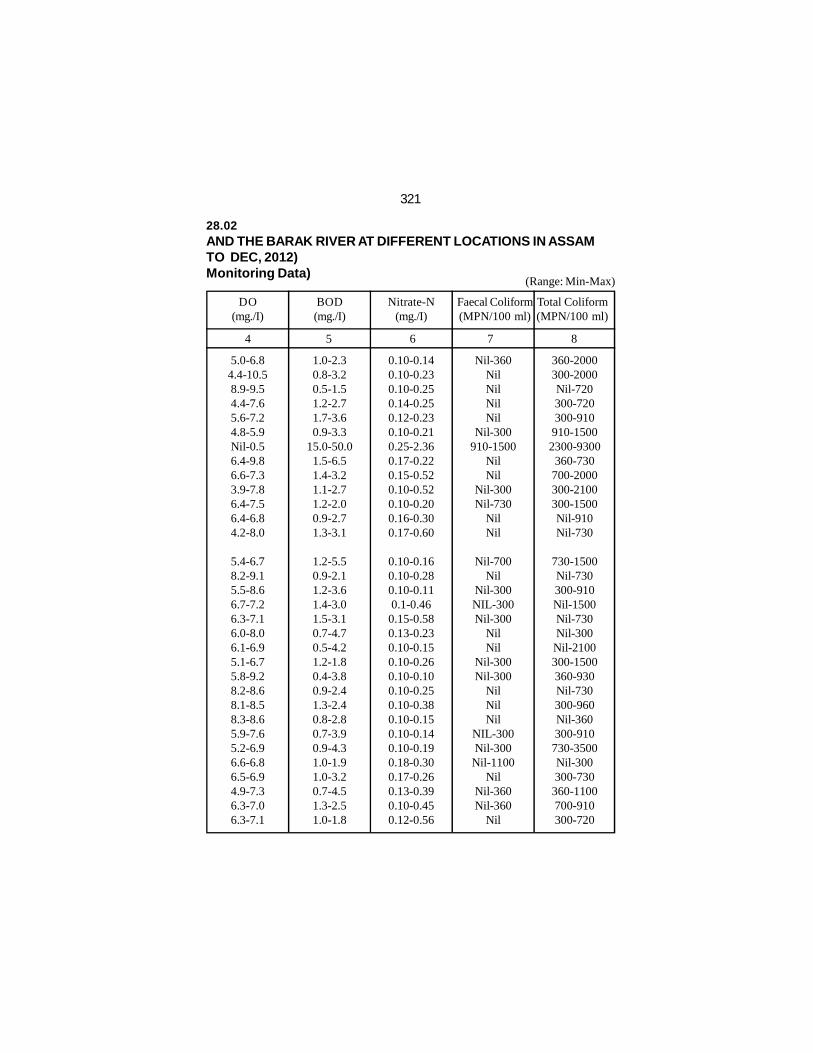
28.02AND THE BARAK RIVER AT DIFFERENT LOCATIONS IN ASSAMTO DEC, 2012)Monitoring Data)
(Range: Min-Max)
4 5 6 7 8
Nil-360NilNilNilNil
Nil-300910-1500
NilNil
Nil-300Nil-730
NilNil
Nil-700Nil
Nil-300NIL-300Nil-300
NilNil
Nil-300Nil-300
NilNilNil
NIL-300Nil-300
Nil-1100Nil
Nil-360Nil-360
Nil
360-2000300-2000Nil-720300-720300-910
910-15002300-9300360-730
700-2000300-2100300-1500Nil-910Nil-730
730-1500Nil-730300-910Nil-1500Nil-730Nil-300
Nil-2100300-1500360-930Nil-730300-960Nil-360300-910
730-3500Nil-300300-730
360-1100700-910300-720
5.0-6.84.4-10.58.9-9.54.4-7.65.6-7.24.8-5.9Nil-0.56.4-9.86.6-7.33.9-7.86.4-7.56.4-6.84.2-8.0
5.4-6.78.2-9.15.5-8.66.7-7.26.3-7.16.0-8.06.1-6.95.1-6.75.8-9.28.2-8.68.1-8.58.3-8.65.9-7.65.2-6.96.6-6.86.5-6.94.9-7.36.3-7.06.3-7.1
1.0-2.30.8-3.20.5-1.51.2-2.71.7-3.60.9-3.3
15.0-50.01.5-6.51.4-3.21.1-2.71.2-2.00.9-2.71.3-3.1
1.2-5.50.9-2.11.2-3.61.4-3.01.5-3.10.7-4.70.5-4.21.2-1.80.4-3.80.9-2.41.3-2.40.8-2.80.7-3.90.9-4.31.0-1.91.0-3.20.7-4.51.3-2.51.0-1.8
0.10-0.140.10-0.230.10-0.250.14-0.250.12-0.230.10-0.210.25-2.360.17-0.220.15-0.520.10-0.520.10-0.200.16-0.300.17-0.60
0.10-0.160.10-0.280.10-0.110.1-0.46
0.15-0.580.13-0.230.10-0.150.10-0.260.10-0.100.10-0.250.10-0.380.10-0.150.10-0.140.10-0.190.18-0.300.17-0.260.13-0.390.10-0.450.12-0.56
321
Faecal Coliform(MPN/100 ml)
DO(mg./I)
BOD(mg./I)
Nitrate-N(mg./I)
Total Coliform(MPN/100 ml)

TABLE-QUALITY OF WELL WATER AT DIFFERENT LOCATIONS
(Based on Half Yearly
Stations
DigboiKarbi AnglongSivasagarSivasagarJorhatSilcharBarpetaBongaigaonGuwahatiGuwahatiLedo, MargheritaNaziraNumaligarhSemenchapariSilapatharLakhimpur TownTezpur Mission CharialiNagaon, PanigaonJagiroad near HPCGarchuk near MSW dumping site, GuwahatiNalbariBarpeta RoadDhaligaon near BRPLKokrajhar HS SchoolDhubri College NagarGoalpara CollegeDiphu Govt. CollegeHaflongKarimganj (College)Hailakandi near ASTC bus standPanchgram market near Cachar paper Mill
1 2 3
6.1-7.96.1-6.86.3-6.46.9-7.56.1-6.96.6-7.47.0-7.86.0-7.16.7-6.86.9-7.35.0-6.07.1-7.26.2-6.86.2-7.16.2-7.06.0-7.16.0-6.36.6-7.06.5-6.96.7-6.86.6-7.26.9-7.96.8-7.26.1-7.96.4-7.57.3-7.37.1-7.97.0-7.16.5-6.66.2-7.06.5-7.2
P HConductance
( )
443-467201-286326-351328-374195-306428-525524-800211-282219-556630-833250-315232-308117-223227-235218-22751-263120-136796-903266-463220-266226-290529-812138-301162-430354-426224-350845-88888-183175-30293-122423-481
μmho/cm
322
1.2.3.4.5.6.7.8.9.10.11.12.13.14.15.16.17.18.19.20.21.22.23.24.25.26.27.28.29.3031.
Parametre

28.03IN ASSAM (FROM JAN TO DEC, 2012)Monitoring Data)
(Range: Min-Max)
4 5 6 7 8
NilNilNilNilNilNilNilNilNilNilNilNilNilNilNilNilNilNilNilNilNilNilNilNilNilNilNilNilNilNilNil
Faecal Coliform(MPN/100 ml)
NilNilNilNilNilNilNilNilNilNilNilNil
Nil-910NilNilNilNilNilNilNilNilNil
Nil-730NilNilNil
Nil-700Nil-360
NilNilNil
DO(mg./I)
BOD(mg./I)
Nitrate-N(mg./I)
Total Coliform(MPN/100 ml)
3.5-4.53.5-5.04.5-5.83.5-4.55.4-5.45.2-5.33.6-5.66.0-6.12.0-6.62.1-3.44.5-4.54.6-5.44.2-5.23.8-4.54.2-5.44.2-5.44.5-4.82.9-9.74.5-7.21.5-4.54.2-6.13.3-6.16.0-6.44.5-5.32.0-2.85.4-6.14.0-4.26.7-6.86.0-7.16.1-6.16.0-6.1
0.6-1.90.4-1.11.5-3.91.3-2.30.2-2.91.5-3.51.4-2.61.7-2.50.5-0.71.4-4.80.3-3.00.7-0.91.9-2.10.8-1.11.8-1.90.6-1.50.5-0.91.1-4.81.8-3.51.3-1.60.8-1.01.1-2.20.5-1.01.5-3.10.6-2.60.7-4.80.9-1.70.7-1.00.5-5.40.5-0.91.3-2.0
0.10-0.300.10-0.100.20-0.400.10-0.300.10-0.100.10-0.300.10-0.100.10-1.000.10-0.600.10-0.100.10-0.130.10-0.100.10.0.130.10-0.110.10-0.100.11-1.100.10-0.700.10-0.100.10-0.100.10-0.100.10-0.750.10-0.700.10-0.220.10-0.200.12-0.120.10-0.750.13-1.670.10-0.100.22-0.220.10-0.110.10-0.10
323

TABLE-WATER QUALITY OF BEELS/ PONDS/ TANK AT DIFFERENT
(Based on Quarterly
Parameters/Stations
Elenga Beel at Jagiroad
Deepar Beel at Guwahati
Joysagar Tank at Sivasagar
Mer Beel at Madhabpur
Daloni Beel at Jogighopa
Bor Beel at Jakai
Borpukhuri at Nazira
Gaurisagar Tank at Gaurisagar
Rajmao Pukhuri at Jorhat
Padum Pukhuri at Tezpur
Gohpur Tank at Gohpur
Jaipal Pukhuri at Sipajhar
Botodrowa Satra Pond at Nagaon
Saran Beel at Morigaon
Dighali Pukhuri at Guwahati
Soubhagya Pond at Kamakhya
Deepar Beel near IASST
Bishnu Puskar Pukhuri at Hajo
Chandubi Beel at Chanddubi
Ganga pukhuriat Nalbari
Rajadinia Pukhuri at Abhayapuri
Mahamaya Mandir pukhuri
Rajapukhuri at Gauripur
Baskandi Pond at Baskandi
Sivasagar Tank
Hordoi Pukhuri at Charaidew
Gelabeel at Dergaon
1 2 3
8.5-12.0
6.7-7.2
6.3-7.0
6.2-7.0
6.5-8.2
6.4-6.6
6.7-7.4
6.3-7.2
6.7-7.4
7.2-8.5
6.7-7.2
6.3-7.4
6.4-7.2
6.4-7.9
6.7-9.0
6.7-7.2
6.7-7.4
7.2-8.5
6.2-7.5
6.7-7.3
6.9-8.2
7.0-7.5
7.0-8.0
6.9-7.6
6.1-7.1
6.2-7.0
6.6-7.2
P HConductance
( )
1016-4510
134-211
20-20
83-105
71-295
84-125
22-40
20-21
68-88
215-332
94-146
20-27
20-33
67-256
136-245
325-492
181-439
101-311
23-47
37-62
20-120
64-131
69-79
81-254
20-23
20-35
56-214
μmho/cm
324
1.
2.
3.
4.
5.
6.
7.
8.
9.
10.
11.
12.
13.
14.
15.
16.
17.
18.
19.
20.
21.
22.
23.
24.
25.
26.
27.

28.04LOCATIONS IN ASSAM (FROM JAN TO DEC, 2012)Monitoring Data)
(Range: Min-Max)
4 5 6 7 8
Nil-910
300-1100
700-1400
360-1500
300-2100
Nil-910
300-1100
360-910
700-1100
Nil-730
300-1100
300-1500
360-910
360-1500
Nil-1500
1100-2800
730-2800
300-1500
300-2100
360-1500
360-930
360-910
333-1100
Nil-2100
300-2100
360-730
730-910
Nil
Nil-360
Nil
Nil
Nil-360
Nil-360
Nil
Nil
Nil-300
Nil-300
Nil
Nil
Nil
Nil-300
Nil-720
360-2100
Nil-360
Nil-360
Nil
Nil-360
Nil-360
Nil-360
Nil
Nil-910
Nil-300
Nil
Nil
Nil-5.2
2.2-7.9
5.3-7.2
4.0-9.6
5.8-6.4
5.5-7.7
5.5-6.7
5.6-7.4
4.7-7.6
8.9-10.0
8.0-8.6
7.8-8.6
6.9-7.8
4.9-7.9
5.4-14.4
3.8-16.0
1.0-7.3
5.3-8.5
6.7-7.9
4.9-8.0
5.4-6.8
4.8-6.8
5.2-6.8
6.1-7.3
4.8-6.6
5.2-7.5
4.0-7.0
14.6-25.0
2.2-4.4
2.0-2.8
3.6-5.6
3.6-6.8
3.5-4.8
1.2-5.6
1.8-4.8
1.2-6.8
2.6-14.6
2.2-9.0
4.0-8.0
3.0-3.8
1.6-4.3
7.2-14.4
4.0-8.8
3.2-7.6
0.5-10.2
1.2-4.2
2.1-7.4
1.4-11.8
3.2-6.1
5.7-13.6
1.2-5.0
2.1-3.6
1.8-3.2
1.6-3.8
0.11-1.65
0.10-0.21
0.10-0.19
0.10-0.40
0.14-0.50
0.10-0.45
0.10-0.29
0.10-0.18
0.10-0.10
0.21-0.80
0.14-1.50
0.10-0.21
0.10-0.21
0.12-0.20
0.13-1.71
0.11-1.40
0.10-0.27
0.10-0.27
0.10-0.15
0.10-0.28
0.10-0.17
0.10-0.58
0.12-0.19
0.11-0.69
0.10-0.15
0.10-0.15
0.10-0.28
325
Faecal Coliform(MPN/100 ml)
DO(mg./I)
BOD(mg./I)
Nitrate-N(mg./I)
Total Coliform(MPN/100 ml)

TABLE - 28.05WATER QUALITY OF THE BRAHMAPUTRA RIVER ATDIFFERENT LOCATIONS (from Jan 2012 to Dec, 2012)
(Based on Monthly/quarterly Monitoring Data)(Range: Min-Max)
Parameters/Station
Brahmaputra River
At Maijan
At Balijan
At Nimatighat
At Dhenukhanapahar
At Chandrapur
At Kacharighat
At Pandu
At Sualkuchi
At Jogighopa
At Dhubri
6.8-7.6
6.9-7.6
6.7-7.8
6.8-7.7
7.0-7.7
7.0-8.0
6.6-7.8
6.9-7.3
7.1-8.1
7.2-7.6
PH
1 2 3 4 5 6 7 8
360-2800
360-1500
300-2300
Nil-2000
300-700
700-1400
700-2000
720-910
720-1500
360-1100
Con
duct
ance
(
)
DO
(mg.
/I)
BO
D(m
g./I
)
Nit
rate
-N(m
g./I
)
Tota
l Col
ifor
m(M
PN
/100
ml)
Faec
al C
olif
orm
(MP
N/1
00 m
l)
83-222
76-198
85-210
79-253
73-359
101-205
95-224
101-210
85-234
67-198
5.7-9.1
4.2-10.8
5.4-7.7
7.8-8.7
5.5-8.0
6.7-8.2
5.5-8.8
6.6-8.5
5.6-6.9
6.5-7.2
0.7-3.1
0.6-2.6
0.6-2.5
0.4-3.6
0.8-1.0
1.3-2.8
0.9-2.1
0.5-0.9
0.8-2.0
0.7-2.6
0.10-0.21
0.11-0.27
0.10-2.10
0.10-0.22
0.10-0.31
0.16-0.46
0.10-0.21
0.10-0.14
0.10-0.30
0.10-0.22
Nil-700
Nil-730
Nil-910
Nil-360
Nil
Nil-360
Nil-360
Nil
Nil
Nil-360
326
Source: (Table 28.01 to 28.05) Pollution Control Board, Assam.

30.MISCELLANEOUS29.MISCELLANEOUS

328TABLE - 29.01
COMPOSITE INDEX OF BACKWARDNESS OF THE DISTRICTSOF ASSAM
Note: Rank: Most Backward-1, Least Backward- 23, 24 and 25 respectively, for the year 2009-2010 ,2010-2011 and 2011-2012.
Source: Directorate of Economics and Statistics, Assam.
Districts
2
1
5
3
7
10
12
13
8
4
11
15
9
6
17
18
7
10
22
16
14
13
21
19
20
21
23
7.3
8.6
9.3
8.8
10.2
12.0
11.3
12.7
12.5
9.4
17.2
12.7
12.1
9.3
13.5
14.1
9.9
15.4
16.5
13.3
13.1
13.1
17.3
14.4
18.6
19.3
18.2
1 2 3 4 5 6 7
3
4
2
9
1
12
8
15
14
7
19
10
11
6
17
21
5
23
20
13
18
16
22
16
25
24
24
8.7
7.7
10.6
9.6
11.1
12.1
12.3
13.2
11.2
10.5
12.2
13.9
11.3
11.0
14.6
14.7
11.1
12.1
18.3
14.0
13.7
13.2
16.5
14.8
15.3
16.5
21.0
1
2
4
3
7
9
8
12
11
5
20
12
10
4
15
16
6
18
19
14
13
13
21
17
23
24
22
2011-20122009-2010 2010-2011
CompositeIndex
Rank CompositeIndex
Rank CompositeIndex
Rank
8.4
9.1
8.3
12.0
7.7
13.1
11.1
14.2
13.8
11.0
15.3
12.1
12.3
10.8
14.6
16.1
10.5
18.1
15.7
13.7
14.7
14.5
17.6
14.5
20.1
19.3
19.3
Dhemaji
Udalguri
Chirang
Dhubri
Karbi-Anglong
Morigaon
Sonitpur
Lakhimpur
Nagaon
Baksa
Darrang
Goalpara
Bongaigaon
Kokrajhar
Hailakandi
Golaghat
Tinsukia
Barpeta
Kamrup
Cachar
Karimganj
Dima-Hasao
Kamrup Metro
Dibrugarh
Jorhat
Nalbari
Sivasagar

Source: The Principal Chief Conservator of Forest (Wildlife), Assam.
TABLE - 29.02REVENUE COLLECTION REGARDING ARRIVAL OF TOURIST
IN NATIONAL PARKS IN ASSAM
Name of National Park
1 2 3 4 5
No. of Visitors
Kaziranga National Park
Manas National Park
Orang National Park
Dibru-Saikhowa National
Park
Nameri National Park
7447
7521
7418
503
237
218
180
159
70
40
42
19
352
457
528
Revenue(in Lakh)
136.73
149.46
205.76
14.67
24.17
25.48
1.82
2.45
2.76
0.56
0.90
1.08
2.72
3.51
4.54
YearIndian Foreign
2010-11
2011-12
2012-13
2010-11
2011-12
2012-13
2010-11
2011-12
2012-13
2010-11
2011-12
2012-13
2010-11
2011-12
2012-13
112392
117308
93747
10843
19705
15890
1702
2678
1847
2351
3970
2656
4460
5601
4370
1.
2.
3.
4.
5.
329
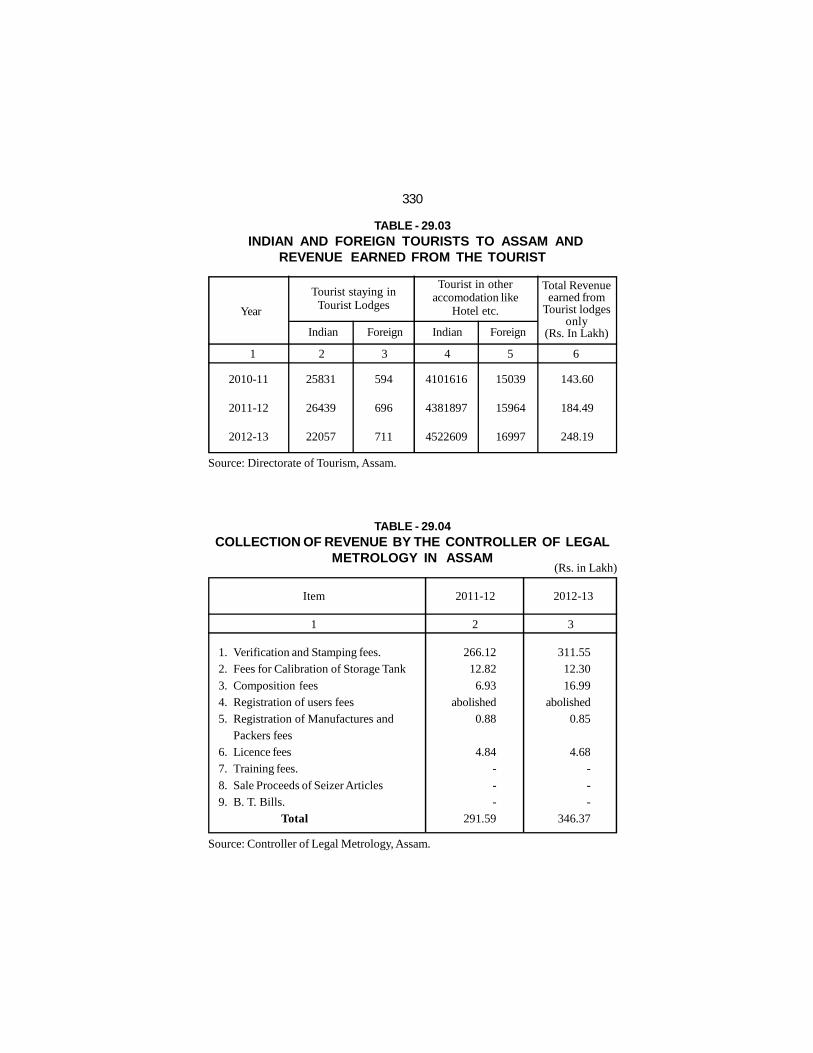
TABLE - 29.03 INDIAN AND FOREIGN TOURISTS TO ASSAM AND
REVENUE EARNED FROM THE TOURIST
330
Source: Controller of Legal Metrology, Assam.
Source: Directorate of Tourism, Assam.
TABLE - 29.04COLLECTION OF REVENUE BY THE CONTROLLER OF LEGAL
METROLOGY IN ASSAM(Rs. in Lakh)
1 2 3 4 5 6
Year
Tourist in otheraccomodation like
Hotel etc.
Total Revenueearned from
Tourist lodgesonly
(Rs. In Lakh)
Tourist staying inTourist Lodges
Indian Foreign Indian Foreign
Item
1 2 3
2011-12
Verification and Stamping fees.Fees for Calibration of Storage Tank
Composition feesRegistration of users feesRegistration of Manufactures andPackers feesLicence feesTraining fees.
Sale Proceeds of Seizer ArticlesB. T. Bills.
Total
2012-13
266.1212.82
6.93abolished
0.88
4.84-
--
291.59
1.2.
3.4.5.
6.7.
8.9.
2010-11
2011-12
2012-13
25831
26439
22057
594
696
711
4101616
4381897
4522609
15039
15964
16997
143.60
184.49
248.19
311.5512.30
16.99abolished
0.85
4.68-
--
346.37
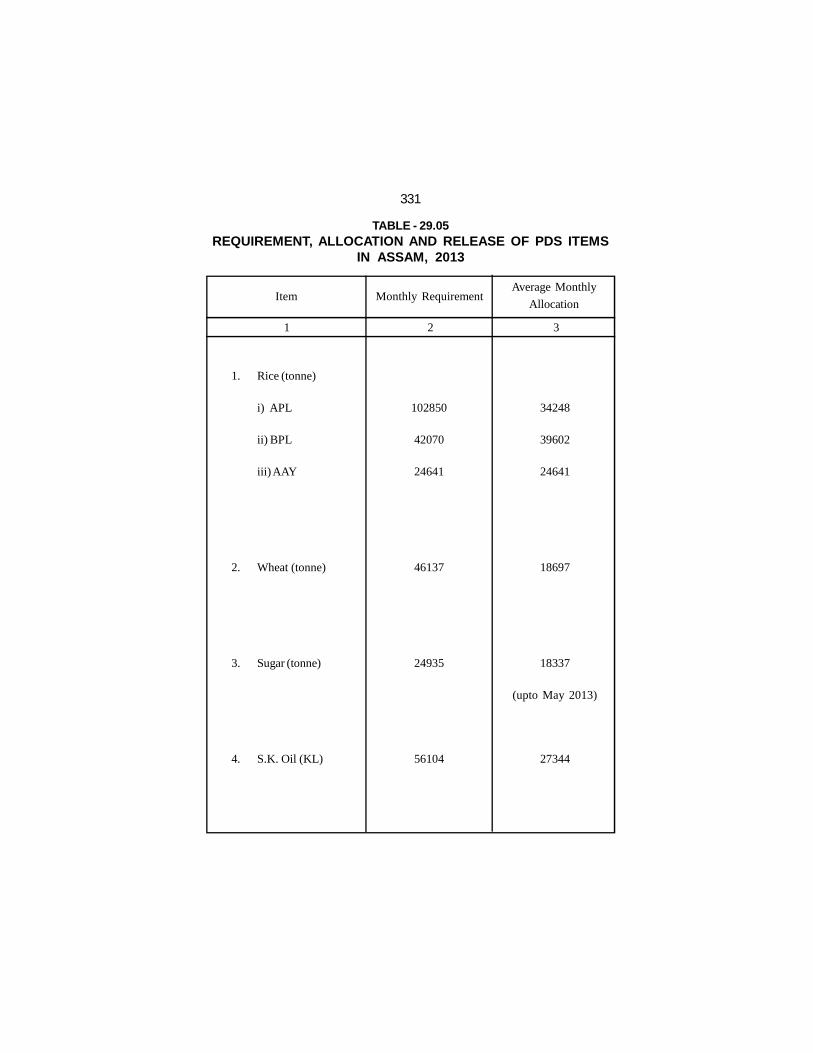
TABLE - 29.05REQUIREMENT, ALLOCATION AND RELEASE OF PDS ITEMS
IN ASSAM, 2013
331
Rice (tonne)
i) APL
ii) BPL
iii) AAY
Wheat (tonne)
Sugar (tonne)
S.K. Oil (KL)
1.
2.
3.
4.
Item Monthly RequirementAverage Monthly
Allocation
1 2 3
102850
42070
24641
46137
24935
56104
34248
39602
24641
18697
18337
(upto May 2013)
27344
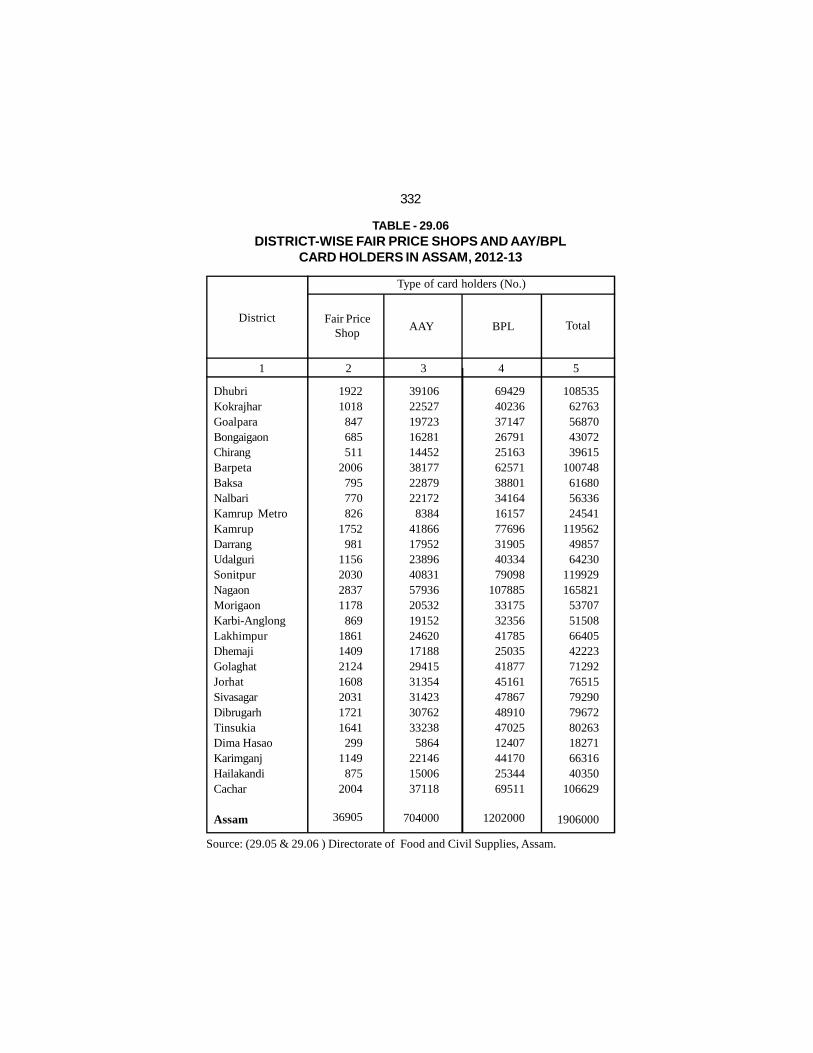
TABLE - 29.06DISTRICT-WISE FAIR PRICE SHOPS AND AAY/BPL
CARD HOLDERS IN ASSAM, 2012-13
Source: (29.05 & 29.06 ) Directorate of Food and Civil Supplies, Assam.
DistrictBPLAAY
DhubriKokrajharGoalparaBongaigaonChirangBarpetaBaksaNalbariKamrup MetroKamrupDarrangUdalguriSonitpurNagaonMorigaonKarbi-AnglongLakhimpurDhemajiGolaghatJorhatSivasagarDibrugarhTinsukiaDima HasaoKarimganjHailakandiCachar
Assam
Type of card holders (No.)
Total
1 2 3 4 5
Fair PriceShop
332
19221018
847685511
2006795770826
1752981
1156203028371178
8691861140921241608203117211641
2991149
8752004
36905
3910622527197231628114452381772287922172
83844186617952238964083157936205321915224620171882941531354314233076233238
5864221461500637118
704000
69429402363714726791251636257138801341641615777696319054033479098
10788533175323564178525035418774516147867489104702512407441702534469511
1202000
10853562763568704307239615
100748616805633624541
1195624985764230
119929165821
537075150866405422237129276515792907967280263182716631640350
106629
1906000

TABLE - 29.07DISTRICT WISE NUMBER OF FIRE SERVICE STATIONS AND
FIRE ACCIDENTS IN ASSAM 2012
333
Source: State Fire Service Organization, Assam.
District
FirePerson
(in Nos.)
1 2 3 4 5 6 7 8
Fire Station
Station
Populationcovered byFire Station(in Lakh)
Fire Accident
No. ofAccident
(FireCalls)
Value ofProperty
Lost (Rs. inLakh)
No. ofHumanlife lost
KokrajharDhubriGoalparaBarpetaMorigaonNagaonSonitpurLakhimpurDhemajiTinsukiaDibrugarhSibsagarJorhatGolaghatKarbi AnglongDima HasaoCacharKarimganjHailakandiBongaigaonChirangKamrup (R)Kamrup (M)NalbariBaksaDarrangUdalguri
Assam
9191017102819107
1313121111102
1212775
15138
1098
307
27353
11633434543384222764132
110
43121499249
214106615981757192755560
16187464927
12717670175836
2157
14-4--5---3-------1---6----
24
111342752371457717351
7936
133233143
18729525
346101
589751
248765266
1202
49
7883
23-6-
1210
-16-134-212---2
18---4
77
No. ofInjured
4011044
11597
321205351982
10153
1381241532
16238603218
14542483
19822
2614

TABLE - 29.08DISTRICT WISE STATISTICS OF WAREHOUSING CENTRES
IN ASSAM, 2012-2013
334
Source: Assam State Warehousing Corporation.
(Capacity in M.T.)
Name ofDistrict
Capacity
Own Const Temp Shed Hired Godown Total
1 2 3 4 5
KokrajharDhubriGoalparaBarpetaMorigaonNagaonSonitpurLakhimpurDhemajiTinsukiaDibrugarhSivasagarJorhatGolaghatKarbi AnglongDima HasaoCacharKarimganjHailakandiBongaigaonChirangKamrupKamrup MetroNalbariBaksaDarrangUdalguri
Assam
2000-
14451--
3564355004877
1163212406
575010140
-50006032
-58003650
-22100
-5950
46639--
75606600
211730
-
175--
770----
160--
170--
310--
1125--
146----
2866
---
5481-
1269------
662---
3580875
----
21864--
330-
34061
2000-
146265481
-37682
55004877
1163212406
591010140
66251706032
-96904525
-23225
-5950
68649--
78906600
248647

TABLE - 29.09STATISTICS OF PUBLIC LIBRARIES IN ASSAM
335
Contd...
Ave
rage
dai
lyre
adin
gre
spon
se (
No.
of P
erso
ns)
Name of Public Library
Boo
ks u
p to
31-3
-201
2(N
os.)
New
Boo
ksA
dded
dur
ing
2012
-13
1 2 3 4 5 6
Reg
iste
red
mem
ber
up t
o31
-3-2
013
Sl.No.
1
2
3
4
5
6
7
8
9
10
11
12
13
14
15
16
17
18
19
20
Ref. Section, Directorate of
Library Services, Assam
Dispur Branch Library, Dispur,
Guwahati-6
Bishnu Nirmala Children Library,
Guwahati-1
Nabin Chandra Bordoloi Hall
Library, Guwahati-1
District Library, Guwahati
District Library, Dibrugarh
District Library, Karimganj
District Library, Goalpara
District Library, Sivasagar
District Library, Kokrajhar
District Library, Bongaigaon
District Library,Golaghat
District Library, Diphu
District Library, Haflong
District Library, Silchar
District Library, N. Lakhimpur
District Library, Mangaldoi
District Library, Nalbari
District Library, Jorhat
District Library, Tezpur
100816
43182
13285
25612
89615
101715
46410
60220
60818
61801
8066
56876
68840
80204
68666
94057
55062
61652
126753
64984
NIL
4080
549
1055
1165
1123
4431
3000
2804
-
643
1205
2702
2634
3127
2344
3658
3038
4715
1730
24
25
40
48
61
25
35
55
70-75
37
45
62
24
46
16
57
65
70
80
55
NO
3206
2914
Does not arise
37253
11850
2914
3527
8042
4834
324
6016
4647
2759
7950
10755
8576
5574
18359
15448
Source: Directorate of Library Services, Assam.

(...Contd) TABLE - 29.09
336
Ave
rage
dai
lyre
adin
gre
spon
se (
No.
of P
erso
ns)
Name of Public Library
Boo
ks u
p to
31-3
-201
2(N
os.)
New
Boo
ksA
dded
dur
ing
2012
-13
1 2 3 4 5 6
Reg
iste
red
mem
ber
up t
o31
-3-2
013
Sl.No.
21
22
23
24
25
26
27
28
29
30
31
32
33
34
35
36
37
38
39
40
41
42
43
44
District Library,Nagaon
District Library, Dhubri
District Library, Barpeta
District Library, Morigaon
District Library, Dhemaji
District Library, Tinsukia
District Library, Hailakandi
Sub-Div. Library, Pragjyotishpur
Sub-Div. Library, Rangia
Sub-Div. Library, Hojai
Sub-Div. Library, Udalguri
Sub-Div. Library, B. Chariali
Sub-Div. Library, Jonai
Sub-Div. Library, Majuli
Sub-Div. Library, Sodia
Sub-Div. Library Sarupathar
Sub-Div. Library,Hamren
Sub-Div. Library, S. Salmara
Sub-Div. Library, N. Salmara
Sub-Div. Library, Charaideo
Sub-Div. Library, Gossaigaon
sub -Div.Library, Tamulpur
Distrrict Library, Chirang
Disrict Library. Baksa
104723
85339
57908
44217
43519
58883
41454
12088
18564
17143
19000
21600
26818
19637
16114
11807
18510
15455
12000
22382
12538
5241
2824
1265
3147
1435
5471
2308
2255
3495
1138
-
2042
528
3000
1163
804
1243
417
1069
260
1500
5000
3864
1000
1000
467
557
50%
35
105
100
30
24
35
45%
9
22
30
15
45
36
19
26
12
20
40%
30
15
30
16
20
15317
7364
5964
4934
4059
5088
2708
467
2219
1061
980
2247
1766
1054
1779
1150
960
546
1078
2035
707
798
NIL
NIL

30.INTER STATECOMPARISON
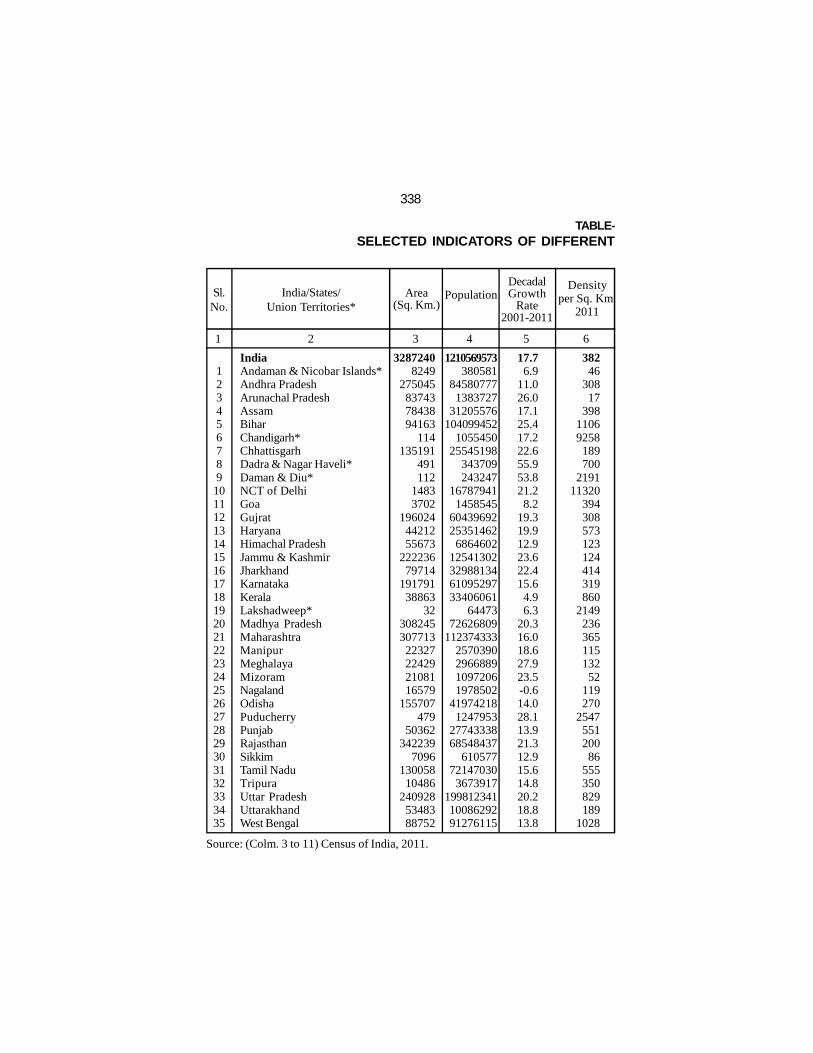
TABLE-SELECTED INDICATORS OF DIFFERENT
338
DecadalGrowth
Rate2001-2011
India/States/Union Territories*
Area(Sq. Km.)
Population
32872408249
275045837437843894163
114135191
491112
14833702
1960244421255673
22223679714
19179138863
3230824530771322327224292108116579
155707479
50362342239
709613005810486
2409285348388752
1 2 3 4 5 6
Densityper Sq. Km.
2011
Sl.No.
123456789
1011121314151617181920212223242526272829303132333435
IndiaAndaman & Nicobar Islands*Andhra PradeshArunachal PradeshAssamBiharChandigarh*ChhattisgarhDadra & Nagar Haveli*Daman & Diu*NCT of DelhiGoaGujratHaryanaHimachal PradeshJammu & KashmirJharkhandKarnatakaKeralaLakshadweep*Madhya PradeshMaharashtraManipurMeghalayaMizoramNagalandOdishaPuducherryPunjabRajasthanSikkimTamil NaduTripuraUttar PradeshUttarakhandWest Bengal
1210569573380581
845807771383727
31205576104099452
105545025545198
343709243247
167879411458545
6043969225351462
686460212541302329881346109529733406061
6447372626809
1123743332570390296688910972061978502
419742181247953
2774333868548437
61057772147030
36739171998123411008629291276115
17.76.9
11.026.017.125.417.222.655.953.821.28.2
19.319.912.923.622.415.64.96.3
20.316.018.627.923.5-0.614.028.113.921.312.915.614.820.218.813.8
38246
30817
39811069258
189700
219111320
394308573123124414319860
214923636511513252
119270
254755120086
555350829189
1028
Source: (Colm. 3 to 11) Census of India, 2011.

30.01STATES/ UNION TERRITORIES OF INDIA
339
Contd...
Sex Ratio(per 1000
male)2011
ChildSex Ratio(0-6 agegroup)2011
943876993938958918818991774618868973919879972889949973
1084947931929992989976931979
1037895928890996960912963950
Literacy rate (2011)
Male FemalePerson
919968939972962935880969926904871942890834909862948948964911918894936970970943941967846888957943957902890956
80.8990.2774.8872.5577.8571.2089.9980.2785.1791.5490.9492.6585.7584.0689.5376.7576.8482.4796.1195.5678.7388.3886.0675.9593.3582.7581.5991.2680.4479.1986.5586.7791.5377.2887.4081.69
64.6482.4359.1557.7066.2751.5081.1960.2464.3279.5580.7684.6669.6865.9475.9356.4355.4268.0892.0787.9559.2475.8772.3772.8989.2776.1164.0180.6770.7352.1275.6173.4482.7357.1870.0170.54
72.9986.6367.0265.3872.1961.8086.0570.2876.2487.1086.2188.7078.0375.5582.8067.1666.4175.3694.0091.8569.3282.3479.2174.4391.3379.5572.8785.8575.8466.1181.4280.0987.2267.6878.8276.26
Sl.No.
123456789
1011121314151617181920212223242526272829303132333435
7 8 9 10 11 12 13 14 1
UrbanPopula-
tion2011(%)
SCPopula-
tion2011(%)
STPopula-
tion 2011(% )
31.237.733.422.914.111.397.323.246.775.297.562.242.634.910.027.424.038.747.778.127.645.232.520.152.128.916.768.337.524.925.248.426.222.330.231.9
16.60.0
16.40.07.2
15.918.912.8
1.82.5
16.81.76.7
20.225.2
7.412.117.1
9.10.0
15.611.8
3.80.60.10.0
17.115.731.917.8
4.620.017.820.718.823.5
8.67.57.0
68.812.41.30.0
30.652.06.30.0
10.214.80.05.7
11.926.27.01.5
94.821.19.4
35.186.194.486.522.80.00.0
13.533.81.1
31.80.62.95.8

(...Contd) TABLE-
340
Source: (Colm. 12 to 18) Census of India, 2011.
1 2 15 16 17 18
LatrinFacilities
46.660.643.241.154.850.186.219.052.676.478.479.764.066.555.548.223.244.577.783.723.959.416.124.131.229.322.477.485.935.052.634.937.151.958.338.6
46.970.149.662.064.923.187.624.654.878.289.579.757.468.669.151.222.051.295.297.828.853.189.362.991.976.522.068.579.335.087.248.386.035.765.858.9
67.286.192.265.737.016.498.475.395.299.199.196.990.490.596.885.145.890.694.499.767.183.968.360.984.281.643.097.796.667.092.593.468.436.887.054.5
Drinkingwaterwithin
premisesElectricity
Households(Nos.)
India/States/Union Territories*
Sl.No.
123456789
1011121314151617181920212223242526272829303132333435
IndiaAndaman & Nicobar Islands*Andhra PradeshArunachal PradeshAssamBiharChandigarh*ChhattisgarhDadra & Nagar Haveli*Daman & Diu*NCT of DelhiGoaGujratHaryanaHimachal PradeshJammu & KashmirJharkhandKarnatakaKeralaLakshadweep*Madhya PradeshMaharashtraManipurMeghalayaMizoramNagalandOdishaPuducherryPunjabRajasthanSikkimTamil NaduTripuraUttar PradeshUttarakhandWest Bangal
24945425294551
21022588270577
640647118913565
2411735650724
7645860956
3435999343611
122484284857524148328021197186254781
133570277853754
115741509325624421519
510448548059222853396002
9637820302450
551307112711146
12900618524982
85555633448035
205697520380315
Percentage of Households having

30.01
341
Contd...
Population Below Poverty Line (%)(using Tendulkar Methodology) 2011-12
25.701.57
10.9638.9333.8934.06
1.6444.6162.59
0.0012.92
6.8121.5411.64
8.4811.5440.8424.53
9.140.00
35.7424.2238.8012.5335.4319.9335.6917.06
7.6616.05
9.8515.8316.5330.4011.6222.52
19 20 21 22 23 24 1
13.700.005.81
20.3320.4931.2322.3124.7515.3812.629.844.09
10.1410.284.337.20
24.8315.254.973.44
21.009.12
32.599.266.36
16.4817.296.309.24
10.693.666.547.42
26.0610.4814.66
21.921.009.20
34.6731.9833.7421.8139.9339.319.869.915.09
16.6311.168.06
10.3536.9620.917.052.77
31.6517.3536.8911.8720.4018.8832.599.698.26
14.718.19
11.2814.0529.4311.2619.98
Rural Urban Combined Male Female
Sl.No.
123456789
1011121314151617181920212223242526272829303132333435
Expectation of Lifeat Birth, 2006-10
MaternalMortality
Ratio (MMR)2010-12
64.6-
63.5-
61.065.5
------
64.967.067.769.2
-64.971.5
-61.167.9
----
62.2-
67.464.7
-67.1
-61.8
-67.4
178NA110NA328219NA
-NANANANA122146NANA
-144
66NA230
87NANANANA235NA155255NA
90NA292
-117
N.B.: In MMR Bihar with Jharkhand, Madhya Pradesh with Chhattisgarh & Uttar Pradesh with Uttara Khand. NA- Not Available.Source: (i) Planning Commission of India, (ii) Office of the Registrar General of India.
67.7-
68.2-
63.266.2
------
69.069.572.471.1
-69.776.9
-63.871.9
----
63.9-
71.668.3
-70.9
-63.7
-71.0
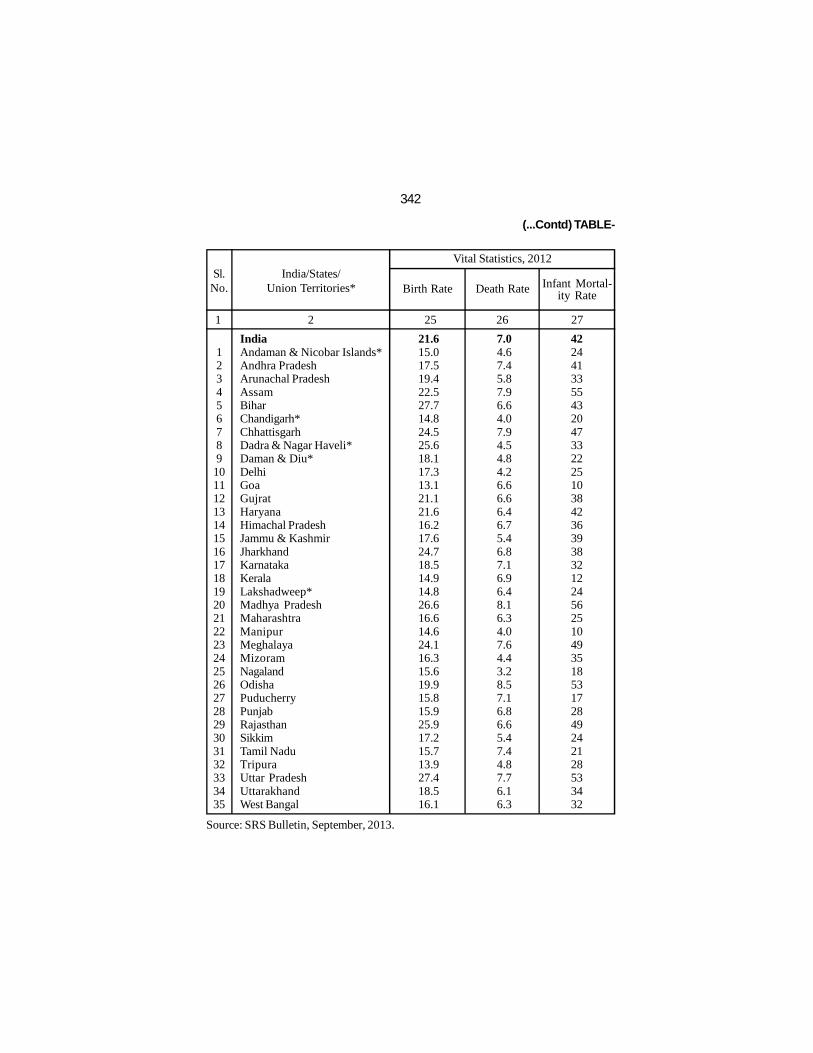
(...Contd) TABLE-
342
Source: SRS Bulletin, September, 2013.
Infant Mortal-ity Rate
Birth Rate Death Rate
21.615.017.519.422.527.714.824.525.618.117.313.121.121.616.217.624.718.514.914.826.616.614.624.116.315.619.915.815.925.917.215.713.927.418.516.1
1 2 25 26 27
7.04.67.45.87.96.64.07.94.54.84.26.66.66.46.75.46.87.16.96.48.16.34.07.64.43.28.57.16.86.65.47.44.87.76.16.3
422441335543204733222510384236393832122456251049351853172849242128533432
Vital Statistics, 2012India/States/
Union Territories*Sl.
No.
123456789
1011121314151617181920212223242526272829303132333435
IndiaAndaman & Nicobar Islands*Andhra PradeshArunachal PradeshAssamBiharChandigarh*ChhattisgarhDadra & Nagar Haveli*Daman & Diu*DelhiGoaGujratHaryanaHimachal PradeshJammu & KashmirJharkhandKarnatakaKeralaLakshadweep*Madhya PradeshMaharashtraManipurMeghalayaMizoramNagalandOdishaPuducherryPunjabRajasthanSikkimTamil NaduTripuraUttar PradeshUttarakhandWest Bangal

30.01
343
N.B.- (Col-28 to Col-35) Reference period for Jammu & Kashmir (01-01-2008), UttaraKhand (01-01-2009), Haryana (01-01-2010), Uttar Pradesh (01-01-2011), Jharkhand(31-12-2011), Manipur, Sikkim, A&N Island, D&N Haveli and Lakshadeep (01-01-2012) and all others (01-01-2013).Source: Directorate General of State Health Services. Contd...
28 29 30 31 32 33 34 35
Rural Hospitals(Govt.)
Urban Hospitals(Govt.)
Total Hospitals(Govt.)
2660431
308382985565
-1903
1--8
14766198
1402545423
10913
1157309217
291221
16592798
204130
161418
515666
1272
362996625
10370466064145442
-5842
50--
18001806212122911342848799022
13097120
694210384
664870270630
7099178
300025620
730129351170
154503746
19285
88121
1522
35106
5120
14
1093
779353
5674
342164
-382864
81110329123
145471
3381
21346
29294
1013017450
27591350
3765778917504928
231200
22961710
17408666755743890
5354296423924
-2336036833
7212087
7941797958419258419
12997830
492942315
409344219
57925
3541632
460384
1020671
52023
24
10911
1553154151
1969549765
12553
15391173
225402253
175050
2432512
331995
39861695
1566
13760131075
379615010
10179132311750
10770281200
229612510
354707879848573185414
5198637021
12030302472171385295710642427
166832103
11419386171560
622293485
563847965
77210
3416311875
1840563083
3055615470121100010561
17150060750
15665113254539868
15972145404
6440600477605426841213334905899690
1016477554727414532397024000
11400827317184243751391641
2291181368559830
879353
2230236
30627846
603198412211215
744581
17463122
808173360891119
910533
24922477
2876
1132905
2514571
24261777
39012031026349911941213
Nos. Beds Nos. Beds Nos. Beds
AveragePopulationserved per
GovtHospital
AveragePopula-tion per
bed inHospital

344
(...Contd) TABLE-
N.A.: Not Available.Source: Agricultural Census, 2005-06.
Average size ofOperational
Holdings(in Hect.)
No. ofOperational
Holding(in '000')
Area underOperational
Holding('000 Hect.)
12922212
12044109
275014657
13461
148
2553
46611603933
1378NA
75816904
107908
13716150203
90169
435631
10046186
738193565
22458922
6992
1 2 36 37 38
15832322
14489361
30496251
15210
214
3861
102693583
968923
N,A123851555
31599420005
172241110
11735019
243963
20939109
6824280
17906847
5526
1.231.881.203.331.110.431.091.511.430.501.491.152.202.231.040.67N.A1.630.230.272.021.461.141.181.226.931.150.783.953.381.480.830.500.800.920.79
Agricultural Census, 2005-06
India/States/Union Territories*
Sl.No.
123456789
1011121314151617181920212223242526272829303132333435
IndiaAndaman & Nicobar Islands*Andhra PradeshArunachal PradeshAssamBiharChandigarh*ChhattisgarhDadra & Nagar Haveli*Daman & Diu*DelhiGoaGujratHaryanaHimachal PradeshJammu & KashmirJharkhandKarnatakaKeralaLakshadweep*Madhya PradeshMaharashtraManipurMeghalayaMizoramNagalandOdishaPuducherryPunjabRajasthanSikkimTamil NaduTripuraUttar PradeshUttrakhandWest Bangal

30.01
345
Source: Statistical Abstract, India 2012. Contd...
Agricultural land use, 2009-10
14002215
9991212
28115332
14683
204
22132
103023550
542735
1250104042079
31497217401
233283123361
557419
145816974
774892
28016589
7415256
39 40 41 42 43 44 1
CroppingIntensity
(%)Area
('000' hect.)
19219717
12560276
40997491
25561
244
46160
111386351932
11451399
128732669
32141122612
233336123486
910732
787521745
1445572309
2476411669530
1003639
5898192
26405624
-4094
132
39140
36354540761899
10665447216
-77018991237128
50264
444020
648910315
632537268
17355925
5365
22653924
18875325
48068684
-6518
244
153403
761916471
138015051547
12312524
-1156612321
569235
61532
7192-
2784715573
997349707
452111764
14291
26586.440.71
3061.370.82
242.271309.86
0.001661.17
1.210.462.359.10
1799.721355.69
53.24111.67537.14167.35
2058.480.00
364.893065.46
12.043.685.470.94
519.3430.76
1865.621073.21
0.001196.85
14.20155.31
4261.501644.56
Net Areasown
('000' hect.)
TotalCroped Area('000' hect.)
Total Food Grains2010-11
Total Con-sumption
NPK(2009-10)(000 tonnes)
137.2113.3125.7130.1145.8140.4200.0118.7120.0100.0209.0121.2108.0178.9171.9155.7111.9123.7128.3100.0143.0129.9100.0118.7100.0134.6163.3168.4540.1128.1187.0113.9110.3149.2157.3181.3
Sl.No.
123456789
1011121314151617181920212223242526272829303132333435
Production(000 tonne)

(...Contd) TABLE-
346
Factories(Nos.)
15887713
17153-
22471918284
1976110314472878520
1557646401545626
203285415907
-3532
1945785
100-
902052671
102626811
4626790
40711015
23446818
1 2 45 46 47 48
15263311
16070-
21171725
2821913109314272781
5141533945411528
592195183535656
-3315
188397594
-85
1980656
100356612
4624881
3581069623306740
387744531912
2834521-
5196049514548695
3277255740626708867604005791873
58955661298829869526196723170496793518
(-)1454016-
10255366346712
321483788
-13524
1246121245370
15419381323042
656792714468
20536424578612461241259470
Factories inoperation
(Nos.)
FixedCapital
(Rs. in lakh)
WorkingCapital
(Rs. in lakh)
Annual Survey of Industries
1352183677780
13028052-
980140445230
5947633721311721733624331386652656422
2403813540224432671378286090
345981196382441255199
-3040541
197273923411
149539-
241079272234294558
26106063893226
9082513289599
66440686966232657135967266
India/States/Union Territories*
Sl.No.
123456789
1011121314151617181920212223242526272829303132333435
IndiaAndaman & Nicobar Islands*Andhra PradeshArunachal PradeshAssamBiharChandigarh*ChhattisgarhDadra & Nagar Haveli*Daman & Diu*DelhiGoaGujratHaryanaHimachal PradeshJammu & KashmirJharkhandKarnatakaKeralaLakshadweep*Madhya PradeshMaharashtraManipurMeghalayaMizoramNagalandOdishaPuducherryPunjabRajasthanSikkimTamil NaduTripuraUttar PradeshUttarakhandWest Bengal

30.01
347
# includes wages, salaries, employers' contribution etc. Contd...
1933053958745
17414928-
1466773755744102910
441207825816311101919861638
132119934281035
64727393359874466030
447509012689020
2241836-
453199529309909
6992186725
-33518
10562767508746
48429495484771128917
1975193483567
1082049645420128496908
49 50 51 52 53 54 1
Wages toworkers
663009835474
4327676-
360552227817
471431584772836604377819446848226395
89698232172886803124255353691347
32055041643951
-1210532
116931552860
91051-
6097123732146412
20613722768311
304377547286
19474372461410404582657592
9157802319
941565-
125759734436951
11629490722856508440838891
890600463570
9951344242
104951584140315423
-209317
106252429504984
-2676
18775640389
454334308132
48541541815
25756590788188895466191
6894071210
574421-
62040318466455
9650458889498395893449309
679673418823
6493725474
157266486113173464
-173169
109871210433621
-532
17258729561
269818203353
28591054941
5735402022148004333916
14700696417
1263457-
1560166535820978
298925148605124466190859127387
17721791006753
18562748119
4098021225112
368677-
4358093307643
13807305
-881
38603682246
55143751073920007
25756419102
1019348347086718640
InvestedCapital
Outstandingloan
, 2009-10 (Factory Sector) (Value: Rs. in Lakh)
# TotalEmoluments
11792055398
1131149-
1487318662010678
15451811418810873612116151697
115923958476212866553023
141447886706365767
-279902
151406934786216
-3004
22752551219
568211392526
64841890149
28401762599238795571994
PersonsEngaged
(workers/employees etc)
TotalWorkers(Nos.)
Sl.No.
123456789
1011121314151617181920212223242526272829303132333435

(...Contd) TABLE-
348
Source: (Colm. 45 to 61) Central Statistical Office (Industrial Statistical Wing) Govt. of India.
TotalInputs
30358533420994
18469501-
30901112557702373703
52297525656989257068328455532322519
5343878214472610
345333510335864984609
1897221714716575
-6922506
4890661413370
166214-
1514947712681222833
100328908489811135529
3038779176341
188546335961043
13420119
1 2 55 56 57 58
33061419912788
20542669-
33299942585285
21599158622316097524288932422204042648676
5901085615296716482326612359146098074
2047005214884525
-7353205
54615263.14407
215966-
2841357644221420575
101634439545077
26782132636256
79119200685327671955
12545454
10506872811
1055686-
70833356485681
220263138150
627534127056938
1824173440630178222
25430217990683196108773
-235607
1711062368
7988-
99314992
29589248024338849
68671276304
2898615832199320352626
Value ofproducts &by products
Value ofOutput
Depre-ciation
Annual Survey of Industries
37330359322669
23446174-
36671562825481
43133767780836457430320242132626302943495
6426575617710694500710313220786712897
2332540515545081
-8693863
6240491815224
223506-
2885065662341636966
1175453410856432
31203737578406
101659225681307932238
15704706
India/States/Union Territories*
Sl.No.
123456789
1011121314151617181920212223242526272829303132333435
IndiaAndaman & Nicobar Islands*Andhra PradeshArunachal PradeshAssamBiharChandigarh*ChhattisgarhDadra & Nagar Haveli*Daman & Diu*DelhiGoaGujratHaryanaHimachal PradeshJammu & KashmirJharkhandKarnatakaKeralaLakshadweep*Madhya PradeshMaharashtraManipurMeghalayaMizoramNagalandOdishaPuducherryPunjabRajasthanSikkimTamil NaduTripuraUttar PradeshUttarakhandWest Bangal

30.01
349
Source: (Colm. 62 & 63) Economic Survey, India - 2012-13. Contd...
59211387864
3920987-
50621223213051953
1328067662291568985375807564038
900280127974541375547
26306215102983669992
719733-
153575111787242
148649303
-13602
1479974384544
14736192027772
1696415914310
22420309766517718751931961
59 60 61 62 63 1
5067910454
3238283-
46209620899039269
1165956534405503256293060519708
795857424063981272082
23387812716043205855
574227-
131046610162554
111244169
-13454
1213005353050
11539131741051
1659264868930
20077258428316320481527370
Net valueAdded
Income Profit
33293065(-)364
1974825-
306080143631
18291867032385801378790102201392321
618639513996451086455185759861802
1980743205551
-874657
6854911(-)26936864
-12573
826969270803602477
1230312145919
229329010974
15649351284961808730
NSDP(Rs. Crore)
73682234691
6089218691
103559230843
21025118762
N. A.N. A.
29784334658N. A.
2796165168849846
113114408737290593
N. A.281812
11506169115
13979N. A.
11299194869
12082220618325266
7481572020
18478609538
82415493399
606039307571480622133363323435
14007346573N. A.N. A.
175812192652
N. A.108859
7489942220356526837483725N. A.
38669101314
3228452971N. A.
5663846150957597460647506
1214408449650750300528219354830
Net State Domestic Product(at current prices) 2011-12
Per CapitaNSDP (Rs.)
, 2009-2010 (Value: Rs. in Lakh)
Sl.No.
123456789
1011121314151617181920212223242526272829303132333435

350
(...Contd) TABLE-
Source: Quarterly Deposits and Credit of all Scheduled Commercial Bank, March 2013, RBI.
1 2 64 65 66
7051331823548
398497472152
7772951652088
4568228382841977325732
7558214400857
36105371699114
455276594536
105700946463942342172
62032008201
1785043153549
1397194228964581
143977882675
20068011771391
498924465772
1191345150151
6645304383444
550649588963
438106915310
285759497354575167445031
75255048
7373038112888
26064171292737
157721218064334154
33154021717121
6101157761
1576489514690327351490518018
66325468664
16255021632678
134545492447
386882247081
2314682699339
10464753
873799
16824828325
17404738
2848529
5801329312361275228073615207
1249039774101249115117
3447177
46255191
977830292
1262615426170
Offices(Nos.)
Distribution of All Scheduled CommercialBanks (Reporting) as on March, 2013
Deposit(Million Rs.)
Credit(Million Rs.)
India/States/Union Territories*
Sl.No.
123456789
1011121314151617181920212223242526272829303132333435
IndiaAndaman & Nicobar Islands*Andhra PradeshArunachal PradeshAssamBiharChandigarh*ChhattisgarhDadra & Nagar Haveli*Daman & Diu*DelhiGoaGujratHaryanaHimachal PradeshJammu & KashmirJharkhandKarnatakaKeralaLakshadweep*Madhya PradeshMaharashtraManipurMeghalayaMizoramNagalandOdishaPuducherryPunjabRajasthanSikkimTamil NaduTripuraUttar PradeshUttrakhandWest Bangal

351
30.01
* Including Deemed University. P - Provisional. Contd...
44760067
15421920
1413325587
2315488
8537
588438
42145348350848877
1486333126
305910
9679727654
73222591353465
22649108
379236788
24498101246
5328143652623
12837046
18776191
54822286
652029
1913
480378
62693493146622161429
134471602
36658
16455761676538337
7974180
292414945
1263112
504789311434454
259385
447323
5461031
24584
33
15539
12181002
582303161979448
313113446
73118
2974
87490
5781610
181936
293104
225841
4360
3128
2039--0
191
2612
710
82911
02142
1211
152
1424
343
3361220
19142
2133
10173
1501
794
10432260
19273
590
49227
3320
240
89712
3631
1630
57
7181453
5143118
10812217
682799
1316
139282
357532781727889
104436442223
1254635019123125
9869
1293121
27337616
593660336
975116334341
748547212
668341941
3120242573
2435274
21066
25631254
01398711376154462673126302
679023
4366249095
2435662718211662
54150301
1395047818
74928218
23071473761566049908
Total Number of Educational Institutions in India(P)
123456789
1011121314151617181920212223242526272829303132333435
67 68 69 70 71 72 73 1
Primary/Jr. BasicSchools
Middle/Sr. BasicSchools
H.Sec./Pre Degree/Jr. Colleges
HighSchool
Sl.No.Poly-
technicsCollege
for Prof.Education
*Univer-sity

(...Contd) TABLE-
1 2 74 75 76
116.784.999.4
176.995.6
123.678.1
120.0107.082.6
129.6101.5121.4100.2109.4111.7148.5104.191.580.8
139.7103.7188.4196.3180.0102.8120.1102.3108.3109.5158.7112.6133.3130.4110.293.9
116.086.299.5
180.894.3
127.778.4
122.8105.6
79.3127.7104.3120.3
94.9109.2109.9147.1104.7
91.481.1
135.2104.7192.1195.0186.0103.3119.4103.6108.8109.9161.6111.8134.1126.9109.0
92.7
115.487.599.7
184.593.1
131.378.6
125.6104.3
76.5126.0106.9119.4
90.6109.1108.3145.9105.2
91.481.4
131.2105.5195.7193.7191.7103.7118.7104.8109.1110.3164.4111.0134.9123.8107.9
91.5
Boys
Gross Enrolment Ratio, 2010-11(P)Classes I- V (6-10 Years)
Girls Total
India/ States/Union Territories*
Sl.No.
123456789
1011121314151617181920212223242526272829303132333435
IndiaAndaman & Nicobar Islands*Andhra PradeshArunachal PradeshAssamBiharChandigarh*ChhattisgarhDadra & Nagar Haveli*Daman & Diu*DelhiGoaGujratHaryanaHimachal PradeshJammu & KashmirJharkhandKarnatakaKeralaLakshadweep*Madhya PradeshMaharashtraManipurMeghalayaMizoramNagalandOdishaPuducherryPunjabRajasthanSikkimTamil NaduTripuraUttar PradeshUttarakhandWest Bengal
352
Source: (Colm. 67 to 82) Economic Survey, India - 2012-13.

30.01
83.186.479.9
102.668.760.477.184.7
100.581.3
106.492.281.584.8
111.492.681.089.1
101.393.0
102.689.6
100.896.2
101.360.780.799.791.773.086.6
111.591.575.5
109.288.0
77 78 79 80 81 82 1
85.587.980.1
105.567.964.681.087.5
100.676.4
108.895.885.783.5
113.894.781.390.7
103.983.0
101.492.4
104.691.0
104.860.082.0
103.294.082.478.8
112.391.979.9
105.886.3
104.386.992.0
152.084.0
102.979.3
109.4103.9
78.2120.1101.0107.2
90.5111.0104.2121.0
99.396.281.9
122.6100.0155.0153.6150.7
85.4104.8103.4103.1
99.3123.8112.0115.4109.5107.8
90.1
Boys Girls
103.785.591.8
148.285.198.577.7
106.6104.982.2
120.298.0
106.194.2
110.1104.5121.598.395.285.6
125.698.3
151.1156.3145.885.4
104.6101.2101.995.2
126.0112.2114.7109.6109.891.5
BoysTotal
104.988.392.2
155.783.0
106.980.7
112.2103.1
75.1120.0104.0108.2
87.5111.7103.9120.6100.2
97.178.4
119.8101.5158.7150.8155.6
85.4105.0105.6104.1103.0121.7111.8116.0109.3105.9
88.7
87.789.480.3
108.567.268.484.590.2
100.772.4
110.999.289.582.3
116.096.681.792.2
106.574.0
100.295.1
108.585.9
108.259.483.3
106.895.891.071.2
113.092.284.1
102.684.6
Sl.No.
123456789
1011121314151617181920212223242526272829303132333435
Girls Total
Gross Enrolment Ratio, 2010-11(P)Classes VI-VIII (11-13 Yrs)
Gross Enrolment Ratio, 2010-11(P)Classes I-VIII (6-13 Yrs)
353
Contd...

(...Contd) TABLE-
Source: Abstract of Selected Educational Statistics, 2009-10.
1 2 83 84 85
27.252.98
15.2439.2332.6740.97
(-)18.0624.9419.954.27
17.07(-)4.29
6.52(-)2.24
1.176.82
26.4110.61
(-)11.028.06
20.4922.5440.0854.5147.4639.7826.18
(-)3.12(-)10.67
52.1111.980.42
24.9741.7031.3316.15
28.864.98
15.8041.3535.8942.25
(-)22.8134.1217.52
2.8513.30
(-)8.5425.66
(-)1.640.748.38
27.0511.12
(-)12.5211.1121.1621.3136.4857.6046.0339.9526.45
(-)3.57(-)18.07
50.5118.58
0.3525.4842.0632.6220.52
30.256.85
16.3443.1438.9943.51
(-)27.0540.8515.18
1.669.82
(-)12.4436.89
(-)1.130.359.79
27.6111.60
(-)13.9914.3121.7720.1933.0560.5244.6840.1026.71
(-)4.00(-)24.59
49.1124.57
0.2925.9542.3833.8224.55
Boys
Drop-out Ratio, 2009-10Classes I-V (6-11 Years)
Girls Total
India/ States/Union Territories*
Sl.No.
123456789
1011121314151617181920212223242526272829303132333435
IndiaAndaman & Nicobar Islands*Andhra PradeshArunachal PradeshAssamBiharChandigarh*ChhattisgarhDadra & Nagar Haveli*Daman & Diu*DelhiGoaGujratHaryanaHimachal PradeshJammu & KashmirJharkhandKarnatakaKeralaLakshadweep*Madhya PradeshMaharashtraManipurMeghalayaMizoramNagalandOdishaPuducherryPunjabRajasthanSikkimTamil NaduTripuraUttar PradeshUttrakhandWest Bengal
354
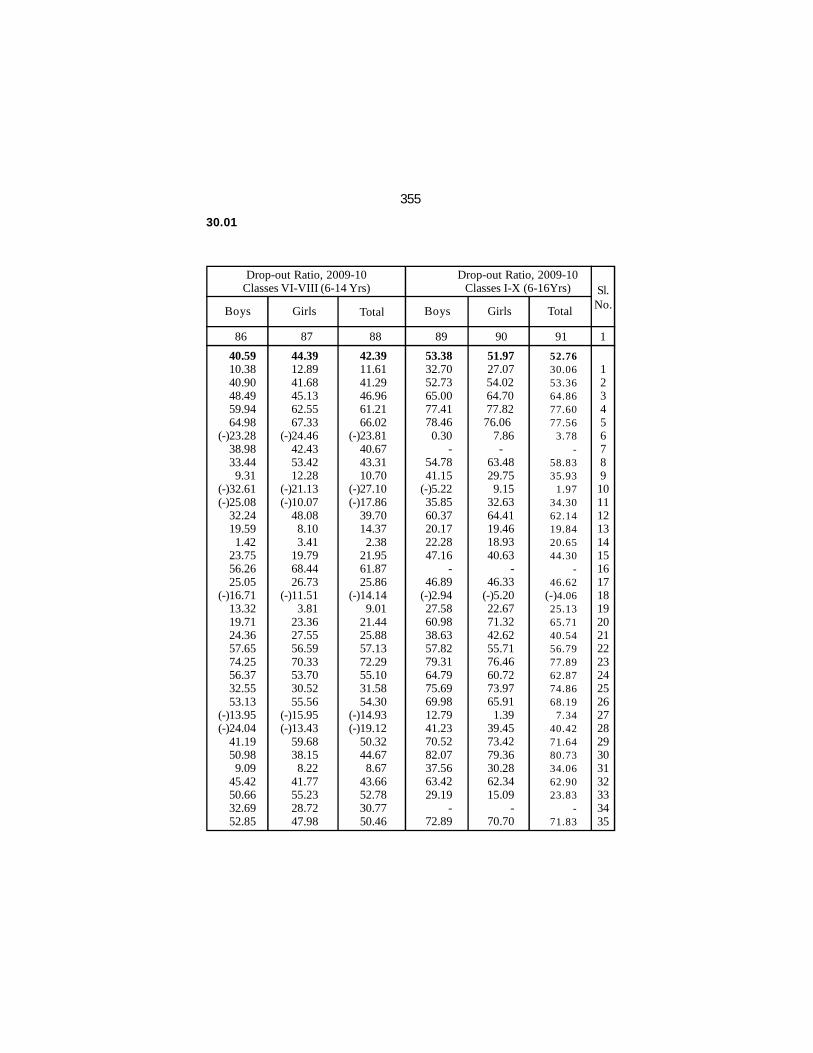
30.01
44.3912.8941.6845.1362.5567.33
(-)24.4642.4353.4212.28
(-)21.13(-)10.07
48.088.103.41
19.7968.4426.73
(-)11.513.81
23.3627.5556.5970.3353.7030.5255.56
(-)15.95(-)13.43
59.6838.158.22
41.7755.2328.7247.98
86 87 88 89 90 91 1
42.3911.6141.2946.9661.2166.02
(-)23.8140.6743.3110.70
(-)27.10(-)17.86
39.7014.372.38
21.9561.8725.86
(-)14.149.01
21.4425.8857.1372.2955.1031.5854.30
(-)14.93(-)19.12
50.3244.678.67
43.6652.7830.7750.46
52.7630.0653.3664.8677.6077.56
3.78-
58.8335.93
1.9734.3062.1419.8420.6544.30
-46.62
(-)4.0625.1365.7140.5456.7977.8962.8774.8668.19
7.3440.4271.6480.7334.0662.9023.83
-71.83
Boys Girls
51.9727.07
54.02 64.70 77.82 76.06
7.86 -
63.4829.759.15
32.6364.4119.4618.9340.63
-46.33
(-)5.2022.6771.3242.6255.7176.4660.7273.9765.911.39
39.4573.4279.3630.2862.3415.09
-70.70
BoysTotal
40.5910.3840.9048.4959.9464.98
(-)23.2838.9833.449.31
(-)32.61(-)25.08
32.2419.591.42
23.7556.2625.05
(-)16.7113.3219.7124.3657.6574.2556.3732.5553.13
(-)13.95(-)24.04
41.1950.989.09
45.4250.6632.6952.85
Sl.No.
123456789
1011121314151617181920212223242526272829303132333435
Girls Total
Drop-out Ratio, 2009-10Classes VI-VIII (6-14 Yrs)
Drop-out Ratio, 2009-10Classes I-X (6-16Yrs)
53.3832.7052.7365.0077.4178.460.30
-54.7841.15
(-)5.2235.8560.3720.1722.2847.16
-46.89
(-)2.9427.5860.9838.6357.8279.3164.7975.6969.9812.7941.2370.5282.0737.5663.4229.19
-72.89
355
31.KEY STATISTICS

TABLE - 31.01SOME KEY STATISTICS OF INDIA
Contd...
Items
Census 2011
Census 2011
2001-2011
Census 2011
Census 2011
Census 2011
Census 2011
Census 2011
Census 2011
Census 2011
2006-102006-102006-10
2012
2010-12
Sl.No.
1.
2.
3.
4.
5.
6.
7.
8.
9.
10.
11.
12.
Geographical Area
Population(i) Total(ii) Male(iii) Female
Decadal Growth Rate
Density of Population
Sex Ratio
Literacy Rate(i) Male(ii) Female(iii) Total
Total Household
Drinking Water Facilitieswithin the Premises
Latrine Facilities
Electricity Facilities
Life Expectancy at Birth(i) Male(ii) Female(iii) Total
Social Indicators(i) Birth Rate(ii) Death Rate(iii) Infant Mortality Rate
(a) Male(b) Female(c) Persons
(iv) MMR
ParticularsUnit
3287240
1210569573623121843587447730
17.7
382
943
80.8964.6472.99
249454252
46.6
46.9
67.2
64.667.766.1
21.67.0
414442
178
Sq. Km.
Nos.
Percent
Per Sq. Km
Per '000' Male
Percent-do--do-
Nos.
%
%
%
YearsYearsYears
Per thousand,,
,,,,,,
Per lakh live birth
ReferenceYear
1 2 3 4 5
357

(...Contd) TABLE - 31.01
Contd...
Items
2010-11(P)
2010-11
2010-11
Sl.No.
13.
14.
15.
Land Utilisation(i) Reporting Area for LUS(ii) Forest(iii) Land Not Available for Cultivation(iv) Fallow lands other thanCurrent Fallows(v) Current Fallows(vi) Net Area Sown(vii) Total Cropped Area(viii) Area Sown More than Once(ix) Net Area Irrigated
Area under some PrincipalCrops(i) Rice(ii) Wheat(iii) Total Pulses(iv) Total Foodgrains(v) Rape & Mustard(vi) Total Oil Seeds(vii) Sugarcane
Production of somePrincipal Crops(i) Rice(ii) Wheat(iii) Total Pulses(iv) Total Foodgrains(v) Rape & Mustard(vi) Total Oil Seeds(vii) Sugarcane
ParticularsUnit
3059037000643564
24589
1426714157919896957390
63601
42.929.126.4
126.76.9
27.24.9
96.086.918.2
244.58.2
32.5342.4
`000 Hectares
Million Hectares
Million Tonnes
ReferenceYear
1 2 3 4 5
358

(...Contd) TABLE - 31.01
Contd...
2010-11
2010-11
2011-12
2011-12
2011-12
2011-12
2011-12
16.
17.
18.
19.
20.
Average Yield of somePrincipal Crops(i) Rice(ii) Wheat(iii) Total Pulses(iv) Total Foodgrains(v) Rape & Mustard(vi) Total Oil Seeds(vii) Sugarcane
Gross Irrigated Area ofsome Principal Crops(i) Rice(ii) Wheat(iii) Total Cereals(iv) Total Pulses(v) Total Foodgrains(vi) Sugarcane
Consumption of ChemicalFertilisers (N+P+K)
Index Number of(i) Area under Principal Crops(ii) Production of Principal Crops(iii) Yield of Principal Crops
Index Number of(i) Whole Sale Price of All Commodities(ii) Consumer Price of Industrial Workers(iii) Agricultural Labour
22392989691
193011851193
70
257092747457264
381561079
4891
277.39
109.8
124.1
113.0
156.1
195
611
Kg. /Hect.,,,,,,,,,,
Tonnes/Hectore
Thousand Hectares
'000' Tonne
Base:2007-08=100
Base:2004-05=100
Base:2001=100
Base:1986-87=100
ItemsSl.
No.ParticularsUnit
ReferenceYear
1 2 3 4 5
359

170.3181.0128.5149.3
570.468.6
209.737.7
(-)13.3967
811.1
54821119388876
47942278372744
4690.3141866
70641604
64.60
(...Contd) TABLE - 31.01
Contd...
Index Number of IndustrialProduction:(i) General(ii) Manufacturing(iii) Mining(iv) Electricity
Industrial Production(i) Coal and Lignite(ii) Finished Steel(iii) Cement(iv) Crude Oil (Petroleum)(v) Natural Gas(vi) Tea
Electricity Generated(Utilities only)Gross National Product(at Factor Cost)(i) At Constant(2004-05)Price(ii) At Current Price
Per Capita Net NationalProduct(i) At Constant (2004-05) Price(ii) At Current Price
Road and Transport(i) Total Road Length(ii) No. of Redg MotorVehicles (All Vehicles)(iii) No. of Goods Vehicles(iv) No. of Buses(v) RailwayRoute Length
Base:2004-05=100
Million Tonnes,,,,,,
Million Cubic MtrsThousand Tonnes
Billion KWH
Rs. Crore
Rs. Crore
'000' Km'000' Numbers
,,,,
'000' Km
2011-12
2010-112010-112010-112010-11
20122010-11
2010-11
2012-13(Q)
2012-13 (Q)
2010-112010-11
2010-112010-11
2011-12 (P)
21.
22.
23.
24.
25.
26.
ItemsSl.
No.ParticularsUnit
ReferenceYear
1 2 3 4 5
360

35416
1376013
922.2
38451201272782218247
7051331855064958
78.111.6
1166439
1967522(-)801083
14126
(...Contd) TABLE - 31.01
Health & Family Welfare(i) No. of GovernmentHospitals under AllopathicSystem(ii) No. of Beds in Govt.Hospital under AllopathicSystem(iii) No. of RegisteredAllopathic MedicalPractioners
Banking (All ScheduledCommercial Banks)(A) Number of Bank Offices (Reporting)
(i) Rural(ii) Urban(iii) Semi Urban(iv) Metropolitan
(B) Deposits(C) Credit(D) Credit-Deposit Ratio(E) Population per office
Foreign Trade(i) Exports (including Re-export)(ii) Imports(iii)Trade Balance
Foreign Exchange Reserves(Excluding Gold, SDRs andReserve Tranche Position atIMF)
in Nos.
,,
,,
Number
Rs. Million,,
Percentin `000
Rs. in Crore
Rs. in billion
2012-13
2012-13
2010-11
Mar-2013
2012-13 (P)(Apr to Dec)
2012-13
27.
28.
29.
30.
ItemsSl.
No. ParticularsUnitReferenceYear
1 2 3 4 5
Source : 1. Population Census of India, 2011; 2. Economic Survey of India, 2012-13;3. Quarterly Statistics on Deposit and Credit of Scheduled Commercial Banks,RBI 2013, March; 4. Department of Agriculture and Co-operation, Ministry ofAgriculture, GOI, 5. Directorate of General State Health Services, GOI;6. MOSPI Press release on 1.3.2014 as available on MOSPI web site.
361