statistical iterative reconstruction to improve image ...chen/publications/medphys_tomo_2015.pdf ·...
TRANSCRIPT
Statistical iterative reconstruction to improve image qualityfor digital breast tomosynthesis
Shiyu Xua)
Department of Electrical and Computer Engineering, Southern Illinois University Carbondale,Carbondale, Illinois 62901
Jianping Lu and Otto ZhouDepartment of Physics and Astronomy and Curriculum in Applied Sciences and Engineering,University of North Carolina Chapel Hill, Chapel Hill, North Carolina 27599
Ying Chenb)
Department of Electrical and Computer Engineering, Southern Illinois University Carbondale,Carbondale, Illinois 62901
(Received 11 June 2014; revised 19 July 2015; accepted for publication 4 August 2015;published 19 August 2015; corrected 1 September 2015)
Purpose: Digital breast tomosynthesis (DBT) is a novel modality with the potential to improveearly detection of breast cancer by providing three-dimensional (3D) imaging with a low radiationdose. 3D image reconstruction presents some challenges: cone-beam and flat-panel geometry, andhighly incomplete sampling. A promising means to overcome these challenges is statistical iterativereconstruction (IR), since it provides the flexibility of accurate physics modeling and a generaldescription of system geometry. The authors’ goal was to develop techniques for applying statisticalIR to tomosynthesis imaging data.Methods: These techniques include the following: a physics model with a local voxel-pair based priorwith flexible parameters to fine-tune image quality; a precomputed parameter λ in the prior, to removedata dependence and to achieve a uniform resolution property; an effective ray-driven technique tocompute the forward and backprojection; and an oversampled, ray-driven method to perform highresolution reconstruction with a practical region-of-interest technique. To assess the performance ofthese techniques, the authors acquired phantom data on the stationary DBT prototype system. To solvethe estimation problem, the authors proposed an optimization-transfer based algorithm frameworkthat potentially allows fewer iterations to achieve an acceptably converged reconstruction.Results: IR improved the detectability of low-contrast and small microcalcifications, reduced cross-plane artifacts, improved spatial resolution, and lowered noise in reconstructed images.Conclusions: Although the computational load remains a significant challenge for practicaldevelopment, the superior image quality provided by statistical IR, combined with advanc-ing computational techniques, may bring benefits to screening, diagnostics, and intraopera-tive imaging in clinical applications. C 2015 American Association of Physicists in Medicine.[http://dx.doi.org/10.1118/1.4928603]
Key words: stationary digital breast tomosynthesis, edge-preserving prior, fast convergence, highresolution reconstruction, optimization transfer, uniform image quality, maximum a posteriori,region-of-interest reconstruction, ray-driven, statistical iterative reconstruction
1. INTRODUCTION
Breast cancer is the most common cancer among women.Around 12% of women will develop invasive breast cancerover the course of her lifetime in the United States.1 Earlydetection is viewed as the best strategy to decrease breastcancer mortality, by allowing intervention at earlier stages ofcancer progression. Over the last two decades, mammographyhas arisen as one of the most important and efficacious tools forthe early detection of breast cancer. However, traditional 2Dmammography has some limitations. For example, the natureof the 2D mammogram can make it very difficult to distinguisha cancer from overlying breast tissues. Moreover, it is particu-larly difficult for radiologists to interpret 2D mammograms of
dense breast tissues. It has been reported that 76% of missedcancers were in dense breasts.2
Compared with traditional 2D mammography, three-dimensional (3D) digital breast tomosynthesis (DBT) imag-ing3–6 has the potential to improve conspicuity of structuresby reducing the visual clutter associated with overlyinganatomy.
Digital tomosynthesis3,4 is a 3D imaging modality. It isa form of limited-angle tomography that produces sectionalimages, which are synthesized from a series of acquiredprojections as the x-ray tube moves along a prescribed path.The typical total angular range of breast tomosynthesis imag-ing is less than 50◦, and the number of projection images islimited with a low total radiation dose. Because the sampling
5377 Med. Phys. 42 (9), September 2015 0094-2405/2015/42(9)/5377/14/$30.00 © 2015 Am. Assoc. Phys. Med. 5377

5378 Xu et al.: IR to improve IQ for DBT 5378
is highly incomplete, the depth resolution is limited; therefore,tomosynthesis cannot produce isotropic spatial resolution ascan be achieved with computed tomography (CT). However,due to the usage of a cone-beam x-ray source and a flat-panel detector, the resolution of a transversely reconstructedplane is often superior to that of CT.4 In addition to breastimaging, tomosynthesis has been applied to a wide varietyof clinical applications over years, including dental imaging,angiography, and imaging of the chest and bones.
The limitations of current tomosynthesis systems includeboth a longer scanning time than a conventional digital x-raymodality and a relatively low spatial resolution. Both resultfrom the limitations of current x-ray tube technology, where asingle x-ray tube is mounted on a rotating gantry and movesalong an arc above objects over a certain angular range andover a relatively long period of time compared to a single-exposure radiograph. For a continuous tube motion design, thehigher the scanning speed, the larger the distance the x-raytube travels during a fixed exposure time and the larger thex-ray focal spot blurring. The amount of blur which can betolerated limits the scanning speed and angular coverage. Inaddition, long scan times increase the probability of patientmotion, which can cause image blur.
To conquer the limitations of tomosynthesis, researchersproposed the concept of stationary digital breast tomosyn-thesis (s-DBT) using a carbon-nanotube based x-ray sourcearray.7,8 Instead of mechanically moving a single x-ray tube,s-DBT applies a stationary x-ray source array, which generatesx-ray beams from different view angles by electronically acti-vating the individual source prepositioned at the correspond-ing view angle, thereby eliminating the focal spot motionblurring. The scanning speed is thus determined only by thedetector readout time and the number of sources, regardlessof the angular coverage spans. More importantly, the spatiallydistributed multibeam x-ray sources also potentially enableimprovement of image quality (IQ) by permitting a wide va-riety of multibeam source distributions.9
Among current reconstruction techniques in tomographicimaging, both analytical reconstruction and iterative recon-struction (IR) are being studied and applied. One classicalanalytical reconstruction is filtered backprojection (FBP),10
which is based on Fourier slice theorem and guarantees aprecise signal reconstruction at a parallel beam geometry anda sampling rate satisfying Nyquist–Shannon theorem. How-ever, FBP will introduce reconstruction errors when appliedto cone-beam geometry and highly incomplete frequencysampling.11 To reduce the reconstruction error, several revisedversions of FBP, such as FBP with postprocessing and FBPwith modified ramp filters,12,13 were proposed. These revisedversions have been widely used in cone-beam tomographicimaging system. Most of these methods ignore the largecone angle effect in Fourier space. IR approaches have thecapability to fully describe the system geometry and physicsmodel.
One of the IRs in tomographic reconstruction is simulta-neous algebraic reconstruction technique (SART),14,15 whichapplies an ordered subsets (OS) method to solve an un-weighted least-squares objective function. Application of this
approach may lead to overfitting to noisy data, artifacts fromlow-dose measurements, and nonconvergence to the globaloptimal.
Another type of IR that has been proposed is statisticalIR (SIR), such as maximum likelihood (ML). Limited-angletomographic reconstruction is ill-posed.16 The ML alone rarelyproduces a satisfactory solution, with the image reconstructedfrom ML being very noisy. One solution is to regularize theestimator by imposing a prior or regularization term, such asin maximum a posteriori (MAP) or penalized weighted leastsquares (PWLS).17–23 One simple regularization enforces aroughness quadratic penalty on the solution with an assump-tion of global smoothness. However, quadratic regulariza-tion usually causes blurred edges. In many images, smalldifferences between neighboring pixels are often associatedwith noise, while large differences are due to the presenceof edges. This assumption has formed the basis for manyedge-preserving regularization techniques, such as those basedon the Huber function24,25 and the q-generalized GaussianMarkov random field (q-GGMRF).26 In these functions, thepenalty influence increases less rapidly than the quadraticfunction for sufficiently large arguments.
Total variation (TV), as an edge-preserving regularization,has also received much attention, along with the emergingapplication of compressed sensing technique. These methodsallow images to be reconstructed from relatively small amountsof data.27,28 Moreover, IR allows the flexibility to incorporatevarious preacquired knowledge to reduce the uncertainty andimprove the model accuracy. Known component reconstruc-tion (KCR)29 with known object shape and composition wasdeveloped for cone-beam CT imaging system. This tech-nique potentially permits a metal artifacts free reconstruction,which will greatly benefit the diagnostic and intraoperativeimaging in case of metal implants and surgery tools pres-ent in the display field. Model based iterative reconstruction(MBIR),26,30 an IR technique recently released in commercialCT, significantly improves IQ compared with conventionalanalytical techniques.
In tomosynthesis, 3D image reconstruction is more chal-lenging because of the large cone-beam angle, the highlyincomplete and nonsymmetric sampling, and the large re-constructed volume. ML method6,31 and MAP (Refs. 32–35)were introduced into tomosynthesis system and comparedwith conventional reconstruction approaches. The results inthis paper focus on demonstrating the value of IR in improvingthe detectability of low-contrast and small objects, reduc-ing cross-plane artifacts, improving resolution, and loweringnoise in reconstructed images. In Sec. 2, multiple key tech-niques in statistical IR are discussed, including prior design,high resolution reconstruction, and a fast converging algo-rithm. In Sec. 3, scans used to acquire the phantom data arecovered, along with the reconstruction methods. The parame-ters controlling the trade-offs of resolution and noise in priordesign are studied as well. The results presented in Sec. 4demonstrate improvement in the visibility of small micro-calcifications, low-contrast detectability, and superior trade-offs between spatial resolution and noise with reduction ofartifacts.
Medical Physics, Vol. 42, No. 9, September 2015
5379 Xu et al.: IR to improve IQ for DBT 5379
2. MODELING AND COMPUTATION2.A. Statistical model for image reconstruction
In a monoenergetic x-ray device, the number of photonsemitted and ultimately detected along a projection follows aPoisson distribution, which can be described mathematicallyas
P(Yi = yi)=θyii e−θi
yi!, (1)
where Yi is a random variable counting the observed photonson the detector along the ith x-ray; yi is one observation ofYi; and θi is the expected value of the random variable Yi,that is related to the line integral projection by Beer’s lawof attenuation.36 In the classical physical model, attenuatedprojections can be expressed as
θi = die−⟨µ,li⟩, (2)
where di is the intensity of the incident x-ray and µ is the linearattenuation coefficient vector to be estimated. Each voxel isrepresented by an attenuation coefficient. li denotes the vectorof the system coefficient generated by each voxel and the ithx-ray. ⟨µ, li⟩ denotes the inner product of the two vectors rep-resenting forward projection along the ith x-ray. The negativelog-likelihood function of all observed photons on the detectorcan be written as18
L(µ)=Mi
{die−⟨µ,li⟩+ yi⟨µ,li⟩}+c, (3)
where c is a constant and M is the number of x-ray beams. Byminimizing (3), the optimal µ can be estimated.
Because all real tomographic data are noisy and the recon-struction problem is ill-conditioned, unregularized reconstruc-tion can suffer from high noise due to “overfitting” noisydata. To reduce the noise, researchers proposed a Bayesianinference method33 that includes a prior encouraging dataconsistency of each projection. More generally, the prior uponthe spatial similarity and the morphology information wasalso studied.24 Most of these priors define a probability den-sity function for voxel difference from their neighbors. Theconstraint is imposed into the solution by adding the negativelog-transformed prior to the negative log-likelihood. Such apenalized-likelihood (PL) objective function has the followingform:
Ψ(µ)= L(µ)+λR(µ), (4)
where the penalty weight λ affects the appearance of thereconstructed images by giving control to the strength of thepenalty R(µ), which is the negative log transformation of theprior Π(µ). One of the most popular is the Gaussian Markovrandom field (GMRF) prior, which is generally defined by thefollowing probability density function:
Π(µ)∼Nj
Njk
exp(ρ(∆ jk)), (5)
where
ρ(∆ jk)=−gjk∆2
jk
2σ2µ
, (6)
j ∈ N is the index of voxel; k ∈ Nj denotes the neighborhoodindex; and σµ is the standard deviation of the voxel value; and∆ jk = µ j−µk. The neighborhood mask gjk is typically definedas
gjk =1
((x j− xk)2+ (yj− yk)2)1/2 , (7)
when a 3×3 neighborhood clique is applied in the transversereconstructed plane, gjk can be simplified to 1.
The quadratic penalty applies a globally smooth effect onvoxels, which often causes edges to be blurred. To improveedge preservation, the generalized Gaussian MRF (gGMRF)37
was introduced into digital tomosynthesis,38 redefining Eq. (6)as follows:
ρ(∆ jk)=(∆ jk
c
) p. (8)
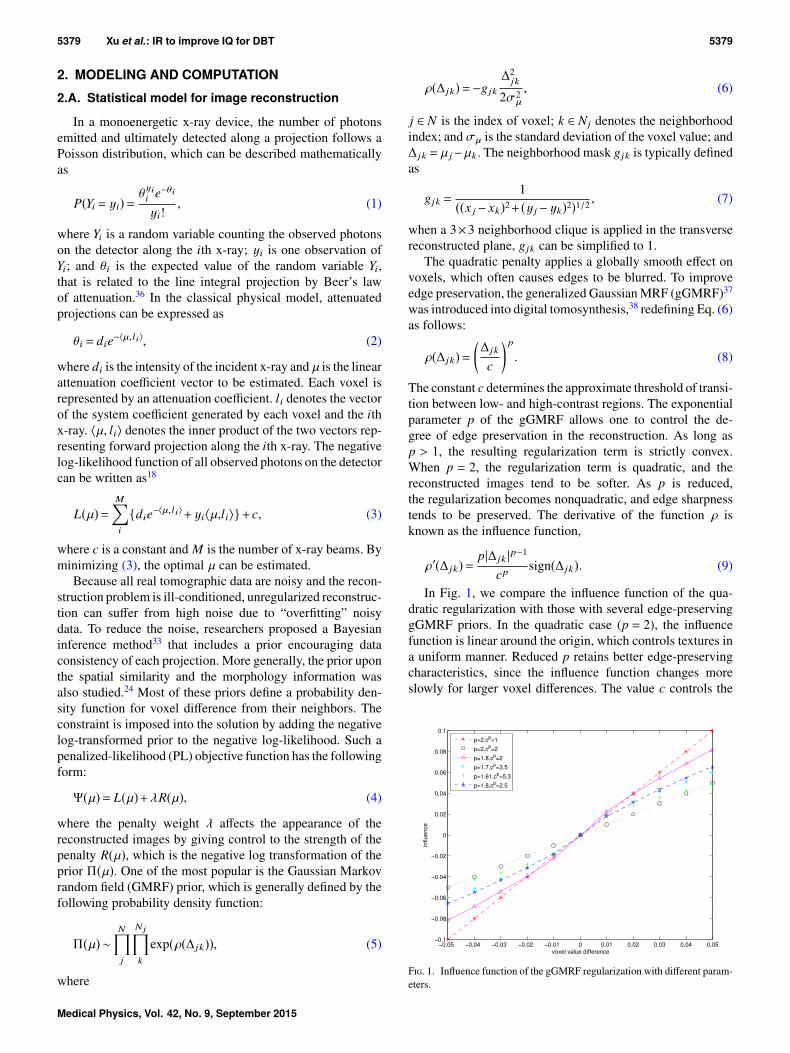
The constant c determines the approximate threshold of transi-tion between low- and high-contrast regions. The exponentialparameter p of the gGMRF allows one to control the de-gree of edge preservation in the reconstruction. As long asp > 1, the resulting regularization term is strictly convex.When p = 2, the regularization term is quadratic, and thereconstructed images tend to be softer. As p is reduced,the regularization becomes nonquadratic, and edge sharpnesstends to be preserved. The derivative of the function ρ isknown as the influence function,
ρ′(∆ jk)= p|∆ jk |p−1
cpsign(∆ jk). (9)
In Fig. 1, we compare the influence function of the qua-dratic regularization with those with several edge-preservinggGMRF priors. In the quadratic case (p = 2), the influencefunction is linear around the origin, which controls textures ina uniform manner. Reduced p retains better edge-preservingcharacteristics, since the influence function changes moreslowly for larger voxel differences. The value c controls the
F. 1. Influence function of the gGMRF regularization with different param-eters.
Medical Physics, Vol. 42, No. 9, September 2015

5380 Xu et al.: IR to improve IQ for DBT 5380
inflexion point. Higher c pushes the edge-preserving behaviortoward the origin. For example, to maintain similar influenceto the quadratic with cp = 1 for differences of 0.01 whichis considered the upper boundary of noise variation, the cp
values for p= 1.8, p= 1.7, and p= 1.61 are set to 2.5, 3.5, and5.3, respectively.
2.B. Geometric configuration and forwardand backprojection model
As shown in Fig. 2, a typical DBT system acquires 11 to25 projections by rotating the x-ray tube around the center ofrotation over an arc of less than 50◦ arc. In a motion synchro-nized with the position of the tube, the collimator is shiftedduring the acquisition, to confine the x-ray illumination area tothe flat-panel detector. This detector, which remains stationaryduring the acquisition, is used to record images consisting ofa large array of small pixels. Antiscatter grids are not usuallyused.
The x-ray dose for a tomosynthesis exam is comparable tothat for a one-view mammogram. In clinical tomosynthesisimaging, the breast of the patient is compressed in the sameway as in mammography. The total image acquisition time isusually about 5 to 8 s.
The major advantage of statistical IRs is that they allowarbitrary specification of the system coefficient used in thestatistical model described as Eq. (3). Any scanning geometrythat uses only a short arc, including the cone-beam and flat-panel detector system above, can be accurately modeled byproper computation of the vector of system coefficients. Themodel can be designed to realistically represent the scanner,although this may come at great computational expense.
At the core of any efficient implementation of IR is thecalculation of system coefficients in the forward and backwardmodel, which often drives computation time and reconstruc-tion accuracy. One of the models to calculate the system coef-ficient matrix is the distance driven approach,39 which accu-rately takes into account both the detector response and thevoxel size. This method leads to fast implementation withoutdegrading the frequency response and is considered to be astate-of-the-art approach. The distance driven technique maybe applied in conjunction with a voxel-based iterative algo-rithm30 such as iterative coordination descent (ICD), where
F. 2. DBT imaging system: (a) front view; (b) side view.
voxel calculations in each iteration require the related errorsinograms to be updated by all other voxels. The inherentsequential processing makes the voxel-based algorithm hard toparallelize. Other algorithms such as in Ref. 40 or OS41 requirea full independent forward and backprojection for each itera-tion, permitting easier parallelization. The ray-driven method,being the most favorable system model for this category ofalgorithms, is applied in this study. A typical 2D ray-drivenforward model is illustrated in Fig. 3(a), where the image spaceis represented by a voxel mesh and the ray is modeled by a lineconnecting the source and the center of each detector element.The expected projection data are formalized as
p1= L1µ1+L2µ2+L3µ3, (10)
where µ j is the linear attenuation coefficient of the jth voxelalong the ray path. An efficient ray-driven method was im-plemented based on the method proposed in the literature.42
A traversal algorithm along each ray is described by the rayequation: u+ t v , where u is the start point of the ray and vdenotes the ray direction vector. The ray is broken into inter-vals of t, each of which spans the whole voxel. To determinet, the ray length crossing the first vertical voxel boundary andthe ray length intersecting the first horizontal voxel boundaryare compared. The minimum of those two will indicate howmuch the ray travels within the current voxel. The intersectedlength within the current voxel is calculated by subtracting thelast value of t from the current value of t. At the boundary,the adjacent voxel is identified and processing continues asbefore. A forward projection along a ray is defined as the innerproduct of intersection length vector and the linear attenuationcoefficient for the corresponding voxel. The backprojectionof a voxel is typically calculated by averaging the “on-path”projection data as shown in 3(b). Assuming that there are atotal of M rays going through the jth voxel over all projectionviews, the backprojection of jth voxel bj is defined as
bj =
Mi=1
li jpi/Li
Mi=1
li j
, (11)
F. 3. Ray-driven model: (a) ray-driven forward model; (b) ray-driven back-projection model.
Medical Physics, Vol. 42, No. 9, September 2015

5381 Xu et al.: IR to improve IQ for DBT 5381
where pi denotes the projection data for the ith detectorelement; li j denotes the length of intersection of the ith raymodel and jth voxel; and Li is the path length of the ray withinthe entire volume.
2.C. Modified regularization design for predictableresolution property
The nonlinearity of the impulse response in statistical IR isoften undesirable since it leads to an unpredictable and nonuni-form resolution. In this section, we present an analytical formof the impulse response and demonstrate a way to linearize itto achieve predictable and uniform resolution. We start froma general quadratic regularization
R(µ)=Nj=1
k∈Nj
12(µ j− µk)2. (12)
The local impulse response of the reconstruction with a PLobjective function shown as Eq. (4) and a quadratic penaltywas previously derived43 as
L j(µ)≈ [ATD(yi)A+λHR]−1ATD(yi)Ae j, (13)
where j denotes an impulse response at the jth voxel with theform of
L j(µ)≈ ∂µ(yi)∂µ j
,
µ(yi) is an estimator of µ on a noiseless measurement {yi}; Arepresents the system coefficient matrix; D(yi) is a diagonalmatrix with the entry yi; HR is the Hessian matrix of R(µ);and e j is the jth unit vector. From Eq. (13), one can see thatthe impulse response L j(µ) depends not only on the systemcoefficient and the penalty weight λ but also on the datasetsassociated with the incident x-ray and the object under scan.The data-sensitivity leads to a nonuniform impulse response,including shift-variant resolution and a data-dependent λ ef-fect on the results. To reduce the data dependence, Fesslerand Rogers proposed a modified penalty function43 for moreuniform resolution. This penalty is written as
Rm(µ)=Nj=1
κ jk∈Nj
ω jkκkψ(µ j− µk), (14)
where ω is the weight assigned to ψ. κ j is formalized foremission tomography as follows:
κ j = s j
i=1g2i jqi
i=1g2i j
. (15)
In x-ray transmission tomography, si, gi j, qi are translated tosi = 1, i ∈ [1,M], gi j = li j, and qi = yi. To reduce the computa-tional complexity, we propose a simplified version as follows:
Rm(µ)=Nj=1
κ2j
k∈Nj
(µ j− µk)22
, (16)
where
κ2j =
Mi=1
l2i jyi
Mi=1
l2i j
, (17)
since the condition of κk ≈ κ j is obviously satisfied in the jthvoxel’s neighbors. κ2 is roughly equivalent to a backprojectionupon the data set {yi}.
We substituted Rm of Eq. (16) into Eq. (13). When ananalogous deduction as in Fessler and Rogers43 is applied,L j(µ) has the following form:
L j(µ)≈ [AT I A+λHR]−1AT I Ae j, (18)
where I is an identity matrix. One can see that as the dataweighting D(yi) is reduced to I, HRm, the Hessian matrixof Rm(µ), is transformed to HR, the Hessian matrix of R(µ).That means that the effect of λ on the impulse response fromarbitrary measurements yi with the modified penalty is equiv-alent to the effect of λ on the impulse response with a uni-form projection of yi = 1 with a quadratic penalty. In otherwords, pre-estimation using the measured data reduces thedata-dependence terms and allows a predictable effect of λ onthe reconstructed results.
Other work44 has shown that κ can also lead to improveduniformity in nonquadratic regularized reconstructions. Intu-itively, κ reduces the data dependence in uniform regions. Theedge-preserving effect on an impulse signal will vary as thedifference changes between the signal and its background. Asa result, the spatial resolution achieved by a quadratic regu-larization with specific λ values permits a baseline selectionfor nonquadratic regularized reconstruction allowing a degreeof resolution uniformity while improving the resolution andnoise trade-off over quadratic regularization.
2.D. Region-of-interest (ROI) reconstructionwith super resolution
Statistical IR can recover fine details and small featuresmore accurately than conventional algorithms. In order tofully utilize this advantage, a higher spatial resolution param-eterization, specifically smaller voxels, needs to be appliedto detect small features such as microcalcification. In thissection, we develop high resolution reconstruction with theray-driven method on an oversampling detector. As a result,intersected ray number and voxel number are significantlyincreased, such that extra computation is required. ROI recon-struction is an efficient option to concentrate computationsonly on the region that contains the interesting diagnosticdetails.
Practically, to increase the spatial resolution, voxels needto be divided into subvoxels. When the subvoxel dimensionsize becomes much smaller than the detector element size,the original ray-driven model, which represents a ray by aline connecting the source and the center of the correspondingdetector element, is not accurate enough potentially causingresolution loss and a chess grid effect.45 Figure 4 demonstratesthe undersampling situation and shows a potential solution
Medical Physics, Vol. 42, No. 9, September 2015

5382 Xu et al.: IR to improve IQ for DBT 5382
F. 4. Ray-driven forward model for voxel and subvoxel: (a) ray-driven model for voxel; (b) ray-driven model for subvoxel; (c) oversampled ray-driven modelfor subvoxel.
as well. Figure 4(a) presents the forward model of a singlevoxel whose size is comparable to the detector element size.The dotted lines aligned at the two boundaries of the detectorelement represent the actual ray coverage. In this case, theintersection between the voxel and the line that connects thesource and the center of the detector is accurate enough forforward and backprojection. In Fig. 4(b), one voxel is dividedinto four subvoxels in order to quadruple the resolution. Ac-cording to the ray-driven model, the forward projection p iswritten as
p= ls1µs1+ ls2µ
s2+ ls4µ
s4, (19)
where lsj denotes the ray intersection with the correspondingsubvoxel j whose attenuation coefficient is µsj. Equation (19)shows that only subvoxels 1, 2, 4 are taken into account forthe ray attenuation. In fact, all of these subvoxels shouldcontribute to the ray attenuation according to the coverage ofthe dotted line. The ray-driven method with an oversamplingdetector46 may solve this problem. Instead of the ray beingmodeled as one line, it can be modeled as two lines, each ofwhich connects the source and quarters of a detector elementas shown in Fig. 4(c). The ray attenuation corresponding tothe detector element d3 is calculated by the forward projectiongiven by the two lines, which is
p=12(ls11µ
s1+ ls13µ
s3+ ls14µ
s4)+
12(ls21µ
s1+ ls22µ
s2+ ls24µ
s4), (20)
where lsi j, i ∈ 1, 2, denotes the intersection of each line withinthe jth subvoxel. Unlike Eq. (19), this calculation counts theeffect from all subvoxels.
The disadvantage of this oversampling detector based ray-driven method is that it significantly increases the computa-tional cost, since more rays are required to be computed andmore voxels are reconstructed. As a result, the high resolutionreconstruction for the whole image volume is not very prac-tical. Fortunately, the intensive computing is not necessary,since small features are only located in a small ROI. There hasbeen much work on reconstruction within a small display fieldof view (DFOV) in CT.47,48 A typical approach involves a two-path reconstruction. The first path involves applying a pilotreconstruction with full field of view (FFOV) with a coarsevoxel size. The second path involves updating the divided
subvoxels in a smaller DFOV within that pilot reconstruction.The nonuniformity of voxel size usually leads to the partialvolume problem resulting in data mismatch in the forwardprojection. The amount of the mismatch is determined by theimplementation.
Compared to CT, in DBT, the image slice, which is parallelto the detector plane, is reconstructed transversely. Further-more, the number of slices is relatively few ranging from 30to 60 depending on slice thickness, and the angular rangeis typically less than 30◦. These specific features allow anaccurate ROI reconstruction without any pilot reconstruction.The key to this technique is (1) to generate a mask for eachprojection and use only the detector elements within the maskand (2) to estimate the minimum volume that needs to beupdated for the ROI reconstruction. As demonstrated in Fig. 5,ROI in the plane p is marked by a circle with its center ate(xe, ye, ze) and a radius of re. A circular mask is projected onthe projection data according to the tube position s(xs,ys,zs),
F. 5. A circular mask, which is formed by projecting the ROI boundaryalong the ray beam, indicates the minimum data set required to reconstructthe voxels in ROI.
Medical Physics, Vol. 42, No. 9, September 2015

5383 Xu et al.: IR to improve IQ for DBT 5383
which locates at the center c(xc, yc, zc). The value zc is 0 in thecoordinate system. The center (xc, yc) may be mathematicallywritten as
xc = xe−(xs− xe)ze
zs− ze,
yc = ye−(ys− ye)ze
zs− ze, (21)
with radius
rc = rezs
zs− ze. (22)
The circular mask in the projection domain indicates theminimum data set required to reconstruct the ROI. There-fore, the number of rays required for forward and backprojec-tion is significantly reduced. In addition, only a small portionof volume, which covers all the ray paths in every circularmask, is necessary for iterative updates. Rough computingrequirements given a typical DBT geometric configurationfollow.
Suppose 15 projections of 2048 × 1664 each are takenand that the bin size is 0.14 mm. To reconstruct 60 slicesof 1 mm thickness, a total of 200 megavoxels need to beupdated in IR iterations, where each voxel is divided into a0.14 × 0.14 × 1 mm grid. In contrast, consider a 7 × 7 mmROI covering a lesion that requires high resolution review. Ahigh spatial resolution ROI reconstruction with the voxel gridsize of 0.07× 0.07× 1 mm can be performed. By applyingour proposed method, only a 10×10×60 mm volume, whichinvolves about 0.6 megavoxels, is necessary for an IR update.Based on our implementation, these computations take onlyseconds for all iterations. In addition, since the uniform andfine voxel size is applied along each ray path, there are lessreconstruction artifacts associated with the partial volume ef-fect. In this work, we adopt ROI reconstruction to reduce thecomputational complexity for high spatial resolution.
2.E. Computation of the solution
Through minimizing the objective function Eq. (4), one canestimate the optimal µ∗, which is formalized as follows:
u∗= argminµ≥0Ψ(µ). (23)
With the choice of a strictly convex prior potential func-tion, the cost function defined in Eq. (3) is strictly convex aswell. ICD is an efficient algorithm to solve this problem. Byrepresenting the objective function as the second order Taylorseries expansion,49 the objective function is approximated bya quadratic form which allows the high dimension optimi-zation problem to be transferred to a sequential 1D optimalsearch. Interleaved nonhomogeneous and homogeneous voxelselection is used to speed up convergence by focusing thecomputation where it is most needed.30
The optimization-transfer (OT) based algorithm20 utilizesa series of separable surrogate parabolic functions lowerbounded by the objective function. Minimization of Eq. (4)is transferred to minimization of these surrogate ones. Wesummarize the OT method as the following algorithm scheme:
for each iteration t = 1,..., Niter doFind an surrogate function G(Θ,Φ) satisfying,(1) G(Θt,Θt)=Ψ(Θt),(2) Ψ(Θ) ≤G(Θ,Θt),∀Θt ,Θ,we apply one step of Newton’s method on the surrogate, theoptimal approximation at (t+1)-th iteration is written as
Θt+1=Θt−∇2
ΘG(Θt,Θt)−1∇ΘG(Θt,Θt), (24)end for
where G(Θ,Θt) is a separable surrogate function lower bound-ed by Ψ(Θ) at Θt. The first Θ represents the linear attenuationcoefficient vector µ. We use Θt+1 to represent the optimal Θwhich leads to the smallest G(Θ,Θt). The “bounded” condi-tion to form G(Θ,Θt) automatically leads to a monotonicconvergence to the global optimal. ∇ΘG(Θt,Θt) representsthe gradient toward the global optimal in the solution space.∇2Θ
G(Θt,Θt)−1, which is the inverse of curvature of the sepa-rable surrogate function, denotes the search step size alongeach dimension. Due to the bounded condition, the curva-ture of the surrogate cannot be smaller than the curvature ofthe objective function, which results in a conservative stepsize.
The bounded condition is not necessary for monotonicity.In fact, a “nonbounded” surrogate with an aggressive step sizeis able to produce a monotonic convergence at faster rate.Some researchers have studied large step sizes. For example,an enlarged step size with the form of exponential power wasproposed for ML-EM reconstruction.50 The algorithm lacksmonotonicity, hence may have a problem with stability. Theidea of over-relaxed step size was also mentioned in Yu et al.30
for the ICD framework, where a factor of 1 to 2 was used toscale up the step size. However, a larger step does not mean afaster convergence and might even lead to divergence.
A method for successively increasing over-relaxation inan OT based algorithm was proposed.51 Instead of a largerstep size, an optimal step size, which produces the fastestconvergence at each search step, was derived with the form ofa scaled step size ρ∇2
ΘG(Θt,Θt)−1. An optimal scaling factor
ρ∗ was defined as
ρ∗=2
2−σmax−σmin, (25)
where 0 ≤ σmin ≤ σmax ≤ 1 are the smallest and largest eigen-values of the convergence matrix.51 The convergence rate isproportional to the largest eigenvalue.51 As iteration proceeds,the σmax has been demonstrated to change from 0 to 1, whichmeans that the convergence speed is gradually slowing downas the estimate at each step is approaching the global optimal.Therefore, the optimal ρ∗ in Eq. (25) varied from 1 to K, avalue larger than 1. That is, the optimal scaling factor ρ∗, whichproduces the optimal step size to achieve the fastest conver-gence rate at each iteration, is not scaled down gradually, butneeds to be successively increased iteratively, which is funda-mentally different from other methods50 where an exponentialfactor is supposed to be more conservative with increasingiterations.
The successively increasing over-relaxation OT based algo-rithm is proposed as follows:
Medical Physics, Vol. 42, No. 9, September 2015
5384 Xu et al.: IR to improve IQ for DBT 5384
ρ= 1 and a = δ (δ > 1 can be adjusted in a specific case)for each iteration t = 1,..., Niter doΘt+1
T =Θt−∇2
ΘG(Θt,Θt)−1∇ΘG(Θt,Θt)
Θt+1NEW=Θ
t+ ρ(Θt+1T −Θ
t)Calculate Ψ(Θt+1
T ) and Ψ(Θt+1NEW)
if Ψ(Θt+1NEW) ≤Ψ(Θt+1
T ) thenρ∗= a and Θt+1=Θt+1
NEWelseρ= 1 and Θt+1=Θt+1
T
end ifend for
ΘNEW is updated by a ρ-scaled difference between ΘT and thelast iteration’s estimate. In image reconstructions, ΘT repre-sents the linear attenuation vector µ, which can be updatedby using the separable surrogate technique.20 Using this tech-nique, we derived the iterative estimate of µ with the gGMRFprior in the following form:
µ(n+1)j = µ
(n)j −
Mi=1
li j(−die−<µ(n),li>+ yi)Mi=1
(li jNj=1
li jdie−<µ(n),li>)
×+λκ2
j
k∈Nj
p|µ(n)j−µ(n)
k|p−1
cpsign(∆ jk)
+2p(p−1)λκ2j
k∈Nj
|µ(n)j−µ(n)
k|p−2
cp
, (26)
where κ is precalculated (before iteration starts) by the back-projection operation as shown in Eq. (17); λ represents thepenalty weight in the place of Eq. (4); and p and c valuesare important parameters to control the trade-offs between theedge-preserving behavior and noise reduction. By comparingthe objective functions Ψ(ΘT) and Ψ(ΘNEW), the update strat-egy and ρ are determined. If Ψ(ΘNEW) is less than Ψ(ΘT),meaning the scaled solution is closer to the optimal in thesolution space, then Θ is updated by ΘNEW and ρ is increasedby a multiplier a. Otherwise, ΘT is used to update Θ, and ρis set to 1. For each iteration step, the algorithm always usesthe choice that achieves a faster convergence. For instance, anacceleration with a factor ϵ is gained in one iteration. After Miterations, an exponential gain of ϵM is achieved.
Given that a representative OT based method requires fullforward and backprojection for each iteration, our proposedmethod requires one extra voxel update. This update is per-formed concurrently with the original one, with a low compu-tational cost. In addition, the calculations of Ψ(ΘNEW) andΨ(ΘT) can reuse the error sinogram and the update operations.The efficiency of the proposed algorithm framework has beendemonstrated in our previous work.51
3. METHODS AND MATERIALS3.A. System description
We acquired data on the stationary DBT prototype sys-tem7,8 to assess the performance of the proposed method. In
this system, a flat-panel detector is used for image acquisition.The origin of the 3D coordinate system is located at the centerof the detector. With a 140 µm detector element pitch, thetotal projection size is 2048×1661. Multiple x-ray beams arepositioned along a straight line parallel to the detector plane.The detector is 690 mm from the source, which is designed tohave 15 x-ray beams spanning a distance of 323.8 mm fromend to end. The linear spacing between the x-ray beams variesto provide a regular 2◦ angular step size.
Breast phantoms were scanned on a stage with a 25.4 mmair gap. Projections were acquired using 28 kVp, a molyb-denum filter, a molybdenum target, and 20 mAs per projection.
3.B. Reconstructions for comparison study
In the comparison study, we compared FBP, SART, andOS MLEM (OS-EM) with the proposed statistical IR. In theremainder of this paper, we use the acronym SIR-ρ-OT to referto the proposed statistical IR, i.e., the successively increasingover-relaxation ρ-based OT (ρ-OT) algorithm for solving theestimation problem posed by SIR.
FBP based reconstruction is widely used in current com-mercial DBT products. Since FBP has a linear response, tun-ing the filter kernel permits a desired trade-off between reso-lution and noise. As a standard reference method, we applieda sampling density based ramp filter52 and a Hanning filter toremove the ring effects and high frequency noise. The kernelwas applied on each row of projection data in the path directionof the x-ray tube, and then the 3D volume was reconstructedby a pixel-driven backprojection.
Unlike the FBP algorithm, which is a one-step operation,iterative algorithms such as SART and OS-EM perform thereconstruction in a recursive fashion. During the iterations, a3D ray-driven method was employed for forward and backpro-jection. The number of iterations was determined based on asemiquantitative method.53 According to the method, curvesof objective function versus iterations, noise versus contrastas iteration proceeds and artifact spread function (ASF)6 weredrawn in a phantom study with the scanner. The number ofiterations was chosen based on those performance curves.
As a reference algorithm, SART is initiated by a backpro-jection and uses eight iterations, each of which is completedby going through all projections sequentially. For an OS basedmethod, there is usually fast convergence at the early iterationsbut eventually oscillation around the global optimal solution.To gain the initial acceleration and avoid the oscillation, weutilized three iterations with ordered subsets, followed byeight iterations with full data sets.
Our proposed statistical IR is solved by the successivelyincreasing over-relaxation OT framework described in Sec. 2with the iterative solution of Eq. (26). According to experi-ments in the literature,35 λ = 8 provided the best trade-off inmaintaining resolution and reducing noise among all inves-tigated λ for the quadratic regularization. Using the edge-preserving penalty with this same λ, the performance canbe further enhanced to achieve a better resolution with thesame amount of noise reduction. Three iterations with orderedsubsets, each of which consists of an individual projection,
Medical Physics, Vol. 42, No. 9, September 2015

5385 Xu et al.: IR to improve IQ for DBT 5385
F. 6. Spatial resolution measured along microcalcification on a focus plane reconstructed by SIR-ρ-OT with selected parameter combinations. (a) PSF curves;(b) MTF curves.
are used to start the estimation process and subsequently fiveiterations with full data sets are performed with the ρ-OTframework. One trick is utilized in our implementation, whereinstead of scaling up step size for all voxels in the samemanner, we only enlarge the step size of those presenting highfrequency features. Therefore, the voxel update in the mostvariable regions, such as edges between high and low-contrastand details within a complex background, contributes more tothe decrease of objective function value, which leads to a fasterconvergence in these regions. The details of the update strategywill be given in another paper.
3.C. Parameter optimization of IR model
The form of the gGMRF prior introduced in Sec. 2 dependson two parameters: p, which controls the degree of curvature inthe influence function in low- and high-contrast regions, andc, which determines the threshold between the two types ofregions. To seek the optimal parameter combination, recon-structions of a homogeneous breast phantom were performedwith multiple parameter choices. They were p = 2, cp = 1;p = 1.8, cp = 2; p = 1.8, cp = 2.5; p = 1.7, cp = 3.5; andp= 1.61, cp= 5.3. Point spread function (PSF) and contrast tonoise ratio (CNR) were applied to measure the results of theseparameter combinations. The case in which p= 2, cp= 1 spec-
F. 7. Measurement of PSF and CNR: (a) microcalcification, used to mea-sure PSF; (b) a mass object and its background, used to calculate CNR.
ifies a quadratic regularization. The reconstruction from thequadratic parameter combination was chosen as the baseline.
The PSF curves presented in Fig. 6(a) were measured byforming profiles through the isolated microcalcification shownin Fig. 7(a). These curves were then fitted into the Gaussianfunctions to remove noise. The Fourier transform of the fittedfunction is the modulation transfer function (MTF), as shownin Fig. 6(b). The spatial frequency at 50% MTF peak is usedto describe the in-plane spatial resolution. As discussed inSec. 2, a smaller p tends to introduce more edge-preservingbehavior toward the high contrast region. By increasing c, theinflexion is pulled closer to the origin to improve the low-contrast detectability. Among all parameter combinations forSIR-ρ-OT, the parameter set p= 1.61, c= 5.3 presents the bestfrequency response which is 18% higher than the baseline. Toinvestigate the contrast sensitivity, CNR is calculated by sub-tracting the mean value in the background marked as region 1[Fig. 7(b)] from the mean value in the mass region marked as2, and then dividing the standard deviation of the background.
The CNR and half-width of 50% MTF above are summa-rized in Table I, which shows that, in terms of CNR, all edge-preserving parameter combinations performed better than thebaseline reconstruction. The case of p = 1.61, cp = 5.3 pro-duced the second highest CNR and led to the highest resolu-tion. The parameter combination p= 1.8, cp= 2 produced thehighest CNR but yielded a slightly worse spatial resolutionthan the baseline. Based on these observations, p = 1.61, cp
= 5.3 may be a good compromise between contrast sensitivityand resolution. This is the parameter set that was adopted inthe rest of experiments.
T I. CNR and in-plane MTF for SIR-ρ-OT with selected parametercombinations.
Parameters CNR HWHM of MTF
p = 2, c = 1 (quadratic) 6.1601 4.0063p = 1.8, cp = 2 12.4267 3.9041p = 1.8, cp = 2.5 6.5769 4.1951p = 1.7, cp = 3.5 7.3294 4.3324p = 1.61, cp = 5.3 7.5906 4.6825
Medical Physics, Vol. 42, No. 9, September 2015

5386 Xu et al.: IR to improve IQ for DBT 5386
4. EXPERIMENTS AND RESULTS4.A. Improvement in detectability
In this section, experiments comparing detectability areconducted with a breast phantom composed of a tissue equiv-alent, complex, heterogeneous background, containing anassortment of microcalcifications, fibrils, and masses, wherethe grain size of microcalcifications varies from 0.130to 0.275 mm. All reconstructed results are presented incomparable display windows. For IR methods, the displaywindow was set to [0.0490,0.0601]. For FBP, it was set to[1.3660,1.3714]. The reason for the shifting is that, withoutperforming data matching, the reconstruction error from FBPwas deteriorated due to the highly incomplete sampling.
Results reconstructed by SIR-ρ-OT with the optimizedparameters were compared against those generated from thereference methods. A nonprewhitening (matched filter)observer signal-to-noise ratio (SNR)54 model is adopted toevaluate the microcalcification visibility. To fully demonstratethe advantage of SIR-ρ-OT, ROI reconstruction with higherresolution was deployed as well, where the transverse voxelsize in the ROI was reduced to 0.07 mm, which is half ofthe detector element size. The reconstructed results were thencompared to those with the original voxel size.
Figure 8 presents the comparison of microcalcificationsin circular masses reconstructed by the different methods.Each row represents reconstructions of microcalcifications of
F. 8. Comparison of microcalcification in mass reconstructed by differentmethods. (a) FBP, (b) SIR-ρ-OT, (c) OS-EM, (d) SART.
a different size, from 0.165 mm (top) to 0.275 mm (bottom).In the first row, the six microcalcifications can be seen clearlywhen the mass is reconstructed by SIR-ρ-OT in (b) but notwhen it is reconstructed by FBP in (a). This difficulty indetection is caused by insufficient spatial resolution. AlthoughOS-EM in (c) and SART in (d) produce resolution as highas the proposed method, the microcalcifications reconstructedby each of these methods are somewhat hidden in the noisybackground. Similar situations can be observed in the secondand third rows. The microcalcifications in the fourth and fifthrows are large enough to be detected among all methods.
To validate the microcalcification detectability improve-ment of our proposed method, we employed the nonprewhiten-ing (matched filter) observer SNR for a signal-known-exactly/background-known-exactly (SKE/BKE) task. This model isgiven as
SNR=λ+− λ−
σ2++σ
2−
2
, (27)
where λ denotes the conditional mean of a statistic λ given thatmicrocalcification is present or absent. Regarding this task,we use f + to represent a vectorized image patch that includesa single microcalcification. λ+ is then calculated as the innerproduct of f + and a signal-present template w, which is createdby binarizing the mean value of all signal-present f +. In thesame manner, λ− is computed as the inner product of f −whichis a microcalcification free image vector and w. The λ is thencomputed by averaging each of the signal responses with thesame template applied. In addition, σ2
+ = wTK+w, where K+
is the covariance of all applied f +.We scanned the phantom three times with the same acqui-
sition parameters. Volumes were reconstructed by each ap-proach. To calculate the SNR for microcalcification of eachsize, a 6 by 6 image patch containing the microcalcificationwas vectorized. There are six microcalcifications for each sizeavailable in one mass as shown in Fig. 8. Hence, a total of18 image patches can be used to calculate the λ+. λ− wascomputed by using 180 image patches over multiple recon-struction slices. Covariance was computed from 800 imagescollected from different locations and multiple adjacent recon-struction slices. In order to obtain a larger number of ROIs,we assumed that σ+ and σ− are identical. Such assumptionsare valid in the limit of small signals but may be violated forlarger signals. Due to a small number of data sets availableto compute σ+, however, we invoked the assumptions for allmicrocalcification sizes to avoid bias in covariance estimation.
T II. Nonprewhitening (matched filter) observer SNR measured on mi-crocalcifications within mass as shown in Fig. 8.
FBP SIR-ρ-OT OS-EM SART
Row 1 12.2 15.5 13.7 14.3Row 2 24.4 32.8 25.2 26.9Row 3 33.0 35.4 32.9 34.4Row 4 36.3 38.0 36.4 36.1Row 5 47.5 48.7 44.9 46.2
Medical Physics, Vol. 42, No. 9, September 2015

5387 Xu et al.: IR to improve IQ for DBT 5387
F. 9. Comparison of fibrils in mass reconstructed by different methods.(a) FBP, (b) SIR-ρ-OT, (c) OS-EM, (d) SART.
A comparison of the SNR results of all methods is summa-rized in Table II. The values in the table align with our obser-vations. For example, in agreement with our observation thatsmall microcalcifications in the second rows could be moreeasily detected using the SIR-ρ-OT method, the observer SNRvalue corresponding to SIR-ρ-OT is obviously higher than thatof its competitors: 34% higher than the SNR value for FBPand over 20% higher than that for other IR methods. The SNRvalues in rows 3, 4, and 5, which represent easier detectiontasks, are only slightly different among all methods.
Figure 9 presents the comparison of fibrils in circularmasses reconstructed by each method. All fibrils in theseresults are detectable. Compared with the results of FBPreconstruction in (a), SIR-ρ-OT produces a much clearerboundary and enhanced contrast for each mass. The resultsof OS-EM in (c) and SART reconstruction in (d) presentrelatively high noise which makes the boundaries of fibrilsmore obscure.
Figure 10 shows an 8.4×8.4 mm area that includes multiplemicrocalcifications embedded in a mass. Compared to FBP
F. 10. Zoomed focus plane with a mass and several granular microcalcifi-cation. (a) SIR-ρ-OT with low resolution, (b) SIR-ρ-OT with high resolution,(c) FBP with low resolution.
F. 11. Zoomed focus plane with a circular mass and six tiny microcalcifica-tion. (a) SIR-ρ-OT with low resolution, (b) SIR-ρ-OT with high resolution,(c) FBP with low resolution.
reconstruction with low spatial resolution shown in Fig. 10(c),SIR-ρ-OT reconstruction with low spatial resolution, shownin Fig. 10(a), significantly reduces the noise in the soft tissue.The image reconstructed by SIR-ρ-OT with high resolution isshown in Fig. 10(b). Comparing (b) to (a) and (c), we noticethat the slowly varying area in the image presents a little highernoise than (a) but still lower than (c). The most significantdifference is the reconstruction of the microcalcifications. (b)shows the sharpest edge for each microcalcification among allcompetitors.
The high spatial resolution reconstruction was also appliedin a ROI with small, barely visible objects. Figure 11 presentsreconstructed images where six smaller microcalcifications of0.130 mm are located in a circular mass within a 14×14 mmarea. The small objects are highly obscured in the results oflow-resolution IR shown in (a) and low-resolution FBP shownin (c). The nonvisibility is mainly caused by insufficient spatialresolution. As shown in (b), SIR-ρ-OT with high resolution ledto better detectability than did the other two methods. In fact,it led to all of the small objects being visible. The higher noisein 11(b) could be better suppressed by applying a larger λ.
4.B. Performance for in-plane resolution/noisetrade-offs
For a comparison of in-plane properties at equal resolutionbetween the reference methods and the proposed method, wereconstructed the image shown in Fig. 7(a). In-plane MTF
F. 12. In-plane MTF measured along microcalcification on a focus planereconstructed by SIR-ρ-OT, FBP, SART, and OS-EM.
Medical Physics, Vol. 42, No. 9, September 2015

5388 Xu et al.: IR to improve IQ for DBT 5388
T III. Comparison of in-plane MTF, noise, and CNR for SIR-ρ-OT andthe reference methods.
FBP SIR-ρ-OT SART OSEM
50% MTF 4.134 4.683 4.766 4.76610% MTF 6.836 7.807 7.988 7.988Standarddeviation (10−4)
7.747 6.644 18.713 17.532
CNR 2.663 7.590 4.550 4.498
was calculated. The standard deviation of noise was measuredin a homogeneous region shown in Fig. 7(b). The CNR wasevaluated for the regions in Fig. 7(b). Results are presented inFig. 12 and Table III.
The measured in-plane MTF for SIR-ρ-OT was compa-rable to that of the SART and OS-EM images, and better thanthat of the FBP image. SIR-ρ-OT presented a 60%–70% noisereduction compared with SART and OS-EM. Furthermore,SIR-ρ-OT provided the best CNR performance among allmethods: close to 1.7 times as high as the performance ofSART and OS-EM, and 3 times as high as FBP.
4.C. Reduction of cross-plane artifacts
We calculated ASF6 to evaluate image blur in the Z direc-tion that is perpendicular to the X–Y detector plane. The imageblur is mainly introduced by the highly undersampled geom-etry. ASF is defined as the ratio of the CNR values betweenthe off-plane layer and the in-plane layer. The measurementwas performed on a breast phantom with a homogeneousbackground.
Figure 13 shows the ASF curves of the selected mass andthe microcalcification shown in Fig. 7. The layers at negativedistances denote the image slices below the feature layer, andthose at positive distances denote image slices above. The FBPresults produced a slowly decreasing ASF curve, indicating astrong interplane blurring effect for the mass object. SIR-ρ-OT, OS-EM, and SART results, on the other hand, producedASF curves that dropped quickly as the distance from thefeature increased, indicating that these techniques are superiorin suppressing interplane blurring.
With the microcalcification, all four methods had compa-rable ASF behaviors at the off-plane close to the in-plane layer.However, at the off-planes farther away from the in-planelayer, the curve from the FBP reconstruction tends to decreaseslowly, whereas those from the other three methods decreasedmore quickly, indicating that those methods were better atmitigating the cross-plane artifacts. SIR-ρ-OT showed slightlyfewer cross-plane artifacts than the other IRs.
The difference between the FBP reconstruction curve andthe other curves was greater in the mass ASF plot versusthe microcalcification plot. This behavior was predictable. InFourier space, the frequency contents of a large object maybe more varied in magnitude than those of a small object. Asa result, the small object could be restored much more easilythan the larger object, when the same Fourier space samplingwas used.
5. DISCUSSION AND CONCLUSION
We have presented multiple key statistical IR techniques forDBT image reconstruction. The effects of the penalty weightλ on the appearance of the reconstructed images were fullyinvestigated using a quadratic regularization with a precom-puted parameter κ. κ was also extended to incorporate ourproposed gGMRF prior. This prior provides flexibility in itsparameters necessary to control the behavior both around theorigin and at the tails of the distribution. Our experiments showthat a superior trade-off between resolution and noise couldbe achieved by optimizing the parameter combination of pand c. Based on an efficient ray-driven model, we proposedan oversampling technique on the detector elements that canimprove the reconstruction accuracy for high spatial resolutionand hence enable improved detectability of microcalcifica-tions whose grain size is smaller than the detector element size.
According to our phantom studies, in which we used anonprewhitening (matched filter) observer metric and visualcomparisons, our proposed statistical IR performed better thantraditional approaches in difficult detection tasks. Comparedto other IR methods such as SART and OS-EM, the proposedSIR-ρ-OT method provided comparable spatial resolutionwith improved CNR performance. These benefits, together
F. 13. Comparison of ASF curves of the selected mass and microcalcification in the results reconstructed by FBP, SIR-ρ-OT, OS-EM, and SART. (a) ASFcurve of mass object; (b) ASF curve of microcalcification object.
Medical Physics, Vol. 42, No. 9, September 2015

5389 Xu et al.: IR to improve IQ for DBT 5389
with those described above, potentially improve the abilityto detect small microcalcifications and reveal low-contrastlesions in clinical applications. In addition, compared to FBP,all IR methods can effectively reduce interplane blurring andartifacts with better ASF behavior, and significantly improveobject conspicuity by removing the overlapping structures.
A practical ROI reconstruction with high spatial resolutionwas applied to reduce the number of rays and the numberof reconstructed voxels. Based on our preliminary evaluation,this solution profoundly lowers the computational complexityand the memory used. However, since IR-based methods stillneed multiple iterations to be convergent, convergence rateremains a challenge for clinical applications. An efficient OT-based algorithm framework with a successively increasingover-relaxation was discussed together with the convergenceanalysis. This method potentially allows fewer iterations toachieve decent image quality and acceptable convergence.
Recent progress in hardware and parallel computing allowsthe realization of the computationally expensive statistical IRin clinical applications. Hardware accelerations will enable thesuperior image quality provided by the proposed statistical IR.Future works will be conducted to investigate these hardwareaccelerations in order to benefit diagnostics in real clinicalapplications.
ACKNOWLEDGMENTS
This work is partly supported by Grant No. NIH/NCIR01 CA134598-01A1. Shiyu Xu wants to thank Dr. SantoshKulkarni and Debashish Pal, both at GE Healthcare, andDr. J. Webster Stayman, in Biomedical Engineering at JohnsHopkins University, for their valuable comments.
a)First author Shiyu Xu was supported for his PhD work on this study byfunding from NIH and Southern Illinois University. Electronic mail: [email protected]
b)Corresponding author. Electronic mail: [email protected]; Present address:MC 6603, Department of Electrical and Computer Engineering, SouthernIllinois University, Carbondale, IL 62901; Telephone 618-453-7060.
1BreastCancer.org, “U.S. Breast Cancer Statistics,” available at http://www.breastcancer.org (2015), accessed July-18-2015.
2R. Holland, M. Mravunac, J. H. Hendriks, and B. V. Bekker, “So-calledinterval cancers of the breast: Pathologic and radiologic analysis of sixty-four cases,” Cancer 49, 2527–2533 (1982).
3J. T. Dobbins and D. J. Godfrey, “Digital X-ray tomosynthesis: Current stateof the art and clinical potential,” Phys. Med. Biol. 48(19), 65–106 (2003).
4J. T. Dobbins, “Tomosynthesis imaging: At a translational crossroads,” Med.Phys. 36(6), 1956–1967 (2009).
5Y. Chen, “Digital breast tomosynthesis (DBT)—A novel imaging tech-nology to improve early breast cancer detection: Implementation, compar-ison and optimization,” Ph.D. thesis, Department of Electrical ComputerEngineering, Duke University, 2007.
6Y. Zhang, “A comparative study of limited-angle cone-beam reconstructionmethods for breast tomosynthesis,” Med. Phys. 33, 3781–3795 (2006).
7X. Qian, R. Rajaram, X. Calderon-Colon, G. Yang, T. Phan, D. S. L. J.Lu, and O. Zhou, “Design and characterization of a spatially distributedmultibeam field emission x-ray source for stationary digital breast tomosyn-thesis,” Med. Phys. 36, 4389–4399 (2009).
8A. W. Tucker, J. Lu, and O. Zhou, “Dependency of image quality onsystem configuration parameters in a stationary digital breast tomosynthesissystem,” Med. Phys. 40(3), 031917 (10pp.) (2013).
9S. Xu, L. Cong, Y. Chen, J. Lu, and O. Zhou, “Breast tomosynthesis imag-ing configuration optimization based on computer simulation,” J. Electron.Imaging 23(1), 013017 (2014).
10H. Turbell, “Cone-beam reconstruction using filtered backprojection,” Ph.D.thesis, Department of Electrical Engineering, Linkoping University, 2001.
11E. J. Candes, J. Romberg, and T. Tao, “Robust uncertainty principles: Exactsignal reconstruction from highly incomplete frequency information,” IEEETrans. Inf. Theory 52, 489–509 (2006).
12G. L. Zeng, “A filtered backprojection algorithm with characteristics of theiterative landweber algorithm,” Med. Phys. 39(2), 603–607 (2012).
13T. Mertelmeier, J. Orman, W. Haerer, and M. K. Dudam, “Optimizingfiltered backprojection reconstruction for a breast tomosynthesis prototypedevice,” Proc. SPIE 6142, 61420F (2006).
14A. H. Andersen and A. C. Kak, “Simultaneous algebraic reconstruction tech-nique (SART): A superior implementation of the art algorithm,” Ultrason.Imaging 6, 81–93 (1984).
15A. H. Andersen, “Algebraic reconstruction in CT from limited views,” IEEETrans. Image Process. 8, 50–55 (1989).
16M. Bertero, T. A. Poggio, and V. Torre, “Ill-posed problems in early vision,”Proc. IEEE 76(8), 869–889 (1988).
17K. Lange, M. Bahn, and R. Little, “A theoretical study of some maximumlikelihood algorithms for emission and transmission tomography,” IEEETrans. Med. Imaging 6, 106–114 (1987).
18K. Lange and J. A. Fessler, “Globally convergent algorithms for maximuma posteriori transmission tomography,” IEEE Trans. Med. Imaging 4(10),1430–1438 (1995).
19A. D. Pierro, “On the relation between the ISRA and the EM algorithm forpositron emission tomography,” IEEE Trans. Med. Imaging 12, 328–333(1993).
20H. Erdogan and J. A. Fessler, “Monotonic algorithms for transmissiontomography,” IEEE Trans. Med. Imaging 18, 801–814 (1999).
21J. A. Fessler, “Iterative method for image reconstruction,” EECS Depart-ment, The University of Michigan, ISBI Tutorial, April 6, 2006.
22I. A. Elbakri and J. A. Fessler, “Efficient and accurate likelihood for iterativeimage reconstruction in X-ray computed tomography,” Proc. SPIE 5032(3),480–492 (2003).
23I. A. Elbakri and J. A. Fessler, “Statistical X-ray computed tomographyimage reconstruction with beam hardening correction,” Proc. SPIE 4322,1–12 (2001).
24J. A. Fessler, “Grouped coordinate descent algorithms for robust edge-preserving image restoration,” Proc. SPIE 3170, 184–194 (1997).
25J. A. Fessler, “Penalized weighted least-squares image reconstruction forpositron emission tomography,” IEEE Trans. Med. Imaging 13, 290–300(1994).
26J.-B. Thibault, K. D. Sauer, C. A. Bouman, and J. Hsien, “A three-dimensional statistical approach to improved image quality for multislicehelical CT,” Med. Phys. 34(11), 4526–4544 (2007).
27S. J. LaRoque, E. Y. Sidky, and X. Pan, “Accurate image reconstruction fromfew-views and limited-angle data in divergent-beam CT,” JOSA A 25(7),1772–1782 (2008).
28Z. Tian, X. Jia, K. Yuan, T. Pan, and S. B. Jiang, “Low-dose CT reconstruc-tion via edge-preserving total variation regularization,” Phys. Med. Biol.56(18), 5949–5967 (2011).
29J. W. Stayman, Y. Otake, J. L. Prince, A. J. Khanna, and J. H. Siewerd-sen, “Model-based tomographic reconstruction of objects containing knowncomponents,” IEEE Trans. Med. Imaging 31, 1837–1848 (2012).
30Z. Yu, J.-B. Thibault, C. A. Bouman, K. D. Sauer, and J. Hsien, “Fastmodel-based x-ray CT reconstruction using spatially non-homogeneousICD optimization,” IEEE Trans. Image Process. 20(1), 161–175 (2011).
31T. Wu, “Tomographic mammography using a limited number of low-dosecone-beam projection images,” Med. Phys. 30, 365–380 (2003).
32M. Das, H. C. Gifford, J. M. O’Connor, and S. J. Glick, “Penalized maximumlikelihood reconstruction for improved microcalcification detection in breasttomosynthesis,” IEEE Trans. Med. Imaging 30, 904–914 (2011).
33S. Xu and Y. Chen, “Compton scattering suppression based image recon-struction method for digital breast tomosynthesis,” in IEEE InternationalWorkshop on Genomic Signal Processing and Statistics (IEEE, 2011),pp. 190–193.
34S. Xu and Y. Chen, “An simulation based image reconstruction strategy withpredictable image quality in limited-angle X-ray,” Proc. SPIE 8668, 86685P(2013).
35S. Xu, Y. Chen, J. Lu, and O. Zhou, “An application of pre-computed back-projection based penalized-likelihood image reconstruction on stationarydigital breast tomosynthesis,” Proc. SPIE 8668, 86680V (2013).
36J. Hsieh, Computed Tomography: Principles, Design, Artifacts, and RecentAdvances (SPIE, Bellingham, WA, 2009).
Medical Physics, Vol. 42, No. 9, September 2015

5390 Xu et al.: IR to improve IQ for DBT 5390
37C. A. Bouman and K. Sauer, “A generalized Gaussian image model foredge-preserving MAP estimation,” IEEE Trans. Image Process. 2, 296–310(1993).
38S. Xu, C. R. Inscoe, J. Lu, O. Zhou, and Y. Chen, “Pre-computed back-projection based penalized-likelihood (PPL) reconstruction with an edge-preserved regularizer with stationary digital breast tomosynthesis,” Proc.SPIE 9033, 903359 (2014).
39B. D. Man and S. Basu, “Distance-driven projection and backprojection inthree dimensions,” Phys. Med. Biol. 49(11), 2463–2475 (2004).
40E. U. Mumcuoglu, R. Leahy, S. R. Cherry, and Z. Zhou, “Fastgradient-based methods for Bayesian reconstruction of transmissionand emission PET images,” IEEE Trans. Med. Imaging 13(4), 687–701(1994).
41H. Erdogan and J. A. Fessler, “Ordered subsets algorithms for transmissiontomography,” Phys. Med. Biol. 44, 2835–2851 (1999).
42J. Amanatides and A. Woo, “A fast voxel traversal algorithm for ray tracing,”Proc. Eurographics 87, 3–10 (1987).
43J. A. Fessler and W. L. Rogers, “Resolution properties of regularized imagereconstruction methods,” Technical Report 297, Communication and SignalProcessing Laboratory, Department of EECS, University of Michigan, AnnArbor, MI 48109-2122, 1995.
44S. Ahn and R. M. Leahy, “Spatial resolution properties of nonquadraticallyregularized image reconstruction for PET,” in 3rd IEEE InternationalSymposium on Biomedical Imaging: Macro to Nano (IEEE, 2006),pp. 287–290.
45C. Miao, “Comparative studies of different system models for iterative CTimage reconstruction,” Ph.D. thesis, Wake Forest University, 2013.
46W. Zhuang, S. Gopal, and T. J. Hebert, “Numerical evaluation of methodsfor computing tomographic projections,” IEEE Trans. Nucl. Sci. 41(4),1660–1665 (1994).
47B. Hamelin, Y. Goussard, J.-P. D. G. Cloutier, G. Beaudoin, and G. Soulez,“Design of iterative ROI transmission tomography reconstruction proce-dures and image quality analysis,” Med. Phys. 37(9), 4577–4589 (2010).
48Z. Yu, J.-B. Thibault, C. A. Bouman, K. Sauer, and J. Hsieh, “Edgelocalized iterative reconstruction for computed tomography,” in Proceed-ings of the 10th International Meeting on Fully Three-Dimensional ImageReconstruction in Radiology and Nuclear Medicine (IEEE, 2009).
49Z. Yu, J.-B. Thibault, C. A. Bouman, K. D. Sauer, and J. Hsien, “Acceleratedline search for coordinate descent optimization,” IEEE Nucl. Sci. Symp.Conf. Rec. 5, 2841–2844 (2006).
50D. Hwang and G. L. Zeng, “Convergence study of an accelerated ML-EMalgorithm using bigger step size,” Phys. Med. Biol. 51, 237–252 (2006).
51S. Xu, Z. Zhang, and Y. Chen, “Statistical iterative reconstruction using fastoptimization transfer algorithm with successively increasing factor in digitalbreast tomosynthesis,” Proc. SPIE 9033, 90335C (2014).
52G. M. Stevens, R. Fahrig, and N. J. Pelc, “Filtered backprojection formodifying the impulse response of circular tomosynthesis,” Med. Phys.28(3), 372–380 (2001).
53S. Xu, H. Schurz, and Y. Chen, “Parameter optimization of relaxed orderedsubsets pre-computed back projection (BP) based penalized-likelihood (OS-PPL) reconstruction in limited-angle X-ray tomography,” Comput. Med.Imaging Graphics 37(4), 304–312 (2013).
54R. F. Wagner and D. G. Brown, “Unified SNR analysis of medical imagingsystems,” Phys. Med. Biol. 30, 489–518 (1985).
Medical Physics, Vol. 42, No. 9, September 2015