statistical learning algorithms applied to automobile insurance ratemaking cas seminar on ratemaking...
TRANSCRIPT

Statistical Learning Algorithms Applied to Automobile Insurance
Ratemaking
CAS Seminar on RatemakingSan Antonio, TX, March 27th, 2003
Charles Dugas, M.Sc.A., A.S.A.Apstat Technologies Inc.
and University of Montréal

Outline
Training an ANN
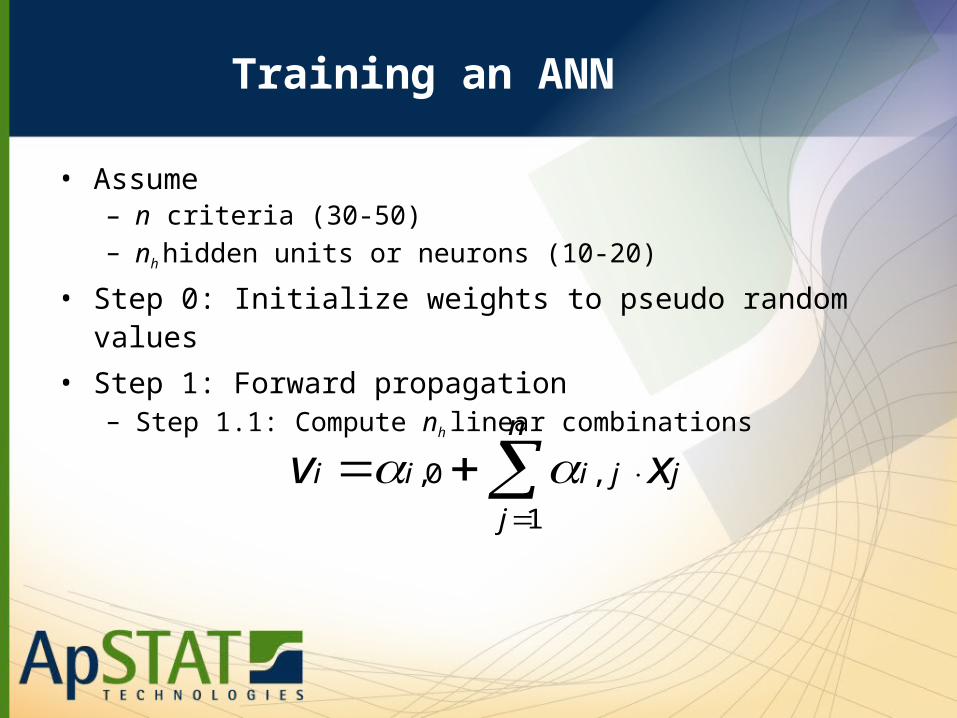
• Assume– n criteria (30-50)– nh hidden units or neurons (10-20)
• Step 0: Initialize weights to pseudo random values
• Step 1: Forward propagation– Step 1.1: Compute nh linear combinations
n
j
jjiii xv1
,0,
Training an ANN (cont’d)
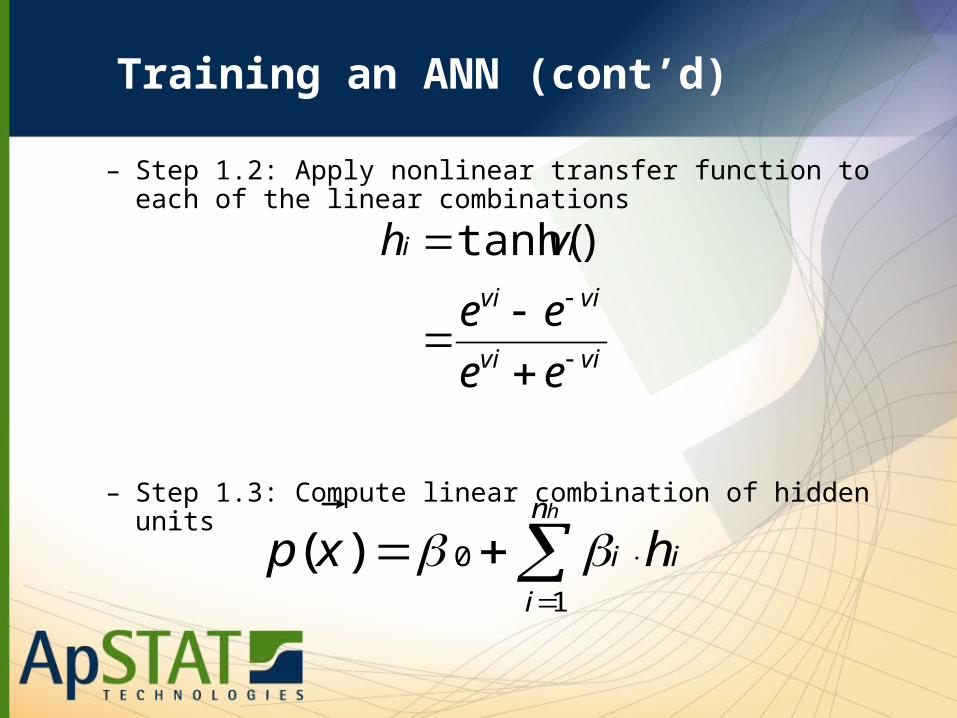
– Step 1.2: Apply nonlinear transfer function to each of the linear combinations
– Step 1.3: Compute linear combination of hidden units
hn
i
ii hxp1
0)(
vivi
vivi
ii
ee
ee
vh
)tanh(

Outline

Training an ANN (cont’d)
• Step 2: Compute approximation error
• Step 3: Backpropagate error and update weights
jijiji
jijiji
e
e
,
2
,,
,
2
,,
'
'
22 ))(( yxpe

Training an ANN (cont’d)
• Epoch: Repeat Steps 1,2 and 3 for each record in the database (100K - 1M).
• Whole training: multiple epochs (10,100,1000).

Nonlinear Transfer Function
• Finite range output : [-1,1] or [0,1]
• “Integrate and fire” neural computation
• Continuous function allows computation of derivatives
• Detect directions of interest
• Otherwise similar to Linear Regression

Pros and Cons
• Performance– successful in multiple industries : banking, pharma,
navigation, terrorism (e.g. HNC/FICO)
• Computationally demanding– no analytical solution– need to use optimization algorithms– multiple passes (epochs) through entire dataset– exponential function is slow
• Black boxes…

The Black Box Argument
Can not associate a specific meaning to each of the parameters
• Explain differences between premiums– gain&loss analysis– small program on laptop or PDA– amount for variables– amount for most important correlations– residual amount for high-level correlations
• Control over possible outcomes– neural networks lead to infinite number of premiums– commonly stated figure of 2:1 worst to best premium
• Explanation– actuarial end, not a business end– gain knowledge
• Legislation…

Challenge of Model Selection

Methodology for Model Selection

Credibility and Model Selection
Credibility
(table-based)
Model Selection
(neural nets)
Parameters trained on
subset of records all records
application local, theoretical global, operational
Bias/Variance dilemma
merge cells minimize mean-squared error

Numerical ResultsMean-Squared Error
Training Validation Test
Constant 56.1108 56.5744 67.1192
Linear 56.0780 56.5463 67.0909
GLM 56.0762 56.5498 67.0926
ANN 56.0706 56.5468 67.0903
Softplus ANN 56.0704 56.5480 67.0918
CHAID 56.0917 56.5657 67.1078
Condmean 56.0827 56.5508 67.0964
Mixture ANN 56.0743 56.5416 67.0851

Numerical ResultsRisk Sharing Pool

Conclusions
• Neural Nets need to be adapted for large claims
• Black box argument s/b put in perspective
• Model Selection is the counterpart to Credibility
• MSE Numerical results not as convining as RSP results
• ANNs should be adopted over the next few years

About Apstat
• Research contract
• 4 Founders: Advisor with 3 PhD students
• Former employers : AT&T, Bell Labs, DoD, FICO, Hydro-Québec, Lucent, MIT, Microsoft, NEC, Nortel, Swiss Re, W.M. Mercer
• insurance analytics (fraud detection, ratemaking, risk sharing pools, customer lifetime value)
• www.apstat.com

Insurance Analytics:CRM
CRM: Customer Relationship Management• market for profit, not numbers
– include CLV (customer lifetime value) – need to merge efforts from marketing & actuarial
• relationship marketing– traditional product-driven mass & and target marketing:– move on to customer-centric relationship marketing to
maximize each customer’s value• cross-selling (could ING direct databases be used to
target market insurance ?)• customer retention, behavior prediction, channel
optimization, personalization

Insurance Analytics: Core Actuarial
Underwriting, Ratemaking
• highly regulated
• strategic concerns
Reinsurance
• mainly market-driven, results from negotiations
• marginal role for analytics
• what is the probability of another WTC next year ?

Insurance Analytics: Fraud
“Detection is Prevention”
• 10% of claims in P&C insurance industry
• analytics for fast track
• increase adjusters’ containment of build-up
• analytics for adjusters’ referrals to SIUs
• increase investigator’s hit rate
• analytics for fraud rings
• deterrence measures (e.g. visit top 10% therapists)

ClaimArrival
Analytics
Fast Track / Express Paid
First Audit
Analytics
Audit PaidSecond Audit and Negotiation
(build-up)SIU
(fraud)
Insurance Analytics: Fraud

Insurance Analytics: Risk Sharing Pools
• purely analytical– legislation is looser– marketing not involved
• business case is quick and easy
• point of entry for new technologies in the industry.
• can’t be used for strategic purposes, theoretically…

RSP: Technicalities
Québec
• 10% of volume
• B.I. not included (SAAQ)
• facility within RSP
• exp. ratio: 25% fixed
• 100% ceeded
Ontario
• 5% of units (car years)
• B.I. included
• facility apart from RSP
• exp. ratio: 30% max.
• 85% ceeded

RSP:Methodology and Hypotheses
glmprojected
prractual
glmnn
prrnnprojected
grossprr
glmgross
PPF
PClaimsPF
LRPP
PPPF
PP
LRPP
/:sorting
/
/
%75
%75

RSP: Analysis of Numerical Results
• system recommends ceeding the full 10% of volume
• true if LR > 60%
• prior knowledge of LR (adjusted severity, frequency ca.17%)
• simulated underwriting (15%, 30%:1M$ PF)
• 100M$ volume
• LR = 65%

Conclusions
• RSP & PRR as testbeds for new technologies
• potential source of important profits
• NNs can reliably identify GLM weaknesses
• ad hoc reductions are RSP-costly
• pressure on analytics (direct, kanetix)
• analytics should merge– hard markets: use fraud patterns to pullout– soft markets: market with CLV

Outline
• Introduction to Neural Networks
• Pros and Cons
• The Black Box Argument
• Model Selection and Credibility
• Performance on Ratemaking
• Other applications
• Conclusions