statistical mechanics of allosteric...
TRANSCRIPT

Statistical Mechanics of Allosteric EnzymesTal Einav,† Linas Mazutis,‡ and Rob Phillips*,§
†Department of Physics, California Institute of Technology, Pasadena, California 91125, United States‡Institute of Biotechnology, Vilnius University, Vilnius, 02241 Lithuania§Department of Applied Physics and Division of Biology, California Institute of Technology, Pasadena, California 91125, UnitedStates
*S Supporting Information
ABSTRACT: The concept of allostery in which macromolecules switch between twodifferent conformations is a central theme in biological processes ranging from generegulation to cell signaling to enzymology. Allosteric enzymes pervade metabolicprocesses, yet a simple and unified treatment of the effects of allostery in enzymes hasbeen lacking. In this work, we take a step toward this goal by modeling allostericenzymes and their interaction with two key molecular playersallosteric regulatorsand competitive inhibitors. We then apply this model to characterize existing data onenzyme activity, comment on how enzyme parameters (such as substrate bindingaffinity) can be experimentally tuned, and make novel predictions on how to controlphenomena such as substrate inhibition.
1. INTRODUCTION
All but the simplest of cellular reactions are catalyzed byenzymes, macromolecules that can increase the rates ofreactions by many orders of magnitude. In some cases, suchas phosphoryl transfer reactions, rate enhancements can be aslarge as 1020-fold or more.1 A deeper understanding of howenzymes work can provide insights into biological phenomenaas diverse as metabolic regulation or the treatment ofdisease.2−4 The basic principles of enzyme mechanics werefirst proposed by Michaelis and Menten5 and later extended byothers.6−8 While the earliest models considered enzymes assingle-state catalysts, experiments soon revealed that someenzymes exhibit richer dynamics.9,10 The concept of allostericenzymes was introduced by Monod−Wyman−Changeux(MWC) and independently by Pardee and Gerhart,7,11−13
providing a much broader framework for explaining the fulldiversity of enzyme behavior. Since then, the MWC concept inwhich macromolecules are thought of as having both aninactive and active state has spread into many fields, proving tobe a powerful conceptual tool capable of explaining manybiological phenomena.14−16
Enzymology is a well studied field, and much has beenlearned both theoretically and experimentally about howenzymes operate.17−20 With the vast number of distinctmolecular players involved in enzymatic reactions (for example,mixed, competitive, uncompetitive, and noncompetitive inhib-itors as well as cofactors, allosteric effectors, and substratemolecules), it is not surprising that new discoveries continue toemerge about the subtleties of enzyme action.9,21,22 In thispaper, we use the MWC model to form a unifying frameworkcapable of describing the broad array of behaviors available toallosteric enzymes.
Statistical mechanics is a field of physics that describes thecollective behavior of large numbers of molecules. Historicallydeveloped to understand the motion of gases, statistical physicshas now seen applications in many areas of biology and hasprovided unexpected connections between distinct problemssuch as how transcription factors are induced by signals fromthe environment, the function of the molecular machineryresponsible for detecting small gradients in chemoattractants,the gating properties of ligand-gated ion channels, and even theaccessibility of genomic DNA in eukaryotes which is packedinto nucleosomes.23−29
The remainder of the paper is organized as follows. Insection 2.1, we show how the theoretical treatment of thetraditional Michaelis−Menten enzyme, an inherently non-equilibrium system, can be stated in a language remarkablysimilar to equilibrium statistical mechanics. This sets the stagefor the remainder of the paper by introducing key notation andthe states and weights formalism that serves as the basis foranalyzing more sophisticated molecular scenarios. In section2.2, we discuss how the states and weights formalism can beused to work out the rates for the simplest MWC enzyme, anallosteric enzyme with a single substrate binding site. This isfollowed by a discussion of how allosteric enzymes are modifiedby the binding of ligands, first an allosteric regulator in section2.3 and then a competitive inhibitor in section 2.4. We nextgeneralize to the much richer case of enzymes with multiplesubstrate binding sites in section 2.5. Lastly, we discuss how tocombine the individual building blocks of allostery, allosteric
Special Issue: William M. Gelbart Festschrift
Received: February 25, 2016Revised: April 10, 2016
Article
pubs.acs.org/JPCB
© XXXX American Chemical Society A DOI: 10.1021/acs.jpcb.6b01911J. Phys. Chem. B XXXX, XXX, XXX−XXX
effectors, competitive inhibitors, and multiple binding sites toanalyze general enzymes in section 2.6. Having built up thisframework, we then apply our model to understand observedenzyme behavior. In section 3.1, we show how disparateenzyme activity curves can be unified within our model andcollapsed onto a single curve. We close by examining the exoticphenomenon of substrate inhibition in section 3.2 and showhow the allosteric nature of some enzymes may be the key tounderstanding and controlling this phenomenon.
2. MODELS2.1. Michaelis−Menten Enzyme. We begin by briefly
introducing the textbook Michaelis−Menten treatment ofenzymes.18 This will serve both to introduce basic notationand to explain the states and weights methodology which wewill use throughout the paper.Many enzyme-catalyzed biochemical reactions are charac-
terized by Michaelis−Menten kinetics. Such enzymes comprisea simple but important class where we can study therelationship between the traditional chemical kinetics basedon reaction rates with a physical view dictated by statisticalmechanics. According to the Michaelis−Menten model,enzymes are single-state catalysts that bind a substrate andpromote its conversion into a product. Although this schemeprecludes allosteric interactions, a significant fraction ofnonregulatory enzymes (e.g., triosephosphate isomerase, bi-sphosphoglycerate mutase, adenylate cyclase) are welldescribed by Michaelis−Menten kinetics.18
The key player in this reaction framework is a monomericenzyme E which binds a substrate S at the substrate binding site(also called the active site or catalytic site), forming anenzyme−substrate complex ES. The enzyme then converts thesubstrate into product P which is subsequently removed fromthe system and cannot return to its original state as substrate. Interms of concentrations, this reaction can be written as
+ ⎯→⎯ +X Yoo[E ] [S] [ES] [E ] [P]k
k k
off
on cat
(1)
where the rate of product formation equals
=t
kd[P]
d[ES] cat (2)
Briggs and Haldane assumed a time scale separation wherethe substrate and product concentrations ([S] and [P]) slowly
change over time while the free and bound enzyme states ([E]and [ES]) changed much more rapidly.6 This allows us toapproximate this system over short time scales by assuming thatthe slow components (in this case [S]) remain constant andcan therefore be absorbed into the kon rate
30
+X Yooooooooo[E] [ES]k k
k [S]
off cat
on
(3)
Assuming that the system (3) reaches steady state (over theshort time scale of this approximation) quickly enough that thesubstrate concentration does not appreciably diminish, thisimplies
= +k k k[E][S] [ES]( )on off cat (4)
which we can rewrite as
=+
≡k
k k K[ES][E]
[S] [S]on
off cat M (5)
where = +K k kkM
off cat
onis called the Michaelis constant. KM
incorporates the binding and unbinding of ligand as well asthe conversion of substrate into product; in the limit kcat = 0,
KM reduces to the familiar dissociation constant =K kkD
off
on.
Using eq 5 and the fact that the total enzyme concentration isconserved, [E] + [ES] = [Etot], we can solve for [E] and [ES]separately as
=+
≡ p[E] [E ]1
1[E ]
K
tot [S] tot E
M (6)
=+
≡ p[ES] [E ]1
[E ]K
K
tot
[S]
[S] tot ESM
M (7)
where =pE[E]
[E ]totand =pES
[ES][E ]tot
are the probabilities of
finding an enzyme in the unbound and bound forms,respectively. Substituting the concentration of bound enzymes[ES] from eq 7 into the rate of product formation eq 2,
=+t
kd[P]
d[E ]
1
K
K
cat tot
[S]
[S]M
M (8)
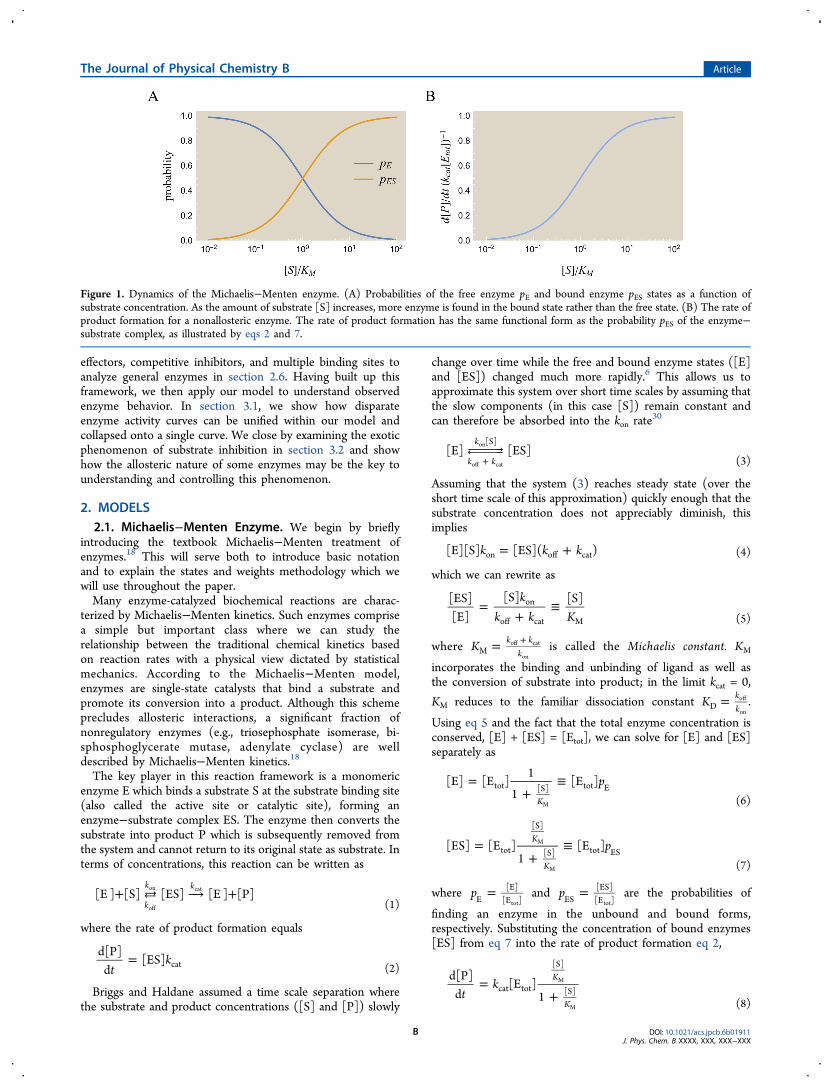
Figure 1. Dynamics of the Michaelis−Menten enzyme. (A) Probabilities of the free enzyme pE and bound enzyme pES states as a function ofsubstrate concentration. As the amount of substrate [S] increases, more enzyme is found in the bound state rather than the free state. (B) The rate ofproduct formation for a nonallosteric enzyme. The rate of product formation has the same functional form as the probability pES of the enzyme−substrate complex, as illustrated by eqs 2 and 7.
The Journal of Physical Chemistry B Article
DOI: 10.1021/acs.jpcb.6b01911J. Phys. Chem. B XXXX, XXX, XXX−XXX
B

Figure 1 shows the probability of free and bound enzyme aswell as the rate of product formation. The two parameters kcatand [Etot] scale t
d[P]d
vertically (if kcat is increased by a factor of
10, the y-axis values in Figure 1B will be multiplied by that samefactor of 10), while KM effectively rescales the substrateconcentration [S]. Increasing KM by a factor of 10 implies that10 times as much substrate is needed to obtain the same rate ofproduct formation; on the semilog plots in Figure 1, thiscorresponds to shifting all curves to the right by one power of10.We can visualize the microscopic states of the enzyme using a
modified states and weights diagram shown in Figure 2.31 The
weight of each enzyme state is proportional to the probability ofits corresponding state (wE ∝ pE, wES ∝ pES)the constant ofproportionality is arbitrary but must be the same for all weights.For example, from eqs 6 and 7, we can multiply the probabilitythat the enzyme will be unbound (pE) or bound to substrate
(pES) by +1K[S]
Mwhich yields the weights
=w 1E (9)
=wK[S]
ESM (10)
Given the weights of an enzyme state, we can proceed in thereverse direction and obtain the probability for each enzymestate using
= =+
pwZ
1
1K
EE
tot[S]
M (11)
= =+
pwZ 1
K
KES
ES
tot
[S]
[S]M
M (12)
where
= +Z w wtot E ES (13)
is the sum of all weights. Dividing by Ztot ensures the totalprobability of all enzyme states equals unity, pE + pES = 1. Therate of product formation eq 8 is given by the product of theenzyme concentration [Etot] times the average catalytic rate
over all states, weighed by each state’s (normalized) weights. Inthe following sections, we will find this trick of writing statesand weights very useful for modeling other molecular players.The weights in Figure 2 allow us to easily understand Figure
1A: when [S] < KM, wE > wES so that an enzyme is more likelyto be in the substrate-free state; when [S] > KM, wE < wES andan enzyme is more likely to be found as an enzyme−substratecomplex. Increasing KM shifts the tipping point of how muchsubstrate is needed before the bound ES enzyme state begins todominate over the free E state.It should be noted that the formal notion of states and
weights employed in physics applies only to equilibriumsystems. For example, a ligand binding to a receptor inequilibrium will yield states and weights similar to Figure 2 butwith the Michaelis constant KM replaced by the dissociationconstant KD.
32 However, the ligand−receptor states andweights can also be derived from the Boltzmann distribution(where the weight of any state j with energy Ej is proportionalto e−βEj) while the enzyme states and weights cannot be derivedfrom the Boltzmann distribution (because the enzyme system isnot in equilibrium). Instead, the nonequilibrium kinetics of thesystem are described by the modified states and weights inFigure 2, where KD for substrate must be replaced with KM.These modified states and weights serve as a mathematical trickthat compactly and correctly represents the behavior of theenzyme, enabling us to apply the well established tools andintuition of equilibrium statistical mechanics when analyzingthe inherently nonequilibrium problem of enzyme kinetics. Inthe next several sections, we will show how to generalize thismethod of states and weights to MWC enzymes withcompetitive inhibitors, allosteric regulators, and multiplesubstrate binding sites.
2.2. MWC Enzyme. Many enzymes are not static entitiesbut dynamic macromolecules that constantly fluctuate betweendifferent conformational states. This notion was initiallyconceived by Monod−Wyman−Changeux (MWC) to charac-terize complex multisubunit proteins such as hemoglobin andaspartate transcarbamoylase (ATCase).7,11,12 The authorssuggested that the ATC enzyme exists in two supramolecularstates: a relaxed “R” state, which has high affinity for substrate,and a tight “T” state, which has low affinity for substrate.Although in the case of ATCase the transition between the Tand R states is induced by an external ligand, recentexperimental advances have shown that many proteinsintrinsically fluctuate between these different states even inthe absence of ligand.33−35 These observations imply that theMWC model can be applied to a wide range of enzymesbeyond those with multisubunit complexes.We will designate an enzyme with two possible states (an
Active state EA and an Inactive state EI) as a MWC enzyme.The kinetics of a general MWC enzyme are given by
which relates the active and inactive enzyme concentrations([EA], [EI]) to the active and inactive enzyme−substratecomplexes ([EAS], [EIS]). In this two-state MWC model,similar to that explored by Howlett et al.,36 the rate of productformation is given by
Figure 2. States and weights for the Michaelis−Menten enzyme. Eachenzyme conformation is shown together with its weight and itscatalytic rate. The probability of finding an enzyme (green) in eitherthe free or bound state equals the weight of that state divided by the
sum of all weights ( +1K[S]
M) where [S] is the concentration of
substrate (dark red) and = +K k kkM
off cat
onis the Michaelis constant. At
[S] = KM, half of the enzyme population exists in the free form andhalf exists in the bound form. For [S] > KM, more than half of allenzymes will be bound to substrate.
The Journal of Physical Chemistry B Article
DOI: 10.1021/acs.jpcb.6b01911J. Phys. Chem. B XXXX, XXX, XXX−XXX
C

= +t
k kd[P]
d[E S] [E S]cat
AA cat
II (15)
The active state will have a faster catalytic rate (often muchfaster) than the inactive state, kcat
A > kcatI .
As in the case of a Michaelis−Menten enzyme, we willassume that all four forms of the enzyme (EA, EI, EAS, and EIS)quickly reach steady state on time scales so short that thesubstrate concentration [S] remains nearly constant. Therefore,we can incorporate the slowly changing quantities [S] and [P]into the rates, a step dubbed the quasi-steady-state approx-imation.30 This allows us to rewrite eq 14 in the following form
Assuming the quasi-steady-state approximation holds, thefour enzyme states will rapidly attain steady-state values
= = = =t t t t
d[E S]d
d[E ]d
d[E S]d
d[E ]d
0A A I I(17)
In addition, a separate constraint on the system that isnecessary and sufficient to apply the method of states andweights is given by the cycle condition: the product of ratesgoing clockwise around any cycle must equal the product ofrates going counterclockwise.30 It should be noted that, toviolate the cycle condition, a system must continuously payenergy, since at least one step in any cycle must be energeticallyunfavorable. We shall proceed with the assumption that thereare no such cycles in our system. For the MWC enzyme (eq16), this implies
+ = +k k k k k k k k k k( [S]) ( ) ( ) ( [S])onA
transAS
offI
catI
transI
offA
catA
transA
onI
transIS
(18)
or equivalently
⏟ ⏟+
=+
kk k
kk
kk k
kk
[S] [S]onA
offA
catA
[E S][E ]
transI
transA
[E ][E ]
onI
offI
catI
[E S][E ]
transIS
transAS
[E S][E S]
A
A
A
II
I
A
I (19)
The validity of both the quasi-steady-state approximation(17) and the cycle condition (19) will be analyzed in section A
of the Supporting Information. Assuming both statements hold,we can invoke detailed balancethe ratio of concentrationsbetween two enzyme states equals the inverse of the ratio ofrates connecting these two states. For example, between theactive states [EAS] and [EA] in eq 16
=+
≡k
k k K[E S][E ]
[S] [S]A
A
onA
offA
catA
MA
(20)
where we have defined the Michaelis constant for the activestate, KM
A . Similarly, we can write the equation for detailedbalance between the inactive states [EIS] and [EI] as
=+
≡k
k k K[E S][E ]
[S] [S]I
I
onI
offI
catI
MI
(21)
An enzyme may have a different affinity for substrate or adifferent catalytic rate in the active and inactive forms. Typicalmeasured values of KM fall into the range 10−7−10−1 M.37
Whether KMA or KM
I is larger depends on the specific enzyme.As a final link between the language of chemical rates and
physical energies, we can recast detailed balance between [EA]and [EI] as
= ≡ β ϵ ϵ− −kk
[E ][E ]
eA
I
transI
transA
( )A I
(22)
where ϵA and ϵI are the free energies of the enzyme in the activeand inactive states, respectively, and β =
k T1
B, where kB is
Boltzmann’s constant and T is the temperature of the system.Whether the active state energy is greater than or less than theinactive state energy depends on the enzyme. For example, ϵI <ϵA in ATCase, whereas the opposite holds true, ϵA < ϵI, inchemoreceptors.9,32
Using eqs 20−22, we can recast the cycle condition (19) (asshown in the underbraces) into a simple relationship betweenthe steady-state enzyme concentrations. Additionally, we canuse these equations to define the weights of each enzyme statein Figure 3. Following section 2.1, the probability of each stateequals its weight divided by the sum of all weights
= βϵ−pZ
e1
Etot
A
A
(23)
= βϵ−pZ
e KE S
[S]
totA
A MA
(24)
Figure 3. States and weights for a MWC enzyme. The energies ϵA and ϵI provide the free energy scale for the substrate-free conformations, dictatingtheir relative probabilities. Decreasing the energy ϵA of the active state would increase the probability of all the active enzyme conformations relativeto the inactive conformations. KM
A denotes the substrate concentration at which half of the active enzymes are bound and half of the active enzymesare unbound, as indicated by the crossing of the (pEA
, blue) and (pEAS, gold) curves at [S] = KMA in Figure 4. KM
I serves an analogous role for the
inactive states.
The Journal of Physical Chemistry B Article
DOI: 10.1021/acs.jpcb.6b01911J. Phys. Chem. B XXXX, XXX, XXX−XXX
D

= βϵ−pZ
e1
Etot
I
I
(25)
= βϵ−pZ
e KE S
[S]
totI
I MI
(26)
where
= + + +βϵ βϵ− −⎛⎝⎜
⎞⎠⎟
⎛⎝⎜
⎞⎠⎟Z
K Ke 1
[S]e 1
[S]tot
MA
MI
A I
(27)
Note that multiplying all of the weights by a constant c will alsomultiply Ztot by c, so that the probability of any state will remainunchanged. That is why in Figure 2 we could neglect the e−βϵ
factor that was implicitly present in each weight.The total amount of enzyme is conserved among the four
enzyme states, [Etot] = [EA] + [EAS] + [EI] + [EIS]. Using thisfact together with eqs 20−22 enables us to solve for theconcentrations of both types of bound enzymes, namely,
=+ + +
=βϵ
βϵ βϵ
−
− −( ) ( )p[E S] [E ]
e
e 1 e 1[E ]K
K K
A tot
[S]
[S] [S]tot E S
A
MA
A
MA
I
MI
A
(28)
=+ + +
=βϵ
βϵ βϵ
−
− −( ) ( )p[E S] [E ]
e
e 1 e 1[E ]K
K K
I tot
[S]
[S] [S]tot E S
I
MI
A
MA
I
MI
I
(29)
Substituting these relations into eq 15 yields the rate of productformation
=+
+ + +
βϵ βϵ
βϵ βϵ
− −
− −( ) ( )t
k kd[P]d
[E ]e e
e 1 e 1
K K
K K
tot
catA [S]
catI [S]
[S] [S]
A
MA
I
MI
A
MA
I
MI (30)
The probabilities (23)−(26) of the different states and the rateof product formation (30) are shown in Figure 4. Although weuse the same parameters from Figure 1 for the active state, the
pEAand pEAS curves in Figure 4A look markedly different from
the pE and pES Michaelis−Menten curves in Figure 1A. Thisindicates that the activity of a MWC enzyme does not equal theactivity of two independent Michaelis−Menten enzymes, onewith the MWC enzyme’s active state parameters and the otherwith the MWC enzyme’s inactive state parameters. Theinterplay of the active and inactive states makes a MWCenzyme inherently more complex than a Michaelis−Mentenenzyme.When [S] = 0, the enzyme only exists in the unbound states
EA and EI whose relative probabilities are given by
= β ϵ ϵ− −ep
p( )EA
EI
A I . When [S] → ∞, the enzyme spends all of its
time in the bound states EAS and EIS which have relative
probabilities = β ϵ ϵ− −ep
pKK
( )EAS
EIS
A I MI
MA . The curves for the active states
(for free enzyme pEAand bound enzyme pEAS) intersect at [S] =
KMA , while the curves of the two inactive states intersect at [S] =
KMI . For the particular parameters shown, even though the
unbound inactive state (green) dominates at low substrateconcentrations, the active state (gold) has the largest statisticalweights as the concentration of substrate increases. Thus,adding substrate causes the enzyme to increasingly favor theactive state.Using this framework, we can compute properties of the
enzyme kinetics curve shown in Figure 4B. One importantproperty is the dynamic range of an enzyme, the differencebetween the maximum and minimum rate of productformation. In the absence of substrate ([S] → 0) and asaturating concentration of substrate ([S] → ∞), the rate ofproduct formation (eq 30) becomes
=→ t
limd[P]
d0
[S] 0 (31)
=+
+→∞
βϵ βϵ
βϵ βϵ
− −
− −t
k klim
d[P]d
[E ] K K
K K[S]
tot
catA e
catI e
e e
A
MA
I
MI
A
MA
I
MI (32)
Figure 4. Quantitative description of a MWC enzyme. (A) Probabilities of each enzyme state. While the active state has the same catalytic rate kcatA
and Michaelis constant KMA as the Michaelis−Menten enzyme in Figure 1A, the inactive state significantly alters the forms of pEA
and pEAS. The dashed
vertical lines indicate where the substrate concentration equals KMA and KM
I , respectively. (B) The rate of product formation,t
d[P]d
. Assuming ≫ 1k
kcatA
catI ,
td[P]
d(blue curve in part B) is dominated by the active enzyme−substrate complex, pEAS (gold curve in part A). Parameters were chosen to reflect
“typical” enzyme kinetics values: = 10k
k2cat
A
catI , = −10K
K1M
A
MI , and e−β(ϵA−ϵI) = e−1.38 Substrate concentrations are shown normalized relative to the active
state parameterK[S]
MA , although the inactive state parameter
K[S]
MI could also have been used.
The Journal of Physical Chemistry B Article
DOI: 10.1021/acs.jpcb.6b01911J. Phys. Chem. B XXXX, XXX, XXX−XXX
E

From these two expressions, we can write the dynamic range as
= −
= −−
+ β ϵ ϵ
→∞ →
− −
⎛⎝⎜
⎞⎠⎟
⎛⎝⎜
⎞⎠⎟
⎛
⎝⎜⎜⎜
⎞
⎠⎟⎟⎟
t t
k
dynamic range limd[P]
dlim
d[P]d
[E ] 11
1 e
kk
KK
[S] [S] 0
tot catA
( )
catI
catA
A I MI
MA (33)
where every term in the fraction has been written as a ratio ofthe active and inactive state parameters. We find that the
dynamic range increases as kk
catI
catA , e−β(ϵA−ϵI), and K
KMI
MA increase
(assuming kcatA > kcat
I ).Another important property is the concentration of substrate
at which the rate of product formation lies halfway between itsminimum and maximum value, which we will denote as [S50]. Itis straightforward to show that the definition
= +→ →∞ →
⎛⎝⎜
⎞⎠⎟t t t
limd[P]
d12
limd[P]
dlim
d[P]d[S] [S ] [S] [S] 050 (34)
is satisfied when
= +
+
β ϵ ϵ
β ϵ ϵ
− −
− −K[S ]
e 1
e KK
50 MA
( )
( )
A I
A I MA
MI (35)
With increasing e−β(ϵA−ϵI), the value of [S50] increases if KMA >
KMI and decreases otherwise. [S50] always decreases as K
KMA
MI
increases. Lastly, we note that, in the limit of a Michaelis−Menten enzyme, ϵI → ∞, we recoup the familiar results
ϵ
ϵ
= → ∞
= → ∞
k
K
dynamic range [E ] ( ) (36)
[S ] ( ) (37)
tot catA
I
50 MA
I
2.3. Allosteric Regulator. The catalytic activity of manyenzymes is controlled by molecules that bind to regulatory siteswhich are often different from the active sites themselves. As a
result of ligand-induced conformational changes, thesemolecules alter the substrate binding site which modifies the
rate of product formation,t
d[P]d
. Allosterically controlled
enzymes represent important regulatory nodes in metabolicpathways and are often responsible for keeping cells inhomeostasis. Some well-studied examples of allosteric controlinclude glycogen phosphorylase, phosphofructokinase, gluta-mine synthetase, and aspartate transcarbamoylase (ATCase). Inmany cases the data from these systems are characterizedphenomenologically using Hill functions, but the Hillcoefficients thus obtained can be difficult to interpret.39 Inaddition, Hill coefficients do not provide much informationabout the organization or regulation of an enzyme, nor do theyreflect the relative probabilities of the possible enzymeconformations, although recent results have begun to addressthese issues.40 In this section, we add one more layer ofcomplexity to our statistical mechanics framework byintroducing an allosteric regulator.Consider a MWC enzyme with one site for an allosteric
regulator R and a different site for a substrate molecule S thatwill be converted into product. We can define the effects of theallosteric regulator directly through the states and weights. As
shown in Figure 5, the regulator R contributes a factorR[R]
DA when
it binds to an active state and a factorR[R]
DI when it binds to an
inactive state where RDA and RD
I are the dissociation constantsbetween the regulator and the active and inactive states of theenzyme, respectively. Unlike theMichaelis constants KM
A and KMI
for the substrate, the dissociation constants RDA and RD
I enter thestates and weights because the regulator can only bind andunbind to the enzyme (and cannot be transformed intoproduct). In other words, if we were to draw a rates diagram forthis enzyme system, detailed balance between the two stateswhere the regulator is bound and unbound would yield a
dissociation constant (kk
off
on) rather than a Michaelis constant
( +k kk
off cat
on).
Figure 5. States and weights for a MWC enzyme with an allosteric regulator. The allosteric regulator (purple) does not directly interact with the
substrate (dark red) but instead introduces a factorR[R]
Dinto the weights where RD is a dissociation constant. Note that the regulator can only associate
to and dissociate from the enzyme, whereas substrate can be turned into product as shown by the Michaelis constant KM. An allosteric activator bindsmore tightly to the active state enzyme, RD
A < RDI , which leads to an increased rate of product formation because the active state catalyzes substrate at
a faster rate than the inactive state, kcatA > kcat
I . An allosteric inhibitor would satisfy RDA > RD
I .
The Journal of Physical Chemistry B Article
DOI: 10.1021/acs.jpcb.6b01911J. Phys. Chem. B XXXX, XXX, XXX−XXX
F

Using the states and weights in Figure 5, we can compute theprobability of each enzyme state. For example, the probabilitiesof the four states that form product are given by
= βϵ−pZ
e KE S
[S]
totA
A MA
(38)
= βϵ−pZ
e K RE SR
[S] [R]
totA
A MA
DA
(39)
= βϵ−pZ
e KE S
[S]
totI
I MI
(40)
= βϵ−pZ
e K RE SR
[S] [R]
totI
I MI
DI
(41)
where
= + + + + +βϵ βϵ− −⎛⎝⎜
⎞⎠⎟⎛⎝⎜
⎞⎠⎟
⎛⎝⎜
⎞⎠⎟⎛⎝⎜
⎞⎠⎟Z
K R K Re 1
[S]1
[R]e 1
[S]1
[R]tot
MA
DA
MI
DI
A I
(42)
is the sum of all weights in Figure 5. An allosteric activator has asmaller dissociation constant RD
A < RDI for binding to the active
state enzyme, so that for larger [R] the probability that theenzyme will be in the active state increases. Because the activestate catalyzes substrate at a faster rate than the inactive state,kcatA > kcat
I , adding an activator increases the rate of product
formationt
d[P]d
. An allosteric inhibitor has the flipped relation
RDA > RD
I and hence causes the opposite effects.Proceeding analogously to section 2.2, the total enzyme
concentration [E ]tot is a conserved quantity which equals thesum of all enzyme states ([EA], [EAS], [EAR], [EASR], and theirinactive state counterparts). Using the probabilities in eqs38−41, we can write these concentrations as [EAS] = [Etot]pEAS,
[EASR] = [Etot]pEASR, ..., so that the rate of product formation
is given by
= + + +
=+ + +
+ + + + +
βϵ βϵ
βϵ βϵ
− −
− −
⎜ ⎟ ⎜ ⎟
⎜ ⎟⎜ ⎟ ⎜ ⎟⎜ ⎟
⎛⎝
⎞⎠
⎛⎝
⎞⎠
⎛⎝
⎞⎠⎛⎝
⎞⎠
⎛⎝
⎞⎠⎛⎝
⎞⎠
tk k
k k
d[P]d
([E S] [E SR]) ([E S] [E SR])
[E ]e 1 e 1
e 1 1 e 1 1
K R K R
K R K R
catA
A A catI
I I
tot
catA [S] [R]
catI [S] [R]
[S] [R] [S] [R]
A
MA
DA
I
MI
DI
A
MA
DA
I
MI
DI
(43)
The rate of product formation (43) for different [R] values isshown in Figure 6. It is important to realize that, by choosingthe weights in Figure 5, we have selected a particular model forthe allosteric regulator, namely, one in which the regulatorbinds equally well to an enzyme with or without substrate.There are many other possible models. For example, we couldadd an interaction energy between an allosteric regulator and abound substrate. However, the simple model in Figure 5already possesses the important feature that adding more
allosteric activator yields a larger rate of product formationt
d[P]d
,
as shown in Figure 6.An allosteric regulator effectively tunes the energies of the
active and inactive states. To better understand this, considerthe probability of an active state enzyme−substrate complex(with or without a bound regulator). Adding eqs 38 and 39,
+ =+
+ + + + +
≡+ + +
βϵ
βϵ βϵ
βϵ
βϵ βϵ
−
− −
−
− −
⎜ ⎟
⎜ ⎟⎜ ⎟ ⎜ ⎟⎜ ⎟
⎜ ⎟ ⎜ ⎟
⎛⎝
⎞⎠
⎛⎝
⎞⎠⎛⎝
⎞⎠
⎛⎝
⎞⎠⎛⎝
⎞⎠
⎛⎝
⎞⎠
⎛⎝
⎞⎠
p pe 1
e 1 1 e 1 1
e
e 1 e 1
K R
K R K R
K
K K
E S E SR
[S] [R]
[S] [R] [S] [R]
[S]
[S] [S]
A A
A
MA
DA
A
MA
DA
I
MI
DI
A
MA
A
MA
I
MI (44)
where
ϵ ϵβ
= − +⎛⎝⎜
⎞⎠⎟R
1log 1
[R]A A
DA
(45)
ϵ ϵβ
= − +⎛⎝⎜
⎞⎠⎟R
1log 1
[R]I I
DI
(46)
We now compare the total probability that an active stateenzyme will be bound to substrate in the presence of anallosteric regulator (eq 44) to this probability in the absence ofan allosteric regulator (eq 24). These two equations show that aMWC enzyme in the presence of regulator concentration [R] isequivalent to a MWC enzyme with no regulator provided thatwe use the new energies ϵA and ϵI for the active and inactivestates. An analogous statement holds for all of theconformations of the enzyme, so that the effects of a regulatorcan be completely absorbed into the energies of the active andinactive states! In other words, adding an allosteric regulatorallows us to tune the parameters ϵA and ϵI of an allostericenzyme, and thus change its rate of product formation, in aquantifiable manner. This simple result emerges from ourassumptions that the allosteric regulator and substrate bindindependently to the enzyme and that the allosteric regulatordoes not affect the rate of product formation.One application of this result is that we can easily compute
the dynamic range of an enzyme as well as the concentration ofsubstrate for half-maximal rate of product formation discussedin section 2.2. Both of these quantities follow from theanalogous expressions for a MWC enzyme (eqs 33 and 35)using the effective energies ϵA and ϵI, resulting in a dynamicrange of the form
Figure 6. Effects of an allosteric regulator R on the rate of product
formationt
d[P]d
. The regulator’s greater affinity for the active enzyme
state increases the fraction of the active conformations and hencet
d[P]d
.
Parameters used were = −10R
R2D
A
DI and the parameters from Figure 4.
The Journal of Physical Chemistry B Article
DOI: 10.1021/acs.jpcb.6b01911J. Phys. Chem. B XXXX, XXX, XXX−XXX
G

=
−−
+ β ϵ ϵ− − ++
⎛
⎝⎜⎜⎜
⎞
⎠⎟⎟⎟
kdynamic range [E ]
11
1 e
kk
RR
KK
tot catA
( )1 [R] /1 [R] /
catI
catA
A I DA
DI
MI
MA (47)
and an [S50] value of
=+
+
β ϵ ϵ
β ϵ ϵ
− − ++
− − ++
K[S ]e 1
e
RR
RR
KK
50 MA
( )1 [R] /1 [R] /
( )1 [R] /1 [R] /
A I DA
DI
A I DA
DI
MA
MI (48)
As expected, the dynamic range of an enzyme increases withregulator concentration [R] for an allosteric activator (RD
A <RDI ). Adding more activator will shift [S50] to the left if KM
A <KMI (as shown in Figure 6) or to the right if KM
A > KMI . The
opposite effects hold for an allosteric inhibitor (RDI < RD
A).2.4. Competitive Inhibitor. Another level of control found
in many enzymes is inhibition. A competitive inhibitor C bindsto the same active site as substrate S, yet unlike the substrate,the competitive inhibitor cannot be turned into product by theenzyme. An enzyme with a single active site can either exist inthe unbound state E, as an enzyme−substrate complex ES, or asan enzyme−competitor complex EC. As more inhibitor isadded to the system, it crowds out the substrate from theenzyme’s active site which decreases product formation. Manycancer drugs (e.g., lapatinib, sorafenib, erlotinib) are com-petitive inhibitors for kinases involved in signaling pathways.41
Starting from our model of a MWC enzyme in Figure 3, wecan introduce a competitive inhibitor by drawing two newstates (an enzyme−competitor complex in the active andinactive forms), as shown in Figure 7. Only the enzyme−substrate complexes in the active (EAS) and inactive (EIS)states form product. The probabilities of each of these states isgiven by eqs 24 and 26 but using the new partition function(which includes the competitive inhibitor states)
= + + + + +βϵ βϵ− −⎛⎝⎜
⎞⎠⎟
⎛⎝⎜
⎞⎠⎟Z
K C K Ce 1
[S] [C]e 1
[S] [C]tot
MA
DA
MI
DI
A I
(49)
Repeating the same analysis from section 2.2, we write theconcentrations of bound enzymes as [EAS] = [Etot]pEAS and
[EIS] = [Etot]pEIS, where [Etot] is the total concentration of
enzymes in the system and pEA,IS is the weight of the bound(in)active state enzyme divided by the partition function, eq 49.Thus, the rate of product formation equals
= +
=+
+ + + + +
βϵ βϵ
βϵ βϵ
− −
− −( ) ( )
tk k
k k
d[P]d
[E S] [E S]
[E ]e e
e 1 e 1
K K
K C K C
catA
A catI
I
tot
catA [S]
catI [S]
[S] [C] [S] [C]
A
MA
I
MI
A
MA
DA
I
MI
DI
(50)
Figure 8 shows the rate of product formation for variousinhibitor concentrations [C]. Adding more competitiveinhibitor increases the probability of the inhibitor-bound statesand thereby drains probability out of those states competent toform product, as expected. Similarly to our analysis of allostericregulators, we can absorb the effects of the competitiveinhibitor (CD
A,I) in eq 50 into the enzyme parameters (ϵA,I, KMA,I)
Figure 7. States and weights for a MWC enzyme with a competitive inhibitor. While the substrate S (dark red) can be transformed into product, theinhibitor C (light blue) can occupy the substrate binding site but cannot be catalyzed. As seen with the allosteric regulator in section 2.3, the
competitive inhibitor contributes a factorC[C]
Dto the statistical weight of a state where CD is the inhibitor’s dissociation constant.
Figure 8. Effects of a competitive inhibitor C on the rate of product
formationt
d[P]d
. When [C] ≲ CDA, CD
I , the inhibitor cannot out-compete
the substrate at high substrate concentrations, while the free form ofenzyme dominates at low substrate concentrations. Therefore,
increasing [C] up to values of ∼CDA or CD
I has little effect ont
d[P]d
.
Once [C] ≳ CDA, CD
I , the inhibitor can out-compete substrate at largeconcentrations, pushing the region where the enzyme−substrate
complex dominates further to the right. Parameters used were = 1C
CDA
DI
and the parameters from Figure 4.
The Journal of Physical Chemistry B Article
DOI: 10.1021/acs.jpcb.6b01911J. Phys. Chem. B XXXX, XXX, XXX−XXX
H

=
+ + +
+ + + + +
≡+
+ + +
βϵ βϵ
βϵ βϵ
βϵ βϵ
βϵ βϵ
−
+
−
+
−
+
−
+
−
−
−
−
⎜ ⎟ ⎜ ⎟
⎛
⎝⎜⎜⎜
⎞
⎠⎟⎟⎟
⎛
⎝⎜⎜⎜
⎞
⎠⎟⎟⎟
⎛⎝
⎞⎠
⎛⎝
⎞⎠
⎛⎝⎜
⎞⎠⎟
⎛⎝⎜
⎞⎠⎟
⎛⎝⎜
⎞⎠⎟
⎛⎝⎜
⎞⎠⎟
( ) ( )
( ) ( )t
k k
k k
d[P]d
[E ]
e 1 e 1
e 1 1 e 1 1
[E ]e e
e 1 e 1
C K C K
C K C K
K K
K K
tot
catA [C] [S]
1catI [C] [S]
1
[C] [S]
1
[C] [S]
1
tot
catA [S]
catI [S]
[S] [S]
C C
C C
A
DA
MA [C]
DA
I
DI
MI [C]
DI
A
DA
MA [C]
DA
I
DI
MI [C]
DI
A
MA
I
MI
A
MA
I
MI (51)
where we have defined the new energies and Michaelisconstants
ϵ ϵβ
= − +⎛⎝⎜
⎞⎠⎟C
1log 1
[C]A A
DA
(52)
ϵ ϵβ
= − +⎛⎝⎜
⎞⎠⎟C
1log 1
[C]I I
DI
(53)
= +⎛⎝⎜
⎞⎠⎟K K
C1
[C]MA
MA
DA
(54)
= +⎛⎝⎜
⎞⎠⎟K K
C1
[C]MI
MI
DI
(55)
Note that eq 51 has exactly the same form as the rate ofproduct formation of a MWC enzyme without a competitiveinhibitor, eq 30. In other words, a competitive inhibitormodulates both the effective energies and the Michaelisconstants of the active and inactive states. Thus, an observedvalue of KM may not represent a true Michaelis constant if aninhibitor is present. In the special case of a Michaelis−Mentenenzyme (e−βϵI → 0), we recover the known result that acompetitive inhibitor only changes the apparent Michaelisconstant.17
As shown for the allosteric regulator, the dynamic range andthe concentration of substrate for half-maximal rate of productformation [S50] follow from the analogous expressions for aMWC enzyme (section 2.2, eqs 33 and 35) using theparameters ϵA,I and KM
A,I. Hence, an allosteric enzyme withone active site in the presence of a competitive inhibitor has adynamic range given by
= −−
+ β ϵ ϵ− −
⎛
⎝⎜⎜⎜
⎞
⎠⎟⎟⎟kdynamic range [E ] 1
1
1 e
kk
KK
tot catA
( )
catI
catA
A I MI
MA (56)
and an [S50] value of
=+ + +
+
β ϵ ϵ
β ϵ ϵ
− −
− −
( ) ( )K[S ]
e 1 1
e
C C
KK
50 MA
( ) [C] [C]
( )
A I
DA
DI
A I MA
MI (57)
Notice that eq 56, the dynamic range of a MWC enzyme inthe presence of a competitive inhibitor, is exactly the same as eq33, the dynamic range in the absence of an inhibitor. Thismakes sense because in the absence of substrate ([S] → 0) the
rate of product formation must be zero and at saturatingsubstrate concentrations ([S] → ∞) the substrate completelycrowds out any inhibitor concentration. Instead of altering therate of product formation at these two limits, the competitive
inhibitor shifts thet
d[P]d
curve, and therefore [S50], to the right
as more inhibitor is added.Said another way, adding a competitive inhibitor effectively
rescales the concentration of substrate in a system. Consider aMWC enzyme in the absence of a competitive inhibitor at ameasured substrate concentration [Sno[C]]. Now consider aseparate system where an enzyme is in the presence of acompetitive inhibitor at a concentration [C] and at a measuredsubstrate concentration [Swith[C]]. It is straightforward to show
that the rate of product formationt
d[P]d
is the same for both
enzymes
=+
+ + +
=+
+ + + + +
βϵ βϵ
βϵ βϵ
βϵ βϵ
βϵ βϵ
− −
− −
− −
− −
⎜ ⎟ ⎜ ⎟
⎜ ⎟ ⎜ ⎟
⎛⎝
⎞⎠
⎛⎝
⎞⎠
⎛⎝
⎞⎠
⎛⎝
⎞⎠
t
k k
k k
d[P]d
[E ]e e
e 1 e 1
[E ]e e
e 1 e 1
K K
K K
K K
K C K C
tot
catA [S ]
catI [S ]
[S ] [S ]
tot
catA [S ]
catI [S ]
[S ] [C] [S ] [C]
A no[C]
MA
I no[C]
MI
A no[C]
MA
I no[C]
MI
A with[C]
MA
I with[C]
MI
A with[C]
MA
DA
I with[C]
MI
DI
(58)
provided that
=+ + +
+
β ϵ ϵ
β ϵ ϵ
− −
− −
( ) ( )[S ]
e 1 1
e 1[S ]
C Cwith[C]
( ) [C] [C]
( ) no[C]
A I
DA
DI
A I
(59)
For any fixed competitive inhibitor concentration [C], thisrescaling amounts to a constant multiplicative factor whichresults in a horizontal shift on a log scale of substrateconcentration [S], as is indeed shown in Figure 8.As we have seen, the effects of both an allosteric regulator
and a competitive inhibitor can be absorbed into theparameters of a MWC enzyme. This suggests that experimentaldata from enzymes that titrate these ligands can be collapsedinto a one-parameter family of curves where the singleparameter is either the concentration of an allosteric effectoror a competitive inhibitor. Indeed, in section 3.1, we shall findthat this theory matches well with experimentally measuredactivity curves.
2.5. Multiple Substrate Binding Sites. In 1965, Gerhartand Schachman used ultracentrifugation to determine thatATCase can be separated into a large (100 kDa) catalyticsubunit where substrate binds and a smaller (30 kDa)regulatory subunit which has binding sites for the allosteric
The Journal of Physical Chemistry B Article
DOI: 10.1021/acs.jpcb.6b01911J. Phys. Chem. B XXXX, XXX, XXX−XXX
I

regulators ATP and CTP.42 Their measurements correctlypredicted that ATCase had multiple active sites and multipleregulatory sites, although their actual numbers were off (theypredicted two active sites and four regulatory sites, whereasATCase has six active sites and six regulatory sites).13 Threeyears later, more refined sequencing by Weber and crystallo-graphic measurements by Wiley and Lipscomb revealed thecorrect quaternary structure of ATCase.43−45
Many enzymes are composed of multiple subunits thatcontain substrate binding sites (also called active sites orcatalytic sites). Having multiple binding sites grants thesubstrate more locations to bind to an enzyme which increasesthe effective affinity between both molecules. A typical enzymewill have between one and six substrate binding sites, andbinding sites for allosteric regulators can appear with similarmultiplicity. However, extreme cases exist such as hemocyaninwhich can have as many as 48 active sites.46 Interestingly, acrossdifferent species, the same enzyme may possess differentnumbers of active or regulatory sites, as well as be affected byother allosteric regulators and competitive inhibitors.10,47
Furthermore, multiple binding sites may interact with eachother in a complex and often uncharacterized manner.48
We now extend the single-site model of a MWC enzymeintroduced in Figure 3 to a MWC enzyme with two substratebinding sites. Assuming that both binding sites are identical andindependent, the states and weights of the system are shown inFigure 9. When the enzyme is doubly occupied EAS
2, weassume that it forms product twice as fast as a singly occupiedenzyme EAS.It has been shown that, in MWC models, explicit cooperative
interaction energies are not required to accurately modelbiological systems; cooperativity is inherently built into the factthat all binding sites switch concurrently from an active state toan inactive state.16 For example, suppose an inactive stateenzyme with two empty catalytic sites binds with its inactivestate affinity KM
I to a single substrate, and that this bindingswitches the enzyme from the inactive to the active state. Then,the second, still empty, catalytic site now has the active stateaffinity KM
A , an effect which can be translated into cooperativity.Note that an explicit interaction energy, if desired, can be addedto the model very simply.
As in the proceeding sections, we compute the probabilityand concentration of each enzyme conformation from thestates and weights (see eqs 23−29). Because the active andinactive conformations each have two singly bound states andone doubly bound state with twice the rate, the enzyme’s rate ofproduct formation is given by
= + + +
=+ + +
+ + +
βϵ βϵ
βϵ βϵ
− −
− −
( ) ( )( ) ( )
tk p k p k p k p
k k
d[P]d
(2 ) 2 ( ) (2 ) 2 ( )
2[E ]e 1 e 1
e 1 e 1
K K K K
K K
catA
E S catA
E S catI
E S catI
E S
tot
catA [S] [S]
catI [S] [S]
[S]2
[S]2
A A2
I I2
A
MA
MA
I
MI
MI
A
MA
I
MI
(60)
We will have much more to say about this model in section
3.2.2, where we will show thatt
d[P]d
as a function of substrate
concentration [S] may form a peak. For now, we mention thewell-known result that a Michaelis−Menten enzyme with twoindependent active sites will act identically to two Michaelis−Menten enzymes each with a single active site (as can be seenin the ϵI → ∞ limit of eq 60).17 It is intuitively clear that this
result does not extend to MWC enzymes:t
d[P]d
for a two-site
MWC enzyme, eq 60, does not equal twice the value oft
d[P]d
for
a one-site MWC enzyme, eq 30.2.6. Modeling Overview. The above sections allow us to
model a complex enzyme with any number of substrate bindingsites, competitive inhibitors, and allosteric regulators. Assumingthat the enzyme is in steady state and that the cycle conditionholds, we first enumerate its states and weights and then usethose weights to calculate the rate of product formation. Ouressential conclusions about the roles of the various participantsin these reactions can be summarized as follows:
1. The (in)active state enzyme contributes a factor (e−βϵI)e−βϵA to the weight. The mathematical simplicity of thismodel belies the complex interplay between the activeand inactive states. Indeed, a MWC enzyme cannot bedecoupled into two Michaelis−Menten enzymes (one forthe active and the other for the inactive states).
Figure 9. States and weights for a MWC enzyme with two substrate binding sites. Each binding site acts independently, and the rate of productformation of a doubly bound state is twice the rate of the corresponding singly bound state.
The Journal of Physical Chemistry B Article
DOI: 10.1021/acs.jpcb.6b01911J. Phys. Chem. B XXXX, XXX, XXX−XXX
J

2. Each bound substrate contributes a factor (K[S]
MI ) K
[S]
MA in the
(in)active state where = +K k kkM
off cat
onis a Michaelis
constant between the substrate and enzyme. It is thisMichaelis constant, and not the dissociation constant,which enters the states and weights diagram.
3. Each bound allosteric regulator or competitive inhibitor
X contributes a factor (X
[X]
dI ) X
[X]
dA in the (in)active state
where =X kkD
offX
onX is the dissociation constant between X
and the enzyme. An allosteric regulator R effectivelytunes the energies of the active and inactive states, asshown in eqs 45 and 46. A competitive inhibitor Ceffectively changes both the energies and Michaelisconstants of the active and inactive states, as described byeqs 52−55.
4. The simplest model for multiple binding sites assumesthat each site is independent of the others. The MWCmodel inherently accounts for the cooperativity betweenthese sites, resulting in sigmoidal activity curves despiteno direct interaction terms.
In section B of the Supporting Information, we simultaneouslycombine all of these mechanisms by analyzing the rate ofproduct formation of ATCase (which has multiple bindingsites) in the presence of substrate, a competitive inhibitor, andallosteric regulators. In addition, the supplementary Mathema-tica notebook lets the reader specify their own enzyme and seeits corresponding properties.Note that while introducing new components (such as a
competitive inhibitor or an allosteric regulator) introduces newparameters into the system, increasing the number of sites doesnot. For example, a MWC enzyme with one (Figure 3), two(Figure 9), or more active sites would require the same fiveparameters: e−β(ϵA−ϵI), KM
A , KMI , kcat
A , and kcatI .
3. APPLICATIONSHaving built a framework to model allosteric enzymes, we nowturn to some applications of how this model can grant insightsinto observed enzyme behavior. Experimentally, the rate ofproduct formation of an enzyme is often measured relative tothe enzyme concentration, a quantity called activity
≡At
1[E ]
d[P]dtot (61)
Enzymes are often characterized by their activity curves assubstrate, inhibitor, and regulator concentrations are titrated.Such data not only determines important kinetic constants butcan also characterize the nature of molecular players such aswhether an inhibitor is competitive, uncompetitive, mixed, ornoncompetitive.49−51 After investigating several activity curves,we turn to a case study of the curious phenomenon of substrateinhibition, where saturating concentrations of substrate inhibitenzyme activity, and propose a new minimal mechanism forsubstrate inhibition caused solely by allostery.3.1. Regulator and Inhibitor Activity Curves. We begin
with an analysis of α-amylase, one of the simplest allostericenzymes, which only has a single catalytic site. α-Amylasecatalyzes the hydrolysis of large polysaccharides (e.g., starchand glycogen) into smaller carbohydrates in human metabo-lism. It is competitively inhibited by isoacarbose51 at the active
site and is allosterically activated by Cl− ions at a distinctallosteric site.52
Figure 10 plots substrate concentration divided by activity,[S]/A, as a function of substrate [S]. Recall from section 2.3
that an enzyme with one active site and one allosteric site hasactivity given by eq 43
=+ + +
+ + + + +
βϵ βϵ
βϵ βϵ
− −
− −
( ) ( )( )( ) ( )( )
Ak ke 1 e 1
e 1 1 e 1 1
K R K R
K R K R
catA [S] [R]
catI [S] [R]
[S] [R] [S] [R]
A
MA
DA
I
MI
DI
A
MA
DA
I
MI
DI
(62)
Thus, we expect the [S]/A curves in Figure 10 to be linear in[S]
=+ + + + +
+ + +
βϵ βϵ
βϵ βϵ
− −
− −
( ) ( )( ) ( )
( ) ( )A k k
[S]e 1 1 e 1 1
e 1 e 1
K R K R
K R K R
[S] [R] [S] [R]
catA 1 [R]
catI 1 [R]
A
MA
DA
I
MI
DI
A
MA
DA
I
MI
DI
(63)
Figure 10 shows that the experimental data is well characterizedby the theory so that the rate of product formation at any othersubstrate and allosteric activator concentration can be predictedby this model. The fitting procedure is discussed in detail insection B of the Supporting Information.In the special case of a Michaelis−Menten enzyme (ϵI →
∞), the above equation becomes
ϵ=+
→ ∞A
Kk
[S] [S]( )M
A
catA I
(64)
The x-intercept of all lines in such a plot would intersect at thepoint (−KM
A , 0) which allows an easy determination of KMA . This
is why plots of [S] vs [S]/A, called Hanes plots, are often seenin enzyme kinetics data. Care must be taken, however, whenextending this analysis to allosteric enzymes where the form ofthe x-intercept is more complicated.We now turn to competitive inhibition. Figure 11A plots the
inverse rate of product formation−( )t
d[P]d
1of α-amylase as a
function of the competitive inhibitor concentration [C]. Thecompetitive inhibitor isoacarbose is titrated for three differentconcentrations of the substrate α-maltotriosyl fluoride (αG3F).
Figure 10. Theoretically and experimentally probing the effects of anallosteric regulator on activity. Data points show experimentallymeasured activity from Feller et al. for the enzyme α-amylase usingsubstrate analogue [S] (EPS) and allosteric activator [R] (NaCl).52
Best fit theoretical curves described by eq 63 are overlaid on the data.The best fit parameters are e−β(ϵA−ϵI) = 7.8 × 10⁻⁴, KM
A = 0.6 mM, KMI =
0.2 mM, RDA = 0.03 mM, RD
I = 7.9 mM, kcatA = 14 s−1, and kcat
I = 0.01 s−1.
The Journal of Physical Chemistry B Article
DOI: 10.1021/acs.jpcb.6b01911J. Phys. Chem. B XXXX, XXX, XXX−XXX
K

Recall from section 2.4, eq 50 that the rate of product
formation for an allosteric enzyme with one active site in the
presence of a competitive inhibitor is given by
=+ + + + +
+
βϵ βϵ
βϵ βϵ
−− −
− −
⎜ ⎟ ⎜ ⎟⎛⎝⎜
⎞⎠⎟
⎛⎝
⎞⎠
⎛⎝
⎞⎠
t k k
d[P]d
1[E ]
e 1 e 1
e e
K C K C
K K
1
tot
[S] [C] [S] [C]
catA [S]
catI [S]
A
MA
DA
I
MI
DI
A
MA
I
MI
(65)
so that the best fit−( )t
d[P]d
1curves in Figure 11A are linear
functions of [C]. Rather than thinking of eq 65 as a function of
the competitive inhibitor concentration [C] and the substrate
concentration [S] separately, we can combine these two
quantities into a single natural parameter for the system. This
will enable us to collapse the different activity curves in Figure
11A onto a single master curve, as shown in Figure 11B.
Algebraically manipulating eq 65,
=+
+ + + + +
≡+
+ +
β ϵ ϵ
β ϵ ϵ β ϵ ϵ
β
β
− −
− − − −
− Δ
− Δ
⎜ ⎟
⎜ ⎟ ⎜ ⎟ ⎜ ⎟
⎛⎝
⎞⎠
⎛⎝
⎞⎠
⎛⎝
⎞⎠
⎛⎝
⎞⎠
t
k k
k K kK
d[P]d
[E ]e
e 1 e 1 1
[E ]( )e( 1)e 1
K
K K
K
K K C C
F
F
tot
catA ( )
catI [S]
( ) [S] ( ) [C] [C]
totcatA
catI
A I MI
MA
MI
A I MI
MA
MI
A I
DA
DI
(66)
where
= β ϵ ϵ− −KKK
e ( ) MI
MA
A I
(67)
βΔ = −
+ + +β ϵ ϵ− −
⎡
⎣
⎢⎢⎢
⎤
⎦
⎥⎥⎥( ) ( )F
1log
e 1 1
K
C C
[S]
( ) [C] [C]
MI
A I
DA
DI
(68)
Therefore,−( )t
d[P]d
1curves at any substrate and inhibitor
concentrations can be compactly shown as data points lying ona single curve in terms of ΔF, which is called the Bohrparameter. Such a data collapse is also possible in the case of
Figure 11. Theoretically and experimentally probing the effects of a competitive inhibitor on activity. (A) Data points show experimentally measuredactivity in arbitrary units from Li et al. for the enzyme α-amylase using substrate analogue [S] (α-maltotriosyl fluoride) and competitive inhibitor [C](isoacarbose).51 Best fit theoretical curves described by the inverse of eq 65 are overlaid on the data. The best fit parameters are e−β(ϵA−ϵI) = 36, KM
A =
0.9 mM, KMI = 2.6 mM, CD
A = 12 nM, CDI = 260 nM, and = 1.4k
kcatA
catI . Note that the x-axis varies [C] rather than [S] as in most other plots. (B) A data
collapse of the three curves using the Bohr parameter ΔF from eq 68 which encompasses the effects of both the substrate and inhibitor upon thesystem.
Figure 12. Enzyme activity curves do not need to be monotonic as predicted by Michaelis−Menten enzyme kinetics. (A) As many as 20% ofenzymes exhibit substrate inhibition, where at high substrate concentrations activity decreases, in contrast to a Michaelis−Menten enzyme shown forreference.53,54 Activity for acetylcholinesterase is shown in units of (nanomol of product)·min−1·(mL of enzyme)−1.55 (B) Some enzymes exhibitinhibitor acceleration, where adding a small amount of a competitive inhibitor increases the rate of product formation. This generates a peak inactivity, in stark contrast to a Michaelis−Menten enzyme which only decreases its activity as more competitive inhibitor is added. Relative activity isshown for ATCase, where relative activity equals activity at [C] divided by the activity with no competitive inhibitor.10 The data and best fitparameters for the substrate inhibition and inhibitor acceleration curves are discussed in section C of the Supporting Information.
The Journal of Physical Chemistry B Article
DOI: 10.1021/acs.jpcb.6b01911J. Phys. Chem. B XXXX, XXX, XXX−XXX
L
allosteric regulators or enzymes with multiple binding sites,although those data collapses may require more than onevariable ΔF. In section C of the Supporting Information, weshow that the Bohr parameter corresponds to a free energydifference between enzyme states and examine other cases ofdata collapse.3.2. Substrate Inhibition. We now turn to a striking
phenomenon observed in the enzyme literature: not allenzymes have a monotonically increasing rate of productformation. Instead, peaks such as those shown schematically inFigure 12 can arise in various enzymes, displaying behavior thatis impossible within Michaelis−Menten kinetics. By exploringthese two phenomena with the MWC model, we gain insightinto their underlying mechanisms and can make quantifiablepredictions as to how to create, amplify, or prevent such peaks.In Figure 12A, the monotonically increasing Michaelis−
Menten curve makes intuitive sensea larger substrateconcentration implies that at any moment the enzyme’s activesite is more likely to be occupied by substrate. Therefore, we
expect that the activity, =At
1[E ]
d[P]dtot
, should increase with the
substrate concentration [S]. However, many enzymes exhibit apeak activity, a behavior called substrate inhibition.53
Even more surprisingly, when a small amount of competitiveinhibitora molecule whose very name implies that itcompetes with substrate and decreases activityis mixedtogether with enzyme, it can increase the rate of productformation. This latter case, called inhibitor acceleration, isshown in Figure 12B.10,56 In contrast, a Michaelis−Mentenenzyme shows the expected behavior that adding morecompetitive inhibitor decreases activity. We will restrict ourattention to the phenomenon of substrate inhibition andrelegate a discussion of inhibitor acceleration to section D ofthe Supporting Information.Using the MWC enzyme model, we can make predictions
about which enzymes can exhibit substrate inhibition. We firstformulate a relationship between the fundamental physicalparameters of an enzyme that are required to generate such apeak and then consider what information about theseunderlying parameters can be gained by analyzing experimentaldata.3.2.1. Single-Site Enzyme. As a preliminary exercise, we
begin by showing that an enzyme with a single active site cannotexhibit substrate inhibition. Said another way, the activity, eq61, of such an enzyme cannot have a peak as a function ofsubstrate concentration [S]. For the remainder of this paper, wewill use the fact that all Michaelis and dissociation constants(KM’s, CD’s, and RD’s) are positive and assume that bothcatalytic constants (kcat
A and kcatI ) are strictly positive unless
otherwise stated.Consider the MWC enzyme with a single substrate binding
site shown in Figure 3. Using eq 30, it is straightforward tocompute the derivative of activity with respect to substrateconcentration [S], namely,
=+ +
+ + +
βϵ βϵ βϵ βϵ
βϵ βϵ
− − − −
− −⎜ ⎟⎛⎝
⎞⎠
( )( ) ( )
Add[S]
(e e ) e e
e 1 e 1
kK
kK
K K[S] [S]
2
A I A catA
MA
I catI
MI
A
MA
I
MI
(69)
Since the numerator cannot equal zero, this enzyme cannothave a peak in its activity when [S] is varied. Note that the
numerator is positive, indicating that enzyme activity willalways increase with substrate concentration.The above results are valid for an arbitrary MWC enzyme
with a single site. In particular, in the limit ϵI → ∞, a MWCenzyme becomes a Michaelis−Menten enzyme. Therefore, aMichaelis−Menten enzyme with a single active site cannotexhibit a peak in activity. In section E of the SupportingInformation, we discuss the generalization of this result: aMichaelis−Menten enzyme with an arbitrary number ofcatalytic sites cannot have a peak in activity. However, as weshall now see, this generalization cannot be made for a MWCenzyme, which can indeed exhibit a peak in its activity when ithas multiple binding sites.
3.2.2. Substrate Inhibition. As many as 20% of enzymes arebelieved to exhibit substrate inhibition, which can offer uniqueadvantages to enzymes such as stabilizing their activity amidfluctuations, enhancing signal transduction, and increasingcellular efficiency.54 This prevalent phenomenon has elicitedvarious explanations, many of which rely on nonequilibriumenzyme dynamics, although some equilibrium mechanisms areknown.53 An example of this latter case is seen in the enzymeaspartate transcarbamoylase (ATCase) which catalyzes one ofthe first steps in the pyrimidine biosynthetic pathway. BeforeATCase can bind to its substrate asparatate (Asp), anintermediate molecule carbamoyl phosphate (CP) must firstbind to ATCase, inducing a change in the enzyme’s shape andelectrostatics which opens up the Asp binding slot.57,58 BecauseAsp can weakly bind to the CP binding pocket, at highconcentrations Asp will outcompete CP and prevent theenzyme from working as efficiently, thereby causing substrateinhibition.59
To the list of such mechanisms, we add the possibility that anenzyme may exhibit substrate inhibition without any additionaleffector molecules. In particular, an allosteric enzyme with twoidentical catalytic sites can exhibit a peak in activity when thesubstrate concentration [S] is varied. We will first analyze theproperties of this peak and then examine why it can occur. Forsimplicity, we will assume kcat
I = 0 throughout this section andleave the general case for section E of the SupportingInformation.Using eqs 60 and 61, the activity of a MWC enzyme with two
active sites is given by
= =+
+ + +
βϵ
βϵ βϵ
−
− −
( )( ) ( )
At
k1[E ]
d[P]d
2 e 1
e 1 e 1
K K
K Ktot
catA [S] [S]
[S]2
[S]2
A
MA
MA
A
MA
I
MI
(70)
A peak will exist provided that = 0Add[S]
has a positive [S] root.
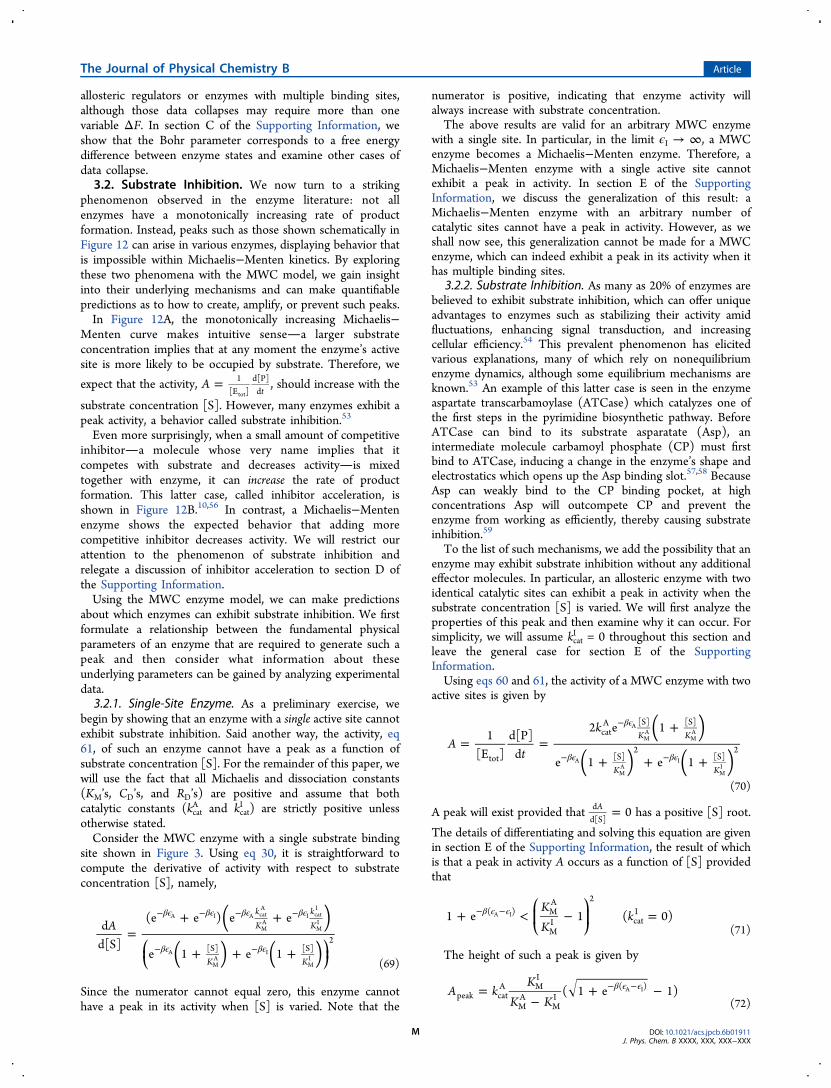
The details of differentiating and solving this equation are givenin section E of the Supporting Information, the result of whichis that a peak in activity A occurs as a function of [S] providedthat
+ < − =β ϵ ϵ− −⎛⎝⎜
⎞⎠⎟
KK
k1 e 1 ( 0)( ) MA
MI
2
catIA I
(71)
The height of such a peak is given by
=−
+ −β ϵ ϵ− −A kK
K K( 1 e 1)peak cat
A MI
MA
MI
( )A I
(72)
The Journal of Physical Chemistry B Article
DOI: 10.1021/acs.jpcb.6b01911J. Phys. Chem. B XXXX, XXX, XXX−XXX
M

Examples of peaks in activity are shown in Figure 13 for variousvalues of e−β(ϵA−ϵI). Substituting in the peak condition eq 71, themaximum peak height is at most
<−
−A k
2
1
KK
KK
peak catA
MA
MI
MA
MI (73)
If we consider the maximum value of e−β(ϵA−ϵI) allowed by thepeak condition eq 71, the peak height approaches kcat
A for largeKK
MA
MI (as seen by the green curve e−β(ϵA−ϵI) = 80 in Figure 13B). In
this limit, the active bound state dominates over all the otherenzyme states so that the activity reaches its largest possiblevalue, kcat
A . Although the “peak height” is maximum in this case,the activity curve is nearly sigmoidal, making the peak hard todistinguish. To that end, it is reasonable to compare the peakheight to the activity at large substrate concentrations
=+
β ϵ ϵ
β ϵ ϵ→∞
− −
− −( )A k2
e
eKK
[S] catA
( )
2( )
A I
MA
MI
A I
(74)
As the energy difference between the active and inactive statese−β(ϵA−ϵI) increases, the peak height Apeak monotonically
increases but the relative peak height→∞
A
Apeak
[S]monotonically
decreases. These relations might be used to design enzymeswith particular activity curves; conversely, experimental data ofsubstrate inhibition can be used to fix a relation between the
parameters e−β(ϵA−ϵI) and KK
MA
MI of an enzyme.
We now turn to the explanation of how such a peak canoccur. One remarkable fact is that a peak cannot happenwithout allostery. If we consider a Michaelis−Menten enzyme(by taking the limit kcat
I → 0 and ϵI → ∞), then the peakcondition eq 71 cannot be satisfied.To gain a qualitative understanding of how a peak can occur,
consider an enzyme that inherently prefers the active state
Figure 13. Peaks in enzyme activity =AE t
1 d[P]dtot
as a function of substrate concentration [S]. Activity is shown in units of kcatA , which rescales the
activity curves vertically. The peak for (A) small and (B) large ratios of the enzyme’s energy in the active versus inactive state, e−β(ϵA−ϵI). The height of
the peak increases with e−β(ϵA−ϵI). The activity is computed from eq 70 using the parameters kcatI = 0, = 10K
KMA
MI , and the different values of e−β(ϵA−ϵI)
shown. As predicted by eq 71, every value in the range < −β ϵ ϵ− − ( )e 1KK
( )2
A I MA
MI will yield a peak in activity. While the peak is more pronounced
when the active state is energetically favorable (e−β(ϵA−ϵI) < 1) in part A, the maximum peak height is much larger in part B, as seen by the differentscale of the y-axis.
Figure 14. Mechanism underlying the peak in activation by substrate S. At low substrate concentrations (left region), all enzymes are unbound andare mostly in the active form (rounded, green). As the amount of substrate is increased (middle region), the probability that an enzyme is singlybound and then doubly bound increases. Because the substrate prefers to bind to an inactive state (sharp, green) enzyme−substrate complex, bindingmore substrate pushes the enzymes into the inactive state. At medium substrate concentrations, more active state enzyme−substrate complexes existthan at high substrate concentrations (right region) which yields a peak. Each enzyme fluctuates between its different configurations, and thecartoons show the distributions of the most prevalent states.
The Journal of Physical Chemistry B Article
DOI: 10.1021/acs.jpcb.6b01911J. Phys. Chem. B XXXX, XXX, XXX−XXX
N

(e−β(ϵA−ϵI) > 1) but with substrate that preferentially binds to
the inactive state ( > 1KK
MA
MI ). Such a system is realized in
bacterial chemotaxis, where the chemotaxis receptors are activewhen unbound but inactive when bound to substrate.32 Thissetup is shown schematically in Figure 14. At low substrateconcentrations, [S] ≪ KM
A , most enzymes will be unbound andtherefore in the active state. At intermediate substrateconcentrations, [S] ≈ KM
A , many enzymes will be singly
bound. Because > 1KK
MA
MI , the substrate will pull these bound
enzymes toward the inactive state. For large substrateconcentrations, [S] ≫ KM
A , most of the enzymes will be doublybound and hence will be predominantly in the inactive form.Because the inactive state does not catalyze substrate (kcat
I = 0),only the number of substrates bound to active state enzymesincreases the rate of product formation, and because more ofthese exist in the intermediate regime, a peak forms.To be more quantitative, the activity eq 70 at the medium
substrate concentration ([S] = KMA ) is given by
=+ +
β ϵ ϵ
β ϵ ϵ→
− −
− −( )A k
4e
1 4eK
KK
[S] catA
( )
2( )
MA
A I
MA
MI
A I
(75)
Comparing this to A[S]→∞ in eq 74, we find that A[S]→KMA >
A[S]→∞ provided that
+ < −β ϵ ϵ− −⎛⎝⎜
⎞⎠⎟
KK
1 e14
1( ) MA
MI
2
A I
(76)
This is in close agreement with the peak condition eq 71, andthe factor of 1
4is due to the fact that the peak need not occur
precisely at [S] = KMA .
Note that the peak condition eq 71 does not necessarily forcethe unbound enzyme to favor the active state (e−β(ϵA−ϵI) > 1),since this condition can still be satisfied if e−β(ϵA−ϵI) < 1.However, the peak condition does require that substratepreferentially binds to the inactive state enzyme (in fact, we
must have > 2KK
MA
MI to satisfy the peak condition).
Recall that as many as 20% of enzymes exhibit substrateinhibition, and this particular mechanism will not apply in everyinstance. To be concrete, an allosteric enzyme that obeys themode of substrate inhibition proposed above (1) must have atleast two catalytic sites and (2) must be driven toward theinactive state upon substrate binding. Therefore, an enzymesuch as ATCase which exhibits substrate inhibition but wherethe substrate preferentially binds to the active state enzymemust have a different underlying mechanism.60 Variousalternative causes including the effects of pH due to substrateor product buildup17,61 or the sequestering effects of ions62,63
may also be responsible for substrate inhibition. However, themechanism of substrate inhibition described above exactlymatches the conditions of acetylcholinesterase whose activity,shown in Figure 12A, is well categorized by the MWC model.55
It would be interesting to test this theory by taking a wellcharacterized enzyme, tuning the MWC parameters so as tosatisfy the peak condition eq 71 (or an analogous relationshipfor an enzyme with more than two catalytic sites), and checkingwhether the system then exhibits substrate inhibition.Experimentally, tuning the parameters can be undertaken byintroducing allosteric regulators or competitive inhibitors as
described by eqs 45 and 46 and eqs 52−55, respectively. Forexample, in section E of the Supporting Information, wedescribe an enzyme system where introducing a competitiveinhibitor induces a peak in activity.
4. DISCUSSIONAllosteric molecules pervade all realms of biology fromchemotaxis receptors to chromatin to enzymes.15,64−66 Thereare various ways to capture the allosteric nature of macro-molecules, with the MWC model representing one amongmany.8,67,68 In any such model, the simple insight thatmolecules exist in an active and inactive state opens a richnew realm of dynamics.The plethora of molecular players that interact with enzymes
serve as the building blocks to generate complex behavior. Inthis paper, we showed the effects of competitive inhibitors,allosteric regulators, and multiple binding sites, looking at eachof these factors first individually and then combining separateaspects. This framework matched well with experimental dataand enabled us to make quantifiable predictions on how theMWC enzyme parameters may be tuned upon the introductionof an allosteric regulator (eqs 45 and 46) or a competitiveinhibitor (eqs 52−55).As an interesting application, we used the MWC model to
explore the unusual behavior of substrate inhibition, where pasta certain point adding more substrate to a system decreases itsrate of product formation. This mechanism implies that anenzyme activity curve may have a peak (see Figure 12), a featthat is impossible for a Michaelis−Menten enzyme. Weexplored a novel minimal mechanism for substrate inhibitionwhich rested upon the allosteric interactions of the active andinactive enzyme states, with suggestive evidence for such amechanism in acetylecholinesterase.The power of the MWC model stems from its simple
description, far-reaching applicability, and its ability to unify theproliferation of data gained over the past 50 years ofenzymology research. A series of activity curves at differentconcentrations of a competitive inhibitor all fall into a one-parameter family of curves, allowing us to predict the activity atany other inhibitor concentration. Such insights not only shedlight on the startling beauty of biological systems but may alsobe harnessed to build synthetic circuits and design new drugs.
■ ASSOCIATED CONTENT*S Supporting InformationThe Supporting Information is available free of charge on theACS Publications website at DOI: 10.1021/acs.jpcb.6b01911.
Derivations aforementioned (PDF)A Mathematica notebook which reproduces the figures inthe paper and includes an interactive enzyme modeler(ZIP)
■ AUTHOR INFORMATIONCorresponding Author*E-mail: [email protected] authors declare no competing financial interest.
■ ACKNOWLEDGMENTSThe authors thank T. Biancalani, J.-P. Changeux, A. Gilson, J.Kondev, M. Manhart, R. Milo, M. Morrison, N. Olsman, and J.Theriot for helpful discussions and insights on this paper. All
The Journal of Physical Chemistry B Article
DOI: 10.1021/acs.jpcb.6b01911J. Phys. Chem. B XXXX, XXX, XXX−XXX
O

plots were made entirely in Mathematica using the Custom-Ticks package.69 This work was supported in the RP group bythe National Institutes of Health through DP1 OD000217(Director’s Pioneer Award) and R01 GM085286, La FondationPierre-Gilles de Gennes, and the National Science Foundationunder Grant No. NSF PHY11-25915 at the Kavli Center forTheoretical Physics. The work was supported in the LM groupby the Research and Development Program (Grant No. CH-3-SMM-01/03). We also thank the Burroughs-Wellcome Fundfor its support of the Physiology Course at the MarineBiological Labratory and a postcourse research grant (LM).One of us (RP) owes his introduction to the many beautifuluses of statistical mechanics in biology to Bill Gelbart to whomthis special issue is dedicated. During his inspiring career,Gelbart has been a passionate and creative developer of insightsinto a wide number of problems using the tools of statisticalmechanics and we hope that our examples on the statisticalmechanics of allosteric enzymes will please him.
■ REFERENCES(1) Lim, W.; Mayer, B.; Pawson, T. Cell Signaling: Principles andMechanisms; Garland Science: New York, 2014.(2) Hidestrand, M.; Oscarson, M.; Salonen, J. S.; Nyman, L.;Pelkonen, O.; Turpeinen, M.; Ingelman-Sundberg, M. CYP2B6 andCYP2C19 as the Major Enzymes Responsible for the Metabolism ofSelegiline. Drug Metab. Dispos. 2001, 29, 1480−1484.(3) Brattstrom, L.; Israelsson, B.; Norrving, B.; Bergqvist, D.; Thorne,J.; Hultberg, B.; Hamfelt, A. Impaired Homocysteine Metabolism inEarly-Onset Cerebral and Peripheral Occlusive Arterial Disease.Atherosclerosis 1990, 81, 51−60.(4) Zelezniak, A.; Pers, T. H.; Soares, S.; Patti, M. E.; Patil, K. R.Metabolic Network Topology Reveals Transcriptional RegulatorySignatures of Type 2 Diabetes. PLoS Comput. Biol. 2010, 6, e1000729.(5) Michaelis, L.; Menten, M. L. Die Kinetik der Invertinwirkung.Biochem Z. 1913, 49, 333−369.(6) Briggs, G. E. A Further Note on the Kinetics of Enzyme Action.Biochem. J. 1925, 19, 1037−1038.(7) Monod, J.; Wyman, J.; Changeux, J. P. On the Nature ofAllosteric Transitions: A Plausible Model. J. Mol. Biol. 1965, 12, 88−118.(8) Koshland, D. E.; Nemethy, G.; Filmer, D. Comparison ofExperimental Binding Data and Theoretical Models in ProteinsContaining Subunits. Biochemistry 1966, 5, 365−385.(9) Cockrell, G. M.; Zheng, Y.; Guo, W.; Peterson, A. W.; Truong, J.K.; Kantrowitz, E. R. New Paradigm for Allosteric Regulation ofEscherichia coli Aspartate Transcarbamoylase. Biochemistry 2013, 52,8036−8047.(10) Wales, M. E.; Madison, L. L.; Glaser, S. S.; Wild, J. R. DivergentAllosteric Patterns Verify the Regulatory Paradigm for AspartateTranscarbamylase. J. Mol. Biol. 1999, 294, 1387−1400.(11) Monod, J.; Changeux, J. P.; Jacob, F. Allosteric Proteins andCellular Control Systems. J. Mol. Biol. 1963, 6, 306−329.(12) Gerhart, J. C.; Pardee, A. B. The Enzymology of Control byFeedback Inhibition. J. Biol. Chem. 1962, 237, 891−896.(13) Gerhart, J. C.; Schachman, H. K. Distinct Subunits for theRegulation and Catalytic Activity of Aspartate Transcarbamylase.Biochemistry 1965, 4, 1054−1062.(14) Daber, R.; Sharp, K.; Lewis, M. One Is Not Enough. J. Mol. Biol.2009, 392, 1133−1144.(15) Changeux, J.-P. Allostery and the Monod-Wyman-ChangeuxModel after 50 years. Annu. Rev. Biophys. 2012, 41, 103−133.(16) Marzen, S.; Garcia, H. G.; Phillips, R. Statistical Mechanics ofMonod-Wyman-Changeux (MWC) Models. J. Mol. Biol. 2013, 425,1433−1460.(17) Segel, I. H. Enzyme Kinetics: Behavior and Analysis of RapidEquilibrium and Steady-State Enzyme Systems; John Wiley Sons: NewYork, 1993; Vol. 2.
(18) Cornish-Bowden, A. Fundamentals of Enzyme Kinetics; PortlandPress Limited: London, 1979.(19) Fersht, A. Structure and Mechanism in Protein Science: A Guide toEnzyme Catalysis and Protein Folding; W. H. Freeman: New York,1999.(20) Price, N. C., Stevens, L. Fundamentals of Enzymology: The Celland Molecular Biology of Catalytic Proteins; Oxford University Press:Oxford, 1999.(21) Reuveni, S.; Urbakh, M.; Klafter, J. Role of Substrate Unbindingin Michaelis-Menten Enzymatic Reactions. Proc. Natl. Acad. Sci. U. S.A. 2014, 111, 4391−4396.(22) Pinto, M. F.; Estevinho, B. N.; Crespo, R.; Rocha, F. A.; Damas,A. M.; Martins, P. M. Enzyme Kinetics: The Whole Picture RevealsHidden Meanings. FEBS J. 2015, 282, 2309−2316.(23) Keymer, J. E.; Endres, R. G.; Skoge, M.; Meir, Y.; Wingreen, N.S. Chemosensing in Escherichia coli: Two Regimes of Two-StateReceptors. Proc. Natl. Acad. Sci. U. S. A. 2006, 103, 1786−1791.(24) Endres, R. G.; Wingreen, N. S. Precise Adaptation in BacterialChemotaxis through ”Assistance Neighborhoods. Proc. Natl. Acad. Sci.U. S. A. 2006, 103, 13040−13044.(25) Mello, B. A.; Tu, Y. An Allosteric Model for HeterogeneousReceptor Complexes. Proc. Natl. Acad. Sci. U. S. A. 2005, 102, 17354−17359.(26) Hansen, C. H.; Endres, R. G.; Wingreen, N. S. Chemotaxis inEscherichia coli: A Molecular Model for Robust Precise Adaptation.PLoS Comput. Biol. 2008, 4, e1.(27) Phillips, R. Napoleon Is in Equilibrium. Annu. Rev. Condens.Matter Phys. 2015, 6, 85−111.(28) Mirny, L. A. Nucleosome-Mediated Cooperativity betweenTranscription Factors. Proc. Natl. Acad. Sci. U. S. A. 2010, 107, 22534−22539.(29) Narula, J.; Igoshin, O. A. Thermodynamic Models ofCombinatorial Gene Regulation by Distant Enhancers. IET Syst. Biol.2010, 4, 393−408.(30) Gunawardena, J. A. Linear Framework for Time-ScaleSeparation in Nonlinear Biochemical Systems. PLoS One 2012, 7,e36321.(31) Bintu, L.; Buchler, N. E.; Garcia, H. G.; Gerland, U.; Hwa, T.;Kondev, J.; Phillips, R. Transcriptional Regulation by the Numbers:Models. Curr. Opin. Genet. Dev. 2005, 15, 116−124.(32) Phillips, R.; Kondev, J.; Theriot, J.; Garcia, H.; Chasan, B.Physical Biology of the Cell, 2nd ed.; Garland Science: New York, 2010.(33) Gardino, A. K.; Volkman, B. F.; Cho, H. S.; Lee, S.-Y.; Wemmer,D. E.; Kern, D. The NMR Solution Structure of BeF3-Activated Spo0FReveals the Conformational Switch in a Phosphorelay System. J. Mol.Biol. 2003, 331, 245−254.(34) Milligan, G. Constitutive Activity and Inverse Agonists of GProtein-Coupled Receptors: A Current Perspective. Mol. Pharmacol.2003, 64, 1271−1276.(35) Kern, D.; Zuiderweg, E. R. The Role of Dynamics in AllostericRegulation. Curr. Opin. Struct. Biol. 2003, 13, 748−757.(36) Howlett, G. J.; Blackburn, M. N.; Compton, J. G.; Schachman,H. K. Allosteric Regulation of Aspartate Transcarbamoylase.Biochemistry 1977, 16, 5091−5099.(37) Wolfenden, R. Degrees of Difficulty of Water-ConsumingReactions in the Absence of Enzymes. Chem. Rev. 2006, 106, 3379−3396.(38) Phillips, R., Milo, R. Cell Biology by the Numbers; GarlandScience: New York, 2015; Chapter 4.(39) Frank, S. Biol. Direct 2013, 8, 31.(40) Dyachenko, A.; Gruber, R.; Shimon, L.; Horovitz, A.; Sharon,M. Allosteric Mechanisms Can Be Distinguished Using StructuralMass Spectrometry. Proc. Natl. Acad. Sci. U. S. A. 2013, 110, 7235−7239.(41) Mellinghoff, I. K., Sawyers, C. L. Therapeutic Kinase Inhibitors;Springer Science & Business Media: Berlin, 2012; Vol. 27.(42) Gerhart, J. From Feedback Inhibition to Allostery: TheEnduring Example of Aspartate Transcarbamoylase. FEBS J. 2014,281, 612−620.
The Journal of Physical Chemistry B Article
DOI: 10.1021/acs.jpcb.6b01911J. Phys. Chem. B XXXX, XXX, XXX−XXX
P

(43) Lipscomb, W. N.; Kantrowitz, E. R. Structure and Mechanismsof Escherichia coli Aspartate Transcarbamoylase. Acc. Chem. Res. 2012,45, 444−453.(44) Weber, K. New Structural Model of E. coli AspartateTranscarbamylase and the Amino-acid Sequence of the RegulatoryPolypeptide Chain. Nature 1968, 218, 1116−1119.(45) Wiley, D. C.; Lipscomb, W. N. Crystallographic Determinationof Symmetry of Aspartate Transcarbamylase. Nature 1968, 218, 1119−1121.(46) Yokota, E.; Riggs, A. F. The Structure of the Hemocyanin fromthe Horseshoe Crab, Limulus polyphemus. J. Biol. Chem. 1984, 259,4739−4749.(47) Taylor, A. B.; Hu, G.; Hart, P. J.; McAlister-Henn, L. AllostericMotions in Structures of Yeast NAD+-Specific Isocitrate Dehydrogen-ase. J. Biol. Chem. 2008, 283, 10872−10880.(48) Giroux, E.; Williams, M. K.; Kantrowitz, E. R. Shared ActiveSites of Fructose-1,6-Bisphosphatase. J. Biol. Chem. 1994, 269, 31404−31409.(49) Cornish-Bowden, A. A. Simple Graphical Method forDetermining the Inhibition Constants of Mixed, Uncompetitive andNon-Competitive Inhibitors. Biochem. J. 1974, 137, 143−144.(50) Berg, J. M.; Tymoczko, J. L.; Stryer, L. Enzymes Can. Be Inhibitedby Specific Molecules, 5th ed.; W. H. Freeman: New York, 2002.(51) Li, C.; Begum, A.; Numao, S.; Park, K. H.; Withers, S. G.;Brayer, G. D. Acarbose Rearrangement Mechanism Implied by theKinetic and Structural Analysis of Human Pancreatic Alpha-Amylase inComplex with Analogues and their Elongated Counterparts.Biochemistry 2005, 44, 3347−3357.(52) Bussy, O. l. Structural and Functional Aspects of ChlorideBinding to Alteromonas haloplanctis Alpha-Amylase. J. Biol. Chem.1996, 271, 23836−23841.(53) Kaiser, P. M. Substrate Inhibition as a Problem of Non-LinearSteady State Kinetics with Monomeric Enzymes. J. Mol. Catal. 1980, 8,431−442.(54) Reed, M. C.; Lieb, A.; Nijhout, H. F. The Biological Significanceof Substrate Inhibition: A Mechanism with Diverse Functions.BioEssays 2010, 32, 422−429.(55) Changeux, J. P. Responses of Acetylcholinesterase fromTorpedo marmorata to Salts and Curarizing Drugs. Mol. Pharmacol.1966, 2, 369−392.(56) Miller, O. J.; Harrak, A. E.; Mangeat, T.; Baret, J.-C.; Frenz, L.;Debs, B. E.; Mayot, E.; Samuels, M. L.; Rooney, E. K.; Dieu, P.; et al.High-Resolution Dose-Response Screening Using Droplet-BasedMicrofluidics. Proc. Natl. Acad. Sci. U. S. A. 2012, 109, 378−383.(57) Wang, J.; Stieglitz, K. A.; Cardia, J. P.; Kantrowitz, E. R.Structural Basis for Ordered Substrate Binding and Cooperativity inAspartate Transcarbamoylase. Proc. Natl. Acad. Sci. U. S. A. 2005, 102,8881−8886.(58) Hsuanyu, Y.; Wedler, F. C. Kinetic Mechanism of NativeEscherichia coli Aspartate Transcarbamylase. Arch. Biochem. Biophys.1987, 259, 316−330.(59) Harris, K. M.; Cockrell, G. M.; Puleo, D. E.; Kantrowitz, E. R.Crystallographic Snapshots of the Complete Catalytic Cycle of theUnregulated Aspartate Transcarbamoylase from Bacillus subtilis. J.Mol. Biol. 2011, 411, 190−200.(60) Wang, J.; Eldo, J.; Kantrowitz, E. R. Structural Model of the RState of Escherichia coli Aspartate Transcarbamoylase with SubstratesBound. J. Mol. Biol. 2007, 371, 1261−1273.(61) Masson, P.; Schopfer, L. M.; Bartels, C. F.; Froment, M.-T.;Ribes, F.; Nachon, F.; Lockridge, O. Substrate Activation inAcetylcholinesterase Induced by Low pH or Mutation in the p-CationSubsite. Biochim. Biophys. Acta, Protein Struct. Mol. Enzymol. 2002,1594, 313−324.(62) Otero, L. H.; Beassoni, P. R.; Boetsch, C.; Lisa, A. T.;Domenech, C. E. Different Effects of Mg and Zn on the Two Sites forAlkylammonium Compounds in Pseudomonas aeruginosa Phosphor-ylcholine Phosphatase. Enzyme Res. 2011, 2011, 918283.
(63) Penner, P. E.; Cohen, L. H. Effects of Adenosine Triphosphateand Magnesium Ions on the Fumarase Reaction. J. Biol. Chem. 1969,244, 1070−1075.(64) Kantrowitz, E. R.; Lipscomb, W. N. Escherichia coli AspartateTranscarbamylase: The Relation between Structure and Function.Science 1988, 241, 669−674.(65) Sprang, S. R.; Acharya, K. R.; Goldsmith, E. J.; Stuart, D. I.;Varvill, K.; Fletterick, R. J.; Madsen, N. B.; Johnson, L. N. StructuralChanges in Glycogen Phosphorylase Induced by Phosphorylation.Nature 1988, 336, 215−221.(66) Boettcher, A. J.; Wu, J.; Kim, C.; Yang, J.; Bruystens, J.; Cheung,N.; Pennypacker, J. K.; Blumenthal, D. A.; Kornev, A. P.; Taylor, S. S.Realizing the Allosteric Potential of the Tetrameric Protein Kinase ARIa Holoenzyme. Structure 2011, 19, 265−276.(67) Gill, S. J.; Robert, C. H.; Coletta, M.; Di Cera, E.; Brunori, M.Cooperative Free Energies for Nested Allosteric Models as Applied toHuman Hemoglobin. Biophys. J. 1986, 50, 747−752.(68) Yifrach, O.; Horovitz, A. Nested Cooperativity in the ATPaseActivity of the Oligomeric Chaperonin GroEL. Biochemistry 1995, 34,5303−5308.(69) Caprio, M. LevelScheme: A Level Scheme Drawing andScientific Figure Preparation System for Mathematica. Comput. Phys.Commun. 2005, 171, 107−118.
The Journal of Physical Chemistry B Article
DOI: 10.1021/acs.jpcb.6b01911J. Phys. Chem. B XXXX, XXX, XXX−XXX
Q