statistical modelling ad for process optimization and ... modelling of anaerobic digestion.pdf ·...
TRANSCRIPT

Statistical Modelling AD for Process Optimization and Bench-marking – A Case Study of E. coli Inactivation Across all Thames Water Conventional Sewage Sludge Treatment Sites Stephen Smith Jin Liu and Yun Gao Department of Civil and Environmental Engineering Pete Pearce and Achame Shana Thames Water
Data Availability
The Water Industry measures many different types of process data: • Flow rates • Concentrations • Valve operations • Electricity consumption • Chemical consumption The information is used corporately and locally for: • On-site process management • Compliance demonstration • Calculate inflow and production quantities This data could also provide critical insights to process operation and efficiency

Advantages and Disadvantages of an Integrated Data Approach
Advantages • Uses existing and maximise potential value of data resources • Applies objective statistical analysis techniques • Integrates all data together to centralise interpretation and reporting • Allows benchmarking, trend assessment, diagnosis and process
optimisation Disadvantages • Sampling, laboratory and equipment analysis errors • Autocorrelation of variables • Predictive capacity limited within the data boundary conditions • Data collected and reported differently within and between companies
• You need to be good at statistics!

E. coli Removal by Conventional AD

Dataset

Methodology High Level Screening and Data Combination
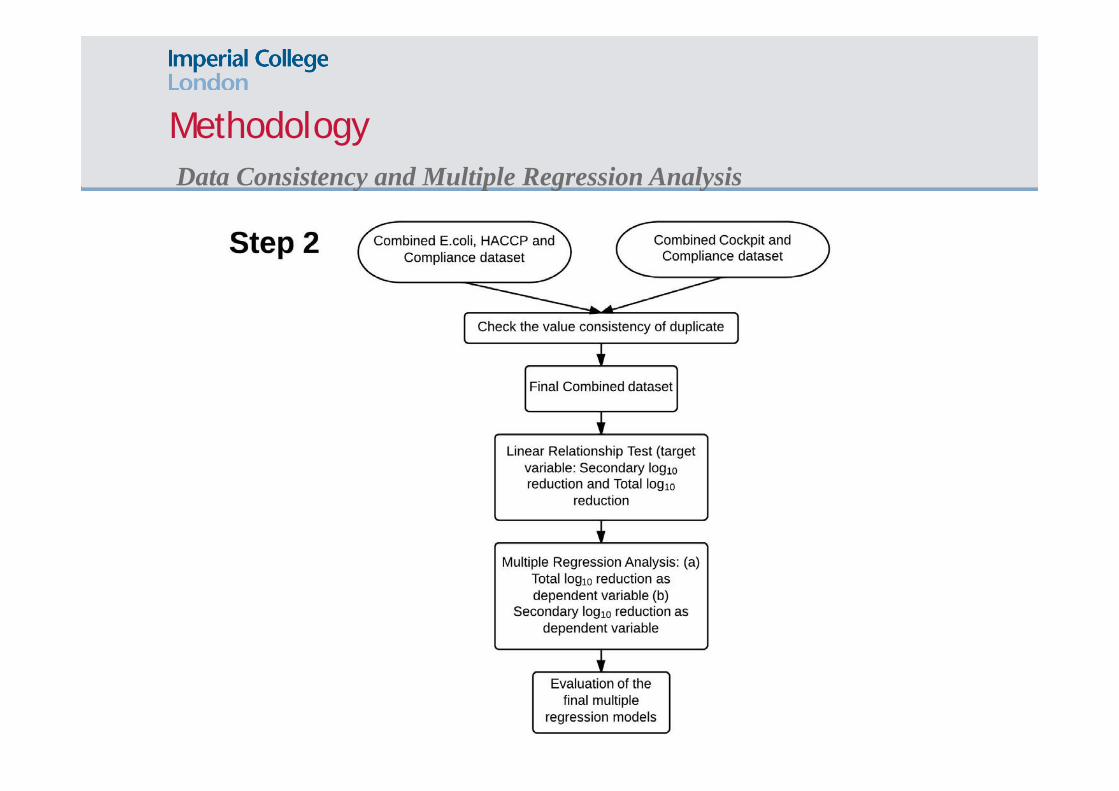
Methodology Data Consistency and Multiple Regression Analysis

Pathogen Reduction Performance Across Years

Seasonal Difference in E. coli Reduction Performance

Correlation Between E. coli Reduction and Physico-Chemical Variables: Primary Digestion
Covariate Significance (P)
Adjusted R2
η2Postive or Negative
Correlation(+/-)
E.coli Input <0.001 0.679 0.126 +
VSR 0.014 0.561 0.008 +
DS input 0.098 0.571 0.003 +
Feed TDS 0.336 0.567 0.001 +
Feed Volume 0.816 0.539 <0.001 -
%primary 0.342 0.564 0.002 +Organic Loading 0.963 0.549 <0.001 +
Nominal HRT 0.922 0.538 <0.001 +
Actual HRT 0.666 0.539 <0.001 -
Temperature 0.741 0.541 <0.001 -

Correlation Between E. coli Reduction and Physico-Chemical Variables: Secondary Digestion + Overall
Covariate Significance (P) Adjusted R2 η2 (%) Positive or Negative Correlation (+/-)
Feed Volume 0.137 0.610 0.3 - Primary Temperature <0.001 0.616 2.0 + Dry Solids Input 0.782 0.623 <0.1 + Volatile Solids
Input 0.820 0.631 <0.1 -
Primary E. coli Input
0.171 0.653 0.4 +
Primary log10 Reduction
<0.001 0.705 9.1 -
Primary VSR 0.991 0.701 <0.1 + Primary Actual HRT 0.117 0.609 0.3 + Secondary retention
time 0.641 0.623 <0.1 - Covariate Significance (P) Adjusted R2 η2 (%) Positive or Negative
Correlation (+/-)
Feed Volume 0.222 0.505 0.3 -
Primary Temperature <0.001 0.541 6.5 +
Dry Solids Input 0.626 0.497 <0.1 +
Volatile Solids Input 0.201 0.483 0.4 -
Primary E. coli Input <0.001 0.685 37.4 +
Primary log10 Reduction <0.001 0.647 26.6 +
Secondary log10 Reduction
<0.001 0.662 30.8 +
Primary VSR 0.070 0.412 1.0 +
Primary Nominal HRT 0.256 0.505 0.3 +
Primary Estimated HRT 0.129 0.506 0.4 +
Secondary retention time
0.082 0.523 0.6 +
Linear Relationship Tests between physico-chemical parameters and secondary E. coli reduction
Linear Relationship Tests between physico-chemical parameters and total E. coli reduction

Primary Digestion Multiple Regression Modelling Summary

Source Type III Sum of Squares df Sig. Partial ƞ2% ƞ2%
Corrected Model 387.4a 101 <0.001 78.4
Intercept 3.2 1 0.001 2.9
Temperature 7.9 1 <0.001 6.9 2.8%
Primary log10 reduction
14.1 1 <0.001 11.7 4.9%
Site 103.8 17 <0.001 49.2 36.4%
Year 3.8 6 0.033 3.4 1.3%
Site * Year 48.5 76 <0.001 31.2 17.0%
Error 107.0 389
Total 1215.3 491
Corrected Total 494.4 490
a. R Squared = 0.784 (Adjusted R Squared = 0.727)
• Target variable: Secondary E. coli log10 reduction
• Covariates: Primary E. coli log10 reduction, Primary Temperature
• Fixed factors: Site, Year
• Interaction term: Site*Year
Tests of Between-Subjects Effects of Model
Multiple Regression Model for Secondary E. coli Reduction

Source Type III Sum of Squares df Sig. Partial η2% η2%
Corrected Model 349.4a 107 <0.001 77.8
Intercept 23.6 1 <0.001 19.2
Temperature 8.6 1 <0.001 8.0 3.0
E. coli_Input 62.9 1 <0.001 38.7 21.3
Site 90.7 17 <0.001 47.7 30.7
Year 3.1 6 .017 3.0 1.1
Site * Year 30.3 82 <0.001 23.3 10.3
Error 99.6 510 33.7
Total 5421.4 618
Corrected Total 448.0 617
a. R Squared =0 .778 (Adjusted R Squared = 0.732)
• Target variable: Total E. coli log10 reduction
• Covariates: Primary E. coli input, Primary temperature
• Fixed factors: Site, Year
• Interaction term: Site*Year
Tests of Between-Subjects Effects of Model
Multiple Regression Model for Total E. coli Reduction

E. coli input log10 cfu g
-1 DS (Categorise)
Primary Temperature Range oC
Predicted total E. coli reduction log10 cfu g
-1 DS
Lowest 4.35 28.5-40.75 -0.48-1.04
Highest 8.36 28.5-40.75 3.30-4.82
Surface plot for primary temperature, E. coli input and total E. coli log10 reduction based on Model
Predicted total E. coli reduction at different E. coli input and temperature
E. coli Removal – AD Process Model

Predicted Minimum Temperatures to Achieve 2 log10 Reductions
16
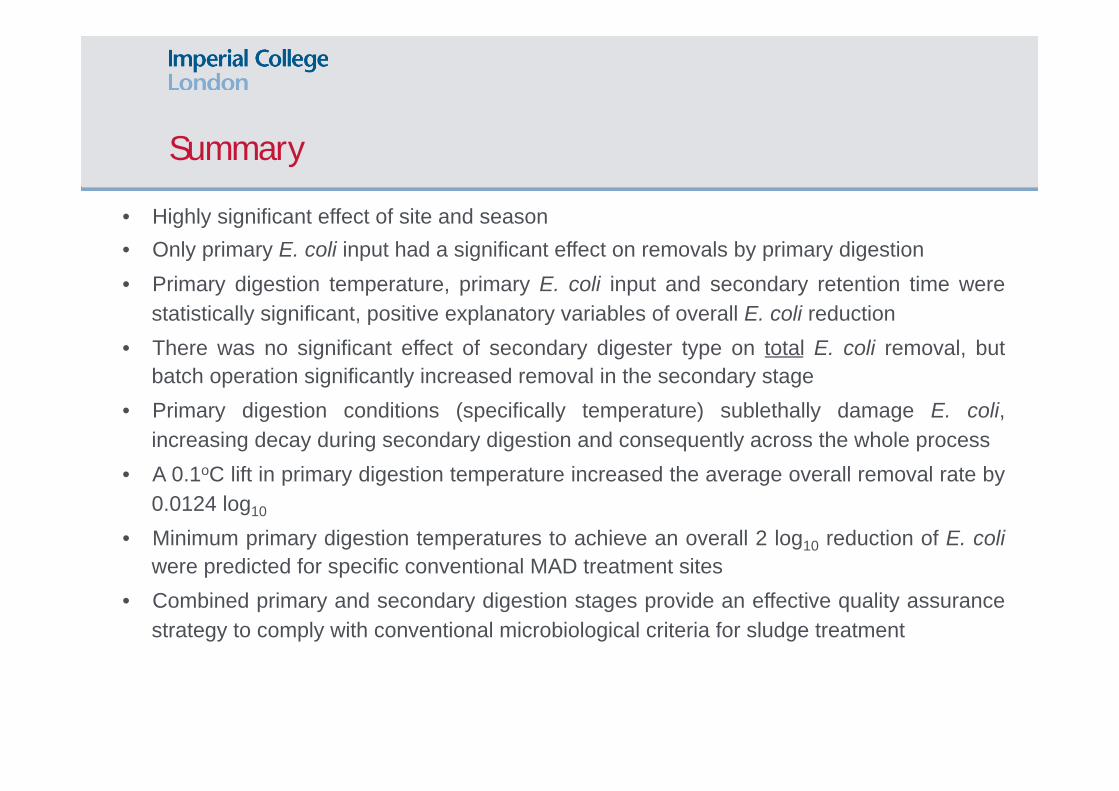
Summary • Highly significant effect of site and season • Only primary E. coli input had a significant effect on removals by primary digestion • Primary digestion temperature, primary E. coli input and secondary retention time were
statistically significant, positive explanatory variables of overall E. coli reduction • There was no significant effect of secondary digester type on total E. coli removal, but
batch operation significantly increased removal in the secondary stage • Primary digestion conditions (specifically temperature) sublethally damage E. coli,
increasing decay during secondary digestion and consequently across the whole process • A 0.1oC lift in primary digestion temperature increased the average overall removal rate by
0.0124 log10
• Minimum primary digestion temperatures to achieve an overall 2 log10 reduction of E. coli were predicted for specific conventional MAD treatment sites
• Combined primary and secondary digestion stages provide an effective quality assurance strategy to comply with conventional microbiological criteria for sludge treatment