statistical practice i revision maths learning centre · statistical practice i revision maths ......
TRANSCRIPT
Statistical Practice I Revision Maths Learning Centre
By Dr David Butler © 2013 The University of Adelaide 4
Details about hypothesis/significance tests and confidence intervals
A significance test is designed to DECIDE the answer to a YES OR NO question using DATA.
This is the information we need to know about a significance test for Stat Prac I:
QUESTION: Types of yes-or-no questions it can answer, including the types of variables involved.
PARAMETERS: The parameters that need to be defined (if any).
HYPOTHESES: Appropriate null and alternative hypotheses.
TEST STATISTIC: The formula for the test statistic
DISTRIBUTION: The distribution of the test statistic given that the null is true.
P-VALUE: Where the p-value is on a picture (if appropriate)
COMPUTER: Where the test statistic and p-value are in computer output (if appropriate)
ASSUMPTIONS: Assumptions needed, and how to check them.
CONFIDENCE INTERVAL: The confidence interval for the matching “how big is this number” question (if appropriate)
These are the significance tests covered in Stat Prac I:
Z-test for one mean.
One-sample t-test for one mean.
Z-test for one proportion.
Chi-squared test for goodness of fit.
Paired t-test.
Two-sample (unpaired) t-test.
Wilcoxon rank-sum test.
ANOVA
Z-test for two proportions.
Chi-squared test for homogeneity.
Chi-squared test for independence.
T-test for slope in regression
Confidence and prediction intervals in regression

Statistical Practice I Revision Maths Learning Centre
By Dr David Butler © 2013 The University of Adelaide 5
Z-test for one mean
QUESTION: Is the mean equal to this particular number?
PARAMETERS: Let be the true mean of the variable.
HYPOTHESES: and (or or )
TEST STATISTIC:
√ ⁄
DISTRIBUTION:
P-VALUE:
ASSUMPTIONS:
True standard deviation known – check with story
Normality – check with histogram
Independence – check with story
CONFIDENCE INTERVAL:
√
Variable
QUANT
True sd
known
z
Just this side
for “<”
Just this side
for “>”
Statistical Practice I Revision Maths Learning Centre
By Dr David Butler © 2013 The University of Adelaide 6
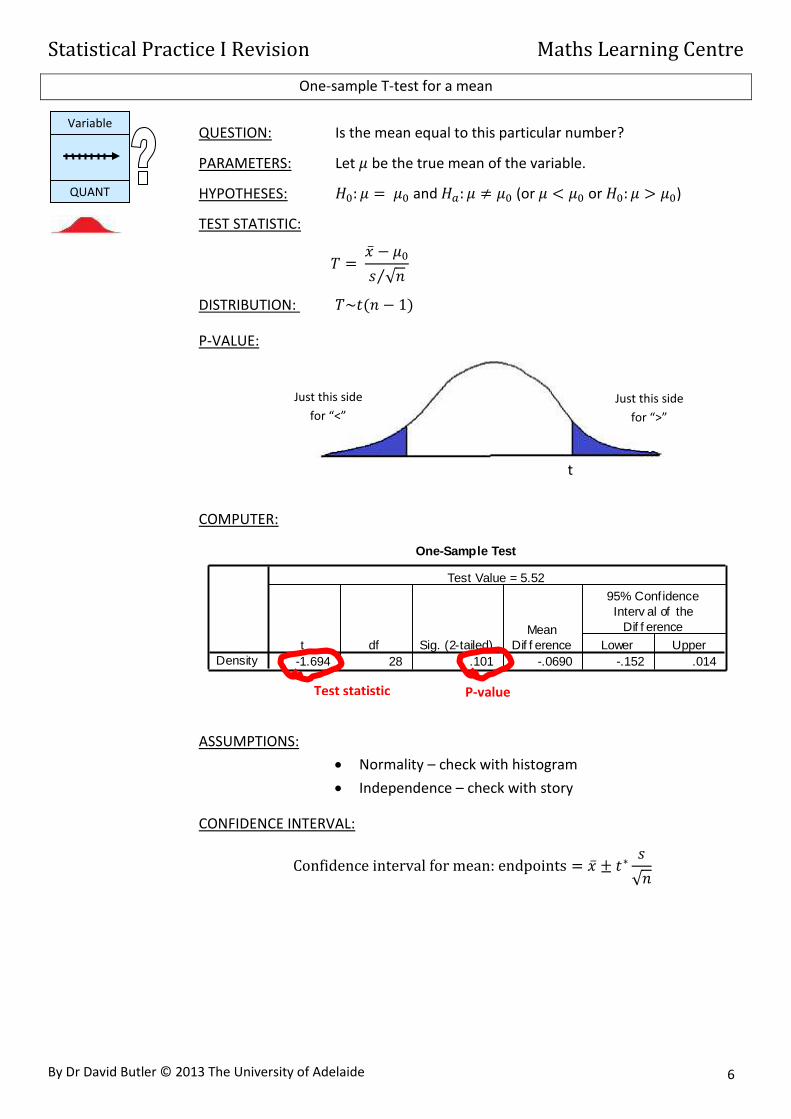
One-sample T-test for a mean
QUESTION: Is the mean equal to this particular number?
PARAMETERS: Let be the true mean of the variable.
HYPOTHESES: and (or or )
TEST STATISTIC:
√ ⁄
DISTRIBUTION:
P-VALUE:
COMPUTER:
ASSUMPTIONS:
Normality – check with histogram
Independence – check with story
CONFIDENCE INTERVAL:
√
One-Sample Test
-1.694 28 .101 -.0690 -.152 .014Density
t df Sig. (2-tailed)
Mean
Dif f erence Lower Upper
95% Conf idence
Interv al of the
Dif f erence
Test Value = 5.52
Variable
QUANT
Test statistic P-value
t
Just this side
for “<”
Just this side
for “>”
Statistical Practice I Revision Maths Learning Centre
By Dr David Butler © 2013 The University of Adelaide 7
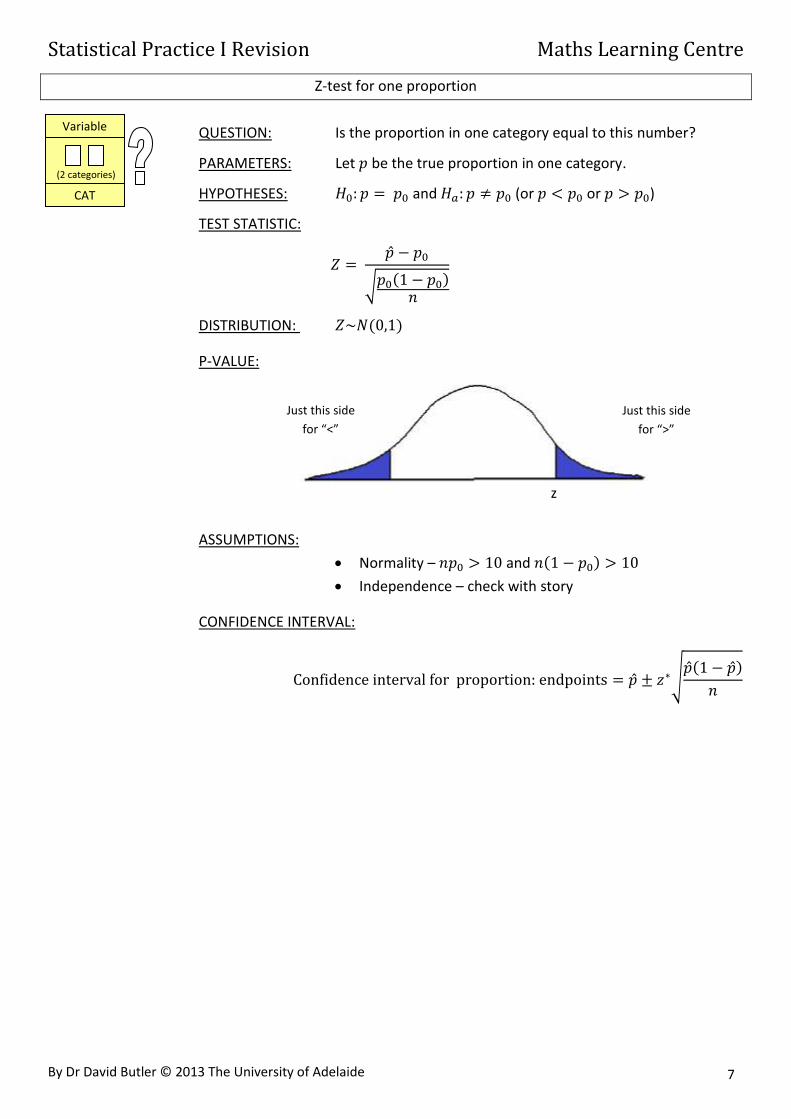
Z-test for one proportion
QUESTION: Is the proportion in one category equal to this number?
PARAMETERS: Let be the true proportion in one category.
HYPOTHESES: and (or or )
TEST STATISTIC:
√
DISTRIBUTION:
P-VALUE:
ASSUMPTIONS:
Normality – and
Independence – check with story
CONFIDENCE INTERVAL:
√
z
Just this side
for “<”
Just this side
for “>”
Variable
CAT
(2 categories)
Statistical Practice I Revision Maths Learning Centre
By Dr David Butler © 2013 The University of Adelaide 8
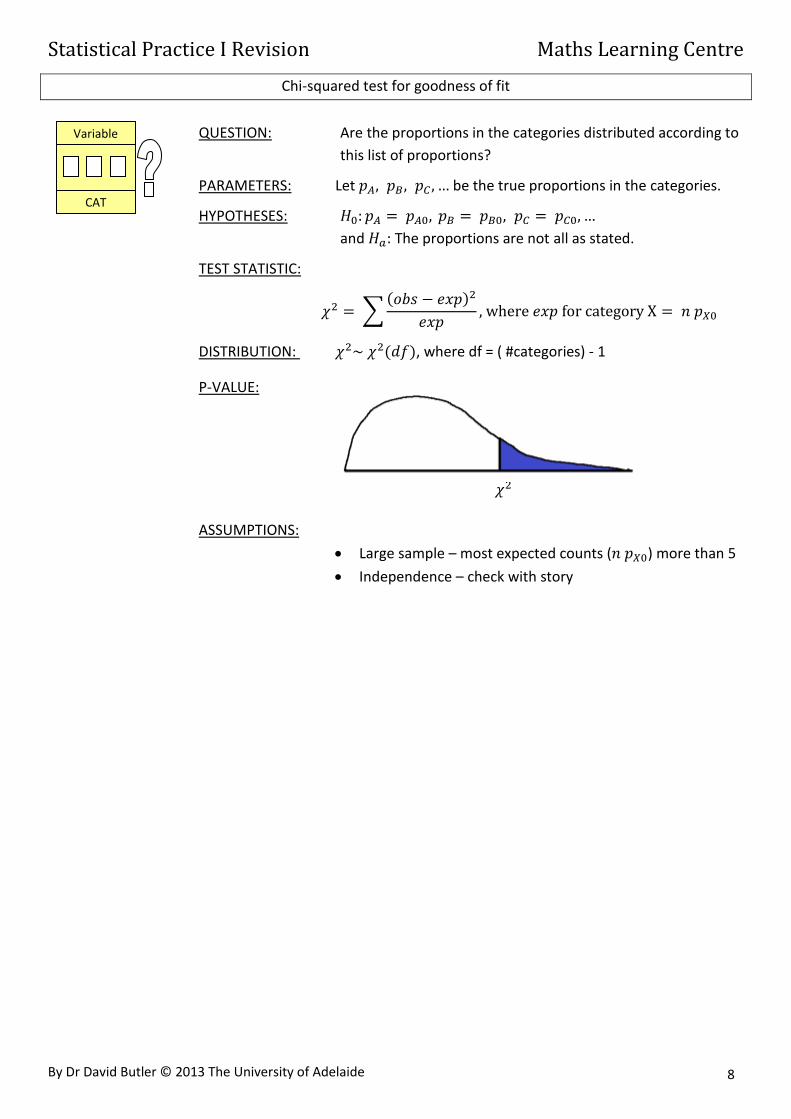
Chi-squared test for goodness of fit
QUESTION: Are the proportions in the categories distributed according to
this list of proportions?
PARAMETERS: Let be the true proportions in the categories.
HYPOTHESES:
and The proportions are not all as stated.
TEST STATISTIC:
∑
DISTRIBUTION: , where df = ( #categories) - 1
P-VALUE:
ASSUMPTIONS:
Large sample – most expected counts ( ) more than 5
Independence – check with story
Variable
CAT

Statistical Practice I Revision Maths Learning Centre
By Dr David Butler © 2013 The University of Adelaide 9
Paired t-test
QUESTION: Is the mean difference equal to 0?
PARAMETERS: Let be the true mean difference (calculated
as A – B).
HYPOTHESES: and
TEST STATISTIC:
√ ⁄
DISTRIBUTION:
P-VALUE:
COMPUTER:
ASSUMPTIONS:
Normality of differences – check with histogram
Independence – check with story
CONFIDENCE INTERVAL:
√
P-value
t
Variable
QUANT
Variable
CAT
(2 categories)
Repeated Measures
Difference
QUANT
Paired Samples Test
1.067 2.434 .628 -.281 2.415 1.697 14 .112Dominant -
Non Dominant
Pair
1
Mean Std. Dev iation
Std. Error
Mean Lower Upper
95% Conf idence
Interv al of the
Dif f erence
Paired Dif f erences
t df Sig. (2-tailed)
Test statistic

Statistical Practice I Revision Maths Learning Centre
By Dr David Butler © 2013 The University of Adelaide 10
P-value Test
statistic
df
Two-sample (unpaired) t-test
QUESTION: Does the category affect the outcome?
OR Are the means different under the two
categories?
PARAMETERS: Let be the true mean difference in category
A, and be the true mean difference in
category B.
HYPOTHESES: and
TEST STATISTIC:
√
DISTRIBUTION: approx. (where df is complicated)
P-VALUE:
COMPUTER:
ASSUMPTIONS:
Normality within each group – check with histograms
Independence within groups – check with story
Independence between groups – check with story
CONFIDENCE INTERVAL:
√
t
Variable
NUMERICAL
Variable
CATEGORICAL
(2 categories)
Independent Groups
Statistical Practice I Revision Maths Learning Centre
By Dr David Butler © 2013 The University of Adelaide 11
P-value
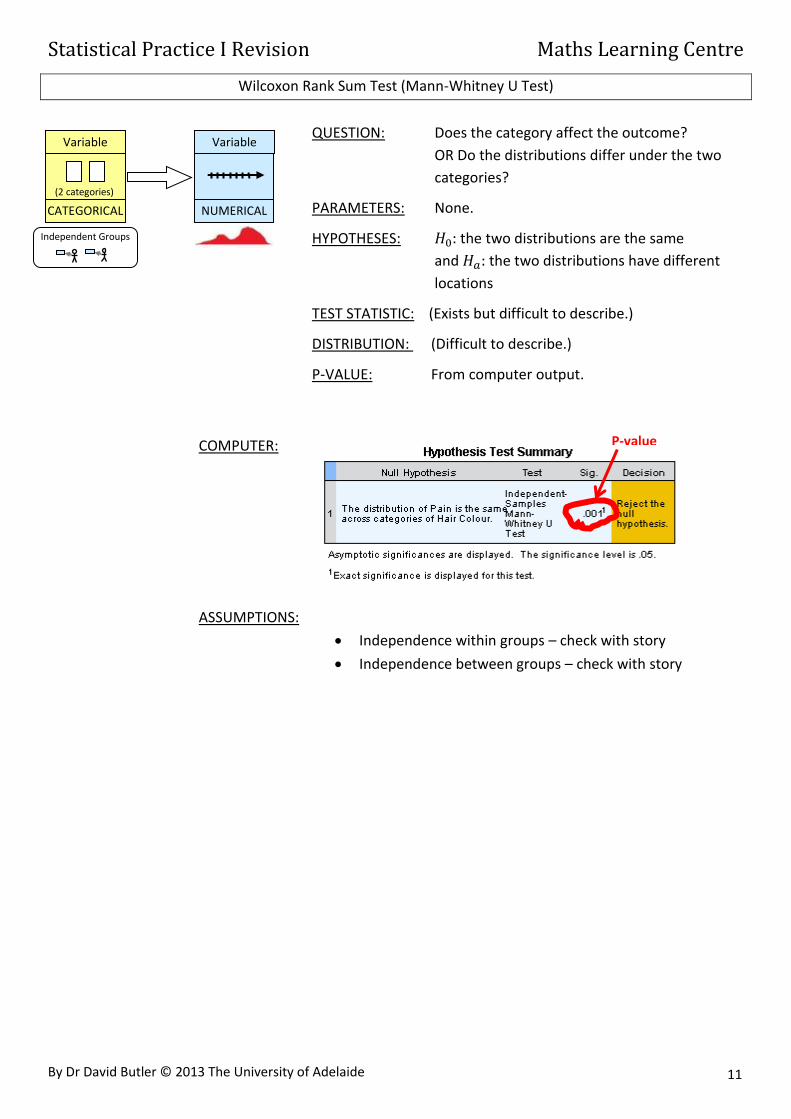
Wilcoxon Rank Sum Test (Mann-Whitney U Test)
QUESTION: Does the category affect the outcome?
OR Do the distributions differ under the two
categories?
PARAMETERS: None.
HYPOTHESES: the two distributions are the same
and the two distributions have different
locations
TEST STATISTIC: (Exists but difficult to describe.)
DISTRIBUTION: (Difficult to describe.)
P-VALUE: From computer output.
COMPUTER:
ASSUMPTIONS:
Independence within groups – check with story
Independence between groups – check with story
Variable
NUMERICAL
Variable
CATEGORICAL
(2 categories)
Independent Groups
Statistical Practice I Revision Maths Learning Centre
By Dr David Butler © 2013 The University of Adelaide 12
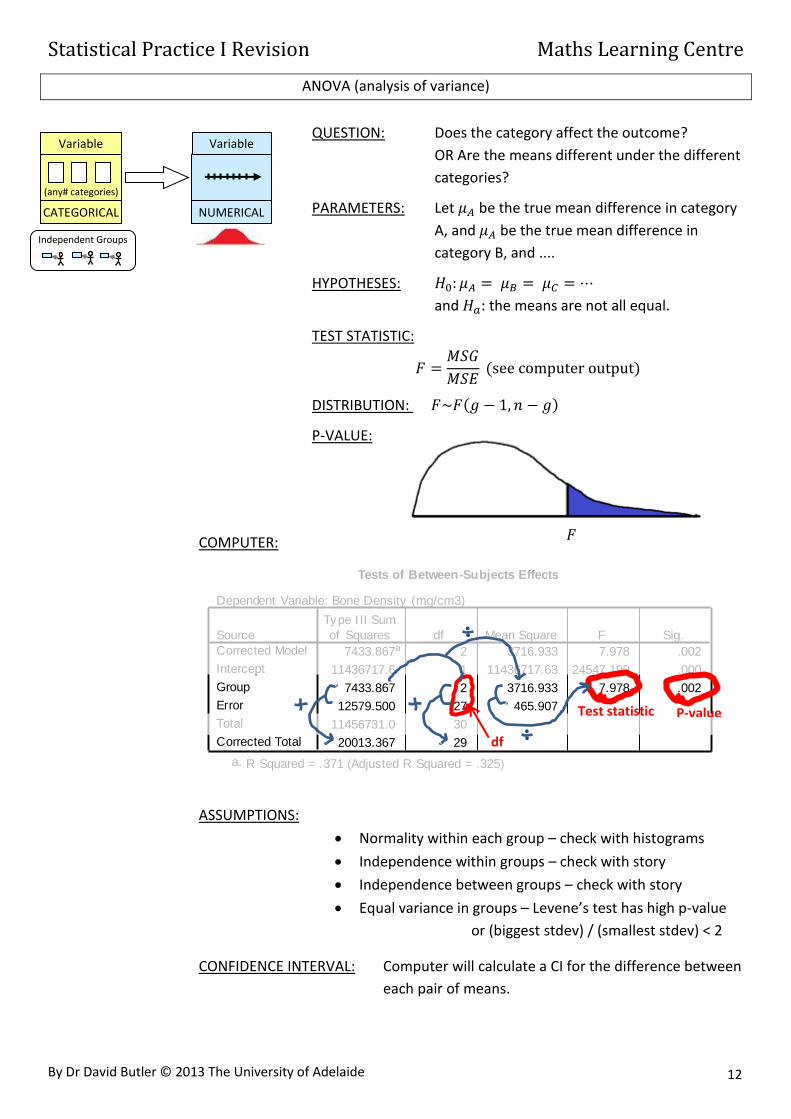
Tests of Between-Subjects Effects
Dependent Variable: Bone Density (mg/cm3)
7433.867a 2 3716.933 7.978 .002
11436717.6 1 11436717.63 24547.190 .000
7433.867 2 3716.933 7.978 .002
12579.500 27 465.907
11456731.0 30
20013.367 29
Source
Corrected Model
Intercept
Group
Error
Total
Corrected Total
Type I II Sum
of Squares df Mean Square F Sig.
R Squared = .371 (Adjusted R Squared = .325)a.
P-value Test statistic
df
ANOVA (analysis of variance)
QUESTION: Does the category affect the outcome?
OR Are the means different under the different
categories?
PARAMETERS: Let be the true mean difference in category
A, and be the true mean difference in
category B, and ....
HYPOTHESES:
and the means are not all equal.
TEST STATISTIC:
DISTRIBUTION:
P-VALUE:
COMPUTER:
ASSUMPTIONS:
Normality within each group – check with histograms
Independence within groups – check with story
Independence between groups – check with story
Equal variance in groups – Levene’s test has high p-value
or (biggest stdev) / (smallest stdev) < 2
CONFIDENCE INTERVAL: Computer will calculate a CI for the difference between
each pair of means.
Variable
NUMERICAL
Variable
CATEGORICAL
(any# categories)
Independent Groups
Statistical Practice I Revision Maths Learning Centre
By Dr David Butler © 2013 The University of Adelaide 13
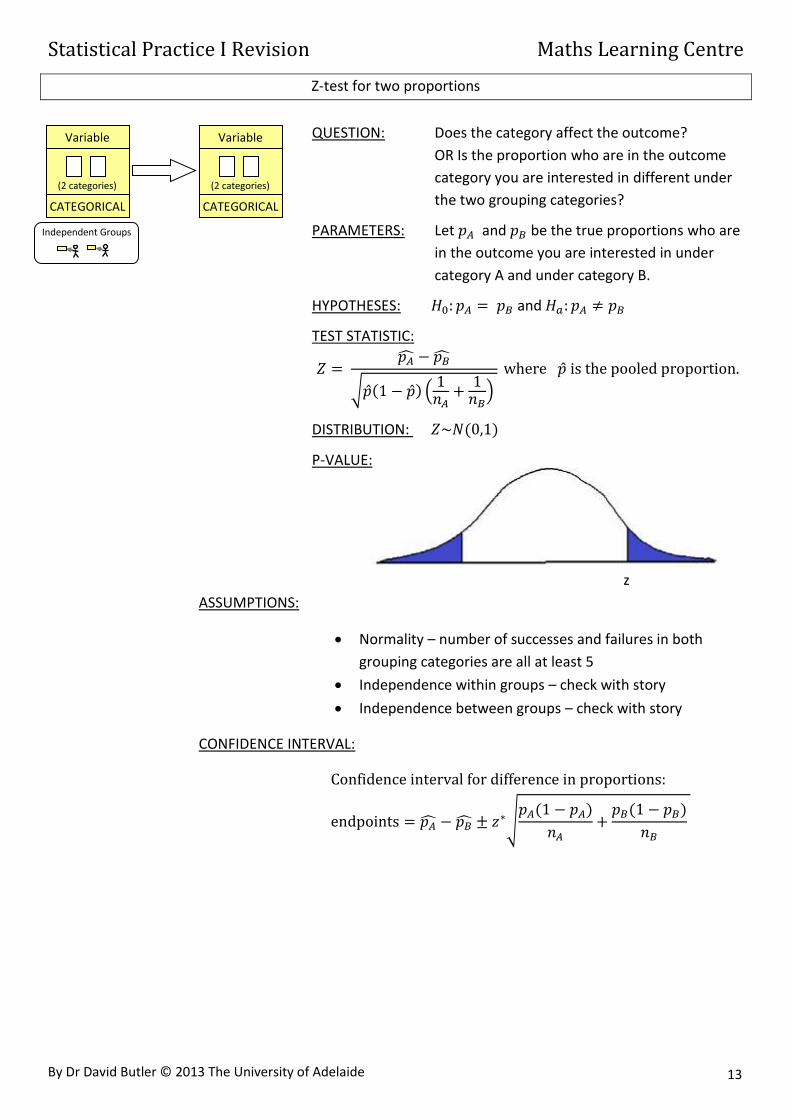
Z-test for two proportions
QUESTION: Does the category affect the outcome?
OR Is the proportion who are in the outcome
category you are interested in different under
the two grouping categories?
PARAMETERS: Let and be the true proportions who are
in the outcome you are interested in under
category A and under category B.
HYPOTHESES: and
TEST STATISTIC:
√ (
)
DISTRIBUTION:
P-VALUE:
ASSUMPTIONS:
Normality – number of successes and failures in both
grouping categories are all at least 5
Independence within groups – check with story
Independence between groups – check with story
CONFIDENCE INTERVAL:
√
z
Variable
CATEGORICAL
(2 categories)
Variable
CATEGORICAL
(2 categories)
Independent Groups
Statistical Practice I Revision Maths Learning Centre
By Dr David Butler © 2013 The University of Adelaide 14
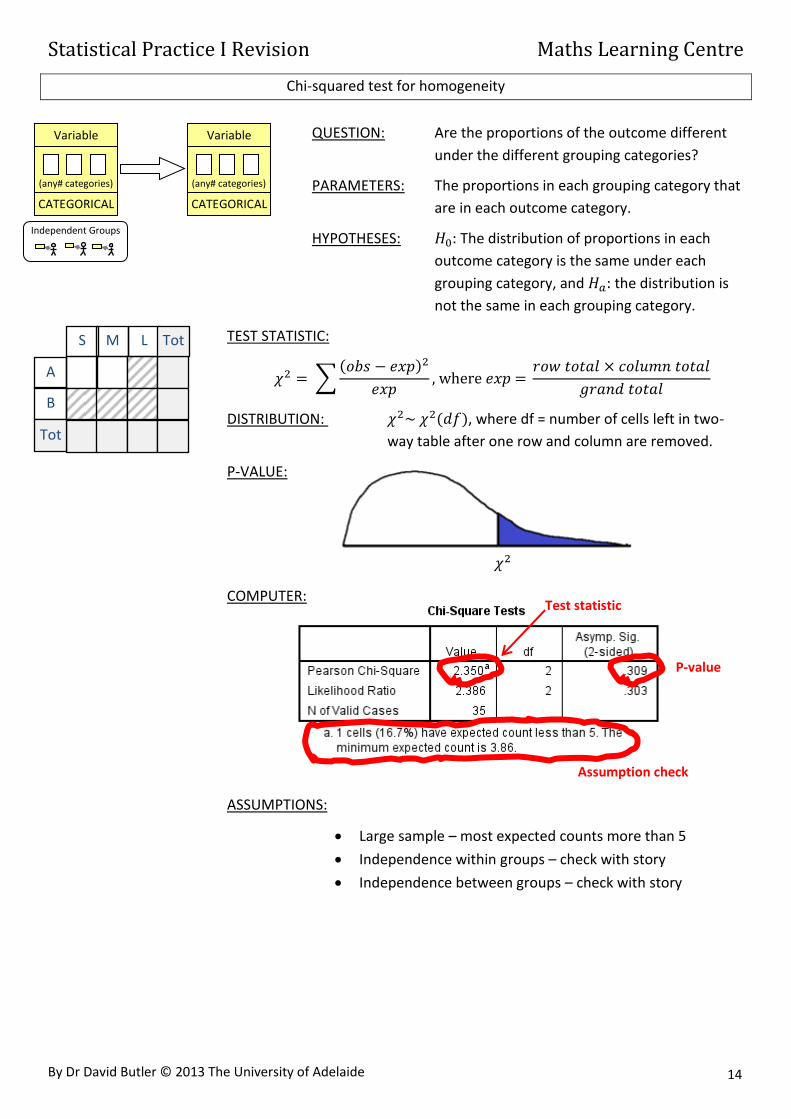
P-value
Assumption check
Test statistic
Chi-squared test for homogeneity
QUESTION: Are the proportions of the outcome different
under the different grouping categories?
PARAMETERS: The proportions in each grouping category that
are in each outcome category.
HYPOTHESES: The distribution of proportions in each
outcome category is the same under each
grouping category, and the distribution is
not the same in each grouping category.
TEST STATISTIC:
∑
DISTRIBUTION: , where df = number of cells left in two-
way table after one row and column are removed.
P-VALUE:
COMPUTER:
ASSUMPTIONS:
Large sample – most expected counts more than 5
Independence within groups – check with story
Independence between groups – check with story
S
B
A
M L
Tot
Tot
Variable
CATEGORICAL
(any# categories)
Variable
CATEGORICAL
(any# categories)
Independent Groups

Statistical Practice I Revision Maths Learning Centre
By Dr David Butler © 2013 The University of Adelaide 15
P-value
Assumption check
Test statistic
Chi-squared test for independence
QUESTION: Are the two variables related?
PARAMETERS: None.
HYPOTHESES: There is no association between the
variables, and There is an association
between the variables.
TEST STATISTIC:
∑
DISTRIBUTION: , where df = number of cells left in two-
way table after one row and column are removed.
P-VALUE:
COMPUTER:
ASSUMPTIONS:
Large sample – most expected counts more than 5
Independence between individuals – check with story
S
B
A
M L
Tot
Tot
Variable
CATEGORICAL
(any# categories)
Variable
CATEGORICAL
(any# categories)
Independent Groups

Statistical Practice I Revision Maths Learning Centre
By Dr David Butler © 2013 The University of Adelaide 16
P-value Test
statistic Confidence interval
T-test for slope in regression
QUESTION: Is there a linear relationship?
PARAMETERS: The true slope as per the regression model
.
HYPOTHESES: and
TEST STATISTIC:
DISTRIBUTION:
P-VALUE:
COMPUTER:
ASSUMPTIONS:
Normality of errors – check with histogram of residuals
Linearity – check with residual plot (random scatter)
Homoskedasticity – check with residual plot (even spread)
Independence between individuals – check with story
CONFIDENCE INTERVAL:
t
Variable
NUMERICAL
Variable
NUMERICAL

Statistical Practice I Revision Maths Learning Centre
By Dr David Butler © 2013 The University of Adelaide 17
M for mean
Confidence interval for mean Prediction interval for mean
I for individual
Confidence intervals and prediction intervals in regression
QUESTION: What is the mean y-value at this particular x-value?
CONFIDENCE INTERVAL FORMULA:
√
∑
QUESTION: What could an individual’s y-value be at this particular x-value?
CONFIDENCE INTERVAL FORMULA:
√
∑
COMPUTER:
NOTE:
The prediction interval is wider
Both intervals are wider the farther is from
Variable
NUMERICAL
Variable
NUMERICAL

Statistical Practice I Revision Maths Learning Centre
By Dr David Butler © 2013 The University of Adelaide 18
INTERPRETING STATISTICS
FILL IN THE BLANK WITH THE WORDS AND NUMBERS IN CONTEXT
SIGNIFICANCE TEST RESULT (REJECT)
Since the p-value is less than significance level, we reject the null hypothesis. So
there is evidence to suggest that meaning of alternative hypothesis in context.
eg: Since the p-value is less than 0.05, we reject the null hypothesis. So
there is evidence to suggest that the mean temperature is different after
meals with chilli and without.
SIGNIFICANCE TEST RESULT (DO NOT REJECT)
Since the p-value is greater than significance level, we do not reject the null
hypothesis. So there is not enough evidence to suggest that meaning of
alternative hypothesis in context.
eg: Since the p-value is greater than 0.05, we do not reject the null
hypothesis. So there is not enough evidence to suggest that there is an
association between gender of author and genre of a novel.
CONFIDENCE INTERVAL
We are confidence level % confident that the parameter for population is
between lower # units and upper # units.
eg: We are 95% confident that the true mean salt content for all chiko
rolls is between 20.1 grams and 30.5 grams.
eg: We are 90 % confident that the true proportion of left-handed people
for students studying creative arts is between 0.15 and 0.37.
SLOPE IN REGRESSION
An increase of one unit in x variable corresponds to an increase/decrease of
slope units in y variable on average.
eg: An increase of one degree Celsius in the internal temperature
corresponds to an increase of 1023 mites per square metre in carpet
dust-mite concentration on average.

Statistical Practice I Revision Maths Learning Centre
By Dr David Butler © 2013 The University of Adelaide 19
CONFIDENCE INTERVAL FOR SLOPE IN REGRESSION
We are confidence level % confident that an increase of one unit in
x variable corresponds to an increase/decrease of between lower # units and
upper # units in y variable on average.
eg: We are 95% confident that an increase of one hour of sleep per week
corresponds to an increase of between 5.2 percentage points and 10.2
percentage points on the final exam on average.
PREDICTION INTERVAL IN REGRESSION
We predict that prediction level % of all things with an x variable of x0 units
will have a y variable between lower # units and upper # units.
eg: We predict that 90% of all adults on this diet program with a dosage
of psyllium husk per day of 75 grams will have a recorded decrease in
cholesterol of 3.1 % to 4.8 %.
COEFFICIENT OF DETERMINATION IN REGRESSION
Approximately R2 % of the variation in y variable is explained by the linear
relationship with x variable.
eg: Approximately 26.2% of the variation in IQ test score is be explained
by the linear relationship with hours of video game use per week.
USING A GRAPH TO CHECK AN ASSUMPTION
In the name of graph, we see that some aspect appears to some description
and so the assumption of name of assumption is reasonable/not reasonable.
eg: In the residual plot, we see that the scatter about the zero line
appears to have a strongly curved pattern so the assumption of linearity
is not reasonable.
eg: In the residual plot, we see that the spread about the zero line
appears to be roughly the same along the whole line so the assumption of
homoscedasticity is reasonable.
eg: In the histogram, we see that the shape of the distribution appears to
be roughly bell-shaped, so the assumption of normality is reasonable.