statistical process control: control charts for attributes what is attribute?, refers to quality...
TRANSCRIPT

STATISTICAL PROCESS CONTROL:STATISTICAL PROCESS CONTROL:CONTROL CHARTS for ATTRIBUTESCONTROL CHARTS for ATTRIBUTES
• What is What is attribute?attribute?, refers to , refers to quality characteristics that conform quality characteristics that conform or do not conform to specifications or do not conform to specifications ((e.g. OK-NG, Accept-Rejecte.g. OK-NG, Accept-Reject))
• Attributes control charts use pass – fail information for Attributes control charts use pass – fail information for charting. charting.
• 2 types of usage:2 types of usage:
1. 1. Measurements not possibleMeasurements not possible – for example, visually inspected – for example, visually inspected items such as color, missing parts, scratches, and damageitems such as color, missing parts, scratches, and damage
2. 2. Measurements can be made but are not made because of time, Measurements can be made but are not made because of time, cost, or needcost, or need (e.g. use go-no-go gauge, fitting jig) (e.g. use go-no-go gauge, fitting jig)
• 2 important terms to differentiate 2 important terms to differentiate
1. 1. DefectDefect - items that contribute to nonconformity of a quality- items that contribute to nonconformity of a quality
characteristicscharacteristics
2. 2. DefectiveDefective - part/product inspected not conforming or - part/product inspected not conforming or meetingmeeting
specification (can have > 1 defects)specification (can have > 1 defects)
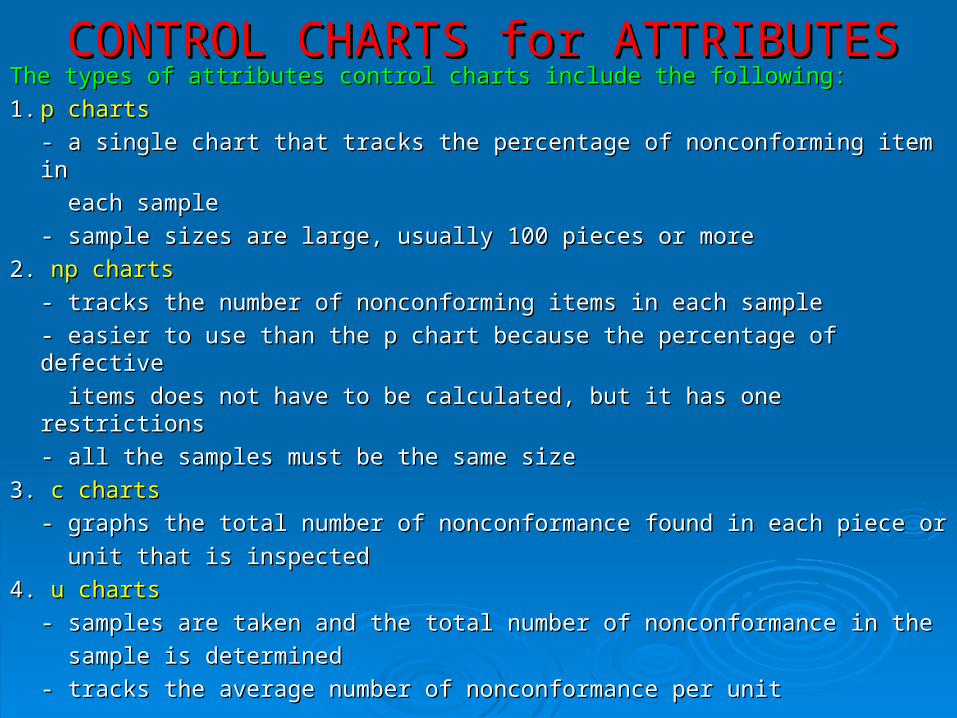
CONTROL CHARTS for ATTRIBUTESCONTROL CHARTS for ATTRIBUTESThe types of attributes control charts include the following:The types of attributes control charts include the following:
1.1. p chartsp charts
- a single chart that tracks the percentage of nonconforming item in - a single chart that tracks the percentage of nonconforming item in
each sampleeach sample
- sample sizes are large, usually 100 pieces or more- sample sizes are large, usually 100 pieces or more
2. 2. np chartsnp charts
- tracks the number of nonconforming items in each sample- tracks the number of nonconforming items in each sample
- easier to use than the p chart because the percentage of defective- easier to use than the p chart because the percentage of defective
items does not have to be calculated, but it has one restrictions items does not have to be calculated, but it has one restrictions
- all the samples must be the same size- all the samples must be the same size
3. 3. c chartsc charts
- graphs the total number of nonconformance found in each piece or- graphs the total number of nonconformance found in each piece or
unit that is inspectedunit that is inspected
4. 4. u chartsu charts
- samples are taken and the total number of nonconformance in the - samples are taken and the total number of nonconformance in the
sample is determinedsample is determined
- tracks the average number of nonconformance per unit - tracks the average number of nonconformance per unit
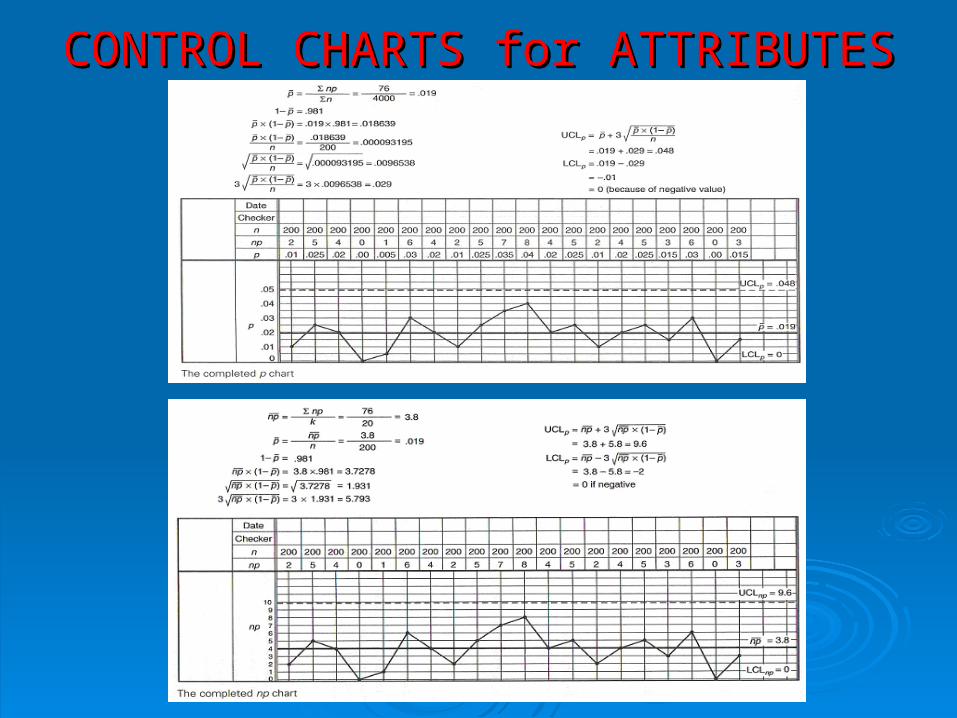
CONTROL CHARTS for ATTRIBUTESCONTROL CHARTS for ATTRIBUTES
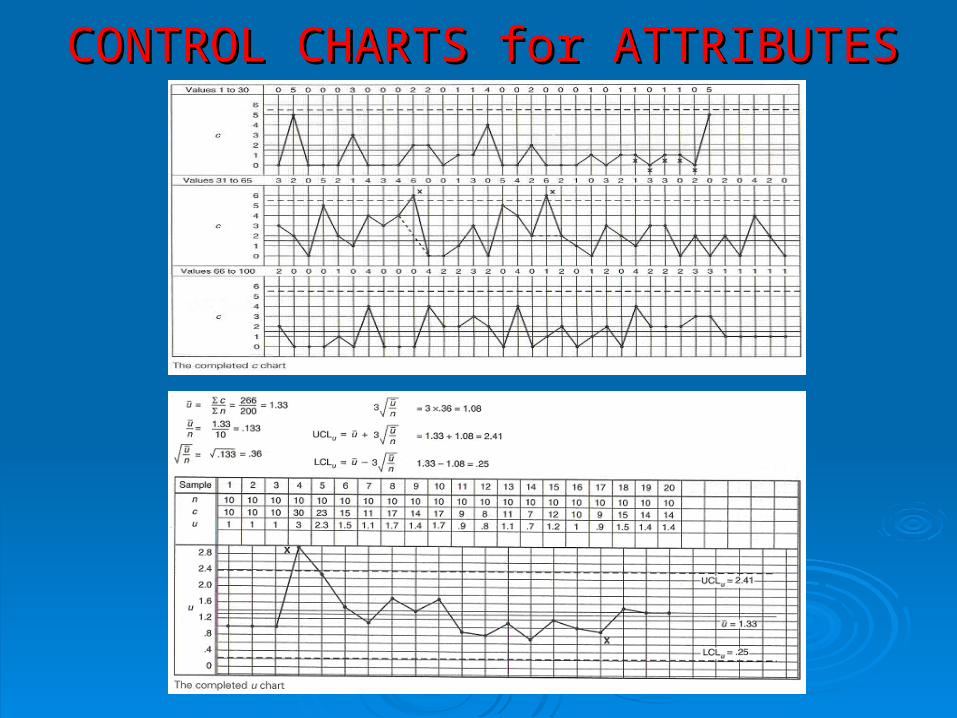
CONTROL CHARTS for ATTRIBUTESCONTROL CHARTS for ATTRIBUTES

CONTROL CHARTS for ATTRIBUTESCONTROL CHARTS for ATTRIBUTESControl Charts for Nonconforming UnitsControl Charts for Nonconforming Units• Control charts for Fraction Defective for nonconforming units based Control charts for Fraction Defective for nonconforming units based
on Binomial Distributionon Binomial Distribution- p Chart - p Chart (proportion nonconforming in sample or subgroup)(proportion nonconforming in sample or subgroup)- np Chart- np Chart (number nonconforming)(number nonconforming)
• ObjectivesObjectives- - Determine the average quality levelDetermine the average quality level – this information provides – this information provides the process capability in terms of attributesthe process capability in terms of attributes- - Bring to the attention of management any changes in the average Bring to the attention of management any changes in the average –– once the average quality is known, changes, become significantonce the average quality is known, changes, become significant- - Improve the product qualityImprove the product quality – p chart can motivate operating and – p chart can motivate operating and management personnel to initiate ideas for quality improvementmanagement personnel to initiate ideas for quality improvement- - Evaluate the quality performance of operating and management Evaluate the quality performance of operating and management personnelpersonnel – supervisors of activities and especially the CEO should – supervisors of activities and especially the CEO should be evaluated by a chart for nonconforming unitsbe evaluated by a chart for nonconforming units- - Determine acceptance criteria of a product before shipment to the Determine acceptance criteria of a product before shipment to the customercustomer – knowledge of the proportion nonconforming provides – knowledge of the proportion nonconforming provides management with information on whether or not to release an management with information on whether or not to release an order order

CONTROL CHARTS for ATTRIBUTESCONTROL CHARTS for ATTRIBUTESp Chartp Chart• Used for data consists of proportion of number of occurrences to Used for data consists of proportion of number of occurrences to
total number of occurrences total number of occurrences • Reports fraction nonconforming in a product, quality Reports fraction nonconforming in a product, quality
characteristics, or group of quality characteristicscharacteristics, or group of quality characteristics• Fraction nonconforming:Fraction nonconforming:
• Fraction nonconforming usually quite small i.e. about 0.15 or lessFraction nonconforming usually quite small i.e. about 0.15 or lessIf > 0.15 problem, need take drastic action If > 0.15 problem, need take drastic action
• Since p is small n must be big to produce meaningful chart Since p is small n must be big to produce meaningful chart • e.g. 450 books inspected from a production if 15000 books at the e.g. 450 books inspected from a production if 15000 books at the
end of inspections 5 book found defectivesend of inspections 5 book found defectives
notice n largenotice n large• The subgroup sizes of the p chart can be either:The subgroup sizes of the p chart can be either:
(a) constant size (same through out)(a) constant size (same through out)(b) variable size (changes)(b) variable size (changes)
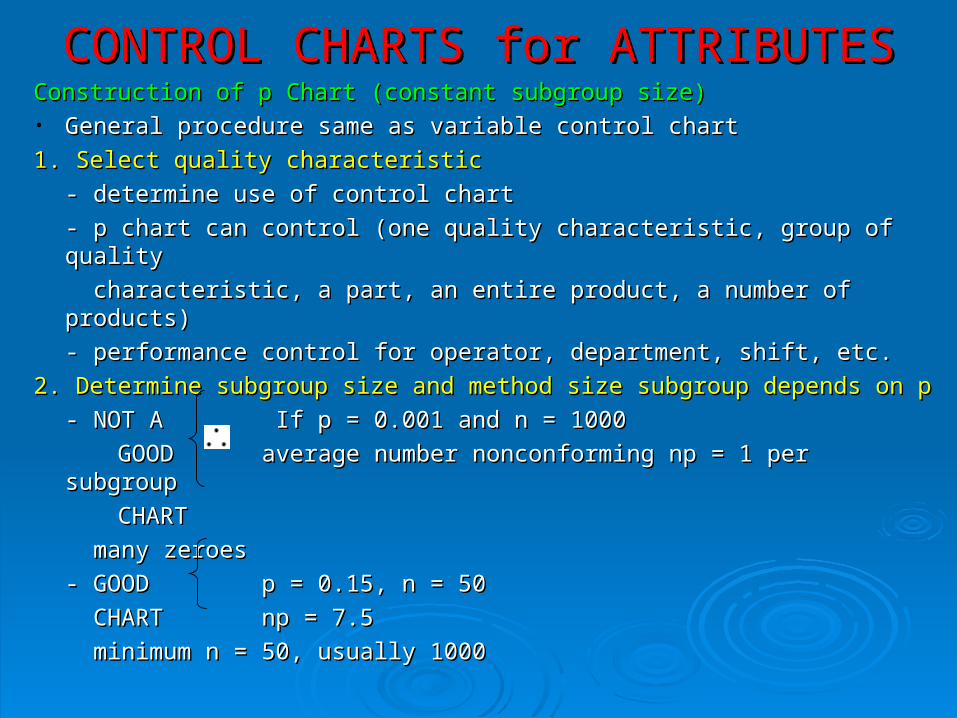
CONTROL CHARTS for ATTRIBUTESCONTROL CHARTS for ATTRIBUTESConstruction of p Chart (constant subgroup size)Construction of p Chart (constant subgroup size) • General procedure same as variable control chartGeneral procedure same as variable control chart
1. Select quality characteristic1. Select quality characteristic
- determine use of control chart- determine use of control chart
- p chart can control (one quality characteristic, group of quality- p chart can control (one quality characteristic, group of quality
characteristic, a part, an entire product, a number of products)characteristic, a part, an entire product, a number of products)
- performance control for operator, department, shift, etc.- performance control for operator, department, shift, etc.
2. Determine subgroup size and method size subgroup depends on 2. Determine subgroup size and method size subgroup depends on pp
- NOT A If p = 0.001 and n = 1000 - NOT A If p = 0.001 and n = 1000
GOODGOOD average number nonconforming np = 1 per average number nonconforming np = 1 per subgroupsubgroup
CHARTCHART
many zeroesmany zeroes
- GOOD p = 0.15, n = 50- GOOD p = 0.15, n = 50
CHART np = 7.5CHART np = 7.5
minimum n = 50, usually 1000minimum n = 50, usually 1000
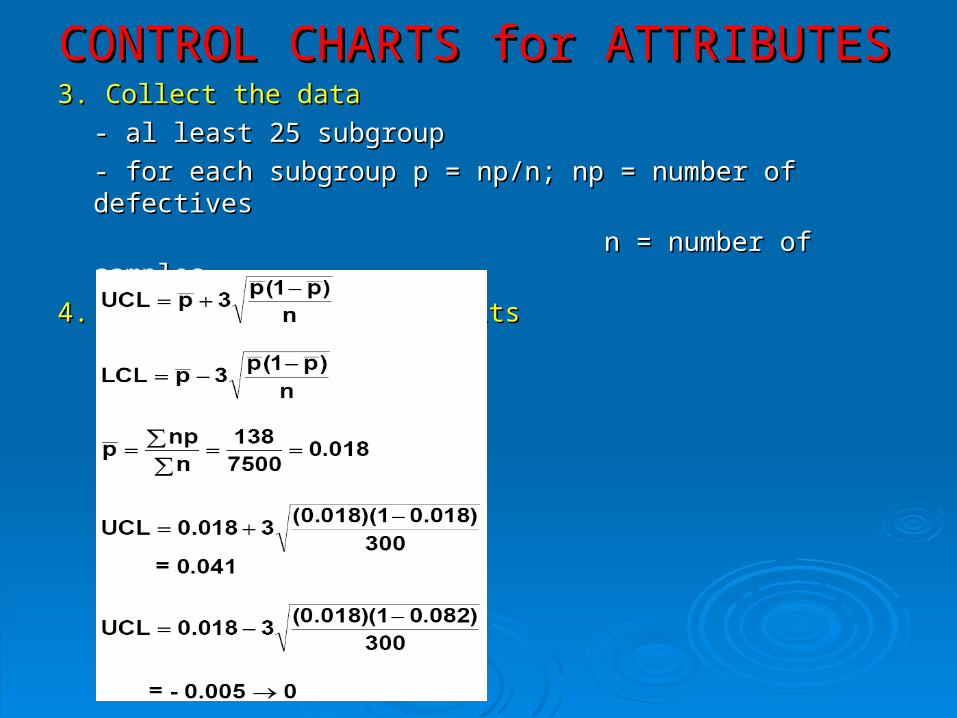
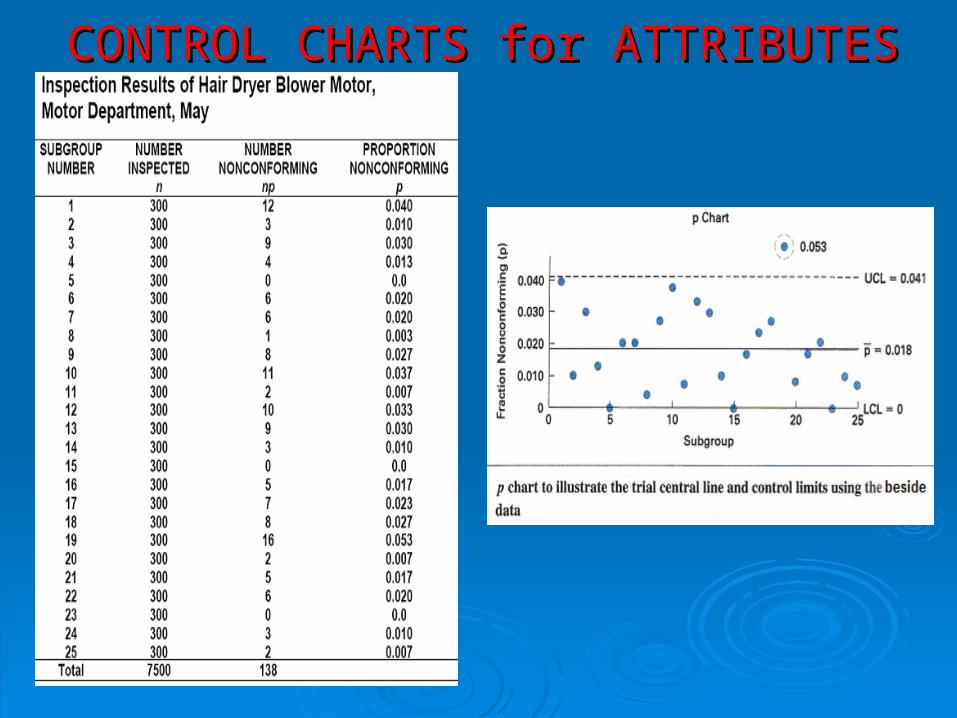
CONTROL CHARTS for ATTRIBUTESCONTROL CHARTS for ATTRIBUTES3. Collect the data3. Collect the data
- al least 25 subgroup- al least 25 subgroup
- for each subgroup p = np/n;- for each subgroup p = np/n; np = number of np = number of defectivesdefectives
n = number of n = number of samplessamples
4. Calculate the trial limits4. Calculate the trial limits
CONTROL CHARTS for ATTRIBUTESCONTROL CHARTS for ATTRIBUTES
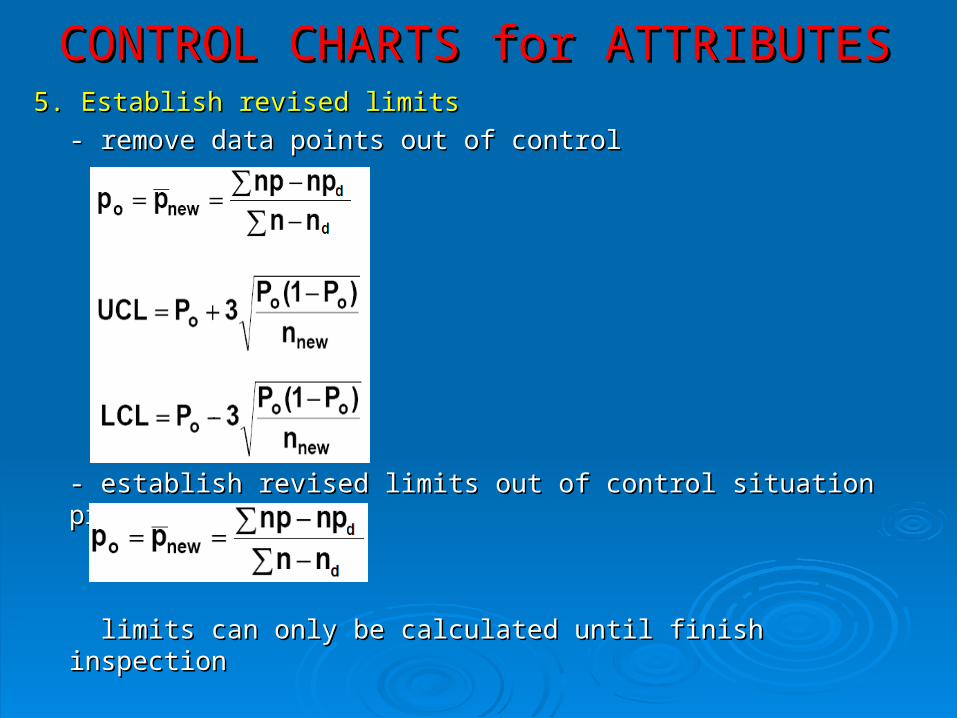
CONTROL CHARTS for ATTRIBUTESCONTROL CHARTS for ATTRIBUTES5. Establish revised limits5. Establish revised limits
- remove data points out of control- remove data points out of control
- establish revised limits out of control situation present - establish revised limits out of control situation present (discard)(discard)
limits can only be calculated until finish inspectionlimits can only be calculated until finish inspection
CONTROL CHARTS for ATTRIBUTESCONTROL CHARTS for ATTRIBUTES
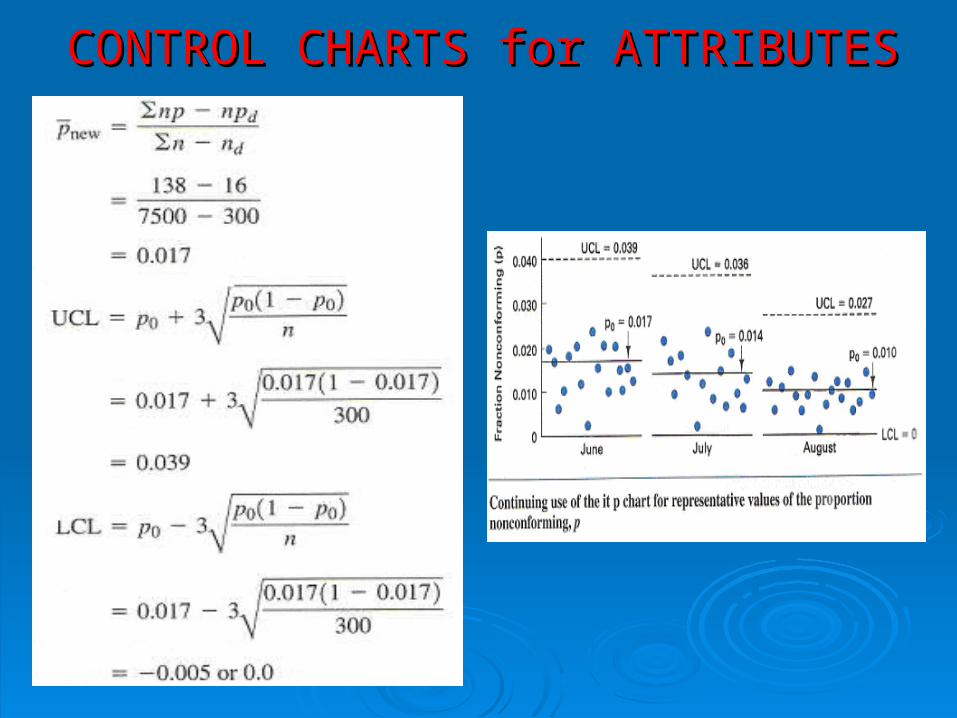
CONTROL CHARTS for ATTRIBUTESCONTROL CHARTS for ATTRIBUTES6. Achieve the objective6. Achieve the objective
- the first five step are planning- the first five step are planning
- the last step involves action and leads to the achievement- the last step involves action and leads to the achievement
of the objectiveof the objective
- some representative values of inspection results for the - some representative values of inspection results for the
month of June are shown in Figure abovemonth of June are shown in Figure above
- analysis of the June results shows that the quality - analysis of the June results shows that the quality
improved and also for entire month of July and Augustimproved and also for entire month of July and August

CONTROL CHARTS for ATTRIBUTESCONTROL CHARTS for ATTRIBUTESConstruction of p Chart (variable subgroup size)Construction of p Chart (variable subgroup size)• There are situations when you cannot obtain constant There are situations when you cannot obtain constant
subgroup sizesubgroup size
- e.g. using 100% inspection results with output quantity- e.g. using 100% inspection results with output quantity
varying day to dayvarying day to day• It is undesirable, but it exists – how to handle?It is undesirable, but it exists – how to handle?
- construction step 1 and 2 is same- construction step 1 and 2 is same
- step 3 – collect data- step 3 – collect data• Additional columns needed:Additional columns needed:
• Each day fraction defective calculated by inspector using np/nEach day fraction defective calculated by inspector using np/n

CONTROL CHARTS for ATTRIBUTESCONTROL CHARTS for ATTRIBUTES
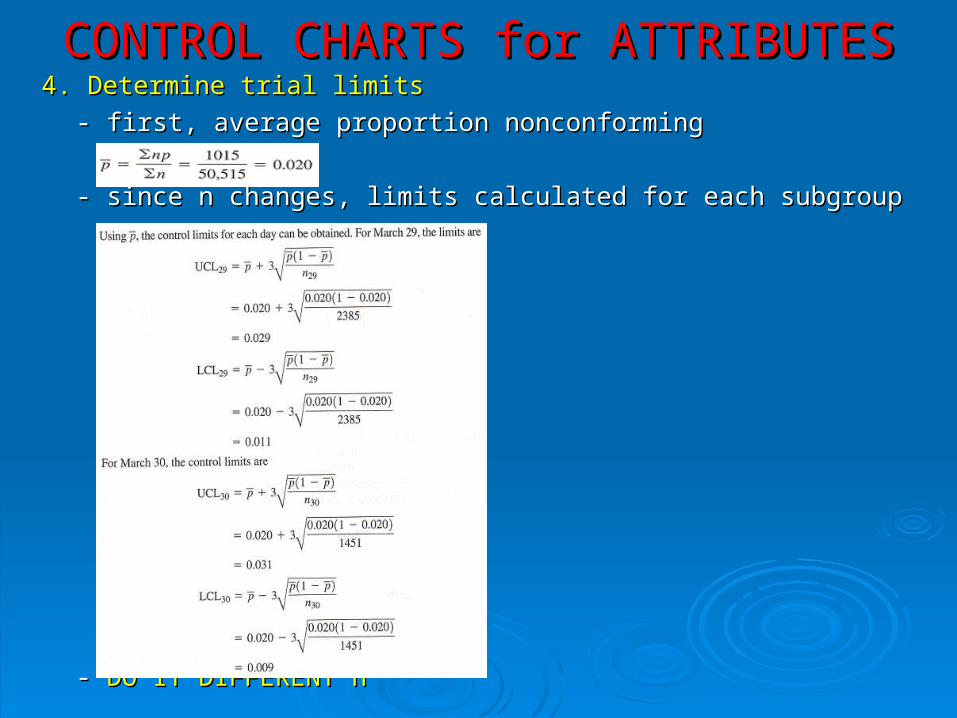
CONTROL CHARTS for ATTRIBUTESCONTROL CHARTS for ATTRIBUTES4. Determine trial limits4. Determine trial limits
- first, average proportion nonconforming- first, average proportion nonconforming
- since n changes, limits calculated for each subgroup- since n changes, limits calculated for each subgroup
- - DO IT DIFFERENT nDO IT DIFFERENT n
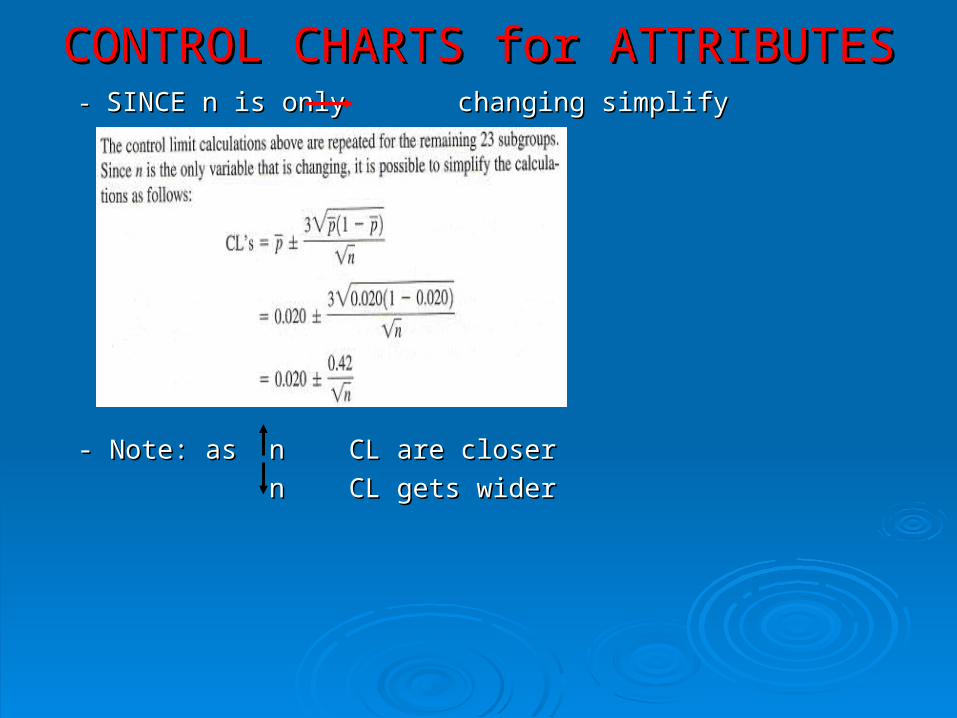
CONTROL CHARTS for ATTRIBUTESCONTROL CHARTS for ATTRIBUTES- - SINCE n is only changing simplify SINCE n is only changing simplify
- Note: as - Note: as n CL are closern CL are closer
n CL gets widern CL gets wider
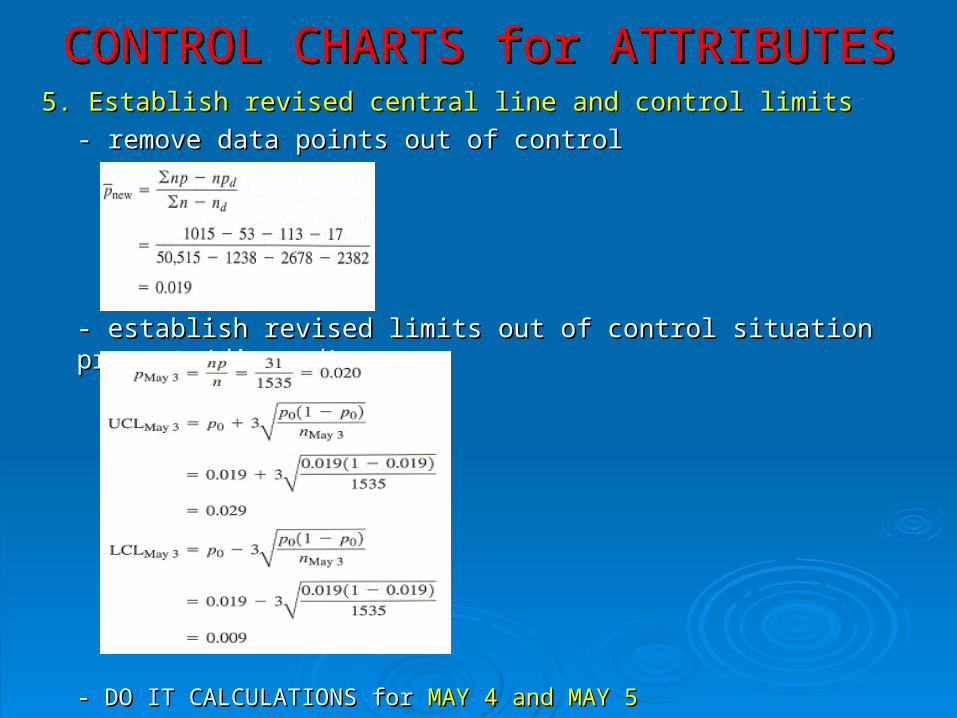
CONTROL CHARTS for ATTRIBUTESCONTROL CHARTS for ATTRIBUTES5. Establish revised central line and control limits5. Establish revised central line and control limits
- remove data points out of control- remove data points out of control
- establish revised limits out of control situation present - establish revised limits out of control situation present (discard)(discard)
- DO IT CALCULATIONS for - DO IT CALCULATIONS for MAY 4 and MAY 5MAY 4 and MAY 5

CONTROL CHARTS for ATTRIBUTESCONTROL CHARTS for ATTRIBUTESTwo techniques to minimize effect of variable subgroup sizeTwo techniques to minimize effect of variable subgroup size1. Using average subgroup size1. Using average subgroup size
- calculate individual limits when subgroup size not within - calculate individual limits when subgroup size not within
± 15% of n± 15% of navav
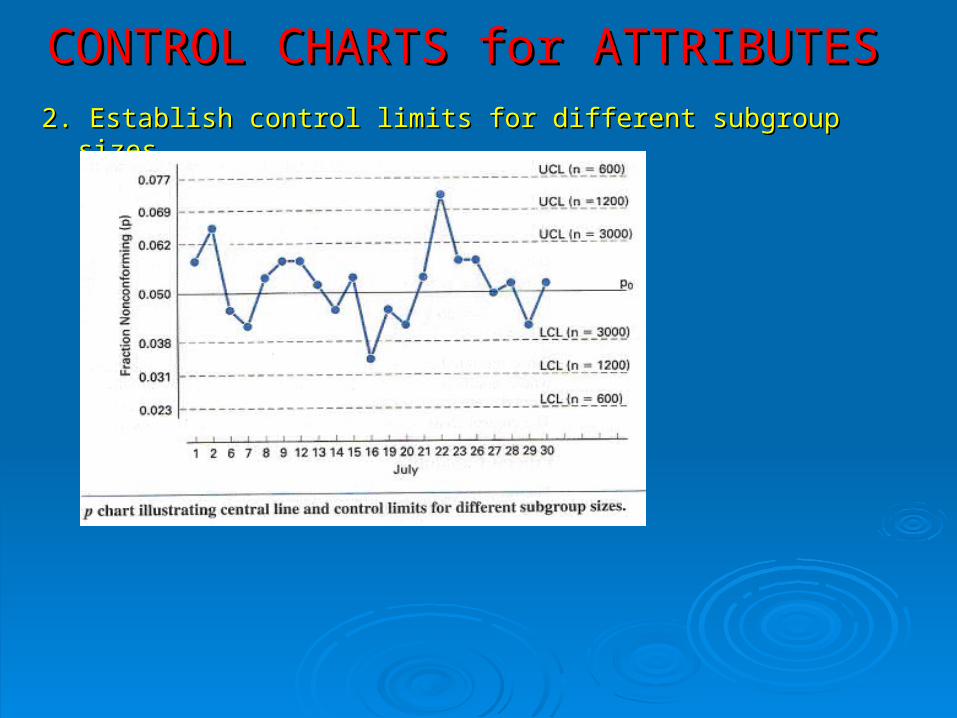
CONTROL CHARTS for ATTRIBUTESCONTROL CHARTS for ATTRIBUTES2. Establish control limits for different subgroup sizes2. Establish control limits for different subgroup sizes
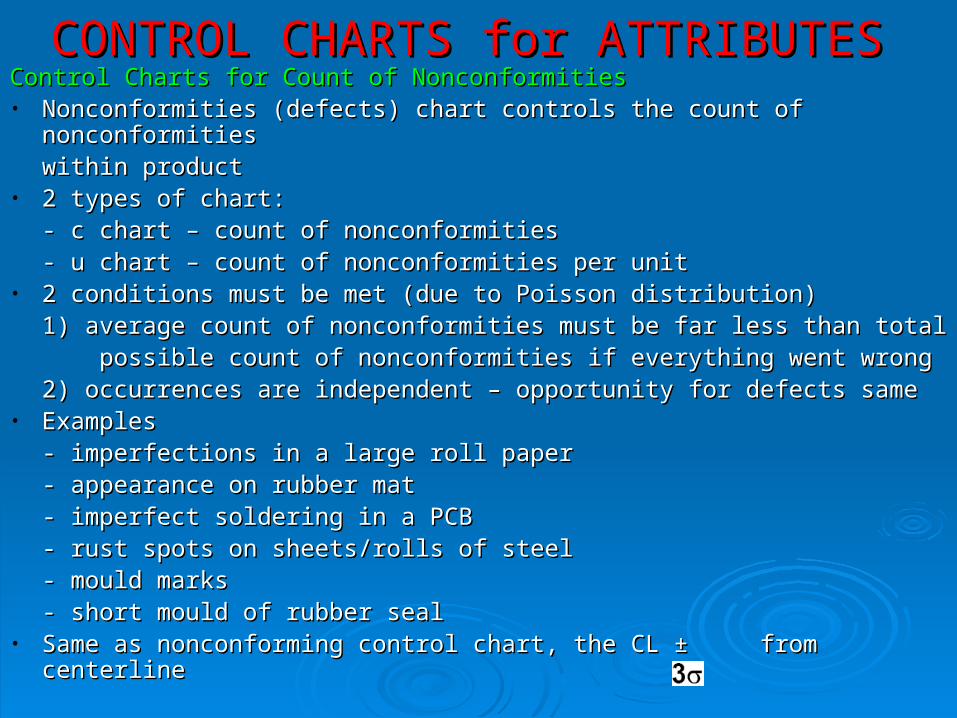
CONTROL CHARTS for ATTRIBUTESCONTROL CHARTS for ATTRIBUTESControl Charts for Count of NonconformitiesControl Charts for Count of Nonconformities• Nonconformities (defects) chart controls the count of Nonconformities (defects) chart controls the count of
nonconformitiesnonconformitieswithin product within product
• 2 types of chart:2 types of chart:- c chart – count of nonconformities- c chart – count of nonconformities- u chart – count of nonconformities per unit- u chart – count of nonconformities per unit
• 2 conditions must be met (due to Poisson distribution)2 conditions must be met (due to Poisson distribution)1) average count of nonconformities must be far less than total 1) average count of nonconformities must be far less than total possible count of nonconformities if everything went wrongpossible count of nonconformities if everything went wrong2) occurrences are independent – opportunity for defects same2) occurrences are independent – opportunity for defects same
• ExamplesExamples- imperfections in a large roll paper- imperfections in a large roll paper- appearance on rubber mat- appearance on rubber mat- imperfect soldering in a PCB- imperfect soldering in a PCB- rust spots on sheets/rolls of steel - rust spots on sheets/rolls of steel - mould marks- mould marks- short mould of rubber seal- short mould of rubber seal
• Same as nonconforming control chart, the CL ± from centerlineSame as nonconforming control chart, the CL ± from centerline
CONTROL CHARTS for ATTRIBUTESCONTROL CHARTS for ATTRIBUTES• ObjectiveObjective
- Determine the average quality level as a benchmark or starting- Determine the average quality level as a benchmark or starting
point – gives the initial process capabilitypoint – gives the initial process capability
- Bring to the attention of management any changes in the average- Bring to the attention of management any changes in the average
- Improve the product quality – charts can motivate operating and- Improve the product quality – charts can motivate operating and
management personnel to initiate ideas for quality improvementmanagement personnel to initiate ideas for quality improvement
- Evaluate the quality performance of operating and management - Evaluate the quality performance of operating and management
personnel.personnel.
- Provide information concerning the acceptability of the product - Provide information concerning the acceptability of the product
prior to shipmentprior to shipment• Because of the limitations of the charts for count of nonconformities, Because of the limitations of the charts for count of nonconformities,
many organizations do not have occasion for their use many organizations do not have occasion for their use
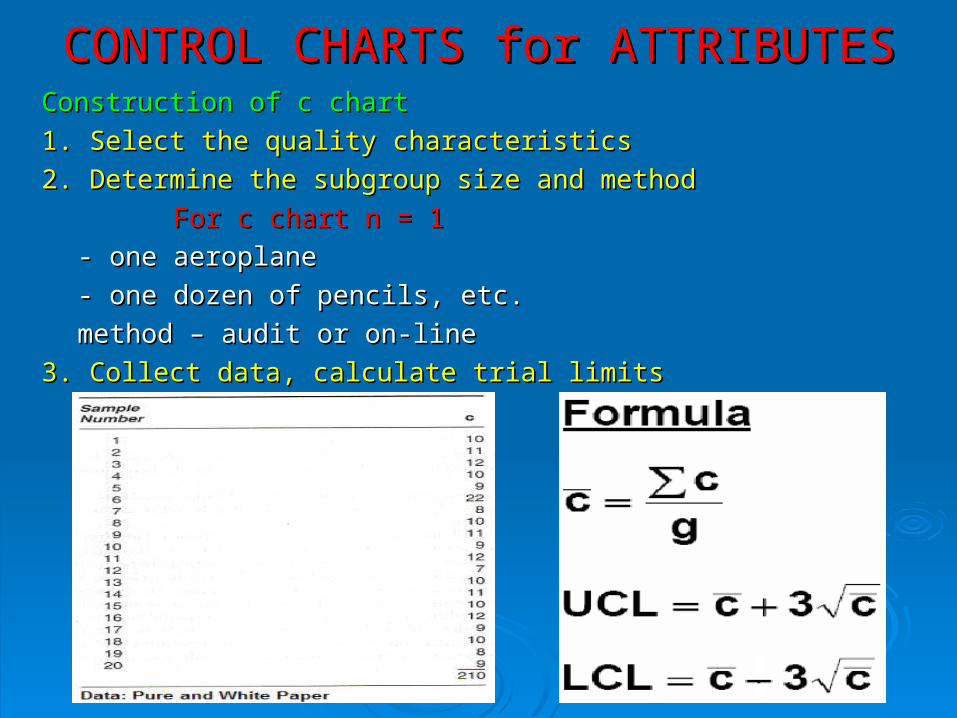
CONTROL CHARTS for ATTRIBUTESCONTROL CHARTS for ATTRIBUTESConstruction of c chartConstruction of c chart
1. Select the quality characteristics1. Select the quality characteristics
2. Determine the subgroup size and method2. Determine the subgroup size and method
For c chartFor c chart n = 1n = 1
- one aeroplane- one aeroplane
- one dozen of pencils, etc.- one dozen of pencils, etc.
method – audit or on-linemethod – audit or on-line
3. Collect data, calculate trial limits3. Collect data, calculate trial limits
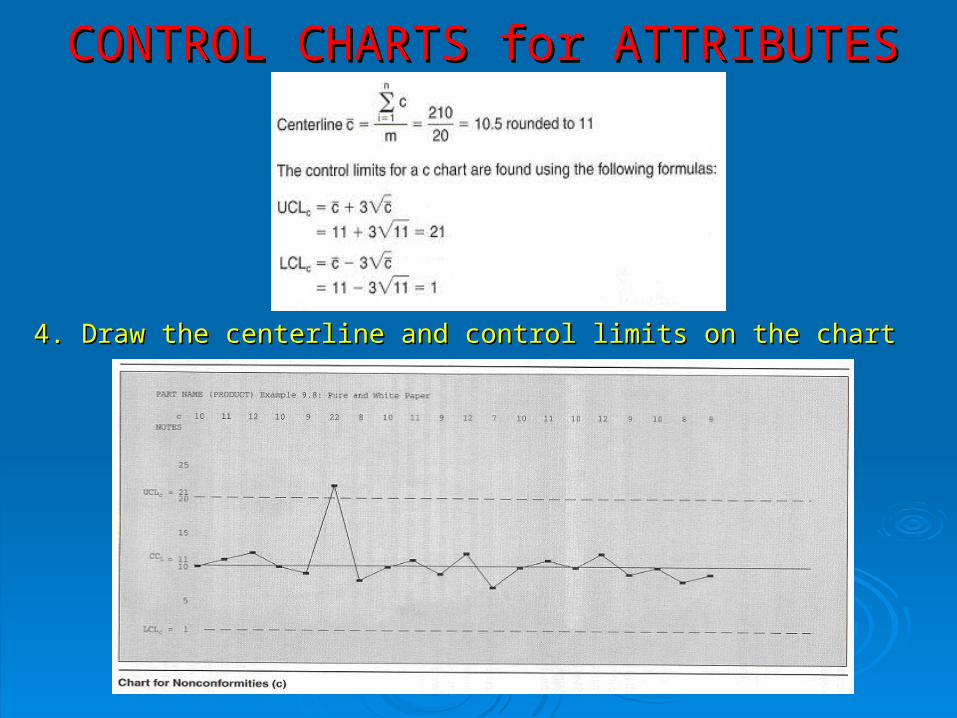
CONTROL CHARTS for ATTRIBUTESCONTROL CHARTS for ATTRIBUTES
4. Draw the centerline and control limits on the chart4. Draw the centerline and control limits on the chart
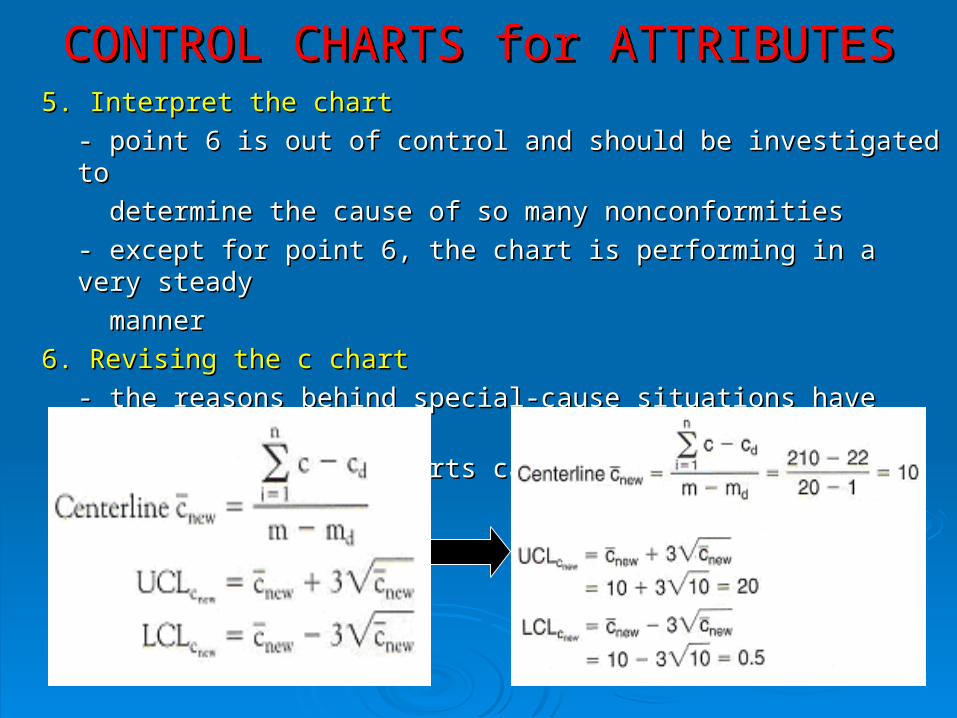
CONTROL CHARTS for ATTRIBUTESCONTROL CHARTS for ATTRIBUTES5. Interpret the chart5. Interpret the chart
- point 6 is out of control and should be investigated to - point 6 is out of control and should be investigated to
determine the cause of so many nonconformitiesdetermine the cause of so many nonconformities
- except for point 6, the chart is performing in a very steady- except for point 6, the chart is performing in a very steady
mannermanner
6. Revising the c chart6. Revising the c chart
- the reasons behind special-cause situations have been - the reasons behind special-cause situations have been identifiedidentified
and corrected, c charts can be revised using this formula:and corrected, c charts can be revised using this formula:

CONTROL CHARTS for ATTRIBUTESCONTROL CHARTS for ATTRIBUTESConstruction of u chart (count of defects per unit)Construction of u chart (count of defects per unit)• For unit > 1For unit > 1• For varying sample sizeFor varying sample size• Also if subgroup size constantAlso if subgroup size constant• u chart is developed u chart is developed same as c chartsame as c chart, collect 25 subgroup , collect 25 subgroup
data, calculate trial limits and revise limitsdata, calculate trial limits and revise limits
Data: Hose Connection
Formula

CONTROL CHARTS for ATTRIBUTESCONTROL CHARTS for ATTRIBUTES
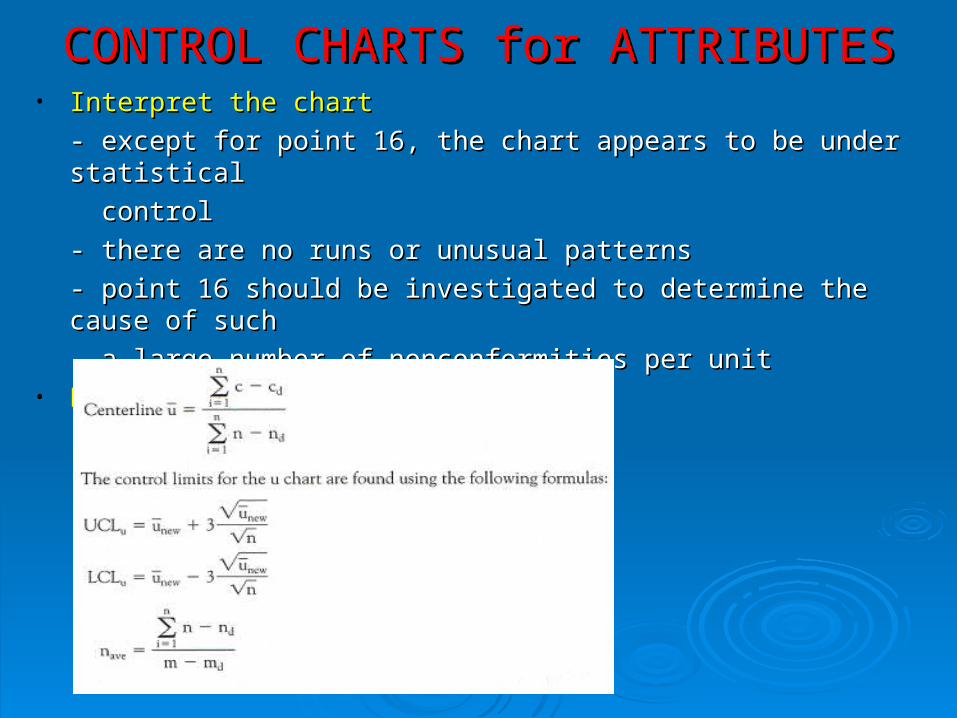
CONTROL CHARTS for ATTRIBUTESCONTROL CHARTS for ATTRIBUTES• Interpret the chartInterpret the chart
- except for point 16, the chart appears to be under statistical - except for point 16, the chart appears to be under statistical
controlcontrol
- there are no runs or unusual patterns- there are no runs or unusual patterns
- point 16 should be investigated to determine the cause of - point 16 should be investigated to determine the cause of suchsuch
a large number of nonconformities per unita large number of nonconformities per unit• Revising the u chartRevising the u chart
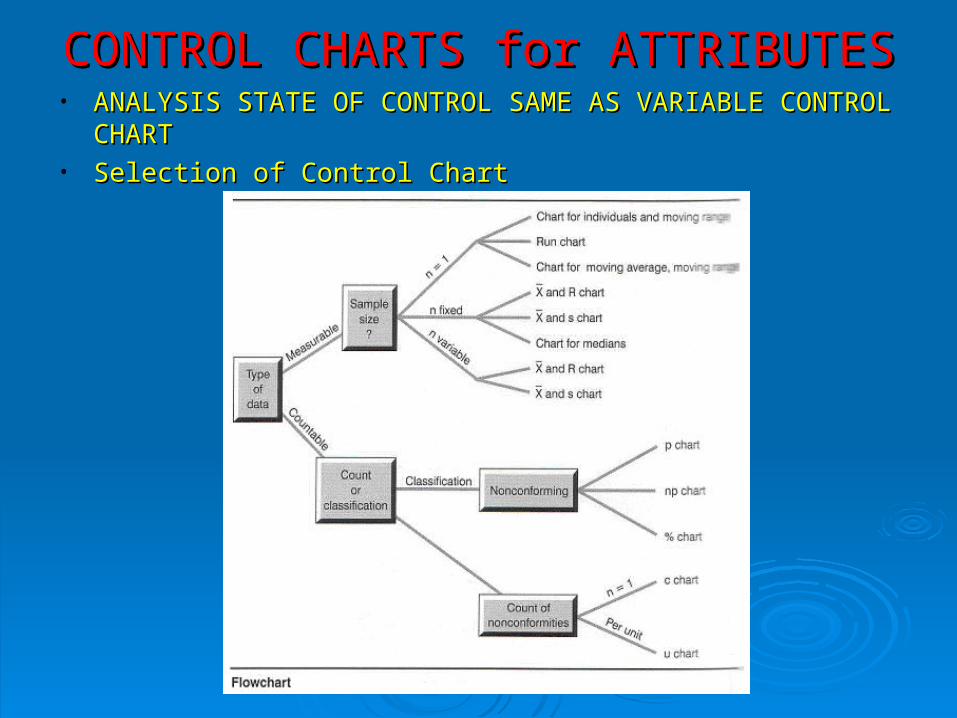
CONTROL CHARTS for ATTRIBUTESCONTROL CHARTS for ATTRIBUTES• ANALYSIS STATE OF CONTROL SAME AS VARIABLE ANALYSIS STATE OF CONTROL SAME AS VARIABLE
CONTROL CHARTCONTROL CHART• Selection of Control ChartSelection of Control Chart