statistical profile of kings countynsfa-fane.ca/wp-content/uploads/2011/06/kings.pdf ·...
TRANSCRIPT
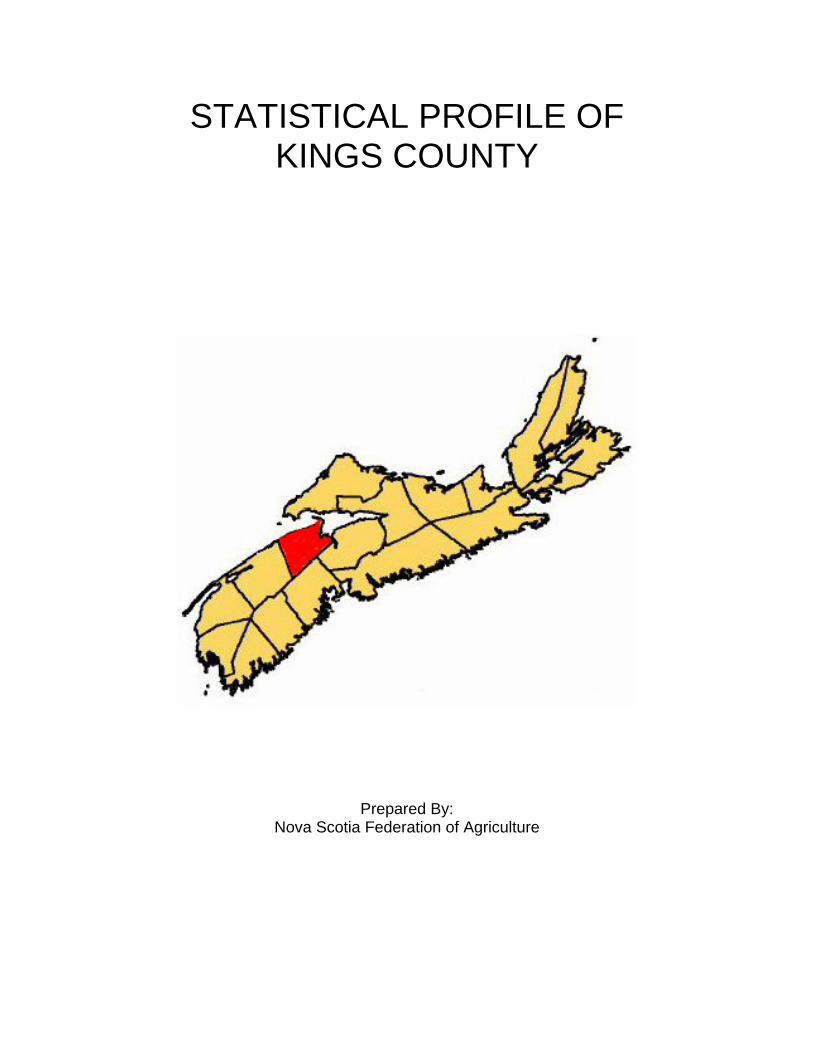
STATISTICAL PROFILE OF KINGS COUNTY
Prepared By: Nova Scotia Federation of Agriculture
1.0 Introduction Agriculture in the Local Economy Agriculture in King’s County is characterized by a diversity of farm production activities including dairy, beef, poultry, beef and horticultural farms. The direct economic impact of these activities is significant. In 2000, agriculture in King’s County generated over $160 million I farm receipts or about 34.1 of all receipts in Nova Scotia. Operating expenses associated with farms in King’s County during the same year amounted to approximately $134 million. Farm businesses have a strong local orientation they both buy and sell in their local community. Indeed, the farm sector creates significant economic activity in the town of King’s County’s three urban centers, which acts as a service centre for the approximately 640 farms located in the county. Agri-related businesses located in the towns of Wolfville, Berwick and Kentville include processors, retailers, wholesalers and contractors. The total direct and indirect jobs associated with agriculture and their linkage to other industrial sectors in King’s County is conservatively estimated at 2850, or approximately 10% of all jobs in the local economy. Given the availability of prime agricultural soils, the current level of farm production and the established agri-related business infrastructure that exists in Wolfville, Berwick, and Kentville, it is evident that agriculture will continue to be significant economic activity and land uses in the area surround King’s County for many years to come.
- 1 -

1.1 Population and Population Change Between 1996 and 2001 the total population of Kings County declined by 0.6%, dropping from 59,065 to 58,709 (Table A). The towns of Berwick (4.0%) and Kentville (1.1%) were the only regions in the county to experience a growth in population between 1996 and 2001. The town of Wolfville had the greatest decline in population at 4.6% in the same years. Table A: Population of Kings County and Census Subdivisions, 1996-2001 1996 2001 % change Kings County 59,913 58,866 -0.6% Subdivision A 22,700 22,430 -1.2% Subdivision B 11,490 11,619 1.1% Subdivision C 8,049 7,943 -1.3% Subdivision D 5,247 5,167 -1.5% Town of Berwick (urban) 2,195 2,282 4.0% Town of Kentville (urban) 5,551 5,610 1.1% Town of Wolfville (urban) 3,833 3,658 -4.6%
Source: Statistics Canada 2001 The vast majority of the population of Kings County is concentrated in rural areas1. During the censuses of 1996 and 2001 over 80% of the population lived in rural areas (Table B). Although both rural and urban population decreased between 1996 and 2001, the proportion they shared in the county did not change. Table B: Kings County, Rural and Urban Populations, 1996-2001
1996 2001
Population % Population %
Rural 47,486 80.4% 47,159 80.3%
Urban 11,579 19.6% 11,550 19.7%
Total 59,065 58,709 Source: Statistics Canada 2001 1.2 Economic Profile In 2001 Kings County had a total experienced labour force2 of 9,320, which represents 6.5% of the total experienced labour force of Nova Scotia (Table C). The percentage of people that work in agriculture in King’s county, 7.04% is significantly higher than the provincial average
1 As defined by Statistics Canada, rural areas are sparsely populated lands lying outside urban areas. Urban areas have minimum population concentrations of 1,000 and a population density of at least 400 per sq. km., based on the previous census population counts. All territory outside urban areas is considered rural. 2 Refers to persons 15 years and over, excluding institutional residents, who were employed or unemployed during the week (Sunday to Saturday) prior to Census Day, and who had last worked for pay or in self-employment in either 2000 or 2001.
- 2 -
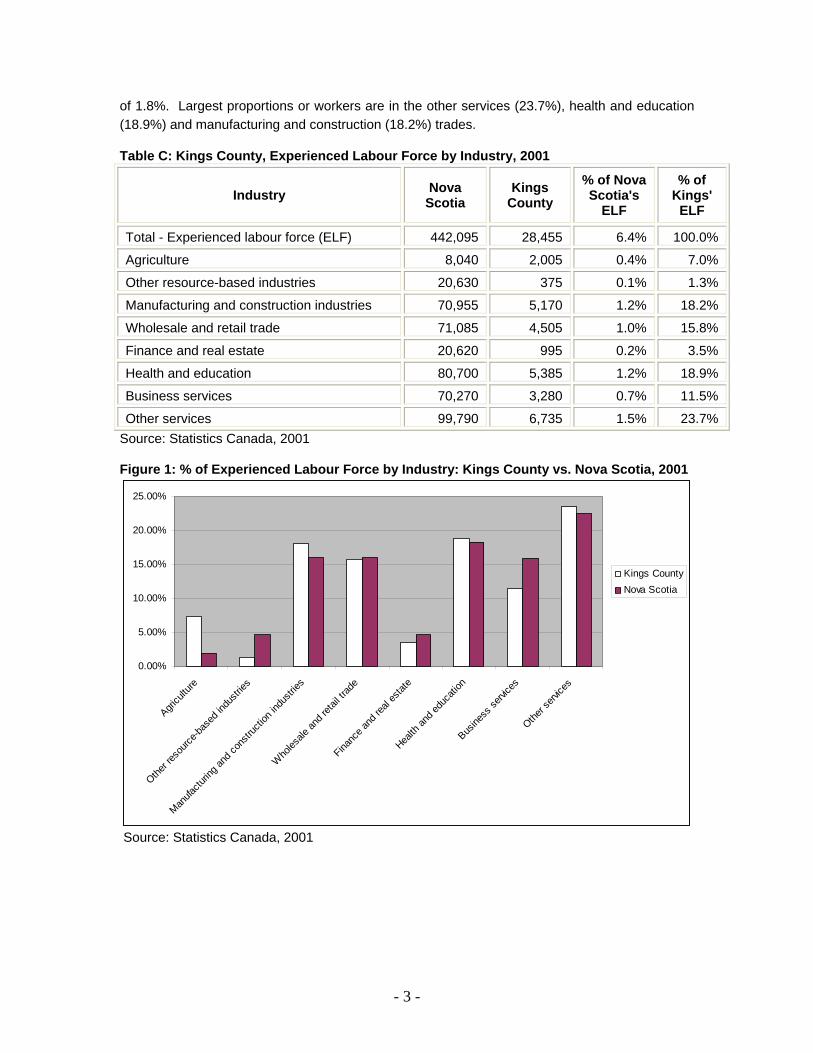
of 1.8%. Largest proportions or workers are in the other services (23.7%), health and education (18.9%) and manufacturing and construction (18.2%) trades. Table C: Kings County, Experienced Labour Force by Industry, 2001
Industry Nova Scotia
Kings County
% of Nova Scotia's
ELF
% of Kings'
ELF
Total - Experienced labour force (ELF) 442,095 28,455 6.4% 100.0%
Agriculture 8,040 2,005 0.4% 7.0%
Other resource-based industries 20,630 375 0.1% 1.3%
Manufacturing and construction industries 70,955 5,170 1.2% 18.2%
Wholesale and retail trade 71,085 4,505 1.0% 15.8%
Finance and real estate 20,620 995 0.2% 3.5%
Health and education 80,700 5,385 1.2% 18.9%
Business services 70,270 3,280 0.7% 11.5%
Other services 99,790 6,735 1.5% 23.7% Source: Statistics Canada, 2001 Figure 1: % of Experienced Labour Force by Industry: Kings County vs. Nova Scotia, 2001
0.00%
5.00%
10.00%
15.00%
20.00%
25.00%
Agricu
lture
Other re
sourc
e-bas
ed in
dustr
ies
Manufa
cturin
g and
cons
tructi
on in
dustr
ies
Who
lesale
and r
etail t
rade
Financ
e and
real
estat
e
Health
and e
duca
tion
Busine
ss se
rvices
Other s
ervice
s
Kings CountyNova Scotia
Source: Statistics Canada, 2001
- 3 -

1.3 Agricultural Profile of Kings County Number of Farms In 2001, the total number of reported farms in Kings County was 580 (17% of total farms in province), which was down from the 591 farms reported in 1996.3 Fruit (21.5%), Beef (18.6%), Miscellaneous specialty4 (14.1%), and Poultry and Egg Farms (11.4%) are the leading farm types in Kings County. From 1996-2001, all four types of these Farms added gains (Table D).5
Table D: Kings County, Total number of Farms by Farm Type, 1996 - 20016
1996 2001 Farm type Farms % of total Farms % of total
% change
Dairy 46 7.8% 34 5.9% -26.1% Cattle (beef) 104 17.6% 108 18.6% 3.85% Hog 44 7.4% 35 6.0% -20.4% Poultry and egg 64 10.8% 66 11.4% 3.12% Wheat 0 0.0% 0 0.0% 0.00% Grain and oilseed (except wheat) 2 0.3% 8 1.4% 400% Field crop (except grain and oilseed) 32 5.4% 43 7.4% 34.4% Fruit 117 19.8% 125 21.5% 6.84% Miscellaneous specialty 82 13.9% 84 14.5% 2.44% Livestock combination 9 1.5% 11 1.9% 22.2% Vegetable 53 9.0% 40 6.9% -24.5% Other combination 38 6.4% 26 4.5% -31.6% Total farms 591 100% 580 100% -1.86% Source: Statistics Canada, 1996, 2001 Kings County has a higher percentage of farms in seven of twelve sectors than the provincial average; these include hog, poultry and egg, grain and oilseed, field crops, fruit, vegetable and other combination. In King’s County 21.5% of all farms are fruit farms, while the provincial average is 18%. Poultry and egg have the largest advantage on the rest of the
3 In 1996 and 2001, the Statistics Canada, Census of Agriculture defined a census farm as an agricultural operation that produces at least one of the following products intended for sale: crops (hay, field crops, tree fruits or nuts, berries or grapes, vegetables, seed); livestock (cattle, pigs, sheep, horses, game animals, other livestock); poultry (hens, chickens, turkeys, chicks, game birds, other poultry); animal products (milk or cream, eggs, wool, furs, meat); or other agricultural products (Christmas trees, greenhouse or nursery products, mushrooms, sod, honey, maple syrup products). 4 Miscellaneous specialty includes greenhouse flower and plant production, bulbs, shrubs, trees, sod, ornamentals, mushroom houses, honey production, maple syrup production, deer, mink, etc. 5 Farm typing is a procedure that classifies each census farm according to the predominant type of production. This is done by estimating the potential receipts from the inventories of crops and livestock reported on the questionnaire and determining the product or group of products that make up the majority of the estimated receipts. For example, a census farm with total potential receipts of 60% from hogs, 20% from beef cattle and 20% from wheat, would be classified as a hog farm. This farm type classification, referred to as "historical," is based on the Standard Industrial Classifications (SIC). 6 Total number of farms reporting total gross farm receipts greater than $2,499. In 1996 the total number of farms reporting total gross farm receipts less than $2,499 was 116; in 2001 the number was 64.
- 4 -

province. In King’s County 11.45 of all farms are poultry and egg while the rest of the province has an average of only about 3.8%. Figure 2: % of Total Farms by Farm Type: Kings County vs. Nova Scotia, 2001
0.00%
5.00%
10.00%
15.00%
20.00%
25.00%
30.00%
Dairy
Cattle
(Bee
f)Hog
Poultry
and e
gg
Whe
at
Grain a
nd oi
lseed
(exc
ept w
heat)
Field c
rop (e
xcep
t grai
n and
oilse
ed)
Fruit
Miscell
aneo
us sp
ecial
ity
Lives
tock c
ombin
ation
Vegeta
ble
Other c
ombin
ation
Kings CountyNova Scotia
Source: Statistics Canada, 2001 In 2001, 49.5% of all farms in Kings County were located in Subdivision A, the western part of the county. The eastern parts of the county have about 44.9% of all farms and the central part of the county has 5.5% of the farms. Table E: Total Number of Farms by Farm Type by Census Division, 20017
Farm Type Nova Scotia
Kings County
Kings Subd.
A
Kings Subd.
B
Kings Subd.
C
Kings Subd.
D Total Farms 3,318 580 287 172 32 89 Dairy 375 34 14 5 1 14 Cattle (Beef) 828 108 59 21 11 17 Hog 65 35 19 14 1 1 Poultry and egg 111 66 9 37 3 17 Wheat 1 0 0 0 0 0 Grain and oilseed (except wheat) 15 8 3 4 1 0 Field crop (except grain and oilseed) 242 43 15 17 3 8
7 Total number of farms reporting total gross farm receipts greater than $2,499. In 2001 the total number of farms reporting total gross farm receipts less than $2,499 was 64.
- 5 -

Fruit 643 125 68 33 5 19 Miscellaneous specialty 757 84 57 15 3 9 Livestock combination 73 11 9 1 0 1 Vegetable 97 40 22 14 3 1 Other combination 101 26 12 11 1 2
Source: Statistics Canada, 2001 Farm Revenue Kings reported close to $160 million in farm receipts in 2000, which increased from just over $132 million in 1995 (Table F). In 2000, the farm receipts in Kings County made up 34.2% of the total farm receipts in the province. The county average of receipts per farm increased from $187,304 to $243,919 between 1995 and 2000. Table F: Total Farm Receipts for Kings County and Nova Scotia, 1995-2000 1995 2000 % change Nova Scotia $384,333,174 $460,424,979 19.8%
Kings County $132,449,162 $157,083,885 18.6%
% of Nova Scotia receipts 34.4% 34.1% Source: Statistics Canada, 1996, 2001 Subdivision B reported 45% of the total farm receipts in Kings County, and had the highest receipt per farm average at over $380,000. In 2000, subdivisions C had an average of under $100,000 which was below the provincial average of $117,365 (Table G). Table G: Total Farm Receipts by Census Subdivision for Kings County, 2000
Total Farms Total Farm Receipts
Percentage of County
Total Receipts per Farm
Kings County 644 $157,083,885 100% $243,919 Kings, Subd. A 323 $53,409,589 34% $165,355 Kings, Subd. B 187 $71,255,714 45% $381,047 Kings, Subd. C 38 $3,655,560 2% $96,199 Kings, Subd. D 96 $28,763,022 18% $299,615
Source: Statistics Canada, 2001 In 2000, Close to 45% of the total farms in Kings County reported receipts of $50,000 or greater. Sixty-four farms reported receipts of less than $2,500 which constitutes 9.94% of the total farms in the county and makes this category the fifth most prevalent. 26% of farms reported receipts of less than $10,000 in 2000 (Table H). The percentage of farms in the $500,000 and over category increased sharply after 1995.
- 6 -

Table H: Total Number of Farms in Kings County by Farm Receipts, 1996-2001 1996 2001 Farm Receipts Category
# of farms % of total # of farms % of total
Under $2,500 116 16.4% 64 9.9%
$2,500 to $4,999 49 6.9% 44 6.8%
$5,000 to $9,999 59 8.3% 61 9.5%
$10,000 to $24,999 121 17.1% 120 18.6%
$25,000 to $49,999 72 10.2% 68 10.6%
$50,000 to $99,999 55 7.8% 43 6.7%
$100,000 to $249,999 96 13.6% 86 13.3%
$250,000 to $499,999 61 8.6% 59 9.2%
$500,000 and over 78 11.0% 99 15.4%
Total farms 707 100.0% 644 100.0% Source: Statistics Canada, 2001 Figure 3: % of Total Farms by Farm Receipts Category: Kings County vs. Nova Scotia, 2001
0.00%
5.00%
10.00%
15.00%
20.00%
25.00%
Under$2,500
$2,500 to$4,999
$5,000 to$9,999
$10,000 to$24,999
$25,000 to$49,999
$50,000 to$99,999
$100,000to
$249,999
$250,000to
$499,999
$500,000and over
Kings County
Nova Scotia
Source: Statistics Canada, 2001
- 7 -

Table I: Total Number of Farms by Total Farm Receipts Category by Census Subdivision, 2001
Farm Receipts Category Nova Scotia
Kings County
Kings Subd.
A
Kings Subd.
B
Kings Subd.
C
Kings Subd.
D Total farms 3,923 644 323 187 38 96 Under $2,500 605 64 36 15 6 7 $2,500 to $4,999 391 44 21 11 4 8 $5,000 to $9,999 555 61 35 13 8 5 $10,000 to $24,999 786 120 67 27 9 17 $25,000 to $49,999 452 68 36 18 3 11 $50,000 to $99,999 287 43 25 8 1 9 $100,000 to $249,999 381 86 49 29 2 6 $250,000 to $499,999 242 59 23 21 2 13 $500,000 and over 224 99 31 45 3 20
Source: Statistics Canada, 2001 Farm Expenses In 2001, the total farm business operating expenses for Kings County were $133,707,503. The average per farm business operating expenses for farms in Kings County was $207,620 which is much higher than the provincial average of $99,081. Wages and salary, livestock & poultry purchases, and total feed and supplement purchases were among the greatest expenses for farms in Kings County (Table J). in 2001, about 4.6% of all expenses to farmers were interest expenses for equipment and loans; this was lower than the provincial average of 6.2%. Table J: Farm Business Operating Expenses for Kings County and Nova Scotia, 2001
Nova Scotia Kings County
Farms reporting Amount $
Farms reporting Amount $
Total farm business operating Expenses 3,923 388,693,565 644 133,707,503 Fertilizer and lime purchases 2,820 12,909,414 475 3,872,023
Purchases of herbicides, insecticides, fungicides, etc. 1,654 8,014,536 361 4,047,526
Seed and plant purchases (excluding materials purchased for resale) 1,729 10,315,606 350 3,613,185 Total feed and supplement purchases 2,226 84,288,007 378 36,070,749 Feed purchases from other farmers 553 4,476,502 89 659,767 Livestock & Poultry Purchases 1,397 35,804,556 274 16,939,876 Veterinary services, drugs, etc. 1,959 6,547,385 334 1,396,339 Custom work and contract work 1,762 12,309,676 320 2,678,353 Wages and Salary 1,944 74,014,740 395 25,635,617
- 8 -
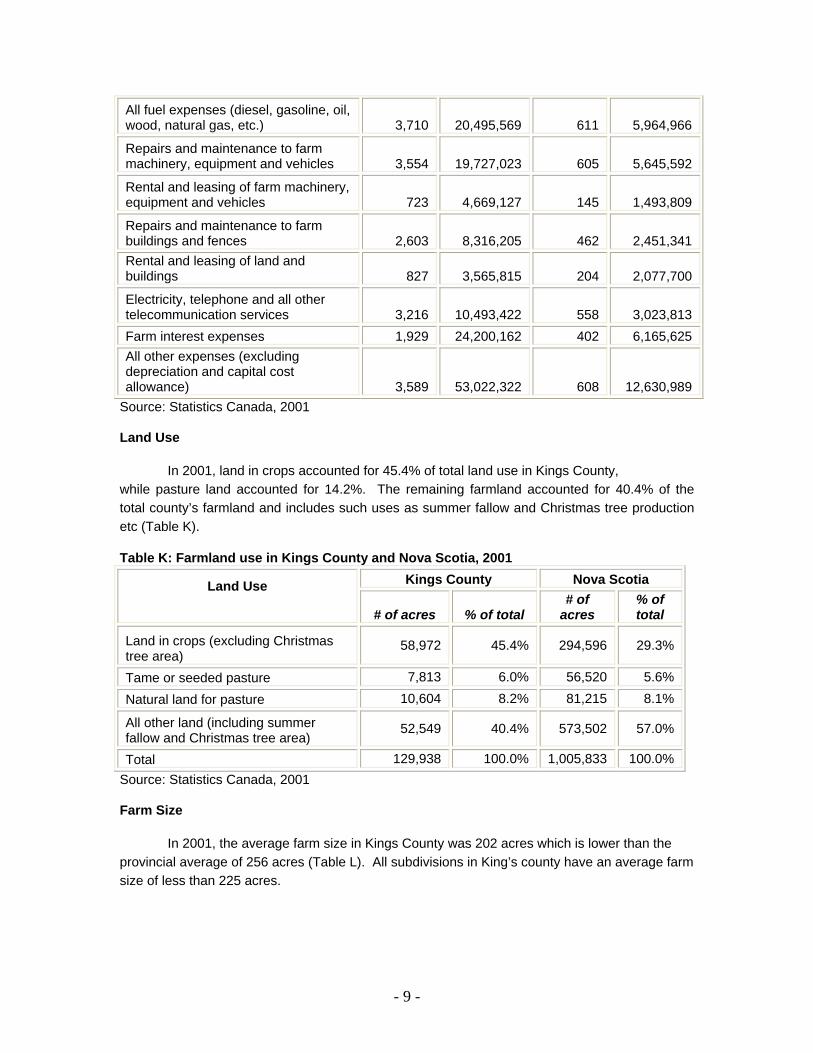
All fuel expenses (diesel, gasoline, oil, wood, natural gas, etc.) 3,710 20,495,569 611 5,964,966
Repairs and maintenance to farm machinery, equipment and vehicles 3,554 19,727,023 605 5,645,592
Rental and leasing of farm machinery, equipment and vehicles 723 4,669,127 145 1,493,809
Repairs and maintenance to farm buildings and fences 2,603 8,316,205 462 2,451,341 Rental and leasing of land and buildings 827 3,565,815 204 2,077,700
Electricity, telephone and all other telecommunication services 3,216 10,493,422 558 3,023,813 Farm interest expenses 1,929 24,200,162 402 6,165,625 All other expenses (excluding depreciation and capital cost allowance) 3,589 53,022,322 608 12,630,989
Source: Statistics Canada, 2001 Land Use In 2001, land in crops accounted for 45.4% of total land use in Kings County, while pasture land accounted for 14.2%. The remaining farmland accounted for 40.4% of the total county’s farmland and includes such uses as summer fallow and Christmas tree production etc (Table K). Table K: Farmland use in Kings County and Nova Scotia, 2001
Kings County Nova Scotia Land Use
# of acres % of total # of
acres % of total
Land in crops (excluding Christmas tree area)
58,972 45.4% 294,596 29.3%
Tame or seeded pasture 7,813 6.0% 56,520 5.6%
Natural land for pasture 10,604 8.2% 81,215 8.1%
All other land (including summer fallow and Christmas tree area)
52,549 40.4% 573,502 57.0%
Total 129,938 100.0% 1,005,833 100.0% Source: Statistics Canada, 2001 Farm Size In 2001, the average farm size in Kings County was 202 acres which is lower than the provincial average of 256 acres (Table L). All subdivisions in King’s county have an average farm size of less than 225 acres.
- 9 -
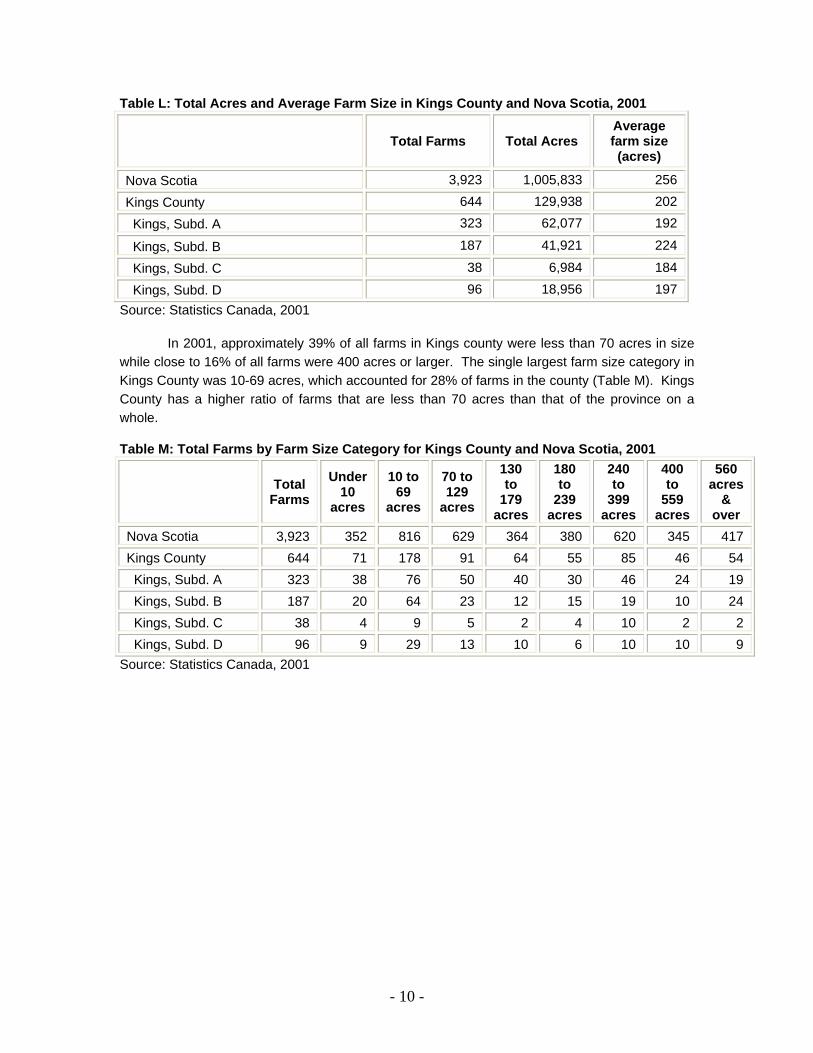
Table L: Total Acres and Average Farm Size in Kings County and Nova Scotia, 2001
Total Farms Total Acres
Average farm size (acres)
Nova Scotia 3,923 1,005,833 256
Kings County 644 129,938 202
Kings, Subd. A 323 62,077 192
Kings, Subd. B 187 41,921 224
Kings, Subd. C 38 6,984 184
Kings, Subd. D 96 18,956 197 Source: Statistics Canada, 2001 In 2001, approximately 39% of all farms in Kings county were less than 70 acres in size while close to 16% of all farms were 400 acres or larger. The single largest farm size category in Kings County was 10-69 acres, which accounted for 28% of farms in the county (Table M). Kings County has a higher ratio of farms that are less than 70 acres than that of the province on a whole. Table M: Total Farms by Farm Size Category for Kings County and Nova Scotia, 2001
Total Farms
Under 10
acres
10 to 69
acres
70 to 129
acres
130 to
179 acres
180 to
239 acres
240 to
399 acres
400 to
559 acres
560 acres
& over
Nova Scotia 3,923 352 816 629 364 380 620 345 417 Kings County 644 71 178 91 64 55 85 46 54 Kings, Subd. A 323 38 76 50 40 30 46 24 19 Kings, Subd. B 187 20 64 23 12 15 19 10 24 Kings, Subd. C 38 4 9 5 2 4 10 2 2 Kings, Subd. D 96 9 29 13 10 6 10 10 9
Source: Statistics Canada, 2001
- 10 -

APPENDIX A: Map of Kings County
Source: Service Nova Scotia & Municipal Relations
- 1 -