statistical quality control chapter 6 ops 370. statistical process/quality control at honda
TRANSCRIPT
Statistical Quality Control
Chapter 6
OPS 370

Statistical Process/Quality Control at Hondahttps://www.youtube.com/watch?v=a9hBmlWRjEc
Two Scoops of Raisins in a Box of Kellogg’s Raisin Bran
Statistical Quality Control

Illustrations• 1. BASF – catalytic cores for pollution control
• 2. Milliken – industrial fabrics
• 3. Thermalex – thermal tubing
• 4. Land’s End – customer service, order fulfillment
• 5. Hospital pharmacy

SQC Categories
• 1. Statistical Process Control (SPC)
• 2. Acceptance Sampling
Types of Quality Data
Variation

Sources of Variation
Cost of Variation

Taguchi Loss Function

Taguchi Loss Function

SPC Methods-Control Charts

Control Charts

Developing a Control Chart

A Process is “In Control” if1. No sample points are outside limits
2. Most sample points are near the process average
3. About an equal number of sample points are above and below the average
4. Sample points appear to be randomly distributed
Control Charts for Attributes

Control Charts for Attributes

Control Chart Z-Value
P Chart Calculations
P-Chart Example
Sample Number of Defective
Tires
Number of Tires in each
Sample
Proportion Defective
1 3 20
2 2 20
3 1 20
4 2 20
5 1 20
Total 9 100
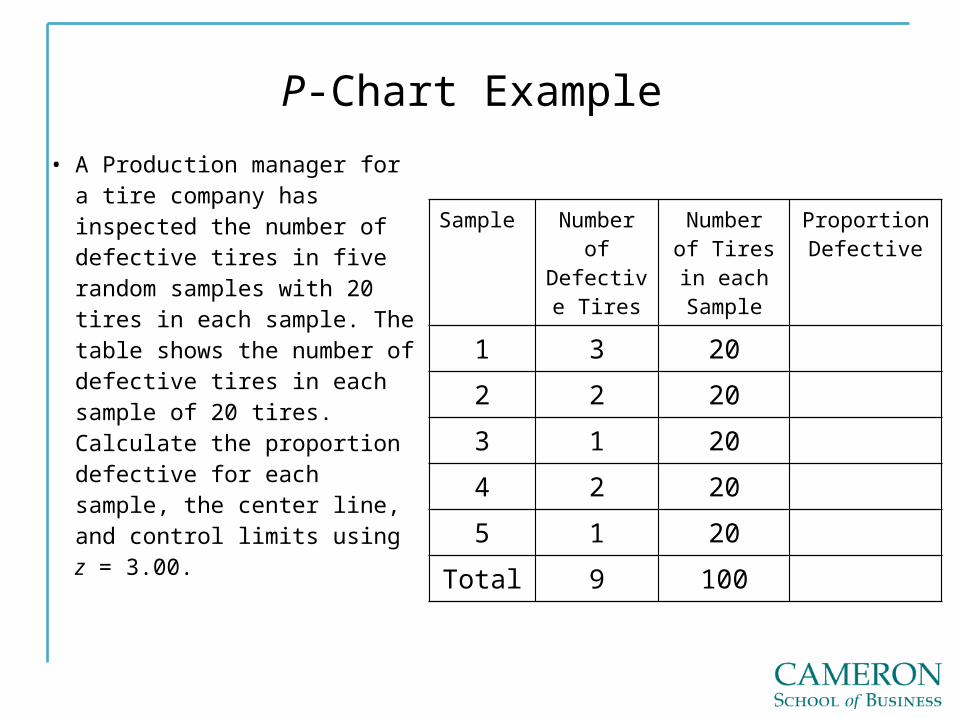
• A Production manager for a tire company has inspected the number of defective tires in five random samples with 20 tires in each sample. The table shows the number of defective tires in each sample of 20 tires. Calculate the proportion defective for each sample, the center line, and control limits using z = 3.00.

P-Chart Example, cont.

C-Chart Calculations
C-Chart Example
WeekNumber of Complaints
1 3
2 2
3 3
4 1
5 3
6 3
7 2
8 1
9 3
10 1
Total 22
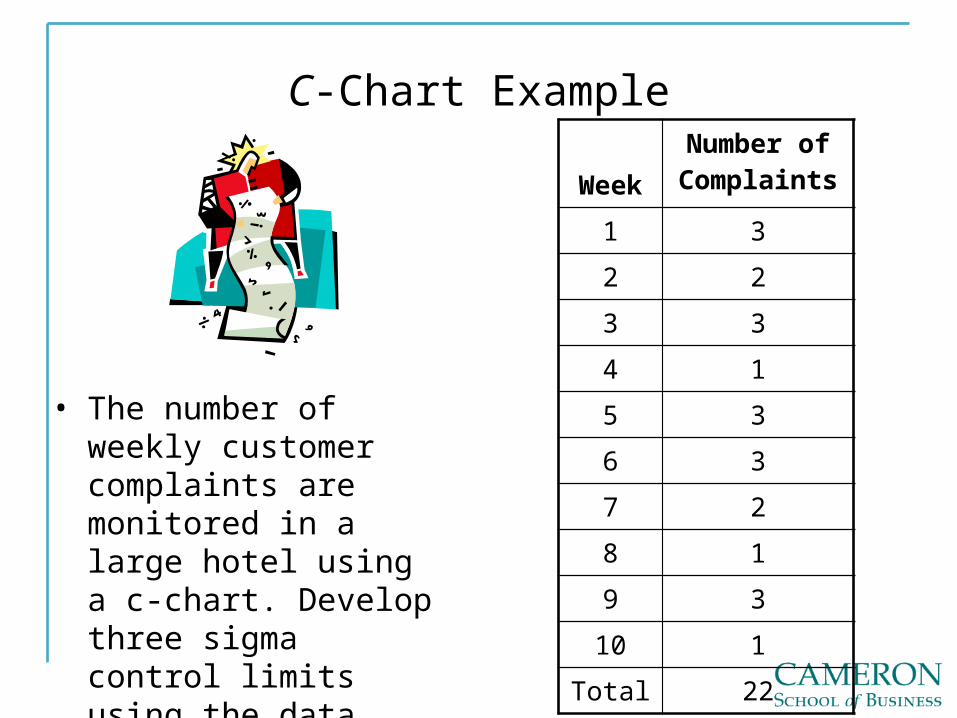
• The number of weekly customer complaints are monitored in a large hotel using a c-chart. Develop three sigma control limits using the data table below.
C-Chart Example, cont.

Control Charts for Variables• 1. Control chart for variables are used to
monitor characteristics that can be measured, such as length, weight, diameter, time
• 2. X-bar Chart: Mean– A. Plots sample averages– B. Measures central tendency (location) of the process
• 3. R Chart: Range– A. Plots sample ranges– B. Measures dispersion (variation) of the process
• 4. MUST use BOTH charts together to effectively monitor and control variable quality charateristics

R-Chart Calculations
Factor for x-Chart
A2 D3 D42 1.88 0.00 3.273 1.02 0.00 2.574 0.73 0.00 2.285 0.58 0.00 2.116 0.48 0.00 2.007 0.42 0.08 1.928 0.37 0.14 1.869 0.34 0.18 1.8210 0.31 0.22 1.7811 0.29 0.26 1.7412 0.27 0.28 1.7213 0.25 0.31 1.6914 0.24 0.33 1.6715 0.22 0.35 1.65
Factors for R-ChartSample Size (n)

Example for Variable Control Charts
Observation Sample 1 Sample 2 Sample 3
x1 15.8 16.1 16.0
x2 16.0 16.0 15.9
x3 15.8 15.8 15.9
x4 15.9 15.9 15.8
• A quality control inspector at the Cocoa Fizz soft drink company has taken three samples with four observations each of the volume of bottles filled (ounces). Use the data below to develop R and X-bar control charts with three sigma control limits for the 16 oz. bottling operation.

R-Chart Example
Observation Sample 1 Sample 2 Sample 3
x1 15.8 16.1 16.0
x2 16.0 16.0 15.9
x3 15.8 15.8 15.9
x4 15.9 15.9 15.8
Range

X-bar Chart Calculations
2
sample size
number of samples
average of the sample means
X-bar parameter
n
k
X
A
Factor for x-Chart
A2 D3 D42 1.88 0.00 3.273 1.02 0.00 2.574 0.73 0.00 2.285 0.58 0.00 2.116 0.48 0.00 2.007 0.42 0.08 1.928 0.37 0.14 1.869 0.34 0.18 1.8210 0.31 0.22 1.7811 0.29 0.26 1.7412 0.27 0.28 1.7213 0.25 0.31 1.6914 0.24 0.33 1.6715 0.22 0.35 1.65
Factors for R-ChartSample Size (n)
RAXLCL
XCL
RAXUCL
2
2

X-bar Chart Example
Observation Sample 1 Sample 2 Sample 3
x1 15.8 16.1 16.0
x2 16.0 16.0 15.9
x3 15.8 15.8 15.9
x4 15.9 15.9 15.8
Sample Mean

Interpreting Control Charts• A process is “in control” if all of the following
conditions are met.1. No sample points are outside limits
2. Most sample points are near the process average
3. About an equal number of sample points are above and below the average
4. Sample points appear to be randomly distributed

X-bar Chart
24.0
25.0
26.0
27.0
28.0
0 20 40 60 80 100
Sample Number
R Chart
02
46
810
0 10 20 30 40 50 60 70 80 90 100
Sample Number
X-bar Chart
23.0
24.0
25.0
26.0
27.0
28.0
0 20 40 60 80 100
Sample Number
R Chart
02
46
810
0 10 20 30 40 50 60 70 80 90 100
Sample Number
2
1
Control Chart Examples

X-bar Chart
20.022.024.026.028.030.032.034.0
0 20 40 60 80 100
Sample Number
R Chart
0
10
20
30
0 10 20 30 40 50 60 70 80 90 100
Sample Number
X-bar Chart
20.022.024.026.028.030.032.034.0
0 20 40 60 80 100
Sample Number
R Chart
0
10
20
30
40
0 10 20 30 40 50 60 70 80 90 100
Sample Number
3
4
Limits Based on Out of Control Data

Process Capability
Process Capability

Individual Measurements
Sample Means
Specification Limits
Control Limits

Process Capability
Design Specifications
Process
Design Specifications
Process

Process Capability
Design Specifications
Process
Design Specifications
Process
Computing Process Capabilityprocess mean (average)
process standard deviation
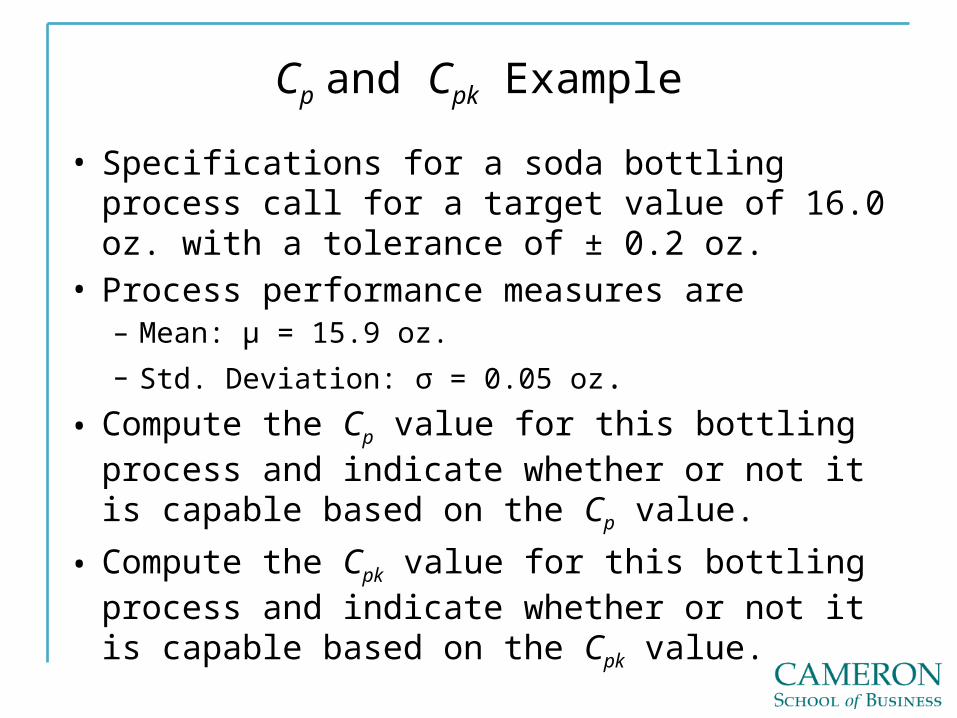
Cp and Cpk Example
• Specifications for a soda bottling process call for a target value of 16.0 oz. with a tolerance of ± 0.2 oz.
• Process performance measures are– Mean: µ = 15.9 oz.
– Std. Deviation: σ = 0.05 oz.
• Compute the Cp value for this bottling process and indicate whether or not it is capable based on the Cp value.
• Compute the Cpk value for this bottling process and indicate whether or not it is capable based on the Cpk value.

Example Calculations