statistical signal detection for spontaneous reports · statistical signal detection for...
TRANSCRIPT
Statistical signal detection for spontaneous reports
PROTECT Symposium February 19-20 2015
Suzie Seabroke

Contents
1. Which disproportionality method to use?
2. Subgroups and stratification
3. Unmasking
4. Drug-drug interactions
5. Duplicate detection

Study Objectives
1. to evaluate the performance of different signal detection algorithms
2. to investigate the impact of stratified and subgroup analyses in routine first pass signal detection
Within several spontaneous databases of varying size and characteristics
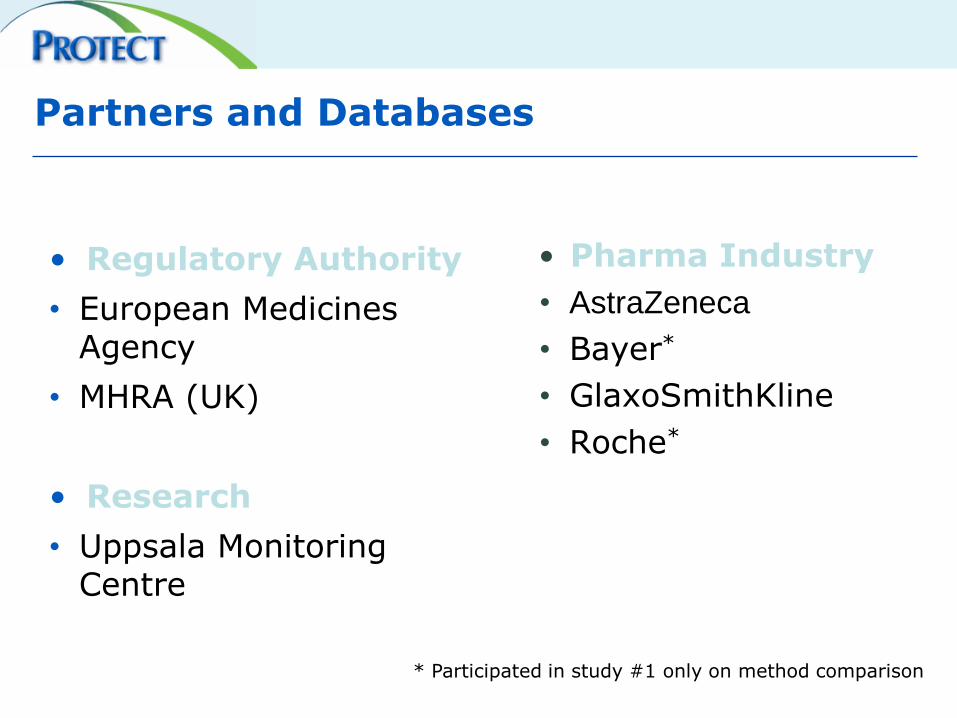
Partners and Databases
• Regulatory Authority
• European Medicines Agency
• MHRA (UK)
• Research
• Uppsala Monitoring Centre
• Pharma Industry
• AstraZeneca
• Bayer*
• GlaxoSmithKline
• Roche*
* Participated in study #1 only on method comparison

Signal Detection Performance Indicators
Signal detection performance measured using two/three performance indicators:
These are calculated on the entire dataset and also as they evolve over
time:
1) Sensitivity (the true positive rate)
Proportion of true ADRs that are correctly detected
2) Precision (positive predictive value)
Proportion of detected signals that correspond to a true ADR
3) Time to detection for the true positives (median or average)
How much time is gained by earlier signalling?
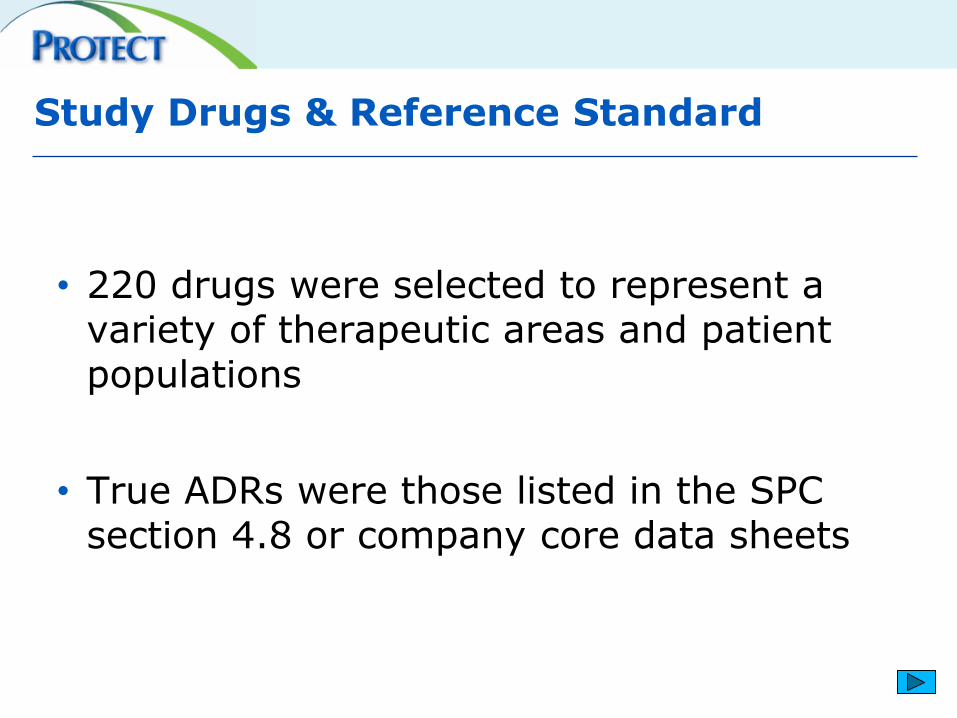
Study Drugs & Reference Standard
• 220 drugs were selected to represent a variety of therapeutic areas and patient populations
• True ADRs were those listed in the SPC section 4.8 or company core data sheets
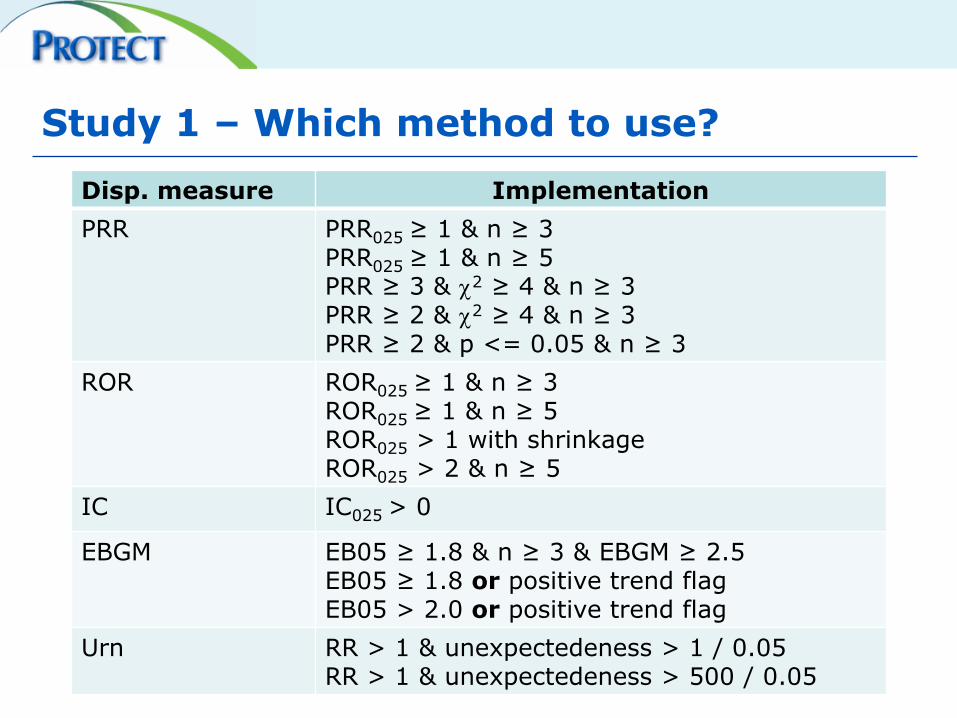
Study 1 – Which method to use?
Disp. measure Implementation
PRR PRR025 ≥ 1 & n ≥ 3 PRR025 ≥ 1 & n ≥ 5 PRR ≥ 3 & 2 ≥ 4 & n ≥ 3 PRR ≥ 2 & 2 ≥ 4 & n ≥ 3 PRR ≥ 2 & p <= 0.05 & n ≥ 3
ROR ROR025 ≥ 1 & n ≥ 3 ROR025 ≥ 1 & n ≥ 5 ROR025 > 1 with shrinkage ROR025 > 2 & n ≥ 5
IC IC025 > 0
EBGM EB05 ≥ 1.8 & n ≥ 3 & EBGM ≥ 2.5 EB05 ≥ 1.8 or positive trend flag EB05 > 2.0 or positive trend flag
Urn RR > 1 & unexpectedeness > 1 / 0.05 RR > 1 & unexpectedeness > 500 / 0.05
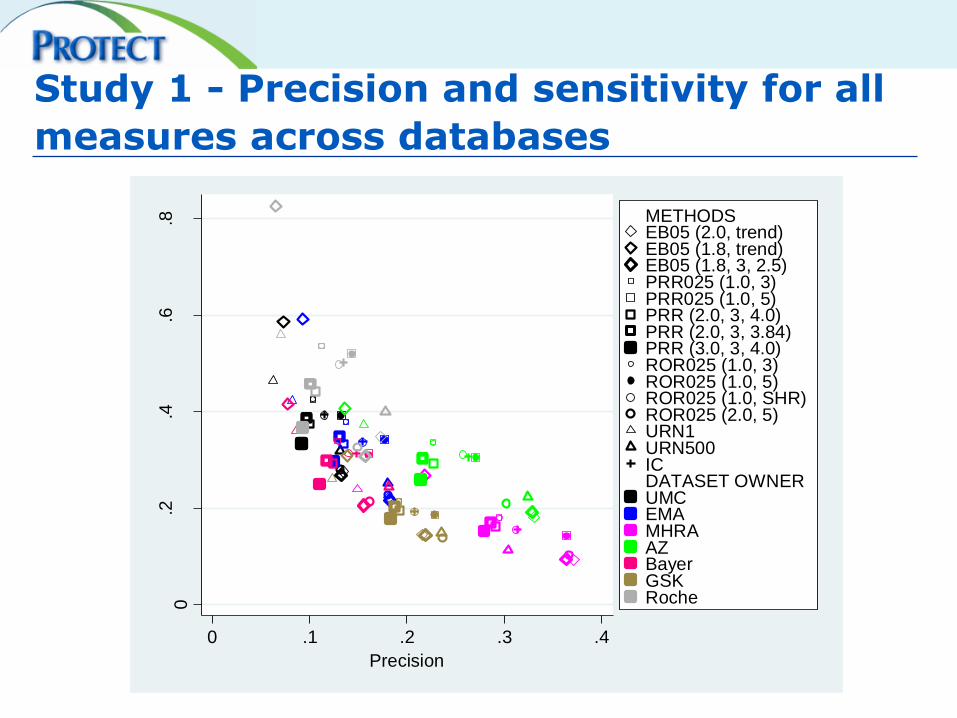
Study 1 - Precision and sensitivity for all
measures across databases 0
.2.4
.6.8
Sen
sitiv
ity
0 .1 .2 .3 .4
Precision
METHODSEB05 (2.0, trend)EB05 (1.8, trend)EB05 (1.8, 3, 2.5)PRR025 (1.0, 3)PRR025 (1.0, 5)PRR (2.0, 3, 4.0)PRR (2.0, 3, 3.84)PRR (3.0, 3, 4.0)ROR025 (1.0, 3)ROR025 (1.0, 5)ROR025 (1.0, SHR)ROR025 (2.0, 5)URN1URN500IC DATASET OWNERUMCEMAMHRAAZBayerGSKRoche

0.1
.2.3
.4.5
Sen
sitiv
ity a
dju
ste
d for
da
taba
se
0 .1 .2 .3
Precision adjusted for database
METHODSEB05 (2.0, trend)EB05 (1.8, trend)EB05 (1.8, 3, 2.5)PRR025 (1.0, 3)PRR025 (1.0, 5)PRR (2.0, 3, 4.0)PRR (2.0, 3, 3.84)PRR (3.0, 3, 4.0)ROR025 (1.0, 3)ROR025 (1.0, 5)ROR025 (1.0, SHR)ROR025 (2.0, 5)URN1URN500IC DATASET OWNERUMCEMAMHRAAZBayerGSKRoche
Study 1 - Performance of measures after
database standardisation

Study 1 - Mean precision and sensitivity
over databases 0
.1.2
.3.4
.5
Mea
n a
dju
ste
d s
en
sitiv
ity o
ver
da
taba
ses
0 .1 .2 .3
Mean adjusted precision over databases
EB05 (2.0, trend)
EB05 (1.8, trend)
EB05 (1.8, 3, 2.5)
PRR025 (1.0, 3)
PRR025 (1.0, 5)
PRR (2.0, 3, 4.0)
PRR (2.0, 3, 3.84)
PRR (3.0, 3, 4.0)
ROR025 (1.0, 3)
ROR025 (1.0, 5)
ROR025 (1.0, SHR)
ROR025 (2.0, 5)
URN1
URN500
IC

Study 1 – Envelope of precision and
sensitivity achievable with PRR
N=1N=2
N=3 N=4 N=5 N=6N=7
Lower confidence bound threshold
varies from 0 to 5 in steps of 0.1
0.2
.4.6
.8
Sen
sitiv
ity
0 .05 .1 .15 .2
Precision
EB05 (2.0, trend)
EB05 (1.8, trend)
EB05 (1.8, 3, 2.5)
PRR025 (1.0, 3)
PRR025 (1.0, 5)
PRR (2.0, 3, 4.0)
PRR (2.0, 3, 3.84)
PRR (3.0, 3, 4.0)
ROR025 (1.0, 3)
ROR025 (1.0, 5)
ROR025 (1.0, SHR)
ROR025 (2.0, 5)
URN1
URN500
IC

Study 1 - Change in precision over time
0.2
.4.6
.81
Pre
cis
ion
0 50 100 150 200
Months from authorisation
PRR025 (1.0, 5), EMA data
IC, EMA data
PRR025 (1.0, 5), UMC data
IC, UMC data

Study 1 - Conclusions
• All disproportionality methods can achieve similar overall performance by choice of algorithm
• Choice of algorithm can provide very different levels of performance
• Relative performance of an algorithm in one database can be predicted from research in others
• Precision seems to decrease over time on the market
Candore G, Juhlin K, Manlik K, Thakrar B, Quarcoo N, Seabroke S, Wisniewski A, Slattery J.
Comparison of statistical signal detection methods within and across databases. Submitted.

Study 2 – Subgroups & Stratification
Covariate Strata
Age 0-23months, 2-11, 12-17, 18-35, 36-64, 65-74, 75+ years, unknown
Gender Male, female, unknown
Time period 5-yearly
Vaccines/Drugs Vaccines, non-vaccines
Event seriousness Serious, non-serious
Reporter qualification
Consumer only, healthcare professional only, mixed
Report source Spontaneous only
Country of origin Individual country of origin
Region of origin North America, Europe, Asia, Japan, Rest of the World

Study 2 - Methods
• Stratified analyses conducted using Mantel-Haenszel approach to obtain a single adjusted value
• Subgroup analyses calculated disproportionality statistics within individual strata separately
• Stratified/subgroup results compared to crude unadjusted results
• Disproportionality statistics: – ROR025 ≥ 1 & n ≥ 3
– IC025 > 0
– EBGM >=2.5, EB05 >=1.8 and n>=3

Study 2 - Precision and sensitivity for
stratified & subgroup analyses (ROR)
Pre
cis
ion
Sensitivity
Age Gender Time period Vaccine Seriousness Reporter Spontaneous Country of origin Continent of origin
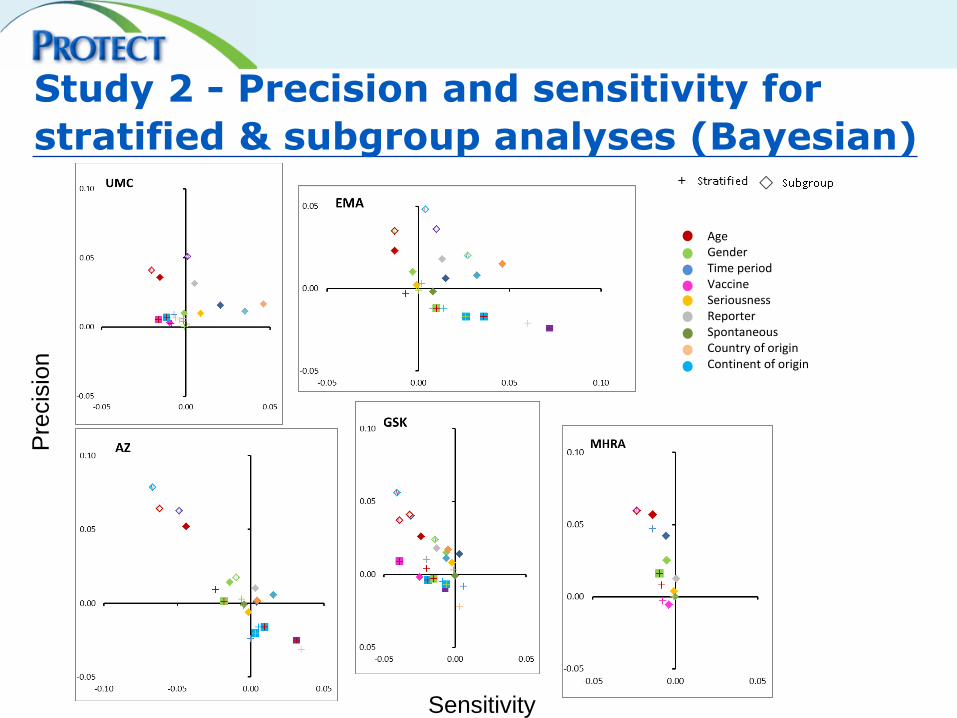
Study 2 - Precision and sensitivity for
stratified & subgroup analyses (Bayesian)
Pre
cis
ion
Sensitivity
Age Gender Time period Vaccine Seriousness Reporter Spontaneous Country of origin Continent of origin
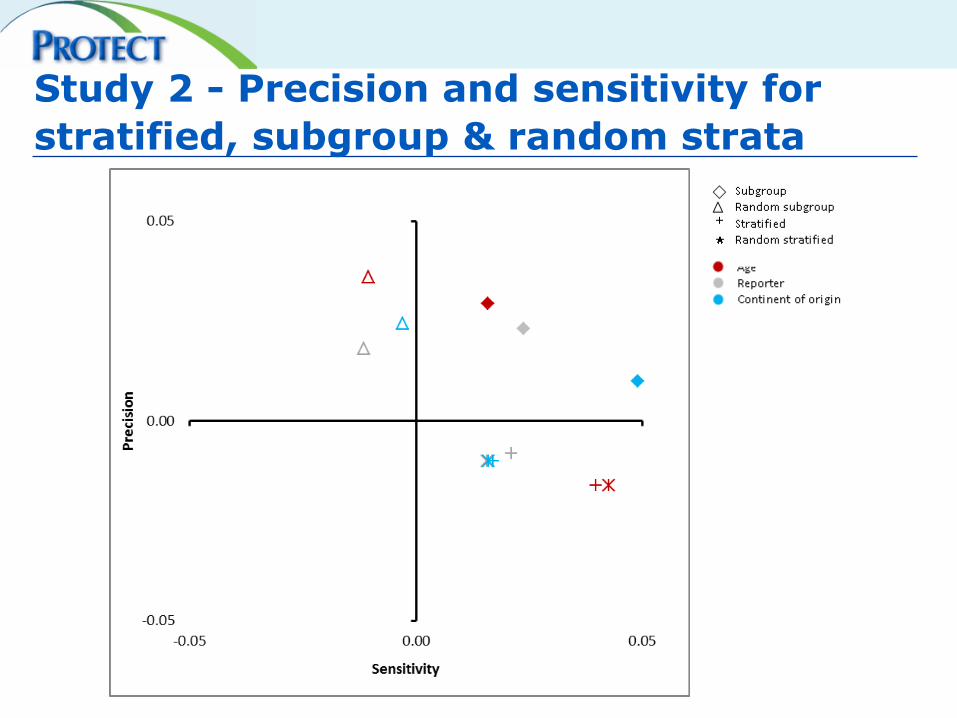
Study 2 - Precision and sensitivity for
stratified, subgroup & random strata
Study 2 - Conclusions
• Subgroup analyses consistently performed better than stratified analyses
• Subgroup analyses are beneficial in large, international databases. Smaller databases may
need to consider a likely tradeoff between sensitivity and precision
• Choice of variables for subgroup analyses will likely vary between different datasets
Seabroke S, Candore G, Juhlin K, Norén GN, Quarcoo N, Tregunno P, Wisniewski A, Slattery J.
The use of stratification and subgroup analyses in statistical signal detection. In Preparation.

Influence of Masking on Disproportionality
• Developed masking ratio to quantify masking effect of given product
• Assessed extent and impact of masking in Eudravigilance and Pfizer spontaneous database
Prevalence of important masking quite rare (0.003% DECs)
Important masking mainly concerns rarely reported events
1. Maignen F, Hauben M, Hung E, Holle LV, Dogne JM. A conceptual approach to the masking
effect of measures of disproportionality. Pharmacoepidemiol Drug Saf. 2014 Feb; 23(2):208-17
2. Maignen F, Hauben M, Hung E, Holle LV, Dogne JM. Assessing the extent and impact of the
masking effect of disproportionality analyses on two spontaneous reporting systems databases.
Pharmacoepidemiol Drug Saf. 2014 Feb; 23(2):195-207

Drug-Drug Interaction Detection
• Objective: Compare sensitivity & specificity of 4 different measures to detect drug-drug interactions
• Reference set:
established DDIs & D-E pairs with no known association
emerging DDIs from Stockley‘s interaction alerts 2007-2009 & D-E pairs not included in same reference
• WHO Vigibase used for analysis

Drug-Drug Interaction Detection
Conclusion: Statistical interaction measures with additive baseline models should be preferred over
multiplicative models for detecting drug-drug interactions in spontaneous data
Soeria-Atmadja D, Juhlin K, Thakrar B, Norén GN. Pharmacoepidemiol Drug Saf. 2014 Feb;
23(S1):294-295

Duplicate Detection
• Objective: compare probabilistic record matching algorithm (VigiMatch) with rule-based approaches
• MHRA, DHMA & AEMPS participated
• Initial evaluation: suspected VigiMatch duplicates 2000-2010 were assessed by respective national centre
• Second evaluation: direct comparison between
VigiMatch & MHRA rule-based algorithm
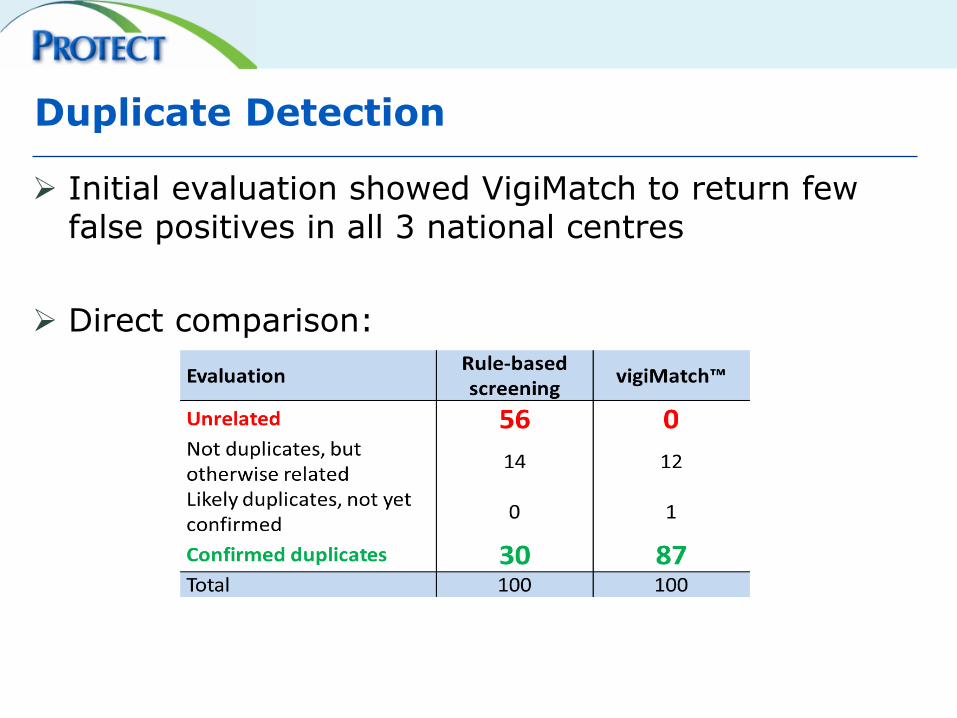
Duplicate Detection
Initial evaluation showed VigiMatch to return few
false positives in all 3 national centres
Direct comparison:

Duplicate Detection
Tregunno P, Bech Fink D, Fernandez-Fernandez C, Lazaro-Bengoa, Norén GN. Performance of
probabilistic method to detect duplicate individual case safety reports. Drug Safety. 2014;
37(4):249-258
Conclusion: Probablistic record matching should be considered as an alternative to rule-based methods
for duplicate detection in spontaneous data