statistical tables are attached - university of...
TRANSCRIPT

1
Statistical tables are attached
Two Hours
UNIVERSITY OF MANCHESTER
Medical Statistics MATH38071
Electronic calculators may be used provided that they cannot store text
Answer ALL five questions in SECTION A (40 marks in total).
Answer TWO of the three questions in Section B (40 marks in total). If more than two questions from
Section B are attempted, then credit will be given for the two best answers.
The total number of marks on the paper is 80.
2
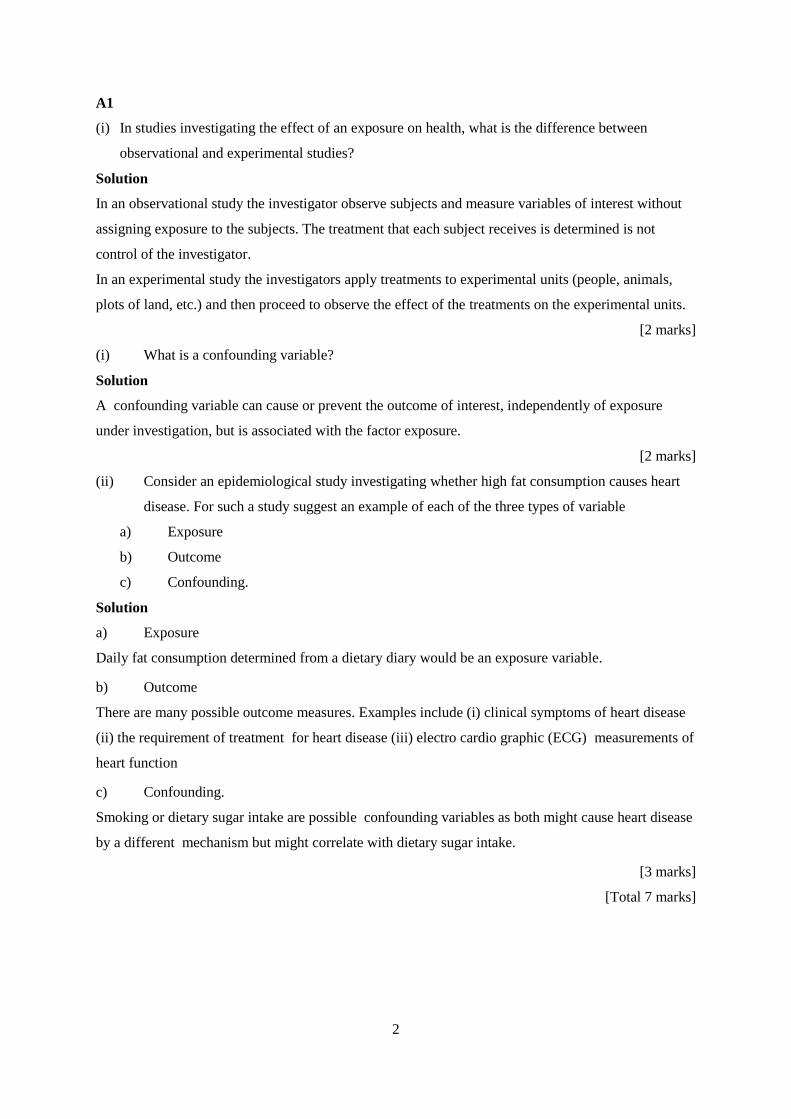
A1
(i) In studies investigating the effect of an exposure on health, what is the difference between
observational and experimental studies?
Solution
In an observational study the investigator observe subjects and measure variables of interest without
assigning exposure to the subjects. The treatment that each subject receives is determined is not
control of the investigator.
In an experimental study the investigators apply treatments to experimental units (people, animals,
plots of land, etc.) and then proceed to observe the effect of the treatments on the experimental units.
[2 marks]
(i) What is a confounding variable?
Solution
A confounding variable can cause or prevent the outcome of interest, independently of exposure
under investigation, but is associated with the factor exposure.
[2 marks]
(ii) Consider an epidemiological study investigating whether high fat consumption causes heart
disease. For such a study suggest an example of each of the three types of variable
a) Exposure
b) Outcome
c) Confounding.
Solution
a) Exposure
Daily fat consumption determined from a dietary diary would be an exposure variable.
b) Outcome
There are many possible outcome measures. Examples include (i) clinical symptoms of heart disease
(ii) the requirement of treatment for heart disease (iii) electro cardio graphic (ECG) measurements of
heart function
c) Confounding.
Smoking or dietary sugar intake are possible confounding variables as both might cause heart disease
by a different mechanism but might correlate with dietary sugar intake.
[3 marks]
[Total 7 marks]

3
A2.
A randomized controlled trial is carried out to compare a new treatment regime (N) with the existing
standard treatment (S) for patients. The effectiveness of treatment is assessed by whether the patient is
still infectious after 2 weeks. The results are summarized in the frequency table below.
Treatment
Standard (S) New (N)
Infectious after 2 weeks Yes 100 70
No 400 430
Total 500 500
(i) Calculate the rate ratio (RR) of the patient still being infectious after 2 weeks with the new
treatment (N) compared to the standard treatment (S).
Solution
70 500
0.7100 500
RR
[2 marks]
(ii) Suppose Tn patients are randomized to treatment (T) and Cn to the control (C).Suppose that
the number of events in each of the two treatment groups are Tr and Cr with probability
parameters T andC , respectively. The standard error of the ˆlog e RR is
1 1 1 1ˆ ˆlog e
T T C C
SE RRr n r n
Calculate the 95% confidence interval for rate ratio of being infectious after 2 weeks.
Solution
1 1 1 1 1 1 1 1ˆ ˆlog 0.020285714 0.14242792670 500 100 500
e
T T C C
SE RRr n r n
The 1 confidence interval for loge RR is given by / 2ˆ ˆlog log
e eRR z SE RR
For 95% confidence / 2 0.025 1.96 z z
Substitution give 0.3567 1.96 0.1424 . The 95% confidence interval for loge RR is therefore
-0.6358 to -0.0775.
The confidence interval for the rate ratio is / 2
1 1 1 1exp log
e
T T C C
RR zr n r n
4
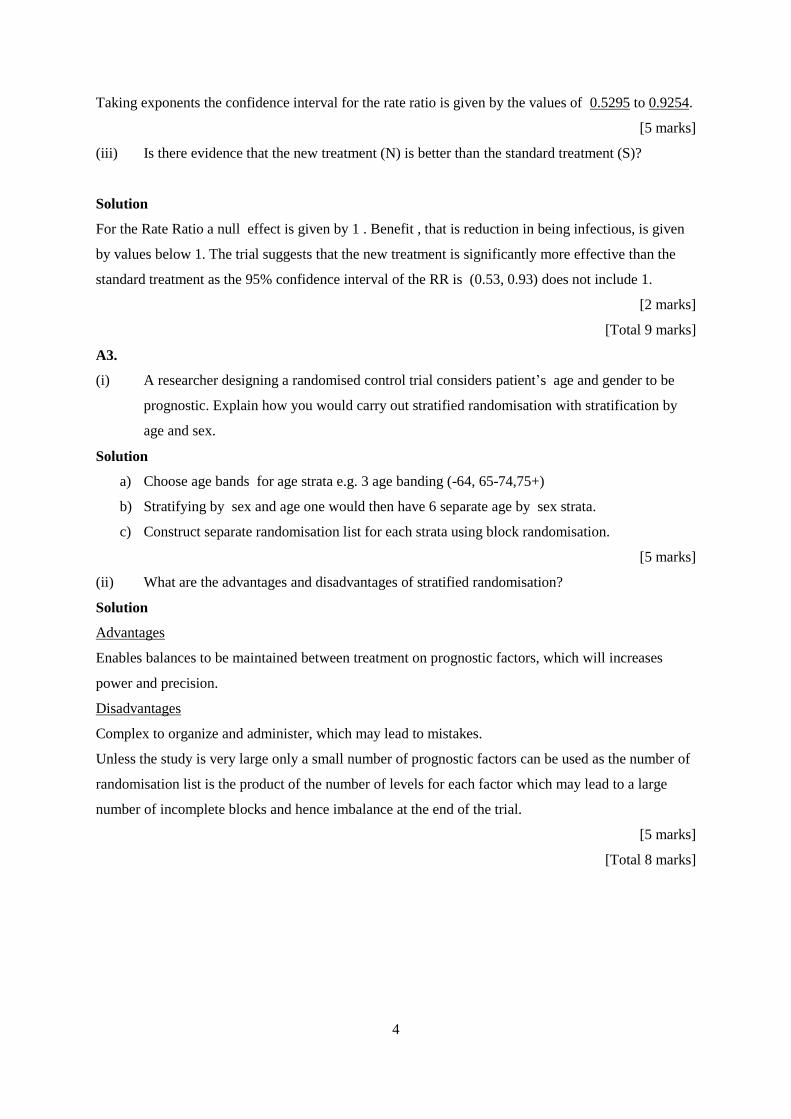
Taking exponents the confidence interval for the rate ratio is given by the values of 0.5295 to 0.9254.
[5 marks]
(iii) Is there evidence that the new treatment (N) is better than the standard treatment (S)?
Solution
For the Rate Ratio a null effect is given by 1 . Benefit , that is reduction in being infectious, is given
by values below 1. The trial suggests that the new treatment is significantly more effective than the
standard treatment as the 95% confidence interval of the RR is (0.53, 0.93) does not include 1.
[2 marks]
[Total 9 marks]
A3.
(i) A researcher designing a randomised control trial considers patient’s age and gender to be
prognostic. Explain how you would carry out stratified randomisation with stratification by
age and sex.
Solution
a) Choose age bands for age strata e.g. 3 age banding (-64, 65-74,75+)
b) Stratifying by sex and age one would then have 6 separate age by sex strata.
c) Construct separate randomisation list for each strata using block randomisation.
[5 marks]
(ii) What are the advantages and disadvantages of stratified randomisation?
Solution
Advantages
Enables balances to be maintained between treatment on prognostic factors, which will increases
power and precision.
Disadvantages
Complex to organize and administer, which may lead to mistakes.
Unless the study is very large only a small number of prognostic factors can be used as the number of
randomisation list is the product of the number of levels for each factor which may lead to a large
number of incomplete blocks and hence imbalance at the end of the trial.
[5 marks]
[Total 8 marks]
5
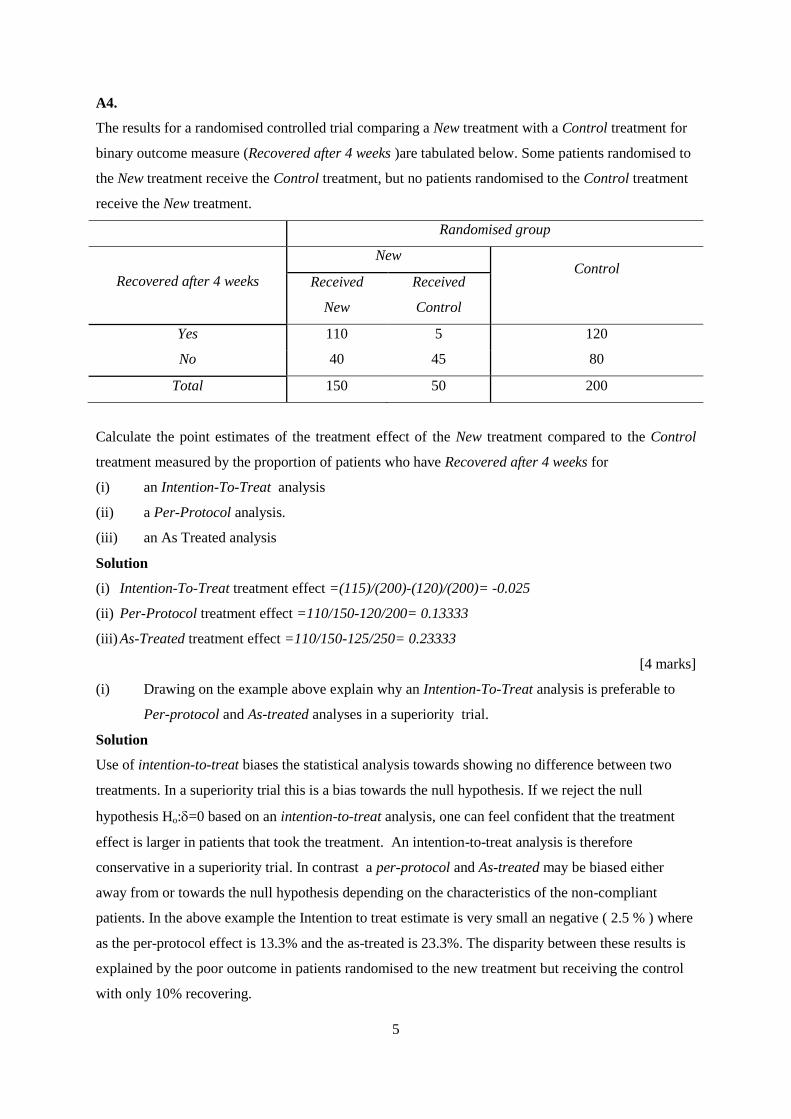
A4.
The results for a randomised controlled trial comparing a New treatment with a Control treatment for
binary outcome measure (Recovered after 4 weeks )are tabulated below. Some patients randomised to
the New treatment receive the Control treatment, but no patients randomised to the Control treatment
receive the New treatment.
Randomised group
Recovered after 4 weeks
New Control
Received
New
Received
Control
Yes 110 5 120
No 40 45 80
Total 150 50 200
Calculate the point estimates of the treatment effect of the New treatment compared to the Control
treatment measured by the proportion of patients who have Recovered after 4 weeks for
(i) an Intention-To-Treat analysis
(ii) a Per-Protocol analysis.
(iii) an As Treated analysis
Solution
(i) Intention-To-Treat treatment effect =(115)/(200)-(120)/(200)= -0.025
(ii) Per-Protocol treatment effect =110/150-120/200= 0.13333
(iii) As-Treated treatment effect =110/150-125/250= 0.23333
[4 marks]
(i) Drawing on the example above explain why an Intention-To-Treat analysis is preferable to
Per-protocol and As-treated analyses in a superiority trial.
Solution
Use of intention-to-treat biases the statistical analysis towards showing no difference between two
treatments. In a superiority trial this is a bias towards the null hypothesis. If we reject the null
hypothesis Ho:=0 based on an intention-to-treat analysis, one can feel confident that the treatment
effect is larger in patients that took the treatment. An intention-to-treat analysis is therefore
conservative in a superiority trial. In contrast a per-protocol and As-treated may be biased either
away from or towards the null hypothesis depending on the characteristics of the non-compliant
patients. In the above example the Intention to treat estimate is very small an negative ( 2.5 % ) where
as the per-protocol effect is 13.3% and the as-treated is 23.3%. The disparity between these results is
explained by the poor outcome in patients randomised to the new treatment but receiving the control
with only 10% recovering.

6
[4 marks]
[Total marks 8]
A5
In a meta-analysis of k trials, suppose ˆiθ is an estimate of the treatment effect for the i
th study and let
ˆ iVar θ be its sampling variance. The minimum variance estimate is defined by
ˆ
ˆ
k
i i
iMV k
i
i
w
w
,
where ˆ1/ i iw Var , and
1
1ˆ1
ˆ
MV k
i i
Var
Var
.
The table below summarizes the outcome of two trials comparing a new drug to prevent high blood
cholesterol with the current standard drug treatment. The treatment effect for each study ˆ , 1,2iθ i
is the difference in mean cholesterol for the two treatments.
(i) Compute the minimum variance estimate of the overall treatment effect, ̂MV , and determine
its 95% confidence interval stating any assumptions you make.
Reduction in
cholesterol
Study
(Date of Publication) ˆiθ ˆ
iVar θ iw
Rahman (2001) 0.36 0.2916 3.43
Chung (2008) 0.68 0.1156 8.65
Solution
The minimum variance estimate
ˆ0.36 3.43+0.68 8.65ˆ 0.589
3.43+8.65
k
i i
iMV k
i
i
w
w
1 1ˆ 0.082783.43+8.65
MV k
i
i
Var
w
ˆ 0.2877 MVSE
7
Assuming ̂MV is normally distributed the 95% c.i. is 0.5891.96 ̂
MVSE , which gives the 95% c.i.
to be from 0.0252 to 1.153.
[6 Marks]
(ii) What can you conclude from the meta-analysis regarding the performance of the new drug?
Solution
There is evidence from the meta-analysis that the new drug gave a greater reduction in blood
cholesterol as the 95% confidence interval for reduction is 0.0252 to 1.153 suggesting statistically
significant decrease.
[2 Marks]
[Total Mark 8]
8
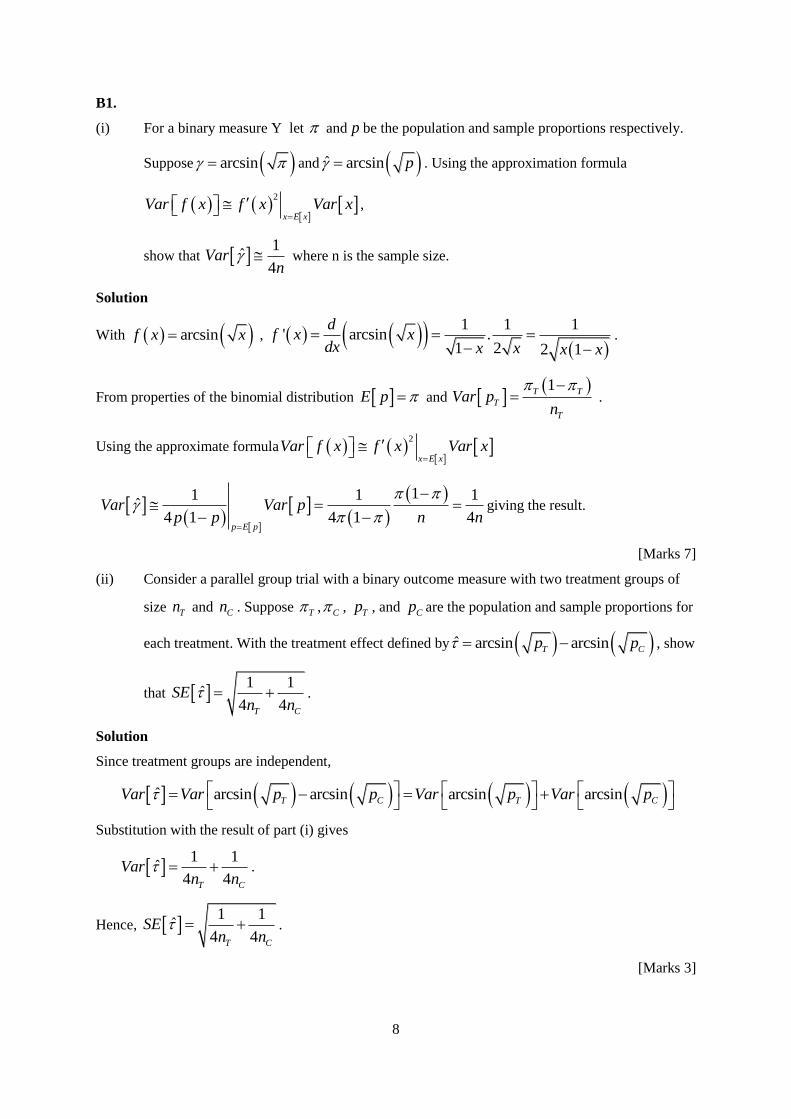
B1.
(i) For a binary measure Y let and p be the population and sample proportions respectively.
Suppose arcsin and ˆ arcsin p . Using the approximation formula
2
x E x
Var f x f x Var x ,
show that 1
ˆ4
Varn
where n is the sample size.
Solution
With arcsinf x x ,
1 1 1' arcsin .
1 2 2 1
df x x
dx x x x x.
From properties of the binomial distribution E p and 1
T T
T
T
Var pn
.
Using the approximate formula
2
x E x
Var f x f x Var x
11 1 1ˆ
4 1 4 1 4
p E p
Var Var pp p n n
giving the result.
[Marks 7]
(ii) Consider a parallel group trial with a binary outcome measure with two treatment groups of
size Tn and Cn . Suppose T ,C , Tp , and Cp are the population and sample proportions for
each treatment. With the treatment effect defined by ˆ arcsin arcsin T Cp p , show
that 1 1
ˆ4 4
T C
SEn n
.
Solution
Since treatment groups are independent,
ˆ arcsin arcsin arcsin arcsin T C T CVar Var p p Var p Var p
Substitution with the result of part (i) gives
1 1
ˆ4 4
T C
Varn n
.
Hence, 1 1
ˆ4 4
T C
SEn n
.
[Marks 3]

9
(iii) For a normally distributed test statistic ˆ
ˆ
T
SE the power to detect a difference D with
a two-sided size test is given by the expression 21
ˆ
DPower zSE
. For a test
of 0 : T CH vs 1 : T CH , show that the power to detect a difference between two
proportions T and C can be estimated by
2
arcsin arcsin1
1 1
4 4
T C
T C
z
n n
,
stating any required assumptions.
Solution
With ˆ arcsin arcsin T Cp p and 1 1
ˆ4 4
T C
SEn n
consider the test statistic
ˆ
ˆ
T
SE. The effect to be detected on the arc-sine scale is arcsin arcsin T C
.
Assuming ̂ is normally distributed substitution in to 21
ˆ
DzSE
gives
2
arcsin arcsinPower = 1
1 1
4 4
T C
T C
z
n n
.
[Marks 4]
(iv) Hence, show that two groups of size
2
2
2
2 arcsin arcsin
T C
z zn
will have power 1- to detect a difference between T andC with a two-sided test
size test.
Solution
Assuming T Cn n
2Power=1- 1 arcsin arcsin . 2 T Cz n

10
Hence 2 arcsin arcsin . 2 T Cz p p n
Taking inverses 2 arcsin arcsin . 2 T Cz z p p n
Rearrangement gives
2
2arcsin arcsin
T C
z zn
p p
Hence
2
2
2
2 arcsin arcsin
T C
z zn
p p
as required.
[Marks 6]
11
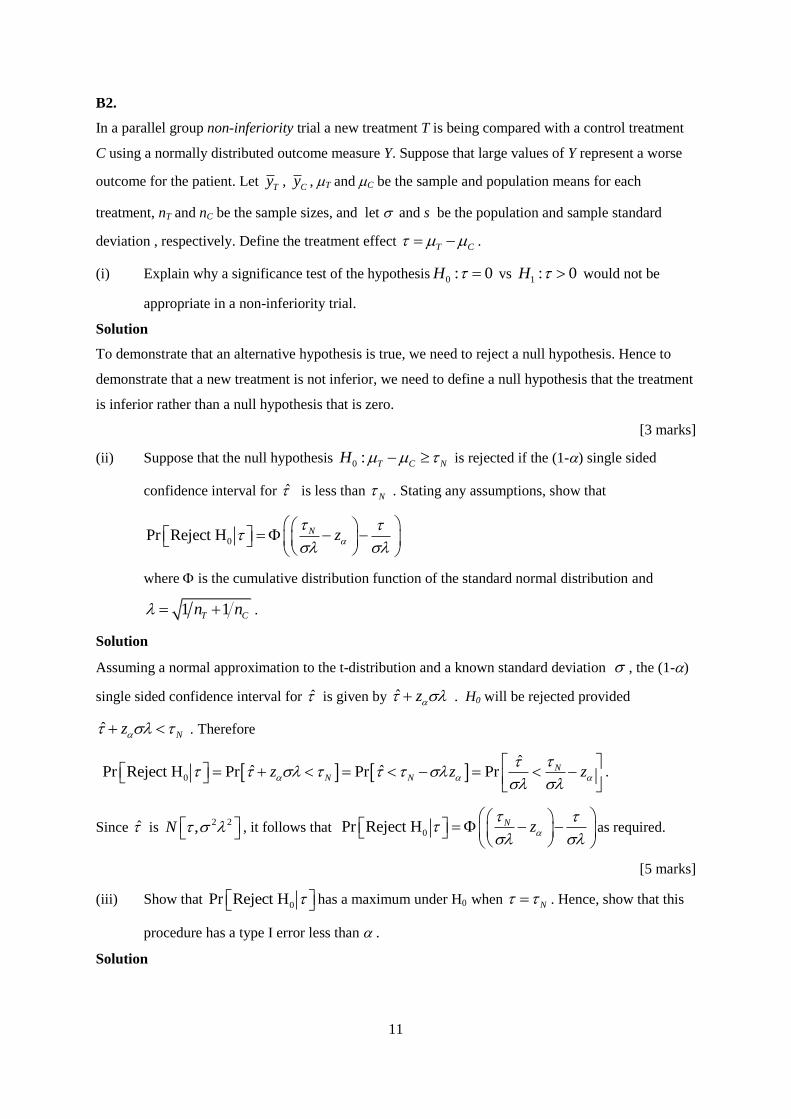
B2.
In a parallel group non-inferiority trial a new treatment T is being compared with a control treatment
C using a normally distributed outcome measure Y. Suppose that large values of Y represent a worse
outcome for the patient. Let Ty , Cy , T and C be the sample and population means for each
treatment, nT and nC be the sample sizes, and let and s be the population and sample standard
deviation , respectively. Define the treatment effect T C .
(i) Explain why a significance test of the hypothesis 0 : 0 H vs 1 : 0 H would not be
appropriate in a non-inferiority trial.
Solution
To demonstrate that an alternative hypothesis is true, we need to reject a null hypothesis. Hence to
demonstrate that a new treatment is not inferior, we need to define a null hypothesis that the treatment
is inferior rather than a null hypothesis that is zero.
[3 marks]
(ii) Suppose that the null hypothesis 0 : T C NH is rejected if the (1-) single sided
confidence interval for ̂ is less than N . Stating any assumptions, show that
0Pr Reject H
N z
where is the cumulative distribution function of the standard normal distribution and
1 1 T Cn n .
Solution
Assuming a normal approximation to the t-distribution and a known standard deviation , the (1-)
single sided confidence interval for ̂ is given by ˆ z . H0 will be rejected provided
ˆ Nz . Therefore
0
ˆˆ ˆ Pr Reject H Pr Pr Pr
NN Nz z z .
Since ̂ is 2 2, N , it follows that 0Pr Reject H
N z as required.
[5 marks]
(iii) Show that 0Pr Reject H has a maximum under H0 when N . Hence, show that this
procedure has a type I error less than .
Solution
12
The maximum of this can be obtained by differentiation w.r.t. . The derivative is
0
1Pr Reject H |
Ndz
d where is the standard normal density function.
Since >0 for finite values, it follows that 0Pr Reject H | is monotone decreasing with. Hence
the type I error rate, which is 0Pr Reject H | when N , has a maximum when N .
Setting N
0Pr Reject H
N Nz z
Since the type I error has a maximum when N the type I error is therefore less than or equal to
.
[7 marks]
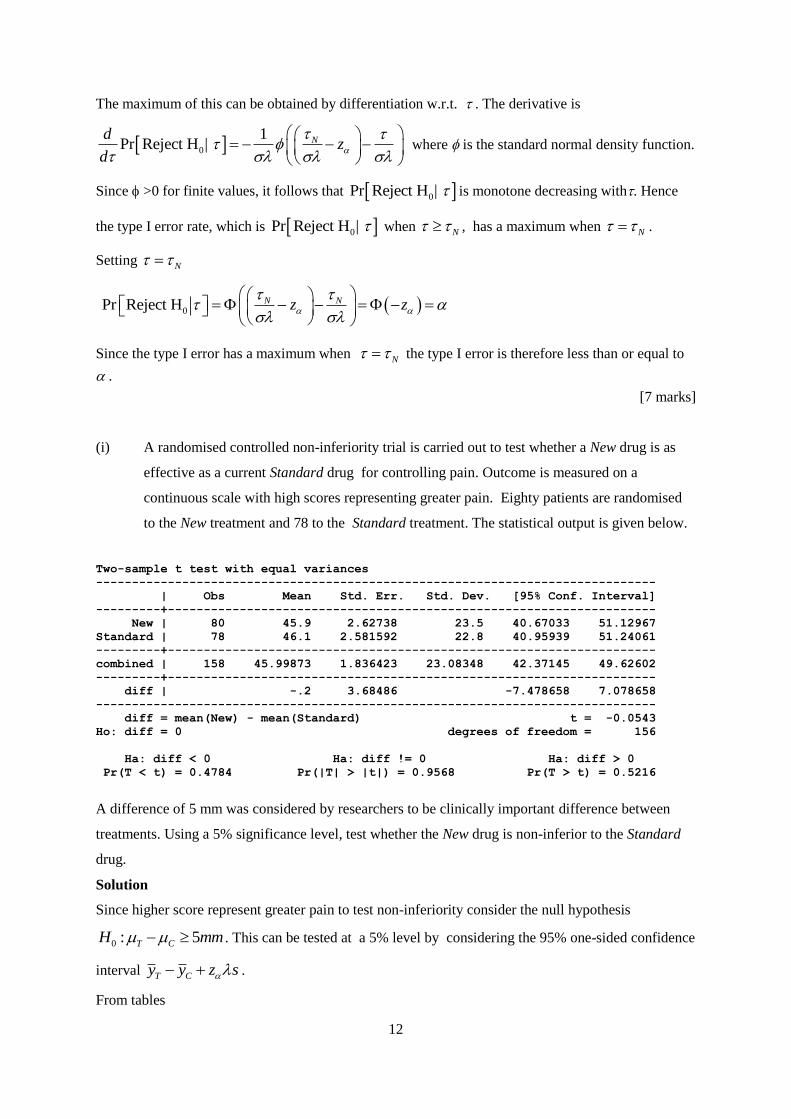
(i) A randomised controlled non-inferiority trial is carried out to test whether a New drug is as
effective as a current Standard drug for controlling pain. Outcome is measured on a
continuous scale with high scores representing greater pain. Eighty patients are randomised
to the New treatment and 78 to the Standard treatment. The statistical output is given below.
Two-sample t test with equal variances
------------------------------------------------------------------------------
| Obs Mean Std. Err. Std. Dev. [95% Conf. Interval]
---------+--------------------------------------------------------------------
New | 80 45.9 2.62738 23.5 40.67033 51.12967
Standard | 78 46.1 2.581592 22.8 40.95939 51.24061
---------+--------------------------------------------------------------------
combined | 158 45.99873 1.836423 23.08348 42.37145 49.62602
---------+--------------------------------------------------------------------
diff | -.2 3.68486 -7.478658 7.078658
------------------------------------------------------------------------------
diff = mean(New) - mean(Standard) t = -0.0543
Ho: diff = 0 degrees of freedom = 156
Ha: diff < 0 Ha: diff != 0 Ha: diff > 0
Pr(T < t) = 0.4784 Pr(|T| > |t|) = 0.9568 Pr(T > t) = 0.5216
A difference of 5 mm was considered by researchers to be clinically important difference between
treatments. Using a 5% significance level, test whether the New drug is non-inferior to the Standard
drug.
Solution
Since higher score represent greater pain to test non-inferiority consider the null hypothesis
0 : 5 T CH mm . This can be tested at a 5% level by considering the 95% one-sided confidence
interval T Cy y z s .
From tables

13
1.645 z
s is the SE = 3.68486
0.20 N Cy y .
So the one-sided upper interval is -0.20 +1.645x3.6848 = 5.862. Since this is above 5mm , the null
hypothesis cannot be rejected.
[5 Marks]
[Total 20 Marks]

14
B3.
For an AB/BA crossover trial a model for a continuous outcome yij of the ith patient in the j
th period
can be written as
1 1 i i iy for a patient in sequence AB in period 1,
2 2 i i iy for a patient in sequence AB in period 2,
1 1 i i iy for a patient in sequence BA in period 1,
2 2 i i iy for a patient in sequence BA in period 2,
where is the mean for the sequence BA in period 1 , is the treatment effect of A relative to B,
is the effect of the second period relative to the first, is the carryover effect, i is a random variable
representing patient i with mean zero and variance 2 B
, and ij is the error term for patient i in period
j assumed to be normally distributed with mean zero and variance 2
. Let 2 1 i i id y y and let ABd ,
AB,
BAd and BAbe the sample and population means of these for sequences AB and BA
respectively.
(i) Explain what is meant by the term carryover effect.
Solution
The effect of either treatment in the first period of a cross-over trial may carry over to the second
period. If there is a difference in the carryover for the two drug sequences, this is the called the
carryover effect.
[2 marks]
(i) In a crossover trial the treatment effect is estimated by ˆ 2 BA ABd d . Show that
this will be biased if there is a carryover effect.
Solution
For sequence AB 2 1 2 1 i i i i id y y
Therefore
2 1
i i i i
i AB i AB i ABAB
AB AB AB
d E d E
E d En n n
Similarly, for sequence BA, 2 1 2 1 i i i i id y y .
Therefore BAE d
Hence ˆ2 2
BA ABd dE E
So the treatment effect is biased by 2 .
[Book Work] [4 marks]

15
(ii) Let 2 1 i i ia y y and ABa , A
AB, BAa and A
BA be the sample and population means for
sequences AB and BA respectively. Show that AB BAE a a .
Solution
For sequence AB
2 1 2 12 2 i i i i i ia y y
Therefore
2
i i
i AB i ABAB
AB AB
a E a
E a En n
For sequence BA
2 1 2 12 2 i i i i i ia y y
2
i i
i BA i BABA
BA BA
a E a
E a En n
Subtraction gives AB BAE a a as required.
[4 marks]
(iii) Show that 2 2 1 14 2
BA AB B
BA AB
Var a an n
Solution
For either sequence
2 2
2 1 1 22 4 4 2 i i i i i i i BVar a Var Var Var Var
Therefore 2 24 2
BAB
AB
Var an
and 2 24 2
BBA
BA
Var an
.
Hence 2 2 1 14 2
BA AB BA AB B
BA AB
Var a a Var a Var an n
, as required.
[4 marks]
(iv) The test statistic Ta ,defined as ˆ
AB BAa
AB BA
a aT
SE a a, has been suggested as a test of the
hypothesis H0: = 0 vs H1: 0. What is the limitation of this as a test for carryover effect in
a crossover trial?
16
Solution
The advantage of a crossover trial is that the between subject variance 2 B, which is generally
larger than the within subject variance 2
, is removed from the test of the treatment effect.
The weakness of the Ta test of carryover effect is that ˆ AB BASE a a includes the between
subject variance 2 B. The statistical test Ta will therefore have low power in the circumstance
when such a test might be used.
[2 marks]
(v) What are the implications of (iv) for the design of crossover trials?
Solution
The implication of this for the design of crossover trials is that they are usually only advisable
in circumstance where the possibility of a carryover effect can be discounted for scientific
reasons or by virtue of the design.
[2 marks]
(vi) How might one prevent a carryover effect in a randomised controlled crossover
comparing two drug?
Solution
One way of preventing a carryover effect is to have a “washout period” between the two
treatments to allow any residual effect of the first treatment to be eliminated before starting
the second treatment.
[2 marks]
[Total marks 20]