statistical tables tables 147 under-five mortality rate (per 1,000 live births) unicef region 1990...
TRANSCRIPT
UNICEF – THE STATE OF THE WORLD’S CHILDREN 2017146
OverviewThis reference guide presents the most recent key statistics on child survival, development and protection for the world’s countries, areas and regions.
The statistical tables in this volume support UNICEF’s focus on progress and results towards internationally agreed-upon goals and compacts relating to children’s rights and development.
Efforts have been made to maximize the comparability of statistics across countries and time. Nevertheless, data used at the country level may differ in terms of the methods used to collect data or arrive at estimates, and in terms of the populations covered. Furthermore, data presented here are subject to evolving methodologies, revisions of time series data (e.g., immunization, maternal mortality ratios) and changing regional classifications. Also, data comparable from one year to the next are unavailable for some indicators. It is therefore not advisable to compare data from consecutive editions of The State of the World’s Children.
The numbers presented in this reference guide are available online at <www.unicef.org/sowc2017> and via the UNICEF global statistical databases at <data.unicef.org>. Please refer to these websites for the latest tables and for any updates or corrigenda subsequent to printing.
General note on the dataData presented in the following statistical tables are derived from the UNICEF global databases and are accompanied by definitions, sources and, where necessary, additional footnotes. The tables draw on
inter-agency estimates and nationally representative household surveys such as Multiple Indicator Cluster Surveys (MICS) and Demographic and Health Surveys (DHS). In addition, data from administrative sources and other United Nations organizations have been used.
Data presented in this year’s statistical tables generally reflect information available as of July 2017. More detailed information on methodology and data sources is available at <data.unicef.org>.
This volume includes the latest population estimates and projections from World Population Prospects: The 2017 revision and World Urbanization Prospects: The 2014 revision (United Nations Department of Economic and Social Affairs, Population Division). Data quality is likely to be adversely affected for countries that have recently suffered disasters, especially where basic country infrastructure has been fragmented or where major population movements have occurred.
Multiple Indicator Cluster Surveys (MICS): UNICEF assists countries in collecting and analyzing data in order to fill data gaps for monitoring the situation of children and women through its international household survey initiative, the Multiple Indicator Cluster Surveys (MICS). Since 1995, close to 300 surveys have been completed in more than 100 countries and areas.
MICS was a major source of data for monitoring progress on the Millennium Development Goals (MDG) indicators and will continue to be a major data source during the 2030 Sustainable Development Agenda to measure Sustainable Development Goal (SDG) indicators. More information is available at <mics.unicef.org>.
Statistical Tables

STATISTICAL TABLES 147
Under-five mortality rate (per 1,000 live births)
UNICEF Region 1990 1995 2000 2005 2010 2015 2016
East Asia and the Pacific 57 49 40 30 22 17 16Europe and Central Asia 31 28 22 16 13 10 10 Eastern Europe and Central Asia 47 45 36 27 20 15 14 Western Europe 11 8 6 5 5 4 4Latin America and the Caribbean 55 44 33 26 25 18 18Middle East and North Africa 66 53 43 34 28 25 24North America 11 9 8 8 7 7 6South Asia 129 112 94 77 63 50 48Sub-Saharan Africa 181 173 155 127 101 81 78 Eastern and Southern Africa 164 156 138 108 82 64 61 West and Central Africa 199 191 173 145 119 98 95Least developed countries 176 160 139 111 89 71 68World 93 87 78 64 52 42 41
Under-five deaths (thousands)
UNICEF Region 1990 1995 2000 2005 2010 2015 2016
East Asia and the Pacific 2,329 1,706 1,221 899 692 537 510 Europe and Central Asia 388 307 223 169 139 112 107 Eastern Europe and Central Asia 331 266 192 143 117 93 88 Western Europe 58 41 30 26 23 20 19 Latin America and the Caribbean 652 513 387 293 270 194 187 Middle East and North Africa 558 427 330 277 255 242 237 North America 47 40 35 35 32 28 28 South Asia 4,730 4,149 3,523 2,904 2,313 1,794 1,713 Sub-Saharan Africa 3,893 4,152 4,149 3,767 3,312 2,923 2,860 Eastern and Southern Africa 1,851 1,945 1,893 1,632 1,352 1,134 1,104 West and Central Africa 2,042 2,207 2,256 2,135 1,959 1,789 1,756 Least developed countries 3,669 3,639 3,437 2,966 2,544 2,154 2,101 World 12,598 11,293 9,868 8,344 7,014 5,831 5,642
Child mortality estimatesEach year, in The State of the World’s Children, UNICEF reports a series of mortality estimates for children – including the annual neonatal mortality rate, infant mortality rate, the under-five mortality rate (total, male and female) and the number of under-five deaths. These figures represent the best estimates available at the time of printing and are based on the work of the United Nations Inter-agency Group for Child Mortality Estimation (UN IGME), which includes UNICEF, the World Health Organization (WHO), the World Bank group and the United Nations Population Division.
UN IGME mortality estimates are updated annually through a detailed review of all newly available data points, which often results in adjustments to previously reported estimates. As a result, consecutive editions of The State of the World’s Children should not be used for analysing mortality trends over time. Comparable global and regional under-five mortality estimates for the period 1990–2016 are presented on page 154. Country-specific mortality indicators for 1990 and 2016, based on the most recent UN IGME estimates, are presented in Table 1 and are available at <data.unicef.org/child-mortality/under-five> and <www.childmortality.org>.

UNICEF – THE STATE OF THE WORLD’S CHILDREN 2017
Somalia 133 1
Chad 127 2
Central African Republic 124 3
Sierra Leone 114 4
Mali 111 5
Nigeria 104 6
Benin 98 7
Democratic Republic of the Congo
94 8
Lesotho 94 8
Côte d'Ivoire 92 10
Equatorial Guinea 91 11
Niger 91 11
South Sudan 91 11
Guinea 89 14
Guinea-Bissau 88 15
Burkina Faso 85 16
Angola 83 17
Mauritania 81 18
Cameroon 80 19
Pakistan 79 20
Togo 76 21
Comoros 73 22
Burundi 72 23
Mozambique 71 24
Afghanistan 70 25
Swaziland 70 25
Haiti 67 27
Liberia 67 27
Gambia 65 29
Sudan 65 29
Djibouti 64 31
Lao People's Democratic Republic
64 31
Zambia 63 33
The following list ranks countries and areas in descending order of their estimated 2016 under-five mortality rate, a critical indicator of the well-being of children. Countries and areas are listed alphabetically in the tables on the following pages.
Countries and areas
Under-5 mortality rate (2016)
Value Rank Countries and areas
Under-5 mortality rate (2016)
Value Rank Countries and areas
Under-5 mortality rate (2016)
Value Rank
HIGHEST UNDER-FIVE MORTALITY RATE
Ghana 59 34
Ethiopia 58 35
United Republic of Tanzania
57 36
Zimbabwe 56 37
Malawi 55 38
Yemen 55 38
Congo 54 40
Kiribati 54 40
Papua New Guinea 54 40
Uganda 53 43
Myanmar 51 44
Turkmenistan 51 44
Timor-Leste 50 46
Kenya 49 47
Gabon 47 48
Senegal 47 48
Madagascar 46 50
Eritrea 45 51
Namibia 45 51
India 43 53
South Africa 43 53
Tajikistan 43 53
Botswana 41 56
Rwanda 39 57
Bolivia (Plurinational State of)
37 58
Marshall Islands 35 59
Nauru 35 59
Nepal 35 59
Bangladesh 34 62
Dominica 34 62
Sao Tome and Principe 34 62
Micronesia (Federated States of)
33 65
Bhutan 32 66
Guyana 32 66
Azerbaijan 31 68
Cambodia 31 68
Dominican Republic 31 68
Iraq 31 68
Guatemala 29 72
Vanuatu 28 73
Morocco 27 74
Philippines 27 74
Indonesia 26 76
Solomon Islands 26 76
Algeria 25 78
Tuvalu 25 78
Uzbekistan 24 80
Egypt 23 81
Fiji 22 82
Niue 22 82
Viet Nam 22 82
Cabo Verde 21 85
Ecuador 21 85
Kyrgyzstan 21 85
Democratic People's Republic of Korea
20 88
Nicaragua 20 88
Paraguay 20 88
Suriname 20 88
Honduras 19 92
State of Palestine 19 92
Trinidad and Tobago 19 92
Jordan 18 95
Mongolia 18 95
Syrian Arab Republic 18 95
Saint Vincent and the Grenadines
17 98
UNDER-FIVE MORTALITY RANKINGS
UNICEF – THE STATE OF THE WORLD’S CHILDREN 2017148

Samoa 17 98
Grenada 16 100
Palau 16 100
Panama 16 100
Republic of Moldova 16 100
Tonga 16 100
Venezuela (Bolivarian Republic of)
16 100
Belize 15 106
Brazil 15 106
Colombia 15 106
El Salvador 15 106
Iran (Islamic Republic of) 15 106
Jamaica 15 106
Mexico 15 106
Peru 15 106
Albania 14 114
Mauritius 14 114
Seychelles 14 114
Tunisia 14 114
Armenia 13 118
Libya 13 118
Saint Lucia 13 118
Saudi Arabia 13 118
Turkey 13 118
Barbados 12 123
Thailand 12 123
The former Yugoslav Republic of Macedonia
12 123
Argentina 11 126
Bahamas 11 126
Georgia 11 126
Kazakhstan 11 126
Oman 11 126
Brunei Darussalam 10 131
China 10 131
Antigua and Barbuda 9 133
Costa Rica 9 133
Maldives 9 133
Qatar 9 133
Romania 9 133
Saint Kitts and Nevis 9 133
Sri Lanka 9 133
Ukraine 9 133
Uruguay 9 133
Bahrain 8 142
Bulgaria 8 142
Chile 8 142
Cook Islands 8 142
Kuwait 8 142
Lebanon 8 142
Malaysia 8 142
Russian Federation 8 142
United Arab Emirates 8 142
Malta 7 151
United States 7 151
Bosnia and Herzegovina 6 153
Cuba 6 153
Serbia 6 153
Slovakia 6 153
Canada 5 157
Croatia 5 157
Hungary 5 157
Latvia 5 157
Lithuania 5 157
New Zealand 5 157
Poland 5 157
Australia 4 164
Austria 4 164
Belarus 4 164
Belgium 4 164
Denmark 4 164
France 4 164
Germany 4 164
Greece 4 164
Ireland 4 164
Israel 4 164
Montenegro 4 164
Netherlands 4 164
Portugal 4 164
Switzerland 4 164
United Kingdom 4 164
Andorra 3 179
Cyprus 3 179
Czechia 3 179
Estonia 3 179
Italy 3 179
Japan 3 179
Monaco 3 179
Norway 3 179
Republic of Korea 3 179
San Marino 3 179
Singapore 3 179
Spain 3 179
Sweden 3 179
Finland 2 192
Iceland 2 192
Luxembourg 2 192
Slovenia 2 192
Anguilla - -
British Virgin Islands - -
Holy See - -
Liechtenstein - -
Montserrat - -
Tokelau - -
Turks and Caicos Islands - -
LOWEST UNDER-5 MORTALITY RATE
ABOUT 15,000 CHILDREN UNDER 5 YEARS OLD STILL DIE EVERY DAY.
Countries and areas
Under-5 mortality rate (2016)
Value Rank Countries and areas
Under-5 mortality rate (2016)
Value Rank Countries and areas
Under-5 mortality rate (2016)
Value Rank
statisical taBles 149

UNICEF – THE STATE OF THE WORLD’S CHILDREN 2017150
Regional classificationAverages presented at the end of each of the 13 statistical tables are calculated using data from countries and areas as classified below.
East Asia and the PacificAustralia; Brunei Darussalam; Cambodia; China; Cook Islands; Democratic People’s Republic of Korea; Fiji; Indonesia; Japan; Kiribati; Lao People’s Democratic Republic; Malaysia; Marshall Islands; Micronesia (Federated States of); Mongolia; Myanmar; Nauru; New Zealand; Niue; Palau; Papua New Guinea; Philippines; Republic of Korea; Samoa; Singapore; Solomon Islands; Thailand; Timor-Leste; Tokelau ; Tonga; Tuvalu; Vanuatu; Viet Nam
Europe and Central AsiaEastern Europe and Central Asia; Western Europe
Eastern Europe and Central AsiaAlbania; Armenia; Azerbaijan; Belarus; Bosnia and Herzegovina; Bulgaria; Croatia; Georgia; Kazakhstan; Kyrgyzstan; Montenegro; Republic of Moldova; Romania; Russian Federation; Serbia; Tajikistan; the former Yugoslav Republic of Macedonia; Turkey; Turkmenistan; Ukraine; Uzbekistan
Western Europe Andorra; Austria; Belgium; Cyprus; Czechia; Denmark; Estonia; Finland; France; Germany; Greece; Holy See; Hungary; Iceland; Ireland; Italy; Latvia; Liechtenstein; Lithuania; Luxembourg; Malta; Monaco; Netherlands; Norway; Poland; Portugal; San Marino; Slovakia; Slovenia; Spain; Sweden; Switzerland; United Kingdom
Latin America and the CaribbeanAnguilla; Antigua and Barbuda; Argentina; Bahamas; Barbados; Belize; Bolivia (Plurinational State of); Brazil; British Virgin Islands; Chile; Colombia; Costa Rica; Cuba; Dominica; Dominican Republic; Ecuador; El Salvador; Grenada; Guatemala; Guyana; Haiti; Honduras; Jamaica; Mexico; Montserrat; Nicaragua; Panama; Paraguay; Peru; Saint Kitts and Nevis; Saint Lucia; Saint Vincent and the Grenadines; Suriname; Trinidad and
Tobago; Turks and Caicos Islands; Uruguay; Venezuela (Bolivarian Republic of)
Middle East and North AfricaAlgeria; Bahrain; Egypt; Iran (Islamic Republic of); Iraq; Israel; Jordan; Kuwait; Lebanon; Libya; Morocco; Oman; Qatar; Saudi Arabia; State of Palestine; Syrian Arab Republic; Tunisia; United Arab Emirates; Yemen
North AmericaCanada; United States
South AsiaAfghanistan; Bangladesh; Bhutan; India; Maldives; Nepal; Pakistan; Sri Lanka
Sub-Saharan AfricaEastern and Southern Africa; West and Central Africa
Eastern and Southern AfricaAngola; Botswana; Burundi; Comoros; Djibouti; Eritrea; Ethiopia; Kenya; Lesotho; Madagascar; Malawi; Mauritius; Mozambique; Namibia; Rwanda; Seychelles; Somalia; South Africa; South Sudan; Sudan; Swaziland; Uganda; United Republic of Tanzania; Zambia; Zimbabwe
West and Central AfricaBenin; Burkina Faso; Cabo Verde; Cameroon; Central African Republic; Chad; Congo; Côte d’Ivoire; Democratic Republic of the Congo; Equatorial Guinea; Gabon; Gambia; Ghana; Guinea; Guinea-Bissau; Liberia; Mali; Mauritania; Niger; Nigeria; Sao Tome and Principe; Senegal; Sierra Leone; Togo
Least developed countries/areas[Classified as such by the United Nations High Representative for the Least Developed Countries, Landlocked Developing Countries and Small Island Developing States (UN-OHRLLS)].
Afghanistan; Angola; Bangladesh; Benin; Bhutan; Burkina Faso; Burundi; Cambodia; Central African Republic; Chad; Comoros; Democratic Republic of the Congo; Djibouti; Eritrea; Ethiopia; Gambia; Guinea; Guinea-Bissau; Haiti; Kiribati; Lao People’s Democratic Republic; Lesotho; Liberia;
STATISTICAL TABLES 151
Madagascar; Malawi; Mali; Mauritania; Mozambique; Myanmar; Nepal; Niger; Rwanda; Sao Tome and Principe; Senegal; Sierra Leone; Solomon Islands; Somalia; South Sudan; Sudan; Timor-Leste; Togo; Tuvalu; Uganda; United Republic of Tanzania; Vanuatu; Yemen; Zambia
Notes on specific tablesTABLE 2. NUTRITION Stunting, wasting and overweight: UNICEF, WHO and the World Bank have continued a process to harmonize anthropometric data used for computation and estimation of regional and global averages and trend analysis. As part of this process, regional and global averages for stunting, wasting and overweight prevalences are derived from a model described in M. de Onis et al., ‘Methodology for Estimating Regional and Global Trends of Child Malnutrition’ (International Journal of Epidemiology, vol. 33, 2004, pp. 1260–1270).
Vitamin A supplementation: Emphasizing the importance for children of receiving two annual doses of vitamin A (spaced 4–6 months apart), this report presents only full coverage of vitamin A supplementation. In the absence of a direct method to measure this indicator, full coverage is reported as the lower coverage estimate from semester 1 (Jan – June) and semester 2 (July – Dec), in a given year. The regional and global aggregates only contain the 82 countries indicated as priority countries for national level programmes. Hence the aggregates are published where at least 50 per cent of the population coverage for the priority countries in each region have been met. In other words, East Asia and Pacific estimates are presented despite there being no data for China, because China is not a priority country for a national level programme.
Low birthweight: The data have not been updated since October 2014 due to ongoing methodological work to revise the analysis method for estimates from household surveys where a large number of children
are not weighed. New methods are currently being applied to generate estimates through an inter-agency process, and updates will be available in the next edition of The State of the World’s Children.
Iodized salt: The definition of the indicator presented in this report has changed from the past when it was about households consuming adequately iodized salt. Now it is about salt with any iodine, as such, global and regional average prevalence estimates are not comparable to the averages published in previous editions of The State of the World’s Children.
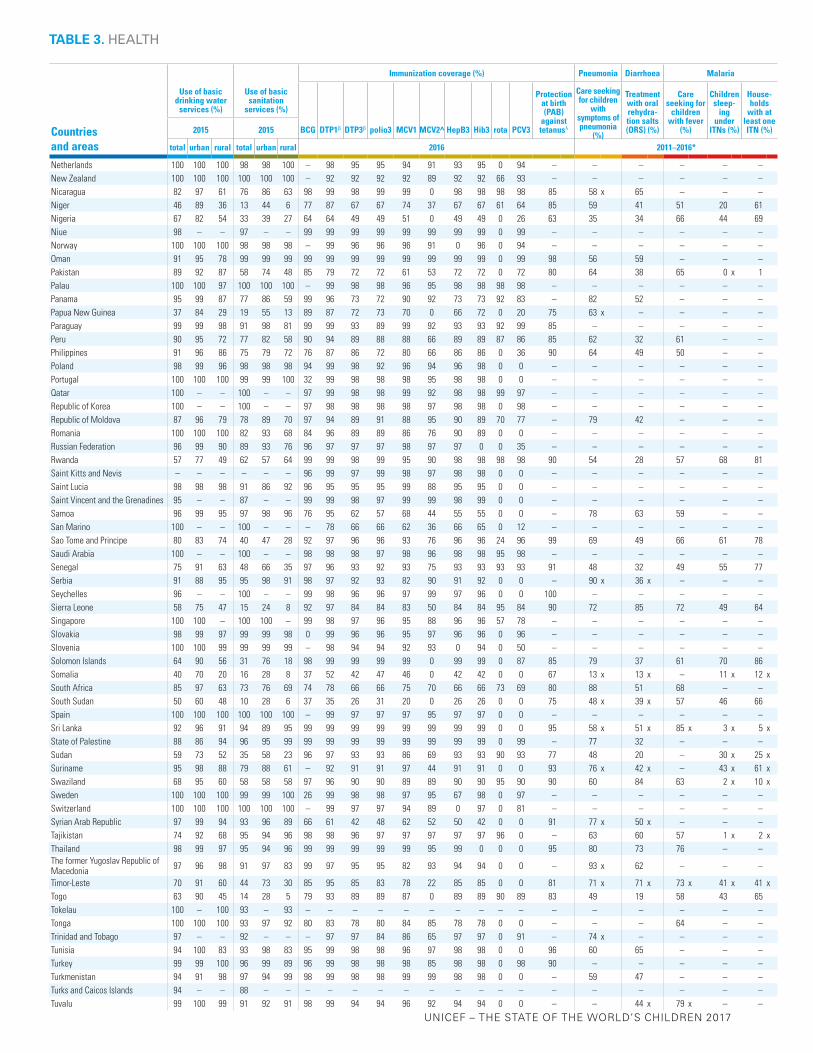
TABLE 3. HEALTH Water, sanitation and hygiene: The drinking water, sanitation and hygiene estimates in this report come from the WHO/UNICEF Joint Monitoring Programme for Water Supply, Sanitation and Hygiene (JMP). Full details of the JMP methodology can be found at <www.washdata.org>. New estimates are released every 2 years which supersede all previous estimates and should not be compared.
Immunization: This report presents WHO and UNICEF estimates of national immunization coverage. Since 2000, the estimates are updated once annually in July, following a consultation process wherein countries are provided draft reports for review and comment. As the system incorporates new empirical data, each annual revision supersedes prior data releases, and coverage levels from earlier revisions are not comparable. A more detailed explanation of the process can be found at <data.unicef.org/child-health/immunization>.
Regional averages for the reported antigens are computed as follows:
• For BCG, regional averages include only those countries where BCG is included in the national routine immunization schedule.
• For DPT, polio, measles, HepB, Hib, PCV and rotavirus vaccines, regional averages include all countries,

UNICEF – THE STATE OF THE WORLD’S CHILDREN 2017152
as these vaccines are universally recommended by WHO.
• For protection at birth (PAB) from tetanus, regional averages include only the countries where maternal and neonatal tetanus is endemic.
TABLE 4. HIV/AIDS In 2017, the Joint United Nations Programme on HIV/AIDS (UNAIDS) released new global, regional and country-level HIV and AIDS estimates for 2016 that reflect the most up-to-date epidemiological estimates, as well as antiretroviral therapy (ART) for adults and children, and prevention of mother-to-child transmission (PMTCT) of HIV coverage data. The estimates are based on the most current available science and WHO programme guidelines, which have resulted in improvements in assumptions of the probability of HIV transmission from mother-to-child, fertility among women by age and HIV serostatus, net survival rates for HIV-infected children and more. Furthermore, this table includes the most recent and reliable data available from population-based surveys and programme service statistics. Based on the refined methodology, UNAIDS has retrospectively generated new estimates of HIV prevalence, the number of people living with HIV and those needing treatment, AIDS-related deaths, new HIV infections and the number of children whose parents have died due to all causes including AIDS for past years.
Only new estimates should be used for trend analysis as the global and regional figures published in The State of the World’s Children are not comparable to estimates previously published. The new HIV and AIDS estimates included in this table are also available on <data.unicef.org> as well as <http://www.aidsinfoonline.org>. More information on HIV and AIDS estimates, methodology and updates can be found at <www.unaids.org>.
The indicators included in Table 4 have been revised from previous editions of The State of the World’s Children in order to better reflect progress in current HIV/AIDS programmes and policy.
TABLE 7. WOMEN Maternal mortality ratio (adjusted): The table presents the ‘adjusted’ maternal mortality ratios for the year 2015, as published by the Maternal Mortality Estimation Inter-agency Group (MMEIG), composed of WHO, UNICEF, the United Nations Population Fund (UNFPA), The World Bank, and the United Nations Population Division, together with independent technical experts. To derive these estimates, the inter-agency group used a dual approach: making adjustments to correct misclassification and underreporting in existing estimates of maternal mortality from civil registration systems, and using a model to generate estimates for countries without reliable national-level estimates of maternal mortality. These ‘adjusted’ estimates should not be compared with previous inter-agency estimates. The full report – with complete country and regional estimates for the years 1990, 1995, 2000, 2005, 2010 and 2015, in addition to details on the methodology – can be found at <data.unicef.org/maternal-health/maternal-mortality.html>.
Demand for family planning satisfied with modern methods: This indicator has been added to replace contraceptive prevalence.
TABLE 8. CHILD PROTECTION Birth Registration: Changes in the definition of birth registration were made from the second and third rounds of MICS (MICS2 and MICS3) to the fourth round (MICS4). In order to allow for comparability with later rounds, data from MICS2 and MICS3 on birth registration were recalculated according to the MICS4 indicator definition. Therefore, the recalculated data presented here may differ from estimates included in MICS2 and MICS3 national reports.
Child labour: The prevalence rates of child labour presented in the table vary widely across countries due to significant differences in survey methodology, questionnaire content, national definitions and thresholds used to establish child labour prevalence. Only a limited number of countries have produced child labour prevalence data based on international

STATISTICAL TABLES 153
standards and classifications. Data from the fourth round of MICS (MICS4, 2009–2012) included in the table have been recalculated according to the indicator definition used in MICS3 surveys, to ensure cross-country comparability. In this definition, the activities of fetching water or collecting firewood are classified as household chores rather than as an economic activity. Under this approach, a child aged 5–14 would have to be engaged in fetching water or collecting firewood for at least 28 hours per week to be considered as a child labourer.
Female genital mutilation/cutting (FGM/C): Data on the prevalence of FGM/C among girls aged 0–14 were recalculated for technical reasons and may differ from that presented in original DHS and MICS country reports. For further details, refer to Female Genital Mutilation/Cutting: A statistical overview and exploration of the dynamics of change, UNICEF, New York, 2013. Regional estimates on the prevalence of FGM/C and attitudes towards the practice are based on available data from only practising countries with nationally representative data and therefore reflect the situation among those living in these affected countries within the region, and not the region as a whole, as there are some non-practising countries in each region as well.
Violent discipline: Estimates used in UNICEF publications and in MICS country reports prior to 2010 were calculated using household weights that did not take into account the last-stage selection of children for the administration of the child discipline module in MICS surveys. (A random selection of one child aged 2–14 is undertaken for the administration of the child discipline module.) In January 2010, it was decided that more accurate estimates are produced by using a household weight that takes the last-stage selection into
account. MICS3 data were recalculated using this approach.
TABLE 12. EARLY CHILDHOOD DEVELOPMENTFather’s support for learning: Data from the third and fourth rounds of MICS (MICS3 and MICS4) refer to father’s engagement in one or more activities to promote learning and school readiness, while the definition was changed in the fifth round (MICS5) to reflect father’s engagement in four or more activities. Therefore, estimates of father’s support for learning from MICS3 and MICS4 are lower than those based on MICS5 results.
Children with inadequate supervision: This indicator was previously referred to as ‘children left in inadequate care’ but has been renamed to more accurately reflect the nature of the underlying construct.
TABLE 13. ECONOMIC INDICATORSNational monetary child poverty has been added in 2016 and 2017 to reflect Sustainable Development Goal 1, Target 1.2 that includes an explicit commitment to reduce poverty among children. This indicator measures “the percentage of children aged 0-17 years old living in households that have income or consumption level below the government defined national poverty threshold”. Data come from official government sources such as Statistical Office tabulations, national household survey and poverty reports and from regional databases such as Eurostat. Note that the methodology used to calculate national poverty prevalence varies by country. For instance, some countries using income and others consumption, some applying an absolute poverty line and others a relative poverty threshold. Therefore, national child poverty rates should be used to monitor progress, but should not be used to compare or rank countries.

UNICEF – THE STATE OF THE WORLD’S CHILDREN 2017
Countries and areas
Under-5 mortality
rank
Under-5 mortality rate
Under-5 mortality rate by
sex2016
Infant mortality rate
(under 1)
Neonatal mortality
rate
Total population (thousands)
Annual number of births
(thousands)
Annual number
of under-5 deaths
(thousands)
Life expectancy at birth (years)
Total adult literacy rate
(%)
Primary school net enrolment
ratio (%)
1990 2016 male female 1990 2016 2016 2016 2016 2016 2016 2011−2016* 2011−2016*
Afghanistan 25 177 70 74 66 120 53 40 34,656 1,143 80 64 32 –Albania 114 40 14 15 12 35 12 6 2,926 35 0 78 97 96Algeria 78 49 25 27 24 41 22 16 40,606 949 24 76 75 x 97Andorra 179 9 3 3 3 7 2 1 77 – 0 – 100 –Angola 17 221 83 88 76 131 55 29 28,813 1,181 96 62 66 84Anguilla – – – – – – – – 15 – – – – –Antigua and Barbuda 133 26 9 9 8 25 5 4 101 2 0 76 99 x 87Argentina 126 29 11 12 10 26 10 6 43,847 754 8 77 98 99Armenia 118 50 13 15 12 42 12 7 2,925 40 1 75 100 96Australia 164 9 4 4 3 8 3 2 24,126 311 1 83 – 97Austria 164 10 4 4 3 8 3 2 8,712 83 0 82 – –Azerbaijan 68 95 31 34 28 75 27 18 9,725 176 5 72 100 94Bahamas 126 24 11 11 10 20 9 6 391 6 0 76 – 98 xBahrain 142 23 8 8 7 20 7 3 1,425 21 0 77 95 x 96Bangladesh 62 144 34 37 32 100 28 20 162,952 3,110 106 72 73 91 xBarbados 123 18 12 13 11 16 11 8 285 3 0 76 – 91Belarus 164 15 4 4 3 12 3 2 9,480 114 0 73 100 x 95Belgium 164 10 4 4 4 8 3 2 11,358 129 1 81 – 99Belize 106 39 15 16 13 32 13 10 367 8 0 70 – 96Benin 7 178 98 102 93 107 63 31 10,872 397 38 61 33 96Bhutan 66 128 32 36 29 90 27 18 798 15 0 70 57 86Bolivia (Plurinational State of) 58 124 37 40 33 85 30 19 10,888 253 9 69 92 88Bosnia and Herzegovina 153 18 6 7 5 16 5 5 3,517 33 0 77 97 –Botswana 56 54 41 44 37 42 33 26 2,250 53 2 67 81 x 91Brazil 106 64 15 16 14 53 14 8 207,653 2,966 45 76 92 93British Virgin Islands – – – – – – – – 31 – – – – –Brunei Darussalam 131 13 10 11 9 10 9 4 423 7 0 77 96 –Bulgaria 142 18 8 8 7 15 7 4 7,131 67 1 75 98 93Burkina Faso 16 199 85 89 80 99 53 26 18,646 716 60 60 35 69Burundi 23 170 72 77 66 103 48 24 10,524 437 31 57 62 94Cabo Verde 85 63 21 23 19 48 18 10 540 11 0 73 87 97Cambodia 68 116 31 34 27 85 26 16 15,762 368 11 69 74 x 95Cameroon 19 143 80 85 74 89 53 24 23,439 842 66 58 71 x 92Canada 157 8 5 5 5 7 4 3 36,290 387 2 82 – 99Central African Republic 3 174 124 130 117 114 89 42 4,595 166 20 52 37 x 71Chad 2 211 127 133 121 111 75 35 14,453 615 77 53 22 79Chile 142 19 8 9 8 16 7 5 17,910 239 2 80 96 94China 131 54 10 11 9 42 9 5 1,403,500 17,035 168 76 95 x –Colombia 106 35 15 17 14 29 13 9 48,653 746 11 74 94 91Comoros 22 126 73 78 68 88 55 33 796 26 2 64 49 79Congo 40 91 54 58 49 59 39 21 5,126 176 9 65 79 91Cook Islands 142 24 8 9 7 21 7 4 17 – 0 – – 95Costa Rica 133 17 9 10 8 14 8 6 4,857 70 1 80 97 96Côte d'Ivoire 10 151 92 101 82 104 66 37 23,696 858 78 54 44 79Croatia 157 13 5 5 4 11 4 3 4,213 39 0 78 99 89Cuba 153 13 6 6 5 11 4 2 11,476 125 1 80 100 92Cyprus 179 11 3 3 2 10 2 1 1,170 13 0 81 99 97Czechia 179 12 3 4 3 10 3 2 10,611 109 0 79 – –Democratic People's Republic of Korea 88 43 20 22 18 33 15 11 25,369 350 7 72 – 94 x
Democratic Republic of the Congo 8 184 94 101 87 118 72 29 78,736 3,269 304 60 77 35 xDenmark 164 9 4 5 4 7 4 3 5,712 59 0 81 – 98Djibouti 31 118 64 70 58 91 54 33 942 22 1 62 – 53Dominica 62 17 34 36 31 14 31 24 74 – 0 – – 93 xDominican Republic 68 60 31 34 28 46 26 21 10,649 216 7 74 92 87Ecuador 85 57 21 23 18 44 18 11 16,385 331 7 76 94 92Egypt 81 86 23 24 22 63 19 13 95,689 2,541 57 71 75 98El Salvador 106 60 15 17 13 46 13 8 6,345 118 2 74 88 91Equatorial Guinea 11 191 91 97 84 129 66 32 1,221 41 4 58 88 x 56Eritrea 51 151 45 49 39 93 33 18 4,955 160 7 65 65 x 39Estonia 179 18 3 3 3 14 2 1 1,312 14 0 78 100 95Ethiopia 35 203 58 64 53 121 41 28 102,403 3,230 187 65 39 x 86Fiji 82 28 22 24 20 24 19 9 899 18 0 70 – 98
Finland 192 7 2 3 2 6 2 1 5,503 59 0 81 – 100
TABLE 1. BASIC INDICATORS
155
Countries and areas
Under-5 mortality
rank
Under-5 mortality rate
Under-5 mortality rate by
sex2016
Infant mortality rate
(under 1)
Neonatal mortality
rate
Total population (thousands)
Annual number of births
(thousands)
Annual number
of under-5 deaths
(thousands)
Life expectancy at birth (years)
Total adult literacy rate
(%)
Primary school net enrolment
ratio (%)
1990 2016 male female 1990 2016 2016 2016 2016 2016 2016 2011−2016* 2011−2016*
France 164 9 4 4 4 7 3 2 64,721 766 3 83 – 99Gabon 48 92 47 52 43 60 34 22 1,980 58 3 66 82 –Gambia 29 168 65 70 61 82 42 28 2,039 79 5 61 42 75Georgia 126 47 11 12 9 40 10 7 3,925 55 1 73 100 99Germany 164 9 4 4 4 7 3 2 81,915 711 3 81 – 99Ghana 34 127 59 64 53 80 41 27 28,207 870 51 63 71 x 87Greece 164 11 4 4 4 9 3 2 11,184 94 0 81 97 96Grenada 100 22 16 17 15 18 14 8 107 2 0 74 – 96Guatemala 72 82 29 31 26 60 24 14 16,582 417 12 73 81 85Guinea 14 235 89 94 84 139 58 25 12,396 442 39 60 32 76Guinea-Bissau 15 219 88 96 80 130 58 38 1,816 66 6 57 46 68 xGuyana 66 60 32 37 28 46 27 20 773 16 1 67 86 81Haiti 27 145 67 73 61 100 51 25 10,847 263 17 63 49 x –Holy See – – – – – – – – 1 – – – – –Honduras 92 58 19 21 17 45 16 10 9,113 198 4 74 89 93Hungary 157 17 5 6 5 15 4 3 9,753 88 0 76 – 91
Iceland 192 6 2 2 2 5 2 1 332 4 0 83 – 99
India 53 126 43 42 44 88 35 25 1,324,171 25,244 1,081 69 69 92Indonesia 76 84 26 29 23 62 22 14 261,115 4,991 131 69 95 90Iran (Islamic Republic of) 106 57 15 16 15 44 13 10 80,277 1,355 20 76 85 99Iraq 68 54 31 34 28 42 26 18 37,203 1,212 38 70 44 92 xIreland 164 9 4 4 3 8 3 2 4,726 69 0 81 – 95Israel 164 12 4 4 3 10 3 2 8,192 167 1 83 – 97Italy 179 10 3 4 3 8 3 2 59,430 495 2 83 99 97Jamaica 106 30 15 17 13 25 13 11 2,881 48 1 76 80 x 92 xJapan 179 6 3 3 3 5 2 1 127,749 1,053 3 84 – 100Jordan 95 37 18 19 17 30 15 11 9,456 243 4 74 98 89Kazakhstan 126 52 11 13 10 44 10 6 17,988 385 4 70 100 x 87Kenya 47 98 49 53 45 63 36 23 48,462 1,504 74 67 79 85Kiribati 40 96 54 59 49 69 42 23 114 3 0 66 – 95Kuwait 142 18 8 9 8 15 7 4 4,053 65 1 75 96 93Kyrgyzstan 85 65 21 24 19 54 19 12 5,956 152 3 71 99 x 89Lao People's Democratic Republic 31 162 64 70 58 111 49 29 6,758 163 10 67 58 93Latvia 157 17 5 5 4 13 4 2 1,971 20 0 75 100 96Lebanon 142 33 8 8 8 27 7 5 6,007 86 1 80 91 x 82Lesotho 8 91 94 101 86 73 72 39 2,204 61 6 54 77 80Liberia 27 258 67 72 62 172 51 23 4,614 157 10 63 43 x 38Libya 118 42 13 14 12 36 11 7 6,293 127 2 72 – –Liechtenstein – – – – – – – – 38 – – – – 94Lithuania 157 15 5 6 5 12 4 3 2,908 31 0 75 100 98Luxembourg 192 9 2 3 2 7 2 2 576 6 0 82 – 93Madagascar 50 160 46 51 42 97 34 19 24,895 812 37 66 72 77 xMalawi 38 232 55 60 50 137 39 23 18,092 653 36 63 62 97 xMalaysia 142 17 8 9 8 14 7 4 31,187 524 4 75 93 x 98Maldives 133 94 9 9 8 68 7 5 428 8 0 77 99 95Mali 5 254 111 115 105 130 68 36 17,995 758 82 58 33 56Malta 151 11 7 7 6 10 6 5 429 4 0 81 93 98Marshall Islands 59 51 35 39 31 40 29 16 53 – 0 – 98 77Mauritania 18 117 81 88 74 71 54 34 4,301 145 12 63 46 x 79Mauritius 114 23 14 15 12 20 12 8 1,262 13 0 75 93 96Mexico 106 46 15 16 13 37 13 8 127,540 2,330 34 77 94 95Micronesia (Federated States of) 65 55 33 37 30 43 28 17 105 2 0 69 – 84Monaco 179 8 3 4 3 6 3 2 38 – 0 – – –Mongolia 95 109 18 21 14 77 15 10 3,027 73 1 69 98 x 97Montenegro 164 17 4 4 4 15 4 2 629 7 0 77 98 93Montserrat – – – – – – – – 5 – – – – 92 xMorocco 74 80 27 30 24 63 23 18 35,277 709 19 76 69 98Mozambique 24 248 71 76 67 165 53 27 28,829 1,105 78 58 51 x 89Myanmar 44 116 51 55 46 82 40 25 52,885 944 48 67 76 95Namibia 51 71 45 49 41 48 32 18 2,480 72 3 64 88 90Nauru 59 58 35 38 31 45 29 22 11 – 0 – – 86Nepal 59 141 35 37 32 98 28 21 28,983 573 20 70 60 97Netherlands 164 8 4 4 3 7 3 3 16,987 179 1 82 – 98New Zealand 157 11 5 6 5 9 5 3 4,661 62 0 82 – 99
TABLE 1. BASIC INDICATORS

UNICEF – THE STATE OF THE WORLD’S CHILDREN 2017
Countries and areas
Under-5 mortality
rank
Under-5 mortality rate
Under-5 mortality rate by
sex2016
Infant mortality rate
(under 1)
Neonatal mortality
rate
Total population (thousands)
Annual number of births
(thousands)
Annual number
of under-5 deaths
(thousands)
Life expectancy at birth (years)
Total adult literacy rate
(%)
Primary school net enrolment
ratio (%)
1990 2016 male female 1990 2016 2016 2016 2016 2016 2016 2011−2016* 2011−2016*
Nicaragua 88 68 20 22 17 51 17 9 6,150 121 2 75 78 x 97 xNiger 11 329 91 95 87 133 51 26 20,673 967 86 60 15 62Nigeria 6 213 104 110 98 126 67 34 185,990 7,141 733 53 51 x 64 xNiue 82 14 22 25 20 12 19 12 2 – 0 – – –Norway 179 9 3 3 2 7 2 2 5,255 62 0 82 – 100Oman 126 39 11 12 10 32 9 5 4,425 81 1 77 93 95Pakistan 20 139 79 82 75 106 64 46 193,203 5,439 424 66 57 74Palau 100 36 16 18 14 31 14 8 22 – 0 – 97 80Panama 100 31 16 18 15 26 14 10 4,034 79 1 78 94 x 93Papua New Guinea 40 88 54 59 50 64 42 24 8,085 221 12 66 57 x 86Paraguay 88 47 20 22 18 37 17 11 6,725 140 3 73 95 89Peru 106 80 15 17 14 57 12 8 31,774 615 9 75 94 94Philippines 74 58 27 30 24 41 22 13 103,320 2,386 64 69 96 96Poland 157 17 5 5 4 15 4 3 38,224 365 2 78 – 96Portugal 164 15 4 4 3 12 3 2 10,372 83 0 81 94 98Qatar 133 21 9 9 8 18 7 4 2,570 25 0 78 98 92Republic of Korea 179 16 3 4 3 14 3 2 50,792 449 2 82 – 98Republic of Moldova 100 33 16 18 14 27 14 12 4,060 43 1 72 99 87Romania 133 31 9 10 8 25 8 4 19,778 192 2 75 99 87Russian Federation 142 22 8 9 7 18 7 3 143,965 1,852 14 71 100 x 97Rwanda 57 151 39 42 35 93 29 17 11,918 370 14 67 68 95Saint Kitts and Nevis 133 32 9 10 8 26 8 6 55 – 0 – – 78Saint Lucia 118 21 13 15 12 18 12 9 178 2 0 75 – 93 xSaint Vincent and the Grenadines 98 24 17 18 15 20 15 10 110 2 0 73 – 94Samoa 98 31 17 19 16 26 15 9 195 5 0 75 99 96San Marino 179 11 3 3 3 10 3 1 33 – 0 – – 93Sao Tome and Principe 62 105 34 37 30 67 26 15 200 7 0 67 90 95Saudi Arabia 118 45 13 14 12 36 11 7 32,276 626 8 75 94 98Senegal 48 140 47 51 43 72 34 21 15,412 542 25 67 43 71Serbia 153 28 6 6 5 24 5 4 8,820 94 1 75 99 96Seychelles 114 17 14 16 13 14 12 9 94 2 0 74 94 x 95Sierra Leone 4 262 114 120 106 156 83 33 7,396 258 29 52 32 99Singapore 179 8 3 3 3 6 2 1 5,622 50 0 83 97 –Slovakia 153 15 6 6 5 13 5 3 5,444 57 0 77 – –Slovenia 192 10 2 3 2 9 2 1 2,078 21 0 81 – 98Solomon Islands 76 38 26 28 23 31 22 10 599 17 0 71 77 71Somalia 1 181 133 139 126 109 83 39 14,318 609 79 56 – –South Africa 53 57 43 48 39 45 34 12 56,015 1,176 51 63 94 83 xSouth Sudan 11 256 91 96 85 152 59 38 12,231 431 38 57 27 x 31Spain 179 9 3 4 3 7 3 2 46,348 415 1 83 98 99Sri Lanka 133 21 9 10 9 18 8 5 20,798 323 3 75 91 x 99State of Palestine 92 45 19 21 18 36 17 11 4,791 150 3 73 97 90Sudan 29 131 65 70 60 82 45 29 39,579 1,290 83 64 54 54Suriname 88 46 20 22 18 40 18 11 558 10 0 71 93 93Swaziland 25 66 70 76 65 50 52 21 1,343 39 3 58 83 x 80Sweden 179 7 3 3 3 6 2 2 9,838 119 0 82 – 99Switzerland 164 8 4 4 4 7 4 3 8,402 86 0 83 – 93Syrian Arab Republic 95 37 18 19 16 30 14 9 18,430 427 7 70 81 x 67Tajikistan 53 107 43 48 38 84 37 20 8,735 251 11 71 99 x 98Thailand 123 38 12 14 11 31 11 7 68,864 726 9 75 93 91The former Yugoslav Republic of Macedonia 123 37 12 13 11 34 11 8 2,081 23 0 76 96 x 91
Timor-Leste 46 175 50 54 46 132 42 22 1,269 44 2 69 58 x 96Togo 21 145 76 82 70 89 51 26 7,606 256 19 60 64 95Tokelau – – – – – – – – 1 – – – – –Tonga 100 22 16 15 18 19 14 7 107 3 0 73 99 88Trinidad and Tobago 92 30 19 20 17 26 17 13 1,365 19 0 71 – 95 xTunisia 114 57 14 15 12 44 12 8 11,403 210 3 76 79 99Turkey 118 74 13 13 12 56 11 7 79,512 1,294 16 76 96 94Turkmenistan 44 86 51 60 42 70 43 22 5,663 144 7 68 – –Turks and Caicos Islands – – – – – – – – 35 – – – – –Tuvalu 78 57 25 28 23 44 21 17 11 – 0 – – 84Uganda 43 175 53 58 48 104 38 21 41,488 1,715 90 60 70 94Ukraine 133 19 9 10 8 17 8 5 44,439 479 4 72 100 96
TABLE 1. BASIC INDICATORS

157
Countries and areas
Under-5 mortality
rank
Under-5 mortality rate
Under-5 mortality rate by
sex2016
Infant mortality rate
(under 1)
Neonatal mortality
rate
Total population (thousands)
Annual number of births
(thousands)
Annual number
of under-5 deaths
(thousands)
Life expectancy at birth (years)
Total adult literacy rate
(%)
Primary school net enrolment
ratio (%)
1990 2016 male female 1990 2016 2016 2016 2016 2016 2016 2011−2016* 2011−2016*
United Arab Emirates 142 17 8 9 7 14 7 4 9,270 92 1 77 90 x 93United Kingdom 164 9 4 5 4 8 4 3 65,789 805 3 82 – 100United Republic of Tanzania 36 179 57 60 53 108 40 22 55,572 2,087 117 66 78 80United States 151 11 7 7 6 9 6 4 322,180 4,003 26 79 – 94Uruguay 133 23 9 10 8 21 8 5 3,444 49 0 77 99 94Uzbekistan 80 72 24 27 21 59 21 14 31,447 663 16 71 100 95Vanuatu 73 36 28 30 25 29 23 12 270 7 0 72 74 x 86Venezuela (Bolivarian Republic of) 100 30 16 18 15 25 14 10 31,568 602 10 75 97 90Viet Nam 82 51 22 25 18 37 17 12 94,569 1,582 34 76 94 x 98Yemen 38 126 55 59 51 88 43 27 27,584 867 48 65 – 85Zambia 33 182 63 68 58 110 44 23 16,591 620 39 62 83 x 87Zimbabwe 37 75 56 62 51 50 40 23 16,150 535 30 61 89 86
SUMMARYEast Asia and the Pacific – 57 16 18 15 43 14 8 2,291,492 31,393 510 75 – 94 **Europe and Central Asia – 31 10 11 9 25 8 5 908,161 11,087 107 77 – 96
Eastern Europe and Central Asia – 47 14 16 13 38 13 7 416,914 6,139 88 73 98 94Western Europe – 11 4 4 4 9 3 2 491,247 4,948 19 81 – 98
Latin America and the Caribbean – 55 18 19 16 44 15 9 633,773 10,749 187 76 94 93Middle East and North Africa – 66 24 26 22 50 20 14 435,225 9,953 237 74 78 94North America – 11 6 7 6 9 6 4 358,469 4,389 28 80 – 94South Asia – 129 48 48 48 92 39 28 1,765,989 35,853 1,713 69 68 90Sub-Saharan Africa – 181 78 84 73 108 53 28 1,034,153 37,038 2,860 60 65 80
Eastern and Southern Africa – 164 61 66 56 101 43 25 542,206 18,203 1,104 63 75 82West and Central Africa – 199 95 101 89 116 63 31 491,947 18,835 1,756 57 – –
Least developed countries – 176 68 73 63 109 48 26 979,388 31,163 2,101 64 63 81World – 93 41 43 39 65 31 19 7,427,263 140,462 5,642 72 78 90 **
For a complete list of countries and areas in the regions, subregions and country categories, see page 150 or visit <data.unicef.org/regionalclassifications>.It is not advisable to compare data from consecutive editions of The State of the World’s Children.
TABLE 1. BASIC INDICATORS
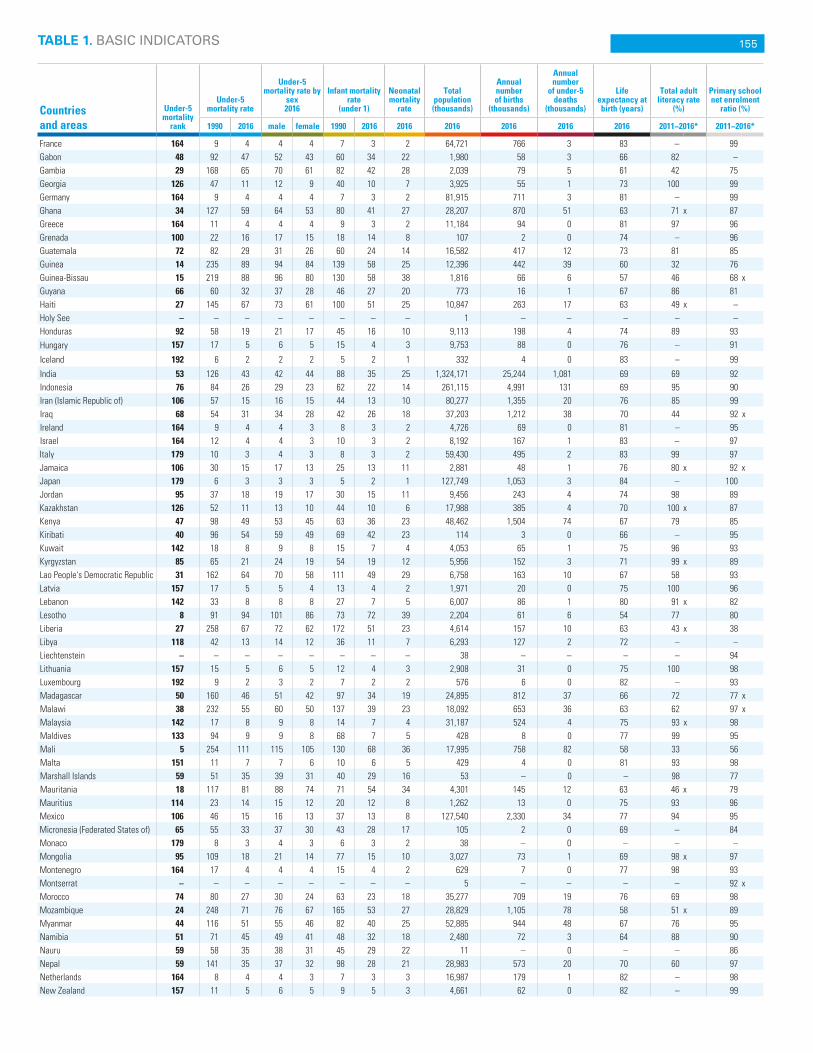
Under-5 mortality rate – Probability of dying between birth and exactly 5 years of age, expressed per 1,000 live births.Infant mortality rate – Probability of dying between birth and exactly 1 year of age, expressed per 1,000 live births.Neonatal mortality rate – Probability of dying during the first 28 days of life, expressed per 1,000 live births.Life expectancy at birth – Number of years newborn children would live if subject to the mortality risks prevailing for the cross section of population at the time of their birth.Total adult literacy rate – Percentage of population aged 15 years and over who can both read and write with understanding a short simple statement on his/her everyday life.
Primary school net enrolment ratio – Number of children enrolled in primary or secondary school who are of official primary school age, expressed as a percentage of the total number of children of official primary school age. Because of the inclusion of primary-school-aged children enrolled in secondary school, this indicator can also be referred to as a primary adjusted net enrolment ratio.
Under-5, infant and neonatal mortality rates – United Nations Inter-agency Group for Child Mortality Estimation (UNICEF, World Health Organization, United Nations Population Division and the World Bank).Total population and births – United Nations Population Division.Under-five deaths – United Nations Inter-agency Group for Child Mortality
Estimation (UNICEF, World Health Organization, United Nations Population Division and the World Bank).Life expectancy at birth – United Nations Population Division.Total adult literacy rate and primary school enrolment ratio – UNESCO Institute for Statistics (UIS).
– Data not available.x Data refer to years or periods other
than those specified in the column heading. Such data are not included in the calculation of regional and global averages, with the exception of 2005–2006 data from India. Estimates from data years prior to 2000 are not displayed.
* Data refer to the most recent year available during the period specified in the column heading.
** Excludes China.
NOTES
DEFINITIONS OF THE INDICATORS MAIN DATA SOURCES

UNICEF – THE STATE OF THE WORLD’S CHILDREN 2017
TABLE 2. NUTRITION
Countries and areas
Low birthweight
(%)U
Early initiation of breast- feeding
(%)
Exclusive breast- feeding
<6 months (%)
Introduction to solid,
semi-solid or soft foods 6–8
months (%)
Minimum acceptable
diet 6–23 months
(%)
Breast- feeding at age 2
(%)
Stunting(%)
Overweight (%)
Wasting (%) Vitamin A
supplementa-tion, full
coverageΔ (%)
Households consuming salt
with iodine(%)
moderate & severeθ
moderate & severeθ
moderate & severeθ severeθ
2011–2016* 2011–2016* 2011–2016* 2015 2011–2016*
Afghanistan – 41 43 61 16 59 41 5 10 4 98 α 57 SAlbania – 43 x 39 x 78 x – 31 x 23 x 23 x 9 x 6 x – 91 x,SAlgeria 6 x 36 26 28 – 27 12 12 4 1 – 81 SAndorra – – – – – – – – – – – –Angola 12 x 48 38 – 13 42 38 3 5 1 14 α 82 SAnguilla – – – – – – – – – – – –Antigua and Barbuda 6 – – – – – – – – – – –Argentina 7 53 33 93 – 29 8 x 10 x 1 x 0 x – –Armenia 8 x 41 45 90 24 22 9 14 4 2 – 99 SAustralia 6 x – – – – – 2 x 8 x 0 x 0 x – –Austria 7 – – – – – – – – – – –Azerbaijan 10 x 20 12 77 22 16 x 18 13 3 1 96 α,w 94 yb
Bahamas 12 – – – – – – – – – – –Bahrain 10 – – – – – – – – – – –Bangladesh 22 x 51 55 65 23 87 36 1 14 3 99 α 69 ya
Barbados 12 40 20 p – – – 8 12 7 2 – 37 SBelarus 5 53 19 64 – 12 5 x 10 x 2 x 1 x – –Belgium 7 x – – – – – – – – – – –Belize 11 68 33 79 – 35 15 7 2 1 – 85Benin 15 x 47 41 73 14 46 34 2 5 1 95 α 69Bhutan 10 x 78 51 87 – 61 34 x 8 x 6 x 2 x – α –Bolivia (Plurinational State of) 6 x 78 64 83 x – 40 x 18 9 x 2 1 – α 85 x,SBosnia and Herzegovina 5 42 19 71 – 12 9 17 2 2 – –Botswana 13 x 40 x 20 x – – 6 x 31 x 11 x 7 x 3 x 57 α 83 x,SBrazil 9 43 x 39 x 94 x – 26 x 7 x 7 x 2 x 0 x – 98 x,SBritish Virgin Islands – – – – – – – – – – – –Brunei Darussalam 12 – – – – – 20 x 8 x 3 x 0 x – –Bulgaria 9 – – – – – 9 x 14 x 3 x 1 x – 92 ya
Burkina Faso 14 x 42 50 59 3 80 27 1 8 1 99 α 92 x,SBurundi 13 x 74 x 83 70 x 10 81 56 1 5 1 71 α 87 x,SCabo Verde 6 x 73 x 60 x – – 13 x – – – – – –Cambodia 11 x 63 65 82 30 37 32 2 10 2 63 α 68 SCameroon 11 x 31 28 83 17 19 32 7 5 1 99 α 86 SCanada 6 – – – – – – 10 x – – – –Central African Republic 14 x 44 x 34 x 59 x – 32 x 41 2 7 2 x 3 α 77 SChad 20 x 23 0 59 6 65 40 3 13 4 85 α 77 SChile 6 – – – – – 2 9 0 – – –China – 41 x 21 60 x – 9 x 8 7 x 2 1 x – 96 yb
Colombia 10 57 x 43 x 86 x 60 x 33 x 13 x 5 x 1 x 0 x – –Comoros 25 x 34 12 81 6 57 32 11 11 4 12 α 82 SCongo 13 x 25 33 84 6 11 21 6 8 3 99 α 90 SCook Islands – – – – – – – – – – – –Costa Rica 7 60 33 86 – 28 6 x 8 x 1 x – – –Côte d'Ivoire 17 x 31 12 64 5 38 30 3 8 2 72 α 82 SCroatia 5 – – – – – – – – – – –Cuba 5 48 33 91 56 24 7 x – 2 x – – –Cyprus 12 x – – – – – – – – – – –Czechia 8 – – – – – 3 x 4 x 5 x 1 x – –Democratic People's Republic of Korea 6 x 28 69 66 – 22 28 0 x 4 1 99 α –
Democratic Republic of the Congo 10 x 52 48 79 8 66 43 4 8 3 94 α 82 SDenmark 5 – – – – – – – – – – –Djibouti 10 x 55 x 1 x 35 x – 18 x 34 8 22 9 72 α 4 x,SDominica 11 – – – – – – – – – – –Dominican Republic 11 x 38 5 81 45 12 7 8 2 1 – 30 x,SEcuador 9 55 40 x 74 – 19 25 8 2 1 – –Egypt 13 x 27 40 77 23 20 22 16 10 5 – α 93 yb
El Salvador 9 42 47 90 67 57 14 6 2 0 – –Equatorial Guinea 13 x 21 7 76 11 5 26 10 3 2 – α 57 x,SEritrea 14 x 93 x 69 x 40 x – 73 x 50 x 2 x 15 x 4 x 51 α 72 x,SEstonia 5 – – – – – – – – – – –Ethiopia 20 x 73 58 60 7 76 38 3 10 3 74 α 86 SFiji 10 x 57 x 40 x – – – 8 x 5 x 6 x 2 x – –Finland 4 – – – – – – – – – – –

159TABLE 2. NUTRITION
Countries and areas
Low birthweight
(%)U
Early initiation of breast- feeding
(%)
Exclusive breast- feeding
<6 months (%)
Introduction to solid,
semi-solid or soft foods 6–8
months (%)
Minimum acceptable
diet 6–23 months
(%)
Breast- feeding at age 2
(%)
Stunting(%)
Overweight (%)
Wasting (%) Vitamin A
supplementa-tion, full
coverageΔ (%)
Households consuming salt
with iodine(%)
moderate & severeθ
moderate & severeθ
moderate & severeθ severeθ
2011–2016* 2011–2016* 2011–2016* 2015 2011–2016*
France 7 – – – – – – – – – – –Gabon 14 x 32 6 82 5 4 18 8 3 1 – α 90 SGambia 10 x 52 47 47 8 42 25 3 11 4 27 α 69 SGeorgia 7 69 55 x 85 x – 17 x 11 x 20 x 2 x 1 x – –Germany 7 – – – – – 1 x 4 x 1 x 0 x – –Ghana 11 56 52 73 13 50 19 3 5 1 28 α 57 SGreece 10 – – – – – – – – – – –Grenada 9 – – – – – – – – – – –Guatemala 11 x 63 53 – 52 57 47 5 1 0 15 α –Guinea 12 x 17 21 43 4 66 31 4 10 4 69 α 61 SGuinea-Bissau 11 x 34 53 71 8 51 28 2 6 1 87 α 26 SGuyana 14 x 49 23 81 40 41 12 5 6 2 – 43 SHaiti 23 47 40 87 14 31 22 4 5 1 21 α 16 SHoly See – – – – – – – – – – – –Honduras 10 64 31 70 54 43 23 5 1 0 – α –Hungary 9 – – – – – – – – – – –Iceland 4 – – – – – – – – – – –India 28 x 42 55 52 10 67 38 2 x 21 8 53 α 93 ya
Indonesia 9 x 49 42 91 37 55 36 12 14 7 82 α 92 yb
Iran (Islamic Republic of) 8 69 53 76 – 51 7 – 4 1 – –Iraq 13 43 20 36 – 23 23 12 7 4 – 55 SIreland 5 – – – – – – – – – – –Israel 8 – – – – – – – – – – –Italy 7 x – – – – – – – – – – –Jamaica 11 65 24 55 – 31 6 9 4 1 x – –Japan 10 – – – – – 7 x 2 x 2 x 0 x – –Jordan 13 x 19 23 92 33 13 8 5 2 1 – 88 x, yb
Kazakhstan 6 83 38 67 45 21 8 9 3 1 – α 94 SKenya 8 x 62 61 80 22 53 26 4 4 1 37 α 95 SKiribati 8 – 69 x – – 82 x – – – – – α –Kuwait 8 – – – – – 5 6 3 1 – –Kyrgyzstan 6 83 41 85 36 23 13 7 3 1 – α 99 SLao People's Democratic Republic 15 39 40 52 – 40 44 2 6 2 88 α 80 SLatvia 5 – – – – – – – – – – –Lebanon 12 x 41 x 27 x – – 11 x 17 x 17 x 7 x 3 x – 95 x,SLesotho 11 x 65 67 83 11 30 33 7 3 1 – α 85 SLiberia 14 x 61 55 46 4 44 32 3 6 2 61 α 91 SLibya – – – – – – 21 x 22 x 7 x 3 x – –Liechtenstein – – – – – – – – – – – –Lithuania 5 – – – – – – – – – – –Luxembourg 7 – – – – – – – – – – –Madagascar 16 x 66 42 90 – 83 49 x 6 x 15 x 6 x 97 α 68 x,SMalawi 14 x 76 61 89 8 72 37 5 3 1 16 α 78 SMalaysia 11 – – – – – 18 7 8 – – –Maldives 11 x 64 x 48 x 91 x – 68 x 20 x 7 x 10 x 3 x 79 α –Mali 18 x 53 33 42 3 53 30 2 14 3 88 α 81 x,SMalta 7 – – – – – – – – – – –Marshall Islands 18 x 73 x 31 x – – 53 x – – – – – α –Mauritania 35 62 41 66 – 40 28 1 15 4 83 α 24 SMauritius 14 x – 21 x – – – – – – – – –Mexico 9 51 31 82 53 24 12 5 1 0 – α –Micronesia (Federated States of) 11 x – – – – – – – – – – α –Monaco 6 – – – – – – – – – – –Mongolia 5 x 71 47 95 35 53 11 11 1 0 38 α 80 SMontenegro 5 14 17 95 66 9 9 22 3 1 – –Montserrat – – – – – – – – – – – –Morocco 15 x 30 28 86 x – 25 15 11 2 1 – α –Mozambique 17 69 41 95 11 52 43 8 6 2 99 α 43 SMyanmar 9 x 67 51 75 16 64 29 1 7 1 88 α 81 SNamibia 16 x 71 49 80 13 21 23 4 7 3 – α 74 SNauru 27 x 76 x 67 x – – 65 x 24 x 3 x 1 x 0 x – –Nepal 18 55 66 84 32 89 36 1 10 2 79 α 94 SNetherlands 6 x – – – – – – – – – – –

UNICEF – THE STATE OF THE WORLD’S CHILDREN 2017
TABLE 2. NUTRITION
Countries and areas
Low birthweight
(%)U
Early initiation of breast- feeding
(%)
Exclusive breast- feeding
<6 months (%)
Introduction to solid,
semi-solid or soft foods 6–8
months (%)
Minimum acceptable
diet 6–23 months
(%)
Breast- feeding at age 2
(%)
Stunting(%)
Overweight (%)
Wasting (%) Vitamin A
supplementa-tion, full
coverageΔ (%)
Households consuming salt
with iodine(%)
moderate & severeθ
moderate & severeθ
moderate & severeθ severeθ
2011–2016* 2011–2016* 2011–2016* 2015 2011–2016*
New Zealand 6 – – – – – – – – – – –Nicaragua 8 68 32 – – 43 23 x 6 x 2 x 1 x 3 α –Niger 27 x 53 23 – 6 50 42 3 10 2 99 α 59 SNigeria 15 33 17 67 10 35 33 2 7 2 76 α 93 SNiue – – – – – – – – – – – –Norway 5 x – – – – – – – – – – –Oman 10 71 33 90 – 48 14 4 8 2 – –Pakistan 32 x 18 38 66 15 56 45 5 11 3 98 α 69 ya
Palau 7 x – – – – – – – – – – –Panama 8 47 22 61 – 34 19 x – 1 x 0 x – –Papua New Guinea 11 x – 56 x – – 72 x 50 14 14 7 – α –Paraguay 6 x 47 x 24 x – – 14 x 11 12 3 0 – 93 yb
Peru 7 55 68 78 53 55 y 14 7 1 0 – 90 SPhilippines 21 x 50 34 x 90 x – 41 33 4 7 2 72 α 52 yb
Poland 6 – – – – – – – – – – –Portugal 9 – – – – – – – – – – –Qatar 8 x 34 29 50 – 32 – – – – – –Republic of Korea 4 x – – – – – 3 7 1 0 – –Republic of Moldova 6 61 36 62 – 12 6 5 2 1 – 58 SRomania 8 12 x 16 x – – – 13 x 8 x 4 x 1 x – –Russian Federation 6 – – – – – – – – – – –Rwanda 7 x 81 87 57 19 87 37 8 2 1 96 α 91 SSaint Kitts and Nevis 10 – – – – – – – – – – –Saint Lucia 10 50 – – – – 3 6 4 1 – 75 SSaint Vincent and the Grenadines 11 – – – – – – – – – – –Samoa 10 x 88 x 51 x – – 74 x 5 5 4 1 – 96 SSan Marino 10 – – – – – – – – – – –Sao Tome and Principe 10 x 38 74 74 22 24 17 2 4 1 42 α 91 SSaudi Arabia 9 – – – – – 9 x 6 x 12 x 5 x – –Senegal 19 31 33 63 10 48 17 1 7 1 29 α 57 SSerbia 6 51 13 97 72 9 6 14 4 1 – –Seychelles – – – – – – 8 10 4 1 – –Sierra Leone 11 x 54 32 63 7 48 38 9 9 4 97 α 74 SSingapore 10 – – – – – 4 x 3 x 4 x 1 x – –Slovakia 8 – – – – – – – – – – –Slovenia 6 – – – – – – – – – – –Solomon Islands 13 x 75 x 74 x – – 67 x 32 4 8 3 – –Somalia – 23 x 5 x 16 x – 27 x 25 x 3 x 15 x 5 x 33 α 7 x,SSouth Africa – 61 x 32 – 23 13 27 13 3 1 – α –South Sudan – 48 x 45 x 21 x – 38 x 31 x 6 x 23 x 10 x – α 60 x,SSpain 8 – – – – – – – – – – –Sri Lanka 17 x 80 x 76 x – – 84 x 17 2 15 3 74 α –State of Palestine 9 x 41 39 90 42 12 7 8 1 0 – 88 SSudan – 69 55 51 15 49 38 3 16 5 72 α 34 SSuriname 14 x 45 x 3 x 47 x – 15 x 9 x 4 x 5 x 1 x – –Swaziland 9 x 48 64 90 38 8 26 9 2 0 – α 90 SSweden 5 – – – – – – – – – – –Switzerland 7 – – – – – – – – – – –Syrian Arab Republic 10 x 46 x 43 x – – 25 x 28 x 18 x 12 x 6 x – –Tajikistan 10 x 50 34 49 20 50 27 7 10 4 97 α 84 SThailand 11 x 40 23 85 56 16 11 8 5 1 – 85The former Yugoslav Republic of Macedonia 6 21 23 41 – 13 5 12 2 0 – –
Timor-Leste 12 x 93 62 97 18 39 50 2 11 2 61 α 76 x,STogo 11 x 61 58 67 12 61 28 2 7 2 6 α 77 STokelau – – – – – – – – – – – –Tonga – 79 52 – – 30 8 17 5 2 – –Trinidad and Tobago 12 41 x 13 x 83 x – 22 x 5 x 5 x 5 x 1 x – 53 x,STunisia 7 40 9 27 – 19 10 14 3 2 – –Turkey 11 x 50 30 75 – 34 10 11 2 0 – 85 x,STurkmenistan 5 73 59 82 77 20 12 6 4 1 – α 100 STurks and Caicos Islands – – – – – – – – – – – –Tuvalu 6 x 15 x 35 x – – 51 x 10 x 6 x 3 x 1 x – –Uganda 12 53 66 67 14 43 29 4 4 1 – α 92 S

161TABLE 2. NUTRITION
Low birthweight – Percentage of infants weighing less than 2,500 grams at birth.Early initiation of breastfeeding – Percentage of infants who are put to the breast within one hour of birth.Exclusive breastfeeding <6 months – Percentage of children aged 0–5 months who are fed exclusively with breast milk in the 24 hours prior to the survey.Introduction of solid, semi-solid or soft foods (6–8 months) – Percentage of children aged 6–8 months who received solid, semi-solid or soft foods in the 24 hours prior to the survey.Minimum Acceptable Diet (6–23 months) – Percentage of breastfed children 6–23 months of age who had at least the minimum dietary diversity and the minimum meal frequency during the previous day AND percentage of non-breastfed children 6–23 months of age who received at least 2 milk feedings and had at least the minimum dietary diversity not including milk feeds and the minimum meal frequency during the previous day.Breastfeeding at age 2 – Percentage of children aged 20–23 months who received breast milk in the 24 hours prior to the survey.
Stunting – Moderate and severe: Percentage of children aged 0–59 months who are below minus two standard deviations from median height-for-age of the WHO Child Growth Standards.Overweight – Moderate and severe: Percentage of children aged 0–59 months who are above two standard deviations from median weight-for-height of the WHO Child Growth Standards (includes obesity). Wasting – Moderate and severe: Percentage of children aged 0–59 months who are below minus two standard deviations from median weight-for-height of the WHO Child Growth Standards.Wasting –severe: Percentage of children aged 0–59 months who are below minus three standard deviations from median weight-for-height of the WHO Child Growth Standards.Vitamin A supplementation, full coverage – The estimated percentage of children aged 6–59 months reached with 2 doses of vitamin A supplements approximately 4–6 months apart in a given calendar year.Households consuming salt with iodine– Percentage of households consuming salt with any iodine (>0 ppm).
Low birthweight – Demographic and Health Surveys (DHS), Multiple Indicator Cluster Surveys (MICS), other national household surveys, data from routine reporting systems, UNICEF and WHO.Infant and young child feeding – DHS, MICS, other national household surveys and UNICEF.
Stunting, overweight, wasting and severe wasting – DHS, MICS, other national household surveys, WHO and UNICEF.Vitamin A supplementation – UNICEF.Iodized salt consumption – DHS, MICS, other national household surveys, school-based surveys and UNICEF.
– Data not available.x Data refer to years or periods other than those
specified in the column heading. Such data are not included in the calculation of regional and global averages, with the exception of 2008 data from China for ‘Early initiation of breastfeeding’, ‘Introduction to solids’ and Breastfeeding at age 2’. Estimates from data years prior to 2000 are not displayed.
y Data differ from the standard definition or refer to only part of a country. If they fall within the noted reference period, such data are included in the calculation of regional and global averages. Surveys with a superscript footnote of “a” are mainly DHS surveys awaiting re-analysis to add the households that did not have salt to the estimate. Surveys with a superscript footnote of “b” cannot be confirmed in whether the reported value includes households without salt or not.
p Based on small denominators (typically 25–49 unweighted cases). No data based on fewer than 25 unweighted cases are displayed.
θ Global and regional averages for stunting (moderate and severe), overweight (moderate and severe), wasting (moderate and severe) and wasting (severe) are estimated using statistical modelling data from the UNICEF-WHO-World Bank Group Joint Child Malnutrition Estimates, May 2017 Edition. For more information see <data.unicef.org/malnutrition>. Disaggregations for stunting (moderate and severe) as shown in tables 10 and 11, are population-weight-ed, which means using the most recent estimate for each country with data between 2011 and 2016; therefore disaggregations may not coincide with total estimates at the global and regional level presented in this table.
Δ Full coverage with vitamin A supplements is reported as the lower percentage of 2 annual coverage points (i.e., lower point between semester 1 (January–June) and semester 2 (July–December) of 2015). Data are only presented for VAS priority countries; thus aggregates are only based on and representative of these priority countries.
w Identifies countries with national vitamin A supple-mentation programmes targeted towards a reduced age range. Coverage figure is reported as targeted.
α Identifies countries which are designated ‘priority’. Priority countries for national vitamin A supplemen-tation programmes are identified as those having high under-five mortality rates (over 70 per 1,000 live births), and/or evidence of vitamin A deficiency among this age group, and/or a history of vitamin A supplementation programmes.
U The low birth weight database has not been updated since October 2014. Given that the data are out of date, aggregates for a number of regions and the global value have been suppressed. New methods are currently being applied to generate estimates through an inter-agency process and updates will be available in the next State of the World’s Children Report.
j Estimates for Eastern Europe and Central Asia are based on a model fit for all of Europe and Central Asia. Data were not available for the Russian Federation and were mainly from countries in Eastern Europe and Central Asia.
k Due to consecutive low population coverage for the two most recent time periods of 2008–2012 and 2013–2016, overweight data for South Asia are not presented in SOWC; however, the estimates are available through the Joint Malnutrition Estimates which can be downloaded at <https://data.unicef.org/topic/nutrition/malnutrition/> but should be interpreted with caution.
S Re-analyzed by adjusting the denominator to include households without salt.
* Data refer to the most recent year available during the period specified in the column heading.
** Excludes China.r Excludes the Russian Federation.N Excludes Brazil.
NOTESDEFINITIONS OF THE INDICATORS
MAIN DATA SOURCES
Countries and areas
Low birthweight
(%)U
Early initiation of breast- feeding
(%)
Exclusive breast- feeding
<6 months (%)
Introduction to solid,
semi-solid or soft foods 6–8
months (%)
Minimum acceptable
diet 6–23 months
(%)
Breast- feeding at age 2
(%)
Stunting(%)
Overweight (%)
Wasting (%) Vitamin A
supplementa-tion, full
coverageΔ (%)
Households consuming salt
with iodine(%)
moderate & severeθ
moderate & severeθ
moderate & severeθ severeθ
2011–2016* 2011–2016* 2011–2016* 2015 2011–2016*
Ukraine 5 66 20 43 – 22 4 x 27 x 0 x 4 x – 36 SUnited Arab Emirates 6 x – – – – – – – – – – –United Kingdom 7 – – – – – – – – – – –United Republic of Tanzania 8 x 51 59 92 9 43 34 4 5 1 87 α 76 SUnited States 8 x – 24 – – – 2 6 1 0 – –Uruguay 8 77 – – – – 11 7 1 0 – –Uzbekistan 5 x 67 x 26 x 47 x – 38 x 20 x 13 x 5 x 2 x 98 α 82 x,SVanuatu 10 x 85 73 72 – 49 29 5 4 1 – 33 x,SVenezuela (Bolivarian Republic of) 9 – – – – – 13 x 6 x 4 x – – –Viet Nam 5 27 24 91 59 22 25 5 6 1 97 α,w 61 SYemen 32 x 53 10 69 15 45 47 2 16 5 8 α 49 SZambia 11 x 66 73 82 11 42 40 6 6 3 – α 88 SZimbabwe 11 58 48 91 8 14 27 6 3 1 45 α 93 S
SUMMARYEast Asia and Pacific – 43 28 69 40 ** 23 9 6 3 1 82 91Europe and Central Asia 6 – – – – – – – – – – –
Eastern Europe and Central Asia 6 57 30 69 – 28 r 6 j 13 j 2 j 0 j – –Western Europe 7 – – – – – – – – – – –
Latin America and Caribbean 9 54 38 82 N 51 N 32 11 7 1 0 – –Middle East and North Africa – 40 32 63 – 29 15 11 7 3 – –North America – – 24 – – – 2 8 1 0 – –South Asia – 39 52 56 12 68 36 4 k 16 5 66 88Sub-Saharan Africa – 51 42 71 11 50 34 4 8 2 72 80
Eastern and Southern Africa – 63 55 75 13 53 34 4 7 2 65 78West and Central Africa – 40 29 68 9 47 34 4 9 3 78 81
Least developed countries – 56 49 70 12 62 – – – – 77 72World – 45 40 66 17 45 23 6 8 3 70 86
For a complete list of countries and areas in the regions, subregions and country categories, see page 150 or visit <data.unicef.org/regionalclassifications>.It is not advisable to compare data from consecutive editions of The State of the World’s Children.

UNICEF – THE STATE OF THE WORLD’S CHILDREN 2017
Countries and areas
Use of basic drinking water
services (%)
Use of basic sanitation
services (%)
Immunization coverage (%) Pneumonia Diarrhoea Malaria
BCG DTP1β DTP3β polio3 MCV1 MCV2^ HepB3 Hib3 rota PCV3
Protection at birth (PAB)
against tetanusλ
Care seeking for children
with symptoms of pneumonia
(%)
Treatment with oral rehydra-tion salts (ORS) (%)
Care seeking for
children with fever
(%)
Children sleep-
ing under
ITNs (%)
House-holds
with at least one ITN (%)2015 2015
total urban rural total urban rural 2016 2011–2016*
Afghanistan 63 89 53 39 56 33 74 73 65 60 62 39 65 65 0 65 65 62 46 63 5 26Albania 91 93 90 98 98 97 99 99 98 98 96 98 98 98 0 98 92 70 x 54 x 71 x – –Algeria 93 95 89 87 90 82 99 96 91 91 94 96 91 91 0 61 92 66 25 – – –Andorra 100 100 100 100 100 100 – 99 98 98 97 90 94 98 0 92 – – – – – –Angola 41 63 23 39 62 21 58 79 64 66 49 26 64 64 53 58 78 49 43 51 22 31Anguilla 98 98 – 97 97 – – – – – – – – – – – – – – – – –Antigua and Barbuda 97 – – 88 – – – 99 99 86 98 87 99 99 0 0 – – – – – –Argentina 100 100 100 95 95 94 92 97 92 87 90 88 92 92 75 82 – 94 18 – – –Armenia 99 99 99 92 96 83 99 97 94 96 97 97 94 94 94 94 – 57 x 37 71 – –Australia 100 100 100 100 – – – 98 94 94 95 94 94 94 87 94 – – – – – –Austria 100 100 100 100 100 100 – 99 87 87 95 89 87 87 61 0 – – – – – –Azerbaijan 84 95 72 89 92 87 98 98 97 98 98 98 97 97 0 97 – 36 x 11 – 1 x –Bahamas 98 – – 92 – – – 95 94 94 89 74 94 94 0 94 100 – – – – –Bahrain 100 – – 100 – – – 99 99 99 99 99 99 99 98 99 98 – – – – –Bangladesh 97 98 97 47 54 43 99 99 97 97 94 93 97 97 0 97 97 42 77 55 – –Barbados 98 – – 96 – – – 99 97 97 92 87 97 97 0 96 – – – – – –Belarus 98 98 99 94 94 95 98 99 98 98 98 98 96 11 0 0 – 93 45 – – –Belgium 100 100 100 99 99 99 – 99 98 98 96 85 97 97 87 94 – – – – – –Belize 97 99 96 87 91 84 94 98 95 96 95 96 95 95 0 0 91 67 55 71 – –Benin 67 77 60 14 25 5 96 86 82 78 74 0 82 82 0 75 85 23 25 44 73 77Bhutan 98 97 98 63 72 57 99 99 98 97 97 90 98 98 0 0 89 74 x 61 x – – –Bolivia (Plurinational State of) 93 99 79 53 64 27 99 99 99 99 99 0 99 99 99 97 87 62 22 – – –Bosnia and Herzegovina 98 97 98 95 99 92 97 90 78 79 83 78 78 69 0 0 – 87 36 – – –Botswana 79 95 58 60 75 39 98 98 95 96 97 74 95 95 95 95 92 14 x 43 x 75 x 31 53Brazil 97 99 87 86 91 58 99 89 86 98 96 72 86 86 94 94 93 50 x – – – –British Virgin Islands 100 – – 97 – – – – – – – – – – – – – – – – – –Brunei Darussalam 100 100 99 96 96 97 99 99 99 99 98 97 99 99 0 0 95 – – – – –Bulgaria 99 99 99 86 87 84 96 94 92 92 92 88 91 92 0 90 – – – – – –Burkina Faso 54 79 43 23 48 12 98 95 91 91 88 50 91 91 91 91 92 52 40 61 75 90Burundi 56 88 52 50 46 51 93 97 94 94 93 72 94 94 96 94 85 63 36 69 40 46Cabo Verde 86 93 74 65 73 51 96 96 96 95 92 95 96 96 0 0 92 – – – – –Cambodia 75 96 70 49 88 39 97 92 90 87 81 58 90 90 0 87 93 69 35 61 4 x 5 xCameroon 65 84 43 39 56 19 70 92 85 83 78 0 85 85 80 84 85 28 16 33 55 71Canada 99 – – 99 – – – 96 91 91 90 86 55 91 0 79 – – – – – –Central African Republic 54 74 41 25 49 9 74 69 47 47 49 0 47 47 0 47 60 30 x 16 x – 36 x 47 xChad 43 78 32 10 33 3 56 60 46 44 58 0 46 46 0 0 80 26 20 23 36 77Chile 100 100 100 100 100 99 97 99 95 95 93 87 95 95 0 90 – – – – – –China 96 96 96 75 86 61 99 99 99 99 99 99 99 0 0 0 – – – – – –Colombia 97 100 86 84 88 72 88 93 91 91 93 87 91 91 90 89 90 64 x 54 x 54 x – 3 xComoros 84 93 80 34 47 29 94 96 91 92 99 0 91 91 0 0 85 38 38 45 41 59Congo 68 85 37 15 20 6 85 85 80 80 80 0 80 80 80 80 85 28 28 51 61 66Cook Islands 100 – – 98 – – 99 99 99 99 90 90 99 99 0 0 – – – – – –Costa Rica 100 100 100 97 98 94 89 99 97 97 93 87 97 97 0 94 – 77 40 – – –Côte d'Ivoire 73 89 54 30 45 13 95 98 85 80 77 0 85 85 0 83 90 38 17 43 37 67Croatia 100 100 100 97 98 96 99 98 93 93 90 96 93 93 0 0 – – – – – –Cuba 95 97 90 91 92 88 99 99 99 98 99 99 99 99 0 0 – 93 61 93 – –Cyprus 100 100 100 99 100 99 – 98 97 97 90 88 97 96 0 81 – – – – – –Czechia 100 100 100 99 99 99 – 98 96 96 98 93 96 96 0 0 – – – – – –Democratic People's Republic of Korea 100 100 99 77 83 68 97 97 96 99 99 98 96 96 0 0 97 80 x 74 x – – –
Democratic Republic of the Congo 42 70 21 20 23 18 80 80 79 74 77 0 79 79 0 77 85 42 39 55 56 70Denmark 100 100 100 100 100 100 – 97 94 94 94 85 0 94 0 94 – – – – – –Djibouti 77 83 55 51 63 13 90 90 84 84 75 82 84 84 86 82 85 94 94 – 20 x 32Dominica 97 – – 78 – – 98 99 99 99 96 92 99 99 0 0 – – – – – –Dominican Republic 94 97 86 83 85 74 99 98 87 82 85 0 80 73 75 30 90 73 48 65 – –Ecuador 93 100 80 86 89 80 84 94 83 79 86 76 84 84 80 84 88 – 46 – – –Egypt 98 99 98 93 97 90 96 96 95 95 95 96 95 95 0 0 80 68 28 68 – –El Salvador 93 98 83 91 93 87 99 97 93 95 90 87 93 93 93 90 90 80 70 – – –Equatorial Guinea 50 78 31 75 80 71 48 40 19 20 30 0 19 19 0 0 70 54 40 62 23 38Eritrea 19 66 6 11 29 6 97 97 95 95 93 85 95 95 96 95 94 45 x 43 x – 20 x 71 xEstonia 100 100 99 100 100 100 95 94 93 93 93 92 93 93 85 0 – – – – – –Ethiopia 39 77 30 7 18 4 75 86 77 75 70 0 77 77 63 76 80 30 30 35 45 64Fiji 94 98 89 96 96 95 99 99 99 99 94 94 99 99 99 99 94 – – – – –
TABLE 3. HEALTH

163
Countries and areas
Use of basic drinking water
services (%)
Use of basic sanitation
services (%)
Immunization coverage (%) Pneumonia Diarrhoea Malaria
BCG DTP1β DTP3β polio3 MCV1 MCV2^ HepB3 Hib3 rota PCV3
Protection at birth (PAB)
against tetanusλ
Care seeking for children
with symptoms of pneumonia
(%)
Treatment with oral rehydra-tion salts (ORS) (%)
Care seeking for
children with fever
(%)
Children sleep-
ing under
ITNs (%)
House-holds
with at least one ITN (%)2015 2015
total urban rural total urban rural 2016 2011–2016*
Finland 100 100 100 99 99 99 – 99 92 92 94 85 0 92 84 87 – – – – – –France 100 100 100 99 99 99 – 99 97 97 90 79 88 96 0 91 – – – – – –Gabon 88 92 59 41 42 32 94 83 75 74 64 0 75 75 0 0 90 68 26 67 39 36Gambia 80 88 68 42 46 35 98 99 95 95 97 79 95 95 95 95 92 68 59 65 47 69Georgia 93 98 87 85 95 73 98 97 92 92 93 85 92 92 75 75 – 74 x 40 x – – –Germany 100 100 100 99 99 99 – 95 95 94 97 93 88 93 66 86 – – – – – –Ghana 78 88 66 14 19 9 94 94 93 95 89 75 93 93 94 93 88 56 49 77 47 68Greece 100 100 100 99 99 98 – 99 99 99 97 83 96 99 20 96 – – – – – –Grenada 96 – – 78 – – – 98 96 98 95 85 96 96 0 0 – – – – – –Guatemala 94 97 89 67 81 53 87 96 80 82 86 65 80 80 82 81 90 52 49 50 – –Guinea 67 88 55 22 34 15 72 65 57 42 54 0 57 57 0 0 80 37 34 37 26 47Guinea-Bissau 69 85 54 21 35 8 94 95 87 87 81 0 87 87 61 80 80 34 35 51 81 90Guyana 95 100 93 86 89 85 95 97 97 94 99 94 97 97 96 92 99 84 43 71 7 5Haiti 64 81 40 31 37 22 72 78 58 56 53 26 58 58 48 0 88 38 53 40 12 19Holy See – – – – – – – – – – – – – – – – – – – – – –Honduras 92 99 84 80 84 75 99 99 97 97 88 0 97 97 97 97 94 64 60 62 – –Hungary 100 100 100 98 98 99 99 99 99 99 99 99 0 99 0 98 – – – – – –Iceland 100 100 100 99 99 100 – 96 91 91 91 95 0 91 0 90 – – – – – –India 88 93 85 44 65 34 89 91 88 86 88 76 88 80 4 0 87 73 51 71 x – –Indonesia 90 97 81 68 77 57 81 95 79 80 76 56 79 79 0 0 85 75 39 74 3 x 3 xIran (Islamic Republic of) 95 97 89 88 92 79 99 99 99 99 99 98 99 99 0 0 95 76 x 61 x – – –Iraq 86 90 78 86 86 86 94 73 63 68 66 64 61 63 34 0 75 74 23 – – –Ireland 99 99 99 92 91 95 18 98 95 95 92 0 95 95 0 91 – – – – – –Israel 100 100 100 100 100 100 – 94 94 94 97 97 95 94 81 93 – – – – – –Italy 100 100 100 99 99 99 – 97 93 93 85 83 93 93 0 89 – – – – – –Jamaica 93 97 88 85 84 87 96 99 99 99 95 85 98 99 0 0 80 82 64 – – –Japan 99 – – 100 – – 84 99 99 99 96 93 0 99 0 99 – – – – – –Jordan 99 99 97 97 97 96 99 99 98 98 96 99 98 98 97 0 90 77 20 69 – –Kazakhstan 91 97 84 98 97 99 95 93 82 82 99 99 82 82 0 97 – 81 62 – – –Kenya 58 83 50 30 35 28 99 96 89 88 75 32 89 89 74 78 85 66 54 72 56 59Kiribati 64 90 44 40 49 32 79 82 81 82 80 79 81 81 79 79 90 81 x 62 x 27 x – –Kuwait 100 – – 100 – – 99 99 99 99 93 96 99 99 0 99 95 – – – – –Kyrgyzstan 87 97 82 97 93 99 97 97 96 97 97 98 96 96 0 0 – 60 33 56 – –Lao People's Democratic Republic 80 92 73 73 93 60 78 85 82 83 76 0 82 82 0 78 90 54 42 – 43 50Latvia 99 99 98 93 97 84 96 99 98 98 93 89 98 98 83 82 – – – – – –Lebanon 92 – – 95 – – – 84 81 75 79 75 81 81 0 0 – 74 x 44 x – – –Lesotho 72 87 66 44 46 43 98 98 93 90 90 82 93 93 0 93 85 63 53 61 – –Liberia 70 80 60 17 28 6 97 99 79 79 80 0 79 79 48 79 89 51 60 78 44 62Libya 97 – – 100 – – 99 98 97 97 97 96 97 97 97 96 – – – – – –Liechtenstein 100 – – 100 – – – – – – – – – – – – – – – – – –Lithuania 97 100 93 94 97 86 98 97 94 94 94 92 95 94 0 82 – – – – – –Luxembourg 100 100 100 98 97 99 – 99 99 99 99 86 94 99 89 95 – – – – – –Madagascar 51 82 34 10 16 6 70 84 77 75 58 0 77 77 78 76 78 41 15 46 73 80Malawi 67 87 63 44 49 43 86 89 84 83 81 61 84 84 81 83 89 78 65 67 43 57Malaysia 96 99 89 100 100 99 98 99 98 98 96 99 98 98 0 0 90 – – – – –Maldives 98 96 100 96 93 98 99 99 99 99 99 99 99 99 0 0 99 22 x 57 x 84 x – –Mali 74 91 63 31 46 22 92 86 68 67 75 0 68 68 60 70 85 23 22 x 49 79 93Malta 100 100 100 100 100 100 – 97 97 97 93 86 97 97 0 0 – – – – – –Marshall Islands 78 70 99 87 95 66 94 87 71 69 75 49 73 58 38 51 – – 38 x 63 x – –Mauritania 70 86 45 45 63 17 85 87 73 67 70 0 73 73 73 73 80 34 19 35 18 67Mauritius 100 100 100 93 94 93 98 97 96 96 92 92 72 96 92 10 95 – – – – –Mexico 98 100 94 89 91 81 99 99 97 96 96 98 93 97 72 92 90 73 61 – – –Micronesia (Federated States of) 88 97 86 – – – 85 95 69 68 70 74 76 61 46 63 – – – – – –Monaco 100 100 – 100 100 – 89 99 99 99 99 0 99 99 0 0 – – – – – –Mongolia 83 94 56 59 66 41 99 99 99 99 98 90 99 99 0 0 – 70 42 – – –Montenegro 98 97 99 96 98 92 88 97 89 89 47 86 75 89 0 0 – 89 x 16 x 74 – –Montserrat 97 – – 89 – – – – – – – – – – – – – – – – – –Morocco 83 96 64 83 89 75 99 99 99 99 99 99 99 99 99 98 90 70 22 – – –Mozambique 47 79 32 24 47 12 95 90 80 80 91 51 80 80 76 80 83 50 55 56 36 51Myanmar 68 82 60 65 76 59 88 94 90 89 91 86 90 90 0 14 87 58 62 65 19 27Namibia 79 97 63 34 55 15 94 98 92 92 85 0 92 92 86 81 88 68 72 63 6 24Nauru 100 100 – 66 66 – 99 98 91 91 98 96 91 91 0 0 – 69 x 23 x 51 x – –Nepal 88 89 87 46 52 45 93 92 87 85 83 25 87 87 0 46 82 85 37 46 – –
TABLE 3. HEALTH
UNICEF – THE STATE OF THE WORLD’S CHILDREN 2017
Countries and areas
Use of basic drinking water
services (%)
Use of basic sanitation
services (%)
Immunization coverage (%) Pneumonia Diarrhoea Malaria
BCG DTP1β DTP3β polio3 MCV1 MCV2^ HepB3 Hib3 rota PCV3
Protection at birth (PAB)
against tetanusλ
Care seeking for children
with symptoms of pneumonia
(%)
Treatment with oral rehydra-tion salts (ORS) (%)
Care seeking for
children with fever
(%)
Children sleep-
ing under
ITNs (%)
House-holds
with at least one ITN (%)2015 2015
total urban rural total urban rural 2016 2011–2016*
Netherlands 100 100 100 98 98 100 – 98 95 95 94 91 93 95 0 94 – – – – – –New Zealand 100 100 100 100 100 100 – 92 92 92 92 89 92 92 66 93 – – – – – –Nicaragua 82 97 61 76 86 63 98 99 98 99 99 0 98 98 98 98 85 58 x 65 – – –Niger 46 89 36 13 44 6 77 87 67 67 74 37 67 67 61 64 85 59 41 51 20 61Nigeria 67 82 54 33 39 27 64 64 49 49 51 0 49 49 0 26 63 35 34 66 44 69Niue 98 – – 97 – – 99 99 99 99 99 99 99 99 0 99 – – – – – –Norway 100 100 100 98 98 98 – 99 96 96 96 91 0 96 0 94 – – – – – –Oman 91 95 78 99 99 99 99 99 99 99 99 99 99 99 0 99 98 56 59 – – –Pakistan 89 92 87 58 74 48 85 79 72 72 61 53 72 72 0 72 80 64 38 65 0 x 1Palau 100 100 97 100 100 100 – 99 98 98 96 95 98 98 98 98 – – – – – –Panama 95 99 87 77 86 59 99 96 73 72 90 92 73 73 92 83 – 82 52 – – –Papua New Guinea 37 84 29 19 55 13 89 87 72 73 70 0 66 72 0 20 75 63 x – – – –Paraguay 99 99 98 91 98 81 99 99 93 89 99 92 93 93 92 99 85 – – – – –Peru 90 95 72 77 82 58 90 94 89 88 88 66 89 89 87 86 85 62 32 61 – –Philippines 91 96 86 75 79 72 76 87 86 72 80 66 86 86 0 36 90 64 49 50 – –Poland 98 99 96 98 98 98 94 99 98 92 96 94 96 98 0 0 – – – – – –Portugal 100 100 100 99 99 100 32 99 98 98 98 95 98 98 0 0 – – – – – –Qatar 100 – – 100 – – 97 99 98 98 99 92 98 98 99 97 – – – – – –Republic of Korea 100 – – 100 – – 97 98 98 98 98 97 98 98 0 98 – – – – – –Republic of Moldova 87 96 79 78 89 70 97 94 89 91 88 95 90 89 70 77 – 79 42 – – –Romania 100 100 100 82 93 68 84 96 89 89 86 76 90 89 0 0 – – – – – –Russian Federation 96 99 90 89 93 76 96 97 97 97 98 97 97 0 0 35 – – – – – –Rwanda 57 77 49 62 57 64 99 99 98 99 95 90 98 98 98 98 90 54 28 57 68 81Saint Kitts and Nevis – – – – – – 96 99 97 99 98 97 98 98 0 0 – – – – – –Saint Lucia 98 98 98 91 86 92 96 95 95 95 99 88 95 95 0 0 – – – – – –Saint Vincent and the Grenadines 95 – – 87 – – 99 99 98 97 99 99 98 99 0 0 – – – – – –Samoa 96 99 95 97 98 96 76 95 62 57 68 44 55 55 0 0 – 78 63 59 – –San Marino 100 – – 100 – – – 78 66 66 62 36 66 65 0 12 – – – – – –Sao Tome and Principe 80 83 74 40 47 28 92 97 96 96 93 76 96 96 24 96 99 69 49 66 61 78Saudi Arabia 100 – – 100 – – 98 98 98 97 98 96 98 98 95 98 – – – – – –Senegal 75 91 63 48 66 35 97 96 93 92 93 75 93 93 93 93 91 48 32 49 55 77Serbia 91 88 95 95 98 91 98 97 92 93 82 90 91 92 0 0 – 90 x 36 x – – –Seychelles 96 – – 100 – – 99 98 96 96 97 99 97 96 0 0 100 – – – – –Sierra Leone 58 75 47 15 24 8 92 97 84 84 83 50 84 84 95 84 90 72 85 72 49 64Singapore 100 100 – 100 100 – 99 98 97 96 95 88 96 96 57 78 – – – – – –Slovakia 98 99 97 99 99 98 0 99 96 96 95 97 96 96 0 96 – – – – – –Slovenia 100 100 99 99 99 99 – 98 94 94 92 93 0 94 0 50 – – – – – –Solomon Islands 64 90 56 31 76 18 98 99 99 99 99 0 99 99 0 87 85 79 37 61 70 86Somalia 40 70 20 16 28 8 37 52 42 47 46 0 42 42 0 0 67 13 x 13 x – 11 x 12 xSouth Africa 85 97 63 73 76 69 74 78 66 66 75 70 66 66 73 69 80 88 51 68 – –South Sudan 50 60 48 10 28 6 37 35 26 31 20 0 26 26 0 0 75 48 x 39 x 57 46 66Spain 100 100 100 100 100 100 – 99 97 97 97 95 97 97 0 0 – – – – – –Sri Lanka 92 96 91 94 89 95 99 99 99 99 99 99 99 99 0 0 95 58 x 51 x 85 x 3 x 5 xState of Palestine 88 86 94 96 95 99 99 99 99 99 99 99 99 99 0 99 – 77 32 – – –Sudan 59 73 52 35 58 23 96 97 93 93 86 69 93 93 90 93 77 48 20 – 30 x 25 xSuriname 95 98 88 79 88 61 – 92 91 91 97 44 91 91 0 0 93 76 x 42 x – 43 x 61 xSwaziland 68 95 60 58 58 58 97 96 90 90 89 89 90 90 95 90 90 60 84 63 2 x 10 xSweden 100 100 100 99 99 100 26 99 98 98 97 95 67 98 0 97 – – – – – –Switzerland 100 100 100 100 100 100 – 99 97 97 94 89 0 97 0 81 – – – – – –Syrian Arab Republic 97 99 94 93 96 89 66 61 42 48 62 52 50 42 0 0 91 77 x 50 x – – –Tajikistan 74 92 68 95 94 96 98 98 96 97 97 97 97 97 96 0 – 63 60 57 1 x 2 xThailand 98 99 97 95 94 96 99 99 99 99 99 95 99 0 0 0 95 80 73 76 – –The former Yugoslav Republic of Macedonia 97 96 98 91 97 83 99 97 95 95 82 93 94 94 0 0 – 93 x 62 – – –
Timor-Leste 70 91 60 44 73 30 85 95 85 83 78 22 85 85 0 0 81 71 x 71 x 73 x 41 x 41 xTogo 63 90 45 14 28 5 79 93 89 89 87 0 89 89 90 89 83 49 19 58 43 65Tokelau 100 – 100 93 – 93 – – – – – – – – – – – – – – – –Tonga 100 100 100 93 97 92 80 83 78 80 84 85 78 78 0 0 – – – 64 – –Trinidad and Tobago 97 – – 92 – – – 97 97 84 86 65 97 97 0 91 – 74 x – – – –Tunisia 94 100 83 93 98 83 95 99 98 98 96 97 98 98 0 0 96 60 65 – – –Turkey 99 99 100 96 99 89 96 99 98 98 98 85 98 98 0 98 90 – – – – –Turkmenistan 94 91 98 97 94 99 98 99 98 98 99 99 98 98 0 0 – 59 47 – – –Turks and Caicos Islands 94 – – 88 – – – – – – – – – – – – – – – – – –Tuvalu 99 100 99 91 92 91 98 99 94 94 96 92 94 94 0 0 – – 44 x 79 x – –
TABLE 3. HEALTH

165TABLE 3. HEALTH
Countries and areas
Use of basic drinking water
services (%)
Use of basic sanitation
services (%)
Immunization coverage (%) Pneumonia Diarrhoea Malaria
BCG DTP1β DTP3β polio3 MCV1 MCV2^ HepB3 Hib3 rota PCV3
Protection at birth (PAB)
against tetanusλ
Care seeking for children
with symptoms of pneumonia
(%)
Treatment with oral rehydra-tion salts (ORS) (%)
Care seeking for
children with fever
(%)
Children sleep-
ing under
ITNs (%)
House-holds
with at least one ITN (%)2015 2015
total urban rural total urban rural 2016 2011–2016*
Uganda 39 73 32 19 28 17 93 89 78 82 82 0 78 78 0 78 87 80 47 81 62 78Ukraine 98 97 100 96 97 93 75 42 19 56 42 31 26 47 0 0 – 92 59 – – –United Arab Emirates 100 100 100 100 100 100 99 99 99 99 99 99 99 99 92 99 – – – – – –United Kingdom 100 100 100 99 99 99 – 98 94 94 92 89 0 94 90 92 – – – – – –United Republic of Tanzania 50 79 37 24 37 17 99 99 97 93 90 71 97 97 96 96 90 55 45 50 54 66United States 99 100 97 100 100 100 – 97 95 94 92 0 93 93 73 93 – – – – – –Uruguay 99 100 94 96 96 95 98 97 95 95 95 92 95 95 0 94 – 91 – – – –Uzbekistan – 99 – 100 100 100 99 99 99 99 99 99 99 99 99 99 – 68 x 28 x – – –Vanuatu 91 99 87 53 61 51 73 75 64 65 53 0 64 64 0 0 78 72 48 57 51 83Venezuela (Bolivarian Republic of) 97 99 86 95 98 72 99 98 84 82 88 53 84 84 47 7 75 72 x 38 x – – –Viet Nam 91 92 91 78 91 72 95 96 96 95 99 95 96 96 0 0 94 81 51 – 9 10Yemen 70 85 63 60 90 44 73 76 71 65 70 49 71 71 59 71 70 34 25 33 – –Zambia 61 86 44 31 49 19 99 99 91 87 93 58 91 91 90 90 85 70 64 75 41 68Zimbabwe 67 94 54 39 54 31 95 94 90 90 95 63 90 90 91 90 80 51 41 50 9 48
SUMMARYEast Asia and Pacific 94 96 91 77 87 63 93 97 94 93 93 87 90 38 1 11 89 ** 72 ** 47 ** 67 ** – –Europe and Central Asia 98 99 94 96 98 92 91 95 92 94 93 88 81 76 22 62 – – – – – –
Eastern Europe and Central Asia 95 98 90 93 95 87 95 93 90 93 93 88 90 61 16 54 – – – – – –Western Europe 100 100 99 99 99 99 66 98 96 95 93 88 69 95 30 71 – – – – – –
Latin America and Caribbean 96 99 86 86 90 68 95 94 90 92 92 73 89 89 77 81 89 72 48 – – –Middle East and North Africa 93 96 87 89 94 81 94 91 88 88 89 87 88 88 29 32 84 65 27 – – –North America 99 100 97 100 100 100 – 97 95 94 92 8 90 93 67 92 – – – – – –South Asia 88 93 86 46 65 37 89 89 86 84 84 72 86 80 3 22 86 69 51 61 ‡ – 5 ‡Sub-Saharan Africa 58 82 43 28 42 20 80 83 74 73 72 24 74 74 45 65 80 47 38 57 48 66
Eastern and Southern Africa 53 82 40 30 48 21 84 88 80 80 76 36 80 80 66 76 82 56 42 56 48 62West and Central Africa 62 82 46 27 37 19 76 77 67 65 67 11 67 67 25 54 77 39 34 57 48 70
Least developed countries 62 83 52 32 46 26 84 87 80 78 77 37 80 80 42 72 84 49 44 53 46 60World 89 95 80 68 83 50 88 91 86 85 85 64 84 70 25 42 84 ** 62 ** 44 ** 59 ‡** – –
For a complete list of countries and areas in the regions, subregions and country categories, see page 150 or visit <data.unicef.org/regionalclassifications>.It is not advisable to compare data from consecutive editions of The State of the World’s Children.
Population using basic drinking water services – Percentage of the population using an improved drinking water source, where collection time is not more than 30 minutes for a round trip including queuing (improved sources include: piped water; boreholes or tubewells; protected dug wells; protected springs; rainwater; and packaged or delivered water.Population using basic sanitation services – Percentage of the population using an improved sanitation facility that is not shared with other households (improved facilities include: flush/pour flush to piped sewerage systems, septic tanks or pit latrines; ventilated improved pit latrines; composting toilets or pit latrines with slabs.EPI – Expanded Programme on Immunization: The first diseases targeted by the EPI were diphtheria, pertussis (whooping cough) and tetanus (DPT); measles; poliomyelitis; and tuberculosis (TB). Additional vaccines have been added to the original six recommended in 1974 and include vaccines to protect against hepatitis B (HepB), and Haemophilus influenzae type b (Hib). Pneumococcal conjugate vaccine (PCV) and rotavirus vaccine, also recommended by the WHO, are increasingly being added to national schedules.BCG – Percentage of live births who received bacille Calmette-Guérin (vaccine against tuberculosis).DTP1 – Percentage of surviving infants who received the first dose of diphtheria, pertussis and tetanus vaccine.DTP3 – Percentage of surviving infants who received three doses of diphtheria, pertussis and tetanus vaccine.Polio3 – Percentage of surviving infants who received three doses of the polio vaccine.MCV1 – Percentage of surviving infants who received the first dose of the measles-containing vaccine.MCV2 – Percentage of children who received the second dose of measles-containing vaccine as per national schedule.
HepB3 – Percentage of surviving infants who received three doses of hepatitis B vaccine.Hib3 – Percentage of surviving infants who received three doses of Haemophilus influenzae type b vaccine.Rota – Percentage of surviving infants who received the last dose of rotavirus vaccine as recommended.PCV3 – Percentage of surviving infants who received three doses of pneumococcal conjugate vaccine.Protection at birth (PAB) – Percentage of newborns protected at birth against tetanus with Tetanus Toxoid.Care-seeking for children with symptoms of pneumonia – Percentage of children under age 5 with symptoms of pneumonia (cough and fast or difficult breathing due to a problem in the chest) in the two weeks preceding the survey for whom advice or treatment was sought from a health facility or provider.Diarrhoea treatment with oral rehydration salts (ORS) – Percentage of children under age 5 who had diarrhoea in the two weeks preceding the survey and who received oral rehydration salts (ORS packets or pre-packaged ORS fluids). Care-seeking for children with fever – Percentage of children under five years of age with fever for whom advice or treatment was sought from a health facility or provider. Excludes drug vendor, stores, shops and traditional healer. In some countries, particularly non-malaria endemic countries, pharmacies have also been excluded from the calculation.Children sleeping under ITNs – Percentage of children under age 5 who slept under an insecticide-treated mosquito net the night prior to the survey.Households with at least one ITN – Percentage of households with at least one insecticide-treated mosquito net.
Use of basic drinking water services and basic sanitation services – WHO/UNICEF Joint Monitoring Programme for Water Supply, Sanitation and Hygiene (JMP).Immunization – WHO and UNICEF estimates of national immunization coverage, 2016 revision.Care-seeking for children with symptoms of pneumonia –
Demographic and Health Surveys (DHS), Multiple Indicator Cluster Surveys (MICS) and other national household surveys.Diarrhoea treatment with oral rehydration salts (ORS) – DHS, MICS and other national household surveys.Malaria prevention and treatment – DHS, MICS, Malaria Indicator Surveys (MIS) and other national household surveys.
– Data not available.x Data refer to years or periods other
than those specified in the column heading. Such data are not included in the calculation of regional and global averages. Estimates from data years prior to 2000 are not displayed.
β Coverage for DPT1 should be at least as high as DPT3. Discrepancies where DPT1 coverage is less than DPT3 reflect deficiencies in the data collection and reporting process. UNICEF and WHO are working with national and territorial systems to eliminate these discrepancies.
^ Generally, the second dose of measles containing vaccine (MCV2) is recommended for administration during the second year of life; however, in many countries, MCV2 is scheduled after the second year. For the calculation of regional aggregates, the coverage of the countries that did not report MCV2
data for 2016 is considered to be 0%, e.g. the regional coverage calculation for North America includes the United States with 0% MCV2 coverage in 2016.
λ WHO and UNICEF employ a complex process employing adminitrative data, surveys (routine and supple-mental), serosurveys, and information on other vaccines to calculate the percentage of births that can be considered as protected against tetanus because pregnant women were given two doses or more of tetanus toxoid (TT) vaccine. The complete methodology can be found at <http://who.int/immunization/monitoring_surveillance/data/en/>.
* Data refer to the most recent year available during the period specified in the column heading.
** Excludes China.‡ Excludes India.
NOTES
DEFINITIONS OF THE INDICATORS MAIN DATA SOURCES
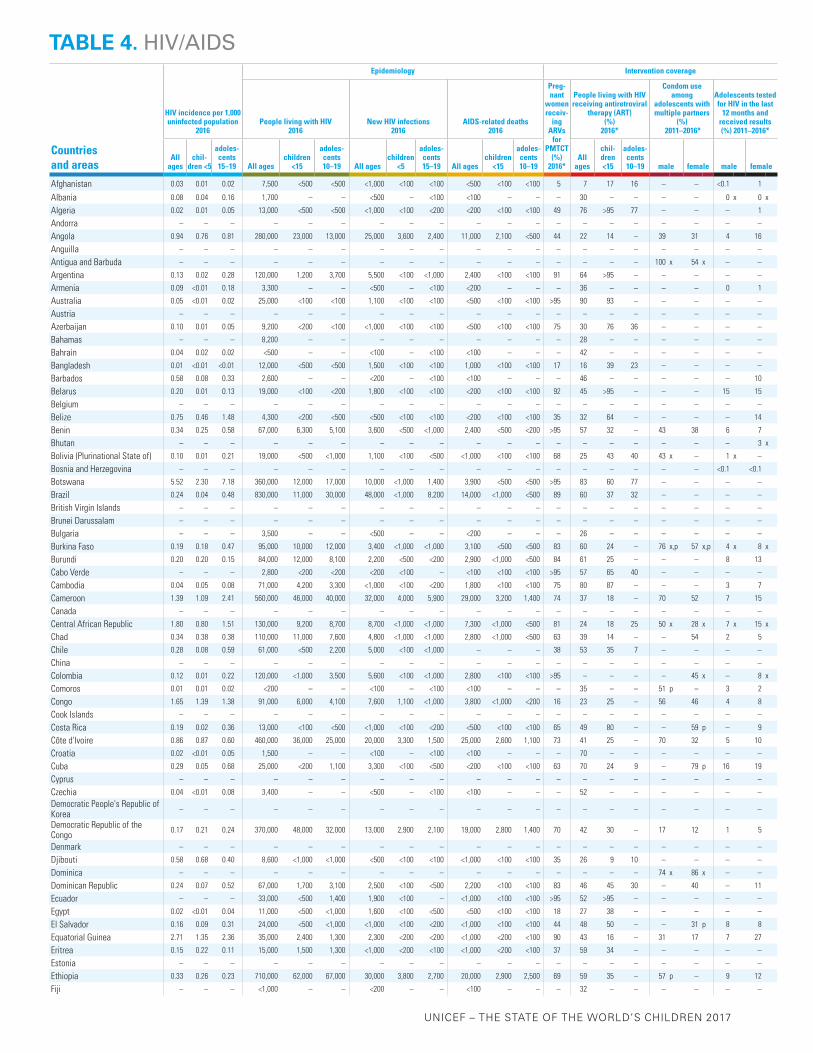
UNICEF – THE STATE OF THE WORLD’S CHILDREN 2017
Countries and areas
HIV incidence per 1,000 uninfected population
2016
Epidemiology Intervention coverage
People living with HIV2016
New HIV infections2016
AIDS-related deaths2016
Preg-nant
women receiv-
ing ARVs
for PMTCT
(%)2016*
People living with HIV receiving antiretroviral
therapy (ART) (%)
2016*
Condom use among
adolescents with multiple partners
(%) 2011–2016*
Adolescents tested for HIV in the last
12 months and received results (%) 2011–2016*
All ages
chil-dren <5
adoles-cents 15–19 All ages
children <15
adoles-cents 10–19 All ages
children <5
adoles-cents 15–19 All ages
children <15
adoles-cents 10–19
All ages
chil-dren <15
adoles-cents 10–19 male female male female
Afghanistan 0.03 0.01 0.02 7,500 <500 <500 <1,000 <100 <100 <500 <100 <100 5 7 17 16 – – <0.1 1
Albania 0.08 0.04 0.16 1,700 – – <500 – <100 <100 – – – 30 – – – – 0 x 0 x
Algeria 0.02 0.01 0.05 13,000 <500 <500 <1,000 <100 <200 <200 <100 <100 49 76 >95 77 – – – 1
Andorra – – – – – – – – – – – – – – – – – – – –
Angola 0.94 0.76 0.81 280,000 23,000 13,000 25,000 3,600 2,400 11,000 2,100 <500 44 22 14 – 39 31 4 16
Anguilla – – – – – – – – – – – – – – – – – – – –
Antigua and Barbuda – – – – – – – – – – – – – – – – 100 x 54 x – –
Argentina 0.13 0.02 0.28 120,000 1,200 3,700 5,500 <100 <1,000 2,400 <100 <100 91 64 >95 – – – – –
Armenia 0.09 <0.01 0.18 3,300 – – <500 – <100 <200 – – – 36 – – – – 0 1
Australia 0.05 <0.01 0.02 25,000 <100 <100 1,100 <100 <100 <500 <100 <100 >95 90 93 – – – – –
Austria – – – – – – – – – – – – – – – – – – – –
Azerbaijan 0.10 0.01 0.05 9,200 <200 <100 <1,000 <100 <100 <500 <100 <100 75 30 76 36 – – – –
Bahamas – – – 8,200 – – – – – – – – – 28 – – – – – –
Bahrain 0.04 0.02 0.02 <500 – – <100 – <100 <100 – – – 42 – – – – – –
Bangladesh 0.01 <0.01 <0.01 12,000 <500 <500 1,500 <100 <100 1,000 <100 <100 17 16 39 23 – – – –
Barbados 0.58 0.08 0.33 2,600 – – <200 – <100 <100 – – – 46 – – – – – 10
Belarus 0.20 0.01 0.13 19,000 <100 <200 1,800 <100 <100 <200 <100 <100 92 45 >95 – – – 15 15
Belgium – – – – – – – – – – – – – – – – – – – –
Belize 0.75 0.46 1.48 4,300 <200 <500 <500 <100 <100 <200 <100 <100 35 32 64 – – – – 14
Benin 0.34 0.25 0.58 67,000 6,300 5,100 3,600 <500 <1,000 2,400 <500 <200 >95 57 32 – 43 38 6 7
Bhutan – – – – – – – – – – – – – – – – – – – 3 x
Bolivia (Plurinational State of) 0.10 0.01 0.21 19,000 <500 <1,000 1,100 <100 <500 <1,000 <100 <100 68 25 43 40 43 x – 1 x –
Bosnia and Herzegovina – – – – – – – – – – – – – – – – – – <0.1 <0.1
Botswana 5.52 2.30 7.18 360,000 12,000 17,000 10,000 <1,000 1,400 3,900 <500 <500 >95 83 60 77 – – – –
Brazil 0.24 0.04 0.48 830,000 11,000 30,000 48,000 <1,000 8,200 14,000 <1,000 <500 89 60 37 32 – – – –
British Virgin Islands – – – – – – – – – – – – – – – – – – – –
Brunei Darussalam – – – – – – – – – – – – – – – – – – – –
Bulgaria – – – 3,500 – – <500 – – <200 – – – 26 – – – – – –
Burkina Faso 0.19 0.18 0.47 95,000 10,000 12,000 3,400 <1,000 <1,000 3,100 <500 <500 83 60 24 – 76 x,p 57 x,p 4 x 8 x
Burundi 0.20 0.20 0.15 84,000 12,000 8,100 2,200 <500 <200 2,900 <1,000 <500 84 61 25 – – – 8 13
Cabo Verde – – – 2,800 <200 <200 <200 <100 – <100 <100 <100 >95 57 65 40 – – – –
Cambodia 0.04 0.05 0.08 71,000 4,200 3,300 <1,000 <100 <200 1,800 <100 <100 75 80 87 – – – 3 7
Cameroon 1.39 1.09 2.41 560,000 46,000 40,000 32,000 4,000 5,900 29,000 3,200 1,400 74 37 18 – 70 52 7 15
Canada – – – – – – – – – – – – – – – – – – – –
Central African Republic 1.80 0.80 1.51 130,000 9,200 8,700 8,700 <1,000 <1,000 7,300 <1,000 <500 81 24 18 25 50 x 28 x 7 x 15 x
Chad 0.34 0.38 0.38 110,000 11,000 7,600 4,800 <1,000 <1,000 2,800 <1,000 <500 63 39 14 – – 54 2 5
Chile 0.28 0.08 0.59 61,000 <500 2,200 5,000 <100 <1,000 – – – 38 53 35 7 – – – –
China – – – – – – – – – – – – – – – – – – – –
Colombia 0.12 0.01 0.22 120,000 <1,000 3,500 5,600 <100 <1,000 2,800 <100 <100 >95 – – – – 45 x – 8 x
Comoros 0.01 0.01 0.02 <200 – – <100 – <100 <100 – – – 35 – – 51 p – 3 2
Congo 1.65 1.39 1.38 91,000 6,000 4,100 7,600 1,100 <1,000 3,800 <1,000 <200 16 23 25 – 56 46 4 8
Cook Islands – – – – – – – – – – – – – – – – – – – –
Costa Rica 0.19 0.02 0.36 13,000 <100 <500 <1,000 <100 <200 <500 <100 <100 65 49 80 – – 59 p – 9
Côte d'Ivoire 0.86 0.87 0.60 460,000 36,000 25,000 20,000 3,300 1,500 25,000 2,600 1,100 73 41 25 – 70 32 5 10
Croatia 0.02 <0.01 0.05 1,500 – – <100 – <100 <100 – – – 70 – – – – – –
Cuba 0.29 0.05 0.68 25,000 <200 1,100 3,300 <100 <500 <200 <100 <100 63 70 24 9 – 79 p 16 19
Cyprus – – – – – – – – – – – – – – – – – – – –
Czechia 0.04 <0.01 0.08 3,400 – – <500 – <100 <100 – – – 52 – – – – – –
Democratic People's Republic of Korea
– – – – – – – – – – – – – – – – – – – –
Democratic Republic of the Congo
0.17 0.21 0.24 370,000 48,000 32,000 13,000 2,900 2,100 19,000 2,800 1,400 70 42 30 – 17 12 1 5
Denmark – – – – – – – – – – – – – – – – – – – –
Djibouti 0.58 0.68 0.40 8,600 <1,000 <1,000 <500 <100 <100 <1,000 <100 <100 35 26 9 10 – – – –
Dominica – – – – – – – – – – – – – – – – 74 x 86 x – –
Dominican Republic 0.24 0.07 0.52 67,000 1,700 3,100 2,500 <100 <500 2,200 <100 <100 83 46 45 30 – 40 – 11
Ecuador – – – 33,000 <500 1,400 1,900 <100 – <1,000 <100 <100 >95 52 >95 – – – – –
Egypt 0.02 <0.01 0.04 11,000 <500 <1,000 1,600 <100 <500 <500 <100 <100 18 27 38 – – – – –
El Salvador 0.16 0.09 0.31 24,000 <500 <1,000 <1,000 <100 <200 <1,000 <100 <100 44 48 50 – – 31 p 8 8
Equatorial Guinea 2.71 1.35 2.36 35,000 2,400 1,300 2,300 <200 <200 <1,000 <200 <100 90 43 16 – 31 17 7 27
Eritrea 0.15 0.22 0.11 15,000 1,500 1,300 <1,000 <200 <100 <1,000 <200 <100 37 59 34 – – – – –
Estonia – – – – – – – – – – – – – – – – – – – –
Ethiopia 0.33 0.26 0.23 710,000 62,000 67,000 30,000 3,800 2,700 20,000 2,900 2,500 69 59 35 – 57 p – 9 12
Fiji – – – <1,000 – – <200 – – <100 – – – 32 – – – – – –
TABLE 4. HIV/AIDS

167
Countries and areas
HIV incidence per 1,000 uninfected population
2016
Epidemiology Intervention coverage
People living with HIV2016
New HIV infections2016
AIDS-related deaths2016
Preg-nant
women receiv-
ing ARVs
for PMTCT
(%)2016*
People living with HIV receiving antiretroviral
therapy (ART) (%)
2016*
Condom use among
adolescents with multiple partners
(%) 2011–2016*
Adolescents tested for HIV in the last
12 months and received results (%) 2011–2016*
All ages
chil-dren <5
adoles-cents 15–19 All ages
children <15
adoles-cents 10–19 All ages
children <5
adoles-cents 15–19 All ages
children <15
adoles-cents 10–19
All ages
chil-dren <15
adoles-cents 10–19 male female male female
Finland – – – – – – – – – – – – – – – – – – – –
France 0.09 0.01 0.25 180,000 <500 2,800 6,000 <100 <1,000 <1,000 <100 <100 >95 78 >95 – – – – –
Gabon 0.92 0.95 1.57 48,000 3,700 2,900 1,700 <500 <500 1,500 <500 <100 76 63 39 61 77 58 6 20
Gambia 0.65 0.47 0.23 20,000 1,600 <1,000 1,300 <200 <100 1,100 <200 <100 69 30 33 – – – 2 6
Georgia 0.28 0.06 0.15 12,000 <100 <100 1,100 <100 <100 <500 <100 <100 46 32 50 62 – – – 2 x
Germany – – – – – – – – – – – – – – – – – – – –
Ghana 0.78 0.79 0.83 290,000 32,000 23,000 20,000 3,000 2,200 15,000 2,500 1,100 56 34 15 – – 22 p 1 5
Greece – – – – – – – – – – – – – – – – – – – –
Grenada – – – – – – – – – – – – – – – – 80 x 92 x – –
Guatemala 0.18 0.15 0.35 46,000 1,800 2,300 2,900 <500 <1,000 1,600 <200 <100 19 36 42 25 66 38 2 5
Guinea 0.67 0.68 1.08 120,000 10,000 8,700 8,300 1,300 1,400 5,800 <1,000 <500 43 35 18 – 46 p 30 1 3
Guinea-Bissau 0.72 0.72 0.56 36,000 4,200 2,100 1,300 <500 <200 2,000 <500 <200 85 33 15 – 60 41 2 5
Guyana 0.77 0.32 1.62 8,500 <500 <1,000 <1,000 <100 <200 <200 <100 <100 66 58 69 – 83 p – 10 16
Haiti 0.77 0.50 0.59 150,000 7,200 6,200 7,900 <1,000 <1,000 4,600 <500 <200 71 55 49 53 58 42 4 9
Holy See – – – – – – – – – – – – – – – – – – – –
Honduras 0.11 0.05 0.21 21,000 <1,000 1,300 <1,000 <100 <200 <1,000 <100 <100 54 51 69 60 73 39 3 10
Hungary – – – – – – – – – – – – – – – – – – – –
Iceland – – – – – – – – – – – – – – – – – – – –
India 0.06 – – 2,100,000 130,000 130,000 80,000 9,100 16,000 62,000 7,000 3,100 41 49 33 – 39 x – 0 x 1 x
Indonesia 0.19 0.13 0.29 620,000 14,000 17,000 48,000 3,200 6,300 38,000 1,900 <500 14 13 21 – – – – –
Iran (Islamic Republic of) 0.06 0.01 0.03 66,000 1,000 <1,000 5,000 <100 <200 4,000 <100 <100 51 14 28 19 – – – –
Iraq – – – – – – – – – – – – – – – – – – – 0
Ireland 0.06 <0.01 0.03 6,200 <100 <100 <500 <100 <100 – – – >95 77 >95 – – – – –
Israel – – – – – – – – – – – – – – – – – – – –
Italy 0.06 0.02 0.04 130,000 <1,000 <500 3,600 <100 <200 – – – 58 80 94 – – – – –
Jamaica – – – 30,000 <500 1,300 1,700 <100 – 1,300 <100 <100 >95 35 >95 – 75 56 p 20 35
Japan – – – – – – – – – – – – – – – – – – – –
Jordan <0.01 <0.01 0.01 <500 – – <100 – <100 <100 – – – 55 – – – – – –
Kazakhstan 0.16 0.03 0.08 26,000 <500 <500 2,900 <100 <100 <1,000 <100 <100 87 31 89 >95 94 p – – 11
Kenya 1.46 0.87 2.69 1,600,000 120,000 140,000 62,000 6,100 14,000 36,000 4,800 3,300 80 64 65 – 64 26 27 35
Kiribati – – – – – – – – – – – – – – – – 29 x – – –
Kuwait 0.02 0.01 0.03 <500 – – <100 – <100 <100 – – – 80 – – – – – –
Kyrgyzstan 0.13 0.02 0.07 8,500 <200 <200 <1,000 <100 <100 <500 <100 <100 – 28 88 >95 – – – 11
Lao People's Democratic Republic
0.10 0.10 0.10 11,000 <1,000 <500 <1,000 <100 <100 <500 <100 <100 50 41 34 – – – 1 1
Latvia 0.23 0.02 0.63 6,600 <100 <200 <500 <100 <100 <500 <100 <100 >95 26 93 – – – – –
Lebanon 0.02 0.02 0.05 2,200 – – <200 – <100 <100 – – – 51 – – – – – –
Lesotho 12.68 7.57 13.73 330,000 – – 21,000 – 2,900 9,900 – – 66 53 – – 80 58 25 41
Liberia 0.66 0.47 1.49 43,000 4,200 5,000 2,900 <500 <1,000 2,800 <500 <500 70 19 11 – 22 p 27 4 13
Libya – – – – – – – – – – – – – – – – – – – –
Liechtenstein – – – – – – – – – – – – – – – – – – – –
Lithuania 0.09 <0.01 0.05 2,900 – – <500 – <100 <200 – – – 23 – – – – – –
Luxembourg 0.18 0.03 0.40 – – – <200 <100 <100 <100 <100 <100 56 – – – – – – –
Madagascar 0.18 0.09 0.37 31,000 1,900 3,200 4,300 <500 <1,000 1,600 <500 <100 3 5 2 52 5 6 p 1 2
Malawi 2.29 1.61 2.58 1,000,000 110,000 90,000 36,000 4,300 4,800 24,000 4,100 3,200 84 66 49 – 59 44 22 32
Malaysia 0.19 0.01 0.07 97,000 <500 <1,000 5,700 <100 <200 7,000 <100 <100 73 37 >95 71 – – – –
Maldives – – – – – – – – – – – – – – – – – – – –
Mali 0.33 0.51 0.62 110,000 14,000 9,900 5,900 1,600 1,200 6,100 <1,000 <500 35 35 21 7 47 26 1 8
Malta – – – <500 – – <100 – – <100 – – – 75 – – – – – –
Marshall Islands – – – – – – – – – – – – – – – – – – – –
Mauritania – – – 11,000 <1,000 <1,000 <500 <100 – <1,000 <100 <100 34 23 23 15 – – – –
Mauritius – – – – – – – – – – – – – – – – – – – –
Mexico 0.10 0.02 0.19 220,000 2,500 7,200 12,000 <500 2,200 4,200 <200 <100 58 60 74 28 – 36 p – 7
Micronesia (Federated States of) – – – – – – – – – – – – – – – – – – – –
Monaco – – – – – – – – – – – – – – – – – – – –
Mongolia 0.01 <0.01 0.02 <500 – – <100 – <100 <100 – – – 33 – – 78 p – – –
Montenegro 0.11 0.05 0.30 <500 – – <100 – <100 <100 – – – 60 – – 64 p – <0.1 0
Montserrat – – – – – – – – – – – – – – – – – – – –
Morocco 0.03 0.01 0.06 22,000 <500 <1,000 <1,000 <100 <200 <1,000 <100 <100 62 48 >95 – – – – –
Mozambique 3.63 2.77 3.03 1,800,000 200,000 120,000 83,000 13,000 9,000 62,000 9,200 4,400 80 54 38 – 39 43 p 10 25
Myanmar 0.22 0.12 0.49 230,000 9,300 11,000 11,000 <1,000 2,300 7,800 <500 <200 87 55 78 – – – 2 1
Namibia 4.37 1.32 5.31 230,000 15,000 13,000 9,600 <500 1,300 4,300 <500 <500 >95 64 66 – 75 61 14 29
Nauru – – – – – – – – – – – – – – – – – – – –
Nepal 0.03 0.02 0.02 32,000 1,200 <1,000 <1,000 <100 <100 1,700 <100 <100 64 40 83 – – – 3 3
TABLE 4. HIV/AIDS

UNICEF – THE STATE OF THE WORLD’S CHILDREN 2017
Countries and areas
HIV incidence per 1,000 uninfected population
2016
Epidemiology Intervention coverage
People living with HIV2016
New HIV infections2016
AIDS-related deaths2016
Preg-nant
women receiv-
ing ARVs
for PMTCT
(%)2016*
People living with HIV receiving antiretroviral
therapy (ART) (%)
2016*
Condom use among
adolescents with multiple partners
(%) 2011–2016*
Adolescents tested for HIV in the last
12 months and received results (%) 2011–2016*
All ages
chil-dren <5
adoles-cents 15–19 All ages
children <15
adoles-cents 10–19 All ages
children <5
adoles-cents 15–19 All ages
children <15
adoles-cents 10–19
All ages
chil-dren <15
adoles-cents 10–19 male female male female
Netherlands 0.03 <0.01 0.07 23,000 <100 <500 <500 <100 <100 <200 <100 <100 >95 80 >95 – – – – –
New Zealand – – – – – – – – – – – – – – – – – – – –
Nicaragua 0.06 0.01 0.13 8,900 <200 <500 <500 <100 <100 <500 <100 <100 >95 43 71 33 – – – –
Niger 0.09 0.13 0.18 48,000 5,800 4,400 1,800 <1,000 <500 3,400 <500 <500 52 32 17 14 – – 2 4
Nigeria 1.23 1.19 2.18 3,200,000 270,000 240,000 220,000 37,000 40,000 160,000 24,000 7,900 32 30 21 – 46 p 38 2 4
Niue – – – – – – – – – – – – – – – – – – – –
Norway – – – – – – – – – – – – – – – – – – – –
Oman – – – – – – – – – – – – – – – – – – – –
Pakistan 0.10 0.04 0.05 130,000 3,300 2,300 19,000 <1,000 <1,000 5,500 <500 <100 4 7 10 85 – – – –
Palau – – – – – – – – – – – – – – – – – – – –
Panama 0.34 0.08 0.70 21,000 – – 1,300 – <500 <1,000 – – – 54 – – – – – –
Papua New Guinea 0.37 0.42 0.27 46,000 3,400 2,000 2,800 <500 <500 1,100 <500 <100 33 52 37 – – – – –
Paraguay 0.20 0.05 0.38 19,000 <500 <1,000 1,300 <100 <500 <1,000 <100 <100 71 35 55 25 – 50 x – –
Peru – – – 70,000 1,300 2,400 2,700 <100 – 2,200 <100 <100 85 60 73 15 – 20 – –
Philippines 0.11 0.01 0.25 56,000 <500 5,200 10,000 <200 2,400 <1,000 <100 <100 12 32 10 3 – – – <0.1
Poland – – – – – – – – – – – – – – – – – – – –
Portugal – – – – – – – – – – – – – – – – – – – –
Qatar 0.02 0.03 0.04 <100 – – <100 – <100 <100 – – – 86 – – – – – –
Republic of Korea – – – – – – – – – – – – – – – – – – – –
Republic of Moldova 0.38 0.06 0.19 15,000 <200 <200 1,600 <100 <100 <500 <100 <100 >95 29 83 55 – – 6 10
Romania 0.04 <0.01 0.10 16,000 <100 <500 <1,000 <100 <200 <200 <100 <100 >95 68 >95 66 – – – –
Russian Federation – – – – – – – – – – – – – – – – – – – –
Rwanda 0.70 0.50 0.85 220,000 16,000 16,000 7,500 <1,000 <1,000 3,300 <1,000 <500 82 80 55 – – – 22 27
Saint Kitts and Nevis – – – – – – – – – – – – – – – – 54 x 50 x – –
Saint Lucia – – – – – – – – – – – – – – – – – – – 12
Saint Vincent and the Grenadines
– – – – – – – – – – – – – – – – – – – –
Samoa – – – – – – – – – – – – – – – – – – 1 x 0 x
San Marino – – – – – – – – – – – – – – – – – – – –
Sao Tome and Principe – – – – – – – – – – – – – – – – 79 – 8 22
Saudi Arabia 0.02 0.01 0.01 8,200 <500 <200 <500 <100 <100 <500 <100 <100 39 60 48 >95 – – – –
Senegal 0.08 0.16 0.12 41,000 4,800 2,900 1,100 <500 <200 1,900 <500 <200 55 52 26 31 – – 6 10
Serbia 0.03 0.01 0.06 2,700 – – <500 – <100 <100 – – – 62 – – 63 x – 1 x 1 x
Seychelles – – – – – – – – – – – – – – – – – – – –
Sierra Leone – – – 67,000 4,400 5,000 5,300 <500 – 2,800 <500 <200 87 26 18 – 24 10 3 11
Singapore – – – – – – – – – – – – – – – – – – – –
Slovakia 0.02 <0.01 0.04 <1,000 – – <200 – <100 <100 – – – 59 – – – – – –
Slovenia 0.03 <0.01 0.06 <1,000 – – <100 – <100 <100 – – – – – – – – – –
Solomon Islands – – – – – – – – – – – – – – – – 54 x,p 15 x,p – –
Somalia 0.17 0.18 0.13 24,000 2,500 1,400 1,800 <500 <200 1,700 <500 <100 7 11 5 – – – – –
South Africa 5.58 2.19 10.51 7,100,000 320,000 370,000 270,000 12,000 50,000 110,000 9,300 6,200 >95 56 55 – 88 – 29 38
South Sudan 1.35 1.25 1.08 200,000 18,000 10,000 16,000 2,400 1,500 13,000 1,700 <500 29 10 5 – – 6 x,p – 4 x
Spain 0.09 <0.01 0.21 140,000 <100 1,200 3,900 <100 <500 – – – >95 77 >95 – – – – –
Sri Lanka 0.03 <0.01 0.06 4,000 – – <1,000 – <100 <200 – – – 27 – – – – – –
State of Palestine – – – – – – – – – – – – – – – – – – – –
Sudan 0.13 0.10 0.26 56,000 3,000 3,800 5,000 <1,000 1,100 3,000 <500 <100 4 10 16 – – – – –
Suriname 0.62 0.17 1.35 4,900 <200 <500 <500 <100 <100 <200 <100 <100 89 48 81 36 – 86 x,p – 11 x
Swaziland 9.37 4.50 11.91 220,000 15,000 15,000 8,800 <1,000 1,400 3,900 <1,000 <500 95 79 64 91 – – 30 41
Sweden 0.06 <0.01 0.14 11,000 <100 <200 <1,000 <100 <100 <100 <100 <100 >95 83 >95 – – – – –
Switzerland – – – – – – – – – – – – – – – – – – – –
Syrian Arab Republic – – – – – – – – – – – – – – – – – – – –
Tajikistan 0.15 0.02 0.07 14,000 <500 <500 1,300 <100 <100 <1,000 <100 <100 85 30 88 90 – – – 1
Thailand 0.10 0.01 0.23 450,000 4,100 9,700 6,400 <100 <1,000 16,000 <100 <100 95 69 86 >95 – – 4 6
The former Yugoslav Republic of Macedonia
0.02 <0.01 0.03 <500 – – <100 – <100 <100 – – – 48 – – – – – –
Timor-Leste – – – – – – – – – – – – – – – – – – – –
Togo 0.59 0.65 0.49 100,000 12,000 7,600 4,100 <1,000 <500 5,100 <1,000 <500 86 51 26 27 – – 7 11
Tokelau – – – – – – – – – – – – – – – – – – – –
Tonga – – – – – – – – – – – – – – – – – – 2 0
Trinidad and Tobago 0.29 0.05 0.60 11,000 <100 <500 <500 <100 <100 <500 <100 <100 95 62 >95 – – – – –
Tunisia 0.03 0.01 0.06 2,900 – – <500 – <100 <100 – – – 29 – – – – – <0.1
Turkey – – – – – – – – – – – – – – – – – – – –
Turkmenistan – – – – – – – – – – – – – – – – – – – 5
Turks and Caicos Islands – – – – – – – – – – – – – – – – – – – –
Tuvalu – – – – – – – – – – – – – – – – – – – –
TABLE 4. HIV/AIDS

169
Countries and areas
HIV incidence per 1,000 uninfected population
2016
Epidemiology Intervention coverage
People living with HIV2016
New HIV infections2016
AIDS-related deaths2016
Preg-nant
women receiv-
ing ARVs
for PMTCT
(%)2016*
People living with HIV receiving antiretroviral
therapy (ART) (%)
2016*
Condom use among
adolescents with multiple partners
(%) 2011–2016*
Adolescents tested for HIV in the last
12 months and received results (%) 2011–2016*
All ages
chil-dren <5
adoles-cents 15–19 All ages
children <15
adoles-cents 10–19 All ages
children <5
adoles-cents 15–19 All ages
children <15
adoles-cents 10–19
All ages
chil-dren <15
adoles-cents 10–19 male female male female
Uganda 1.50 0.69 2.55 1,400,000 130,000 120,000 52,000 4,600 10,000 28,000 5,800 3,800 >95 67 47 – 52 26 28 39
Ukraine 0.38 0.17 0.57 240,000 4,000 5,100 17,000 <500 1,200 8,500 <200 <100 84 37 64 – 90 – 10 7
United Arab Emirates – – – – – – – – – – – – – – – – – – – –
United Kingdom – – – – – – – – – – – – – – – – – – – –
United Republic of Tanzania 1.19 1.28 1.04 1,400,000 110,000 98,000 55,000 10,000 5,500 33,000 6,500 3,200 84 62 48 – 45 38 13 21
United States – – – – – – – – – – – – – – – – – – – –
Uruguay – – – 12,000 <100 <500 <1,000 <100 – <500 <100 <100 83 53 >95 – – 67 p – 7
Uzbekistan – – – – – – – – – – – – – – – – – – – –
Vanuatu – – – – – – – – – – – – – – – – – – – –
Venezuela (Bolivarian Republic of)
0.21 0.10 0.44 120,000 2,500 4,400 6,500 <500 1,200 2,500 <200 <100 48 – – – – – – –
Viet Nam 0.12 0.04 0.06 250,000 5,800 3,200 11,000 <500 <500 8,000 <200 <100 66 47 84 – – – – 4
Yemen 0.04 0.02 0.08 9,900 <500 <1,000 1,100 <100 <500 <500 <100 <100 8 18 21 – – – – –
Zambia 4.08 3.28 6.46 1,200,000 94,000 95,000 59,000 8,900 11,000 21,000 5,700 2,300 83 65 52 – 38 33 19 33
Zimbabwe 3.03 1.36 3.50 1,300,000 – – 40,000 – 5,800 30,000 – – 93 75 – – 71 – 19 30
SUMMARYEast Asia and Pacific 0.07 0.03 0.11 2,800,000 48,000 60,000 160,000 5,100 15,000 100,000 3,000 <1,000 54 48 62 – – – – –
Europe & Central Asia 0.25 0.02 0.19 2,400,000 – – 220,000 – 9,900 49,000 – – – 46 – – – – – –
Eastern Europe & Central Asia 0.47 0.03 0.28 1,600,000 – – 190,000 – 7,200 41,000 – – – 29 – – – – – –
Western Europe 0.06 0.01 0.11 840,000 – – 29,000 – 2,700 8,400 – – – 77 – – – – – –
Latin America and Caribbean 0.19 0.05 0.36 2,100,000 34,000 77,000 120,000 2,600 19,000 45,000 2,000 <1,000 75 57 53 – – – – –
Middle East and North Africa 0.03 0.01 0.04 150,000 3,000 4,000 11,000 <500 1,100 6,300 <200 <100 37 33 62 – – – – –
North America – 0.01 0.24 – – – – – – – – – – – – – – – – –
South Asia 0.06 0.02 0.03 2,300,000 140,000 130,000 100,000 10,000 18,000 71,000 7,600 3,100 38 46 33 – – – – –
Sub-Saharan Africa 1.23 0.87 1.83 25,700,000 1,900,000 1,700,000 1,200,000 140,000 190,000 730,000 100,000 50,000 78 54 42 – 49 32 10 15
Eastern and Southern Africa 1.68 1.01 2.34 19,600,000 1,400,000 1,300,000 800,000 79,000 130,000 420,000 59,000 34,000 88 60 51 – 54 – 16 24
West and Central Africa 0.78 0.74 1.25 6,100,000 540,000 450,000 360,000 60,000 62,000 300,000 43,000 16,000 49 34 21 – 43 32 3 6
Least developed countries 0.54 0.46 0.70 10,800,000 980,000 800,000 490,000 69,000 68,000 320,000 52,000 27,000 81 56 40 – – – 8 13
World 0.26 0.29 0.55 36,700,000 2,100,000 2,100,000 1,800,000 160,000 260,000 1,000,000 120,000 55,000 76 53 43 – – – – –
For a complete list of countries and areas in the regions, subregions and country categories, see page 150 or visit <data.unicef.org/regionalclassifications>.It is not advisable to compare data from consecutive editions of The State of the World’s Children.
HIV incidence per 1,000 uninfected population – Estimated number of new HIV infections per 1,000 uninfected population, 2016. Data reported for children (aged <5), adolescents (aged 15–19) and all ages.People living with HIV – Estimated number of people living with HIV, 2016. Data reported for children (aged 0–14), adolescents (aged 10–19) and all ages.New HIV infections – Estimated number of new HIV infections, 2016. Data reported for children (aged <5), adolescents (aged 15–19) and all ages.AIDS-related deaths – Estimated number of AIDS-related deaths, 2016. Data reported for children (aged 0–14), adolescents (aged 10–19) and all ages.Pregnant women receiving ARVs for PMTCT – Per cent of the estimated number of pregnant women living with HIV receiving effective regimens (excludes single-dose nevirapine)
of antiretroviral medicines (ARVs) for preventing mother-to-child transmission (PMTCT) of HIV, 2016. People living with HIV receiving ART – Per cent of the estimated number of people living with HIV receiving antiretroviral therapy (ART), 2016. Data reported for children (aged 0–14), adolescents (aged 10–19) and all ages. Condom use among adolescents with multiple partners– Among adolescent males and females (aged 15–19) who reported having had more than one sexual partner in the last 12 months, the percentage who reported the use of a condom the last time they had sex with any partner, 2011–2016.Adolescents tested for HIV in the last 12 months and received results – Percentage of adolescent boys and girls (aged 15–19) who were tested for HIV in the last 12 months and received the result of the most recent test, 2011–2016.
HIV incidence per 1,000 uninfected population – UNAIDS 2017 estimates, July 2017.People living with HIV – UNAIDS 2017 estimates, July 2017.New HIV infections – UNAIDS 2017 estimates, July 2017.AIDS-related deaths – UNAIDS 2017 estimates, July 2017.Pregnant women receiving ARVs for PMTCT – UNAIDS 2017 estimates, July 2017.
People living with HIV receiving ART – UNAIDS 2017 estimates, July 2017.Condom use among adolescents with multiple partners – UNICEF global databases based on Multiple Indicator Cluster Surveys (MICS), Demographic and Health Surveys (DHS), AIDS Indicator Surveys (AIS), and other national household surveys.Adolescents tested for HIV in the last 12 months and received results – UNICEF global databases based on MICS, DHS, AIS, and other national household surveys.
– Data not available.x Data refer to years or periods other
than those specified in the column heading. Such data are not included in the calculation of regional and global averages. Estimates from years prior to 2006 are not displayed.
p Based on small denominators (typically 25–49 unweighted cases). No data based on fewer than 25 unweighted cases are displayed.
* Data refer to the most recent year available during the period specified in the column heading.
NOTES
DEFINITIONS OF THE INDICATORS MAIN DATA SOURCES
TABLE 4. HIV/AIDS

UNICEF – THE STATE OF THE WORLD’S CHILDREN 2017
Youth (15–24 years) literacy
rate (%)Number per 100
population
Pre-primary school
participation Primary school participationLower secondary school
participation
Gross enrolment ratio (%)
Gross enrolment ratio (%)
Net enrolment ratio (%)
Net attendance ratio (%)
Out-of-school rate of children of primary
school age (%)
Survival rate to last primary
grade (%) Net enrolment
ratio (%)Net attendance
ratio (%)
Countries and areas
2011–2016* 2016 2011–2016* 2011–2016* 2011–2016* 2011–2016* 2011–2016* 2011–2016* 2011–2016* 2011–2016*
male femalemobile phones
internet users male female male female male female male female male female male female male female male female
Afghanistan 62 32 66 11 – – 132 91 – – 73 53 – – – – 62 38 48 28Albania 99 99 105 66 90 87 116 112 96 95 92 93 3 5 95 96 91 90 90 x 92 xAlgeria 96 x 92 x 117 43 79 79 120 113 – – 98 97 – – 93 95 – – 82 85Andorra 100 100 87 98 – – – – – – – – – – 71 70 – – – –Angola 85 71 55 13 64 94 157 100 95 73 76 76 5 27 – – – – 32 31Anguilla – – 178 x 82 – – – – – – – – – – – – – – – –Antigua and Barbuda – – 194 73 97 95 100 94 88 86 – – 9 10 – – 78 82 – –Argentina 99 99 151 70 72 73 110 110 100 99 98 99 0 1 96 96 – – 75 77Armenia 100 100 115 62 52 53 98 98 96 96 100 99 3 4 100 99 – – 97 98Australia – – 110 88 127 123 102 102 97 97 – – 3 3 – – – – – –Austria – – 166 84 103 104 104 102 – – – – – – 99 100 – – – –Azerbaijan 100 100 106 78 24 24 107 106 95 93 69 y 67 y 5 7 100 95 85 82 – –Bahamas – – 92 80 – – – – – – – – – – – – – – – –Bahrain 99 x 98 x 217 98 56 55 101 102 96 97 86 x 87 x 2 2 99 97 90 88 – –Bangladesh 91 94 78 18 31 31 116 125 – – 90 93 – – – – 61 75 51 60Barbados – – 115 80 83 86 93 94 90 92 100 99 9 8 – – 80 87 89 89Belarus 100 x 100 x 124 71 106 101 101 101 95 96 93 90 5 4 98 99 – – 94 97Belgium – – 111 87 117 116 104 104 99 99 – – 1 1 92 95 85 87 – –Belize – – 64 45 49 50 116 110 97 95 96 97 0 1 96 94 70 73 – –Benin 64 41 80 12 24 24 134 124 100 88 77 72 0 12 59 56 49 41 40 34Bhutan 90 84 89 42 25 27 97 103 85 87 96 95 12 10 78 79 57 67 52 54Bolivia (Plurinational State of) 99 99 91 40 71 71 98 96 89 88 97 x 97 x 9 11 96 97 64 66 – –Bosnia and Herzegovina 100 100 89 69 – – – – – – 97 95 – – 96 98 – – 94 96Botswana 92 x 96 x 159 39 18 18 109 106 90 92 – – 9 8 93 95 46 57 – –Brazil 98 99 119 60 93 92 117 114 92 93 97 97 6 5 – – 76 80 – –British Virgin Islands – – 199 x 38 x – – – – – – – – – – – – – – – –Brunei Darussalam 99 100 121 75 71 73 108 108 – – – – – – 98 95 – – – –Bulgaria 98 98 127 60 84 82 98 97 94 93 – – 5 5 96 96 81 78 – –Burkina Faso 57 44 84 14 4 4 90 86 71 67 54 50 29 32 62 71 27 26 19 17Burundi 85 75 48 5 13 13 123 124 93 95 85 84 6 4 41 48 21 25 12 11Cabo Verde 98 99 122 48 74 73 113 107 97 97 – – 3 3 88 90 66 75 – –Cambodia 88 x 86 x 125 26 17 19 117 116 94 96 92 94 6 4 41 55 44 49 47 54Cameroon 85 x 76 x 68 25 38 38 123 111 97 87 87 84 0 9 65 67 44 40 51 49Canada – – 84 90 74 73 100 101 – – – – – – – – – – – –Central African Republic 49 x 27 x 25 4 6 6 107 80 79 62 78 68 21 38 47 45 16 9 17 13Chad 41 22 44 5 1 1 115 88 89 69 53 47 11 31 54 46 – – 16 11Chile 99 99 127 66 88 86 103 100 94 94 91 y 92 y 6 6 99 100 75 82 – –China 100 x 100 x 97 53 83 84 104 104 – – 97 y 97 y – – – – – – – –Colombia 98 99 117 58 85 84 115 112 91 91 94 95 7 7 86 91 72 78 74 81Comoros 74 70 58 8 20 21 107 99 81 78 84 84 17 20 65 78 38 42 45 52Congo 86 77 113 8 14 14 107 115 88 95 96 97 11 3 – – – – 65 61Cook Islands – – 56 x 54 84 97 106 99 97 93 – – 2 3 79 74 90 91 – –Costa Rica 99 99 159 66 53 52 110 109 97 96 96 96 3 4 93 95 74 76 71 73Côte d'Ivoire 59 47 126 27 7 7 99 88 84 75 79 74 16 25 85 80 39 28 26 20Croatia 100 100 104 73 64 61 98 98 89 89 – – 3 0 99 99 91 92 – –Cuba 100 100 35 39 102 103 100 95 92 92 – – 8 8 94 95 91 95 – –Cyprus 100 100 134 76 81 80 99 99 97 98 – – 2 2 98 97 94 95 – –Czechia – – 115 76 107 104 100 100 – – – – – – 99 100 – – – –Democratic People's Republic of Korea 100 x 100 x 14 0 x 51 51 – – – – 99 99 – – – – 57 57 – –
Democratic Republic of the Congo 91 80 39 6 4 4 112 102 – – 88 85 – – 56 55 – – 39 31Denmark – – 123 97 96 96 102 101 98 98 – – 1 1 100 100 89 94 – –Djibouti – – 38 13 5 5 69 62 61 54 71 y 68 y 39 46 80 71 44 37 – –Dominica – – 107 67 87 88 117 115 – – – – – – 81 77 – – – –Dominican Republic 97 98 81 61 43 45 108 99 88 86 94 96 11 12 77 81 48 58 58 72Ecuador 99 99 84 54 70 73 107 114 91 93 97 y 97 y 3 1 81 83 74 78 – –Egypt 94 90 114 39 31 30 104 104 98 98 97 97 1 1 – – 83 88 84 86El Salvador 97 98 141 29 71 73 111 107 91 92 95 96 8 7 76 80 67 72 69 73Equatorial Guinea 98 x 97 x 66 24 58 58 80 78 55 56 61 x 60 x 43 43 72 72 22 24 – –Eritrea 91 x 83 x 7 1 13 13 53 46 41 37 83 y 79 y 59 63 72 74 20 19 63 y 55 yEstonia 100 100 149 87 90 87 98 99 94 95 – – 6 4 98 98 – – – –Ethiopia 63 x 47 x 51 15 31 30 107 97 89 82 64 y 67 y 11 17 37 39 35 33 21 26Fiji – – 103 47 – – 106 105 97 98 – – 2 2 98 96 87 91 – –
TABLE 5. EDUCATION

171TABLE 5. EDUCATION
Youth (15–24 years) literacy
rate (%)Number per 100
population
Pre-primary school
participation Primary school participationLower secondary school
participation
Gross enrolment ratio (%)
Gross enrolment ratio (%)
Net enrolment ratio (%)
Net attendance ratio (%)
Out-of-school rate of children of primary
school age (%)
Survival rate to last primary
grade (%) Net enrolment
ratio (%)Net attendance
ratio (%)
Countries and areas
2011–2016* 2016 2011–2016* 2011–2016* 2011–2016* 2011–2016* 2011–2016* 2011–2016* 2011–2016* 2011–2016*
male femalemobile phones
internet users male female male female male female male female male female male female male female male female
Finland – – 134 88 79 79 102 101 99 100 – – 1 0 100 100 96 97 – –France – – 103 86 109 109 106 105 99 99 – – 1 0 – – – – – –Gabon 87 89 144 48 36 38 144 140 – – 97 98 – – – – – – 51 59Gambia 66 56 140 19 37 39 90 94 71 78 65 66 28 20 73 77 35 41 32 32Georgia 100 100 129 50 – – 116 118 – – 98 97 – – 99 99 93 91 99 y 99 yGermany – – 115 90 112 111 105 105 – – – – – – 97 96 – – – –Ghana 88 x 83 x 139 35 117 119 107 110 87 88 70 70 13 11 85 82 50 50 33 35Greece 99 99 113 69 49 49 98 97 97 96 – – 3 4 92 92 95 94 – –Grenada – – 111 56 89 83 107 103 96 95 – – 2 2 – – 79 82 – –Guatemala 95 93 115 35 44 45 104 100 86 85 94 93 12 12 75 74 47 46 54 50Guinea 57 37 85 10 15 15 99 84 81 70 63 58 16 28 67 65 35 24 32 26Guinea-Bissau 71 50 70 4 – – – – – – 62 62 – – – – – – 10 9Guyana 96 97 66 36 95 93 87 84 83 80 97 97 14 16 90 95 77 75 92 95Haiti 74 x 70 x 61 12 – – – – – – 83 84 – – – – – – 19 26Holy See – – – – – – – – – – – – – – – – – – – –Honduras 95 97 91 30 45 47 111 110 92 94 95 y 92 y 7 6 74 82 43 50 48 57Hungary – – 119 79 80 78 102 101 91 90 – – 4 4 98 98 90 89 – –Iceland – – 118 98 97 97 100 99 100 99 – – 0 1 97 99 96 98 – –India 90 82 87 30 13 12 103 115 92 93 85 x 82 x 3 2 82 81 64 69 – –Indonesia 100 100 149 25 57 59 107 104 90 89 99 99 9 10 – – 74 79 85 y 89 yIran (Islamic Republic of) 98 98 100 53 51 50 106 112 – – 96 97 – – 98 97 90 92 – –Iraq 57 49 82 21 – – – – – – 93 87 – – – – – – 51 47Ireland – – 104 82 95 99 101 102 94 95 – – 2 0 – – – – – –Israel – – 132 80 111 111 104 105 97 98 – – 3 2 100 98 – – – –Italy 100 100 140 61 100 97 101 101 98 97 – – 1 1 99 99 – – – –Jamaica – – 116 45 96 103 – – – – 97 99 – – 93 96 68 78 92 92Japan – – 130 92 – – 101 101 100 100 – – 0 0 100 100 – – – –Jordan 99 99 196 62 33 32 97 98 89 89 98 98 11 11 – – 82 83 92 94Kazakhstan 100 x 100 x 150 77 59 60 109 111 88 87 100 100 0 0 99 99 – – 99 100Kenya 87 86 81 26 77 76 109 109 83 87 84 87 16 12 – – – – 38 46Kiribati – – 51 14 – – 103 106 – – 83 87 – – – – 68 88 – –Kuwait 99 99 147 78 82 80 102 103 93 93 – – 2 1 95 96 81 88 – –Kyrgyzstan 100 x 100 x 131 35 28 28 108 107 90 88 99 99 2 3 96 97 88 87 98 98Lao People's Democratic Republic 77 67 55 22 35 36 114 109 93 92 85 85 7 8 77 80 55 57 40 44Latvia 100 100 131 80 89 88 100 99 96 96 – – 3 3 95 95 – – – –Lebanon 99 x 99 x 96 76 80 75 97 88 85 79 98 98 14 19 87 94 67 67 – –Lesotho 80 94 107 27 33 35 107 104 79 82 90 94 21 18 57 74 22 39 20 37Liberia 63 x 37 x 83 7 159 153 99 89 39 36 42 43 61 64 – – 7 6 14 15Libya – – 120 20 – – – – – – – – – – – – – – – –Liechtenstein – – 116 98 102 106 106 105 91 90 – – 3 2 – – 90 84 – –Lithuania 100 100 141 74 92 91 103 104 98 98 – – 1 0 98 98 97 96 – –Luxembourg – – 148 97 94 93 97 97 93 93 – – 4 4 82 84 83 87 – –Madagascar 78 75 42 5 17 19 149 149 – – 68 y 71 y – – 41 44 28 31 22 x 25 xMalawi 72 73 40 10 81 82 144 147 – – 93 95 – – 54 55 29 30 25 31Malaysia 98 x 98 x 141 79 92 96 102 102 98 98 – – 2 2 92 92 85 89 – –Maldives 99 99 223 59 101 102 97 – 94 96 94 95 6 4 80 84 70 67 64 x 78 xMali 61 39 120 11 4 4 79 72 59 52 55 51 36 43 64 59 33 28 34 26Malta 98 99 125 77 109 113 102 105 97 100 – – 3 0 95 98 96 96 – –Marshall Islands 98 99 29 x 30 40 41 93 93 75 79 – – 24 19 – – 58 64 – –Mauritania 66 x 48 x 87 18 9 12 100 105 77 81 58 62 22 18 65 63 22 21 21 20Mauritius 98 99 144 53 103 105 102 104 95 97 – – 5 3 96 96 82 86 – –Mexico 99 99 88 60 68 70 104 103 95 95 98 98 3 2 95 96 79 82 86 89Micronesia (Federated States of) – – 22 33 34 32 95 96 83 85 – – 17 15 – – 49 56 – –Monaco – – 86 95 – – – – – – – – – – – – – – – –Mongolia 98 x 99 x 114 22 85 86 102 100 97 96 98 99 2 3 – – – – 91 95Montenegro 99 99 167 70 57 54 95 93 93 92 98 98 6 7 80 81 93 93 93 96Montserrat – – 97 x 55 x – – – – – – – – – – – – – – – –Morocco 95 88 121 58 63 51 118 112 99 98 91 x 88 x 1 1 91 87 62 63 – –Mozambique 80 x 57 x 66 18 – – 110 101 91 87 71 72 9 13 34 32 17 19 15 17Myanmar 85 84 89 25 23 24 101 98 – – 93 92 – – – – 53 52 67 71Namibia 93 95 109 31 21 22 113 110 88 91 92 93 11 8 89 92 41 55 54 67Nauru – – 97 54 x 85 96 110 100 88 84 97 y 98 y 11 16 – – 66 71 – –

UNICEF – THE STATE OF THE WORLD’S CHILDREN 2017
Youth (15–24 years) literacy
rate (%)Number per 100
population
Pre-primary school
participation Primary school participationLower secondary school
participation
Gross enrolment ratio (%)
Gross enrolment ratio (%)
Net enrolment ratio (%)
Net attendance ratio (%)
Out-of-school rate of children of primary
school age (%)
Survival rate to last primary
grade (%) Net enrolment
ratio (%)Net attendance
ratio (%)
Countries and areas
2011–2016* 2016 2011–2016* 2011–2016* 2011–2016* 2011–2016* 2011–2016* 2011–2016* 2011–2016* 2011–2016*
male femalemobile phones
internet users male female male female male female male female male female male female male female male female
Nepal 90 80 112 20 85 83 131 141 97 97 76 76 3 3 75 78 55 53 42 46Netherlands – – 130 90 95 97 105 104 98 99 – – 2 1 – – – – – –New Zealand – – 125 88 93 93 100 99 99 99 – – 1 1 – – 97 98 – –Nicaragua 85 x 89 x 122 25 – – – – – – 71 x,y 70 x,y – – – – – – – –Niger 35 15 49 4 7 8 78 67 67 57 55 46 32 42 63 66 23 16 21 17Nigeria 76 x 58 x 82 26 – – 94 93 – – 70 66 – – – – – – 50 49Niue – – 38 x 80 x 113 125 147 120 – – 100 100 – – – – – – – –Norway – – 110 97 97 98 101 100 100 100 – – 0 0 99 100 99 99 – –Oman 99 99 159 70 55 56 107 111 95 94 97 98 2 2 98 99 81 86 – –Pakistan 80 66 71 16 77 67 100 85 79 68 67 60 21 32 64 64 58 48 36 34Palau 98 99 91 x – 71 77 100 112 74 87 – – 26 13 – – 33 38 – –Panama 98 x 97 x 172 54 48 49 104 101 94 93 97 97 6 7 85 87 71 74 78 86Papua New Guinea 69 x 64 x 49 10 – – 120 109 89 83 – – 10 16 – – 17 14 – –Paraguay 98 99 105 51 38 38 108 104 89 88 90 y 91 y 11 11 83 86 58 63 – –Peru 99 99 117 45 88 89 102 102 94 94 92 y 91 y 2 2 89 92 71 72 85 87Philippines 97 99 109 56 – – 117 117 94 98 88 x 89 x 5 1 – – 58 70 – –Poland – – 146 73 79 79 100 101 96 96 – – 3 3 98 98 93 94 – –Portugal 99 99 109 70 94 93 109 105 98 98 – – 2 2 – – – – – –Qatar 98 100 147 94 58 60 102 104 92 93 96 97 4 3 99 96 76 83 – –Republic of Korea – – 123 93 94 94 99 99 98 98 – – 1 1 99 100 98 97 – –Republic of Moldova 99 100 111 71 84 83 93 92 87 86 99 98 10 10 95 95 83 82 96 97Romania 99 99 106 60 91 91 91 89 87 87 92 y 91 y 10 10 94 94 84 83 90 y 90 yRussian Federation 100 x 100 x 163 76 88 86 100 101 96 97 – – 3 2 99 100 97 98 – –Rwanda 81 83 70 20 18 18 132 133 94 96 93 96 6 4 41 48 19 24 25 34Saint Kitts and Nevis – – 137 77 91 81 82 83 77 80 – – 21 18 96 95 80 82 – –Saint Lucia – – 95 47 56 59 – – – – 100 99 – – 90 90 74 75 95 90Saint Vincent and the Grenadines – – 103 56 93 93 106 103 94 94 – – 1 1 – – 88 89 – –Samoa 99 99 69 29 39 42 107 107 96 96 88 y 89 y 3 2 92 89 66 68 – –San Marino – – 114 50 x 106 108 94 93 93 92 – – 7 7 95 98 91 94 – –Sao Tome and Principe 97 96 85 28 52 56 118 111 96 94 94 94 3 5 – – 50 60 46 57Saudi Arabia 99 99 158 74 17 18 108 111 97 98 – – 3 2 – – 76 70 – –Senegal 61 51 99 26 14 16 78 87 68 75 53 55 30 24 56 60 39 42 27 30Serbia 100 100 121 67 59 58 101 101 96 96 99 99 1 1 100 97 97 97 97 96Seychelles 99 x 99 x 161 57 88 93 101 104 94 96 – – 5 4 – – – – – –Sierra Leone 65 51 98 12 10 11 127 128 99 99 74 78 1 1 48 48 31 29 36 36Singapore 100 100 147 81 – – – – – – – – – – – – – – – –Slovakia – – 128 80 95 93 100 99 – – – – – – 99 99 – – – –Slovenia – – 115 75 95 92 99 99 97 98 – – 3 2 99 99 95 97 – –Solomon Islands – – 70 11 100 100 115 114 70 71 65 68 30 29 68 78 23 25 – –Somalia – – 58 2 – – – – – – 24 x 19 x – – – – – – – –South Africa 99 99 142 54 77 78 102 97 – – 97 97 – – – – – – – –South Sudan 44 x 30 x 25 x 16 x 10 10 75 53 35 27 26 21 65 73 – – 1 1 6 3Spain 100 100 110 81 97 96 104 106 99 100 – – 1 0 97 98 – – – –Sri Lanka 98 x 99 x 118 32 93 93 103 101 98 96 – – 2 4 99 99 96 96 – –State of Palestine 99 99 77 61 53 52 94 94 90 91 99 99 8 7 94 99 83 87 92 97Sudan 69 x 63 x 69 28 36 48 74 67 52 55 69 67 47 44 80 79 – – 31 32Suriname 98 97 146 45 90 97 124 121 93 94 95 96 6 5 85 98 50 61 46 61Swaziland 92 x 95 x 76 29 25 26 118 108 80 79 97 98 20 20 72 77 20 31 33 48Sweden – – 127 92 94 94 121 126 99 99 – – 0 0 99 100 – – – –Switzerland – – 136 89 105 104 104 104 93 93 – – 1 0 – – 87 87 – –Syrian Arab Republic 95 x 90 x 54 32 6 6 81 79 67 66 97 x 96 x 28 30 93 93 53 52 – –Tajikistan 100 x 100 x 107 20 12 10 100 98 97 98 85 86 2 0 99 99 98 95 86 84Thailand 98 98 173 48 74 64 106 99 94 87 95 95 6 13 – – 79 79 83 86The former Yugoslav Republic of Macedonia – 98 x 101 72 36 36 94 93 91 91 98 98 9 9 97 96 78 76 86 85
Timor-Leste 80 x 79 x 125 25 18 20 137 136 94 97 71 73 5 1 81 84 39 48 30 34Togo 90 78 75 11 17 18 125 118 94 88 90 87 4 10 55 53 – – 45 40Tokelau – – 0 x 1 x 175 160 121 – – – – – – – – – – – – –Tonga 99 100 75 40 39 38 109 107 92 94 93 y 93 y 5 3 – – 78 84 – –Trinidad and Tobago – – 161 73 – – – – – – 98 x 98 x – – – – – – – –Tunisia 97 96 126 51 44 44 116 113 – – 98 98 – – 93 95 80 85 76 85Turkey 100 99 97 58 30 28 103 102 95 94 94 97 5 6 88 88 88 86 – –Turkmenistan – – 158 18 64 62 90 89 – – 98 98 – – – – – – 98 98
TABLE 5. EDUCATION
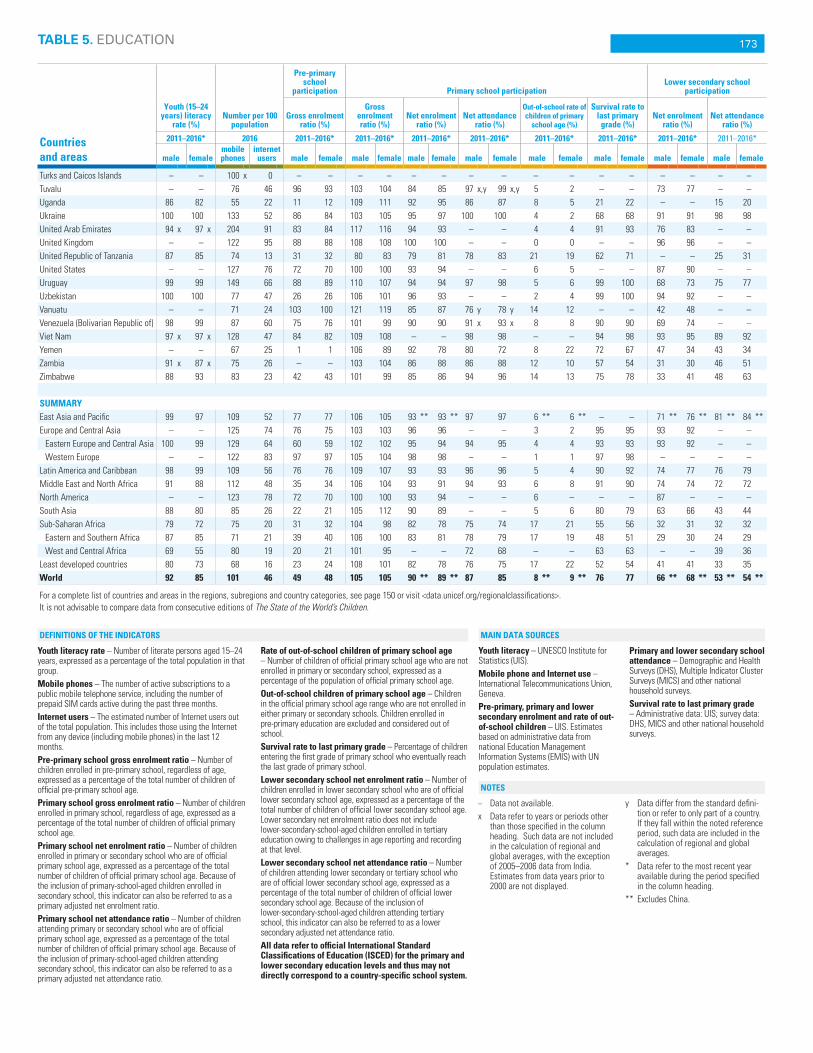
173TABLE 5. EDUCATION
Youth (15–24 years) literacy
rate (%)Number per 100
population
Pre-primary school
participation Primary school participationLower secondary school
participation
Gross enrolment ratio (%)
Gross enrolment ratio (%)
Net enrolment ratio (%)
Net attendance ratio (%)
Out-of-school rate of children of primary
school age (%)
Survival rate to last primary
grade (%) Net enrolment
ratio (%)Net attendance
ratio (%)
Countries and areas
2011–2016* 2016 2011–2016* 2011–2016* 2011–2016* 2011–2016* 2011–2016* 2011–2016* 2011–2016* 2011–2016*
male femalemobile phones
internet users male female male female male female male female male female male female male female male female
Turks and Caicos Islands – – 100 x 0 – – – – – – – – – – – – – – – –Tuvalu – – 76 46 96 93 103 104 84 85 97 x,y 99 x,y 5 2 – – 73 77 – –Uganda 86 82 55 22 11 12 109 111 92 95 86 87 8 5 21 22 – – 15 20Ukraine 100 100 133 52 86 84 103 105 95 97 100 100 4 2 68 68 91 91 98 98United Arab Emirates 94 x 97 x 204 91 83 84 117 116 94 93 – – 4 4 91 93 76 83 – –United Kingdom – – 122 95 88 88 108 108 100 100 – – 0 0 – – 96 96 – –United Republic of Tanzania 87 85 74 13 31 32 80 83 79 81 78 83 21 19 62 71 – – 25 31United States – – 127 76 72 70 100 100 93 94 – – 6 5 – – 87 90 – –Uruguay 99 99 149 66 88 89 110 107 94 94 97 98 5 6 99 100 68 73 75 77Uzbekistan 100 100 77 47 26 26 106 101 96 93 – – 2 4 99 100 94 92 – –Vanuatu – – 71 24 103 100 121 119 85 87 76 y 78 y 14 12 – – 42 48 – –Venezuela (Bolivarian Republic of) 98 99 87 60 75 76 101 99 90 90 91 x 93 x 8 8 90 90 69 74 – –Viet Nam 97 x 97 x 128 47 84 82 109 108 – – 98 98 – – 94 98 93 95 89 92Yemen – – 67 25 1 1 106 89 92 78 80 72 8 22 72 67 47 34 43 34Zambia 91 x 87 x 75 26 – – 103 104 86 88 86 88 12 10 57 54 31 30 46 51Zimbabwe 88 93 83 23 42 43 101 99 85 86 94 96 14 13 75 78 33 41 48 63
SUMMARYEast Asia and Pacific 99 97 109 52 77 77 106 105 93 ** 93 ** 97 97 6 ** 6 ** – – 71 ** 76 ** 81 ** 84 **Europe and Central Asia – – 125 74 76 75 103 103 96 96 – – 3 2 95 95 93 92 – –
Eastern Europe and Central Asia 100 99 129 64 60 59 102 102 95 94 94 95 4 4 93 93 93 92 – –Western Europe – – 122 83 97 97 105 104 98 98 – – 1 1 97 98 – – – –
Latin America and Caribbean 98 99 109 56 76 76 109 107 93 93 96 96 5 4 90 92 74 77 76 79Middle East and North Africa 91 88 112 48 35 34 106 104 93 91 94 93 6 8 91 90 74 74 72 72North America – – 123 78 72 70 100 100 93 94 – – 6 – – – 87 – – –South Asia 88 80 85 26 22 21 105 112 90 89 – – 5 6 80 79 63 66 43 44Sub-Saharan Africa 79 72 75 20 31 32 104 98 82 78 75 74 17 21 55 56 32 31 32 32
Eastern and Southern Africa 87 85 71 21 39 40 106 100 83 81 78 79 17 19 48 51 29 30 24 29West and Central Africa 69 55 80 19 20 21 101 95 – – 72 68 – – 63 63 – – 39 36
Least developed countries 80 73 68 16 23 24 108 101 82 78 76 75 17 22 52 54 41 41 33 35World 92 85 101 46 49 48 105 105 90 ** 89 ** 87 85 8 ** 9 ** 76 77 66 ** 68 ** 53 ** 54 **
For a complete list of countries and areas in the regions, subregions and country categories, see page 150 or visit <data.unicef.org/regionalclassifications>.It is not advisable to compare data from consecutive editions of The State of the World’s Children.
Youth literacy rate – Number of literate persons aged 15–24 years, expressed as a percentage of the total population in that group.Mobile phones – The number of active subscriptions to a public mobile telephone service, including the number of prepaid SIM cards active during the past three months.Internet users – The estimated number of Internet users out of the total population. This includes those using the Internet from any device (including mobile phones) in the last 12 months.Pre-primary school gross enrolment ratio – Number of children enrolled in pre-primary school, regardless of age, expressed as a percentage of the total number of children of official pre-primary school age.Primary school gross enrolment ratio – Number of children enrolled in primary school, regardless of age, expressed as a percentage of the total number of children of official primary school age.Primary school net enrolment ratio – Number of children enrolled in primary or secondary school who are of official primary school age, expressed as a percentage of the total number of children of official primary school age. Because of the inclusion of primary-school-aged children enrolled in secondary school, this indicator can also be referred to as a primary adjusted net enrolment ratio.Primary school net attendance ratio – Number of children attending primary or secondary school who are of official primary school age, expressed as a percentage of the total number of children of official primary school age. Because of the inclusion of primary-school-aged children attending secondary school, this indicator can also be referred to as a primary adjusted net attendance ratio.
Rate of out-of-school children of primary school age – Number of children of official primary school age who are not enrolled in primary or secondary school, expressed as a percentage of the population of official primary school age. Out-of-school children of primary school age – Children in the official primary school age range who are not enrolled in either primary or secondary schools. Children enrolled in pre-primary education are excluded and considered out of school.Survival rate to last primary grade – Percentage of children entering the first grade of primary school who eventually reach the last grade of primary school. Lower secondary school net enrolment ratio – Number of children enrolled in lower secondary school who are of official lower secondary school age, expressed as a percentage of the total number of children of official lower secondary school age. Lower secondary net enrolment ratio does not include lower-secondary-school-aged children enrolled in tertiary education owing to challenges in age reporting and recording at that level. Lower secondary school net attendance ratio – Number of children attending lower secondary or tertiary school who are of official lower secondary school age, expressed as a percentage of the total number of children of official lower secondary school age. Because of the inclusion of lower-secondary-school-aged children attending tertiary school, this indicator can also be referred to as a lower secondary adjusted net attendance ratio.All data refer to official International Standard Classifications of Education (ISCED) for the primary and lower secondary education levels and thus may not directly correspond to a country-specific school system.
Youth literacy – UNESCO Institute for Statistics (UIS).Mobile phone and Internet use – International Telecommunications Union, Geneva.Pre-primary, primary and lower secondary enrolment and rate of out-of-school children – UIS. Estimates based on administrative data from national Education Management Information Systems (EMIS) with UN population estimates.
Primary and lower secondary school attendance – Demographic and Health Surveys (DHS), Multiple Indicator Cluster Surveys (MICS) and other national household surveys.Survival rate to last primary grade – Administrative data: UIS; survey data: DHS, MICS and other national household surveys.
− Data not available.x Data refer to years or periods other
than those specified in the column heading. Such data are not included in the calculation of regional and global averages, with the exception of 2005–2006 data from India. Estimates from data years prior to 2000 are not displayed.
y Data differ from the standard defini-tion or refer to only part of a country. If they fall within the noted reference period, such data are included in the calculation of regional and global averages.
* Data refer to the most recent year available during the period specified in the column heading.
** Excludes China.
NOTES
MAIN DATA SOURCESDEFINITIONS OF THE INDICATORS

UNICEF – THE STATE OF THE WORLD’S CHILDREN 2017
Countries and areas
Population (thousands)Population
annual growth rate (%) Crude death rate Crude birth rate Life expectancy
Total fertility
rate
Urbanized population
(%)
Average annual growth rate of urban
population (%)2016
total under 18 under 5 1990–2016 2016–2030α 1970 1990 2016 1970 1990 2016 1970 1990 2016 2016 2016 1990–2016 2016–2030α
Afghanistan 34,656 17,744 5,233 4.0 2.1 28 16 7 52 49 33 37 50 64 4.6 27 5.5 3.6Albania 2,926 659 177 -0.4 0.0 8 6 7 32 25 12 67 72 78 1.7 58 1.5 1.4Algeria 40,606 13,495 4,699 1.7 1.3 17 6 5 47 32 23 50 67 76 2.8 71 3.0 1.7Andorra 77 13 3 1.3 0.1 – – – – – – – – – – 85 1.1 0.2Angola 28,813 15,416 5,277 3.3 3.1 27 23 9 53 53 42 37 42 62 5.7 45 5.3 4.2Anguilla 15 4 1 2.2 0.5 – – – – – – – – – – 100 2.2 0.5Antigua and Barbuda 101 30 8 1.6 0.9 7 7 6 31 19 16 66 71 76 2.1 23 0.0 0.3Argentina 43,847 13,076 3,736 1.1 0.8 9 8 8 23 22 17 66 72 77 2.3 92 1.2 0.8Armenia 2,925 685 202 -0.7 0.0 6 8 10 23 22 13 70 68 75 1.6 63 -0.9 0.1Australia 24,126 5,433 1,551 1.3 1.1 9 7 7 20 15 13 71 77 83 1.8 90 1.5 1.2Austria 8,712 1,489 412 0.5 0.2 13 11 10 16 11 10 70 76 82 1.5 66 0.5 0.6Azerbaijan 9,725 2,653 891 1.1 0.7 9 9 7 32 29 18 63 65 72 2.1 55 1.2 1.2Bahamas 391 97 28 1.6 0.8 6 5 6 26 24 14 66 71 76 1.8 83 1.8 1.1Bahrain 1,425 334 107 4.1 2.5 7 3 2 38 29 15 63 72 77 2.0 89 4.0 1.3Bangladesh 162,952 56,869 15,236 1.6 0.9 19 10 5 48 35 19 48 58 72 2.1 35 3.8 2.7Barbados 285 66 17 0.3 0.1 10 10 11 22 16 12 66 71 76 1.8 31 0.3 0.7Belarus 9,480 1,821 579 -0.3 -0.2 9 11 13 16 14 12 71 71 73 1.7 77 0.2 -0.2Belgium 11,358 2,309 643 0.5 0.4 12 11 10 14 12 11 71 76 81 1.8 98 0.5 0.3Belize 367 141 40 2.6 1.8 8 5 5 42 36 23 66 71 70 2.5 44 2.2 2.0Benin 10,872 5,379 1,775 3.0 2.6 24 15 9 47 46 37 42 54 61 5.0 44 4.1 3.4Bhutan 798 259 70 1.5 1.0 24 13 6 49 39 18 40 53 70 2.1 39 4.8 2.3Bolivia (Plurinational State of) 10,888 4,150 1,189 1.8 1.4 20 13 7 42 35 23 46 55 69 2.9 69 2.8 1.9Bosnia and Herzegovina 3,517 628 157 -0.9 -0.2 7 8 11 24 15 9 66 71 77 1.4 40 -0.6 0.6Botswana 2,250 840 259 1.9 1.6 13 8 7 46 34 24 55 62 67 2.7 58 2.8 1.4Brazil 207,653 56,235 14,919 1.3 0.6 10 7 6 35 25 14 59 65 76 1.7 86 1.8 0.8British Virgin Islands 31 9 3 2.4 1.0 – – – – – – – – – – 47 3.0 1.4Brunei Darussalam 423 120 34 1.9 1.0 6 4 4 37 29 16 67 73 77 1.9 78 2.6 1.3Bulgaria 7,131 1,183 324 -0.8 -0.7 9 12 15 16 12 9 71 71 75 1.6 74 -0.4 -0.5Burkina Faso 18,646 9,724 3,221 2.9 2.7 25 17 9 47 47 39 39 49 60 5.4 31 5.9 4.7Burundi 10,524 5,372 1,901 2.6 2.9 21 18 11 47 50 42 44 48 57 5.7 12 5.3 5.1Cabo Verde 540 200 55 1.8 1.2 14 8 6 42 40 21 54 65 73 2.3 66 3.0 1.5Cambodia 15,762 5,854 1,761 2.2 1.3 20 13 6 43 42 23 42 54 69 2.6 21 3.3 2.7Cameroon 23,439 11,578 3,804 2.7 2.4 19 15 10 45 45 36 46 52 58 4.7 55 3.9 3.2Canada 36,290 6,999 1,929 1.0 0.8 7 7 7 17 14 11 73 77 82 1.6 82 1.3 1.0Central African Republic 4,595 2,326 730 1.7 2.1 23 17 14 43 41 36 42 49 52 4.9 40 2.3 2.8Chad 14,453 7,854 2,666 3.4 2.8 23 19 13 47 51 43 41 47 53 5.9 23 3.6 4.0Chile 17,910 4,462 1,184 1.2 0.7 10 6 6 30 22 13 62 74 80 1.8 90 1.5 0.8China 1,403,500 295,112 85,866 0.7 0.2 11 7 7 36 22 12 59 69 76 1.6 57 3.7 1.6Colombia 48,653 14,055 3,712 1.3 0.6 9 6 6 38 26 15 61 68 74 1.9 77 2.0 1.3Comoros 796 369 119 2.5 2.1 19 12 7 46 43 33 46 57 64 4.3 28 2.6 2.8Congo 5,126 2,489 824 2.9 2.5 14 12 7 43 38 35 53 56 65 4.7 66 3.4 3.0Cook Islands 17 6 2 -0.2 0.2 – – – – – – – – – – 75 1.7 0.7Costa Rica 4,857 1,296 346 1.7 0.8 7 4 5 33 27 14 66 76 80 1.8 78 3.6 1.6Côte d'Ivoire 23,696 11,689 3,861 2.5 2.4 21 14 12 52 43 37 44 52 54 4.9 55 3.5 3.1Croatia 4,213 756 196 -0.5 -0.6 11 11 13 15 11 9 68 72 78 1.5 59 -0.1 0.2Cuba 11,476 2,260 636 0.3 0.0 7 7 8 29 17 11 70 75 80 1.7 77 0.4 -0.1Cyprus 1,170 241 66 1.6 0.7 7 7 7 19 19 11 73 77 81 1.3 67 1.6 0.8Czechia 10,611 1,881 534 0.1 -0.1 12 12 11 16 12 10 70 72 79 1.5 73 0.1 0.3Democratic People's Republic of Korea 25,369 6,452 1,726 0.9 0.4 10 6 9 37 21 14 60 70 72 1.9 61 1.0 0.8
Democratic Republic of the Congo 78,736 41,553 14,494 3.2 3.0 20 17 10 47 46 42 44 49 60 6.1 43 4.2 3.6Denmark 5,712 1,157 285 0.4 0.4 10 12 9 15 12 10 73 75 81 1.7 88 0.5 0.6Djibouti 942 356 102 1.8 1.3 15 11 8 45 40 23 49 57 62 2.8 77 1.8 1.3Dominica 74 22 6 0.1 0.4 – – – – – – – – – – 70 0.5 0.7Dominican Republic 10,649 3,750 1,060 1.5 0.9 11 6 6 42 30 20 58 68 74 2.4 80 2.9 1.5Ecuador 16,385 5,606 1,611 1.8 1.3 12 6 5 41 30 20 58 69 76 2.5 64 2.4 1.7Egypt 95,689 36,997 12,876 2.0 1.6 16 8 6 42 34 26 52 65 71 3.3 43 1.6 1.8El Salvador 6,345 2,153 577 0.7 0.5 13 8 7 43 31 19 55 64 74 2.1 67 1.9 1.0Equatorial Guinea 1,221 521 182 4.0 3.0 26 18 10 42 42 34 40 48 58 4.7 40 3.6 3.0Eritrea 4,955 2,397 744 1.8 2.2 21 16 7 47 42 32 43 50 65 4.1 23 4.3 4.4Estonia 1,312 247 68 -0.7 -0.3 11 13 12 15 14 11 70 69 78 1.6 67 -1.0 -0.3Ethiopia 102,403 49,500 15,177 2.9 2.2 21 18 7 48 48 32 43 47 65 4.2 20 4.6 4.3Fiji 899 303 87 0.8 0.5 8 6 7 34 29 19 60 66 70 2.5 54 1.8 0.9Finland 5,503 1,078 297 0.4 0.3 10 10 10 14 13 11 70 75 81 1.8 84 0.6 0.4France 64,721 14,080 3,842 0.5 0.3 11 9 9 17 13 12 72 77 83 2.0 80 0.8 0.7Gabon 1,980 822 274 2.8 1.9 20 11 8 37 37 30 47 61 66 3.8 87 3.4 2.2
TABLE 6. DEMOGRAPHIC INDICATORS

175
Countries and areas
Population (thousands)Population
annual growth rate (%) Crude death rate Crude birth rate Life expectancy
Total fertility
rate
Urbanized population
(%)
Average annual growth rate of urban
population (%)2016
total under 18 under 5 1990–2016 2016–2030α 1970 1990 2016 1970 1990 2016 1970 1990 2016 2016 2016 1990–2016 2016–2030α
Gambia 2,039 1,065 360 3.1 2.8 26 14 8 50 47 39 38 52 61 5.4 60 4.8 3.6Georgia 3,925 875 271 -1.2 -0.3 9 9 13 20 17 13 67 70 73 2.0 54 -1.0 -0.1Germany 81,915 13,103 3,557 0.1 0.0 12 12 11 14 10 9 71 75 81 1.5 76 0.2 0.0Ghana 28,207 12,689 4,085 2.5 2.0 16 11 8 47 39 31 49 57 63 4.0 55 4.0 2.7Greece 11,184 1,937 474 0.3 -0.3 10 9 11 18 11 8 71 77 81 1.3 78 0.7 0.2Grenada 107 34 10 0.4 0.3 9 9 7 28 28 19 64 69 74 2.1 36 0.7 0.4Guatemala 16,582 7,047 2,023 2.2 1.8 14 9 5 45 39 25 53 62 73 3.0 52 3.3 3.0Guinea 12,396 6,082 1,983 2.8 2.5 27 17 9 45 47 36 37 50 60 4.9 38 4.0 3.5Guinea-Bissau 1,816 872 291 2.2 2.3 22 17 11 43 46 37 42 49 57 4.6 50 4.5 3.2Guyana 773 277 76 0.2 0.5 9 8 8 36 28 21 62 63 67 2.5 29 0.3 1.1Haiti 10,847 4,296 1,233 1.6 1.0 18 13 9 39 37 24 47 55 63 2.9 60 4.4 2.2Holy See 1 0 0 0.2 0.0 – – – – – – – – – – 100 0.2 0.0Honduras 9,113 3,541 951 2.3 1.4 15 7 5 48 39 22 53 67 74 2.5 55 3.4 2.5Hungary 9,753 1,694 436 -0.2 -0.4 11 14 13 15 12 9 69 69 76 1.4 72 0.1 0.2Iceland 332 80 22 1.0 0.7 7 7 6 21 17 13 74 78 83 1.9 94 1.3 0.9India 1,324,171 448,314 119,998 1.6 1.0 17 11 7 39 32 19 48 58 69 2.3 33 2.5 2.2Indonesia 261,115 85,965 24,822 1.4 0.9 13 8 7 40 26 19 55 63 69 2.4 54 3.6 1.9Iran (Islamic Republic of) 80,277 22,149 6,823 1.4 0.7 16 7 5 42 33 17 51 64 76 1.7 74 2.4 1.4Iraq 37,203 17,460 5,738 2.9 2.6 12 7 5 46 38 33 58 66 70 4.4 70 2.8 2.6Ireland 4,726 1,197 344 1.1 0.7 11 9 6 22 14 14 71 75 81 2.0 64 1.6 1.3Israel 8,192 2,672 841 2.3 1.4 7 6 5 26 22 20 72 77 83 3.0 92 2.3 1.4Italy 59,430 9,761 2,482 0.2 -0.2 10 10 10 17 10 8 72 77 83 1.5 69 0.4 0.3Jamaica 2,881 820 205 0.7 0.1 8 7 7 35 25 17 68 72 76 2.0 55 1.1 0.9Japan 127,749 20,051 5,343 0.1 -0.4 7 7 11 19 10 8 72 79 84 1.5 94 0.9 -0.1Jordan 9,456 3,959 1,227 3.8 1.2 10 5 4 51 35 26 60 70 74 3.4 84 3.8 1.5Kazakhstan 17,988 5,566 1,997 0.3 0.9 9 9 9 26 23 21 63 67 70 2.6 53 0.0 1.0Kenya 48,462 23,094 7,023 2.8 2.3 15 10 6 51 42 31 52 58 67 3.9 26 4.5 4.0Kiribati 114 47 14 1.8 1.5 13 10 7 35 37 28 54 60 66 3.7 44 2.5 1.9Kuwait 4,053 989 316 2.5 1.3 6 3 3 48 23 16 66 72 75 2.0 98 2.2 2.0Kyrgyzstan 5,956 2,167 760 1.2 1.2 11 8 6 32 32 25 60 66 71 3.0 36 0.9 2.0Lao People's Democratic Republic 6,758 2,674 766 1.8 1.2 18 14 7 43 43 24 46 54 67 2.7 40 5.6 3.3Latvia 1,971 350 97 -1.2 -0.9 11 13 15 14 14 10 70 69 75 1.5 67 -1.2 -0.5Lebanon 6,007 1,743 483 3.1 -0.8 8 7 5 32 25 15 66 70 80 1.7 88 2.6 0.3Lesotho 2,204 932 286 1.2 1.2 17 10 13 43 35 28 49 59 54 3.1 28 3.8 2.6Liberia 4,614 2,249 715 3.0 2.4 24 18 8 49 45 34 39 47 63 4.6 50 2.6 3.2Libya 6,293 2,111 627 1.3 1.1 13 5 5 51 29 20 56 69 72 2.3 79 1.7 1.4Liechtenstein 38 7 2 1.0 0.6 – – – – – – – – – – 14 0.4 1.1Lithuania 2,908 519 152 -0.9 -0.5 9 11 14 17 15 11 71 71 75 1.7 67 -0.9 -0.2Luxembourg 576 115 32 1.6 1.1 12 10 7 13 12 11 70 75 82 1.6 90 1.8 1.2Madagascar 24,895 11,988 3,769 2.9 2.6 21 15 6 48 44 33 45 51 66 4.2 36 4.6 4.2Malawi 18,092 9,265 2,908 2.5 2.7 25 19 7 54 49 37 41 47 63 4.6 16 3.8 4.2Malaysia 31,187 9,350 2,612 2.1 1.2 7 5 5 34 28 17 64 71 75 2.0 75 3.7 1.8Maldives 428 117 39 2.5 1.3 21 9 3 50 41 18 44 61 77 2.1 47 4.3 2.6Mali 17,995 9,806 3,332 2.9 2.9 32 20 10 50 49 43 32 46 58 6.1 41 5.0 4.7Malta 429 75 21 0.6 0.2 9 8 9 16 15 10 71 76 81 1.5 96 0.8 0.2Marshall Islands 53 19 5 0.4 0.3 – – – – – – – – – – 73 0.9 0.9Mauritania 4,301 1,996 655 2.9 2.5 16 11 8 46 41 34 49 58 63 4.7 60 4.2 2.9Mauritius 1,262 295 68 0.7 0.1 7 6 8 29 21 11 63 69 75 1.4 40 0.3 0.3Mexico 127,540 41,600 11,581 1.5 1.0 10 5 5 44 29 18 61 71 77 2.2 80 1.9 1.2Micronesia (Federated States of) 105 43 12 0.3 0.8 9 7 6 41 34 24 62 66 69 3.1 22 -0.2 1.6Monaco 38 7 2 1.0 0.5 – – – – – – – – – – 100 1.0 0.9Mongolia 3,027 1,017 368 1.3 1.2 15 10 6 44 32 24 55 60 69 2.8 73 2.1 1.7Montenegro 629 139 36 0.1 0.0 7 7 10 22 16 11 70 75 77 1.7 64 1.2 0.2Montserrat 5 2 0 -2.8 0.3 – – – – – – – – – – 9 -4.0 1.0Morocco 35,277 11,491 3,508 1.3 1.1 14 7 5 43 29 20 53 65 76 2.5 61 2.1 1.6Mozambique 28,829 14,929 4,950 3.0 2.8 25 21 10 48 46 39 39 43 58 5.2 33 3.8 3.5Myanmar 52,885 17,485 4,538 1.0 0.8 15 10 8 39 27 18 51 59 67 2.2 35 2.3 2.0Namibia 2,480 1,076 344 2.2 1.9 15 9 7 43 38 29 52 62 64 3.4 48 4.2 3.1Nauru 11 4 1 0.8 0.1 – – – – – – – – – – 100 0.4 0.5Nepal 28,983 11,190 2,756 1.7 1.0 23 13 6 43 39 20 41 54 70 2.1 19 4.7 2.9Netherlands 16,987 3,425 894 0.5 0.3 8 9 9 18 13 11 74 77 82 1.7 91 1.6 0.5New Zealand 4,661 1,109 304 1.2 0.8 8 8 7 22 17 13 71 75 82 2.0 86 1.3 0.9Nicaragua 6,150 2,174 597 1.5 1.0 13 7 5 46 36 20 54 64 75 2.2 59 2.1 1.7Niger 20,673 11,752 4,218 3.6 3.8 28 23 10 57 56 48 36 44 60 7.2 19 4.5 5.7Nigeria 185,990 93,965 31,802 2.6 2.5 23 19 12 46 44 39 41 46 53 5.5 49 4.5 3.9
TABLE 6. DEMOGRAPHIC INDICATORS
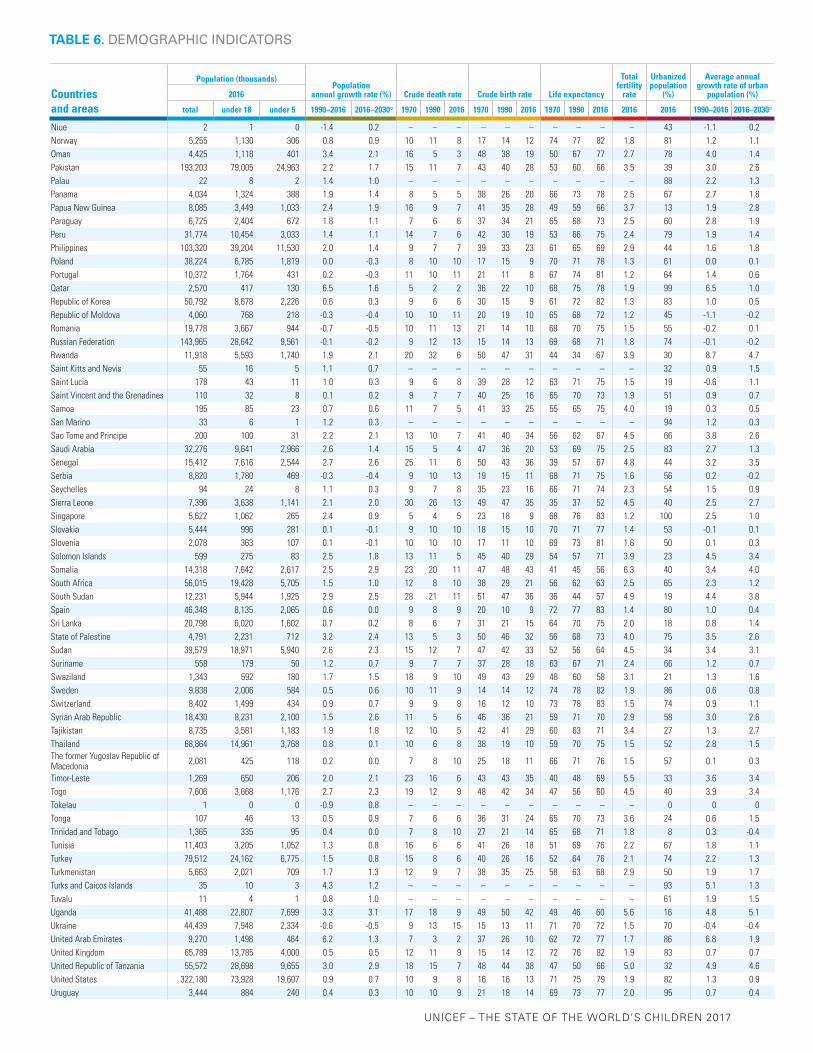
UNICEF – THE STATE OF THE WORLD’S CHILDREN 2017
Countries and areas
Population (thousands)Population
annual growth rate (%) Crude death rate Crude birth rate Life expectancy
Total fertility
rate
Urbanized population
(%)
Average annual growth rate of urban
population (%)2016
total under 18 under 5 1990–2016 2016–2030α 1970 1990 2016 1970 1990 2016 1970 1990 2016 2016 2016 1990–2016 2016–2030α
Niue 2 1 0 -1.4 0.2 – – – – – – – – – – 43 -1.1 0.2Norway 5,255 1,130 306 0.8 0.9 10 11 8 17 14 12 74 77 82 1.8 81 1.2 1.1Oman 4,425 1,118 401 3.4 2.1 16 5 3 48 38 19 50 67 77 2.7 78 4.0 1.4Pakistan 193,203 79,005 24,963 2.2 1.7 15 11 7 43 40 28 53 60 66 3.5 39 3.0 2.6Palau 22 8 2 1.4 1.0 – – – – – – – – – – 88 2.2 1.3Panama 4,034 1,324 388 1.9 1.4 8 5 5 38 26 20 66 73 78 2.5 67 2.7 1.8Papua New Guinea 8,085 3,449 1,033 2.4 1.9 16 9 7 41 35 28 49 59 66 3.7 13 1.9 2.8Paraguay 6,725 2,404 672 1.8 1.1 7 6 6 37 34 21 65 68 73 2.5 60 2.8 1.9Peru 31,774 10,454 3,033 1.4 1.1 14 7 6 42 30 19 53 66 75 2.4 79 1.9 1.4Philippines 103,320 39,204 11,530 2.0 1.4 9 7 7 39 33 23 61 65 69 2.9 44 1.6 1.8Poland 38,224 6,785 1,819 0.0 -0.3 8 10 10 17 15 9 70 71 78 1.3 61 0.0 0.1Portugal 10,372 1,764 431 0.2 -0.3 11 10 11 21 11 8 67 74 81 1.2 64 1.4 0.6Qatar 2,570 417 130 6.5 1.6 5 2 2 36 22 10 68 75 78 1.9 99 6.5 1.0Republic of Korea 50,792 8,678 2,226 0.6 0.3 9 6 6 30 15 9 61 72 82 1.3 83 1.0 0.5Republic of Moldova 4,060 768 218 -0.3 -0.4 10 10 11 20 19 10 65 68 72 1.2 45 -1.1 -0.2Romania 19,778 3,667 944 -0.7 -0.5 10 11 13 21 14 10 68 70 75 1.5 55 -0.2 0.1Russian Federation 143,965 28,642 9,561 -0.1 -0.2 9 12 13 15 14 13 69 68 71 1.8 74 -0.1 -0.2Rwanda 11,918 5,593 1,740 1.9 2.1 20 32 6 50 47 31 44 34 67 3.9 30 8.7 4.7Saint Kitts and Nevis 55 16 5 1.1 0.7 – – – – – – – – – – 32 0.9 1.5Saint Lucia 178 43 11 1.0 0.3 9 6 8 39 28 12 63 71 75 1.5 19 -0.6 1.1Saint Vincent and the Grenadines 110 32 8 0.1 0.2 9 7 7 40 25 16 65 70 73 1.9 51 0.9 0.7Samoa 195 85 23 0.7 0.6 11 7 5 41 33 25 55 65 75 4.0 19 0.3 0.5San Marino 33 6 1 1.2 0.3 – – – – – – – – – – 94 1.2 0.3Sao Tome and Principe 200 100 31 2.2 2.1 13 10 7 41 40 34 56 62 67 4.5 66 3.8 2.6Saudi Arabia 32,276 9,641 2,966 2.6 1.4 15 5 4 47 36 20 53 69 75 2.5 83 2.7 1.3Senegal 15,412 7,616 2,544 2.7 2.6 25 11 6 50 43 36 39 57 67 4.8 44 3.2 3.5Serbia 8,820 1,780 469 -0.3 -0.4 9 10 13 19 15 11 68 71 75 1.6 56 0.2 -0.2Seychelles 94 24 8 1.1 0.3 9 7 8 35 23 16 66 71 74 2.3 54 1.5 0.9Sierra Leone 7,396 3,638 1,141 2.1 2.0 30 26 13 49 47 35 35 37 52 4.5 40 2.5 2.7Singapore 5,622 1,062 265 2.4 0.9 5 4 5 23 18 9 68 76 83 1.2 100 2.5 1.0Slovakia 5,444 996 281 0.1 -0.1 9 10 10 18 15 10 70 71 77 1.4 53 -0.1 0.1Slovenia 2,078 363 107 0.1 -0.1 10 10 10 17 11 10 69 73 81 1.6 50 0.1 0.3Solomon Islands 599 275 83 2.5 1.8 13 11 5 45 40 29 54 57 71 3.9 23 4.5 3.4Somalia 14,318 7,642 2,617 2.5 2.9 23 20 11 47 48 43 41 45 56 6.3 40 3.4 4.0South Africa 56,015 19,428 5,705 1.5 1.0 12 8 10 38 29 21 56 62 63 2.5 65 2.3 1.2South Sudan 12,231 5,944 1,925 2.9 2.5 28 21 11 51 47 36 36 44 57 4.9 19 4.4 3.8Spain 46,348 8,135 2,065 0.6 0.0 9 8 9 20 10 9 72 77 83 1.4 80 1.0 0.4Sri Lanka 20,798 6,020 1,602 0.7 0.2 8 6 7 31 21 15 64 70 75 2.0 18 0.8 1.4State of Palestine 4,791 2,231 712 3.2 2.4 13 5 3 50 46 32 56 68 73 4.0 75 3.5 2.6Sudan 39,579 18,971 5,940 2.6 2.3 15 12 7 47 42 33 52 56 64 4.5 34 3.4 3.1Suriname 558 179 50 1.2 0.7 9 7 7 37 28 18 63 67 71 2.4 66 1.2 0.7Swaziland 1,343 592 180 1.7 1.5 18 9 10 49 43 29 48 60 58 3.1 21 1.3 1.6Sweden 9,838 2,006 584 0.5 0.6 10 11 9 14 14 12 74 78 82 1.9 86 0.6 0.8Switzerland 8,402 1,499 434 0.9 0.7 9 9 8 16 12 10 73 78 83 1.5 74 0.9 1.1Syrian Arab Republic 18,430 8,231 2,100 1.5 2.6 11 5 6 46 36 21 59 71 70 2.9 58 3.0 2.6Tajikistan 8,735 3,581 1,183 1.9 1.8 12 10 5 42 41 29 60 63 71 3.4 27 1.3 2.7Thailand 68,864 14,961 3,768 0.8 0.1 10 6 8 38 19 10 59 70 75 1.5 52 2.8 1.5The former Yugoslav Republic of Macedonia 2,081 425 118 0.2 0.0 7 8 10 25 18 11 66 71 76 1.5 57 0.1 0.3
Timor-Leste 1,269 650 206 2.0 2.1 23 16 6 43 43 35 40 48 69 5.5 33 3.6 3.4Togo 7,606 3,668 1,176 2.7 2.3 19 12 9 48 42 34 47 56 60 4.5 40 3.9 3.4Tokelau 1 0 0 -0.9 0.8 – – – – – – – – – – 0 0 0Tonga 107 46 13 0.5 0.9 7 6 6 36 31 24 65 70 73 3.6 24 0.6 1.5Trinidad and Tobago 1,365 335 95 0.4 0.0 7 8 10 27 21 14 65 68 71 1.8 8 0.3 -0.4Tunisia 11,403 3,205 1,052 1.3 0.8 16 6 6 41 26 18 51 69 76 2.2 67 1.8 1.1Turkey 79,512 24,162 6,775 1.5 0.8 15 8 6 40 26 16 52 64 76 2.1 74 2.2 1.3Turkmenistan 5,663 2,021 709 1.7 1.3 12 9 7 38 35 25 58 63 68 2.9 50 1.9 1.7Turks and Caicos Islands 35 10 3 4.3 1.2 – – – – – – – – – – 93 5.1 1.3Tuvalu 11 4 1 0.8 1.0 – – – – – – – – – – 61 1.9 1.5Uganda 41,488 22,807 7,699 3.3 3.1 17 18 9 49 50 42 49 46 60 5.6 16 4.8 5.1Ukraine 44,439 7,948 2,334 -0.6 -0.5 9 13 15 15 13 11 71 70 72 1.5 70 -0.4 -0.4United Arab Emirates 9,270 1,498 464 6.2 1.3 7 3 2 37 26 10 62 72 77 1.7 86 6.8 1.9United Kingdom 65,789 13,785 4,000 0.5 0.5 12 11 9 15 14 12 72 76 82 1.9 83 0.7 0.7United Republic of Tanzania 55,572 28,698 9,655 3.0 2.9 18 15 7 48 44 38 47 50 66 5.0 32 4.9 4.6United States 322,180 73,928 19,607 0.9 0.7 10 9 8 16 16 13 71 75 79 1.9 82 1.3 0.9Uruguay 3,444 884 240 0.4 0.3 10 10 9 21 18 14 69 73 77 2.0 95 0.7 0.4
TABLE 6. DEMOGRAPHIC INDICATORS

177
Countries and areas
Population (thousands)Population
annual growth rate (%) Crude death rate Crude birth rate Life expectancy
Total fertility
rate
Urbanized population
(%)
Average annual growth rate of urban
population (%)2016
total under 18 under 5 1990–2016 2016–2030α 1970 1990 2016 1970 1990 2016 1970 1990 2016 2016 2016 1990–2016 2016–2030α
Uzbekistan 31,447 10,386 3,184 1.7 1.1 10 8 6 37 35 21 62 66 71 2.3 36 1.1 1.7Vanuatu 270 114 34 2.4 1.9 14 8 5 42 36 26 52 63 72 3.3 26 3.7 3.0Venezuela (Bolivarian Republic of) 31,568 10,493 2,974 1.8 1.1 7 5 6 37 29 19 65 70 75 2.3 89 2.0 1.2Viet Nam 94,569 25,780 7,761 1.3 0.8 12 6 6 36 29 17 60 71 76 2.0 34 3.2 2.2Yemen 27,584 12,957 4,075 3.2 2.1 25 11 6 53 52 32 41 58 65 4.0 35 5.1 3.4Zambia 16,591 8,647 2,820 2.8 2.9 17 18 8 50 45 38 49 45 62 5.0 41 2.9 4.3Zimbabwe 16,150 7,726 2,539 1.8 2.1 13 10 8 47 37 33 55 58 61 3.8 32 1.9 2.3
SUMMARY East Asia and Pacific 2,291,492 545,358 156,758 0.9 0.4 11 7 7 35 22 14 60 69 75 1.8 57 3.0 1.5Europe and Central Asia 908,161 191,748 55,778 0.3 0.2 10 11 10 18 15 12 69 72 77 1.8 71 0.5 0.4
Eastern Europe and Central Asia 416,914 100,514 31,087 0.2 0.2 10 11 11 21 18 15 66 68 73 1.9 64 0.3 0.4Western Europe 491,247 91,234 24,691 0.3 0.1 11 10 10 16 12 10 71 75 81 1.6 76 0.6 0.4
Latin America and Caribbean 633,773 193,378 53,227 1.4 0.8 10 7 6 37 27 17 60 68 76 2.1 80 1.9 1.1Middle East and North Africa 435,225 152,698 49,143 2.1 1.5 15 7 5 44 34 23 53 66 74 2.8 63 2.6 1.8North America 358,469 80,927 21,535 0.9 0.7 9 9 8 16 16 12 71 75 80 1.8 83 1.3 0.9South Asia 1,765,989 619,518 169,895 1.7 1.0 17 11 7 40 33 20 48 58 69 2.5 33 2.7 2.3Sub-Saharan Africa 1,034,153 511,533 167,977 2.7 2.5 21 16 9 47 44 36 45 50 60 4.8 37 4.0 3.6
Eastern and Southern Africa 542,206 261,901 83,757 2.6 2.4 19 16 8 47 43 34 47 51 63 4.4 31 3.7 3.5West and Central Africa 491,947 249,631 84,220 2.8 2.6 23 17 11 47 45 39 42 49 57 5.4 45 4.2 3.7
Least developed countries 979,388 454,924 142,971 2.5 2.2 21 15 8 47 42 32 44 52 64 4.1 31 4.0 3.6World 7,427,263 2,295,160 674,314 1.3 1.0 13 9 8 33 26 19 59 65 72 2.4 54 2.2 1.6
For a complete list of countries and areas in the regions, subregions and country categories, see page 150 or visit <data.unicef.org/regionalclassifications>.It is not advisable to compare data from consecutive editions of The State of the World’s Children.
TABLE 6. DEMOGRAPHIC INDICATORS
Crude death rate – Annual number of deaths per 1,000 population.Crude birth rate – Annual number of births per 1,000 population.Life expectancy– Number of years newborn children would live if subject to the mortality risks prevailing for the cross section of population at the time of their birth.Total fertility rate – Number of children who would be born per woman if she lived to the end of her childbearing years and bore children at each age in accordance with prevailing age-specific fertility rates.Urbanized population – Percentage of population living in urban areas as defined according to the national definition used in the most recent population census.
Population – United Nations Population Division. Growth rates calculated by UNICEF based on data from United Nations Population Division. Crude death and birth rates – United Nations Population Division.Life expectancy – United Nations Population Division.Total fertility rate – United Nations Population Division.
− Data not available. α Based on medium-fertility variant projections.
NOTES
DEFINITIONS OF THE INDICATORS MAIN DATA SOURCES

UNICEF – THE STATE OF THE WORLD’S CHILDREN 2017
TABLE 7. WOMEN
Countries and areas
Life expec-tancy:
females as a %
of males
Adult literacy
rate: females as a % of
males
Enrolment ratios: females as a % of males
Survival rate to the last grade of primary: females as
a % of males
Demand for family
planning satisfied
with modern methods
(%)
Antenatal care (%) Delivery care (%)Post-natal health
check (%)+ Maternal mortality ratio†
Primary GER
Second-ary GER
At least one visit
At least four
visits
Skilled birth
attendant
Institu-tional
deliveryC-
section
For new-borns
For mothers Reported Adjusted
Lifetime risk of
maternal death (1 in:)
20162011–2016* 2011–2016* 2011–2016* 2011–2016* 2011–2016*
2013–2016*
2011–2016*
2011–2016* 2011–2016* 2011–2016* 2015
Afghanistan 104 39 69 56 – 42 59 18 51 48 3 9 40 1,300 396 52Albania 105 98 97 94 101 13 x 97 x 67 x 99 x 97 x 19 x 1 x 83 x 6 29 1,900Algeria 103 82 x 94 104 102 77 93 67 97 97 16 – – – 140 240Andorra – 100 – – 99 – – – – – – – – – – –Angola 110 67 64 65 – 24 82 61 50 46 4 21 23 – 477 32Anguilla – – – – – – – – – – – – – – – –Antigua and Barbuda 107 101 x 94 102 – – 100 x 100 100 – – – – 0 x – –Argentina 110 100 100 107 100 – 98 90 100 99 29 – – 39 52 790Armenia 109 100 100 101 99 40 100 96 100 99 18 98 97 17 25 2,300Australia 105 – 100 95 – – 98 x 92 x – 99 31 x – – – 6 8,700Austria 106 – 99 95 101 – – – 99 99 24 x – – – 4 18,200Azerbaijan 109 100 98 – 95 22 x 92 66 100 93 20 3 x 83 14 25 1,600Bahamas 108 – – – – – 98 x 85 98 – – – – 37 80 660Bahrain 103 95 x 101 100 97 – 100 x 100 100 98 x – – – 17 x 15 3,000Bangladesh 105 92 108 113 – 73 64 31 42 37 23 32 36 180 176 240Barbados 107 – 101 103 – 70 93 88 99 100 21 98 97 52 27 2,100Belarus 116 100 x 100 99 100 74 100 100 100 100 25 100 100 0 4 13,800Belgium 106 – 100 114 102 – – – – – 18 x – – – 7 8,000Belize 108 – 95 102 98 66 97 93 97 96 34 96 96 45 28 1,300Benin 105 49 92 70 95 25 83 59 77 87 5 80 78 350 405 51Bhutan 101 73 107 107 101 85 x 98 85 86 x 74 12 x 30 x 41 x 86 148 310Bolivia (Plurinational State of) 108 92 97 98 101 43 x 90 75 85 x 71 27 76 x 77 x 310 x 206 160Bosnia and Herzegovina 107 96 – – 101 22 87 84 100 100 14 – – 0 11 6,800Botswana 109 102 x 97 – 103 82 x 94 x 73 x 99 x 100 – – – 130 129 270Brazil 110 101 97 105 – 90 97 91 99 99 56 – – 55 44 1,200British Virgin Islands – – – – – – – – – – – – – – – –Brunei Darussalam 104 97 100 100 97 – 99 x 93 100 100 x – – – – 23 2,300Bulgaria 110 99 99 97 100 – – – 100 94 36 – – 6 11 6,200Burkina Faso 102 59 96 92 114 44 93 47 80 82 4 33 74 330 371 48Burundi 107 78 101 91 118 33 99 49 85 84 4 x 8 x 49 500 x 712 23Cabo Verde 106 89 95 112 101 73 x 98 x 72 x 92 76 x 11 x – – 10 42 900Cambodia 106 80 x 99 – 134 56 95 76 89 83 6 79 90 170 161 210Cameroon 104 83 x 90 86 104 40 83 59 65 61 2 69 65 780 596 35Canada 105 – 101 100 – – 100 x 99 x 100 x 98 26 x – – 11 7 8,800Central African Republic 107 48 x 74 51 96 29 68 x 38 x 40 x 53 x 5 x – – 540 x 882 27Chad 105 45 77 46 85 18 55 31 20 22 1 5 16 860 856 18Chile 107 100 97 101 101 – – – 100 100 50 – – 14 22 2,600China 104 95 x 100 103 – 97 x 97 69 100 100 41 – – 20 27 2,400Colombia 110 100 97 107 106 84 x 97 90 99 99 46 7 x 1 54 64 800Comoros 105 75 93 107 121 28 92 49 82 x 76 10 14 49 170 335 66Congo 105 84 107 87 – 39 93 79 94 92 5 86 80 440 442 45Cook Islands – – 94 108 94 – 100 x – 100 x 100 x – – – 0 – –Costa Rica 106 100 99 104 101 89 98 90 99 99 22 – – 28 25 2,100Côte d'Ivoire 106 73 89 72 95 31 91 44 59 x 57 3 34 70 610 645 32Croatia 109 99 100 105 99 – – 92 100 – 21 – – 3 8 7,900Cuba 105 100 95 105 100 88 99 98 99 100 40 98 99 42 39 1,800Cyprus 106 99 100 99 99 – 99 x – – 97 – – – – 7 9,400Czechia 108 – 100 101 100 86 x – – 100 x 100 20 x – – 1 4 14,800Democratic People's Republic of Korea 110 – – 101 – 90 100 x 94 x 100 x 95 x 13 x – – 77 x 82 660
Democratic Republic of the Congo 105 75 91 62 99 16 88 48 80 80 5 8 44 850 693 24Denmark 105 – 98 104 100 – – – – – 21 x – – – 6 9,500Djibouti 105 – 91 82 88 – 88 23 87 x 87 11 – – 380 229 140Dominica – – 98 99 95 – 100 x – 100 – – – – 110 – –Dominican Republic 109 101 91 110 105 84 98 93 98 98 58 95 95 110 92 400Ecuador 107 98 106 104 102 81 84 x 58 x 96 93 46 – – 46 64 580Egypt 106 81 100 99 – 80 90 83 92 87 52 14 82 49 33 810El Salvador 113 96 96 101 105 82 96 90 98 98 32 97 94 42 54 890Equatorial Guinea 105 86 x 98 – 100 21 91 67 68 x 67 7 – – 310 342 61Eritrea 107 73 x 86 85 103 20 x 89 x 57 x 34 x 34 x 3 x – 5 x 490 x 501 43Estonia 113 100 100 99 101 – – 97 100 x 99 – – – 7 9 6,300Ethiopia 106 59 x 91 96 105 59 62 32 28 26 2 0 17 410 353 64Fiji 109 – 99 111 98 – 100 x 94 100 99 – – – 59 30 1,200

179TABLE 7. WOMEN
Countries and areas
Life expec-tancy:
females as a %
of males
Adult literacy
rate: females as a % of
males
Enrolment ratios: females as a % of males
Survival rate to the last grade of primary: females as
a % of males
Demand for family
planning satisfied
with modern methods
(%)
Antenatal care (%) Delivery care (%)Post-natal health
check (%)+ Maternal mortality ratio†
Primary GER
Second-ary GER
At least one visit
At least four
visits
Skilled birth
attendant
Institu-tional
deliveryC-
section
For new-borns
For mothers Reported Adjusted
Lifetime risk of
maternal death (1 in:)
20162011–2016* 2011–2016* 2011–2016* 2011–2016* 2011–2016*
2013–2016*
2011–2016*
2011–2016* 2011–2016* 2011–2016* 2015
Finland 107 – 100 109 100 – 100 x – – 100 16 x – – – 3 21,700France 108 – 99 101 – 96 x 100 x 99 x – 98 21 x – – – 8 6,100Gabon 105 94 97 – – 34 95 78 89 x 90 10 25 60 320 291 85Gambia 104 65 105 – 106 24 86 78 57 63 2 6 76 430 706 24Georgia 112 100 102 100 100 53 x 98 x 88 100 100 41 – – 32 36 1,500Germany 106 – 99 94 100 – 100 x 99 – 99 29 x – – – 6 11,700Ghana 103 83 x 102 97 97 41 91 87 71 73 13 23 81 450 x 319 74Greece 107 98 99 94 100 – – – – – – – – – 3 23,700Grenada 107 – 96 100 – – 100 x – 99 – – – – 23 27 1,500Guatemala 109 88 96 93 99 66 91 86 66 65 26 8 78 140 88 330Guinea 102 50 85 66 97 16 85 57 45 x 40 2 25 37 720 679 29Guinea–Bissau 106 50 – – – 38 92 65 45 44 4 55 48 900 549 38Guyana 107 99 97 99 105 53 91 87 86 93 17 95 93 86 x 229 170Haiti 107 84 x – – – 45 90 67 49 36 6 19 32 380 359 90Holy See – – – – – – – – – – – – – – – –Honduras 107 100 99 119 110 76 97 89 83 x 83 19 81 85 73 x 129 300Hungary 110 – 99 100 100 – – – 99 x – 31 x – – 15 17 4,400Iceland 104 – 99 104 102 – – – – – 17 x – – – 3 14,600India 105 75 112 101 99 72 74 x 51 81 79 17 24 62 170 174 220Indonesia 106 96 97 100 – 79 95 84 93 80 12 48 80 360 126 320Iran (Islamic Republic of) 103 89 105 99 99 69 97 x 94 x 96 x 95 x 46 x – – 25 x 25 2,000Iraq 107 72 – – – 59 78 50 91 x 77 22 – – 35 50 420Ireland 105 – 101 103 – – 100 x – 100 x 100 25 x – – – 8 6,100Israel 104 – 101 101 98 – – – – – – – – – 5 6,200Italy 106 99 99 98 100 – 99 x 68 x – 100 40 x – – – 4 19,700Jamaica 107 116 x – 107 103 83 x 98 86 99 x 99 21 – – 80 89 520Japan 108 – 100 100 100 – – – – 100 – – – – 5 13,400Jordan 105 99 101 106 – 58 99 95 100 x 99 28 75 82 19 x 58 490Kazakhstan 115 100 x 102 103 101 80 99 95 99 99 15 99 98 13 12 3,000Kenya 108 88 99 – – 75 94 58 62 61 9 36 53 360 510 42Kiribati 110 – 103 – – 36 x 88 x 71 x 98 x 66 x 10 x – – 33 90 300Kuwait 103 98 101 116 101 – 100 x – 99 x 99 – – – 2 4 10,300Kyrgyzstan 112 99 x 99 102 100 62 98 95 98 98 7 99 98 36 76 390Lao People's Democratic Republic 105 74 96 93 104 61 54 37 40 x 38 4 41 40 210 197 150Latvia 114 100 99 99 100 – 92 x – 100 x 98 – – – 24 18 3,500Lebanon 105 93 x 91 99 108 – 96 x – 98 x 100 x – – – – 15 3,700Lesotho 109 125 97 136 129 76 95 74 78 77 10 18 62 1,000 487 61Liberia 103 44 x 90 78 – 37 96 78 61 56 4 35 71 1,100 725 28Libya 108 – – – – 30 x 93 x – – 100 – – – – 9 4,200Liechtenstein – – 98 78 – – – – – – – – – – – –Lithuania 115 100 100 96 100 – 100 x – 100 x – – – – 7 10 6,300Luxembourg 106 – 100 102 103 – – 97 100 x 100 x 29 x – – – 10 6,500Madagascar 105 91 100 98 105 50 x 82 51 44 38 2 13 x 46 x 480 353 60Malawi 109 79 102 90 102 75 95 51 90 91 6 60 42 440 634 29Malaysia 106 95 x 100 108 101 – 97 – 99 99 – – – 24 40 1,200Maldives 103 100 – – 106 43 x 99 x 85 x 96 x 95 x 32 x 1 x 70 x 110 68 600Mali 102 49 91 81 94 48 48 38 44 65 2 63 58 460 x 587 27Malta 104 103 102 107 104 – 100 x – – 100 – – – – 9 8,300Marshall Islands – 100 100 110 – 81 x 81 x 77 x 90 x 85 x 9 x – – 110 – –Mauritania 105 62 x 105 93 98 30 85 63 64 69 5 58 57 630 602 36Mauritius 110 96 102 105 99 41 – – 100 98 x – – – 22 x 53 1,300Mexico 107 98 100 107 102 81 99 94 98 97 41 95 95 35 38 1,100Micronesia (Federated States of) 103 – 100 – – – 80 x – 100 x 87 x 11 x – – 160 100 310Monaco – – – – – – – – – – – – – – – –Mongolia 113 100 x 98 102 – 68 99 90 98 98 23 99 95 26 44 800Montenegro 106 98 98 100 102 34 92 87 99 99 20 99 95 0 x 7 8,300Montserrat – – – – – – – – – – – – – – – –Morocco 103 74 95 85 96 75 77 55 74 x 73 16 – 1 x 110 x 121 320Mozambique 108 54 x 92 92 94 28 91 51 54 x 55 4 – 5 x 410 489 40Myanmar 107 90 97 103 – 75 81 59 60 37 17 36 71 230 178 260Namibia 109 99 97 – 104 75 97 63 88 87 14 20 69 390 265 100Nauru – – 92 102 – 43 x 95 x 40 x 97 x 99 x 8 x – – 0 – –Nepal 105 68 108 107 104 56 84 69 58 57 9 58 57 280 x 258 150

UNICEF – THE STATE OF THE WORLD’S CHILDREN 2017
Countries and areas
Life expec-tancy:
females as a %
of males
Adult literacy
rate: females as a % of
males
Enrolment ratios: females as a % of males
Survival rate to the last grade of primary: females as
a % of males
Demand for family
planning satisfied
with modern methods
(%)
Antenatal care (%) Delivery care (%)Post-natal health
check (%)+ Maternal mortality ratio†
Primary GER
Second-ary GER
At least one visit
At least four
visits
Skilled birth
attendant
Institu-tional
deliveryC-
section
For new-borns
For mothers Reported Adjusted
Lifetime risk of
maternal death (1 in:)
20162011–2016* 2011–2016* 2011–2016* 2011–2016* 2011–2016*
2013–2016*
2011–2016*
2011–2016* 2011–2016* 2011–2016* 2015
Netherlands 105 – 99 101 – – – – – – 14 x – – – 7 8,700New Zealand 104 – 100 106 – – – – – 97 23 x – – – 11 4,500Nicaragua 108 100 x – – – 90 95 88 88 x 71 30 – 3 x 51 150 270Niger 103 38 86 71 104 35 83 38 40 59 1 13 37 520 553 23Nigeria 103 68 x 98 93 – 33 61 51 35 36 2 14 40 550 814 22Niue – – 82 110 – – 100 x – 100 x – – – – 0 – –Norway 105 – 100 97 100 – – – – 99 16 x – – – 5 11,500Oman 106 89 103 107 101 19 x 99 94 99 99 19 98 95 18 17 1,900Pakistan 103 64 85 79 99 47 73 37 55 48 14 43 60 280 x 178 140Palau – 100 111 99 – – 90 x 81 x 100 100 x – – – 0 x – –Panama 108 99 x 97 107 102 76 93 88 94 91 28 93 92 81 94 420Papua New Guinea 108 80 x 91 76 – 41 x 79 x 55 x 53 x 43 – – – 730 x 215 120Paraguay 106 98 97 107 104 84 x 96 x 83 96 x 97 49 – – 82 132 270Peru 107 94 100 100 103 63 97 96 92 91 32 96 93 93 x 68 570Philippines 110 101 100 110 – 52 95 84 73 61 9 53 72 220 114 280Poland 111 – 100 96 100 – – – 100 x 100 21 x – – 2 3 22,100Portugal 108 96 96 97 – – 100 x – 100 x 99 31 x – – – 10 8,200Qatar 103 100 101 126 97 69 91 85 100 99 20 – – 11 13 3,500Republic of Korea 108 – 99 99 100 – – 97 – 100 32 x – – – 11 7,200Republic of Moldova 113 100 99 101 100 60 99 95 100 99 16 – 87 x 30 23 3,200Romania 110 99 98 99 100 47 x 76 76 x 95 95 34 – – 14 31 2,300Russian Federation 117 100 x 101 98 101 72 – – 100 x 99 13 – – 11 25 2,300Rwanda 107 89 101 109 118 66 99 44 91 91 13 19 43 210 290 85Saint Kitts and Nevis – – 102 105 98 – 100 x – 100 – – – – 310 – –Saint Lucia 107 – – 99 100 72 97 90 99 x 100 19 100 90 34 48 1,100Saint Vincent and the Grenadines 106 – 98 97 – – 100 x 100 x 99 – – – – 45 45 1,100Samoa 109 100 100 111 97 39 93 73 83 82 5 – 63 29 x 51 500San Marino – – 99 103 103 – – – – – – – – – – –Sao Tome and Principe 107 90 94 113 – 50 98 84 93 91 6 91 87 160 x 156 140Saudi Arabia 104 95 103 76 – – 97 x – 98 – – – – 14 12 3,100Senegal 106 64 112 98 108 44 95 47 53 75 5 50 74 430 315 61Serbia 108 99 100 101 97 25 98 94 98 98 29 – – 12 17 3,900Seychelles 113 101 x 103 107 – – – – 99 x – – – – 57 x – –Sierra Leone 102 60 101 86 101 38 97 76 60 54 3 39 73 1,200 1,360 17Singapore 105 97 – – – – – – – 100 – – – – 10 8,200Slovakia 110 – 99 101 101 – 97 x – 99 x – 24 x – – 0 6 12,100Slovenia 107 – 100 100 100 – 100 x – 100 x 100 – – – 0 9 7,000Solomon Islands 104 – 99 94 114 60 x 89 69 86 85 6 16 69 150 x 114 220Somalia 106 – – – – – 26 x 6 x 9 x 9 x – – – 1,000 x 732 22South Africa 112 98 95 127 – 81 x 94 76 97 96 26 – 84 580 138 300South Sudan 104 55 x 71 54 – 6 x 62 17 x 19 x 12 x 1 x – – 2,100 x 789 26Spain 107 99 101 100 100 – – – – – 26 x – – – 5 14,700Sri Lanka 109 97 x 98 105 100 69 x 99 x 93 x 99 x 100 32 – – 32 30 1,600State of Palestine 105 97 100 110 105 65 99 96 100 99 20 94 91 – 45 490Sudan 105 – 90 95 99 30 79 51 78 28 9 28 27 220 x 311 72Suriname 109 96 98 127 115 73 x 91 x 67 x 90 x 92 x 19 x – – 130 155 270Swaziland 112 98 x 92 99 107 81 99 76 88 88 12 90 88 590 x 389 76Sweden 104 – 104 114 100 – 100 x – – – – – – – 4 12,900Switzerland 105 – 100 97 – – – – – – 30 x – – – 5 12,400Syrian Arab Republic 120 84 x 97 100 101 53 x 88 x 64 x 96 x 78 x 26 x – – 65 x 68 440Tajikistan 109 100 x 99 90 101 51 79 53 98 77 4 54 81 29 32 790Thailand 111 96 94 94 – 89 98 91 99 99 33 – – 12 x 20 3,600The former Yugoslav Republic of Macedonia 105 96 x 99 97 99 22 99 94 100 100 25 – – 4 8 8,500
Timor–Leste 105 83 x 99 107 103 38 x 84 x 55 x 29 x 21 x 2 x 2 x 24 x 570 x 215 82Togo 103 66 95 – 96 32 73 57 45 73 7 35 71 400 368 58Tokelau – – – 93 – – – – – – – – – – – –Tonga 109 100 99 109 – 48 99 70 96 x 98 17 – – 36 x 124 230Trinidad and Tobago 110 – – – – 55 x 96 x 100 100 97 x – – – 84 63 860Tunisia 106 84 97 105 103 73 98 85 74 x 99 27 98 92 – 62 710Turkey 109 94 99 97 99 60 97 89 97 97 48 72 88 29 x 16 3,000Turkmenistan 111 – 98 96 – 76 100 96 100 100 6 100 100 7 x 42 940Turks and Caicos Islands – – – – – – – – – – – – – – – –
TABLE 7. WOMEN
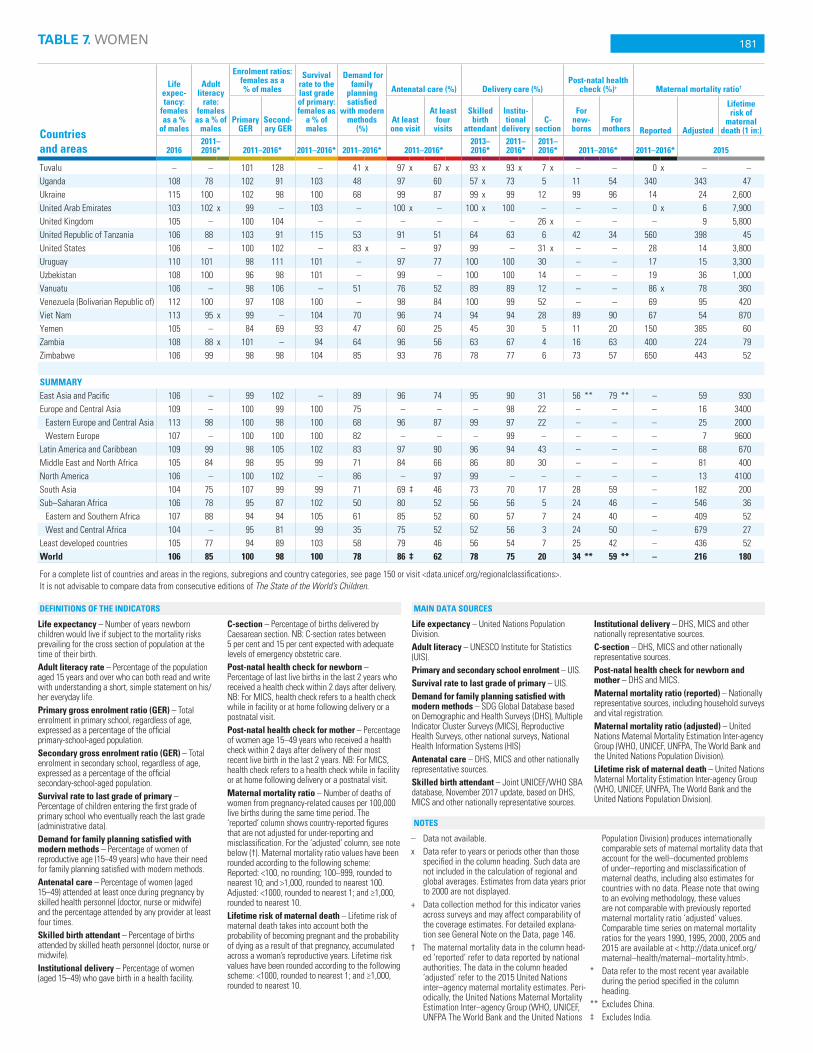
181
Countries and areas
Life expec-tancy:
females as a %
of males
Adult literacy
rate: females as a % of
males
Enrolment ratios: females as a % of males
Survival rate to the last grade of primary: females as
a % of males
Demand for family
planning satisfied
with modern methods
(%)
Antenatal care (%) Delivery care (%)Post-natal health
check (%)+ Maternal mortality ratio†
Primary GER
Second-ary GER
At least one visit
At least four
visits
Skilled birth
attendant
Institu-tional
deliveryC-
section
For new-borns
For mothers Reported Adjusted
Lifetime risk of
maternal death (1 in:)
20162011–2016* 2011–2016* 2011–2016* 2011–2016* 2011–2016*
2013–2016*
2011–2016*
2011–2016* 2011–2016* 2011–2016* 2015
Tuvalu – – 101 128 – 41 x 97 x 67 x 93 x 93 x 7 x – – 0 x – –Uganda 108 78 102 91 103 48 97 60 57 x 73 5 11 54 340 343 47Ukraine 115 100 102 98 100 68 99 87 99 x 99 12 99 96 14 24 2,600United Arab Emirates 103 102 x 99 – 103 – 100 x – 100 x 100 – – – 0 x 6 7,900United Kingdom 105 – 100 104 – – – – – – 26 x – – – 9 5,800United Republic of Tanzania 106 88 103 91 115 53 91 51 64 63 6 42 34 560 398 45United States 106 – 100 102 – 83 x – 97 99 – 31 x – – 28 14 3,800Uruguay 110 101 98 111 101 – 97 77 100 100 30 – – 17 15 3,300Uzbekistan 108 100 96 98 101 – 99 – 100 100 14 – – 19 36 1,000Vanuatu 106 – 98 106 – 51 76 52 89 89 12 – – 86 x 78 360Venezuela (Bolivarian Republic of) 112 100 97 108 100 – 98 84 100 99 52 – – 69 95 420Viet Nam 113 95 x 99 – 104 70 96 74 94 94 28 89 90 67 54 870Yemen 105 – 84 69 93 47 60 25 45 30 5 11 20 150 385 60Zambia 108 88 x 101 – 94 64 96 56 63 67 4 16 63 400 224 79Zimbabwe 106 99 98 98 104 85 93 76 78 77 6 73 57 650 443 52
SUMMARYEast Asia and Pacific 106 – 99 102 – 89 96 74 95 90 31 56 ** 79 ** – 59 930Europe and Central Asia 109 – 100 99 100 75 – – – 98 22 – – – 16 3400
Eastern Europe and Central Asia 113 98 100 98 100 68 96 87 99 97 22 – – – 25 2000Western Europe 107 – 100 100 100 82 – – – 99 – – – – 7 9600
Latin America and Caribbean 109 99 98 105 102 83 97 90 96 94 43 – – – 68 670Middle East and North Africa 105 84 98 95 99 71 84 66 86 80 30 – – – 81 400North America 106 – 100 102 – 86 – 97 99 – – – – – 13 4100South Asia 104 75 107 99 99 71 69 ‡ 46 73 70 17 28 59 – 182 200Sub–Saharan Africa 106 78 95 87 102 50 80 52 56 56 5 24 46 – 546 36
Eastern and Southern Africa 107 88 94 94 105 61 85 52 60 57 7 24 40 – 409 52West and Central Africa 104 – 95 81 99 35 75 52 52 56 3 24 50 – 679 27
Least developed countries 105 77 94 89 103 58 79 46 56 54 7 25 42 – 436 52World 106 85 100 98 100 78 86 ‡ 62 78 75 20 34 ** 59 ** – 216 180
For a complete list of countries and areas in the regions, subregions and country categories, see page 150 or visit <data.unicef.org/regionalclassifications>.It is not advisable to compare data from consecutive editions of The State of the World’s Children.
Life expectancy – Number of years newborn children would live if subject to the mortality risks prevailing for the cross section of population at the time of their birth.Adult literacy rate – Percentage of the population aged 15 years and over who can both read and write with understanding a short, simple statement on his/her everyday life.Primary gross enrolment ratio (GER) – Total enrolment in primary school, regardless of age, expressed as a percentage of the official primary-school-aged population.Secondary gross enrolment ratio (GER) – Total enrolment in secondary school, regardless of age, expressed as a percentage of the official secondary-school-aged population.Survival rate to last grade of primary – Percentage of children entering the first grade of primary school who eventually reach the last grade (administrative data).Demand for family planning satisfied with modern methods – Percentage of women of reproductive age (15−49 years) who have their need for family planning satisfied with modern methods. Antenatal care – Percentage of women (aged 15–49) attended at least once during pregnancy by skilled health personnel (doctor, nurse or midwife) and the percentage attended by any provider at least four times.Skilled birth attendant – Percentage of births attended by skilled heath personnel (doctor, nurse or midwife).Institutional delivery – Percentage of women (aged 15–49) who gave birth in a health facility.
C-section – Percentage of births delivered by Caesarean section. NB: C-section rates between 5 per cent and 15 per cent expected with adequate levels of emergency obstetric care.Post-natal health check for newborn – Percentage of last live births in the last 2 years who received a health check within 2 days after delivery. NB: For MICS, health check refers to a health check while in facility or at home following delivery or a postnatal visit.Post-natal health check for mother – Percentage of women age 15–49 years who received a health check within 2 days after delivery of their most recent live birth in the last 2 years. NB: For MICS, health check refers to a health check while in facility or at home following delivery or a postnatal visit.Maternal mortality ratio – Number of deaths of women from pregnancy-related causes per 100,000 live births during the same time period. The ‘reported’ column shows country-reported figures that are not adjusted for under-reporting and misclassification. For the ‘adjusted’ column, see note below (†). Maternal mortality ratio values have been rounded according to the following scheme: Reported: <100, no rounding; 100–999, rounded to nearest 10; and >1,000, rounded to nearest 100. Adjusted: <1000, rounded to nearest 1; and ≥1,000, rounded to nearest 10.Lifetime risk of maternal death – Lifetime risk of maternal death takes into account both the probability of becoming pregnant and the probability of dying as a result of that pregnancy, accumulated across a woman’s reproductive years. Lifetime risk values have been rounded according to the following scheme: <1000, rounded to nearest 1; and ≥1,000, rounded to nearest 10.
Life expectancy – United Nations Population Division.Adult literacy – UNESCO Institute for Statistics (UIS).Primary and secondary school enrolment – UIS.Survival rate to last grade of primary – UIS.Demand for family planning satisfied with modern methods – SDG Global Database based on Demographic and Health Surveys (DHS), Multiple Indicator Cluster Surveys (MICS), Reproductive Health Surveys, other national surveys, National Health Information Systems (HIS)Antenatal care – DHS, MICS and other nationally representative sources.Skilled birth attendant – Joint UNICEF/WHO SBA database, November 2017 update, based on DHS, MICS and other nationally representative sources.
Institutional delivery – DHS, MICS and other nationally representative sources.C-section – DHS, MICS and other nationally representative sources.Post-natal health check for newborn and mother – DHS and MICS.Maternal mortality ratio (reported) – Nationally representative sources, including household surveys and vital registration.Maternal mortality ratio (adjusted) – United Nations Maternal Mortality Estimation Inter-agency Group (WHO, UNICEF, UNFPA, The World Bank and the United Nations Population Division).Lifetime risk of maternal death – United Nations Maternal Mortality Estimation Inter-agency Group (WHO, UNICEF, UNFPA, The World Bank and the United Nations Population Division).
– Data not available.x Data refer to years or periods other than those
specified in the column heading. Such data are not included in the calculation of regional and global averages. Estimates from data years prior to 2000 are not displayed.
+ Data collection method for this indicator varies across surveys and may affect comparability of the coverage estimates. For detailed explana-tion see General Note on the Data, page 146.
† The maternal mortality data in the column head-ed ‘reported’ refer to data reported by national authorities. The data in the column headed ‘adjusted’ refer to the 2015 United Nations inter–agency maternal mortality estimates. Peri-odically, the United Nations Maternal Mortality Estimation Inter–agency Group (WHO, UNICEF, UNFPA The World Bank and the United Nations
Population Division) produces internationally comparable sets of maternal mortality data that account for the well–documented problems of under–reporting and misclassification of maternal deaths, including also estimates for countries with no data. Please note that owing to an evolving methodology, these values are not comparable with previously reported maternal mortality ratio ‘adjusted’ values. Comparable time series on maternal mortality ratios for the years 1990, 1995, 2000, 2005 and 2015 are available at < http://data.unicef.org/maternal–health/maternal–mortality.html>.
* Data refer to the most recent year available during the period specified in the column heading.
** Excludes China.‡ Excludes India.
NOTES
MAIN DATA SOURCESDEFINITIONS OF THE INDICATORS
TABLE 7. WOMEN

UNICEF – THE STATE OF THE WORLD’S CHILDREN 2017
Countries and areas
Child labour (%)+
2010–2016*Child marriage (%)
2010–2016*
Birth registration
(%)++ 2010–2016*
Female genital mutilation/cutting (%)+ 2004–2016* Justification of
wife-beating (%) 2010–2016*
Violent discipline (%)+
2010–2016*prevalence attitudes
total male femalemarried by
15married by
18 total womena girlsb support for
the practicec male female total male female
Afghanistan 29 34 24 9 35 42 – – – 72 y 80 y 74 y 75 y 74 yAlbania 5 y 6 y 4 y 0 x 10 x 99 x – – – 36 x 30 x 77 x,y 81 x,y 73 x,yAlgeria 5 y 6 y 5 y 0 3 100 – – – – 59 y 86 y 88 y 85 yAndorra – – – – – 100 v – – – – – – – –Angola 23 22 25 8 30 25 – – – 20 25 – – –Anguilla – – – – – – – – – – – – – –Antigua and Barbuda – – – – – – – – – – – – – –Argentina 4 y 5 y 4 y – – 100 y – – – – 2 72 y 74 y 71 yArmenia 9 y 11 y 6 y 0 5 99 – – – 23 10 69 71 67Australia – – – – – 100 v – – – – – – – –Austria – – – – – 100 v – – – – – – – –Azerbaijan 7 x,y 8 x,y 5 x,y 2 11 94 x – – – – 28 77 x,y 80 x,y 74 x,yBahamas – – – – – – – – – – – – – –Bahrain 5 x,y 6 x,y 3 x,y – – – – – – – – – – –Bangladesh 4 y 5 y 4 y 22 59 20 – – – – 28 y 82 83 82Barbados 2 y 3 y 1 y 1 11 99 – – – – 3 75 y 78 y 72 yBelarus 1 y 1 y 2 y 0 3 100 y – – – 4 4 65 y 67 y 62 yBelgium – – – – – 100 v – – – – – – – –Belize 3 y 5 y 1 y 3 26 96 – – – 5 5 65 67 63Benin 53 54 51 7 26 85 9 0 3 17 36 91 92 90Bhutan 3 y 3 y 3 y 6 26 100 – – – – 68 – – –Bolivia (Plurinational State of) 26 x,y 28 x,y 24 x,y 3 x 22 x 76 x,y – – – – 16 x – – –Bosnia and Herzegovina 5 x,y 7 x,y 4 x,y 0 4 100 x – – – 6 5 55 y 60 y 50 yBotswana 9 x,y 11 x,y 7 x,y – – 83 y – – – – – – – –Brazil 7 y 9 y 5 y 11 x 36 x 96 – – – – – – – –British Virgin Islands – – – – – – – – – – – – – –Brunei Darussalam – – – – – – – – – – – – – –Bulgaria – – – – – 100 y – – – – – – – –Burkina Faso 39 y 42 y 36 y 10 52 77 76 13 9 34 44 83 x,y 84 x,y 82 x,yBurundi 26 y 26 y 27 y 3 20 75 – – – 44 73 – – –Cabo Verde 6 y – – 3 x 18 x 91 – – – 17 x,y 17 x,y – – –Cambodia 19 y 20 y 19 y 2 19 73 – – – 27 y 50 y – – –Cameroon 47 50 44 10 31 66 1 1 y 7 39 36 85 85 85Canada – – – – – 100 v – – – – – – – –Central African Republic 29 y 27 y 30 y 29 68 61 24 1 11 75 80 92 y 92 y 92 yChad 52 51 52 30 67 12 38 10 29 51 74 71 72 71Chile 7 y – – – – 99 y – – – – – – – –China – – – – – – – – – – – – – –Colombia 8 y 10 y 5 y 5 23 99 – – – – – – – –Comoros 22 y 20 y 24 y 10 32 87 – – – 17 39 – – –Congo 23 – – 6 33 96 – – – 40 54 83 – –Cook Islands – – – – – – – – – – – – – –Costa Rica 4 y 4 y 5 y 7 21 100 y – – – – 4 46 y 52 y 39 yCôte d'Ivoire 26 y 25 y 28 y 10 33 65 38 10 14 42 48 91 x,y 91 x,y 91 x,yCroatia – – – – – – – – – – – – – –Cuba – – – 5 26 100 – – – 7 y 4 y 36 37 35Cyprus – – – – – 100 v – – – – – – – –Czechia – – – – – 100 v – – – – – – – –Democratic People's Republic of Korea – – – – – 100 x – – – – – – – –
Democratic Republic of the Congo 38 36 41 10 37 25 – – – 61 75 82 82 81Denmark – – – – – 100 v – – – – – – – –Djibouti 8 x,y 8 x,y 8 x,y 2 x 5 x 92 x 93 49 y 37 – – 72 x,y 73 x,y 71 x,yDominica – – – – – – – – – – – – – –Dominican Republic 13 17 9 12 36 88 – – – – 2 63 64 61Ecuador 5 y 5 y 5 y 4 x 22 x 94 – – – – – – – –Egypt 7 8 6 2 17 99 87 14 y 54 – 36 y 93 93 93El Salvador 9 y 13 y 5 y 6 26 99 – – – – 8 52 55 50Equatorial Guinea 28 x,y 28 x,y 28 x,y 9 30 54 – – – 52 53 – – –Eritrea – – – 13 41 – 83 33 12 45 51 – – –Estonia – – – – – 100 v – – – – – – – –Ethiopia 27 y 31 y 24 y 14 40 3 65 16 18 28 63 – – –Fiji – – – – – – – – – – – 72 x,y – –Finland – – – – – 100 v – – – – – – – –
TABLE 8. CHILD PROTECTION

183TABLE 8. CHILD PROTECTION
Countries and areas
Child labour (%)+
2010–2016*Child marriage (%)
2010–2016*
Birth registration
(%)++ 2010–2016*
Female genital mutilation/cutting (%)+ 2004–2016* Justification of
wife-beating (%) 2010–2016*
Violent discipline (%)+
2010–2016*prevalence attitudes
total male femalemarried by
15married by
18 total womena girlsb support for
the practicec male female total male female
France – – – – – 100 v – – – – – – – –Gabon 13 y 15 y 12 y 6 22 90 – – – 40 50 – – –Gambia 19 y 21 y 18 y 9 30 72 75 56 65 33 58 90 y 90 y 91 yGeorgia 4 y 6 y 2 y 1 14 100 – – – – 7 x 67 x,y 70 x,y 63 x,yGermany – – – – – 100 v – – – – – – – –Ghana 22 y 23 y 21 y 5 21 71 4 1 2 13 28 94 y 94 y 94 yGreece – – – – – 100 v – – – – – – – –Grenada – – – – – – – – – – – – – –Guatemala 26 y 35 y 16 y 6 30 96 y – – – 7 11 – – –Guinea 28 y 29 y 27 y 21 52 58 97 46 76 66 92 – – –Guinea-Bissau 51 50 53 6 24 24 45 30 13 29 42 82 83 82Guyana 18 20 17 4 30 89 – – – 10 10 70 74 65Haiti 24 y 25 y 24 y 3 18 80 – – – 15 17 85 y 85 y 84 yHoly See – – – – – – – – – – – – – –Honduras 14 y 21 y 8 y 8 34 94 – – – 10 12 – – –Hungary – – – – – 100 v – – – – – – – –Iceland – – – – – 100 v – – – – – – – –India 12 x,y 12 x,y 12 x,y 18 x 47 x 72 – – – 42 x 47 x – – –Indonesia 7 x,y 8 x,y 6 x,y 1 14 73 y – 49 y – 18 y 35 – – –Iran (Islamic Republic of) 11 y 13 y 10 y 3 17 99 y – – – – – – – –Iraq 5 y 5 y 4 y 5 24 99 8 3 y 5 – 51 79 y 81 y 77 yIreland – – – – – 100 v – – – – – – – –Israel – – – – – 100 v – – – – – – – –Italy – – – – – 100 v – – – – – – – –Jamaica 3 y 4 y 3 y 1 8 100 – – – – 5 85 y 87 y 82 yJapan – – – – – 100 v – – – – – – – –Jordan 2 y 3 y 0 y 0 8 99 – – – – 70 y 90 y 91 y 89 yKazakhstan 2 x,y 2 x,y 2 x,y 0 7 100 – – – – 14 53 55 50Kenya 26 x,y 27 x,y 25 x,y 4 23 67 21 3 6 36 42 – – –Kiribati – – – 3 x 20 x 94 x – – – 60 x 76 x 81 x,y – –Kuwait – – – – – – – – – – – – – –Kyrgyzstan 26 30 22 1 12 98 – – – – 33 57 60 54Lao People's Democratic Republic 10 y 9 y 11 y 9 35 75 – – – 49 58 76 y 77 y 74 yLatvia – – – – – 100 v – – – – – – – –Lebanon 2 x,y 3 x,y 1 x,y 1 x 6 x 100 x – – – – 10 x,y 82 x,y 82 x,y 82 x,yLesotho 23 x,y 25 x,y 21 x,y 1 17 43 – – – 40 33 – – –Liberia 21 x,y 21 x,y 21 x,y 9 36 25 y 50 – 39 24 43 90 x,y 90 x,y 90 x,yLibya – – – – – – – – – – – – – –Liechtenstein – – – – – 100 v – – – – – – – –Lithuania – – – – – 100 v – – – – – – – –Luxembourg – – – – – 100 v – – – – – – – –Madagascar 23 y 23 y 23 y 12 41 83 – – – 46 y 45 – – –Malawi 39 42 37 9 42 67 – – – 13 16 72 73 72Malaysia – – – – – – – – – – – 71 y 74 y 67 yMaldives – – – 0 x 4 x 93 x – – – 14 x,y 31 x,y – – –Mali 56 59 52 17 52 87 83 76 75 51 73 73 73 73Malta – – – – – 100 v – – – – – – – –Marshall Islands – – – 6 x 26 x 96 x – – – 58 x 56 x – – –Mauritania 38 – – 14 34 66 67 53 36 21 y 27 y 80 – –Mauritius – – – – – – – – – – – – – –Mexico 12 16 9 4 26 95 – – – – 5 63 63 63Micronesia (Federated States of) – – – – – – – – – – – – – –Monaco – – – – – 100 v – – – – – – – –Mongolia 17 19 15 0 5 99 – – – 9 y 10 49 52 46Montenegro 13 15 10 1 5 99 – – – 5 3 69 73 66Montserrat – – – – – – – – – – – – – –Morocco 8 x,y 9 x,y 8 x,y 3 x 16 x 94 y – – – – 64 x 91 x,y 92 x,y 90 x,yMozambique 22 x,y 21 x,y 24 x,y 14 48 48 – – – 20 23 – – –Myanmar 9 y 10 y 9 y 2 16 81 – – – 49 51 77 y 80 y 75 yNamibia – – – 2 7 87 y – – – 22 28 – – –Nauru – – – 2 x 27 x 83 x – – – – – – – –Nepal 37 37 38 10 37 58 – – – – 43 82 83 81Netherlands – – – – – 100 v – – – – – – – –New Zealand – – – – – 100 v – – – – – – – –
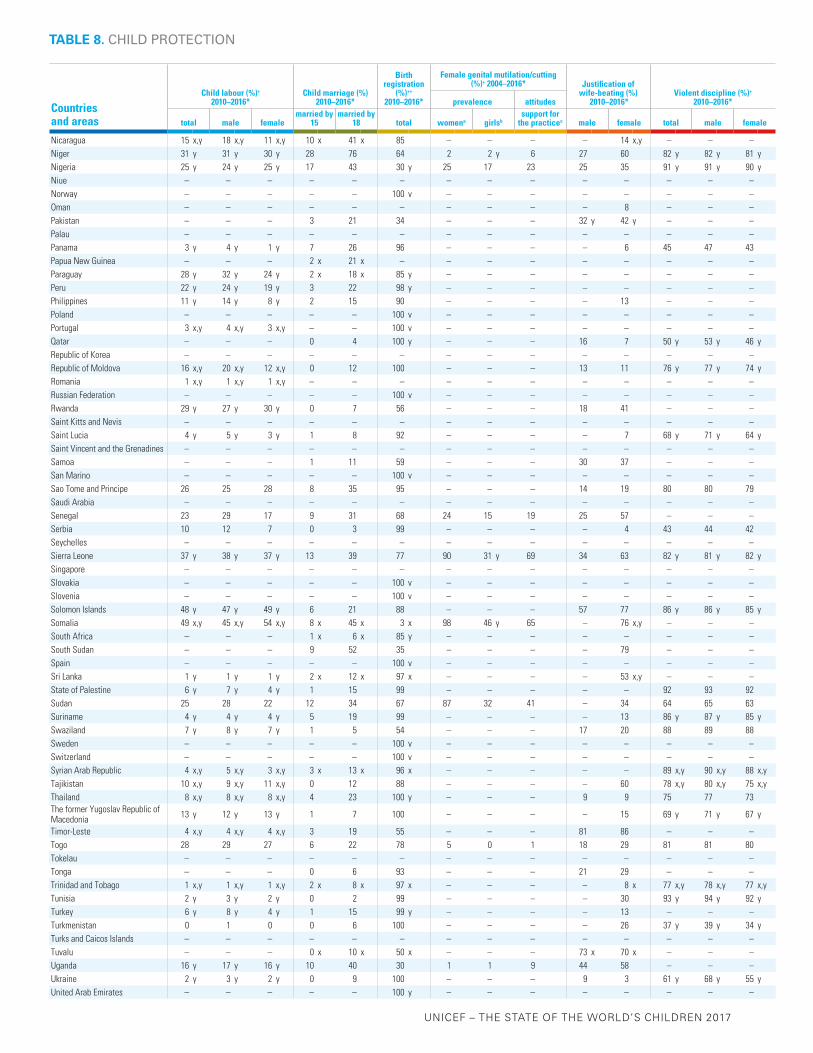
UNICEF – THE STATE OF THE WORLD’S CHILDREN 2017
Countries and areas
Child labour (%)+
2010–2016*Child marriage (%)
2010–2016*
Birth registration
(%)++ 2010–2016*
Female genital mutilation/cutting (%)+ 2004–2016* Justification of
wife-beating (%) 2010–2016*
Violent discipline (%)+
2010–2016*prevalence attitudes
total male femalemarried by
15married by
18 total womena girlsb support for
the practicec male female total male female
Nicaragua 15 x,y 18 x,y 11 x,y 10 x 41 x 85 – – – – 14 x,y – – –Niger 31 y 31 y 30 y 28 76 64 2 2 y 6 27 60 82 y 82 y 81 yNigeria 25 y 24 y 25 y 17 43 30 y 25 17 23 25 35 91 y 91 y 90 yNiue – – – – – – – – – – – – – –Norway – – – – – 100 v – – – – – – – –Oman – – – – – – – – – – 8 – – –Pakistan – – – 3 21 34 – – – 32 y 42 y – – –Palau – – – – – – – – – – – – – –Panama 3 y 4 y 1 y 7 26 96 – – – – 6 45 47 43Papua New Guinea – – – 2 x 21 x – – – – – – – – –Paraguay 28 y 32 y 24 y 2 x 18 x 85 y – – – – – – – –Peru 22 y 24 y 19 y 3 22 98 y – – – – – – – –Philippines 11 y 14 y 8 y 2 15 90 – – – – 13 – – –Poland – – – – – 100 v – – – – – – – –Portugal 3 x,y 4 x,y 3 x,y – – 100 v – – – – – – – –Qatar – – – 0 4 100 y – – – 16 7 50 y 53 y 46 yRepublic of Korea – – – – – – – – – – – – – –Republic of Moldova 16 x,y 20 x,y 12 x,y 0 12 100 – – – 13 11 76 y 77 y 74 yRomania 1 x,y 1 x,y 1 x,y – – – – – – – – – – –Russian Federation – – – – – 100 v – – – – – – – –Rwanda 29 y 27 y 30 y 0 7 56 – – – 18 41 – – –Saint Kitts and Nevis – – – – – – – – – – – – – –Saint Lucia 4 y 5 y 3 y 1 8 92 – – – – 7 68 y 71 y 64 ySaint Vincent and the Grenadines – – – – – – – – – – – – – –Samoa – – – 1 11 59 – – – 30 37 – – –San Marino – – – – – 100 v – – – – – – – –Sao Tome and Principe 26 25 28 8 35 95 – – – 14 19 80 80 79Saudi Arabia – – – – – – – – – – – – – –Senegal 23 29 17 9 31 68 24 15 19 25 57 – – –Serbia 10 12 7 0 3 99 – – – – 4 43 44 42Seychelles – – – – – – – – – – – – – –Sierra Leone 37 y 38 y 37 y 13 39 77 90 31 y 69 34 63 82 y 81 y 82 ySingapore – – – – – – – – – – – – – –Slovakia – – – – – 100 v – – – – – – – –Slovenia – – – – – 100 v – – – – – – – –Solomon Islands 48 y 47 y 49 y 6 21 88 – – – 57 77 86 y 86 y 85 ySomalia 49 x,y 45 x,y 54 x,y 8 x 45 x 3 x 98 46 y 65 – 76 x,y – – –South Africa – – – 1 x 6 x 85 y – – – – – – – –South Sudan – – – 9 52 35 – – – – 79 – – –Spain – – – – – 100 v – – – – – – – –Sri Lanka 1 y 1 y 1 y 2 x 12 x 97 x – – – – 53 x,y – – –State of Palestine 6 y 7 y 4 y 1 15 99 – – – – – 92 93 92Sudan 25 28 22 12 34 67 87 32 41 – 34 64 65 63Suriname 4 y 4 y 4 y 5 19 99 – – – – 13 86 y 87 y 85 ySwaziland 7 y 8 y 7 y 1 5 54 – – – 17 20 88 89 88Sweden – – – – – 100 v – – – – – – – –Switzerland – – – – – 100 v – – – – – – – –Syrian Arab Republic 4 x,y 5 x,y 3 x,y 3 x 13 x 96 x – – – – – 89 x,y 90 x,y 88 x,yTajikistan 10 x,y 9 x,y 11 x,y 0 12 88 – – – – 60 78 x,y 80 x,y 75 x,yThailand 8 x,y 8 x,y 8 x,y 4 23 100 y – – – 9 9 75 77 73The former Yugoslav Republic of Macedonia 13 y 12 y 13 y 1 7 100 – – – – 15 69 y 71 y 67 y
Timor-Leste 4 x,y 4 x,y 4 x,y 3 19 55 – – – 81 86 – – –Togo 28 29 27 6 22 78 5 0 1 18 29 81 81 80Tokelau – – – – – – – – – – – – – –Tonga – – – 0 6 93 – – – 21 29 – – –Trinidad and Tobago 1 x,y 1 x,y 1 x,y 2 x 8 x 97 x – – – – 8 x 77 x,y 78 x,y 77 x,yTunisia 2 y 3 y 2 y 0 2 99 – – – – 30 93 y 94 y 92 yTurkey 6 y 8 y 4 y 1 15 99 y – – – – 13 – – –Turkmenistan 0 1 0 0 6 100 – – – – 26 37 y 39 y 34 yTurks and Caicos Islands – – – – – – – – – – – – – –Tuvalu – – – 0 x 10 x 50 x – – – 73 x 70 x – – –Uganda 16 y 17 y 16 y 10 40 30 1 1 9 44 58 – – –Ukraine 2 y 3 y 2 y 0 9 100 – – – 9 3 61 y 68 y 55 yUnited Arab Emirates – – – – – 100 y – – – – – – – –
TABLE 8. CHILD PROTECTION
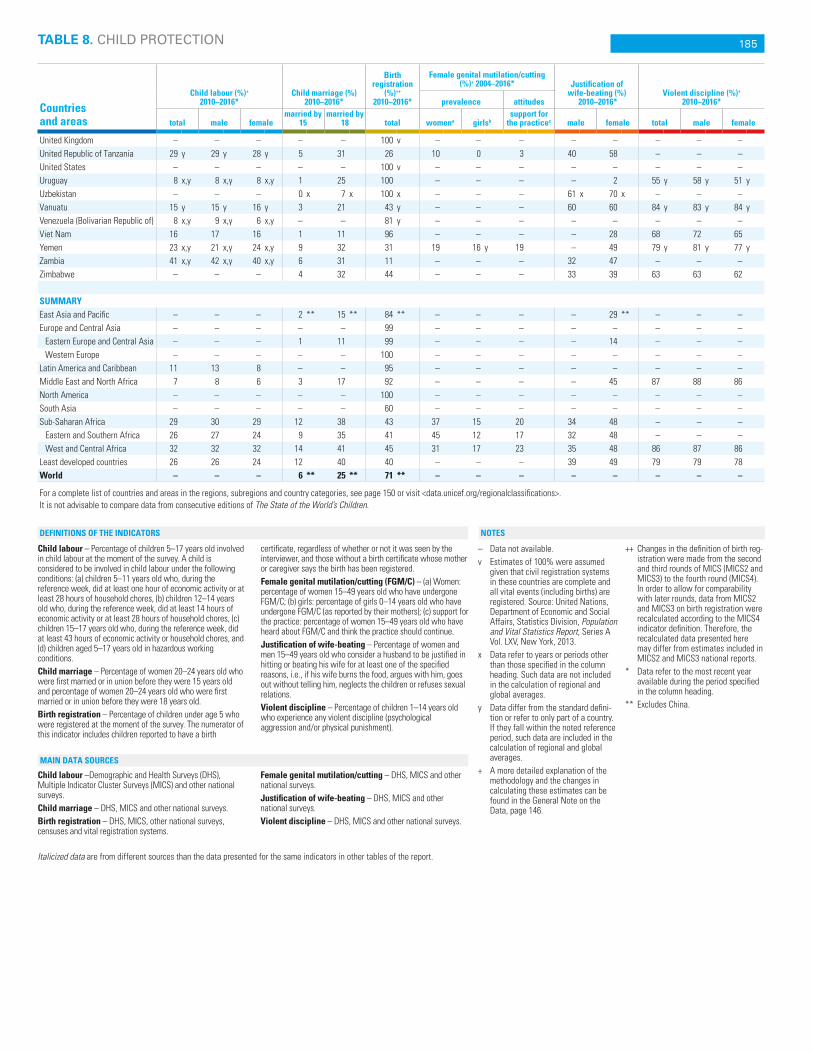
185TABLE 8. CHILD PROTECTION
Countries and areas
Child labour (%)+
2010–2016*Child marriage (%)
2010–2016*
Birth registration
(%)++ 2010–2016*
Female genital mutilation/cutting (%)+ 2004–2016* Justification of
wife-beating (%) 2010–2016*
Violent discipline (%)+
2010–2016*prevalence attitudes
total male femalemarried by
15married by
18 total womena girlsb support for
the practicec male female total male female
United Kingdom – – – – – 100 v – – – – – – – –United Republic of Tanzania 29 y 29 y 28 y 5 31 26 10 0 3 40 58 – – –United States – – – – – 100 v – – – – – – – –Uruguay 8 x,y 8 x,y 8 x,y 1 25 100 – – – – 2 55 y 58 y 51 yUzbekistan – – – 0 x 7 x 100 x – – – 61 x 70 x – – –Vanuatu 15 y 15 y 16 y 3 21 43 y – – – 60 60 84 y 83 y 84 yVenezuela (Bolivarian Republic of) 8 x,y 9 x,y 6 x,y – – 81 y – – – – – – – –Viet Nam 16 17 16 1 11 96 – – – – 28 68 72 65Yemen 23 x,y 21 x,y 24 x,y 9 32 31 19 16 y 19 – 49 79 y 81 y 77 yZambia 41 x,y 42 x,y 40 x,y 6 31 11 – – – 32 47 – – –Zimbabwe – – – 4 32 44 – – – 33 39 63 63 62
SUMMARY East Asia and Pacific – – – 2 ** 15 ** 84 ** – – – – 29 ** – – –Europe and Central Asia – – – – – 99 – – – – – – – –
Eastern Europe and Central Asia – – – 1 11 99 – – – – 14 – – –Western Europe – – – – – 100 – – – – – – – –
Latin America and Caribbean 11 13 8 – – 95 – – – – – – – –Middle East and North Africa 7 8 6 3 17 92 – – – – 45 87 88 86North America – – – – – 100 – – – – – – – –South Asia – – – – – 60 – – – – – – – –Sub-Saharan Africa 29 30 29 12 38 43 37 15 20 34 48 – – –
Eastern and Southern Africa 26 27 24 9 35 41 45 12 17 32 48 – – –West and Central Africa 32 32 32 14 41 45 31 17 23 35 48 86 87 86
Least developed countries 26 26 24 12 40 40 – – – 39 49 79 79 78World – – – 6 ** 25 ** 71 ** – – – – – – – –
For a complete list of countries and areas in the regions, subregions and country categories, see page 150 or visit <data.unicef.org/regionalclassifications>.It is not advisable to compare data from consecutive editions of The State of the World’s Children.
Child labour – Percentage of children 5–17 years old involved in child labour at the moment of the survey. A child is considered to be involved in child labour under the following conditions: (a) children 5–11 years old who, during the reference week, did at least one hour of economic activity or at least 28 hours of household chores, (b) children 12–14 years old who, during the reference week, did at least 14 hours of economic activity or at least 28 hours of household chores, (c) children 15–17 years old who, during the reference week, did at least 43 hours of economic activity or household chores, and (d) children aged 5–17 years old in hazardous working conditions.Child marriage – Percentage of women 20–24 years old who were first married or in union before they were 15 years old and percentage of women 20–24 years old who were first married or in union before they were 18 years old.Birth registration – Percentage of children under age 5 who were registered at the moment of the survey. The numerator of this indicator includes children reported to have a birth
certificate, regardless of whether or not it was seen by the interviewer, and those without a birth certificate whose mother or caregiver says the birth has been registered.Female genital mutilation/cutting (FGM/C) – (a) Women: percentage of women 15–49 years old who have undergone FGM/C; (b) girls: percentage of girls 0–14 years old who have undergone FGM/C (as reported by their mothers); (c) support for the practice: percentage of women 15–49 years old who have heard about FGM/C and think the practice should continue.Justification of wife-beating – Percentage of women and men 15–49 years old who consider a husband to be justified in hitting or beating his wife for at least one of the specified reasons, i.e., if his wife burns the food, argues with him, goes out without telling him, neglects the children or refuses sexual relations.Violent discipline – Percentage of children 1–14 years old who experience any violent discipline (psychological aggression and/or physical punishment).
Child labour –Demographic and Health Surveys (DHS), Multiple Indicator Cluster Surveys (MICS) and other national surveys.Child marriage – DHS, MICS and other national surveys.Birth registration – DHS, MICS, other national surveys, censuses and vital registration systems.
Female genital mutilation/cutting – DHS, MICS and other national surveys.Justification of wife-beating – DHS, MICS and other national surveys.Violent discipline – DHS, MICS and other national surveys.
– Data not available.v Estimates of 100% were assumed
given that civil registration systems in these countries are complete and all vital events (including births) are registered. Source: United Nations, Department of Economic and Social Affairs, Statistics Division, Population and Vital Statistics Report, Series A Vol. LXV, New York, 2013.
x Data refer to years or periods other than those specified in the column heading. Such data are not included in the calculation of regional and global averages.
y Data differ from the standard defini-tion or refer to only part of a country. If they fall within the noted reference period, such data are included in the calculation of regional and global averages.
+ A more detailed explanation of the methodology and the changes in calculating these estimates can be found in the General Note on the Data, page 146.
++ Changes in the definition of birth reg-istration were made from the second and third rounds of MICS (MICS2 and MICS3) to the fourth round (MICS4). In order to allow for comparability with later rounds, data from MICS2 and MICS3 on birth registration were recalculated according to the MICS4 indicator definition. Therefore, the recalculated data presented here may differ from estimates included in MICS2 and MICS3 national reports.
* Data refer to the most recent year available during the period specified in the column heading.
** Excludes China.
NOTESDEFINITIONS OF THE INDICATORS
MAIN DATA SOURCES
Italicized data are from different sources than the data presented for the same indicators in other tables of the report.

UNICEF – THE STATE OF THE WORLD’S CHILDREN 2017
Countries and areas
Adolescent populationAdolescents
currently married/ in union
(%)2010–2016*
Births by age 18
(%)Adolescent
birth rate
Justification of wife-beating among
adolescents (%)
2010–2016*
Use of mass media among adolescents
(%)2010–2016*
Lower secondary
school gross enrolment ratio
Upper secondary
school gross enrolment ratio
Comprehensive knowledge of HIV
among adolescents (%)
2011–2016* Aged 10–19 (thousands)
Proportion of total
population (%)
2016 2016 male female2011–2016* 2009–2014* male female male female 2011–2016* male female
Afghanistan 8,587 25 3 17 20 90 x 71 y 78 y 70 y 52 y 67 43 4 1Albania 446 15 1 x 8 x 3 x 18 37 x 24 x 97 x 99 x 101 89 21 x 36 xAlgeria 5,942 15 – 3 1 12 – 55 y – – 132 63 – 7Andorra – – – – – 5 – – – – – – – – Angola 6,486 23 2 18 38 191 24 25 84 77 36 21 29 31Anguilla – – – – – 46 x – – – – – – – – Antigua and Barbuda 17 17 – – – 67 x – – – – 117 82 55 x 40 xArgentina 7,020 16 – – 12 70 – 2 – – 128 85 – 36Armenia 356 12 0 5 1 23 25 9 88 92 88 90 9 15Australia 2,897 12 – – – 14 – – – – 112 186 – – Austria 873 10 – – – 8 – – – – 100 100 – – Azerbaijan 1,358 14 – 9 4 47 – 24 – 98 91 – 2 x 3 xBahamas 55 14 – – – 40 x – – – – – – – – Bahrain 158 11 – – – 15 – – – – 101 103 – – Bangladesh 32,575 20 – 44 36 83 – 29 y – 54 y 83 48 – 12Barbados 37 13 – 1 7 49 x – 5 – 98 107 113 – 66Belarus 904 10 1 7 3 x 22 3 3 – – 102 119 53 51Belgium 1,253 11 – – – 8 – – – – 185 158 – – Belize 78 21 11 21 17 64 8 6 92 92 91 60 – 39Benin 2,440 22 1 16 19 98 19 31 68 57 70 38 29 22Bhutan 148 19 – 15 15 x 28 – 70 – – 96 69 – 22 x,pBolivia (Plurinational State of) 2,216 20 4 x 13 x 20 x 89 x – 17 x 100 x 97 x 96 81 24 x 20 xBosnia and Herzegovina 410 12 0 1 – 11 5 1 100 100 – – 41 42Botswana 431 19 – – – 39 – – – – 91 – – – Brazil 33,760 16 1 4 – 65 – – – – 106 91 – – British Virgin Islands – – – – – 27 x – – – – 111 80 – – Brunei Darussalam 70 16 – – – 17 x – – – – 105 93 – – Bulgaria 620 9 – 2 y 5 43 – – – – 90 108 – – Burkina Faso 4,306 23 2 32 28 x 136 x 40 39 61 55 47 13 31 x 29 xBurundi 2,243 21 1 9 11 x 65 x 56 74 83 69 54 25 50 46Cabo Verde 114 21 2 x 8 x 22 x 92 x 24 x 23 x 88 x 88 x 115 73 – – Cambodia 3,052 19 3 16 7 57 26 y 46 y 77 74 63 – 42 33Cameroon 5,206 22 1 20 28 128 x 45 37 80 64 68 43 30 26Canada 3,968 11 – – – 13 – – – – 100 119 – – Central African Republic 1,117 24 11 55 45 x 229 83 79 – – 23 9 26 x 17 xChad 3,433 24 3 38 51 203 54 69 30 23 26 18 12 10Chile 2,591 14 – – – 50 – – – – 103 100 – – China 159,642 11 1 2 – 6 – – – – 99 90 – – Colombia 8,139 17 – 13 20 85 x – – – – 106 82 – 21 xComoros 173 22 8 16 17 71 29 43 79 67 66 52 21 18Congo 1,083 21 2 16 26 147 76 y 73 y 56 68 65 38 25 p 16Cook Islands – – – – – 56 – – – – 96 73 – – Costa Rica 759 16 2 10 13 67 – 3 – – 133 109 – 29Côte d'Ivoire 5,409 23 1 21 31 125 51 51 73 62 55 28 21 15Croatia 447 11 – – – 12 – – – – 104 93 – – Cuba 1,336 12 7 16 6 50 5 y 4 y – – 101 100 48 59Cyprus 143 12 – – – 4 – – – – 100 100 – – Czechia 936 9 – – – 11 – – – – 101 110 – – Democratic People's Republic of Korea 3,839 15 – – – 1 x – – – – 92 95 – 7 x
Democratic Republic of the Congo 17,401 22 1 21 27 135 69 75 49 38 56 37 20 17Denmark 690 12 – – – 2 – – – – 117 144 – – Djibouti 196 21 1 3 – 21 – – – – 53 41 – 16 xDominica – – – – – 47 x – – – – 115 81 39 x 49 xDominican Republic 2,007 19 – 28 21 90 – 3 – 98 86 74 39 – Ecuador 3,005 18 – 16 x – 100 x – – – – 116 96 – – Egypt 17,041 18 – 14 7 56 – 46 y 100 100 99 73 5 3El Salvador 1,289 20 – 16 18 63 – 10 – 98 99 61 25 28Equatorial Guinea 217 18 5 22 42 177 x 56 57 91 91 39 – 12 17Eritrea 1,085 22 1 17 19 x – 60 51 70 54 39 23 32 x 22 xEstonia 122 9 – – – 16 – – – – 112 118 – – Ethiopia 24,772 24 1 17 22 71 33 60 38 31 43 18 32 24Fiji 157 17 – – – 28 x – – – – 103 76 – – Finland 594 11 – – – 7 – – – – 102 194 – –
TABLE 9. ADOLESCENTS

187
Countries and areas
Adolescent populationAdolescents
currently married/ in union
(%)2010–2016*
Births by age 18
(%)Adolescent
birth rate
Justification of wife-beating among
adolescents (%)
2010–2016*
Use of mass media among adolescents
(%)2010–2016*
Lower secondary
school gross enrolment ratio
Upper secondary
school gross enrolment ratio
Comprehensive knowledge of HIV
among adolescents (%)
2011–2016* Aged 10–19 (thousands)
Proportion of total
population (%)
2016 2016 male female2011–2016* 2009–2014* male female male female 2011–2016* male female
France 7,723 12 – – – 9 – – – – 108 115 – – Gabon 379 19 1 14 28 115 47 58 95 94 – – 35 29Gambia 467 23 0 24 19 88 42 58 82 70 64 – 27 22Georgia 450 11 – 11 6 x 40 – 5 x – – 114 95 – – Germany 7,795 10 – – – 8 – – – – 101 105 – – Ghana 6,009 21 1 6 17 65 20 35 81 67 89 39 25 18Greece 1,108 10 – – – 9 – – – – 101 111 – – Grenada 19 17 – – – 53 x – – – – 100 98 67 x 59 xGuatemala 3,787 23 6 20 20 92 12 14 95 90 72 55 18 20Guinea 2,786 22 1 33 40 154 63 89 55 53 44 31 29 20Guinea-Bissau 395 22 0 11 28 137 37 40 96 89 – – 19 20Guyana 165 21 13 13 16 97 x 14 10 95 96 93 83 33 48Haiti 2,285 21 2 12 13 65 22 24 85 80 – – 25 32Holy See – – – – – – – – – – – – – – Honduras 1,990 22 5 23 22 99 18 15 98 94 74 66 33 29Hungary 996 10 – – – 20 – – – – 100 110 – – Iceland 43 13 – – – 7 – – – – 97 133 – – India 250,086 19 5 x 30 x 22 x 39 47 x 45 x 88 x 72 x 88 64 35 x 19 xIndonesia 46,188 18 – 9 y 7 47 48 y 45 88 y,p 91 95 76 4 p 9Iran (Islamic Republic of) 10,928 14 – 16 x 5 x 35 – – – – 99 85 – – Iraq 8,019 22 – 21 12 68 x – 50 – – – – – 3Ireland 583 12 – – – 9 – – – – 111 154 – – Israel 1,296 16 – – – 10 – – – – 104 101 – – Italy 5,592 9 – – – 6 – – – – 106 101 – – Jamaica 520 18 – 3 15 72 x – 8 – – 86 76 34 39Japan 11,650 9 – – – 4 – – – – 102 101 – – Jordan 1,918 20 – 6 4 27 – 84 y – 100 y 87 74 – 6Kazakhstan 2,269 13 – 6 2 31 x – 8 – 96 114 103 30 – Kenya 11,065 23 1 12 23 101 37 45 84 75 97 – 58 52Kiribati 23 20 5 x 16 x 9 x 49 65 x 77 x 58 x 57 x 105 – 46 x 41 xKuwait 450 11 – – – 8 – – – – 99 85 – – Kyrgyzstan 991 17 – 14 4 42 – 22 – 100 97 81 18 – Lao People's Democratic Republic 1,432 21 9 25 18 94 50 56 92 93 76 43 25 23Latvia 181 9 – – – 15 – – – – 116 123 – – Lebanon 1,061 18 – 3 x – 18 x – 22 x,y – – 68 55 – – Lesotho 495 22 1 18 14 94 49 48 60 66 63 40 30 35Liberia 1,041 23 2 14 37 147 29 45 59 47 44 29 19 35Libya 1,093 17 – – – 4 x – – – – – – – – Liechtenstein – – – – – 2 – – – – 98 139 – – Lithuania 307 11 – – – 14 – – – – 106 114 – – Luxembourg 65 11 – – – 6 – – – – 114 94 – – Madagascar 5,740 23 7 28 36 147 x 44 47 62 59 50 22 24 21Malawi 4,262 24 3 24 31 143 24 21 50 35 53 22 43 39Malaysia 5,513 18 5 6 – 13 – – – – 89 69 – – Maldives 59 14 – 5 x 1 x 14 – 41 x,y – 100 x 97 – – 22 xMali 4,135 23 2 40 37 178 54 68 83 75 52 29 27 21Malta 44 10 – – – 16 – – – – 102 90 – – Marshall Islands – – 5 x 21 x 21 x 85 71 x 47 x 86 x 85 x 81 67 35 x 27 xMauritania 917 21 1 28 22 71 – 36 55 x 44 x 37 21 10 – Mauritius 189 15 – – – 31 – – – – 111 84 – – Mexico 23,416 18 6 15 21 84 – 6 – 96 116 65 – 28Micronesia (Federated States of) 25 24 – – – 33 – – – – 81 – – – Monaco – – – – – – – – – – – – – – Mongolia 448 15 1 5 3 40 9 14 98 98 93 90 17 18Montenegro 81 13 0 2 3 12 5 2 – – 95 86 35 42Montserrat – – – – – 36 – – – – – – – – Morocco 5,982 17 1 11 8 x 32 x – 64 x – 90 x 97 55 – – Mozambique 6,649 23 8 37 40 166 20 24 73 57 39 21 28 28Myanmar 10,042 19 5 13 5 17 x 57 53 75 76 59 34 14 13Namibia 539 22 1 5 15 78 30 28 65 y 69 92 – 51 56Nauru – – 9 x 18 x 22 x 106 – – 89 x 86 x 77 94 8 x 8 xNepal 6,625 23 – 25 16 87 x – 35 – 77 93 50 24 18Netherlands 2,021 12 – – – 5 – – – – 136 134 – –
TABLE 9. ADOLESCENTS

UNICEF – THE STATE OF THE WORLD’S CHILDREN 2017
Countries and areas
Adolescent populationAdolescents
currently married/ in union
(%)2010–2016*
Births by age 18
(%)Adolescent
birth rate
Justification of wife-beating among
adolescents (%)
2010–2016*
Use of mass media among adolescents
(%)2010–2016*
Lower secondary
school gross enrolment ratio
Upper secondary
school gross enrolment ratio
Comprehensive knowledge of HIV
among adolescents (%)
2011–2016* Aged 10–19 (thousands)
Proportion of total
population (%)
2016 2016 male female2011–2016* 2009–2014* male female male female 2011–2016* male female
New Zealand 616 13 – – – 22 – – – – 103 134 – – Nicaragua 1,207 20 – 24 x 28 x 92 – 19 x,y – 95 x – – – – Niger 4,704 23 3 61 48 210 41 54 35 44 27 10 21 12Nigeria 41,050 22 1 29 29 123 27 33 54 50 52 60 29 22Niue – – – – – 16 – – – – 119 95 – – Norway 633 12 – – – 6 – – – – 100 125 – – Oman 480 11 – 3 2 12 – 10 – – 113 96 – – Pakistan 38,907 20 2 14 8 48 33 y,p 53 y 59 y,p 49 y 57 35 5 p 1Palau – – – – – 27 – – – – 78 119 – – Panama 696 17 – 14 – 89 – 9 – 96 94 57 – – Papua New Guinea 1,728 21 3 x 15 x 14 x 65 x – – – – 73 22 – – Paraguay 1,342 20 – 11 x – 63 x – – – – 84 69 – – Peru 5,606 18 – 11 16 68 – – – 90 100 90 – 21 xPhilippines 20,667 20 – 10 8 59 – 14 – 90 92 77 – 19 xPoland 3,814 10 – – – 14 – – – – 101 115 – – Portugal 1,080 10 – – – 12 – – – – 119 119 – – Qatar 200 8 1 4 – 16 22 6 y 98 98 100 82 23 10Republic of Korea 5,686 11 – – – 2 – – – – 103 95 – – Republic of Moldova 444 11 1 10 4 25 14 13 96 96 87 85 26 35Romania 2,132 11 – – – 36 – – – – 93 92 – – Russian Federation 13,260 9 – – – 27 – – – – 101 114 – – Rwanda 2,607 22 0 3 6 41 x 24 45 78 71 42 31 60 62Saint Kitts and Nevis – – – – – 75 x – – – – 93 86 55 x 54 xSaint Lucia 29 16 – 4 – 50 x – 15 – 99 87 82 – 58Saint Vincent and the Grenadines 19 17 – – – 70 – – – – 120 86 – – Samoa 43 22 1 8 6 39 28 34 99 97 102 78 5 x 2 xSan Marino – – – – – 1 – – – – 94 95 – – Sao Tome and Principe 46 23 1 15 27 110 x 19 24 97 97 110 61 42 41Saudi Arabia 4,818 15 – – – 7 x – – – – 108 108 – – Senegal 3,380 22 0 21 18 80 36 57 69 76 59 36 28 26Serbia 1,063 12 – 4 1 22 – 2 99 100 102 91 43 x 53 xSeychelles 12 12 – – – 62 – – – – 112 59 – – Sierra Leone 1,704 23 1 19 36 131 32 55 55 49 61 28 29 28Singapore 665 12 – – – 3 – – – – – – – – Slovakia 553 10 – – – 21 – – – – 98 86 – – Slovenia 186 9 – – – 5 – – – – 100 118 – – Solomon Islands 134 22 2 11 15 62 x 60 78 37 28 78 29 26 x 29 xSomalia 3,333 23 – 25 x – 123 x – 75 x,y – – – – – 3 xSouth Africa 10,319 18 2 x 4 x 15 x 54 x – – – – 97 88 – – South Sudan 2,767 23 – 40 28 x 158 x – 72 – – 18 5 – 8 xSpain 4,386 9 – – – 9 – – – – 124 136 – – Sri Lanka 3,284 16 – 9 x 4 x 24 x – 54 x,y – 88 x,y 99 99 – – State of Palestine 1,083 23 – 9 22 67 – – – – 88 66 – 5Sudan 9,060 23 – 21 22 102 – 36 – – 54 35 10 – Suriname 99 18 – 12 – 66 x – 19 – 99 101 54 – 40 xSwaziland 302 23 0 4 17 89 29 32 89 86 75 52 44 45Sweden 1,025 10 – – – 3 – – – – 115 164 – – Switzerland 833 10 – – – 3 – – – – 106 98 – – Syrian Arab Republic 4,586 25 – 10 x 9 x 75 x – – – – 61 32 – 6 xTajikistan 1,710 20 – 13 2 47 – 47 – 89 98 68 9 – Thailand 9,207 13 7 14 9 60 9 9 – – 128 130 45 47The formeryugoslav Republic of Macedonia 253 12 – 4 2 19 – 14 – – 83 76 – 23 x
Timor-Leste 314 25 0 8 9 x 54 x 72 81 61 62 87 65 15 x 11 xTogo 1,665 22 1 13 15 77 19 26 67 63 68 36 28 23Tokelau – – – – – 30 – – – – 206 – – – Tonga 24 23 4 5 2 30 29 27 92 95 103 56 13 10Trinidad and Tobago 177 13 – 6 x – 36 x – 10 x – – – – – 49 xTunisia 1,618 14 – 1 1 7 – 27 – 98 103 78 – 15Turkey 13,335 17 – 7 6 29 – 10 – – 99 106 – – Turkmenistan 954 17 – 6 1 21 x – 17 – 100 73 120 – 19Turks and Caicos Islands – – – – – 29 x – – – – – – – – Tuvalu – – 2 x 8 x 3 x 42 x 83 x 69 x 89 x 95 x 99 56 57 x 31 xUganda 9,920 24 2 20 33 140 52 62 88 82 – – 40 41
TABLE 9. ADOLESCENTS
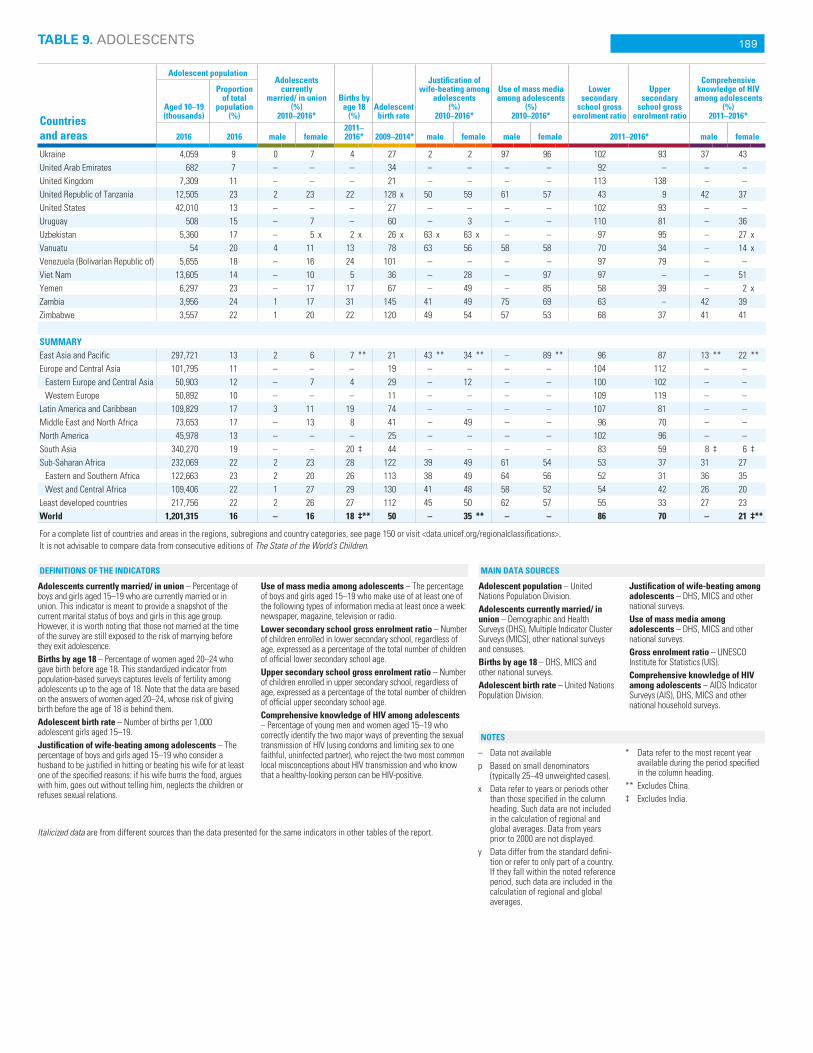
189
Countries and areas
Adolescent populationAdolescents
currently married/ in union
(%)2010–2016*
Births by age 18
(%)Adolescent
birth rate
Justification of wife-beating among
adolescents (%)
2010–2016*
Use of mass media among adolescents
(%)2010–2016*
Lower secondary
school gross enrolment ratio
Upper secondary
school gross enrolment ratio
Comprehensive knowledge of HIV
among adolescents (%)
2011–2016* Aged 10–19 (thousands)
Proportion of total
population (%)
2016 2016 male female2011–2016* 2009–2014* male female male female 2011–2016* male female
Ukraine 4,059 9 0 7 4 27 2 2 97 96 102 93 37 43United Arab Emirates 682 7 – – – 34 – – – – 92 – – – United Kingdom 7,309 11 – – – 21 – – – – 113 138 – – United Republic of Tanzania 12,505 23 2 23 22 128 x 50 59 61 57 43 9 42 37United States 42,010 13 – – – 27 – – – – 102 93 – – Uruguay 508 15 – 7 – 60 – 3 – – 110 81 – 36Uzbekistan 5,360 17 – 5 x 2 x 26 x 63 x 63 x – – 97 95 – 27 xVanuatu 54 20 4 11 13 78 63 56 58 58 70 34 – 14 xVenezuela (Bolivarian Republic of) 5,655 18 – 16 24 101 – – – – 97 79 – – Viet Nam 13,605 14 – 10 5 36 – 28 – 97 97 – – 51Yemen 6,297 23 – 17 17 67 – 49 – 85 58 39 – 2 xZambia 3,956 24 1 17 31 145 41 49 75 69 63 – 42 39Zimbabwe 3,557 22 1 20 22 120 49 54 57 53 68 37 41 41
SUMMARYEast Asia and Pacific 297,721 13 2 6 7 ** 21 43 ** 34 ** – 89 ** 96 87 13 ** 22 **Europe and Central Asia 101,795 11 – – – 19 – – – – 104 112 – –
Eastern Europe and Central Asia 50,903 12 – 7 4 29 – 12 – – 100 102 – – Western Europe 50,892 10 – – – 11 – – – – 109 119 – –
Latin America and Caribbean 109,829 17 3 11 19 74 – – – – 107 81 – – Middle East and North Africa 73,653 17 – 13 8 41 – 49 – – 96 70 – – North America 45,978 13 – – – 25 – – – – 102 96 – – South Asia 340,270 19 – – 20 ‡ 44 – – – – 83 59 8 ‡ 6 ‡Sub-Saharan Africa 232,069 22 2 23 28 122 39 49 61 54 53 37 31 27
Eastern and Southern Africa 122,663 23 2 20 26 113 38 49 64 56 52 31 36 35West and Central Africa 109,406 22 1 27 29 130 41 48 58 52 54 42 26 20
Least developed countries 217,756 22 2 26 27 112 45 50 62 57 55 33 27 23World 1,201,315 16 – 16 18 ‡** 50 – 35 ** – – 86 70 – 21 ‡**
For a complete list of countries and areas in the regions, subregions and country categories, see page 150 or visit <data.unicef.org/regionalclassifications>.It is not advisable to compare data from consecutive editions of The State of the World’s Children.
TABLE 9. ADOLESCENTS
Adolescents currently married/ in union – Percentage of boys and girls aged 15–19 who are currently married or in union. This indicator is meant to provide a snapshot of the current marital status of boys and girls in this age group. However, it is worth noting that those not married at the time of the survey are still exposed to the risk of marrying before they exit adolescence.Births by age 18 – Percentage of women aged 20–24 who gave birth before age 18. This standardized indicator from population-based surveys captures levels of fertility among adolescents up to the age of 18. Note that the data are based on the answers of women aged 20–24, whose risk of giving birth before the age of 18 is behind them.Adolescent birth rate – Number of births per 1,000 adolescent girls aged 15–19.Justification of wife-beating among adolescents – The percentage of boys and girls aged 15–19 who consider a husband to be justified in hitting or beating his wife for at least one of the specified reasons: if his wife burns the food, argues with him, goes out without telling him, neglects the children or refuses sexual relations.
Use of mass media among adolescents – The percentage of boys and girls aged 15–19 who make use of at least one of the following types of information media at least once a week: newspaper, magazine, television or radio.Lower secondary school gross enrolment ratio – Number of children enrolled in lower secondary school, regardless of age, expressed as a percentage of the total number of children of official lower secondary school age.Upper secondary school gross enrolment ratio – Number of children enrolled in upper secondary school, regardless of age, expressed as a percentage of the total number of children of official upper secondary school age.Comprehensive knowledge of HIV among adolescents – Percentage of young men and women aged 15–19 who correctly identify the two major ways of preventing the sexual transmission of HIV (using condoms and limiting sex to one faithful, uninfected partner), who reject the two most common local misconceptions about HIV transmission and who know that a healthy-looking person can be HIV-positive.
Adolescent population – United Nations Population Division.Adolescents currently married/ in union – Demographic and Health Surveys (DHS), Multiple Indicator Cluster Surveys (MICS), other national surveys and censuses.Births by age 18 – DHS, MICS and other national surveys.Adolescent birth rate – United Nations Population Division.
Justification of wife-beating among adolescents – DHS, MICS and other national surveys.Use of mass media among adolescents – DHS, MICS and other national surveys.Gross enrolment ratio – UNESCO Institute for Statistics (UIS).Comprehensive knowledge of HIV among adolescents – AIDS Indicator Surveys (AIS), DHS, MICS and other national household surveys.
– Data not availablep Based on small denominators
(typically 25–49 unweighted cases).x Data refer to years or periods other
than those specified in the column heading. Such data are not included in the calculation of regional and global averages. Data from years prior to 2000 are not displayed.
y Data differ from the standard defini-tion or refer to only part of a country. If they fall within the noted reference period, such data are included in the calculation of regional and global averages.
* Data refer to the most recent year available during the period specified in the column heading.
** Excludes China. ‡ Excludes India.
NOTES
MAIN DATA SOURCESDEFINITIONS OF THE INDICATORS
Italicized data are from different sources than the data presented for the same indicators in other tables of the report.

UNICEF – THE STATE OF THE WORLD’S CHILDREN 2017
Countries and areas
Birth registration (%)++
2010–2016*
Skilled birth attendant (%)
2011–2016*
Stunting prevalence in children under 5
(moderate & severe)θ (%) 2011–2016*
Oral rehydration salts (ORS) treatment for children with diarrhoea
(%) 2011–2016*
Primary school net attendance ratio
2011–2016*
Comprehensive knowledge of HIV/AIDS
(%) Females 15–242011–2016*
Use of basic sanitation services
(%)2015
urban rural
ratio of urban
to rural urban rural
ratio of urban
to rural urban rural
ratio of rural to urban urban rural
ratio of urban to
rural urban rural
ratio of urban to
rural urban rural
ratio of urban to
rural urban rural
ratio of urban
to rural
Afghanistan 64 36 1.8 79 42 1.9 – – – 44 47 0.9 80 59 1.4 2 1 2.1 56 33 1.7Albania 99 x 98 x 1.0 x 100 x 99 x 1.0 x 23 x 23 x 1.0 x – – – 93 92 1.0 51 x 26 x 2.0 x 98 97 1.0Algeria 100 100 1.0 98 95 1.0 11 12 1.1 25 26 1.0 98 97 1.0 11 7 1.7 90 82 1.1Andorra – – – – – – – – – – – – – – – – – – 100 100 1.0Angola 33 14 2.4 68 21 3.2 32 46 1.4 49 32 1.5 84 61 1.4 42 9 4.4 62 21 2.9Anguilla – – – – – – – – – – – – – – – – – – 97 – –Antigua and Barbuda – – – – – – – – – – – – – – – – – – – – –Argentina – – – – – – – – – – – – – – – – – – 95 94 1.0Armenia 99 98 1.0 100 100 1.0 6 13 2.2 – – – 100 99 1.0 25 14 1.7 96 83 1.2Australia – – – – – – – – – – – – – – – – – – – – –Austria – – – – – – – – – – – – – – – – – – 100 100 1.0Azerbaijan 96 x 92 x 1.0 x 99 95 1.0 15 21 1.4 11 11 1.0 68 y 67 y 1.0 y 7 x 2 x 3.3 x 92 87 1.1Bahamas – – – – – – – – – – – – – – – – – – – – –Bahrain – – – – – – – – – – – – – – – – – – – – –Bangladesh 23 19 1.2 61 36 1.7 31 38 1.2 83 75 1.1 91 92 1.0 14 8 1.8 54 43 1.2Barbados 98 100 1.0 98 100 1.0 8 7 0.9 – – – 100 99 1.0 67 69 1.0 – – –Belarus – – – 100 100 1.0 3 x 8 x 2.6 x – – – 91 93 1.0 56 57 1.0 94 95 1.0Belgium – – – – – – – – – – – – – – – – – – 99 99 1.0Belize 97 95 1.0 98 96 1.0 11 18 1.7 54 56 1.0 99 94 1.0 55 33 1.7 91 84 1.1Benin 88 82 1.1 83 73 1.2 29 38 1.3 26 25 1.1 83 69 1.2 25 18 1.3 25 5 4.6Bhutan 100 100 1.0 96 67 1.4 28 x 36 x 1.3 x 64 x 60 x 1.1 x 98 94 1.0 32 x 15 x 2.1 x 72 57 1.3Bolivia (Plurinational State of) 79 x,y 72 x,y 1.1 x,y 94 68 1.4 14 25 1.8 23 20 1.2 98 x 96 x 1.0 x 32 x 9 x 3.5 x 64 27 2.4Bosnia and Herzegovina 99 x 100 x 1.0 x 100 100 1.0 11 8 0.7 – – – 95 97 1.0 50 47 1.1 99 92 1.1Botswana 78 x 67 x 1.2 x 99 x 90 x 1.1 x – – – – – – – – – – – – 75 39 1.9Brazil – – – 98 x 94 x 1.0 x 7 x 8 x 1.1 x – – – – – – – – – 91 58 1.6British Virgin Islands – – – – – – – – – – – – – – – – – – – – –Brunei Darussalam – – – – – – – – – – – – – – – – – – 96 97 1.0Bulgaria – – – – – – – – – – – – – – – – – – 87 84 1.0Burkina Faso 93 74 1.3 95 77 1.2 21 x 37 x 1.8 x 46 38 1.2 83 45 1.8 46 x 24 x 1.9 x 48 12 4.0Burundi 87 74 1.2 96 84 1.1 28 59 2.1 30 36 0.8 91 84 1.1 61 51 1.2 46 51 0.9Cabo Verde – – – 91 x 64 x 1.4 x – – – – – – – – – – – – 73 51 1.4Cambodia 84 72 1.2 98 88 1.1 24 34 1.4 30 36 0.8 97 92 1.1 55 33 1.7 88 39 2.3Cameroon 84 53 1.6 88 49 1.8 23 38 1.7 24 12 2.1 94 79 1.2 37 18 2.1 56 19 2.9Canada – – – – – – – – – – – – – – – – – – – – –Central African Republic 78 52 1.5 74 x 22 x 3.4 x 38 42 1.1 23 x 12 x 2.0 x 86 66 1.3 19 x 16 x 1.2 x 49 9 5.4Chad 36 6 5.6 54 12 4.6 32 42 1.3 28 18 1.5 72 45 1.6 25 6 4.0 33 3 11.3Chile – – – 100 x 99 x 1.0 x – – – – – – – – – – – – 100 99 1.0China – – – 100 100 1.0 4 11 2.6 – – – 97 y 96 y 1.0 y – – – 86 61 1.4Colombia 99 98 1.0 99 88 1.1 11 x 17 x 1.5 x 57 x 49 x 1.2 x 94 94 1.0 26 x 17 x 1.5 x 88 72 1.2Comoros 90 87 1.0 92 79 1.2 26 35 1.4 40 37 1.1 90 82 1.1 24 17 1.4 47 29 1.6Congo 95 85 1.1 98 84 1.2 20 30 1.5 31 22 1.4 – – – 16 10 1.5 20 6 3.6Cook Islands – – – – – – – – – – – – – – – – – – – – –Costa Rica 100 99 1.0 99 97 1.0 – – – 43 35 1.2 97 95 1.0 37 27 1.4 98 94 1.0Côte d'Ivoire 85 54 1.6 84 45 1.9 22 34 1.6 22 14 1.5 85 71 1.2 22 8 2.7 45 13 3.5Croatia – – – – – – – – – – – – – – – – – – 98 96 1.0Cuba 100 100 1.0 99 100 1.0 – – – 62 59 1.0 – – – 61 63 1.0 92 88 1.0Cyprus – – – – – – – – – – – – – – – – – – 100 99 1.0Czechia – – – – – – – – – – – – – – – – – – 99 99 1.0Democratic People's Republic of Korea 100 x 100 x 1.0 x 100 x 100 x 1.0 x 23 x 45 x 1.9 x 75 x 73 x 1.0 x 100 99 1.0 11 x 4 x 2.8 x 83 68 1.2
Democratic Republic of the Congo 30 22 1.3 94 74 1.3 33 47 1.4 44 37 1.2 93 84 1.1 24 15 1.6 23 18 1.3Denmark – – – – – – – – – – – – – – – – – – 100 100 1.0Djibouti 92 x 84 x 1.1 x 98 55 1.8 30 42 1.4 – – – – – – 18 x 9 x 2.0 x 63 13 4.8Dominica – – – – – – – – – – – – – – – – – – – – –Dominican Republic 90 82 1.1 98 97 1.0 7 6 0.9 50 42 1.2 – – – 49 38 1.3 85 74 1.2Ecuador 95 91 1.0 98 x 99 x 1.0 x – – – 52 35 1.5 97 y 97 y 1.0 y – – – 89 80 1.1Egypt 100 99 1.0 97 89 1.1 23 21 0.9 26 29 0.9 97 97 1.0 5 4 1.5 97 90 1.1El Salvador 98 99 1.0 99 96 1.0 11 17 1.5 72 68 1.1 97 95 1.0 37 22 1.7 93 87 1.1Equatorial Guinea 60 47 1.3 86 53 1.6 20 32 1.6 55 27 2.0 – – – 27 9 2.9 80 71 1.1Eritrea – – – 74 x 17 x 4.4 x 38 x 56 x 1.4 x 51 x 41 x 1.2 x 91 y 77 y 1.2 y 32 x 20 x 1.7 x 29 6 4.7Estonia – – – – – – – – – – – – – – – – – – 100 100 1.0Ethiopia 12 2 7.2 80 21 3.8 25 40 1.6 41 28 1.4 80 y 63 y 1.3 y 38 19 2.0 18 4 4.3Fiji – – – – – – – – – – – – – – – – – – 96 95 1.0Finland – – – – – – – – – – – – – – – – – – 99 99 1.0
TABLE 10. DISPARITIES BY RESIDENCE
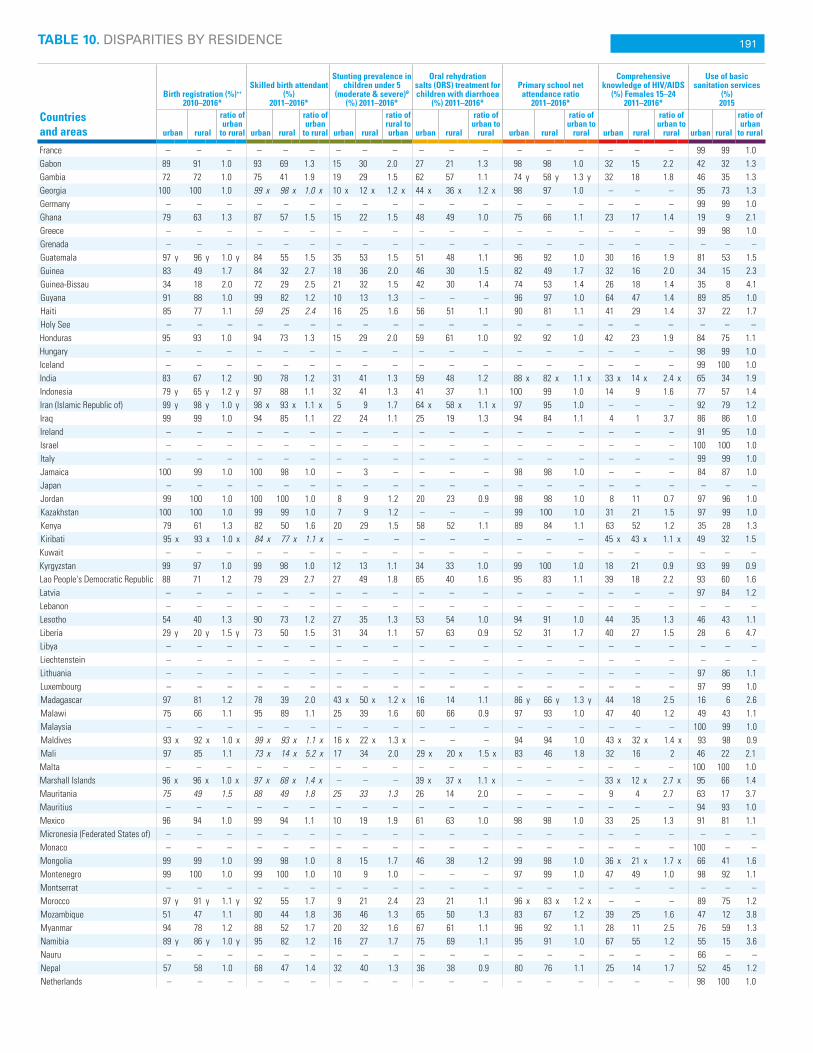
191TABLE 10. DISPARITIES BY RESIDENCE
Countries and areas
Birth registration (%)++
2010–2016*
Skilled birth attendant (%)
2011–2016*
Stunting prevalence in children under 5
(moderate & severe)θ (%) 2011–2016*
Oral rehydration salts (ORS) treatment for children with diarrhoea
(%) 2011–2016*
Primary school net attendance ratio
2011–2016*
Comprehensive knowledge of HIV/AIDS
(%) Females 15–242011–2016*
Use of basic sanitation services
(%)2015
urban rural
ratio of urban
to rural urban rural
ratio of urban
to rural urban rural
ratio of rural to urban urban rural
ratio of urban to
rural urban rural
ratio of urban to
rural urban rural
ratio of urban to
rural urban rural
ratio of urban
to rural
France – – – – – – – – – – – – – – – – – – 99 99 1.0Gabon 89 91 1.0 93 69 1.3 15 30 2.0 27 21 1.3 98 98 1.0 32 15 2.2 42 32 1.3Gambia 72 72 1.0 75 41 1.9 19 29 1.5 62 57 1.1 74 y 58 y 1.3 y 32 18 1.8 46 35 1.3Georgia 100 100 1.0 99 x 98 x 1.0 x 10 x 12 x 1.2 x 44 x 36 x 1.2 x 98 97 1.0 – – – 95 73 1.3Germany – – – – – – – – – – – – – – – – – – 99 99 1.0Ghana 79 63 1.3 87 57 1.5 15 22 1.5 48 49 1.0 75 66 1.1 23 17 1.4 19 9 2.1Greece – – – – – – – – – – – – – – – – – – 99 98 1.0Grenada – – – – – – – – – – – – – – – – – – – – –Guatemala 97 y 96 y 1.0 y 84 55 1.5 35 53 1.5 51 48 1.1 96 92 1.0 30 16 1.9 81 53 1.5Guinea 83 49 1.7 84 32 2.7 18 36 2.0 46 30 1.5 82 49 1.7 32 16 2.0 34 15 2.3Guinea-Bissau 34 18 2.0 72 29 2.5 21 32 1.5 42 30 1.4 74 53 1.4 26 18 1.4 35 8 4.1Guyana 91 88 1.0 99 82 1.2 10 13 1.3 – – – 96 97 1.0 64 47 1.4 89 85 1.0Haiti 85 77 1.1 59 25 2.4 16 25 1.6 56 51 1.1 90 81 1.1 41 29 1.4 37 22 1.7Holy See – – – – – – – – – – – – – – – – – – – – –Honduras 95 93 1.0 94 73 1.3 15 29 2.0 59 61 1.0 92 92 1.0 42 23 1.9 84 75 1.1Hungary – – – – – – – – – – – – – – – – – – 98 99 1.0Iceland – – – – – – – – – – – – – – – – – – 99 100 1.0India 83 67 1.2 90 78 1.2 31 41 1.3 59 48 1.2 88 x 82 x 1.1 x 33 x 14 x 2.4 x 65 34 1.9Indonesia 79 y 65 y 1.2 y 97 88 1.1 32 41 1.3 41 37 1.1 100 99 1.0 14 9 1.6 77 57 1.4Iran (Islamic Republic of) 99 y 98 y 1.0 y 98 x 93 x 1.1 x 5 9 1.7 64 x 58 x 1.1 x 97 95 1.0 – – – 92 79 1.2Iraq 99 99 1.0 94 85 1.1 22 24 1.1 25 19 1.3 94 84 1.1 4 1 3.7 86 86 1.0Ireland – – – – – – – – – – – – – – – – – – 91 95 1.0Israel – – – – – – – – – – – – – – – – – – 100 100 1.0Italy – – – – – – – – – – – – – – – – – – 99 99 1.0Jamaica 100 99 1.0 100 98 1.0 – 3 – – – – 98 98 1.0 – – – 84 87 1.0Japan – – – – – – – – – – – – – – – – – – – – –Jordan 99 100 1.0 100 100 1.0 8 9 1.2 20 23 0.9 98 98 1.0 8 11 0.7 97 96 1.0Kazakhstan 100 100 1.0 99 99 1.0 7 9 1.2 – – – 99 100 1.0 31 21 1.5 97 99 1.0Kenya 79 61 1.3 82 50 1.6 20 29 1.5 58 52 1.1 89 84 1.1 63 52 1.2 35 28 1.3Kiribati 95 x 93 x 1.0 x 84 x 77 x 1.1 x – – – – – – – – – 45 x 43 x 1.1 x 49 32 1.5Kuwait – – – – – – – – – – – – – – – – – – – – –Kyrgyzstan 99 97 1.0 99 98 1.0 12 13 1.1 34 33 1.0 99 100 1.0 18 21 0.9 93 99 0.9Lao People's Democratic Republic 88 71 1.2 79 29 2.7 27 49 1.8 65 40 1.6 95 83 1.1 39 18 2.2 93 60 1.6Latvia – – – – – – – – – – – – – – – – – – 97 84 1.2Lebanon – – – – – – – – – – – – – – – – – – – – –Lesotho 54 40 1.3 90 73 1.2 27 35 1.3 53 54 1.0 94 91 1.0 44 35 1.3 46 43 1.1Liberia 29 y 20 y 1.5 y 73 50 1.5 31 34 1.1 57 63 0.9 52 31 1.7 40 27 1.5 28 6 4.7Libya – – – – – – – – – – – – – – – – – – – – –Liechtenstein – – – – – – – – – – – – – – – – – – – – –Lithuania – – – – – – – – – – – – – – – – – – 97 86 1.1Luxembourg – – – – – – – – – – – – – – – – – – 97 99 1.0Madagascar 97 81 1.2 78 39 2.0 43 x 50 x 1.2 x 16 14 1.1 86 y 66 y 1.3 y 44 18 2.5 16 6 2.6Malawi 75 66 1.1 95 89 1.1 25 39 1.6 60 66 0.9 97 93 1.0 47 40 1.2 49 43 1.1Malaysia – – – – – – – – – – – – – – – – – – 100 99 1.0Maldives 93 x 92 x 1.0 x 99 x 93 x 1.1 x 16 x 22 x 1.3 x – – – 94 94 1.0 43 x 32 x 1.4 x 93 98 0.9Mali 97 85 1.1 73 x 14 x 5.2 x 17 34 2.0 29 x 20 x 1.5 x 83 46 1.8 32 16 2 46 22 2.1Malta – – – – – – – – – – – – – – – – – – 100 100 1.0Marshall Islands 96 x 96 x 1.0 x 97 x 68 x 1.4 x – – – 39 x 37 x 1.1 x – – – 33 x 12 x 2.7 x 95 66 1.4Mauritania 75 49 1.5 88 49 1.8 25 33 1.3 26 14 2.0 – – – 9 4 2.7 63 17 3.7Mauritius – – – – – – – – – – – – – – – – – – 94 93 1.0Mexico 96 94 1.0 99 94 1.1 10 19 1.9 61 63 1.0 98 98 1.0 33 25 1.3 91 81 1.1Micronesia (Federated States of) – – – – – – – – – – – – – – – – – – – – –Monaco – – – – – – – – – – – – – – – – – – 100 – –Mongolia 99 99 1.0 99 98 1.0 8 15 1.7 46 38 1.2 99 98 1.0 36 x 21 x 1.7 x 66 41 1.6Montenegro 99 100 1.0 99 100 1.0 10 9 1.0 – – – 97 99 1.0 47 49 1.0 98 92 1.1Montserrat – – – – – – – – – – – – – – – – – – – – –Morocco 97 y 91 y 1.1 y 92 55 1.7 9 21 2.4 23 21 1.1 96 x 83 x 1.2 x – – – 89 75 1.2Mozambique 51 47 1.1 80 44 1.8 36 46 1.3 65 50 1.3 83 67 1.2 39 25 1.6 47 12 3.8Myanmar 94 78 1.2 88 52 1.7 20 32 1.6 67 61 1.1 96 92 1.1 28 11 2.5 76 59 1.3Namibia 89 y 86 y 1.0 y 95 82 1.2 16 27 1.7 75 69 1.1 95 91 1.0 67 55 1.2 55 15 3.6Nauru – – – – – – – – – – – – – – – – – – 66 – –Nepal 57 58 1.0 68 47 1.4 32 40 1.3 36 38 0.9 80 76 1.1 25 14 1.7 52 45 1.2Netherlands – – – – – – – – – – – – – – – – – – 98 100 1.0

UNICEF – THE STATE OF THE WORLD’S CHILDREN 2017
TABLE 10. DISPARITIES BY RESIDENCE
Countries and areas
Birth registration (%)++
2010–2016*
Skilled birth attendant (%)
2011–2016*
Stunting prevalence in children under 5
(moderate & severe)θ (%) 2011–2016*
Oral rehydration salts (ORS) treatment for children with diarrhoea
(%) 2011–2016*
Primary school net attendance ratio
2011–2016*
Comprehensive knowledge of HIV/AIDS
(%) Females 15–242011–2016*
Use of basic sanitation services
(%)2015
urban rural
ratio of urban
to rural urban rural
ratio of urban
to rural urban rural
ratio of rural to urban urban rural
ratio of urban to
rural urban rural
ratio of urban to
rural urban rural
ratio of urban to
rural urban rural
ratio of urban
to rural
New Zealand – – – – – – – – – – – – – – – – – – 100 100 1.0Nicaragua – – – 97 79 1.2 15 x 30 x 2.0 x 74 57 1.3 76 x,y 64 x,y 1.2 x,y – – – 86 63 1.4Niger 92 60 1.5 83 32 2.6 34 45 1.3 47 44 1.1 83 45 1.9 31 9 3.3 44 6 7.4Nigeria 50 y 19 y 2.7 y 62 21 3.0 26 43 1.7 45 28 1.6 87 57 1.5 30 20 1.4 39 27 1.4Niue – – – – – – – – – – – – 100 100 1.0 – – – – – –Norway – – – – – – – – – – – – – – – – – – 98 98 1.0Oman – – – 99 98 1.0 14 15 1.1 58 62 0.9 98 97 1.0 – – – 99 99 1.0Pakistan 59 23 2.6 71 44 1.6 37 48 1.3 42 37 1.1 75 59 1.3 – – – 74 48 1.5Palau – – – – – – – – – – – – – – – – – – 100 100 1.0Panama 98 93 1.1 100 78 1.3 – – – 61 44 1.4 97 97 1.0 – – – 86 59 1.4Papua New Guinea – – – 88 x 48 x 1.9 x 36 x 51 x 1.4 x – – – – – – – – – 55 13 4.2Paraguay 87 y 80 y 1.1 y 94 x 79 x 1.2 x 12 10 0.8 – – – 92 y 90 y 1.0 y – – – 98 81 1.2Peru 98 y 96 y 1.0 y 98 75 1.3 9 28 3.0 37 22 1.7 92 y 92 y 1.0 y 27 x 8 x 3.3 x 82 58 1.4Philippines – – – 83 64 1.3 28 38 1.3 54 45 1.2 90 x 87 x 1.0 x 23 x 17 x 1.4 x 79 72 1.1Poland – – – – – – – – – – – – – – – – – – 98 98 1.0Portugal – – – – – – – – – – – – – – – – – – 99 100 1.0Qatar – – – – – – – – – – – – – – – – – – – – –Republic of Korea – – – – – – – – – – – – – – – – – – – – –Republic of Moldova 100 100 1.0 100 99 1.0 4 8 2.2 – – – 98 99 1.0 41 32 1.3 89 70 1.3Romania – – – 94 96 1.0 14 x 13 x 0.9 x – – – – – – – – – 93 68 1.4Russian Federation – – – – – – – – – – – – – – – – – – 93 76 1.2Rwanda 55 56 1.0 97 89 1.1 27 40 1.5 33 27 1.3 96 94 1.0 74 62 1.2 57 64 0.9Saint Kitts and Nevis – – – – – – – – – – – – – – – – – – – – –Saint Lucia 91 92 1.0 – – – 4 2 0.6 – – – 99 100 1.0 57 63 0.9 86 92 0.9Saint Vincent and the Grenadines – – – – – – – – – – – – – – – – – – – – –Samoa 68 57 1.2 97 79 1.2 4 5 1.1 – – – 89 y 88 y 1.0 y 5 x 2 x 2.4 x 98 96 1.0San Marino – – – – – – – – – – – – – – – – – – – – –Sao Tome and Principe 96 93 1.0 95 88 1.1 16 19 1.2 46 57 0.8 94 94 1.0 43 40 1.1 47 28 1.7Saudi Arabia – – – – – – – – – – – – – – – – – – – – –Senegal 87 58 1.5 70 44 1.6 14 24 1.7 32 31 1.0 72 43 1.7 – – – 66 35 1.9Serbia 100 99 1.0 98 99 1.0 7 5 0.8 50 x 22 x 2.3 x 100 98 1.0 63 x 41 x 1.5 x 98 91 1.1Seychelles – – – – – – – – – – – – – – – – – – – – –Sierra Leone 80 76 1.1 79 53 1.5 30 40 1.4 86 85 1.0 88 71 1.2 38 22 1.7 24 8 2.8Singapore – – – – – – – – – – – – – – – – – – 100 – –Slovakia – – – – – – – – – – – – – – – – – – 99 98 1.0Slovenia – – – – – – – – – – – – – – – – – – 99 99 1.0Solomon Islands 89 88 1.0 96 84 1.1 27 32 1.2 45 35 1.3 – – – 34 x 28 x 1.2 x 76 18 4.1Somalia 6 x 2 x 3.7 x 21 x 3 x 7.4 x 32 x 48 x 1.5 x 25 x 9 x 3.0 x 39 x 11 x 3.4 x 7 x 2 x 4.1 x 28 8 3.5South Africa – – – 98 95 1.0 26 y 29 y 1.1 y 53 49 1.1 – – – – – – 76 69 1.1South Sudan 45 32 1.4 31 x 15 x 2.0 x 29 x 32 x 1.1 x 44 x 37 x 1.2 x 40 19 2.1 16 x 7 x 2.3 x 28 6 4.3Spain – – – – – – – – – – – – – – – – – – 100 100 1.0Sri Lanka 97 x 98 x 1.0 x 99 x 99 x 1.0 x – – – – – – – – – – – – 89 95 0.9State of Palestine 99 100 1.0 100 100 1.0 8 8 1.0 30 34 0.9 99 99 1.0 8 x 6 x 1.3 x 95 99 1.0Sudan 89 59 1.5 93 72 1.3 27 43 1.6 25 18 1.4 86 61 1.4 12 7 1.9 58 23 2.5Suriname 100 98 1.0 93 x 84 x 1.1 x 7 x 12 x 1.8 x 33 x 55 x 0.6 x 97 94 1.0 45 x 33 x 1.4 x 88 61 1.4Swaziland 64 51 1.3 93 86 1.1 19 27 1.4 64 90 0.7 98 98 1.0 56 47 1.2 58 58 1.0Sweden – – – – – – – – – – – – – – – – – – 99 100 1.0Switzerland – – – – – – – – – – – – – – – – – – 100 100 1.0Syrian Arab Republic 97 x 95 x 1.0 x 99 x 93 x 1.1 x 28 x 28 x 1.0 x 56 x 44 x 1.3 x 98 x 96 x 1.0 x 7 x 7 x 1.0 x 96 89 1.1Tajikistan 88 89 1.0 93 86 1.1 22 28 1.3 58 61 0.9 87 85 1.0 11 8 1.4 94 96 1.0Thailand 99 y 100 y 1.0 y 99 100 1.0 10 11 1.1 68 75 0.9 95 95 1.0 55 56 1.0 94 96 1.0The former Yugoslav Republic of Macedonia 100 100 1.0 94 88 1.1 4 6 1.4 19 x 30 x 0.6 x 98 98 1.0 33 x 18 x 1.8 x 97 83 1.2
Timor-Leste 50 57 0.9 59 x 20 x 2.9 x 39 55 1.4 65 x 74 x 0.9 x 80 70 1.1 14 x 12 x 1.2 x 73 30 2.4Togo 95 69 1.4 82 24 3.4 16 33 2.1 18 19 0.9 96 85 1.1 28 19 1.5 28 5 6.2Tokelau – – – – – – – – – – – – – – – – – – – 93 0.0Tonga 92 94 1.0 94 96 1.0 9 8 0.9 – – – 92 y 93 y 1.0 y 11 13 0.8 97 92 1.0Trinidad and Tobago – – – – – – – – – – – – – – – – – – – – –Tunisia 100 98 1.0 77 67 1.1 8 14 1.7 69 59 1.2 99 97 1.0 22 13 1.7 98 83 1.2Turkey 99 y 98 y 1.0 y 99 92 1.1 8 14 1.8 – – – 95 96 1.0 – – – 99 89 1.1Turkmenistan 100 100 1.0 100 100 1.0 12 11 0.9 – – – 98 98 1.0 7 x 4 x 2.0 x 94 99 1.0Turks and Caicos Islands – – – – – – – – – – – – – – – – – – – – –Tuvalu 60 x 38 x 1.6 x 93 x 93 x 1.0 x 10 x 11 x 1.1 x – – – 98 x,y 99 x,y 1.0 x,y 38 x 41 x 0.9 x 92 91 1.0Uganda 38 29 1.3 89 52 1.7 24 30 1.3 53 45 1.2 91 86 1.1 55 42 1.3 28 17 1.6

193TABLE 10. DISPARITIES BY RESIDENCE
Countries and areas
Birth registration (%)++
2010–2016*
Skilled birth attendant (%)
2011–2016*
Stunting prevalence in children under 5
(moderate & severe)θ (%) 2011–2016*
Oral rehydration salts (ORS) treatment for children with diarrhoea
(%) 2011–2016*
Primary school net attendance ratio
2011–2016*
Comprehensive knowledge of HIV/AIDS
(%) Females 15–242011–2016*
Use of basic sanitation services
(%)2015
urban rural
ratio of urban
to rural urban rural
ratio of urban
to rural urban rural
ratio of rural to urban urban rural
ratio of urban to
rural urban rural
ratio of urban to
rural urban rural
ratio of urban to
rural urban rural
ratio of urban
to rural
Ukraine 100 100 1.0 99 99 1.0 – – – – – – 100 100 1.0 52 45 1.1 97 93 1.1United Arab Emirates – – – – – – – – – – – – – – – – – – 100 100 1.0United Kingdom – – – – – – – – – – – – – – – – – – 99 99 1.0United Republic of Tanzania 51 18 2.9 87 55 1.6 25 38 1.5 46 44 1.0 91 77 1.2 52 36 1.5 37 17 2.2United States – – – – – – – – – – – – – – – – – – 100 100 1.0Uruguay 100 100 1.0 98 98 1.0 – – – – – – 97 97 1.0 34 – – 96 95 1.0Uzbekistan 100 x 100 x 1.0 x 100 100 1.0 18 x 19 x 1.1 x 34 x 31 x 1.1 x – – – 33 x 30 x 1.1 x 100 100 1.0Vanuatu 61 y 37 y 1.7 y 96 87 1.1 19 32 1.6 38 52 0.7 77 y 77 y 1.0 y 23 x 13 x 1.8 x 61 51 1.2Venezuela (Bolivarian Republic of) – – – – – – – – – – – – – – – – – – 98 72 1.4Viet Nam 97 96 1.0 99 92 1.1 12 27 2.3 58 49 1.2 98 97 1.0 54 47 1.1 91 72 1.3Yemen 48 24 2.0 73 34 2.1 34 51 1.5 24 26 0.9 85 73 1.2 4 x 1 x 6.7 x 90 44 2.1Zambia 20 7 3.0 88 51 1.7 36 42 1.2 68 62 1.1 92 84 1.1 50 34 1.5 49 19 2.6Zimbabwe 67 34 1.9 93 71 1.3 22 29 1.3 46 38 1.2 98 94 1.0 56 41 1.4 54 31 1.7
SUMMARYEast Asia and Pacific 85 ** 77 ** 1.1 ** 98 91 1.1 13 21 1.7 49 ** 46 ** 1.1 ** 98 96 1.0 29 ** 23 ** 1.3 ** 87 63 1.4Europe and Central Asia – – – – – – – – – – – – – – – – – – 98 92 1.1
Eastern Europe and Central Asia 99 97 1.0 99 96 1.0 10 r 14 r 1.4 r – – – 96 96 1.0 – – – 95 87 1.1Western Europe – – – – – – – – – – – – – – – – – – 99 99 1.0
Latin America and Caribbean 96 93 1.0 – – – 13 N 23 N 1.8 N – – – 95 93 1.0 – – – 90 68 1.3Middle East and North Africa 96 87 1.1 93 76 1.2 17 21 1.2 27 27 1.0 96 91 1.0 – – – 94 81 1.2North America – – – – – – – – – – – – – – – – – – 100 100 1.0South Asia 73 56 1.3 84 68 1.2 32 42 1.3 57 49 1.2 86 79 1.1 13 ‡ 7 ‡ 1.8 ‡ 65 37 1.8Sub-Saharan Africa 57 35 1.6 80 46 1.7 26 39 1.5 43 36 1.2 86 68 1.3 37 23 1.6 42 20 2.1
Eastern and Southern Africa 52 33 1.6 86 50 1.7 26 38 1.5 47 39 1.2 87 73 1.2 45 30 1.5 48 21 2.2West and Central Africa 60 38 1.6 76 41 1.8 26 40 1.5 41 32 1.3 86 61 1.4 28 17 1.7 37 19 2.0
Least developed countries 52 36 1.5 81 48 1.7 28 40 1.4 49 42 1.2 87 72 1.2 31 18 1.7 46 26 1.8World 82 ** 59 ** 1.4 ** 89 67 1.3 23 32 1.4 48 ** 42 ** 1.1 ** 92 81 1.1 30 ‡** 20 ‡** 1.5 ‡** 83 50 1.7
For a complete list of countries and areas in the regions, subregions and country categories, see page 150 or visit <data.unicef.org/regionalclassifications>.It is not advisable to compare data from consecutive editions of The State of the World’s Children.
Italicized data are from different sources than the data presented for the same indicators in other tables of the report.
Birth registration – Percentage of children under age 5 who were registered at the moment of the survey. The numerator of this indicator includes children reported to have a birth certificate, regardless of whether or not it was seen by the interviewer, and those without a birth certificate whose mother or caregiver says the birth has been registered.Skilled birth attendant – Percentage of births attended by skilled health personnel (doctor, nurse or midwife).Stunting prevalence in children under 5–Percentage of children aged 0–59 months who are below minus two standard deviations from median height-for-age of the WHO Child Growth Standards.Stunting – Moderate and severe: Percentage of children aged 0–59 months who are below minus two standard deviations from median height-for-age of the WHO Child Growth Standards.Diarrhoea treatment with oral rehydration salts (ORS) – Percentage of children under age 5 who had diarrhoea in the two weeks preceding the survey and who received oral rehydration salts (ORS packets or pre-packaged ORS fluids).
Primary school net attendance ratio – Number of children attending primary or secondary school who are of official primary school age, expressed as a percentage of the total number of children of official primary school age. Because of the inclusion of primary-school-aged children attending secondary school, this indicator can also be referred to as a primary adjusted net attendance ratio.Comprehensive knowledge of HIV – Percentage of young women (aged 15–24) who correctly identify the two major ways of preventing the sexual transmission of HIV (using condoms and limiting sex to one faithful, uninfected partner), who reject the two most common local misconceptions about HIV transmission and who know that a healthy-looking person can be HIV-positive.Use of basic sanitation services – Percentage of the population using an improved sanitation facility that is not shared with other households (improved facilities include: flush/pour flush to piped sewerage systems, septic tanks or pit latrines; ventilated improved pit latrines; composting toilets or pit latrines with slabs.
Birth registration – Demographic and Health Surveys (DHS), Multiple Indicator Cluster Surveys (MICS), other national surveys, censuses and vital registration systems.Skilled birth attendant – DHS, MICS and other nationally representative sources.Stunting prevalence in children under 5 – DHS, MICS, other national household surveys, WHO and UNICEF.Diarrhoea treatment with oral rehydration salts (ORS) – DHS, MICS and other national household surveys.
Primary school attendance ratio – DHS, MICS and other national household surveys.Comprehensive knowledge of HIV – AIDS Indicator Surveys (AIS), DHS, MICS, and other national household surveys; DHS STATcompiler, www.statcompiler.com.Use of basic sanitation services – WHO/UNICEF Joint Monitoring Programme for Water Supply, Sanitation and Hygiene (JMP).
– Data not available.p Based on small denominators
(typically 25–49 unweighted cases). No data based on fewer than 25 unweighted cases are displayed.
x Data refer to years or periods other than those specified in the column heading. Such data are not included in the calculation of regional and global averages, with the exception of 2005–2006 data on primary attendance from India. Estimates from data years prior to 2000 are not displayed.
y Data differ from the standard defini-tion or refer to only part of a country. If they fall within the noted reference period, such data are included in the calculation of regional and global averages.
++ Changes in the definition of birth reg-istration were made from the second and third rounds of MICS (MICS2 and MICS3) to the fourth round (MICS4). In order to allow for comparability with later rounds, data from MICS2 and MICS3 on birth registration were recalculated according to the MICS4 indicator definition. Therefore, the recalculated data presented here may differ from estimates included in MICS2 and MICS3 national reports.
θ Global and regional averages for stunting (moderate and severe) are estimated using statistical modelling data from the UNICEF-WHO-World Bank Group Joint Child Manutrition Estimates, May 2017 Edition. For more information see <data.unicef.org/malnutrition>. Disaggregations for stunting (moderate and severe) are population-weighted, which means using the most recent estimate for each country with data between 2011 and 2016; therefore disaggregations may not coincide with total estimates at the global and regional level.
* Data refer to the most recent year available during the period specified in the column heading.
** Excludes China.‡ Excludes India.r Excludes the Russian Federation. N Excludes Brazil.
NOTESDEFINITIONS OF THE INDICATORS
MAIN DATA SOURCES
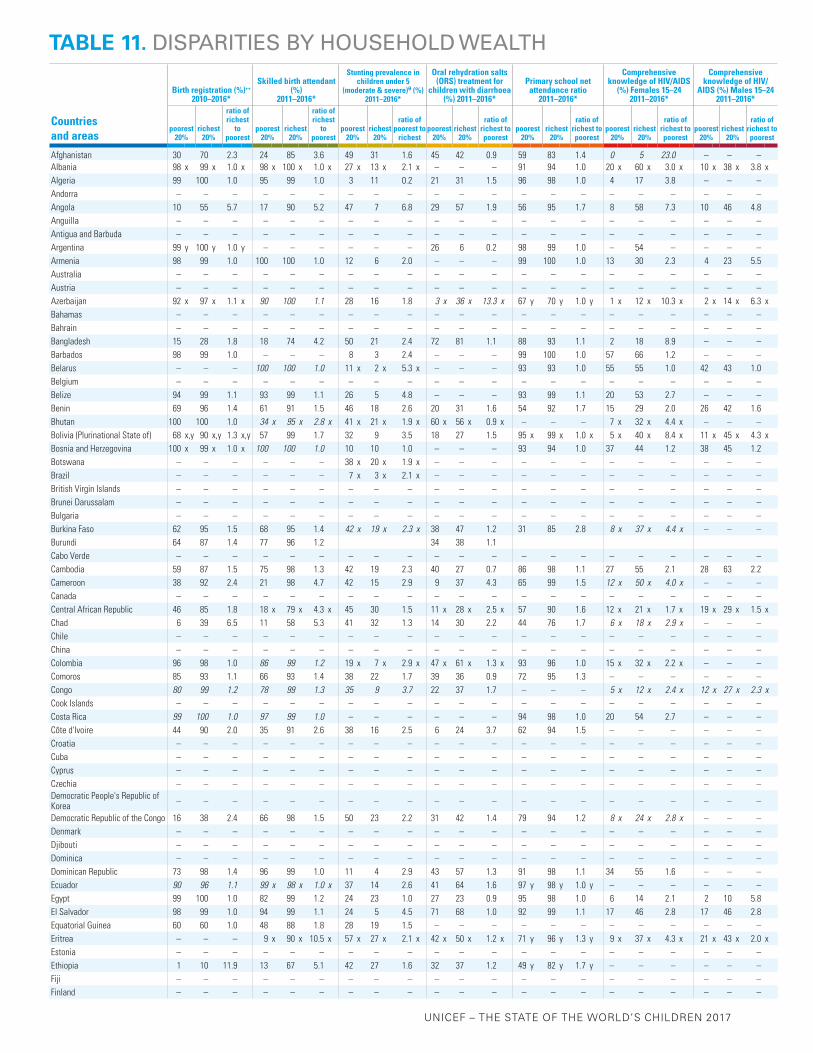
UNICEF – THE STATE OF THE WORLD’S CHILDREN 2017
Countries and areas
Birth registration (%)++
2010–2016*
Skilled birth attendant (%)
2011–2016*
Stunting prevalence in children under 5
(moderate & severe)θ (%) 2011–2016*
Oral rehydration salts (ORS) treatment for
children with diarrhoea (%) 2011–2016*
Primary school net attendance ratio
2011–2016*
Comprehensive knowledge of HIV/AIDS
(%) Females 15–24 2011–2016*
Comprehensive knowledge of HIV/
AIDS (%) Males 15–242011–2016*
poorest 20%
richest 20%
ratio of richest
to poorest
poorest 20%
richest 20%
ratio of richest
to poorest
poorest 20%
richest 20%
ratio of poorest to
richestpoorest
20%richest
20%
ratio of richest to poorest
poorest 20%
richest 20%
ratio of richest to poorest
poorest 20%
richest 20%
ratio of richest to poorest
poorest 20%
richest 20%
ratio of richest to poorest
Afghanistan 30 70 2.3 24 85 3.6 49 31 1.6 45 42 0.9 59 83 1.4 0 5 23.0 – – –Albania 98 x 99 x 1.0 x 98 x 100 x 1.0 x 27 x 13 x 2.1 x – – – 91 94 1.0 20 x 60 x 3.0 x 10 x 38 x 3.8 xAlgeria 99 100 1.0 95 99 1.0 3 11 0.2 21 31 1.5 96 98 1.0 4 17 3.8 – – –Andorra – – – – – – – – – – – – – – – – – – – – –Angola 10 55 5.7 17 90 5.2 47 7 6.8 29 57 1.9 56 95 1.7 8 58 7.3 10 46 4.8Anguilla – – – – – – – – – – – – – – – – – – – – –Antigua and Barbuda – – – – – – – – – – – – – – – – – – – – –Argentina 99 y 100 y 1.0 y – – – – – – 26 6 0.2 98 99 1.0 – 54 – – – –Armenia 98 99 1.0 100 100 1.0 12 6 2.0 – – – 99 100 1.0 13 30 2.3 4 23 5.5Australia – – – – – – – – – – – – – – – – – – – – –Austria – – – – – – – – – – – – – – – – – – – – –Azerbaijan 92 x 97 x 1.1 x 90 100 1.1 28 16 1.8 3 x 36 x 13.3 x 67 y 70 y 1.0 y 1 x 12 x 10.3 x 2 x 14 x 6.3 xBahamas – – – – – – – – – – – – – – – – – – – – –Bahrain – – – – – – – – – – – – – – – – – – – – –Bangladesh 15 28 1.8 18 74 4.2 50 21 2.4 72 81 1.1 88 93 1.1 2 18 8.9 – – –Barbados 98 99 1.0 – – – 8 3 2.4 – – – 99 100 1.0 57 66 1.2 – – –Belarus – – – 100 100 1.0 11 x 2 x 5.3 x – – – 93 93 1.0 55 55 1.0 42 43 1.0Belgium – – – – – – – – – – – – – – – – – – – – –Belize 94 99 1.1 93 99 1.1 26 5 4.8 – – – 93 99 1.1 20 53 2.7 – – –Benin 69 96 1.4 61 91 1.5 46 18 2.6 20 31 1.6 54 92 1.7 15 29 2.0 26 42 1.6Bhutan 100 100 1.0 34 x 95 x 2.8 x 41 x 21 x 1.9 x 60 x 56 x 0.9 x – – – 7 x 32 x 4.4 x – – –Bolivia (Plurinational State of) 68 x,y 90 x,y 1.3 x,y 57 99 1.7 32 9 3.5 18 27 1.5 95 x 99 x 1.0 x 5 x 40 x 8.4 x 11 x 45 x 4.3 xBosnia and Herzegovina 100 x 99 x 1.0 x 100 100 1.0 10 10 1.0 – – – 93 94 1.0 37 44 1.2 38 45 1.2Botswana – – – – – – 38 x 20 x 1.9 x – – – – – – – – – – – –Brazil – – – – – – 7 x 3 x 2.1 x – – – – – – – – – – – –British Virgin Islands – – – – – – – – – – – – – – – – – – – – –Brunei Darussalam – – – – – – – – – – – – – – – – – – – – –Bulgaria – – – – – – – – – – – – – – – – – – – – –Burkina Faso 62 95 1.5 68 95 1.4 42 x 19 x 2.3 x 38 47 1.2 31 85 2.8 8 x 37 x 4.4 x – – –Burundi 64 87 1.4 77 96 1.2 34 38 1.1Cabo Verde – – – – – – – – – – – – – – – – – – – – –Cambodia 59 87 1.5 75 98 1.3 42 19 2.3 40 27 0.7 86 98 1.1 27 55 2.1 28 63 2.2Cameroon 38 92 2.4 21 98 4.7 42 15 2.9 9 37 4.3 65 99 1.5 12 x 50 x 4.0 x – – –Canada – – – – – – – – – – – – – – – – – – – – –Central African Republic 46 85 1.8 18 x 79 x 4.3 x 45 30 1.5 11 x 28 x 2.5 x 57 90 1.6 12 x 21 x 1.7 x 19 x 29 x 1.5 xChad 6 39 6.5 11 58 5.3 41 32 1.3 14 30 2.2 44 76 1.7 6 x 18 x 2.9 x – – –Chile – – – – – – – – – – – – – – – – – – – – –China – – – – – – – – – – – – – – – – – – – – –Colombia 96 98 1.0 86 99 1.2 19 x 7 x 2.9 x 47 x 61 x 1.3 x 93 96 1.0 15 x 32 x 2.2 x – – –Comoros 85 93 1.1 66 93 1.4 38 22 1.7 39 36 0.9 72 95 1.3 – – – – – –Congo 80 99 1.2 78 99 1.3 35 9 3.7 22 37 1.7 – – – 5 x 12 x 2.4 x 12 x 27 x 2.3 xCook Islands – – – – – – – – – – – – – – – – – – – – –Costa Rica 99 100 1.0 97 99 1.0 – – – – – – 94 98 1.0 20 54 2.7 – – –Côte d'Ivoire 44 90 2.0 35 91 2.6 38 16 2.5 6 24 3.7 62 94 1.5 – – – – – –Croatia – – – – – – – – – – – – – – – – – – – – –Cuba – – – – – – – – – – – – – – – – – – – – –Cyprus – – – – – – – – – – – – – – – – – – – – –Czechia – – – – – – – – – – – – – – – – – – – – –Democratic People's Republic of Korea – – – – – – – – – – – – – – – – – – – – –
Democratic Republic of the Congo 16 38 2.4 66 98 1.5 50 23 2.2 31 42 1.4 79 94 1.2 8 x 24 x 2.8 x – – –Denmark – – – – – – – – – – – – – – – – – – – – –Djibouti – – – – – – – – – – – – – – – – – – – – –Dominica – – – – – – – – – – – – – – – – – – – – –Dominican Republic 73 98 1.4 96 99 1.0 11 4 2.9 43 57 1.3 91 98 1.1 34 55 1.6 – – –Ecuador 90 96 1.1 99 x 98 x 1.0 x 37 14 2.6 41 64 1.6 97 y 98 y 1.0 y – – – – – –Egypt 99 100 1.0 82 99 1.2 24 23 1.0 27 23 0.9 95 98 1.0 6 14 2.1 2 10 5.8El Salvador 98 99 1.0 94 99 1.1 24 5 4.5 71 68 1.0 92 99 1.1 17 46 2.8 17 46 2.8Equatorial Guinea 60 60 1.0 48 88 1.8 28 19 1.5 – – – – – – – – – – – –Eritrea – – – 9 x 90 x 10.5 x 57 x 27 x 2.1 x 42 x 50 x 1.2 x 71 y 96 y 1.3 y 9 x 37 x 4.3 x 21 x 43 x 2.0 xEstonia – – – – – – – – – – – – – – – – – – – – –Ethiopia 1 10 11.9 13 67 5.1 42 27 1.6 32 37 1.2 49 y 82 y 1.7 y – – – – – –Fiji – – – – – – – – – – – – – – – – – – – – –Finland – – – – – – – – – – – – – – – – – – – – –
TABLE 11. DISPARITIES BY HOUSEHOLD WEALTH
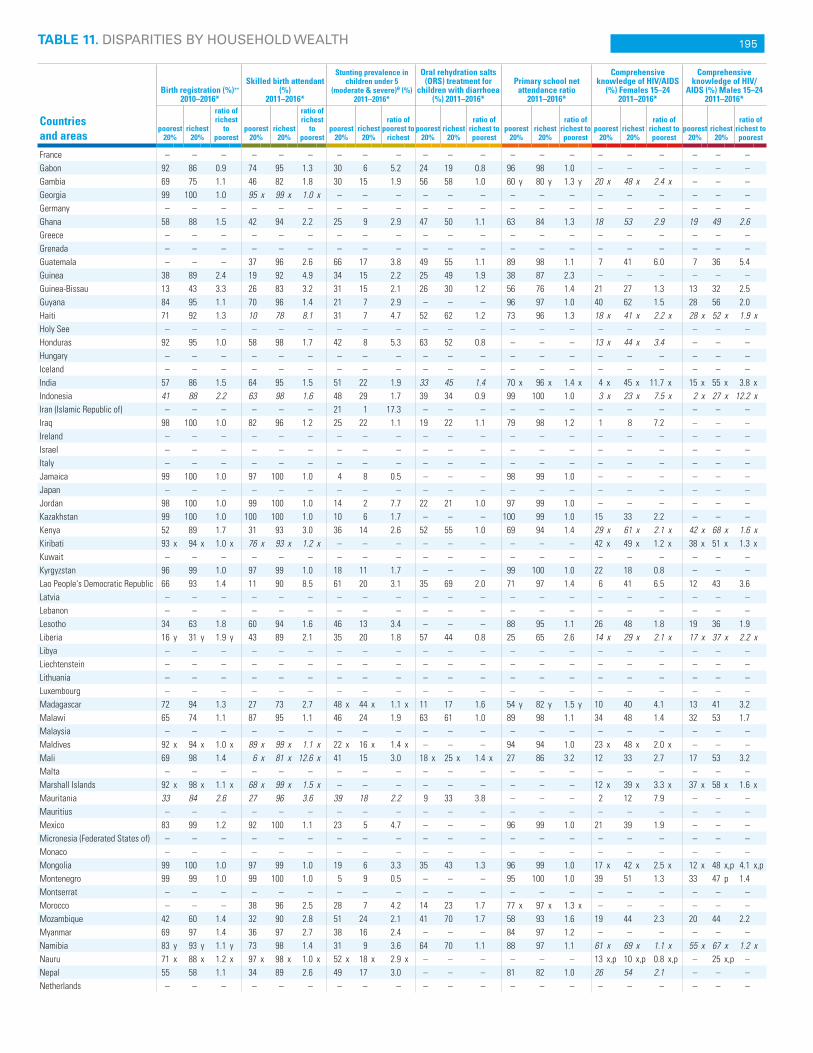
195TABLE 11. DISPARITIES BY HOUSEHOLD WEALTH
Countries and areas
Birth registration (%)++
2010–2016*
Skilled birth attendant (%)
2011–2016*
Stunting prevalence in children under 5
(moderate & severe)θ (%) 2011–2016*
Oral rehydration salts (ORS) treatment for
children with diarrhoea (%) 2011–2016*
Primary school net attendance ratio
2011–2016*
Comprehensive knowledge of HIV/AIDS
(%) Females 15–24 2011–2016*
Comprehensive knowledge of HIV/
AIDS (%) Males 15–242011–2016*
poorest 20%
richest 20%
ratio of richest
to poorest
poorest 20%
richest 20%
ratio of richest
to poorest
poorest 20%
richest 20%
ratio of poorest to
richestpoorest
20%richest
20%
ratio of richest to poorest
poorest 20%
richest 20%
ratio of richest to poorest
poorest 20%
richest 20%
ratio of richest to poorest
poorest 20%
richest 20%
ratio of richest to poorest
France – – – – – – – – – – – – – – – – – – – – –Gabon 92 86 0.9 74 95 1.3 30 6 5.2 24 19 0.8 96 98 1.0 – – – – – –Gambia 69 75 1.1 46 82 1.8 30 15 1.9 56 58 1.0 60 y 80 y 1.3 y 20 x 48 x 2.4 x – – –Georgia 99 100 1.0 95 x 99 x 1.0 x – – – – – – – – – – – – – – –Germany – – – – – – – – – – – – – – – – – – – – –Ghana 58 88 1.5 42 94 2.2 25 9 2.9 47 50 1.1 63 84 1.3 18 53 2.9 19 49 2.6Greece – – – – – – – – – – – – – – – – – – – – –Grenada – – – – – – – – – – – – – – – – – – – – –Guatemala – – – 37 96 2.6 66 17 3.8 49 55 1.1 89 98 1.1 7 41 6.0 7 36 5.4Guinea 38 89 2.4 19 92 4.9 34 15 2.2 25 49 1.9 38 87 2.3 – – – – – –Guinea-Bissau 13 43 3.3 26 83 3.2 31 15 2.1 26 30 1.2 56 76 1.4 21 27 1.3 13 32 2.5Guyana 84 95 1.1 70 96 1.4 21 7 2.9 – – – 96 97 1.0 40 62 1.5 28 56 2.0Haiti 71 92 1.3 10 78 8.1 31 7 4.7 52 62 1.2 73 96 1.3 18 x 41 x 2.2 x 28 x 52 x 1.9 xHoly See – – – – – – – – – – – – – – – – – – – – –Honduras 92 95 1.0 58 98 1.7 42 8 5.3 63 52 0.8 – – – 13 x 44 x 3.4 – – –Hungary – – – – – – – – – – – – – – – – – – – – –Iceland – – – – – – – – – – – – – – – – – – – – –India 57 86 1.5 64 95 1.5 51 22 1.9 33 45 1.4 70 x 96 x 1.4 x 4 x 45 x 11.7 x 15 x 55 x 3.8 xIndonesia 41 88 2.2 63 98 1.6 48 29 1.7 39 34 0.9 99 100 1.0 3 x 23 x 7.5 x 2 x 27 x 12.2 xIran (Islamic Republic of) – – – – – – 21 1 17.3 – – – – – – – – – – – –Iraq 98 100 1.0 82 96 1.2 25 22 1.1 19 22 1.1 79 98 1.2 1 8 7.2 – – –Ireland – – – – – – – – – – – – – – – – – – – – –Israel – – – – – – – – – – – – – – – – – – – – –Italy – – – – – – – – – – – – – – – – – – – – –Jamaica 99 100 1.0 97 100 1.0 4 8 0.5 – – – 98 99 1.0 – – – – – –Japan – – – – – – – – – – – – – – – – – – – – –Jordan 98 100 1.0 99 100 1.0 14 2 7.7 22 21 1.0 97 99 1.0 – – – – – –Kazakhstan 99 100 1.0 100 100 1.0 10 6 1.7 – – – 100 99 1.0 15 33 2.2 – – –Kenya 52 89 1.7 31 93 3.0 36 14 2.6 52 55 1.0 69 94 1.4 29 x 61 x 2.1 x 42 x 68 x 1.6 xKiribati 93 x 94 x 1.0 x 76 x 93 x 1.2 x – – – – – – – – – 42 x 49 x 1.2 x 38 x 51 x 1.3 xKuwait – – – – – – – – – – – – – – – – – – – – –Kyrgyzstan 96 99 1.0 97 99 1.0 18 11 1.7 – – – 99 100 1.0 22 18 0.8 – – –Lao People's Democratic Republic 66 93 1.4 11 90 8.5 61 20 3.1 35 69 2.0 71 97 1.4 6 41 6.5 12 43 3.6Latvia – – – – – – – – – – – – – – – – – – – – –Lebanon – – – – – – – – – – – – – – – – – – – – –Lesotho 34 63 1.8 60 94 1.6 46 13 3.4 – – – 88 95 1.1 26 48 1.8 19 36 1.9Liberia 16 y 31 y 1.9 y 43 89 2.1 35 20 1.8 57 44 0.8 25 65 2.6 14 x 29 x 2.1 x 17 x 37 x 2.2 xLibya – – – – – – – – – – – – – – – – – – – – –Liechtenstein – – – – – – – – – – – – – – – – – – – – –Lithuania – – – – – – – – – – – – – – – – – – – – –Luxembourg – – – – – – – – – – – – – – – – – – – – –Madagascar 72 94 1.3 27 73 2.7 48 x 44 x 1.1 x 11 17 1.6 54 y 82 y 1.5 y 10 40 4.1 13 41 3.2Malawi 65 74 1.1 87 95 1.1 46 24 1.9 63 61 1.0 89 98 1.1 34 48 1.4 32 53 1.7Malaysia – – – – – – – – – – – – – – – – – – – – –Maldives 92 x 94 x 1.0 x 89 x 99 x 1.1 x 22 x 16 x 1.4 x – – – 94 94 1.0 23 x 48 x 2.0 x – – –Mali 69 98 1.4 6 x 81 x 12.6 x 41 15 3.0 18 x 25 x 1.4 x 27 86 3.2 12 33 2.7 17 53 3.2Malta – – – – – – – – – – – – – – – – – – – – –Marshall Islands 92 x 98 x 1.1 x 68 x 99 x 1.5 x – – – – – – – – – 12 x 39 x 3.3 x 37 x 58 x 1.6 xMauritania 33 84 2.6 27 96 3.6 39 18 2.2 9 33 3.8 – – – 2 12 7.9 – – –Mauritius – – – – – – – – – – – – – – – – – – – – –Mexico 83 99 1.2 92 100 1.1 23 5 4.7 – – – 96 99 1.0 21 39 1.9 – – –Micronesia (Federated States of) – – – – – – – – – – – – – – – – – – – – –Monaco – – – – – – – – – – – – – – – – – – – – –Mongolia 99 100 1.0 97 99 1.0 19 6 3.3 35 43 1.3 96 99 1.0 17 x 42 x 2.5 x 12 x 48 x,p 4.1 x,pMontenegro 99 99 1.0 99 100 1.0 5 9 0.5 – – – 95 100 1.0 39 51 1.3 33 47 p 1.4Montserrat – – – – – – – – – – – – – – – – – – – – –Morocco – – – 38 96 2.5 28 7 4.2 14 23 1.7 77 x 97 x 1.3 x – – – – – –Mozambique 42 60 1.4 32 90 2.8 51 24 2.1 41 70 1.7 58 93 1.6 19 44 2.3 20 44 2.2Myanmar 69 97 1.4 36 97 2.7 38 16 2.4 – – – 84 97 1.2 – – – – – –Namibia 83 y 93 y 1.1 y 73 98 1.4 31 9 3.6 64 70 1.1 88 97 1.1 61 x 69 x 1.1 x 55 x 67 x 1.2 xNauru 71 x 88 x 1.2 x 97 x 98 x 1.0 x 52 x 18 x 2.9 x – – – – – – 13 x,p 10 x,p 0.8 x,p – 25 x,p –Nepal 55 58 1.1 34 89 2.6 49 17 3.0 – – – 81 82 1.0 26 54 2.1 – – –Netherlands – – – – – – – – – – – – – – – – – – – – –

UNICEF – THE STATE OF THE WORLD’S CHILDREN 2017
TABLE 11. DISPARITIES BY HOUSEHOLD WEALTH
Countries and areas
Birth registration (%)++
2010–2016*
Skilled birth attendant (%)
2011–2016*
Stunting prevalence in children under 5
(moderate & severe)θ (%) 2011–2016*
Oral rehydration salts (ORS) treatment for
children with diarrhoea (%) 2011–2016*
Primary school net attendance ratio
2011–2016*
Comprehensive knowledge of HIV/AIDS
(%) Females 15–24 2011–2016*
Comprehensive knowledge of HIV/
AIDS (%) Males 15–242011–2016*
poorest 20%
richest 20%
ratio of richest
to poorest
poorest 20%
richest 20%
ratio of richest
to poorest
poorest 20%
richest 20%
ratio of poorest to
richestpoorest
20%richest
20%
ratio of richest to poorest
poorest 20%
richest 20%
ratio of richest to poorest
poorest 20%
richest 20%
ratio of richest to poorest
poorest 20%
richest 20%
ratio of richest to poorest
New Zealand – – – – – – – – – – – – – – – – – – – – –Nicaragua – – – 42 x 99 x 2.4 x 35 x 6 x 6.0 x 53 x 64 x 1.2 x – – – – – – – – –Niger 50 89 1.8 12 71 6.0 47 35 1.4 34 49 1.4 35 81 2.3 6 30 5.0 6 42 7.2Nigeria 7 y 65 y 9.7 y 5 81 15.6 54 18 3.0 20 53 2.6 28 95 3.3 15 33 2.2 23 43 1.9Niue – – – – – – – – – – – – 100 100 1.0 – – – – – –Norway – – – – – – – – – – – – – – – – – – – – –Oman – – – – – – – – – – – – – – – – – – – – –Pakistan 5 71 14.3 30 85 2.9 62 23 2.7 34 48 1.4 39 87 2.2 – – – – – –Palau – – – – – – – – – – – – – – – – – – – – –Panama 90 97 1.1 72 100 1.4 – – – – – – 96 97 1.0 – – – – – –Papua New Guinea – – – – – – – – – – – – – – – – – – – – –Paraguay 67 y 89 y 1.3 y – – – 28 13 2.2 – – – – – – – – – – – –Peru 95 y 99 y 1.0 y 71 100 1.4 32 3 11.3 23 44 1.9 92 y 92 y 1.0 y – – – – – –Philippines – – – 42 96 2.3 49 15 3.3 – – – 79 x 92 x 1.2 x 14 x 26 x 1.8 x – – –Poland – – – – – – – – – – – – – – – – – – – – –Portugal – – – – – – – – – – – – – – – – – – – – –Qatar – – – – – – – – – – – – – – – – – – – – –Republic of Korea – – – – – – – – – – – – – – – – – – – – –Republic of Moldova 99 100 1.0 98 99 1.0 11 3 4.2 – – – 98 99 1.0 14 47 3.3 13 40 3.1Romania – – – – – – – – – – – – – – – – – – – – –Russian Federation – – – – – – – – – – – – – – – – – – – – –Rwanda 43 64 1.5 84 97 1.2 49 21 2.3 22 37 1.7 88 97 1.1 – – – – – –Saint Kitts and Nevis – – – – – – – – – – – – – – – – – – – – –Saint Lucia – – – – – – – – – – – – 98 100 1.0 – – – – – –Saint Vincent and the Grenadines – – – – – – – – – – – – – – – – – – – – –Samoa 47 77 1.6 72 94 1.3 6 3 2.3 – – – 85 y 91 y 1.1 y 3 x 3 x 1.0 x 3 x 9 x 2.7 xSan Marino – – – – – – – – – – – – – – – – – – – – –Sao Tome and Principe 88 100 1.1 85 98 1.1 26 7 3.8 – – – 92 96 1.1 39 51 1.3 38 56 1.5Saudi Arabia – – – – – – – – – – – – – – – – – – – – –Senegal 44 93 2.1 29 81 2.8 28 10 2.8 28 23 0.8 43 78 1.8 – – – – – –Serbia 97 100 1.0 98 95 1.0 14 4 3.3 – – – 97 100 1.0 28 x 69 x 2.4 x 28 x 66 x 2.4 xSeychelles – – – – – – – – – – – – – – – – – – – – –Sierra Leone 77 80 1.0 51 84 1.6 43 28 1.5 87 88 1.0 62 92 1.5 14 x 36 x 2.6 x – – –Singapore – – – – – – – – – – – – – – – – – – – – –Slovakia – – – – – – – – – – – – – – – – – – – – –Slovenia – – – – – – – – – – – – – – – – – – – – –Solomon Islands 87 88 1.0 72 96 1.3 36.2 25 – 37 39 1.0 – – – 17 x 37 x 2.1 x 35 x 50 x 1.5 xSomalia 1 x 7 x 6.6 x 1 x 27 x 27.1 x 52 x 25 x 2.0 x 7 x 31 x 4.8 x 4 x 50 x 13.2 x 1 x 8 x 13.5 x – – –South Africa – – – 93 99 1.1 36 13 2.9 – – – – – – – – – – – –South Sudan 21 57 2.7 8 x 41 x 5.1 x 31 x 27 x 1.2 x 27 x 52 x 1.9 x 10 50 5.1 3 x 18 x 6.1 x – – –Spain – – – – – – – – – – – – – – – – – – – – –Sri Lanka 97 x 98 x 1.0 x 97 x 99 x 1.0 x 19 10 2.0 – – – – – – – – – – – –State of Palestine 100 99 1.0 100 99 1.0 8 7 1.1 23 31 1.3 99 99 1.0 5 x 10 x 2.1 x – – –Sudan 37 98 2.6 48 99 2.1 44 21 2.1 16 21 1.3 48 94 1.9 2 19 8.7 – – –Suriname 98 100 1.0 83 x 94 x 1.1 x 13 x 6 x 2.4 x – – – 92 97 1.1 26 x 52 x 2.0 x – – –Swaziland 39 78 2.0 76 95 1.2 30 9 3.3 – – – 97 98 1.0 38 54 1.4 40 69 1.7Sweden – – – – – – – – – – – – – – – – – – – – –Switzerland – – – – – – – – – – – – – – – – – – – – –Syrian Arab Republic 93 x 99 x 1.1 x 75 x 99 x 1.3 x 35 x 25 x 1.4 x 46 x 59 x 1.3 x 92 x 99 x 1.1 x 4 x 10 x 2.9 x – – –Tajikistan 86 90 1.0 74 96 1.3 32 21 1.5 53 62 1.2 85 88 1.0 – – – – – –Thailand 100 y 100 y 1.0 y 98 100 1.0 13 12 1.1 78 81 1.0 92 97 1.1 42 53 1.3 37 53 1.4The former Yugoslav Republic of Macedonia 99 100 1.0 78 97 1.2 7 2 3.6 – – – 96 99 1.0 9 x 45 x 5.0 x – – –
Timor-Leste 50 56 1.1 10 x 69 x 6.9 x 59 39 1.5 70 x 71 x 1.0 x 60 84 1.4 9 x 16 x 1.8 x 11 x 35 x 3.0 xTogo 67 97 1.5 11 87 8.1 33 11 3.2 28 25 0.9 80 97 1.2 18 x 42 x 2.3 x 20 x 55 x 2.7 xTokelau – – – – – – – – – – – – – – – – – – – – –Tonga 92 96 1.1 93 97 1.0 7 10 0.7 – – – 94 y 94 y 1.0 y 11 16 1.4 13 14 1.1Trinidad and Tobago 96 x 99 x 1.0 x 98 x 99 x 1.0 x – – – – – – 95 98 1.0 48 x 62 x 1.3 x – – –Tunisia 98 100 1.0 63 89 1.4 16 8 2.0 – – – 96 99 1.0 10 p 29 2.8 – – –Turkey 98 y 99 y 1.0 y 91 100 1.1 18 4 4.3 – – – 92 96 1.0 – – – – – –Turkmenistan 100 99 1.0 100 100 1.0 16 11 1.4 – – – 98 98 1.0 17 p 32 1.9 – – –Turks and Caicos Islands – – – – – – – – – – – – – – – – – – – – –Tuvalu 39 x 71 x 1.8 x 95 x 90 x 1.0 x 8 x 13 x 0.6 x – – – 99 x,y 100 x,y 1.0 x,y 34 x,p 39 x 1.2 x – 67 x,p –Uganda 27 44 1.6 43 88 2.0 32 17 1.9 48 53 1.1 79 92 1.2 20 x,p 47 x 2.3 x 28 x 47 x 1.6 x

197TABLE 11. DISPARITIES BY HOUSEHOLD WEALTH
Countries and areas
Birth registration (%)++
2010–2016*
Skilled birth attendant (%)
2011–2016*
Stunting prevalence in children under 5
(moderate & severe)θ (%) 2011–2016*
Oral rehydration salts (ORS) treatment for
children with diarrhoea (%) 2011–2016*
Primary school net attendance ratio
2011–2016*
Comprehensive knowledge of HIV/AIDS
(%) Females 15–24 2011–2016*
Comprehensive knowledge of HIV/
AIDS (%) Males 15–242011–2016*
poorest 20%
richest 20%
ratio of richest
to poorest
poorest 20%
richest 20%
ratio of richest
to poorest
poorest 20%
richest 20%
ratio of poorest to
richestpoorest
20%richest
20%
ratio of richest to poorest
poorest 20%
richest 20%
ratio of richest to poorest
poorest 20%
richest 20%
ratio of richest to poorest
poorest 20%
richest 20%
ratio of richest to poorest
Ukraine 100 99 1.0 99 100 1.0 – – – – – – 100 100 1.0 41 p 53 1.3 40 54 1.3United Arab Emirates – – – – – – – – – – – – – – – – – – – – –United Kingdom – – – – – – – – – – – – – – – – – – – – –United Republic of Tanzania 8 65 8.5 42 95 2.3 40 19 2.1 40 45 1.1 63 95 1.5 39 x,p 55 x 1.4 x 34 x 56 x 1.7 xUnited States – – – – – – – – – – – – – – – – – – – – –Uruguay – – – – – – – – – – – – 97 98 1.0 – – – – – –Uzbekistan 100 x 100 x 1.0 x 99 x 100 x 1.0 x 21 x 15 x 1.4 x 27 x 19 x 0.7 x – – – 25 x 33 x 1.3 x – – –Vanuatu 33 y 59 y 1.8 y 77 95 1.2 40 16 2.4 – – – 75 y 80 y 1.1 y 9 x 23 x 2.7 x – – –Venezuela (Bolivarian Republic of) – – – 99 93 0.9 – – – – – – 86 99 1.2 – – – – – –Viet Nam 91 98 1.1 73 100 1.4 41 6 6.7 – – – 94 98 1.0 30 65 2.2 – – –Yemen 17 56 3.3 19 81 4.2 59 26 2.3 27 21 0.8 56 90 1.6 0 x 4 x – x – – –Zambia 5 29 6.0 45 94 2.1 47 28 1.7 59 68 1.1 75 97 1.3 24 x 48 x 2.0 x 24 x 51 x 2.1 xZimbabwe 24 79 3.3 62 96 1.6 33 17 2.0 30 44 1.5 91 100 1.1 47 65 1.4 43 67 1.6
SUMMARYEast Asia and Pacific 59 ** 92 ** 1.6 ** 60 ** 98 ** 1.6 ** 44 ** 20 ** 2.2 ** – – – 95 ** 99 ** 1.0 ** – – – – – –Europe and Central Asia – – – – – – – – – – – – – – – – – – – – –
Eastern Europe and Central Asia 98 98 1.0 93 99 1.1 18 r 8 r 2.4 r – – – 94 96 1.0 – – – – – –Western Europe – – – – – – – – – – – – – – – – – – – – –
Latin America and Caribbean 88 98 1.1 80 98 1.2 30 N 7 N 4.3 N – – – 94 97 1.0 – – – – – –Middle East and North Africa 88 94 1.1 72 96 1.3 24 15 1.6 23 24 1.0 86 97 1.1 – – – – – –North America – – – – – – – – – – – – – – – – – – – – –South Asia 45 78 1.7 53 91 1.7 52 22 2.0 37 49 1.3 67 94 1.4 5 ‡ 21 ‡ 4.1 ‡ – – –Sub-Saharan Africa 27 63 2.3 34 87 2.6 44 19 2.3 31 45 1.5 54 91 1.7 – – – – – –
Eastern and Southern Africa 27 55 2.1 40 87 2.2 42 19 2.2 37 46 1.2 63 90 1.4 – – – – – –West and Central Africa 28 70 2.5 28 86 3.1 46 19 2.4 25 45 1.8 46 91 2.0 14 34 2.4 – – –
Least developed countries 30 56 1.9 36 85 2.4 45 21 2.1 39 47 1.2 64 89 1.4 – – – – – –World 56 ** 82 ** 1.5 ** 51 ** 91 ** 1.8 ** 44 19 2.2 34 ** 45 ** 1.3 ** 70 ** 94 ** 1.3 ** – – – – – –
For a complete list of countries and areas in the regions, subregions and country categories, see page 150 or visit <data.unicef.org/regionalclassifications>.It is not advisable to compare data from consecutive editions of The State of the World’s Children.
Birth registration – Percentage of children under age 5 who were registered at the moment of the survey. The numerator of this indicator includes children reported to have a birth certificate, regardless of whether or not it was seen by the interviewer, and those without a birth certificate whose mother or caregiver says the birth has been registered.Skilled birth attendant – Percentage of births attended by skilled health personnel (doctor, nurse or midwife).Stunting prevalence in children under 5–Percentage of children aged 0–59 months who are below minus two standard deviations from median height-for-age of the WHO Child Growth Standards.Stunting – Moderate and severe: Percentage of children aged 0–59 months who are below minus two standard deviations from median height-for-age of the WHO Child Growth Standards.
Diarrhoea treatment with oral rehydration salts (ORS) – Percentage of children under age 5 who had diarrhoea in the two weeks preceding the survey and who received oral rehydration salts (ORS packets or pre-packaged ORS fluids). Primary school net attendance ratio – Number of children attending primary or secondary school who are of official primary school age, expressed as a percentage of the total number of children of official primary school age. Because of the inclusion of primary-school-aged children attending secondary school, this indicator can also be referred to as a primary adjusted net attendance ratio.Comprehensive knowledge of HIV – Percentage of young men and women (aged 15–24) who correctly identify the two major ways of preventing the sexual transmission of HIV (using condoms and limiting sex to one faithful, uninfected partner), who reject the two most common local misconceptions about HIV transmission and who know that a healthy-looking person can be HIV-positive.
DEFINITIONS OF THE INDICATORS
Italicized data are from different sources than the data presented for the same indicators in other tables of the report.
Birth registration – Demographic and Health Surveys (DHS), Multiple Indicator Cluster Surveys (MICS), other national surveys, censuses and vital registration systems.Skilled birth attendant – DHS, MICS and other nationally representative sources.Stunting prevalence in children under 5 – DHS, MICS, other national household surveys, WHO and UNICEF.
Diarrhoea treatment with oral rehydration salts (ORS) – DHS, MICS and other national household surveys.Primary school attendance ratio – DHS, MICS and other national household surveys.Comprehensive knowledge of HIV – AIDS Indicator Surveys (AIS), DHS, MICS, and other national household surveys; DHS STATcompiler, www.statcompiler.com.
MAIN DATA SOURCES
– Data not available.p Based on small denominators
(typically 25–49 unweighted cases). No data based on fewer than 25 unweighted cases are displayed.
x Data refer to years or periods other than those specified in the column heading. Such data are not included in the calculation of regional and global averages, with the exception of 2005–2006 data on primary attendance from India. Estimates from data years prior to 2000 are not displayed.
y Data differ from the standard defini-tion or refer to only part of a country. If they fall within the noted reference period, such data are included in the calculation of regional and global averages.
++ Changes in the definition of birth reg-istration were made from the second and third rounds of MICS (MICS2 and MICS3) to the fourth round (MICS4). In order to allow for comparability with later rounds, data from MICS2 and MICS3 on birth registration were recalculated according to the MICS4 indicator definition. Therefore, the recalculated data presented here may differ from estimates included in MICS2 and MICS3 national reports.
θ Global and regional averages for stunting (moderate and severe) are estimated using statistical modelling data from the UNICEF-WHO-World Bank Group Joint Child Malnutrition Estimates, May 2017 Edition. For more information see <data.unicef.org/malnutrition>. Disaggregations for stunting (moderate and severe) are population-weighted, which means using the most recent estimate for each country with data between 2011 and 2016; therefore disaggregations may not coincide with total estimates at the global and regional level.
* Data refer to the most recent year available during the period specified in the column heading.
** Excludes China.‡ Excludes India.r Excludes the Russian Federation.N Excludes Brazil.
NOTES

UNICEF – THE STATE OF THE WORLD’S CHILDREN 2017
Countries and areas
Attendance in early childhood education2005–2016*
Adult support for learning ++
2005–2016*
Father’s support
for learning
++
2005–2016*
Learning materials at home 2005–2016* Children with inadequate
supervision2005–2016*Children’s books Playthings ++
total male femalepoorest
20%richest
20% total male femalepoorest
20%richest
20% totalpoorest
20%richest
20% totalpoorest
20%richest
20% total male femalepoorest
20%richest
20%
Afghanistan 1 1 1 0 4 73 74 73 72 80 62 y 2 1 5 53 52 57 40 42 39 43 27Albania 40 39 42 26 60 86 85 87 68 96 53 y 32 16 52 53 57 48 13 14 11 9 16Algeria 17 17 16 7 31 78 79 78 64 92 79 y 11 3 23 35 32 36 6 6 5 6 6Andorra – – – – – – – – – – – – – – – – – – – – – –Angola – – – – – – – – – – – – – – – – – – – – – –Anguilla – – – – – – – – – – – – – – – – – – – – – –Antigua and Barbuda – – – – – – – – – – – – – – – – – – – – – –Argentina 63 61 66 46 85 84 83 85 73 95 57 y 61 40 83 61 58 63 8 9 8 10 5Armenia – – – – – – – – – – – – – – – – – – – – – –Australia – – – – – – – – – – – – – – – – – – – – – –Austria – – – – – – – – – – – – – – – – – – – – – –Azerbaijan – – – – – – – – – – – – – – – – – – – – – –Bahamas – – – – – – – – – – – – – – – – – – – – – –Bahrain – – – – – – – – – – – – – – – – – – – – – –Bangladesh 13 13 14 12 18 78 78 78 64 94 10 9 2 23 60 57 60 12 11 12 14 12Barbados 90 88 91 90 p 97 p 97 97 97 100 p 100 p 46 y 85 83 89 76 68 77 1 2 1 0 3Belarus 88 86 89 75 91 96 94 97 90 99 68 y 92 83 96 79 77 79 4 4 4 4 5Belgium – – – – – – – – – – – – – – – – – – – – – –Belize 55 52 58 29 72 88 89 86 80 94 24 44 23 73 68 70 66 13 15 11 15 11Benin 13 13 14 2 38 28 28 27 18 48 5 1 0 6 48 39 65 34 35 34 39 25Bhutan 10 10 10 3 27 54 52 57 40 73 51 y 6 1 24 52 36 60 14 13 15 17 7Bolivia (Plurinational State of) – – – – – – – – – – – – – – – – – – – – – –Bosnia and Herzegovina 13 12 14 2 31 95 95 96 87 100 76 y 56 39 73 56 58 60 2 2 2 3 1Botswana 18 – – – – – – – – – – – – – – – – – – – – –Brazil 70 y – – – – – – – – – – – – – – – – – – – – –British Virgin Islands – – – – – – – – – – – – – – – – – – – – – –Brunei Darussalam – – – – – – – – – – – – – – – – – – – – – –Bulgaria – – – – – – – – – – – – – – – – – – – – – –Burkina Faso 3 y 3 y 3 y – – 14 14 14 12 26 24 y – – – – – – – – – – –Burundi 5 5 5 4 10 34 35 34 32 38 20 y – – – – – – – – – – –Cabo Verde – – – – – – – – – – – – – – – – – – – – – –Cambodia 15 y 12 y 17 y 7 y 38 y 59 y 57 y 62 y 48 y 73 y 9 y 4 y 1 y 12 y 34 y 20 y 53 y 10 y 10 y 10 y 16 y 4 yCameroon 28 27 29 2 66 44 45 44 50 52 4 4 0 17 53 47 65 34 34 35 52 23Canada – – – – – – – – – – – – – – – – – – – – – –Central African Republic 5 5 6 2 17 74 74 74 70 78 42 y 1 0 3 49 41 51 61 60 62 58 60Chad 3 y 3 y 3 y 1 y 11 y 47 y 48 y 46 y 41 y 51 y 20 y 1 y 1 y 2 y 41 y 33 y 52 y 47 y 50 y 45 y 43 y 46 yChile – – – – – – – – – – – – – – – – – – – – – –China – – – – – – – – – – – – – – – – – – – – – –Colombia 37 y – – – – – – – – – – – – – – – – – – – – –Comoros – – – – – – – – – – – – – – – – – – – – – –Congo 36 – – – – 59 – – – – 6 3 – – 51 – – 42 – – – –Cook Islands – – – – – – – – – – – – – – – – – – – – – –Costa Rica 18 17 18 8 40 68 69 66 54 88 52 y 37 13 70 73 68 74 4 4 4 6 3Côte d'Ivoire 5 5 5 1 15 50 50 51 55 57 40 y 5 3 13 39 44 35 59 60 58 62 51Croatia 74 y 75 y 73 y – – – – – – – – – – – – – – – – – – –Cuba 76 75 77 – – 89 89 90 – – 18 48 – – 78 – – 4 4 4 – –Cyprus – – – – – – – – – – – – – – – – – – – – – –Czechia – – – – – – – – – – – – – – – – – – – – – –Democratic People's Republic of Korea 98 98 97 – – 91 88 93 – – 75 y 79 – – 47 – – 17 17 16 – –
Democratic Republic of the Congo 7 y 7 y 7 y 1 y 20 y 52 y 55 y 48 y 45 y 64 y 4 y 1 y 0 y 2 y 27 y 18 y 49 y 49 y 50 y 48 y 57 y 29 yDenmark – – – – – – – – – – – – – – – – – – – – – –Djibouti 14 12 16 – – 37 y 38 y 35 y – – 28 y 15 – – 24 – – 8 8 8 – –Dominica – – – – – – – – – – – – – – – – – – – – – –Dominican Republic 40 39 40 16 72 58 58 59 38 73 6 10 2 28 57 57 58 5 5 5 7 3Ecuador – – – – – – – – – – – – – – – – – – – – – –Egypt 47 y 48 y 47 y 34 y 50 y – – – – – – – – – – – – 4 4 4 7 2El Salvador 25 24 26 19 44 59 57 62 45 78 8 18 6 44 62 62 58 4 4 3 4 4Equatorial Guinea – – – – – – – – – – – – – – – – – – – – – –Eritrea – – – – – – – – – – – – – – – – – – – – – –Estonia – – – – – – – – – – – – – – – – – – – – – –Ethiopia – – – – – – – – – – – – – – – – – – – – – –Fiji – – – – – – – – – – – – – – – – – – – – – –Finland – – – – – – – – – – – – – – – – – – – – – –France – – – – – – – – – – – – – – – – – – – – – –
TABLE 12. EARLY CHILDHOOD DEVELOPMENT

199TABLE 12. EARLY CHILDHOOD DEVELOPMENT
Countries and areas
Attendance in early childhood education2005–2016*
Adult support for learning ++
2005–2016*
Father’s support
for learning
++
2005–2016*
Learning materials at home 2005–2016* Children with inadequate
supervision2005–2016*Children’s books Playthings ++
total male femalepoorest
20%richest
20% total male femalepoorest
20%richest
20% totalpoorest
20%richest
20% totalpoorest
20%richest
20% total male femalepoorest
20%richest
20%
Gabon – – – – – – – – – – – – – – – – – – – – – –Gambia 18 17 19 12 32 48 49 47 50 55 21 y 1 0 4 42 28 50 21 22 19 25 18Georgia 62 y – – – – 83 82 84 85 82 35 y 58 y 40 y 74 y 38 41 41 6 y 6 y 7 y 6 y 8 yGermany – – – – – – – – – – – – – – – – – – – – – –Ghana 68 65 72 42 97 40 38 42 23 78 30 y 6 1 23 41 31 51 21 21 21 27 15Greece – – – – – – – – – – – – – – – – – – – – – –Grenada – – – – – – – – – – – – – – – – – – – – – –Guatemala – – – – – – – – – – – – – – – – – – – – – –Guinea – – – – – – – – – – – – – – – – – – – – – –Guinea-Bissau 13 13 14 3 46 34 41 28 33 51 0 1 0 3 31 24 46 31 31 31 27 38Guyana 61 63 59 45 76 87 85 90 82 94 16 47 25 76 69 65 70 5 5 5 10 1Haiti – – – – – – – – – – – – – – – – – – – – – –Holy See – – – – – – – – – – – – – – – – – – – – – –Honduras 19 17 21 13 28 48 47 49 28 75 59 y 11 1 34 78 74 81 4 5 4 8 2Hungary – – – – – – – – – – – – – – – – – – – – – –Iceland – – – – – – – – – – – – – – – – – – – – – –India – – – – – – – – – – – – – – – – – – – – – –Indonesia 17 16 18 – – – – – – – – – – – – – – – – – – –Iran (Islamic Republic of) 20 y 19 y 22 y – – 70 y 69 y 70 y – – 60 y 36 y – – 67 y – – 15 y 15 y 15 y – –Iraq 4 4 4 1 10 58 58 59 40 78 55 y 5 1 16 34 34 32 8 8 7 9 8Ireland – – – – – – – – – – – – – – – – – – – – – –Israel – – – – – – – – – – – – – – – – – – – – – –Italy – – – – – – – – – – – – – – – – – – – – – –Jamaica 92 92 91 88 100 88 86 90 76 86 28 y 55 34 73 61 64 56 2 2 2 2 1Japan – – – – – – – – – – – – – – – – – – – – – –Jordan 22 y 21 y 23 y 11 y 39 y 82 y 81 y 83 y 75 y 87 y 72 y 23 y 11 y 40 y 70 y 68 y 74 y 9 y 9 y 9 y 11 y 8 yKazakhstan 55 53 58 45 70 86 84 87 83 95 7 51 35 73 60 63 61 5 4 6 8 3Kenya – – – – – – – – – – – – – – – – – – – – – –Kiribati – – – – – – – – – – – – – – – – – – – – – –Kuwait – – – – – – – – – – – – – – – – – – – – – –Kyrgyzstan 23 23 23 12 50 72 74 70 63 73 3 27 15 54 59 63 54 5 5 4 6 5Lao People's Democratic Republic 23 21 25 5 73 57 58 57 42 87 52 y 5 1 24 41 29 50 14 15 13 20 8Latvia – – – – – – – – – – – – – – – – – – – – – –Lebanon 62 63 60 – – 56 y 58 y 54 y – – 74 y 29 – – 16 y – – 9 8 10 – –Lesotho – – – – – – – – – – – – – – – – – – – – – –Liberia – – – – – – – – – – – – – – – – – – – – – –Libya – – – – – – – – – – – – – – – – – – – – – –Liechtenstein – – – – – – – – – – – – – – – – – – – – – –Lithuania – – – – – – – – – – – – – – – – – – – – – –Luxembourg – – – – – – – – – – – – – – – – – – – – – –Madagascar – – – – – – – – – – – – – – – – – – – – – –Malawi 39 37 41 26 67 29 29 30 22 44 3 1 0 6 45 35 66 37 37 37 39 28Malaysia 53 52 55 – – 25 25 24 – – – 56 – – 62 – – 3 3 3 – –Maldives – – – – – – – – – – – – – – – – – – – – – –Mali 5 6 5 1 21 55 55 55 53 65 5 0 0 2 52 42 70 32 32 32 31 27Malta – – – – – – – – – – – – – – – – – – – – – –Marshall Islands – – – – – – – – – – – – – – – – – – – – – –Mauritania 12 – – – – 44 – – – – 5 1 − − 33 – – 34 – – – –Mauritius – – – – – – – – – – – – – – – – – – – – – –Mexico 60 58 62 58 71 76 71 80 62 94 14 35 15 64 76 74 85 5 5 5 8 3Micronesia (Federated States of) – – – – – – – – – – – – – – – – – – – – – –Monaco – – – – – – – – – – – – – – – – – – – – – –Mongolia 68 68 68 36 90 55 55 55 38 71 10 33 13 57 56 57 58 10 9 11 15 8Montenegro 40 39 42 7 66 98 97 99 93 98 45 73 48 87 60 61 66 3 3 3 2 3Montserrat – – – – – – – – – – – – – – – – – – – – – –Morocco 39 36 41 6 78 35 y 34 y 35 y 16 y 59 y 58 y 21 y 9 y 52 y 14 y 19 y 7 y 11 – – – –Mozambique – – – – – 47 45 48 48 50 20 y 3 2 10 – – – 33 33 32 – –Myanmar 23 y 22 y 25 y 11 y 42 y 54 y 53 y 56 y 43 y 77 y 6 y 5 y 1 y 15 y 72 y 64 y 76 y 13 y 14 y 13 y 21 y 5 yNamibia – – – – – – – – – – – – – – – – – – – – – –Nauru – – – – – – – – – – – – – – – – – – – – – –Nepal 51 52 49 41 84 67 70 64 51 90 10 5 1 16 59 60 60 21 20 21 30 12Netherlands – – – – – – – – – – – – – – – – – – – – – –New Zealand – – – – – – – – – – – – – – – – – – – – – –Nicaragua – – – – – – – – – – – – – – – – – – – – – –

UNICEF – THE STATE OF THE WORLD’S CHILDREN 2017
Countries and areas
Attendance in early childhood education2005–2016*
Adult support for learning ++
2005–2016*
Father’s support
for learning
++
2005–2016*
Learning materials at home 2005–2016* Children with inadequate
supervision2005–2016*Children’s books Playthings ++
total male femalepoorest
20%richest
20% total male femalepoorest
20%richest
20% totalpoorest
20%richest
20% totalpoorest
20%richest
20% total male femalepoorest
20%richest
20%
Niger – – – – – – – – – – – – – – – – – – – – – –Nigeria 43 42 43 10 84 65 66 64 48 89 37 y 6 0 19 38 29 48 40 40 40 40 34Niue – – – – – – – – – – – – – – – – – – – – – –Norway – – – – – – – – – – – – – – – – – – – – – –Oman 29 28 31 − − 81 78 84 − − 22 25 − − 75 − − 45 44 45 − −Pakistan – – – – – – – – – – – – – – – – – – – – – –Palau – – – – – – – – – – – – – – – – – – – – – –Panama 37 38 35 28 67 74 73 74 55 89 45 y 26 7 59 69 67 68 3 3 2 6 1Papua New Guinea – – – – – – – – – – – – – – – – – – – – – –Paraguay – – – – – – – – – – – – – – – – – – – – – –Peru 77 y 76 y 79 y 70 y 90 y – – – – – – – – – – – – – – – – –Philippines – – – – – – – – – – – – – – – – – – – – – –Poland – – – – – – – – – – – – – – – – – – – – – –Portugal – – – – – – – – – – – – – – – – – – – – – –Qatar 41 41 41 – – 88 89 88 – – 85 y 40 – – 55 – – 12 12 11 – –Republic of Korea – – – – – – – – – – – – – – – – – – – – – –Republic of Moldova 71 74 67 50 88 89 86 92 81 95 47 y 68 33 87 68 75 69 6 6 6 9 5Romania 82 y 82 y 83 y – – – – – – – – – – – – – – – – – – –Russian Federation – – – – – – – – – – – – – – – – – – – – – –Rwanda 13 y 12 y 14 y 3 y 45 y 49 y 49 y 49 y 36 y 66 y 3 y 1 y 0 y 3 y 30 y 21 y 41 y 35 y 35 y 35 y 38 y 21 ySaint Kitts and Nevis – – – – – – – – – – – – – – – – – – – – – –Saint Lucia 85 87 84 – – 93 89 96 – – 50 y 68 – – 59 – – 5 5 5 – –Saint Vincent and the Grenadines – – – – – – – – – – – – – – – – – – – – – –Samoa – – – – – – – – – – – – – – – – – – – – – –San Marino – – – – – – – – – – – – – – – – – – – – – –Sao Tome and Principe 36 34 39 21 63 63 63 63 48 74 3 6 1 20 65 65 57 16 17 14 26 8Saudi Arabia – – – – – – – – – – – – – – – – – – – – – –Senegal 35 y 35 y 34 y 12 y 68 y – – – – – – – – – – – – – – – – –Serbia 50 52 49 9 82 96 95 96 87 98 37 72 44 83 75 78 76 1 2 1 3 2Seychelles – – – – – – – – – – – – – – – – – – – – – –Sierra Leone 14 13 15 5 42 54 53 55 45 79 42 y 2 0 10 35 24 50 32 33 32 29 28Singapore – – – – – – – – – – – – – – – – – – – – – –Slovakia – – – – – – – – – – – – – – – – – – – – – –Slovenia – – – – – – – – – – – – – – – – – – – – – –Solomon Islands – – – – – – – – – – – – – – – – – – – – – –Somalia 2 2 2 1 6 79 80 79 76 85 48 y – – – – – – – – – – –South Africa 48 y – – – – – – – – – – – – – – – – – – – – –South Sudan 6 6 6 2 13 – – – – – – – – – – – – – – – – –Spain – – – – – – – – – – – – – – – – – – – – – –Sri Lanka – – – – – – – – – – – – – – – – – – – – – –State of Palestine 26 27 26 21 38 78 77 78 69 87 12 20 13 31 69 64 72 14 14 15 15 12Sudan 22 22 23 7 59 − − − − − − 2 0 7 46 36 55 − − − − −Suriname 34 33 35 16 63 73 71 75 56 91 26 y 25 4 61 59 61 60 7 7 7 9 8Swaziland 30 26 33 28 48 39 33 44 25 59 2 6 2 19 67 56 78 17 16 17 18 15Sweden – – – – – – – – – – – – – – – – – – – – – –Switzerland – – – – – – – – – – – – – – – – – – – – – –Syrian Arab Republic 8 8 7 4 18 70 70 69 52 84 62 y 30 12 53 52 52 51 17 17 17 22 15Tajikistan 6 – – – – 74 73 74 56 86 23 y 17 4 33 46 43 44 13 13 12 15 11Thailand 85 84 85 86 84 93 93 92 87 98 34 41 23 73 76 81 67 2 6 6 8 3The former Yugoslav Republic of Macedonia 30 – – – – 92 92 91 81 96 71 y 52 18 81 71 70 79 5 5 5 11 1
Timor-Leste – – – – – – – – – – – – – – – – – – – – – –Togo 26 y 26 y 26 y 15 y 52 y 25 y 25 y 25 y 20 y 42 y 21 y 1 y 0 y 3 y 34 y 22 y 48 y 29 y 26 y 33 y 36 y 26 yTokelau – – – – – – – – – – – – – – – – – – – – – –Tonga – – – – – – – – – – – – – – – – – – – – – –Trinidad and Tobago 75 74 76 65 87 98 98 98 96 100 63 y 81 66 93 65 63 72 1 1 1 2 0Tunisia 44 42 47 13 81 71 68 74 44 90 71 y 18 3 40 53 46 56 13 13 14 18 9Turkey – – – – – – – – – – – – – – – – – – – – – –Turkmenistan 43 43 43 17 81 94 94 95 92 98 15 48 30 66 53 59 56 1 0 1 1 1Turks and Caicos Islands – – – – – – – – – – – – – – – – – – – – – –Tuvalu – – – – – – – – – – – – – – – – – – – – – –Uganda – – – – – – – – – – – – – – – – – – – – – –Ukraine 52 54 50 30 68 98 97 98 95 99 71 y 91 92 92 52 61 51 7 6 7 11 5United Arab Emirates – – – – – – – – – – – – – – – – – – – – – –United Kingdom – – – – – – – – – – – – – – – – – – – – – –
TABLE 12. EARLY CHILDHOOD DEVELOPMENT

201
Countries and areas
Attendance in early childhood education2005–2016*
Adult support for learning ++
2005–2016*
Father’s support
for learning
++
2005–2016*
Learning materials at home 2005–2016* Children with inadequate
supervision2005–2016*Children’s books Playthings ++
total male femalepoorest
20%richest
20% total male femalepoorest
20%richest
20% totalpoorest
20%richest
20% totalpoorest
20%richest
20% total male femalepoorest
20%richest
20%
United Republic of Tanzania – – – – – – – – – – – – – – – – – – – – – –United States – – – – – – – – – – – – – – – – – – – – – –Uruguay 81 83 80 – – 93 94 91 – – 66 y 59 – – 75 – – 3 3 3 – –Uzbekistan 21 y 21 y 21 y – – 91 91 90 83 95 54 y 43 32 59 67 74 62 5 5 5 6 7Vanuatu – – – – – – – – – – – – – – – – – – – – – –Venezuela (Bolivarian Republic of) 66 y – – – – – – – – – – – – – – – – – – – – –Viet Nam 71 74 69 53 86 76 76 76 52 96 15 26 6 58 52 44 54 7 6 8 14 2Yemen 3 3 3 0 8 33 34 32 16 56 37 y 10 4 31 49 45 49 34 36 33 46 22Zambia – – – – – – – – – – – – – – – – – – – – – –Zimbabwe 22 20 23 17 34 43 43 43 35 59 3 3 1 12 62 48 74 19 19 18 25 7
SUMMARYEast Asia and Pacific 37 ** 37 ** 37 ** − − − − − − − − − − − − − − − − − − −Europe and Central Asia − − − − − − − − − − − − − − − − − − − − − −
Eastern Europe and Central Asia − − − − − − − − − − − − − − − − − − − − − −Western Europe − − − − − − − − − − − − − − − − − − − − − −
Latin America and Caribbean 61 − − − − − − − − − − − − − − − − − − − − −Middle East and North Africa 26 25 26 15 37 61 61 61 – – 58 19 – – 45 − − 11 12 11 14 8North America − − − − − − − − − − − − − − − − − − − − − −South Asia − − − − − − − − − − − − − − − − − − − − − −Sub-Saharan Africa 27 25 26 8 54 53 53 52 44 69 23 3 0 12 39 – – 39 – – − −
Eastern and Southern Africa – – – – – – – – – – – – – – – – – – – – – –West and Central Africa 27 27 28 8 58 54 55 53 44 72 24 4 0 13 38 30 50 41 41 41 44 32
Least developed countries 13 13 14 7 29 55 56 55 47 69 17 4 1 11 47 40 57 31 − − − −World − − − − − − − − − − − − − − − − − − − − − −
For a complete list of countries and areas in the regions, subregions and country categories, see page 150 or visit <data.unicef.org/regionalclassifications>.It is not advisable to compare data from consecutive editions of The State of the World’s Children.
TABLE 12. EARLY CHILDHOOD DEVELOPMENT
Attendance in early childhood education – Percentage of children 36–59 months old who are attending an early childhood education programme.Adult support for learning – Percentage of children 36–59 months old with whom an adult has engaged in four or more of the following activities to promote learning and school readiness in the past 3 days: a) reading books to the child, b) telling stories to the child, c) singing songs to the child, d) taking the child outside the home, e) playing with the child, and f) spending time with the child naming, counting or drawing things.Father’s support for learning – Percentage of children 36–59 months old whose father has engaged in four or more of the following activities to promote learning and school readiness in the past 3 days: a) reading books to the child, b) telling stories to the child, c) singing songs to the child, d) taking the child outside the home, e) playing with the child, and f) spending time with the child naming, counting or drawing things.
Learning materials at home: Children’s books – Percentage of children 0–59 months old who have three or more children’s books at home.Learning materials at home: Playthings – Percentage of children 0–59 months old with two or more of the following playthings at home: household objects or objects found outside (sticks, rocks, animals, shells, leaves etc.), homemade toys or toys that came from a store.Children with inadequate supervision – Percentage of children 0–59 months old left alone or in the care of another child younger than 10 years of age for more than one hour at least once in the past week.
Attendance in early childhood education – Demographic and Health Surveys (DHS), Multiple Indicator Cluster Surveys (MICS), and other national surveys.Adult support for learning – DHS, MICS and other national surveys.Father’s support for learning – DHS, MICS and other national surveys.Learning materials at home: Children’s books – DHS, MICS and other national surveys.
Learning materials at home: Playthings – DHS, MICS and other national surveys.Children with inadequate supervision – DHS, MICS and other national surveys.
– Data not available.p Based on small denominators
(typically 25–49 unweighted cases). No data based on fewer than 25 unweighted cases are displayed.
y Data differ from the standard defini-tion or refer to only part of a country. If they fall within the noted reference period, such data are included in the calculation of regional and global averages.
++ Changes in the definitions of several ECD indicators were made between the third and fourth round of MICS (MICS3 and MICS4). In order to allow for comparability with MICS4, data from MICS3 for the adult support
for learning, father’s support for learning and learning materials at home (playthings) indicators were recalculated according to MICS4 indicator definitions. Therefore, the recalculated data presented here will differ from estimates reported in MICS3 national reports.
* Data refer to the most recent year available during the period specified in the column heading.
NOTESDEFINITIONS OF THE INDICATORS
MAIN DATA SOURCES

UNICEF – THE STATE OF THE WORLD’S CHILDREN 2017
Countries and areas
Population below international poverty line of
US$1.90 per day (%)
National monetary child poverty
(%)P ODA inflow in millions US$ODA inflow
as a % of recipient GNI
Share of household income
(%, 2009–2013*)2010–2014* 2010–2016* 2015 2015 poorest 40% richest 20%
Afghanistan – – 4,239 21 – –Albania 1 – 334 3 22 38Algeria – – 88 0 – –Andorra – – – – – –Angola 30 x – 380 0 15 x 49 xAnguilla – – – – – –Antigua and Barbuda – 24 x 1 0 – –Argentina 2 – -23 0 15 47Armenia 2 34 348 3 21 40Australia – – – – 19 42Austria – – – – 21 38Azerbaijan 1 x 5 70 0 21 x 41 xBahamas – – – – – –Bahrain – – – – – –Bangladesh 19 – 2,570 1 21 42Barbados – 32 – – – –Belarus 0 9 105 0 24 36Belgium – – – – 23 36Belize 14 x – 27 2 11 x 58 xBenin 53 – 430 5 16 51Bhutan 2 – 97 5 18 46Bolivia (Plurinational State of) 7 – 787 2 12 52Bosnia and Herzegovina 0 – 355 2 19 41Botswana 18 x 26 66 0 9 65Brazil 4 – 999 0 11 57British Virgin Islands – 29 x – – – –Brunei Darussalam – – – – – –Bulgaria 2 25 – – 18 43Burkina Faso 44 – 997 9 17 47Burundi 78 x 55 367 12 21 x 43 xCabo Verde 8 x – 153 10 14 x 53 xCambodia 2 – 677 4 22 40Cameroon 24 – 664 2 15 x 49 xCanada – – – – 20 41Central African Republic 66 x – 487 31 10 x 61 xChad 38 – 607 6 15 49Chile 1 18 50 0 13 57China 2 7 y -332 0 15 48Colombia 6 – 1,347 0 11 58Comoros 14 x – 66 12 11 x 61 xCongo 37 54 x 89 1 12 54Cook Islands – – – – – –Costa Rica 2 – 109 0 12 54Côte d'Ivoire 29 x – 653 2 – –Croatia 1 21 – – 20 40Cuba – – 553 – – –Cyprus – – – – 20 43Czechia 0 – – – 24 36Democratic People's Republic of Korea – – 131 – – –
Democratic Republic of the Congo 77 – 2,599 8 16 48Denmark – – – – 23 38Djibouti 23 – 170 – 15 50Dominica – 38 x 11 2 – –Dominican Republic 2 – 278 0 14 53Ecuador 4 – 311 0 13 53Egypt – 29 2,488 1 – –El Salvador 3 44 88 0 15 50Equatorial Guinea – – 8 0 – –Eritrea – – 92 – – –Estonia 1 – – – 20 41Ethiopia 34 – 3,234 5 21 42Fiji 4 x – 102 2 16 x 50 xFinland – – – – 23 37
TABLE 13. ECONOMIC INDICATORS

203
Countries and areas
Population below international poverty line of
US$1.90 per day (%)
National monetary child poverty
(%)P ODA inflow in millions US$ODA inflow
as a % of recipient GNI
Share of household income
(%, 2009–2013*)2010–2014* 2010–2016* 2015 2015 poorest 40% richest 20%
France – – – – 20 41Gabon 8 x – 99 1 16 x 49 xGambia 45 x – 108 12 14 x 53 xGeorgia 10 27 448 3 16 46Germany – – – – 22 39Ghana 25 x – 1,768 5 15 x 49 xGreece – – – – 17 42Grenada – 51 x 23 2 – –Guatemala 9 68 408 1 12 57Guinea 35 – 538 9 20 42Guinea-Bissau 67 – 95 9 13 57Guyana 14 x – 31 1 14 x 50 xHaiti 54 – 1,043 12 8 64Holy See – – – – – –Honduras 16 74 537 3 10 58Hungary 0 – – – 21 39Iceland – – – – 23 36India 21 – 3,163 0 20 44Indonesia 8 17 x -43 0 18 47Iran (Islamic Republic of) 0 – 111 – 18 45Iraq – – 1,485 1 – –Ireland – – – – 20 41Israel – – – – 14 47Italy – – – – 19 42Jamaica 2 x – 57 0 15 x 52 xJapan – – – – 20 x 40 xJordan – 19 2,150 6 – –Kazakhstan 0 45 83 0 24 36Kenya 34 x – 2,474 4 13 x 54 xKiribati 14 x – 65 19 18 x 44 xKuwait – – – – – –Kyrgyzstan 1 46 769 12 23 38Lao People's Democratic Republic 17 – 471 3 18 46Latvia 1 – – – 19 42Lebanon – – 975 2 – –Lesotho 60 – 83 3 10 58Liberia 69 x – 1,094 62 18 x 44 xLibya – – 158 – – –Liechtenstein – – – – – –Lithuania 1 – – – 19 42Luxembourg – – – – 19 42Madagascar 78 78 677 7 16 49Malawi 71 – 1,049 17 15 52Malaysia 0 x – -1 0 13 51Maldives 7 x – 27 1 17 45Mali 49 x – 1,200 10 20 41Malta – – – – – –Marshall Islands – – 57 24 – –Mauritania 6 – 318 7 18 x 42 xMauritius 1 – 77 1 19 44Mexico 3 54 309 0 14 54Micronesia (Federated States of) 17 – 81 22 15 48Monaco – – – – – –Mongolia 0 – 236 2 20 42Montenegro 0 13 100 2 20 40Montserrat – 47 x – – – –Morocco 3 x – 1,369 1 17 x 48 xMozambique 69 x – 1,815 12 15 x 51 xMyanmar – – 1,169 2 – –Namibia 23 x 34 142 1 9 66Nauru – – 31 25 – –Nepal 15 – 1,216 6 20 42Netherlands – – – – 23 37New Zealand – – – – – –
TABLE 13. ECONOMIC INDICATORS
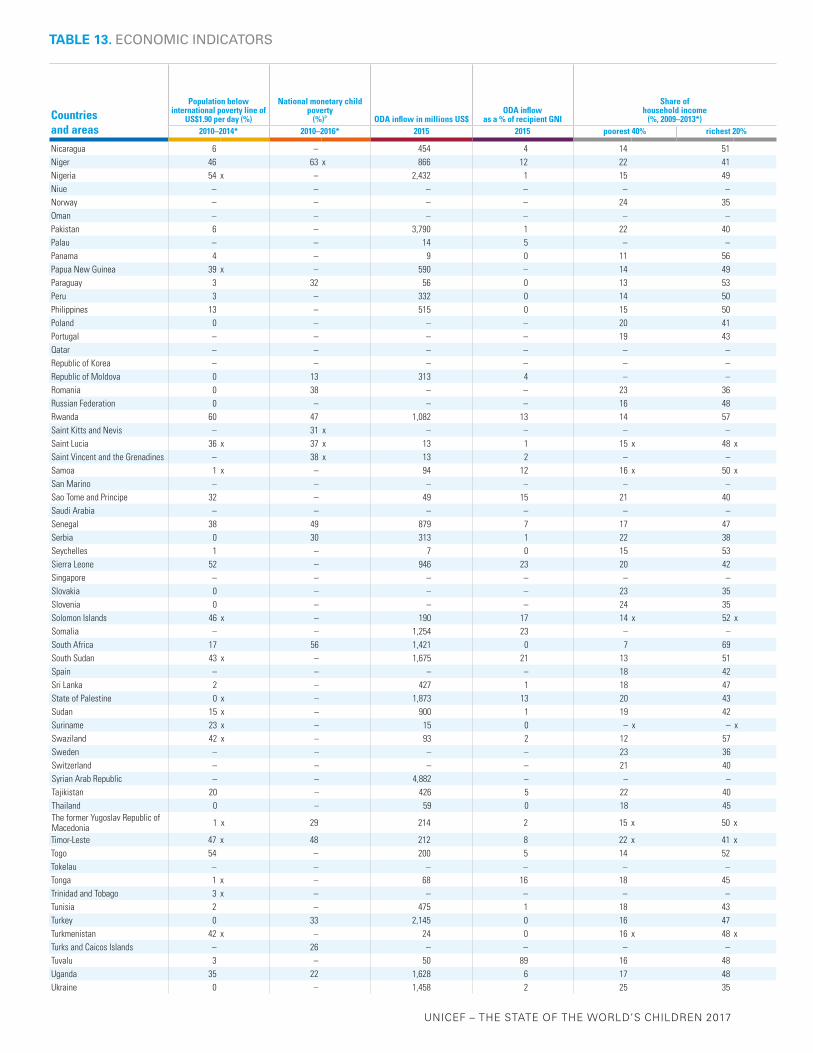
UNICEF – THE STATE OF THE WORLD’S CHILDREN 2017
Countries and areas
Population below international poverty line of
US$1.90 per day (%)
National monetary child poverty
(%)P ODA inflow in millions US$ODA inflow
as a % of recipient GNI
Share of household income
(%, 2009–2013*)2010–2014* 2010–2016* 2015 2015 poorest 40% richest 20%
Nicaragua 6 – 454 4 14 51Niger 46 63 x 866 12 22 41Nigeria 54 x – 2,432 1 15 49Niue – – – – – –Norway – – – – 24 35Oman – – – – – –Pakistan 6 – 3,790 1 22 40Palau – – 14 5 – –Panama 4 – 9 0 11 56Papua New Guinea 39 x – 590 – 14 49Paraguay 3 32 56 0 13 53Peru 3 – 332 0 14 50Philippines 13 – 515 0 15 50Poland 0 – – – 20 41Portugal – – – – 19 43Qatar – – – – – –Republic of Korea – – – – – –Republic of Moldova 0 13 313 4 – –Romania 0 38 – – 23 36Russian Federation 0 – – – 16 48Rwanda 60 47 1,082 13 14 57Saint Kitts and Nevis – 31 x – – – –Saint Lucia 36 x 37 x 13 1 15 x 48 xSaint Vincent and the Grenadines – 38 x 13 2 – –Samoa 1 x – 94 12 16 x 50 xSan Marino – – – – – –Sao Tome and Principe 32 – 49 15 21 40Saudi Arabia – – – – – –Senegal 38 49 879 7 17 47Serbia 0 30 313 1 22 38Seychelles 1 – 7 0 15 53Sierra Leone 52 – 946 23 20 42Singapore – – – – – –Slovakia 0 – – – 23 35Slovenia 0 – – – 24 35Solomon Islands 46 x – 190 17 14 x 52 xSomalia – – 1,254 23 – –South Africa 17 56 1,421 0 7 69South Sudan 43 x – 1,675 21 13 51Spain – – – – 18 42Sri Lanka 2 – 427 1 18 47State of Palestine 0 x – 1,873 13 20 43Sudan 15 x – 900 1 19 42Suriname 23 x – 15 0 – x – xSwaziland 42 x – 93 2 12 57Sweden – – – – 23 36Switzerland – – – – 21 40Syrian Arab Republic – – 4,882 – – –Tajikistan 20 – 426 5 22 40Thailand 0 – 59 0 18 45The former Yugoslav Republic of Macedonia 1 x 29 214 2 15 x 50 x
Timor-Leste 47 x 48 212 8 22 x 41 xTogo 54 – 200 5 14 52Tokelau – – – – – –Tonga 1 x – 68 16 18 45Trinidad and Tobago 3 x – – – – –Tunisia 2 – 475 1 18 43Turkey 0 33 2,145 0 16 47Turkmenistan 42 x – 24 0 16 x 48 xTurks and Caicos Islands – 26 – – – –Tuvalu 3 – 50 89 16 48Uganda 35 22 1,628 6 17 48Ukraine 0 – 1,458 2 25 35
TABLE 13. ECONOMIC INDICATORS

205
Countries and areas
Population below international poverty line of
US$1.90 per day (%)
National monetary child poverty
(%)P ODA inflow in millions US$ODA inflow
as a % of recipient GNI
Share of household income
(%, 2009–2013*)2010–2014* 2010–2016* 2015 2015 poorest 40% richest 20%
United Arab Emirates – – – – – –United Kingdom – – – – 20 40United Republic of Tanzania 47 29 2,580 6 19 46United States – – – – 15 46Uruguay 0 – 19 0 15 48Uzbekistan 67 x 13 448 1 19 x 43 xVanuatu 15 – 187 – 18 44Venezuela (Bolivarian Republic of) 9 x – 37 – 12 x 51 xViet Nam 3 – 3,157 2 17 46Yemen – – 1,531 4 – –Zambia 64 65 797 4 11 61Zimbabwe 21 78 788 5 15 50
SUMMARYEast Asia and Pacific 3 – 7,781 0 16 48Europe and Central Asia – – 7,950 1 20 42
Eastern Europe and Central Asia 1 – 7,950 1 19 44Western Europe – – – – 20 40
Latin America and Caribbean 5 – 7,896 0 12 55Middle East and North Africa – – 17,585 1 – –North America – – – – 16 46South Asia 19 – 15,530 1 20 43Sub-Saharan Africa 45 – 40,194 3 16 49
Eastern and Southern Africa 40 – 22,915 3 16 50West and Central Africa – – 17,279 2 16 48
Least developed countries 40 – 42,980 5 18 45World 13 – 96,936 0 17 46
For a complete list of countries and areas in the regions, subregions and country categories, see page 150 or visit <data.unicef.org/regionalclassifications>.It is not advisable to compare data from consecutive editions of The State of the World’s Children.
TABLE 13. ECONOMIC INDICATORS
Population below international poverty line of US$1.90 per day – Poverty headcount ratio at $1.90 a day is the percentage of the population living on less than $1.90 a day at 2011 international prices. As a result of revisions in PPP exchange rates, poverty rates for individual countries cannot be compared with poverty rates reported in earlier editions.National monetary child poverty – Percentage of children aged 0–17 years old living in households with income or consumption below the government defined national monetary poverty threshold.
ODA – Net official development assistance.Share of household income – Percentage of income received by the 20 per cent of households with the highest income and by the 40 per cent of households with the lowest income.
Population below international poverty line of US$1.90 per day – The World Bank.National monetary child poverty – Data are compiled from official national government sources such as Statistical Office tabulations and national household survey and poverty reports, and from official regional databases such as those compiled by Eurostat. National estimates are based on representative household income or expenditure surveys.
ODA – Organisation for Economic Co-operation and Development.Share of household income – The World Bank.
– Data not available.x Data refer to years or periods other
than those specified in the column heading. Such data are not included in the calculation of regional and global averages.
y Data differ from the standard defini-tion or refer to only part of a country. If they fall within the reference period, such data are included in the calculation of regional and global averages.
P This indicator reflects very different national methodologies, and current coverage is insufficient to establish robust profiles at the regional level and global level.
* Data refer to the most recent year available during the period specified in the column heading.
NOTES
MAIN DATA SOURCES
DEFINITIONS OF THE INDICATORS