statistical tensile strength of nextel™ 610 and nextel™ 720 fibers
DESCRIPTION
Statistical tensile strength of Nextel 610 and Nextel 720 fibersby DAVID M. WILSONTRANSCRIPT

Statistical tensile strength of Nextel™ 610 and Nextel™ 720 fibers
DAVID M. WILSON
3M Metal Matrix Composites Department, St. Paul, Minnesota 55144-1000
Abstract
The properties of fiber-reinforced composites are dependent not only on the
strength of the reinforcement fiber but also the distribution of fiber strength. In
this study, the single filament strength of several lots of Nextel™ 610 and
Nextel™ 720 Ceramic Fibers was measured. Fracture statistics were correlated
with the effects of gauge length and diameter variation, and the Weibull modulus
was calculated using several different techniques. It was found that the
measured Weibull modulus at a single gauge length did not accurately predict
either the gauge length or diameter dependence of tensile strength.
1. Introduction
Two new polycrystalline fibers, Nextel™ 610 and Nextel™ 720 fiber, have
recently become commercially available* . Nextel™ 610 fiber is an alpha-
alumina fiber with excellent strength and high elastic modulus. Tensile strengths
for polycrystalline fibers above 3 GPa had previously only been achieved by SiC
fibers. Oxide fibers have superior resistance to oxidation and corrosion in
certain environments; because of this, oxide fibers have the potential to produce
composites with unique and superior properties. For instance, the high strength
* At this time, both types of fiber are experimental products
of Nextel™ 610 fiber has allowed the development of a new generation of
aluminum matrix composites which have tensile strength in excess of 1500 MPa
[1]. In addition, oxide fibers are produced from aqueous solutions or sols, and
are fired in air, which makes them less expensive than SiC fibers. Nextel™ 720
fiber was developed with the goal of maximizing creep resistance. The creep
resistance of Nextel™ 720 fiber is higher than other polycrystalline oxide fiber,
and allows the fabrication of composites with useful mechanical properties at
1100�C or above. Both Nextel™ 610 and 720 fibers have excellent chemical
stability due to their high alumina content and crystalline nature. A summary of
the properties of Nextel™ 610 and 720 fiber are given in Table 1. The
microstructure and high temperature properties of both fibers have been
described previously [2,3,4].
Nextel™ 610 and 720 fibers are specifically targeted as reinforcements for metal
and ceramic composites. The strength of metal and ceramic composites is
critically dependent on not only the strength but the strength distribution of the
reinforcing fiber. Thus, a thorough understanding of fiber mechanical properties
is of prime importance. The purpose of this study is to describe the tensile
strength and statistical distribution of tensile strength of Nextel™ 610 and 720
fibers.
The statistical variability of the tensile strength of reinforcement fibers is now
commonly reported in terms of Weibull modulus. An excellent review of the
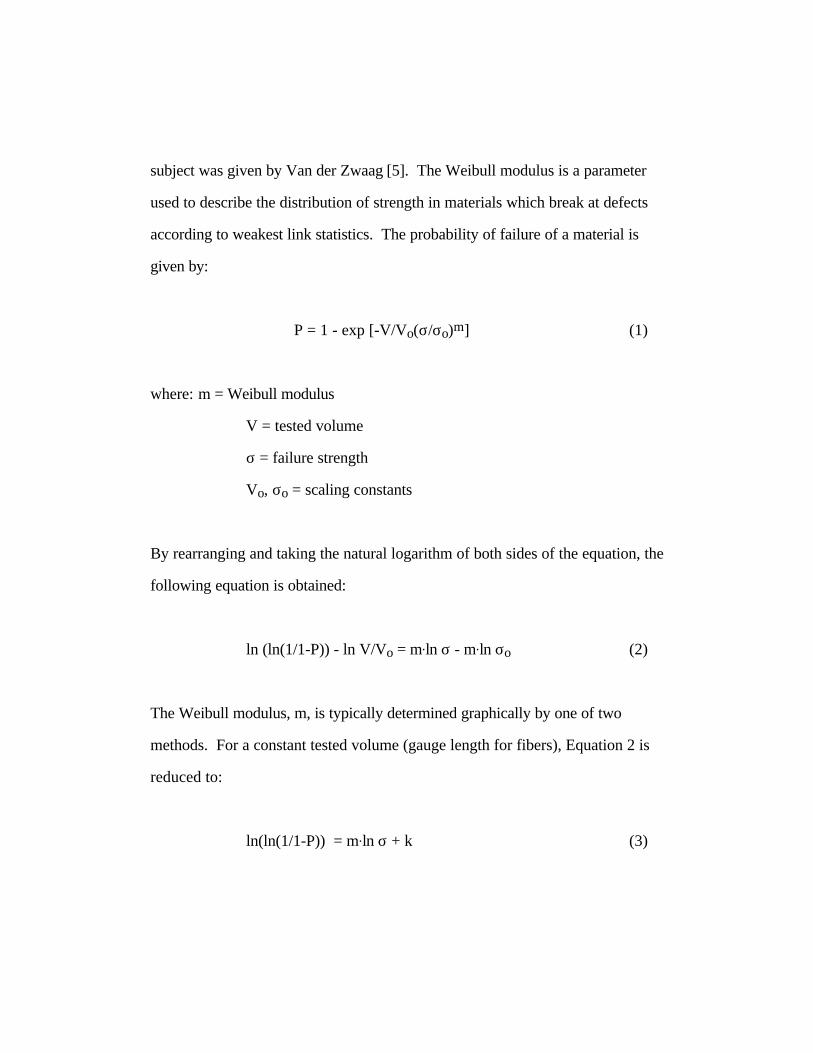
subject was given by Van der Zwaag [5]. The Weibull modulus is a parameter
used to describe the distribution of strength in materials which break at defects
according to weakest link statistics. The probability of failure of a material is
given by:
P = 1 - exp [-V/Vo(σ/σo)m] (1)
where: m = Weibull modulus
V = tested volume
σ = failure strength
Vo, σo = scaling constants
By rearranging and taking the natural logarithm of both sides of the equation, the
following equation is obtained:
ln (ln(1/1-P)) - ln V/Vo = m.ln σ - m.ln σo (2)
The Weibull modulus, m, is typically determined graphically by one of two
methods. For a constant tested volume (gauge length for fibers), Equation 2 is
reduced to:
ln(ln(1/1-P)) = m.ln σ + k (3)
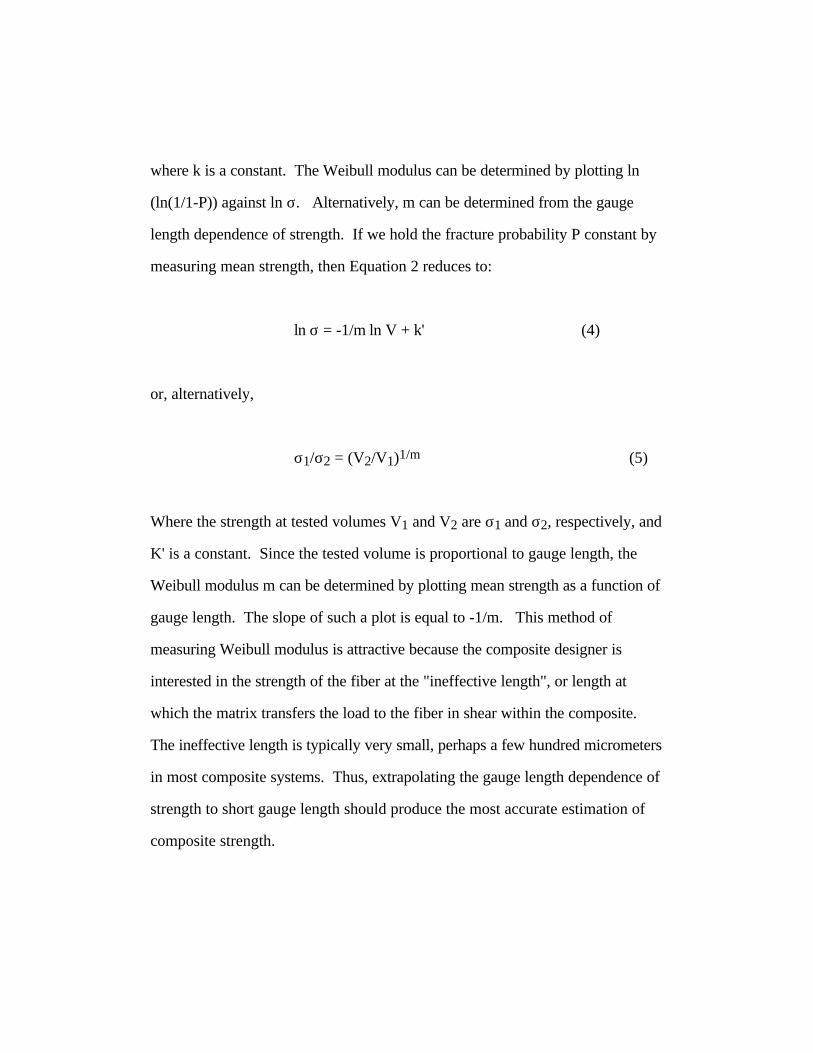
where k is a constant. The Weibull modulus can be determined by plotting ln
(ln(1/1-P)) against ln σ. Alternatively, m can be determined from the gauge
length dependence of strength. If we hold the fracture probability P constant by
measuring mean strength, then Equation 2 reduces to:
ln σ = -1/m ln V + k' (4)
or, alternatively,
σ1/σ2 = (V2/V1)1/m (5)
Where the strength at tested volumes V1 and V2 are σ1 and σ2, respectively, and
K' is a constant. Since the tested volume is proportional to gauge length, the
Weibull modulus m can be determined by plotting mean strength as a function of
gauge length. The slope of such a plot is equal to -1/m. This method of
measuring Weibull modulus is attractive because the composite designer is
interested in the strength of the fiber at the "ineffective length", or length at
which the matrix transfers the load to the fiber in shear within the composite.
The ineffective length is typically very small, perhaps a few hundred micrometers
in most composite systems. Thus, extrapolating the gauge length dependence of
strength to short gauge length should produce the most accurate estimation of
composite strength.
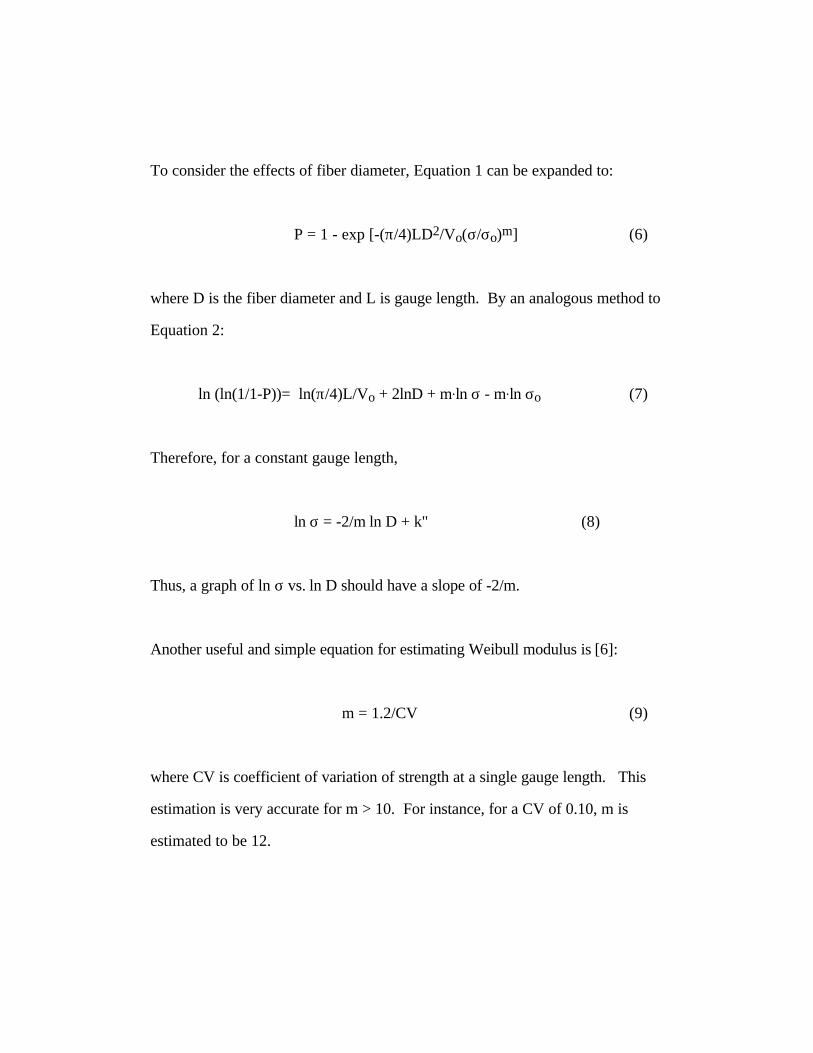
To consider the effects of fiber diameter, Equation 1 can be expanded to:
P = 1 - exp [-(π/4)LD2/Vo(σ/σo)m] (6)
where D is the fiber diameter and L is gauge length. By an analogous method to
Equation 2:
ln (ln(1/1-P))= ln(π/4)L/Vo + 2lnD + m.ln σ - m.ln σo (7)
Therefore, for a constant gauge length,
ln σ = -2/m ln D + k" (8)
Thus, a graph of ln σ vs. ln D should have a slope of -2/m.
Another useful and simple equation for estimating Weibull modulus is [6]:
m = 1.2/CV (9)
where CV is coefficient of variation of strength at a single gauge length. This
estimation is very accurate for m > 10. For instance, for a CV of 0.10, m is
estimated to be 12.
2. Experimental Procedure
Single filament strength testing was performed using rubber-faced clamp grips
with 25 x 25 mm grip faces. For Nextel™ 610 fiber, this method was found to
give higher breaking loads than paper tabs recommended in ASTM-3379-75.
The tested gauge length was 25 mm unless otherwise specified, and the strain
rate was 0.02/min. In this study, almost no fibers were lost due to breakage
during sample mounting and testing. Achieving good alignment of fibers with
the grips and load axis was critical to obtaining accurate load values.
During fiber testing, no fiber remained in the gauge length after fracture. It is
believed that this resulted from vibrations caused by the release of stored strain
energy during fiber fracture. Therefore, fiber diameter was measured on fiber
ends removed from the grips after fiber failure. Scanning electron microscopy
(SEM) examination (Cambridge 240, Leica-Cambridge, Ltd, Cambridge,
England) found that fiber diameter was constant within 0.1 µm down the length
of individual fibers within 25 mm length. Thus, fiber diameter in the grips is
expected to be equal to the diameter at the point of fracture. In this work, fiber
diameter was measured using a Measure-Rite™ image analysis system (Model
M25-6002, Dolan-Jenner Industries, Lawrence, MA), attached to a light
microscope (Olympus™ BHS, Olympus Corporation, Lake Success, NY) at
1000X magnification. Prior to this study, a number of fiber diameter
measurement methods, including unaided optical microscopy, laser
diffraction/refraction and vibroscopes were evaluated. Significant variability

was found in all in comparison to SEM measurements. The image analysis
system was found to provide the most accurate diameter measurements and was
also simple to use, a significant factor in minimizing operator fatigue and
maintaining measurement accuracy. In this system, fiber ends were measured
relative to a round template on a video monitor. Blind, replicate studies were
performed to determine measurement accuracy. The image analysis method was
repeatable to an average error of <0.1 µm, and the mean difference between
testers was also <0.1 µm. In these tests, diameter values measured using this
technique were between 0.0 and 0.3 µm less than SEM measurements
(standardized relative to an 10 µm SEM calibration grid). The reason for this
difference is unknown. The image analysis system was consistently accurate to
<0.1 µm in measuring the calibration grid. Thus, reported tensile strength may
be as much as 5% higher (~28 MPa) than true values. Diameter measurements
correlated to within 1% (0.12 µm) of diameters calculated from measured fiber
density and weight per unit length.
In this study, several production lots of fiber were tested. Fibers were taken
from several spools throughout each lot to incorporate any possible property
variation within the lot in fiber fracture statistics. For each spool tested, the
strength of ten single filaments were measured. Using this data, Weibull
modulus was calculated using three methods: 1) Weibull plot, or strength
distribution, method (Equation 3), 2) Gauge Length method (Equation 4) and 3)
Diameter method (Equation 8). For Weibull plots, P = (i-0.5)/n was used to
estimate fracture probability, where n is the number of fibers tested and i is the
rank of strength for each fiber. This is the most accurate estimator for small
sample sizes [7,8].
3. Results
3.1 Classical Weibull Statistical Analysis
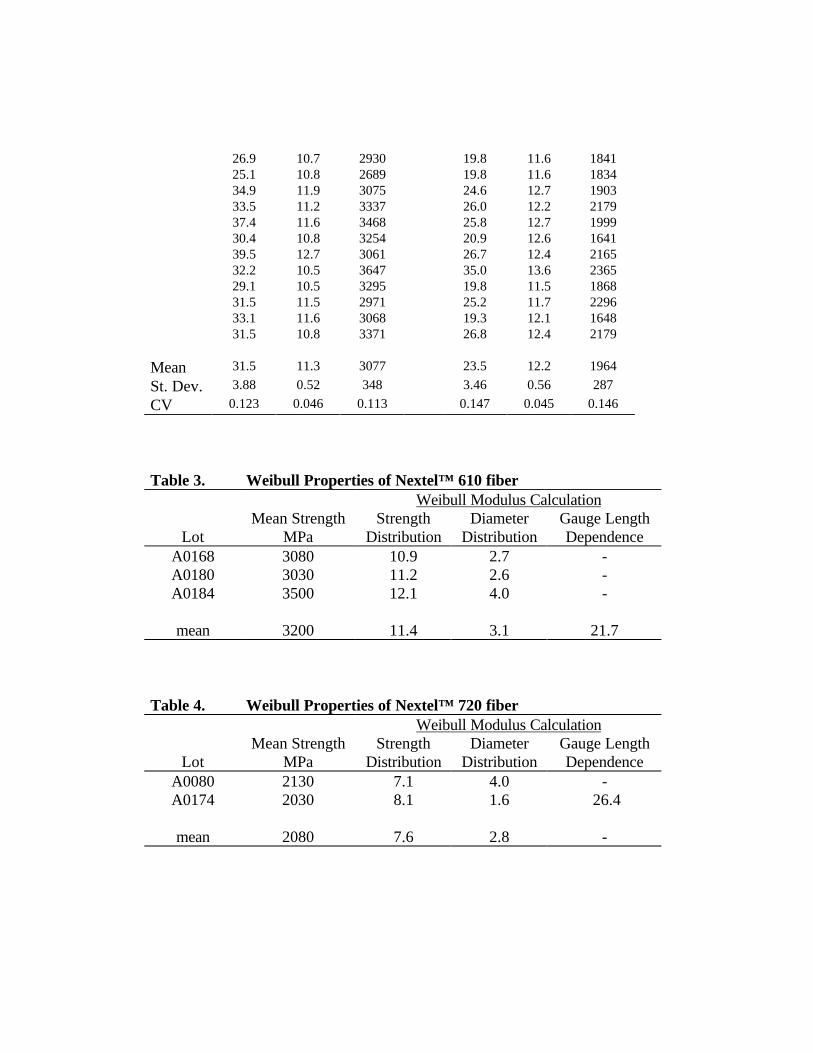
Table 2 shows a data series for Nextel™ 610 and 720 fibers. The measured
strengths are typical of fibers currently being produced. The mean breaking
loads of these lots were 3077 and 1964 MPa, respectively. The strength of
Nextel™ 610 fiber is higher, primarily because of its finer grain size. The
diameter of Nextel™ 720 fiber is slightly larger, 12.5 µm compared with 11.5
µm for Nextel™ 610 fiber. The coefficient of variation of diameter of both
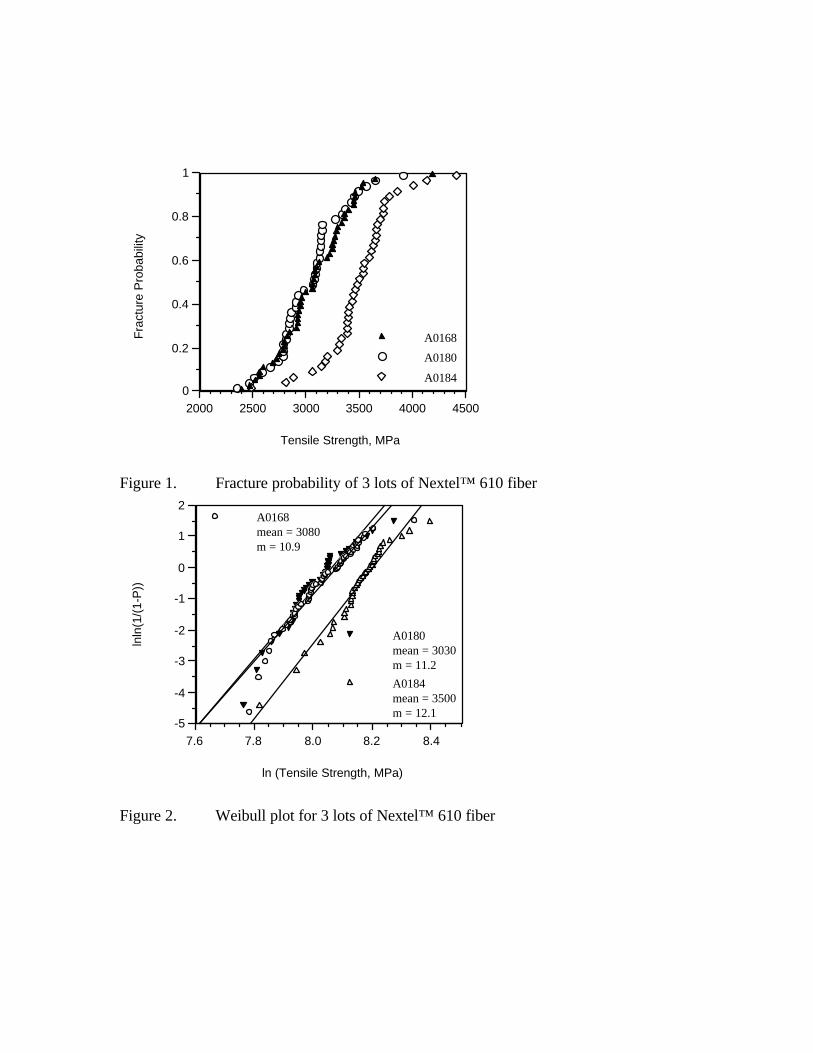
fibers is small, less than 5%. Figure 1 shows the distribution of single filament
strength for three lots of Nextel™ 610 fiber. For individual lots, approximately
80% of the fibers broke within 10% of the mean strength, indicating a high
degree of consistency between fibers. The data has a sinusoidal form, as
expected. Lot A0184 had the highest mean tensile strength of any lot tested to
date, 3500 MPa. Lots A0168 and A0180 were more typical, having tensile
strength near 3000 MPa. Weibull plots for the three lots of Nextel™ 610 fiber
are shown in Figure 2. The calculated Weibull modulus varied between 10.9 and
12.1 for the three lots (Table 3). The data was fitted using the least squares
method; the two-parameter Weibull equation fit the data fairly well, although
some deviation of from the best-fit line occurred at the high and low strength

extremes. The Weibull modulus calculated using the strength distribution
technique (Equation 3) for all three lots of fiber was 11-12. The corresponding
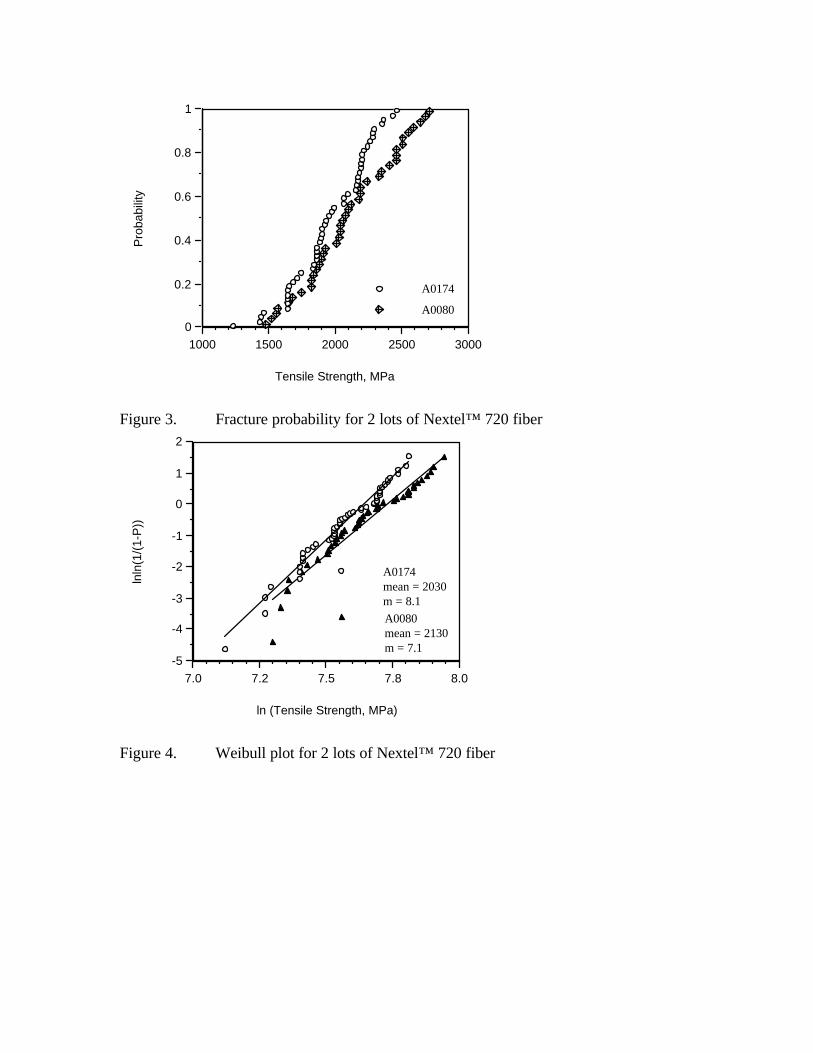
strength distribution and Weibull plot for Nextel™ 720 fiber is given in Figures 3
and 4. The tensile strength of Nextel™ 720 fiber was less than that of Nextel™
610 fiber, ranging from 1500 MPa to 2700 MPa. The Weibull modulus for
Nextel™ 720 fiber was also less than for Nextel™ 610 fiber, approximately 7.1
and 8.1 for lots A0080 and A0174, respectively (Table 4)
3.2 Gauge Length Effects
The mean tensile strength of four lots of Nextel™ 610 fiber and one lot of
Nextel™ 720 fiber as a function of gauge length is given in Figures 5 and 6,
respectively. Ten filaments were measured for each data point. For Nextel™
610 fiber, the scatter in the data was large enough that the mean strength for all
four lots was used to calculate Weibull modulus. For both types of fiber, the
reduction of strength with increasing gauge length was small. For Nextel™ 610
fiber, mean fiber strength decreased only 10% (from 3080 to 2780 MPa) for a
10-fold increase in gauge length. For some individual lots, the measured tensile
strength actually increased with gauge length. This amount of variability was
not surprising, since the coefficient of variation in mean tensile strength averaged
about 0.1 or 10% for these fibers, equal to the variation in strength over the
gauge length tested. Using the mean strength, the Weibull modulus for Nextel™
610 and Nextel™ 720 fiber were 22 and 26, respectively. This is substantially

higher than the Weibull modulus measured from the distribution of tensile
strength.
3.3 Diameter Effects
Commercial ceramic fibers do not have a completely uniform diameter
throughout all fibers in a bundle or tow. Because diameter varies from fiber to
fiber, testing fibers at constant gauge length does not maintain a constant tested
volume. The distribution of volumes is proportional to the distribution of fiber
diameters.
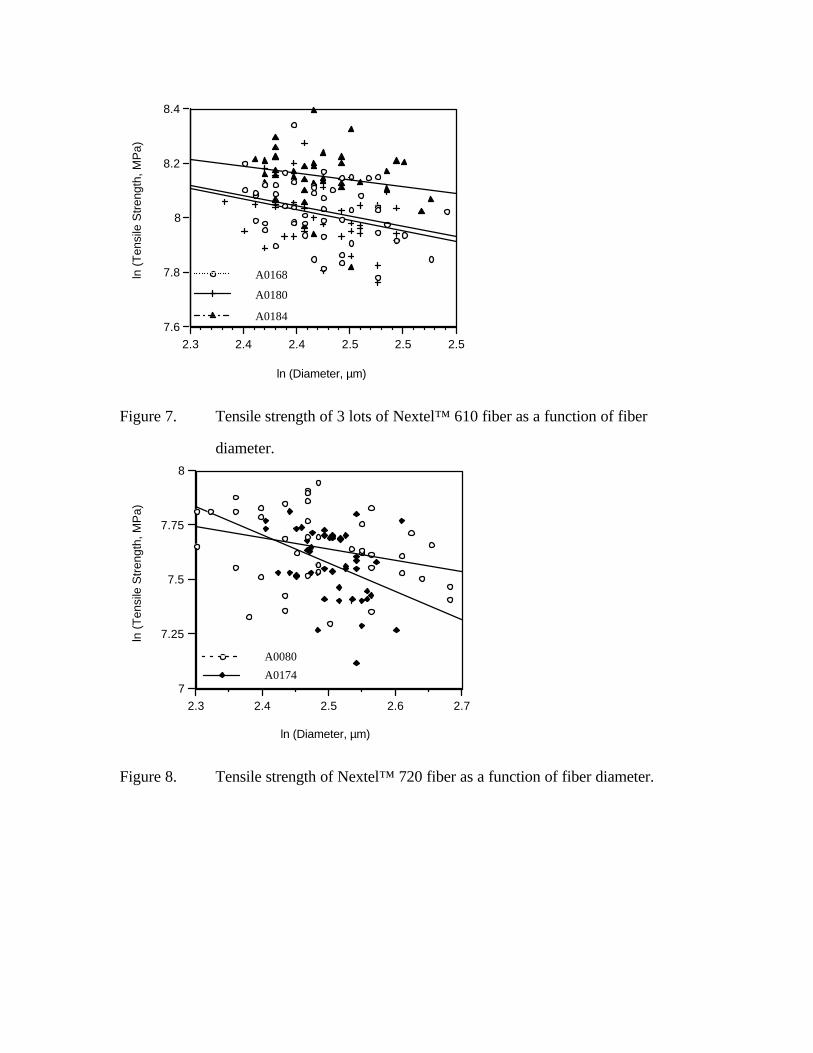
The natural log of tensile strength as a function of the natural log of fiber
diameter for Nextel™ 610 and Nextel™ 720 fiber is plotted in Figures 7 and 8,
respectively. As given in Equation 8, the slope of the best fit line is equal to -
2/m. For Nextel™ 610 fiber, the Weibull modulus calculated using this data for
all three lots was between 2.6 and 4. The scatter in this data was large;
however, the trend was very consistent. A large amount of scatter is expected
due to the statistical nature of fracture. The trend was also similar for other data
not presented here; thus, the result is believed to be reliable despite the scatter.
For Nextel™ 720 fiber, the Weibull modulus was 4.0 and 1.6 for lots A0080 and
A0174, respectively. For both Nextel™ 610 and 720 fibers, this value was much
lower than determined using the other methods. In both cases, the low m
indicated a stronger dependence of strength on diameter than the gauge length
measurements. Tables 3 and 4 summarize the Weibull modulus results using all
analysis methods.
4. Discussion
The tensile strength of Nextel™ 610 fiber is by far the highest strength measured
for any polycrystalline oxide fiber. Other commercially available oxide fibers
have reported tensile strengths of no more than 2.1 GPa [9]. Early lots of
Nextel™ 610 fiber (pre-1993) had tensile strengths near 2.5 GPa, better than
other commercial materials, but lower than target properties for MMC
reinforcements. Fractography experiments on early versions of Nextel™ 610
fiber identified several types of fracture origins, including internal inclusions
caused by both inorganic and organic particulate contamination, surface welding
and other surface damage [10]. Process development work targeted the
elimination of these flaws as a method of increasing fiber strength. These efforts
were successful; improvements in process cleanliness during precursor
preparation and improved fiber processing techniques since that time have
resulted in significantly increased single filament strength.
The measured Weibull modulus of Nextel™ 720 fiber and especially, Nextel™
610 fiber was also much higher than most multifilament ceramic fibers. For
instance, Weibull moduli for Nicalon are 3-4 [11-13], Fiber FP 4-6 [12-16],
Altex 4-6 [17,18], and carbon fibers 3-8 [19-22]. For early lots of Nextel™ 610
fibers, it was also found that the Weibull modulus was below 10 [23]. As
process development work eliminated large flaws and increased tensile strength,
the Weibull modulus also increased. This is not surprising, since eliminating large
flaws from a population of defects will leave only the small flaws remaining.
This would narrow the flaw size distribution, resulting in increased Weibull
modulus. Fractography experiments also confirmed that flaw size for recent lots
was reduced compared with earlier, weaker fibers. The correlation between high
fiber strength and high Weibull modulus has been noted previously [5].
The three Weibull modulus measurement techniques investigated in this study
produced very different results. For both Nextel™ 610 and Nextel™ 720 fibers,
the calculated Weibull modulus was much higher with the gauge length method
than with the Weibull plot method, which was in turn much higher than the
diameter method. Thus, it is clear that the simple two-parameter Weibull model
does not describe the tensile strength statistics of either fiber. Specifically, the
Weibull modulus determined from the statistics of fracture at one gauge length
cannot be used to determine strength at other gauge lengths or for fibers with
different diameters. An examination of the literature for ceramic fibers finds that
large differences in Weibull modulus for the gauge length and strength
distribution technique are common. The Weibull modulus has been determined
to be a factor of 2 higher with the gauge length technique than the strength
distribution technique for Fiber FP and PRD-166 [15], Nicalon [13], and carbon
fibers [24,25]. The reason for this phenomenon is not fully understood.
However, some speculation on possible causes may be useful.
It is not commonly understood that fiber diameter variability will have an effect
on measured Weibull modulus. Weibull theory predicts that fibers with larger
diameter should, on average, have a greater chance to have a large flaw, and will
therefore be weaker than smaller fibers. This is well understood. However, for
fiber testing, it has special relevance. Because there is a distribution of individual
fiber diameters within a tow, the tested volume will vary even when the tested
gauge length is constant. Thus, the measured strength distribution will be
created by the overlap of the dispersion of strength due to the volumetric
distribution of flaws and due to the variable fiber volume. Because of this effect,
the natural distribution of fiber strength will be artificially broadened, lowering
the measured Weibull modulus. Initially, it was suspected that the measured
Weibull modulus of 12 for Nextel 610™ fibers at 25 mm gauge length could
have resulted from the combined effect of a gauge length Weibull modulus of 22
with a diameter Weibull modulus of 3. To determine the viability of this
hypothesis, a few simple calculations were made. The width of overlapping
distributions can be calculated using the following equation:
CVtotal2 = CV12 + CV22 (10)
Where CV1 and CV2 are the coefficient of variations of population 1 and 2,
respectively. For Nextel 610™ fibers, the coefficient of variation in fiber
diameter was 0.046. This is equivalent to a 9.4% variation in volume. For a
Weibull modulus (relative to diameter variation) of 3, Equation 5 predicts a
change in strength of 3.0% for a 9.4% change in volume. For m = 22, the CV
will be 0.0545 (from Eq. 9). Combining the CVs with Eq. 10, the measured CV
would be �(0.0545 2 + 0.032) = 0.0624, equivalent to m = 19.2. This is a
change of 13% from the "true" value of 22. However, it does not accurately
predict the measured value of 12. Therefore, this effect does not explain the
observed results. Note, however, that this effect could become quite important
if the diameter variability were larger. The diameter distributions of other
ceramic fibers can be as much as 15% [9,13]. For a diameter CV of 0.15, the
combined Weibull modulus using m = 3 and 22, as above, would be �(0.0545 2
+ 0.09762) = 0.112. This is equivalent to m = 10.7, or only about 50% of the
"true" Weibull modulus. This is a significant change.
An initial attempt to treat this effect analytically was made by Wagner [26,27].
A three-parameter model for Weibull modulus using an additional parameter δ to
take into account the effect of fiber diameter was proposed:
P = 1-exp[-(D/Do)δ(σ/σo)m] (11)
Where δ is a parameter similar to Weibull modulus and Do is a scaling
parameter. Wagner assumed that the parameter δ was equal to 2/m, as predicted
by the Weibull equations for volume flaws. This equation was also used by
Masson [20]. In that study, δ was allowed to take any value; it was found that δ
was typically as large or larger than m, but the scatter was also large. However,
in both cases, Equation 10 was found to provide improved fit to the
experimental data. Potentially, this equation could be extended to gauge length
variation as well, with a third experimental parameter. However, this would add
considerable complication to the Weibull theory. Because of this, and since
these effects were not large enough to explain the results with Nextel fibers, no
attempt was made to calculate δ in this study.
Diameter measurement error could also produce significant changes in measured
Weibull modulus. If, because of measurement errors, some fibers are measured
to have smaller diameters than they actually have, erroneously high strength
values will be generated. Conversely, erroneously large diameter measurements
will produce low strength values. Thus, the consequence of this phenomenon is
that the strength distribution at a single gauge length will be broadened, so the
Weibull modulus will be underestimated. For instance, a mean diameter
measurement error of 5% would produce a CV in area and therefore measured
strength, of 10.25%. Using Equation 9, a CV in strength of 0.1025 corresponds
to a Weibull modulus of 11.7. Thus, even if the fiber had zero true variability,
the Weibull modulus would be less than that measured for Nextel 610. Note
that a 5% error in diameter measurement represents only 0.6 µm for a 12 µm
diameter fiber. Given that most fiber diameter measurements are done using
optical microscopes, this magnitude of error would not be unexpected, unless
special precautions are taken. Thus, extreme care must be taken to minimize
diameter measurement error. In this study, the measurement error was 0.1%.
This would produce a CV in strength of 0.0175. If the true Weibull modulus
was 22, the combined CV would be �(0.0545 2 + 0.01752) = 0.0572, equivalent
to m = 21.0. This is only 5% less than the Weibull modulus in the absence of
measurement errors. Therefore, measurement error is not sufficient to explain
the observed differences in Weibull modulus.
If we assume that measurement error is not a factor, and diameter variability is
not large enough to explain the differences in measured Weibull modulus, then
what physical phenomenon could cause the Weibull modulus to be largest with
respect to gauge length variability, intermediate for the strength distribution, and
smallest for the diameter variability? This result suggests that the flaw
population is not random, but that 1) there are, on average, larger flaws in large
diameter fibers than predicted from their increased volume, and 2) there is a
broader flaw distribution between different fibers in a tow than the distribution
of flaws down the length of a single fiber. Considering situation 1), there are
several reasons why fiber diameter would be expected to have a stronger than
predicted effect on strength than gauge length. Experiments with large diameter
Nextel™ 610 fibers for titanium and intermetallic composites have demonstrated
that it is difficult to produce large diameter fibers using the Nextel™ process.
High strength continuous fibers with diameters as large as 20 µm have been
produced [28], but significant process changes were required. If these processes
are not performed correctly, critical defects, such as welds, blisters and voids,
were created during processing. In a single tow, all fibers are processed at
identical conditions. Thus, the larger fibers in the tow may have a larger
probability of incurring process-related damage than the smaller fibers. This
would produce the low Weibull modulus as measured by the diameter variability
method. However, note that the observed flaws in these fibers were primarily
welds, which are not related to pyrolysis problems (see below).
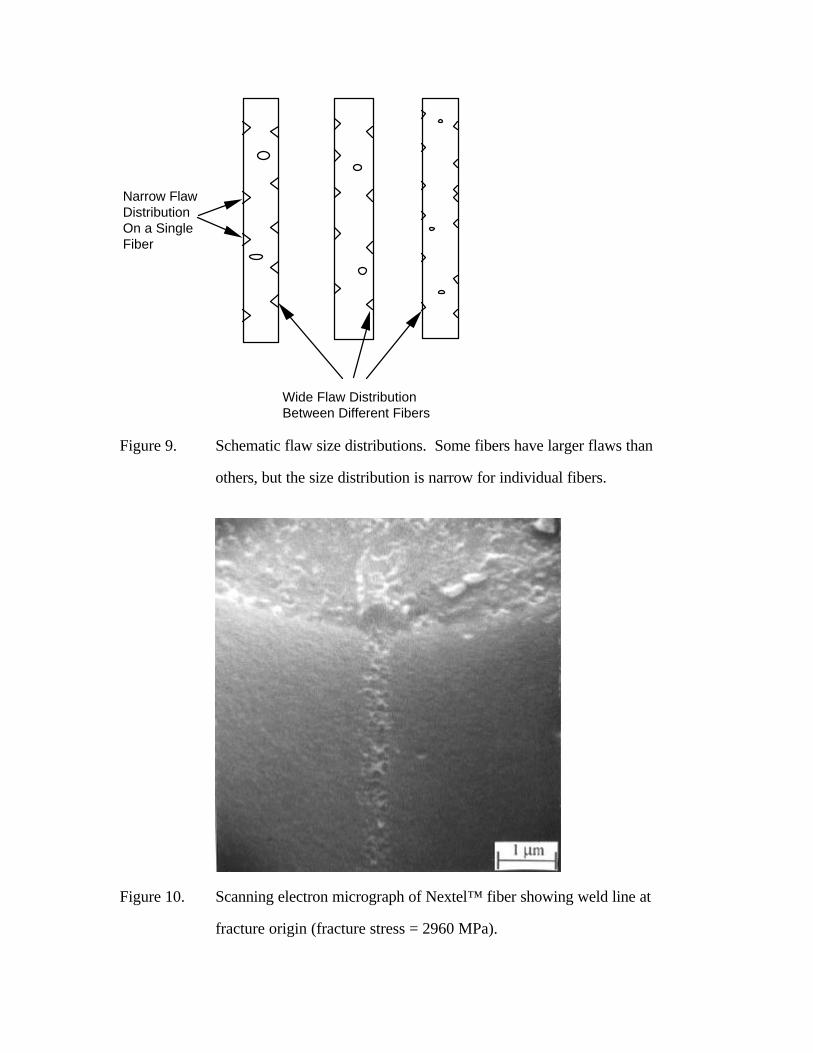
Situation 2, the prediction of variation in flaw population between different
fibers, is illustrated in Figure 9. In this scenario, each fiber would have a
separate and unique population of flaws. Some fibers would have a distribution
of relatively small flaws. Some fibers would have a distribution of larger flaws.
Thus, if one separated a number of fibers from the bundle and tested them, one
would get a wide strength distribution (and therefore low Weibull modulus),
since the flaw size on different fibers would be quite different. However, if one
tested fibers at different gauge lengths, the result would be a high Weibull
modulus. This is true since this measurement would have not be related to the
distribution of flaw size between fibers, but would correspond to the distribution
of flaws within individual fibers. The wide strength distribution between fibers
would be lost, since the mean strength at each gauge length, rather than the
distribution of strength, would be used for the analysis. The Weibull modulus as
determined from the strength distribution at a single gauge length would have an
intermediate value. This physical model would explain the observed results for
Nextel™ 610 and 720 fibers.

The question then arises: is there a plausible physical basis for this scenario? The
most common cause of fracture in Nextel™ 610 and 720 fibers are weld lines.
Figure 10 shows a Nextel™ 610 fiber with fracture originating at a weld line
(fracture stress = 2960 MPa). These are believed to result from contact between
adjacent fibers during processing, possibly during sintering. The size of the
flaws is typically < 0.5µm, as expected by simple calculation from the Griffith
fracture criterion using KIc = 4 for alumina. For fibers to form welds, they must
obviously be in contact with adjacent fibers. In a tow of 420 filaments, it would
be expected that some filaments would be touching and some would not. For
instance, the opportunities for fibers on the outside of the tow to touch
neighbors is less than in the center of the bundle. The severity of the weld would
then vary between fibers within a bundle. Conversely, the weld line may
produce a very narrow distribution of flaws down the length of the fiber. Of
course, for any given fiber, the weld tracks may start and stop at various points
down the length of the fiber. However, within the gauge length examined in this
study, welding may be consistent down the length of the fiber. Thus, it seems
possible that the scenario of Figure 9 may occur.
In earlier-generation Nextel™ 610 fibers, in addition to lower Weibull modulus,
the gauge length and standard deviation methods produced equal results [10].
However, this fiber had a different type of fracture origins [29]. Although welds
were also observed, particulate inclusions originating as contaminants in the fiber

precursor were a primary cause of fracture. In this case, defects would be
expected to be distributed randomly in the volume of the fibers, since each
particle would have an equal chance of being incorporated into any fiber. This
creates a situation where the Weibull theory, which assumes a random
distribution of flaws within the volume of the samples, is accurate. Thus, even
for a single fiber type such as Nextel™ 610, it is difficult to have a high degree
of confidence in extrapolating Weibull parameters without extensive test data,
including a detailed knowledge of the fracture origins. Perhaps it is not
surprising that the fracture statistics change with process modifications;
however, this illustrates the difficulty in using Weibull theory for mechanical
property prediction. Certainly, using Weibull theory without considering the
nature of the flaw distributions can lead to an incorrect extrapolation of fiber
properties.
5. Conclusions
The tensile strength of Nextel™ 610 and Nextel™ 720 fibers was determined to
be 3200 and 2100 MPa, respectively. The high strength and narrow strength
distribution of Nextel™ 610 was attributed to a reduction in flaw size due to
process improvements.
The Weibull modulus of both fibers was measured using three different
techniques. The Weibull modulus of Nextel™ 610 and Nextel™ 720 fibers was
22 and 26, respectively, when determined from the variability with changing

gauge length, 11.5 and 8, respectively, when determined from strength variability
at a single gauge length, and 3.1 and 2.8, respectively, when determined from
variability between fibers with different diameter. Thus, traditional two-
parameter Weibull statistics were not sufficient to describe the fracture statistics
of Nextel™ 610 and Nextel™ 720 fibers. Mechanisms for non-random fiber
flaw generation during fiber processing were proposed to explain the measured
effects.
The high Weibull modulus with respect to strength variability and gauge length
variation indicates the degree of consistency achieved during fiber processing.
The effect of the low Weibull modulus with respect to diameter variation is of
minor practical importance because the diameter size variability was small.
Acknowledgments
The assistance of Dave Lueneburg, Steve Lieder, and Margaret Vogel-Martin in
fiber test development as well as Dave Jensen and Robinson Vo at 3M and Alan
Seid and Christy Schramm at Touchstone Research Laboratories in fiber testing
is gratefully appreciated.
References
1. H.E. DEVE and C. McCULLOUGH, J. of Met., 47 (1995) 33-37 .

2. D.M. WILSON, D.C. LUENEBURG, and S.L. LIEDER, Ceram. Eng. Sci. Proc., 14
(1993) 609-621.
3. D.M. WILSON, S.L. LIEDER, and D.C. LUENEBURG, Materials Research Society
Symposium Proceedings, Vol. 350, Intermetallic Matrix Composites III, edited by
J.A. Graves, R.R. Bowman, and J.J. Lewandowski (Mat. Res. Soc., Pittsbury, PA,
1994) pp. 89-98.
4. D.M. WILSON, S.L. LIEDER, and D.C. LUENEBURG, Cer. Eng. Sci. Proc., 16
(1995) 1005-1014.
5. S. VAN DER ZWAAG, J. Test Eval., 17 (1989) 292-298.
6. A. KELLY and N.H. MACMILLAN, "Strong Solids", 3rd ed. (Clarenden Press,
Oxford, 1986).
7. B. BERGMAN, J. Mat. Sci. Ltrs., 5 (1986) 611-614.
8. J. K. WEDDELL, J. Text. Inst., 81 (1990) 333-59.
9. B. BERGMAN, J. Mat. Sci. Ltrs., 3 (1984) 689-692.
10. M.M. VOGEL-MARTIN and D.M. WILSON, NASA Conf. Publ. 3175, part 2, 1992,
16th Annual Conference on Metal Matrix Carbon and Ceramic Matrix Composites,
pp. 519-533.
11. H.F. WU and A.N. NETRAVALI, J. Mat. Sci., 27 (1992) 3318-3324.
12. Y. MATSUO, J.X. LI, and S. KIMURA, Adv. Comp. Mat., 2 (1992) 17-28.
13. G. SIMON and A.R. BUNSELL, J. Mat. Sci., 19 (1984) 3649-3657.
14. J. NUNES, Comp. Techn. Rev., 5 (1983) 53-60.
15. V. LAVASTE, J. BESSON, and A.R. BUNSELL, J. Mat. Sci., 30 (1995) 2042-2048.
16. S.N. PATANKAR, J. Mat. Sci. Ltrs., 10 (1991) 1176-1181.
17. Ch. LESNIEWSKI, C. AUBIN, AND A.R. BUNSELL, Comp. Sci. and Tech., 37
(1990) 63-78.
18. K. JAKUS and V. TULLURI, Ceram. Eng. Sci. Proc., 10 (1989) 1338-1349.
19. Y. TANABE, E. YASUDA, and A.R. BUNSELL, Y. Favry, M. Inagaki, and M.
Sakai, J. Mat. Sci., 26 (1991) 1601-1604.
20. J.J. MASSON, K. SCHULTE, F. GIROT, and Y. LE PETITCORPS, Mat. Sci. Eng.,
A135 (1991) 59-63.
21. S-H. OWN, R.V. SUBRAMANIAN, and S.C. SAUNDERS, J. Mat. Sci., 21 (1986)
3912-3920.
22. J. BREEDON JONES, J.B. BARR, and R.E. SMITH, J. Mat. Sci., 15 (1980) 2455-
2465.
23. Z.R. XU, K.K. CHAWLA, and X. LI, Mat. Sci. Eng., A171 (1993) 249-256.
24. El.M. ASLOUN, J.B. DONNET, G. GUILPAIN, M. NARDIN, and J. SCHULTZ,J.
Mat. Sci., 24 (1989) 3504-3510.
25. J.W. HITCHON and D.C. PHILLIPS, Fiber Sci. and Tech., 12 (1979) 217-233.
26. H. D. WAGNER, S. L. PHOENIX, and P. SCHWARTZ, J. Comp. Mat., 18 (1984)
312-338.
27. H.D. WAGNER, J. Poly. Sci.: Part B: Polymer Physics, 27 (1989) 115-149.
28. M.A. LEITHEISER and D.M. WILSON, Alumina Fiber Development NASP
Materials/Structures Maturation Program, Phase II Final Report, February, 1991.
29. D. M. WILSON, NASA Conference Proc. 3097, Part 1, 14th Annual Conference on
Metal Matrix Carbon and Ceramic Matrix Composites, edited by J. Buckley. pp 105-
117.
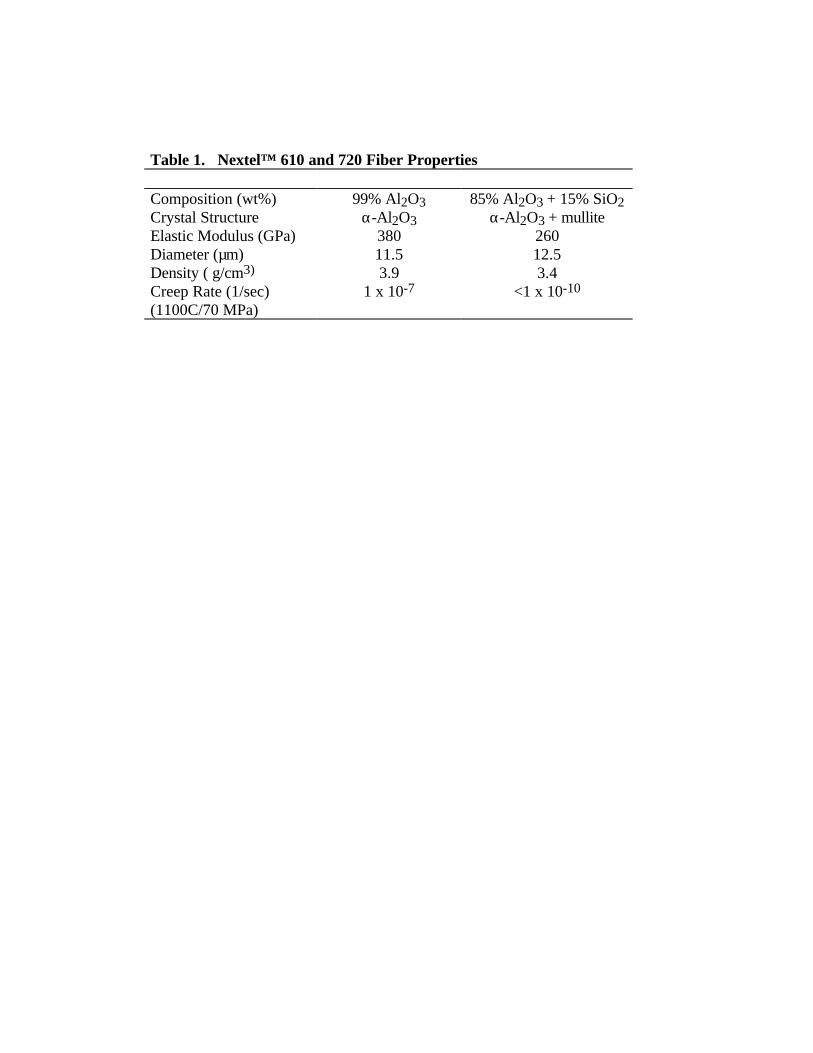
Table 1. Nextel™ 610 and 720 Fiber Properties
Composition (wt%) 99% Al2O3 85% Al2O3 + 15% SiO2Crystal Structure α-Al2O3 α-Al2O3 + mulliteElastic Modulus (GPa) 380 260Diameter (µm) 11.5 12.5Density ( g/cm3) 3.9 3.4Creep Rate (1/sec)(1100�C/70 MPa)
1 x 10⁻⁷ <1 x 10⁻¹⁰

Table 2. Nextel™ 610 and 720 Fiber Tensile Data Nextel™ 610 Fiber (A0168) Nextel™ 720 Fiber (A0172)
Fiber Strength
Fiber Strength
Load(g)
Dia.(µm)
(MPa) Load(g)
Dia.(µm)
(MPa)
28.5 11.0 2944 26.4 12.3 219932.8 11.3 3206 26.3 12.3 218532.3 12.1 2751 22.6 12.3 188231.6 11.3 3089 23.3 11.1 235833.0 11.0 3406 22.5 11.1 228232.9 11.2 3275 24.6 11.6 228227.6 11.5 2606 26.4 12.3 219229.3 11.6 2723 21.4 12.4 174425.3 11.3 2475 23.1 11.8 206128.9 11.1 2930 21.1 12.6 164826.8 11.5 2530 26.6 12.1 226127.2 11.9 2399 20.1 12.4 164133.4 12.2 2806 22.3 12.1 189632.1 11.9 2827 24.1 12.5 192330.2 11.3 2951 21.0 11.9 186126.2 10.7 2854 23.9 12.5 190328.4 11.0 2930 21.5 12.0 186825.8 11.2 2565 16.6 12.0 144127.6 11.1 2799 23.7 11.9 209630.1 11.0 3102 26.6 12.3 221336.6 11.5 3454 22.9 12.9 171740.6 11.0 4185 25.5 12.7 197235.1 11.9 3095 22.1 12.9 165529.2 10.6 3247 22.8 13.0 168230.9 10.7 3371 27.6 12.5 220634.4 11.4 3302 21.5 12.8 164136.2 11.3 3544 19.2 12.8 146238.5 11.8 3454 15.9 12.7 123439.3 11.9 3468 20.9 13.5 143435.5 11.7 3233 31.4 12.7 243432.2 12.5 2571 23.1 11.8 206829.4 10.6 3268 19.1 11.3 186828.6 11.3 2792 22.3 12.0 193733.6 12.0 2916 26.9 13.1 195829.7 11.1 3006 25.9 12.1 220633.5 10.9 3523 24.1 11.8 215826.6 10.6 2958 25.4 11.9 224129.7 10.9 3123 26.1 11.5 2468
26.9 10.7 2930 19.8 11.6 184125.1 10.8 2689 19.8 11.6 183434.9 11.9 3075 24.6 12.7 190333.5 11.2 3337 26.0 12.2 217937.4 11.6 3468 25.8 12.7 199930.4 10.8 3254 20.9 12.6 164139.5 12.7 3061 26.7 12.4 216532.2 10.5 3647 35.0 13.6 236529.1 10.5 3295 19.8 11.5 186831.5 11.5 2971 25.2 11.7 229633.1 11.6 3068 19.3 12.1 164831.5 10.8 3371 26.8 12.4 2179
Mean 31.5 11.3 3077 23.5 12.2 1964
St. Dev. 3.88 0.52 348 3.46 0.56 287
CV 0.123 0.046 0.113 0.147 0.045 0.146
Table 3. Weibull Properties of Nextel™ 610 fiberWeibull Modulus Calculation
Mean Strength Strength Diameter Gauge LengthLot MPa Distribution Distribution Dependence
A0168 3080 10.9 2.7 -A0180 3030 11.2 2.6 -A0184 3500 12.1 4.0 -
mean 3200 11.4 3.1 21.7
Table 4. Weibull Properties of Nextel™ 720 fiberWeibull Modulus Calculation
Mean Strength Strength Diameter Gauge LengthLot MPa Distribution Distribution Dependence
A0080 2130 7.1 4.0 -A0174 2030 8.1 1.6 26.4
mean 2080 7.6 2.8 -
Figure 1. Fracture probability of 3 lots of Nextel™ 610 fiber
Figure 2. Weibull plot for 3 lots of Nextel™ 610 fiber
Figure 3. Fracture probability for 2 lots of Nextel™ 720 fiber
Figure 4. Weibull plot for 2 lots of Nextel™ 720 fiber
Figure 5. Tensile strength of 4 lots of Nextel™ 610 fiber as a function of
gauge length. The line is the least squares fit of the mean
strength of all 4 lots.
Figure 6. Tensile strength Nextel™ 720 fiber as a function of gauge length.
Figure 7. Tensile strength of 3 lots of Nextel™ 610 fiber as a function of
fiber diameter.
Figure 8. Tensile strength of Nextel™ 720 fiber as a function of fiber
diameter.
Figure 9. Schematic flaw size distributions. Some fibers have larger flaws
than others, but the size distribution is narrow for individual
fibers.

Figure 10. Scanning electron micrograph of Nextel™ fiber showing weld
line at fracture origin (fracture stress = 2960 MPa).
0
0.2
0.4
0.6
0.8
1
Fra
ctur
e P
roba
bilit
y
2000 2500 3000 3500 4000 4500
Tensile Strength, MPa
A0180
A0184
A0168
Figure 1. Fracture probability of 3 lots of Nextel™ 610 fiber
-5
-4
-3
-2
-1
0
1
2
lnln
(1/(
1-P
))
7.6 7.8 8.0 8.2 8.4
ln (Tensile Strength, MPa)
A0180mean = 3030m = 11.2
A0168mean = 3080m = 10.9
A0184mean = 3500m = 12.1
Figure 2. Weibull plot for 3 lots of Nextel™ 610 fiber
0
0.2
0.4
0.6
0.8
1
Pro
babi
lity
1000 1500 2000 2500 3000
Tensile Strength, MPa
A0080
A0174
Figure 3. Fracture probability for 2 lots of Nextel™ 720 fiber
-5
-4
-3
-2
-1
0
1
2
lnln
(1/(
1-P
))
7.0 7.2 7.5 7.8 8.0
ln (Tensile Strength, MPa)
A0080mean = 2130m = 7.1
A0174mean = 2030m = 8.1
Figure 4. Weibull plot for 2 lots of Nextel™ 720 fiber

1000
10000
Ten
sile
Str
engt
h, M
Pa
10.0 100.0 1000.0
Gauge Length, mm
A0184
A0182
A0178
A0175
Figure 5. Tensile strength of 4 lots of Nextel™ 610 fiber as a function of gauge
length. The line is the least squares fit of the mean strength of all 4 lots.
1000
10000
Ten
sile
Str
engt
h, M
Pa
10.0 100.0 1000.0
Gauge Length, mm
A0174m = 26.4
Figure 6. Tensile strength Nextel™ 720 fiber as a function of gauge length.
7.6
7.8
8
8.2
8.4
ln (
Ten
sile
Str
engt
h, M
Pa)
2.3 2.4 2.4 2.5 2.5 2.5
ln (Diameter, µm)
A0180
A0184
A0168
Figure 7. Tensile strength of 3 lots of Nextel™ 610 fiber as a function of fiber
diameter.
7
7.25
7.5
7.75
8
ln (
Ten
sile
Str
engt
h, M
Pa)
2.3 2.4 2.5 2.6 2.7
ln (Diameter, µm)
A0174
A0080
Figure 8. Tensile strength of Nextel™ 720 fiber as a function of fiber diameter.
Narrow Flaw Distribution On a Single Fiber
Wide Flaw Distribution Between Different Fibers
Figure 9. Schematic flaw size distributions. Some fibers have larger flaws than
others, but the size distribution is narrow for individual fibers.
Figure 10. Scanning electron micrograph of Nextel™ fiber showing weld line at
fracture origin (fracture stress = 2960 MPa).