statistical validation of scientific modelsrsmith/ma797v_s10/lecture12.pdf · validation: the...
TRANSCRIPT

Statistical Validation of Scientific Models
"When I use a word," Humpty Dumpty said, in a rather scornful tone, "it meansjust what I choose it to mean - neither more nor less,” Through the Looking Glass,Charles Lutwidge Dodgson (Lewis Carroll).
Examples of Scientific Accidents and their Reasons
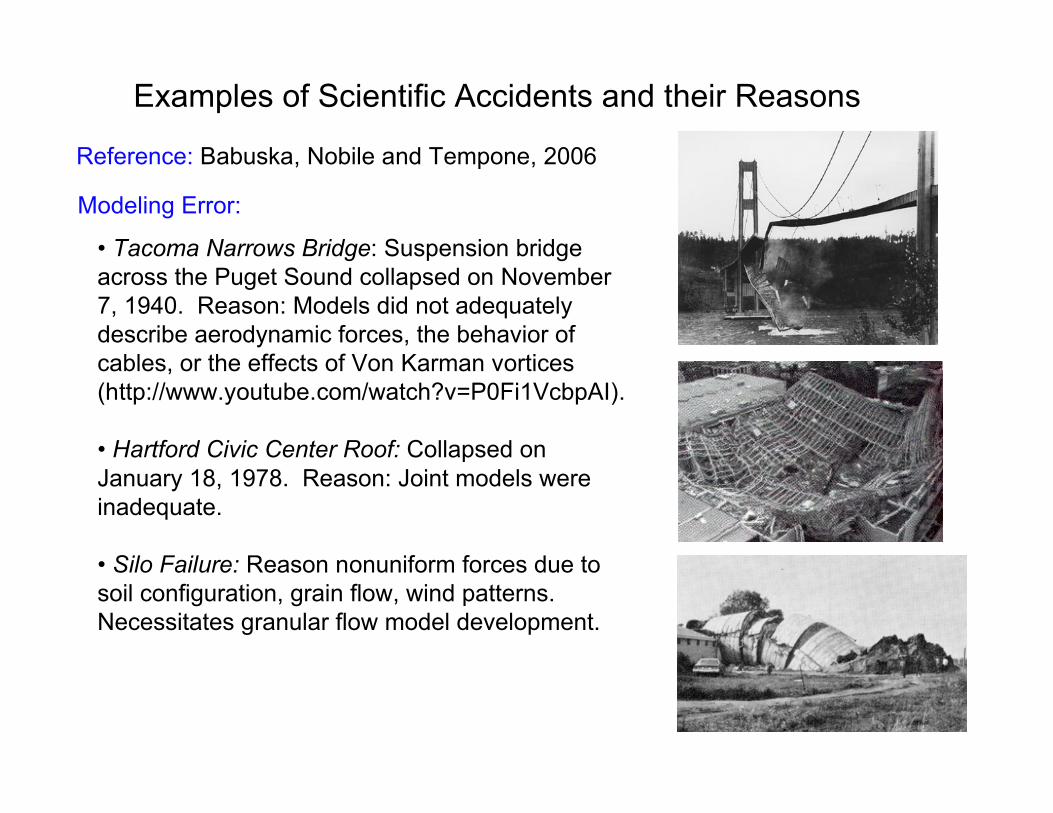
Modeling Error:
Reference: Babuska, Nobile and Tempone, 2006
• Tacoma Narrows Bridge: Suspension bridgeacross the Puget Sound collapsed on November7, 1940. Reason: Models did not adequatelydescribe aerodynamic forces, the behavior ofcables, or the effects of Von Karman vortices(http://www.youtube.com/watch?v=P0Fi1VcbpAI).
• Hartford Civic Center Roof: Collapsed onJanuary 18, 1978. Reason: Joint models wereinadequate.
• Silo Failure: Reason nonuniform forces due tosoil configuration, grain flow, wind patterns.Necessitates granular flow model development.
Examples of Scientific Accidents and their Reasons
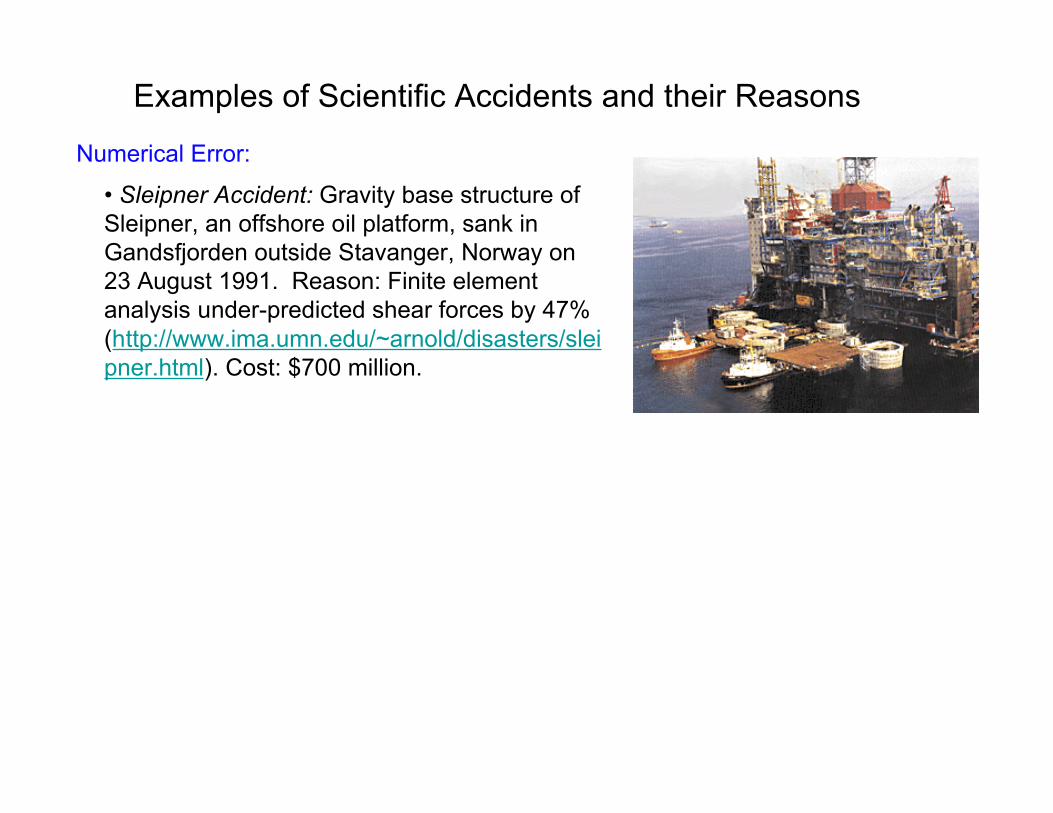
Numerical Error:
• Sleipner Accident: Gravity base structure ofSleipner, an offshore oil platform, sank inGandsfjorden outside Stavanger, Norway on23 August 1991. Reason: Finite elementanalysis under-predicted shear forces by 47%(http://www.ima.umn.edu/~arnold/disasters/sleipner.html). Cost: $700 million.
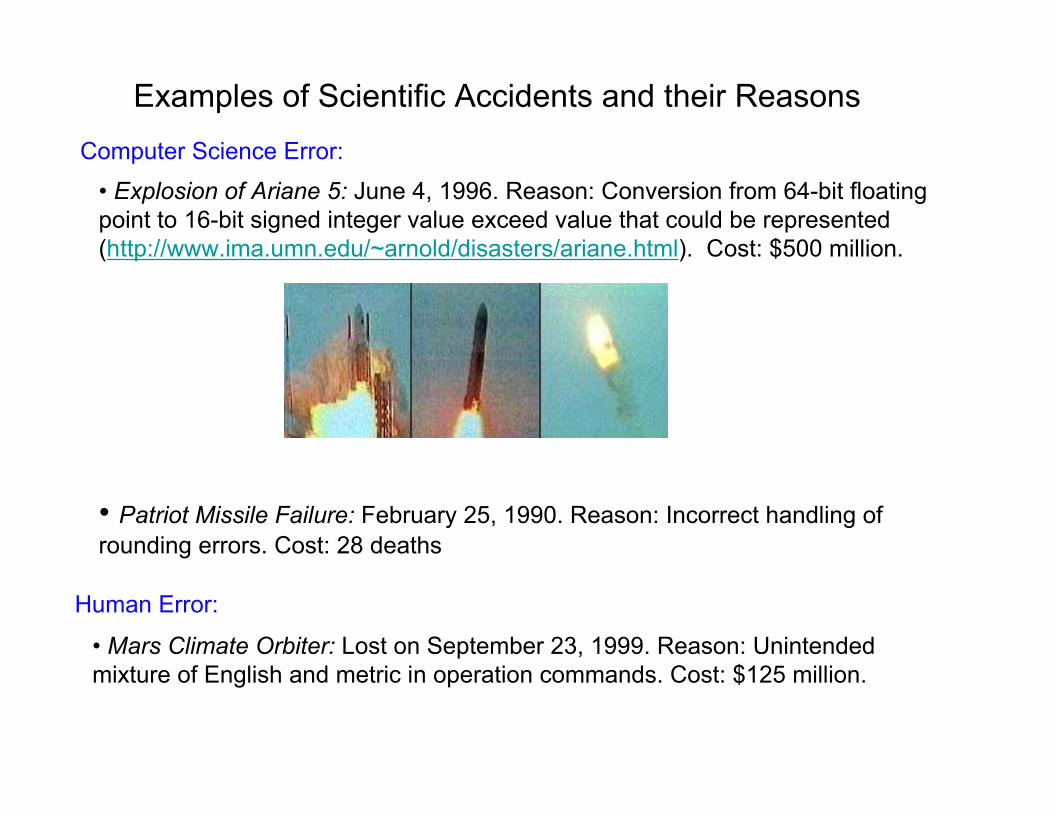
Examples of Scientific Accidents and their ReasonsComputer Science Error:
Human Error:
• Explosion of Ariane 5: June 4, 1996. Reason: Conversion from 64-bit floatingpoint to 16-bit signed integer value exceed value that could be represented(http://www.ima.umn.edu/~arnold/disasters/ariane.html). Cost: $500 million.
• Patriot Missile Failure: February 25, 1990. Reason: Incorrect handling ofrounding errors. Cost: 28 deaths
• Mars Climate Orbiter: Lost on September 23, 1999. Reason: Unintendedmixture of English and metric in operation commands. Cost: $125 million.
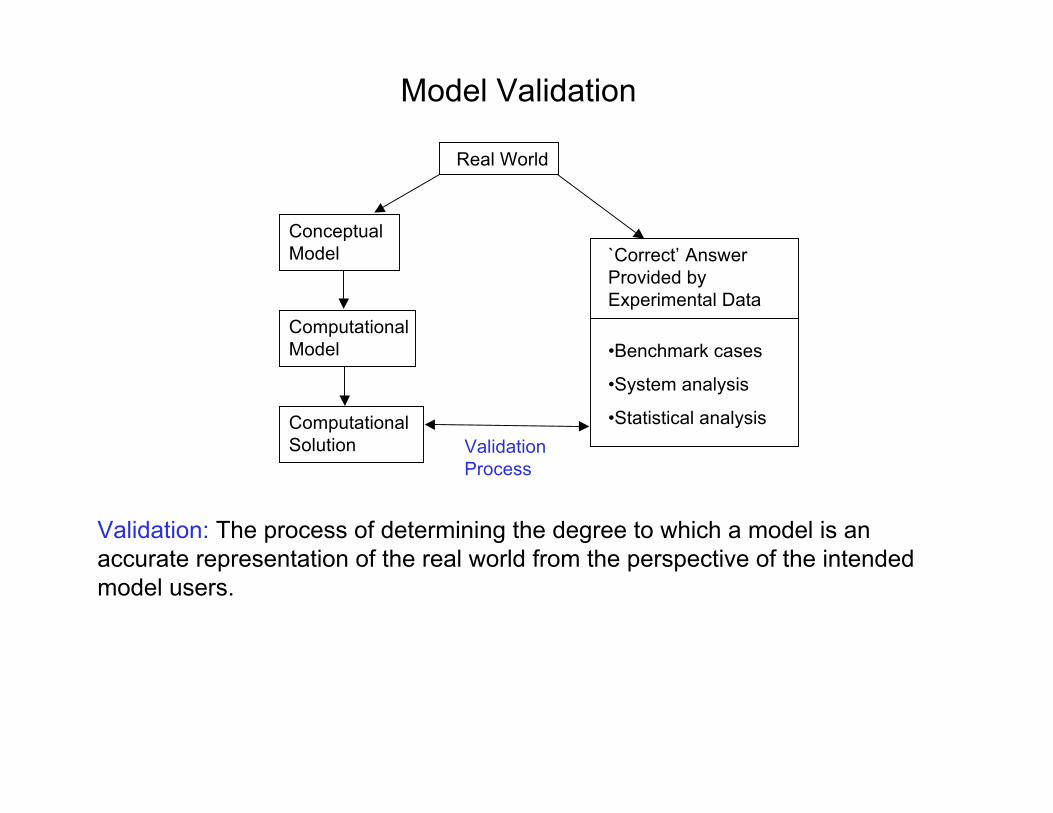
Model Validation
Validation: The process of determining the degree to which a model is anaccurate representation of the real world from the perspective of the intendedmodel users.
ValidationProcess
Real World
ConceptualModel
ComputationalModel
ComputationalSolution
`Correct’ AnswerProvided byExperimental Data
•Benchmark cases
•System analysis
•Statistical analysis
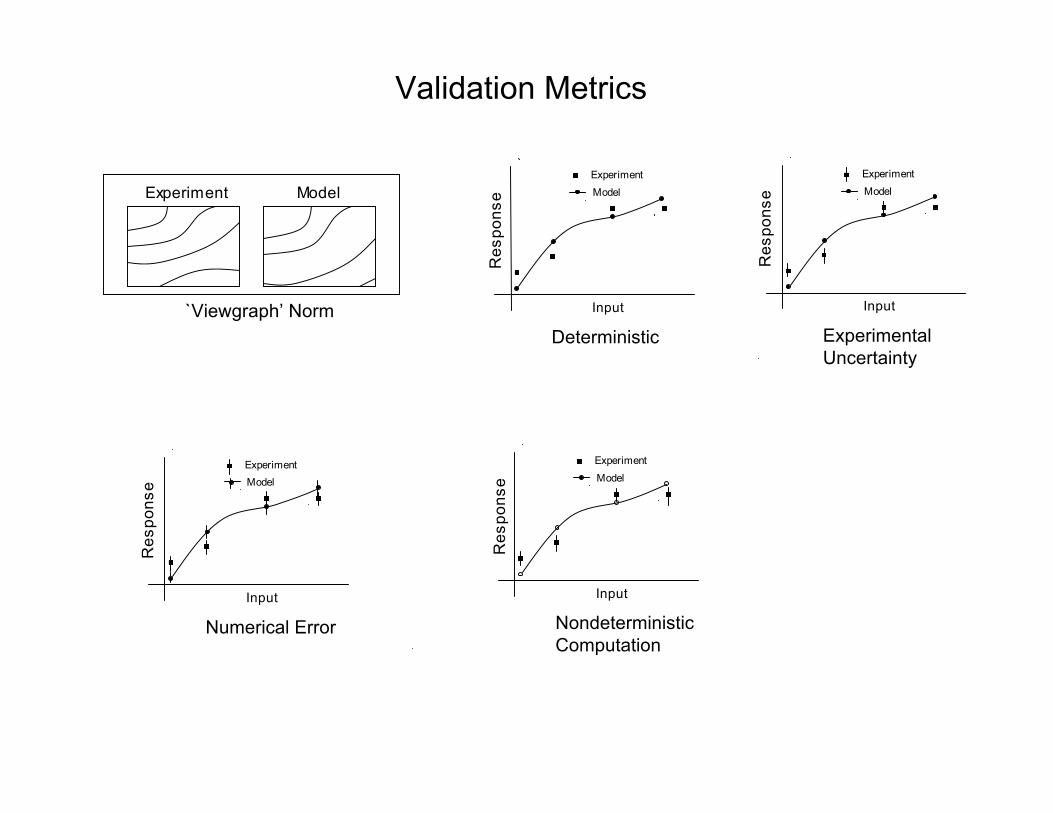
Validation Metrics
Experiment Model
`Viewgraph’ Norm Input
Res
pons
e
Experiment
Model
Deterministic
Input
Res
pons
e
Experiment
Model
ExperimentalUncertainty
Input
Res
pons
e
ExperimentModel
Numerical Error
Input
Res
pons
e
Experiment
Model
NondeterministicComputation
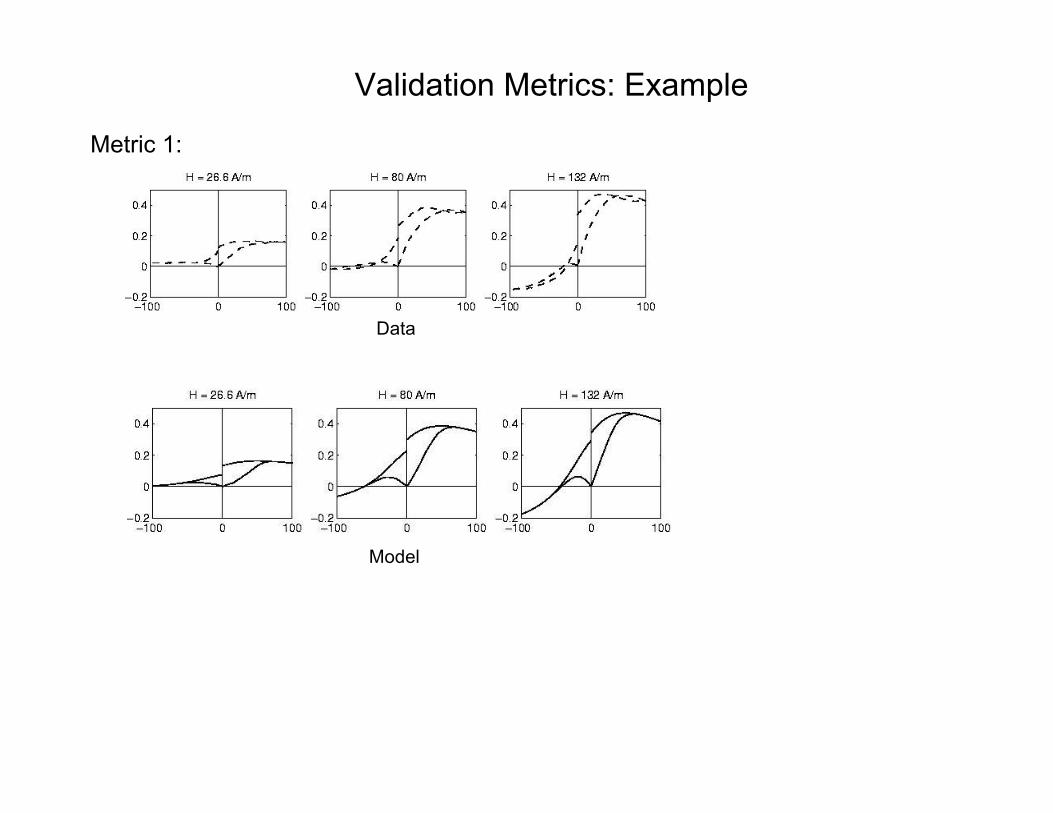
Validation Metrics: Example
Metric 1:
Data
Model
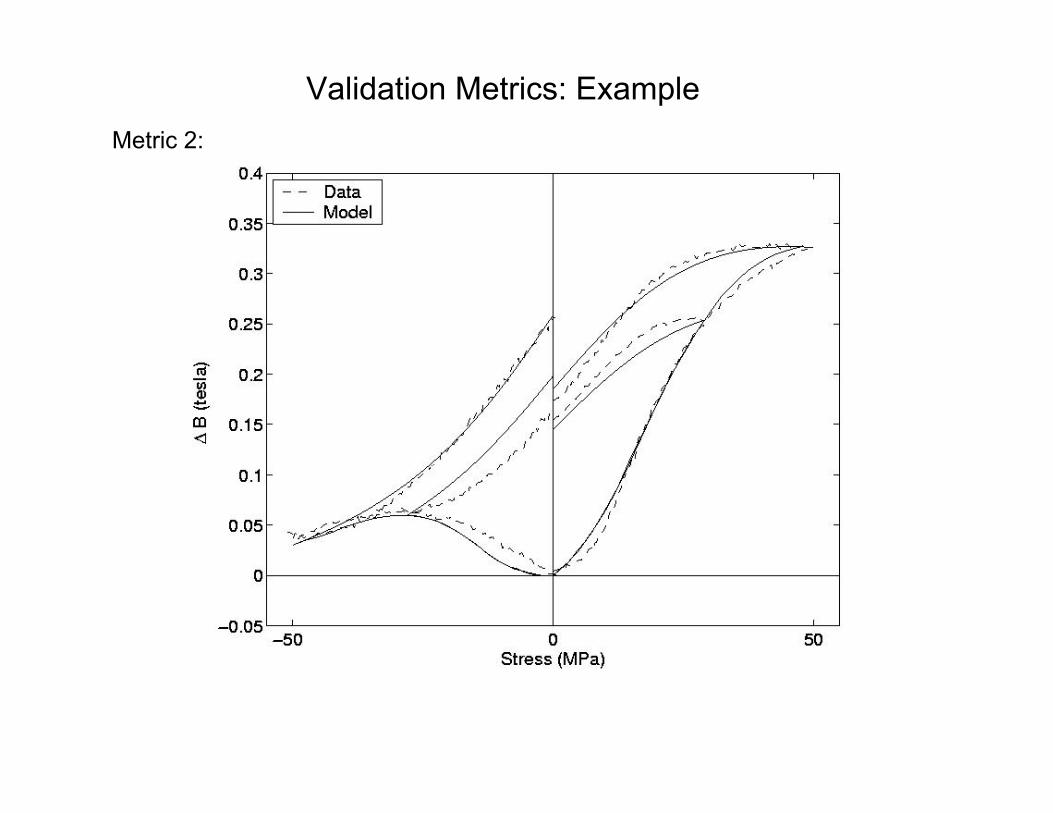
Validation Metrics: ExampleMetric 2:

Difficulties with Using Existing Experimental Data for Validation
1. Incomplete documentation of experimental conditions
• Boundary and initial conditions
• Material properties
• Geometry of the system
2. Limited documentation of measurement errors
• Lack of experimental uncertainty estimates
Note: It is critical that modelers, numerical analysts, andexperimentalists work together
Reference: Oberkampf, Trucano and Hirsch 2004
Two Approaches:
Validation Strategies
1. Perform the experiment, independently, multiple times. If theexperiments are truly independent, make estimates regarding thestatistics of the uncertainty.
-- Multiple, independent, validation experiments are often infeasible
2. Given estimates of pdf for parameters and input variables, determinehow uncertainty propagates through full experimental process
-- Termed `Validation Using Propagation of Uncertainty’
-- Often less expensive
-- Forces analysis of uncertainly in both models and experiments
Scientific Validation: Is the difference between model predictions and experimentalobservations significant relative to the uncertainty in the validation exercise?
Engineering Validation: Is the difference between model predictions andexperimental observations significant relative to the uncertainty in the validationexercise, plan an acceptable error?
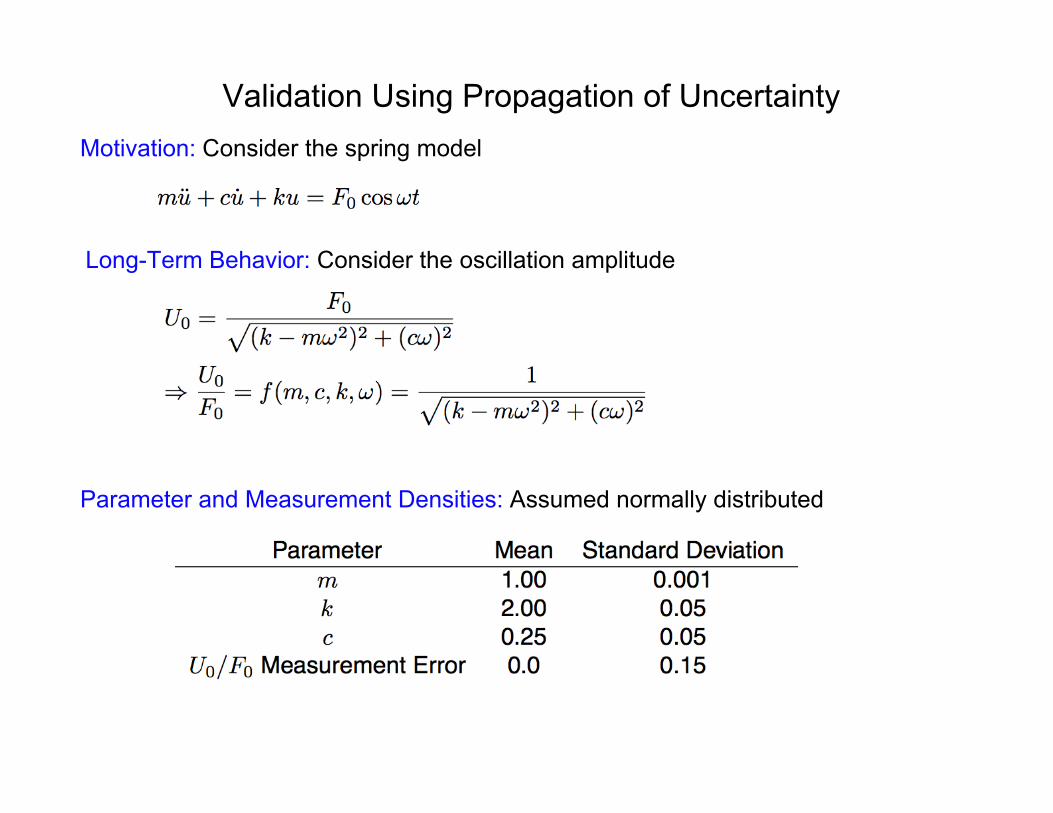
Validation Using Propagation of UncertaintyMotivation: Consider the spring model
Long-Term Behavior: Consider the oscillation amplitude
Parameter and Measurement Densities: Assumed normally distributed
Validation Using Propagation of Uncertainty
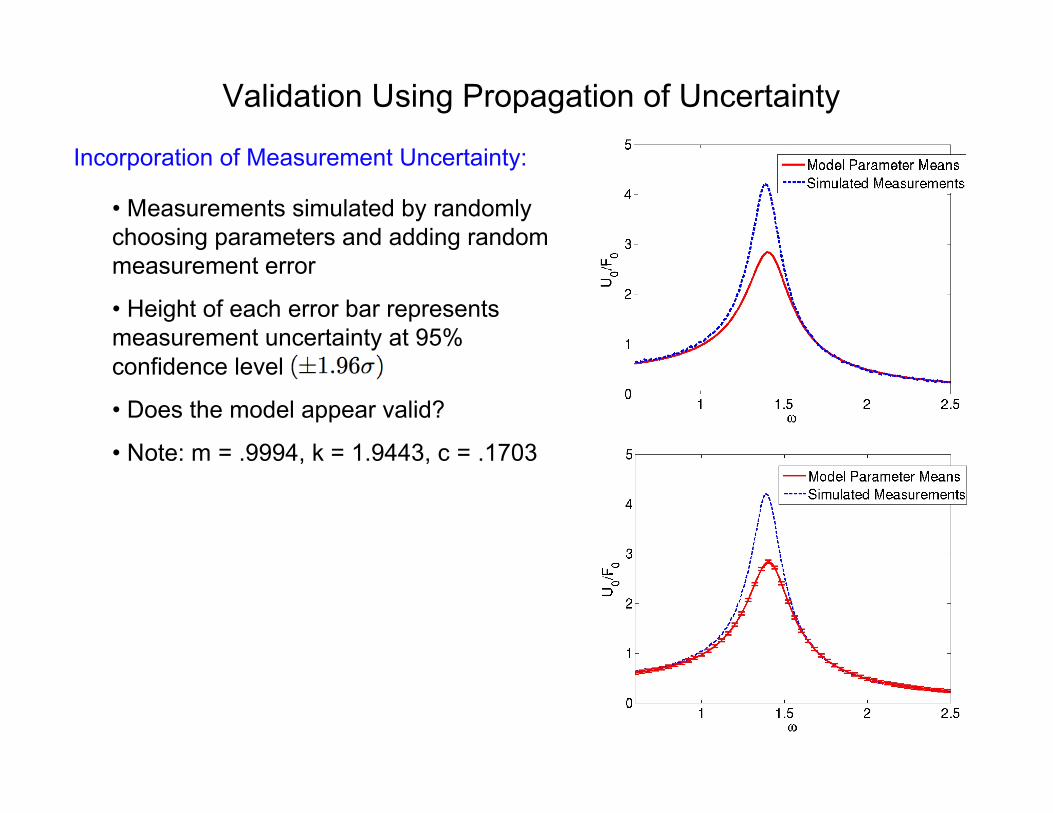
Incorporation of Measurement Uncertainty:
• Measurements simulated by randomlychoosing parameters and adding randommeasurement error
• Height of each error bar representsmeasurement uncertainty at 95%confidence level
• Does the model appear valid?
• Note: m = .9994, k = 1.9443, c = .1703

Validation Using Propagation of Uncertainty
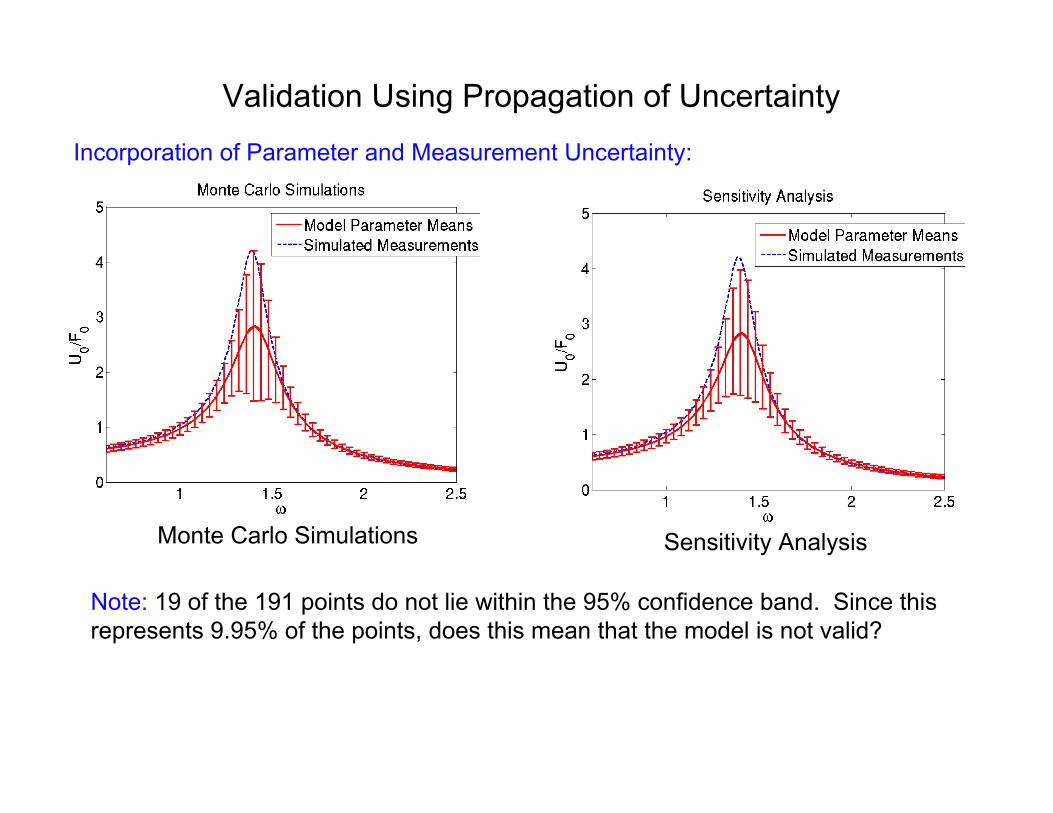
Incorporation of Parameter and Measurement Uncertainty:
Recall: Let X and Y be random variables and consider the sum
Properties:
Present Problem: Assume experimental measurements are independentfrom estimates for model parameters
Strategy: Use Monte Carlo simulations or sensitivity analysis to predict 95%confidence level for model predictions and add to standard deviation formeasurement uncertainty.
Validation Using Propagation of Uncertainty
Incorporation of Parameter and Measurement Uncertainty:
Monte Carlo Simulations Sensitivity Analysis
Note: 19 of the 191 points do not lie within the 95% confidence band. Since thisrepresents 9.95% of the points, does this mean that the model is not valid?
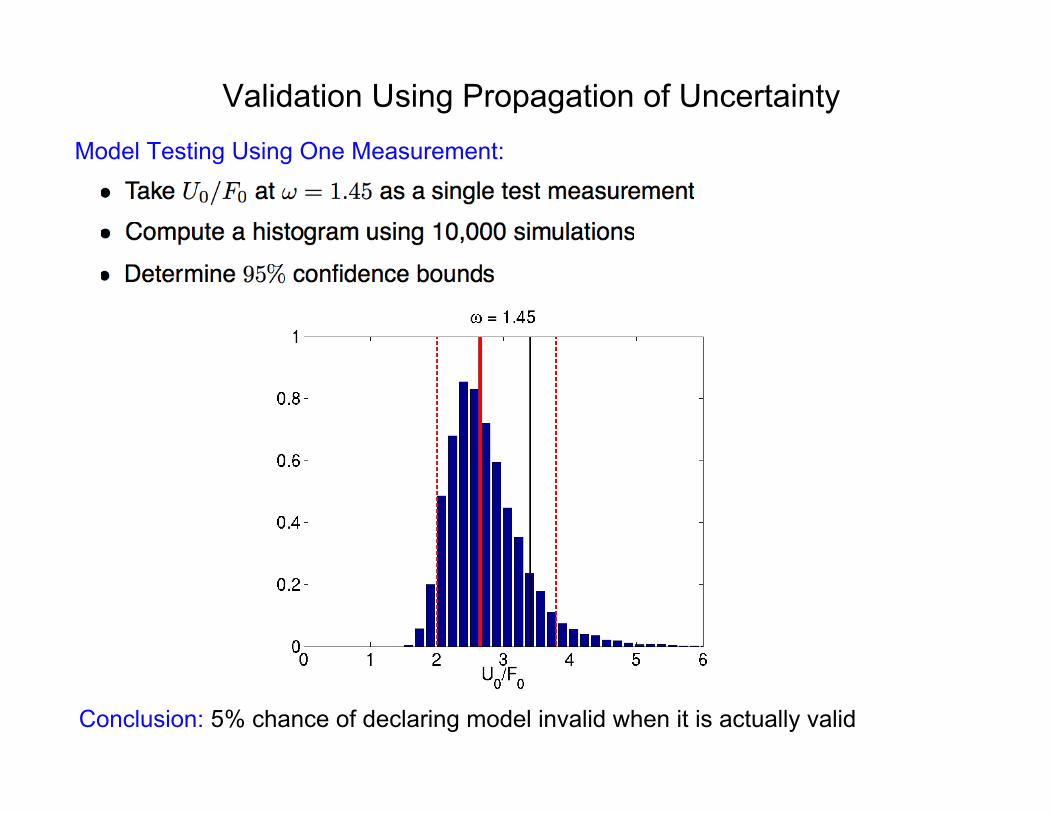
Validation Using Propagation of UncertaintyModel Testing Using One Measurement:
Conclusion: 5% chance of declaring model invalid when it is actually valid
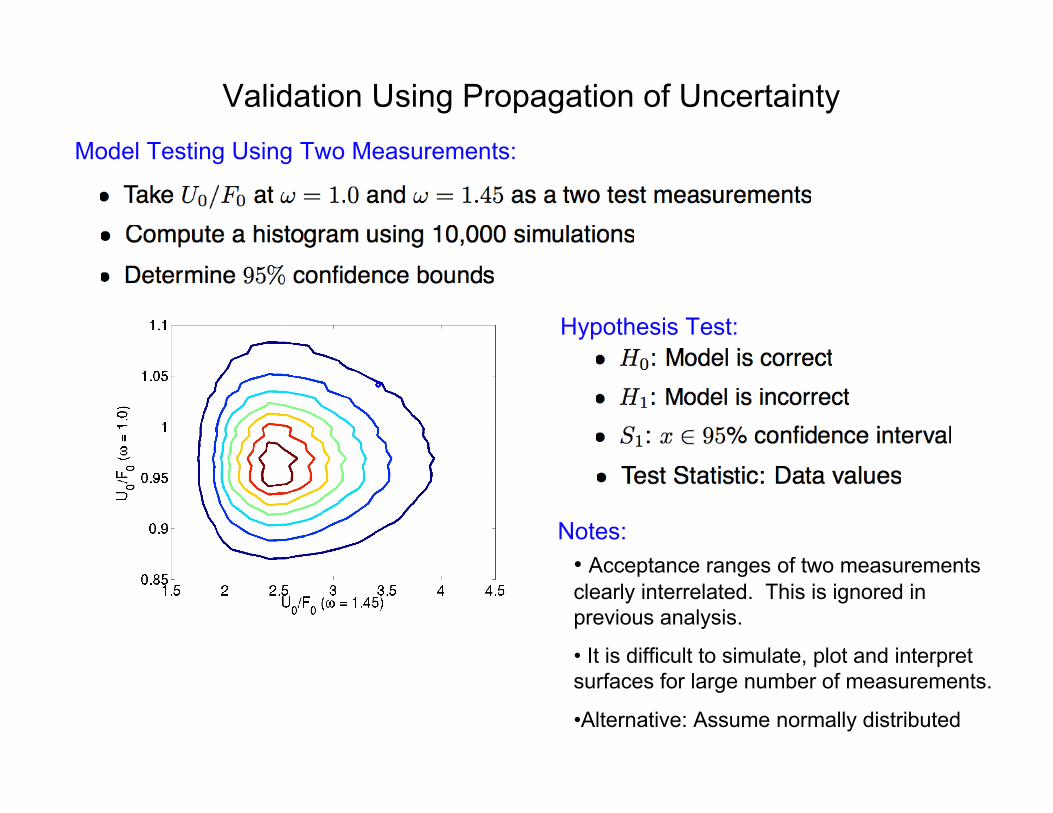
Validation Using Propagation of UncertaintyModel Testing Using Two Measurements:
Hypothesis Test:
Notes:• Acceptance ranges of two measurementsclearly interrelated. This is ignored inprevious analysis.
• It is difficult to simulate, plot and interpretsurfaces for large number of measurements.
•Alternative: Assume normally distributed
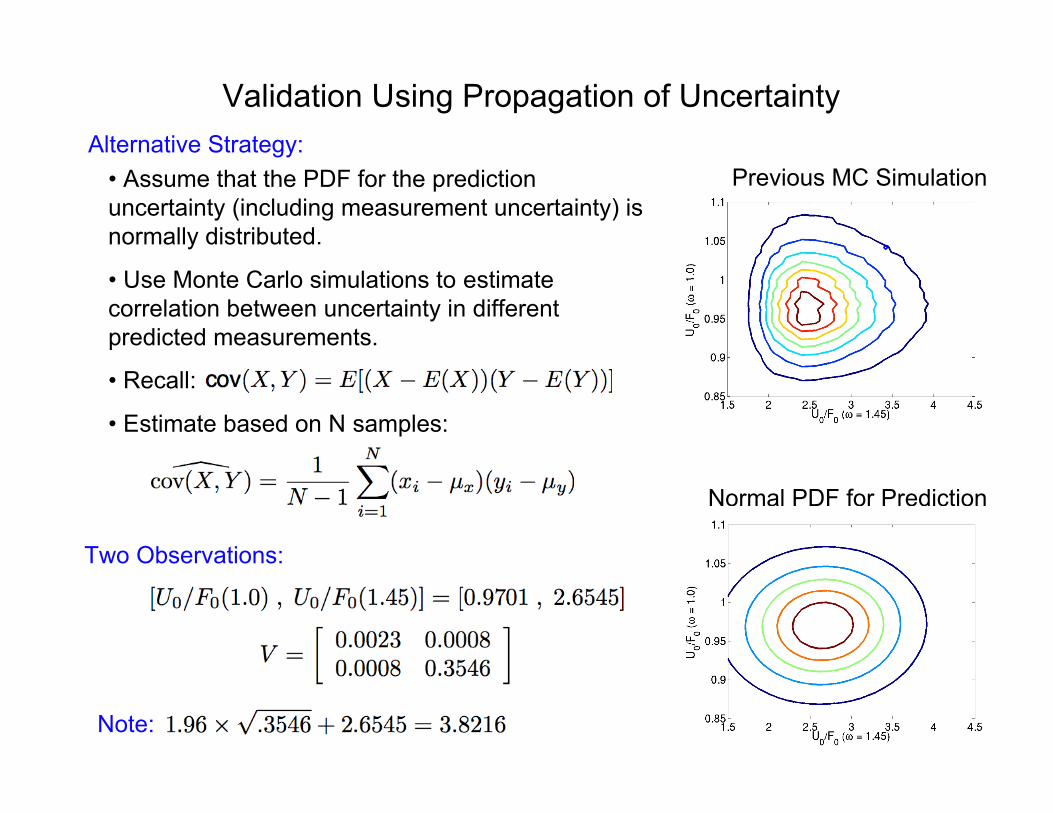
Validation Using Propagation of UncertaintyAlternative Strategy:
• Assume that the PDF for the predictionuncertainty (including measurement uncertainty) isnormally distributed.
• Use Monte Carlo simulations to estimatecorrelation between uncertainty in differentpredicted measurements.
• Recall:
• Estimate based on N samples:
Two Observations:
Previous MC Simulation
Note:
Normal PDF for Prediction
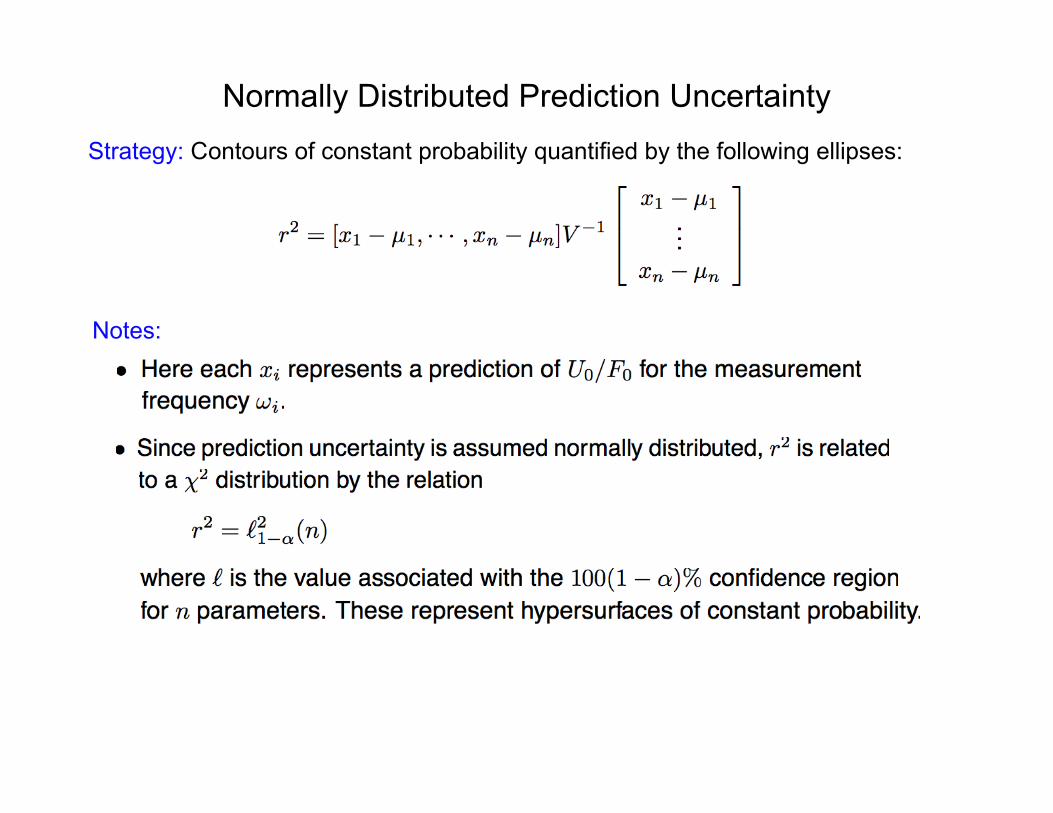
Normally Distributed Prediction UncertaintyStrategy: Contours of constant probability quantified by the following ellipses:
Notes:
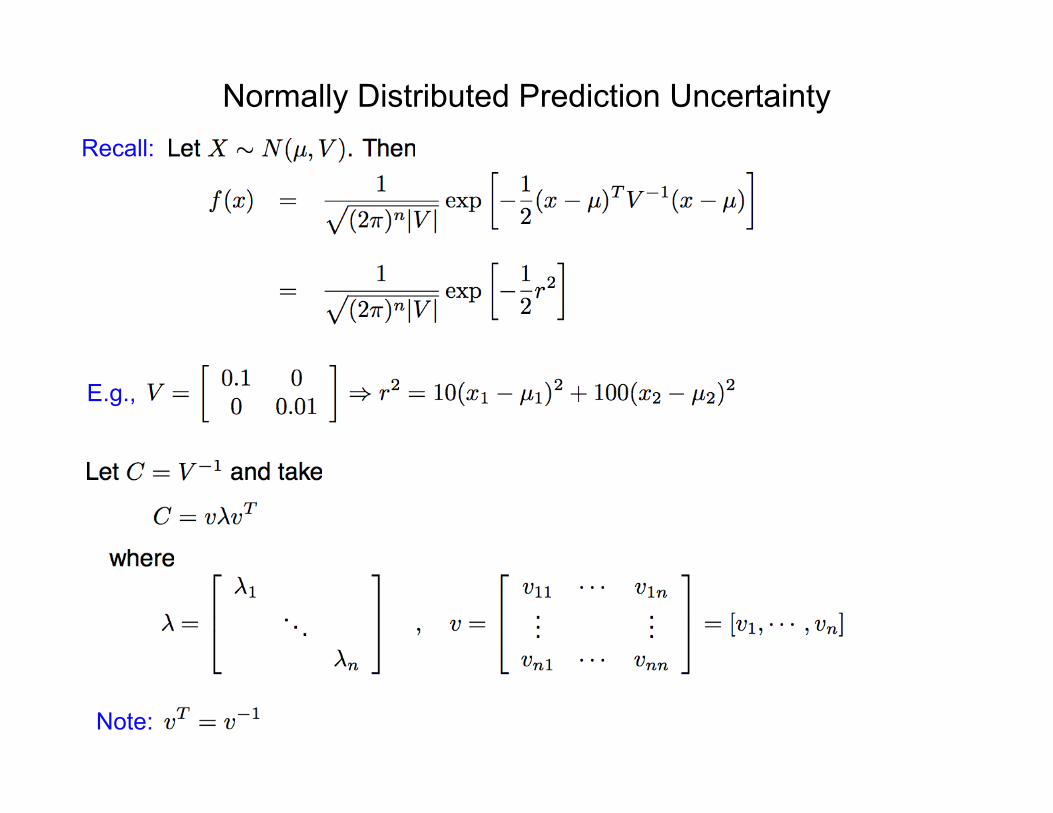
Normally Distributed Prediction UncertaintyRecall:
E.g.,
Note:

Normally Distributed Prediction Uncertainty
New Coordinate Vector:
Second Transformation:
Probability that Point Lies Inside Hypersphere:
Note:
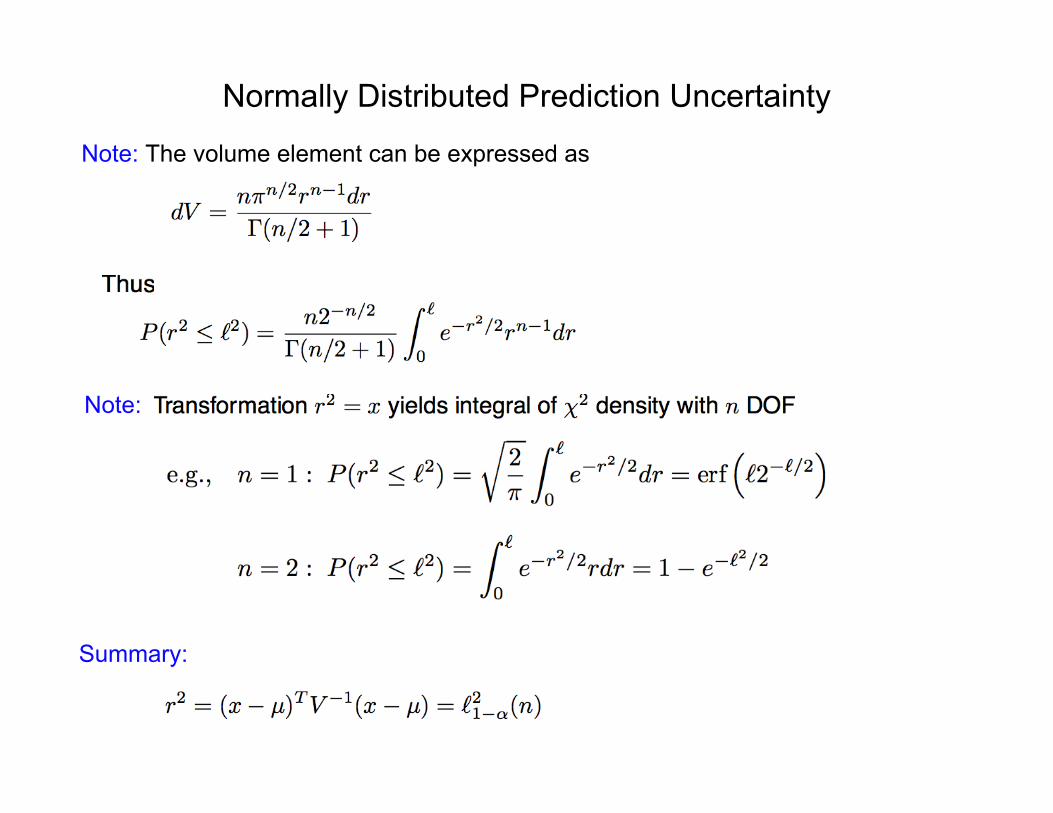
Normally Distributed Prediction Uncertainty
Note: The volume element can be expressed as
Note:
Summary:

Normally Distributed Prediction Uncertainty
Example: 2 Measurement Points
95% Confidence Region and Data Point

Normally Distributed Prediction Uncertainty
Example: 191 Measurement Points
Numerical Issues: The covariance matrix V can be very ill-conditioned. Thisnecessitates use of the Moore-Penrose or pseudoinverse pinv.m

Alternative Method: Optimization-BasedNotes:
• Avoids the assumption that model uncertainty is normally distributed
• Requires statistical model for input parameters and measurement uncertainty
• Example:
Model prediction
95% Confidence region
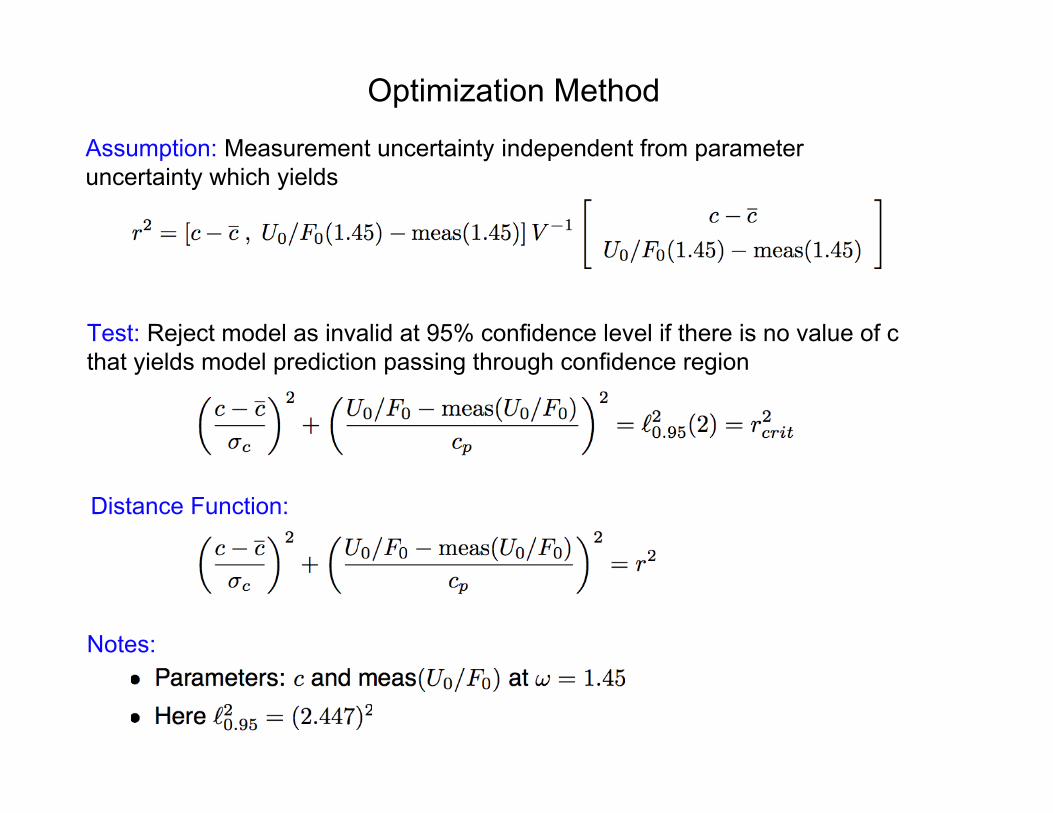
Optimization Method
Assumption: Measurement uncertainty independent from parameteruncertainty which yields
Test: Reject model as invalid at 95% confidence level if there is no value of cthat yields model prediction passing through confidence region
Distance Function:
Notes:
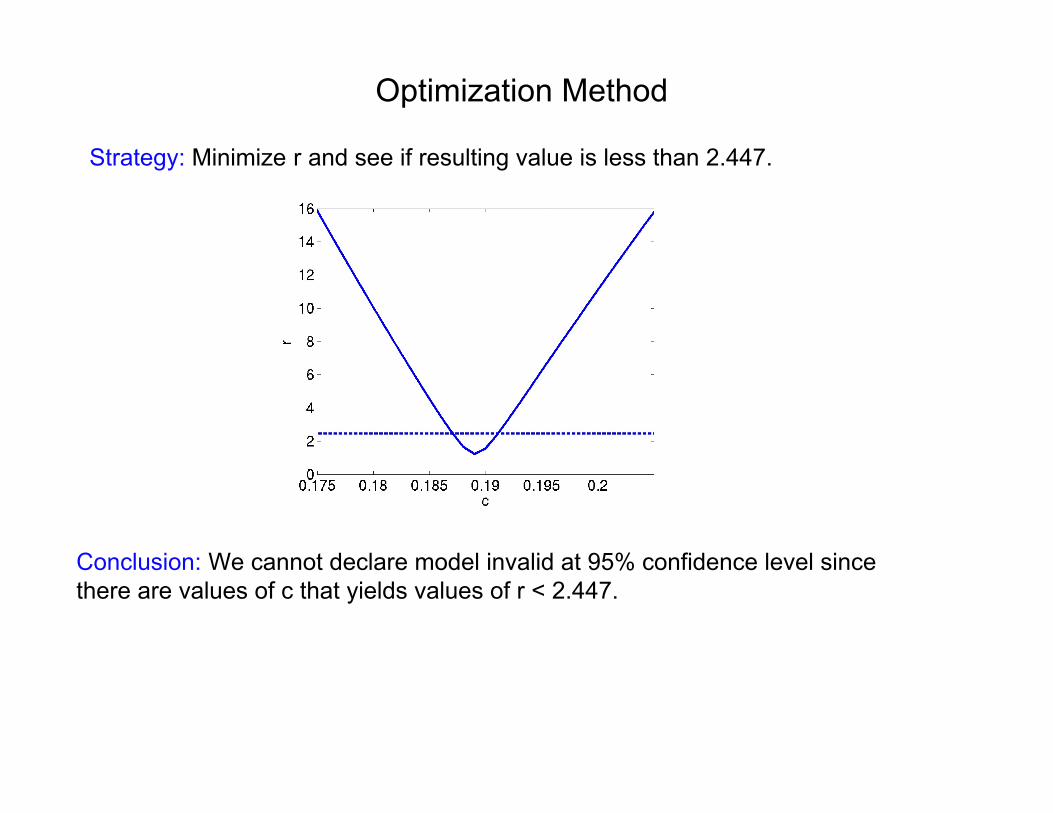
Optimization Method
Strategy: Minimize r and see if resulting value is less than 2.447.
Conclusion: We cannot declare model invalid at 95% confidence level sincethere are values of c that yields values of r < 2.447.
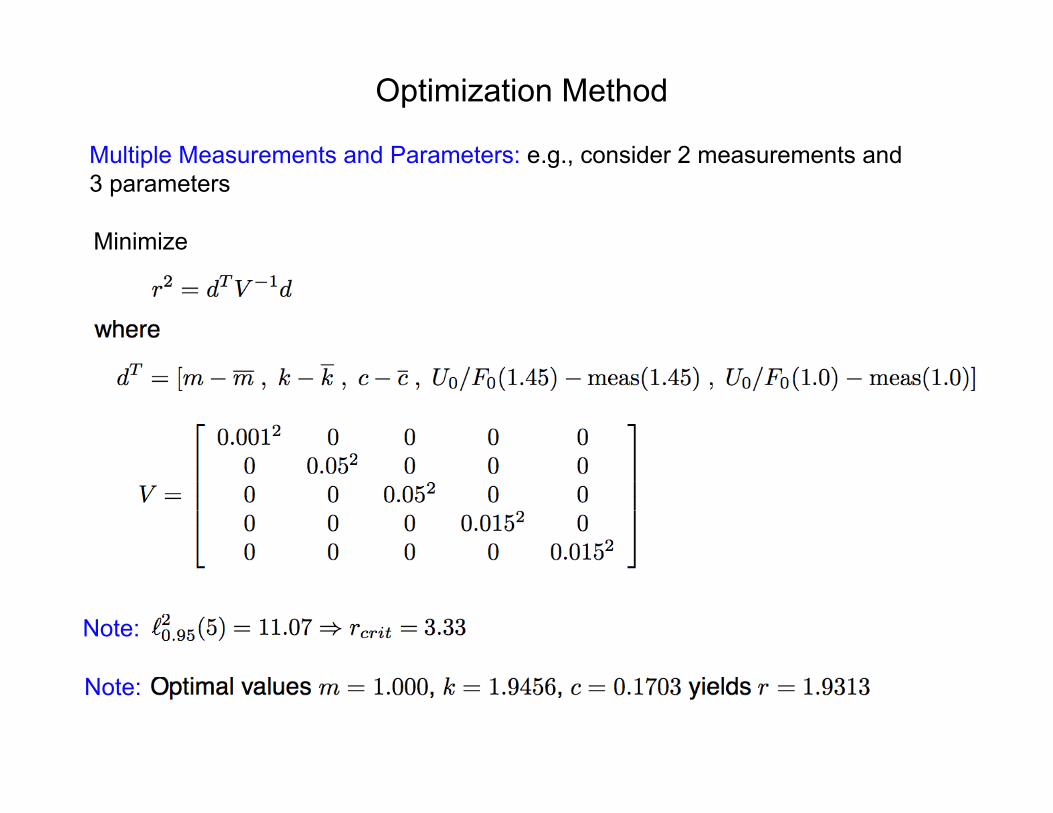
Optimization Method
Multiple Measurements and Parameters: e.g., consider 2 measurements and3 parameters
Minimize
Note:
Note:
Optimization Method
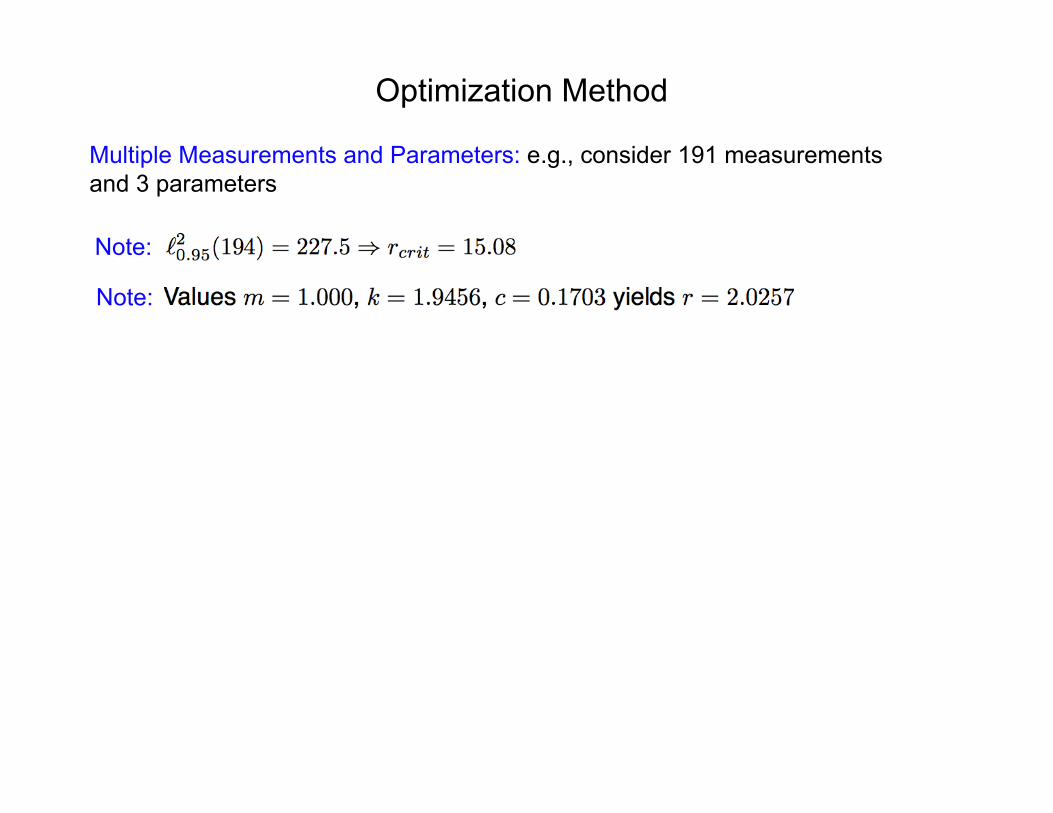
Multiple Measurements and Parameters: e.g., consider 191 measurementsand 3 parameters
Note:
Note: