statistical yearbook 2012
TRANSCRIPT

STATISTICAL YEARBOOK 2012
i

STATISTICAL YEARBOOK 2012
ii

STATISTICAL YEARBOOK 2012
iii
TABLE OF CONTENTS
SUBJECT PAGE
Message from the Director of the Department of Commerce ii
American Samoa Government Departments/Offices iv-v
American Samoa Legislative Branch vi
American Samoa Judiciary Branch vii
Comparison of selected Wage rates paid in American Samoa with U.S.
mainland minimum wage increases, 2001-2009 vii
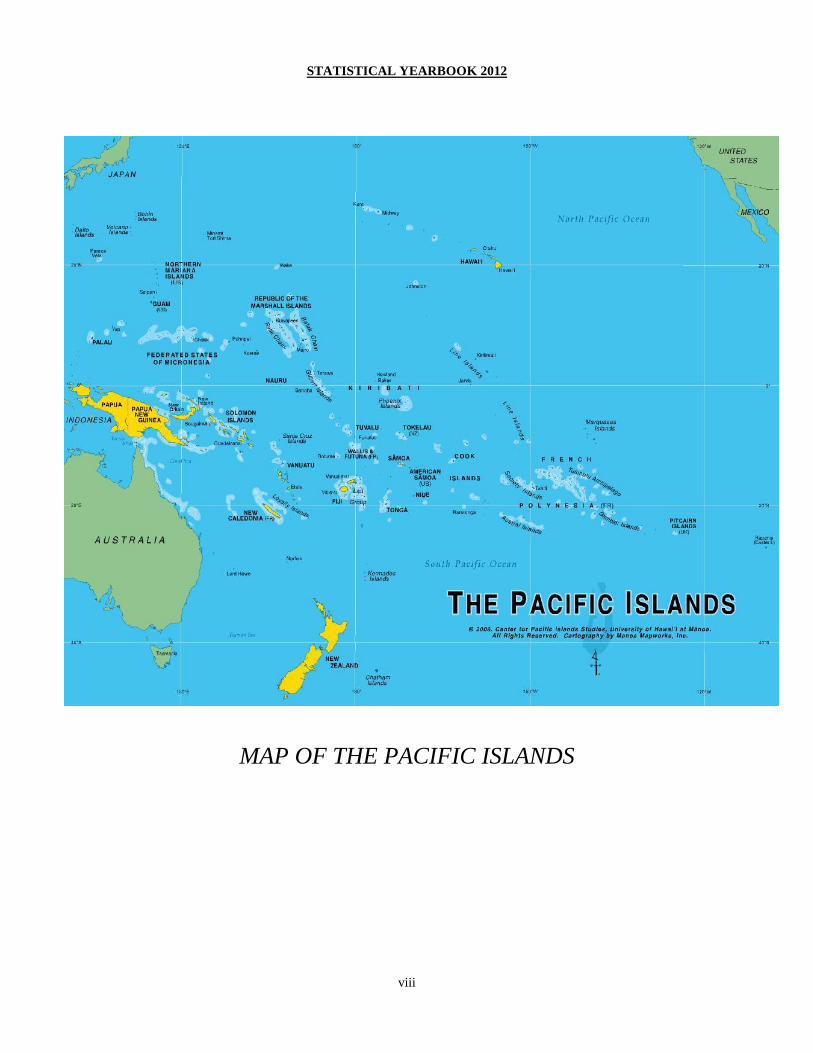
Map of the Pacific Islands viii
Map of American Samoa ix
United States and Metric Weights and Measures x
Tabular Presentation xi
Method of Order xi
List of Tables xii-xviii
List of Figures xviii
Sections:
1. Population 1-24
2. Vital and Health Statistics 25-41
3. Education 42-62
4. Law Enforcement 63-71
5. Climate 72-76
6. Land Use/Ownership, Housing Characteristics, and Building
Permits
77-87
7. International Arrivals and Departures 88-101
8. Election 102-107
9. Government Finance 108-112
10. Labor Force, Employment and Earnings 113-135
11. Prices and Expenditures 136-142
12. Communication and Transportation 143-151
13. Agriculture and Fishery 152-168
14. Commerce and Trade 169-177
15. Electricity and Water 178-190
16. National Accounts 191-193
Community Comments and Suggestions – 2012 194
STATISTICAL YEARBOOK 2012
iv
LOLO L. MOLIGA GOVERNOR OF AMERICAN SAMOA
LEMANU PELETI MAUGA
LT. GOVERNOR
GOVERNOR’S OFFICE
Department of Commerce
Pago Pago, Am. Samoa 96799
Keniseli F. Lafaele
Director
PH# (684) 633-5155
FAX# (684) 633-4195
Department of Public Works
Pago Pago, Am. Samoa 96799
Faleosina Voight
Director
PH# (684) 633-4141
FAX# (684) 633-5958
Department of Public Safety
Pago Pago, Am. Samoa 96799
William E. Haleck
Commissioner
PH# (684) 633-1111
FAX# (684) 633-5111
Department of Agriculture
Pago Pago, Am. Samoa 96799
Lealao M. Purcell
Director
PH# (684) 699-1497
FAX# (684) 699-4031
Department of Education
Pago Pago, Am. Samoa 96799
Vaitinasa Dr. Salu Hunkin Finau
Acting Director
PH# (684) 633-5237
FAX# (684) 633-4240
Department of Human Resources
Pago Pago, Am. Samoa 96799
Sonny Thompson
Director
PH# (684) 633-4485
FAX# (684) 633-1139
Department of Treasury
Pago Pago, Am. Samoa 96799
Falema’o M. Pili
Treasurer
PH# (684) 633-4155
FAX# (684) 633-4100
Department of Local Government
Pago Pago, Am. Samoa 96799
PC Satele Galu T. Satele
Secretary of Samoan Affairs
PH# (684) 633-5201
FAX# (684) 633-5590
Department of Administrative Services
Pago Pago, Am. Samoa 96799
Malemo Tausaga
Director
PH# (684) 633-4156
FAX# (684) 633-1841
Department of Human & Social Services
Pago Pago, Am. Samoa 96799
Taeaoafua Dr. Meki Solomona
Director
PH# (684) 633-1187
FAX# (684) 633-7449
Department of Legal Affairs
Pago Pago, Am. Samoa 96799
Afoa L. Su’esu’e Lutu
Attorney General
PH# (684) 633-4163
FAX# (684) 633-1838
Department of Marine & Wildlife Resources
Pago Pago, Am. Samoa 96799
Dr. Ruth Matagi-Tofiga
Director
PH# (684) 633-4456
FAX# (684) 633-5944
Department of Parks & Recreation
Pago Pago, Am. Samoa 96799
Maeata’anoa Pili Gaoteote
Director
PH# (684) 699-9614
FAX# (684) 699-4427
Department of Port Administration
Pago Pago, Am. Samoa 96799
Taimalelagi Dr. Claire Tuia- Poumele
Director
PH# (684) 633-4251
FAX# (684) 633-5281
LBJ Medical Center Hospital Authority
Pago, Am. Samoa 96799
Joseph Davis-Fleming
Chief Executive Officer
PH# (684) 633-4590
FAX# (684) 633-1869
Office of Procurement
Pago Pago, Am. Samoa 96799
Tiaotalaga John E. Kruse
Chief Procurement Officer
PH# (684) 699-1170
FAX# (684) 699-2387
Office of Communications
Pago Pago, Am. Samoa 96799
Moefa’auo Bill Emmsley
Chief Executive Officer
PH# (684) 633-1121
FAX# (684) 633-9032
American Samoa Community College
Pago Pago, Am. Samoa 96799
Dr. Seth Galea’i
President
PH# (684) 699-9155
FAX# (684) 699-2062
Office of Public Information
Pago Pago, Am. Samoa 96799
Fagafaga Daniel Langkilde
Director
PH# (684) 633-4191
FAX# (684) 633-1044
American Samoa Power Authority
Pago Pago, Am. Samoa 96799
Utu Abe Malae
Acting Chief Executive Officer
PH# (684) 644-5251
FAX# (684) 644-5005
Am. Samoa Development Bank
Pago Pago, Am. Samoa 96799
Jason Betham
Acting President
PH# (684) 633-4031
FAX# (684) 633-1163
Territorial Administration on Aging
Pago Pago, Am. Samoa 96799
HTC Ale Tifi Malae
Director
PH# (684) 633-1251
FAX# (684) 633-2533
Office of Protection Advocacy
Pago Pago, Am. Samoa 96799
Pita Tinitali
Director
PH# (684) 699-2441
FAX# (684) 633-7286
Election Office
Pago Pago, Am. Samoa 96799
Tua’olo Manaia Fruean
Chief Election Officer
PH# (684) 633-2522
FAX# (684) 633-7116
Criminal Justice Planning Agency
Pago Pago, Am. Samoa 96799
Keith Gebauer
Director
PH# (684) 633-5221
FAX# (684) 633- 7552
Environmental Protection Agency
Pago Pago, Am. Samoa 96799
Ameko Pato
Executive Director
PH# (684) 633-2304
FAX# (684) 633-5801
Arts Council
Pago Pago, Am. Samoa 96799
Utu Dr. Laloulu Tagomailelagi
Executive Director
PH# (684) 633-4347
FAX# (684) 633-2059
STATISTICAL YEARBOOK 2012
v
LOLO L. MOLIGA GOVERNOR OF AMERICAN SAMOA
LEMANU PELETI MAUGA LT. GOVERNOR
GOVERNOR’S OFFICE
Office of Program Planning & Budget Veterans Affairs Office Department of Youth and Women’s Affairs
Pago Pago, Am. Samoa 96799 Pago Pago, Am. Samoa 96799 Pago Pago, Am. Samoa 96799
Catherine Saelua Dr. Fred Urhle Pa’u Roy Ausage
Director Veterans Affairs Officer Acting Director
PH# (684) 633-4201 PH# (684) 699-3730 PH# (684) 633-2835
FAX# (684) 633-1148 FAX# (684) 699-9934/3371 FAX# (684) 633-2875
Office of the Administrative Law Judge Office of Property Management Territorial Energy Office
Toetagata Albert Mailo Malo L. Niumata Taliga Vaiolo
Administrative Law Judge Chief Property Management Officer Acting Director
PH# (684) 633-7712 PH# (684) 699-6537 PH# (684) 699-1101
FAX (684) 533-7725 FAX (684) 699-6536 FAX (684) 699-2835
Public Library Department of Health Office of Public Defender
Cheryl Morales-Polataivao Motusa T. Nua Marc Douglas Fiaui
Territorial Librarian Director Public Defender
PH# (684) 633-5816 PH# (684) 633-4606 PH# (684) 633-1286
FAX (684) 633-5823 FAX (684) 633-5379 FAX (684) 633-4745
Territorial Audit Office Department of Homeland Security
Liua Fatuesi Iuniasolua T. Savusa
Acting Territorial Auditor Executive Director
PH# (684) 633-5191 PH# (684) 633-2827
FAX (684) 633-1039 FAX (684) 633-2979

STATISTICAL YEARBOOK 2012
vi
Members of the 33
nd Legislature
Gaoteote Palaie Tofau President of the Senate
Phone: (684) 633-4565
Savali Talavou Ale Speaker of the House of Representatives
Phone: (684) 633-5763
American Samoa Fono
DISTRICT HOUSE PHONE DISTRICT SENATE PHONE
14 ALATAUA SAVALI TALAVOU ALE
SPEAKER
(684) 633-5763 3 VAIFANUA GAOTEOTE PALAIE TOFAU
(PRESIDENT)
(684) 633-5853
1 TA’U TALIA FA’AFETAI I’AULUALO
VICE SPEAKER
(684) 633-5152 6 MAOPUTASI FA’AGATA MANO (684) 633-4759
1 TA’U FETUI FETU JR. (684) 633-4822 6 MAOPUTASI MAUGA T. ASUEGA (684) 633-4947
2 OFU/OLOSEGA TOEAINA FAUFANO AUTELE (684) 633-4754 1 TA'U NUANUAOLEFEAGAIGA T. SAOLUAGA (684) 633-4656
3 VAIFANUA FATULEGAE’E PALEPOI MAUGA (684) 633-5556 1 TA'U GALEA’I M. TU’UFULI (684) 633-5453
4 SA’OLE TALAMAITAI ELISARA SU’A (684) 633-4956 4 SAOLE SAOLE M.F. SAOLE (684) 633-5668
5 SUA #1 PULELEIITE LI’AMATUA TUFELE, JR
(684) 633-5557 2 OFU/OLOSEGA LAOLAGI SAVALI VAEAO (684) 633-5663
6 SUA #2 LEMAPU SUIAUNOA TALO (684) 633-4059 5 SUA SUA V. MATA’UTIA (684) 633-4869
7 MAOPUTASI #1 VAILOATA ETEUATI AMITUANA’I (684) 633-4657 5 SUA TIALAVEA MISIUALAPA (684) 633-5754
8 MAOPUTASI #2 MAUGAOALII LEAPAI T. ANOA’I (684) 633-4011 6 MAOPUTASI FAUMUINA TAGISIAALI’I (684) 633-5359
9 MAOPUTASI #3 VA’AMUA HENRY SESEPASARA (684) 633-1581 7 ITUAU ALO FAAUUGA (684) 633-4553
10 MAOPUTASI #4 VAETASI TUUMOLIMOLI S. MOLIGA
(684) 633-4058 7 ITUAU SOLIAI TUIPINE FUIMAONO (684) 633-5854
11 MAOPUTASI #5 FAIMEALELEI ANTHONY F. ALLEN (684) 633-5458 8 TUALAUTA MAGALEI LOGOVI’I (684) 633-4057
12 ITUAU TAOTASI ARCHIE SOLIAI (684) 633-4557 8 TUALAUTA LETULIGASENOA SOLI (684) 633-5553
12 ITUAU FAGASOAIA F. LEALAITAFEA (684) 633-7876 9 LEASINA/AITU LEATUALEVAO S. ASIFOA (684) 633-4654
13 FOFO PULETUIMALO D. S. KOKO (684) 633-5669 10 TUALATAI TUIASINA SIOLOSEGA ESERA (684) 633-5757
15 TUALAUTA FLORENCE VAILI SAULO (684) 633-5454 11 FOFO AVEGALIO P. AIGAMAUA (684) 633-4568
15 TUALAUTA LARRY S. SANITOA (684) 633-5363 12 ALATAUA FALETAGOA’I I. TUIOLEMOTU (684) 633-4457
16 TUALATAI TIMUSA TINI C. LAM YUEN (684) 633-4954
17 AITULAGI ATUALEVAO GAFATASI AFALAVA (684) 633-5457
SWAINS ISLAND SU’A ALEXANDER E.JENNINGS (684) 633-5758

STATISTICAL YEARBOOK 2012
vii
F. Michael Kruse Chief Justice
Lyle L. Richmond Associate Justice
Phone: (684) 633-1261
Fax: (684) 633-1318
Pago Pago, Am. Samoa 96799
NAME POSITION PHONE
John L. Ward II District Court Judge/Associate Justice (684) 633-1261
Logoai Siaki Chief Associate Judge “
Mamea Sala, Jr. Associate Judge “
Su’apaia Edmund C. Pereira Associate Judge “
Fa’asua P. Pomele Associate Judge “
Satele A. Lili’o Associate Judge “
Elvis P. Patea Acting Associate Justice “
Muasau T. Tofili Associate Judge “
Comparison of selected wage rates paid in American Samoa with U.S. mainland minimum wage increases, 2001-
2009.
American Samoa Rates
Year U.S. Minimum Wage Fish Canning Construction Retailing, etc.
Finance &
Insurance Government Miscellaneous
2001
2002
2003
2004
2005
2006
2007
2008
2009
$5.15
$5.15
$5.15
$5.15
$5.15
$5.15
$5.85
$6.55
$7.25
$3.26
$3.26
$3.26
$3.26
$3.26
$3.26
$3.76
$4.26
$4.76
$3.55
$3.60
$3.60
$3.60
$3.60
43.60
$4.10
$4.60
$5.10
$3.06
$3.10
$3.10
$3.10
$3.10
$3.10
$3.60
$4.10
$4.60
$3.94
$3.99
$3.99
$3.99
$3.99
$3.99
$4.49
$4.99
$5.49
$2.73
$2.77
$2.77
$2.77
$2.84
$2.91
$3.41
$3.91
$4.41
$2.54
$2.57
$2.57
$2.57
$2.63
$2.70
$3.20
$3.70
$4.20
STATISTICAL YEARBOOK 2012
viii
MAP OF THE PACIFIC ISLANDS
STATISTICAL YEARBOOK 2012
ix
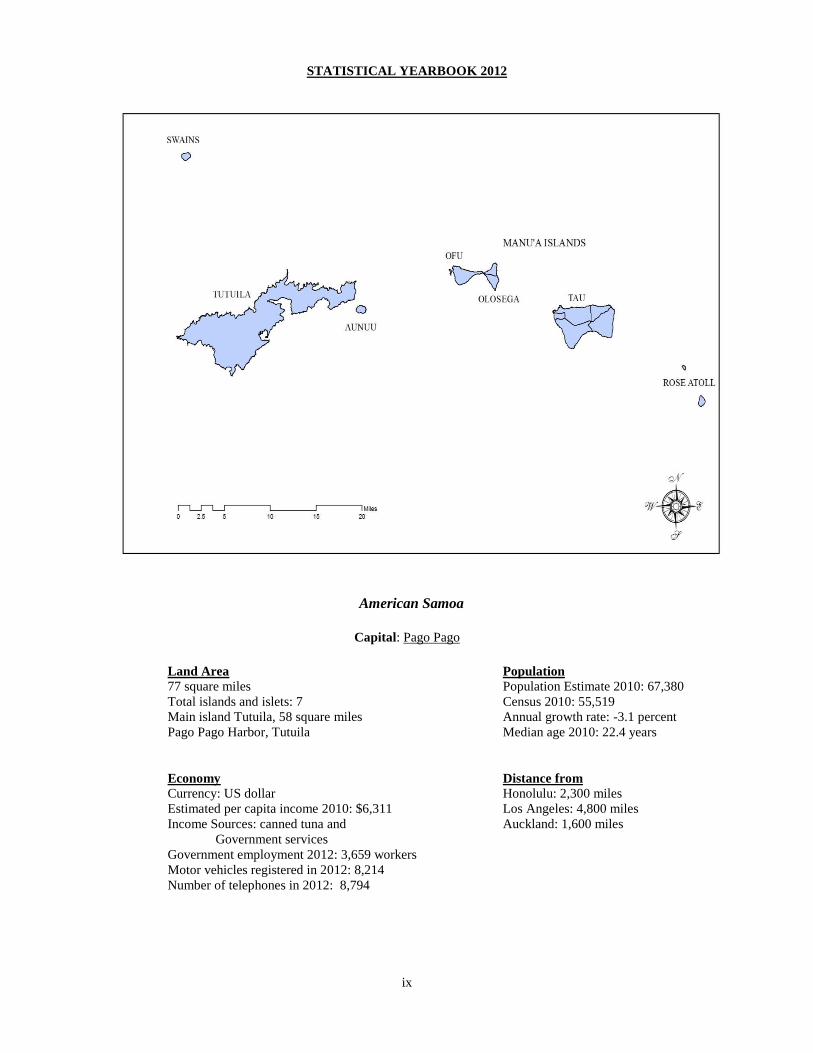
American Samoa
Capital: Pago Pago
Land Area Population
77 square miles Population Estimate 2010: 67,380
Total islands and islets: 7 Census 2010: 55,519
Main island Tutuila, 58 square miles Annual growth rate: -3.1 percent
Pago Pago Harbor, Tutuila Median age 2010: 22.4 years
Economy Distance from
Currency: US dollar Honolulu: 2,300 miles
Estimated per capita income 2010: $6,311 Los Angeles: 4,800 miles
Income Sources: canned tuna and Auckland: 1,600 miles
Government services
Government employment 2012: 3,659 workers
Motor vehicles registered in 2012: 8,214
Number of telephones in 2012: 8,794

STATISTICAL YEARBOOK 2012
x
U.S. to Metric Metric to U.S. LENGTH:
Inches X 25.4 = millimeters millimeters X 0.039 = inches
Feet X 0.305 = meters meters X 3.281 = feet
Statute miles X 1.609 = kilometers kilometers X 0.621 = miles
AREA:
Sq. feet X 0.093 = sq. meters sq. meters X 10.764 = sq. feet
Acres X 0.405 = hectares hectares X 2.471 = acres
Sq. miles X 2.589 = sq. kilometers sq. kilometers X 0.386 = sq. miles
VOLUME & CAPACITY:
Cubic feet X 0.028 = cu. meters cu. meters X 35.315 = cu. Feet
Cubic Yard X 0.765 = cu. meters cu. meters X 1.308 = cu. Yards
Fluid ounces X 29.573 = milliliters milliliters X 0.034 = Fl. Oz.
Quarts (liq.) X 0.946 = liters liters X 0.057 = qt. (liq.)
Gallons (liq.) X 3.785 = liters liters X 0.264 = gals (liq.)
MASS:
Oz. (avdp.) X 28.350 = grams grams X 0.035 = oz. (avdp.)
lbs. (avdp.) X 0.454 = kilograms kilograms X 2.205 = lbs. (avdp.)
Hwt. X 45.359 = kilograms kilograms X 0.022 = Hwt.
Short tons X 0.907 = metric tons metric tons X 1.102 = short tons
Miscellaneous conversions:
1 statute mile = 5,280 feet = 1,760 yards 1 acre = 43,560 sq. feet
1 square mile = 640 acres 1 short ton = 2,000 pounds
Fahrenheit to Celsius Celsius to Fahrenheit
Temperature
100 degrees Fahrenheit
37.8 degrees Celsius 40 degrees Celsius 104.0 degrees Fahrenheit
90 32.2 35 95.0
80 26.7 30 86.0
70 21.1 25 77.0
60 15.6 20 68.0
50 10.0 15 59.0
40 4.4 10 50.0
30 -1.1 5 41.0
20 -6.7 0 32.0
10 -12.2 -5 23.0
-10 14.0
STATISTICAL YEARBOOK 2012
xi
TABULAR PRESENTATION
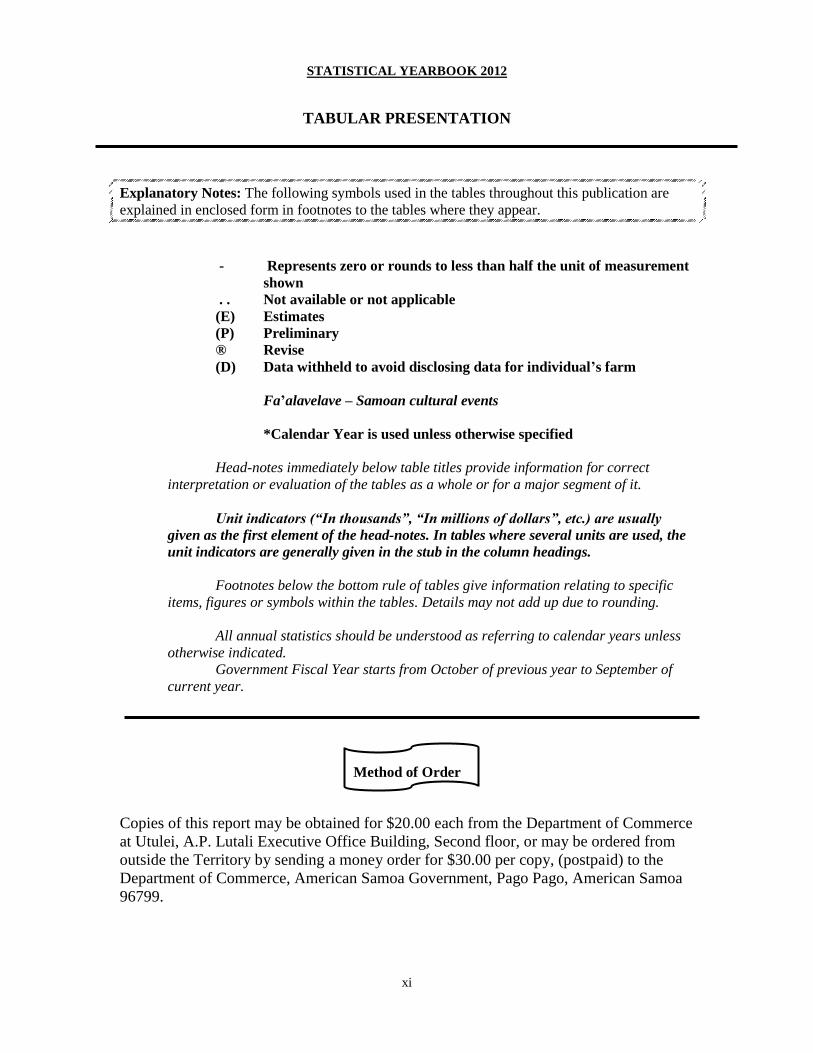
Explanatory Notes: The following symbols used in the tables throughout this publication are
explained in enclosed form in footnotes to the tables where they appear.
- Represents zero or rounds to less than half the unit of measurement
shown
. . Not available or not applicable
(E) Estimates
(P) Preliminary
® Revise
(D) Data withheld to avoid disclosing data for individual’s farm
Fa’alavelave – Samoan cultural events
*Calendar Year is used unless otherwise specified
Head-notes immediately below table titles provide information for correct
interpretation or evaluation of the tables as a whole or for a major segment of it.
Unit indicators (“In thousands”, “In millions of dollars”, etc.) are usually
given as the first element of the head-notes. In tables where several units are used, the
unit indicators are generally given in the stub in the column headings.
Footnotes below the bottom rule of tables give information relating to specific
items, figures or symbols within the tables. Details may not add up due to rounding.
All annual statistics should be understood as referring to calendar years unless
otherwise indicated.
Government Fiscal Year starts from October of previous year to September of
current year.
Method of Order
Copies of this report may be obtained for $20.00 each from the Department of Commerce
at Utulei, A.P. Lutali Executive Office Building, Second floor, or may be ordered from
outside the Territory by sending a money order for $30.00 per copy, (postpaid) to the
Department of Commerce, American Samoa Government, Pago Pago, American Samoa
96799.
STATISTICAL YEARBOOK 2012
xii
LIST OF TABLES
Table
No.
Table Title Page
No.
POPULATION
1.1 Population, Density and Growth in the Pacific: 2011 2
1.2 Census Population, Growth, Gender and Median Age: 1900
to 2010
3
1.3 Census Population by District: 1900 to 2010 4
1.4 Mid-Year Population Estimates: 2001 to 2010 4
1.5 Migration and Natural Increase: 1970 to 2010 5
1.6 Birthplace by District and County, American Samoa: 2010 5
1.7 Population by Village: 1980 to 2010 6-7
1.8 Population by District and County: 1940 to 2010 8
1.9 Sex Ratio: 1908 to 2010 9
1.10 Percent Never Married and Age at First Marriage: 1956 to
2010
9
1.11 Average Number of Children Ever Born Per Woman: 1956 to
2010
10
1.12 Age by Place of Birth, American Samoa: 2010 10
1.13 Father’s and Mother’s Place of Birth by Place of Birth and
District, American Samoa: 2010
11
1.14 Mother’s Country of Birth: 1974 to 2010 12
1.15 Place of Birth: 2010 12
1.16 Ethnic Origin and Race: 1980 to 2010 13
1.17 Citizenship by District: 1990, 2000 and 2010 14
1.18 Household by Type: 1980 to 2010 15
1.19 Place of Birth: 1980 to 2010 15
1.20 Village Population by Gender: 2010 16-17
1.21 Village Population by Age Group: 2010 18-19
1.22 Population by Age: 1970 to 2010 20-21
1.23 District and County Population by Age: 2010 21
1.24 Village Population by Ethnic Origin: 2010 22-23
1.25 Ethnicity: 1990 to 2010 24
VITAL AND HEALTH STATISTICS
2.1 Vital Statistics: 2002 to 2010 26
2.2 Births by Month: 2002 to 2012 26
2.2a Deaths by Month: 2002 to 2012 27
2.3 Live Births by Birthweight: 2002 to 2012 27
2.4 Live Births by Legitimacy and Gender: 2002 to 2012 28
2.5 Live Births by Age of Mother and Live Birth Order: 2012 28
2.6 Live Births by Age of Mother: 2002 to 2012 29
2.7 Live Births by Type: 2002 to 2012 29
2.8 Deaths by Age: 2002 to 2012 30
2.9 Deaths by Age and Gender: 2002 to 2012 31-32

STATISTICAL YEARBOOK 2012
xiii
2.10 Cause of Death: 2002 to 2012 33
2.11 Infant Deaths by Month: 2002 to 2012 33
2.12 Notifiable Diseases: 2002 to 2012 34
2.13 Out-patient Visits by Type of Clinic: 2002 to 2012 35
2.14 Hospital Discharges by Type of Service: 2002 to 2012 36
2.15 Marriages: 2002 to 2012 37
2.16 American Samoa Life Table by Sex 38
2.17 Fertility for Women 35 to 44 Years by District and County,
American Samoa: 2010
39
2.18 Marital Status by District and County, American Samoa:
2010
40-41
EDUCATION
3.1 Educational Institutions and Enrollment at Beginning of
School Year by Type and Level: 2002 to 2012
43
3.2 Public and Private School Enrollment by Level and by Month:
August 2011 to June 2012
44
3.3 Public and Private School Enrollment by Grade, at the
Beginning of School Year: 2002 to 2012
45
3.4 Number of Teachers in Classrooms: 2002 to 2012 46
3.5 Public High School Graduates: 2002 to 2012 46
3.6 Number of Degrees Earned by Educators: 2009 to 2012 46
3.7 American Samoa Community College Enrollment by Status,
Gender, Age, and Citizenship: Fall 2002 to 2012
47-48
3.8 American Samoa Community College Enrollment by Major,
Certificate Programs, and Others: 2002 to 2012
49-52
3.9 Degree and Certificate Awarded at the American Samoa
Community College: 2002 to 2012
53
3.10 School Enrollment by Age: 2010
53
3.11 Educational Attainment by Level and by District and County,
American Samoa: 2010
54
3.12 School Enrollment, Educational Attainment, Vocational
Training and Gender by Place of Birth, and District, American
Samoa: 2010
55-56
3.13 Educational Attainment by Level and Village, American
Samoa: 2010
57-58
3.14 School Enrollment by Level of School, District and
County, American Samoa: 2010 59
3.15 School Enrollment by Level of School and Village, American
Samoa: 2010
60-61
3.16 Number of Dropouts: 2002 to 2008 62
LAW ENFORCEMENT
4.1 Part 1 and Part 2 Offenses by Type of Offense: FY2002 to
FY2012
64
4.2 Part 1 and Part 2 Juvenile Offenses by Type of Offense:
FY2002 to FY2012
65

STATISTICAL YEARBOOK 2012
xiv
4.3 Traffic Accidents: FY2002 to FY2012 65
4.4 Registered Firearms by Type: FY2002 to FY2012 66
4.5 Inmate Population by Month, Tafuna Correctional Facility:
FY2002 to FY2012
66
4.6 Inmate Population by Nationality: FY2002 to FY2012 67
4.7 Fires by Type: FY2002 to FY2012 67
4.8 High Court Cases Filed and Disposed by Type: 2002 to 2012 68
4.9 High Court Cases Filed: 2002 to 2012 69
4.10 Family, Drug and Alcohol Cases Filed and Disposed by Type:
2002 to 2012
69-70
4.11 District Court Cases Filed and Disposed by Type: 2002 to
2012
70-71
CLIMATE
5.1 Meteorological Data for American Samoa by Month: 2012 73
5.2 Climatic Normal, Means, and Extremes for American Samoa:
2012
74
5.3 Average Temperatures for American Samoa: 2002 to 2012 75
5.4 Rainfall (Inches): 2002 to 2012 75
5.5 Cooling Degree Days for American Samoa: 2002 to 2012 76
LAND USE/REGISTRATION, HOUSING
CHARACTERISTICS, AND BUILDING PERMITS
6.1 Land Ownership Registration: 2001 to 2011 78
6.2 Housing Units by Tenure, and District and County, American
Samoa: 2000
78
6.3 Units in Structure for District and County, American Samoa:
2000
79
6.4 Average Number of Occupants Per Room by Village,
American Samoa: 2010
80-81
6.5 Rooms by District and County, American Samoa: 2010 82
6.6 Bedrooms by District and County, American Samoa: 2010 83
6.7 Persons Per Room by District: 2010 84
6.8 Year Structure Built by District and County, American
Samoa: 2010
85
6.9 Water Source and Sewage Disposal: 2010 86
6.10 Bathing and Toilet Facilities: 2010 86
6.11 Type of Land Use and Building Permits by Month: 2012 87
6.12 Number and Estimated Value of Building Permits: 2002 to
2012
87
INTERNATIONAL ARRIVALS AND DEPARTURES
7.1 Arrivals by Citizenship and Purpose of Travel: 2012 89-90
7.2 Visitor Arrivals by Purpose of Travel: 2005-2012 91
7.3 Business Arrivals by Month: 2005-2012 91
7.4 Tourist Arrivals by Month: 2005-2012 92
7.5 Arrivals to Visit Relatives by Month: 2005-2012 92
7.6 Employment Arrivals by Month: 2005-2012 93

STATISTICAL YEARBOOK 2012
xv
7.7 In-Transit Arrivals by Month: 2005-2012 93
7.8 Resident Arrivals by Month: 2005-2012 94
7.9 Tourist Arrivals by Citizenship: 2005-2012 94
7.10 Departure by Citizenship and Purpose of Travel: 2012 95-96
7.11 Visitor Departures by Purpose of Travel: 2005-2012 97
7.12 Business Departures by Month: 2005-2012 97
7.13 Tourist Departures by Month: 2005-2012 98
7.14 Departures to Visit Friends/Relatives by Month: 2005- 2012 98
7.15 Employment Departures by Month: 2005- 2012 99
7.16 In-Transit Departures by Month: 2005-2012 99
7.17 Resident Departures by Month: 2005-2012 100
7.18 Tourist Departures by Citizenship: 2005-2012 100
7.19 Analysis of Arrivals and Departures by Purpose: 2005 to 2012 101
ELECTION
8.1 Votes Cast in General Election by District and Village:
November 6, 2012
103
8.2 Registered Voters and Votes Cast in General Election by
District: 2008, 2010 and 2012
104
8.3 Age and Gender of Registered Voters in General Election by
District and Village: November 6, 2012
105-106
8.4 Registered Voters and Votes Cast: 1992 to 2012 107
GOVERNMENT FINANCE
9.1 Combined of Revenues, Expenditure and Changes in Fund
Balances all Governmental Fund Types and Expendable Trust
Funds: FY2012
109
9.2 Revenues, Expenditures and Other Financial Sources:
FY2002 to FY2012
110
9.3 General Governmental Revenues by Source (Governmental
Fund Types): FY2002 to FY2012
110
9.4 Functional Expenditures for All Governmental Funds by
Category: FY2002 to FY2011
111
9.5 General Fund Expenditures by Function: FY2002 to FY2011 112
9.6 General Fund Revenues by Source: FY2002 to FY2011 112
LABOR FORCE, EMPLOYMENT AND EARNINGS
10.1 Current Employment Estimates: 2002 to 2012 114
10.2 Labor Force: 2000, 2005 AND 2010 114
10.3 American Samoa Government Employment by Status: 2002
to 2012
115
10.4 Employment Status by District and County, American Samoa:
2010
116
10.5 Work Status in 2009 by Gender and County: 2010 117
10.6 Occupation for District and County, American Samoa: 2010 118-119
10.7 Industry for District and County, American Samoa: 2010 120-121
10.8 Class of Worker for District and County, American Samoa:
2010
122
STATISTICAL YEARBOOK 2012
xvi
10.9 Minimum Hourly Wage Rates Under the Fair Labor Standards
Act for American Samoa: 2001 to 2009
123
10.10 Household Income in 2009 for District and County, American
Samoa: 2010
124
10.11 Per Capita Income in Year Before Census: 1969 to 2009 124
10.12 Place of Work for District and County, American Samoa:
2010
125
10.13 Place of Work for Villages, American Samoa: 2010 126-127
10.14 Poverty Status and Workers in Family in 2009 by Ethnic
Origin or Race, American Samoa: 2010
128-130
10.15 Individual Poverty Status for District and County, American
Samoa: 2010
131
10.16 Family Poverty Status in 2009 for District and County,
American Samoa: 2010
132
10.17 Family Poverty Status in 2009 for Families with Female
Householder for District and County, American Samoa: 2010
133
10.18 Family Poverty Status in 2009 for Village, American Samoa:
2010
134-135
PRICES AND EXPENDITURES
11.1 New Consumer Price Index by Quarter: 2008 to 2012 137
11.2 Consumer Price Index by Quarter: 2002 to 2007 138
11.2a Consumer Price Index by Major Group: 2002 to 2007 139
11.3 Average Retail Prices of Selected Commodities: 2002 to 2012 140
11.4 Annual Household Expenditures by Item: 1988 and 1995 141
11.5 General Regular Household Expenditures: 1995 142
COMMUNICATION AND TRANSPORTATION
12.1 Local and Overseas Telephone, Telex, Facsimile and
Telegram Services: 2002 to 2012
144
12.2 Cellular, Internet, Cable and Text Messaging: 2012 145
12.3 Registration of Motor Vehicles by Type: FY2002 to FY2012 145
12.4 Drivers’ Licenses and Permits in Force: FY2002 to FY2012 146
12.5 Vessel and Cargo Movement at Pago Pago Harbor: FY2002
to FY2012
147
12.6 Vessel Traffic at Pago Pago Harbor: FY2002 to FY2012 148
12.7 Commercial Carrier Air Traffic Between Pago Pago
International Airport and All Destinations: FY2002 to
FY2012
149
12.8 Commercial Carrier Air Traffic Between Pago Pago and
Honolulu: 2002 to 2012
149-150
12.9 Commercial Carrier Air Traffic Between Pago Pago and
Samoa: 2002 to 2012
150-151
12.10 Aircraft Operations by Type of Aircraft at Pago Pago
International Airport: FY2002 to FY2012
151
AGRICLUTURE AND FISHING
13.1 Farms, Land in Farms, and Land Use: 1970 to 2008 153
13.2 Comparative Data for Farms and Land in Farms by Size of 154

STATISTICAL YEARBOOK 2012
xvii
Farm: 1998, 2003 and 2008
13.3 Land Area, Farms, Land in Farms by District and County,
Agriculture Census Years: 1998 to 2008
155
13.4 Farms, Land in Farms, and Size of Farm by Districts and
Counties: 2008
156
13.4A Farms, Land in Farms, and Size of Farm by Districts and
Counties: 2003
157
13.5 Farms, Land in Farms, and Land Use, by Districts and
Counties: 2003 and 2008
158-160
13.6 Tenure and Characteristics of Operations: 2003 and 2008 161
13.7 Field Crops, Melons, and Vegetables: 1998, 2003 and 2008 162
13.8 Fruits and Nuts: 1998, 2003 and 2008 163
13.9 Livestock, Poultry, and Their Products: 1998 and 2003 164
13.10 Agricultural Produce Sold at the Market by Type: FY2002 to
FY2012
164
13.11 Vegetables, Fruits, Coconuts, and Root Crops Sold at the
Market: FY2002 to FY2012
165-166
13.12 Local Fishing Activities: FY2002 to FY2012 167
13.13 Estimated Offshore Catch by Method: FY2002 to FY2012 167
13.14 Estimated Offshore Catch by Method and by Month: 2012 168
COMMERCE AND TRADE
14.1 Balance of Trade (All Items): FY2007 to FY2012 170
14.2 Imports by HS: 2007 to 2012 170-172
14.3 Domestic Exports by HS: 2007 to 2012 172-173
14.4 Principal Domestic Exports: 2007 to 2012 173
14.5 Principal Imports: 2007 to 2012 174
14.6 Balance of Trade by Major Partner Countries: 2007 to 2012 175-176
14.7 Trade by Region: 2007 to 2012 177
ELECTRICITY AND WATER
15.1 Electricity Generated and Sales: FY2002 to FY2012 179
15.2 Electricity Generated and Sales by Plant and by Month:
FY2010 to FY2012
180
15.3 Electricity Generated by Generator Type, and by Month:
FY2010 to FY2012 (MWh)
181
15.4 Fuel Consumption Efficiency: FY2003 to FY2012 182
15.5 Average Weighted Fuel Costs Per Gallon and Fuel Surcharges
Per KWh: FY2002 to FY2012
183
15.6 Electricity Sales by Number of Meters, and by Customer
Class: FY2002 to FY2012
184
15.7 Electricity Consumption by Customer Class: FY2002 to
FY2012
185
15.8 Water Production Versus Electricity Cost: FY2008 to
FY2012
186

STATISTICAL YEARBOOK 2012
xviii
15.9 Water Sales by Class: FY2008 to FY2012 187
15.10 Water Production Versus Sales: FY2008 to FY2012 188
15.11 Comparison of Water Production, Sales and Unaccounted for
Water (UFW): FY2008 to FY2012
188
15.12 Water Sales by Village: FY2012 189
15.13 Source of Water by District and County, American Samoa:
2010
190
NATIONAL ACCOUNTS
16.1 Gross Domestic Product: 2002 to 2012 192
16.2 Real Gross Domestic Product, Chained Dollars: 2002 to 2012 193
LIST OF FIGURES
Figure
No. Figure Title
Page
No.
1 Number of Telephone and Cell Phones: 2002 to 2012 149
2 Gross Domestic Product vs. Real Gross Domestic Product: 2002 to 2012 193
STATISTICAL YEARBOOK 2012
1
Section One
POPULATION
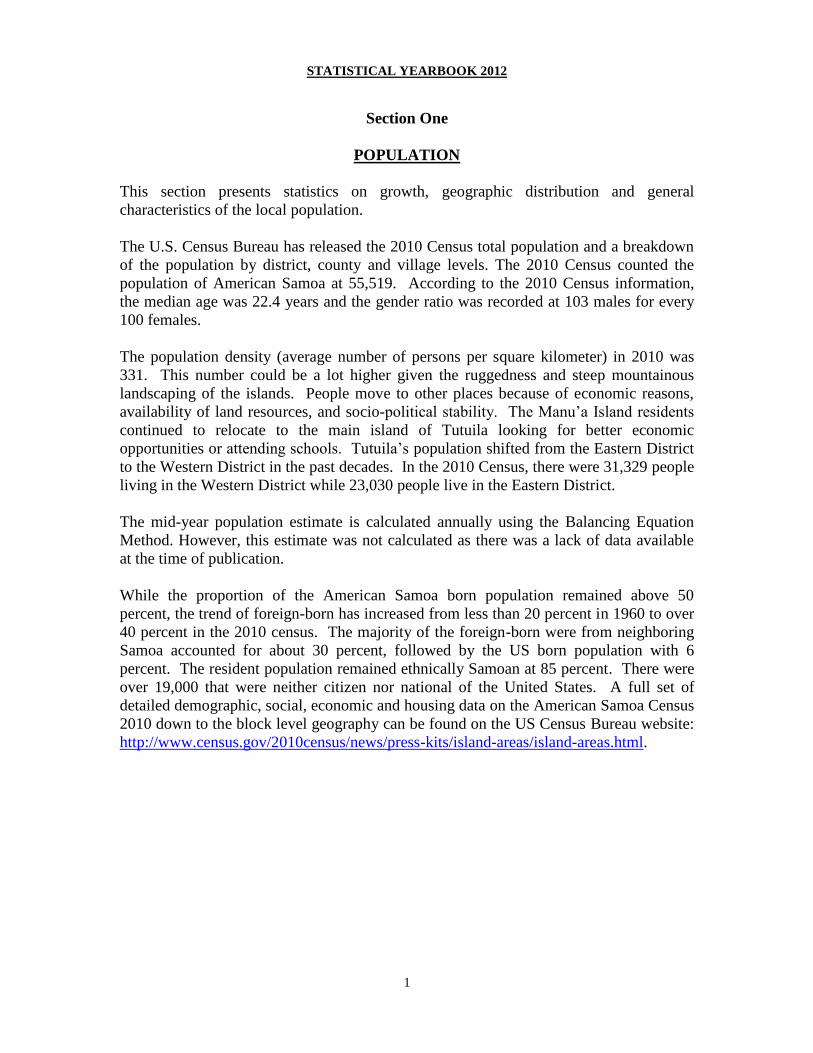
This section presents statistics on growth, geographic distribution and general
characteristics of the local population.
The U.S. Census Bureau has released the 2010 Census total population and a breakdown
of the population by district, county and village levels. The 2010 Census counted the
population of American Samoa at 55,519. According to the 2010 Census information,
the median age was 22.4 years and the gender ratio was recorded at 103 males for every
100 females.
The population density (average number of persons per square kilometer) in 2010 was
331. This number could be a lot higher given the ruggedness and steep mountainous
landscaping of the islands. People move to other places because of economic reasons,
availability of land resources, and socio-political stability. The Manu’a Island residents
continued to relocate to the main island of Tutuila looking for better economic
opportunities or attending schools. Tutuila’s population shifted from the Eastern District
to the Western District in the past decades. In the 2010 Census, there were 31,329 people
living in the Western District while 23,030 people live in the Eastern District.
The mid-year population estimate is calculated annually using the Balancing Equation
Method. However, this estimate was not calculated as there was a lack of data available
at the time of publication.
While the proportion of the American Samoa born population remained above 50
percent, the trend of foreign-born has increased from less than 20 percent in 1960 to over
40 percent in the 2010 census. The majority of the foreign-born were from neighboring
Samoa accounted for about 30 percent, followed by the US born population with 6
percent. The resident population remained ethnically Samoan at 85 percent. There were
over 19,000 that were neither citizen nor national of the United States. A full set of
detailed demographic, social, economic and housing data on the American Samoa Census
2010 down to the block level geography can be found on the US Census Bureau website:
http://www.census.gov/2010census/news/press-kits/island-areas/island-areas.html.
STATISTICAL YEARBOOK 2012
2
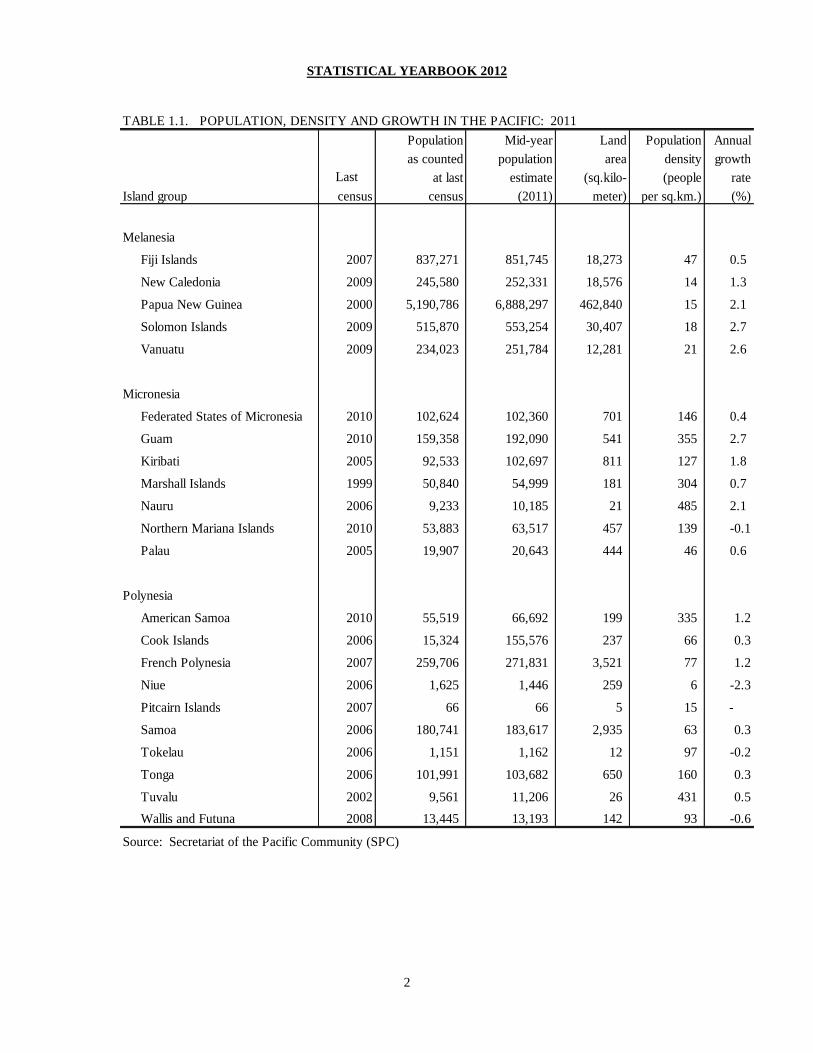
TABLE 1.1. POPULATION, DENSITY AND GROWTH IN THE PACIFIC: 2011
Population Mid-year Land Population Annual
as counted population area density growth
Last at last estimate (sq.kilo- (people rate
Island group census census (2011) meter) per sq.km.) (%)
Melanesia
Fiji Islands 2007 837,271 851,745 18,273 47 0.5
New Caledonia 2009 245,580 252,331 18,576 14 1.3
Papua New Guinea 2000 5,190,786 6,888,297 462,840 15 2.1
Solomon Islands 2009 515,870 553,254 30,407 18 2.7
Vanuatu 2009 234,023 251,784 12,281 21 2.6
Micronesia
Federated States of Micronesia 2010 102,624 102,360 701 146 0.4
Guam 2010 159,358 192,090 541 355 2.7
Kiribati 2005 92,533 102,697 811 127 1.8
Marshall Islands 1999 50,840 54,999 181 304 0.7
Nauru 2006 9,233 10,185 21 485 2.1
Northern Mariana Islands 2010 53,883 63,517 457 139 -0.1
Palau 2005 19,907 20,643 444 46 0.6
Polynesia
American Samoa 2010 55,519 66,692 199 335 1.2
Cook Islands 2006 15,324 155,576 237 66 0.3
French Polynesia 2007 259,706 271,831 3,521 77 1.2
Niue 2006 1,625 1,446 259 6 -2.3
Pitcairn Islands 2007 66 66 5 15 -
Samoa 2006 180,741 183,617 2,935 63 0.3
Tokelau 2006 1,151 1,162 12 97 -0.2
Tonga 2006 101,991 103,682 650 160 0.3
Tuvalu 2002 9,561 11,206 26 431 0.5
Wallis and Futuna 2008 13,445 13,193 142 93 -0.6
Source: Secretariat of the Pacific Community (SPC)

STATISTICAL YEARBOOK 2012
3
Table 1.2. CENSUS POPULATION, GROWTH, GENDER AND MEDIAN AGE: 1900 TO 2010
Annual
growth rate Males per Median Age
Year Total (percent) Males Females 100 females Total Males Females
2010 55,519 -3.1 28,164 27,355 103.0 22.4 21.8 23.2
2000 57,291 2.0 29,264 28,027 104.4 21.3 21.0 21.7
1990 46,773 3.7 24,023 22,750 105.6 20.9 20.6 21.2
1980 32,297 1.8 16,384 15,913 103.0 18.8 18.3 19.2
1974 29,190 1.6 14,747 14,443 102.1 17.4 16.8 17.8
1970 27,159 3.0 13,682 13,477 101.5 16.1 16.1 16.1
1960 20,051 -0.1 10,164 9,887 102.8 15.7 15.0 16.5
1956 20,154 1.0 10,107 10,047 100.6 15.7 15.0 16.4
1950 18,937 2.8 9,818 9,119 107.7 17.0 16.6 17.4
1945 16,493 4.9 8,565 7,928 108.0 .. .. ..
1940 12,908 2.5 6,612 6,296 105.0 .. .. ..
1930 10,055 3.4 5,208 4,847 107.4 .. .. ..
1926 8,763 1.4 4,494 4,269 105.3 .. .. ..
1920 8,058 1.3 4,092 3,966 103.2 .. .. ..
1912 7,251 1.3 3,836 3,415 112.3 .. .. ..
1908 6,780 2.8 3,619 3,161 114.5 .. .. ..
1903 5,888 2.8 .. .. .. .. .. ..
1901 5,563 -2.0 .. .. .. .. .. ..
1900 5,679 .. .. .. .. .. .. ..
SOURCE: U.S. Bureau of the Census, Censuses of Population; ASG Department of Commerce

STATISTICAL YEARBOOK 2012
4
Table 1.3. CENSUS POPULATION BY DISTRICT: 1900 TO 2010
Popula- Manu'a/ Manu'a/
Year tion Total Eastern Western Swains Total Eastern Western Swains
2010 55,519 54,359 23,030 31,329 1,160 100.0 41.5 56.4 2.1
2000 57,291 55,876 23,441 32,435 1,415 100.0 40.9 56.6 2.5
1990 46,773 45,043 21,175 23,868 1,730 100.0 45.3 51.0 3.7
1980 32,297 30,538 17,311 13,227 1,759 100.0 53.6 41.0 5.4
1974 29,190 27,348 16,828 10,520 1,842 100.0 57.6 36.0 6.3
1970 27,159 24,973 15,955 9,018 2,186 100.0 58.7 33.2 8.0
1960 20,051 17,250 11,137 6,113 2,801 100.0 55.5 30.5 14.0
1956 20,154 17,307 11,405 5,902 2,847 100.0 56.6 29.3 14.1
1950 18,937 15,954 10,624 5,330 2,983 100.0 56.1 28.1 15.8
1940 12,908 10,164 6,733 3,431 2,744 100.0 52.2 26.6 21.3
1930 10,055 7,809 5,032 2,777 2,246 100.0 50.0 27.6 22.3
1926 8,763 6,616 4,221 2,395 2,147 100.0 48.2 27.3 24.5
1920 8,058 6,185 3,777 2,408 1,873 100.0 46.9 29.9 23.2
1912 7,251 5,454 3,186 2,268 1,797 100.0 43.9 31.3 24.8
1908 6,780 4,925 3,018 1,907 1,855 100.0 44.5 28.1 27.4
1903 5,888 4,193 2,441 1,752 1,695 100.0 41.5 29.8 28.8
1901 5,563 3,960 2,342 1,618 1,603 100.0 42.1 29.1 28.8
1900 5,679 3,923 2,221 1,702 1,756 100.0 39.1 30.0 30.9
SOURCE: U.S. Bureau of the Census, Censuses of Population; ASG Department of Commerce
Tutuila/Districts Percent distribution
Table 1.4. MID-YEAR POPULATION ESTIMATES: 2001 TO 2010
Year Population
2010 67,380
2009 70,100
2008 69,200
2007 68,200
2006 66,900
2005 65,500
2004 64,100
2003 62,600
2002 60,800
2001 59,400
Note: Population Estimates for 2011 and 2012 are not available.
SOURCE: Department of Commerce, Statistics Division.

STATISTICAL YEARBOOK 2012
5
Table 1.5. MIGRATION AND NATURAL INCREASE: 1970 TO 2010
2000 to 1990 to 1980 to 1974 to 1970 to
Component 2010 2000 1990 1980 1974
1. First census population 57,291 46,773 32,297 29,190 27,159
2. Second census population 55,519 57,291 46,773 32,297 29,190
3. Net increase -1,772 10,518 14,476 3,107 2,031
4. Births 16,782 17,882 14,150 5,945 4,143
5. Deaths 2,912 2,371 1,601 724 602
6. Natural increase 13,870 15,511 12,549 5,221 3,541
7. Apparent net migration -15,642 -4,993 1,927 -2,114 -1,510
8. Percent intercensal increase -3 22 45 11 7
9. Percent intercensal natural increase 24 33 39 18 13
10. Percent intercensal net migration -27 -11 6 -7 -6
11. Annual rate of growth (percent) -0.3 2.0 4 2 2
SOURCE: ASG Department of Commerce; LBJ Medical Center
Table 1.6. BIRTHPLACE BY DISTRICT AND COUNTY, AMERICAN SAMOA: 2010
Born
Born in Outside Other
District American American Pacific Phili- Cali- Else-
County Total Samoa Samoa Total Samoa Tonga Island Total ppines Total fornia Hawaii where
DISTRICTS
American Samoa 55,519 31,964 23,555 18,158 16,350 1,035 773 1,801 1,061 3,423 1,242 1,164 173
Eastern District 23,030 14,084 8,946 6,588 6,167 207 214 970 535 1,307 489 476 81
Manu'a District 1,143 896 247 142 132 5 5 7 4 98 40 29 -
Swains Island 17 8 9 5 4 - 1 1 1 3 - - -
Western District 31,329 16,976 14,353 11,423 10,047 823 553 823 521 2,015 713 659 92
COUNTIES
Ituau 4,676 2,750 1,926 1,303 1,194 51 58 308 205 300 132 94 15
Ma'oputasi 10,299 6,206 4,093 2,996 2,782 98 116 519 239 534 194 181 44
Sa'ole 2,187 1,382 805 610 568 29 13 71 44 119 39 52 5
Sua 3,323 2,098 1,225 941 897 22 22 52 38 219 82 85 13
Vaifanua 2,545 1,648 897 738 726 7 5 20 9 135 42 64 4
Faleasao 162 118 44 25 23 - 2 6 4 13 5 4 -
Fitiuta 270 223 47 31 27 3 1 1 - 15 5 5 -
Ofu 176 138 38 19 17 1 1 - - 19 4 7 -
Olosega 177 138 39 25 25 - - - - 14 10 - -
Ta'u 358 279 79 42 40 1 1 - - 37 16 13 -
Swains Island 17 8 9 5 4 - 1 1 1 3 - - -
Lealataua 5,103 2,993 2,110 1,620 1,516 53 51 94 62 386 140 137 10
Leasina 1,807 1,049 758 649 632 9 8 13 3 94 32 40 2
Tualatai 3,561 1,685 1,876 1,635 1,567 21 47 45 24 184 61 74 12
Tualauta 20,858 11,249 9,609 7,519 6,332 740 447 671 432 1,351 480 408 68
Source: 2010 American Samoa Census Profile
Asia United States
Born Outside American Samoa

STATISTICAL YEARBOOK 2012
6
Table 1.7. POPULATION BY VILLAGE: 1980 TO 2010
Place 2010 2000 1990 1980
Total 55,519 57,291 46,773 32,297
Aasu 494 364 341 214
Afao 182 188 145 80
Afono 524 530 434 284
Agugulu 51 45 42 38
Alao 495 528 463 274
Alaufau (a) .. .. ..
Alega 54 54 49 30
Alofau 646 495 458 418
Amaluia 162 179 206 215
Amanave 250 287 378 269
Amaua 96 102 128 90
Amouli 920 520 463 363
Anasosopo (b) .. .. .. ..
Anua 18 265 65 50
Aoa 855 507 491 304
Aoloau 615 778 544 398
Asili 224 250 203 145
Atu'u 359 413 408 377
Aua 2,077 2,193 1,896 1,379
Auasi 113 125 122 117
Auma 254 .. .. ..
Aumi 186 249 228 155
Aunu'u 436 476 463 414
Auto 262 258 255 201
Avaio 44 57 50 55
Avau (c) .. .. .. ..
Faga'alu 910 1,006 1,006 757
Faga'itua 433 483 455 422
Fagali'i 247 259 206 112
Fagamalo 47 39 92 68
Faganeanea 150 183 168 191
Fagasa 831 900 717 657
Fagatogo 1,737 2,096 2,323 1,944
Failolo 108 128 81 76
Faleasao 162 135 246 263
Faleniu 1,898 2,056 833 544
Fatumafuti 113 103 81 76
Foga'au (d) .. .. .. ..
Futiga 723 731 720 322
Ili'ili 3,195 2,513 1,790 970
Lauli'i 892 937 814 600
Continued on next page.

STATISTICAL YEARBOOK 2012
7
Table 1.7. POPULATION BY VILLAGE: 1980 TO 2010 (continued)
Place 2010 2000 1990 1980
Leloaloa 448 534 412 414
Leone 1,919 3,568 3,013 1,652
Lepine (e) .. .. .. ..
Leusoali'i 117 181 247 201
Luma 183 288 293 236
Maia 153 177 207 206
Malaeimi 1,182 1,067 830 717
Malaeloa/Aitulagi 698 597 585 631
Malaeloa/Ituau 550 627 523 467
Maloata 8 17 16 13
Mapusagafou 1,126 1,642 1,133 758
Mapusagatuai (f) .. .. .. ..
Masausi 164 178 157 107
Masefau 425 435 389 320
Matu'u 399 385 364 239
Mesepa 444 481 483 346
Nua 141 207 267 182
Nu'uuli 3,955 5,154 3,893 2,585
Ofu 176 289 353 345
Olosega 172 206 201 211
Onenoa 150 153 136 140
Pagai 118 122 107 ..
Pago Pago 3,656 4,278 3,519 3,075
Pava'ia'i 2,450 2,200 1,692 1,031
Poloa 193 203 176 126
Puapua 965 .. .. ..
Sa'ilele 75 100 130 117
Satala 297
Se'etaga 299 270 228 207
Sili 5 10 24 38
Si'ufaga 175 92 143 232
Swains 17 37 16 27
Tafananai (g) .. .. .. 83
Tafuna 7,945 8,409 5,174 1,086
Taputimu 841 640 520 434
Tula 405 413 423 347
Utulei 684 807 930 980
Utumea East 48 64 57 47
Utumea West 53 44 53 46
Utusia (h) 74 .. .. 44
Vailoatai 1,447 989 805 677
Vaitogi 1,959 1,347 1,302 664
Vatia 640 648 608 394
NOTE: (a) Alaufau was included in Ofu Village since the 1980 Census.
(b) Anasosopo was included in Aua since the 1980 Census.
(c) Avau was included in Nu'uuli since the 1980 Census.
(d) Foga'au was included in Amouli since the 1980 Census.
(e) Lepine was included in Nu'uuli since the 1980 Census.
(f) Mapusagatuai was listed as Mesepa since the 1980 Census.
(g) Tafananai was included in Laulii since the 1990 Census.
(h) Utusia was included in Fagaitua since the 1990 Census.
SOURCE: U.S. Bureau of Census; Census of Population, ASG Department of
Commerce.
STATISTICAL YEARBOOK 2012
8
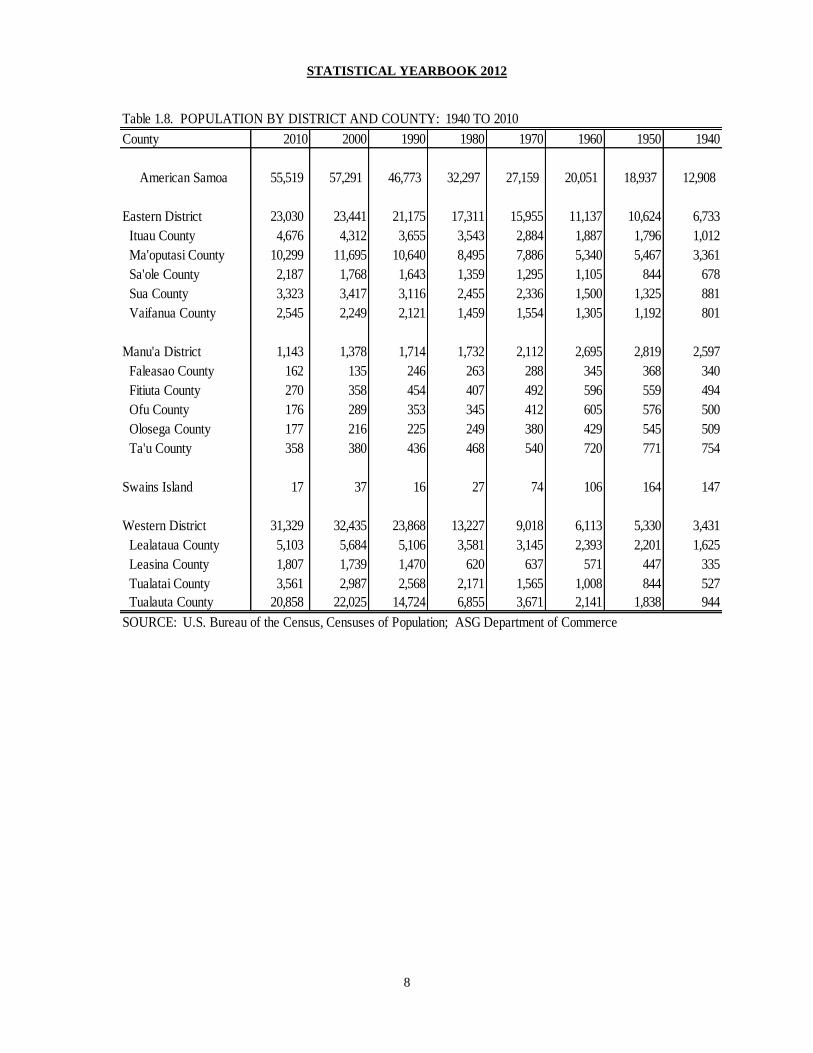
Table 1.8. POPULATION BY DISTRICT AND COUNTY: 1940 TO 2010
County 2010 2000 1990 1980 1970 1960 1950 1940
American Samoa 55,519 57,291 46,773 32,297 27,159 20,051 18,937 12,908
Eastern District 23,030 23,441 21,175 17,311 15,955 11,137 10,624 6,733
Ituau County 4,676 4,312 3,655 3,543 2,884 1,887 1,796 1,012
Ma'oputasi County 10,299 11,695 10,640 8,495 7,886 5,340 5,467 3,361
Sa'ole County 2,187 1,768 1,643 1,359 1,295 1,105 844 678
Sua County 3,323 3,417 3,116 2,455 2,336 1,500 1,325 881
Vaifanua County 2,545 2,249 2,121 1,459 1,554 1,305 1,192 801
Manu'a District 1,143 1,378 1,714 1,732 2,112 2,695 2,819 2,597
Faleasao County 162 135 246 263 288 345 368 340
Fitiuta County 270 358 454 407 492 596 559 494
Ofu County 176 289 353 345 412 605 576 500
Olosega County 177 216 225 249 380 429 545 509
Ta'u County 358 380 436 468 540 720 771 754
Swains Island 17 37 16 27 74 106 164 147
Western District 31,329 32,435 23,868 13,227 9,018 6,113 5,330 3,431
Lealataua County 5,103 5,684 5,106 3,581 3,145 2,393 2,201 1,625
Leasina County 1,807 1,739 1,470 620 637 571 447 335
Tualatai County 3,561 2,987 2,568 2,171 1,565 1,008 844 527
Tualauta County 20,858 22,025 14,724 6,855 3,671 2,141 1,838 944
SOURCE: U.S. Bureau of the Census, Censuses of Population; ASG Department of Commerce
STATISTICAL YEARBOOK 2012
9
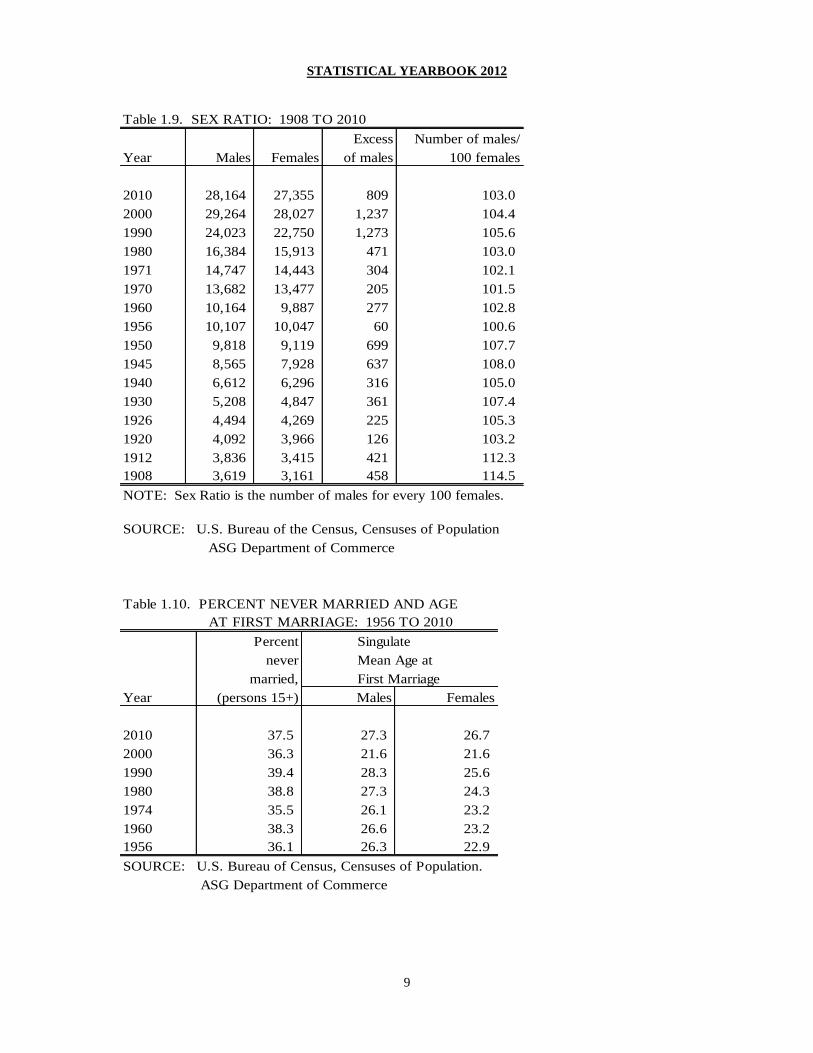
Table 1.9. SEX RATIO: 1908 TO 2010
Excess Number of males/
Year Males Females of males 100 females
2010 28,164 27,355 809 103.0
2000 29,264 28,027 1,237 104.4
1990 24,023 22,750 1,273 105.6
1980 16,384 15,913 471 103.0
1971 14,747 14,443 304 102.1
1970 13,682 13,477 205 101.5
1960 10,164 9,887 277 102.8
1956 10,107 10,047 60 100.6
1950 9,818 9,119 699 107.7
1945 8,565 7,928 637 108.0
1940 6,612 6,296 316 105.0
1930 5,208 4,847 361 107.4
1926 4,494 4,269 225 105.3
1920 4,092 3,966 126 103.2
1912 3,836 3,415 421 112.3
1908 3,619 3,161 458 114.5
NOTE: Sex Ratio is the number of males for every 100 females.
SOURCE: U.S. Bureau of the Census, Censuses of Population
ASG Department of Commerce
Table 1.10. PERCENT NEVER MARRIED AND AGE
AT FIRST MARRIAGE: 1956 TO 2010
Percent Singulate
never Mean Age at
married, First Marriage
Year (persons 15+) Males Females
2010 37.5 27.3 26.7
2000 36.3 21.6 21.6
1990 39.4 28.3 25.6
1980 38.8 27.3 24.3
1974 35.5 26.1 23.2
1960 38.3 26.6 23.2
1956 36.1 26.3 22.9
SOURCE: U.S. Bureau of Census, Censuses of Population.
ASG Department of Commerce
STATISTICAL YEARBOOK 2012
10
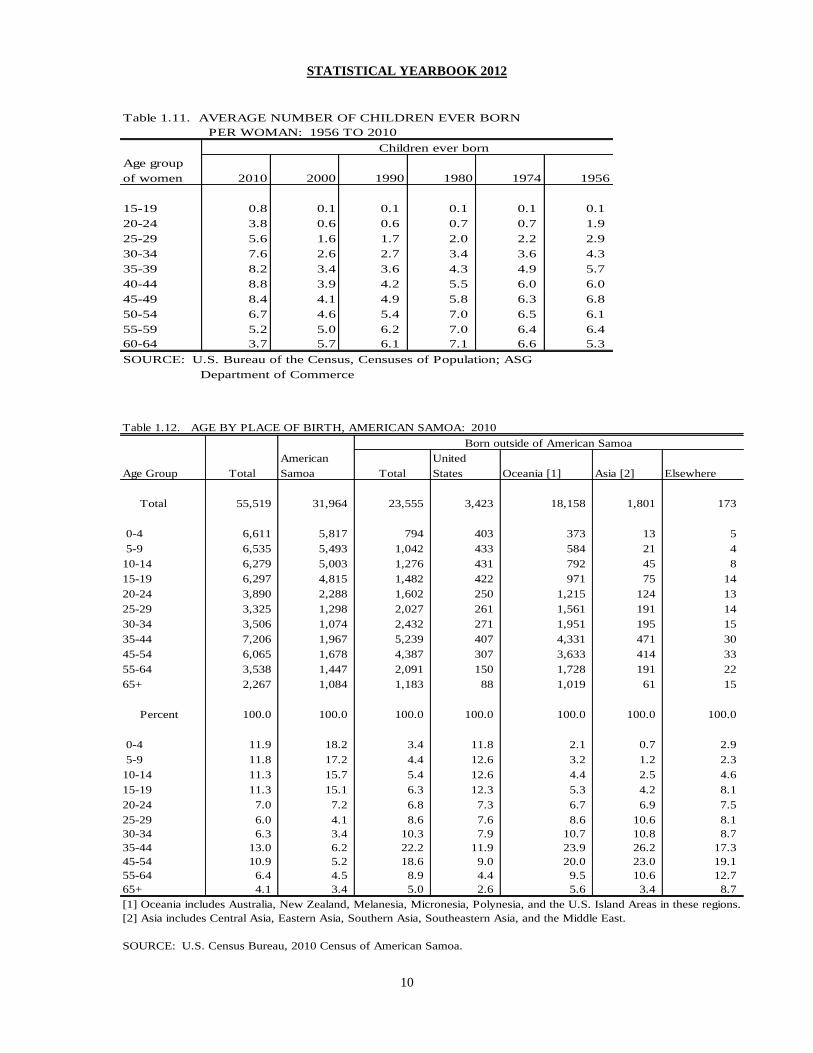
Table 1.11. AVERAGE NUMBER OF CHILDREN EVER BORN
PER WOMAN: 1956 TO 2010
Age group
of women 2010 2000 1990 1980 1974 1956
15-19 0.8 0.1 0.1 0.1 0.1 0.1
20-24 3.8 0.6 0.6 0.7 0.7 1.9
25-29 5.6 1.6 1.7 2.0 2.2 2.9
30-34 7.6 2.6 2.7 3.4 3.6 4.3
35-39 8.2 3.4 3.6 4.3 4.9 5.7
40-44 8.8 3.9 4.2 5.5 6.0 6.0
45-49 8.4 4.1 4.9 5.8 6.3 6.8
50-54 6.7 4.6 5.4 7.0 6.5 6.1
55-59 5.2 5.0 6.2 7.0 6.4 6.4
60-64 3.7 5.7 6.1 7.1 6.6 5.3
SOURCE: U.S. Bureau of the Census, Censuses of Population; ASG
Department of Commerce
Children ever born
Table 1.12. AGE BY PLACE OF BIRTH, AMERICAN SAMOA: 2010
American United
Age Group Total Samoa Total States Oceania [1] Asia [2] Elsewhere
Total 55,519 31,964 23,555 3,423 18,158 1,801 173
0-4 6,611 5,817 794 403 373 13 5
5-9 6,535 5,493 1,042 433 584 21 4
10-14 6,279 5,003 1,276 431 792 45 8
15-19 6,297 4,815 1,482 422 971 75 14
20-24 3,890 2,288 1,602 250 1,215 124 13
25-29 3,325 1,298 2,027 261 1,561 191 14
30-34 3,506 1,074 2,432 271 1,951 195 15
35-44 7,206 1,967 5,239 407 4,331 471 30
45-54 6,065 1,678 4,387 307 3,633 414 33
55-64 3,538 1,447 2,091 150 1,728 191 22
65+ 2,267 1,084 1,183 88 1,019 61 15
Percent 100.0 100.0 100.0 100.0 100.0 100.0 100.0
0-4 11.9 18.2 3.4 11.8 2.1 0.7 2.9
5-9 11.8 17.2 4.4 12.6 3.2 1.2 2.3
10-14 11.3 15.7 5.4 12.6 4.4 2.5 4.6
15-19 11.3 15.1 6.3 12.3 5.3 4.2 8.1
20-24 7.0 7.2 6.8 7.3 6.7 6.9 7.5
25-29 6.0 4.1 8.6 7.6 8.6 10.6 8.1
30-34 6.3 3.4 10.3 7.9 10.7 10.8 8.7
35-44 13.0 6.2 22.2 11.9 23.9 26.2 17.3
45-54 10.9 5.2 18.6 9.0 20.0 23.0 19.1
55-64 6.4 4.5 8.9 4.4 9.5 10.6 12.7
65+ 4.1 3.4 5.0 2.6 5.6 3.4 8.7
[1] Oceania includes Australia, New Zealand, Melanesia, Micronesia, Polynesia, and the U.S. Island Areas in these regions.
[2] Asia includes Central Asia, Eastern Asia, Southern Asia, Southeastern Asia, and the Middle East.
SOURCE: U.S. Census Bureau, 2010 Census of American Samoa.
Born outside of American Samoa
STATISTICAL YEARBOOK 2012
11
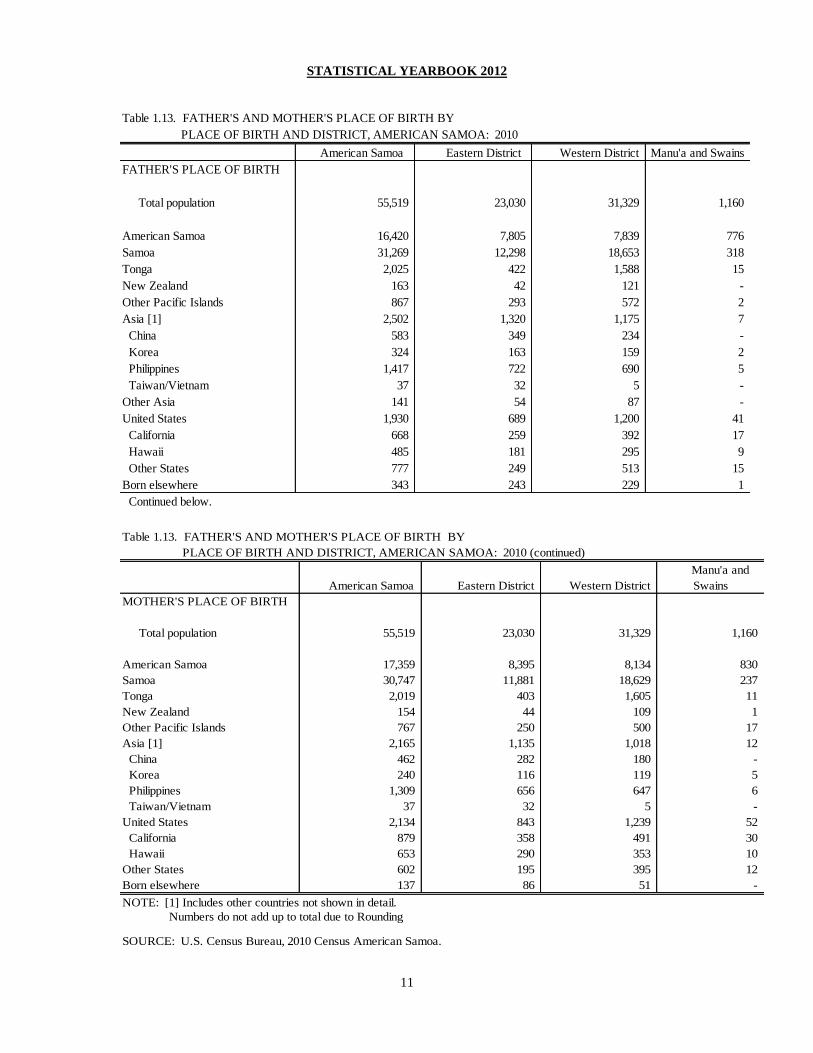
Table 1.13. FATHER'S AND MOTHER'S PLACE OF BIRTH BY
PLACE OF BIRTH AND DISTRICT, AMERICAN SAMOA: 2010
American Samoa Eastern District Western District Manu'a and Swains
FATHER'S PLACE OF BIRTH
Total population 55,519 23,030 31,329 1,160
American Samoa 16,420 7,805 7,839 776
Samoa 31,269 12,298 18,653 318
Tonga 2,025 422 1,588 15
New Zealand 163 42 121 -
Other Pacific Islands 867 293 572 2
Asia [1] 2,502 1,320 1,175 7
China 583 349 234 -
Korea 324 163 159 2
Philippines 1,417 722 690 5
Taiwan/Vietnam 37 32 5 -
Other Asia 141 54 87 -
United States 1,930 689 1,200 41
California 668 259 392 17
Hawaii 485 181 295 9
Other States 777 249 513 15
Born elsewhere 343 243 229 1
Continued below. Table 1.13. FATHER'S AND MOTHER'S PLACE OF BIRTH BY
PLACE OF BIRTH AND DISTRICT, AMERICAN SAMOA: 2010 (continued)
American Samoa Eastern District Western District
Manu'a and
Swains
MOTHER'S PLACE OF BIRTH
Total population 55,519 23,030 31,329 1,160
American Samoa 17,359 8,395 8,134 830
Samoa 30,747 11,881 18,629 237
Tonga 2,019 403 1,605 11
New Zealand 154 44 109 1
Other Pacific Islands 767 250 500 17
Asia [1] 2,165 1,135 1,018 12
China 462 282 180 -
Korea 240 116 119 5
Philippines 1,309 656 647 6
Taiwan/Vietnam 37 32 5 -
United States 2,134 843 1,239 52
California 879 358 491 30
Hawaii 653 290 353 10
Other States 602 195 395 12
Born elsewhere 137 86 51 -
NOTE: [1] Includes other countries not shown in detail.
Numbers do not add up to total due to Rounding
SOURCE: U.S. Census Bureau, 2010 Census American Samoa.
STATISTICAL YEARBOOK 2012
12
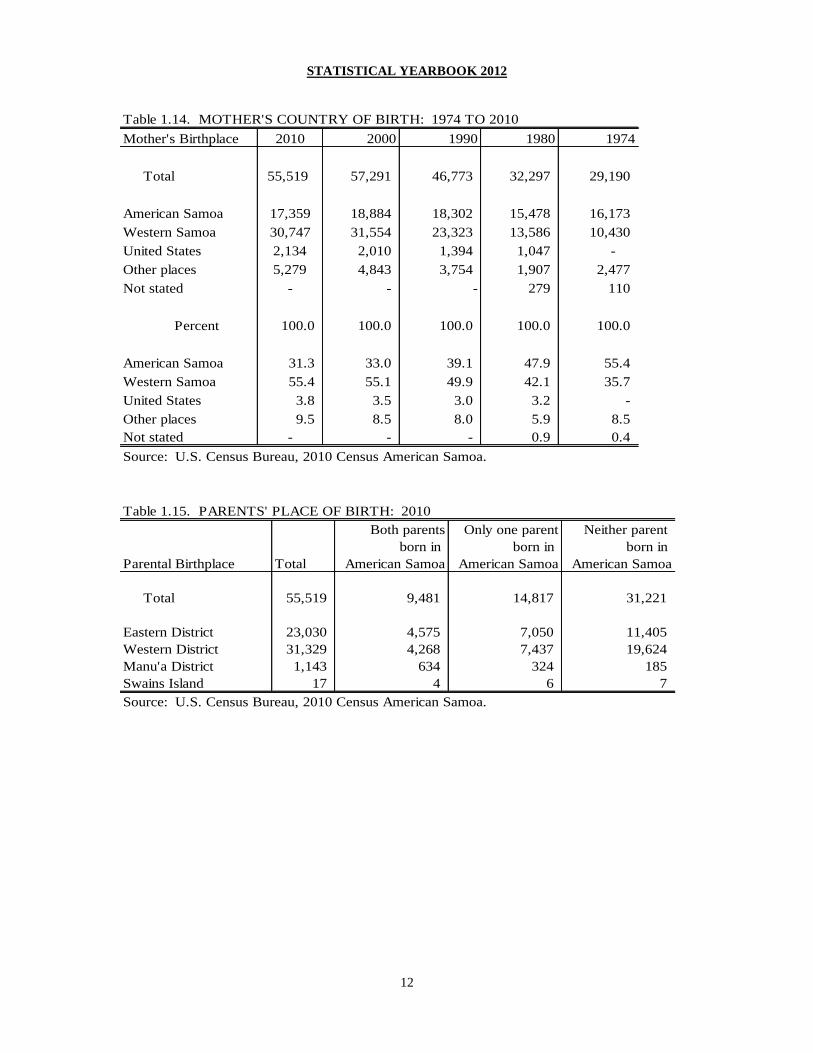
Table 1.14. MOTHER'S COUNTRY OF BIRTH: 1974 TO 2010
Mother's Birthplace 2010 2000 1990 1980 1974
Total 55,519 57,291 46,773 32,297 29,190
American Samoa 17,359 18,884 18,302 15,478 16,173
Western Samoa 30,747 31,554 23,323 13,586 10,430
United States 2,134 2,010 1,394 1,047 -
Other places 5,279 4,843 3,754 1,907 2,477
Not stated - - - 279 110
Percent 100.0 100.0 100.0 100.0 100.0
American Samoa 31.3 33.0 39.1 47.9 55.4
Western Samoa 55.4 55.1 49.9 42.1 35.7
United States 3.8 3.5 3.0 3.2 -
Other places 9.5 8.5 8.0 5.9 8.5
Not stated - - - 0.9 0.4
Source: U.S. Census Bureau, 2010 Census American Samoa.
Table 1.15. PARENTS' PLACE OF BIRTH: 2010
Both parents Only one parent Neither parent
born in born in born in
Parental Birthplace Total American Samoa American Samoa American Samoa
Total 55,519 9,481 14,817 31,221
Eastern District 23,030 4,575 7,050 11,405
Western District 31,329 4,268 7,437 19,624
Manu'a District 1,143 634 324 185
Swains Island 17 4 6 7
Source: U.S. Census Bureau, 2010 Census American Samoa.
STATISTICAL YEARBOOK 2012
13
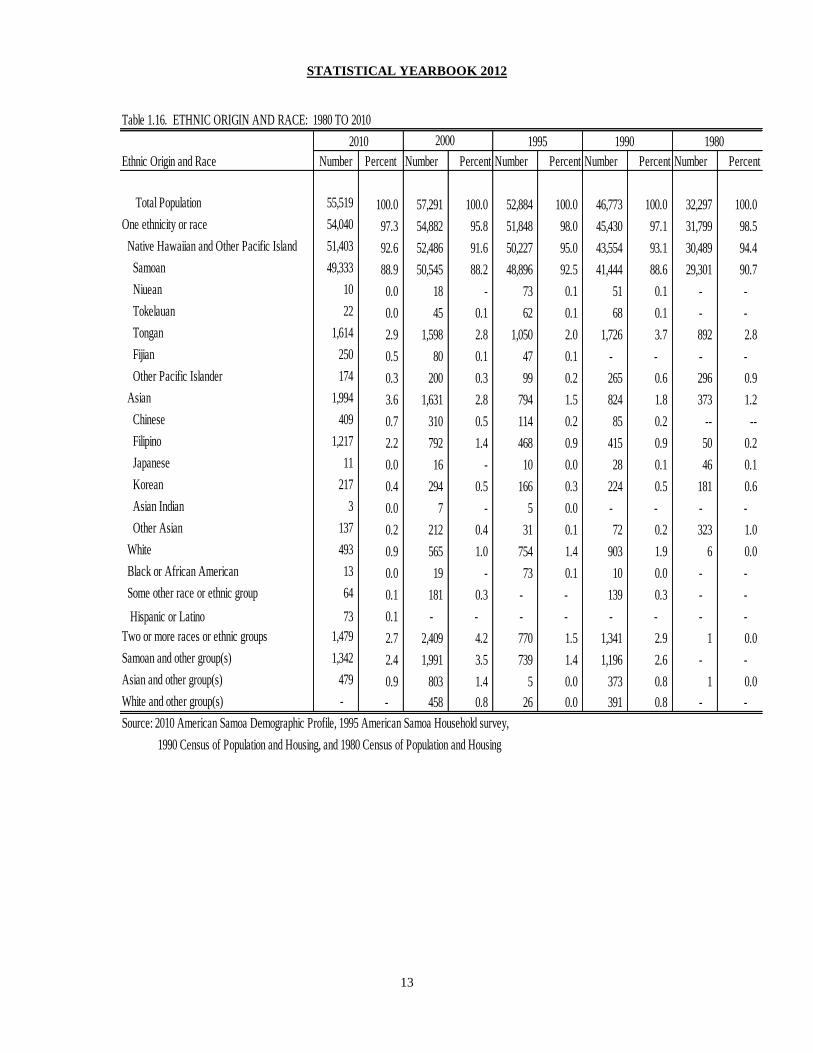
Table 1.16. ETHNIC ORIGIN AND RACE: 1980 TO 2010
2000 1995 1990 1980
Ethnic Origin and Race Number Percent Number Percent Number Percent Number Percent Number Percent
Total Population 55,519 100.0 57,291 100.0 52,884 100.0 46,773 100.0 32,297 100.0
One ethnicity or race 54,040 97.3 54,882 95.8 51,848 98.0 45,430 97.1 31,799 98.5
Native Hawaiian and Other Pacific Island 51,403 92.6 52,486 91.6 50,227 95.0 43,554 93.1 30,489 94.4
Samoan 49,333 88.9 50,545 88.2 48,896 92.5 41,444 88.6 29,301 90.7
Niuean 10 0.0 18 - 73 0.1 51 0.1 - -
Tokelauan 22 0.0 45 0.1 62 0.1 68 0.1 - -
Tongan 1,614 2.9 1,598 2.8 1,050 2.0 1,726 3.7 892 2.8
Fijian 250 0.5 80 0.1 47 0.1 - - - -
Other Pacific Islander 174 0.3 200 0.3 99 0.2 265 0.6 296 0.9
Asian 1,994 3.6 1,631 2.8 794 1.5 824 1.8 373 1.2
Chinese 409 0.7 310 0.5 114 0.2 85 0.2 -- --
Filipino 1,217 2.2 792 1.4 468 0.9 415 0.9 50 0.2
Japanese 11 0.0 16 - 10 0.0 28 0.1 46 0.1
Korean 217 0.4 294 0.5 166 0.3 224 0.5 181 0.6
Asian Indian 3 0.0 7 - 5 0.0 - - - -
Other Asian 137 0.2 212 0.4 31 0.1 72 0.2 323 1.0
White 493 0.9 565 1.0 754 1.4 903 1.9 6 0.0
Black or African American 13 0.0 19 - 73 0.1 10 0.0 - -
Some other race or ethnic group 64 0.1 181 0.3 - - 139 0.3 - -
Hispanic or Latino 73 0.1 - - - - - - - -
Two or more races or ethnic groups 1,479 2.7 2,409 4.2 770 1.5 1,341 2.9 1 0.0
Samoan and other group(s) 1,342 2.4 1,991 3.5 739 1.4 1,196 2.6 - -
Asian and other group(s) 479 0.9 803 1.4 5 0.0 373 0.8 1 0.0
White and other group(s) - - 458 0.8 26 0.0 391 0.8 - -
Source: 2010 American Samoa Demographic Profile, 1995 American Samoa Household survey,
1990 Census of Population and Housing, and 1980 Census of Population and Housing
2010
STATISTICAL YEARBOOK 2012
14
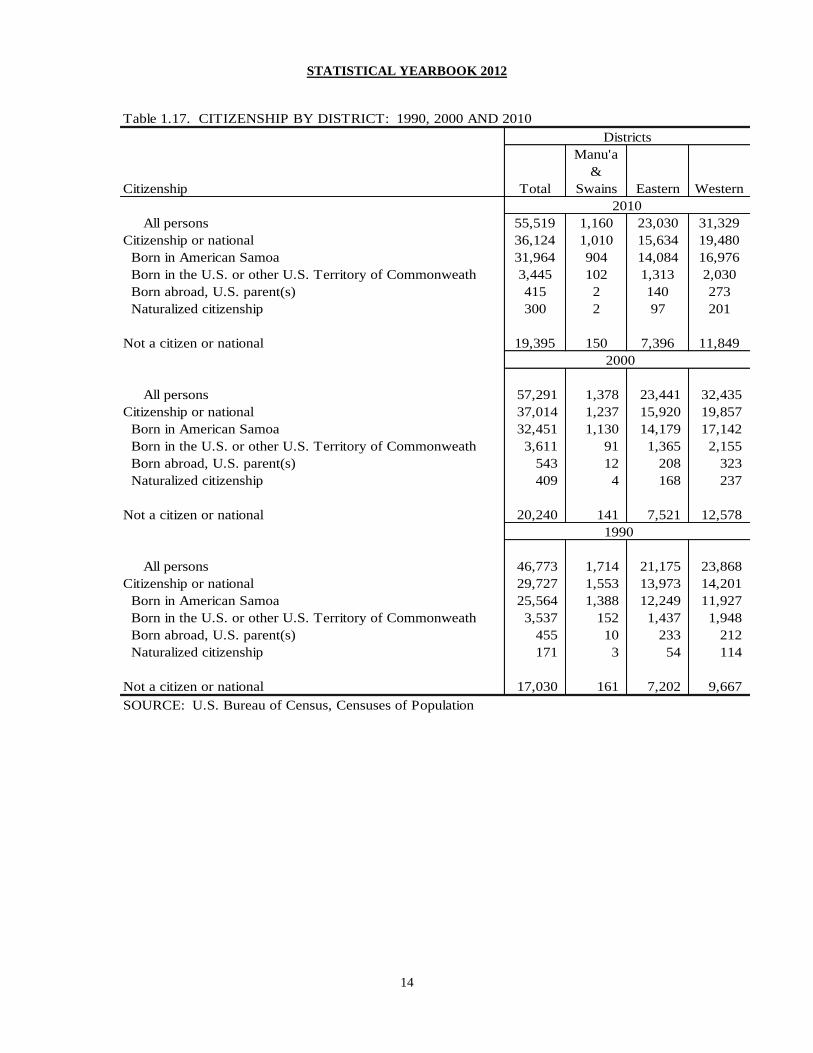
Table 1.17. CITIZENSHIP BY DISTRICT: 1990, 2000 AND 2010
Citizenship Total
Manu'a
&
Swains Eastern Western
All persons 55,519 1,160 23,030 31,329
Citizenship or national 36,124 1,010 15,634 19,480
Born in American Samoa 31,964 904 14,084 16,976
Born in the U.S. or other U.S. Territory of Commonweath 3,445 102 1,313 2,030
Born abroad, U.S. parent(s) 415 2 140 273
Naturalized citizenship 300 2 97 201
Not a citizen or national 19,395 150 7,396 11,849
2000
All persons 57,291 1,378 23,441 32,435
Citizenship or national 37,014 1,237 15,920 19,857
Born in American Samoa 32,451 1,130 14,179 17,142
Born in the U.S. or other U.S. Territory of Commonweath 3,611 91 1,365 2,155
Born abroad, U.S. parent(s) 543 12 208 323
Naturalized citizenship 409 4 168 237
Not a citizen or national 20,240 141 7,521 12,578
1990
All persons 46,773 1,714 21,175 23,868
Citizenship or national 29,727 1,553 13,973 14,201
Born in American Samoa 25,564 1,388 12,249 11,927
Born in the U.S. or other U.S. Territory of Commonweath 3,537 152 1,437 1,948
Born abroad, U.S. parent(s) 455 10 233 212
Naturalized citizenship 171 3 54 114
Not a citizen or national 17,030 161 7,202 9,667
SOURCE: U.S. Bureau of Census, Censuses of Population
2010
Districts

STATISTICAL YEARBOOK 2012
15
Table 1.18. HOUSEHOLD BY TYPE: 1980 TO 2010
Household by type Number Percent Number Percent Number Percent Number Percent
Total households 9,688 100.0 9349 100.0 6,607 100.0 4,455 100.0
Family households (families) 8,834 0.9 8706 93.1 6,301 95.4 4,287 96.2
With own children under 18 years 5,630 0.6 6279 67.4 4,605 69.7 3,311 74.3
Married-couple families 6,501 0.7 6596 70.6 5,153 78.0 3,475 78.0
With own children under 18 years 4,728 0.5 5261 56.3 4,105 62.1 2,911 65.3
Female householder, no husband present 1,630 0.2 1398 15.0 768 11.6 546 12.3
With own children under 18 years 625 0.1 640 6.8 345 5.2 295 6.6
Nonfamily households 854 0.1 643 6.9 306 4.6 168 3.8
Householder living alone 700 0.1 529 5.7 -- -- 114 2.6
Householder 65 years and over 108 0.0 68 0.7 -- -- 16 0.4
Households with individuals under 18 years 7,375 0.8 7598 81.3 -- -- -- --
Households with individuals 65 years and over 1,883 0.2 1591 17.0 -- -- -- --
Average household size 5.6 -- 6.0 -- 6.2 -- 7.2 0.2
Average family size 5.9 -- 6.2 -- -- -- 7.3 0.2
SOURCE: 2010 American Samoa Demographic Profile; 2000 Census of Population;
1990 Census of Population and Housing; and 1980 Census of Population and Housing.
2010 2000 1990 1980
Table 1.19. PLACE OF BIRTH: 1980 TO 2010
2010 2000 1995 1990 1980
Place of Birth Number Percent Number
Perce
nt Number Percent Number Percent Number Percent
Total population 55,519 100.0 57,291 100.0 52,884 100.0 46,773 100.0 32,297 100.0
Born in American Samoa 31,964 57.6 32,470 56.7 33,722 63.8 25,573 54.7 18,586 57.5
Born outside American Samoa 23,555 42.4 24,821 43.3 19,099 36.1 21,200 45.3 13,711 42.5
Fiji 301 0.5 153 0.3 - - - - - -
New Zealand 221 0.4 230 0.4 187 0.4 238 0.5 - -
Samoa 16,350 29.4 17,712 30.9 14,165 26.8 14,714 31.5 9,686 30.0
Tokelau 13 0.0 27 - 26 0.0 30 0.1 - -
Tonga 1,035 1.9 1,146 2.0 811 1.5 1,308 2.8 796 2.5
Other Pacific Island 238 0.4 260 0.5 250 0.5 311 0.7 24 0.1
Asia 1,801 3.2 1,459 2.5 660 1.2 735 1.6 268 0.8
China 408 0.7 165 0.3 99 0.2 37 0.1 - -
Korea 193 0.3 183 0.3 130 0.2 202 0.4 142 0.4
Philippines 1,061 1.9 664 1.2 369 0.7 380 0.8 38 0.1
Taiwan - - 187 0.3 - - 63 0.1 23 0.1
Vietnam 36 0.1 204 0.4 - - 1 0.0 - -
United States 3,423 6.2 3,592 6.3 2,808 5.3 3,519 7.5 2,189 6.8
California 1,242 2.2 1,494 2.6 946 1.8 1,622 3.5 842 2.6
Hawaii 1,164 2.1 1,171 2.0 816 1.5 1,076 2.3 541 1.7
Elsewhere 173 0.3 242 0.4 192 0.4 310 0.7 287 0.9
SOURCE: U.S. Census Bureau, 2010 Census American Samoa, 1995 American Samoa Household
Survey, 1990 Census of Population and Housing, and 1980 Census of Population and Housing.
STATISTICAL YEARBOOK 2012
16
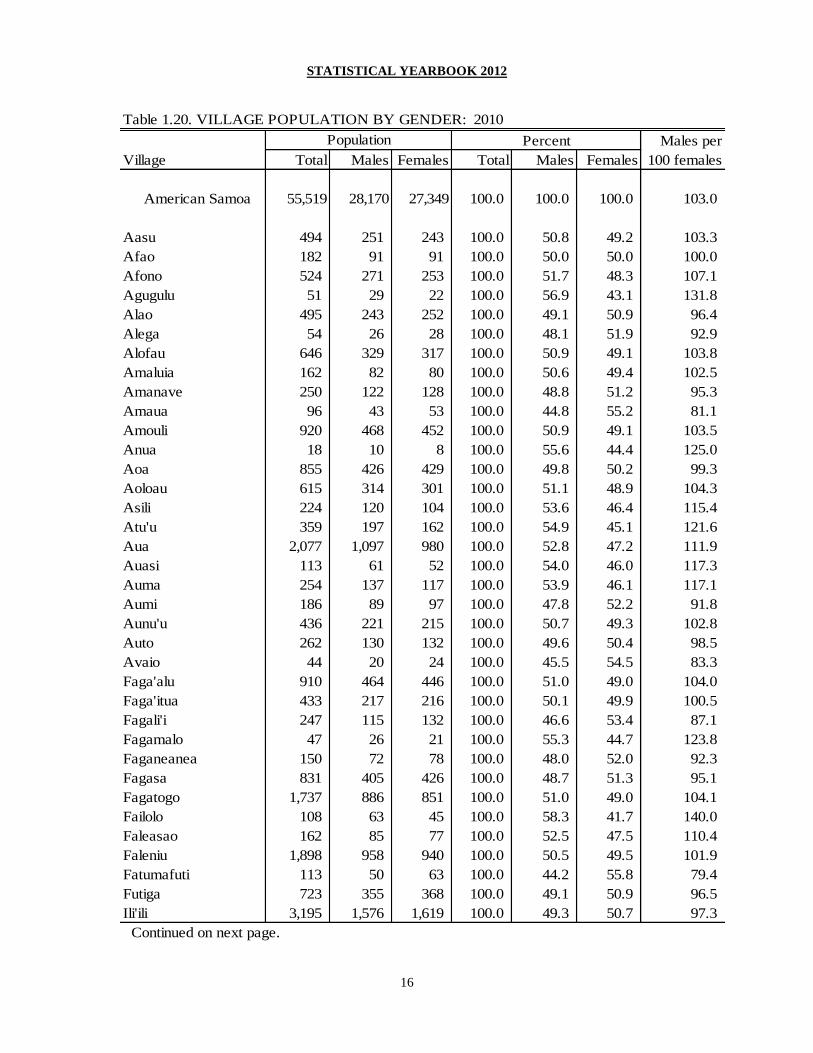
Table 1.20. VILLAGE POPULATION BY GENDER: 2010
Males per
Village Total Males Females Total Males Females 100 females
American Samoa 55,519 28,170 27,349 100.0 100.0 100.0 103.0
Aasu 494 251 243 100.0 50.8 49.2 103.3
Afao 182 91 91 100.0 50.0 50.0 100.0
Afono 524 271 253 100.0 51.7 48.3 107.1
Agugulu 51 29 22 100.0 56.9 43.1 131.8
Alao 495 243 252 100.0 49.1 50.9 96.4
Alega 54 26 28 100.0 48.1 51.9 92.9
Alofau 646 329 317 100.0 50.9 49.1 103.8
Amaluia 162 82 80 100.0 50.6 49.4 102.5
Amanave 250 122 128 100.0 48.8 51.2 95.3
Amaua 96 43 53 100.0 44.8 55.2 81.1
Amouli 920 468 452 100.0 50.9 49.1 103.5
Anua 18 10 8 100.0 55.6 44.4 125.0
Aoa 855 426 429 100.0 49.8 50.2 99.3
Aoloau 615 314 301 100.0 51.1 48.9 104.3
Asili 224 120 104 100.0 53.6 46.4 115.4
Atu'u 359 197 162 100.0 54.9 45.1 121.6
Aua 2,077 1,097 980 100.0 52.8 47.2 111.9
Auasi 113 61 52 100.0 54.0 46.0 117.3
Auma 254 137 117 100.0 53.9 46.1 117.1
Aumi 186 89 97 100.0 47.8 52.2 91.8
Aunu'u 436 221 215 100.0 50.7 49.3 102.8
Auto 262 130 132 100.0 49.6 50.4 98.5
Avaio 44 20 24 100.0 45.5 54.5 83.3
Faga'alu 910 464 446 100.0 51.0 49.0 104.0
Faga'itua 433 217 216 100.0 50.1 49.9 100.5
Fagali'i 247 115 132 100.0 46.6 53.4 87.1
Fagamalo 47 26 21 100.0 55.3 44.7 123.8
Faganeanea 150 72 78 100.0 48.0 52.0 92.3
Fagasa 831 405 426 100.0 48.7 51.3 95.1
Fagatogo 1,737 886 851 100.0 51.0 49.0 104.1
Failolo 108 63 45 100.0 58.3 41.7 140.0
Faleasao 162 85 77 100.0 52.5 47.5 110.4
Faleniu 1,898 958 940 100.0 50.5 49.5 101.9
Fatumafuti 113 50 63 100.0 44.2 55.8 79.4
Futiga 723 355 368 100.0 49.1 50.9 96.5
Ili'ili 3,195 1,576 1,619 100.0 49.3 50.7 97.3
Continued on next page.
Population Percent
STATISTICAL YEARBOOK 2012
17
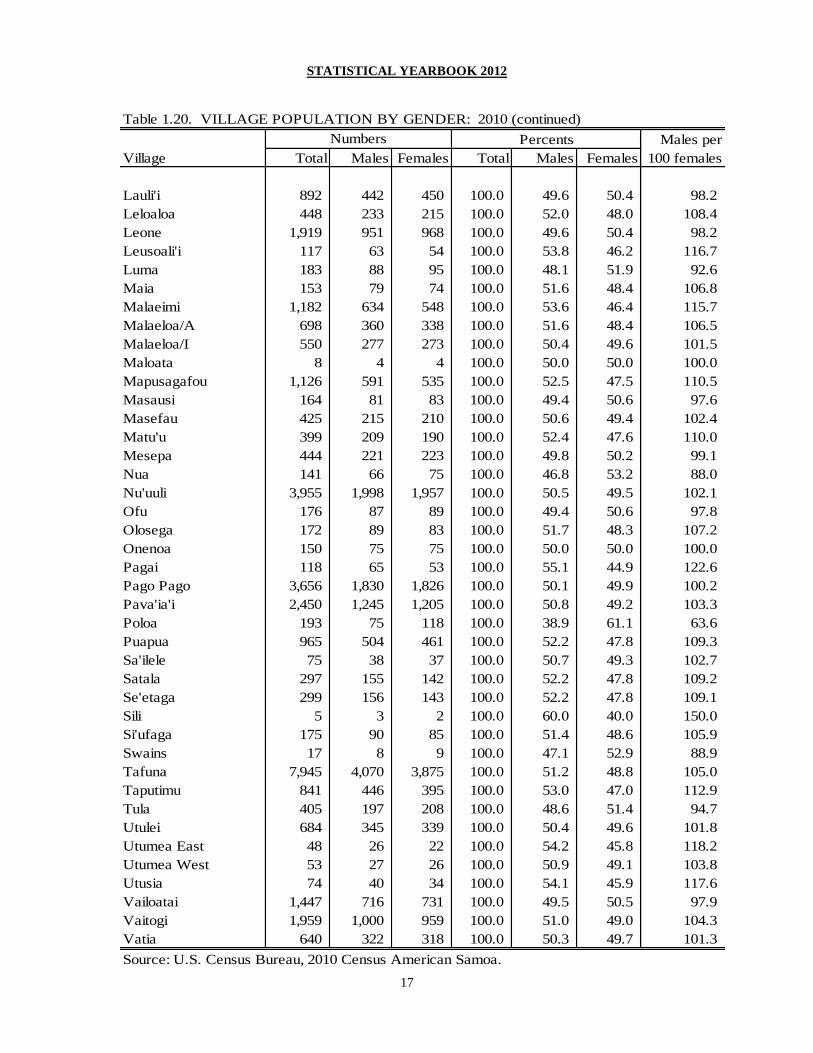
Table 1.20. VILLAGE POPULATION BY GENDER: 2010 (continued)
Males per
Village Total Males Females Total Males Females 100 females
Lauli'i 892 442 450 100.0 49.6 50.4 98.2
Leloaloa 448 233 215 100.0 52.0 48.0 108.4
Leone 1,919 951 968 100.0 49.6 50.4 98.2
Leusoali'i 117 63 54 100.0 53.8 46.2 116.7
Luma 183 88 95 100.0 48.1 51.9 92.6
Maia 153 79 74 100.0 51.6 48.4 106.8
Malaeimi 1,182 634 548 100.0 53.6 46.4 115.7
Malaeloa/A 698 360 338 100.0 51.6 48.4 106.5
Malaeloa/I 550 277 273 100.0 50.4 49.6 101.5
Maloata 8 4 4 100.0 50.0 50.0 100.0
Mapusagafou 1,126 591 535 100.0 52.5 47.5 110.5
Masausi 164 81 83 100.0 49.4 50.6 97.6
Masefau 425 215 210 100.0 50.6 49.4 102.4
Matu'u 399 209 190 100.0 52.4 47.6 110.0
Mesepa 444 221 223 100.0 49.8 50.2 99.1
Nua 141 66 75 100.0 46.8 53.2 88.0
Nu'uuli 3,955 1,998 1,957 100.0 50.5 49.5 102.1
Ofu 176 87 89 100.0 49.4 50.6 97.8
Olosega 172 89 83 100.0 51.7 48.3 107.2
Onenoa 150 75 75 100.0 50.0 50.0 100.0
Pagai 118 65 53 100.0 55.1 44.9 122.6
Pago Pago 3,656 1,830 1,826 100.0 50.1 49.9 100.2
Pava'ia'i 2,450 1,245 1,205 100.0 50.8 49.2 103.3
Poloa 193 75 118 100.0 38.9 61.1 63.6
Puapua 965 504 461 100.0 52.2 47.8 109.3
Sa'ilele 75 38 37 100.0 50.7 49.3 102.7
Satala 297 155 142 100.0 52.2 47.8 109.2
Se'etaga 299 156 143 100.0 52.2 47.8 109.1
Sili 5 3 2 100.0 60.0 40.0 150.0
Si'ufaga 175 90 85 100.0 51.4 48.6 105.9
Swains 17 8 9 100.0 47.1 52.9 88.9
Tafuna 7,945 4,070 3,875 100.0 51.2 48.8 105.0
Taputimu 841 446 395 100.0 53.0 47.0 112.9
Tula 405 197 208 100.0 48.6 51.4 94.7
Utulei 684 345 339 100.0 50.4 49.6 101.8
Utumea East 48 26 22 100.0 54.2 45.8 118.2
Utumea West 53 27 26 100.0 50.9 49.1 103.8
Utusia 74 40 34 100.0 54.1 45.9 117.6
Vailoatai 1,447 716 731 100.0 49.5 50.5 97.9
Vaitogi 1,959 1,000 959 100.0 51.0 49.0 104.3
Vatia 640 322 318 100.0 50.3 49.7 101.3
Source: U.S. Census Bureau, 2010 Census American Samoa.
Numbers Percents

STATISTICAL YEARBOOK 2012
18
Table 1.21. VILLAGE POPULATION BY AGE GROUP: 2010
Under Median
Village Total 5 5-9 10-14 15-19 20-24 25-34 35-44 45-54 55-59 60-64 65-74 75-84 85+ age
American Samoa 55,519 6,611 6,535 6,279 6,297 3,922 6,835 7,196 6,022 2,067 1,480 1,616 546 113 22.4
Aasu 494 65 69 48 61 37 55 62 54 15 11 15 1 1 20.6
Afao 182 25 21 32 18 11 32 17 15 5 1 4 1 0 18.3
Afono 524 54 58 78 75 42 40 73 54 18 11 14 5 2 19.7
Agugulu 51 7 9 3 6 3 5 9 5 4 0 0 0 0 20.5
Alao 495 57 44 59 79 36 49 70 57 14 10 14 5 1 20.8
Alega 54 6 3 4 5 4 7 6 5 2 6 4 1 1 29.0
Alofau 646 79 62 54 81 46 78 114 76 23 13 15 4 1 25.1
Amaluia 162 15 18 20 20 10 16 15 26 11 4 6 1 0 24.0
Amanave 250 29 27 28 33 21 26 31 36 6 7 5 1 - 22.0
Amaua 96 9 3 7 14 5 13 14 19 3 3 5 1 - 32.0
Amouli 920 111 120 119 100 52 103 123 103 29 18 29 8 5 20.7
Anua 18 2 2 4 0 0 1 4 4 0 0 - 1 - 33.5
Aoa 855 132 119 88 91 45 112 103 89 36 12 18 9 1 19.8
Aoloau 615 76 67 58 68 55 77 83 65 16 22 15 11 2 22.9
Asili 224 31 32 28 24 15 18 26 24 6 10 6 4 - 19.3
Atu'u 359 25 43 45 50 24 38 53 44 12 14 5 5 1 22.9
Aua 2,077 252 255 239 230 153 261 254 239 78 46 49 15 6 21.8
Auasi 113 10 9 18 16 7 15 15 8 5 2 6 2 - 23.5
Auma 254 27 23 34 40 11 24 34 36 12 7 5 1 0 21.5
Aumi 186 32 22 23 20 13 15 19 21 5 4 10 1 1 19.2
Aunu'u 436 57 58 49 49 30 57 41 52 16 10 10 6 1 20.6
Auto 262 29 32 28 27 20 37 33 26 13 9 8 0 - 23.5
Avaio 44 6 4 7 1 4 4 4 6 1 2 4 1 - 26.5
Faga'alu 910 103 95 108 86 42 127 140 100 26 33 33 15 2 27.0
Faga'itua 433 30 48 60 51 31 46 63 51 20 14 13 6 - 24.4
Fagali'i 247 37 27 23 26 18 35 29 27 9 5 7 3 1 22.4
Fagamalo 47 4 4 7 6 4 4 3 5 3 2 4 1 - 23.5
Faganeanea 150 13 19 18 20 10 20 17 17 4 6 4 1 1 22.0
Fagasa 831 85 74 112 122 56 93 95 101 32 23 29 6 3 22.0
Fagatogo 1,737 211 194 170 162 143 230 239 195 69 51 51 17 5 24.4
Failolo 108 10 12 21 17 7 3 13 16 5 2 2 - - 18.7
Faleasao 162 14 12 21 16 20 15 27 13 8 7 5 3 1 28.0
Faleniu 1,898 284 228 227 204 124 248 253 184 59 33 40 14 - 20.2
Fatumafuti 113 15 13 19 13 8 12 10 10 3 3 5 2 - 18.4
Futiga 723 91 77 88 85 49 80 92 83 30 20 17 11 - 21.5
Ili'ili 3,195 367 377 357 361 226 369 407 367 117 92 114 36 5 22.9
Continued on next page.

STATISTICAL YEARBOOK 2012
19
Table 1.21. VILLAGE POPULATION BY AGE GROUP: 2010 (continued)
Under Median
Village Total 5 5-9 10-14 15-19 20-24 25-34 35-44 45-54 55-59 60-64 65-74 75-84 85+ age
Lauli'i 892 99 104 107 102 67 99 111 107 30 29 28 9 - 22.2
Leloaloa 448 40 40 65 53 57 62 56 29 14 9 16 7 - 24.2
Leone 1,919 204 219 226 221 126 225 221 234 92 59 66 25 1 23.4
Leusoali'i 117 10 11 16 15 10 10 11 11 2 8 8 5 - 23.5
Luma 183 28 18 20 26 6 26 17 13 12 7 9 1 - 19.9
Maia 153 21 16 18 20 11 7 22 17 5 3 8 4 1 20.8
Malaeimi 1,182 156 147 139 138 74 171 162 100 41 22 26 5 1 20.6
Malaeloa/Aitulagi 698 85 99 67 83 53 89 75 74 28 20 21 4 - 21.2
Malaeloa/Ituau 550 72 72 55 66 42 80 53 58 20 21 7 3 1 21.3
Maloata 8 - - 1 1 1 1 - 2 - 1 1 - - 41.0
Mapusagafou 1,126 159 165 117 126 77 152 120 96 44 28 31 8 3 19.7
Masausi 164 22 17 18 19 11 15 30 18 5 5 3 1 - 22.0
Masefau 425 43 45 44 58 32 58 46 44 22 9 17 6 1 23.6
Matu'u 399 57 47 35 45 24 62 48 42 16 9 8 5 1 23.1
Mesepa 444 56 48 50 49 43 56 53 55 12 13 8 1 - 21.9
Nua 141 21 15 17 14 6 23 16 16 4 5 4 - - 22.8
Nu'uuli 3,955 488 438 403 411 295 539 549 435 156 96 106 34 5 24.2
Ofu 176 14 23 21 12 13 20 20 20 6 11 13 3 - 27.5
Olosega 172 19 19 26 13 16 19 19 19 5 5 8 4 - 21.7
Onenoa 150 24 12 16 12 12 13 22 10 9 3 11 4 2 24.5
Pagai 118 9 16 13 21 9 7 22 12 2 2 2 2 1 20.0
Pago Pago 3,656 446 452 391 401 268 494 465 404 103 86 108 30 8 22.5
Pava'ia'i 2,450 320 299 293 276 172 275 336 241 95 60 59 21 3 20.9
Poloa 193 28 18 18 19 16 29 25 20 7 3 8 2 - 24.2
Puapua 965 121 112 100 101 65 121 138 117 27 17 38 4 4 23.7
Sa'ilele 75 8 8 10 6 5 11 5 10 5 1 4 2 - 26.3
Satala 297 32 37 29 29 17 49 48 32 10 5 8 1 - 27.2
Se'etaga 299 28 45 37 33 26 37 42 16 12 6 13 4 - 21.2
Sili 5 - - - - 2 2 - 1 - - - - - 29.5
Si'ufaga 175 28 19 21 22 12 8 9 19 17 7 8 2 3 19.2
Swains 17 1 - 1 3 4 - 2 1 3 2 - - - 23.5
Tafuna 7,945 886 955 855 884 520 1,025 1,084 877 306 257 200 78 18 23.6
Taputimu 841 101 106 109 104 61 90 98 93 38 13 24 3 1 20.0
Tula 405 43 46 36 45 40 53 38 42 18 19 13 11 1 24.3
Utulei 684 74 77 67 70 42 83 110 77 20 20 34 5 5 26.4
Utumea East 48 4 11 3 6 2 6 3 7 1 2 2 0 1 20.0
Utumea West 53 5 9 9 8 2 3 9 5 0 0 2 1 0 15.9
Utusia 74 6 6 5 12 8 4 13 8 7 2 2 1 0 25.5
Vailoatai 1,447 170 186 195 176 110 148 184 147 51 30 33 14 3 19.9
Vaitogi 1,959 217 240 256 228 117 228 234 196 92 55 64 25 7 21.3
Vatia 640 66 58 66 92 66 70 89 64 15 17 24 12 1 22.8
Source: U.S. Census Bureau, 2010 Census American Samoa.
STATISTICAL YEARBOOK 2012
20
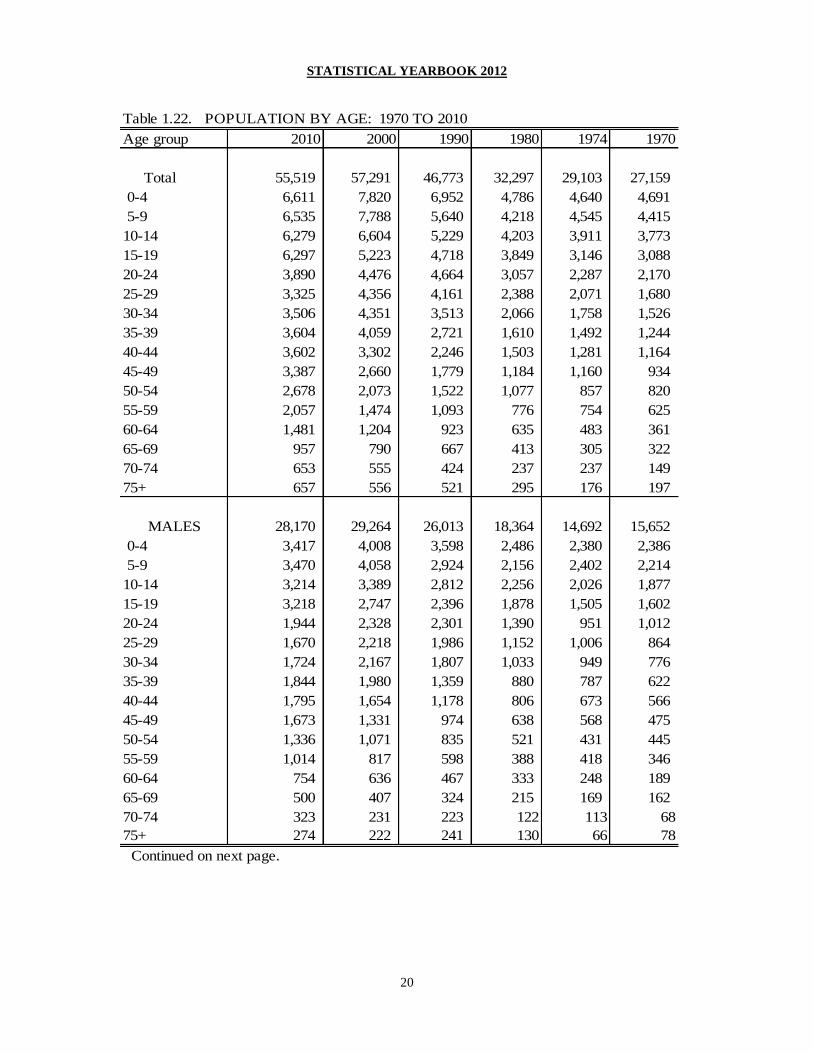
Table 1.22. POPULATION BY AGE: 1970 TO 2010
Age group 2010 2000 1990 1980 1974 1970
Total 55,519 57,291 46,773 32,297 29,103 27,159
0-4 6,611 7,820 6,952 4,786 4,640 4,691
5-9 6,535 7,788 5,640 4,218 4,545 4,415
10-14 6,279 6,604 5,229 4,203 3,911 3,773
15-19 6,297 5,223 4,718 3,849 3,146 3,088
20-24 3,890 4,476 4,664 3,057 2,287 2,170
25-29 3,325 4,356 4,161 2,388 2,071 1,680
30-34 3,506 4,351 3,513 2,066 1,758 1,526
35-39 3,604 4,059 2,721 1,610 1,492 1,244
40-44 3,602 3,302 2,246 1,503 1,281 1,164
45-49 3,387 2,660 1,779 1,184 1,160 934
50-54 2,678 2,073 1,522 1,077 857 820
55-59 2,057 1,474 1,093 776 754 625
60-64 1,481 1,204 923 635 483 361
65-69 957 790 667 413 305 322
70-74 653 555 424 237 237 149
75+ 657 556 521 295 176 197
MALES 28,170 29,264 26,013 18,364 14,692 15,652
0-4 3,417 4,008 3,598 2,486 2,380 2,386
5-9 3,470 4,058 2,924 2,156 2,402 2,214
10-14 3,214 3,389 2,812 2,256 2,026 1,877
15-19 3,218 2,747 2,396 1,878 1,505 1,602
20-24 1,944 2,328 2,301 1,390 951 1,012
25-29 1,670 2,218 1,986 1,152 1,006 864
30-34 1,724 2,167 1,807 1,033 949 776
35-39 1,844 1,980 1,359 880 787 622
40-44 1,795 1,654 1,178 806 673 566
45-49 1,673 1,331 974 638 568 475
50-54 1,336 1,071 835 521 431 445
55-59 1,014 817 598 388 418 346
60-64 754 636 467 333 248 189
65-69 500 407 324 215 169 162
70-74 323 231 223 122 113 68
75+ 274 222 241 130 66 78
Continued on next page.
STATISTICAL YEARBOOK 2012
21
Table 1.22. POPULATION BY AGE: 1970 TO 2010 (continued)
Age group 2010 2000 1990 1980 1974 1970
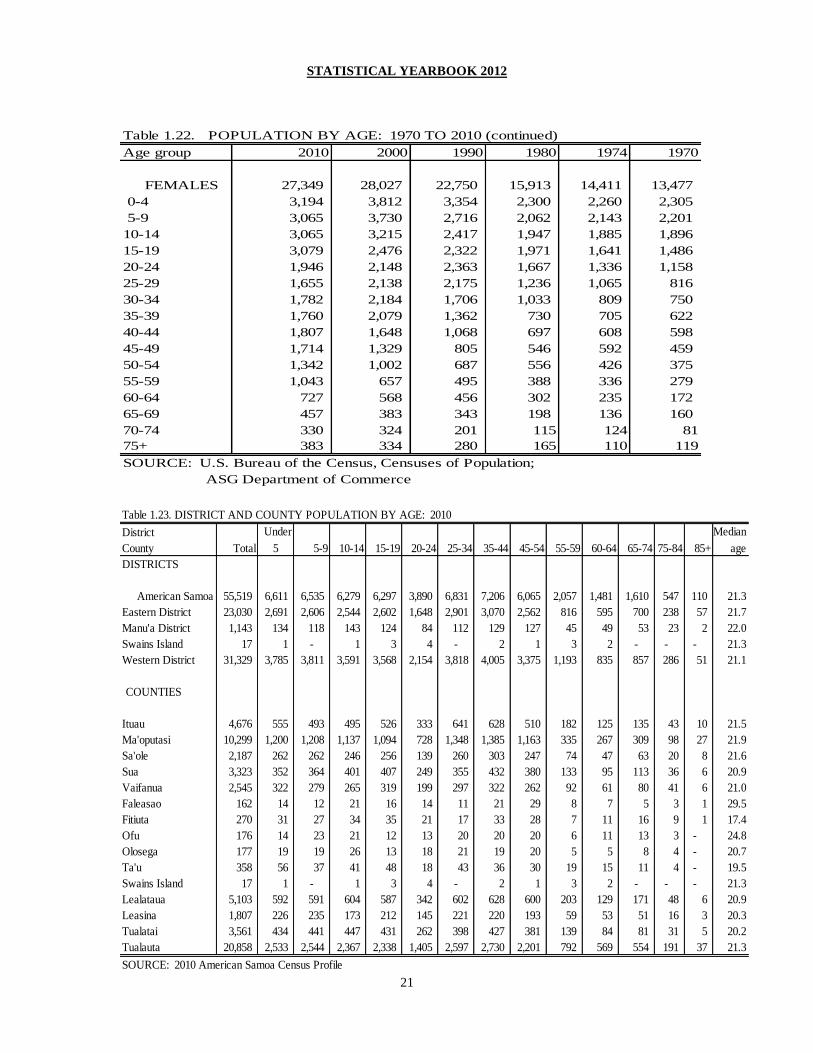
FEMALES 27,349 28,027 22,750 15,913 14,411 13,477
0-4 3,194 3,812 3,354 2,300 2,260 2,305
5-9 3,065 3,730 2,716 2,062 2,143 2,201
10-14 3,065 3,215 2,417 1,947 1,885 1,896
15-19 3,079 2,476 2,322 1,971 1,641 1,486
20-24 1,946 2,148 2,363 1,667 1,336 1,158
25-29 1,655 2,138 2,175 1,236 1,065 816
30-34 1,782 2,184 1,706 1,033 809 750
35-39 1,760 2,079 1,362 730 705 622
40-44 1,807 1,648 1,068 697 608 598
45-49 1,714 1,329 805 546 592 459
50-54 1,342 1,002 687 556 426 375
55-59 1,043 657 495 388 336 279
60-64 727 568 456 302 235 172
65-69 457 383 343 198 136 160
70-74 330 324 201 115 124 81
75+ 383 334 280 165 110 119
SOURCE: U.S. Bureau of the Census, Censuses of Population;
ASG Department of Commerce Table 1.23. DISTRICT AND COUNTY POPULATION BY AGE: 2010
District Under Median
County Total 5 5-9 10-14 15-19 20-24 25-34 35-44 45-54 55-59 60-64 65-74 75-84 85+ age
DISTRICTS
American Samoa 55,519 6,611 6,535 6,279 6,297 3,890 6,831 7,206 6,065 2,057 1,481 1,610 547 110 21.3
Eastern District 23,030 2,691 2,606 2,544 2,602 1,648 2,901 3,070 2,562 816 595 700 238 57 21.7
Manu'a District 1,143 134 118 143 124 84 112 129 127 45 49 53 23 2 22.0
Swains Island 17 1 - 1 3 4 - 2 1 3 2 - - - 21.3
Western District 31,329 3,785 3,811 3,591 3,568 2,154 3,818 4,005 3,375 1,193 835 857 286 51 21.1
COUNTIES
Ituau 4,676 555 493 495 526 333 641 628 510 182 125 135 43 10 21.5
Ma'oputasi 10,299 1,200 1,208 1,137 1,094 728 1,348 1,385 1,163 335 267 309 98 27 21.9
Sa'ole 2,187 262 262 246 256 139 260 303 247 74 47 63 20 8 21.6
Sua 3,323 352 364 401 407 249 355 432 380 133 95 113 36 6 20.9
Vaifanua 2,545 322 279 265 319 199 297 322 262 92 61 80 41 6 21.0
Faleasao 162 14 12 21 16 14 11 21 29 8 7 5 3 1 29.5
Fitiuta 270 31 27 34 35 21 17 33 28 7 11 16 9 1 17.4
Ofu 176 14 23 21 12 13 20 20 20 6 11 13 3 - 24.8
Olosega 177 19 19 26 13 18 21 19 20 5 5 8 4 - 20.7
Ta'u 358 56 37 41 48 18 43 36 30 19 15 11 4 - 19.5
Swains Island 17 1 - 1 3 4 - 2 1 3 2 - - - 21.3
Lealataua 5,103 592 591 604 587 342 602 628 600 203 129 171 48 6 20.9
Leasina 1,807 226 235 173 212 145 221 220 193 59 53 51 16 3 20.3
Tualatai 3,561 434 441 447 431 262 398 427 381 139 84 81 31 5 20.2
Tualauta 20,858 2,533 2,544 2,367 2,338 1,405 2,597 2,730 2,201 792 569 554 191 37 21.3
SOURCE: 2010 American Samoa Census Profile

STATISTICAL YEARBOOK 2012
22
Table 1.24. VILLAGE POPULATION BY ETHNIC ORIGIN: 2010
Village Total Samoan Tongan
Other
Pacific
Islanders Total
Filipino White
Other
Single Total
Native
Hawaiian &
Other Pacific
Islander &
Samoan
& Other
groups
Asian &
Other
groups
American Samoa 55,519 49,333 1,614 456 1,994 1,217 493 150 1,479 1,387 1,342 479
Aasu 494 488 1 - 5 - - - - - - -
Afao 182 169 1 - 2 - 2 - 8 8 8 -
Afono 524 501 4 2 10 8 1 - 6 6 6 -
Agugulu 51 49 2 - - - - - - - - -
Alao 495 484 - 1 4 2 - - 6 6 6 5
Alega 54 38 - - 1 - 9 - 6 1 1 5
Alofau 646 580 15 5 30 18 2 2 12 12 11 -
Amaluia 162 150 - 1 - - 2 - 9 9 9 7
Amanave 250 236 2 - 5 5 - - 7 7 7 6
Amaua 96 89 1 - 1 1 - - 5 5 5 2
Amouli 920 825 21 2 44 33 5 - 23 23 22 6
Anua 18 12 - - 5 2 1 - - - - -
Aoa 855 826 1 3 16 7 - - 9 9 9 8
Aoloau 615 601 2 1 2 2 - 1 8 7 7 5
Asili 224 219 1 - - - - - 4 4 4 4
Atu'u 359 280 12 8 37 13 1 3 18 17 17 14
Aua 2,077 1,899 8 14 114 46 1 4 37 35 35 20
Auasi 113 112 - - - - - - 1 1 1 -
Auma 254 248 1 - 1 1 - - 4 3 3 2
Aumi 186 176 2 - 3 1 - 1 4 4 4 -
Aunu'u 436 430 2 - - - - - 4 4 4 2
Auto 262 240 3 1 10 10 - 1 7 7 7 2
Avaio 44 40 - - 1 1 2 - 1 1 1 1
Faga'alu 910 738 23 16 66 44 13 8 46 45 45 15
Faga'itua 433 401 - 1 11 9 7 6 7 7 7 -
Fagali'i 247 235 - 1 9 9 - - 2 2 2 -
Fagamalo 47 47 - - - - - - - - - -
Faganeanea 150 141 - 1 4 4 4 - - - - -
Fagasa 831 815 2 - - - 2 - 12 12 12 5
Fagatogo 1,737 1,490 20 14 132 72 6 5 70 63 63 12
Failolo 108 102 - - 4 - 2 - - - - -
Faleasao 162 156 - - 5 4 - - 1 1 1 -
Faleniu 1,898 1,503 316 11 34 18 3 - 31 31 25 9
Fatumafuti 113 97 2 2 - - - - 12 12 12 -
Futiga 723 680 3 1 21 14 2 7 9 9 9 3
Ili'ili 3,195 2,781 89 23 117 72 68 15 102 91 87 35
Continued on next page.
Single Ethnic Origin or Race
Asian
Two or more Ethnic Origins or Races
STATISTICAL YEARBOOK 2012
23
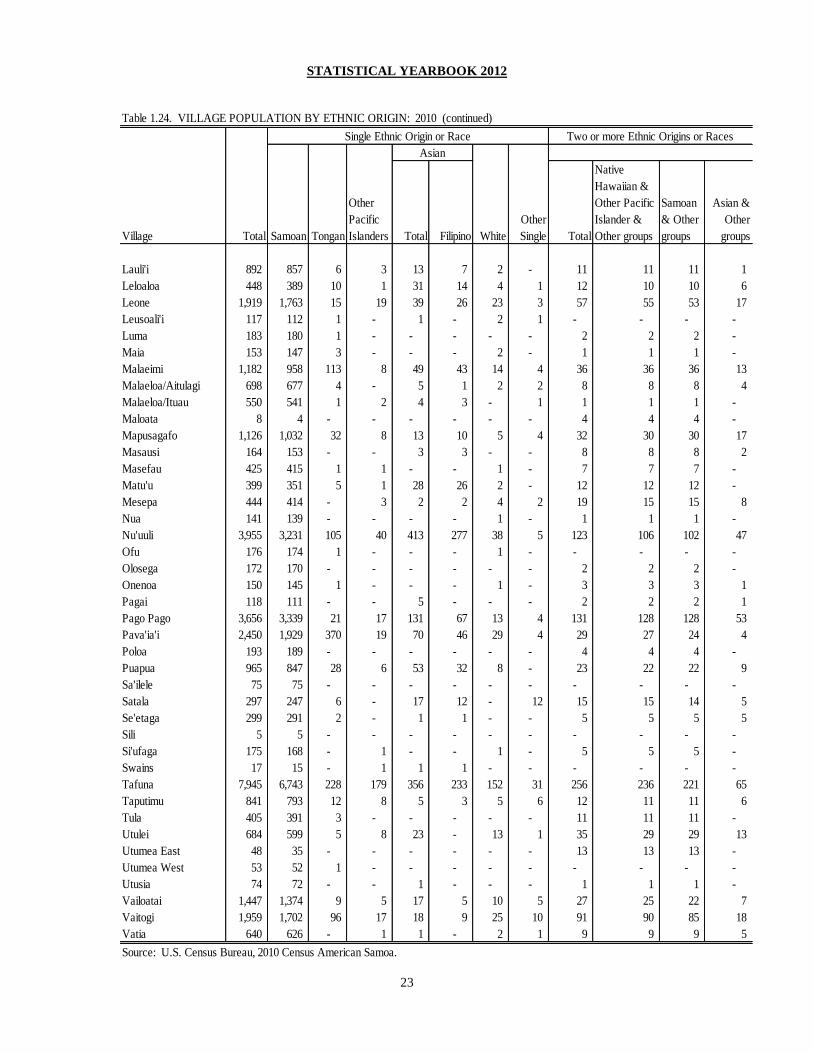
Table 1.24. VILLAGE POPULATION BY ETHNIC ORIGIN: 2010 (continued)
Village Total Samoan Tongan
Other
Pacific
Islanders Total
Filipino White
Other
Single Total
Native
Hawaiian &
Other Pacific
Islander &
Other groups
Samoan
& Other
groups
Asian &
Other
groups
Lauli'i 892 857 6 3 13 7 2 - 11 11 11 1
Leloaloa 448 389 10 1 31 14 4 1 12 10 10 6
Leone 1,919 1,763 15 19 39 26 23 3 57 55 53 17
Leusoali'i 117 112 1 - 1 - 2 1 - - - -
Luma 183 180 1 - - - - - 2 2 2 -
Maia 153 147 3 - - - 2 - 1 1 1 -
Malaeimi 1,182 958 113 8 49 43 14 4 36 36 36 13
Malaeloa/Aitulagi 698 677 4 - 5 1 2 2 8 8 8 4
Malaeloa/Ituau 550 541 1 2 4 3 - 1 1 1 1 -
Maloata 8 4 - - - - - - 4 4 4 -
Mapusagafo 1,126 1,032 32 8 13 10 5 4 32 30 30 17
Masausi 164 153 - - 3 3 - - 8 8 8 2
Masefau 425 415 1 1 - - 1 - 7 7 7 -
Matu'u 399 351 5 1 28 26 2 - 12 12 12 -
Mesepa 444 414 - 3 2 2 4 2 19 15 15 8
Nua 141 139 - - - - 1 - 1 1 1 -
Nu'uuli 3,955 3,231 105 40 413 277 38 5 123 106 102 47
Ofu 176 174 1 - - - 1 - - - - -
Olosega 172 170 - - - - - - 2 2 2 -
Onenoa 150 145 1 - - - 1 - 3 3 3 1
Pagai 118 111 - - 5 - - - 2 2 2 1
Pago Pago 3,656 3,339 21 17 131 67 13 4 131 128 128 53
Pava'ia'i 2,450 1,929 370 19 70 46 29 4 29 27 24 4
Poloa 193 189 - - - - - - 4 4 4 -
Puapua 965 847 28 6 53 32 8 - 23 22 22 9
Sa'ilele 75 75 - - - - - - - - - -
Satala 297 247 6 - 17 12 - 12 15 15 14 5
Se'etaga 299 291 2 - 1 1 - - 5 5 5 5
Sili 5 5 - - - - - - - - - -
Si'ufaga 175 168 - 1 - - 1 - 5 5 5 -
Swains 17 15 - 1 1 1 - - - - - -
Tafuna 7,945 6,743 228 179 356 233 152 31 256 236 221 65
Taputimu 841 793 12 8 5 3 5 6 12 11 11 6
Tula 405 391 3 - - - - - 11 11 11 -
Utulei 684 599 5 8 23 - 13 1 35 29 29 13
Utumea East 48 35 - - - - - - 13 13 13 -
Utumea West 53 52 1 - - - - - - - - -
Utusia 74 72 - - 1 - - - 1 1 1 -
Vailoatai 1,447 1,374 9 5 17 5 10 5 27 25 22 7
Vaitogi 1,959 1,702 96 17 18 9 25 10 91 90 85 18
Vatia 640 626 - 1 1 - 2 1 9 9 9 5
Source: U.S. Census Bureau, 2010 Census American Samoa.
Asian
Two or more Ethnic Origins or RacesSingle Ethnic Origin or Race
STATISTICAL YEARBOOK 2012
24
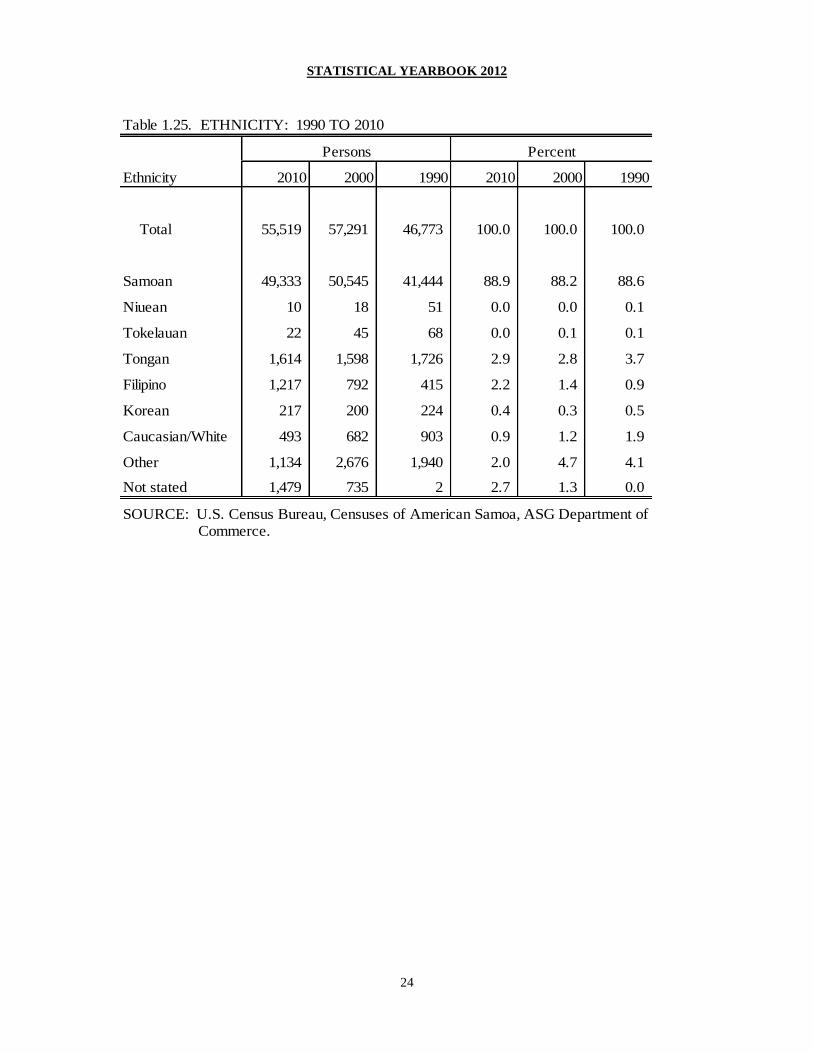
Table 1.25. ETHNICITY: 1990 TO 2010
Ethnicity 2010 2000 1990 2010 2000 1990
Total 55,519 57,291 46,773 100.0 100.0 100.0
Samoan 49,333 50,545 41,444 88.9 88.2 88.6
Niuean 10 18 51 0.0 0.0 0.1
Tokelauan 22 45 68 0.0 0.1 0.1
Tongan 1,614 1,598 1,726 2.9 2.8 3.7
Filipino 1,217 792 415 2.2 1.4 0.9
Korean 217 200 224 0.4 0.3 0.5
Caucasian/White 493 682 903 0.9 1.2 1.9
Other 1,134 2,676 1,940 2.0 4.7 4.1
Not stated 1,479 735 2 2.7 1.3 0.0
SOURCE: U.S. Census Bureau, Censuses of American Samoa, ASG Department of Commerce.
Persons Percent
STATISTICAL YEARBOOK 2012
25
Section Two
VITAL AND HEALTH STATISTICS
This section presents data on births, deaths, life expectancy, marriages, diseases, patient
visits and hospital discharges.
The LBJ Medical Authority reported 1,175 births and 282 deaths in 2012. Teen births
dropped slightly to 133 births in 2012. Due to the unavailability of the 2011 and 2012
population estimates, the last data recorded for Crude Birth Rate (CBR), Crude Death
Rate (CDR), infant mortality rate, neonatal mortality rate, and fetal deaths were for 2010.
However, the number of births, deaths, infants, neonatal, and feta are available for 2011
and 2012. The three leading cause of death in 2012 were Heart Disease,
Influenza/pneumonia, and Malignant Neoplasm.
Population natural growth is defined as total births minus deaths. The natural growth of
the population in 2012 was 893 and is slowly decreasing. Natural growth prior to 2005
registered above 1,300 persons added to the local population each year. The number of
out-patient visits in 2012 was 105,015 a decrease of 14,053 from the previous year. The
addition of the following units: Renal Dialysis, Primary Care, and Mental Health have
increased the number of out-patient visits in the last two years. Marriage licenses
processed at the Vital Statistics dropped again in 2012. There were 155 marriage licenses
recorded in the registry in 2012.

STATISTICAL YEARBOOK 2012
26
Table 2.1. VITAL STATISTICS: 2002 TO 2010
Deaths under 1 year
Rates per 1,000
live-births
Esti- Rates per Neo-
mated 1,000 persons Numbers Infant natal
popula- Bir- Dea- Bir- Dea- In- Neo- morta- morta- Fetal
Year tion ths ths ths ths fant natal Fetal lity lity deaths
2010 67,380 1,279 247 19.0 3.7 19 12 6 14.9 9.4 4.7
2009 70,100 1,375 324 19.6 4.6 16 8 4 11.6 5.8 2.9
2008 69,200 1,338 240 19.3 3.5 9 8 4 6.7 6.0 3.0
2007 68,200 1,293 251 19.0 3.7 6 6 5 4.6 4.6 3.9
2006 66,900 1,442 267 21.6 4.0 17 9 21 11.8 6.2 14.6
2005 65,500 1,720 279 26.3 4.3 12 5 8 7.0 2.9 4.7
2004 64,100 1,713 289 26.7 4.5 26 17 17 15.2 9.9 9.9
2003 62,600 1,608 257 25.7 4.1 20 15 20 12.4 9.3 12.4
2002 60,800 1,629 295 26.8 4.9 27 12 13 16.6 7.4 8.0
NOTE: Population estimates are as of July 1st each year. Fetal deaths are excluded from total
deaths. Population estimates for 2011 and 2012 are not available. However, the number of births,
deaths, infant, neonatal and fetal are available for these two years.
SOURCE: Health Information Management Department, LBJ Tropical Medical Center
Table 2.2. BIRTHS BY MONTH: 2002 TO 2012
Month 2012 2011 2010 2009 2008 2007 2006 2005 2004 2003 2002
Total 1,175 1,287 1,279 1,375 1,338 1,293 1,442 1,720 1,713 1,608 1,629
January 94 90 110 134 98 104 106 125 143 121 128
February 89 97 108 115 100 82 97 136 138 124 154
March 91 115 125 101 123 108 139 168 188 167 135
April 93 116 133 111 113 117 128 164 166 162 157
May 96 139 125 128 119 134 162 183 147 128 154
June 110 104 117 128 108 123 118 146 140 154 143
July 126 107 112 122 102 109 123 159 124 159 141
August 102 102 93 110 126 120 137 124 136 121 130
September 81 120 94 106 107 114 129 125 109 112 132
October 88 97 83 96 102 88 107 144 130 120 105
November 104 111 93 100 113 85 96 107 152 114 111
December 101 89 86 124 127 109 100 139 140 126 139
SOURCE: Health Information Management Department, LBJ Tropical Medical Center
Births
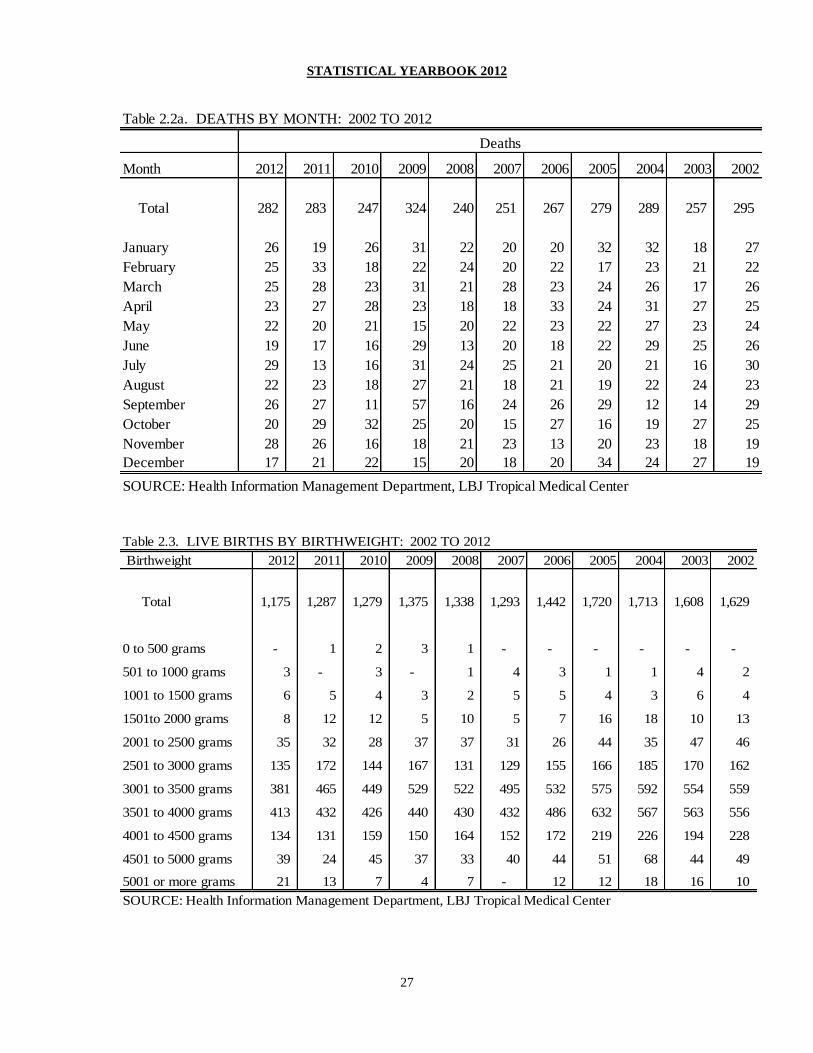
STATISTICAL YEARBOOK 2012
27
Table 2.2a. DEATHS BY MONTH: 2002 TO 2012
Month 2012 2011 2010 2009 2008 2007 2006 2005 2004 2003 2002
Total 282 283 247 324 240 251 267 279 289 257 295
January 26 19 26 31 22 20 20 32 32 18 27
February 25 33 18 22 24 20 22 17 23 21 22
March 25 28 23 31 21 28 23 24 26 17 26
April 23 27 28 23 18 18 33 24 31 27 25
May 22 20 21 15 20 22 23 22 27 23 24
June 19 17 16 29 13 20 18 22 29 25 26
July 29 13 16 31 24 25 21 20 21 16 30
August 22 23 18 27 21 18 21 19 22 24 23
September 26 27 11 57 16 24 26 29 12 14 29
October 20 29 32 25 20 15 27 16 19 27 25
November 28 26 16 18 21 23 13 20 23 18 19
December 17 21 22 15 20 18 20 34 24 27 19
SOURCE: Health Information Management Department, LBJ Tropical Medical Center
Deaths
Table 2.3. LIVE BIRTHS BY BIRTHWEIGHT: 2002 TO 2012
Birthweight 2012 2011 2010 2009 2008 2007 2006 2005 2004 2003 2002
Total 1,175 1,287 1,279 1,375 1,338 1,293 1,442 1,720 1,713 1,608 1,629
0 to 500 grams - 1 2 3 1 - - - - - -
501 to 1000 grams 3 - 3 - 1 4 3 1 1 4 2
1001 to 1500 grams 6 5 4 3 2 5 5 4 3 6 4
1501to 2000 grams 8 12 12 5 10 5 7 16 18 10 13
2001 to 2500 grams 35 32 28 37 37 31 26 44 35 47 46
2501 to 3000 grams 135 172 144 167 131 129 155 166 185 170 162
3001 to 3500 grams 381 465 449 529 522 495 532 575 592 554 559
3501 to 4000 grams 413 432 426 440 430 432 486 632 567 563 556
4001 to 4500 grams 134 131 159 150 164 152 172 219 226 194 228
4501 to 5000 grams 39 24 45 37 33 40 44 51 68 44 49
5001 or more grams 21 13 7 4 7 - 12 12 18 16 10
SOURCE: Health Information Management Department, LBJ Tropical Medical Center
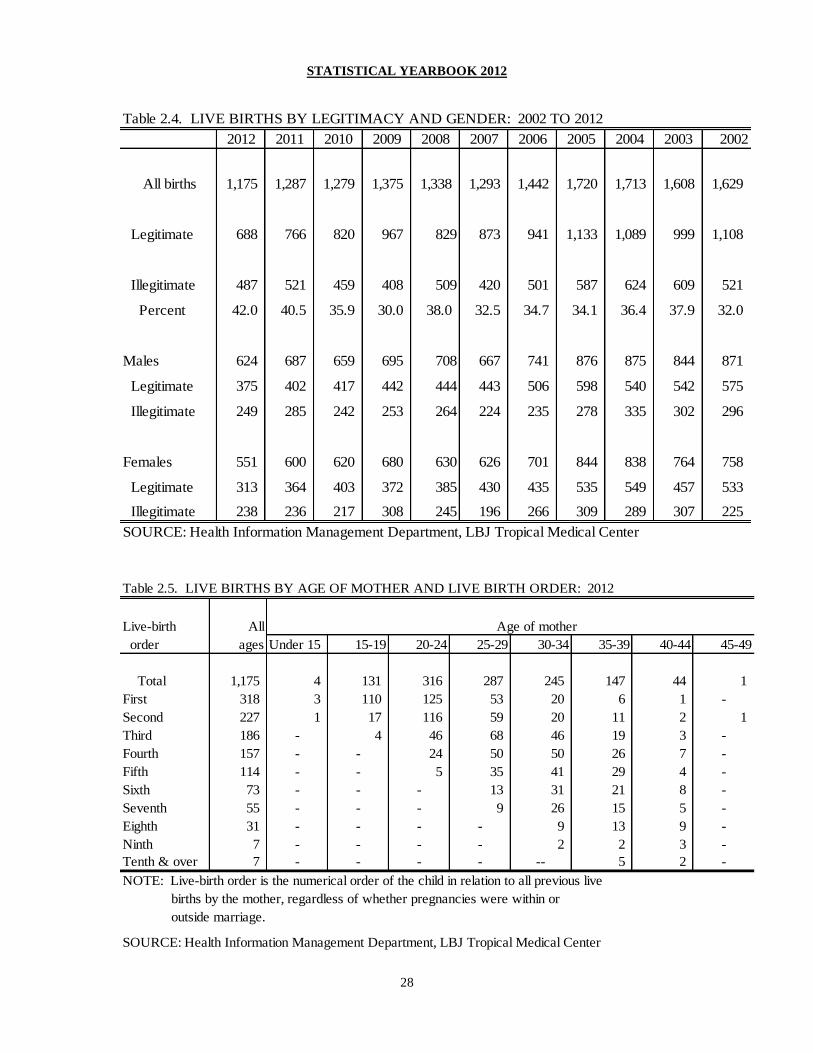
STATISTICAL YEARBOOK 2012
28
Table 2.4. LIVE BIRTHS BY LEGITIMACY AND GENDER: 2002 TO 2012
2012 2011 2010 2009 2008 2007 2006 2005 2004 2003 2002
All births 1,175 1,287 1,279 1,375 1,338 1,293 1,442 1,720 1,713 1,608 1,629
Legitimate 688 766 820 967 829 873 941 1,133 1,089 999 1,108
Illegitimate 487 521 459 408 509 420 501 587 624 609 521
Percent 42.0 40.5 35.9 30.0 38.0 32.5 34.7 34.1 36.4 37.9 32.0
Males 624 687 659 695 708 667 741 876 875 844 871
Legitimate 375 402 417 442 444 443 506 598 540 542 575
Illegitimate 249 285 242 253 264 224 235 278 335 302 296
Females 551 600 620 680 630 626 701 844 838 764 758
Legitimate 313 364 403 372 385 430 435 535 549 457 533
Illegitimate 238 236 217 308 245 196 266 309 289 307 225
SOURCE: Health Information Management Department, LBJ Tropical Medical Center
Table 2.5. LIVE BIRTHS BY AGE OF MOTHER AND LIVE BIRTH ORDER: 2012
Live-birth All Age of mother
order ages Under 15 15-19 20-24 25-29 30-34 35-39 40-44 45-49
Total 1,175 4 131 316 287 245 147 44 1
First 318 3 110 125 53 20 6 1 -
Second 227 1 17 116 59 20 11 2 1
Third 186 - 4 46 68 46 19 3 -
Fourth 157 - - 24 50 50 26 7 -
Fifth 114 - - 5 35 41 29 4 -
Sixth 73 - - - 13 31 21 8 -
Seventh 55 - - - 9 26 15 5 -
Eighth 31 - - - - 9 13 9 -
Ninth 7 - - - - 2 2 3 -
Tenth & over 7 - - - - -- 5 2 -
NOTE: Live-birth order is the numerical order of the child in relation to all previous live
births by the mother, regardless of whether pregnancies were within or
outside marriage.
SOURCE: Health Information Management Department, LBJ Tropical Medical Center
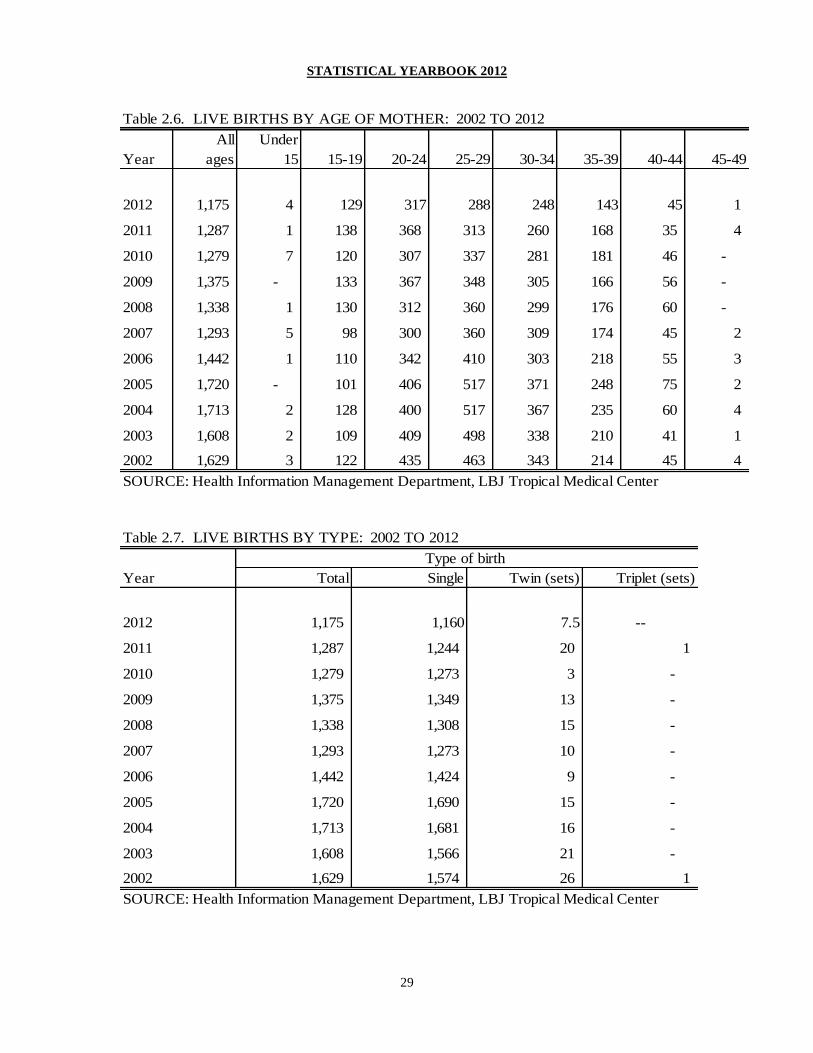
STATISTICAL YEARBOOK 2012
29
Table 2.6. LIVE BIRTHS BY AGE OF MOTHER: 2002 TO 2012
All Under
Year ages 15 15-19 20-24 25-29 30-34 35-39 40-44 45-49
2012 1,175 4 129 317 288 248 143 45 1
2011 1,287 1 138 368 313 260 168 35 4
2010 1,279 7 120 307 337 281 181 46 -
2009 1,375 - 133 367 348 305 166 56 -
2008 1,338 1 130 312 360 299 176 60 -
2007 1,293 5 98 300 360 309 174 45 2
2006 1,442 1 110 342 410 303 218 55 3
2005 1,720 - 101 406 517 371 248 75 2
2004 1,713 2 128 400 517 367 235 60 4
2003 1,608 2 109 409 498 338 210 41 1
2002 1,629 3 122 435 463 343 214 45 4
SOURCE: Health Information Management Department, LBJ Tropical Medical Center
Table 2.7. LIVE BIRTHS BY TYPE: 2002 TO 2012
Type of birth
Year Total Single Twin (sets) Triplet (sets)
2012 1,175 1,160 7.5 --
2011 1,287 1,244 20 1
2010 1,279 1,273 3 -
2009 1,375 1,349 13 -
2008 1,338 1,308 15 -
2007 1,293 1,273 10 -
2006 1,442 1,424 9 -
2005 1,720 1,690 15 -
2004 1,713 1,681 16 -
2003 1,608 1,566 21 -
2002 1,629 1,574 26 1
SOURCE: Health Information Management Department, LBJ Tropical Medical Center

STATISTICAL YEARBOOK 2012
30
Table 2.8. DEATHS BY AGE: 2002 TO 2012
Age group 2012 2011 2010 2009 2008 2007 2006 2005 2004 2003 2002
All ages 282 283 247 324 240 251 267 279 289 257 295
Under 1 8 9 19 16 17 12 17 12 26 20 27
1 to 4 3 4 1 5 - 1 7 6 4 5 10
5 to 9 2 - - 7 2 - 1 5 2 1 2
10 to 14 2 1 2 0 2 4 5 2 3 3 4
15 to 19 4 5 5 4 4 3 3 2 4 7 12
20 to 24 3 - 1 9 6 9 5 3 4 4 6
25 to 29 3 7 2 5 5 4 4 3 7 6 5
30 to 34 7 8 4 6 8 8 5 5 8 2 2
35 to 39 6 8 7 6 7 10 10 15 10 4 11
40 to 44 13 12 11 12 10 9 9 9 16 12 8
45 to 49 19 21 24 34 13 12 19 12 13 13 19
50 to 54 21 22 23 28 16 21 18 19 22 22 14
55 to 59 30 34 20 23 14 23 21 30 24 22 16
60 to 64 22 32 27 39 29 18 23 24 23 27 25
65 to 69 32 32 23 22 31 27 27 30 32 34 35
70 to 74 35 32 24 29 21 28 31 28 29 22 26
75 to 79 26 21 22 33 26 28 28 26 27 25 22
80 to 84 28 13 11 23 15 15 13 24 16 14 26
85 + 18 22 21 23 14 19 21 24 19 14 25
SOURCE: Health Information Management Department, LBJ Tropical Medical Center
Health Information System Office, ASG Department of Health

STATISTICAL YEARBOOK 2012
31
Table 2.9. DEATHS BY AGE AND GENDER: 2002 TO 2012
Age 2012 2011 2010 2009 2008 2007 2006 2005 2004 2003 2002
All ages 163 159 160 186 140 139 156 177 166 153 160
Under 1 5 7 10 12 11 6 9 6 20 13 18
1 to 4 1 3 1 3 - - 3 2 1 4 5
5 to 9 2 - - 3 - - 1 5 1 - 2
10 to 14 1 1 - - 2 3 2 1 - - 4
15 to 19 4 4 5 3 3 2 - 2 2 5 9
20 to 24 1 1 1 6 3 5 4 2 2 2 2
25 to 29 2 2 2 3 2 3 3 2 4 4 3
30 to 34 1 4 3 3 3 2 5 3 6 1 2
35 to 39 4 6 5 4 7 5 6 12 7 2 5
40 to 44 8 7 7 6 9 6 4 6 9 6 2
45 to 49 11 13 20 16 9 6 10 6 8 9 12
50 to 54 13 12 17 22 6 16 11 14 16 14 6
55 to 59 18 18 13 17 10 11 13 23 16 17 8
60 to 64 15 19 18 19 18 12 15 21 12 19 20
65 to 69 20 21 13 12 23 20 18 18 21 25 15
70 to 74 24 13 17 21 12 19 22 17 14 12 13
75 to 79 11 14 12 18 10 13 19 15 13 12 13
80 to 84 10 8 6 8 4 5 6 9 8 5 14
85+ 12 6 10 10 8 5 5 13 6 3 7
Continued on next page.
Males

STATISTICAL YEARBOOK 2012
32
Table 2.9. DEATHS BY AGE AND GENDER: 2002 TO 2012 (continued)
Age 2012 2011 2010 2009 2008 2007 2006 2005 2004 2003 2002
All ages 119 124 87 138 100 112 111 102 122 104 135
Under 1 3 2 9 4 6 6 8 6 8 7 9
1 to 4 2 1 - 2 - 1 4 4 3 1 5
5 to 9 0 - - 4 2 - - - 1 1 -
10 to 14 1 - 2 0 - 1 3 1 2 3 -
15 to 19 0 1 - 1 1 1 3 - 2 2 3
20 to 24 2 - - 3 3 4 1 1 2 2 4
25 to 29 1 5 - 2 3 1 1 1 2 2 2
30 to 34 6 4 1 3 5 6 0 2 2 1 -
35 to 39 2 2 2 2 - 5 4 3 3 2 6
40 to 44 5 5 4 6 1 3 5 3 7 6 6
45 to 49 8 8 4 18 4 6 9 6 4 4 7
50 to 54 8 9 6 6 10 5 7 5 7 8 8
55 to 59 12 16 7 6 4 12 8 7 8 5 8
60 to 64 7 13 9 20 11 6 8 3 10 8 5
65 to 69 12 11 10 10 8 7 9 12 12 9 20
70 to 74 11 19 7 8 9 9 9 11 14 10 13
75 to 79 15 7 10 15 16 15 9 11 14 13 9
80 to 84 18 5 5 15 11 10 7 15 8 9 12
85+ 6 16 11 13 6 14 16 11 13 11 18
SOURCE: Health Information Management Department, LBJ Tropical Medical Center
Females

STATISTICAL YEARBOOK 2012
33
Table 2.10. CAUSE OF DEATH: 2002 TO 2012
Cause of death 2012 2011 2010 2009 2008 2007 2006 2005 2004 2003 2002
Total 282 283 247 324 240 251 267 279 289 257 289
Heart diseases 68 21 26 42 17 31 44 45 47 38 62
Malignant neoplasm 40 46 36 40 41 35 33 36 38 36 37
Cerebrovascular disease 23 11 21 23 42 26 13 25 22 22 17
Accidents 7 10 18 42 2 11 12 11 11 13 16
Nephritis & nephrosis - 1 - - 1 - - - 10 12 10
Septicemia 17 22 16 33 25 8 7 5 12 6 9
Chronic obstructive pulmonary & allied conditions 9 11 12 14 4 11 8 21 17 10 14
Influenza/pneumonia 30 15 5 21 13 20 20 12 18 21 11
Perinatal conditions 3 6 12 4 2 5 8 7 14 15 8
Ill-defined causes 17 9 24 31 11 25 29 5 - - -
Hypertension 9 36 10 11 6 10 12 12 9 5 9
Homicide - 1 1 2 3 1 1 4 5 3 10
Suicide 4 1 - 3 2 1 2 2 6 9 4
Congenital anomalies 3 - 1 5 8 4 2 5 4 2 3
Diabetes mellitus 24 63 40 32 32 32 35 33 25 30 29
Dehydration 1 - - - 2 1 2 3 - - -
Chronic liver & cirrhosis 1 4 2 1 1 1 - - 3 2 4
All other causes 26 26 23 20 28 29 39 53 48 33 46
SOURCE: Health Information Management Department, LBJ Tropical Medical Center
Table 2.11. INFANT DEATHS BY MONTH: 2002 TO 2012
Month 2012 2011 2010 2009 2008 2007 2006 2005 2004 2003 2002
Total 4 9 19 16 17 12 17 12 26 20 27
January - 1 1 2 2 1 2 1 4 2 3
February 1 - 1 1 1 2 1 2 3 4 3
March - - 1 2 1 - 1 - 1 - 2
April - 1 1 1 2 1 2 1 7 2 3
May - 3 3 - 2 1 - 2 3 3 3
June - - 2 2 1 - - 1 - 2 3
July 1 - 2 2 3 - 6 1 1 2 2
August - - 2 2 1 - 3 - 1 1 2
September 1 1 1 3 1 2 1 2 - - 1
October - 1 - 1 1 - - 1 4 2 -
November 1 2 4 - - 5 - - 1 1 1
December - - 1 - 2 - 1 1 1 1 4
SOURCE: Health Information Management Department, LBJ Tropical Medical Center

STATISTICAL YEARBOOK 2012
34
Table 2.12. NOTIFIABLE DISEASES: 2002 TO 2012
Disease 2012 2011 2010 2009 2008 2007 2006 2005 2004 2003 2002
All diseases 416 752 1,094 933 3,331 2,276 329 17 348 461 836
Communicable diseases 284 641 947 774 3,331 2,022 33 17 33 92 399
Chickenpox 7 50 27 55 8 6 - - - 2 -
Dengue fever 52 329 434 667 130 - - - - 141
Diarrhea, infantile 3 7 8 .. .. .. .. .. .. ..
Diarrhea, unspecified 18 34 32 13 .. .. .. .. .. .. 146
Gonorrhea 1 1 2 7 3 .. .. 1 .. ..
Hepatitis A .. .. - - 4 - -
Hepatitis B 18 26 28 28 .. 14 .. .. 10 69 44
Hepatitis, unspecified 1 .. 1 .. .. 1 - -
Influenza & flu syndrome 19 131 69 2,462 1,828 .. .. .. .. 48
Leprosy, lepromatous 9 1 1 .. .. .. .. ..
Leprosy, tuberculoid .. .. .. .. .. .. ..
Leprosy, other (leptospirosis) 1 25 9 16 4 4 - -
Measles 1 - - - - - - -
Meningitis, all 3 3 6 .. .. .. 1 1 8 9
Mumps 1 4 25 2 - - - - -
Rheumatic fever 5 6 3 2 .. .. .. .. .. .. ..
Salmonellosis 8 31 2 7 2 2 2 - -
Scabies 107 120 121 28 .. - - - - - -
Shigellosis 4 28 5 8 9 11 7 7 7 10
Tuberculosis, pulmonary 1 4 3 2 1 3 1 - - 1 1
Typhoid 12 5 2 7 3 3 2 2 5 -
Food poisoning 16 17 11 9 .. .. .. .. .. .. ..
Fish poisoning 2 3 6 .. 2 .. .. .. .. ..
Microfilaremia .. .. .. .. .. .. ..
Pertusis (whooping cough) 6 5 .. - - - - .. ..
Syphilis - 10 5 8 .. 4 .. 1 1 .. ..
Chlamydia 100 261 179 90 118
Non-Communicable diseases 132 111 147 159 .. 254 296 .. 315 369 437
Dog bites 101 90 127 136 .. 165 169 .. 176 193 242
Road traffic injuries 27 18 7 17 .. 77 116 .. 122 143 163
Suicide 4 3 13 6 .. 12 11 .. 17 33 32
Note: Data for 2002 to 2006 and 2012 are low due to data not being reconciled completely by the source.
SOURCE: Health Information System Office, ASG Department of Health
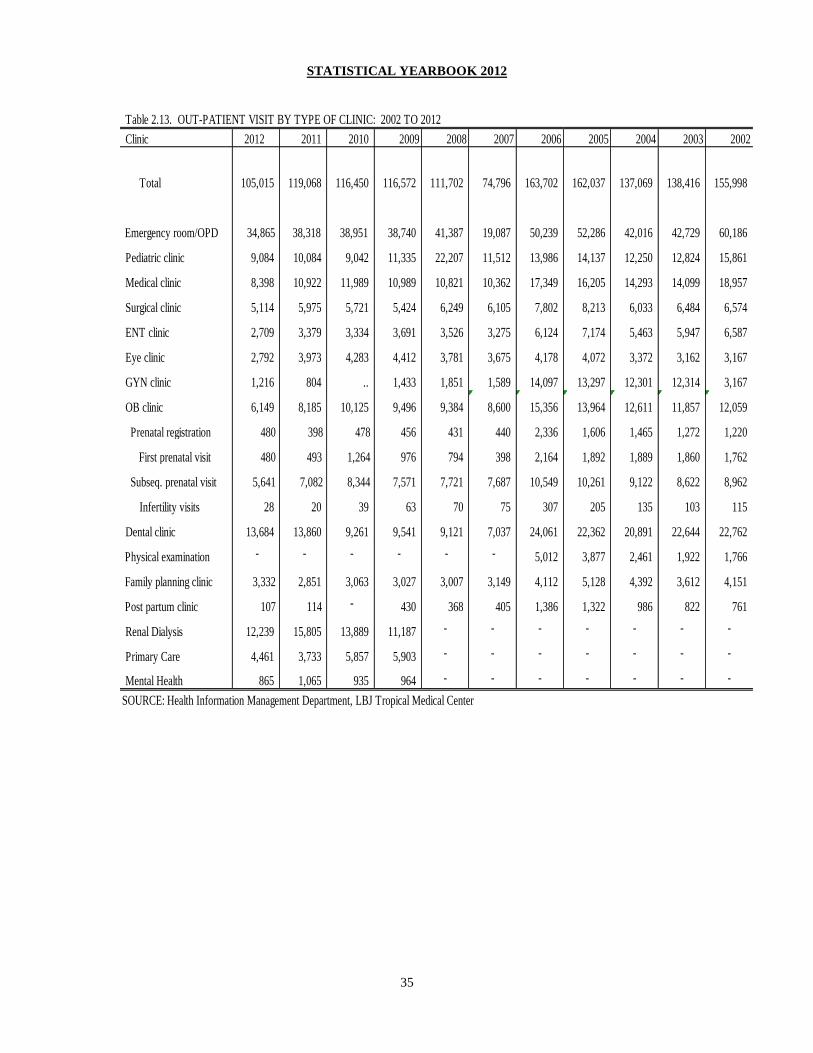
STATISTICAL YEARBOOK 2012
35
Table 2.13. OUT-PATIENT VISIT BY TYPE OF CLINIC: 2002 TO 2012
Clinic 2012 2011 2010 2009 2008 2007 2006 2005 2004 2003 2002
Total 105,015 119,068 116,450 116,572 111,702 74,796 163,702 162,037 137,069 138,416 155,998
Emergency room/OPD 34,865 38,318 38,951 38,740 41,387 19,087 50,239 52,286 42,016 42,729 60,186
Pediatric clinic 9,084 10,084 9,042 11,335 22,207 11,512 13,986 14,137 12,250 12,824 15,861
Medical clinic 8,398 10,922 11,989 10,989 10,821 10,362 17,349 16,205 14,293 14,099 18,957
Surgical clinic 5,114 5,975 5,721 5,424 6,249 6,105 7,802 8,213 6,033 6,484 6,574
ENT clinic 2,709 3,379 3,334 3,691 3,526 3,275 6,124 7,174 5,463 5,947 6,587
Eye clinic 2,792 3,973 4,283 4,412 3,781 3,675 4,178 4,072 3,372 3,162 3,167
GYN clinic 1,216 804 .. 1,433 1,851 1,589 14,097 13,297 12,301 12,314 3,167
OB clinic 6,149 8,185 10,125 9,496 9,384 8,600 15,356 13,964 12,611 11,857 12,059
Prenatal registration 480 398 478 456 431 440 2,336 1,606 1,465 1,272 1,220
First prenatal visit 480 493 1,264 976 794 398 2,164 1,892 1,889 1,860 1,762
Subseq. prenatal visit 5,641 7,082 8,344 7,571 7,721 7,687 10,549 10,261 9,122 8,622 8,962
Infertility visits 28 20 39 63 70 75 307 205 135 103 115
Dental clinic 13,684 13,860 9,261 9,541 9,121 7,037 24,061 22,362 20,891 22,644 22,762
Physical examination - - - - - - 5,012 3,877 2,461 1,922 1,766
Family planning clinic 3,332 2,851 3,063 3,027 3,007 3,149 4,112 5,128 4,392 3,612 4,151
Post partum clinic 107 114 - 430 368 405 1,386 1,322 986 822 761
Renal Dialysis 12,239 15,805 13,889 11,187 - - - - - - -
Primary Care 4,461 3,733 5,857 5,903 - - - - - - -
Mental Health 865 1,065 935 964 - - - - - - -
SOURCE: Health Information Management Department, LBJ Tropical Medical Center
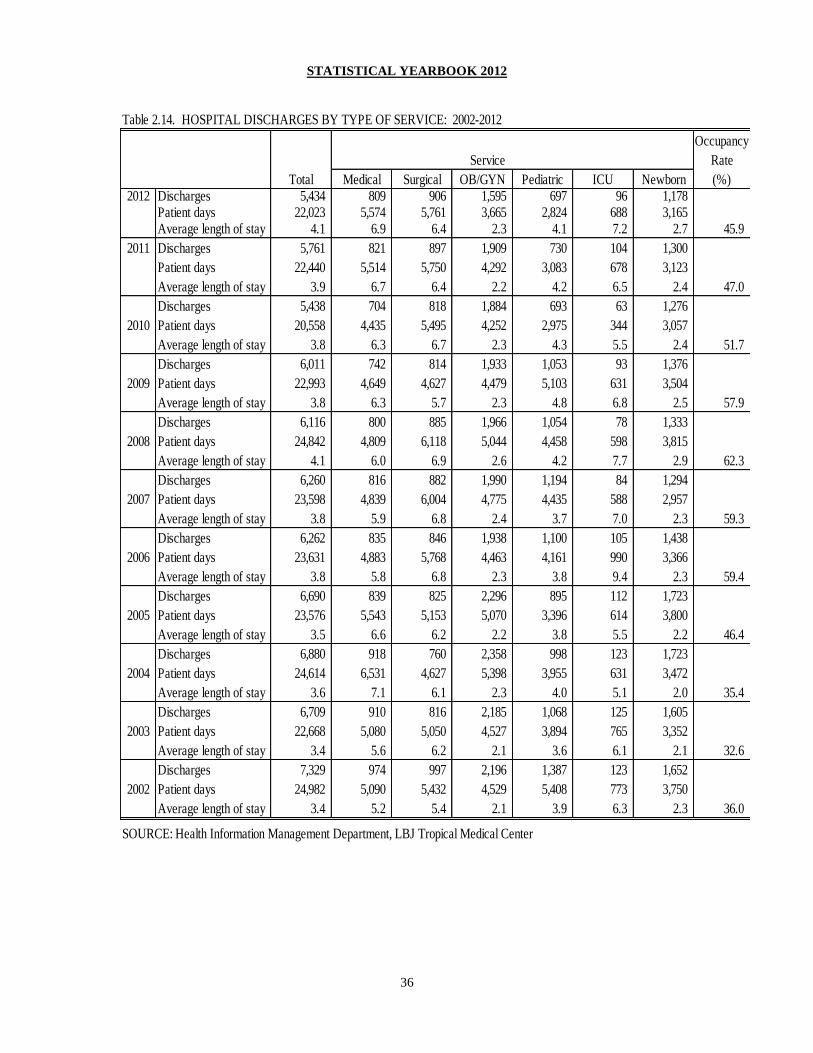
STATISTICAL YEARBOOK 2012
36
Table 2.14. HOSPITAL DISCHARGES BY TYPE OF SERVICE: 2002-2012
Occupancy
Service Rate
Total Medical Surgical OB/GYN Pediatric ICU Newborn (%)2012 Discharges 5,434 809 906 1,595 697 96 1,178
Patient days 22,023 5,574 5,761 3,665 2,824 688 3,165 Average length of stay 4.1 6.9 6.4 2.3 4.1 7.2 2.7 45.9
2011 Discharges 5,761 821 897 1,909 730 104 1,300
Patient days 22,440 5,514 5,750 4,292 3,083 678 3,123
Average length of stay 3.9 6.7 6.4 2.2 4.2 6.5 2.4 47.0
Discharges 5,438 704 818 1,884 693 63 1,276
2010 Patient days 20,558 4,435 5,495 4,252 2,975 344 3,057
Average length of stay 3.8 6.3 6.7 2.3 4.3 5.5 2.4 51.7
Discharges 6,011 742 814 1,933 1,053 93 1,376
2009 Patient days 22,993 4,649 4,627 4,479 5,103 631 3,504
Average length of stay 3.8 6.3 5.7 2.3 4.8 6.8 2.5 57.9
Discharges 6,116 800 885 1,966 1,054 78 1,333
2008 Patient days 24,842 4,809 6,118 5,044 4,458 598 3,815
Average length of stay 4.1 6.0 6.9 2.6 4.2 7.7 2.9 62.3
Discharges 6,260 816 882 1,990 1,194 84 1,294
2007 Patient days 23,598 4,839 6,004 4,775 4,435 588 2,957
Average length of stay 3.8 5.9 6.8 2.4 3.7 7.0 2.3 59.3
Discharges 6,262 835 846 1,938 1,100 105 1,438
2006 Patient days 23,631 4,883 5,768 4,463 4,161 990 3,366
Average length of stay 3.8 5.8 6.8 2.3 3.8 9.4 2.3 59.4
Discharges 6,690 839 825 2,296 895 112 1,723
2005 Patient days 23,576 5,543 5,153 5,070 3,396 614 3,800
Average length of stay 3.5 6.6 6.2 2.2 3.8 5.5 2.2 46.4
Discharges 6,880 918 760 2,358 998 123 1,723
2004 Patient days 24,614 6,531 4,627 5,398 3,955 631 3,472
Average length of stay 3.6 7.1 6.1 2.3 4.0 5.1 2.0 35.4
Discharges 6,709 910 816 2,185 1,068 125 1,605
2003 Patient days 22,668 5,080 5,050 4,527 3,894 765 3,352
Average length of stay 3.4 5.6 6.2 2.1 3.6 6.1 2.1 32.6
Discharges 7,329 974 997 2,196 1,387 123 1,652
2002 Patient days 24,982 5,090 5,432 4,529 5,408 773 3,750
Average length of stay 3.4 5.2 5.4 2.1 3.9 6.3 2.3 36.0
SOURCE: Health Information Management Department, LBJ Tropical Medical Center

STATISTICAL YEARBOOK 2012
37
Table 2.15. MARRIAGES : 2002 TO 2012
Month 2012 2011 2010 2009 2008 2007 2006 2005 2004 2003 2002
Total marriages 155 204 227 151 209 214 219 247 287 285 292
January 11 7 22 23 18 12 12 12 18 19 13
February 12 13 32 21 11 17 20 26 21 29 25
March 3 33 21 24 13 19 26 28 35 28 25
April 18 20 9 19 24 22 17 16 25 28 22
May 17 16 9 21 29 15 16 16 28 21 24
June 13 14 26 - 18 20 16 22 17 19 28
July 16 24 13 8 24 17 16 21 25 21 25
August 21 12 12 4 21 19 22 23 25 16 23
September 9 11 19 4 6 20 17 22 28 20 24
October 19 13 17 3 17 17 14 15 19 25 27
November 9 19 23 8 21 18 20 22 14 31 21
December 7 22 24 16 7 18 23 24 32 28 35
SOURCE: Office of Homeland Security-Vital Statistics, Office of the Registrar.

STATISTICAL YEARBOOK 2012
38
Table 2.16. AMERICAN SAMOA LIFE TABLE BY SEX
Average 1990
Age death population nmx nqx lx nLx Tx ex
Males
0 11 575 0.019130 0.019130 100,000.0 98,661 6,852,505 68.525050
1-4 4 3,023 0.001323 0.005279 98,087.0 391,312 6,753,844 68.855649
5-9 1 2,924 0.000342 0.001709 97,569.2 487,429 6,362,532 65.210442
10-14 1 2,812 0.000356 0.001777 97,402.5 486,580 5,875,102 60.317762
15-19 4 2,396 0.001669 0.008313 97,229.5 484,127 5,388,522 55.420660
20-24 4 2,301 0.001738 0.008654 96,421.3 480,020 4,904,395 50.864249
25-29 5 1,956 0.002518 0.012509 95,586.8 474,945 4,424,375 46.286464
30-34 5 1,807 0.002767 0.013740 94,391.1 468,713 3,949,431 41.841151
35-39 4 1,359 0.002943 0.014609 93,094.1 462,071 3,480,718 37.389232
40-44 5 1,178 0.004244 0.021000 91,734.1 453,855 3,018,647 32.906487
45-49 6 974 0.006160 0.030334 89,807.7 442,228 2,564,792 28.558700
50-54 7 835 0.008383 0.041056 87,083.5 426,479 2,122,564 24.373886
55-59 12 598 0.020067 0.095541 83,508.3 397,595 1,696,085 20.310388
60-64 12 467 0.025696 0.120724 75,529.8 354,853 1,298,490 17.191767
65-69 13 324 0.040123 0.182328 66,411.5 301,786 943,637 14.208939
70-74 11 223 0.049327 0.219561 54,302.8 241,707 641,851 11.819853
75-79 11 137 0.080292 0.334347 42,380.0 176,476 400,144 9.441808
80-84 6 55 0.109091 0.428572 28,210.4 110,827 223,667.9 7.928565
85+ 7 49 0.142857 1.000000 16,120.2 112,841 112,841.4 7.000000
Females
0 8 557 0.014363 0.014363 100,000.0 98,994.6 7,616,115 76.161150
1-4 2 2,797 0.000715 0.002856 98,563.7 393,692 7,517,120 76.266617
5-9 1 2,716 0.000368 0.001839 98,282.2 490,959 7,123,428 72.479337
10-14 1 2,417 0.000414 0.002067 98,101.4 490,000 6,632,469 67.608287
15-19 1 2,322 0.000431 0.002151 97,898.7 488,967 6,142,469 62.743117
20-24 1 2,363 0.000423 0.002114 97,688.1 487,924 5,653,502 57.872980
25-29 1 2,175 0.000460 0.002296 97,481.6 486,849 5,165,578 52.990271
30-34 1 1,706 0.000586 0.002927 97,257.8 485,577 4,678,729 48.106470
35-39 2 1,362 0.001468 0.007315 96,973.2 48.092.3 4,193,152 43.240336
40-44 2 1,068 0.001873 0.009320 96,293.8 479,076 3,710,059 38.528547
45-49 3 805 0.003727 0.018462 95,366.6 472,432 3,230,983 33.879597
50-54 4 687 0.005822 0.028694 93,606.0 461,315 2,758,552 29.469817
55-59 5 495 0.010101 0.049261 90,920.0 443,403 2,297,236 25.266553
60-64 5 456 0.010965 0.053362 86,441.2 420,675 1,853,833 21.446169
65-69 8 153 0.023324 0.110193 81,828.6 386,601 1,433,159 17.514164
70-74 7 201 0.034826 0.160183 72,811.6 334,900 1,046,558 14.373499
75-79 8 153 0.052288 0.231216 61,148.5 270,396 711,658.1 11.638203
80-84 6 70 0.085714 0.35294 47,010.0 193,571 441,262.1 9.386568
85+ 7 57 0.122807 1.000000 30,418.3 247,692 247,691.5 8.142856
SOURCE: American Samoa Government, Department of Commerce
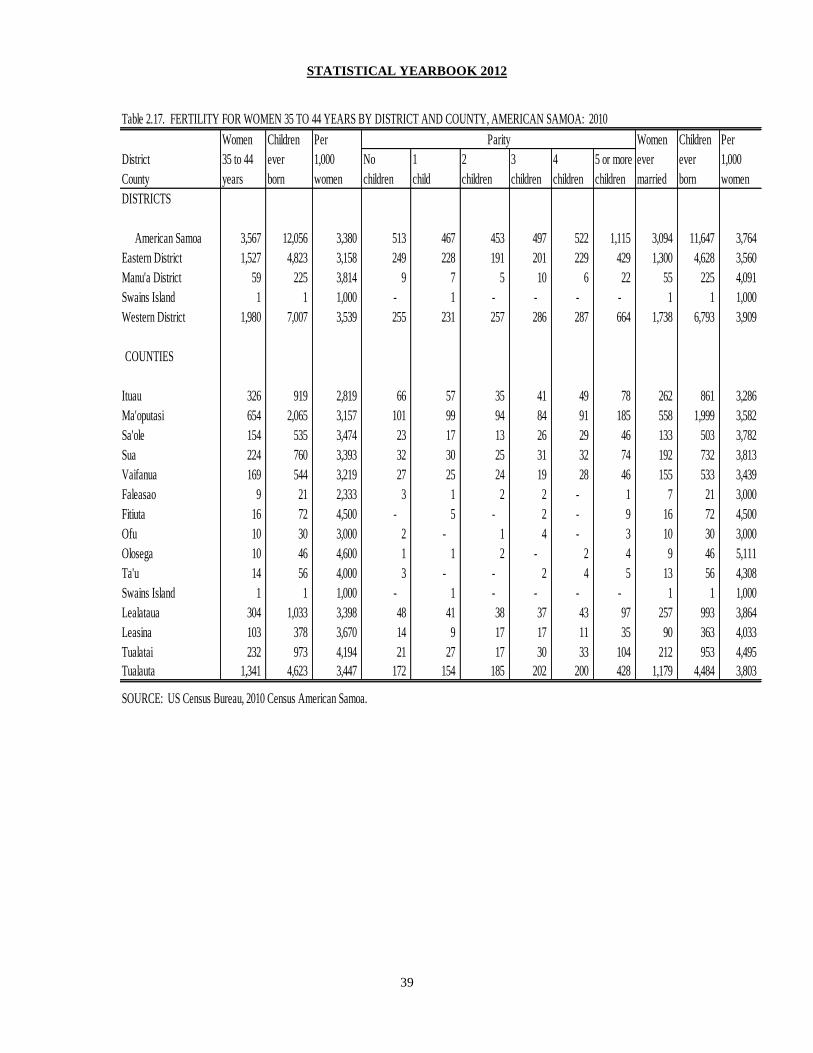
STATISTICAL YEARBOOK 2012
39
Table 2.17. FERTILITY FOR WOMEN 35 TO 44 YEARS BY DISTRICT AND COUNTY, AMERICAN SAMOA: 2010
Women Children Per Women Children Per
District 35 to 44 ever 1,000 No 1 2 3 4 5 or more ever ever 1,000
County years born women children child children children children children married born women
DISTRICTS
American Samoa 3,567 12,056 3,380 513 467 453 497 522 1,115 3,094 11,647 3,764
Eastern District 1,527 4,823 3,158 249 228 191 201 229 429 1,300 4,628 3,560
Manu'a District 59 225 3,814 9 7 5 10 6 22 55 225 4,091
Swains Island 1 1 1,000 - 1 - - - - 1 1 1,000
Western District 1,980 7,007 3,539 255 231 257 286 287 664 1,738 6,793 3,909
COUNTIES
Ituau 326 919 2,819 66 57 35 41 49 78 262 861 3,286
Ma'oputasi 654 2,065 3,157 101 99 94 84 91 185 558 1,999 3,582
Sa'ole 154 535 3,474 23 17 13 26 29 46 133 503 3,782
Sua 224 760 3,393 32 30 25 31 32 74 192 732 3,813
Vaifanua 169 544 3,219 27 25 24 19 28 46 155 533 3,439
Faleasao 9 21 2,333 3 1 2 2 - 1 7 21 3,000
Fitiuta 16 72 4,500 - 5 - 2 - 9 16 72 4,500
Ofu 10 30 3,000 2 - 1 4 - 3 10 30 3,000
Olosega 10 46 4,600 1 1 2 - 2 4 9 46 5,111
Ta'u 14 56 4,000 3 - - 2 4 5 13 56 4,308
Swains Island 1 1 1,000 - 1 - - - - 1 1 1,000
Lealataua 304 1,033 3,398 48 41 38 37 43 97 257 993 3,864
Leasina 103 378 3,670 14 9 17 17 11 35 90 363 4,033
Tualatai 232 973 4,194 21 27 17 30 33 104 212 953 4,495
Tualauta 1,341 4,623 3,447 172 154 185 202 200 428 1,179 4,484 3,803
SOURCE: US Census Bureau, 2010 Census American Samoa.
Parity
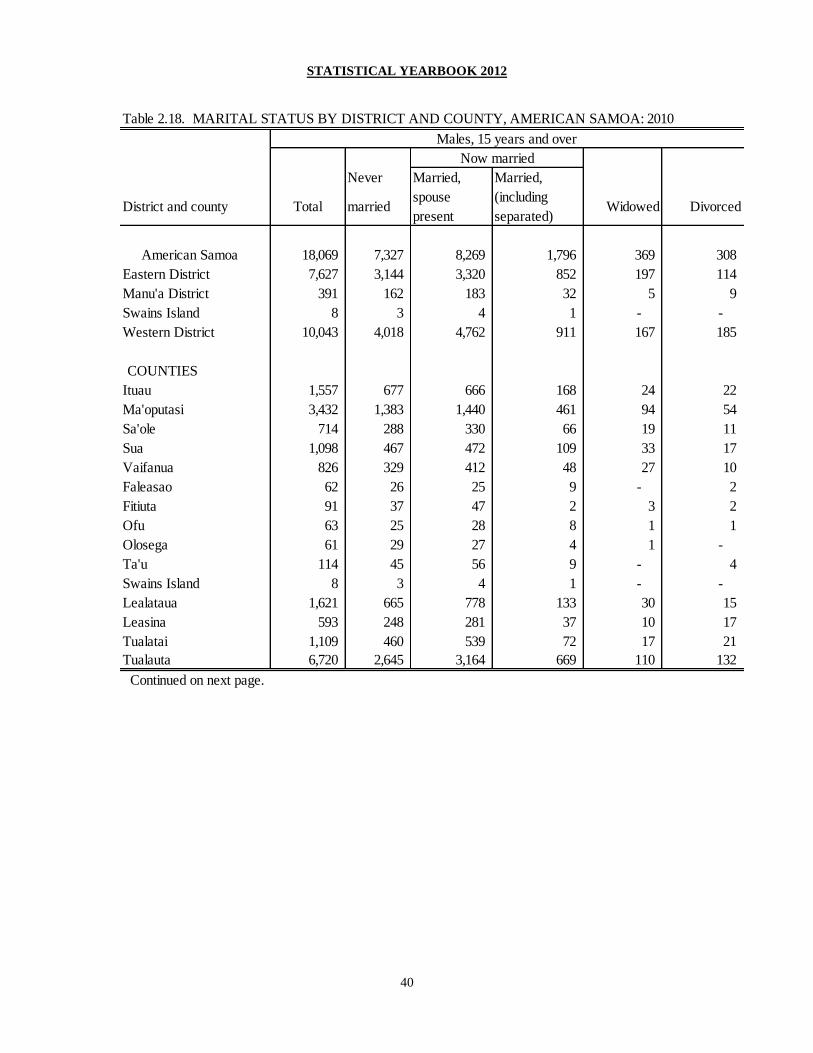
STATISTICAL YEARBOOK 2012
40
Table 2.18. MARITAL STATUS BY DISTRICT AND COUNTY, AMERICAN SAMOA: 2010
Never Married, Married,
District and county Total marriedspouse
present
(including
separated)Widowed Divorced
American Samoa 18,069 7,327 8,269 1,796 369 308
Eastern District 7,627 3,144 3,320 852 197 114
Manu'a District 391 162 183 32 5 9
Swains Island 8 3 4 1 - -
Western District 10,043 4,018 4,762 911 167 185
COUNTIES
Ituau 1,557 677 666 168 24 22
Ma'oputasi 3,432 1,383 1,440 461 94 54
Sa'ole 714 288 330 66 19 11
Sua 1,098 467 472 109 33 17
Vaifanua 826 329 412 48 27 10
Faleasao 62 26 25 9 - 2
Fitiuta 91 37 47 2 3 2
Ofu 63 25 28 8 1 1
Olosega 61 29 27 4 1 -
Ta'u 114 45 56 9 - 4
Swains Island 8 3 4 1 - -
Lealataua 1,621 665 778 133 30 15
Leasina 593 248 281 37 10 17
Tualatai 1,109 460 539 72 17 21
Tualauta 6,720 2,645 3,164 669 110 132
Continued on next page.
Males, 15 years and over
Now married

STATISTICAL YEARBOOK 2012
41
Table 2.18. MARITAL STATUS BY DISTRICT AND COUNTY, AMERICAN SAMOA: 2010 (continued)
Never Married, Married,
District and county Total marriedspouse
present
(including
separated)Widowed Divorced
American Samoa 18,025 6,207 8,269 1,629 1,479 441
Eastern District 7,562 2,645 3,320 750 663 184
Manu'a District 357 108 183 19 37 10
Swains Island 7 1 4 1 - 1
Western District 10,099 3,453 4,762 859 779 246
COUNTIES
Ituau 1,576 563 666 181 124 42
Ma'oputasi 3,332 1,164 1,440 347 294 87
Sa'ole 703 237 330 55 62 19
Sua 1,108 417 472 92 104 23
Vaifanua 853 274 412 75 79 13
Faleasao 53 18 25 3 5 2
Fitiuta 87 23 47 5 8 4
Ofu 55 16 28 3 6 2
Olosega 52 13 27 2 9 1
Ta'u 110 38 56 6 9 1
Swains Island 7 1 4 1 - 1
Lealataua 1,695 589 778 141 151 36
Leasina 580 195 281 47 49 8
Tualatai 1,130 400 539 83 84 24
Tualauta 6,684 2,259 3,164 588 495 178
SOURCE: US Census Bureau, 2010 Census American Samoa.
Now married
Females, 15 years and over
STATISTICAL YEARBOOK 2012
42
Section Three
EDUCATION
This section presents statistical information on the number of educational institutions,
school enrollment, and educational achievement.
Total educational institutions in 2012 were 151. This includes the only community
college in American Samoa. School enrollment is at 18,000 for school years 2012. The
American Samoa Community College dropped slightly in 2011 and continued to drop in
2012.
Table 3.2 shows that the average school enrollment for public schools for the 2011-2012
school years was 13,280. School enrollment for public schools dropped this year at
15,109. Public high school graduates vary from year to year. In 2011 and 2012, public
high school graduates dropped below the 1,000 mark at 942.
In 2012, there were 562 students who enrolled at ASCC full time and 1,233 enrolled part-
time. Since 2002, there were more females attending ASCC than males.
ASCC offers many majors and certificate programs. The majority of students major in
liberal arts but other majors that are popular as well are accounting, business
management, criminal justice, art, education, pre law, and nursing.
The American Samoa Community College awarded 135 degrees and certificates in 2012.
The college awarded 90 Associate of Arts degrees (66.7%), 40 Associate of Science
degrees (29.6%), and 2 Certificate of Proficiency (1.5%) in 2012.

STATISTICAL YEARBOOK 2012
43
Table 3.1. EDUCATIONAL INSTITUTIONS AND ENROLLMENT AT BEGINNING
OF SCHOOL YEAR BY TYPE AND LEVEL: 2002 TO 2012
Status 2012 2011 2010 2009 2008 2007 2006 2005 2004 2003 2002
Total institutions 151 115 112 112 112 112 124 117 117 139 140
Pre-school 64 32 31 30 30 32 40 37 37 61 64
Public 54 21 21 21 21 24 29 29 29 52 55
Private 10 11 10 9 9 8 11 8 8 9 9
K-Program 37 35 33 34 34 33 35 33 33 32 32
Public 22 23 23 23 23 23 23 23 23 23 23
Private 15 12 10 11 11 10 12 10 10 9 9
Elementary 37 36 36 36 36 33 35 33 33 32 31
Public 22 23 23 23 23 23 23 23 23 23 23
Private 15 13 13 13 13 10 12 10 10 9 8
Secondary 12 11 11 11 11 12 12 12 12 12 11
Public 6 5 5 5 5 6 6 6 6 6 6
Private 6 6 6 6 6 6 6 6 6 6 5
College 1 1 1 1 1 1 1 1 1 1 1
Special Ed. - - - - - 1 1 1 1 1 1
Total enrollment 18,044 17,768 17,885 17,637 17,594 19,559 19,528 19,846 19,023 18,997 18,895
Pre-school 1,681 1,257 1,408 1,354 1,358 2,018 2,038 1,985 1,970 2,218 1,986
Public 1,346 866 940 1,010 979 1,614 1,634 1,562 1,532 1,524 1,530
Private 335 391 468 344 379 404 404 423 438 694 456
K-Program 1,212 1,160 1,213 1,280 1,250 1,247 1,316 1,371 1,360 1,239 1,299
Public 907 866 940 1,010 979 959 1,028 1,094 1,035 984 982
Private 305 294 273 270 271 288 288 277 325 255 317
Elemantary 10,700 10,612 10,673 10,570 10,550 11,304 11,100 11,477 11,165 11,165 11,308
Public 8,707 8,432 8,521 8,520 8,506 9,539 9,335 9,415 9,291 9,337 9,477
Private 1,993 2,180 2,152 2,050 2,044 1,765 1,765 2,062 1,874 1,828 1,831
Secondary 4,451 4,739 4,591 4,433 4,436 4,990 5,074 4,982 4,495 4,336 4,251
Public 4,149 4,011 4,145 3,795 3,796 4,467 4,551 4,489 4,066 4,063 3,958
Private 302 728 446 638 640 523 523 493 429 273 293
Special Ed. - - - - - - - 31 33 39 51
College, (Fall) 1,795 2,042 2,193 2,188 1,826 1,767 1,607 1,601 1,550 1,537 1,367
SOURCE: Department of Education, Office of Student Services, Data and
Research; American Samoa Community College, Admissions and
Records Office
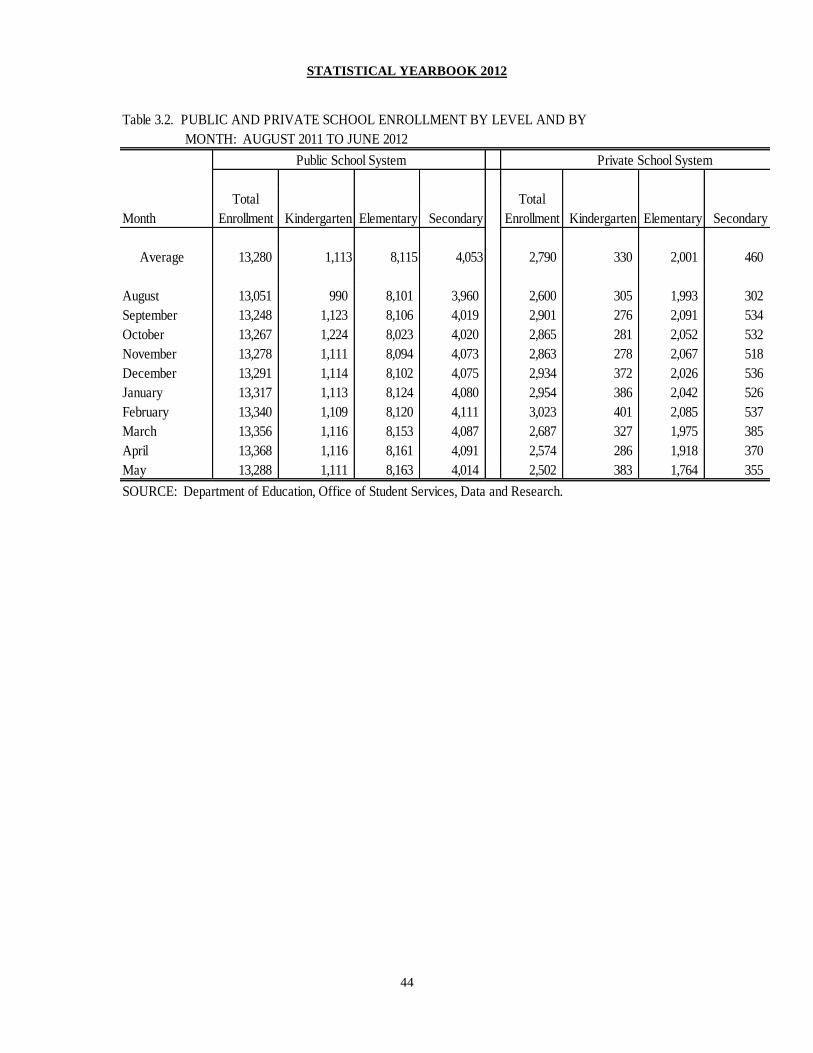
STATISTICAL YEARBOOK 2012
44
Table 3.2. PUBLIC AND PRIVATE SCHOOL ENROLLMENT BY LEVEL AND BY
MONTH: AUGUST 2011 TO JUNE 2012
Total Total
Month Enrollment Kindergarten Elementary Secondary Enrollment Kindergarten Elementary Secondary
Average 13,280 1,113 8,115 4,053 2,790 330 2,001 460
August 13,051 990 8,101 3,960 2,600 305 1,993 302
September 13,248 1,123 8,106 4,019 2,901 276 2,091 534
October 13,267 1,224 8,023 4,020 2,865 281 2,052 532
November 13,278 1,111 8,094 4,073 2,863 278 2,067 518
December 13,291 1,114 8,102 4,075 2,934 372 2,026 536
January 13,317 1,113 8,124 4,080 2,954 386 2,042 526
February 13,340 1,109 8,120 4,111 3,023 401 2,085 537
March 13,356 1,116 8,153 4,087 2,687 327 1,975 385
April 13,368 1,116 8,161 4,091 2,574 286 1,918 370
May 13,288 1,111 8,163 4,014 2,502 383 1,764 355
SOURCE: Department of Education, Office of Student Services, Data and Research.
Public School System Private School System

STATISTICAL YEARBOOK 2012
45
Table 3.3. PUBLIC AND PRIVATE SCHOOL ENROLLMENT BY GRADE, AT
THE BEGINNING OF SCHOOL YEAR: 2002 TO 2012
Grade 2012 2011 2010 2009 2008 2007 2006 2005 2004 2003 2002
All grades 1/ 17,060 18,573 16,052 19,420 19,221 18,799 19,494 19,561 19,021 18,997 18,895
Early childhood
education 1,681 1,923 2,000 1,729 1,671 2,018 2,404 1,985 1,970 2,218 1,986
Kindergarten 1,212 1,355 940 1,291 1,249 1,192 1,316 1,371 1,360 1,239 1,299
1 808 1,383 1,071 1,284 1,312 1,404 1,068 1,418 1,402 1,397 1,415
2 1,394 1,287 1,035 1,298 1,309 1,385 1,383 1,410 1,394 1,470 1,488
3 1,394 1,280 1,068 1,297 1,279 1,313 1,390 1,374 1,358 1,526 1,544
4 1,314 1,262 1,069 1,296 1,282 1,336 1,343 1,332 1,316 1,474 1,492
5 1,241 1,259 1,070 1,283 1,270 1,140 1,299 1,410 1,394 1,358 1,376
6 1,285 1,249 1,080 1,263 1,219 1,421 1,358 1,481 1,465 1,364 1,382
7 1,227 1,248 1,085 1,218 1,292 1,282 1,400 1,454 1,438 1,351 1,369
8 1,291 1,219 1,043 1,261 1,317 1,322 1,429 1,413 1,397 1,225 1,242
9 1,251 1,279 1,195 1,362 1,457 1,369 1,465 1,322 1,223 1,205 1,188
10 584 1,309 1,122 1,362 1,308 1,331 1,280 1,322 1,225 1,107 1,101
11 1,172 1,278 1,199 1,230 1,164 1,144 1,234 1,172 1,076 1,038 994
12 1,206 1,242 1,075 1,093 1,113 1,142 1,095 1,066 970 986 968
Special education - - - 1,153 979 - 30 31 33 39 51
SOURCE: Department of Education, Office of Student Services, Data and Research.
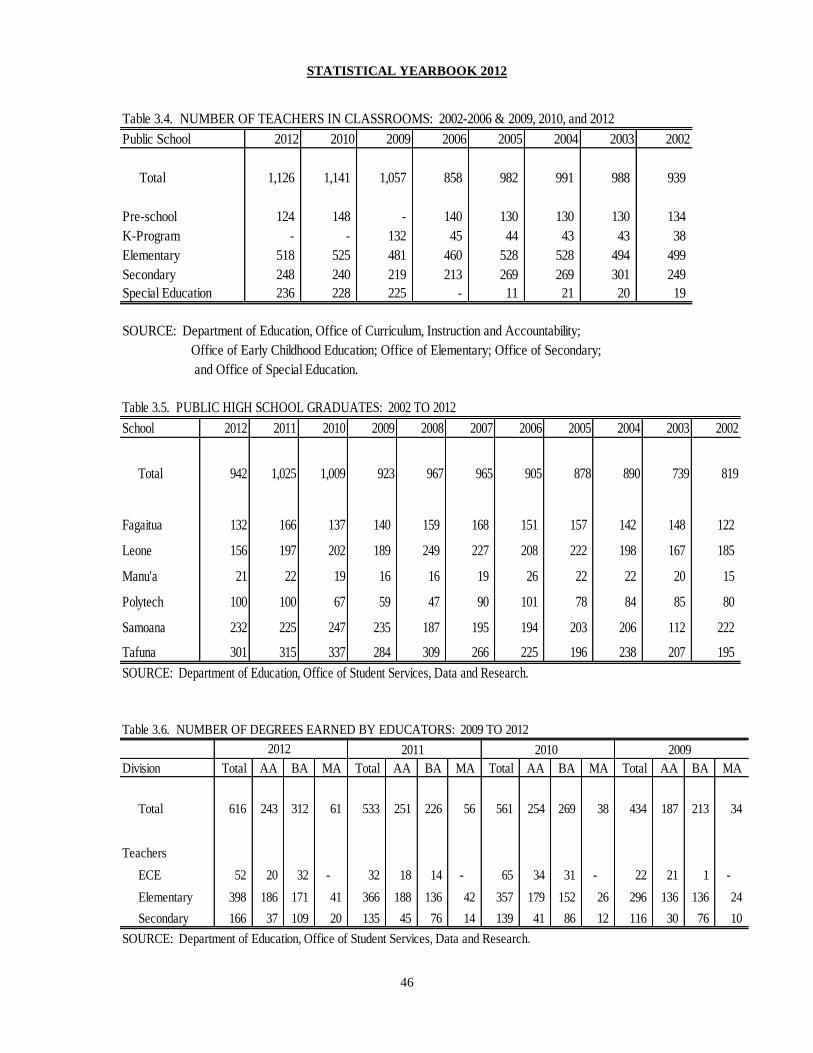
STATISTICAL YEARBOOK 2012
46
Table 3.4. NUMBER OF TEACHERS IN CLASSROOMS: 2002-2006 & 2009, 2010, and 2012
Public School 2012 2010 2009 2006 2005 2004 2003 2002
Total 1,126 1,141 1,057 858 982 991 988 939
Pre-school 124 148 - 140 130 130 130 134
K-Program - - 132 45 44 43 43 38
Elementary 518 525 481 460 528 528 494 499
Secondary 248 240 219 213 269 269 301 249
Special Education 236 228 225 - 11 21 20 19
SOURCE: Department of Education, Office of Curriculum, Instruction and Accountability;
Office of Early Childhood Education; Office of Elementary; Office of Secondary;
and Office of Special Education.
Table 3.5. PUBLIC HIGH SCHOOL GRADUATES: 2002 TO 2012
School 2012 2011 2010 2009 2008 2007 2006 2005 2004 2003 2002
Total 942 1,025 1,009 923 967 965 905 878 890 739 819
Fagaitua 132 166 137 140 159 168 151 157 142 148 122
Leone 156 197 202 189 249 227 208 222 198 167 185
Manu'a 21 22 19 16 16 19 26 22 22 20 15
Polytech 100 100 67 59 47 90 101 78 84 85 80
Samoana 232 225 247 235 187 195 194 203 206 112 222
Tafuna 301 315 337 284 309 266 225 196 238 207 195
SOURCE: Department of Education, Office of Student Services, Data and Research.
Table 3.6. NUMBER OF DEGREES EARNED BY EDUCATORS: 2009 TO 2012
Division Total AA BA MA Total AA BA MA Total AA BA MA Total AA BA MA
Total 616 243 312 61 533 251 226 56 561 254 269 38 434 187 213 34
Teachers
ECE 52 20 32 - 32 18 14 - 65 34 31 - 22 21 1 -
Elementary 398 186 171 41 366 188 136 42 357 179 152 26 296 136 136 24
Secondary 166 37 109 20 135 45 76 14 139 41 86 12 116 30 76 10
SOURCE: Department of Education, Office of Student Services, Data and Research.
2012 2011 2010 2009
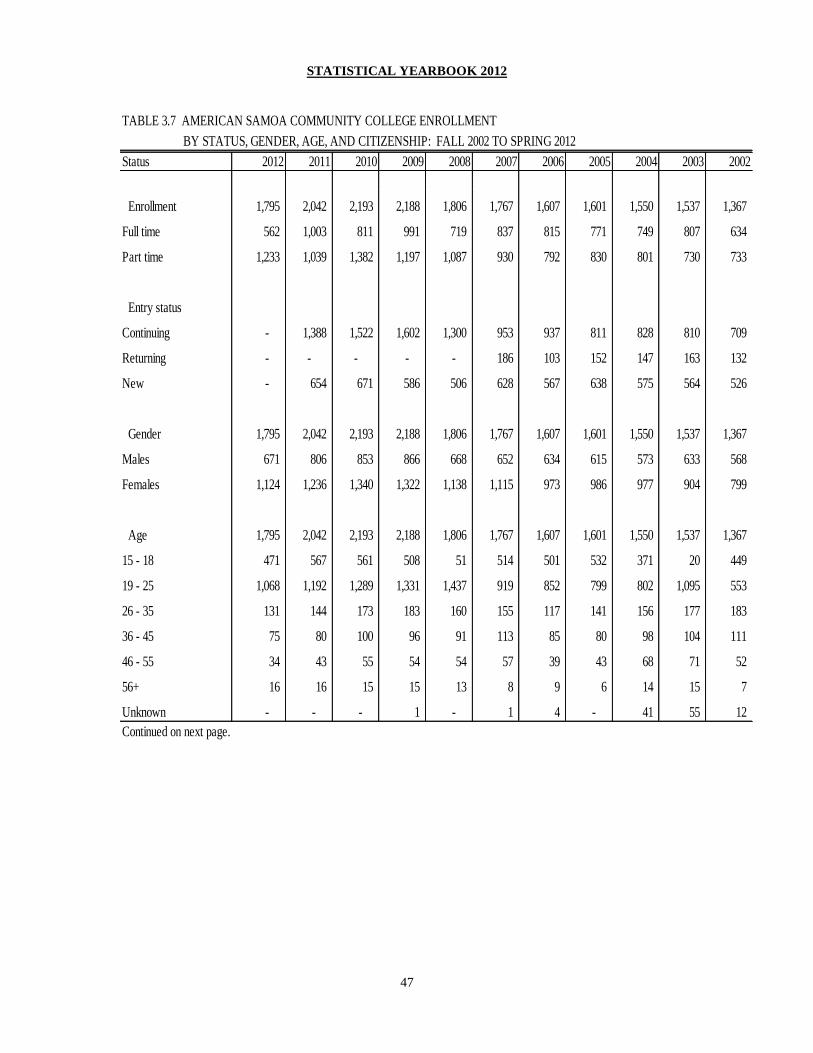
STATISTICAL YEARBOOK 2012
47
TABLE 3.7 AMERICAN SAMOA COMMUNITY COLLEGE ENROLLMENT
BY STATUS, GENDER, AGE, AND CITIZENSHIP: FALL 2002 TO SPRING 2012
Status 2012 2011 2010 2009 2008 2007 2006 2005 2004 2003 2002
Enrollment 1,795 2,042 2,193 2,188 1,806 1,767 1,607 1,601 1,550 1,537 1,367
Full time 562 1,003 811 991 719 837 815 771 749 807 634
Part time 1,233 1,039 1,382 1,197 1,087 930 792 830 801 730 733
Entry status
Continuing - 1,388 1,522 1,602 1,300 953 937 811 828 810 709
Returning - - - - - 186 103 152 147 163 132
New - 654 671 586 506 628 567 638 575 564 526
Gender 1,795 2,042 2,193 2,188 1,806 1,767 1,607 1,601 1,550 1,537 1,367
Males 671 806 853 866 668 652 634 615 573 633 568
Females 1,124 1,236 1,340 1,322 1,138 1,115 973 986 977 904 799
Age 1,795 2,042 2,193 2,188 1,806 1,767 1,607 1,601 1,550 1,537 1,367
15 - 18 471 567 561 508 51 514 501 532 371 20 449
19 - 25 1,068 1,192 1,289 1,331 1,437 919 852 799 802 1,095 553
26 - 35 131 144 173 183 160 155 117 141 156 177 183
36 - 45 75 80 100 96 91 113 85 80 98 104 111
46 - 55 34 43 55 54 54 57 39 43 68 71 52
56+ 16 16 15 15 13 8 9 6 14 15 7
Unknown - - - 1 - 1 4 - 41 55 12
Continued on next page.
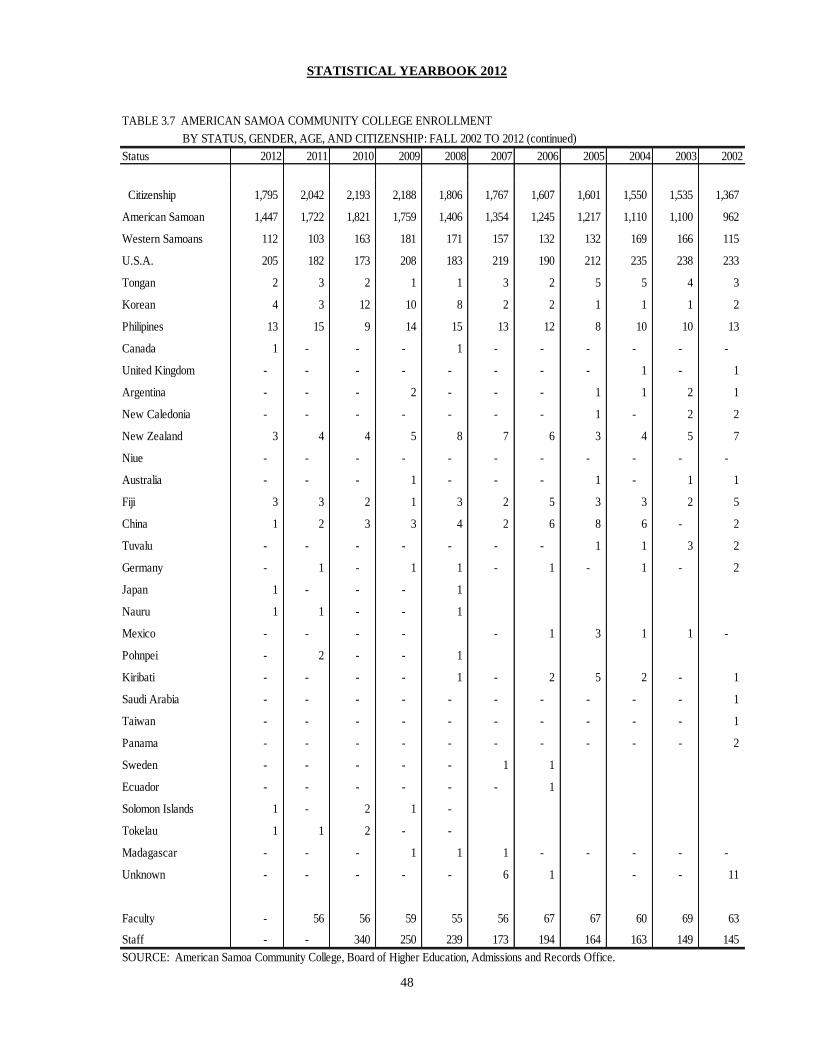
STATISTICAL YEARBOOK 2012
48
TABLE 3.7 AMERICAN SAMOA COMMUNITY COLLEGE ENROLLMENT
BY STATUS, GENDER, AGE, AND CITIZENSHIP: FALL 2002 TO 2012 (continued)
Status 2012 2011 2010 2009 2008 2007 2006 2005 2004 2003 2002
Citizenship 1,795 2,042 2,193 2,188 1,806 1,767 1,607 1,601 1,550 1,535 1,367
American Samoan 1,447 1,722 1,821 1,759 1,406 1,354 1,245 1,217 1,110 1,100 962
Western Samoans 112 103 163 181 171 157 132 132 169 166 115
U.S.A. 205 182 173 208 183 219 190 212 235 238 233
Tongan 2 3 2 1 1 3 2 5 5 4 3
Korean 4 3 12 10 8 2 2 1 1 1 2
Philipines 13 15 9 14 15 13 12 8 10 10 13
Canada 1 - - - 1 - - - - - -
United Kingdom - - - - - - - - 1 - 1
Argentina - - - 2 - - - 1 1 2 1
New Caledonia - - - - - - - 1 - 2 2
New Zealand 3 4 4 5 8 7 6 3 4 5 7
Niue - - - - - - - - - - -
Australia - - - 1 - - - 1 - 1 1
Fiji 3 3 2 1 3 2 5 3 3 2 5
China 1 2 3 3 4 2 6 8 6 - 2
Tuvalu - - - - - - - 1 1 3 2
Germany - 1 - 1 1 - 1 - 1 - 2
Japan 1 - - - 1
Nauru 1 1 - - 1
Mexico - - - - - 1 3 1 1 -
Pohnpei - 2 - - 1
Kiribati - - - - 1 - 2 5 2 - 1
Saudi Arabia - - - - - - - - - - 1
Taiwan - - - - - - - - - - 1
Panama - - - - - - - - - - 2
Sweden - - - - - 1 1
Ecuador - - - - - - 1
Solomon Islands 1 - 2 1 -
Tokelau 1 1 2 - -
Madagascar - - - 1 1 1 - - - - -
Unknown - - - - - 6 1 - - 11
Faculty - 56 56 59 55 56 67 67 60 69 63
Staff - - 340 250 239 173 194 164 163 149 145
SOURCE: American Samoa Community College, Board of Higher Education, Admissions and Records Office.

STATISTICAL YEARBOOK 2012
49
Table 3.8. AMERICAN SAMOA COMMUNITY COLLEGE ENROLLMENT BY MAJOR,
CERTIFICATE PROGRAMS, AND OTHERS: 2002 TO 2012
Subject 2012 2011 2010 2009 2008 2007 2006 2005 2004 2003 2002
Fall enrollment 1,795 2,042 2,193 2,188 1,806 1,767 1,607 1,601 1,550 1,537 1,367
Accounting 85 112 124 101 83 74 65 79 92 109 93
Accounting/Art - - 1
Accounting/Business Management 12 13 18 20 12 1 14 10 - 1 1
Accounting/ Civil Engineering Technology 2 1 1 - -
Accounting/Education 3 - - - - 1 1 - -
Accounting/Health Science 1
Accounting/Music 1
Accounting/Office Administration & Technology - - - 2 2 1 - - -
Accounting/Samoan Studies 1 - - - - 1
Agribusiness 2 6 5 5 3 5 3 - 3 7 4
Agribusiness/Criminal Justice 1
Agribusiness/General Agriculture - 1 -
Agriculture - - - - - 6 11 22 16
Agriculture Drafting/Welding/Construction/CT in Arch. Draft - - - 1 - 1 - - -
Architectural Drafting 12 26 27 25 17 23 24 18 16 19 20
Architectural Drafting/Business Management 1
Architectural Drafting/Civil Engineering Technology 1
Architectural Drafting/Construction - 1 -
Architectural Drafting/Criminal Justice - 1 1
Architectural Drafting/Electronics 1 1 2 1 -
Architectural Drafting/Art 1 1 1 - 7 1 - - - -
Architectural Drafting/OAT - - - 1 1 - - - -
Art 25 47 43 37 25 23 20 14 23 26 14
Art/Automotive Mechanics/Pre-law - - 1
Art/Education 1 1 - 1 -
Art/Music 1 2 3 1 1 1
Art/Marine Science 1
Automotive Body Repair 1 - 4 6 14 11 5 10 9 3
Automotive Body Repair Electronics - - - 1
Automotive Mechanics 3 5 4 6 7 21 10 16 20 27 5
Automotive Mechanics/Automotive Body Repair 1 2 3 1
Automotive Mechanics/Certificate in Welding - - 1
Automotive Mechanics/Civil Engineering Technology 1
Automotive Mechanics/Criminal Justice 1
Business Management 39 51 65 58 47 61 46 59 77 83 76
Business Management /Art 1 - 1 1 1
Business Management/ Education 2 1 - - - 1 1 2 - - -
Business Management/Accounting/Office Administration & Technology - 1 - 2
Business Management/Electronics 1 1 - - 1
Business Management/General Agriculture 1
Business Management/Natural Resources 1
Business Management/Office Administration & Technology - - - - 1 1 - - -
Business Management/Certificate in ICT - - 1
Certificate in Air Conditioning & Refrigeration - - 1
Certificate Architectural Drafting 1 - - - - - - 1 2 2
Certificate Auto Body Repair 1 8 8 12 2 - 2 2 1 - -
Certificate in Accounting 2 1 2 2 - - - - 2 1 -
Certificate in Automotive Mechanics 2 4 3 6 13 - 1 1 - - -
Certificate in Auto Technology/Automotive Body Repair - 2 -
Certificate in Auto Technology/Electronics 2 1 1 -
Certificate in Automotive Mechanics/General Agriculture 1 - -
Certificate in Automotive Mechanics/Criminal Justice - 1 -
Certificate in Automotive Mechanics/Welding - - 1
Certificate in Automotive Technology 7 11 10 10 -
Certificate in Automotive Technology/Certificate in Civil Engineering Technology1
Certificate in Carpentry 2 4 1 -
Certificate in Civil Engineering Technology 2 3 4 5 2 - 2 1 1 - 1
Civil Engineering Technology/Certificate in ACR - - 1
Certificate in Computer Systems 4 3 4
Certificate in Construction - - - - 1 - - - -
Certificate in Criminal Justice 3 - 1 - - - - 1 - 2
Certificate in Diesel Engines 4 1 1 1 1
Certificate in Diesel Engines/Electronics 1 - - 1
Certificate in Electrical Technology 2 2 7 5 -
Continued on next page
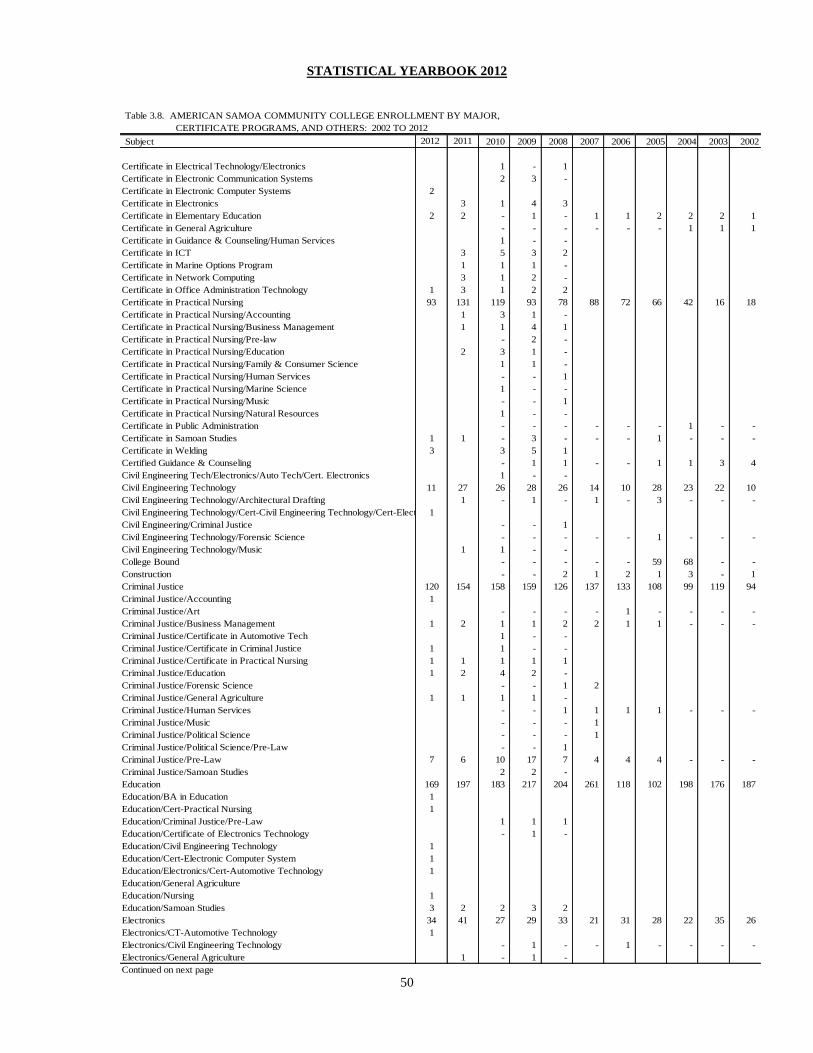
STATISTICAL YEARBOOK 2012
50
Table 3.8. AMERICAN SAMOA COMMUNITY COLLEGE ENROLLMENT BY MAJOR,
CERTIFICATE PROGRAMS, AND OTHERS: 2002 TO 2012
Subject 2012 2011 2010 2009 2008 2007 2006 2005 2004 2003 2002
Certificate in Electrical Technology/Electronics 1 - 1
Certificate in Electronic Communication Systems 2 3 -
Certificate in Electronic Computer Systems 2
Certificate in Electronics 3 1 4 3
Certificate in Elementary Education 2 2 - 1 - 1 1 2 2 2 1
Certificate in General Agriculture - - - - - - 1 1 1
Certificate in Guidance & Counseling/Human Services 1 - -
Certificate in ICT 3 5 3 2
Certificate in Marine Options Program 1 1 1 -
Certificate in Network Computing 3 1 2 -
Certificate in Office Administration Technology 1 3 1 2 2
Certificate in Practical Nursing 93 131 119 93 78 88 72 66 42 16 18
Certificate in Practical Nursing/Accounting 1 3 1 -
Certificate in Practical Nursing/Business Management 1 1 4 1
Certificate in Practical Nursing/Pre-law - 2 -
Certificate in Practical Nursing/Education 2 3 1 -
Certificate in Practical Nursing/Family & Consumer Science 1 1 -
Certificate in Practical Nursing/Human Services - - 1
Certificate in Practical Nursing/Marine Science 1 - -
Certificate in Practical Nursing/Music - - 1
Certificate in Practical Nursing/Natural Resources 1 - -
Certificate in Public Administration - - - - - - 1 - -
Certificate in Samoan Studies 1 1 - 3 - - - 1 - - -
Certificate in Welding 3 3 5 1
Certified Guidance & Counseling - 1 1 - - 1 1 3 4
Civil Engineering Tech/Electronics/Auto Tech/Cert. Electronics 1 - -
Civil Engineering Technology 11 27 26 28 26 14 10 28 23 22 10
Civil Engineering Technology/Architectural Drafting 1 - 1 - 1 - 3 - - -
Civil Engineering Technology/Cert-Civil Engineering Technology/Cert-Electrical Technology1
Civil Engineering/Criminal Justice - - 1
Civil Engineering Technology/Forensic Science - - - - - 1 - - -
Civil Engineering Technology/Music 1 1 - -
College Bound - - - - - 59 68 - -
Construction - - 2 1 2 1 3 - 1
Criminal Justice 120 154 158 159 126 137 133 108 99 119 94
Criminal Justice/Accounting 1
Criminal Justice/Art - - - - 1 - - - -
Criminal Justice/Business Management 1 2 1 1 2 2 1 1 - - -
Criminal Justice/Certificate in Automotive Tech 1 - -
Criminal Justice/Certificate in Criminal Justice 1 1 - -
Criminal Justice/Certificate in Practical Nursing 1 1 1 1 1
Criminal Justice/Education 1 2 4 2 -
Criminal Justice/Forensic Science - - 1 2
Criminal Justice/General Agriculture 1 1 1 1 -
Criminal Justice/Human Services - - 1 1 1 1 - - -
Criminal Justice/Music - - - 1
Criminal Justice/Political Science - - - 1
Criminal Justice/Political Science/Pre-Law - - 1
Criminal Justice/Pre-Law 7 6 10 17 7 4 4 4 - - -
Criminal Justice/Samoan Studies 2 2 -
Education 169 197 183 217 204 261 118 102 198 176 187
Education/BA in Education 1
Education/Cert-Practical Nursing 1
Education/Criminal Justice/Pre-Law 1 1 1
Education/Certificate of Electronics Technology - 1 -
Education/Civil Engineering Technology 1
Education/Cert-Electronic Computer System 1
Education/Electronics/Cert-Automotive Technology 1
Education/General Agriculture
Education/Nursing 1
Education/Samoan Studies 3 2 2 3 2
Electronics 34 41 27 29 33 21 31 28 22 35 26
Electronics/CT-Automotive Technology 1
Electronics/Civil Engineering Technology - 1 - - 1 - - - -
Electronics/General Agriculture 1 - 1 -
Continued on next page
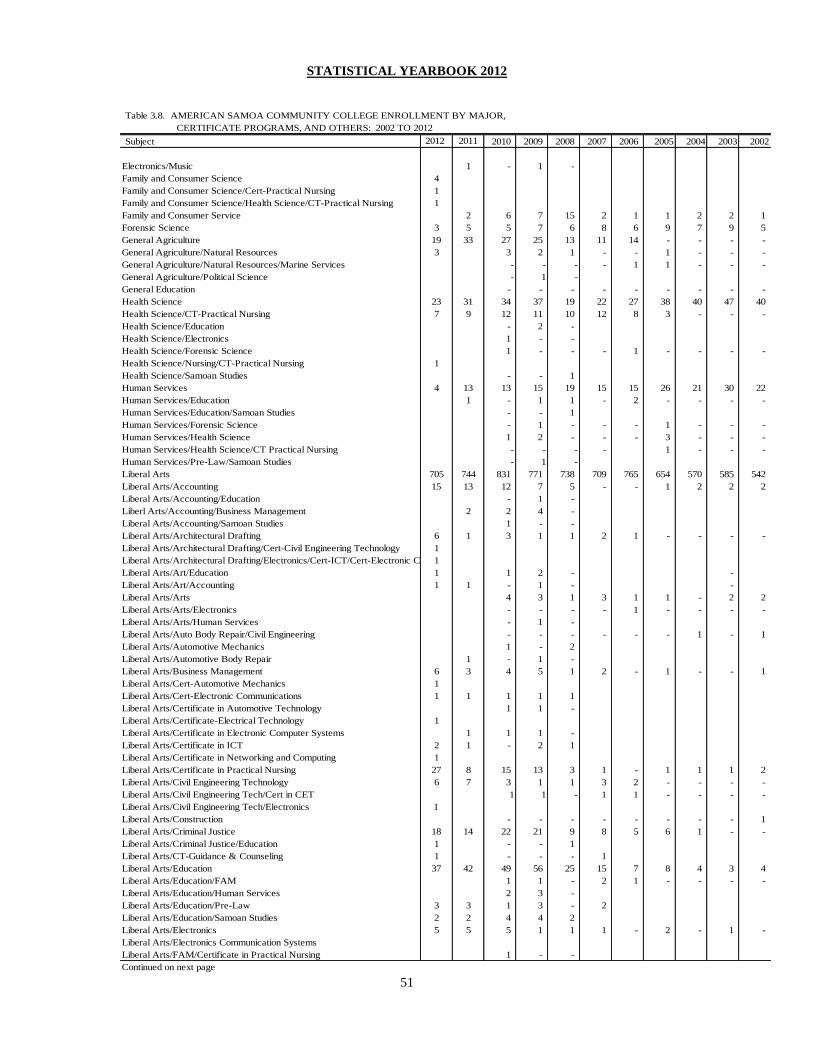
STATISTICAL YEARBOOK 2012
51
Table 3.8. AMERICAN SAMOA COMMUNITY COLLEGE ENROLLMENT BY MAJOR,
CERTIFICATE PROGRAMS, AND OTHERS: 2002 TO 2012
Subject 2012 2011 2010 2009 2008 2007 2006 2005 2004 2003 2002
Electronics/Music 1 - 1 -
Family and Consumer Science 4
Family and Consumer Science/Cert-Practical Nursing 1
Family and Consumer Science/Health Science/CT-Practical Nursing 1
Family and Consumer Service 2 6 7 15 2 1 1 2 2 1
Forensic Science 3 5 5 7 6 8 6 9 7 9 5
General Agriculture 19 33 27 25 13 11 14 - - - -
General Agriculture/Natural Resources 3 3 2 1 - - 1 - - -
General Agriculture/Natural Resources/Marine Services - - - - 1 1 - - -
General Agriculture/Political Science - 1 -
General Education - - - - - - - - -
Health Science 23 31 34 37 19 22 27 38 40 47 40
Health Science/CT-Practical Nursing 7 9 12 11 10 12 8 3 - - -
Health Science/Education - 2 -
Health Science/Electronics 1 - -
Health Science/Forensic Science 1 - - - 1 - - - -
Health Science/Nursing/CT-Practical Nursing 1
Health Science/Samoan Studies - - 1
Human Services 4 13 13 15 19 15 15 26 21 30 22
Human Services/Education 1 - 1 1 - 2 - - - -
Human Services/Education/Samoan Studies - - 1
Human Services/Forensic Science - 1 - - - 1 - - -
Human Services/Health Science 1 2 - - - 3 - - -
Human Services/Health Science/CT Practical Nursing - - - - 1 - - -
Human Services/Pre-Law/Samoan Studies - 1 -
Liberal Arts 705 744 831 771 738 709 765 654 570 585 542
Liberal Arts/Accounting 15 13 12 7 5 - - 1 2 2 2
Liberal Arts/Accounting/Education - 1 -
Liberl Arts/Accounting/Business Management 2 2 4 -
Liberal Arts/Accounting/Samoan Studies 1 - -
Liberal Arts/Architectural Drafting 6 1 3 1 1 2 1 - - - -
Liberal Arts/Architectural Drafting/Cert-Civil Engineering Technology 1
Liberal Arts/Architectural Drafting/Electronics/Cert-ICT/Cert-Electronic Computer System1
Liberal Arts/Art/Education 1 1 2 - -
Liberal Arts/Art/Accounting 1 1 - 1 - -
Liberal Arts/Arts 4 3 1 3 1 1 - 2 2
Liberal Arts/Arts/Electronics - - - - 1 - - - -
Liberal Arts/Arts/Human Services - 1 -
Liberal Arts/Auto Body Repair/Civil Engineering - - - - - - 1 - 1
Liberal Arts/Automotive Mechanics 1 - 2
Liberal Arts/Automotive Body Repair 1 - 1 -
Liberal Arts/Business Management 6 3 4 5 1 2 - 1 - - 1
Liberal Arts/Cert-Automotive Mechanics 1
Liberal Arts/Cert-Electronic Communications 1 1 1 1 1
Liberal Arts/Certificate in Automotive Technology 1 1 -
Liberal Arts/Certificate-Electrical Technology 1
Liberal Arts/Certificate in Electronic Computer Systems 1 1 1 -
Liberal Arts/Certificate in ICT 2 1 - 2 1
Liberal Arts/Certificate in Networking and Computing 1
Liberal Arts/Certificate in Practical Nursing 27 8 15 13 3 1 - 1 1 1 2
Liberal Arts/Civil Engineering Technology 6 7 3 1 1 3 2 - - - -
Liberal Arts/Civil Engineering Tech/Cert in CET 1 1 - 1 1 - - - -
Liberal Arts/Civil Engineering Tech/Electronics 1
Liberal Arts/Construction - - - - - - - - 1
Liberal Arts/Criminal Justice 18 14 22 21 9 8 5 6 1 - -
Liberal Arts/Criminal Justice/Education 1 - - 1
Liberal Arts/CT-Guidance & Counseling 1 - - - 1
Liberal Arts/Education 37 42 49 56 25 15 7 8 4 3 4
Liberal Arts/Education/FAM 1 1 - 2 1 - - - -
Liberal Arts/Education/Human Services 2 3 -
Liberal Arts/Education/Pre-Law 3 3 1 3 - 2
Liberal Arts/Education/Samoan Studies 2 2 4 4 2
Liberal Arts/Electronics 5 5 5 1 1 1 - 2 - 1 -
Liberal Arts/Electronics Communication Systems
Liberal Arts/FAM/Certificate in Practical Nursing 1 - -
Continued on next page

STATISTICAL YEARBOOK 2012
52
Table 3.8. AMERICAN SAMOA COMMUNITY COLLEGE ENROLLMENT BY MAJOR,
CERTIFICATE PROGRAMS, AND OTHERS: 2002 TO 2012
Subject 2012 2011 2010 2009 2008 2007 2006 2005 2004 2003 2002
Liberal Arts/Family and Consumer Science 2 1 - 3
Liberal Arts/General Agriculture 6 3 3 4 3 1
Liberal Arts/Health Science 6 6 5 2 - 1 - 1 - - 2
Liberal Arts/Health Science/Certificate in Practical Nursing 1 - 1 -
Liberal Arts/Human Services 1 4 5 7 2 2 6 4 2 4 7
Liberal Arts/Human Services/Samoan Studies - - 1
Liberal Arts/Marine Science 5 6 9 7 1 4 5 5 - - 2
Liberal Arts/Marine Science/Education - - 1 - - 1 - - -
Liberal Arts/Marine Science/Health Science - - - 2 1 1 - - -
Liberal Arts/Marine Science/Political Science - - - 1
Liberal Arts/Music 2 1 2 - 1 1 - - - 1
Liberal Arts/Music/Criiminal Justice - - 1
Liberal Arts/Music/Education - - - 1
Liberal Arts/Natural Resources 3 1 2 2 1 1
Liberal Arts/Nursing 1 - 1 - - 1 - - - -
Liberal Arts/Nursing/CT-Practical Nursing 1
Liberal Arts/Office Administration & Tech. 1 - - - - - 1 - - 1
Liberal Arts/Political Science 1 2 2 1 4 5 1 - -
Liberal Arts/Pre Law 17 13 24 32 16 8 5 9 - - 5
Liberal Arts/Pre Law/Political Science - - - - - 1 - - -
Liberal Arts/Pre-Law/Criminal Justice 1 2 6 5 2 1
Liberal Arts/Samoan Studies 8 10 13 15 2 1 1 - - - -
Marine Science/Business Management 1 - - 1 1
Marine Science/Civil Engineering Technology - - - - - 1 - - -
Marine Science/Criminal Justice 2
Marine Science/Education 1 - - 1 1
Marine Science/General Agriculture 2 1 - - - 1
Marine Science/Liberal Arts/Health Science - - - - - 1 - - -
Marine Science/Natural Resources - - - - - 1 - - -
Marine Science/Marine Science Option Program - 1 -
Marine Sciences 17 20 18 14 15 12 18 11 14 17 7
Music 17 22 19 19 20 9 13 20 22 19 14
Music/Pre-Law - - 1
Music/Samoan Studies - - - 1 - 1 - - -
Natural Resources 11 10 7 9 7 9 4 1 8 8 3
Natural Resources/Art 1 - - - - - 1 - - -
Nursing 17 13 9 9 16 12 7 13 46 55 58
Nursing/Certified Practical Nursing 5 - - - - - 1 - - 2
Nursing/Health Science 1 - - - 1 - 2 1 - -
OAT/Certificate in Practical Nursing - - - 1 1 - - - -
Office Administration & Technology (OAT) 2 4 3 3 5 9 10 12 13 6 6
PICTA (Pacific Information & Communications Technology Academy) - - - - - 21 - - -
Political Science 3 6 10 5 4 9 15 16 6 - -
Political Science/Samoan Studies 1
Political Science /Education - - - 1 1 - - - -
Political Science/Human Services - - - 1
Political Science/Pre-Law 1 1 - - - 3 - 1 - - -
Pre Law 26 60 43 32 28 32 34 29 41 41 40
Pre Law/Education - - - - 1 2 - - -
Pre-Law/Forensic Science 1 1 1 1 -
Public Administration - - - 3 2 - 4 9 7
Samoan Studies 7 4 14 23 7 9 3 4 2 4 -
Samoan Studies/Certificate in Samoa Studies 1 3 -
Self Enrichment (Non-Degree Seeking) 40 2 22 57 50 23 27 44 13 - 2
Teacher Education Program 3 - - - - - - - - -
Undecided - - - - - - - - -
Unknowns - - - - - - - - -
Upward Bound - - - - - - - - -
Welding 1 1 - 2 3 8 6 10 9 12 8
SOURCE: American Samoa Community College, Board of Higher Education, Admissions and Records Office.
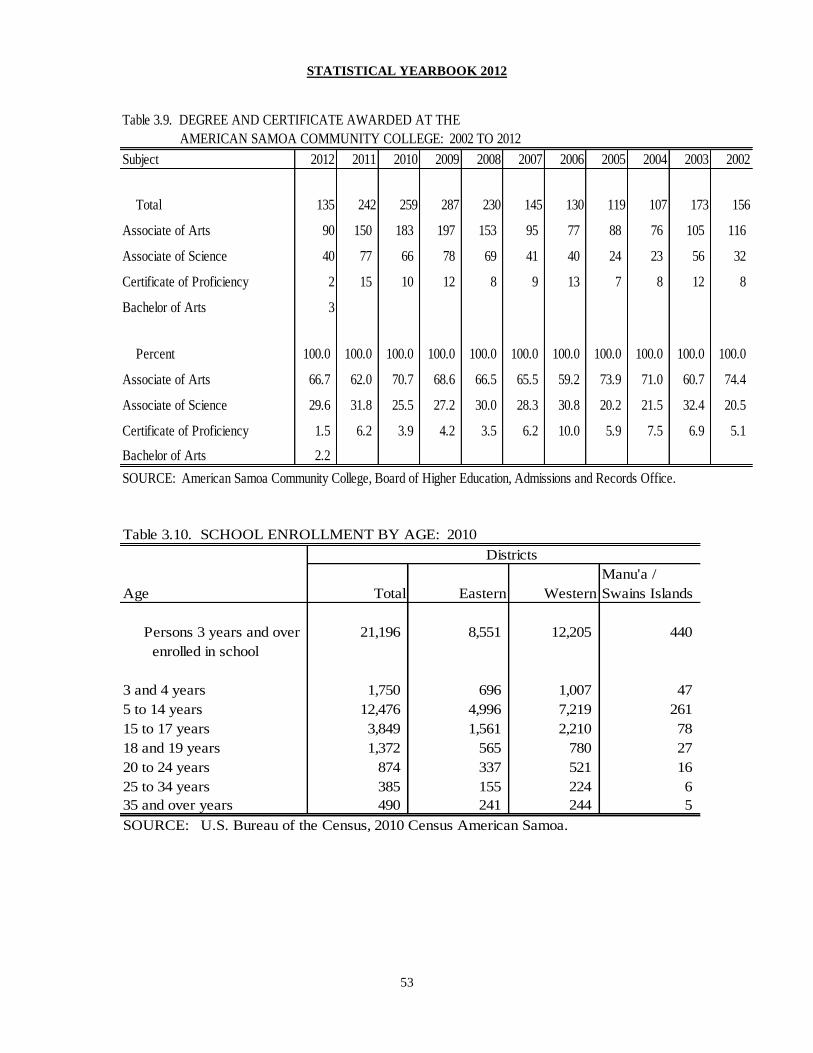
STATISTICAL YEARBOOK 2012
53
Table 3.9. DEGREE AND CERTIFICATE AWARDED AT THE
AMERICAN SAMOA COMMUNITY COLLEGE: 2002 TO 2012
Subject 2012 2011 2010 2009 2008 2007 2006 2005 2004 2003 2002
Total 135 242 259 287 230 145 130 119 107 173 156
Associate of Arts 90 150 183 197 153 95 77 88 76 105 116
Associate of Science 40 77 66 78 69 41 40 24 23 56 32
Certificate of Proficiency 2 15 10 12 8 9 13 7 8 12 8
Bachelor of Arts 3
Percent 100.0 100.0 100.0 100.0 100.0 100.0 100.0 100.0 100.0 100.0 100.0
Associate of Arts 66.7 62.0 70.7 68.6 66.5 65.5 59.2 73.9 71.0 60.7 74.4
Associate of Science 29.6 31.8 25.5 27.2 30.0 28.3 30.8 20.2 21.5 32.4 20.5
Certificate of Proficiency 1.5 6.2 3.9 4.2 3.5 6.2 10.0 5.9 7.5 6.9 5.1
Bachelor of Arts 2.2
SOURCE: American Samoa Community College, Board of Higher Education, Admissions and Records Office.
Table 3.10. SCHOOL ENROLLMENT BY AGE: 2010
Districts
Manu'a /
Age Total Eastern Western Swains Islands
Persons 3 years and over 21,196 8,551 12,205 440
enrolled in school
3 and 4 years 1,750 696 1,007 47
5 to 14 years 12,476 4,996 7,219 261
15 to 17 years 3,849 1,561 2,210 78
18 and 19 years 1,372 565 780 27
20 to 24 years 874 337 521 16
25 to 34 years 385 155 224 6
35 and over years 490 241 244 5
SOURCE: U.S. Bureau of the Census, 2010 Census American Samoa.

STATISTICAL YEARBOOK 2012
54
Table 3.11. EDUCATIONAL ATTAINMENT BY DISTRICT AND COUNTY, AMERICAN SAMOA: 2010
Population 25 years and over
9th to 12th High school Some college Graduate or
District Less than grade, no graduate, GED, or Associates Bachelor's professional HS
County Total 9th grade diploma or equivalent degree degree degree grad BS+
DISTRICTS
American Samoa 25,907 1,775 2,867 12,512 6,179 1,668 906 82.1 9.9
Eastern District 10,939 772 1,133 5,465 2,629 615 325 82.6 8.6
Manu'a District 540 37 56 290 121 25 11 82.8 6.7
Swains Island 8 - - 3 1 3 1 100.0 50.0
Western District 14,420 966 1,678 6,754 3,428 1,025 569 81.7 11.1
COUNTIES
Ituau 2,274 167 269 997 608 152 81 80.8 10.2
Ma'oputasi 4,932 332 519 2,455 1,218 267 141 82.7 8.3
Sa'ole 1,022 48 129 520 237 57 31 82.7 8.6
Sua 1,550 136 102 808 367 88 49 84.6 8.8
Vaifanua 1,161 89 114 685 199 51 23 82.5 6.4
Faleasao 85 3 5 47 23 3 4 90.6 8.2
Fitiuta 122 10 21 60 23 6 2 74.6 6.6
Ofu 93 10 8 56 14 2 3 80.6 5.4
Olosega 82 11 6 42 22 1 - 79.3 1.2
Ta'u 158 3 16 85 39 13 2 88.0 9.5
Swains Island 8 - - 3 1 3 1 100.0 50.0
Lealataua 2,387 160 280 1,129 555 181 82 81.6 11.0
Leasina 816 68 120 422 158 34 14 77.0 5.9
Tualatai 1,546 103 177 778 361 83 44 81.9 8.2
Tualauta 9,671 635 1,101 4,425 2,354 727 429 82.0 12.0
Source: US Census Bureau, 2010 Census American Samoa.
Percent

STATISTICAL YEARBOOK 2012
55
Table 3.12. SCHOOL ENROLLMENT, EDUCATIONAL ATTAINMENT, VOCATIONAL TRAINING, AND GENDER
BY DISTRICT, AMERICAN SAMOA: 2010
American Samoa Eastern District Western District Manu'a and Swains
School Enrollment and
Type of School Total
Population 3 years and over
and enrolled in school 21,196 8,551 12,205 440
Enrolled in public school 18,916 7,794 10,697 425
Pre-kindergarten/kindergarten 2,860 1,130 1,656 74
Elementary school, 1st to 8th 8,985 3,705 5,068 212
High school, 9th to 12th grade 4,977 2,112 2,758 107
College 2,094 847 1,215 32
Enrolled in private school or home schooled 2,280 757 1,508 15
Pre-kindergarten/kindergarten 434 153 280 1
Elementary school, 1st to 8th 1,166 379 785 2
High school, 9th to 12th grade 407 129 271 7
College 273 96 172 5
Not enrolled in school 30,341 12,857 16,849 635
Females 3 years and over
and enrolled in school 10,456 4,274 5,961 221
Pre-kindergarten/kindergarten 1,624 634 948 42
Elementary school, 1st to 8th 4,835 1,997 2,730 108
High school, 9th to 12th grade 2,623 1,086 1,485 52
College 1,374 557 798 19
Educational Attainment
Population 25 years and over 25,907 10,939 14,420 548
None 556 282 252 22
Elementary: 4 or less year 208 84 123 1
5 and 6 years 273 118 152 3
7 and 8 years 738 288 439 11
High school: 1 year 342 127 202 13
2 years 479 180 284 15
3 years 780 252 519 9
4 years,no diploma 1,266 574 673 19
High school graduate 12,512 5,465 6,754 293
Some college, no degree 3,952 1,701 2,188 63
Associate degree 2,227 928 1,240 59
Continued on next page.
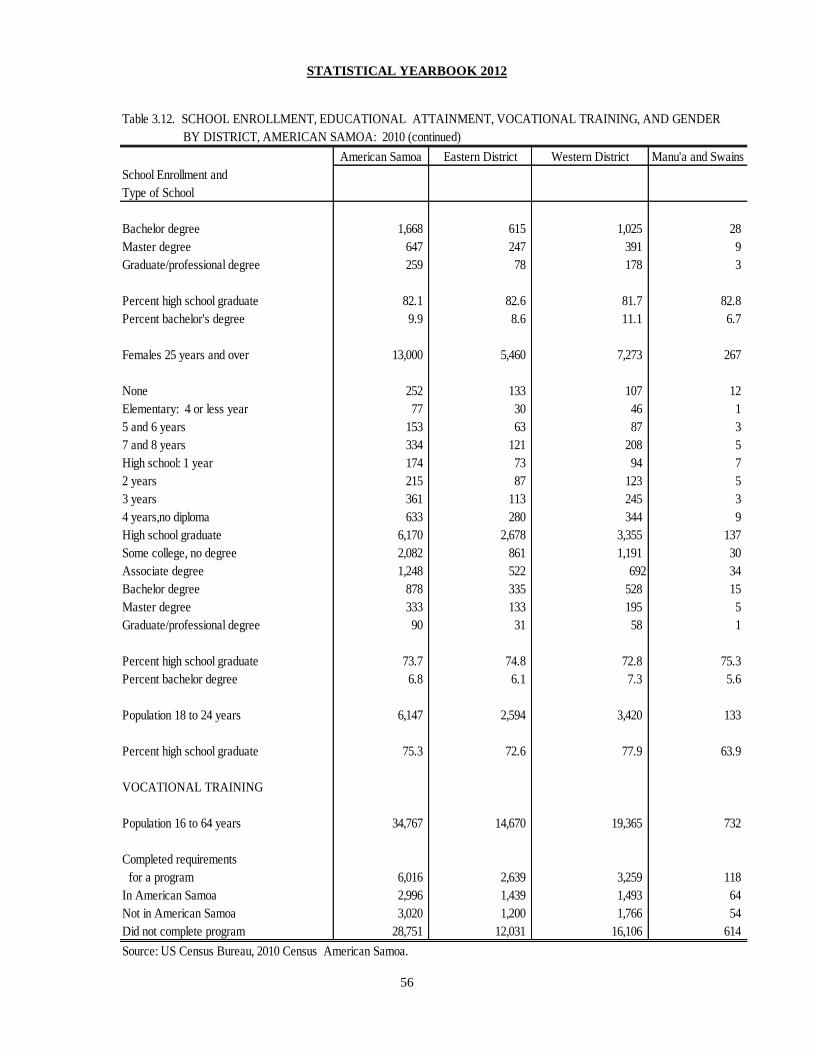
STATISTICAL YEARBOOK 2012
56
Table 3.12. SCHOOL ENROLLMENT, EDUCATIONAL ATTAINMENT, VOCATIONAL TRAINING, AND GENDER
BY DISTRICT, AMERICAN SAMOA: 2010 (continued)
American Samoa Eastern District Western District Manu'a and Swains
School Enrollment and
Type of School
Bachelor degree 1,668 615 1,025 28
Master degree 647 247 391 9
Graduate/professional degree 259 78 178 3
Percent high school graduate 82.1 82.6 81.7 82.8
Percent bachelor's degree 9.9 8.6 11.1 6.7
Females 25 years and over 13,000 5,460 7,273 267
None 252 133 107 12
Elementary: 4 or less year 77 30 46 1
5 and 6 years 153 63 87 3
7 and 8 years 334 121 208 5
High school: 1 year 174 73 94 7
2 years 215 87 123 5
3 years 361 113 245 3
4 years,no diploma 633 280 344 9
High school graduate 6,170 2,678 3,355 137
Some college, no degree 2,082 861 1,191 30
Associate degree 1,248 522 692 34
Bachelor degree 878 335 528 15
Master degree 333 133 195 5
Graduate/professional degree 90 31 58 1
Percent high school graduate 73.7 74.8 72.8 75.3
Percent bachelor degree 6.8 6.1 7.3 5.6
Population 18 to 24 years 6,147 2,594 3,420 133
Percent high school graduate 75.3 72.6 77.9 63.9
VOCATIONAL TRAINING
Population 16 to 64 years 34,767 14,670 19,365 732
Completed requirements
for a program 6,016 2,639 3,259 118
In American Samoa 2,996 1,439 1,493 64
Not in American Samoa 3,020 1,200 1,766 54
Did not complete program 28,751 12,031 16,106 614
Source: US Census Bureau, 2010 Census American Samoa.
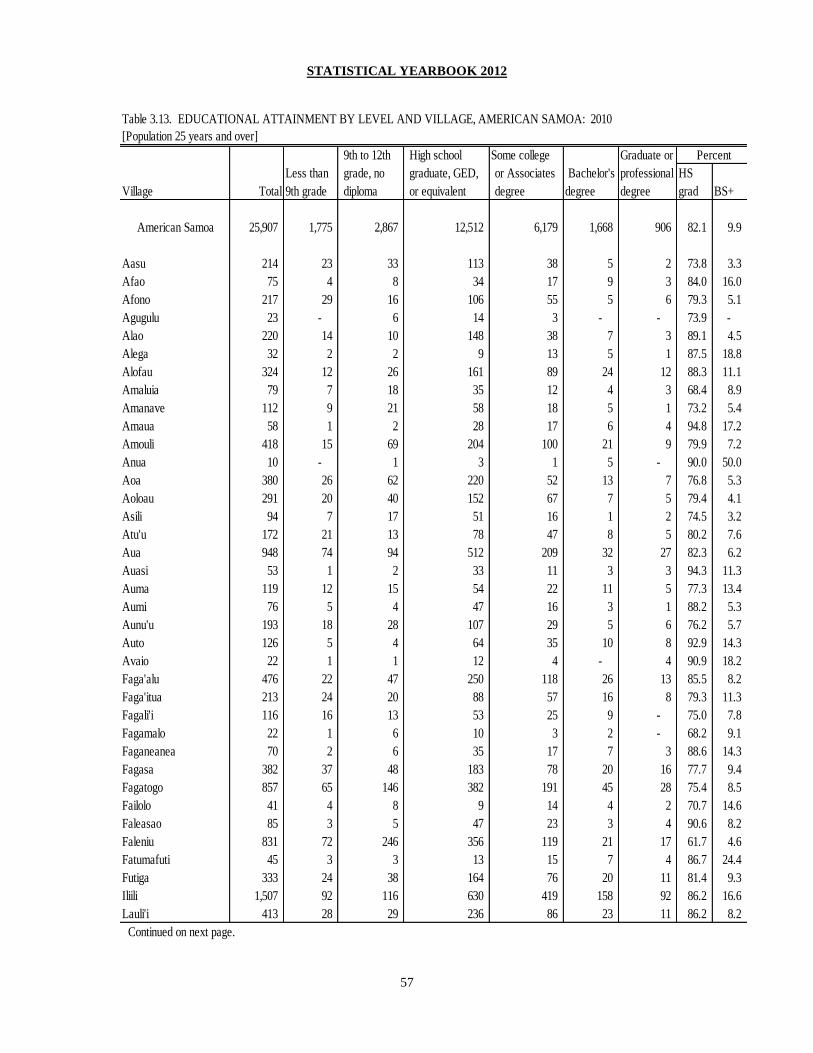
STATISTICAL YEARBOOK 2012
57
Table 3.13. EDUCATIONAL ATTAINMENT BY LEVEL AND VILLAGE, AMERICAN SAMOA: 2010
[Population 25 years and over]
9th to 12th High school Some college Graduate or
Less than grade, no graduate, GED, or Associates Bachelor's professional HS
Village Total 9th grade diploma or equivalent degree degree degree grad BS+
American Samoa 25,907 1,775 2,867 12,512 6,179 1,668 906 82.1 9.9
Aasu 214 23 33 113 38 5 2 73.8 3.3
Afao 75 4 8 34 17 9 3 84.0 16.0
Afono 217 29 16 106 55 5 6 79.3 5.1
Agugulu 23 - 6 14 3 - - 73.9 -
Alao 220 14 10 148 38 7 3 89.1 4.5
Alega 32 2 2 9 13 5 1 87.5 18.8
Alofau 324 12 26 161 89 24 12 88.3 11.1
Amaluia 79 7 18 35 12 4 3 68.4 8.9
Amanave 112 9 21 58 18 5 1 73.2 5.4
Amaua 58 1 2 28 17 6 4 94.8 17.2
Amouli 418 15 69 204 100 21 9 79.9 7.2
Anua 10 - 1 3 1 5 - 90.0 50.0
Aoa 380 26 62 220 52 13 7 76.8 5.3
Aoloau 291 20 40 152 67 7 5 79.4 4.1
Asili 94 7 17 51 16 1 2 74.5 3.2
Atu'u 172 21 13 78 47 8 5 80.2 7.6
Aua 948 74 94 512 209 32 27 82.3 6.2
Auasi 53 1 2 33 11 3 3 94.3 11.3
Auma 119 12 15 54 22 11 5 77.3 13.4
Aumi 76 5 4 47 16 3 1 88.2 5.3
Aunu'u 193 18 28 107 29 5 6 76.2 5.7
Auto 126 5 4 64 35 10 8 92.9 14.3
Avaio 22 1 1 12 4 - 4 90.9 18.2
Faga'alu 476 22 47 250 118 26 13 85.5 8.2
Faga'itua 213 24 20 88 57 16 8 79.3 11.3
Fagali'i 116 16 13 53 25 9 - 75.0 7.8
Fagamalo 22 1 6 10 3 2 - 68.2 9.1
Faganeanea 70 2 6 35 17 7 3 88.6 14.3
Fagasa 382 37 48 183 78 20 16 77.7 9.4
Fagatogo 857 65 146 382 191 45 28 75.4 8.5
Failolo 41 4 8 9 14 4 2 70.7 14.6
Faleasao 85 3 5 47 23 3 4 90.6 8.2
Faleniu 831 72 246 356 119 21 17 61.7 4.6
Fatumafuti 45 3 3 13 15 7 4 86.7 24.4
Futiga 333 24 38 164 76 20 11 81.4 9.3
Iliili 1,507 92 116 630 419 158 92 86.2 16.6
Lauli'i 413 28 29 236 86 23 11 86.2 8.2
Continued on next page.
Percent

STATISTICAL YEARBOOK 2012
58
Table 3.13. EDUCATIONAL ATTAINMENT BY LEVEL AND VILLAGE, AMERICAN SAMOA: 2010 (Continued)
[Population 25 years and over]
9th to 12th High school Some college Graduate or Percent
Less than grade, no graduate, GED, or Associates Bachelor's professional HS
Village Total 9th grade diploma or equivalent degree degree degree grad BS+
Leloaloa 219 14 28 93 65 15 4 80.8 8.7
Leone 923 60 89 412 235 83 44 83.9 13.8
Leusoali'i 55 5 10 26 11 1 2 72.7 5.5
Luma 85 2 6 50 22 4 1 90.6 5.9
Maia 67 5 11 34 12 5 - 76.1 7.5
Malaeimi 528 38 88 226 118 43 15 76.1 11.0
Malaeloa/Aitulagi 311 25 47 157 53 22 7 76.8 9.3
Malaeloa/Ituau 243 8 37 132 46 15 5 81.5 8.2
Maloata 5 - - 1 2 1 1 100.0 40.0
Mapusagafou 482 43 56 250 96 26 11 79.5 7.7
Masausi 77 10 4 37 19 7 - 81.8 9.1
Masefau 203 16 14 114 44 10 5 85.2 7.4
Matu'u 191 7 22 93 46 16 7 84.8 12.0
Mesepa 198 12 19 122 32 9 4 84.3 6.6
Nua 68 6 10 20 27 4 1 76.5 7.4
Nu'uuli 1,920 144 249 809 532 127 59 79.5 9.7
Ofu 93 10 8 56 14 2 3 80.6 5.4
Olosega 79 11 6 39 22 1 - 78.5 1.3
Onenoa 74 8 6 42 10 7 1 81.1 10.8
Pagai 50 6 4 29 5 5 1 80.0 12.0
Pago Pago 1,698 97 140 905 423 92 41 86.0 7.8
Pava'ia'i 1,090 82 115 568 236 62 27 81.9 8.2
Poloa 94 5 10 44 29 5 1 84.0 6.4
Puapua 466 26 49 250 95 32 14 83.9 9.9
Sa'ilele 38 4 4 15 15 - - 78.9 0.0
Satala 153 20 18 70 36 6 3 75.2 5.9
Se'etaga 130 2 10 75 33 9 1 90.8 7.7
Sili 3 - - 3 - - - 100.0 0.0
Si'ufaga 73 1 10 35 17 9 1 84.9 13.7
Swains 8 - - 3 1 3 1 100.0 50.0
Tafuna 3,845 199 312 1,735 1,031 342 226 86.7 14.8
Taputimu 360 24 31 188 88 16 13 84.7 8.1
Tula 195 15 5 120 39 8 8 89.7 8.2
Utulei 354 16 29 149 113 31 16 87.3 13.3
Utumea East 22 1 2 10 7 1 1 86.4 9.1
Utumea West 20 1 - 9 4 2 4 95.0 30.0
Utusia 37 6 - 28 2 1 - 83.8 2.7
Vailoatai 610 47 71 294 151 32 15 80.7 7.7
Vaitogi 901 74 93 415 238 48 33 81.5 9.0
Vatia 292 26 31 155 60 16 4 80.5 6.8
Source: US Census Bureau, 2010 Census American Samoa.
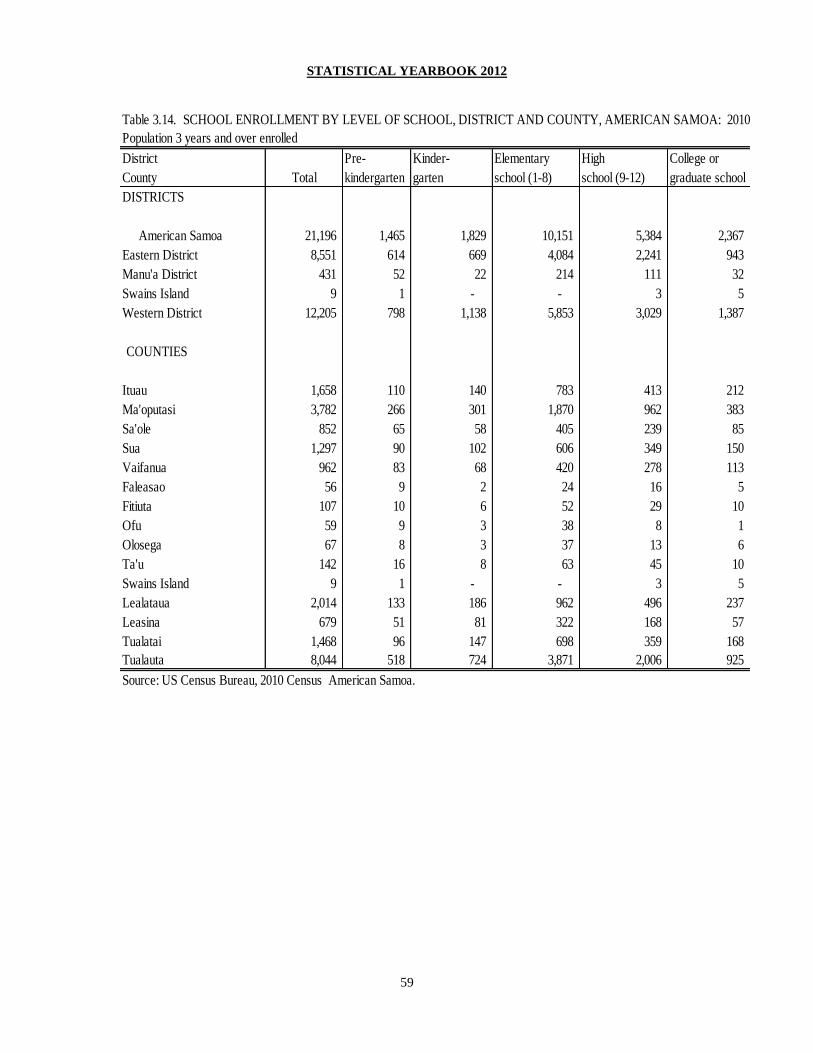
STATISTICAL YEARBOOK 2012
59
Table 3.14. SCHOOL ENROLLMENT BY LEVEL OF SCHOOL, DISTRICT AND COUNTY, AMERICAN SAMOA: 2010
Population 3 years and over enrolled
District Pre- Kinder- Elementary High College or
County Total kindergarten garten school (1-8) school (9-12) graduate school
DISTRICTS
American Samoa 21,196 1,465 1,829 10,151 5,384 2,367
Eastern District 8,551 614 669 4,084 2,241 943
Manu'a District 431 52 22 214 111 32
Swains Island 9 1 - - 3 5
Western District 12,205 798 1,138 5,853 3,029 1,387
COUNTIES
Ituau 1,658 110 140 783 413 212
Ma'oputasi 3,782 266 301 1,870 962 383
Sa'ole 852 65 58 405 239 85
Sua 1,297 90 102 606 349 150
Vaifanua 962 83 68 420 278 113
Faleasao 56 9 2 24 16 5
Fitiuta 107 10 6 52 29 10
Ofu 59 9 3 38 8 1
Olosega 67 8 3 37 13 6
Ta'u 142 16 8 63 45 10
Swains Island 9 1 - - 3 5
Lealataua 2,014 133 186 962 496 237
Leasina 679 51 81 322 168 57
Tualatai 1,468 96 147 698 359 168
Tualauta 8,044 518 724 3,871 2,006 925
Source: US Census Bureau, 2010 Census American Samoa.

STATISTICAL YEARBOOK 2012
60
Table 3.15. SCHOOL ENROLLMENT BY LEVEL OF SCHOOL AND VILLAGE, AMERICAN SAMOA: 2010
[Population 3 years and over enrolled]
Pre Kinder- Elementary High College or
Village Total kindergarten garten school (1-8) school (9-12) graduate school
American Samoa 21,196 1,465 1,829 10,151 5,384 2,367
Aasu 193 16 25 89 53 10
Afao 86 3 7 42 21 13
Afono 242 14 12 110 74 32
Agugulu 16 - 1 11 3 1
Alao 190 15 13 85 58 19
Alega 16 - 3 3 7 3
Alofau 221 17 21 93 67 23
Amaluia 59 1 7 28 15 8
Amanave 110 7 7 50 29 17
Amaua 25 3 1 8 8 5
Amouli 386 31 21 192 106 36
Anua 8 1 1 5 1 -
Aoa 359 31 36 162 102 28
Aoloau 207 16 20 100 52 19
Asili 103 12 14 49 17 11
Atu'u 153 4 12 69 53 15
Aua 812 61 57 402 189 103
Auasi 49 3 2 23 15 6
Auma 102 7 5 53 35 2
Aumi 74 5 10 37 17 5
Aunu'u 158 13 10 82 41 12
Auto 97 3 11 45 22 16
Avaio 16 - - 8 4 4
Faga'alu 311 18 28 158 79 28
Faga'itua 166 15 10 90 35 16
Fagali'i 91 8 7 44 19 13
Fagamalo 20 1 1 9 5 4
Faganeanea 63 1 3 34 14 11
Fagasa 320 20 28 147 85 40
Fagatogo 608 62 53 285 144 64
Failolo 53 - 3 27 15 8
Faleasao 56 9 2 24 16 5
Faleniu 701 55 77 355 167 47
Fatumafuti 48 4 3 25 10 6
Futiga 277 14 24 134 69 36
Iliili 1,220 55 108 575 315 167
Lauli'i 350 37 24 168 80 41
Continued on next page.

STATISTICAL YEARBOOK 2012
61
Table 3.15. SCHOOL ENROLLMENT BY LEVEL OF SCHOOL AND VILLAGE, AMERICAN SAMOA: 2010
[Population 3 years and over enrolled] (Continued)
Pre Kinder- Elementary High College or
Village Total kindergarten garten school (1-8) school (9-12) graduate school
Leloaloa 160 6 10 81 50 13
Leone 736 50 65 355 175 91
Leusoali'i 49 4 1 24 14 6
Luma 66 5 5 28 25 3
Maia 58 6 5 28 15 4
Malaeimi 452 19 43 226 117 47
Malaeloa/Aitulagi 279 19 36 133 63 28
Malaeloa/Ituau 209 17 28 97 45 22
Maloata 3 - - 1 - 2
Mapusagafou 459 44 41 228 108 38
Masausi 58 2 7 25 15 9
Masefau 160 10 11 72 54 13
Matu'u 154 12 16 63 39 24
Mesepa 159 12 13 77 37 20
Nua 56 4 6 22 16 8
Nu'uuli 1,362 94 109 672 332 155
Ofu 59 9 3 38 8 1
Olosega 67 8 3 37 13 6
Onenoa 37 3 2 18 10 4
Pagai 57 - 6 23 22 6
Pago Pago 1,328 84 111 679 343 111
Pava'ia'i 964 76 76 465 252 95
Poloa 74 8 6 28 15 17
Puapua 349 25 49 156 94 25
Sa'ilele 21 - 4 12 3 2
Satala 114 7 11 52 31 13
Se'etaga 129 6 7 72 29 15
Sili - - - - - -
Si'ufaga 76 11 3 35 20 7
Swains 9 1 - - 3 5
Tafuna 3,062 192 278 1,425 757 410
Taputimu 354 24 46 158 93 33
Tula 128 15 3 56 31 23
Utulei 240 19 15 114 62 30
Utumea East 27 1 3 11 7 5
Utumea West 27 1 1 15 8 2
Utusia 26 1 4 9 11 1
Vailoatai 628 41 49 309 152 77
Vaitogi 786 48 72 387 196 83
Vatia 248 19 14 99 77 39
Source: US Census Bureau, 2010 Census American Samoa.

STATISTICAL YEARBOOK 2012
62
Table 3.16. NUMBER OF DROPOUTS: 2002 TO 2008
Grades
School year K-8 9-12
2008 .. 45
2007 .. 35
2006 20 53
2005 35 ..
2004 30 56
2003 88 81
2002 75 42
Note: Number of dropouts from 2009 to 2012 are not available.
SOURCE: Department of Education, Office of Student Services,
Data and Research.
STATISTICAL YEARBOOK 2012
63
Section Four
LAW ENFORCEMENT
This section contains statistical data on crime, traffic, accidents, firearm registration,
correctional facility population, fire, and court activities.
The Department of Public Safety reported 1,863 offenses in FY2012, a 19.2% increase
from 2011. Both Part One and Part Two offenses increased in FY2012. For Part One
offenses, burglary remained the number one offense followed by larceny. All Part One
offenses with the exception of criminal homicide increased in FY2012. For Part Two
offenses, disorderly conduct is still the number one offense for Part Two offenses. Since
FY2009, DUI offenses have decreased 37.4% with 149 in FY2012.
For offenses committed by juveniles, the number of offenses increased by 25.6 percent in
FY2012 for Part One offenses. For Part Two offenses, the number increased by 35.8
percent in the same year. The two leading offenses for Part One and Part Two offenses
respectively were burglary and disorderly conduct.
In FY2012, traffic accidents increased by 4.0 percent. There were 705 traffic accidents
reported in FY2012. About 114 people were injured in these accidents and two fatalities
were reported. There were 135 firearms registered in FY2012 compared to 146 in
FY2011. The Tafuna Correctional Facility reported that there were 172 inmates in
FY2012 compared to 176 in 2011. The average inmate population in FY2012 was also
172 compared to 176 in FY2011. In FY2012, the majority of inmates incarcerated are
from US National with 49.4% and Samoa make up 38.4% of inmates while the remaining
12.2 percent are other nationalities.
In 2012, there were 112 fires reported. There were 92 residential home fires, 8
commercial building fires, and 12 industrial fires.
The High Court reported there were 352 cases filed in FY2012. There were 2,609
pending cases from FY2012. Only 568 cases were completed and disposed in FY2012.
Because there were only 568 cases completed and disposed in FY2012, the pending cases
for FY2012 that will carry on to FY2013 will be 2,609.

STATISTICAL YEARBOOK 2012
64
Table 4.1. PART 1 AND PART 2 OFFENSES BY TYPE OF OFFENSE: FY2002 TO FY2012
Offenses 2012 2011 2010 2009 2008 2007 2006 2005 2004 2003 2002
Total 1,863 1,563 1,654 2,267 1,953 1,762 1,724 1,768 1,671 2,454 2,411
Part one 322 251 279 448 423 387 321 336 371 415 466
Arson 3 2 3 4 4 4 3 4 4 - 5
Assault (1st & 2nd) 49 44 56 87 73 68 61 92 83 90 99
Burglary 155 123 128 250 207 197 149 163 196 206 240
Criminal homicide 2 5 5 2 3 1 4 6 4 3 7
Forcible rape 13 8 10 20 32 22 24 12 10 19 22
Larceny 99 65 71 79 88 86 73 55 66 88 85
Motor vehicle theft - 2 4 4 9 4 1 2 5 8 5
Robbery 1 2 2 2 7 5 6 2 3 1 3
Part two 1,541 1,312 1,375 1,819 1,530 1,375 1,403 1,432 1,300 2,039 1,945
Disorderly conduct 456 325 310 439 390 316 250 367 . 758 766
D.U.I. 149 206 219 238 165 242 359 201 272 219 172
Embezzlement 3 9 1 5 6 3 6 1 - - 4
Family and children 9 11 20 49 40 30 18 32 4 3 9
Forgery/wCounterfeit 2 3 4 5 1 5 3 2 2 5 4
Gambling - - - - - 1 - - - - -
Narcotics 18 22 28 24 12 21 27 51 24 23 17
Property damage/vandalism 160 137 138 191 186 135 107 87 91 114 139
Runaways 23 12 17 28 17 15 24 21 24 23 15
Sex offenses 24 10 17 17 11 14 26 26 18 24 12
Truancy 1 1 2 3 2 3 1 1 1 - -
Weapons 6 6 7 7 6 7 4 10 10 6 11
All other offenses 690 570 612 813 694 583 578 633 854 864 796
SOURCE: Department of Public Safety, Records Office

STATISTICAL YEARBOOK 2012
65
Table 4.2. PART 1 AND PART 2 JUVENILE OFFENSES BY TYPE
OF OFFENSE: FY2002 TO FY2012
Offenses 2012 2011 2010 2009 2008 2007 2006 2005 2004 2003 2002
Total 206 164 162 242 289 130 115 115 122 143 165
Part One 57 55 54 62 106 41 29 39 38 53 63
Arson - - - 1 1 - - - - - 1
Assault 28 22 14 9 21 13 9 20 7 10 26
Auto theft - - 2 - 1 - - - 1 - 1
Burglary 21 24 27 38 43 16 14 13 19 32 16
Larceny 8 8 9 11 29 9 4 4 8 11 14
Murder - - - 1 - - - - 1 - 1
Rape - - 1 2 9 3 2 2 - - 2
Robbery - 1 1 - 2 - - - 2 - 2
Part Two 148 109 108 180 183 89 86 76 84 90 102
Disorderly conduct 61 45 27 23 36 23 14 14 25 22 24
Drugs 2 - 1 - 6 2 6 6 3 5 4
Offense A/Family - - - - - - - - - 1 2
Property damage 9 6 11 19 31 14 5 5 6 10 13
Runaways 23 12 17 32 28 15 24 25 24 21 15
Sexual Offense 2 - 5 5 3 2 1 1 - 2 -
Truancy 1 2 5 4 3 - - 1 - -
Weapons - 2 - 1 1 - 1 1 - - 1
Others 51 43 45 95 74 30 35 24 25 29 43
SOURCE: Department of Public Safety, Records Office
Table 4.3. TRAFFIC ACCIDENTS: FY2002 TO FY 2012
Total Persons
Year Accidents Injured Fatalities
2012 705 114 2
2011 678 70 1
2010 711 79 5
2009 803 134 3
2008 619 208 1
2007 729 142 1
2006 683 157 2
2005 780 111 4
2004 936 259 2
2003 916 250 3
2002 1,051 336 7
SOURCE: Department of Public Safety, Records Office.
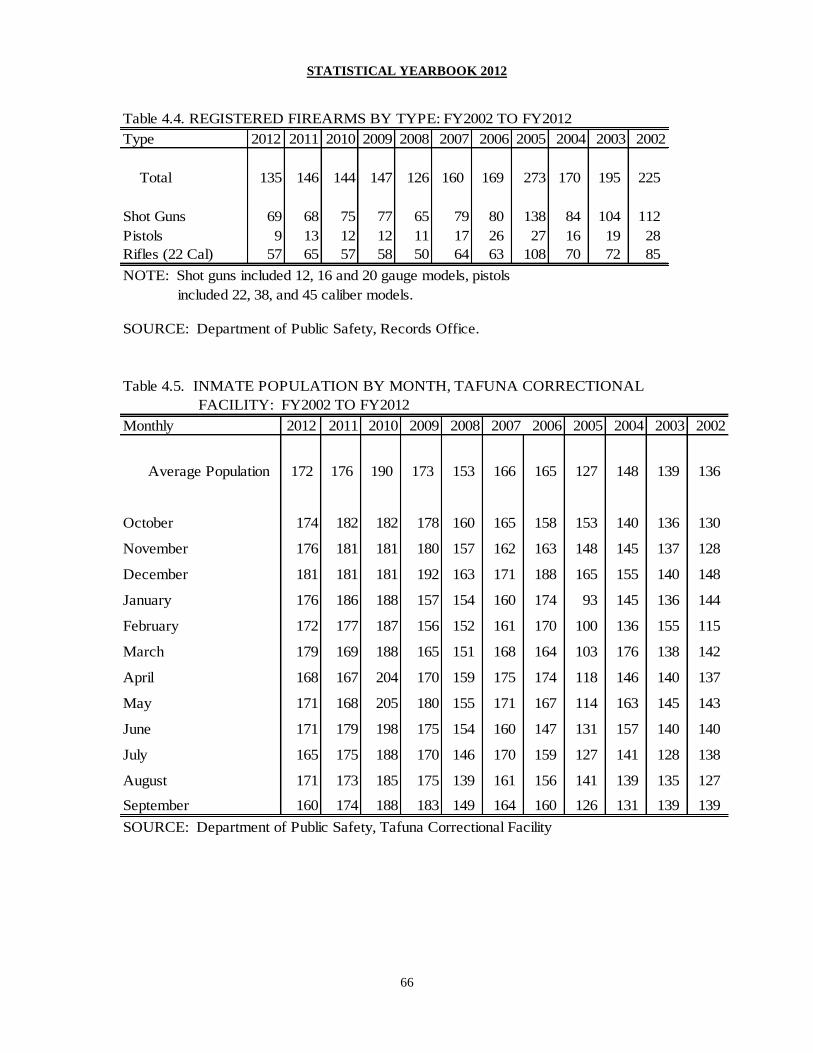
STATISTICAL YEARBOOK 2012
66
Table 4.4. REGISTERED FIREARMS BY TYPE: FY2002 TO FY2012
Type 2012 2011 2010 2009 2008 2007 2006 2005 2004 2003 2002
Total 135 146 144 147 126 160 169 273 170 195 225
Shot Guns 69 68 75 77 65 79 80 138 84 104 112
Pistols 9 13 12 12 11 17 26 27 16 19 28
Rifles (22 Cal) 57 65 57 58 50 64 63 108 70 72 85
NOTE: Shot guns included 12, 16 and 20 gauge models, pistols
included 22, 38, and 45 caliber models.
SOURCE: Department of Public Safety, Records Office.
Table 4.5. INMATE POPULATION BY MONTH, TAFUNA CORRECTIONAL
FACILITY: FY2002 TO FY2012
Monthly 2012 2011 2010 2009 2008 2007 2006 2005 2004 2003 2002
Average Population 172 176 190 173 153 166 165 127 148 139 136
October 174 182 182 178 160 165 158 153 140 136 130
November 176 181 181 180 157 162 163 148 145 137 128
December 181 181 181 192 163 171 188 165 155 140 148
January 176 186 188 157 154 160 174 93 145 136 144
February 172 177 187 156 152 161 170 100 136 155 115
March 179 169 188 165 151 168 164 103 176 138 142
April 168 167 204 170 159 175 174 118 146 140 137
May 171 168 205 180 155 171 167 114 163 145 143
June 171 179 198 175 154 160 147 131 157 140 140
July 165 175 188 170 146 170 159 127 141 128 138
August 171 173 185 175 139 161 156 141 139 135 127
September 160 174 188 183 149 164 160 126 131 139 139
SOURCE: Department of Public Safety, Tafuna Correctional Facility

STATISTICAL YEARBOOK 2012
67
Table 4.6. INMATE POPULATION BY NATIONALITY: FY2002 TO FY2012
2008 2007
Popu- Percent Popu- Percent Popu- Percent Popu- Percent Popu- Percent Popu- Percent
Nationality lation lation lation lation lation lation
Total 172 100 176 100 218 100.0 218 100.0 120 100.0 202 100.0
U.S. National 85 49.4 79 44.9 93 42.7 100 45.9 49 40.8 84 41.6
Western Samoan 66 38.4 74 42 105 48.2 101 46.3 58 48.3 100 49.5
Tongan 8 7.6 7 4 2 0.9 2 0.9 1 0.8 3 1.5
Others 13 7.6 16 9.1 18 8.3 15 6.9 12 10.0 15 7.4
Continued below.
2012 2011 2010
Table 4.6. INMATE POPULATION BY NATIONALITY: FY2002 TO FY2012 (continued)
2006 2005 2004 2003 2002
Popu- Percent Popu- Percent Popu- Percent Popu- Percent Popu- Percent
Nationality lation lation lation lation lation
Total 182 100.0 165 100.0 147 100.0 139 100.0 135 100.0
U.S. National 53 29.1 35 21.2 50 34.0 49 35.3 45 33.3
Western Samoan 119 65.4 114 69.1 59 40.1 63 45.3 57 42.2
Tongan 2 1.1 1 0.6 15 10.2 11 7.9 16 11.9
Others 8 4.4 15 9.1 23 15.6 16 11.5 17 12.6
SOURCE: Department of Public Safety, Records Office
Table 4.7. FIRES BY TYPE: FY2002 TO FY2012
Type 2012 2011 2010 2009 2008 2007 2006 2005 2004 2003 2002
Total 112 81 79 104 109 98 105 84 65 55 33
Residential 92 67 66 82 80 70 90 60 42 35 22
Major 14 20 22 31 50 60 65 40 30 25 12
Minor 78 47 44 51 30 10 25 20 12 10 10
Commercial 8 8 7 10 9 10 11 10 10 11 8
Major 2 2 2 8 3 5 5 8 7 6 2
Minor 6 6 5 2 6 5 6 2 3 5 6
Industrial 12 6 6 12 20 18 4 14 13 9 3
Major 2 1 2 6 3 8 3 10 10 4 1
Minor 10 5 4 6 17 10 1 4 3 5 2
SOURCE: Department of Public Safety, Fire Department.
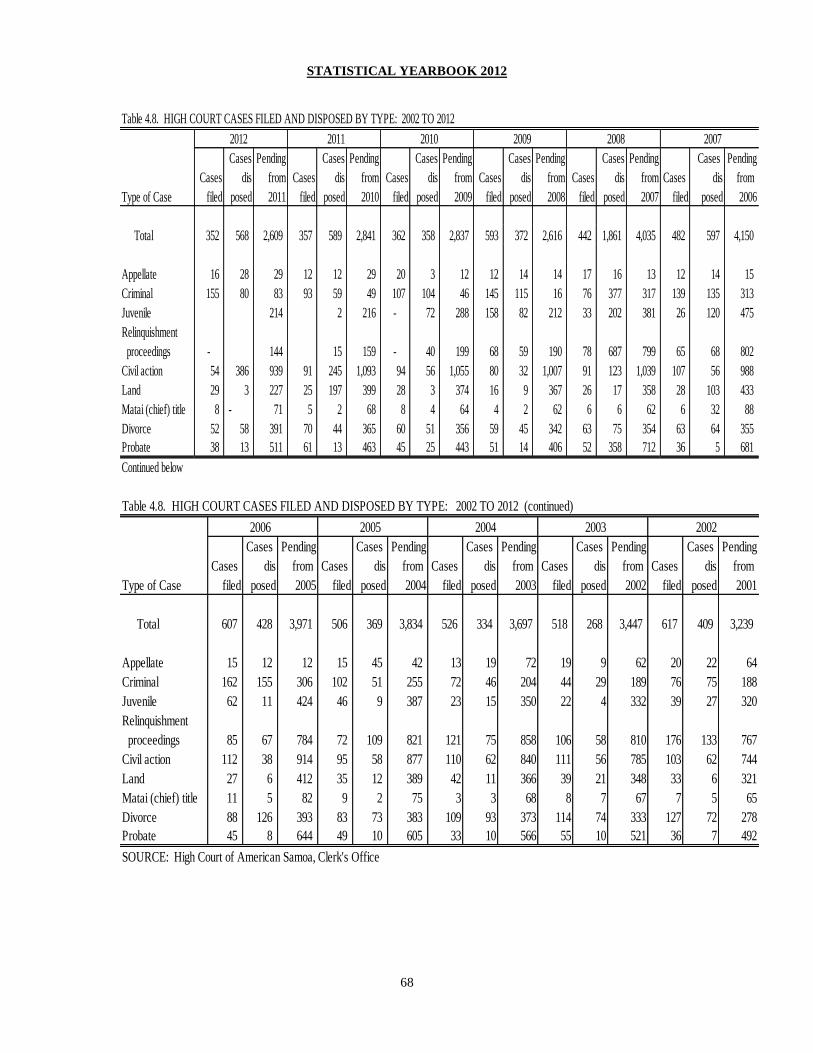
STATISTICAL YEARBOOK 2012
68
Table 4.8. HIGH COURT CASES FILED AND DISPOSED BY TYPE: 2002 TO 2012
2012 2011 2010 2009 2008 2007
Cases Pending Cases Pending Cases Pending Cases Pending Cases Pending Cases Pending
Cases dis from Cases dis from Cases dis from Cases dis from Cases dis from Cases dis from
Type of Case filed posed 2011 filed posed 2010 filed posed 2009 filed posed 2008 filed posed 2007 filed posed 2006
Total 352 568 2,609 357 589 2,841 362 358 2,837 593 372 2,616 442 1,861 4,035 482 597 4,150
Appellate 16 28 29 12 12 29 20 3 12 12 14 14 17 16 13 12 14 15
Criminal 155 80 83 93 59 49 107 104 46 145 115 16 76 377 317 139 135 313
Juvenile 214 2 216 - 72 288 158 82 212 33 202 381 26 120 475
Relinquishment
proceedings - 144 15 159 - 40 199 68 59 190 78 687 799 65 68 802
Civil action 54 386 939 91 245 1,093 94 56 1,055 80 32 1,007 91 123 1,039 107 56 988
Land 29 3 227 25 197 399 28 3 374 16 9 367 26 17 358 28 103 433
Matai (chief) title 8 - 71 5 2 68 8 4 64 4 2 62 6 6 62 6 32 88
Divorce 52 58 391 70 44 365 60 51 356 59 45 342 63 75 354 63 64 355
Probate 38 13 511 61 13 463 45 25 443 51 14 406 52 358 712 36 5 681
Continued below
Table 4.8. HIGH COURT CASES FILED AND DISPOSED BY TYPE: 2002 TO 2012 (continued)
2006 2005 2004 2003 2002
Cases Pending Cases Pending Cases Pending Cases Pending Cases Pending
Cases dis from Cases dis from Cases dis from Cases dis from Cases dis from
Type of Case filed posed 2005 filed posed 2004 filed posed 2003 filed posed 2002 filed posed 2001
Total 607 428 3,971 506 369 3,834 526 334 3,697 518 268 3,447 617 409 3,239
Appellate 15 12 12 15 45 42 13 19 72 19 9 62 20 22 64
Criminal 162 155 306 102 51 255 72 46 204 44 29 189 76 75 188
Juvenile 62 11 424 46 9 387 23 15 350 22 4 332 39 27 320
Relinquishment
proceedings 85 67 784 72 109 821 121 75 858 106 58 810 176 133 767
Civil action 112 38 914 95 58 877 110 62 840 111 56 785 103 62 744
Land 27 6 412 35 12 389 42 11 366 39 21 348 33 6 321
Matai (chief) title 11 5 82 9 2 75 3 3 68 8 7 67 7 5 65
Divorce 88 126 393 83 73 383 109 93 373 114 74 333 127 72 278
Probate 45 8 644 49 10 605 33 10 566 55 10 521 36 7 492
SOURCE: High Court of American Samoa, Clerk's Office

STATISTICAL YEARBOOK 2012
69
Table 4.9. HIGH COURT CASES FILED: 2002 TO 2012
Type of Case 2012 2011 2010 2009 2008 2007 2006 2005 2004 2003 2002
Total 352 357 362 593 442 482 607 506 526 518 617
Appellate 16 12 20 12 17 12 15 15 13 19 20
Criminal 155 93 107 145 76 139 162 102 72 44 76
Juvenile - - - 158 33 26 62 46 23 22 39
Relinquishment
proceedings - - - 68 78 65 85 72 121 106 176
Civil action 54 91 94 80 91 107 112 95 110 111 103
Land 29 25 28 16 26 28 27 35 42 39 33
Matai (chief) title 8 5 8 4 6 6 11 9 3 8 7
Divorce 52 70 60 59 63 63 88 83 109 114 127
Probate 38 61 45 51 52 36 45 49 33 55 36
SOURCE: High Court of American Samoa, Clerk's Office
Table 4.10. FAMILY, DRUG AND ALCOHOL CASES FILED AND DISPOSED BY TYPE: 2003 TO 2012
2012 2011 2010 2009 2008
Cases Pending Cases Pending Cases Pending Cases Pending Cases Pending
Cases dis from Cases dis from Cases dis from Cases dis from Cases dis from
Type of Case filed posed 2011 filed posed 2010 filed posed 2009 filed posed 2008 filed posed 2007
Total 455 354 147 408 386 125 357 291 59 13 8 54 10 11 53
Criminal - - - 36 21 34 41 27 20 7 6 19 1 2 20
Juvenile Delinquet 15 7 49 212 210 - - - - - - - - - -
Juvenile 292 247 2 69 51 - 316 263 2 1 - 1 3 2 -
Juvenile Guardianship 68 50 18 42 22 - - - - - - - - - -
Juvenile Relinquishments 26 6 20 46 72 - - - - - - - - - -
Divorce 53 44 54 - - - - - 28 3 1 26 6 4 24
Civil action 1 - - - 4 8 - 1 9 2 1 8 - 1 9
Protection Orders - - 4 1 4 - - - - - - - - - -
Adult Guardianship - - - 2 2 - - - - - - - - - -
Uniform Reciprocal Enforcement
& Support Act (URESA) - - - - - - - - - - - - 2 -
Continued on next page.
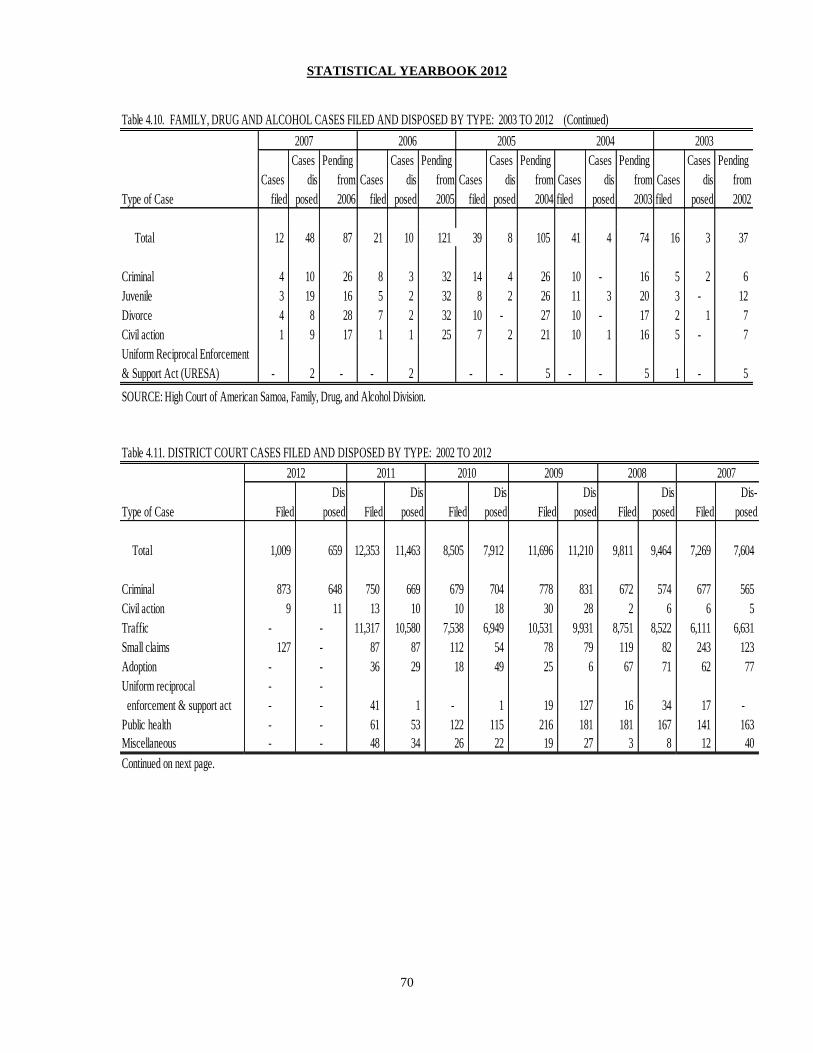
STATISTICAL YEARBOOK 2012
70
Table 4.10. FAMILY, DRUG AND ALCOHOL CASES FILED AND DISPOSED BY TYPE: 2003 TO 2012 (Continued)
2007 2006 2005 2004 2003
Cases Pending Cases Pending Cases Pending Cases Pending Cases Pending
Cases dis from Cases dis from Cases dis from Cases dis from Cases dis from
Type of Case filed posed 2006 filed posed 2005 filed posed 2004 filed posed 2003 filed posed 2002
Total 12 48 87 21 10 121 39 8 105 41 4 74 16 3 37
Criminal 4 10 26 8 3 32 14 4 26 10 - 16 5 2 6
Juvenile 3 19 16 5 2 32 8 2 26 11 3 20 3 - 12
Divorce 4 8 28 7 2 32 10 - 27 10 - 17 2 1 7
Civil action 1 9 17 1 1 25 7 2 21 10 1 16 5 - 7
Uniform Reciprocal Enforcement
& Support Act (URESA) - 2 - - 2 - - 5 - - 5 1 - 5
SOURCE: High Court of American Samoa, Family, Drug, and Alcohol Division.
Table 4.11. DISTRICT COURT CASES FILED AND DISPOSED BY TYPE: 2002 TO 2012
Dis Dis Dis Dis Dis Dis-
Type of Case Filed posed Filed posed Filed posed Filed posed Filed posed Filed posed
Total 1,009 659 12,353 11,463 8,505 7,912 11,696 11,210 9,811 9,464 7,269 7,604
Criminal 873 648 750 669 679 704 778 831 672 574 677 565
Civil action 9 11 13 10 10 18 30 28 2 6 6 5
Traffic - - 11,317 10,580 7,538 6,949 10,531 9,931 8,751 8,522 6,111 6,631
Small claims 127 - 87 87 112 54 78 79 119 82 243 123
Adoption - - 36 29 18 49 25 6 67 71 62 77
Uniform reciprocal - -
enforcement & support act - - 41 1 - 1 19 127 16 34 17 -
Public health - - 61 53 122 115 216 181 181 167 141 163
Miscellaneous - - 48 34 26 22 19 27 3 8 12 40
Continued on next page.
2012 2008200920102011 2007

STATISTICAL YEARBOOK 2012
71
Table 4.11. DISTRICT COURT CASES FILED AND DISPOSED BY TYPE: 2002 TO 2012 (continued)
2004 2003 2002
Dis- Dis- Dis- Dis- Dis-
Type of Case Filed posed Filed posed Filed posed Filed posed Filed posed
Total 7,689 7,324 5,899 4,459 5,880 5,340 7,030 6,610 10,342 9,696
Criminal 668 655 473 450 78 72 43 44 94 90
Civil action 8 6 5 2 2 - 15 7 8 5
Traffic 6,571 6,303 4,734 3,387 5,284 4,857 5,717 5,436 9,251 8,766
Small claims 292 252 408 400 400 310 468 355 675 550
Adoption 66 47 57 53 88 80 76 68 105 100
Uniform reciprocal
enforcement & support act 6 1 9 6 11 5 3 2 18 8
Public health 78 60 213 161 17 16 708 698 191 177
Miscellaneous - - - - - - - - - -
Note: Figures reported for 2012 are low but will be updated in the next publication.
SOURCE: High Court of American Samoa, Clerk's Office.
2006 2005
STATISTICAL YEARBOOK 2012
72
Section Five
CLIMATE
This section presents climate data for American Samoa.
American Samoa has a tropical maritime climate with abundant rain and warm, humid
days and nights. The average temperature in 2012 was recorded at 81.4 degrees
Fahrenheit. Throughout the past ten years, average temperature remained between 75.1
and 83.6 degrees. A total of 124.01 inches of rainfall was recorded in 2012. The month
of November recorded the most rain with 18.35 inches and August recorded the lowest
rainfall with 3.19 inches.
The two main seasons in Samoa are those of wet and dry, sometimes referred to as
‘summer’ and ‘winter’. However, these are actually relative terms as it still rains quite a
bit during the dry season. In addition, the south coast receives, on an annual basis,
approximately twice as much rain as the north coast.
Summer or wet season is also cyclone season and runs from November through April.
Winds tend to be either calm or mainly out of the north. Although heavy rain, showers
and long rainy periods can occur any month of the year, torrential downpours are most
common and humidity is at its peak during the summer months.
Winter or dry season is also Trade Wind season and runs May through October. The
Trade Winds are mainly south-easterly but can turn to a more easterly direction at times.
During the winter months the Trade Winds tend to blow rather incessantly and can range
from anywhere from mild to rather strong at times. However, the Trade Winds can also
blow during any month of the year, not just the winter months, or they might
unexpectedly stop blowing in the middle of the Trade Wind season, often for days at a
time.

STATISTICAL YEARBOOK 2012
73
Table 5.1. METEOROLOGICAL DATA FOR AMERICAN SAMOA BY MONTH: 2012
Extreme
Average temperatures, Precipitation, inches temperatures,
degrees (fahrenheit) (water equivalent) degrees, Wind speed, mph
Mean Daily Greatest Date of (fahrenheit)
maxi- mini- in 24 occur- Record Ave- Peak
Month mum mum Monthly Total hours rence Hi Low rage gust
Annual 85.6 77.1 81.4 124.01 8.3 9/1/2012 96 62 11 81
January 86.1 77.4 81.8 8.14 1.92 24-25 95 67 9.8 48
February 86.2 77.0 81.6 11.76 2.49 5-6 96 67 9.7 63
March 86.0 76.5 81.3 14.00 1.79 16 95 67 9.0 37
April 86.1 76.1 81.1 8.41 2.62 29-30 95 68 9.4 35
May 85.3 76.2 80.8 12.15 2.39 02 93 66 11.1 35
June 83.8 77.5 80.7 6.13 1.60 2-3 91 64 13.2 43
July 82.7 77.0 79.9 5.84 2.05 12-13 91 62 13.9 33
August 84.2 76.8 80.5 3.19 1.73 09 92 64 13.6 33
September 85.6 77.4 81.5 12.74 8.29 1 92 63 13.7 38
October 86.7 78.1 82.4 4.99 1.66 16-17 94 67 12.2 35
November 87.8 78.0 83.0 18.35 7.76 4-5 95 67 11.0 39
December 86.9 77.3 82.1 18.31 3.91 12-13 94 67 10.2 81
SOURCE: U.S. Department of Commerce, National Oceanic and Atmospheric, National
Climatic Data Center, Local Climatological Data, Pago Pago, American Samoa.
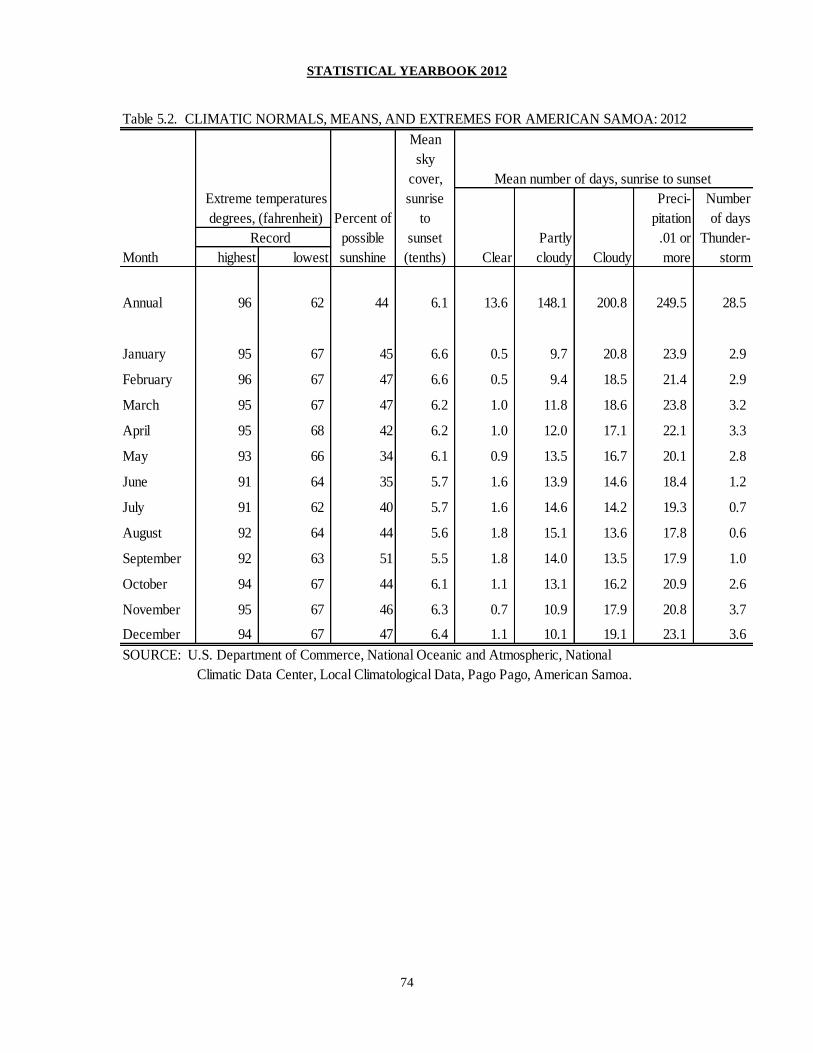
STATISTICAL YEARBOOK 2012
74
Table 5.2. CLIMATIC NORMALS, MEANS, AND EXTREMES FOR AMERICAN SAMOA: 2012
Mean
sky
cover, Mean number of days, sunrise to sunset
Extreme temperatures sunrise Preci- Number
degrees, (fahrenheit) Percent of to pitation of days
Record possible sunset Partly .01 or Thunder-
Month highest lowest sunshine (tenths) Clear cloudy Cloudy more storm
Annual 96 62 44 6.1 13.6 148.1 200.8 249.5 28.5
January 95 67 45 6.6 0.5 9.7 20.8 23.9 2.9
February 96 67 47 6.6 0.5 9.4 18.5 21.4 2.9
March 95 67 47 6.2 1.0 11.8 18.6 23.8 3.2
April 95 68 42 6.2 1.0 12.0 17.1 22.1 3.3
May 93 66 34 6.1 0.9 13.5 16.7 20.1 2.8
June 91 64 35 5.7 1.6 13.9 14.6 18.4 1.2
July 91 62 40 5.7 1.6 14.6 14.2 19.3 0.7
August 92 64 44 5.6 1.8 15.1 13.6 17.8 0.6
September 92 63 51 5.5 1.8 14.0 13.5 17.9 1.0
October 94 67 44 6.1 1.1 13.1 16.2 20.9 2.6
November 95 67 46 6.3 0.7 10.9 17.9 20.8 3.7
December 94 67 47 6.4 1.1 10.1 19.1 23.1 3.6
SOURCE: U.S. Department of Commerce, National Oceanic and Atmospheric, National
Climatic Data Center, Local Climatological Data, Pago Pago, American Samoa.

STATISTICAL YEARBOOK 2012
75
Table 5.3. AVERAGE TEMPERATURES FOR AMERICAN SAMOA:
2002 TO 2012 (Degrees, fahrenheit)
Month 2012 2011 2010 2009 2008 2007 2006 2005 2004 2003 2002
Annual Average 81.4 81.2 82.4 82.4 82.7 83.3 82.1 82.6 75.1 82.4 83.6
January 81.7 80.9 85.0 85.0 83.4 83.2 82.1 84.0 81.8 85.4 84.3
February 81.6 80.2 83.9 85.4 84.2 83.6 82.4 84.7 81.3 83.8 85.4
March 81.3 81.8 85.7 85.2 83.5 83.5 83.7 84.6 81.5 84.6 84.3
April 81.1 82.4 82.9 85.4 83.3 84.2 83.7 83.6 81.3 82.9 84.1
May 80.8 81.3 82.7 82.0 82.6 82.5 83.9 82.1 80.8 82.8 84.1
June 80.7 81.2 81.5 81.1 81.1 83.5 81.9 80.8 - 80.7 82.7
July 79.8 81.7 81.1 80.6 80.6 82.9 80.3 80.4 80.7 80.6 82.8
August 80.5 80.1 80.4 79.7 81.8 83.2 81.2 80.8 81.4 79.3 81.2
September 81.5 81.3 80.9 80.3 81.3 83.0 81.0 81.9 82.0 81.8 82.8
October 82.4 81.5 81.5 81.2 82.8 83.1 81.0 82.6 82.5 82.5 82.3
November 83.0 80.8 81.0 81.3 83.2 83.7 81.2 83.6 83.1 81.7 84.0
December 82.1 81.7 81.8 81.4 84.6 83.5 82.3 82.5 84.7 82.5 84.6
SOURCE: U.S. Department of Commerce, National Oceanic and
Atmospheric Administration, National Climatic Data Center,
Local Climatological Data, Pago Pago, American Samoa
Table 5.4. RAINFALL (INCHES): 2002 to 2012
Rainfall 2012 2011 2010 2009 2008 2007 2006 2005 2004 2003 2002
Total 124.01 117.23 130.24 139.28 129.64 145.19 160.05 150.09 95.76 131.71 112.80
January 8.14 25.72 28.31 11.34 22.15 21.01 23.88 13.25 12.31 7.41 7.42
February 11.76 13.39 15.83 7.62 4.90 10.35 29.27 10.55 13.65 9.11 4.85
March 14.00 5.77 4.99 9.99 10.08 20.31 8.50 12.94 13.60 10.41 12.56
April 8.41 4.01 10.33 9.28 12.89 4.66 5.15 14.50 7.40 9.33 17.84
May 12.15 3.69 6.61 19.17 19.83 17.34 7.86 10.78 5.11 19.59 11.20
June 6.13 7.01 5.05 3.65 12.00 3.44 5.07 13.32 3.76 7.69 5.92
July 5.84 2.31 8.30 9.96 4.46 5.67 8.27 5.43 7.11 12.43 10.42
August 3.19 3.85 4.32 10.41 3.59 4.74 8.75 13.56 2.67 6.78 5.90
September 12.74 13.21 9.68 6.28 6.13 17.02 15.83 14.43 4.95 4.32 1.62
October 4.99 12.67 15.33 7.53 3.23 16.18 9.75 6.75 11.52 6.48 11.87
November 18.35 15.91 9.15 16.65 11.87 14.61 16.09 9.69 4.00 21.39 15.26
December 18.31 9.69 12.34 27.40 18.51 9.86 21.63 24.89 9.68 16.77 7.94
SOURCE: U.S. Department of Commerce, National Oceanic and Atmospheric,
National Climatic Data Center; Local Clibatological Data, Pago Pago, American Samoa.

STATISTICAL YEARBOOK 2012
76
Table 5.5. COOLING DEGREE DAYS FOR AMERICAN SAMOA: 2002 TO 2012
(Base 65 degrees, fahrenheit).
Month 2012 2011 2010 2009 2008 2007 2006 2005 2004 2003 2002
Total 6,078 6,023 6,410 6,413 6,565 6,768 6,312 6,511 5,769 6,414 6,846
January 527 500 624 625 578 573 534 596 528 637 604
February 487 432 535 578 565 527 492 557 481 531 581
March 510 525 647 631 578 583 587 611 519 614 607
April 490 527 542 619 557 583 569 566 495 545 581
May 499 515 557 534 554 548 596 535 496 560 595
June 475 496 500 489 489 561 514 483 - 478 540
July 469 527 506 492 493 561 485 485 497 485 557
August 488 476 486 464 529 571 508 498 518 447 508
September 502 495 485 465 494 544 484 513 517 508 537
October 548 521 517 507 559 569 504 556 549 550 543
November 544 485 485 495 553 564 495 562 551 509 579
December 539 524 526 514 616 584 544 549 618 550 614
Note: A cooling degree day is a unit used to relate the day's temperature to the energy demands of air conditioning.
Cooling degree days are calculated by subtracting 65 from a day's average temperature. For example, if the day's
high is 90°F and the day's low is 70ºF, the day's average is 80ºF. Eighty minus 65 is 15 cooling degree days.
Cooling degree days can be used to compare the current summer to past summers. It can also be used to
compare the heat in one part of the country with another.
SOURCE: U.S. Department of Commerce, National Oceanic Atmospheric
Administration, National Climatic Data Center; Local Climatological, Pago Pago, American Samoa.

STATISTICAL YEARBOOK 2012
77
Section Six
LAND USE/REGISTRATION, HOUSING CHARACTERISTICS, AND
BUILDING PERMITS
This section presents statistics on land use, land ownership registration and tenure,
housing characteristics, building permits, type and value of construction activities.
American Samoa has a total land area of 48,767 acres and about two-thirds of the land is
steeply sloping and virtually inaccessible. Land registration at the Office of the
Territorial Registrar added another 12 acres of land in 2012. Approximately 7,875 acres
of land have been registered in 2012. Land ownership registration is categorized into five
titles. Communal land holds 27 percent, individually-owned holds 26 percent,
government-owned holds 21.0 percent, freehold land holds14 percent and church-owned
holds 13 percent.
In the 2010 Census, American Samoa registered 10, 963 housing units. Of the 10,963
housing units, 88 percent were occupied and 12 percent (1,275) were vacant. Of the
9,688 occupied housing units, 73 percent were owner-occupied and 27 percent were
rather occupied. In the Tualauta County, Tafuna village had the highest number of
occupants per room in both owner-occupied and renter-occupied units.
Approximately 55 percent of the 10,963 housing units were located in the Maoputasi and
Tualauta counties. Furthermore, these two counties absorbed most of the growth: a
combined 68 percent of the rental market. Housing units are characterized as single
detached units, attached units, 2 houses, 3 or more houses. This is unique to American
Samoa where about 8 percent of households live in two or more houses. Those living in
apartment housing although small but are on the rise as 7 percent of households live in
building with two or more housing units. Those living in single detached houses have
increased slightly from 78 percent in 2000 to 79 percent in 2010.
The number of building permits issued dropped 692 in 2012. Permits for new structures
decreased in 2012 with 135 permits issued. Permits for extension, repair and alteration
dropped in 2012 with 199. The estimated value of construction in 2012 was $28 million.
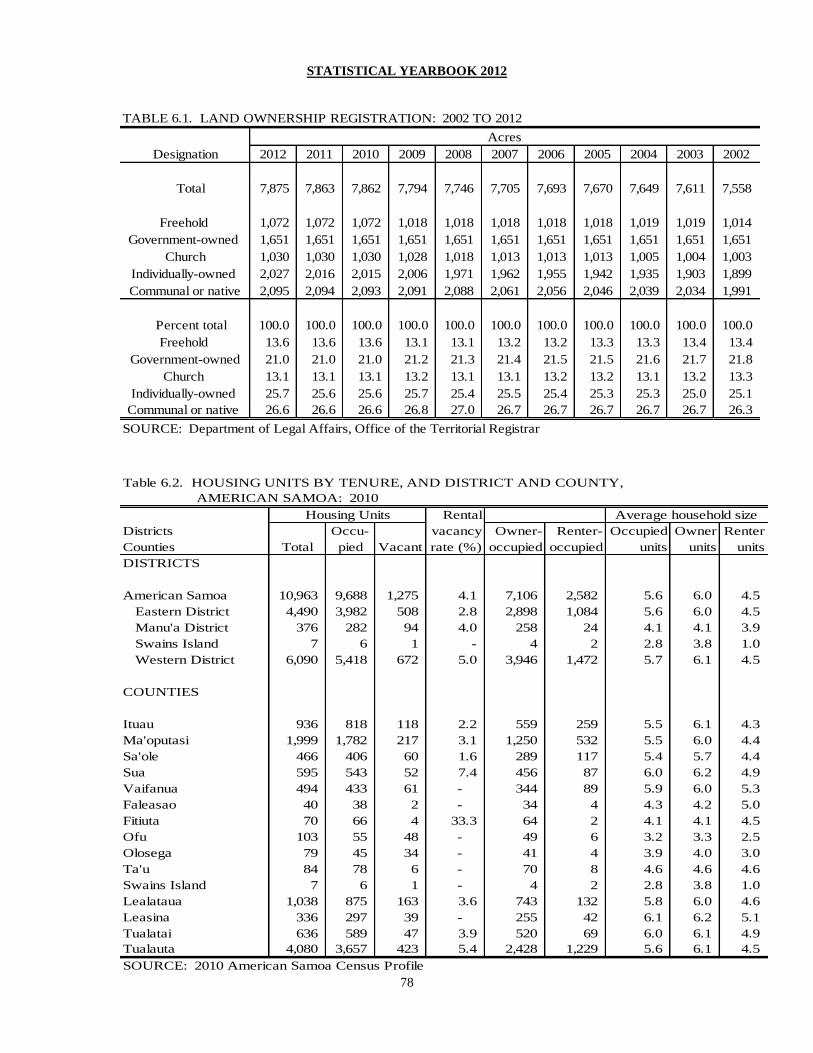
STATISTICAL YEARBOOK 2012
78
TABLE 6.1. LAND OWNERSHIP REGISTRATION: 2002 TO 2012
Designation 2012 2011 2010 2009 2008 2007 2006 2005 2004 2003 2002
Total 7,875 7,863 7,862 7,794 7,746 7,705 7,693 7,670 7,649 7,611 7,558
Freehold 1,072 1,072 1,072 1,018 1,018 1,018 1,018 1,018 1,019 1,019 1,014
Government-owned 1,651 1,651 1,651 1,651 1,651 1,651 1,651 1,651 1,651 1,651 1,651
Church 1,030 1,030 1,030 1,028 1,018 1,013 1,013 1,013 1,005 1,004 1,003
Individually-owned 2,027 2,016 2,015 2,006 1,971 1,962 1,955 1,942 1,935 1,903 1,899
Communal or native 2,095 2,094 2,093 2,091 2,088 2,061 2,056 2,046 2,039 2,034 1,991
Percent total 100.0 100.0 100.0 100.0 100.0 100.0 100.0 100.0 100.0 100.0 100.0
Freehold 13.6 13.6 13.6 13.1 13.1 13.2 13.2 13.3 13.3 13.4 13.4
Government-owned 21.0 21.0 21.0 21.2 21.3 21.4 21.5 21.5 21.6 21.7 21.8
Church 13.1 13.1 13.1 13.2 13.1 13.1 13.2 13.2 13.1 13.2 13.3
Individually-owned 25.7 25.6 25.6 25.7 25.4 25.5 25.4 25.3 25.3 25.0 25.1
Communal or native 26.6 26.6 26.6 26.8 27.0 26.7 26.7 26.7 26.7 26.7 26.3
SOURCE: Department of Legal Affairs, Office of the Territorial Registrar
Acres
Table 6.2. HOUSING UNITS BY TENURE, AND DISTRICT AND COUNTY,
AMERICAN SAMOA: 2010
Rental
Districts Occu- vacancy Owner- Renter- Occupied Owner Renter
Counties Total pied Vacant rate (%) occupied occupied units units units
DISTRICTS
American Samoa 10,963 9,688 1,275 4.1 7,106 2,582 5.6 6.0 4.5
Eastern District 4,490 3,982 508 2.8 2,898 1,084 5.6 6.0 4.5
Manu'a District 376 282 94 4.0 258 24 4.1 4.1 3.9
Swains Island 7 6 1 - 4 2 2.8 3.8 1.0
Western District 6,090 5,418 672 5.0 3,946 1,472 5.7 6.1 4.5
COUNTIES
Ituau 936 818 118 2.2 559 259 5.5 6.1 4.3
Ma'oputasi 1,999 1,782 217 3.1 1,250 532 5.5 6.0 4.4
Sa'ole 466 406 60 1.6 289 117 5.4 5.7 4.4
Sua 595 543 52 7.4 456 87 6.0 6.2 4.9
Vaifanua 494 433 61 - 344 89 5.9 6.0 5.3
Faleasao 40 38 2 - 34 4 4.3 4.2 5.0
Fitiuta 70 66 4 33.3 64 2 4.1 4.1 4.5
Ofu 103 55 48 - 49 6 3.2 3.3 2.5
Olosega 79 45 34 - 41 4 3.9 4.0 3.0
Ta'u 84 78 6 - 70 8 4.6 4.6 4.6
Swains Island 7 6 1 - 4 2 2.8 3.8 1.0
Lealataua 1,038 875 163 3.6 743 132 5.8 6.0 4.6
Leasina 336 297 39 - 255 42 6.1 6.2 5.1
Tualatai 636 589 47 3.9 520 69 6.0 6.1 4.9
Tualauta 4,080 3,657 423 5.4 2,428 1,229 5.6 6.1 4.5
SOURCE: 2010 American Samoa Census Profile
Housing Units Average household size
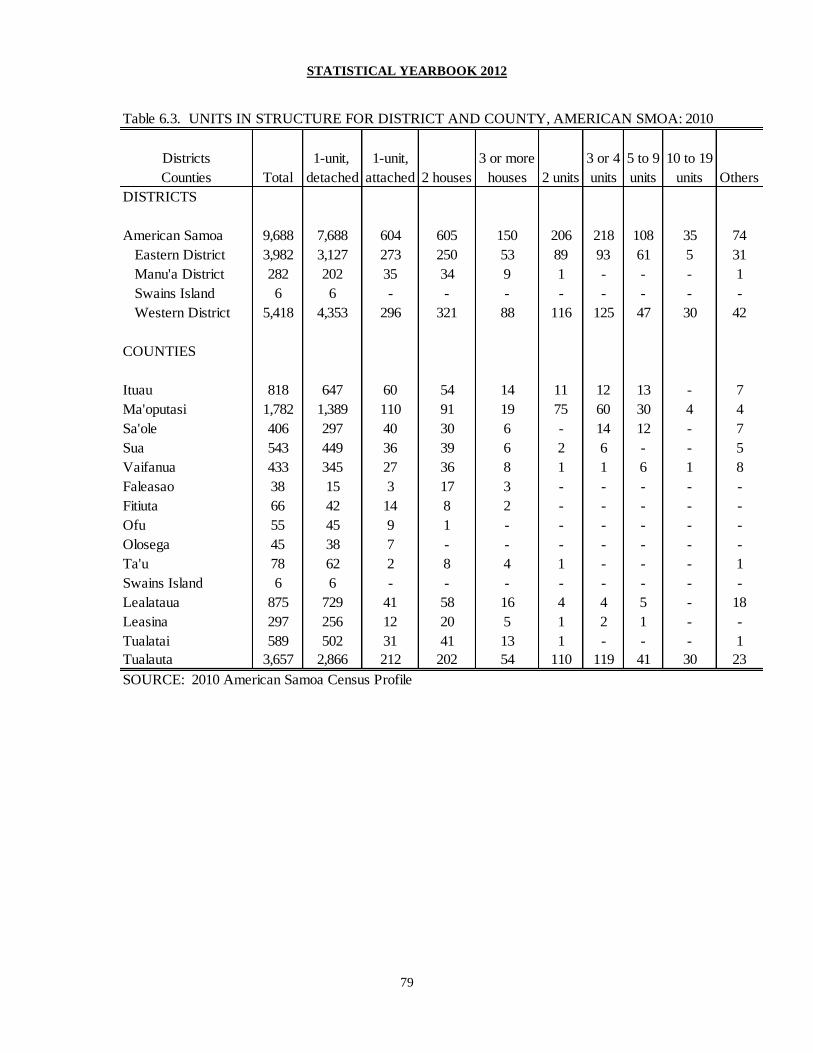
STATISTICAL YEARBOOK 2012
79
Table 6.3. UNITS IN STRUCTURE FOR DISTRICT AND COUNTY, AMERICAN SMOA: 2010
Districts 1-unit, 1-unit, 3 or more 3 or 4 5 to 9 10 to 19
Counties Total detached attached 2 houses houses 2 units units units units Others
DISTRICTS
American Samoa 9,688 7,688 604 605 150 206 218 108 35 74
Eastern District 3,982 3,127 273 250 53 89 93 61 5 31
Manu'a District 282 202 35 34 9 1 - - - 1
Swains Island 6 6 - - - - - - - -
Western District 5,418 4,353 296 321 88 116 125 47 30 42
COUNTIES
Ituau 818 647 60 54 14 11 12 13 - 7
Ma'oputasi 1,782 1,389 110 91 19 75 60 30 4 4
Sa'ole 406 297 40 30 6 - 14 12 - 7
Sua 543 449 36 39 6 2 6 - - 5
Vaifanua 433 345 27 36 8 1 1 6 1 8
Faleasao 38 15 3 17 3 - - - - -
Fitiuta 66 42 14 8 2 - - - - -
Ofu 55 45 9 1 - - - - - -
Olosega 45 38 7 - - - - - - -
Ta'u 78 62 2 8 4 1 - - - 1
Swains Island 6 6 - - - - - - - -
Lealataua 875 729 41 58 16 4 4 5 - 18
Leasina 297 256 12 20 5 1 2 1 - -
Tualatai 589 502 31 41 13 1 - - - 1
Tualauta 3,657 2,866 212 202 54 110 119 41 30 23
SOURCE: 2010 American Samoa Census Profile
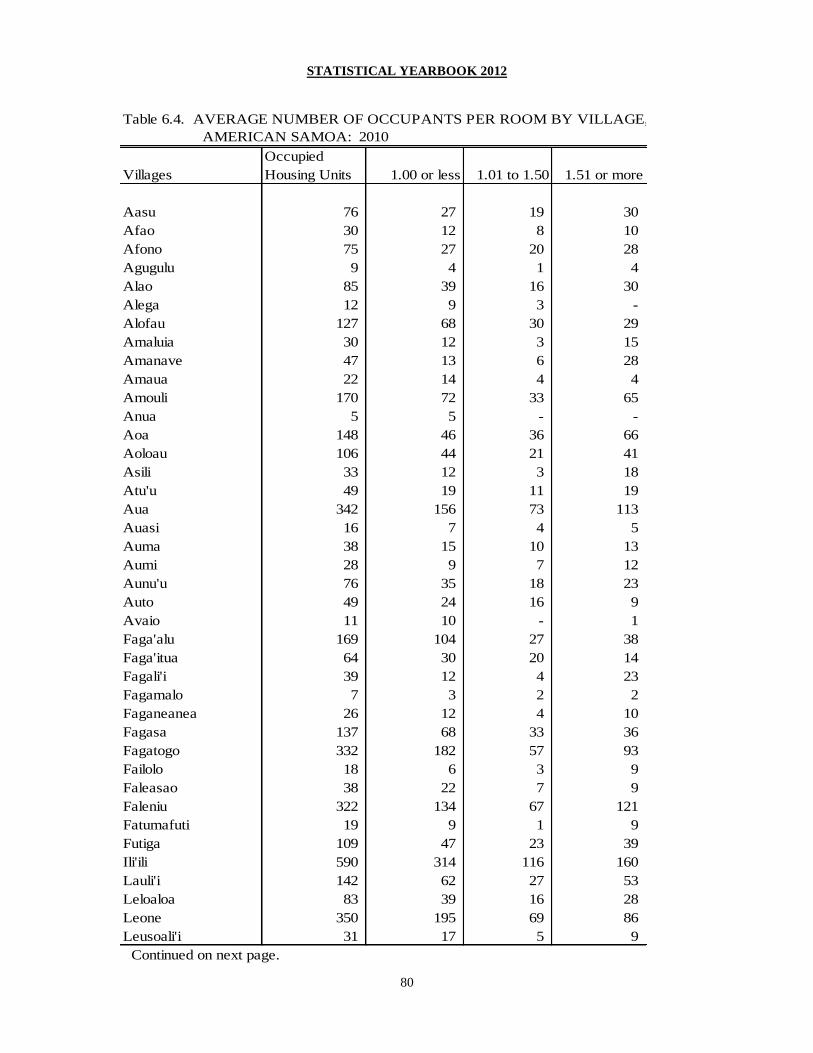
STATISTICAL YEARBOOK 2012
80
Table 6.4. AVERAGE NUMBER OF OCCUPANTS PER ROOM BY VILLAGE,
AMERICAN SAMOA: 2010
Occupied
Villages Housing Units 1.00 or less 1.01 to 1.50 1.51 or more
Aasu 76 27 19 30
Afao 30 12 8 10
Afono 75 27 20 28
Agugulu 9 4 1 4
Alao 85 39 16 30
Alega 12 9 3 -
Alofau 127 68 30 29
Amaluia 30 12 3 15
Amanave 47 13 6 28
Amaua 22 14 4 4
Amouli 170 72 33 65
Anua 5 5 - -
Aoa 148 46 36 66
Aoloau 106 44 21 41
Asili 33 12 3 18
Atu'u 49 19 11 19
Aua 342 156 73 113
Auasi 16 7 4 5
Auma 38 15 10 13
Aumi 28 9 7 12
Aunu'u 76 35 18 23
Auto 49 24 16 9
Avaio 11 10 - 1
Faga'alu 169 104 27 38
Faga'itua 64 30 20 14
Fagali'i 39 12 4 23
Fagamalo 7 3 2 2
Faganeanea 26 12 4 10
Fagasa 137 68 33 36
Fagatogo 332 182 57 93
Failolo 18 6 3 9
Faleasao 38 22 7 9
Faleniu 322 134 67 121
Fatumafuti 19 9 1 9
Futiga 109 47 23 39
Ili'ili 590 314 116 160
Lauli'i 142 62 27 53
Leloaloa 83 39 16 28
Leone 350 195 69 86
Leusoali'i 31 17 5 9
Continued on next page.

STATISTICAL YEARBOOK 2012
81
Table 6.4. AVERAGE NUMBER OF OCCUPANTS PER ROOM BY VILLAGE,
AMERICAN SAMOA: 2010 (continued)
Occupied
Villages Housing Units 1.00 or less 1.01 to 1.50 1.51 or more
Luma 36 23 9 4
Maia 35 15 6 14
Malaeimi 206 84 37 85
Malaeloa/A 115 47 22 46
Malaeloa/I 90 37 16 37
Maloata 2 2 - -
Mapusagafou 193 81 44 68
Masausi 28 12 5 11
Masefau 72 28 18 26
Matu'u 68 30 18 20
Mesepa 81 40 16 25
Nua 22 9 6 7
Nu'uuli 694 343 133 218
Ofu 55 43 6 6
Olosega 44 30 7 7
Onenoa 24 11 - 13
Pagai 18 5 7 6
Pago Pago 625 291 121 213
Pava'ia'i 388 147 80 161
Poloa 35 14 8 13
Puapua 165 74 26 65
Sa'ilele 13 6 1 6
Satala 49 21 6 22
Se'etaga 43 9 14 20
Sili 1 1 - -
Si'ufaga 42 28 7 7
Swains 6 4 - 2
Tafuna 1,428 750 254 424
Taputimu 146 59 33 54
Tula 76 40 19 17
Utulei 109 53 29 27
Utumea East 12 9 2 1
Utumea West 7 3 1 3
Utusia 14 8 2 4
Vailoatai 244 92 54 98
Vaitogi 342 148 66 128
Vatia 100 48 19 33
SOURCE: 2010 American Samoa Census Profile
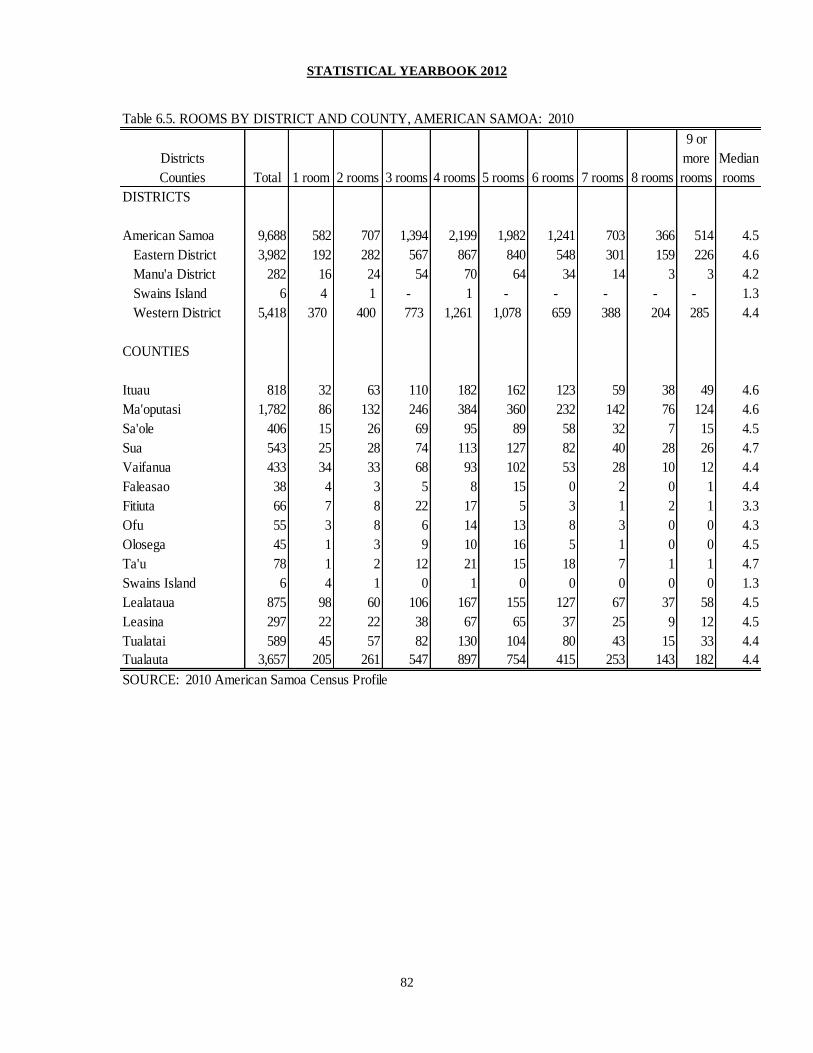
STATISTICAL YEARBOOK 2012
82
Table 6.5. ROOMS BY DISTRICT AND COUNTY, AMERICAN SAMOA: 2010
9 or
Districts more Median
Counties Total 1 room 2 rooms 3 rooms 4 rooms 5 rooms 6 rooms 7 rooms 8 rooms rooms rooms
DISTRICTS
American Samoa 9,688 582 707 1,394 2,199 1,982 1,241 703 366 514 4.5
Eastern District 3,982 192 282 567 867 840 548 301 159 226 4.6
Manu'a District 282 16 24 54 70 64 34 14 3 3 4.2
Swains Island 6 4 1 - 1 - - - - - 1.3
Western District 5,418 370 400 773 1,261 1,078 659 388 204 285 4.4
COUNTIES
Ituau 818 32 63 110 182 162 123 59 38 49 4.6
Ma'oputasi 1,782 86 132 246 384 360 232 142 76 124 4.6
Sa'ole 406 15 26 69 95 89 58 32 7 15 4.5
Sua 543 25 28 74 113 127 82 40 28 26 4.7
Vaifanua 433 34 33 68 93 102 53 28 10 12 4.4
Faleasao 38 4 3 5 8 15 0 2 0 1 4.4
Fitiuta 66 7 8 22 17 5 3 1 2 1 3.3
Ofu 55 3 8 6 14 13 8 3 0 0 4.3
Olosega 45 1 3 9 10 16 5 1 0 0 4.5
Ta'u 78 1 2 12 21 15 18 7 1 1 4.7
Swains Island 6 4 1 0 1 0 0 0 0 0 1.3
Lealataua 875 98 60 106 167 155 127 67 37 58 4.5
Leasina 297 22 22 38 67 65 37 25 9 12 4.5
Tualatai 589 45 57 82 130 104 80 43 15 33 4.4
Tualauta 3,657 205 261 547 897 754 415 253 143 182 4.4
SOURCE: 2010 American Samoa Census Profile
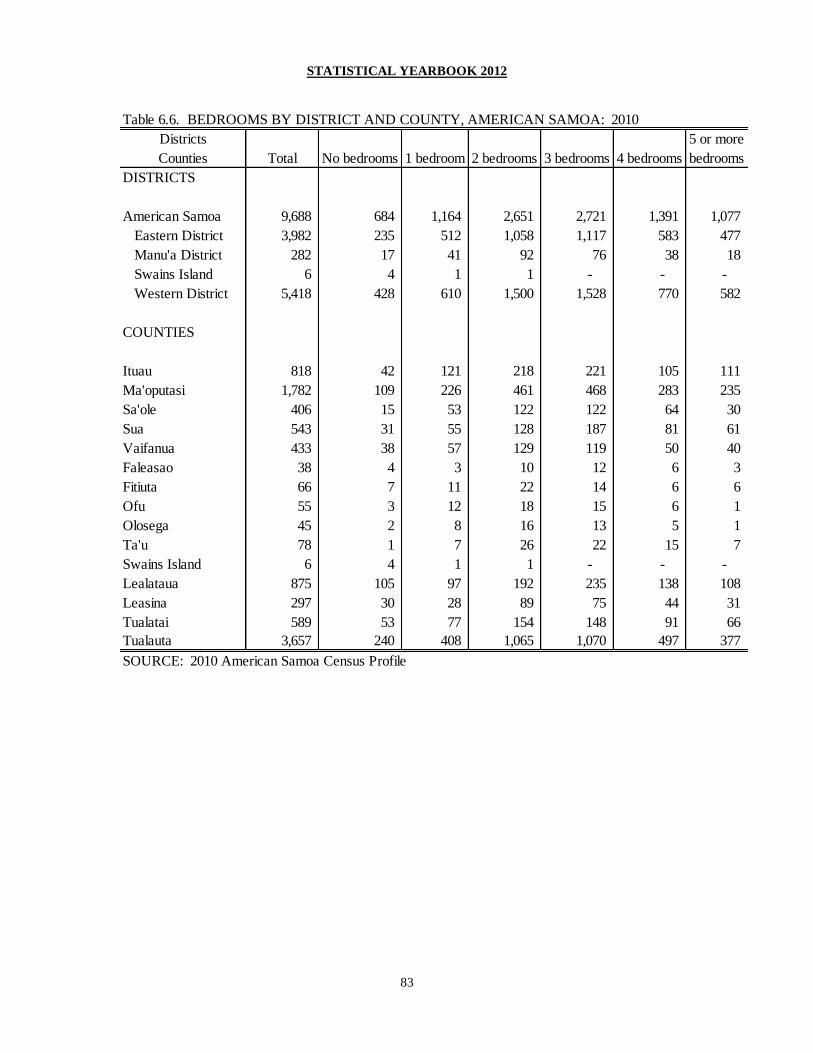
STATISTICAL YEARBOOK 2012
83
Table 6.6. BEDROOMS BY DISTRICT AND COUNTY, AMERICAN SAMOA: 2010
Districts 5 or more
Counties Total No bedrooms 1 bedroom 2 bedrooms 3 bedrooms 4 bedrooms bedrooms
DISTRICTS
American Samoa 9,688 684 1,164 2,651 2,721 1,391 1,077
Eastern District 3,982 235 512 1,058 1,117 583 477
Manu'a District 282 17 41 92 76 38 18
Swains Island 6 4 1 1 - - -
Western District 5,418 428 610 1,500 1,528 770 582
COUNTIES
Ituau 818 42 121 218 221 105 111
Ma'oputasi 1,782 109 226 461 468 283 235
Sa'ole 406 15 53 122 122 64 30
Sua 543 31 55 128 187 81 61
Vaifanua 433 38 57 129 119 50 40
Faleasao 38 4 3 10 12 6 3
Fitiuta 66 7 11 22 14 6 6
Ofu 55 3 12 18 15 6 1
Olosega 45 2 8 16 13 5 1
Ta'u 78 1 7 26 22 15 7
Swains Island 6 4 1 1 - - -
Lealataua 875 105 97 192 235 138 108
Leasina 297 30 28 89 75 44 31
Tualatai 589 53 77 154 148 91 66
Tualauta 3,657 240 408 1,065 1,070 497 377
SOURCE: 2010 American Samoa Census Profile

STATISTICAL YEARBOOK 2012
84
TABLE 6.7. PERSONS PER ROOM BY DISTRICT: 2010
Manu'a
Persons per room Total Eastern Western Swains
Total Occupied units 9,688 3,982 5,418 288
Owner occupied units 7,106 2,898 3,946 262
Percent total 100.0 100.0 100.0 100.0
0.50 or less 14.3 13.9 13.5 30.2
0.51 to 1.00 29.9 31.3 28.7 32.4
1.01 to 1.50 21.1 21.6 21.0 17.6
1.51 to 2.00 16.0 16.5 15.9 11.8
2.01 or more 18.8 16.7 21.0 8.0
Renter occupied units 2,582 1,084 1,472 26
Percent total 100.0 100.0 100.0 100.0
0.50 or less 25.2 25.4 25.3 15.4
0.51 to 1.00 30.7 30.3 30.6 57.7
1.01 to 1.50 16.1 17.0 15.7 3.8
1.51 to 2.00 13.0 12.6 13.3 7.7
2.01 or more 15.0 14.8 15.1 15.4
SOURCE: U.S. Bureau of the Census, Censuses of Population; ASG Department of Commerce
2010

STATISTICAL YEARBOOK 2012
85
Table 6.8. Year Structure Built by District and County, American Samoa: 2010
Districts 2009 to 2000 to 1990 to 1980 to 1970 to 1960 to 1950 to 1940 to 1939 or
Counties Total March 2010 2008 1999 1989 1979 1969 1959 1949 earlier
DISTRICTS
American Samoa 9,688 432 2,255 2,866 2,117 959 777 137 69 76
Eastern District 3,982 171 833 1,068 806 467 449 81 44 63
Manu'a District 282 3 29 68 123 31 24 3 1 -
Swains Island 6 - 1 1 3 - - - - 1
Western District 5,418 258 1,392 1,729 1,185 461 304 53 24 12
COUNTIES
Ituau 818 34 178 248 169 72 81 20 12 4
Ma'oputasi 1,782 77 357 429 374 235 220 34 19 37
Sa'ole 406 18 80 103 90 47 55 7 2 4
Sua 543 15 132 148 83 75 51 15 7 17
Vaifanua 433 27 86 140 90 38 42 5 4 1
Faleasao 38 1 2 10 24 - - - 1 -
Fitiuta 66 - 9 10 34 6 6 1 - -
Ofu 55 2 8 10 12 14 7 2 - -
Olosega 45 - 5 12 17 5 6 - - -
Ta'u 78 - 5 26 36 6 5 - - -
Swains Island 6 - 1 1 3 - - - - 1
Lealataua 875 80 167 236 171 88 94 20 12 7
Leasina 297 10 76 99 66 25 17 4 - -
Tualatai 589 19 148 170 110 65 63 8 4 2
Tualauta 3,657 149 1,001 1,224 838 283 130 21 8 3
Source: 2010 American Samoa Census Profile
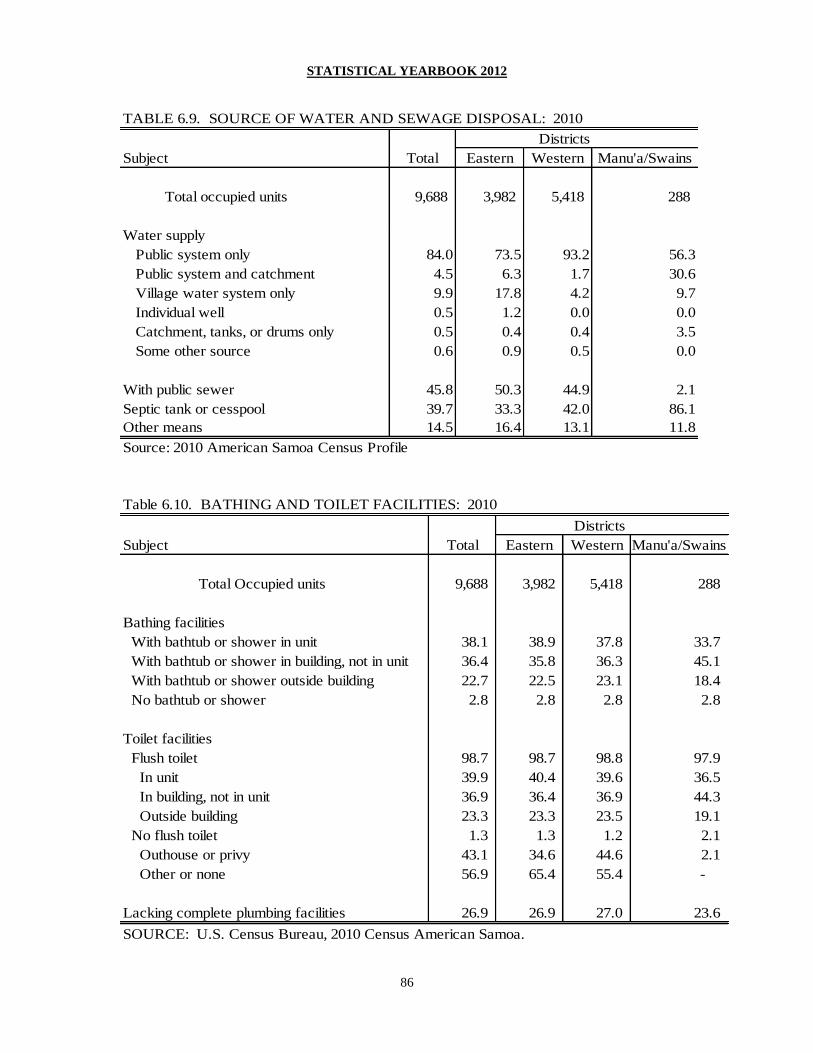
STATISTICAL YEARBOOK 2012
86
TABLE 6.9. SOURCE OF WATER AND SEWAGE DISPOSAL: 2010
Districts
Subject Total Eastern Western Manu'a/Swains
Total occupied units 9,688 3,982 5,418 288
Water supply
Public system only 84.0 73.5 93.2 56.3
Public system and catchment 4.5 6.3 1.7 30.6
Village water system only 9.9 17.8 4.2 9.7
Individual well 0.5 1.2 0.0 0.0
Catchment, tanks, or drums only 0.5 0.4 0.4 3.5
Some other source 0.6 0.9 0.5 0.0
With public sewer 45.8 50.3 44.9 2.1
Septic tank or cesspool 39.7 33.3 42.0 86.1
Other means 14.5 16.4 13.1 11.8
Source: 2010 American Samoa Census Profile
Table 6.10. BATHING AND TOILET FACILITIES: 2010
Districts
Subject Total Eastern Western Manu'a/Swains
Total Occupied units 9,688 3,982 5,418 288
Bathing facilities
With bathtub or shower in unit 38.1 38.9 37.8 33.7
With bathtub or shower in building, not in unit 36.4 35.8 36.3 45.1
With bathtub or shower outside building 22.7 22.5 23.1 18.4
No bathtub or shower 2.8 2.8 2.8 2.8
Toilet facilities
Flush toilet 98.7 98.7 98.8 97.9
In unit 39.9 40.4 39.6 36.5
In building, not in unit 36.9 36.4 36.9 44.3
Outside building 23.3 23.3 23.5 19.1
No flush toilet 1.3 1.3 1.2 2.1
Outhouse or privy 43.1 34.6 44.6 2.1
Other or none 56.9 65.4 55.4 -
Lacking complete plumbing facilities 26.9 26.9 27.0 23.6
SOURCE: U.S. Census Bureau, 2010 Census American Samoa.
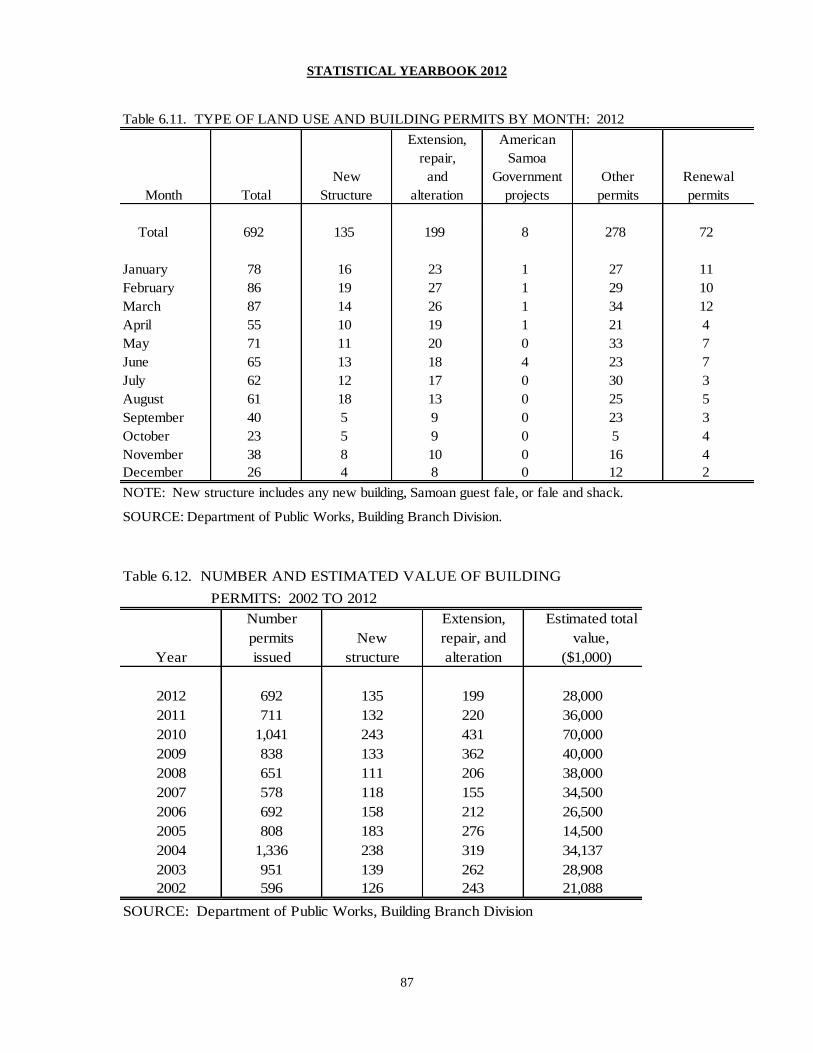
STATISTICAL YEARBOOK 2012
87
Table 6.11. TYPE OF LAND USE AND BUILDING PERMITS BY MONTH: 2012
Extension, American
repair, Samoa
New and Government Other Renewal
Month Total Structure alteration projects permits permits
Total 692 135 199 8 278 72
January 78 16 23 1 27 11
February 86 19 27 1 29 10
March 87 14 26 1 34 12
April 55 10 19 1 21 4
May 71 11 20 0 33 7
June 65 13 18 4 23 7
July 62 12 17 0 30 3
August 61 18 13 0 25 5
September 40 5 9 0 23 3
October 23 5 9 0 5 4
November 38 8 10 0 16 4
December 26 4 8 0 12 2
NOTE: New structure includes any new building, Samoan guest fale, or fale and shack.
SOURCE: Department of Public Works, Building Branch Division.
Table 6.12. NUMBER AND ESTIMATED VALUE OF BUILDING
PERMITS: 2002 TO 2012
Number Extension, Estimated total
permits New repair, and value,
Year issued structure alteration ($1,000)
2012 692 135 199 28,000
2011 711 132 220 36,000
2010 1,041 243 431 70,000
2009 838 133 362 40,000
2008 651 111 206 38,000
2007 578 118 155 34,500
2006 692 158 212 26,500
2005 808 183 276 14,500
2004 1,336 238 319 34,137
2003 951 139 262 28,908
2002 596 126 243 21,088
SOURCE: Department of Public Works, Building Branch Division
STATISTICAL YEARBOOK 2012
88
Section Seven
INTERNATIONAL ARRIVALS AND DEPARTURES
This section presents statistical data on international arrivals and departures by purpose
and citizenship of travelers.
In 2012, approximately 67,979 travelers arrived in American Samoa. The majority of
travelers were returning residents of American Samoa (about 39,136). Visitor arrivals
accounted for 40 percent of all arrivals in 2012. However, visitor arrivals dropped again
for the fourth year in a row with 27,348.
Approximately 69,472 travelers departed American Samoa in 2012. The majority of
departures were residents leaving the island (39,100) for better opportunities abroad. In
2012, there was a net loss of 1493 persons. When comparing 2011 to 2012, arrivals and
departures have increased in 2012.
The United States continued to be our primary tourism market holding 56 percent of the
market. New Zealand followed with 29 percent, Australia with 11 percent and the rest of
the countries with the remaining 9 percent.
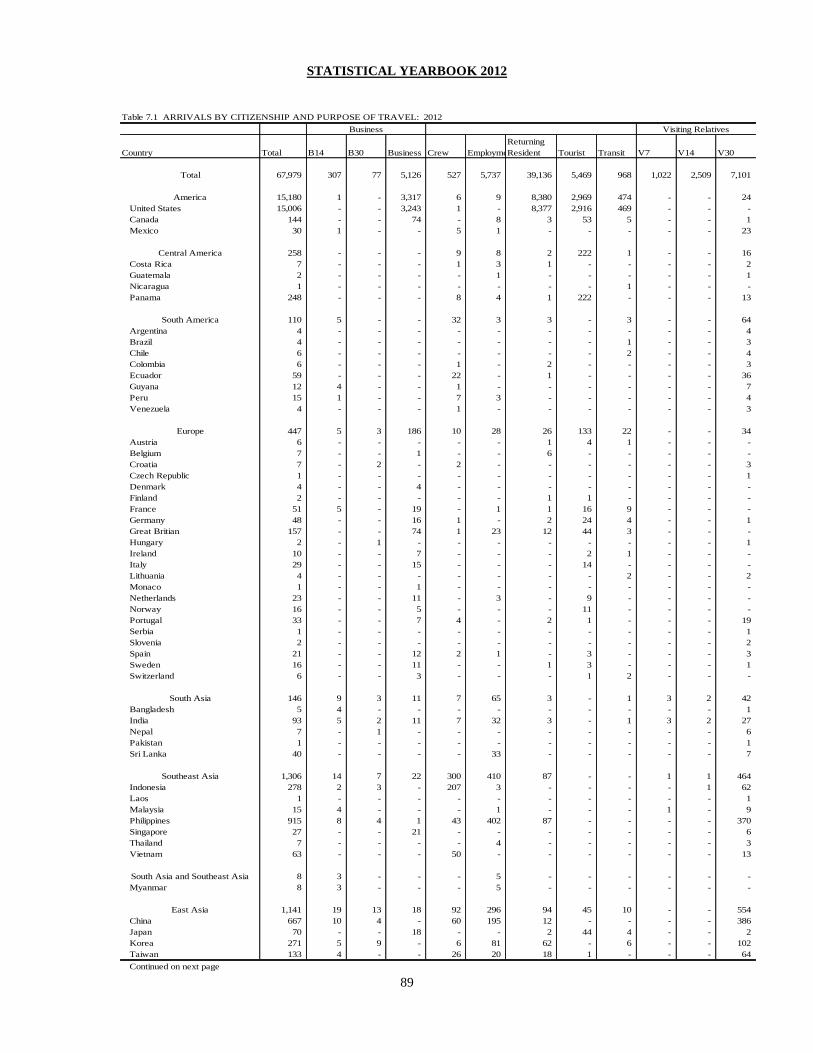
STATISTICAL YEARBOOK 2012
89
Table 7.1 ARRIVALS BY CITIZENSHIP AND PURPOSE OF TRAVEL: 2012
Country Total B14 B30 Business Crew Employment
Returning
Resident Tourist Transit V7 V14 V30
Total 67,979 307 77 5,126 527 5,737 39,136 5,469 968 1,022 2,509 7,101
America 15,180 1 - 3,317 6 9 8,380 2,969 474 - - 24
United States 15,006 - - 3,243 1 - 8,377 2,916 469 - - -
Canada 144 - - 74 - 8 3 53 5 - - 1
Mexico 30 1 - - 5 1 - - - - - 23
Central America 258 - - - 9 8 2 222 1 - - 16
Costa Rica 7 - - - 1 3 1 - - - - 2
Guatemala 2 - - - - 1 - - - - - 1
Nicaragua 1 - - - - - - - 1 - - -
Panama 248 - - - 8 4 1 222 - - - 13
South America 110 5 - - 32 3 3 - 3 - - 64
Argentina 4 - - - - - - - - - - 4
Brazil 4 - - - - - - - 1 - - 3
Chile 6 - - - - - - - 2 - - 4
Colombia 6 - - - 1 - 2 - - - - 3
Ecuador 59 - - - 22 - 1 - - - - 36
Guyana 12 4 - - 1 - - - - - - 7
Peru 15 1 - - 7 3 - - - - - 4
Venezuela 4 - - - 1 - - - - - - 3
Europe 447 5 3 186 10 28 26 133 22 - - 34
Austria 6 - - - - - 1 4 1 - - -
Belgium 7 - - 1 - - 6 - - - - -
Croatia 7 - 2 - 2 - - - - - - 3
Czech Republic 1 - - - - - - - - - - 1
Denmark 4 - - 4 - - - - - - - -
Finland 2 - - - - - 1 1 - - - -
France 51 5 - 19 - 1 1 16 9 - - -
Germany 48 - - 16 1 - 2 24 4 - - 1
Great Britian 157 - - 74 1 23 12 44 3 - - -
Hungary 2 - 1 - - - - - - - - 1
Ireland 10 - - 7 - - - 2 1 - - -
Italy 29 - - 15 - - - 14 - - - -
Lithuania 4 - - - - - - - 2 - - 2
Monaco 1 - - 1 - - - - - - - -
Netherlands 23 - - 11 - 3 - 9 - - - -
Norway 16 - - 5 - - - 11 - - - -
Portugal 33 - - 7 4 - 2 1 - - - 19
Serbia 1 - - - - - - - - - - 1
Slovenia 2 - - - - - - - - - - 2
Spain 21 - - 12 2 1 - 3 - - - 3
Sweden 16 - - 11 - - 1 3 - - - 1
Switzerland 6 - - 3 - - - 1 2 - - -
South Asia 146 9 3 11 7 65 3 - 1 3 2 42
Bangladesh 5 4 - - - - - - - - - 1
India 93 5 2 11 7 32 3 - 1 3 2 27
Nepal 7 - 1 - - - - - - - - 6
Pakistan 1 - - - - - - - - - - 1
Sri Lanka 40 - - - - 33 - - - - - 7
Southeast Asia 1,306 14 7 22 300 410 87 - - 1 1 464
Indonesia 278 2 3 - 207 3 - - - - 1 62
Laos 1 - - - - - - - - - - 1
Malaysia 15 4 - - - 1 - - - 1 - 9
Philippines 915 8 4 1 43 402 87 - - - - 370
Singapore 27 - - 21 - - - - - - - 6
Thailand 7 - - - - 4 - - - - - 3
Vietnam 63 - - - 50 - - - - - - 13
South Asia and Southeast Asia 8 3 - - - 5 - - - - - -
Myanmar 8 3 - - - 5 - - - - - -
East Asia 1,141 19 13 18 92 296 94 45 10 - - 554
China 667 10 4 - 60 195 12 - - - - 386
Japan 70 - - 18 - - 2 44 4 - - 2
Korea 271 5 9 - 6 81 62 - 6 - - 102
Taiwan 133 4 - - 26 20 18 1 - - - 64
Continued on next page
Business Visiting Relatives

STATISTICAL YEARBOOK 2012
90
Table 7.1 ARRIVALS BY CITIZENSHIP AND PURPOSE OF TRAVEL: 2012 (Continued)
Country Total B14 B30 Business Crew Employment
Returning
Resident Tourist Transit V7 V14 V30
Australia/New Zealand 4,469 - 1 1,552 2 389 389 2,083 53 - - -
Australia 1,006 - - 337 1 44 58 555 11 - - -
New Zealand 3,463 - 1 1,215 1 345 331 1,528 42 - - -
Pacific Islands 44,830 224 45 14 67 4,522 30,152 11 396 1,018 2,506 5,875
American Samoa 22,600 - - - - - 22,600 - - - - -
Fiji 578 18 16 - 26 163 30 - 7 - 2 316
Kiribati 15 4 1 - 4 - - - - - - 6
Federated States of Micronesia 15 - - 5 1 - 1 7 1 - - -
Marshall Islands 19 - - 6 - 1 1 1 10 - - -
Nauru 12 5 1 - 1 1 - - - - - 4
Palau 7 - - 3 - - - 3 1 - - -
Papua New Guinea 34 17 1 - - 2 - - - - 6 8
Solomon Islands 64 23 - - 4 4 - - - - 3 30
Tonga 590 14 6 - 2 190 139 - 11 - 17 211
Tuvalu 50 8 - - - 3 19 - - - 3 17
Vanuatu 44 3 - - 22 - - - - - 2 17
Samoa 20,802 132 20 - 7 4,158 7,362 - 366 1,018 2,473 5,266
Other Geo. Areas
Africa 48 22 - 6 2 - - 6 6 - - 6
Botswana 3 3 - - - - - - - - - -
Ghana 1 1 - - - - - - - - - -
Kenya 1 - - - - - - - - - - 1
Madagascar 22 4 - 6 - - - 6 6 - - -
Malawi 1 1 - - - - - - - - - -
Namibia 1 1 - - - - - - - - - -
Nigeria 2 - - - - - - - - - - 2
South Africa 11 7 - - 1 - - - - - - 3
Zambia 4 4 - - - - - - - - - -
Zimbabwe 1 1 - - - - - - - - - -
Other 1 - - - 1 - - - - - - -
Middle East 1 - - - - - - - - - - 1
Russia 14 - 1 - - 2 - - - - - 11
Other 21 5 4 - - - - - 2 - - 10
Azerbaijan 1 - - - - - - - 1 - - -
Jamaica 10 4 2 - - - - - - - - 4
Vatican 1 - - - - - - - - - - 1
Puerto Rico 1 - - - - - - - 1 - - -
Trinidad and Tobago 1 - - - - - - - - - - 1
Ukraine 3 1 2 - - - - - - - - -
Uzbekistan 2 - - - - - - - - - - 2
Other 2 - - - - - - - - - - 2
SOURCE: Department of Legal Affairs, Immigration Office.
Business Visiting Relatives

STATISTICAL YEARBOOK 2012
91
Table 7.2. VISITOR ARRIVALS BY PURPOSE OF TRAVEL: 2005 TO 2012
Purpose 2012 2011 2010 2009 2008 2007 2006 2005
Total 27,348 28,403 29,060 30,705 31,277 30,599 31,172 30,221
Business 5,510 5,414 5,873 6,407 5,337 5,214 4,643 4,394
Tourist 5,469 5,682 6,126 6,474 7,084 7,521 7,762 7,027
Visit relative 10,632 10,833 10,630 10,663 11,861 11,356 12,942 13,075
Employment 5,737 6,474 6,431 7,161 6,995 6,508 5,825 5,725
Percent 100.0 100.0 100.0 100.0 100.0 100.0 100.0 100.0
Business 20.1 19.1 20.2 20.9 17.1 17.0 14.9 14.5
Tourist 20.0 20.0 21.1 21.1 22.6 24.6 24.9 23.3
Visit relative 38.9 38.1 36.6 34.7 37.9 37.1 41.5 43.3
Employment 21.0 22.8 22.1 23.3 22.4 21.3 18.7 18.9
SOURCE: Department of Legal Affairs, Immigration Office. Table 7.3. BUSINESS ARRIVALS BY MONTH: 2005 TO 2012
Month 2012 2011 2010 2009 2008 2007 2006 2005
Total 5,570 5,414 5,873 6,407 5,337 5,214 4,643 4,394
January 357 394 550 431 427 353 313 287
February 371 503 431 430 490 393 335 372
March 477 536 525 533 454 594 424 424
April 603 393 634 582 419 467 354 404
May 357 482 459 351 362 366 390 339
June 647 492 513 481 456 533 536 353
July 598 529 637 528 755 446 414 532
August 543 504 481 603 410 578 403 399
September 360 395 431 559 379 461 327 330
October 402 443 405 982 493 349 394 386
November 547 388 405 546 389 435 393 311
December 308 355 402 381 303 239 360 257
SOURCE: Department of Legal Affairs, Immigration Office.
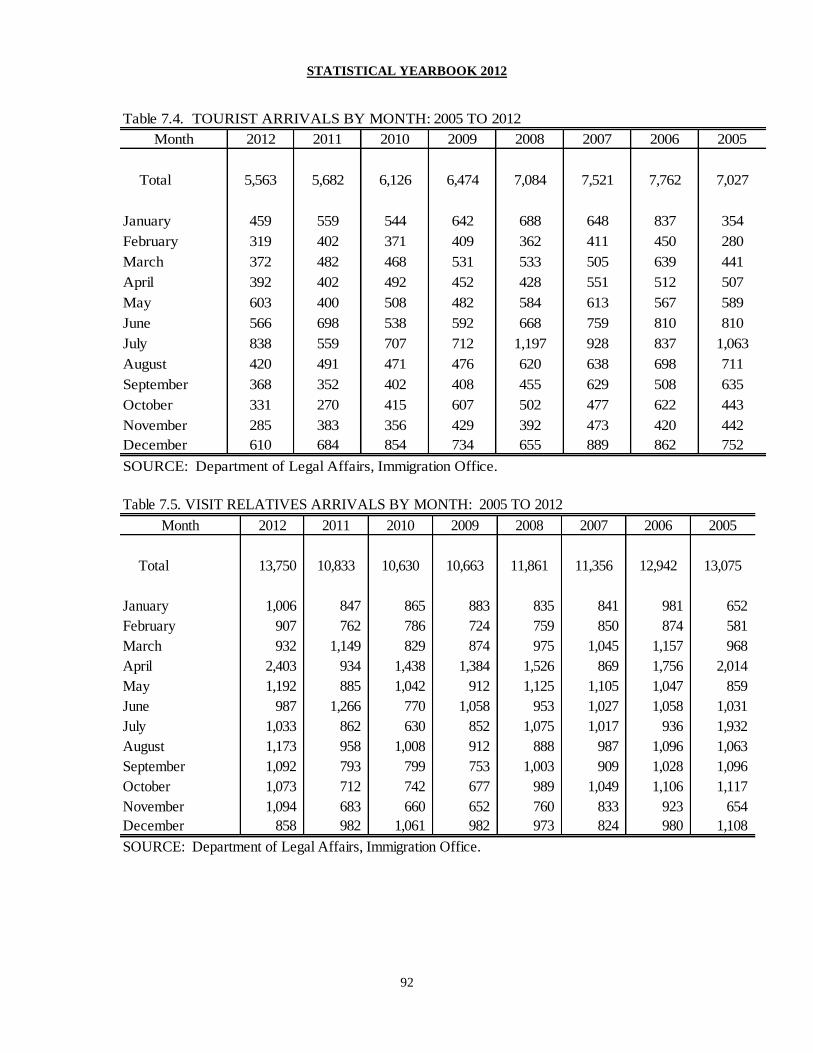
STATISTICAL YEARBOOK 2012
92
Table 7.4. TOURIST ARRIVALS BY MONTH: 2005 TO 2012
Month 2012 2011 2010 2009 2008 2007 2006 2005
Total 5,563 5,682 6,126 6,474 7,084 7,521 7,762 7,027
January 459 559 544 642 688 648 837 354
February 319 402 371 409 362 411 450 280
March 372 482 468 531 533 505 639 441
April 392 402 492 452 428 551 512 507
May 603 400 508 482 584 613 567 589
June 566 698 538 592 668 759 810 810
July 838 559 707 712 1,197 928 837 1,063
August 420 491 471 476 620 638 698 711
September 368 352 402 408 455 629 508 635
October 331 270 415 607 502 477 622 443
November 285 383 356 429 392 473 420 442
December 610 684 854 734 655 889 862 752
SOURCE: Department of Legal Affairs, Immigration Office.
Table 7.5. VISIT RELATIVES ARRIVALS BY MONTH: 2005 TO 2012
Month 2012 2011 2010 2009 2008 2007 2006 2005
Total 13,750 10,833 10,630 10,663 11,861 11,356 12,942 13,075
January 1,006 847 865 883 835 841 981 652
February 907 762 786 724 759 850 874 581
March 932 1,149 829 874 975 1,045 1,157 968
April 2,403 934 1,438 1,384 1,526 869 1,756 2,014
May 1,192 885 1,042 912 1,125 1,105 1,047 859
June 987 1,266 770 1,058 953 1,027 1,058 1,031
July 1,033 862 630 852 1,075 1,017 936 1,932
August 1,173 958 1,008 912 888 987 1,096 1,063
September 1,092 793 799 753 1,003 909 1,028 1,096
October 1,073 712 742 677 989 1,049 1,106 1,117
November 1,094 683 660 652 760 833 923 654
December 858 982 1,061 982 973 824 980 1,108
SOURCE: Department of Legal Affairs, Immigration Office.
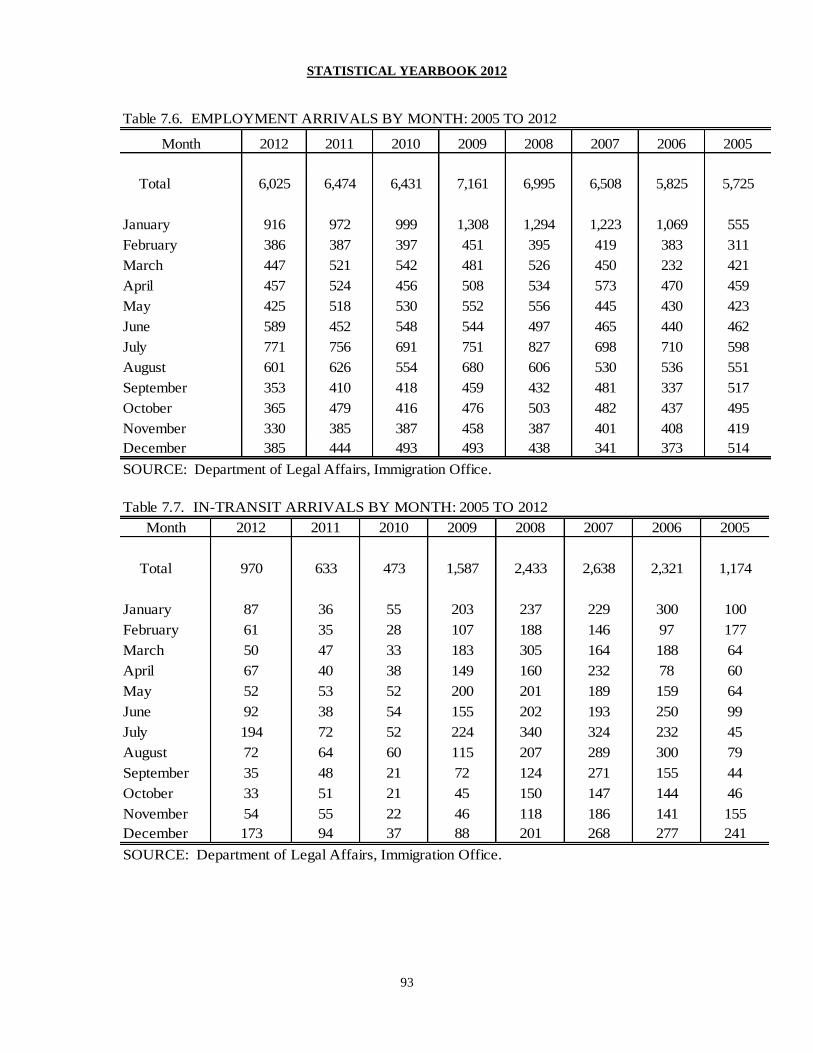
STATISTICAL YEARBOOK 2012
93
Table 7.6. EMPLOYMENT ARRIVALS BY MONTH: 2005 TO 2012
Month 2012 2011 2010 2009 2008 2007 2006 2005
Total 6,025 6,474 6,431 7,161 6,995 6,508 5,825 5,725
January 916 972 999 1,308 1,294 1,223 1,069 555
February 386 387 397 451 395 419 383 311
March 447 521 542 481 526 450 232 421
April 457 524 456 508 534 573 470 459
May 425 518 530 552 556 445 430 423
June 589 452 548 544 497 465 440 462
July 771 756 691 751 827 698 710 598
August 601 626 554 680 606 530 536 551
September 353 410 418 459 432 481 337 517
October 365 479 416 476 503 482 437 495
November 330 385 387 458 387 401 408 419
December 385 444 493 493 438 341 373 514
SOURCE: Department of Legal Affairs, Immigration Office.
Table 7.7. IN-TRANSIT ARRIVALS BY MONTH: 2005 TO 2012
Month 2012 2011 2010 2009 2008 2007 2006 2005
Total 970 633 473 1,587 2,433 2,638 2,321 1,174
January 87 36 55 203 237 229 300 100
February 61 35 28 107 188 146 97 177
March 50 47 33 183 305 164 188 64
April 67 40 38 149 160 232 78 60
May 52 53 52 200 201 189 159 64
June 92 38 54 155 202 193 250 99
July 194 72 52 224 340 324 232 45
August 72 64 60 115 207 289 300 79
September 35 48 21 72 124 271 155 44
October 33 51 21 45 150 147 144 46
November 54 55 22 46 118 186 141 155
December 173 94 37 88 201 268 277 241
SOURCE: Department of Legal Affairs, Immigration Office.
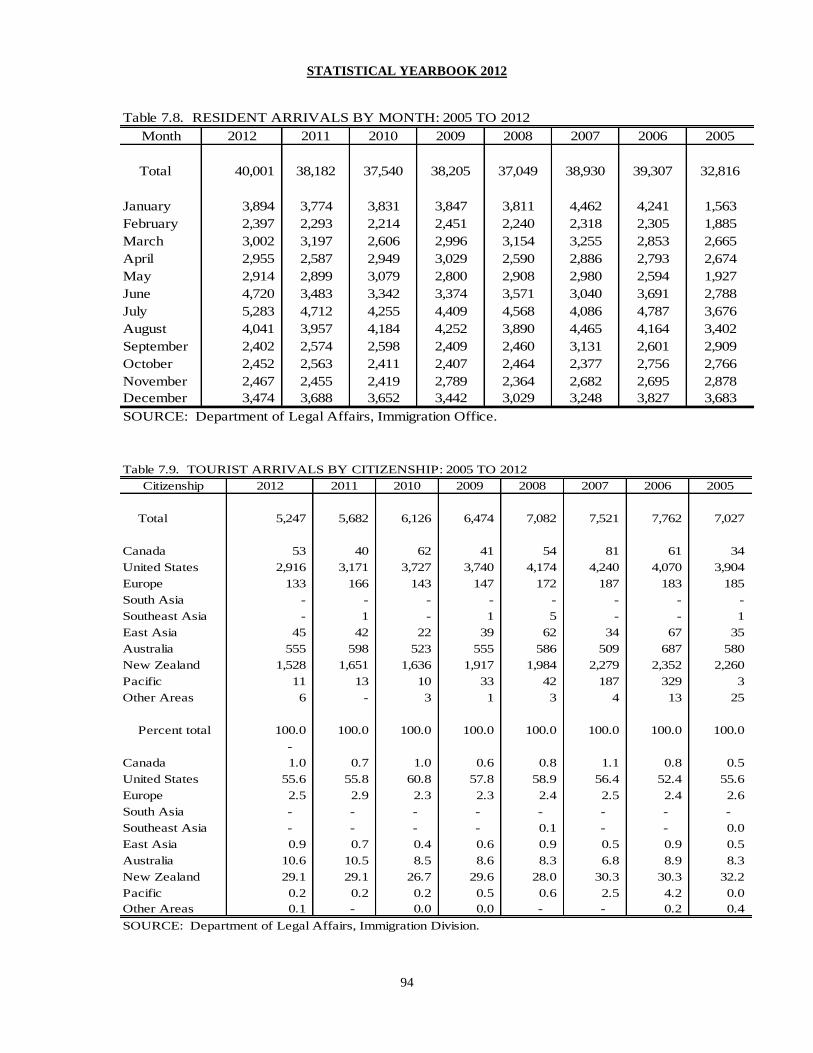
STATISTICAL YEARBOOK 2012
94
Table 7.8. RESIDENT ARRIVALS BY MONTH: 2005 TO 2012
Month 2012 2011 2010 2009 2008 2007 2006 2005
Total 40,001 38,182 37,540 38,205 37,049 38,930 39,307 32,816
January 3,894 3,774 3,831 3,847 3,811 4,462 4,241 1,563
February 2,397 2,293 2,214 2,451 2,240 2,318 2,305 1,885
March 3,002 3,197 2,606 2,996 3,154 3,255 2,853 2,665
April 2,955 2,587 2,949 3,029 2,590 2,886 2,793 2,674
May 2,914 2,899 3,079 2,800 2,908 2,980 2,594 1,927
June 4,720 3,483 3,342 3,374 3,571 3,040 3,691 2,788
July 5,283 4,712 4,255 4,409 4,568 4,086 4,787 3,676
August 4,041 3,957 4,184 4,252 3,890 4,465 4,164 3,402
September 2,402 2,574 2,598 2,409 2,460 3,131 2,601 2,909
October 2,452 2,563 2,411 2,407 2,464 2,377 2,756 2,766
November 2,467 2,455 2,419 2,789 2,364 2,682 2,695 2,878
December 3,474 3,688 3,652 3,442 3,029 3,248 3,827 3,683
SOURCE: Department of Legal Affairs, Immigration Office.
Table 7.9. TOURIST ARRIVALS BY CITIZENSHIP: 2005 TO 2012
Citizenship 2012 2011 2010 2009 2008 2007 2006 2005
Total 5,247 5,682 6,126 6,474 7,082 7,521 7,762 7,027
Canada 53 40 62 41 54 81 61 34
United States 2,916 3,171 3,727 3,740 4,174 4,240 4,070 3,904
Europe 133 166 143 147 172 187 183 185
South Asia - - - - - - - -
Southeast Asia - 1 - 1 5 - - 1
East Asia 45 42 22 39 62 34 67 35
Australia 555 598 523 555 586 509 687 580
New Zealand 1,528 1,651 1,636 1,917 1,984 2,279 2,352 2,260
Pacific 11 13 10 33 42 187 329 3
Other Areas 6 - 3 1 3 4 13 25
Percent total 100.0 100.0 100.0 100.0 100.0 100.0 100.0 100.0
-
Canada 1.0 0.7 1.0 0.6 0.8 1.1 0.8 0.5
United States 55.6 55.8 60.8 57.8 58.9 56.4 52.4 55.6
Europe 2.5 2.9 2.3 2.3 2.4 2.5 2.4 2.6
South Asia - - - - - - - -
Southeast Asia - - - - 0.1 - - 0.0
East Asia 0.9 0.7 0.4 0.6 0.9 0.5 0.9 0.5
Australia 10.6 10.5 8.5 8.6 8.3 6.8 8.9 8.3
New Zealand 29.1 29.1 26.7 29.6 28.0 30.3 30.3 32.2
Pacific 0.2 0.2 0.2 0.5 0.6 2.5 4.2 0.0
Other Areas 0.1 - 0.0 0.0 - - 0.2 0.4
SOURCE: Department of Legal Affairs, Immigration Division.
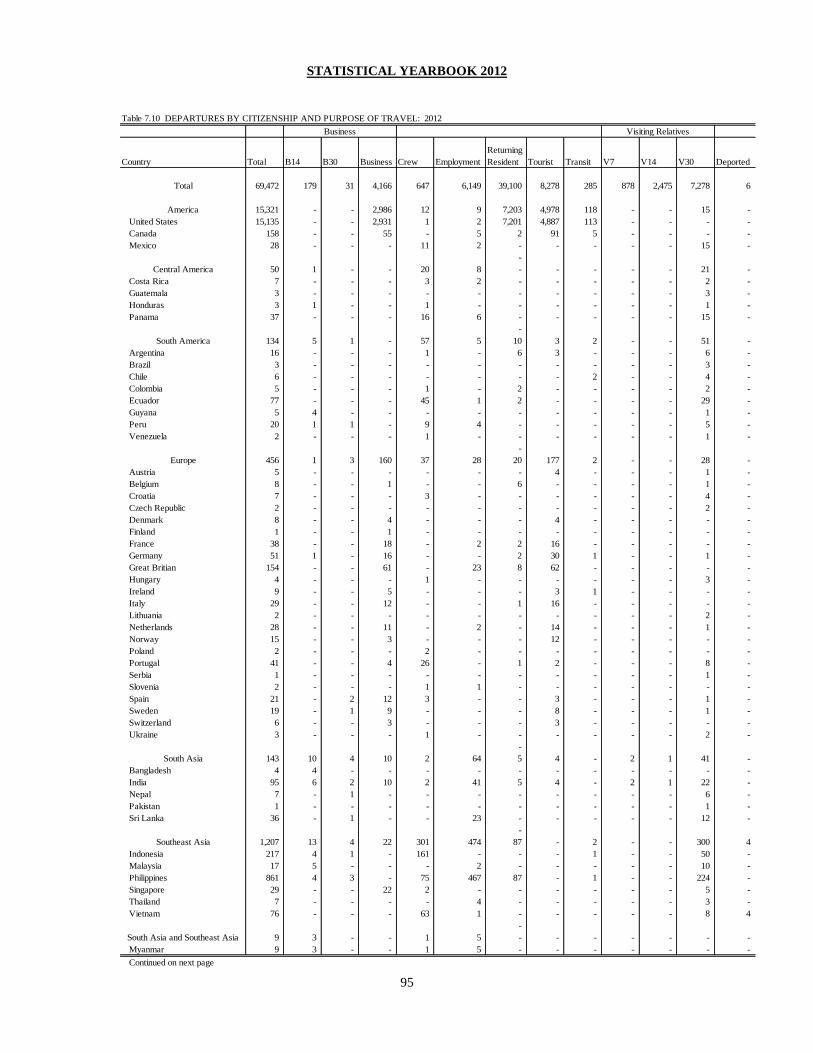
STATISTICAL YEARBOOK 2012
95
Table 7.10 DEPARTURES BY CITIZENSHIP AND PURPOSE OF TRAVEL: 2012
Country Total B14 B30 Business Crew Employment
Returning
Resident Tourist Transit V7 V14 V30 Deported
Total 69,472 179 31 4,166 647 6,149 39,100 8,278 285 878 2,475 7,278 6
America 15,321 - - 2,986 12 9 7,203 4,978 118 - - 15 -
United States 15,135 - - 2,931 1 2 7,201 4,887 113 - - - -
Canada 158 - - 55 - 5 2 91 5 - - - -
Mexico 28 - - - 11 2 - - - - - 15 -
-
Central America 50 1 - - 20 8 - - - - - 21 -
Costa Rica 7 - - - 3 2 - - - - - 2 -
Guatemala 3 - - - - - - - - - - 3 -
Honduras 3 1 - - 1 - - - - - - 1 -
Panama 37 - - - 16 6 - - - - - 15 -
-
South America 134 5 1 - 57 5 10 3 2 - - 51 -
Argentina 16 - - - 1 - 6 3 - - - 6 -
Brazil 3 - - - - - - - - - - 3 -
Chile 6 - - - - - - - 2 - - 4 -
Colombia 5 - - - 1 - 2 - - - - 2 -
Ecuador 77 - - - 45 1 2 - - - - 29 -
Guyana 5 4 - - - - - - - - - 1 -
Peru 20 1 1 - 9 4 - - - - - 5 -
Venezuela 2 - - - 1 - - - - - - 1 -
-
Europe 456 1 3 160 37 28 20 177 2 - - 28 -
Austria 5 - - - - - - 4 - - - 1 -
Belgium 8 - - 1 - - 6 - - - - 1 -
Croatia 7 - - - 3 - - - - - - 4 -
Czech Republic 2 - - - - - - - - - - 2 -
Denmark 8 - - 4 - - - 4 - - - - -
Finland 1 - - 1 - - - - - - - - -
France 38 - - 18 - 2 2 16 - - - - -
Germany 51 1 - 16 - - 2 30 1 - - 1 -
Great Britian 154 - - 61 - 23 8 62 - - - - -
Hungary 4 - - - 1 - - - - - - 3 -
Ireland 9 - - 5 - - - 3 1 - - - -
Italy 29 - - 12 - - 1 16 - - - - -
Lithuania 2 - - - - - - - - - - 2 -
Netherlands 28 - - 11 - 2 - 14 - - - 1 -
Norway 15 - - 3 - - - 12 - - - - -
Poland 2 - - - 2 - - - - - - - -
Portugal 41 - - 4 26 - 1 2 - - - 8 -
Serbia 1 - - - - - - - - - - 1 -
Slovenia 2 - - - 1 1 - - - - - - -
Spain 21 - 2 12 3 - - 3 - - - 1 -
Sweden 19 - 1 9 - - - 8 - - - 1 -
Switzerland 6 - - 3 - - - 3 - - - - -
Ukraine 3 - - - 1 - - - - - - 2 -
-
South Asia 143 10 4 10 2 64 5 4 - 2 1 41 -
Bangladesh 4 4 - - - - - - - - - - -
India 95 6 2 10 2 41 5 4 - 2 1 22 -
Nepal 7 - 1 - - - - - - - - 6 -
Pakistan 1 - - - - - - - - - - 1 -
Sri Lanka 36 - 1 - - 23 - - - - - 12 -
-
Southeast Asia 1,207 13 4 22 301 474 87 - 2 - - 300 4
Indonesia 217 4 1 - 161 - - - 1 - - 50 -
Malaysia 17 5 - - - 2 - - - - - 10 -
Philippines 861 4 3 - 75 467 87 - 1 - - 224 -
Singapore 29 - - 22 2 - - - - - - 5 -
Thailand 7 - - - - 4 - - - - - 3 -
Vietnam 76 - - - 63 1 - - - - - 8 4
-
South Asia and Southeast Asia 9 3 - - 1 5 - - - - - - -
Myanmar 9 3 - - 1 5 - - - - - - -
Continued on next page
Business Visiting Relatives
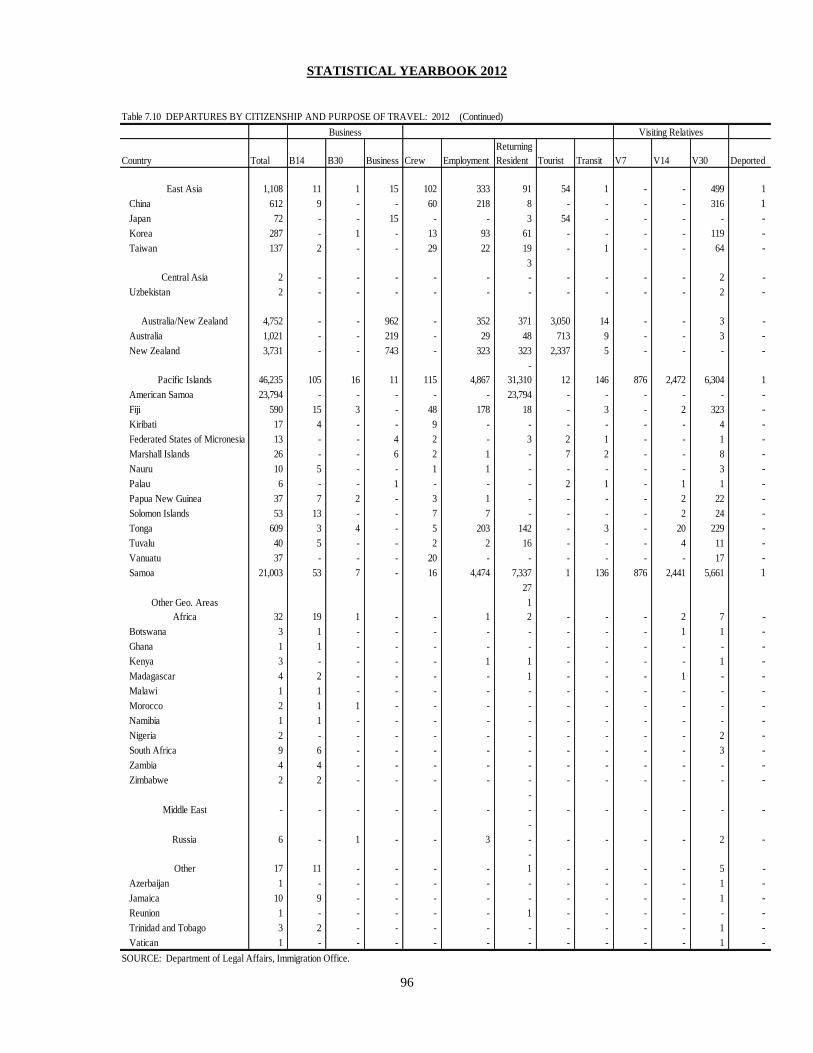
STATISTICAL YEARBOOK 2012
96
Table 7.10 DEPARTURES BY CITIZENSHIP AND PURPOSE OF TRAVEL: 2012 (Continued)
Country Total B14 B30 Business Crew Employment
Returning
Resident Tourist Transit V7 V14 V30 Deported
East Asia 1,108 11 1 15 102 333 91 54 1 - - 499 1
China 612 9 - - 60 218 8 - - - - 316 1
Japan 72 - - 15 - - 3 54 - - - - -
Korea 287 - 1 - 13 93 61 - - - - 119 -
Taiwan 137 2 - - 29 22 19 - 1 - - 64 -
3
Central Asia 2 - - - - - - - - - - 2 -
Uzbekistan 2 - - - - - - - - - - 2 -
Australia/New Zealand 4,752 - - 962 - 352 371 3,050 14 - - 3 -
Australia 1,021 - - 219 - 29 48 713 9 - - 3 -
New Zealand 3,731 - - 743 - 323 323 2,337 5 - - - -
-
Pacific Islands 46,235 105 16 11 115 4,867 31,310 12 146 876 2,472 6,304 1
American Samoa 23,794 - - - - - 23,794 - - - - - -
Fiji 590 15 3 - 48 178 18 - 3 - 2 323 -
Kiribati 17 4 - - 9 - - - - - - 4 -
Federated States of Micronesia 13 - - 4 2 - 3 2 1 - - 1 -
Marshall Islands 26 - - 6 2 1 - 7 2 - - 8 -
Nauru 10 5 - - 1 1 - - - - - 3 -
Palau 6 - - 1 - - - 2 1 - 1 1 -
Papua New Guinea 37 7 2 - 3 1 - - - - 2 22 -
Solomon Islands 53 13 - - 7 7 - - - - 2 24 -
Tonga 609 3 4 - 5 203 142 - 3 - 20 229 -
Tuvalu 40 5 - - 2 2 16 - - - 4 11 -
Vanuatu 37 - - - 20 - - - - - - 17 -
Samoa 21,003 53 7 - 16 4,474 7,337 1 136 876 2,441 5,661 1
27
Other Geo. Areas 1
Africa 32 19 1 - - 1 2 - - - 2 7 -
Botswana 3 1 - - - - - - - - 1 1 -
Ghana 1 1 - - - - - - - - - - -
Kenya 3 - - - - 1 1 - - - - 1 -
Madagascar 4 2 - - - - 1 - - - 1 - -
Malawi 1 1 - - - - - - - - - - -
Morocco 2 1 1 - - - - - - - - - -
Namibia 1 1 - - - - - - - - - - -
Nigeria 2 - - - - - - - - - - 2 -
South Africa 9 6 - - - - - - - - - 3 -
Zambia 4 4 - - - - - - - - - - -
Zimbabwe 2 2 - - - - - - - - - - -
-
Middle East - - - - - - - - - - - - -
-
Russia 6 - 1 - - 3 - - - - - 2 -
-
Other 17 11 - - - - 1 - - - - 5 -
Azerbaijan 1 - - - - - - - - - - 1 -
Jamaica 10 9 - - - - - - - - - 1 -
Reunion 1 - - - - - 1 - - - - - -
Trinidad and Tobago 3 2 - - - - - - - - - 1 -
Vatican 1 - - - - - - - - - - 1 -
SOURCE: Department of Legal Affairs, Immigration Office.
Business Visiting Relatives
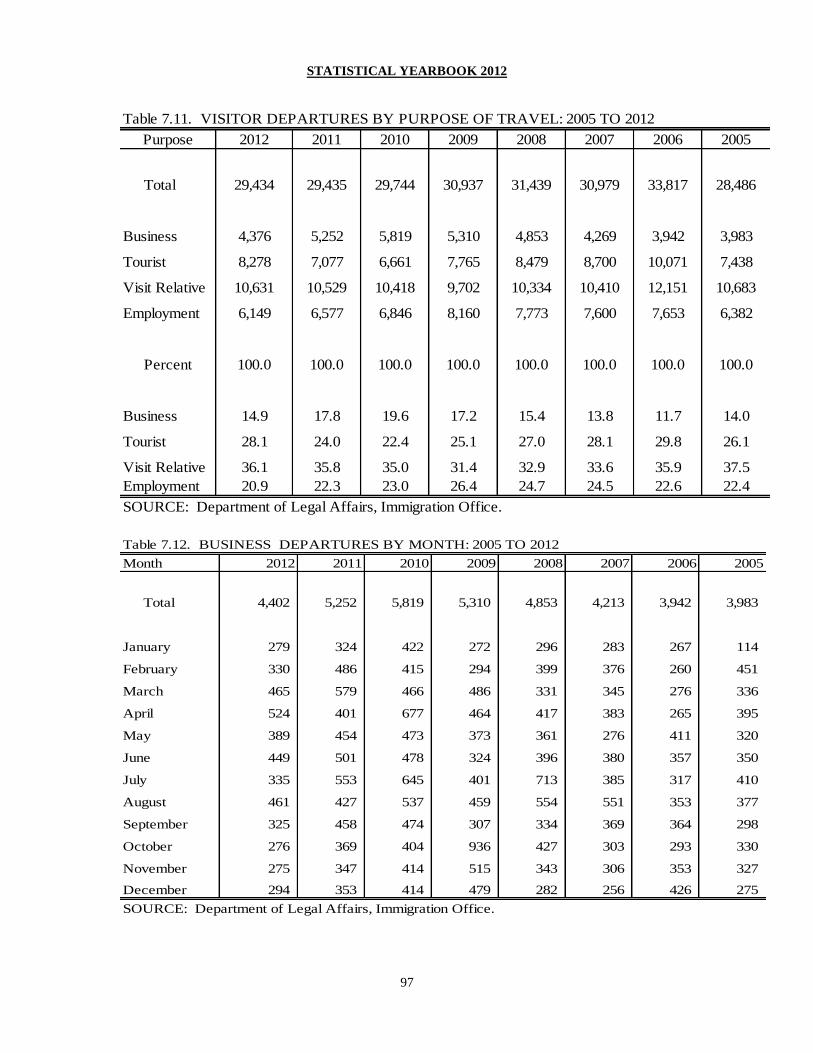
STATISTICAL YEARBOOK 2012
97
Table 7.11. VISITOR DEPARTURES BY PURPOSE OF TRAVEL: 2005 TO 2012
Purpose 2012 2011 2010 2009 2008 2007 2006 2005
Total 29,434 29,435 29,744 30,937 31,439 30,979 33,817 28,486
Business 4,376 5,252 5,819 5,310 4,853 4,269 3,942 3,983
Tourist 8,278 7,077 6,661 7,765 8,479 8,700 10,071 7,438
Visit Relative 10,631 10,529 10,418 9,702 10,334 10,410 12,151 10,683
Employment 6,149 6,577 6,846 8,160 7,773 7,600 7,653 6,382
Percent 100.0 100.0 100.0 100.0 100.0 100.0 100.0 100.0
Business 14.9 17.8 19.6 17.2 15.4 13.8 11.7 14.0
Tourist 28.1 24.0 22.4 25.1 27.0 28.1 29.8 26.1
Visit Relative 36.1 35.8 35.0 31.4 32.9 33.6 35.9 37.5
Employment 20.9 22.3 23.0 26.4 24.7 24.5 22.6 22.4
SOURCE: Department of Legal Affairs, Immigration Office. Table 7.12. BUSINESS DEPARTURES BY MONTH: 2005 TO 2012
Month 2012 2011 2010 2009 2008 2007 2006 2005
Total 4,402 5,252 5,819 5,310 4,853 4,213 3,942 3,983
January 279 324 422 272 296 283 267 114
February 330 486 415 294 399 376 260 451
March 465 579 466 486 331 345 276 336
April 524 401 677 464 417 383 265 395
May 389 454 473 373 361 276 411 320
June 449 501 478 324 396 380 357 350
July 335 553 645 401 713 385 317 410
August 461 427 537 459 554 551 353 377
September 325 458 474 307 334 369 364 298
October 276 369 404 936 427 303 293 330
November 275 347 414 515 343 306 353 327
December 294 353 414 479 282 256 426 275
SOURCE: Department of Legal Affairs, Immigration Office.
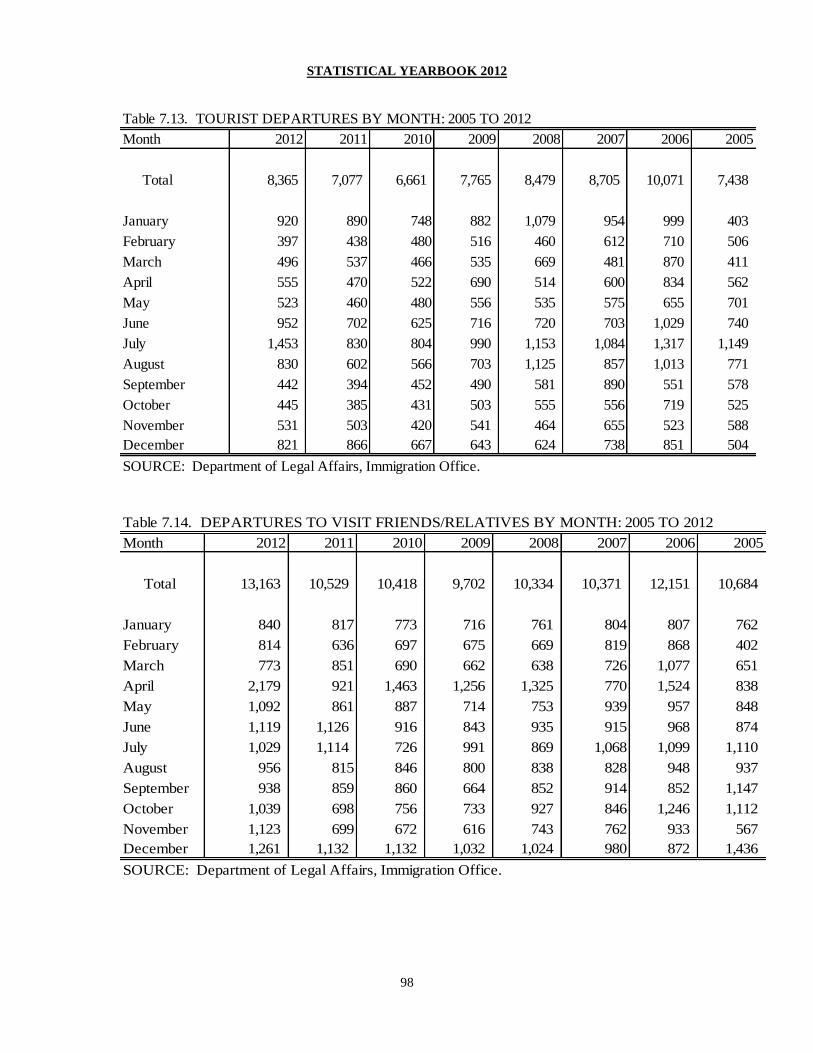
STATISTICAL YEARBOOK 2012
98
Table 7.13. TOURIST DEPARTURES BY MONTH: 2005 TO 2012
Month 2012 2011 2010 2009 2008 2007 2006 2005
Total 8,365 7,077 6,661 7,765 8,479 8,705 10,071 7,438
January 920 890 748 882 1,079 954 999 403
February 397 438 480 516 460 612 710 506
March 496 537 466 535 669 481 870 411
April 555 470 522 690 514 600 834 562
May 523 460 480 556 535 575 655 701
June 952 702 625 716 720 703 1,029 740
July 1,453 830 804 990 1,153 1,084 1,317 1,149
August 830 602 566 703 1,125 857 1,013 771
September 442 394 452 490 581 890 551 578
October 445 385 431 503 555 556 719 525
November 531 503 420 541 464 655 523 588
December 821 866 667 643 624 738 851 504
SOURCE: Department of Legal Affairs, Immigration Office.
Table 7.14. DEPARTURES TO VISIT FRIENDS/RELATIVES BY MONTH: 2005 TO 2012
Month 2012 2011 2010 2009 2008 2007 2006 2005
Total 13,163 10,529 10,418 9,702 10,334 10,371 12,151 10,684
January 840 817 773 716 761 804 807 762
February 814 636 697 675 669 819 868 402
March 773 851 690 662 638 726 1,077 651
April 2,179 921 1,463 1,256 1,325 770 1,524 838
May 1,092 861 887 714 753 939 957 848
June 1,119 1,126 916 843 935 915 968 874
July 1,029 1,114 726 991 869 1,068 1,099 1,110
August 956 815 846 800 838 828 948 937
September 938 859 860 664 852 914 852 1,147
October 1,039 698 756 733 927 846 1,246 1,112
November 1,123 699 672 616 743 762 933 567
December 1,261 1,132 1,132 1,032 1,024 980 872 1,436
SOURCE: Department of Legal Affairs, Immigration Office.
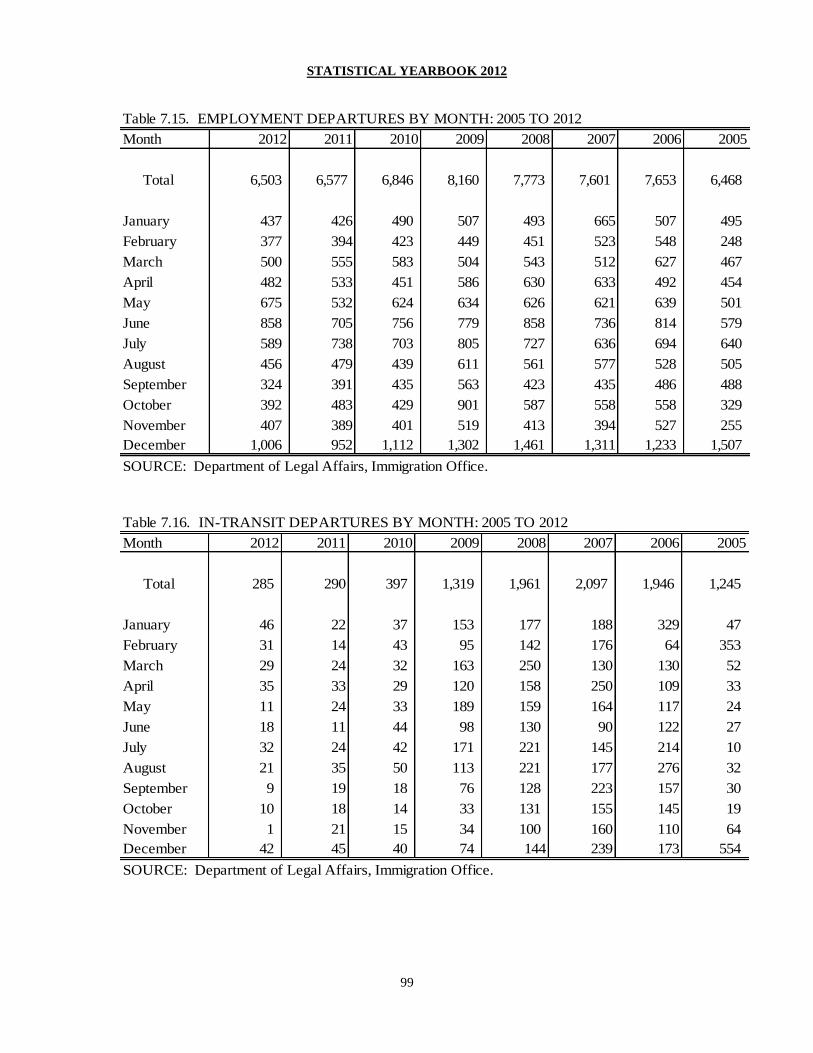
STATISTICAL YEARBOOK 2012
99
Table 7.15. EMPLOYMENT DEPARTURES BY MONTH: 2005 TO 2012
Month 2012 2011 2010 2009 2008 2007 2006 2005
Total 6,503 6,577 6,846 8,160 7,773 7,601 7,653 6,468
January 437 426 490 507 493 665 507 495
February 377 394 423 449 451 523 548 248
March 500 555 583 504 543 512 627 467
April 482 533 451 586 630 633 492 454
May 675 532 624 634 626 621 639 501
June 858 705 756 779 858 736 814 579
July 589 738 703 805 727 636 694 640
August 456 479 439 611 561 577 528 505
September 324 391 435 563 423 435 486 488
October 392 483 429 901 587 558 558 329
November 407 389 401 519 413 394 527 255
December 1,006 952 1,112 1,302 1,461 1,311 1,233 1,507
SOURCE: Department of Legal Affairs, Immigration Office.
Table 7.16. IN-TRANSIT DEPARTURES BY MONTH: 2005 TO 2012
Month 2012 2011 2010 2009 2008 2007 2006 2005
Total 285 290 397 1,319 1,961 2,097 1,946 1,245
January 46 22 37 153 177 188 329 47
February 31 14 43 95 142 176 64 353
March 29 24 32 163 250 130 130 52
April 35 33 29 120 158 250 109 33
May 11 24 33 189 159 164 117 24
June 18 11 44 98 130 90 122 27
July 32 24 42 171 221 145 214 10
August 21 35 50 113 221 177 276 32
September 9 19 18 76 128 223 157 30
October 10 18 14 33 131 155 145 19
November 1 21 15 34 100 160 110 64
December 42 45 40 74 144 239 173 554
SOURCE: Department of Legal Affairs, Immigration Office.
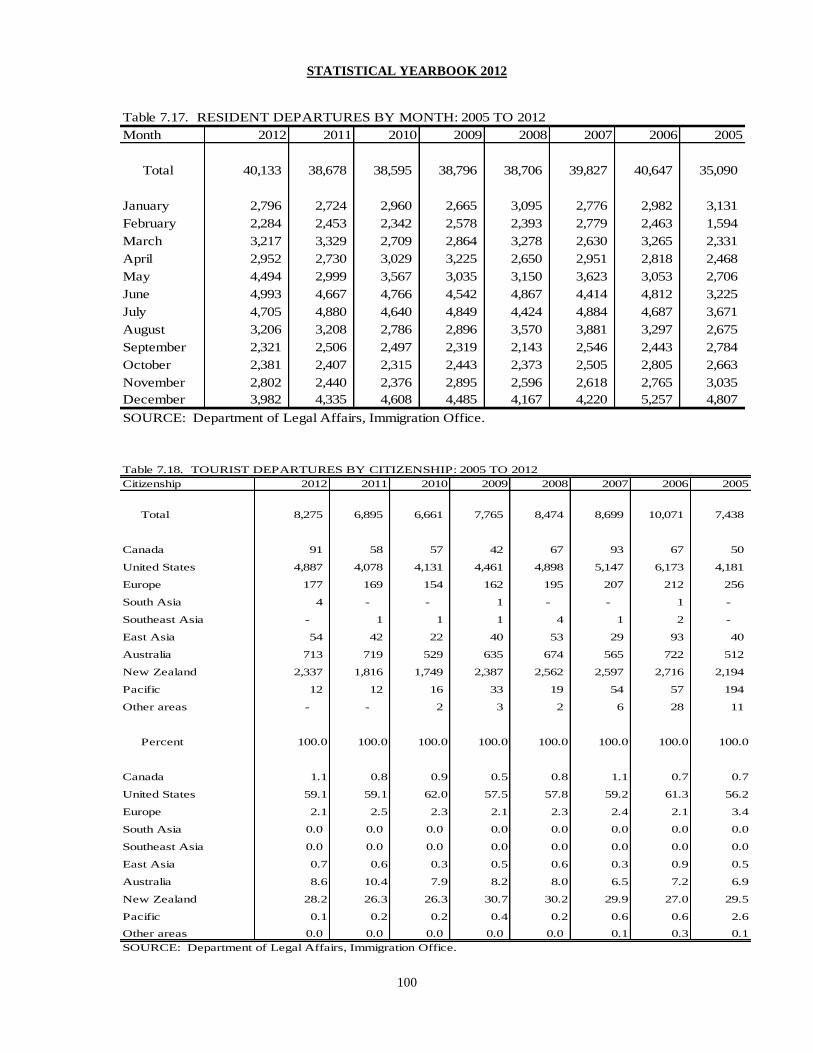
STATISTICAL YEARBOOK 2012
100
Table 7.17. RESIDENT DEPARTURES BY MONTH: 2005 TO 2012
Month 2012 2011 2010 2009 2008 2007 2006 2005
Total 40,133 38,678 38,595 38,796 38,706 39,827 40,647 35,090
January 2,796 2,724 2,960 2,665 3,095 2,776 2,982 3,131
February 2,284 2,453 2,342 2,578 2,393 2,779 2,463 1,594
March 3,217 3,329 2,709 2,864 3,278 2,630 3,265 2,331
April 2,952 2,730 3,029 3,225 2,650 2,951 2,818 2,468
May 4,494 2,999 3,567 3,035 3,150 3,623 3,053 2,706
June 4,993 4,667 4,766 4,542 4,867 4,414 4,812 3,225
July 4,705 4,880 4,640 4,849 4,424 4,884 4,687 3,671
August 3,206 3,208 2,786 2,896 3,570 3,881 3,297 2,675
September 2,321 2,506 2,497 2,319 2,143 2,546 2,443 2,784
October 2,381 2,407 2,315 2,443 2,373 2,505 2,805 2,663
November 2,802 2,440 2,376 2,895 2,596 2,618 2,765 3,035
December 3,982 4,335 4,608 4,485 4,167 4,220 5,257 4,807
SOURCE: Department of Legal Affairs, Immigration Office.
Table 7.18. TOURIST DEPARTURES BY CITIZENSHIP: 2005 TO 2012
Citizenship 2012 2011 2010 2009 2008 2007 2006 2005
Total 8,275 6,895 6,661 7,765 8,474 8,699 10,071 7,438
Canada 91 58 57 42 67 93 67 50
United States 4,887 4,078 4,131 4,461 4,898 5,147 6,173 4,181
Europe 177 169 154 162 195 207 212 256
South Asia 4 - - 1 - - 1 -
Southeast Asia - 1 1 1 4 1 2 -
East Asia 54 42 22 40 53 29 93 40
Australia 713 719 529 635 674 565 722 512
New Zealand 2,337 1,816 1,749 2,387 2,562 2,597 2,716 2,194
Pacific 12 12 16 33 19 54 57 194
Other areas - - 2 3 2 6 28 11
Percent 100.0 100.0 100.0 100.0 100.0 100.0 100.0 100.0
Canada 1.1 0.8 0.9 0.5 0.8 1.1 0.7 0.7
United States 59.1 59.1 62.0 57.5 57.8 59.2 61.3 56.2
Europe 2.1 2.5 2.3 2.1 2.3 2.4 2.1 3.4
South Asia 0.0 0.0 0.0 0.0 0.0 0.0 0.0 0.0
Southeast Asia 0.0 0.0 0.0 0.0 0.0 0.0 0.0 0.0
East Asia 0.7 0.6 0.3 0.5 0.6 0.3 0.9 0.5
Australia 8.6 10.4 7.9 8.2 8.0 6.5 7.2 6.9
New Zealand 28.2 26.3 26.3 30.7 30.2 29.9 27.0 29.5
Pacific 0.1 0.2 0.2 0.4 0.2 0.6 0.6 2.6
Other areas 0.0 0.0 0.0 0.0 0.0 0.1 0.3 0.1
SOURCE: Department of Legal Affairs, Immigration Office.

STATISTICAL YEARBOOK 2012
101
Table 7.19. ANALYSIS OF ARRIVALS AND DEPARTURES BY PURPOSE: 2005 TO 2012
Arri- Depar- Arri- Depar- Arri- Depar- Arri- Depar- Arri- Depar- Arri- Depar- Arri- Depar- Arri- Depar-
Purpose vals tures vals tures vals tures vals tures vals tures vals tures vals tures vals tures
Total 67,979 69,472 67,470 68,833 67,513 69,391 70,848 71,567 72,999 74,499 72,423 73,733 72,800 76,410 64,211 64,908
Business 5,510 4,376 5,414 5,252 5,873 5,819 6,407 5,310 5,337 4,853 5,214 4,269 4,643 3,942 4,394 3,983
Tourist 5,469 8,278 5,682 7,077 6,126 6,661 6,474 7,765 7,084 8,479 7,521 8,700 7,762 10,071 7,027 7,438
Visit relative 10,632 10,631 10,833 10,529 10,630 10,418 10,663 9,702 11,861 10,334 11,356 10,410 12,942 12,151 13,075 10,684
Employment 5,737 6,149 6,474 6,577 6,431 6,846 7,161 8,160 6,995 7,773 6,508 7,600 5,825 7,653 5,725 6,468
In-transit 968 285 633 290 473 397 1,587 1,319 2,433 1,961 2,638 2,099 2,321 1,946 1,174 1,245
Returning residents 39,136 39,100 38,182 38,678 37,540 38,595 38,205 38,796 37,049 38,706 38,930 40,221 39,307 40,647 32,816 35,090
Crew 527 647 252 419 439 562 351 515 496 377 256 434 .. .. .. ..
Deported .. 6 .. 11 1 93 .. .. .. .. .. .. .. .. .. ..
Arts Festival .. .. .. .. .. .. .. .. 1,744 2,016 .. .. .. .. .. ..
SOURCE: Department of Legal Affairs, Immigration Division.
2006 20052012 2011 2010 2009 2008 2007

STATISTICAL YEARBOOK 2012
102
Section Eight
ELECTION
This section presents data on the American Samoa voter registration, election results and
participation by voting districts, village, age and gender of the voting population.
About 17,768 people registered to vote in the 2012 General Election on November 6,
2012. This is an increase from the 2010 General Election. Although this many registered
to vote in the 2012 election, only 13,178 actually voted. The Tualauta voting district
(District #15) cast the most votes with 2,643 (20.1 percent). Ituau (District #12) was
second with 1,723 votes cast (about 13.1 percent) in the General Election.
In the 2012 election, the majority of registered voters were between the ages of 18 and 34
(47.1 percent). About 25.6 percent of registered voters were between the ages of 35 and
49. The 65 and over age group had the least registered voters with 9.9 percent. The 50-
64 age group made up 18.7 percent of registered voters. A total of 6,033 males (45.8
percent) registered to vote while 7,145 females (54.2 percent) registered to vote in the
2012 General Election.

STATISTICAL YEARBOOK 2012
103
Table 8.1. VOTES CAST IN GENERAL ELECTION BY DISTRICT AND
VILLAGE: NOVEMBER 6, 2012
Voting District Votes Voting % Voting District Votes Voting %
and Village Cast by District and Village Cast by District
All ages 13,178 100%
1 Manu'a 753 5.7% 10 Ma'oputasi 317 2.4%
Faleasao 183 Atu'u, Leloaloa 317
Fitiuta 239
Tau 331 11 Ma'oputasi 497 3.8%
Aua 497
2 Manu'a 414 3.1%
Ofu 216 12 Ituau 1,723 13.1%
Olosega, Sili 198 Fagasa 282
Matu'u, Faganeanea 154
3 Vaifanua 694 5.3% Nu'uuli 1,287
Alao 164
Aoa 132 13 Fofo 1,001 7.6%
Tula, Onenoa 184 Leone 1,001
Vatia 214
14 Alataua 505 3.8%
4 Sa'ole 501 3.8% Agagugu, Amanave, Fa'ilolo 87
Alofau 125 Amaluia, Afao, Asili, Atauloma 126
Amouli, Auasi, Utumea 181 Nua, Se'etaga 132
Aunu'u 195 Poloa, Fagalii, Fagamalo 160
5 Sua I 564 4.3% 15 Tualauta 2,643 20.1%
Alega, Amaua, Auto, Avaio 120 Faleniu, Mapusaga, Mesepa 439
Fagaitua 173 Ili'ili 460
Laulii 271 Pavaiai 433
Tafuna 845
6 Sua II 415 3.1% Vaitogi 466
Afono 169
Masausi, Sailele 75 16 Tualatai 740 5.6%
Masefau 171 Futiga, Malaeloa-Ituau 250
Taputimu 166
7 Ma'oputasi 521 4.0% Vailoatai 324
Faga'alu, Fatumafuti 277
Utulei, Gataivai 244 17 Aitulagi 506 3.8%
Aasu, Aoloau 365
8 Ma'oputasi 524 4.0% Malaeloa-Aitulagi 141
Fagatogo 524
18 Swains Island 4 0.0%
9 Ma'oputasi 856 6.5%
Pago Pago 856
SOURCE: Election Office

STATISTICAL YEARBOOK 2012
104
Table 8.2. REGISTERED VOTERS AND VOTES CAST IN GENERAL ELECTION
BY DISTRICT: 2008, 2010 AND 2012
2012
Voting Registered Votes Percent Registered Votes Percent Registered Votes Percent
District Voters Cast Voted Voters Cast Voted Voters Cast Voted
Total 17,768 13,178 74 16,124 11,019 68 16,780 12,419 74
1 Manu'a 1,005 753 75 985 760 77 1,027 794 77
2 Manu'a 528 414 78 493 410 83 506 425 84
3 Vaifanua 948 694 73 860 616 72 905 659 73
4 Sa'ole 619 501 81 571 409 72 638 489 77
5 Sua I 769 564 73 707 486 69 735 558 76
6 Sua II 535 415 78 487 366 75 493 377 76
7 Ma'oputasi 671 521 78 657 452 69 700 502 72
8 Ma'oputasi 723 524 72 682 497 73 705 521 74
9 Ma'oputasi 1,179 856 73 1,104 723 65 1,163 871 75
10 Ma'oputasi 445 317 71 433 319 74 418 311 74
11 Ma'oputasi 665 497 75 639 461 72 671 504 75
12 Itu'au 2,346 1,723 73 2,096 1,477 70 2,147 1,590 74
13 Fofo 1,346 1,001 74 1,264 937 74 1,271 970 76
14 Alataua 700 505 72 655 461 70 693 501 72
15 Tualauta 3,558 2,643 74 2,887 1,540 53 3,038 2,164 71
16 Tualatai 1,053 740 70 959 669 70 955 684 72
17 Aitulagi 670 506 76 636 429 67 706 493 70
Swains Island 8 4 50 9 7 78 9 6 67
SOURCE: Election Office
2010 2008
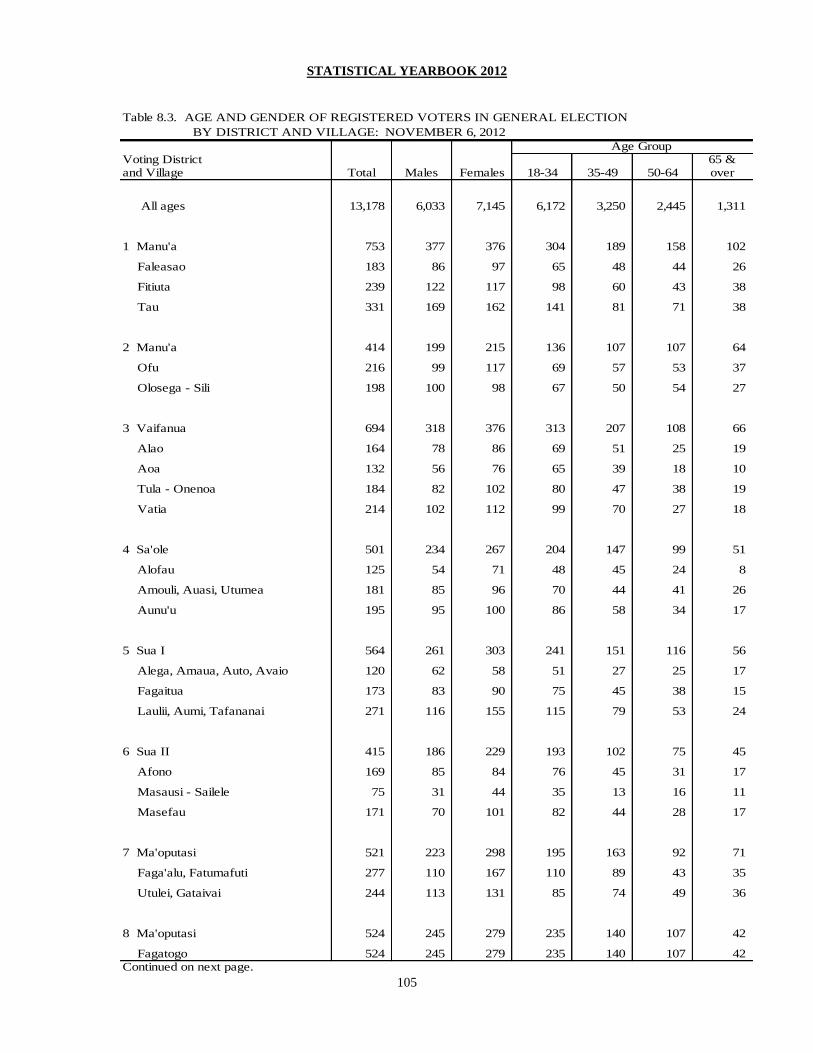
STATISTICAL YEARBOOK 2012
105
Table 8.3. AGE AND GENDER OF REGISTERED VOTERS IN GENERAL ELECTION
BY DISTRICT AND VILLAGE: NOVEMBER 6, 2012
Voting District 65 &and Village Total Males Females 18-34 35-49 50-64 over
All ages 13,178 6,033 7,145 6,172 3,250 2,445 1,311
1 Manu'a 753 377 376 304 189 158 102
Faleasao 183 86 97 65 48 44 26
Fitiuta 239 122 117 98 60 43 38
Tau 331 169 162 141 81 71 38
2 Manu'a 414 199 215 136 107 107 64
Ofu 216 99 117 69 57 53 37
Olosega - Sili 198 100 98 67 50 54 27
3 Vaifanua 694 318 376 313 207 108 66
Alao 164 78 86 69 51 25 19
Aoa 132 56 76 65 39 18 10
Tula - Onenoa 184 82 102 80 47 38 19
Vatia 214 102 112 99 70 27 18
4 Sa'ole 501 234 267 204 147 99 51
Alofau 125 54 71 48 45 24 8
Amouli, Auasi, Utumea 181 85 96 70 44 41 26
Aunu'u 195 95 100 86 58 34 17
5 Sua I 564 261 303 241 151 116 56
Alega, Amaua, Auto, Avaio 120 62 58 51 27 25 17
Fagaitua 173 83 90 75 45 38 15
Laulii, Aumi, Tafananai 271 116 155 115 79 53 24
6 Sua II 415 186 229 193 102 75 45
Afono 169 85 84 76 45 31 17
Masausi - Sailele 75 31 44 35 13 16 11
Masefau 171 70 101 82 44 28 17
7 Ma'oputasi 521 223 298 195 163 92 71
Faga'alu, Fatumafuti 277 110 167 110 89 43 35
Utulei, Gataivai 244 113 131 85 74 49 36
8 Ma'oputasi 524 245 279 235 140 107 42
Fagatogo 524 245 279 235 140 107 42 Continued on next page.
Age Group

STATISTICAL YEARBOOK 2012
106
Table 8.3. AGE AND GENDER OF REGISTERED VOTERS IN GENERAL ELECTION
BY DISTRICT AND VILLAGE: NOVEMBER 6, 2012 (continued)
Age GroupVoting District 65 &and Village Total Males Females 18-34 35-49 50-64 over
9 Ma'oputasi 856 379 477 395 231 148 82
Pago Pago 856 379 477 395 231 148 82
10 Ma'oputasi 317 150 167 162 76 47 32
Atu'u - Leloaloa - Satala 317 150 167 162 76 47 32
11 Ma'oputasi 497 207 290 226 139 79 53
Aua 497 207 290 226 139 79 53
12 Ituau 1,723 772 951 825 429 313 156
Fagasa 282 121 161 117 79 61 25
Matu'u, Faganeanea 154 71 83 64 46 27 17
Nu'uuli 1,287 580 707 644 304 225 114
13 Fofo 1,001 444 557 424 244 230 103
Leone 1,001 444 557 424 244 230 103
14 Alataua 505 243 262 253 112 90 50
Agagulu, Fa'ilolo, Amanave 87 34 53 50 13 16 8
Amaluia, Afao, Asili, Atauloma 126 66 60 56 34 25 11
Nua, Se'etaga 132 70 62 60 32 21 19
Poloa, Fagali'i, Malota, Fagamalo 160 73 87 87 33 28 12
15 Tualauta 2,643 1,191 1,452 1,454 514 436 239
Faleniu, Mapusaga, Mesepa 439 200 239 264 75 65 35
Ili'ili 460 208 252 215 93 94 58
Pavaia'i 433 202 231 214 110 69 40
Tafuna 845 356 489 528 136 125 56
Vaitogi 466 225 241 233 100 83 50
16 Tualatai 740 351 389 364 168 155 53
Futiga, Malaeloa, Itu'au 250 115 135 130 56 44 20
Taputimu 166 85 81 89 26 40 11
Vailoatai 324 151 173 145 86 71 22
17 Aitulagi 506 251 255 247 131 82 46
Aasu, Aoloau 365 182 183 175 90 60 40
Malaeloa, Aitulagi 141 69 72 72 41 22 6
18 Swains Island 4 2 2 1 - 3 -
SOURCE: Election Office
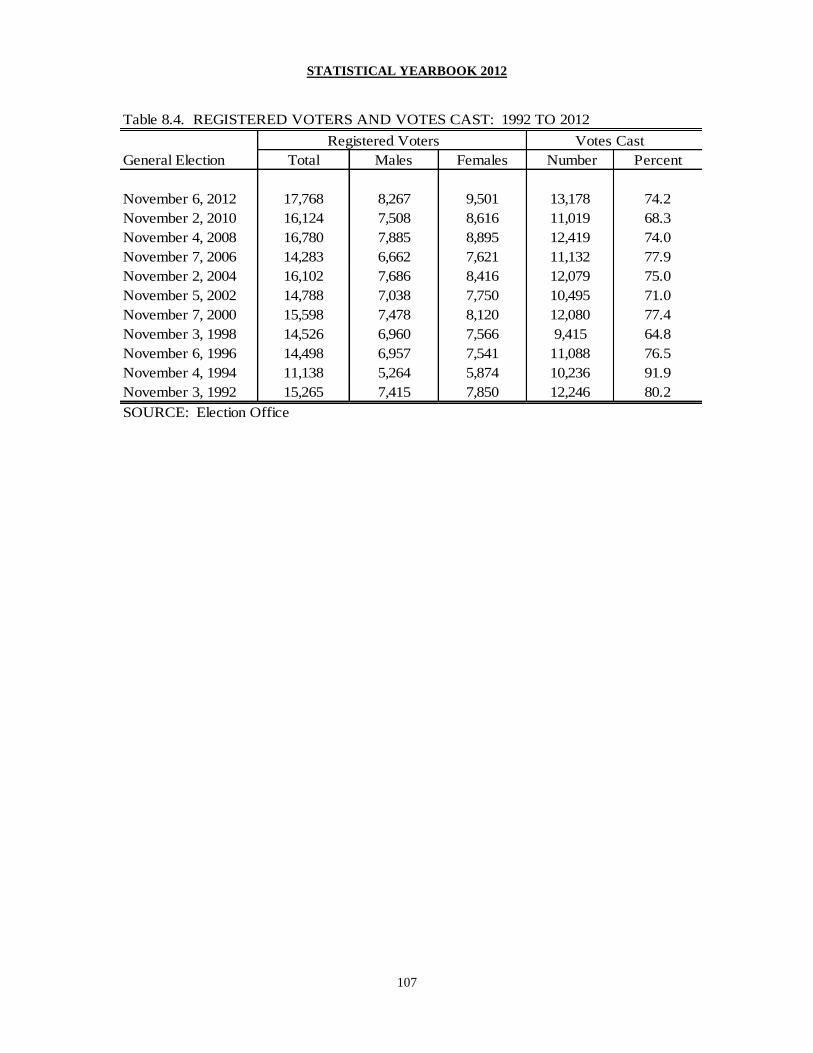
STATISTICAL YEARBOOK 2012
107
Table 8.4. REGISTERED VOTERS AND VOTES CAST: 1992 TO 2012
General Election Total Males Females Number Percent
November 6, 2012 17,768 8,267 9,501 13,178 74.2
November 2, 2010 16,124 7,508 8,616 11,019 68.3
November 4, 2008 16,780 7,885 8,895 12,419 74.0
November 7, 2006 14,283 6,662 7,621 11,132 77.9
November 2, 2004 16,102 7,686 8,416 12,079 75.0
November 5, 2002 14,788 7,038 7,750 10,495 71.0
November 7, 2000 15,598 7,478 8,120 12,080 77.4
November 3, 1998 14,526 6,960 7,566 9,415 64.8
November 6, 1996 14,498 6,957 7,541 11,088 76.5
November 4, 1994 11,138 5,264 5,874 10,236 91.9
November 3, 1992 15,265 7,415 7,850 12,246 80.2
SOURCE: Election Office
Registered Voters Votes Cast

STATISTICAL YEARBOOK 2012
108
Section Nine
GOVERNMENT FINANCE
This section presents statistical data on government revenues and expenditures.
In 2002, the American Samoa Government adopted GASB Statement No. 34. It is a
reporting approach established by Governmental Accounting Standards Board to enforce
new requirements and a new reporting model for the annual financial reports of state and
local governments. Its primary purpose is to develop annual financial reports for easier
interpretations and understandings of government funding. GASB No. 34 has technically
changed the format of the financial statements in contrast to the previous years. This had
made financial data incompatible for analytical purposes. Therefore, it is difficult to
evaluate the financial trend from previous to 2002.
The American Samoa Government collected $278 million in revenues and spent $277
million in Fiscal Year 2012. The resulting surplus was $1 million. In Fiscal Year 2011,
the government collected $278.3 million in revenues and spent $282.9 million resulting
in a $4 million deficit. Federal grants accounted for 71 percent of revenues in FY 2012.
Local taxes accounted for 23 percent of revenues in the same fiscal year.
In Fiscal Year 2011, thirty-one percent of expenditures were for Education/Culture and
thirty-five percent were for General Government. Federal grants accounted for seventy-
three percent of revenues and local taxes amounted to twenty-six percent of revenues in
FY 2011.
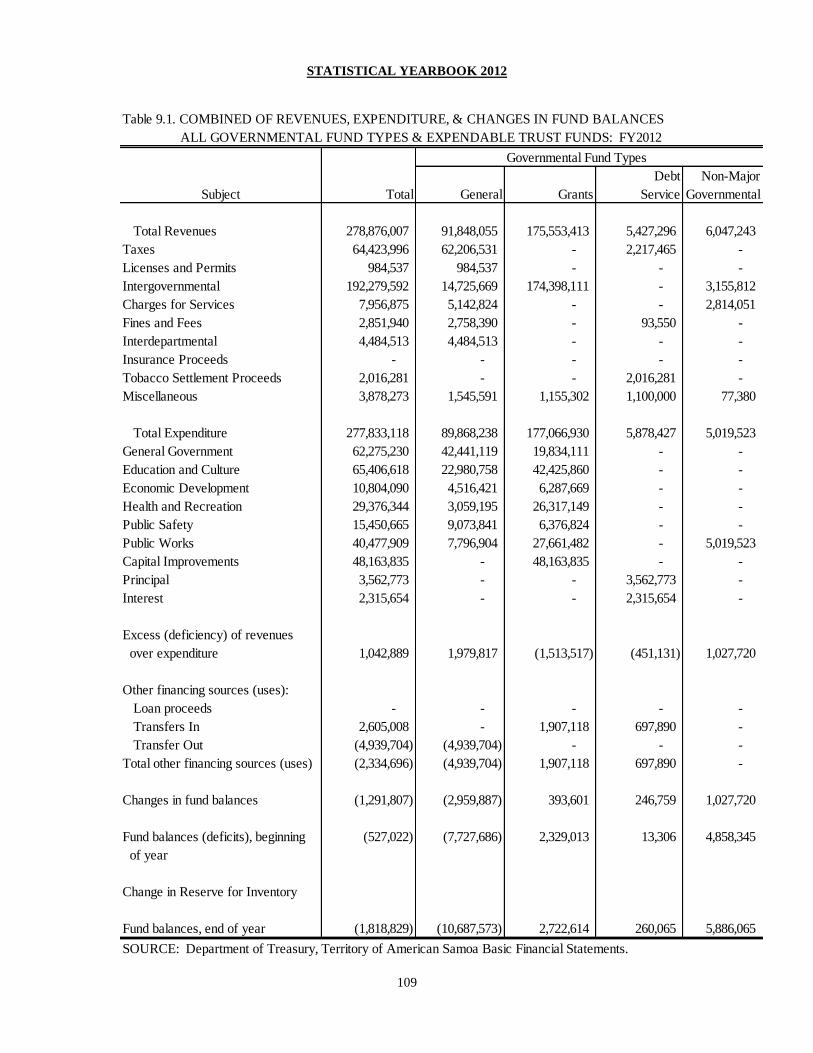
STATISTICAL YEARBOOK 2012
109
Table 9.1. COMBINED OF REVENUES, EXPENDITURE, & CHANGES IN FUND BALANCES
ALL GOVERNMENTAL FUND TYPES & EXPENDABLE TRUST FUNDS: FY2012
Governmental Fund Types
Debt Non-Major
Subject Total General Grants Service Governmental
Total Revenues 278,876,007 91,848,055 175,553,413 5,427,296 6,047,243
Taxes 64,423,996 62,206,531 - 2,217,465 -
Licenses and Permits 984,537 984,537 - - -
Intergovernmental 192,279,592 14,725,669 174,398,111 - 3,155,812
Charges for Services 7,956,875 5,142,824 - - 2,814,051
Fines and Fees 2,851,940 2,758,390 - 93,550 -
Interdepartmental 4,484,513 4,484,513 - - -
Insurance Proceeds - - - - -
Tobacco Settlement Proceeds 2,016,281 - - 2,016,281 -
Miscellaneous 3,878,273 1,545,591 1,155,302 1,100,000 77,380
Total Expenditure 277,833,118 89,868,238 177,066,930 5,878,427 5,019,523
General Government 62,275,230 42,441,119 19,834,111 - -
Education and Culture 65,406,618 22,980,758 42,425,860 - -
Economic Development 10,804,090 4,516,421 6,287,669 - -
Health and Recreation 29,376,344 3,059,195 26,317,149 - -
Public Safety 15,450,665 9,073,841 6,376,824 - -
Public Works 40,477,909 7,796,904 27,661,482 - 5,019,523
Capital Improvements 48,163,835 - 48,163,835 - -
Principal 3,562,773 - - 3,562,773 -
Interest 2,315,654 - - 2,315,654 -
Excess (deficiency) of revenues
over expenditure 1,042,889 1,979,817 (1,513,517) (451,131) 1,027,720
Other financing sources (uses):
Loan proceeds - - - - -
Transfers In 2,605,008 - 1,907,118 697,890 -
Transfer Out (4,939,704) (4,939,704) - - -
Total other financing sources (uses) (2,334,696) (4,939,704) 1,907,118 697,890 -
Changes in fund balances (1,291,807) (2,959,887) 393,601 246,759 1,027,720
Fund balances (deficits), beginning (527,022) (7,727,686) 2,329,013 13,306 4,858,345
of year
Change in Reserve for Inventory
Fund balances, end of year (1,818,829) (10,687,573) 2,722,614 260,065 5,886,065
SOURCE: Department of Treasury, Territory of American Samoa Basic Financial Statements.

STATISTICAL YEARBOOK 2012
110
Table 9.2. REVENUE, EXPENDITURE, AND OTHER FINANCIAL SOURCES: FY2002 TO FY2012
Function 2012 2011 2010 2009 2008 2007 2006 2005 2004 2003 2002
Revenue All Sources 278,876,007 278,299,082 267,357,356 211,152,764 200,951,245 171,967,989 195,242,222 182,014,612 188,877,568 197,937,045 211,530,940
Expenditure All Sources 277,833,118 282,944,594 266,849,361 221,975,079 200,758,517 179,022,404 202,490,440 192,498,724 192,421,535 170,748,872 180,541,130
Surplus (Deficit) - Current ops 1,042,889 (4,645,512) 507,995 (10,822,315) 192,728 (7,054,415) (7,248,218) (10,484,112) (3,543,967) 27,188,173 30,989,810
Other Financial Sources (Uses) (2,334,696) 2,615,877 (5,309,748) 868,361 (1,518,714) (875,486) 8,847,569 (2,209,877) (2,371,449) 2,196,503 734,881
Tobacco loan proceeds - - - - - - - - - 3,050,000 -
Loan Proceeds - 4,641,207 2,430,263 2,946,409 - - 10,000,000 - - - 2,442,661
Operating Transfers In 2,605,008 2,547,781 673,854 2,086,056 7,554,309 1,807,926 459,000 4,202,514 5,894,635 1,989,139 2,224,258
Operating Transfers Out (4,939,704) (4,573,111) (8,413,865) (4,164,104) (9,073,023) (2,683,412) (1,611,431) (6,412,391) (8,266,084) (2,842,636) (3,932,038)
2000 Bonds - - - - - - - - - - -
Surplus (Deficit) All Sources (1,291,807) (2,029,635) (4,801,753) (9,953,954) (1,325,986) (7,929,901) 1,599,351 (12,693,989) (5,915,416) 29,384,676 31,724,691
Fund Balance (Deficit)-Beginning 6,304,366 16,258,320 18,657,463 26,360,418 25,214,811 37,826,655 43,236,517 15,233,174 16,491,517
Changes in Reserves for Inventory - - (1,073,157) 226,946 (453,744) 82,145 505,552 1,381,333 -
Fund Balance (Deficit)-Ending (1,291,807) (2,029,635) 1,502,613 6,304,366 16,258,320 18,657,463 26,360,418 25,214,811 37,826,653 43,236,517 15,233,174
SOURCE: Department of Treasury, Comprehensive Annual Financial Reports, Territory of American Samoa
Table 9.3. GENERAL GOVERNMENTAL REVENUE BY SOURCE (GOVERNMENTAL FUND TYPES): FY2002 TO FY2012
Function 2012 2011 2010 2009 2008 2007 2006 2005 2004 2003 2002
Revenues 278,876,007 278,299,082 267,357,356 211,152,764 200,951,245 171,967,989 195,242,222 182,014,612 188,877,568 197,937,045 211,530,940
Taxes 64,423,996 55,666,924 58,933,172 52,895,909 58,853,591 50,369,760 58,028,656 50,396,685 54,841,157 50,982,945 55,430,564
Licenses & Permits 984,537 976,012 1,003,204 912,787 992,767 1,382,906 1,026,761 1,159,883 1,398,718 1,331,549 826,293
Insurance claim/proceeds - - - - - - 1,109,955 290,003 - 30,000,000 40,000,000
Intergovernmental 192,279,592 199,420,028 183,753,528 134,070,264 108,494,257 101,975,776 113,090,007 111,783,137 113,960,653 97,530,861 95,366,789
Charges for services 7,956,875 7,981,939 7,587,204 7,910,518 7,822,360 7,908,443 8,514,017 8,437,856 7,710,281 8,666,185 9,983,174
Fines & Fees 2,851,940 2,682,052 2,615,910 2,902,639 2,872,900 2,465,064 2,367,292 1,869,332 2,249,387 1,631,126 1,777,983
Interdepartmental 4,484,513 4,488,342 6,391,129 6,065,493 6,541,933 3,451,493 5,218,104 5,371,126 4,980,834 4,404,945 4,405,110
Tobacco Settlement Proceeds 2,016,281 1,978,664 2,136,256 2,503,705 2,371,569 931,863 890,289 959,191 966,144 1,130,421 1,173,890
Deficit reduction - - - - - - - - - - -
Miscellaneous 3,878,273 5,105,121 4,936,953 3,891,449 13,001,868 3,482,684 4,997,141 1,747,399 2,770,394 2,259,013 2,567,137
Local Revenue Collection 80,095,621 72,412,048 75,076,443 68,513,302 83,543,486 65,608,857 74,933,867 63,611,155 68,969,937 64,870,818 70,585,151
US Federal Grants/Assistance 196,764,105 203,908,370 190,144,657 140,135,757 115,036,190 105,427,269 118,308,111 117,154,263 118,941,487 101,935,806 99,771,899
Insurance Claims/ - - - - - - - - - - -
Tobacco Proceeds 2,016,281 1,978,664 2,136,256 2,503,705 2,371,569 931,863 2,000,244 1,249,194 966,144 31,130,421 41,173,890
SOURCE: Department of Treasury, Comprehensive Annual Financial Reports, Territory of American Samoa
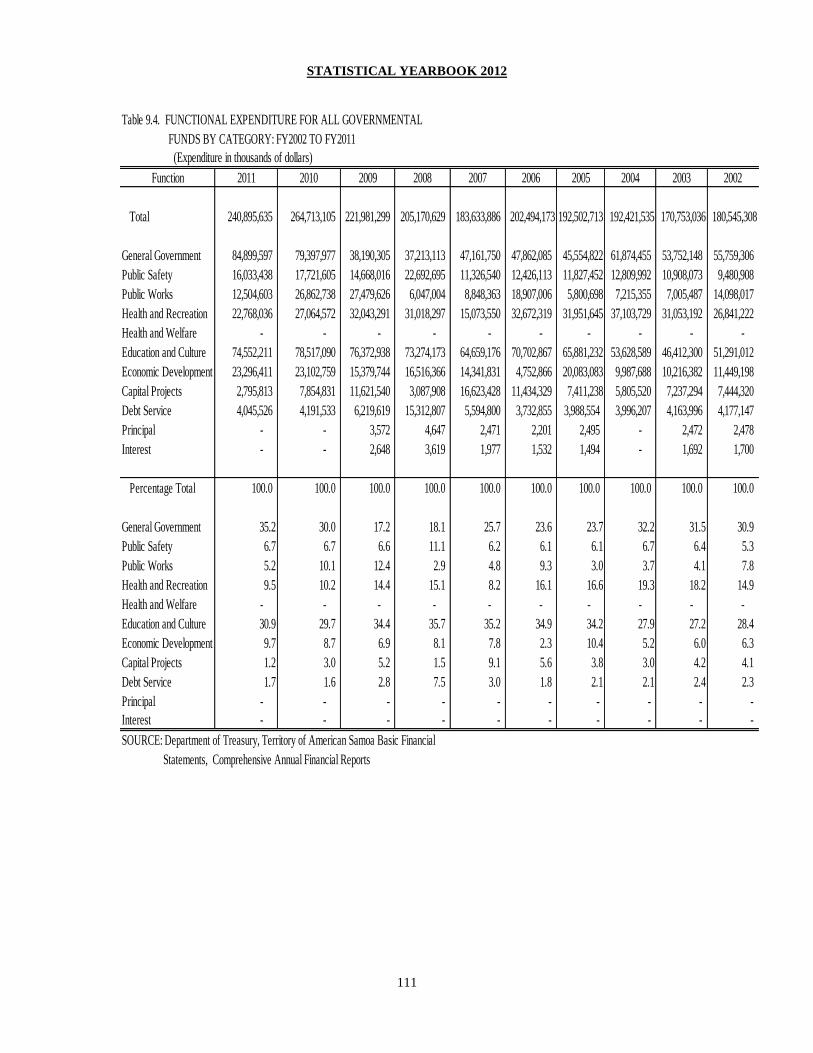
STATISTICAL YEARBOOK 2012
111
Table 9.4. FUNCTIONAL EXPENDITURE FOR ALL GOVERNMENTAL
FUNDS BY CATEGORY: FY2002 TO FY2011
(Expenditure in thousands of dollars)
Function 2011 2010 2009 2008 2007 2006 2005 2004 2003 2002
Total 240,895,635 264,713,105 221,981,299 205,170,629 183,633,886 202,494,173 192,502,713 192,421,535 170,753,036 180,545,308
General Government 84,899,597 79,397,977 38,190,305 37,213,113 47,161,750 47,862,085 45,554,822 61,874,455 53,752,148 55,759,306
Public Safety 16,033,438 17,721,605 14,668,016 22,692,695 11,326,540 12,426,113 11,827,452 12,809,992 10,908,073 9,480,908
Public Works 12,504,603 26,862,738 27,479,626 6,047,004 8,848,363 18,907,006 5,800,698 7,215,355 7,005,487 14,098,017
Health and Recreation 22,768,036 27,064,572 32,043,291 31,018,297 15,073,550 32,672,319 31,951,645 37,103,729 31,053,192 26,841,222
Health and Welfare - - - - - - - - - -
Education and Culture 74,552,211 78,517,090 76,372,938 73,274,173 64,659,176 70,702,867 65,881,232 53,628,589 46,412,300 51,291,012
Economic Development 23,296,411 23,102,759 15,379,744 16,516,366 14,341,831 4,752,866 20,083,083 9,987,688 10,216,382 11,449,198
Capital Projects 2,795,813 7,854,831 11,621,540 3,087,908 16,623,428 11,434,329 7,411,238 5,805,520 7,237,294 7,444,320
Debt Service 4,045,526 4,191,533 6,219,619 15,312,807 5,594,800 3,732,855 3,988,554 3,996,207 4,163,996 4,177,147
Principal - - 3,572 4,647 2,471 2,201 2,495 - 2,472 2,478
Interest - - 2,648 3,619 1,977 1,532 1,494 - 1,692 1,700
Percentage Total 100.0 100.0 100.0 100.0 100.0 100.0 100.0 100.0 100.0 100.0
General Government 35.2 30.0 17.2 18.1 25.7 23.6 23.7 32.2 31.5 30.9
Public Safety 6.7 6.7 6.6 11.1 6.2 6.1 6.1 6.7 6.4 5.3
Public Works 5.2 10.1 12.4 2.9 4.8 9.3 3.0 3.7 4.1 7.8
Health and Recreation 9.5 10.2 14.4 15.1 8.2 16.1 16.6 19.3 18.2 14.9
Health and Welfare - - - - - - - - - -
Education and Culture 30.9 29.7 34.4 35.7 35.2 34.9 34.2 27.9 27.2 28.4
Economic Development 9.7 8.7 6.9 8.1 7.8 2.3 10.4 5.2 6.0 6.3
Capital Projects 1.2 3.0 5.2 1.5 9.1 5.6 3.8 3.0 4.2 4.1
Debt Service 1.7 1.6 2.8 7.5 3.0 1.8 2.1 2.1 2.4 2.3
Principal - - - - - - - - - -
Interest - - - - - - - - - -
SOURCE: Department of Treasury, Territory of American Samoa Basic Financial
Statements, Comprehensive Annual Financial Reports
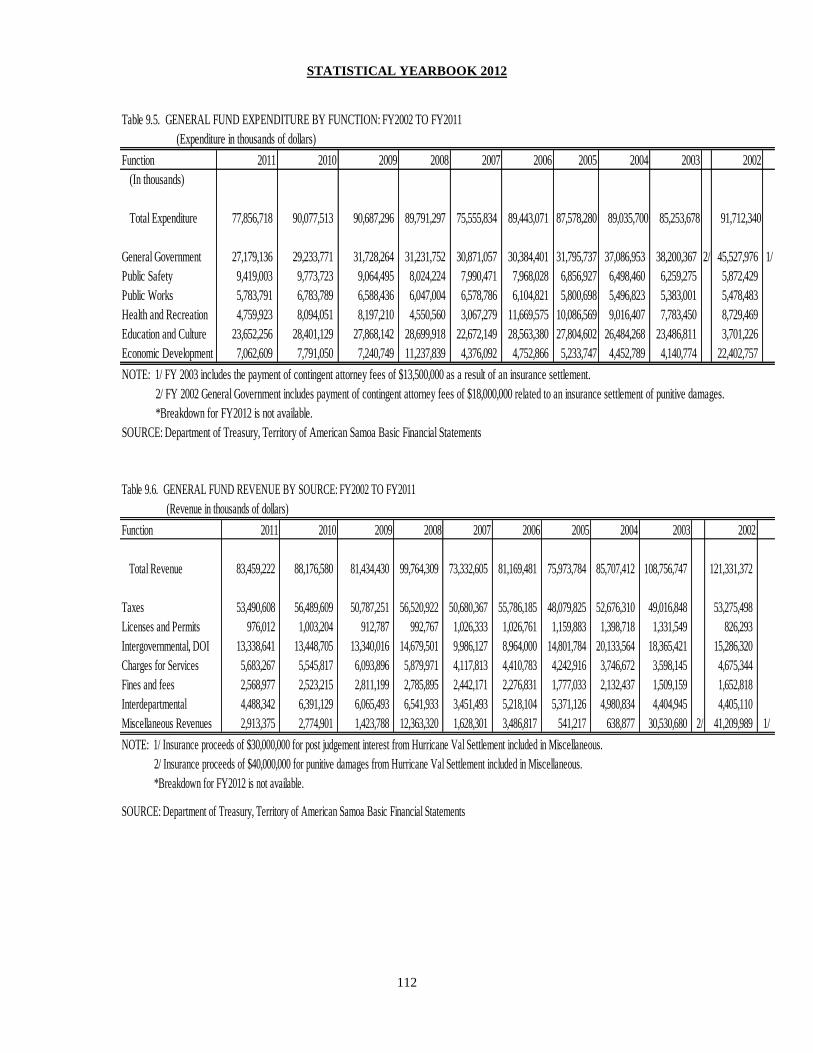
STATISTICAL YEARBOOK 2012
112
Table 9.5. GENERAL FUND EXPENDITURE BY FUNCTION: FY2002 TO FY2011
(Expenditure in thousands of dollars)
Function 2011 2010 2009 2008 2007 2006 2005 2004 2003 2002
(In thousands)
Total Expenditure 77,856,718 90,077,513 90,687,296 89,791,297 75,555,834 89,443,071 87,578,280 89,035,700 85,253,678 91,712,340
General Government 27,179,136 29,233,771 31,728,264 31,231,752 30,871,057 30,384,401 31,795,737 37,086,953 38,200,367 2/ 45,527,976 1/
Public Safety 9,419,003 9,773,723 9,064,495 8,024,224 7,990,471 7,968,028 6,856,927 6,498,460 6,259,275 5,872,429
Public Works 5,783,791 6,783,789 6,588,436 6,047,004 6,578,786 6,104,821 5,800,698 5,496,823 5,383,001 5,478,483
Health and Recreation 4,759,923 8,094,051 8,197,210 4,550,560 3,067,279 11,669,575 10,086,569 9,016,407 7,783,450 8,729,469
Education and Culture 23,652,256 28,401,129 27,868,142 28,699,918 22,672,149 28,563,380 27,804,602 26,484,268 23,486,811 3,701,226
Economic Development 7,062,609 7,791,050 7,240,749 11,237,839 4,376,092 4,752,866 5,233,747 4,452,789 4,140,774 22,402,757
NOTE: 1/ FY 2003 includes the payment of contingent attorney fees of $13,500,000 as a result of an insurance settlement.
2/ FY 2002 General Government includes payment of contingent attorney fees of $18,000,000 related to an insurance settlement of punitive damages.
*Breakdown for FY2012 is not available.
SOURCE: Department of Treasury, Territory of American Samoa Basic Financial Statements
Table 9.6. GENERAL FUND REVENUE BY SOURCE: FY2002 TO FY2011
(Revenue in thousands of dollars)
Function 2011 2010 2009 2008 2007 2006 2005 2004 2003 2002
Total Revenue 83,459,222 88,176,580 81,434,430 99,764,309 73,332,605 81,169,481 75,973,784 85,707,412 108,756,747 121,331,372
Taxes 53,490,608 56,489,609 50,787,251 56,520,922 50,680,367 55,786,185 48,079,825 52,676,310 49,016,848 53,275,498
Licenses and Permits 976,012 1,003,204 912,787 992,767 1,026,333 1,026,761 1,159,883 1,398,718 1,331,549 826,293
Intergovernmental, DOI 13,338,641 13,448,705 13,340,016 14,679,501 9,986,127 8,964,000 14,801,784 20,133,564 18,365,421 15,286,320
Charges for Services 5,683,267 5,545,817 6,093,896 5,879,971 4,117,813 4,410,783 4,242,916 3,746,672 3,598,145 4,675,344
Fines and fees 2,568,977 2,523,215 2,811,199 2,785,895 2,442,171 2,276,831 1,777,033 2,132,437 1,509,159 1,652,818
Interdepartmental 4,488,342 6,391,129 6,065,493 6,541,933 3,451,493 5,218,104 5,371,126 4,980,834 4,404,945 4,405,110
Miscellaneous Revenues 2,913,375 2,774,901 1,423,788 12,363,320 1,628,301 3,486,817 541,217 638,877 30,530,680 2/ 41,209,989 1/
NOTE: 1/ Insurance proceeds of $30,000,000 for post judgement interest from Hurricane Val Settlement included in Miscellaneous.
2/ Insurance proceeds of $40,000,000 for punitive damages from Hurricane Val Settlement included in Miscellaneous.
*Breakdown for FY2012 is not available.
SOURCE: Department of Treasury, Territory of American Samoa Basic Financial Statements
STATISTICAL YEARBOOK 2012
113
Section Ten
LABOR FORCE, EMPLOYMENT AND EARNINGS
This section presents statistical data on labor force participation, employment and
earnings.
Total employment in 2011 and 2012 were estimated at 18,028 and 14,806 respectively.
General government and the four authorities made up 36 percent of the workforce in
2012. In 2011, it went up 34 percent. Employment dropped to 14,806 in 2012. Both
government and the private sector employment dropped in 2012.
The Fair Minimum Wage Act of 2007 (Public Law 110-28) ordered new wage increases
for American Samoa. The law stipulated $0.50 increases to current local minimum
wages every year until it reaches the US minimum wage of $7.25 an hour. Local
minimum wages for various industries in American Samoa had another fifty-cent
increase on May 25, 2009. In 2010, a bill was passed to postpone the 50 cents increases
for 2010 and 2011until September 30, 2012 when this issue will be discussed again in the
U.S. Congress. Another bill was approved by Congress in 2012 to postpone the
minimum wage increase (50 cents) until September 30, 2015. The current minimum
wage rates by industry in American Samoa still remain on the last 50 cents increase on
May 25, 2009.
In 2010, the median household income was $23,892. Close to $350 million worth of
income from all sources were received by all residents of the territory in 2010. Thus, the
per capita income was $6,311.
In 2010, about 57.8 percent of all persons or 54.4 percent of families were below the
national poverty level Of the 3,875 grandparents reported to have lived with their
grandchildren, 66 percent of them were responsible for grandchildren.
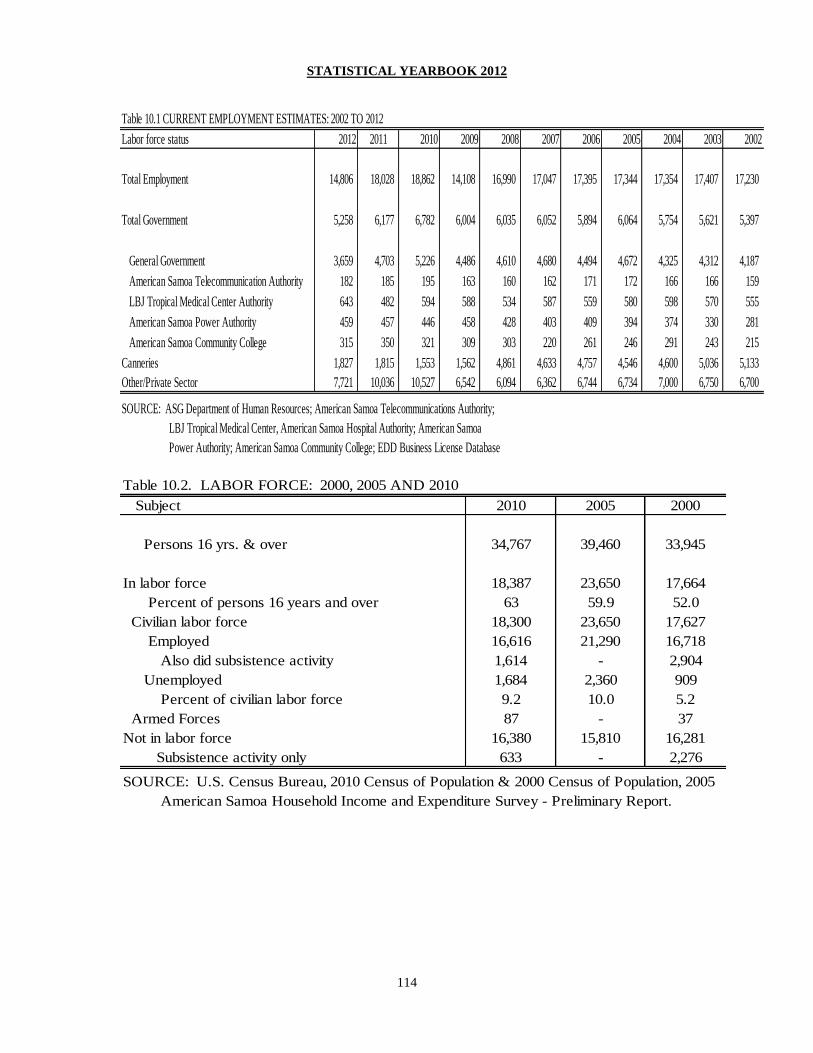
STATISTICAL YEARBOOK 2012
114
Table 10.1 CURRENT EMPLOYMENT ESTIMATES: 2002 TO 2012
Labor force status 2012 2011 2010 2009 2008 2007 2006 2005 2004 2003 2002
Total Employment 14,806 18,028 18,862 14,108 16,990 17,047 17,395 17,344 17,354 17,407 17,230
Total Government 5,258 6,177 6,782 6,004 6,035 6,052 5,894 6,064 5,754 5,621 5,397
General Government 3,659 4,703 5,226 4,486 4,610 4,680 4,494 4,672 4,325 4,312 4,187
American Samoa Telecommunication Authority 182 185 195 163 160 162 171 172 166 166 159
LBJ Tropical Medical Center Authority 643 482 594 588 534 587 559 580 598 570 555
American Samoa Power Authority 459 457 446 458 428 403 409 394 374 330 281
American Samoa Community College 315 350 321 309 303 220 261 246 291 243 215
Canneries 1,827 1,815 1,553 1,562 4,861 4,633 4,757 4,546 4,600 5,036 5,133
Other/Private Sector 7,721 10,036 10,527 6,542 6,094 6,362 6,744 6,734 7,000 6,750 6,700
SOURCE: ASG Department of Human Resources; American Samoa Telecommunications Authority;
LBJ Tropical Medical Center, American Samoa Hospital Authority; American Samoa
Power Authority; American Samoa Community College; EDD Business License Database
Table 10.2. LABOR FORCE: 2000, 2005 AND 2010
Subject 2010 2005 2000
Persons 16 yrs. & over 34,767 39,460 33,945
In labor force 18,387 23,650 17,664
Percent of persons 16 years and over 63 59.9 52.0
Civilian labor force 18,300 23,650 17,627
Employed 16,616 21,290 16,718
Also did subsistence activity 1,614 - 2,904
Unemployed 1,684 2,360 909
Percent of civilian labor force 9.2 10.0 5.2
Armed Forces 87 - 37
Not in labor force 16,380 15,810 16,281
Subsistence activity only 633 - 2,276
SOURCE: U.S. Census Bureau, 2010 Census of Population & 2000 Census of Population, 2005
American Samoa Household Income and Expenditure Survey - Preliminary Report.
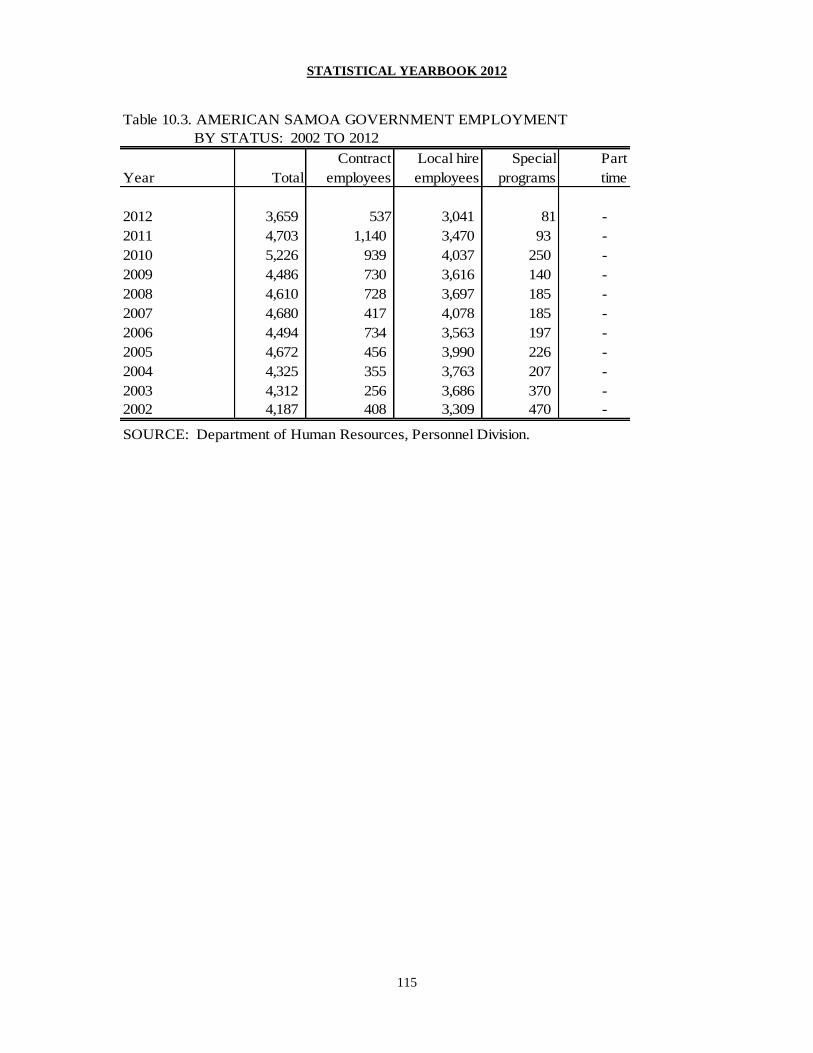
STATISTICAL YEARBOOK 2012
115
Table 10.3. AMERICAN SAMOA GOVERNMENT EMPLOYMENT
BY STATUS: 2002 TO 2012
Contract Local hire Special Part
Year Total employees employees programs time
2012 3,659 537 3,041 81 -
2011 4,703 1,140 3,470 93 -
2010 5,226 939 4,037 250 -
2009 4,486 730 3,616 140 -
2008 4,610 728 3,697 185 -
2007 4,680 417 4,078 185 -
2006 4,494 734 3,563 197 -
2005 4,672 456 3,990 226 -
2004 4,325 355 3,763 207 -
2003 4,312 256 3,686 370 -
2002 4,187 408 3,309 470 -
SOURCE: Department of Human Resources, Personnel Division.

STATISTICAL YEARBOOK 2012
116
Table 10.4. EMPLOYMENT STATUS BY DISTRICT AND COUNTY, AMERICAN SAMOA: 2010
In labor force
Total Civilian labor force Not in labor force
District 16+ Employed Unemployed Armed Subsist.
County years Total Total Total Subsistence Number Percent Forces Total only
DISTRICTS
American Samoa 34,767 18,387 18,300 16,616 1,614 1,684 9.2 87 16,380 633
Eastern District 14,670 7,801 7,755 6,981 649 774 10.0 46 6,869 221
Manu'a District 717 378 378 338 151 40 10.6 - 339 91
Swains Island 15 3 3 3 - - - - 12 2
Western District 19,365 10,205 10,164 9,294 814 870 8.6 41 9,160 319
COUNTIES
Ituau 3,044 1,643 1,636 1,500 139 136 8.3 7 1,401 51
Ma'oputasi 6,539 3,557 3,539 3,145 295 394 11.1 18 2,982 100
Sa'ole 1,356 688 684 617 73 67 9.8 4 668 33
Sua 2,124 1,087 1,077 979 86 98 9.1 10 1,037 18
Vaifanua 1,607 826 819 740 56 79 9.6 7 781 19
Faleasao 112 68 68 61 22 7 10.3 - 44 5
Fitiuta 169 84 84 77 28 7 8.3 - 85 29
Ofu 116 67 67 58 42 9 13.4 - 49 30
Olosega 106 66 66 54 38 12 18.2 - 40 18
Ta'u 214 93 93 88 21 5 5.4 - 121 9
Swains Island 15 3 3 3 - - - - 12 2
Lealataua 3,195 1,729 1,722 1,535 191 187 10.9 7 1,466 51
Leasina 1,117 576 575 491 43 84 14.6 1 541 21
Tualatai 2,149 1,124 1,121 991 87 130 11.6 3 1,025 37
Tualauta 12,904 6,776 6,746 6,277 493 469 7.0 30 6,128 210
SOURCE: 2010 American Samoa Census Profile
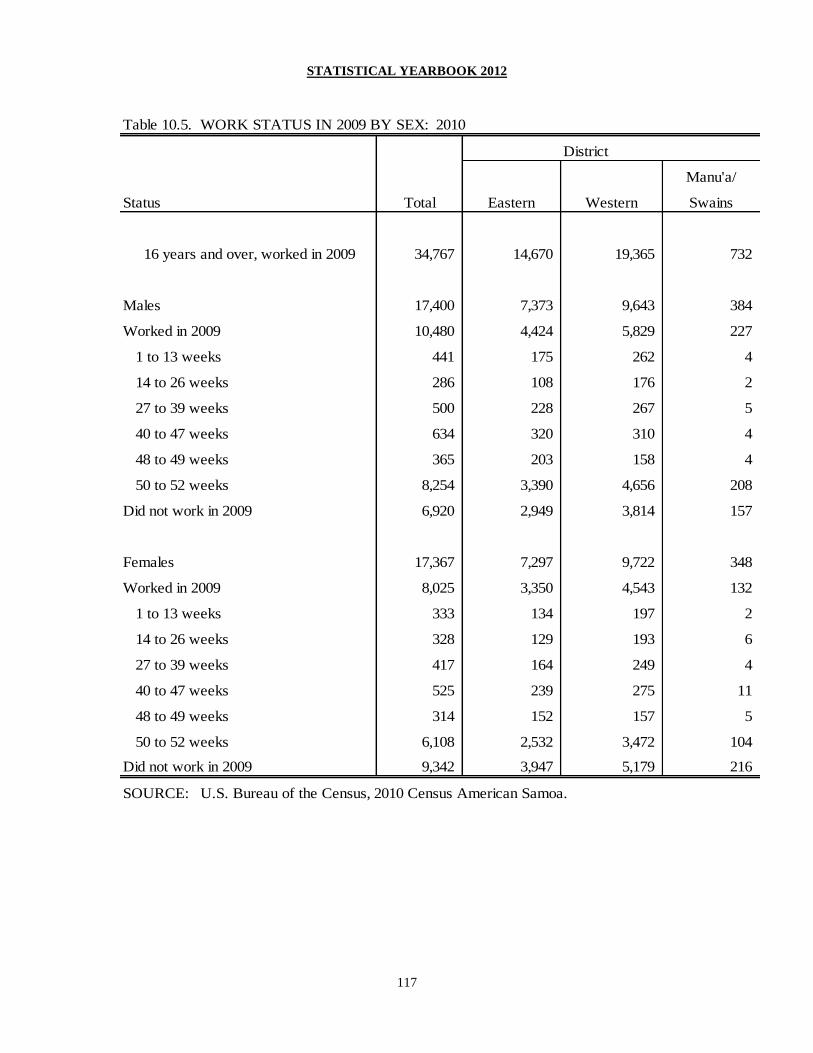
STATISTICAL YEARBOOK 2012
117
Table 10.5. WORK STATUS IN 2009 BY SEX: 2010
District
Manu'a/
Status Total Eastern Western Swains
16 years and over, worked in 2009 34,767 14,670 19,365 732
Males 17,400 7,373 9,643 384
Worked in 2009 10,480 4,424 5,829 227
1 to 13 weeks 441 175 262 4
14 to 26 weeks 286 108 176 2
27 to 39 weeks 500 228 267 5
40 to 47 weeks 634 320 310 4
48 to 49 weeks 365 203 158 4
50 to 52 weeks 8,254 3,390 4,656 208
Did not work in 2009 6,920 2,949 3,814 157
Females 17,367 7,297 9,722 348
Worked in 2009 8,025 3,350 4,543 132
1 to 13 weeks 333 134 197 2
14 to 26 weeks 328 129 193 6
27 to 39 weeks 417 164 249 4
40 to 47 weeks 525 239 275 11
48 to 49 weeks 314 152 157 5
50 to 52 weeks 6,108 2,532 3,472 104
Did not work in 2009 9,342 3,947 5,179 216
SOURCE: U.S. Bureau of the Census, 2010 Census American Samoa.
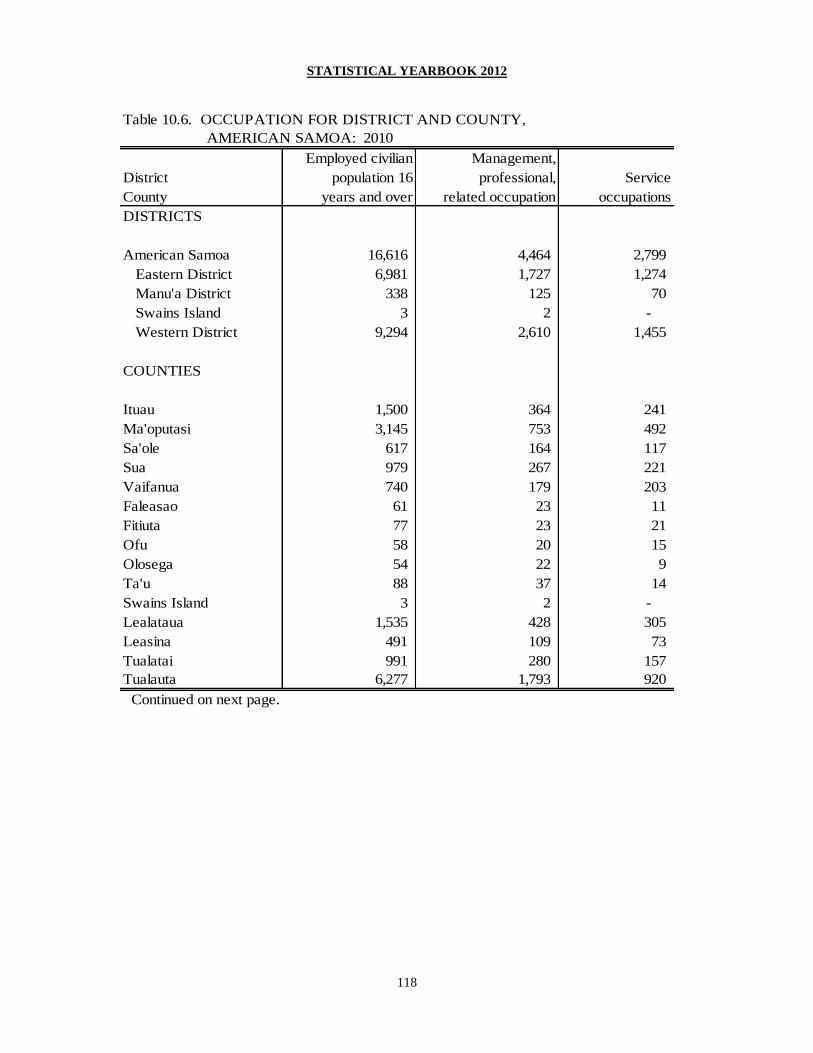
STATISTICAL YEARBOOK 2012
118
Table 10.6. OCCUPATION FOR DISTRICT AND COUNTY,
AMERICAN SAMOA: 2010
Employed civilian Management,
District population 16 professional, Service
County years and over related occupation occupations
DISTRICTS
American Samoa 16,616 4,464 2,799
Eastern District 6,981 1,727 1,274
Manu'a District 338 125 70
Swains Island 3 2 -
Western District 9,294 2,610 1,455
COUNTIES
Ituau 1,500 364 241
Ma'oputasi 3,145 753 492
Sa'ole 617 164 117
Sua 979 267 221
Vaifanua 740 179 203
Faleasao 61 23 11
Fitiuta 77 23 21
Ofu 58 20 15
Olosega 54 22 9
Ta'u 88 37 14
Swains Island 3 2 -
Lealataua 1,535 428 305
Leasina 491 109 73
Tualatai 991 280 157
Tualauta 6,277 1,793 920
Continued on next page.
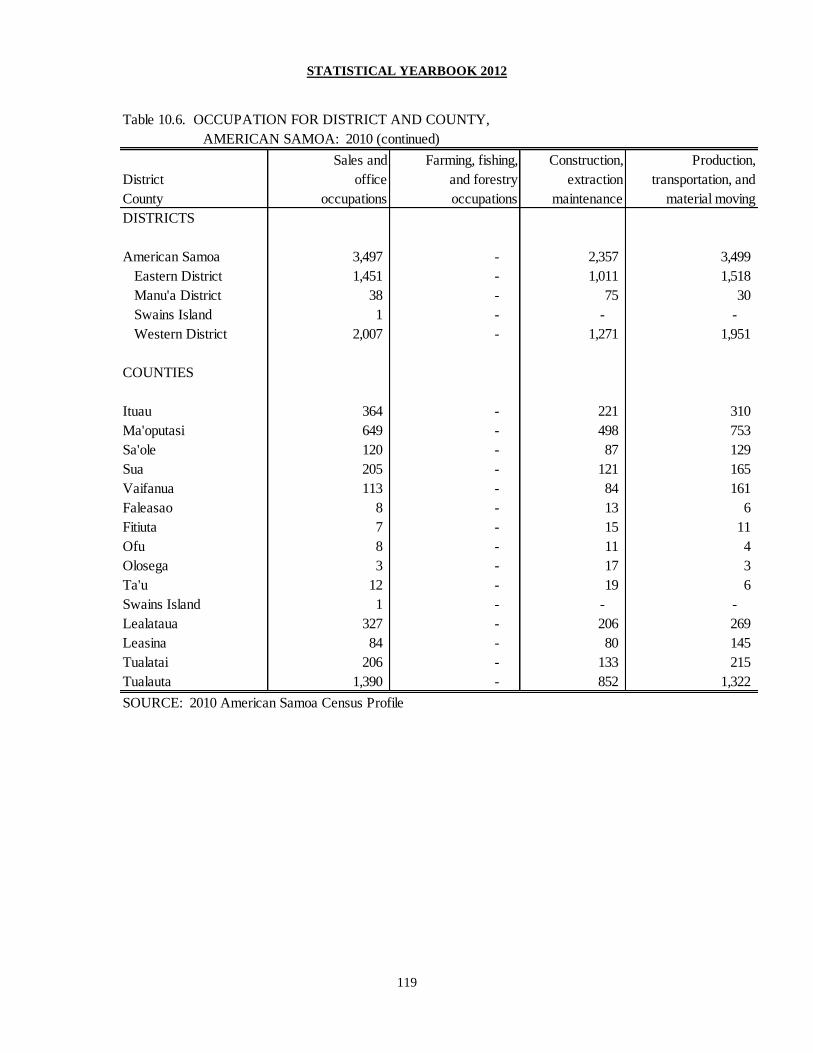
STATISTICAL YEARBOOK 2012
119
Table 10.6. OCCUPATION FOR DISTRICT AND COUNTY,
AMERICAN SAMOA: 2010 (continued)
Sales and Farming, fishing, Construction, Production,
District office and forestry extraction transportation, and
County occupations occupations maintenance material moving
DISTRICTS
American Samoa 3,497 - 2,357 3,499
Eastern District 1,451 - 1,011 1,518
Manu'a District 38 - 75 30
Swains Island 1 - - -
Western District 2,007 - 1,271 1,951
COUNTIES
Ituau 364 - 221 310
Ma'oputasi 649 - 498 753
Sa'ole 120 - 87 129
Sua 205 - 121 165
Vaifanua 113 - 84 161
Faleasao 8 - 13 6
Fitiuta 7 - 15 11
Ofu 8 - 11 4
Olosega 3 - 17 3
Ta'u 12 - 19 6
Swains Island 1 - - -
Lealataua 327 - 206 269
Leasina 84 - 80 145
Tualatai 206 - 133 215
Tualauta 1,390 - 852 1,322
SOURCE: 2010 American Samoa Census Profile
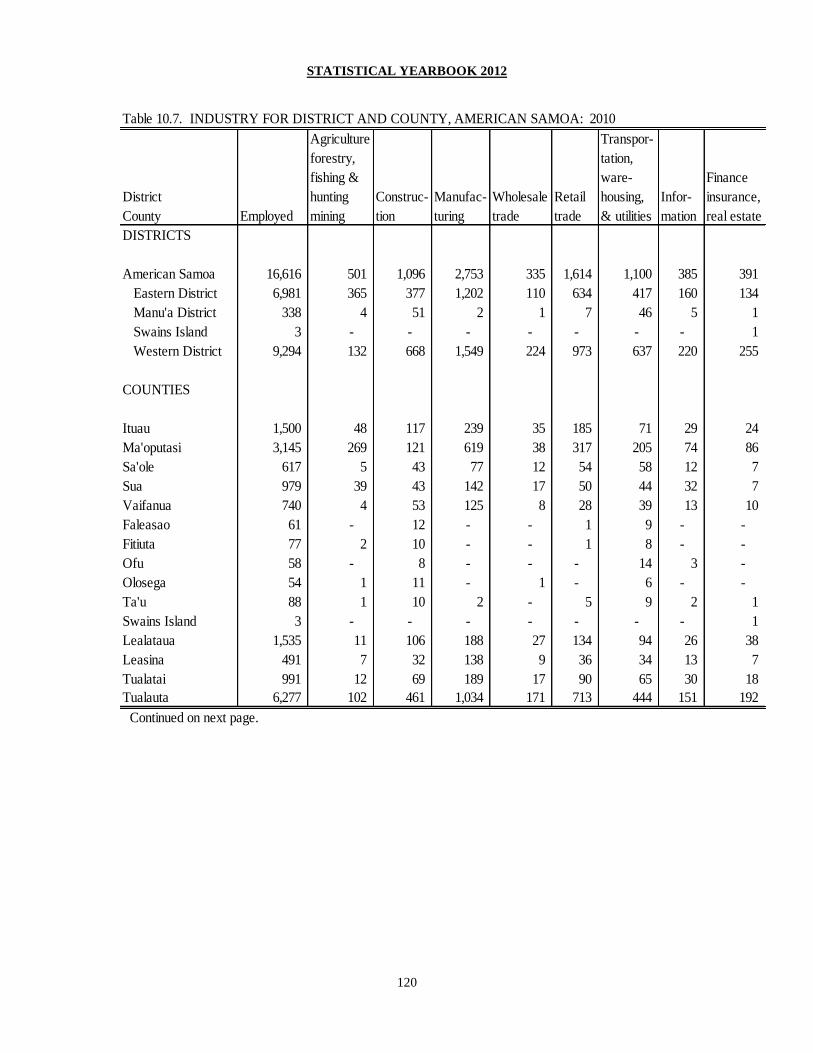
STATISTICAL YEARBOOK 2012
120
Table 10.7. INDUSTRY FOR DISTRICT AND COUNTY, AMERICAN SAMOA: 2010
Agriculture Transpor-
forestry, tation,
fishing & ware- Finance
District hunting Construc- Manufac- Wholesale Retail housing, Infor- insurance,
County Employed mining tion turing trade trade & utilities mation real estate
DISTRICTS
American Samoa 16,616 501 1,096 2,753 335 1,614 1,100 385 391
Eastern District 6,981 365 377 1,202 110 634 417 160 134
Manu'a District 338 4 51 2 1 7 46 5 1
Swains Island 3 - - - - - - - 1
Western District 9,294 132 668 1,549 224 973 637 220 255
COUNTIES
Ituau 1,500 48 117 239 35 185 71 29 24
Ma'oputasi 3,145 269 121 619 38 317 205 74 86
Sa'ole 617 5 43 77 12 54 58 12 7
Sua 979 39 43 142 17 50 44 32 7
Vaifanua 740 4 53 125 8 28 39 13 10
Faleasao 61 - 12 - - 1 9 - -
Fitiuta 77 2 10 - - 1 8 - -
Ofu 58 - 8 - - - 14 3 -
Olosega 54 1 11 - 1 - 6 - -
Ta'u 88 1 10 2 - 5 9 2 1
Swains Island 3 - - - - - - - 1
Lealataua 1,535 11 106 188 27 134 94 26 38
Leasina 491 7 32 138 9 36 34 13 7
Tualatai 991 12 69 189 17 90 65 30 18
Tualauta 6,277 102 461 1,034 171 713 444 151 192
Continued on next page.

STATISTICAL YEARBOOK 2012
121
Table 10.7. INDUSTRY FOR DISTRICT AND COUNTY, AMERICAN SAMOA: 2010 (continued)
Professional Education, Arts, entertainment, Other services,
District management, heatlh & recreation, hotal & (except public Public
County administrative social services food services administration) administration
DISTRICTS
American Samoa 330 3,324 932 626 3,229
Eastern District 118 1,383 370 209 1,502
Manu'a District 2 116 4 12 87
Swains Island - 2 - - -
Western District 210 1,823 558 405 1,640
COUNTIES
Ituau 37 268 102 44 301
Ma'oputasi 38 529 185 97 567
Sa'ole 13 143 38 22 133
Sua 14 258 25 29 279
Vaifanua 16 185 20 17 222
Faleasao - 25 - 1 13
Fitiuta 1 26 2 5 22
Ofu - 24 - 3 6
Olosega - 18 - 1 16
Ta'u 1 23 2 2 30
Swains Island - 2 - - -
Lealataua 35 325 63 43 445
Leasina 5 86 26 8 90
Tualatai 13 199 49 33 207
Tualauta 157 1,213 420 321 898
SOURCE: 2010 American Samoa Census Profile

STATISTICAL YEARBOOK 2012
122
Table 10.8. CLASS OF WORKER FOR DISTRICT AND COUNTY, AMERICAN SAMOA: 2010
Private wage Employees in Self-employed in Unpaid
District Employed civilian and salary own incorpo- Government own not incor- family
County 16 years and over workers rated business workers porated business workers
DISTRICTS
American Samoa 16,616 8,839 - 7,257 520 -
Eastern District 6,981 3,536 - 3,224 221 -
Manu'a District 338 53 - 278 7 -
Swains Island 3 2 - 1 - -
Western District 9,294 5,248 - 3,754 292 -
COUNTIES
Ituau 1,500 837 - 624 39 -
Ma'oputasi 3,145 1,812 - 1,229 104 -
Sa'ole 617 259 - 322 36 -
Sua 979 353 - 608 18 -
Vaifanua 740 275 - 441 24 -
Faleasao 61 12 - 46 3 -
Fitiuta 77 14 - 61 2 -
Ofu 58 10 - 48 - -
Olosega 54 2 - 52 - -
Ta'u 88 15 - 71 2 -
Swains Island 3 2 - 1 - -
Lealataua 1,535 650 - 846 39 -
Leasina 491 299 - 188 4 -
Tualatai 991 523 - 443 25 -
Tualauta 6,277 3,776 - 2,277 224 -
SOURCE: 2010 American Samoa Census Profile
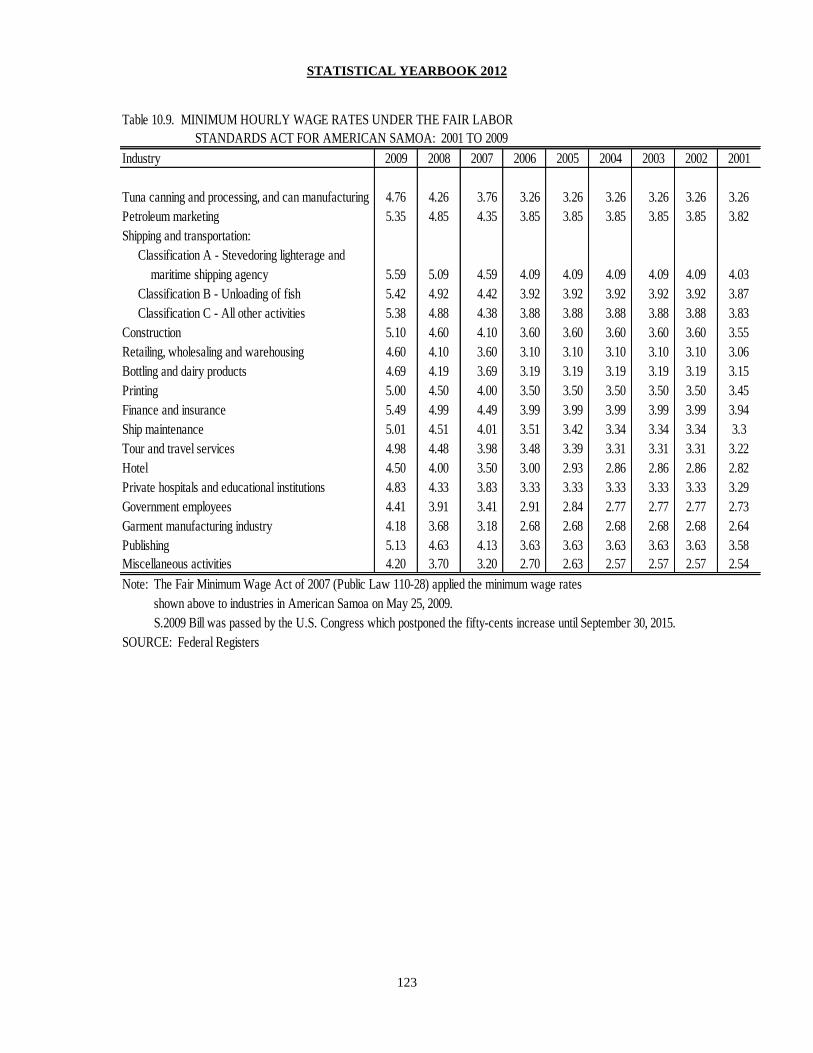
STATISTICAL YEARBOOK 2012
123
Table 10.9. MINIMUM HOURLY WAGE RATES UNDER THE FAIR LABOR
STANDARDS ACT FOR AMERICAN SAMOA: 2001 TO 2009
Industry 2009 2008 2007 2006 2005 2004 2003 2002 2001
Tuna canning and processing, and can manufacturing 4.76 4.26 3.76 3.26 3.26 3.26 3.26 3.26 3.26
Petroleum marketing 5.35 4.85 4.35 3.85 3.85 3.85 3.85 3.85 3.82
Shipping and transportation:
Classification A - Stevedoring lighterage and
maritime shipping agency 5.59 5.09 4.59 4.09 4.09 4.09 4.09 4.09 4.03
Classification B - Unloading of fish 5.42 4.92 4.42 3.92 3.92 3.92 3.92 3.92 3.87
Classification C - All other activities 5.38 4.88 4.38 3.88 3.88 3.88 3.88 3.88 3.83
Construction 5.10 4.60 4.10 3.60 3.60 3.60 3.60 3.60 3.55
Retailing, wholesaling and warehousing 4.60 4.10 3.60 3.10 3.10 3.10 3.10 3.10 3.06
Bottling and dairy products 4.69 4.19 3.69 3.19 3.19 3.19 3.19 3.19 3.15
Printing 5.00 4.50 4.00 3.50 3.50 3.50 3.50 3.50 3.45
Finance and insurance 5.49 4.99 4.49 3.99 3.99 3.99 3.99 3.99 3.94
Ship maintenance 5.01 4.51 4.01 3.51 3.42 3.34 3.34 3.34 3.3
Tour and travel services 4.98 4.48 3.98 3.48 3.39 3.31 3.31 3.31 3.22
Hotel 4.50 4.00 3.50 3.00 2.93 2.86 2.86 2.86 2.82
Private hospitals and educational institutions 4.83 4.33 3.83 3.33 3.33 3.33 3.33 3.33 3.29
Government employees 4.41 3.91 3.41 2.91 2.84 2.77 2.77 2.77 2.73
Garment manufacturing industry 4.18 3.68 3.18 2.68 2.68 2.68 2.68 2.68 2.64
Publishing 5.13 4.63 4.13 3.63 3.63 3.63 3.63 3.63 3.58
Miscellaneous activities 4.20 3.70 3.20 2.70 2.63 2.57 2.57 2.57 2.54
Note: The Fair Minimum Wage Act of 2007 (Public Law 110-28) applied the minimum wage rates
shown above to industries in American Samoa on May 25, 2009.
S.2009 Bill was passed by the U.S. Congress which postponed the fifty-cents increase until September 30, 2015.
SOURCE: Federal Registers
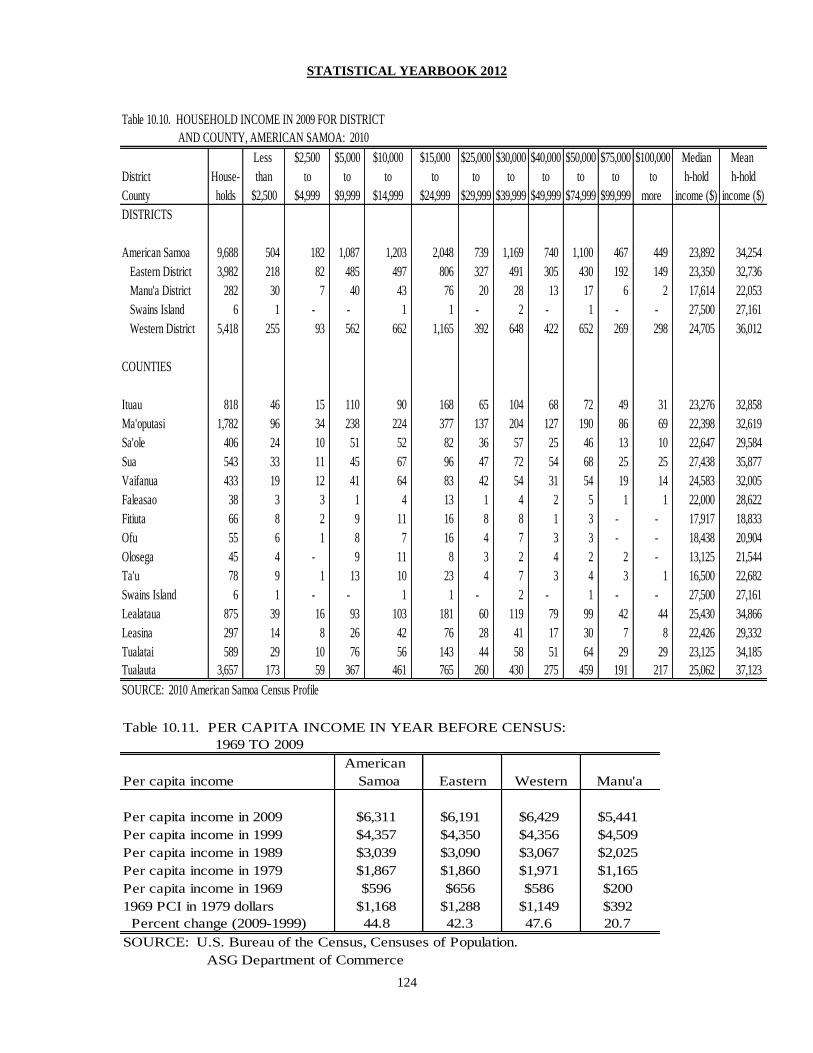
STATISTICAL YEARBOOK 2012
124
Table 10.10. HOUSEHOLD INCOME IN 2009 FOR DISTRICT
AND COUNTY, AMERICAN SAMOA: 2010
Less $2,500 $5,000 $10,000 $15,000 $25,000 $30,000 $40,000 $50,000 $75,000 $100,000 Median Mean
District House- than to to to to to to to to to to h-hold h-hold
County holds $2,500 $4,999 $9,999 $14,999 $24,999 $29,999 $39,999 $49,999 $74,999 $99,999 more income ($) income ($)
DISTRICTS
American Samoa 9,688 504 182 1,087 1,203 2,048 739 1,169 740 1,100 467 449 23,892 34,254
Eastern District 3,982 218 82 485 497 806 327 491 305 430 192 149 23,350 32,736
Manu'a District 282 30 7 40 43 76 20 28 13 17 6 2 17,614 22,053
Swains Island 6 1 - - 1 1 - 2 - 1 - - 27,500 27,161
Western District 5,418 255 93 562 662 1,165 392 648 422 652 269 298 24,705 36,012
COUNTIES
Ituau 818 46 15 110 90 168 65 104 68 72 49 31 23,276 32,858
Ma'oputasi 1,782 96 34 238 224 377 137 204 127 190 86 69 22,398 32,619
Sa'ole 406 24 10 51 52 82 36 57 25 46 13 10 22,647 29,584
Sua 543 33 11 45 67 96 47 72 54 68 25 25 27,438 35,877
Vaifanua 433 19 12 41 64 83 42 54 31 54 19 14 24,583 32,005
Faleasao 38 3 3 1 4 13 1 4 2 5 1 1 22,000 28,622
Fitiuta 66 8 2 9 11 16 8 8 1 3 - - 17,917 18,833
Ofu 55 6 1 8 7 16 4 7 3 3 - - 18,438 20,904
Olosega 45 4 - 9 11 8 3 2 4 2 2 - 13,125 21,544
Ta'u 78 9 1 13 10 23 4 7 3 4 3 1 16,500 22,682
Swains Island 6 1 - - 1 1 - 2 - 1 - - 27,500 27,161
Lealataua 875 39 16 93 103 181 60 119 79 99 42 44 25,430 34,866
Leasina 297 14 8 26 42 76 28 41 17 30 7 8 22,426 29,332
Tualatai 589 29 10 76 56 143 44 58 51 64 29 29 23,125 34,185
Tualauta 3,657 173 59 367 461 765 260 430 275 459 191 217 25,062 37,123
SOURCE: 2010 American Samoa Census Profile
Table 10.11. PER CAPITA INCOME IN YEAR BEFORE CENSUS:
1969 TO 2009
American
Per capita income Samoa Eastern Western Manu'a
Per capita income in 2009 $6,311 $6,191 $6,429 $5,441
Per capita income in 1999 $4,357 $4,350 $4,356 $4,509
Per capita income in 1989 $3,039 $3,090 $3,067 $2,025
Per capita income in 1979 $1,867 $1,860 $1,971 $1,165
Per capita income in 1969 $596 $656 $586 $200
1969 PCI in 1979 dollars $1,168 $1,288 $1,149 $392
Percent change (2009-1999) 44.8 42.3 47.6 20.7
SOURCE: U.S. Bureau of the Census, Censuses of Population.
ASG Department of Commerce
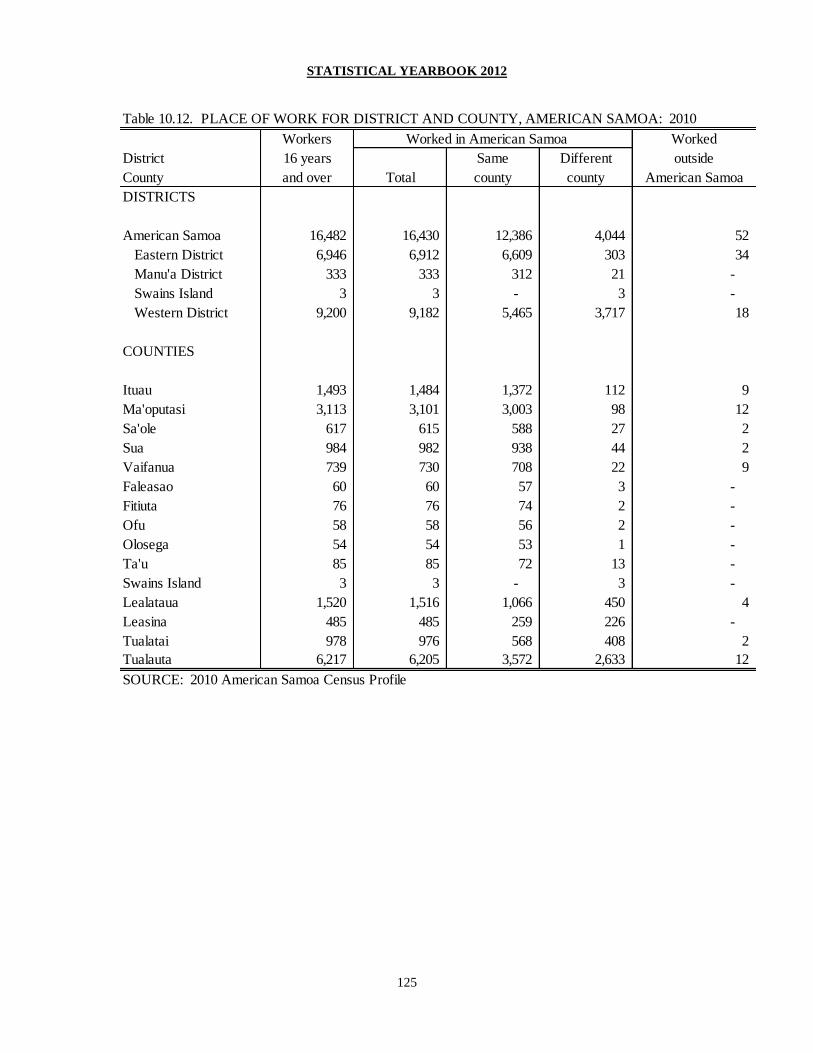
STATISTICAL YEARBOOK 2012
125
Table 10.12. PLACE OF WORK FOR DISTRICT AND COUNTY, AMERICAN SAMOA: 2010
Workers Worked in American Samoa Worked
District 16 years Same Different outside
County and over Total county county American Samoa
DISTRICTS
American Samoa 16,482 16,430 12,386 4,044 52
Eastern District 6,946 6,912 6,609 303 34
Manu'a District 333 333 312 21 -
Swains Island 3 3 - 3 -
Western District 9,200 9,182 5,465 3,717 18
COUNTIES
Ituau 1,493 1,484 1,372 112 9
Ma'oputasi 3,113 3,101 3,003 98 12
Sa'ole 617 615 588 27 2
Sua 984 982 938 44 2
Vaifanua 739 730 708 22 9
Faleasao 60 60 57 3 -
Fitiuta 76 76 74 2 -
Ofu 58 58 56 2 -
Olosega 54 54 53 1 -
Ta'u 85 85 72 13 -
Swains Island 3 3 - 3 -
Lealataua 1,520 1,516 1,066 450 4
Leasina 485 485 259 226 -
Tualatai 978 976 568 408 2
Tualauta 6,217 6,205 3,572 2,633 12
SOURCE: 2010 American Samoa Census Profile
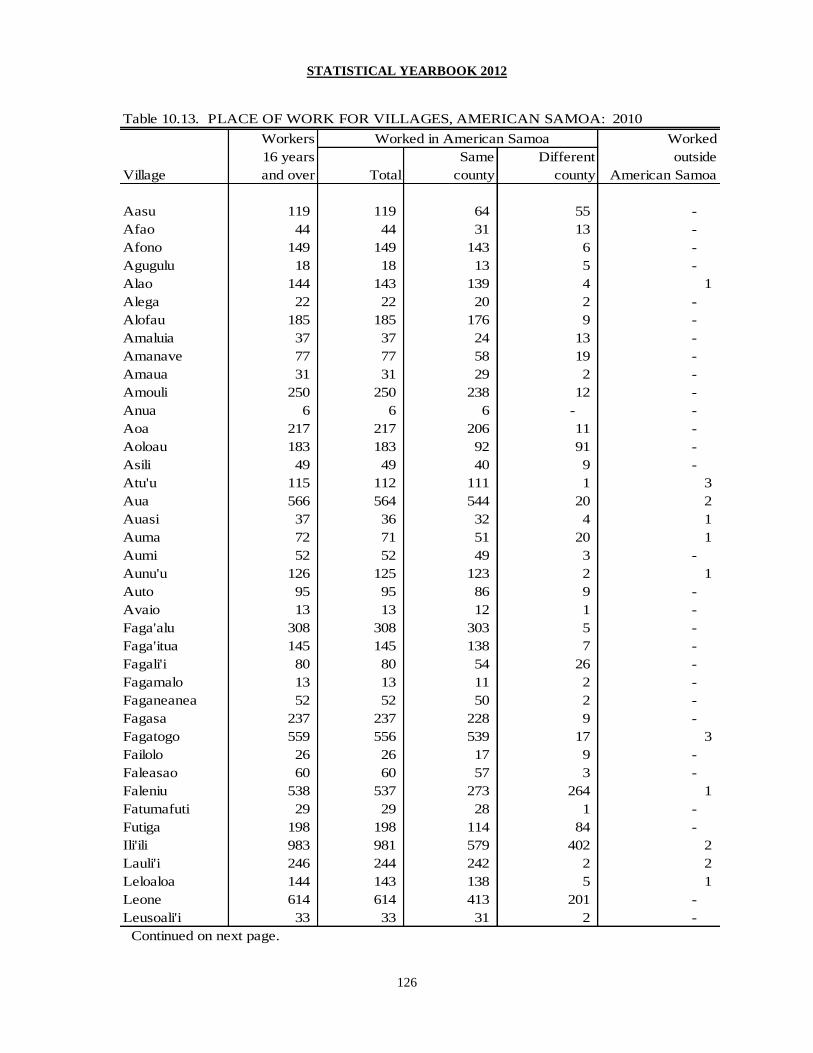
STATISTICAL YEARBOOK 2012
126
Table 10.13. PLACE OF WORK FOR VILLAGES, AMERICAN SAMOA: 2010
Workers Worked in American Samoa Worked
16 years Same Different outside
Village and over Total county county American Samoa
Aasu 119 119 64 55 -
Afao 44 44 31 13 -
Afono 149 149 143 6 -
Agugulu 18 18 13 5 -
Alao 144 143 139 4 1
Alega 22 22 20 2 -
Alofau 185 185 176 9 -
Amaluia 37 37 24 13 -
Amanave 77 77 58 19 -
Amaua 31 31 29 2 -
Amouli 250 250 238 12 -
Anua 6 6 6 - -
Aoa 217 217 206 11 -
Aoloau 183 183 92 91 -
Asili 49 49 40 9 -
Atu'u 115 112 111 1 3
Aua 566 564 544 20 2
Auasi 37 36 32 4 1
Auma 72 71 51 20 1
Aumi 52 52 49 3 -
Aunu'u 126 125 123 2 1
Auto 95 95 86 9 -
Avaio 13 13 12 1 -
Faga'alu 308 308 303 5 -
Faga'itua 145 145 138 7 -
Fagali'i 80 80 54 26 -
Fagamalo 13 13 11 2 -
Faganeanea 52 52 50 2 -
Fagasa 237 237 228 9 -
Fagatogo 559 556 539 17 3
Failolo 26 26 17 9 -
Faleasao 60 60 57 3 -
Faleniu 538 537 273 264 1
Fatumafuti 29 29 28 1 -
Futiga 198 198 114 84 -
Ili'ili 983 981 579 402 2
Lauli'i 246 244 242 2 2
Leloaloa 144 143 138 5 1
Leone 614 614 413 201 -
Leusoali'i 33 33 31 2 -
Continued on next page.

STATISTICAL YEARBOOK 2012
127
Table 10.13. PLACE OF WORK FOR VILLAGES, AMERICAN SAMOA: 2010 (continued)
Workers Worked in American Samoa Worked
16 years Same Different outside
Village and over Total county county Americn Samoa
Luma 46 46 35 11 -
Maia 43 43 43 - -
Malaeimi 372 372 220 152 -
Malaeloa/A 183 183 103 80 -
Malaeloa/I 148 148 85 63 -
Maloata 6 6 3 3 -
Mapusagafou 302 302 192 110 -
Masausi 59 59 54 5 -
Masefau 114 114 109 5 -
Matu'u 124 124 118 6 -
Mesepa 159 159 84 75 -
Nua 32 32 17 15 -
Nu'uuli 1,296 1,287 1,008 279 9
Ofu 58 58 56 2 -
Olosega 52 52 51 1 -
Onenoa 36 36 36 - -
Pagai 37 37 37 - -
Pago Pago 1,069 1,066 1,033 33 3
Pava'ia'i 685 684 415 269 1
Poloa 53 51 37 14 2
Puapua 305 305 232 73 -
Sa'ilele 15 15 13 2 -
Satala 109 109 104 5 -
Se'etaga 82 82 60 22 -
Sili 2 2 2 - -
Si'ufaga 39 39 37 2 -
Swains 3 3 - 3 -
Tafuna 2,432 2,426 1,478 948 6
Taputimu 235 234 133 101 1
Tula 137 134 131 3 3
Utulei 208 208 197 11 -
Utumea East 11 11 11 - -
Utumea West 12 11 5 6 1
Utusia 14 14 14 - -
Vailoatai 397 396 236 160 1
Vaitogi 530 528 299 229 2
Vatia 205 200 196 4 5
SOURCE: 2010 American Samoa Census Profile

STATISTICAL YEARBOOK 2012
128
Table 10.14. POVERTY STATUS AND WORKERS IN FAMILY IN 2009 BY ETHNIC ORIGIN OR RACE, AMERICAN SAMOA: 2010
Samoan Tongan
Other
Native
Hawaiian
and Other
Pacific
Islander Filipino
Other
Asian
All incom levels in 2009
All families [1,2] 8,834 8,638 7,725 299 91 207 109 207 196
With related children under 18 years 7,344 7,187 6,535 262 61 147 60 122 157
With related children age under 5 years 3,998 3,924 3,592 150 36 61 24 61 74
Families with female householder, no husband present [1,2] 1,630 1,592 1,479 41 16 33 11 12 38
With related children under 18 years 1,303 1,278 1,204 33 10 17 6 8 25
With related children under 5 years 660 652 618 19 5 6 2 2 8
All individuals 55,009 53,560 48,931 1,605 447 1,193 748 636 1,449
Under 18 years 23,185 22,423 21,301 625 100 226 80 91 762
Related children under 18 years 23,110 22,356 21,254 624 99 225 64 90 754
18 to 64 years 29,567 28,922 25,654 907 329 938 640 454 645
18 years and over 31,824 31,137 27,630 980 347 967 668 545 687
65 years and over 2,257 2,215 1,976 73 18 29 28 91 42
Unrelated individuals 2,709 2,611 1,390 77 119 394 432 199 98
Below poverty level in 2009
All families [1,2] 4,810 4,752 4,311 227 47 87 44 36 58
With related children under 18 years 4,399 4,346 3,958 213 38 74 34 29 53
With related children under 5 years 2,592 2,560 2,337 127 24 39 16 17 32
Families with female householder, no husband present [1,2] 895 883 818 28 8 15 8 6 12
With related children under 18 years 787 778 728 25 6 9 5 5 9
With related children under 5 years 422 420 395 14 4 4 1 2 2
Continued on next page.
Asian
Other Ethnic
Origin or
Race
Two or More
Ethnic
Origins or
RacesTotalTotal
One Ethnic Origin or Race
Native Hawaiian and Other
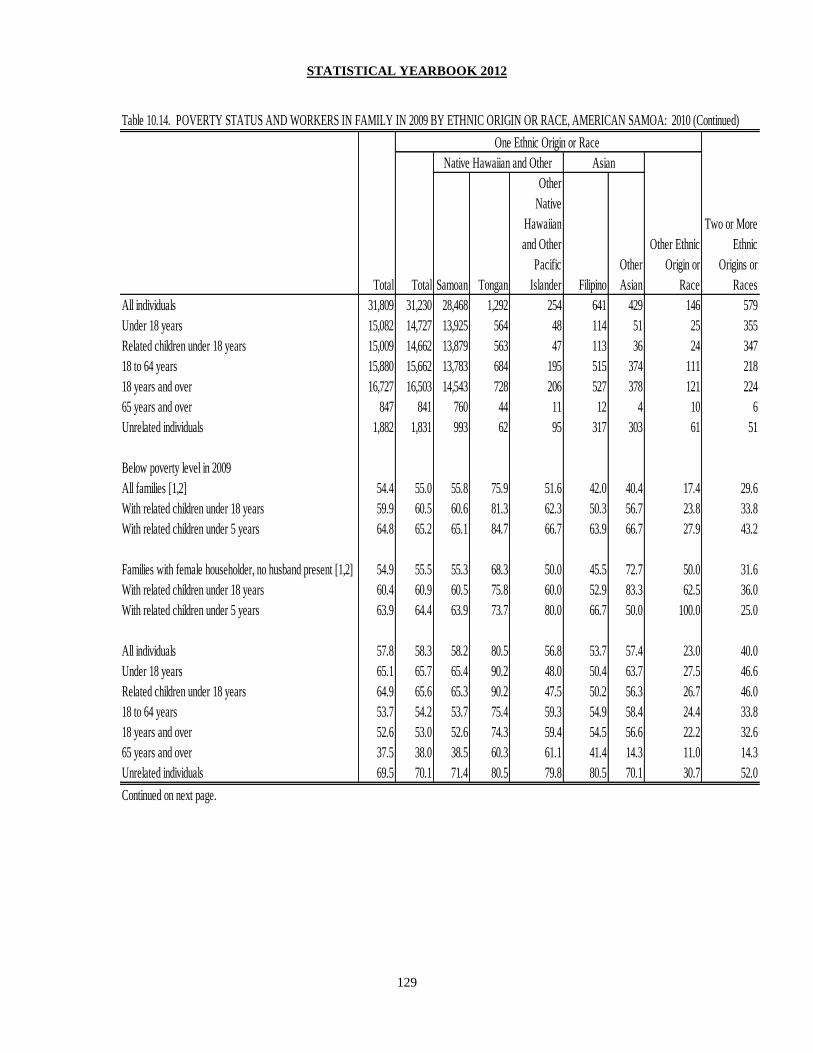
STATISTICAL YEARBOOK 2012
129
Table 10.14. POVERTY STATUS AND WORKERS IN FAMILY IN 2009 BY ETHNIC ORIGIN OR RACE, AMERICAN SAMOA: 2010 (Continued)
Samoan Tongan
Other
Native
Hawaiian
and Other
Pacific
Islander Filipino
Other
Asian
All individuals 31,809 31,230 28,468 1,292 254 641 429 146 579
Under 18 years 15,082 14,727 13,925 564 48 114 51 25 355
Related children under 18 years 15,009 14,662 13,879 563 47 113 36 24 347
18 to 64 years 15,880 15,662 13,783 684 195 515 374 111 218
18 years and over 16,727 16,503 14,543 728 206 527 378 121 224
65 years and over 847 841 760 44 11 12 4 10 6
Unrelated individuals 1,882 1,831 993 62 95 317 303 61 51
Below poverty level in 2009
All families [1,2] 54.4 55.0 55.8 75.9 51.6 42.0 40.4 17.4 29.6
With related children under 18 years 59.9 60.5 60.6 81.3 62.3 50.3 56.7 23.8 33.8
With related children under 5 years 64.8 65.2 65.1 84.7 66.7 63.9 66.7 27.9 43.2
Families with female householder, no husband present [1,2] 54.9 55.5 55.3 68.3 50.0 45.5 72.7 50.0 31.6
With related children under 18 years 60.4 60.9 60.5 75.8 60.0 52.9 83.3 62.5 36.0
With related children under 5 years 63.9 64.4 63.9 73.7 80.0 66.7 50.0 100.0 25.0
All individuals 57.8 58.3 58.2 80.5 56.8 53.7 57.4 23.0 40.0
Under 18 years 65.1 65.7 65.4 90.2 48.0 50.4 63.7 27.5 46.6
Related children under 18 years 64.9 65.6 65.3 90.2 47.5 50.2 56.3 26.7 46.0
18 to 64 years 53.7 54.2 53.7 75.4 59.3 54.9 58.4 24.4 33.8
18 years and over 52.6 53.0 52.6 74.3 59.4 54.5 56.6 22.2 32.6
65 years and over 37.5 38.0 38.5 60.3 61.1 41.4 14.3 11.0 14.3
Unrelated individuals 69.5 70.1 71.4 80.5 79.8 80.5 70.1 30.7 52.0
Continued on next page.
Other Ethnic
Origin or
RaceTotal
Two or More
Ethnic
Origins or
Races
One Ethnic Origin or Race
Total
Native Hawaiian and Other Asian
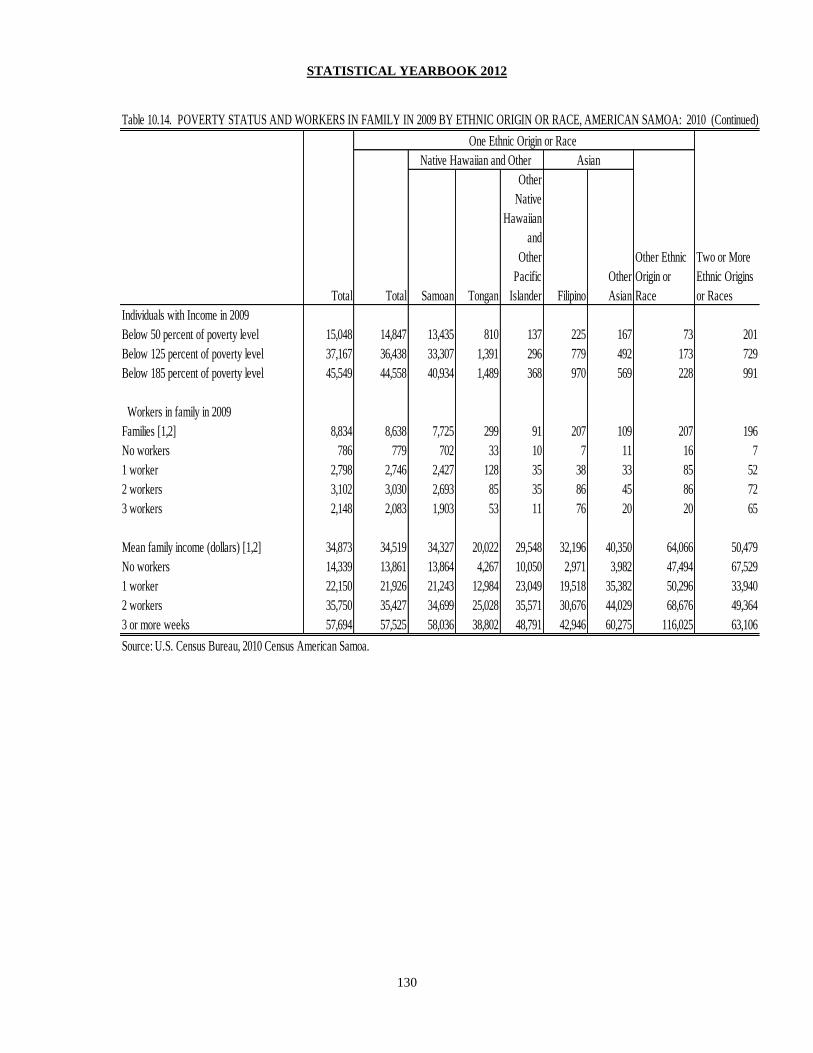
STATISTICAL YEARBOOK 2012
130
Table 10.14. POVERTY STATUS AND WORKERS IN FAMILY IN 2009 BY ETHNIC ORIGIN OR RACE, AMERICAN SAMOA: 2010 (Continued)
Samoan Tongan
Other
Native
Hawaiian
and
Other
Pacific
Islander Filipino
Other
Asian
Individuals with Income in 2009
Below 50 percent of poverty level 15,048 14,847 13,435 810 137 225 167 73 201
Below 125 percent of poverty level 37,167 36,438 33,307 1,391 296 779 492 173 729
Below 185 percent of poverty level 45,549 44,558 40,934 1,489 368 970 569 228 991
Workers in family in 2009
Families [1,2] 8,834 8,638 7,725 299 91 207 109 207 196
No workers 786 779 702 33 10 7 11 16 7
1 worker 2,798 2,746 2,427 128 35 38 33 85 52
2 workers 3,102 3,030 2,693 85 35 86 45 86 72
3 workers 2,148 2,083 1,903 53 11 76 20 20 65
Mean family income (dollars) [1,2] 34,873 34,519 34,327 20,022 29,548 32,196 40,350 64,066 50,479
No workers 14,339 13,861 13,864 4,267 10,050 2,971 3,982 47,494 67,529
1 worker 22,150 21,926 21,243 12,984 23,049 19,518 35,382 50,296 33,940
2 workers 35,750 35,427 34,699 25,028 35,571 30,676 44,029 68,676 49,364
3 or more weeks 57,694 57,525 58,036 38,802 48,791 42,946 60,275 116,025 63,106
Source: U.S. Census Bureau, 2010 Census American Samoa.
Total
One Ethnic Origin or Race
Two or More
Ethnic Origins
or RacesTotal
Native Hawaiian and Other Asian
Other Ethnic
Origin or
Race
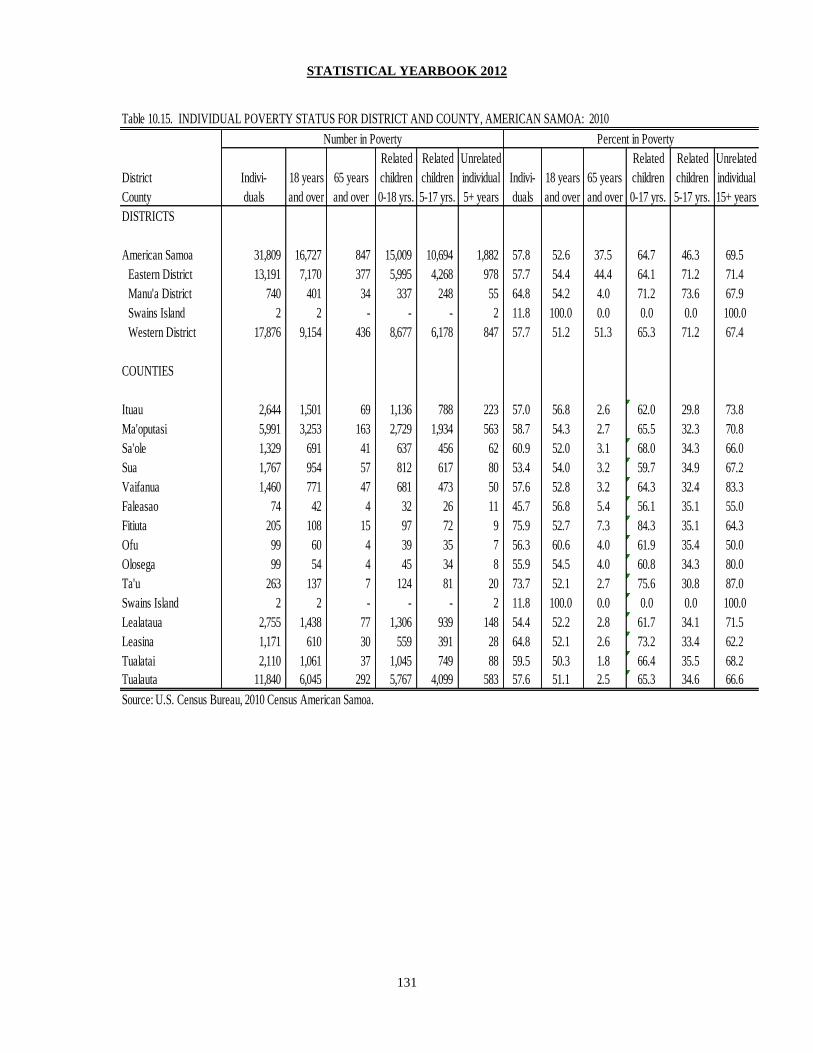
STATISTICAL YEARBOOK 2012
131
Table 10.15. INDIVIDUAL POVERTY STATUS FOR DISTRICT AND COUNTY, AMERICAN SAMOA: 2010
Related Related Unrelated Related Related Unrelated
District Indivi- 18 years 65 years children children individual Indivi- 18 years 65 years children children individual
County duals and over and over 0-18 yrs. 5-17 yrs. 5+ years duals and over and over 0-17 yrs. 5-17 yrs. 15+ years
DISTRICTS
American Samoa 31,809 16,727 847 15,009 10,694 1,882 57.8 52.6 37.5 64.7 46.3 69.5
Eastern District 13,191 7,170 377 5,995 4,268 978 57.7 54.4 44.4 64.1 71.2 71.4
Manu'a District 740 401 34 337 248 55 64.8 54.2 4.0 71.2 73.6 67.9
Swains Island 2 2 - - - 2 11.8 100.0 0.0 0.0 0.0 100.0
Western District 17,876 9,154 436 8,677 6,178 847 57.7 51.2 51.3 65.3 71.2 67.4
COUNTIES
Ituau 2,644 1,501 69 1,136 788 223 57.0 56.8 2.6 62.0 29.8 73.8
Ma'oputasi 5,991 3,253 163 2,729 1,934 563 58.7 54.3 2.7 65.5 32.3 70.8
Sa'ole 1,329 691 41 637 456 62 60.9 52.0 3.1 68.0 34.3 66.0
Sua 1,767 954 57 812 617 80 53.4 54.0 3.2 59.7 34.9 67.2
Vaifanua 1,460 771 47 681 473 50 57.6 52.8 3.2 64.3 32.4 83.3
Faleasao 74 42 4 32 26 11 45.7 56.8 5.4 56.1 35.1 55.0
Fitiuta 205 108 15 97 72 9 75.9 52.7 7.3 84.3 35.1 64.3
Ofu 99 60 4 39 35 7 56.3 60.6 4.0 61.9 35.4 50.0
Olosega 99 54 4 45 34 8 55.9 54.5 4.0 60.8 34.3 80.0
Ta'u 263 137 7 124 81 20 73.7 52.1 2.7 75.6 30.8 87.0
Swains Island 2 2 - - - 2 11.8 100.0 0.0 0.0 0.0 100.0
Lealataua 2,755 1,438 77 1,306 939 148 54.4 52.2 2.8 61.7 34.1 71.5
Leasina 1,171 610 30 559 391 28 64.8 52.1 2.6 73.2 33.4 62.2
Tualatai 2,110 1,061 37 1,045 749 88 59.5 50.3 1.8 66.4 35.5 68.2
Tualauta 11,840 6,045 292 5,767 4,099 583 57.6 51.1 2.5 65.3 34.6 66.6
Source: U.S. Census Bureau, 2010 Census American Samoa.
Number in Poverty Percent in Poverty

STATISTICAL YEARBOOK 2012
132
Table 10.16. FAMILY POVERTY STATUS IN 2009 FOR DISTRICT
AND COUNTY, AMERICAN SAMOA: 2010
Number in poverty Percent in poverty
With related With related With related With related
Districts children under children under children under children under
County Families 18 years 5 years Families 18 years 5 years
DISTRICTS
American Samoa 4,810 4,399 2,592 54.4 59.9 64.8
Eastern District 1,995 1,795 1,038 41.5 40.8 40.0
Manu'a District 138 119 55 2.9 2.7 2.1
Swains Island 0 0 0 0.0 0.0 0.0
Western District 2,677 2,485 1,499 55.7 56.5 57.8
COUNTIES
Ituau 407 352 209 8.5 8.0 8.1
Ma'oputasi 878 810 482 18.3 18.4 18.6
Sa'ole 210 188 110 4.4 4.3 4.2
Sua 267 235 121 5.6 5.3 4.7
Vaifanua 233 210 116 4.8 4.8 4.5
Faleasao 12 10 4 0.2 0.2 0.2
Fitiuta 39 34 16 0.8 0.8 0.6
Ofu 23 21 3 0.5 0.5 0.1
Olosega 21 17 8 0.4 0.4 0.3
Ta'u 43 37 24 0.9 0.8 0.9
Swains Island 0 0 0 0.0 0.0 0.0
Lealataua 420 380 219 8.7 8.6 8.4
Leasina 169 161 103 3.5 3.7 4.0
Tualatai 308 286 177 6.4 6.5 6.8
Tualauta 1,780 1,658 1,000 37.0 37.7 38.6
Source: U.S. Census Bureau, 2010 Census American Samoa.
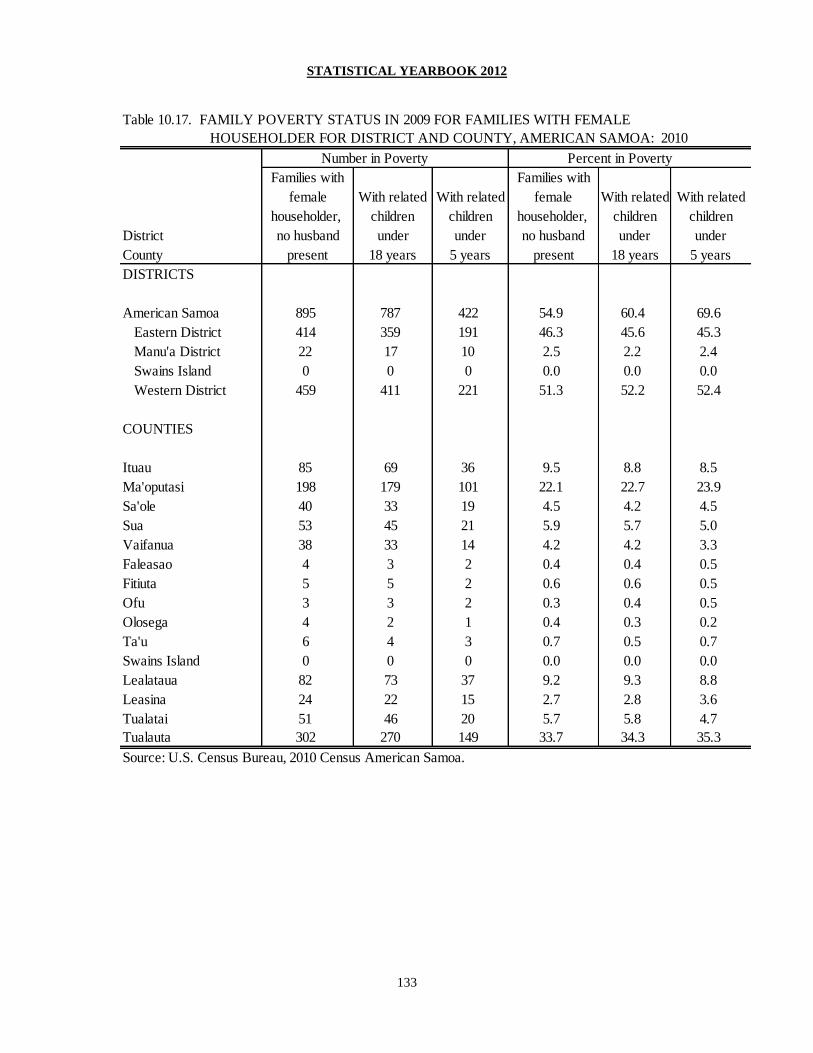
STATISTICAL YEARBOOK 2012
133
Table 10.17. FAMILY POVERTY STATUS IN 2009 FOR FAMILIES WITH FEMALE
HOUSEHOLDER FOR DISTRICT AND COUNTY, AMERICAN SAMOA: 2010
Number in Poverty Percent in Poverty
Families with Families with
female With related With related female With related With related
householder, children children householder, children children
District no husband under under no husband under under
County present 18 years 5 years present 18 years 5 years
DISTRICTS
American Samoa 895 787 422 54.9 60.4 69.6
Eastern District 414 359 191 46.3 45.6 45.3
Manu'a District 22 17 10 2.5 2.2 2.4
Swains Island 0 0 0 0.0 0.0 0.0
Western District 459 411 221 51.3 52.2 52.4
COUNTIES
Ituau 85 69 36 9.5 8.8 8.5
Ma'oputasi 198 179 101 22.1 22.7 23.9
Sa'ole 40 33 19 4.5 4.2 4.5
Sua 53 45 21 5.9 5.7 5.0
Vaifanua 38 33 14 4.2 4.2 3.3
Faleasao 4 3 2 0.4 0.4 0.5
Fitiuta 5 5 2 0.6 0.6 0.5
Ofu 3 3 2 0.3 0.4 0.5
Olosega 4 2 1 0.4 0.3 0.2
Ta'u 6 4 3 0.7 0.5 0.7
Swains Island 0 0 0 0.0 0.0 0.0
Lealataua 82 73 37 9.2 9.3 8.8
Leasina 24 22 15 2.7 2.8 3.6
Tualatai 51 46 20 5.7 5.8 4.7
Tualauta 302 270 149 33.7 34.3 35.3
Source: U.S. Census Bureau, 2010 Census American Samoa.
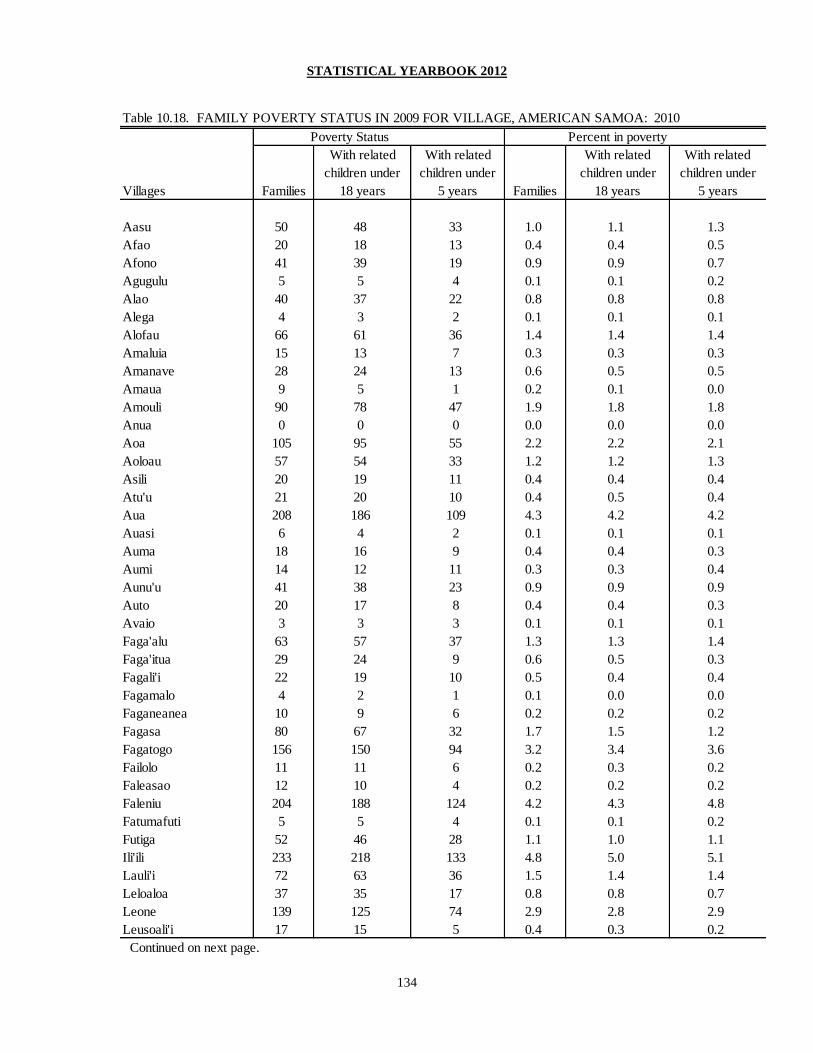
STATISTICAL YEARBOOK 2012
134
Table 10.18. FAMILY POVERTY STATUS IN 2009 FOR VILLAGE, AMERICAN SAMOA: 2010
Poverty Status Percent in poverty
With related With related With related With related
children under children under children under children under
Villages Families 18 years 5 years Families 18 years 5 years
Aasu 50 48 33 1.0 1.1 1.3
Afao 20 18 13 0.4 0.4 0.5
Afono 41 39 19 0.9 0.9 0.7
Agugulu 5 5 4 0.1 0.1 0.2
Alao 40 37 22 0.8 0.8 0.8
Alega 4 3 2 0.1 0.1 0.1
Alofau 66 61 36 1.4 1.4 1.4
Amaluia 15 13 7 0.3 0.3 0.3
Amanave 28 24 13 0.6 0.5 0.5
Amaua 9 5 1 0.2 0.1 0.0
Amouli 90 78 47 1.9 1.8 1.8
Anua 0 0 0 0.0 0.0 0.0
Aoa 105 95 55 2.2 2.2 2.1
Aoloau 57 54 33 1.2 1.2 1.3
Asili 20 19 11 0.4 0.4 0.4
Atu'u 21 20 10 0.4 0.5 0.4
Aua 208 186 109 4.3 4.2 4.2
Auasi 6 4 2 0.1 0.1 0.1
Auma 18 16 9 0.4 0.4 0.3
Aumi 14 12 11 0.3 0.3 0.4
Aunu'u 41 38 23 0.9 0.9 0.9
Auto 20 17 8 0.4 0.4 0.3
Avaio 3 3 3 0.1 0.1 0.1
Faga'alu 63 57 37 1.3 1.3 1.4
Faga'itua 29 24 9 0.6 0.5 0.3
Fagali'i 22 19 10 0.5 0.4 0.4
Fagamalo 4 2 1 0.1 0.0 0.0
Faganeanea 10 9 6 0.2 0.2 0.2
Fagasa 80 67 32 1.7 1.5 1.2
Fagatogo 156 150 94 3.2 3.4 3.6
Failolo 11 11 6 0.2 0.3 0.2
Faleasao 12 10 4 0.2 0.2 0.2
Faleniu 204 188 124 4.2 4.3 4.8
Fatumafuti 5 5 4 0.1 0.1 0.2
Futiga 52 46 28 1.1 1.0 1.1
Ili'ili 233 218 133 4.8 5.0 5.1
Lauli'i 72 63 36 1.5 1.4 1.4
Leloaloa 37 35 17 0.8 0.8 0.7
Leone 139 125 74 2.9 2.8 2.9
Leusoali'i 17 15 5 0.4 0.3 0.2
Continued on next page.
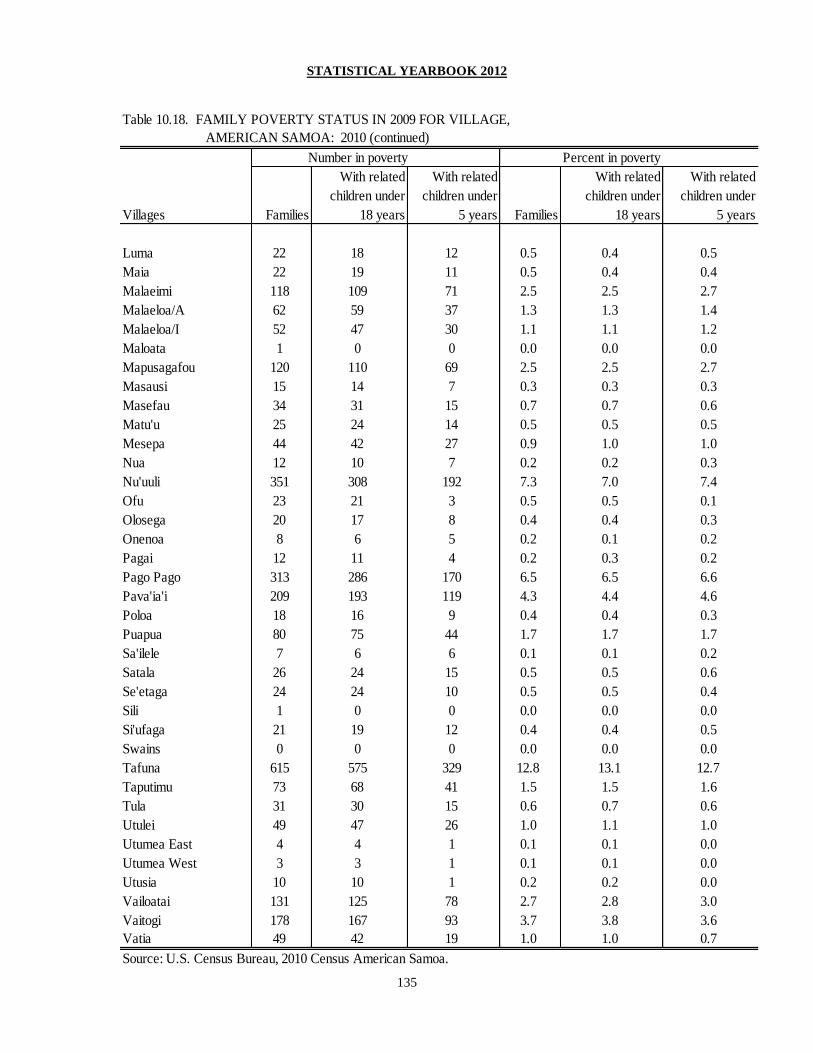
STATISTICAL YEARBOOK 2012
135
Table 10.18. FAMILY POVERTY STATUS IN 2009 FOR VILLAGE,
AMERICAN SAMOA: 2010 (continued)
Number in poverty Percent in poverty
With related With related With related With related
children under children under children under children under
Villages Families 18 years 5 years Families 18 years 5 years
Luma 22 18 12 0.5 0.4 0.5
Maia 22 19 11 0.5 0.4 0.4
Malaeimi 118 109 71 2.5 2.5 2.7
Malaeloa/A 62 59 37 1.3 1.3 1.4
Malaeloa/I 52 47 30 1.1 1.1 1.2
Maloata 1 0 0 0.0 0.0 0.0
Mapusagafou 120 110 69 2.5 2.5 2.7
Masausi 15 14 7 0.3 0.3 0.3
Masefau 34 31 15 0.7 0.7 0.6
Matu'u 25 24 14 0.5 0.5 0.5
Mesepa 44 42 27 0.9 1.0 1.0
Nua 12 10 7 0.2 0.2 0.3
Nu'uuli 351 308 192 7.3 7.0 7.4
Ofu 23 21 3 0.5 0.5 0.1
Olosega 20 17 8 0.4 0.4 0.3
Onenoa 8 6 5 0.2 0.1 0.2
Pagai 12 11 4 0.2 0.3 0.2
Pago Pago 313 286 170 6.5 6.5 6.6
Pava'ia'i 209 193 119 4.3 4.4 4.6
Poloa 18 16 9 0.4 0.4 0.3
Puapua 80 75 44 1.7 1.7 1.7
Sa'ilele 7 6 6 0.1 0.1 0.2
Satala 26 24 15 0.5 0.5 0.6
Se'etaga 24 24 10 0.5 0.5 0.4
Sili 1 0 0 0.0 0.0 0.0
Si'ufaga 21 19 12 0.4 0.4 0.5
Swains 0 0 0 0.0 0.0 0.0
Tafuna 615 575 329 12.8 13.1 12.7
Taputimu 73 68 41 1.5 1.5 1.6
Tula 31 30 15 0.6 0.7 0.6
Utulei 49 47 26 1.0 1.1 1.0
Utumea East 4 4 1 0.1 0.1 0.0
Utumea West 3 3 1 0.1 0.1 0.0
Utusia 10 10 1 0.2 0.2 0.0
Vailoatai 131 125 78 2.7 2.8 3.0
Vaitogi 178 167 93 3.7 3.8 3.6
Vatia 49 42 19 1.0 1.0 0.7
Source: U.S. Census Bureau, 2010 Census American Samoa.

STATISTICAL YEARBOOK 2012
136
Section Eleven
CONSUMER PRICES AND EXPENDITURES
This section presents statistical data on local consumer prices and indices with some
household expenditure information from previous household surveys.
American Samoa initiated a Consumer Price Index rebase in the fourth quarter of 2007.
Commodity descriptions and household spending details from the 2005 household
income and expenditure survey were utilized for creating new CPI weights distributions.
The current CPI was expanded and added three new subgroups making it 9 subgroups
now. Two other major revisions were done to the CPI since the inception in 1974. The
first revision was carried out in 1982 after consultation with an SPC CPI expert and then
another one in 1997 using the 1995 household income and expenditure survey results.
Table 11.1 shows the Consumer Price Index in 2012 registered at an average of 129.7
index points for All Items. The average inflation rate in 2012 was calculated at 3.3
percent. Table 11.4 shows average retail prices of selected commodities from 2002-
2012. Units for a few commodities were changed and noted on the bottom of the table.
Since there is no final report for the 2005 Household Income and Expenditure Survey
(HIES), household expenditures from the 1995 HIES is still being published until a new
HIES is conducted.

STATISTICAL YEARBOOK 2012
137
Table 11.1 CONSUMER PRICE INDEX BY QUARTER: 2008 TO 2012
Quarter 2012 2011 2010 2009 2008
Inflation rate 4 2.4 6.9 4.5 0.6 12.2
3 2.7 6.9 4.6 0.4 13.6
2 3.8 7.9 4.8 4.9 8.6
1 4.3 7.2 5.3 7.3 7.7
All Items 4 130.5 126.1 118.0 112.9 112.2
3 130.2 125.5 117.4 112.2 111.7
2 130.0 124.0 114.9 109.6 104.5
1 128.0 121.4 114.5 108.7 101.3
Food 4 152.2 144.9 138.4 127.6 122.9
3 151.8 143.4 138.4 126.6 119.1
2 151.7 142.2 130.9 124.3 108.2
1 148.4 138.9 129.9 121.9 101.9
Housing 4 130.8 125.3 113.1 106.5 117.2
3 130.5 124.6 111.3 105.7 119.2
2 130.4 120.2 107.6 103.8 107.8
1 135.5 115.5 107.9 107.3 102.7
Apparel 4 117.4 116.6 107.3 100.0 103.0
3 117.9 115.9 107.4 99.3 107.7
2 117.9 115.5 108.2 99.0 100.0
1 117.0 113.8 108.2 96.3 100.0
Transportation 4 124.5 124.7 117.9 119.8 109.4
3 129.7 124.8 117.2 119.4 107.4
2 129.7 125.2 117.2 113.1 102.6
1 128.7 123.0 117.5 107.9 101.1
Alcohol/Tobacco 4 137.2 138.8 120.6 110.0 100.0
3 124.9 135.5 120.2 106.1 103.3
2 125.8 136.1 123.7 103.2 105.1
1 125.2 133.8 113.6 101.9 100.0
Others 4 117.4 114.3 109.8 109.7 103.9
3 126.0 114.8 109.7 109.7 100.3
2 107.4 114.4 109.9 106.1 99.9
1 107.3 114.0 109.3 105.6 99.8
Recreation 4 119.3 115.2 103.0 102.1 99.4
3 117.7 114.9 103.0 100.3 102.6
2 118.1 112.9 104.9 99.9 100.0
1 117.8 112.3 104.1 99.7 100.0
Medical Care 4 128.2 107.5 104.5 102.4 101.7
3 102.6 107.7 104.5 102.5 101.1
2 102.6 107.7 103.9 102.2 100.3
1 101.9 106.8 103.9 101.8 100.2
Education/Commu-
nication 4 102.8 101.9 101.3 101.1 100.3
3 117.4 102.1 101.1 101.1 100.1
2 117.3 101.8 101.1 101.1 100.0
1 116.3 101.8 101.1 101.1 100.0
Note: The American Samoa new CPI base period was the 4th quarter of 2007.
New categories Recreation, Medical Care and Education/Communication were added
in the latest revision of the CPI.
Source: ASG Department of Commerce.
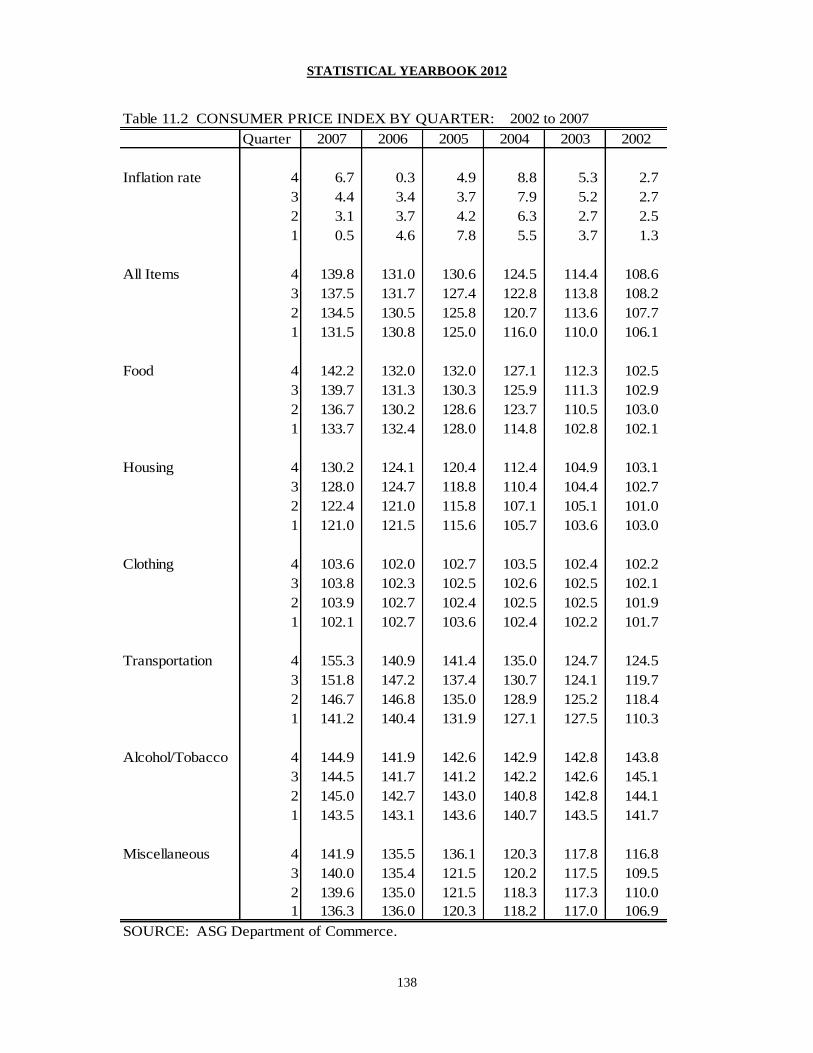
STATISTICAL YEARBOOK 2012
138
Table 11.2 CONSUMER PRICE INDEX BY QUARTER: 2002 to 2007
Quarter 2007 2006 2005 2004 2003 2002
Inflation rate 4 6.7 0.3 4.9 8.8 5.3 2.7
3 4.4 3.4 3.7 7.9 5.2 2.7
2 3.1 3.7 4.2 6.3 2.7 2.5
1 0.5 4.6 7.8 5.5 3.7 1.3
All Items 4 139.8 131.0 130.6 124.5 114.4 108.6
3 137.5 131.7 127.4 122.8 113.8 108.2
2 134.5 130.5 125.8 120.7 113.6 107.7
1 131.5 130.8 125.0 116.0 110.0 106.1
Food 4 142.2 132.0 132.0 127.1 112.3 102.5
3 139.7 131.3 130.3 125.9 111.3 102.9
2 136.7 130.2 128.6 123.7 110.5 103.0
1 133.7 132.4 128.0 114.8 102.8 102.1
Housing 4 130.2 124.1 120.4 112.4 104.9 103.1
3 128.0 124.7 118.8 110.4 104.4 102.7
2 122.4 121.0 115.8 107.1 105.1 101.0
1 121.0 121.5 115.6 105.7 103.6 103.0
Clothing 4 103.6 102.0 102.7 103.5 102.4 102.2
3 103.8 102.3 102.5 102.6 102.5 102.1
2 103.9 102.7 102.4 102.5 102.5 101.9
1 102.1 102.7 103.6 102.4 102.2 101.7
Transportation 4 155.3 140.9 141.4 135.0 124.7 124.5
3 151.8 147.2 137.4 130.7 124.1 119.7
2 146.7 146.8 135.0 128.9 125.2 118.4
1 141.2 140.4 131.9 127.1 127.5 110.3
Alcohol/Tobacco 4 144.9 141.9 142.6 142.9 142.8 143.8
3 144.5 141.7 141.2 142.2 142.6 145.1
2 145.0 142.7 143.0 140.8 142.8 144.1
1 143.5 143.1 143.6 140.7 143.5 141.7
Miscellaneous 4 141.9 135.5 136.1 120.3 117.8 116.8
3 140.0 135.4 121.5 120.2 117.5 109.5
2 139.6 135.0 121.5 118.3 117.3 110.0
1 136.3 136.0 120.3 118.2 117.0 106.9
SOURCE: ASG Department of Commerce.
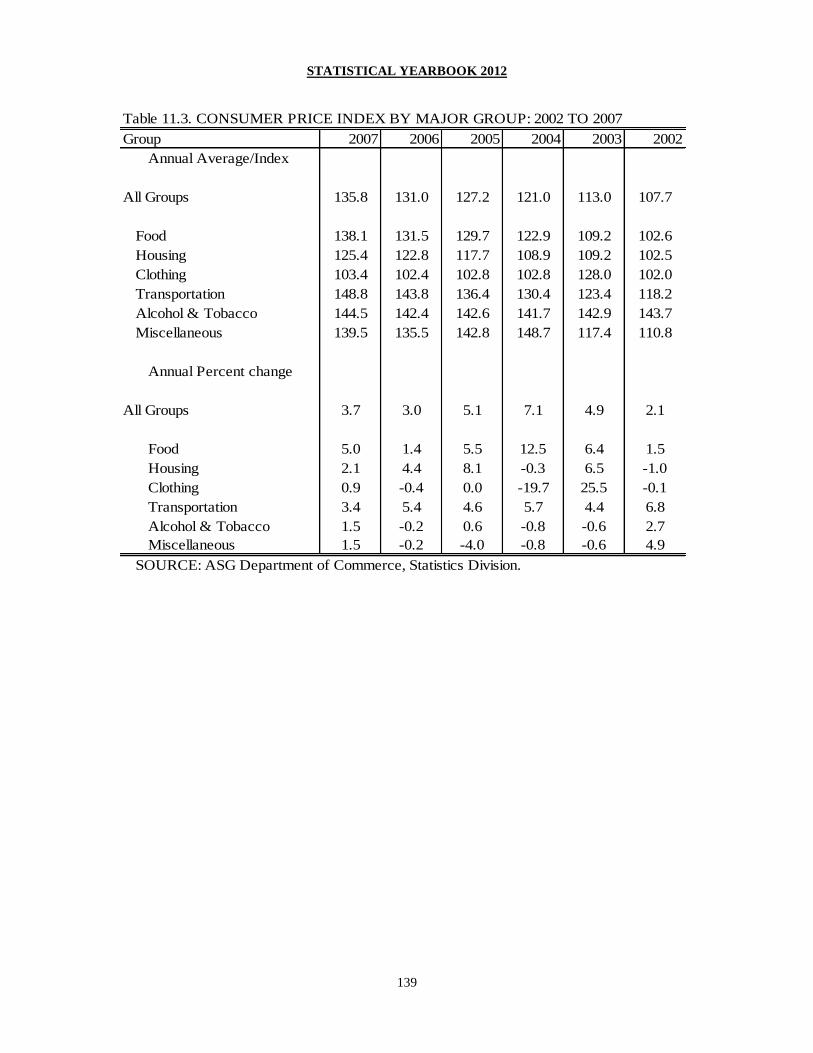
STATISTICAL YEARBOOK 2012
139
Table 11.3. CONSUMER PRICE INDEX BY MAJOR GROUP: 2002 TO 2007
Group 2007 2006 2005 2004 2003 2002
Annual Average/Index
All Groups 135.8 131.0 127.2 121.0 113.0 107.7
Food 138.1 131.5 129.7 122.9 109.2 102.6
Housing 125.4 122.8 117.7 108.9 109.2 102.5
Clothing 103.4 102.4 102.8 102.8 128.0 102.0
Transportation 148.8 143.8 136.4 130.4 123.4 118.2
Alcohol & Tobacco 144.5 142.4 142.6 141.7 142.9 143.7
Miscellaneous 139.5 135.5 142.8 148.7 117.4 110.8
Annual Percent change
All Groups 3.7 3.0 5.1 7.1 4.9 2.1
Food 5.0 1.4 5.5 12.5 6.4 1.5
Housing 2.1 4.4 8.1 -0.3 6.5 -1.0
Clothing 0.9 -0.4 0.0 -19.7 25.5 -0.1
Transportation 3.4 5.4 4.6 5.7 4.4 6.8
Alcohol & Tobacco 1.5 -0.2 0.6 -0.8 -0.6 2.7
Miscellaneous 1.5 -0.2 -4.0 -0.8 -0.6 4.9
SOURCE: ASG Department of Commerce, Statistics Division.
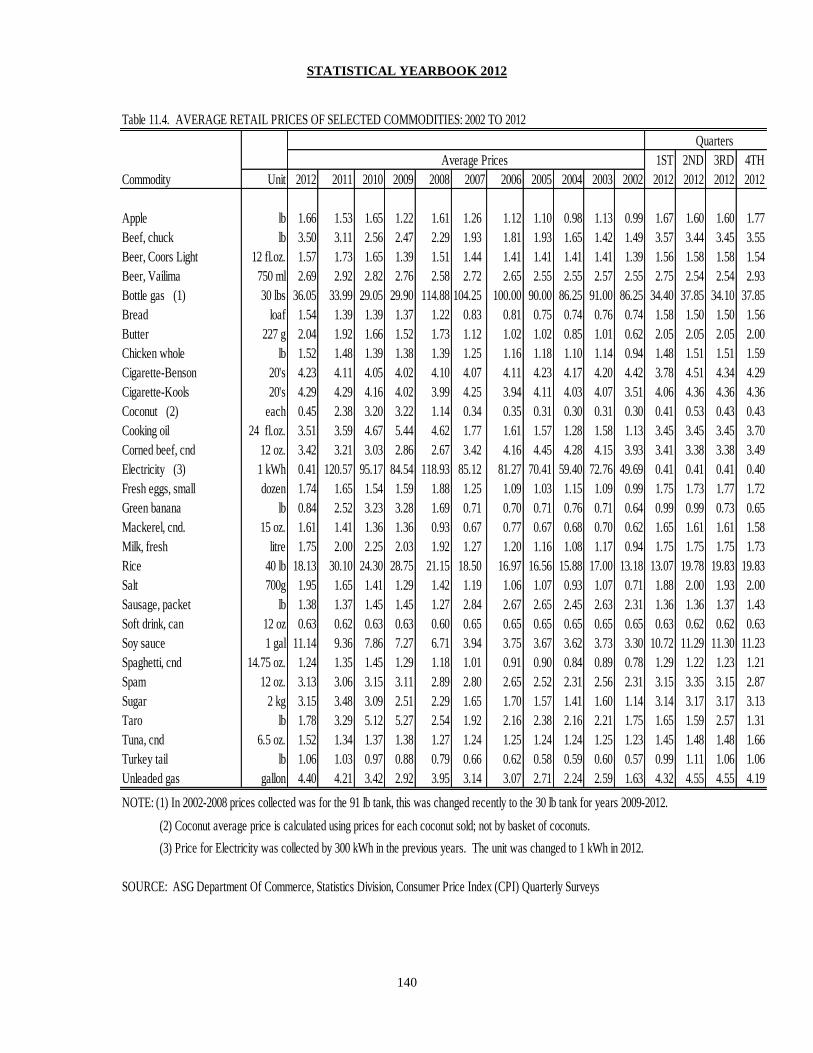
STATISTICAL YEARBOOK 2012
140
Table 11.4. AVERAGE RETAIL PRICES OF SELECTED COMMODITIES: 2002 TO 2012
1ST 2ND 3RD 4TH
Commodity Unit 2012 2011 2010 2009 2008 2007 2006 2005 2004 2003 2002 2012 2012 2012 2012
Apple lb 1.66 1.53 1.65 1.22 1.61 1.26 1.12 1.10 0.98 1.13 0.99 1.67 1.60 1.60 1.77
Beef, chuck lb 3.50 3.11 2.56 2.47 2.29 1.93 1.81 1.93 1.65 1.42 1.49 3.57 3.44 3.45 3.55
Beer, Coors Light 12 fl.oz. 1.57 1.73 1.65 1.39 1.51 1.44 1.41 1.41 1.41 1.41 1.39 1.56 1.58 1.58 1.54
Beer, Vailima 750 ml 2.69 2.92 2.82 2.76 2.58 2.72 2.65 2.55 2.55 2.57 2.55 2.75 2.54 2.54 2.93
Bottle gas (1) 30 lbs 36.05 33.99 29.05 29.90 114.88 104.25 100.00 90.00 86.25 91.00 86.25 34.40 37.85 34.10 37.85
Bread loaf 1.54 1.39 1.39 1.37 1.22 0.83 0.81 0.75 0.74 0.76 0.74 1.58 1.50 1.50 1.56
Butter 227 g 2.04 1.92 1.66 1.52 1.73 1.12 1.02 1.02 0.85 1.01 0.62 2.05 2.05 2.05 2.00
Chicken whole lb 1.52 1.48 1.39 1.38 1.39 1.25 1.16 1.18 1.10 1.14 0.94 1.48 1.51 1.51 1.59
Cigarette-Benson 20's 4.23 4.11 4.05 4.02 4.10 4.07 4.11 4.23 4.17 4.20 4.42 3.78 4.51 4.34 4.29
Cigarette-Kools 20's 4.29 4.29 4.16 4.02 3.99 4.25 3.94 4.11 4.03 4.07 3.51 4.06 4.36 4.36 4.36
Coconut (2) each 0.45 2.38 3.20 3.22 1.14 0.34 0.35 0.31 0.30 0.31 0.30 0.41 0.53 0.43 0.43
Cooking oil 24 fl.oz. 3.51 3.59 4.67 5.44 4.62 1.77 1.61 1.57 1.28 1.58 1.13 3.45 3.45 3.45 3.70
Corned beef, cnd 12 oz. 3.42 3.21 3.03 2.86 2.67 3.42 4.16 4.45 4.28 4.15 3.93 3.41 3.38 3.38 3.49
Electricity (3) 1 kWh 0.41 120.57 95.17 84.54 118.93 85.12 81.27 70.41 59.40 72.76 49.69 0.41 0.41 0.41 0.40
Fresh eggs, small dozen 1.74 1.65 1.54 1.59 1.88 1.25 1.09 1.03 1.15 1.09 0.99 1.75 1.73 1.77 1.72
Green banana lb 0.84 2.52 3.23 3.28 1.69 0.71 0.70 0.71 0.76 0.71 0.64 0.99 0.99 0.73 0.65
Mackerel, cnd. 15 oz. 1.61 1.41 1.36 1.36 0.93 0.67 0.77 0.67 0.68 0.70 0.62 1.65 1.61 1.61 1.58
Milk, fresh litre 1.75 2.00 2.25 2.03 1.92 1.27 1.20 1.16 1.08 1.17 0.94 1.75 1.75 1.75 1.73
Rice 40 lb 18.13 30.10 24.30 28.75 21.15 18.50 16.97 16.56 15.88 17.00 13.18 13.07 19.78 19.83 19.83
Salt 700g 1.95 1.65 1.41 1.29 1.42 1.19 1.06 1.07 0.93 1.07 0.71 1.88 2.00 1.93 2.00
Sausage, packet lb 1.38 1.37 1.45 1.45 1.27 2.84 2.67 2.65 2.45 2.63 2.31 1.36 1.36 1.37 1.43
Soft drink, can 12 oz 0.63 0.62 0.63 0.63 0.60 0.65 0.65 0.65 0.65 0.65 0.65 0.63 0.62 0.62 0.63
Soy sauce 1 gal 11.14 9.36 7.86 7.27 6.71 3.94 3.75 3.67 3.62 3.73 3.30 10.72 11.29 11.30 11.23
Spaghetti, cnd 14.75 oz. 1.24 1.35 1.45 1.29 1.18 1.01 0.91 0.90 0.84 0.89 0.78 1.29 1.22 1.23 1.21
Spam 12 oz. 3.13 3.06 3.15 3.11 2.89 2.80 2.65 2.52 2.31 2.56 2.31 3.15 3.35 3.15 2.87
Sugar 2 kg 3.15 3.48 3.09 2.51 2.29 1.65 1.70 1.57 1.41 1.60 1.14 3.14 3.17 3.17 3.13
Taro lb 1.78 3.29 5.12 5.27 2.54 1.92 2.16 2.38 2.16 2.21 1.75 1.65 1.59 2.57 1.31
Tuna, cnd 6.5 oz. 1.52 1.34 1.37 1.38 1.27 1.24 1.25 1.24 1.24 1.25 1.23 1.45 1.48 1.48 1.66
Turkey tail lb 1.06 1.03 0.97 0.88 0.79 0.66 0.62 0.58 0.59 0.60 0.57 0.99 1.11 1.06 1.06
Unleaded gas gallon 4.40 4.21 3.42 2.92 3.95 3.14 3.07 2.71 2.24 2.59 1.63 4.32 4.55 4.55 4.19
NOTE: (1) In 2002-2008 prices collected was for the 91 lb tank, this was changed recently to the 30 lb tank for years 2009-2012.
(2) Coconut average price is calculated using prices for each coconut sold; not by basket of coconuts.
(3) Price for Electricity was collected by 300 kWh in the previous years. The unit was changed to 1 kWh in 2012.
SOURCE: ASG Department Of Commerce, Statistics Division, Consumer Price Index (CPI) Quarterly Surveys
Quarters
Average Prices
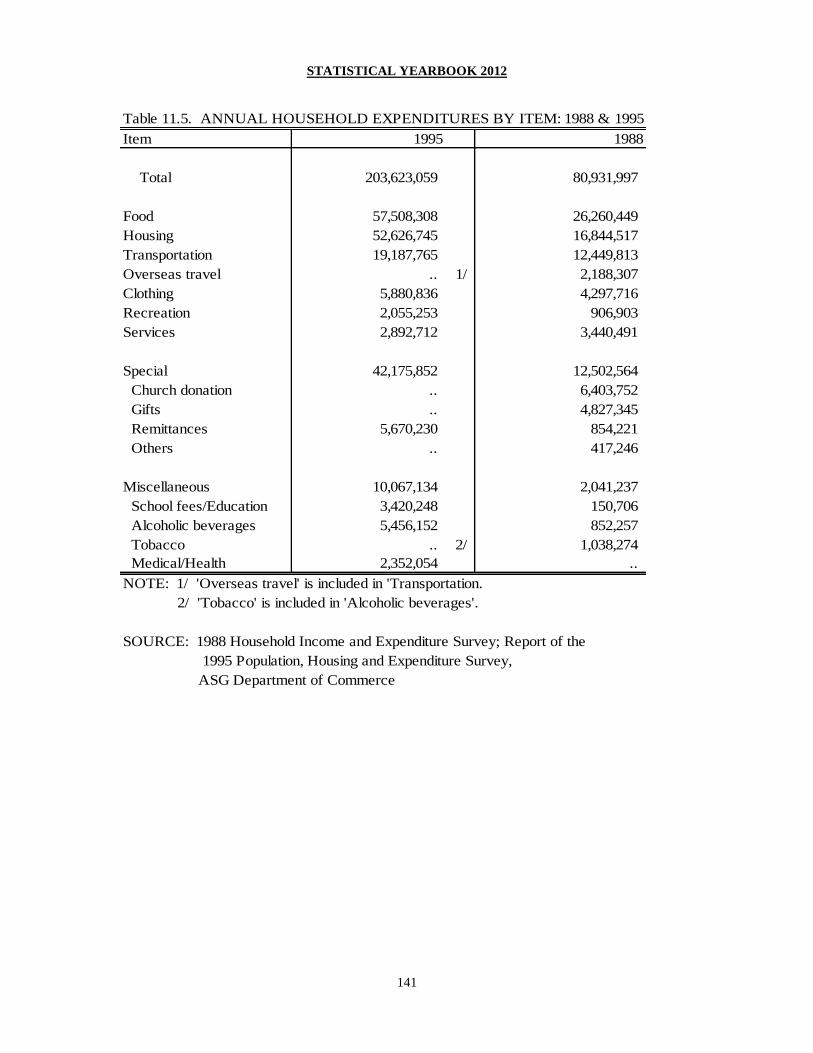
STATISTICAL YEARBOOK 2012
141
Table 11.5. ANNUAL HOUSEHOLD EXPENDITURES BY ITEM: 1988 & 1995
Item 1995 1988
Total 203,623,059 80,931,997
Food 57,508,308 26,260,449
Housing 52,626,745 16,844,517
Transportation 19,187,765 12,449,813
Overseas travel .. 1/ 2,188,307
Clothing 5,880,836 4,297,716
Recreation 2,055,253 906,903
Services 2,892,712 3,440,491
Special 42,175,852 12,502,564
Church donation .. 6,403,752
Gifts .. 4,827,345
Remittances 5,670,230 854,221
Others .. 417,246
Miscellaneous 10,067,134 2,041,237
School fees/Education 3,420,248 150,706
Alcoholic beverages 5,456,152 852,257
Tobacco .. 2/ 1,038,274
Medical/Health 2,352,054 ..
NOTE: 1/ 'Overseas travel' is included in 'Transportation.
2/ 'Tobacco' is included in 'Alcoholic beverages'.
SOURCE: 1988 Household Income and Expenditure Survey; Report of the
1995 Population, Housing and Expenditure Survey,
ASG Department of Commerce

STATISTICAL YEARBOOK 2012
142
Table 11.6. GENERAL REGULAR HOUSEHOLD EXPENDITURES: 1995
House- Annual
Expenditures holds Percent Amount Average
Total 8,366 100.0 $88,575,001 $10,586
Housing 2,917 34.9 $14,328,548 $4,912
Mortgage/loan payment 1,789 21.4 $10,537,051 $5,890
Rent 837 10.0 $3,412,781 $4,077
Insurance 603 7.2 $378,716 $628
Vehicles 3,708 44.3 $10,061,953 $2,714
Loan repayments 1,550 18.5 $7,994,688 $16,113
Registration & insurance 3,635 43.4 $2,067,265 $1,530
Driver's licenses 3,739 44.7 $104,130 $28
Utility costs 8,330 99.6 $21,095,505 $2,532
Electricity 8,159 97.5 $7,692,110 $2,509
Water 4,919 58.8 $3,462,576 $10,720
Telephone 5,897 70.5 $7,378,363 $3,598
Gas/kerosene 4,534 54.2 $2,562,456 $1,879
Membership fees 1,227 14.7 $809,011 $659
Social clubs 530 6.3 $255,242 $1,934
Sporting clubs 515 6.2 $89,856 $400
Credit cards 291 3.5 $282,074 $2,072
Others 208 2.5 $181,839 $2,026
Church-related expenses 7,561 90.4 $13,917,914 $1,841
Special regular expenses 7,613 91.0 $22,587,708 $3,712
Wedding 4,670 55.8 $6,185,192 $3,544
Funerals 6,734 80.5 $11,696,620 $5,160
Matai titles 4,233 50.6 $4,705,896 $3,137
SOURCE: ASG Department of Commerce, Report of the 1995 Population,
Housing and Expenditure Survey
STATISTICAL YEARBOOK 2012
143
Section Twelve
COMMUNICATION AND TRANSPORTATION
This section presents statistical data on communication and transportation services
including vehicle registration and driver licenses, vessel and cargo movements, and air
traffic and aircraft operations. This publication also includes data from Blue Sky
Communications for the very first time.
Table 12.1 shows the number of telephones declined for the sixth year in a row. There
were 8,794 telephones in 2012 compared to 9,226 in 2011. The number of cellular
phones skyrocketed in 2010 with 20,053 to 29,096 in 2011. However, it dropped slightly
to 29,033 in 2012. The number of internet subscribers remained at 2,000.
Table 12.2 shows Blue Sky has 9,484 cellular phones, 1,129 MoanaTV cable subscribers,
3,000 internet subscribers, and 19,735 text message subscribers.
Table 12.3 shows that a total of 8,227 motor vehicles were registered at the Office of
Motor Vehicles in 2012. This is true because of the drop of commercial and private
vehicles being registered. However, the number of ASG registered vehicles increased by
40 in 2012.
Table 12.4 shows a drop in licenses and permits issued in 2012. A total of 7,153 licenses
and permits were issued in 2011, whereas in 2012, only 6,567 were issued.
Table 12.5 shows the vessel and cargo movement within the Territory. If you look at the
trend, the number of incoming and outgoing vessels is consistent from year to year.
However, the incoming and outgoing cargo in tons varies from year to year. Table 12.6
shows that most of the vessels coming in to the Territory fall under the others category.
Other vessels that entered and left the Territory were freighters, yachts, tankers, and
cruise ships.
Table 12.7 shows that there were 3,477 flights that landed at Pago Pago International
Airport in 2012 compared to 3,511 in 2011. The incoming flights carried 67,980
passengers and the same number of flights took off carrying 69,652 passengers. About 2
million pounds of cargo and 1.8 million pounds of mail were brought in by commercial
carriers.
Table 12.8 and T12.9 show there were 136 flights in 2012 between Pago Pago and
Honolulu. This is an average of 11 flights per month. In 2012, there were 3,053 flights
between Pago Pago and Samoa (an average of 254 flights per month).

STATISTICAL YEARBOOK 2012
144
T12.1. LOCAL AND OVERSEAS TELEPHONE, TELEX, FACSIMILE AND TELEGRAM SERVICES: 2002 TO 2012
Services 2012 2011 2010 2009 2008 2007 2006 2005 2004 2003 2002
Local Telephone Service
Number of telephones 8,794 9,226 9,792 10,134 10,270 10,427 10,737 10,663 10,354 10,713 14,053
Miles of telephone cable .. .. .. .. .. .. 99.7* 28 24 22 20
Cellular instruments 29,033 29,096 20,053 16,982 18,752 15,747 8,525 8,065 2,250 2,100 2,036
Overseas Telephone Services
Number of completed calls .. .. .. .. .. .. .. 3,804,625 3,925,456 3,724,866 3,648,153
Number of minutes 18,853,334 18,872,740 18,823,276 17,897,279 19,092,180 19,339,324 19,130,814 16,555,332 20,445,274 19,385,221 17,305,279
Facsimile Services
Number of subscribers 634 637 647 664 670 660 686 695 600 582 750
Overseas Telegram Services
Number of messages handled .. .. .. .. .. .. .. .. 160 712 1,327
Internet Service @samoatelco.com 2,017 2,032 1,889 2,086 2,040 2,077 1,973 1,928 1700 1,500 1,400
NOTE: *Includes primary and secondary roads.
SOURCE: American Samoa Telecommunications Authority
0
5000
10000
15000
20000
25000
30000
35000
2002 2003 2004 2005 2006 2007 2008 2009 2010 2011 2012
Qu
anti
ty
Year
Number of Telephones and Cell Phones
2002 - 2012
Telephones
Cell phones

STATISTICAL YEARBOOK 2012
145
TABLE 12.2. CELLULAR, INTERNET, CABLE, AND
TEXT MESSAGING SERVICES: 2012
Services 2012
Number of Cellular Instruments 9,484
Number of phone cards purchased 175,663
Number of E-Charges 949,593
Internet service
Number of subscribers 1,129
Cable service (Moana TV)
Number of Cable subscribers 3,000
Text Messaging service
Number of Text message subscribers 19,735
Source: Blue Sky Communications
Table 12.3. REGISTRATION OF MOTOR VEHICLES BY TYPE: FY2002 TO FY2012
Private Motor ASG
Year Total Bus Rental Taxi Cargo Vehicles Bike Trailers Vehicles
2012 8,227 155 105 125 323 6,721 79 86 633
2011 9,395 182 129 128 398 7,791 73 101 593
2010 8,774 165 92 51 375 7,323 70 109 589
2009 9,131 177 133 104 400 7,686 78 126 427
2008 9,211 135 130 85 431 7,781 88 121 440
2007 8,940 195 177 113 415 7,418 76 146 400
2006 9,215 202 168 107 400 7,758 68 111 401
2005 8,576 226 .. 123 431 7,226 66 127 377
2004 8,768 197 .. 276 498 6,954 64 133 646
2003 8,166 180 .. 123 488 6,597 71 109 598
2002 8,097 176 .. 108 449 6,644 33 133 554
Note: ASG vehicles are now included in the total of registered motor vehicles.
Totals for previous years were revised to reflect this change.
SOURCE: Office of Highway Safety; Office of Property Management
Commercial Others
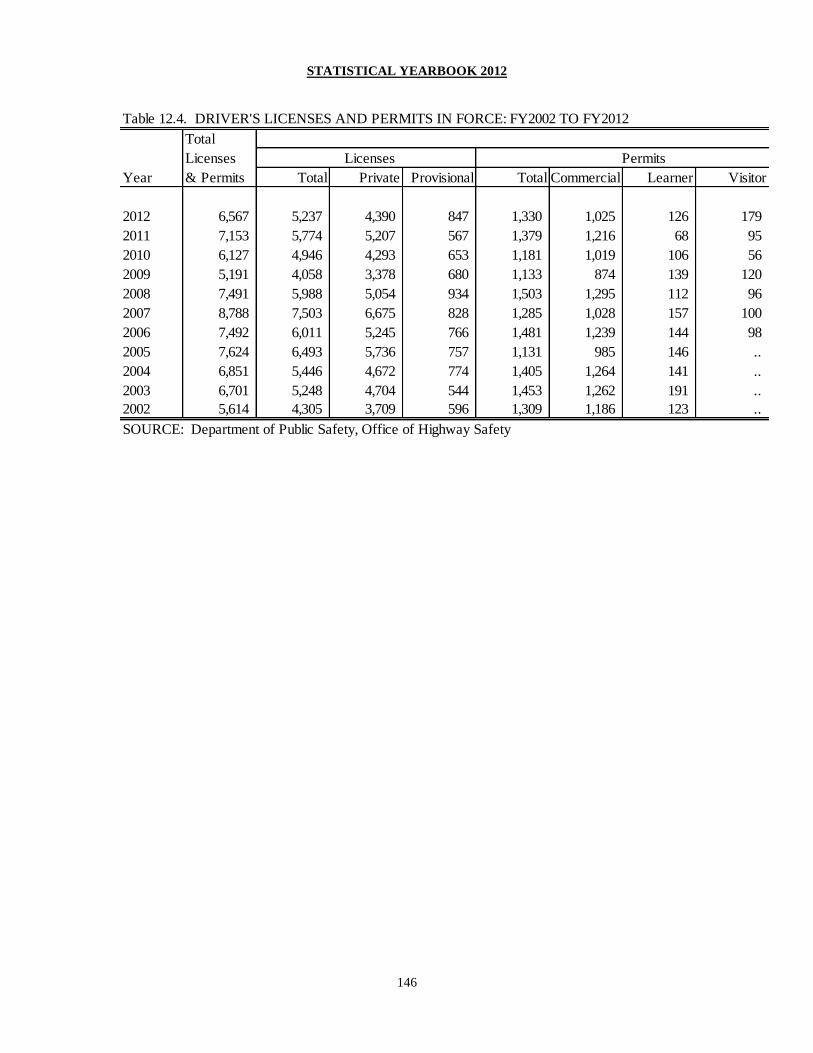
STATISTICAL YEARBOOK 2012
146
Table 12.4. DRIVER'S LICENSES AND PERMITS IN FORCE: FY2002 TO FY2012
Total
Licenses
Year & Permits Total Private Provisional Total Commercial Learner Visitor
2012 6,567 5,237 4,390 847 1,330 1,025 126 179
2011 7,153 5,774 5,207 567 1,379 1,216 68 95
2010 6,127 4,946 4,293 653 1,181 1,019 106 56
2009 5,191 4,058 3,378 680 1,133 874 139 120
2008 7,491 5,988 5,054 934 1,503 1,295 112 96
2007 8,788 7,503 6,675 828 1,285 1,028 157 100
2006 7,492 6,011 5,245 766 1,481 1,239 144 98
2005 7,624 6,493 5,736 757 1,131 985 146 ..
2004 6,851 5,446 4,672 774 1,405 1,264 141 ..
2003 6,701 5,248 4,704 544 1,453 1,262 191 ..
2002 5,614 4,305 3,709 596 1,309 1,186 123 ..
SOURCE: Department of Public Safety, Office of Highway Safety
Licenses Permits
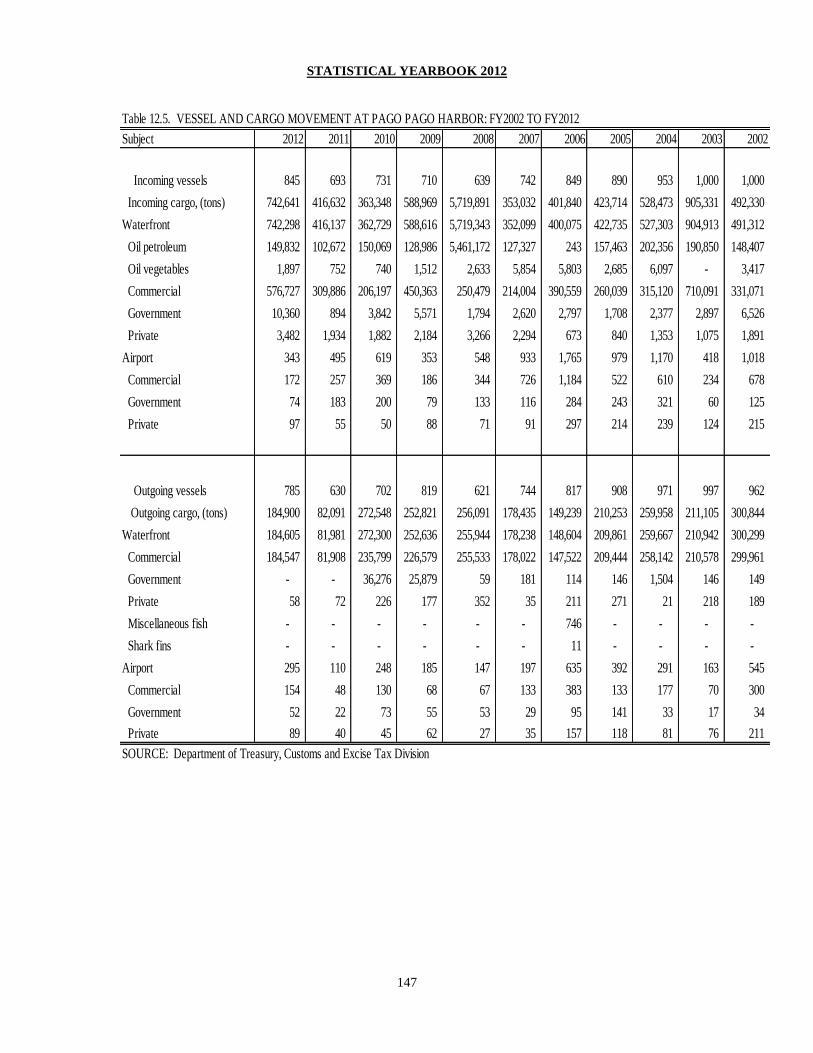
STATISTICAL YEARBOOK 2012
147
Table 12.5. VESSEL AND CARGO MOVEMENT AT PAGO PAGO HARBOR: FY2002 TO FY2012
Subject 2012 2011 2010 2009 2008 2007 2006 2005 2004 2003 2002
Incoming vessels 845 693 731 710 639 742 849 890 953 1,000 1,000
Incoming cargo, (tons) 742,641 416,632 363,348 588,969 5,719,891 353,032 401,840 423,714 528,473 905,331 492,330
Waterfront 742,298 416,137 362,729 588,616 5,719,343 352,099 400,075 422,735 527,303 904,913 491,312
Oil petroleum 149,832 102,672 150,069 128,986 5,461,172 127,327 243 157,463 202,356 190,850 148,407
Oil vegetables 1,897 752 740 1,512 2,633 5,854 5,803 2,685 6,097 - 3,417
Commercial 576,727 309,886 206,197 450,363 250,479 214,004 390,559 260,039 315,120 710,091 331,071
Government 10,360 894 3,842 5,571 1,794 2,620 2,797 1,708 2,377 2,897 6,526
Private 3,482 1,934 1,882 2,184 3,266 2,294 673 840 1,353 1,075 1,891
Airport 343 495 619 353 548 933 1,765 979 1,170 418 1,018
Commercial 172 257 369 186 344 726 1,184 522 610 234 678
Government 74 183 200 79 133 116 284 243 321 60 125
Private 97 55 50 88 71 91 297 214 239 124 215
Outgoing vessels 785 630 702 819 621 744 817 908 971 997 962
Outgoing cargo, (tons) 184,900 82,091 272,548 252,821 256,091 178,435 149,239 210,253 259,958 211,105 300,844
Waterfront 184,605 81,981 272,300 252,636 255,944 178,238 148,604 209,861 259,667 210,942 300,299
Commercial 184,547 81,908 235,799 226,579 255,533 178,022 147,522 209,444 258,142 210,578 299,961
Government - - 36,276 25,879 59 181 114 146 1,504 146 149
Private 58 72 226 177 352 35 211 271 21 218 189
Miscellaneous fish - - - - - - 746 - - - -
Shark fins - - - - - - 11 - - - -
Airport 295 110 248 185 147 197 635 392 291 163 545
Commercial 154 48 130 68 67 133 383 133 177 70 300
Government 52 22 73 55 53 29 95 141 33 17 34
Private 89 40 45 62 27 35 157 118 81 76 211
SOURCE: Department of Treasury, Customs and Excise Tax Division

STATISTICAL YEARBOOK 2012
148
Table 12.6. VESSEL TRAFFIC AT PAGO PAGO HARBOR: FY2002 TO FY2012
Type 2012 2011 2010 2009 2008 2007 2006 2005 2004 2003 2002
Incoming vessels 845 693 731 710 639 742 849 890 953 1,000 1,000
Cruise ships 26 7 8 10 8 5 6 6 5 9 1
Government boats - - - - - - 4 4 5 2 2
Freighters 66 96 111 124 114 146 172 158 168 163 149
Tankers 30 31 31 30 24 29 33 31 28 32 28
Fishing boats - - 75 83 137 152 276 513 573 590 679
Yachts 60 113 84 50 95 69 84 76 68 84 54
Local boats - - - - - - - 6 8 24 9
Military/naval ships 3 - - - - 1 1 4 2 1 3
Barges/tugs - - 1 - - - 3 - 1 2 1
Reefers 9 15 18 15 13 18 17 19 23 19 17
Others 651 431 403 398 248 322 253 73 72 74 57
Outgoing vessels 785 630 702 819 621 744 817 908 971 997 962
Cruise ships 26 8 8 10 8 5 6 6 5 9 1
Government boats - - - - - - 2 5 5 4 2
Freighters 66 96 101 124 114 147 171 158 168 163 149
Tankers 30 28 31 29 24 29 33 31 28 32 28
Fishing boats - - 76 95 140 160 250 532 593 575 652
Yachts 62 79 79 60 75 71 77 78 67 82 46
Local boats - - - - - - - 6 8 22 10
Military/naval ships 3 - - - - 1 1 4 2 1 3
Barges/tugs - - 1 - - - 2 - 1 2 1
Reefers 7 13 13 11 14 15 18 16 22 28 15
Others 591 406 393 490 246 316 257 72 72 79 55
SOURCE: Department of Treasury, Customs and Excise Tax Division
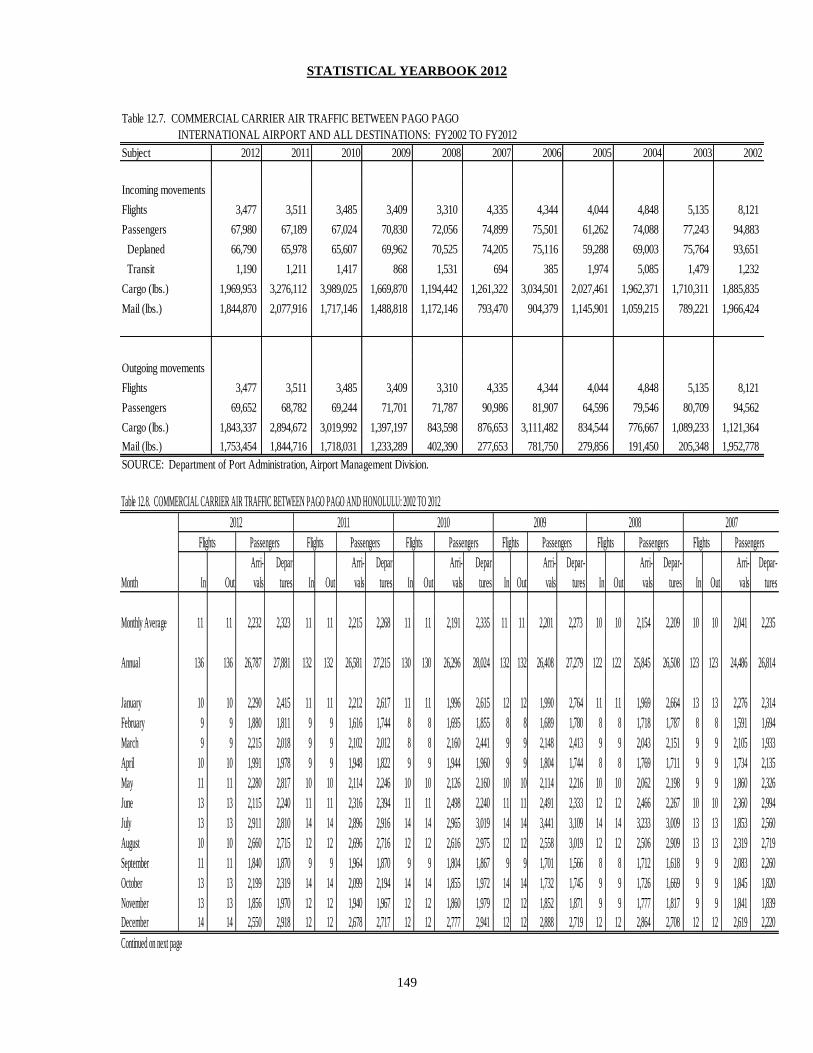
STATISTICAL YEARBOOK 2012
149
Table 12.7. COMMERCIAL CARRIER AIR TRAFFIC BETWEEN PAGO PAGO
INTERNATIONAL AIRPORT AND ALL DESTINATIONS: FY2002 TO FY2012
Subject 2012 2011 2010 2009 2008 2007 2006 2005 2004 2003 2002
Incoming movements
Flights 3,477 3,511 3,485 3,409 3,310 4,335 4,344 4,044 4,848 5,135 8,121
Passengers 67,980 67,189 67,024 70,830 72,056 74,899 75,501 61,262 74,088 77,243 94,883
Deplaned 66,790 65,978 65,607 69,962 70,525 74,205 75,116 59,288 69,003 75,764 93,651
Transit 1,190 1,211 1,417 868 1,531 694 385 1,974 5,085 1,479 1,232
Cargo (lbs.) 1,969,953 3,276,112 3,989,025 1,669,870 1,194,442 1,261,322 3,034,501 2,027,461 1,962,371 1,710,311 1,885,835
Mail (lbs.) 1,844,870 2,077,916 1,717,146 1,488,818 1,172,146 793,470 904,379 1,145,901 1,059,215 789,221 1,966,424
Outgoing movements
Flights 3,477 3,511 3,485 3,409 3,310 4,335 4,344 4,044 4,848 5,135 8,121
Passengers 69,652 68,782 69,244 71,701 71,787 90,986 81,907 64,596 79,546 80,709 94,562
Cargo (lbs.) 1,843,337 2,894,672 3,019,992 1,397,197 843,598 876,653 3,111,482 834,544 776,667 1,089,233 1,121,364
Mail (lbs.) 1,753,454 1,844,716 1,718,031 1,233,289 402,390 277,653 781,750 279,856 191,450 205,348 1,952,778
SOURCE: Department of Port Administration, Airport Management Division.
Table 12.8. COMMERCIAL CARRIER AIR TRAFFIC BETWEEN PAGO PAGO AND HONOLULU: 2002 TO 2012
Arri- Depar Arri- Depar Arri- Depar Arri- Depar- Arri- Depar- Arri- Depar-
Month In Out vals tures In Out vals tures In Out vals tures In Out vals tures In Out vals tures In Out vals tures
Monthly Average 11 11 2,232 2,323 11 11 2,215 2,268 11 11 2,191 2,335 11 11 2,201 2,273 10 10 2,154 2,209 10 10 2,041 2,235
Annual 136 136 26,787 27,881 132 132 26,581 27,215 130 130 26,296 28,024 132 132 26,408 27,279 122 122 25,845 26,508 123 123 24,486 26,814
January 10 10 2,290 2,415 11 11 2,212 2,617 11 11 1,996 2,615 12 12 1,990 2,764 11 11 1,969 2,664 13 13 2,276 2,314
February 9 9 1,880 1,811 9 9 1,616 1,744 8 8 1,695 1,855 8 8 1,689 1,780 8 8 1,718 1,787 8 8 1,591 1,694
March 9 9 2,215 2,018 9 9 2,102 2,012 8 8 2,160 2,441 9 9 2,148 2,413 9 9 2,043 2,151 9 9 2,105 1,933
April 10 10 1,991 1,978 9 9 1,948 1,822 9 9 1,944 1,960 9 9 1,804 1,744 8 8 1,769 1,711 9 9 1,734 2,135
May 11 11 2,280 2,817 10 10 2,114 2,246 10 10 2,126 2,160 10 10 2,114 2,216 10 10 2,062 2,198 9 9 1,860 2,326
June 13 13 2,115 2,240 11 11 2,316 2,394 11 11 2,498 2,240 11 11 2,491 2,333 12 12 2,466 2,267 10 10 2,360 2,994
July 13 13 2,911 2,810 14 14 2,896 2,916 14 14 2,965 3,019 14 14 3,441 3,109 14 14 3,233 3,009 13 13 1,853 2,560
August 10 10 2,660 2,715 12 12 2,696 2,716 12 12 2,616 2,975 12 12 2,558 3,019 12 12 2,506 2,909 13 13 2,319 2,719
September 11 11 1,840 1,870 9 9 1,964 1,870 9 9 1,804 1,867 9 9 1,701 1,566 8 8 1,712 1,618 9 9 2,083 2,260
October 13 13 2,199 2,319 14 14 2,099 2,194 14 14 1,855 1,972 14 14 1,732 1,745 9 9 1,726 1,669 9 9 1,845 1,820
November 13 13 1,856 1,970 12 12 1,940 1,967 12 12 1,860 1,979 12 12 1,852 1,871 9 9 1,777 1,817 9 9 1,841 1,839
December 14 14 2,550 2,918 12 12 2,678 2,717 12 12 2,777 2,941 12 12 2,888 2,719 12 12 2,864 2,708 12 12 2,619 2,220
Continued on next page
2012
Flights Passengers Flights PassengersPassengers
20082011
Flights Passengers
2010
Flights Flights Passengers Flights Passengers
2009 2007
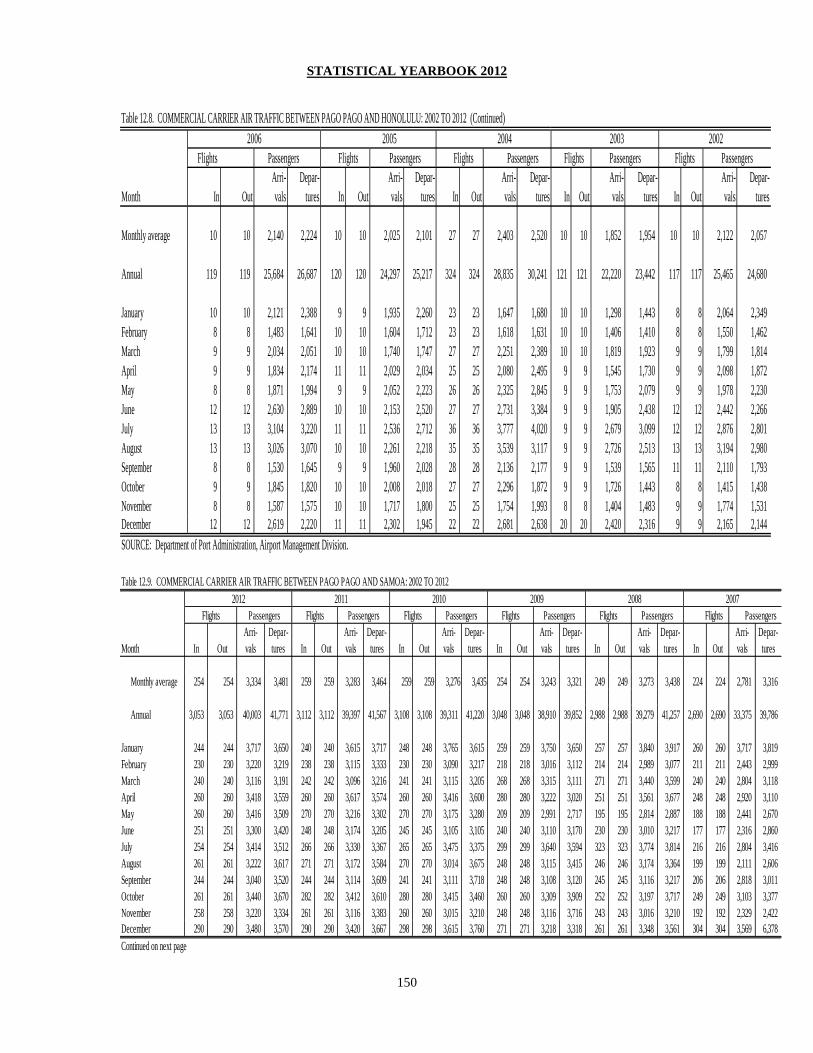
STATISTICAL YEARBOOK 2012
150
Table 12.8. COMMERCIAL CARRIER AIR TRAFFIC BETWEEN PAGO PAGO AND HONOLULU: 2002 TO 2012 (Continued)
Arri- Depar- Arri- Depar- Arri- Depar- Arri- Depar- Arri- Depar-
Month In Out vals tures In Out vals tures In Out vals tures In Out vals tures In Out vals tures
Monthly average 10 10 2,140 2,224 10 10 2,025 2,101 27 27 2,403 2,520 10 10 1,852 1,954 10 10 2,122 2,057
Annual 119 119 25,684 26,687 120 120 24,297 25,217 324 324 28,835 30,241 121 121 22,220 23,442 117 117 25,465 24,680
January 10 10 2,121 2,388 9 9 1,935 2,260 23 23 1,647 1,680 10 10 1,298 1,443 8 8 2,064 2,349
February 8 8 1,483 1,641 10 10 1,604 1,712 23 23 1,618 1,631 10 10 1,406 1,410 8 8 1,550 1,462
March 9 9 2,034 2,051 10 10 1,740 1,747 27 27 2,251 2,389 10 10 1,819 1,923 9 9 1,799 1,814
April 9 9 1,834 2,174 11 11 2,029 2,034 25 25 2,080 2,495 9 9 1,545 1,730 9 9 2,098 1,872
May 8 8 1,871 1,994 9 9 2,052 2,223 26 26 2,325 2,845 9 9 1,753 2,079 9 9 1,978 2,230
June 12 12 2,630 2,889 10 10 2,153 2,520 27 27 2,731 3,384 9 9 1,905 2,438 12 12 2,442 2,266
July 13 13 3,104 3,220 11 11 2,536 2,712 36 36 3,777 4,020 9 9 2,679 3,099 12 12 2,876 2,801
August 13 13 3,026 3,070 10 10 2,261 2,218 35 35 3,539 3,117 9 9 2,726 2,513 13 13 3,194 2,980
September 8 8 1,530 1,645 9 9 1,960 2,028 28 28 2,136 2,177 9 9 1,539 1,565 11 11 2,110 1,793
October 9 9 1,845 1,820 10 10 2,008 2,018 27 27 2,296 1,872 9 9 1,726 1,443 8 8 1,415 1,438
November 8 8 1,587 1,575 10 10 1,717 1,800 25 25 1,754 1,993 8 8 1,404 1,483 9 9 1,774 1,531
December 12 12 2,619 2,220 11 11 2,302 1,945 22 22 2,681 2,638 20 20 2,420 2,316 9 9 2,165 2,144
SOURCE: Department of Port Administration, Airport Management Division.
Flights Passengers Passengers Flights Passengers Flights Passengers Flights Passengers
2006 2005 2004 2003 2002
Flights
Table 12.9. COMMERCIAL CARRIER AIR TRAFFIC BETWEEN PAGO PAGO AND SAMOA: 2002 TO 2012
Arri- Depar- Arri- Depar- Arri- Depar- Arri- Depar- Arri- Depar- Arri- Depar-
Month In Out vals tures In Out vals tures In Out vals tures In Out vals tures In Out vals tures In Out vals tures
Monthly average 254 254 3,334 3,481 259 259 3,283 3,464 259 259 3,276 3,435 254 254 3,243 3,321 249 249 3,273 3,438 224 224 2,781 3,316
Annual 3,053 3,053 40,003 41,771 3,112 3,112 39,397 41,567 3,108 3,108 39,311 41,220 3,048 3,048 38,910 39,852 2,988 2,988 39,279 41,257 2,690 2,690 33,375 39,786
January 244 244 3,717 3,650 240 240 3,615 3,717 248 248 3,765 3,615 259 259 3,750 3,650 257 257 3,840 3,917 260 260 3,717 3,819
February 230 230 3,220 3,219 238 238 3,115 3,333 230 230 3,090 3,217 218 218 3,016 3,112 214 214 2,989 3,077 211 211 2,443 2,999
March 240 240 3,116 3,191 242 242 3,096 3,216 241 241 3,115 3,205 268 268 3,315 3,111 271 271 3,440 3,599 240 240 2,804 3,118
April 260 260 3,418 3,559 260 260 3,617 3,574 260 260 3,416 3,600 280 280 3,222 3,020 251 251 3,561 3,677 248 248 2,920 3,110
May 260 260 3,416 3,509 270 270 3,216 3,302 270 270 3,175 3,280 209 209 2,991 2,717 195 195 2,814 2,887 188 188 2,441 2,670
June 251 251 3,300 3,420 248 248 3,174 3,205 245 245 3,105 3,105 240 240 3,110 3,170 230 230 3,010 3,217 177 177 2,316 2,860
July 254 254 3,414 3,512 266 266 3,330 3,367 265 265 3,475 3,375 299 299 3,640 3,594 323 323 3,774 3,814 216 216 2,804 3,416
August 261 261 3,222 3,617 271 271 3,172 3,584 270 270 3,014 3,675 248 248 3,115 3,415 246 246 3,174 3,364 199 199 2,111 2,606
September 244 244 3,040 3,520 244 244 3,114 3,609 241 241 3,111 3,718 248 248 3,108 3,120 245 245 3,116 3,217 206 206 2,818 3,011
October 261 261 3,440 3,670 282 282 3,412 3,610 280 280 3,415 3,460 260 260 3,309 3,909 252 252 3,197 3,717 249 249 3,103 3,377
November 258 258 3,220 3,334 261 261 3,116 3,383 260 260 3,015 3,210 248 248 3,116 3,716 243 243 3,016 3,210 192 192 2,329 2,422
December 290 290 3,480 3,570 290 290 3,420 3,667 298 298 3,615 3,760 271 271 3,218 3,318 261 261 3,348 3,561 304 304 3,569 6,378
Continued on next page
2012
Flights Passengers FlightsPassengersFlights Passengers
2007
PassengersPassengers Flights Passengers Flights
2011
Flights
20092010 2008
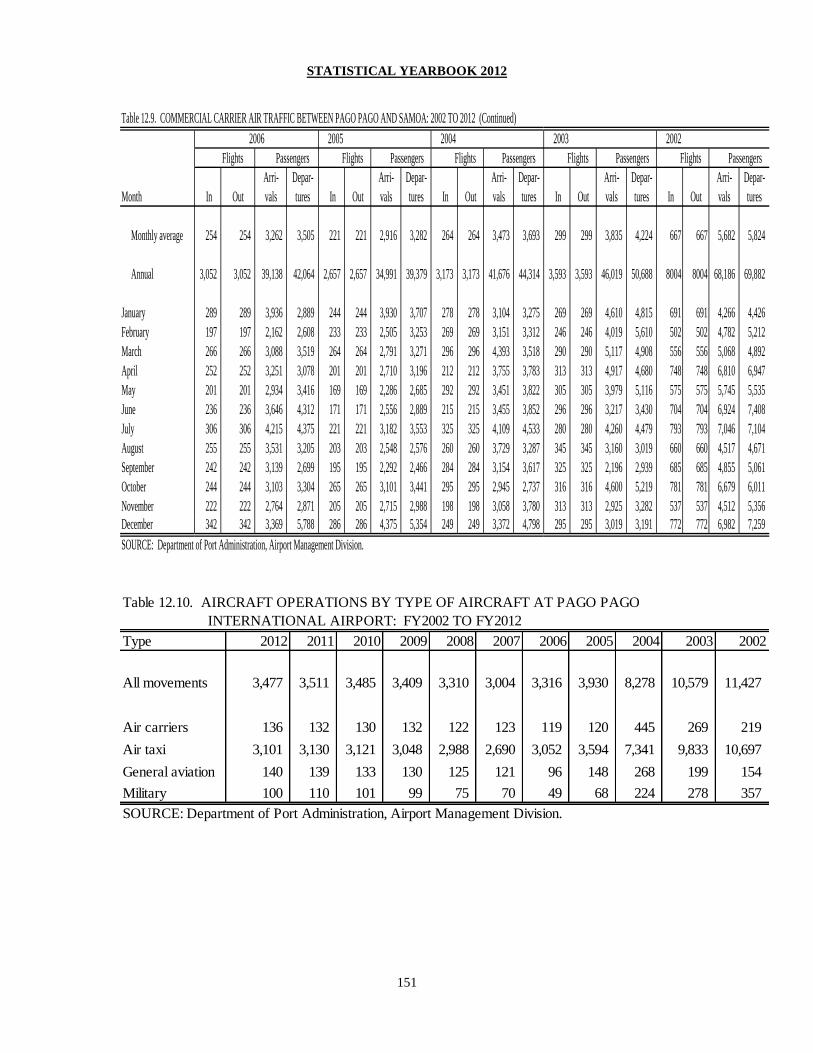
STATISTICAL YEARBOOK 2012
151
Table 12.9. COMMERCIAL CARRIER AIR TRAFFIC BETWEEN PAGO PAGO AND SAMOA: 2002 TO 2012 (Continued)
2005 2004 2003 2002
Arri- Depar- Arri- Depar- Arri- Depar- Arri- Depar- Arri- Depar-
Month In Out vals tures In Out vals tures In Out vals tures In Out vals tures In Out vals tures
Monthly average 254 254 3,262 3,505 221 221 2,916 3,282 264 264 3,473 3,693 299 299 3,835 4,224 667 667 5,682 5,824
Annual 3,052 3,052 39,138 42,064 2,657 2,657 34,991 39,379 3,173 3,173 41,676 44,314 3,593 3,593 46,019 50,688 8004 8004 68,186 69,882
January 289 289 3,936 2,889 244 244 3,930 3,707 278 278 3,104 3,275 269 269 4,610 4,815 691 691 4,266 4,426
February 197 197 2,162 2,608 233 233 2,505 3,253 269 269 3,151 3,312 246 246 4,019 5,610 502 502 4,782 5,212
March 266 266 3,088 3,519 264 264 2,791 3,271 296 296 4,393 3,518 290 290 5,117 4,908 556 556 5,068 4,892
April 252 252 3,251 3,078 201 201 2,710 3,196 212 212 3,755 3,783 313 313 4,917 4,680 748 748 6,810 6,947
May 201 201 2,934 3,416 169 169 2,286 2,685 292 292 3,451 3,822 305 305 3,979 5,116 575 575 5,745 5,535
June 236 236 3,646 4,312 171 171 2,556 2,889 215 215 3,455 3,852 296 296 3,217 3,430 704 704 6,924 7,408
July 306 306 4,215 4,375 221 221 3,182 3,553 325 325 4,109 4,533 280 280 4,260 4,479 793 793 7,046 7,104
August 255 255 3,531 3,205 203 203 2,548 2,576 260 260 3,729 3,287 345 345 3,160 3,019 660 660 4,517 4,671
September 242 242 3,139 2,699 195 195 2,292 2,466 284 284 3,154 3,617 325 325 2,196 2,939 685 685 4,855 5,061
October 244 244 3,103 3,304 265 265 3,101 3,441 295 295 2,945 2,737 316 316 4,600 5,219 781 781 6,679 6,011
November 222 222 2,764 2,871 205 205 2,715 2,988 198 198 3,058 3,780 313 313 2,925 3,282 537 537 4,512 5,356
December 342 342 3,369 5,788 286 286 4,375 5,354 249 249 3,372 4,798 295 295 3,019 3,191 772 772 6,982 7,259
SOURCE: Department of Port Administration, Airport Management Division.
Flights Passengers
2006
Flights Passengers Flights Passengers Flights Passengers Flights Passengers
Table 12.10. AIRCRAFT OPERATIONS BY TYPE OF AIRCRAFT AT PAGO PAGO
INTERNATIONAL AIRPORT: FY2002 TO FY2012
Type 2012 2011 2010 2009 2008 2007 2006 2005 2004 2003 2002
All movements 3,477 3,511 3,485 3,409 3,310 3,004 3,316 3,930 8,278 10,579 11,427
Air carriers 136 132 130 132 122 123 119 120 445 269 219
Air taxi 3,101 3,130 3,121 3,048 2,988 2,690 3,052 3,594 7,341 9,833 10,697
General aviation 140 139 133 130 125 121 96 148 268 199 154
Military 100 110 101 99 75 70 49 68 224 278 357
SOURCE: Department of Port Administration, Airport Management Division.
STATISTICAL YEARBOOK 2012
152
Section Thirteen
AGRICULTURE AND FISHING
This section presents statistics on agricultural land, farms, farm tenures, field crops and
livestock, and local fishing.
The 2009 Agricultural Census, which is conducted every five years, will be conducted
again in 2013 with the assistance of USDA-NASS. The Agriculture Census was usually
conducted as supplement to the Decennial Census of Population and Housing.
A total of 5,840 farms were covered in 2008. Approximately 39 percent of total land area
(19,003 acres) is used for farming. This includes cropland, pastureland, and other farm
uses including woodland. The majority of farms were cropland farms covering over
12,971 acres of land. Forty-four percent of farms were 1 to 2 acres in size. Another 22
percent were one or less acre in size. Similar distributions of average farm sizes were
seen in both the 2003 and 2008 censuses.
All agricultural farming whether for commercial resale or home consumption were
valued at $49.3 million in 2008. This is a significant drop from the 2003 census with
$58.2 million. The drop in value of agriculture farming was probably due to flooding
which affected American Samoa in 2003 and Hurricane Heta that devastated the islands
in January 2004.
Staple food (taro, green bananas and breadfruits) sold at the market increased in 2011
after a drop in 2010. Vegetables sold at the marketplace dropped drastically to 19,896
pounds compared to a huge increase in 2010 with 175,221 pounds. Main contributors to
this increase in the previous year include Chinese cabbage, cucumbers, eggplants and
other vegetables.
Table 13.12 shows that in 2012, about 63,945 pounds of fish were caught by local
fishermen. This is a drop from the previous year which recorded 98,906 pound of fish
caught. The number of boats utilized also dropped from 42 in 2011 to only 34 in 2012.
The number of fishermen also dropped to 102 in 2012 from 126 in 2011.
Table 13.13 shows the five methods used in catching fish. Total pounds caught using the
five methods dropped in 2012 although it increased in 2011.

STATISTICAL YEARBOOK 2012
153
Table 13.1. FARMS, LAND IN FARMS, AND LAND USE: 1970 TO 2008
Item 2008 2003 1998 1990 1980 1970
Number of farms 5,840 7,094 6,473 1,126 1,331 1,923
Land in farms, acres 1/ 19,003 19,642 19,736 7,966 6,000 10,409
Average size of farm, acres 3.3 2.8 3.0 7.1 4.5 5.4
Approximate land area, acres 48,460 48,460 48,640 48,640 48,640 48,640
Proportion in farms, percent 39.1 40.4 40.6 16.4 12.3 21.4
Number of cropland farms 5,650 7,014 6,468 1,033 1,789 2,633
Number of cropland acres 1/ 12,971 14,289 13,375 5,687 4,678 7,571
Number of farms used for crops 5,816 7,009 6,468 1,027 1,314 1,917
Number of crop acres 11,922 12,439 11,842 5,046 4,038 5,722
Number of farms used for other purposes 665 1,155 1,161 174 475 716
Number of acres used for other purposes 1,367 1,850 1,533 641 640 1,850
Number of pastureland farms, except cropland pastured 137 74 177 136 359 303
Number of pastureland acres, except cropland pastured 70 59 476 426 307 636
Number of other land farms 2/ 3,023 5,527 5,045 600 827 797
Number of acres in other land 2/ 2,383 4,014 3,219 1,853 1,013 2,201
NOTE: 1/ Detail may not add to total due to rounding.
2/ 1990 data includes woodland, except woodland pastured.
SOURCE: U.S. Bureau of the Census, Censuses of Agriculture; U.S. Department of Agriculture-NASS,
1998, 2003 and 2008 Agriculture Censuses.
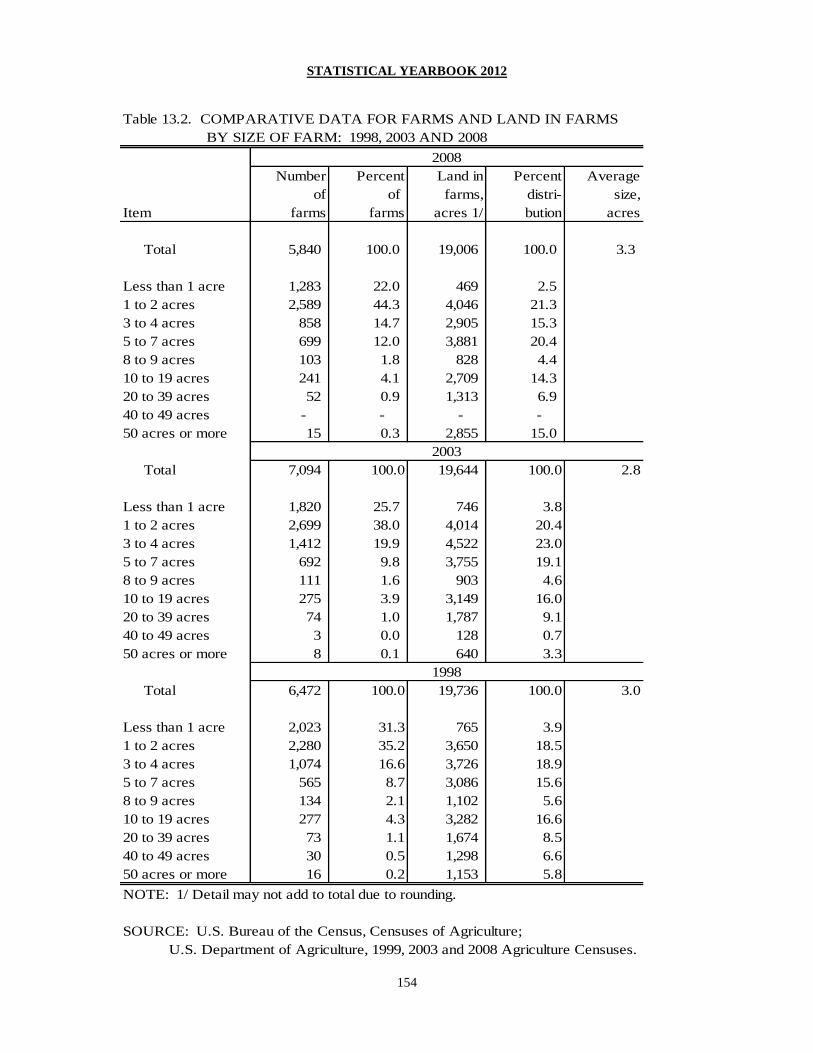
STATISTICAL YEARBOOK 2012
154
Table 13.2. COMPARATIVE DATA FOR FARMS AND LAND IN FARMS
BY SIZE OF FARM: 1998, 2003 AND 2008
Number Percent Land in Percent Average
of of farms, distri- size,
Item farms farms acres 1/ bution acres
Total 5,840 100.0 19,006 100.0 3.3
Less than 1 acre 1,283 22.0 469 2.5
1 to 2 acres 2,589 44.3 4,046 21.3
3 to 4 acres 858 14.7 2,905 15.3
5 to 7 acres 699 12.0 3,881 20.4
8 to 9 acres 103 1.8 828 4.4
10 to 19 acres 241 4.1 2,709 14.3
20 to 39 acres 52 0.9 1,313 6.9
40 to 49 acres - - - -
50 acres or more 15 0.3 2,855 15.0
Total 7,094 100.0 19,644 100.0 2.8
Less than 1 acre 1,820 25.7 746 3.8
1 to 2 acres 2,699 38.0 4,014 20.4
3 to 4 acres 1,412 19.9 4,522 23.0
5 to 7 acres 692 9.8 3,755 19.1
8 to 9 acres 111 1.6 903 4.6
10 to 19 acres 275 3.9 3,149 16.0
20 to 39 acres 74 1.0 1,787 9.1
40 to 49 acres 3 0.0 128 0.7
50 acres or more 8 0.1 640 3.3
Total 6,472 100.0 19,736 100.0 3.0
Less than 1 acre 2,023 31.3 765 3.9
1 to 2 acres 2,280 35.2 3,650 18.5
3 to 4 acres 1,074 16.6 3,726 18.9
5 to 7 acres 565 8.7 3,086 15.6
8 to 9 acres 134 2.1 1,102 5.6
10 to 19 acres 277 4.3 3,282 16.6
20 to 39 acres 73 1.1 1,674 8.5
40 to 49 acres 30 0.5 1,298 6.6
50 acres or more 16 0.2 1,153 5.8
NOTE: 1/ Detail may not add to total due to rounding.
SOURCE: U.S. Bureau of the Census, Censuses of Agriculture;
U.S. Department of Agriculture, 1999, 2003 and 2008 Agriculture Censuses.
1998
2003
2008
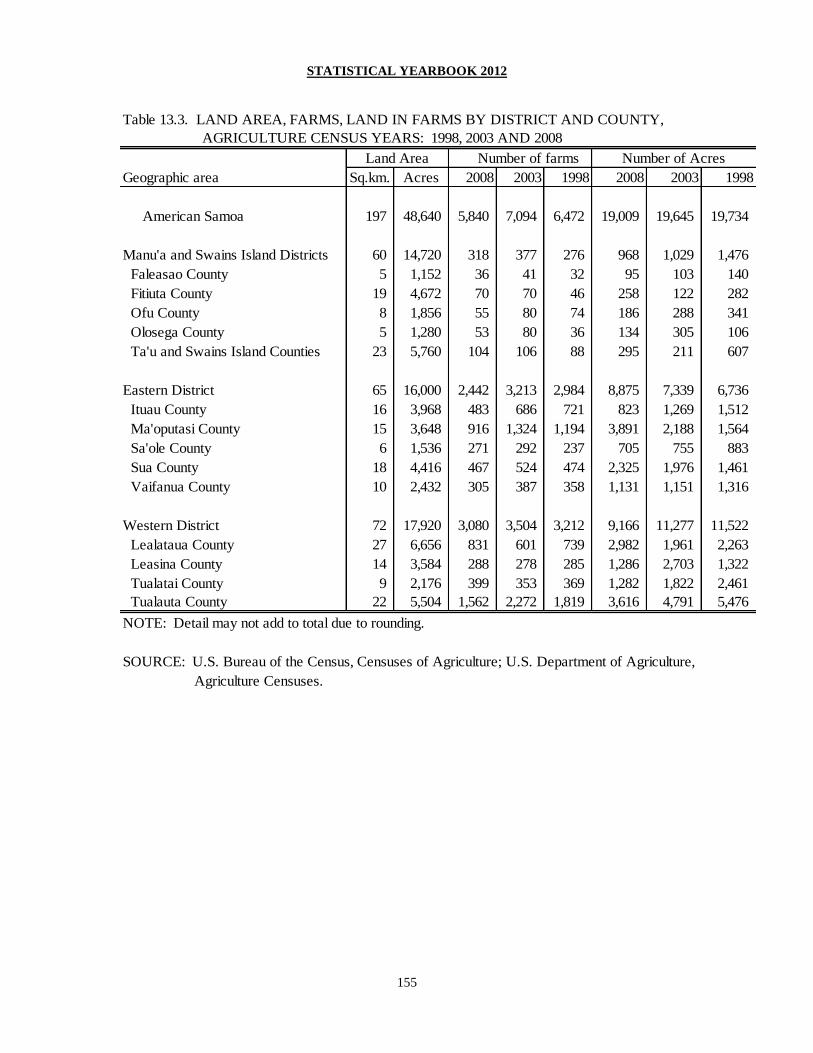
STATISTICAL YEARBOOK 2012
155
Table 13.3. LAND AREA, FARMS, LAND IN FARMS BY DISTRICT AND COUNTY,
AGRICULTURE CENSUS YEARS: 1998, 2003 AND 2008
Geographic area Sq.km. Acres 2008 2003 1998 2008 2003 1998
American Samoa 197 48,640 5,840 7,094 6,472 19,009 19,645 19,734
Manu'a and Swains Island Districts 60 14,720 318 377 276 968 1,029 1,476
Faleasao County 5 1,152 36 41 32 95 103 140
Fitiuta County 19 4,672 70 70 46 258 122 282
Ofu County 8 1,856 55 80 74 186 288 341
Olosega County 5 1,280 53 80 36 134 305 106
Ta'u and Swains Island Counties 23 5,760 104 106 88 295 211 607
Eastern District 65 16,000 2,442 3,213 2,984 8,875 7,339 6,736
Ituau County 16 3,968 483 686 721 823 1,269 1,512
Ma'oputasi County 15 3,648 916 1,324 1,194 3,891 2,188 1,564
Sa'ole County 6 1,536 271 292 237 705 755 883
Sua County 18 4,416 467 524 474 2,325 1,976 1,461
Vaifanua County 10 2,432 305 387 358 1,131 1,151 1,316
Western District 72 17,920 3,080 3,504 3,212 9,166 11,277 11,522
Lealataua County 27 6,656 831 601 739 2,982 1,961 2,263
Leasina County 14 3,584 288 278 285 1,286 2,703 1,322
Tualatai County 9 2,176 399 353 369 1,282 1,822 2,461
Tualauta County 22 5,504 1,562 2,272 1,819 3,616 4,791 5,476
NOTE: Detail may not add to total due to rounding.
SOURCE: U.S. Bureau of the Census, Censuses of Agriculture; U.S. Department of Agriculture,
Agriculture Censuses.
Land Area Number of farms Number of Acres

STATISTICAL YEARBOOK 2012
156
Table 13.4. FARMS, LAND IN FARMS, AND SIZE OF FARM BY DISTRICTS AND COUNTIES: 2008
Geographic area Farms Acres Farms Acres Farms Acres Farms Acres Farms Acres Farms Acres Farms Acres Farms Acres Farms Acres Farms Acres
ALL FARMS
American Samoa 5,840 19,005 1,283 469 2,589 4,046 858 2,905 699 3,881 103 828 241 2,709 52 1,313 - - 15 2,855
Manu'a and Swains Island Districts 318 968 7 4 169 288 73 236 65 351 - - 2 (D) 2 (D) - - - -
Faleasao County 36 95 3 2 21 39 6 24 6 30 - - - - - - - - - -
Fitiuta County 70 258 2 (D) 32 46 16 50 18 101 - - - - 2 (D) - - - -
Ofu County 55 186 - - 23 44 12 36 20 106 - - - - - - - - - -
Olosega County 53 134 - - 33 50 11 35 9 50 - - - - - - - - - -
Ta'u and Swains Island Counties 104 295 2 (D) 60 109 28 91 12 64 - - 2 (D) - - - - - -
Eastern District 2,442 8,873 610 196 1,116 1,625 270 898 269 1,520 50 400 101 1,105 11 275 (D) - 15 2,855
Ituau County 483 823 195 45 215 299 40 140 23 134 - - 5 50 5 155 - - - -
Ma'oputasi County 916 3,891 225 78 500 762 70 248 80 464 15 120 20 (D) 1 (D) - - 5 2,000
Sa'ole County 271 705 40 17 150 218 40 125 20 105 10 80 6 (D) 5 (D) - - - -
Sua County 467 2,325 90 33 176 250 65 200 71 392 15 120 40 475 - - - - 10 855
Vaifanua County 305 1,131 60 24 75 98 55 185 75 425 10 80 30 320 - - - - - -
Western District 3,080 9,164 666 269 1,304 2,134 515 1,771 365 2,011 53 428 138 1,574 39 978 - - - -
Lealataua County 831 2,982 85 39 370 632 155 543 147 797 16 129 48 543 10 300 - - - -
Leasina County 288 1,286 50 20 91 140 65 224 31 171 8 65 29 372 14 295 - - - -
Tualatai County 399 1,282 30 16 179 312 112 368 49 265 10 81 17 200 2 (D) - - - -
Tualauta County 1,562 3,616 501 195 664 1,050 183 637 138 778 19 154 44 460 13 (D) - - - -
NOTE: (D) Withheld to avoid disclosing data for individual farms.
Detail may not add to total because of rounding.
SOURCE: U.S. Department of Agriculture, 2008 Agriculture Census.
20-39 40-49 50+Total <1 1-2 3-4 5-7 8-9 10-19

STATISTICAL YEARBOOK 2012
157
Table 13.4A. FARMS, LAND IN FARMS, AND SIZE OF FARM BY DISTRICTS AND COUNTIES: 2003
Geographic area Farms Acres Farms Acres Farms Acres Farms Acres Farms Acres Farms Acres Farms Acres Farms Acres Farms Acres Farms Acres
American Samoa 7,094 19,642 1,820 746 2,699 4,014 1,412 4,522 692 3,755 111 903 275 3,149 74 1,787 3 128 8 640
Manu'a and Swains Island Districts 377 1,028 25 17 165 275 157 512 15 85 5 40 10 100 - - - - - -
Faleasao County 41 103 - - 20 36 21 68 - - - - - - - - - - - -
Fitiuta County 70 122 10 8 40 62 20 53 - - - - - - - - - - - -
Ofu County 80 288 - - 20 35 45 158 10 55 5 40 - - - - - - - -
Olosega County 80 305 - - 25 45 40 130 5 30 - - 10 100 - - - - - -
Ta'u and Swains Island Counties 106 211 15 9 60 98 31 104 - - - - - - - - - - - -
Eastern District 3,213 7,337 845 343 1,306 1,938 636 2,019 306 1,654 31 253 82 901 6 (D) - - 1 (D)
Ituau County 686 1,269 185 89 290 422 165 507 46 251 - - - - - - - - - -
Ma'oputasi County 1,324 2,188 455 169 565 813 230 736 58 317 6 53 10 100 - - - - - -
Sa'ole County 292 755 80 33 110 165 51 156 40 210 - - 6 66 5 (D) - - - -
Sua County 524 1,976 50 21 186 305 135 450 96 510 10 80 46 535 - - - - 1 (D)
Vaifanua County 387 1,151 75 31 155 233 55 170 66 366 15 120 20 200 1 (D) - - - -
Western District 3,504 11,277 950 387 1,228 1,802 619 1,992 371 2,017 75 610 183 2,148 68 1,631 3 128 7 565
Lealataua County 601 1,961 55 26 252 393 195 618 51 276 6 53 36 438 6 158 - - - -
Leasina County 278 2,703 10 6 45 70 50 159 54 299 15 125 65 730 31 763 2 (D) 6 (D)
Tualatai County 353 1,822 15 9 90 134 82 263 98 546 15 118 39 453 14 301 - - - -
Tualauta County 2,272 4,791 870 347 841 1,205 292 952 168 896 39 314 43 528 17 410 1 (D) 1 (D)
NOTE: (D) Withheld to avoid disclosing data for individual farms.
Detail may not add to total because of rounding.
SOURCE: U.S. Department of Agriculture, 2003 Agriculture Census.
10-19 20-39 40-49 50+Total <1 1-2 3-4 5-7 8-9
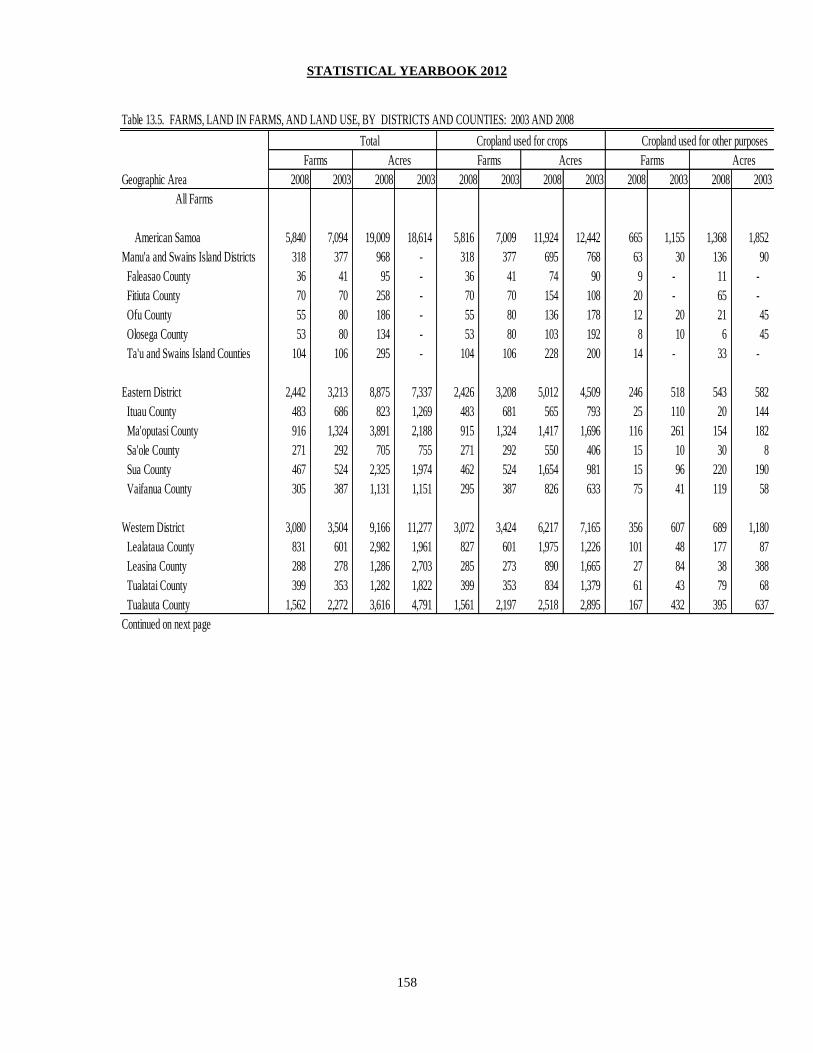
STATISTICAL YEARBOOK 2012
158
Table 13.5. FARMS, LAND IN FARMS, AND LAND USE, BY DISTRICTS AND COUNTIES: 2003 AND 2008
Farms Acres Farms Acres Farms Acres
Geographic Area 2008 2003 2008 2003 2008 2003 2008 2003 2008 2003 2008 2003
All Farms
American Samoa 5,840 7,094 19,009 18,614 5,816 7,009 11,924 12,442 665 1,155 1,368 1,852
Manu'a and Swains Island Districts 318 377 968 - 318 377 695 768 63 30 136 90
Faleasao County 36 41 95 - 36 41 74 90 9 - 11 -
Fitiuta County 70 70 258 - 70 70 154 108 20 - 65 -
Ofu County 55 80 186 - 55 80 136 178 12 20 21 45
Olosega County 53 80 134 - 53 80 103 192 8 10 6 45
Ta'u and Swains Island Counties 104 106 295 - 104 106 228 200 14 - 33 -
Eastern District 2,442 3,213 8,875 7,337 2,426 3,208 5,012 4,509 246 518 543 582
Ituau County 483 686 823 1,269 483 681 565 793 25 110 20 144
Ma'oputasi County 916 1,324 3,891 2,188 915 1,324 1,417 1,696 116 261 154 182
Sa'ole County 271 292 705 755 271 292 550 406 15 10 30 8
Sua County 467 524 2,325 1,974 462 524 1,654 981 15 96 220 190
Vaifanua County 305 387 1,131 1,151 295 387 826 633 75 41 119 58
Western District 3,080 3,504 9,166 11,277 3,072 3,424 6,217 7,165 356 607 689 1,180
Lealataua County 831 601 2,982 1,961 827 601 1,975 1,226 101 48 177 87
Leasina County 288 278 1,286 2,703 285 273 890 1,665 27 84 38 388
Tualatai County 399 353 1,282 1,822 399 353 834 1,379 61 43 79 68
Tualauta County 1,562 2,272 3,616 4,791 1,561 2,197 2,518 2,895 167 432 395 637
Continued on next page
Cropland used for other purposes Cropland used for crops Total

STATISTICAL YEARBOOK 2012
159
Table 13.5. FARMS, LAND IN FARMS, AND LAND USE, BY DISTRICTS AND COUNTIES: 2003 AND 2008 (continued)
Farms Acres Farms Acres Farms Acres
Geographic Area 2008 2003 2008 2003 2008 2003 2008 2003 2008 2003 2008 2003
Commrecial Farms
American Samoa 1,968 2,318 10,602 11,072 1,959 2,313 6,154 6,954 237 519 810 1,185
Manu'a and Swains Island Districts 133 162 478 622 133 162 327 415 20 30 79 90
Faleasao County 15 16 38 52 15 16 29 47 - - - -
Fitiuta County 36 15 170 32 36 15 101 28 10 - 51 -
Ofu County 32 45 110 200 32 45 87 105 3 20 3 45
Olosega County 14 45 39 228 14 45 28 130 3 10 2 45
Ta'u and Swains Island Counties 36 41 121 110 36 41 82 105 4 - 23 -
Eastern District 602 968 4,750 3,116 601 968 2,079 1,810 66 138 299 197
Ituau County 68 156 148 404 68 156 130 276 - 25 - 36
Ma'oputasi County 211 254 2,844 654 210 254 628 512 41 66 72 61
Sa'ole County 71 157 227 547 71 157 188 261 - - - -
Sua County 137 209 993 846 137 209 659 414 10 31 210 55
Vaifanua County 115 192 538 665 115 192 474 347 15 16 17 45
Western District 1,233 1,188 5,374 7,334 1,225 1,183 3,748 4,729 151 351 432 898
Lealataua County 330 185 1,365 958 326 185 925 561 41 22 70 34
Leasina County 183 208 1,037 2,495 180 208 726 1,513 17 79 23 383
Tualatai County 194 153 748 1,027 194 153 522 832 26 13 38 33
Tualauta County 526 642 2,224 2,854 525 637 1,575 1,823 67 237 301 448
Continued on next page
Cropland used for crops Total Cropland used for other purposes

STATISTICAL YEARBOOK 2012
160
Table 13.5. FARMS, LAND IN FARMS, AND LAND USE, BY DISTRICTS AND COUNTIES: 2003 AND 2008 (continued)
Farms Acres Farms Acres Farms Acres
Geographic Area 2008 2003 2008 2003 2008 2003 2008 2003 2008 2003 2008 2003
Noncommercial Farms
American Samoa 3,872 4,776 8,407 8,565 3,857 4,696 5,770 5,491 428 636 558 669
Manu'a and Swains Island Districts 185 215 490 400 185 215 368 355 43 - 56 -
Faleasao County 21 25 57 51 21 25 45 43 9 - 11 -
Fitiuta County 34 55 88 91 34 55 53 81 10 - 14 -
Ofu County 23 35 76 84 23 35 49 73 9 - 18 -
Olosega County 39 35 95 73 39 35 75 62 5 - 3 -
Ta'u and Swains Island Counties 68 65 174 101 68 65 146 96 10 - 10 -
Eastern District 1,840 2,245 4,125 4,222 1,825 2,240 2,933 2,699 180 380 244 386
Ituau County 415 530 675 865 415 525 435 517 25 85 20 108
Ma'oputasi County 705 1,070 1,047 1,534 705 1,070 789 1,184 75 195 82 122
Sa'ole County 200 135 478 208 200 135 362 145 15 10 30 8
Sua County 330 315 1,332 1,129 325 315 995 567 5 65 10 135
Vaifanua County 190 195 593 486 180 195 352 286 60 25 102 13
Western District 1,847 2,316 3,792 3,943 1,847 2,241 2,469 2,437 205 256 258 283
Lealataua County 501 416 1,617 1,003 501 416 1,050 665 60 26 108 53
Leasina County 105 70 249 206 105 65 164 152 10 5 15 5
Tualatai County 205 200 534 797 205 200 312 548 35 30 41 35
Tualauta County 1,036 1,630 1,392 1,937 1,036 1,560 943 1,072 100 195 94 190
SOURCE: U.S. Department of Agriculture, Agriculture Censuses
Cropland used for crops Total Cropland used for other purposes
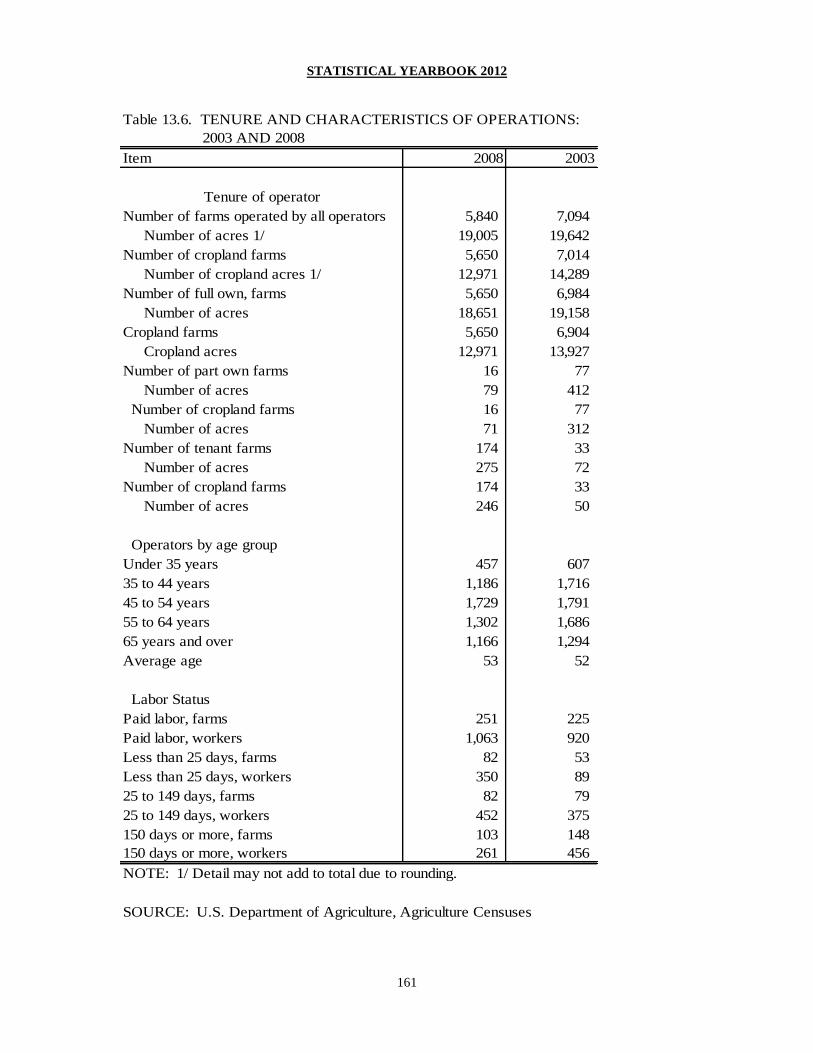
STATISTICAL YEARBOOK 2012
161
Table 13.6. TENURE AND CHARACTERISTICS OF OPERATIONS:
2003 AND 2008
Item 2008 2003
Tenure of operator
Number of farms operated by all operators 5,840 7,094
Number of acres 1/ 19,005 19,642
Number of cropland farms 5,650 7,014
Number of cropland acres 1/ 12,971 14,289
Number of full own, farms 5,650 6,984
Number of acres 18,651 19,158
Cropland farms 5,650 6,904
Cropland acres 12,971 13,927
Number of part own farms 16 77
Number of acres 79 412
Number of cropland farms 16 77
Number of acres 71 312
Number of tenant farms 174 33
Number of acres 275 72
Number of cropland farms 174 33
Number of acres 246 50
Operators by age group
Under 35 years 457 607
35 to 44 years 1,186 1,716
45 to 54 years 1,729 1,791
55 to 64 years 1,302 1,686
65 years and over 1,166 1,294
Average age 53 52
Labor Status
Paid labor, farms 251 225
Paid labor, workers 1,063 920
Less than 25 days, farms 82 53
Less than 25 days, workers 350 89
25 to 149 days, farms 82 79
25 to 149 days, workers 452 375
150 days or more, farms 103 148
150 days or more, workers 261 456
NOTE: 1/ Detail may not add to total due to rounding.
SOURCE: U.S. Department of Agriculture, Agriculture Censuses

STATISTICAL YEARBOOK 2012
162
Table 13.7. FIELD CROPS, MELONS, AND VEGETABLES: 1998, 2003 AND 2008
Pounds Pounds
harvested harvested Value Value
for for of of
Crop Farms Acres sale consumption sales ($) consumption ($)
Cabbage 184 89 301,693 117,970 332,236 129,913
Cassava 670 311 169,250 776,071 180,125 825,937
Corn 86 29 96,900 51,155 168,308 88,852
Cucumbers 334 151 405,854 211,005 371,920 193,363
Eggplant 257 66 71,700 129,533 61,888 111,807
Giant taro 2,770 1,412 191,650 3,831,835 205,961 4,117,968
Green beans 256 91 219,206 100,967 294,627 135,706
Green onions 43 20 15,400 7,625 27,599 13,665
Melons 53 22 2,400 78,800 2,500 82,083
Sugarcane 550 163 1,600 109,575 834 57,116
Taro 4,228 4,048 4,253,680 9,088,374 6,106,784 13,047,699
Tomatoes 214 59 19,840 162,339 22,555 184,554
Yams 1,677 703 199,310 1,481,224 200,955 1,493,449
Other field crops and
vegetables 294 160 60,326 452,097 59,003 442,182
2003
Cabbage 364 176 538,485 146,992 451,209 206,960
Cassava 240 83 26,750 198,763 23,005 170,936
Corn 37 14 25,000 58,340 15,530 36,241
Cucumbers 567 268 708,412 295,819 612,038 255,575
Eggplant 280 97 154,665 228,004 96,629 142,449
Giant taro 2,833 1,469 785,450 3,647,680 586,095 2,721,863
Green beans 349 120 137,670 170,331 128,240 158,664
Green onions 58 19 40,390 5,300 94,615 12,415
Melons 84 23 82,310 57,790 80,244 56,339
Sugarcane 268 74 6,335 53,043 3,290 27,547
Taro 5,002 4,501 5,861,353 9,438,709 6,469,847 10,418,585
Tomatoes 190 60 78,400 195,314 95,794 238,647
Yams 1,773 1,215 927,530 2,136,449 784,070 1,806,007
Other field crops and
vegetables 297 137 109,815 372,973 107,625 365,535
1998
Cabbage 239 71 429,680 11 309,804 119,876
Cassava 476 124 202,172 576,133 89,056 270,783
Corn 28 5 33,645 37,769 41,949 47,211
Cucumbers 304 102 354,109 246,861 290,413 202,426
Eggplant 189 33 89,661 127,161 70,319 104,272
Giant taro 2,184 807 1,874,979 538,772 1,637,364 4,948,470
Green beans 145 20 58,060 59,681 89,746 91,907
Green onions 51 10 11,979 5,569 18,671 9,134
Melons 16 1 5,824 2,281 8,887 3,490
Sugarcane 246 47 39,705 45,331 10,211 11,786
Taro 1,819 971 2,938,838 5,427,203 5,135,551 9,986,054
Tomatoes 155 41 109,331 331,392 231,148 672,726
Yams 988 241 401,355 1,229,902 397,241 1,365,191
Other field crops and
vegetables 171 44 179,376 242,036 106,223 145,222
SOURCE: American Samoa 1998, 2003 and 2008 Agriculture Censuses; U.S. Department of
Agriculture, National Agricultural Statistics Service.
2008
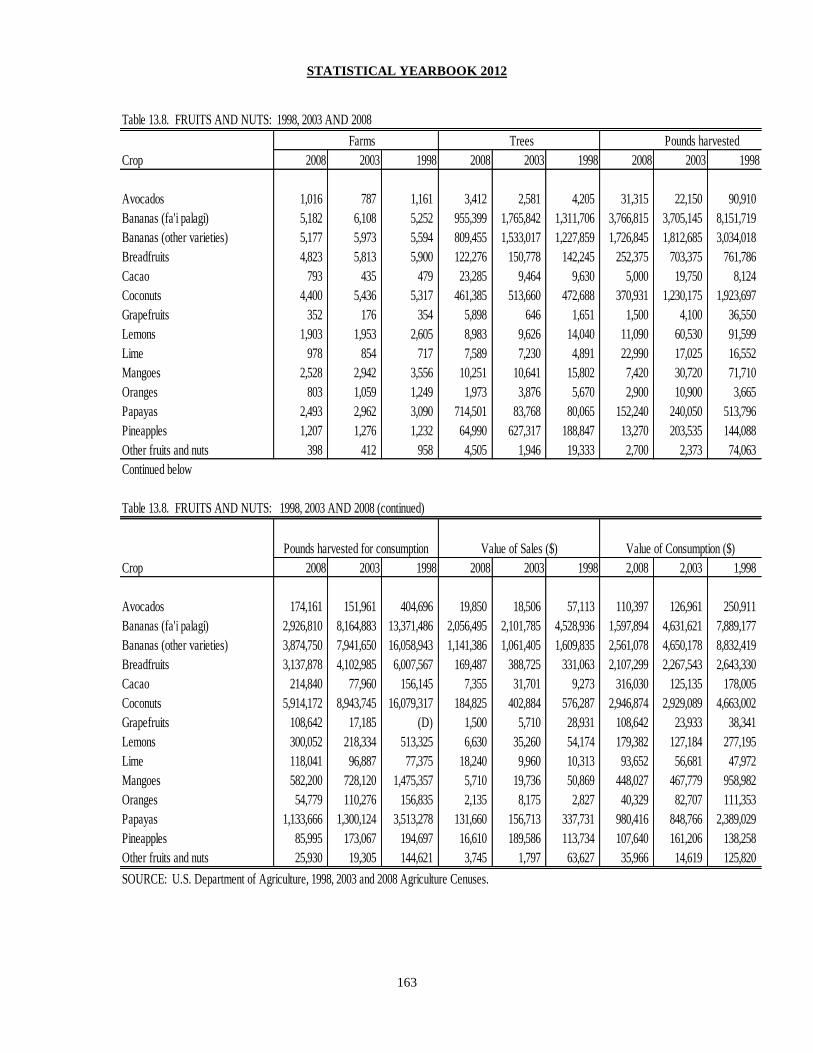
STATISTICAL YEARBOOK 2012
163
Table 13.8. FRUITS AND NUTS: 1998, 2003 AND 2008
Crop 2008 2003 1998 2008 2003 1998 2008 2003 1998
Avocados 1,016 787 1,161 3,412 2,581 4,205 31,315 22,150 90,910
Bananas (fa'i palagi) 5,182 6,108 5,252 955,399 1,765,842 1,311,706 3,766,815 3,705,145 8,151,719
Bananas (other varieties) 5,177 5,973 5,594 809,455 1,533,017 1,227,859 1,726,845 1,812,685 3,034,018
Breadfruits 4,823 5,813 5,900 122,276 150,778 142,245 252,375 703,375 761,786
Cacao 793 435 479 23,285 9,464 9,630 5,000 19,750 8,124
Coconuts 4,400 5,436 5,317 461,385 513,660 472,688 370,931 1,230,175 1,923,697
Grapefruits 352 176 354 5,898 646 1,651 1,500 4,100 36,550
Lemons 1,903 1,953 2,605 8,983 9,626 14,040 11,090 60,530 91,599
Lime 978 854 717 7,589 7,230 4,891 22,990 17,025 16,552
Mangoes 2,528 2,942 3,556 10,251 10,641 15,802 7,420 30,720 71,710
Oranges 803 1,059 1,249 1,973 3,876 5,670 2,900 10,900 3,665
Papayas 2,493 2,962 3,090 714,501 83,768 80,065 152,240 240,050 513,796
Pineapples 1,207 1,276 1,232 64,990 627,317 188,847 13,270 203,535 144,088
Other fruits and nuts 398 412 958 4,505 1,946 19,333 2,700 2,373 74,063
Continued below
Table 13.8. FRUITS AND NUTS: 1998, 2003 AND 2008 (continued)
Crop 2008 2003 1998 2008 2003 1998 2,008 2,003 1,998
Avocados 174,161 151,961 404,696 19,850 18,506 57,113 110,397 126,961 250,911
Bananas (fa'i palagi) 2,926,810 8,164,883 13,371,486 2,056,495 2,101,785 4,528,936 1,597,894 4,631,621 7,889,177
Bananas (other varieties) 3,874,750 7,941,650 16,058,943 1,141,386 1,061,405 1,609,835 2,561,078 4,650,178 8,832,419
Breadfruits 3,137,878 4,102,985 6,007,567 169,487 388,725 331,063 2,107,299 2,267,543 2,643,330
Cacao 214,840 77,960 156,145 7,355 31,701 9,273 316,030 125,135 178,005
Coconuts 5,914,172 8,943,745 16,079,317 184,825 402,884 576,287 2,946,874 2,929,089 4,663,002
Grapefruits 108,642 17,185 (D) 1,500 5,710 28,931 108,642 23,933 38,341
Lemons 300,052 218,334 513,325 6,630 35,260 54,174 179,382 127,184 277,195
Lime 118,041 96,887 77,375 18,240 9,960 10,313 93,652 56,681 47,972
Mangoes 582,200 728,120 1,475,357 5,710 19,736 50,869 448,027 467,779 958,982
Oranges 54,779 110,276 156,835 2,135 8,175 2,827 40,329 82,707 111,353
Papayas 1,133,666 1,300,124 3,513,278 131,660 156,713 337,731 980,416 848,766 2,389,029
Pineapples 85,995 173,067 194,697 16,610 189,586 113,734 107,640 161,206 138,258
Other fruits and nuts 25,930 19,305 144,621 3,745 1,797 63,627 35,966 14,619 125,820
SOURCE: U.S. Department of Agriculture, 1998, 2003 and 2008 Agriculture Cenuses.
Value of Sales ($)Pounds harvested for consumption Value of Consumption ($)
Trees Farms Pounds harvested
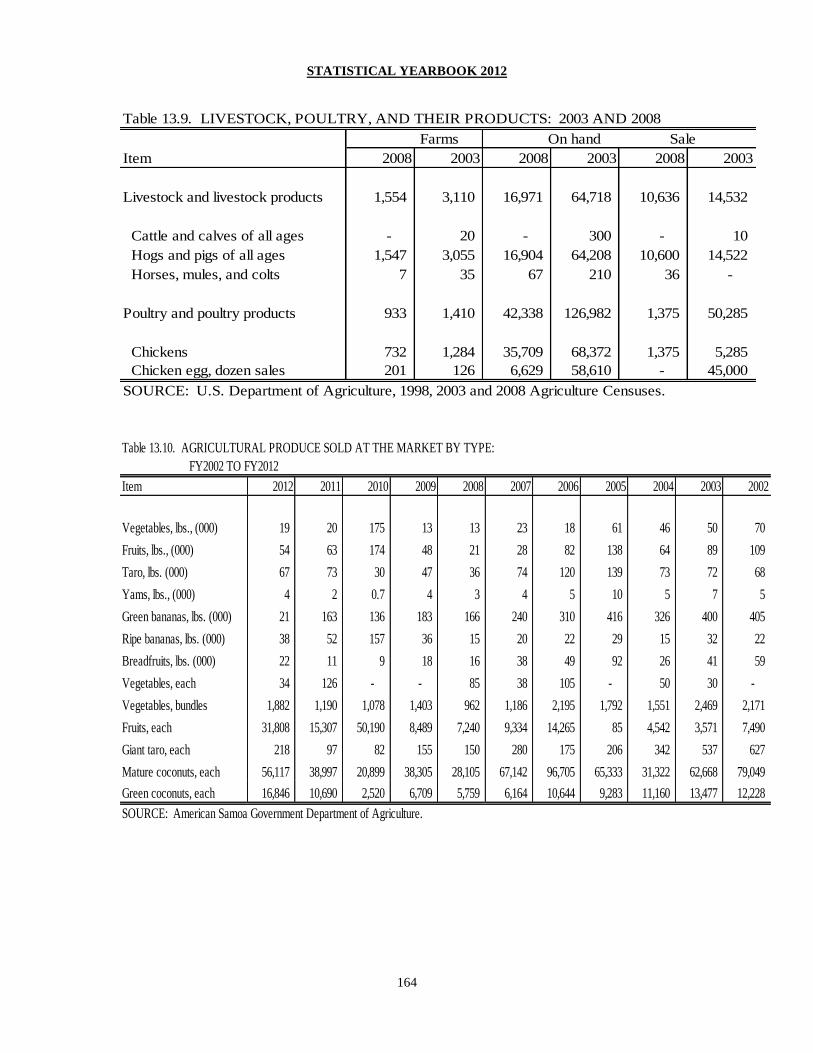
STATISTICAL YEARBOOK 2012
164
Table 13.9. LIVESTOCK, POULTRY, AND THEIR PRODUCTS: 2003 AND 2008
Farms On hand Sale
Item 2008 2003 2008 2003 2008 2003
Livestock and livestock products 1,554 3,110 16,971 64,718 10,636 14,532
Cattle and calves of all ages - 20 - 300 - 10
Hogs and pigs of all ages 1,547 3,055 16,904 64,208 10,600 14,522
Horses, mules, and colts 7 35 67 210 36 -
Poultry and poultry products 933 1,410 42,338 126,982 1,375 50,285
Chickens 732 1,284 35,709 68,372 1,375 5,285
Chicken egg, dozen sales 201 126 6,629 58,610 - 45,000
SOURCE: U.S. Department of Agriculture, 1998, 2003 and 2008 Agriculture Censuses.
Table 13.10. AGRICULTURAL PRODUCE SOLD AT THE MARKET BY TYPE:
FY2002 TO FY2012
Item 2012 2011 2010 2009 2008 2007 2006 2005 2004 2003 2002
Vegetables, lbs., (000) 19 20 175 13 13 23 18 61 46 50 70
Fruits, lbs., (000) 54 63 174 48 21 28 82 138 64 89 109
Taro, lbs. (000) 67 73 30 47 36 74 120 139 73 72 68
Yams, lbs., (000) 4 2 0.7 4 3 4 5 10 5 7 5
Green bananas, lbs. (000) 21 163 136 183 166 240 310 416 326 400 405
Ripe bananas, lbs. (000) 38 52 157 36 15 20 22 29 15 32 22
Breadfruits, lbs. (000) 22 11 9 18 16 38 49 92 26 41 59
Vegetables, each 34 126 - - 85 38 105 - 50 30 -
Vegetables, bundles 1,882 1,190 1,078 1,403 962 1,186 2,195 1,792 1,551 2,469 2,171
Fruits, each 31,808 15,307 50,190 8,489 7,240 9,334 14,265 85 4,542 3,571 7,490
Giant taro, each 218 97 82 155 150 280 175 206 342 537 627
Mature coconuts, each 56,117 38,997 20,899 38,305 28,105 67,142 96,705 65,333 31,322 62,668 79,049
Green coconuts, each 16,846 10,690 2,520 6,709 5,759 6,164 10,644 9,283 11,160 13,477 12,228
SOURCE: American Samoa Government Department of Agriculture.
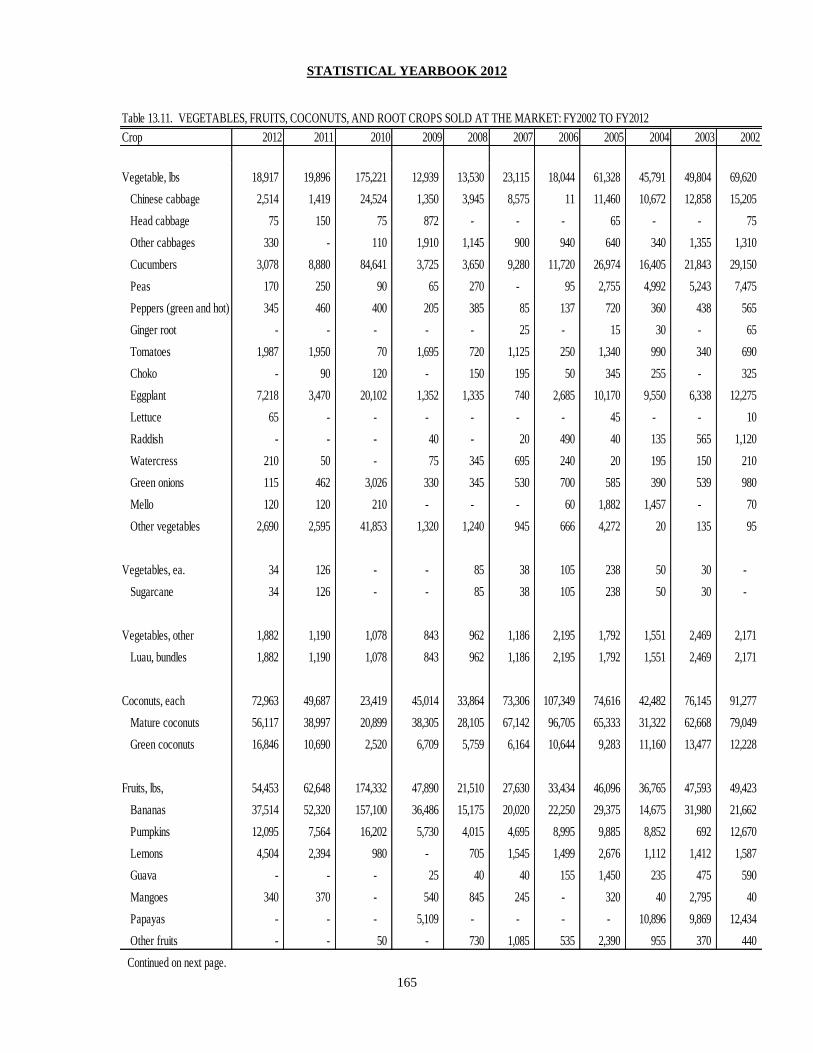
STATISTICAL YEARBOOK 2012
165
Table 13.11. VEGETABLES, FRUITS, COCONUTS, AND ROOT CROPS SOLD AT THE MARKET: FY2002 TO FY2012
Crop 2012 2011 2010 2009 2008 2007 2006 2005 2004 2003 2002
Vegetable, lbs 18,917 19,896 175,221 12,939 13,530 23,115 18,044 61,328 45,791 49,804 69,620
Chinese cabbage 2,514 1,419 24,524 1,350 3,945 8,575 11 11,460 10,672 12,858 15,205
Head cabbage 75 150 75 872 - - - 65 - - 75
Other cabbages 330 - 110 1,910 1,145 900 940 640 340 1,355 1,310
Cucumbers 3,078 8,880 84,641 3,725 3,650 9,280 11,720 26,974 16,405 21,843 29,150
Peas 170 250 90 65 270 - 95 2,755 4,992 5,243 7,475
Peppers (green and hot) 345 460 400 205 385 85 137 720 360 438 565
Ginger root - - - - - 25 - 15 30 - 65
Tomatoes 1,987 1,950 70 1,695 720 1,125 250 1,340 990 340 690
Choko - 90 120 - 150 195 50 345 255 - 325
Eggplant 7,218 3,470 20,102 1,352 1,335 740 2,685 10,170 9,550 6,338 12,275
Lettuce 65 - - - - - - 45 - - 10
Raddish - - - 40 - 20 490 40 135 565 1,120
Watercress 210 50 - 75 345 695 240 20 195 150 210
Green onions 115 462 3,026 330 345 530 700 585 390 539 980
Mello 120 120 210 - - - 60 1,882 1,457 - 70
Other vegetables 2,690 2,595 41,853 1,320 1,240 945 666 4,272 20 135 95
Vegetables, ea. 34 126 - - 85 38 105 238 50 30 -
Sugarcane 34 126 - - 85 38 105 238 50 30 -
Vegetables, other 1,882 1,190 1,078 843 962 1,186 2,195 1,792 1,551 2,469 2,171
Luau, bundles 1,882 1,190 1,078 843 962 1,186 2,195 1,792 1,551 2,469 2,171
Coconuts, each 72,963 49,687 23,419 45,014 33,864 73,306 107,349 74,616 42,482 76,145 91,277
Mature coconuts 56,117 38,997 20,899 38,305 28,105 67,142 96,705 65,333 31,322 62,668 79,049
Green coconuts 16,846 10,690 2,520 6,709 5,759 6,164 10,644 9,283 11,160 13,477 12,228
Fruits, lbs, 54,453 62,648 174,332 47,890 21,510 27,630 33,434 46,096 36,765 47,593 49,423
Bananas 37,514 52,320 157,100 36,486 15,175 20,020 22,250 29,375 14,675 31,980 21,662
Pumpkins 12,095 7,564 16,202 5,730 4,015 4,695 8,995 9,885 8,852 692 12,670
Lemons 4,504 2,394 980 - 705 1,545 1,499 2,676 1,112 1,412 1,587
Guava - - - 25 40 40 155 1,450 235 475 590
Mangoes 340 370 - 540 845 245 - 320 40 2,795 40
Papayas - - - 5,109 - - - - 10,896 9,869 12,434
Other fruits - - 50 - 730 1,085 535 2,390 955 370 440
Continued on next page.

STATISTICAL YEARBOOK 2012
166
Table 13.11. VEGETABLES, FRUITS, COCONUTS, AND ROOT CROPS SOLD AT THE MARKET: FY2002 TO FY2012 (continued)
Crop 2012 2011 2010 2009 2008 2007 2006 2005 2004 2003 2002
Fruits, each 31,808 15,307 50,190 8,489 7,240 9,334 14,265 3,390 15,438 13,440 19,924
Avocado 2,473 1,346 - 1,335 490 675 225 855 1,035 735 1,300
Melons - - - 50 - - - 160 - - -
Papayas 24,069 11,435 48,776 5,109 5,200 5,640 8,095 .. 10,896 9,869 12,434
Pineapples 5,196 2,401 1,414 1,995 1,450 2,974 5,870 2,130 4,512 3,571 7,435
Other fruits 70 125 - - 100 45 75 85 30 - 55
Roots, lbs. 72,736 76,437 32,961 51,760 39,645 80,735 125,152 149,973 78,630 81,411 74,599
Taro 66,686 73,085 29,736 47,335 35,870 74,385 117,952 138,949 72,915 71,619 68,409
Taro (palagi) - - 280 280 520 905 2,230 .. .. .. ..
Yams 3,920 2,112 730 3,505 3,145 4,400 4,515 9,739 4,590 7,407 5,220
Tapioca 1,260 230 1,465 640 - 705 455 1,255 600 2,125 595
Sweet potatoes 870 1,010 750 - 110 340 - 30 525 260 375
Roots, ea. 218 97 82 155 150 280 175 206 342 537 627
Giant taro, each 218 97 82 155 150 280 175 206 342 537 627
Other crops 229,940 173,838 144,248 200,887 182,321 278,818 359,234 508,255 352,708 440,813 463,325
Breadfruits 21,922 11,022 8,700 18,227 16,431 38,138 49,025 92,314 26,405 40,702 58,510
Green banana 208,018 162,816 135,548 182,660 165,890 240,680 310,209 415,941 326,303 400,111 404,815
SOURCE: Department of Agriculture

STATISTICAL YEARBOOK 2012
167
Table 13.12. LOCAL FISHING ACTIVITIES: FY2002 TO FY2012
Number Number Estimated
of of pounds
Year boats fishermen caught
2012 34 102 63,945
2011 42 126 98,906
2010 46 138 61,020
2009 48 144 117,736
2008 47 141 210,442
2007 57 171 202,043
2006 51 153 194,395
2005 53 159 140,887
2004 56 168 201,725
2003 74 222 434,559
2002 47 141 933,154
SOURCE: Department of Marine and Wildlife Resources.
Table 13.13. ESTIMATED OFFSHORE CATCH BY METHOD: FY2002 TO FY2012
Year Total (lbs.) Trolling Bottom Fishing
Trolling and
Bottom Fishing Spear Fishing Longlining
2012 63,945 20,724 19,689 3,448 18,003 2,081
2011 98,906 30,131 30,113 5,601 24,281 8,780
2010 61,020 2,205 23,146 987 31,971 2,711
2009 111,736 4,293 68,812 983 14,251 23,397
2008 210,442 40,064 103,959 3,533 9,357 53,529
2007 189,552 14,225 43,350 1,393 24,858 105,726
2006 194,395 19,254 11,433 82 13,691 149,935
2005 139,434 11,914 13,768 115 7,944 105,693
2004 201,725 14,256 18,302 594 3,598 164,975
2003 434,559 19,472 23,737 89 4,859 386,402
2002 933,154 18,731 40,801 - 7,652 865,970
SOURCE: Department of Marine and Wildlife Resources.
Method
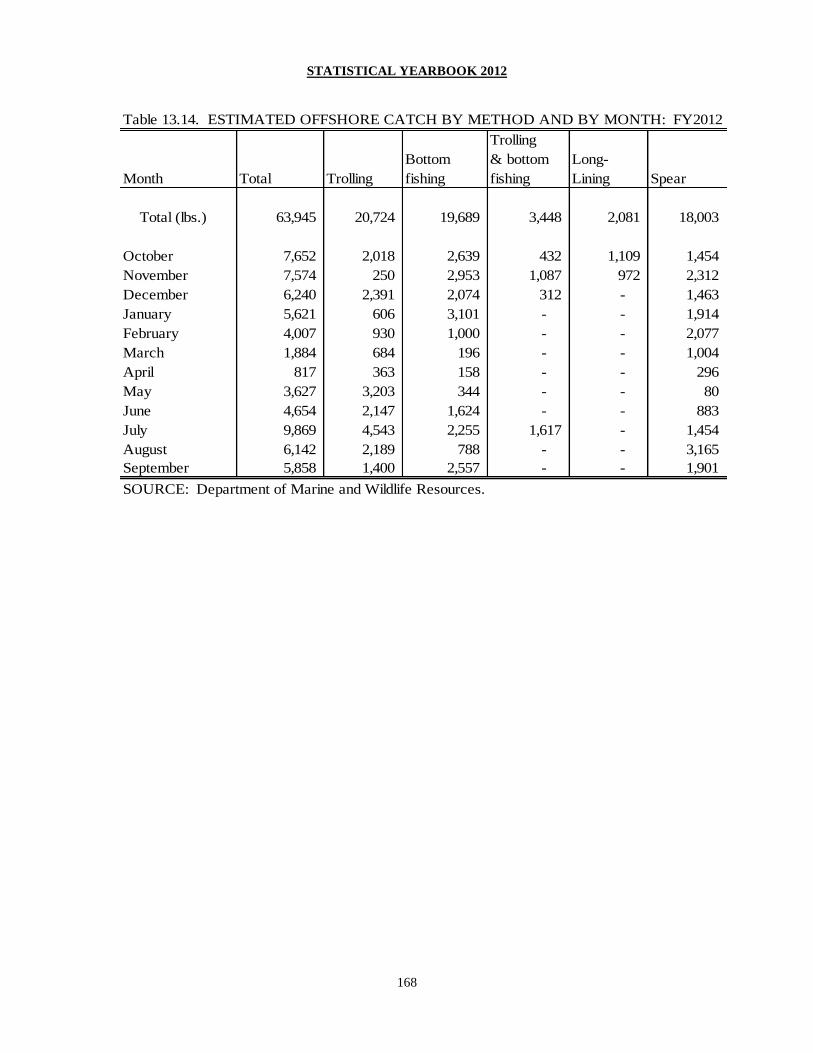
STATISTICAL YEARBOOK 2012
168
Table 13.14. ESTIMATED OFFSHORE CATCH BY METHOD AND BY MONTH: FY2012
Trolling
Bottom & bottom Long-
Month Total Trolling fishing fishing Lining Spear
Total (lbs.) 63,945 20,724 19,689 3,448 2,081 18,003
October 7,652 2,018 2,639 432 1,109 1,454
November 7,574 250 2,953 1,087 972 2,312
December 6,240 2,391 2,074 312 - 1,463
January 5,621 606 3,101 - - 1,914
February 4,007 930 1,000 - - 2,077
March 1,884 684 196 - - 1,004
April 817 363 158 - - 296
May 3,627 3,203 344 - - 80
June 4,654 2,147 1,624 - - 883
July 9,869 4,543 2,255 1,617 - 1,454
August 6,142 2,189 788 - - 3,165
September 5,858 1,400 2,557 - - 1,901
SOURCE: Department of Marine and Wildlife Resources.
STATISTICAL YEARBOOK 2012
169
Section Fourteen
COMMERCE AND TRADE
This section covers data on trade, government purchases, and business registration.
In this publication, trade data is classified using the 2012 Harmonized System Code. The
Secretariat of the Pacific Community assisted the Statistics Division in technical
assistance on improving the International Merchandise Trade Statistics for American
Samoa. An economic statistician from SPC worked with the Statistics Division staff on
improving trade statistics and adopting the accepted practice as used by the United
Nations. New tables were recommended to be used and are published in this publication.
The American Samoa Balance of Trade in fiscal year 2012 recorded a surplus of $151.3
million. Imports include government purchases, value of fish brought in for processing
for the canneries, and value of commercial merchandise brought in for resale. Trade data
is still considered incomplete because of the absence of the Post Exchange (PX) data
from the import series. The value of exports is made up primarily of canned tuna and by-
products.
Imports brought in through Customs Regulations for commercial use and resale valued at
$269.6 million which is an increase from FY2011 reported value. The United States
continued to be American Samoa’s leading trade partner, followed by Fiji, New Zealand,
Korea and Taiwan.
Major improvements are needed at the Customs Office for the collection of trade
statistics, especially in regards to the right Country of Origin and the correct value of
imported goods. Any and all goods crossing American Samoa border should be
accounted for regardless of purpose or user. Valuation of goods (FOB and CIF) must be
applied. Automation and standard commodity classification of all goods should be
adopted. Differentiation between intermediate goods and final consumption goods need
major improvements.

STATISTICAL YEARBOOK 2012
170
Trade Balance
Annually Domestic Re-exports Total Imports CIF Surplus(+) / Deficit(-)
2012 418,047,313 2,876,129 420,923,442 269,614,159 151,309,283
2011 278,288,152 2,825,627 281,113,779 207,387,800 73,725,979
2010 315,570,103 3,342,454 318,912,557 239,163,212 79,749,345
2009 491,239,242 2,748,124 493,987,366 311,374,752 182,612,614
2008 592,466,782 3,101,098 595,567,880 331,623,182 263,944,698
2007 463,120,592 2,940,532 466,061,124 232,201,560 233,859,564
Note: HS 2012 used.
Source: Department of Treasury, Customs and Excise Tax Division; U.S. Federal Trade Reports FT895
(2007-2012).
T14.1. BALANCE OF TRADE - ALL ITEMS: 2007 TO 2012
Exports FOB
[US$]
T14.2. IMPORTS BY HS: 2007 TO 2012
I II III IV V VI VII VIII IX X
Total
Live animals:
animal
products
Vegetable
products
Animal or vegetable
oils & fats
Prepared
foodstuffs,
beverages,
spirits &
tobacco
Mineral
products
Chemicals and
allied products
Plastic, rubber &
articles thereof
Raw hides, skins,
leather articles &
travel goods
Wood, cork &
articles thereof &
plaiting material
Wood pulp,
paper &
paperboard &
articles thereof
Periods 01 -05 06 -14 15 16 - 24 25 - 27 28 - 38 39 - 40 41 - 43 44 - 46 47 - 49
Annually
2012 149,694,870 78,474,874 14,940,405 10,801,714 17,193,492 7,866,243 8,567,348 2,019,341 2,740,468 1,690,806 2,614,294
2011 128,406,388 56,072,337 10,519,116 2,263,820 21,519,534 5,881,716 11,321,495 3,621,835 3,632,563 5,348,441 6,579,125
2010 151,104,031 78,079,519 8,177,736 2,345,479 23,223,376 9,538,123 8,409,224 2,320,665 6,207,903 4,289,821 6,430,889
2009 204,684,064 131,809,775 9,606,392 3,700,975 20,345,234 10,456,289 7,677,795 2,106,557 3,035,443 2,188,499 9,523,101
2008 221,627,484 111,378,446 7,575,592 5,969,753 22,679,419 44,918,895 8,717,702 2,698,774 1,986,422 3,184,490 8,666,327
2007 138,528,866 64,098,111 6,608,172 2,909,275 16,857,408 25,016,164 7,078,387 1,870,015 4,677,294 3,821,689 4,132,753
Continued on next page.
(US$)
HS
Sections

STATISTICAL YEARBOOK 2012
171
XI XII XIII XIV XV XVI XVII XVIII XIX XX XXI XXII
Textiles &
textile
articles
Footwear,
headgear,
umbrellas &
parts thereof
Articles of stone,
plaster, cement,
glass & ceremic
products
Pearls, precious &
semi-precious stones
& metals
Base metals
& articles
thereof
Machinery &
mechanical &
electrical
appliances &
parts thereof
Vehicles, aircraft
& associated
transport
equipment
Photographic &
optical, medical &
surgical goods &
clocks/watches &
musical instruments
Arms and
ammunition,
parts &
accessories
thereof
Miscellaneous
manufactured
articles
Works of art,
collectors
pieces &
antiques Others
Periods 50 - 63 64 - 67 68 - 70 71 72 - 83 84 - 85 86 - 89 90 - 92 93 94 - 96 97 99
Annually
2012 2,785,885 794,690 460,344 46,518 49,925,331 13,935,999 38,786,757 9,697,734 34,660 6,017,745 219,511
2011 1,646,405 480,730 776,591 1,568,722 37,830,811 13,723,117 15,555,871 128,566 507 7,035,033 1,881,465
2010 2,081,296 787,377 381,572 79,876 34,120,847 18,460,282 23,386,853 176,524 759 9,250,334 1,414,757
2009 4,234,004 948,419 228,307 151,964 51,572,186 16,087,708 25,607,791 291,717 1,223 9,721,773 2,079,600
2008 3,851,664 648,340 1,190,379 155,214 65,235,105 18,403,071 18,512,122 412,579 0 4,387,017 1,051,871
2007 1,459,598 551,870 938,933 308,851 57,188,252 12,215,377 14,310,701 359,732 150 6,463,159 1,335,669
Continued below
T14.2. IMPORTS BY HS: 2007 TO 2012 (Continued)
HS
Sections
T14.2. IMPORTS BY HS: 2007 TO 2012 (Continued)
I II III IV V VI VII VIII IX X XI
Live
animals:
animal
products
Vegetable
products
Animal or
vegetable
oils & fats
Prepared
foodstuffs,
beverages
, spirits &
tobacco
Mineral
products
Chemicals
and allied
products
Plastic, rubber &
articles thereof
Raw hides,
skins,
leather
articles &
travel
goods
Wood,
cork &
articles
thereof &
plaiting
material
Wood pulp,
paper &
paperboard
& articles
thereof
Textiles
&
textile
articles
Periods 01 -05 06 -14 15 16 - 24 25 - 27 28 - 38 39 - 40 41 - 43 44 - 46 47 - 49 50 - 63
Annually
2012 37.84% 7.20% 5.21% 8.29% 3.79% 4.13% 0.97% 1.32% 0.82% 1.26% 1.34%
2011 27.04% 5.07% 1.09% 10.38% 2.84% 5.46% 1.75% 1.75% 2.58% 3.17% 0.79%
2010 32.65% 3.42% 0.98% 9.71% 3.99% 3.52% 0.97% 2.60% 1.79% 2.69% 0.87%
2009 42.33% 3.09% 1.19% 6.53% 3.36% 2.47% 0.68% 0.97% 0.70% 3.06% 1.36%
2008 33.59% 2.28% 1.80% 6.84% 13.55% 2.63% 0.81% 0.60% 0.96% 2.61% 1.16%
2007 27.60% 2.85% 1.25% 7.26% 10.77% 3.05% 0.81% 2.01% 1.65% 1.78% 0.63%
Continued on next page.
Percentage for principal imports
HS
Sections
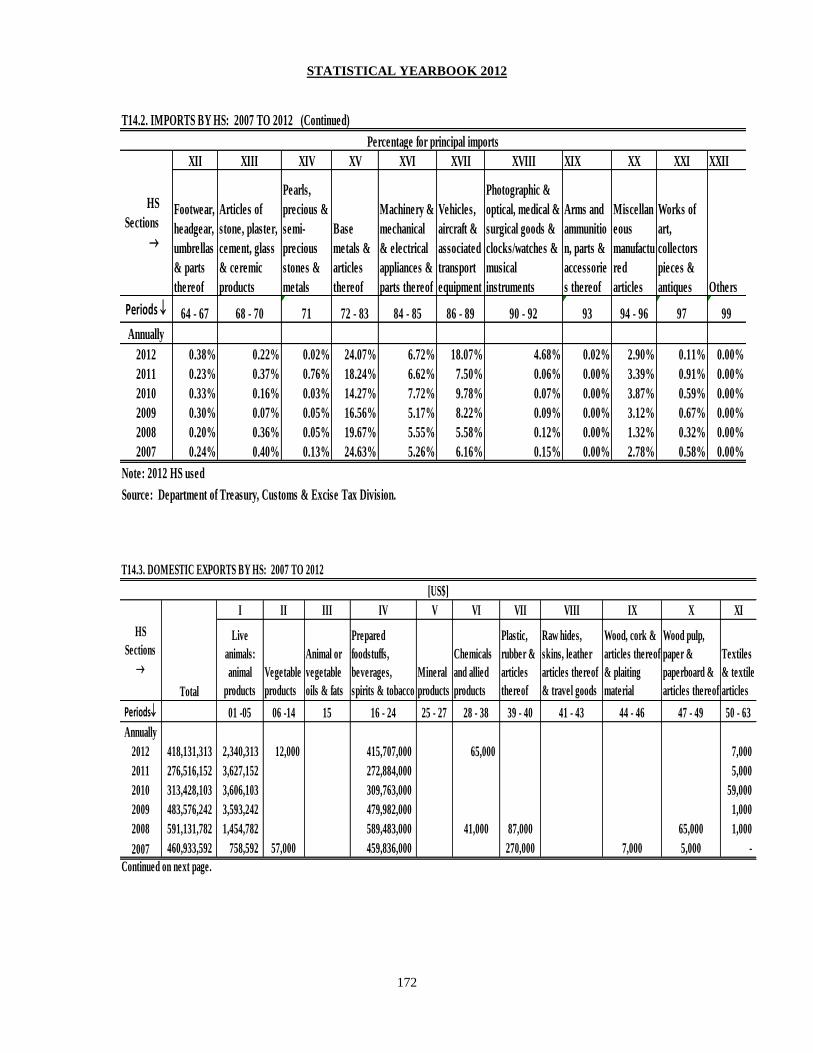
STATISTICAL YEARBOOK 2012
172
T14.2. IMPORTS BY HS: 2007 TO 2012 (Continued)
XII XIII XIV XV XVI XVII XVIII XIX XX XXI XXII
Footwear,
headgear,
umbrellas
& parts
thereof
Articles of
stone, plaster,
cement, glass
& ceremic
products
Pearls,
precious &
semi-
precious
stones &
metals
Base
metals &
articles
thereof
Machinery &
mechanical
& electrical
appliances &
parts thereof
Vehicles,
aircraft &
associated
transport
equipment
Photographic &
optical, medical &
surgical goods &
clocks/watches &
musical
instruments
Arms and
ammunitio
n, parts &
accessorie
s thereof
Miscellan
eous
manufactu
red
articles
Works of
art,
collectors
pieces &
antiques Others
Periods 64 - 67 68 - 70 71 72 - 83 84 - 85 86 - 89 90 - 92 93 94 - 96 97 99
Annually
2012 0.38% 0.22% 0.02% 24.07% 6.72% 18.07% 4.68% 0.02% 2.90% 0.11% 0.00%
2011 0.23% 0.37% 0.76% 18.24% 6.62% 7.50% 0.06% 0.00% 3.39% 0.91% 0.00%
2010 0.33% 0.16% 0.03% 14.27% 7.72% 9.78% 0.07% 0.00% 3.87% 0.59% 0.00%
2009 0.30% 0.07% 0.05% 16.56% 5.17% 8.22% 0.09% 0.00% 3.12% 0.67% 0.00%
2008 0.20% 0.36% 0.05% 19.67% 5.55% 5.58% 0.12% 0.00% 1.32% 0.32% 0.00%
2007 0.24% 0.40% 0.13% 24.63% 5.26% 6.16% 0.15% 0.00% 2.78% 0.58% 0.00%
Note: 2012 HS used
Source: Department of Treasury, Customs & Excise Tax Division.
Percentage for principal imports
HS
Sections
T14.3. DOMESTIC EXPORTS BY HS: 2007 TO 2012
I II III IV V VI VII VIII IX X XI
Live
animals:
animal
products
Vegetable
products
Animal or
vegetable
oils & fats
Prepared
foodstuffs,
beverages,
spirits & tobacco
Mineral
products
Chemicals
and allied
products
Plastic,
rubber &
articles
thereof
Raw hides,
skins, leather
articles thereof
& travel goods
Wood, cork &
articles thereof
& plaiting
material
Wood pulp,
paper &
paperboard &
articles thereof
Textiles
& textile
articles
Periods 01 -05 06 -14 15 16 - 24 25 - 27 28 - 38 39 - 40 41 - 43 44 - 46 47 - 49 50 - 63
Annually
2012 418,131,313 2,340,313 12,000 415,707,000 65,000 7,000
2011 276,516,152 3,627,152 272,884,000 5,000
2010 313,428,103 3,606,103 309,763,000 59,000
2009 483,576,242 3,593,242 479,982,000 1,000
2008 591,131,782 1,454,782 589,483,000 41,000 87,000 65,000 1,000
2007 460,933,592 758,592 57,000 459,836,000 270,000 7,000 5,000 -
Continued on next page.
HS
Sections
Total
[US$]

STATISTICAL YEARBOOK 2012
173
T14.3. DOMESTIC EXPORTS BY HS: 2007 TO 2012 (Continued)
XII XIII XIV XV XVI XVII XVIII XIX XX XXI XXII
Footwear,
headgear,
umbrellas &
parts thereof
Articles of stone,
plaster, cement,
glass & ceremic
products
Pearls, precious
& semi-precious
stones & metals
Base metals &
articles
thereof
Machinery &
mechanical &
electrical appliances
& parts thereof
Vehicles, aircraft
& associated
transport
equipment
Photographic & optical,
medical & surgical goods
& clocks/watches &
musical instruments
Arms and
ammunition, parts
& accessories
thereof
Miscellaneous
manufactured
articles
Works of art,
collectors
pieces &
antiques Others
Periods 64 - 67 68 - 70 71 72 - 83 84 - 85 86 - 89 90 - 92 93 94 - 96 97
Annually
2012 5,000 73,000 42,000 243,000 119,000 68,000 103,000
2011 1,772,000
2010 2,142,000
2009 7,365,000 298,000
2008 16,000 245,000 3,000 15,000 4,000 1,052,000
2007 11,000 51,000 988,000 13,000 13,000 1,111,000
Note: 2012 HS used
Source: Department of Treasury, Customs & Excise Tax Division.
HS
Sections
[US$]
Commodity 2012 2011 2010 2009 2008 2007
Total 418,784,313 278,288,152 315,570,103 490,941,242 590,954,782 463,120,592
Canned Tuna 415,707,000 272,884,000 302,151,000 471,307,000 579,717,000 451,495,000
Pet food 7,496,000 8,622,000 9,766,000 8,341,000
Fish meal 2,340,313 3,627,152 3,606,103 3,593,242 1,454,782 758,592
Aluminium 38,000 1,772,000 2,142,000 7,365,000 16,000 51,000
Other Domestic Exports 699,000 5,000 175,000 54,000 1,000 2,475,000
Note: HS 2012 used
Source: Department of Treasury, Customs and Excise Tax Division; U.S. Federal Trade Reports FT895 (2007-2012).
[US$]
Annually
T14.4. PRINCIPAL DOMESTIC EXPORTS: 2007 TO 2012
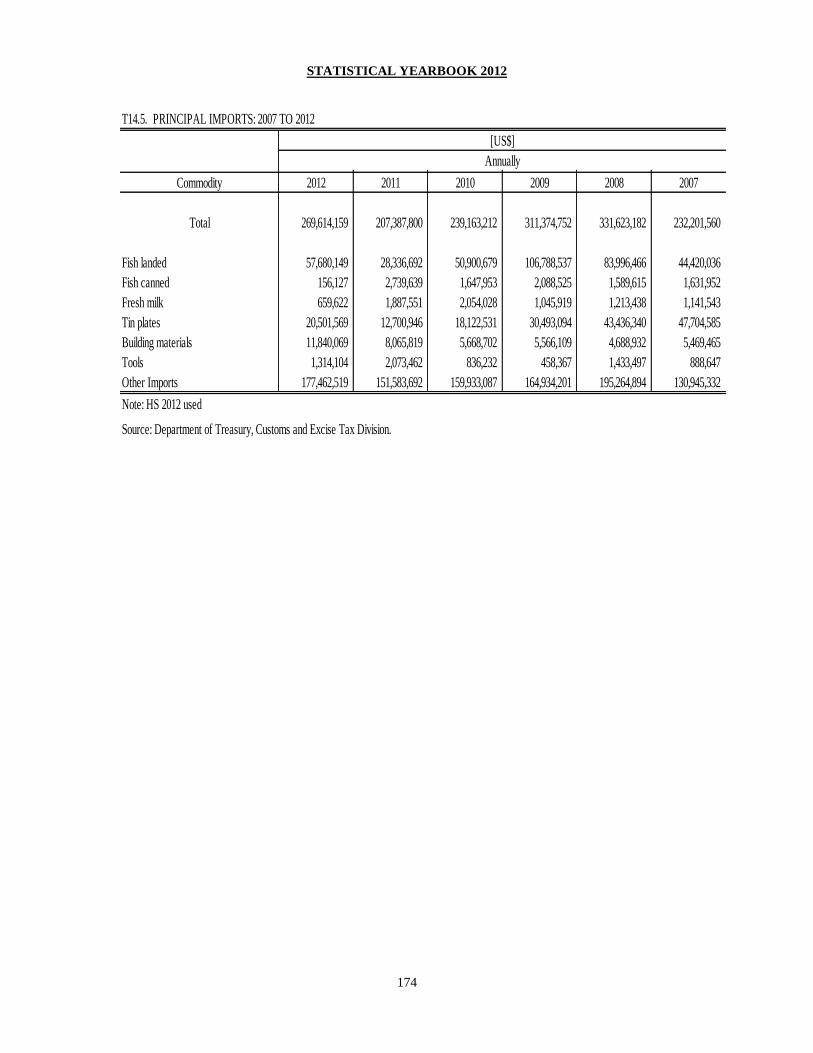
STATISTICAL YEARBOOK 2012
174
Commodity 2012 2011 2010 2009 2008 2007
Total 269,614,159 207,387,800 239,163,212 311,374,752 331,623,182 232,201,560
Fish landed 57,680,149 28,336,692 50,900,679 106,788,537 83,996,466 44,420,036
Fish canned 156,127 2,739,639 1,647,953 2,088,525 1,589,615 1,631,952
Fresh milk 659,622 1,887,551 2,054,028 1,045,919 1,213,438 1,141,543
Tin plates 20,501,569 12,700,946 18,122,531 30,493,094 43,436,340 47,704,585
Building materials 11,840,069 8,065,819 5,668,702 5,566,109 4,688,932 5,469,465
Tools 1,314,104 2,073,462 836,232 458,367 1,433,497 888,647
Other Imports 177,462,519 151,583,692 159,933,087 164,934,201 195,264,894 130,945,332
Note: HS 2012 used
Source: Department of Treasury, Customs and Excise Tax Division.
T14.5. PRINCIPAL IMPORTS: 2007 TO 2012
[US$]
Annually
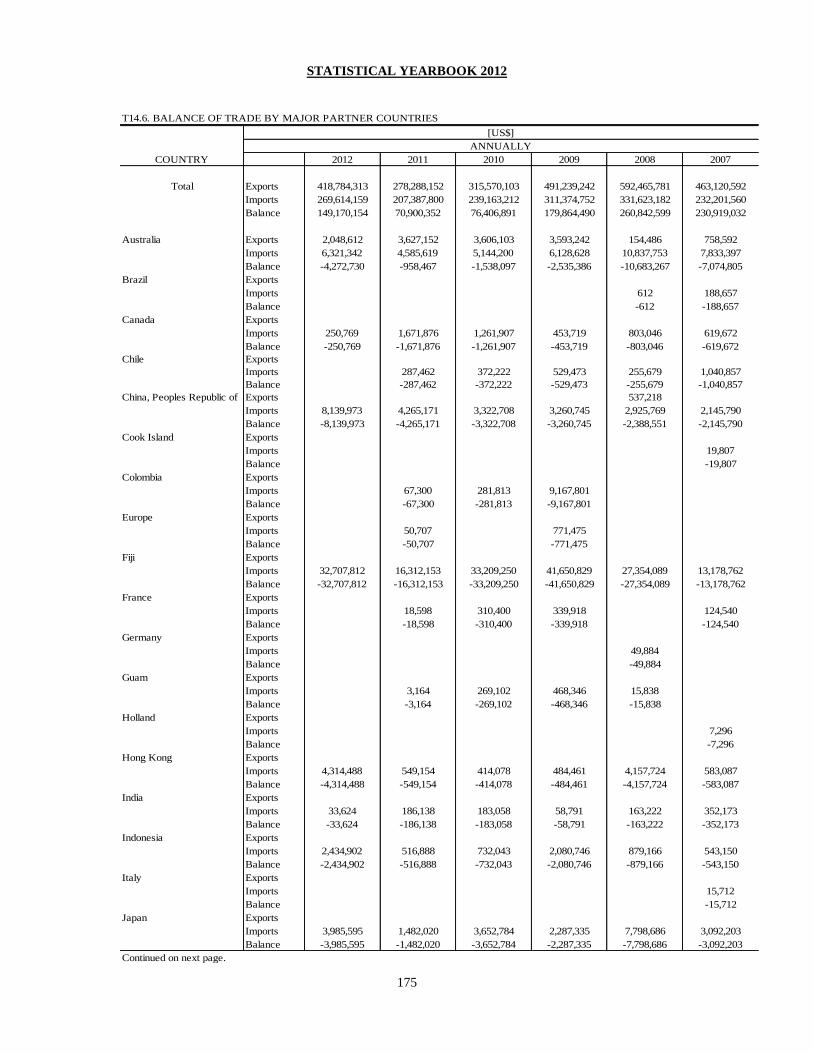
STATISTICAL YEARBOOK 2012
175
T14.6. BALANCE OF TRADE BY MAJOR PARTNER COUNTRIES
COUNTRY 2012 2011 2010 2009 2008 2007
Total Exports 418,784,313 278,288,152 315,570,103 491,239,242 592,465,781 463,120,592
Imports 269,614,159 207,387,800 239,163,212 311,374,752 331,623,182 232,201,560
Balance 149,170,154 70,900,352 76,406,891 179,864,490 260,842,599 230,919,032
Australia Exports 2,048,612 3,627,152 3,606,103 3,593,242 154,486 758,592
Imports 6,321,342 4,585,619 5,144,200 6,128,628 10,837,753 7,833,397
Balance -4,272,730 -958,467 -1,538,097 -2,535,386 -10,683,267 -7,074,805
Brazil Exports
Imports 612 188,657
Balance -612 -188,657
Canada Exports
Imports 250,769 1,671,876 1,261,907 453,719 803,046 619,672
Balance -250,769 -1,671,876 -1,261,907 -453,719 -803,046 -619,672
Chile Exports
Imports 287,462 372,222 529,473 255,679 1,040,857
Balance -287,462 -372,222 -529,473 -255,679 -1,040,857
China, Peoples Republic of Exports 537,218
Imports 8,139,973 4,265,171 3,322,708 3,260,745 2,925,769 2,145,790
Balance -8,139,973 -4,265,171 -3,322,708 -3,260,745 -2,388,551 -2,145,790
Cook Island Exports
Imports 19,807
Balance -19,807
Colombia Exports
Imports 67,300 281,813 9,167,801
Balance -67,300 -281,813 -9,167,801
Europe Exports
Imports 50,707 771,475
Balance -50,707 -771,475
Fiji Exports
Imports 32,707,812 16,312,153 33,209,250 41,650,829 27,354,089 13,178,762
Balance -32,707,812 -16,312,153 -33,209,250 -41,650,829 -27,354,089 -13,178,762
France Exports
Imports 18,598 310,400 339,918 124,540
Balance -18,598 -310,400 -339,918 -124,540
Germany Exports
Imports 49,884
Balance -49,884
Guam Exports
Imports 3,164 269,102 468,346 15,838
Balance -3,164 -269,102 -468,346 -15,838
Holland Exports
Imports 7,296
Balance -7,296
Hong Kong Exports
Imports 4,314,488 549,154 414,078 484,461 4,157,724 583,087
Balance -4,314,488 -549,154 -414,078 -484,461 -4,157,724 -583,087
India Exports
Imports 33,624 186,138 183,058 58,791 163,222 352,173
Balance -33,624 -186,138 -183,058 -58,791 -163,222 -352,173
Indonesia Exports
Imports 2,434,902 516,888 732,043 2,080,746 879,166 543,150
Balance -2,434,902 -516,888 -732,043 -2,080,746 -879,166 -543,150
Italy Exports
Imports 15,712
Balance -15,712
Japan Exports
Imports 3,985,595 1,482,020 3,652,784 2,287,335 7,798,686 3,092,203
Balance -3,985,595 -1,482,020 -3,652,784 -2,287,335 -7,798,686 -3,092,203
Continued on next page.
[US$]
ANNUALLY

STATISTICAL YEARBOOK 2012
176
T14.6. BALANCE OF TRADE BY MAJOR PARTNER COUNTRIES (continued)
COUNTRY 2012 2011 2010 2009 2008 2007
Korea Exports
Imports 15,383,718 16,458,315 20,453,233 23,330,278 26,426,830 19,994,883
Balance -15,383,718 -16,458,315 -20,453,233 -23,330,278 -26,426,830 -19,994,883
Malaysia Exports
Imports 4,830 492,075 113,132 86,535 128,862 920,424
Balance -4,830 -492,075 -113,132 -86,535 -128,862 -920,424
Mexico Exports
Imports 315,917 164,024 119,370 51,767
Balance -315,917 -164,024 -119,370 -51,767
New Caledonia Exports 127,650
Imports 341,509 4,204,244 1,765,297 1,947,192 2,030,063 1,046,834
Balance -213,859 -4,204,244 -1,765,297 -1,947,192 -2,030,063 -1,046,834
Niue Exports
Imports 1,036,131 1,094,041
Balance -1,036,131 -1,094,041
New Zealand Exports 111,280
Imports 21,912,425 24,946,995 28,036,207 25,640,404 28,483,617 24,359,054
Balance -21,912,425 -24,946,995 -28,036,207 -25,640,404 -28,372,337 -24,359,054
Samoa Exports
Imports 8,988,265 6,880,017 9,627,852 4,977,541 11,175,492 1,693,500
Balance -8,988,265 -6,880,017 -9,627,852 -4,977,541 -11,175,492 -1,693,500
Singapore Exports
Imports 1,153,852 1,089,081 6,838,147 8,817,883 50,707,546 25,024,224
Balance -1,153,852 -1,089,081 -6,838,147 -8,817,883 -50,707,546 -25,024,224
Papua New Guinea Exports
Imports 918 1,875,768 4,263,867 4,345,596 5,768,346 2,315,787
Balance -918 -1,875,768 -4,263,867 -4,345,596 -5,768,346 -2,315,787
Phillipines Exports 54,704 221,141
Imports 222,327 727,254 2,018,107 1,631,693 1,403,400 645,970
Balance -167,623 -727,254 -2,018,107 -1,631,693 -1,182,259 -645,970
Puerto Rico Exports
Imports 240,269
Balance -240,269
South Africa Exports
Imports 36,250 2,485,212 8,853,020 8,271,866
Balance -36,250 -2,485,212 -8,853,020 -8,271,866
Spain Exports
Imports 3,440 380,482 470,267 1,412,727 3,014
Balance -3,440 -380,482 -470,267 -1,412,727 -3,014
Tahiti Exports
Imports 3,310,418 3,530,998 4,438,823 13,505,827 4,142,485 4,052,766
Balance -3,310,418 -3,530,998 -4,438,823 -13,505,827 -4,142,485 -4,052,766
Thailand Exports
Imports 371,260 666,561 1,082,073 22,517,408 12,957,371 11,043,046
Balance -371,260 -666,561 -1,082,073 -22,517,408 -12,957,371 -11,043,046
Taiwan Exports 109,347 429,656
Imports 12,210,326 2,899,068 3,394,889 2,137,727 7,131,690 5,005,601
Balance -12,100,979 -2,899,068 -3,394,889 -2,137,727 -6,702,034 -5,005,601
Tonga Exports
Imports 123,102 61,154 129,859 588,356 387,218 426,911
Balance -123,102 -61,154 -129,859 -588,356 -387,218 -426,911
Tunisia (N/Africa) Exports
Imports 197,454
Balance -197,454
United States of America Exports 416,444,000 274,661,000 311,964,000 487,646,000 591,012,000 462,362,000
Imports 147,402,704 113,090,187 104,627,450 124,757,972 114,798,701 104,279,059
Balance 269,041,296 161,570,813 207,336,550 362,888,029 476,213,300 358,082,942
Unaccounted Exports
Imports 61,854
Balance -61,854
Vietnam Exports
Imports 114,226 190,993 84,787
Balance -114,226 -190,993 -84,787
Note: HS 2012 used
Source: Department of Treasury, Customs and Excise Tax Division; U.S. Federal Trade Reports FT895 (2007-2012)
[US$]
ANNUALLY
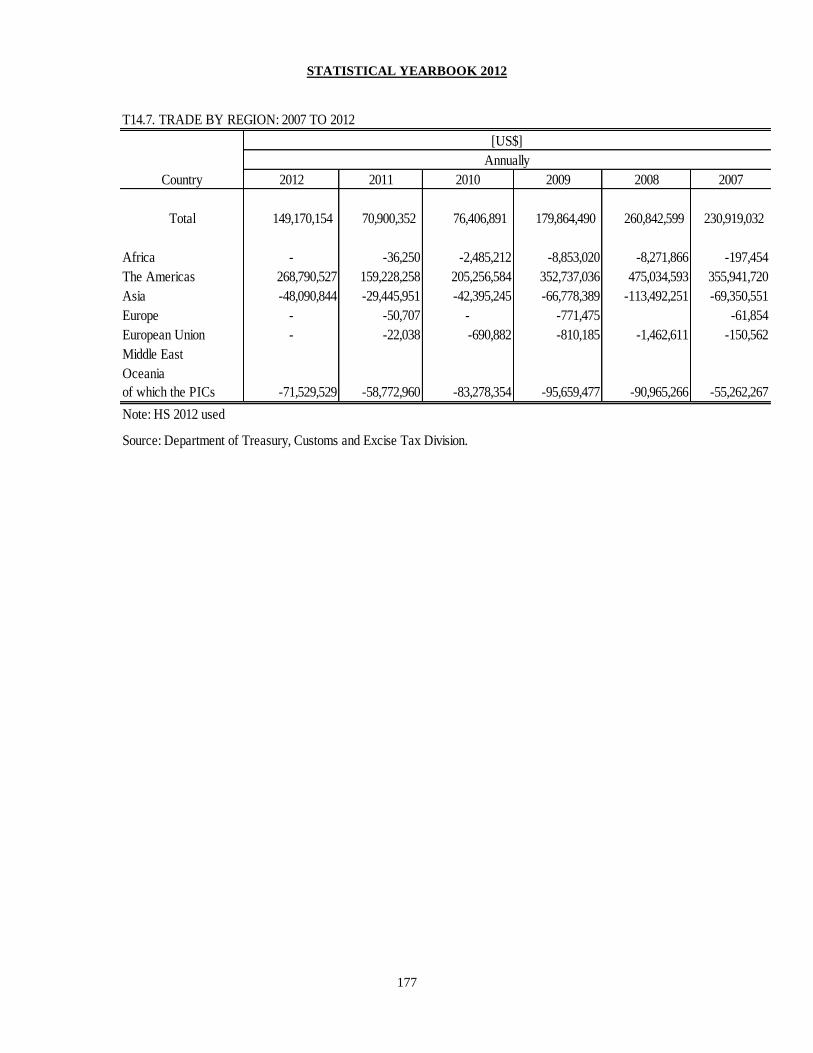
STATISTICAL YEARBOOK 2012
177
T14.7. TRADE BY REGION: 2007 TO 2012
Country 2012 2011 2010 2009 2008 2007
Total 149,170,154 70,900,352 76,406,891 179,864,490 260,842,599 230,919,032
Africa - -36,250 -2,485,212 -8,853,020 -8,271,866 -197,454
The Americas 268,790,527 159,228,258 205,256,584 352,737,036 475,034,593 355,941,720
Asia -48,090,844 -29,445,951 -42,395,245 -66,778,389 -113,492,251 -69,350,551
Europe - -50,707 - -771,475 -61,854
European Union - -22,038 -690,882 -810,185 -1,462,611 -150,562
Middle East
Oceania
of which the PICs -71,529,529 -58,772,960 -83,278,354 -95,659,477 -90,965,266 -55,262,267
Note: HS 2012 used
Source: Department of Treasury, Customs and Excise Tax Division.
[US$]
Annually

STATISTICAL YEARBOOK 2012
178
Section Fifteen
ELECTRICITY AND WATER
This section presents statistical data in electricity production and consumption, number of
meters and water usage.
Table 15.1 shows electricity generated in the past three years were 159 million KWh in
FY2010, 155 million KWh in FY2011, and 157 million KWh in FY2012. Although it
went up in 2012, it is a small increase compared to previous years. About 7.7 million
KWh was used in the production of electricity, netting 148.9 million KWh for sale. With
9.7 percent of line loss, only 134 million KWh was sold. Fuel efficiency remained at
14.1 KWh per gallon for the past ten years. Lube efficiency increased to 5,591 in 2012.
About 11 gallons of fuel was consumed in FY2012. The average cost of a gallon of fuel
was $3.774 in FY2012. With the increase in cost of a gallon of fuel in the past three
years, the fuel surcharge also increased in this period.
The number of meters went up in FY2012 to 12,177. The majority of meters were for
residential usage (about 88.3 percent of total meters). About 7 percent were for
commercial usage. The rest were for government (3.6 percent), ASPA (1.1 percent) and
large power (.03 percent).
About 4,772 million gallons of water were sold in FY2012.
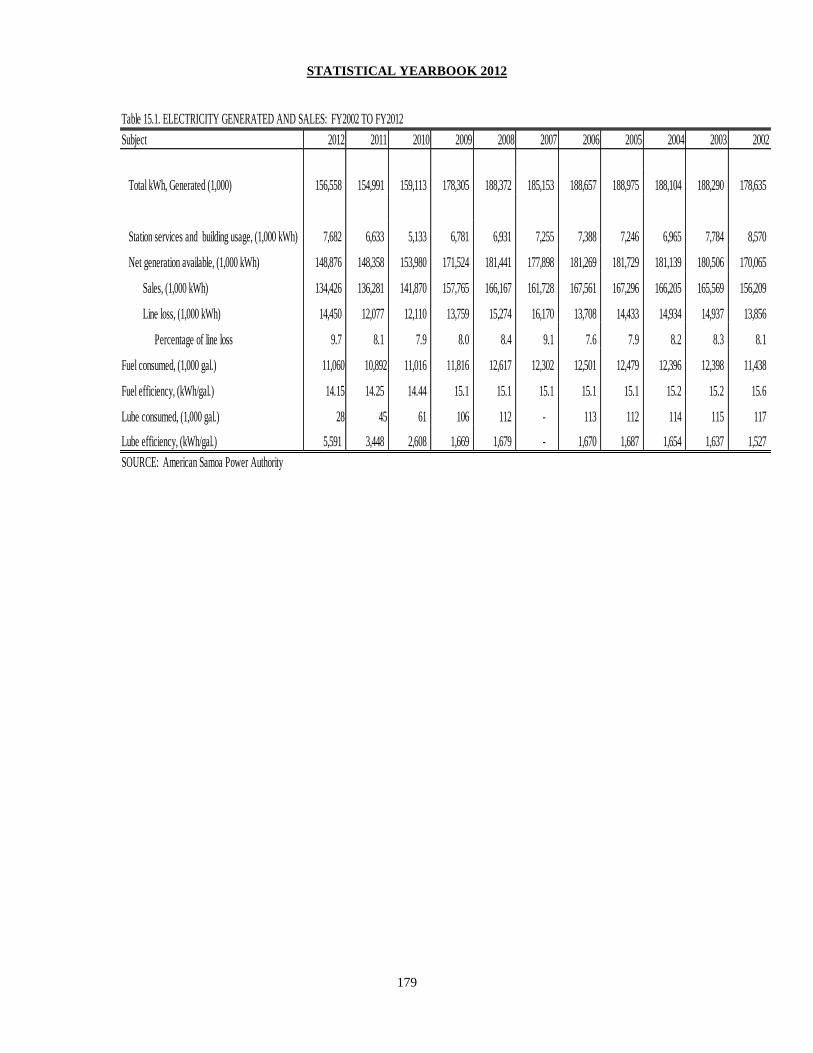
STATISTICAL YEARBOOK 2012
179
Table 15.1. ELECTRICITY GENERATED AND SALES: FY2002 TO FY2012
Subject 2012 2011 2010 2009 2008 2007 2006 2005 2004 2003 2002
Total kWh, Generated (1,000) 156,558 154,991 159,113 178,305 188,372 185,153 188,657 188,975 188,104 188,290 178,635
Station services and building usage, (1,000 kWh) 7,682 6,633 5,133 6,781 6,931 7,255 7,388 7,246 6,965 7,784 8,570
Net generation available, (1,000 kWh) 148,876 148,358 153,980 171,524 181,441 177,898 181,269 181,729 181,139 180,506 170,065
Sales, (1,000 kWh) 134,426 136,281 141,870 157,765 166,167 161,728 167,561 167,296 166,205 165,569 156,209
Line loss, (1,000 kWh) 14,450 12,077 12,110 13,759 15,274 16,170 13,708 14,433 14,934 14,937 13,856
Percentage of line loss 9.7 8.1 7.9 8.0 8.4 9.1 7.6 7.9 8.2 8.3 8.1
Fuel consumed, (1,000 gal.) 11,060 10,892 11,016 11,816 12,617 12,302 12,501 12,479 12,396 12,398 11,438
Fuel efficiency, (kWh/gal.) 14.15 14.25 14.44 15.1 15.1 15.1 15.1 15.1 15.2 15.2 15.6
Lube consumed, (1,000 gal.) 28 45 61 106 112 - 113 112 114 115 117
Lube efficiency, (kWh/gal.) 5,591 3,448 2,608 1,669 1,679 - 1,670 1,687 1,654 1,637 1,527
SOURCE: American Samoa Power Authority
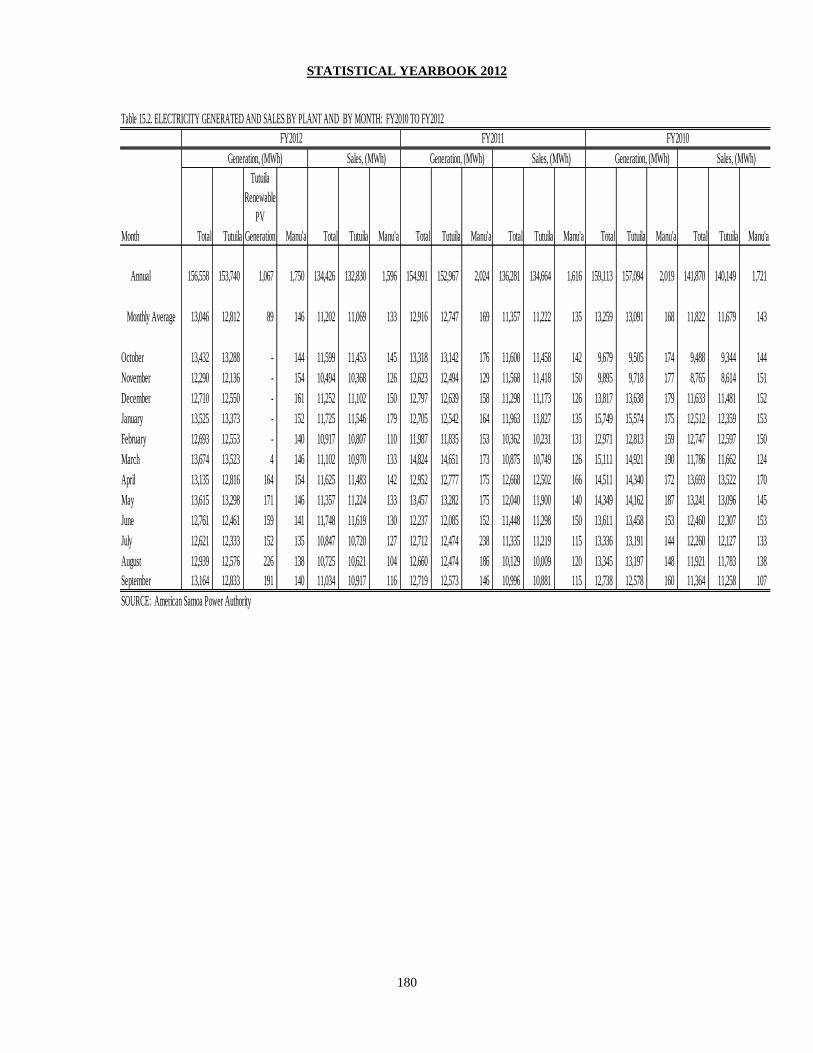
STATISTICAL YEARBOOK 2012
180
Table 15.2. ELECTRICITY GENERATED AND SALES BY PLANT AND BY MONTH: FY2010 TO FY2012
Month Total Tutuila
Tutuila
Renewable
PV
Generation Manu'a Total Tutuila Manu'a Total Tutuila Manu'a Total Tutuila Manu'a Total Tutuila Manu'a Total Tutuila Manu'a
Annual 156,558 153,740 1,067 1,750 134,426 132,830 1,596 154,991 152,967 2,024 136,281 134,664 1,616 159,113 157,094 2,019 141,870 140,149 1,721
Monthly Average 13,046 12,812 89 146 11,202 11,069 133 12,916 12,747 169 11,357 11,222 135 13,259 13,091 168 11,822 11,679 143
October 13,432 13,288 - 144 11,599 11,453 145 13,318 13,142 176 11,600 11,458 142 9,679 9,505 174 9,488 9,344 144
November 12,290 12,136 - 154 10,494 10,368 126 12,623 12,494 129 11,568 11,418 150 9,895 9,718 177 8,765 8,614 151
December 12,710 12,550 - 161 11,252 11,102 150 12,797 12,639 158 11,298 11,173 126 13,817 13,638 179 11,633 11,481 152
January 13,525 13,373 - 152 11,725 11,546 179 12,705 12,542 164 11,963 11,827 135 15,749 15,574 175 12,512 12,359 153
February 12,693 12,553 - 140 10,917 10,807 110 11,987 11,835 153 10,362 10,231 131 12,971 12,813 159 12,747 12,597 150
March 13,674 13,523 4 146 11,102 10,970 133 14,824 14,651 173 10,875 10,749 126 15,111 14,921 190 11,786 11,662 124
April 13,135 12,816 164 154 11,625 11,483 142 12,952 12,777 175 12,668 12,502 166 14,511 14,340 172 13,693 13,522 170
May 13,615 13,298 171 146 11,357 11,224 133 13,457 13,282 175 12,040 11,900 140 14,349 14,162 187 13,241 13,096 145
June 12,761 12,461 159 141 11,748 11,619 130 12,237 12,085 152 11,448 11,298 150 13,611 13,458 153 12,460 12,307 153
July 12,621 12,333 152 135 10,847 10,720 127 12,712 12,474 238 11,335 11,219 115 13,336 13,191 144 12,260 12,127 133
August 12,939 12,576 226 138 10,725 10,621 104 12,660 12,474 186 10,129 10,009 120 13,345 13,197 148 11,921 11,783 138
September 13,164 12,833 191 140 11,034 10,917 116 12,719 12,573 146 10,996 10,881 115 12,738 12,578 160 11,364 11,258 107
SOURCE: American Samoa Power Authority
FY2012 FY2011 FY2010
Generation, (MWh) Sales, (MWh) Generation, (MWh) Sales, (MWh) Generation, (MWh) Sales, (MWh)
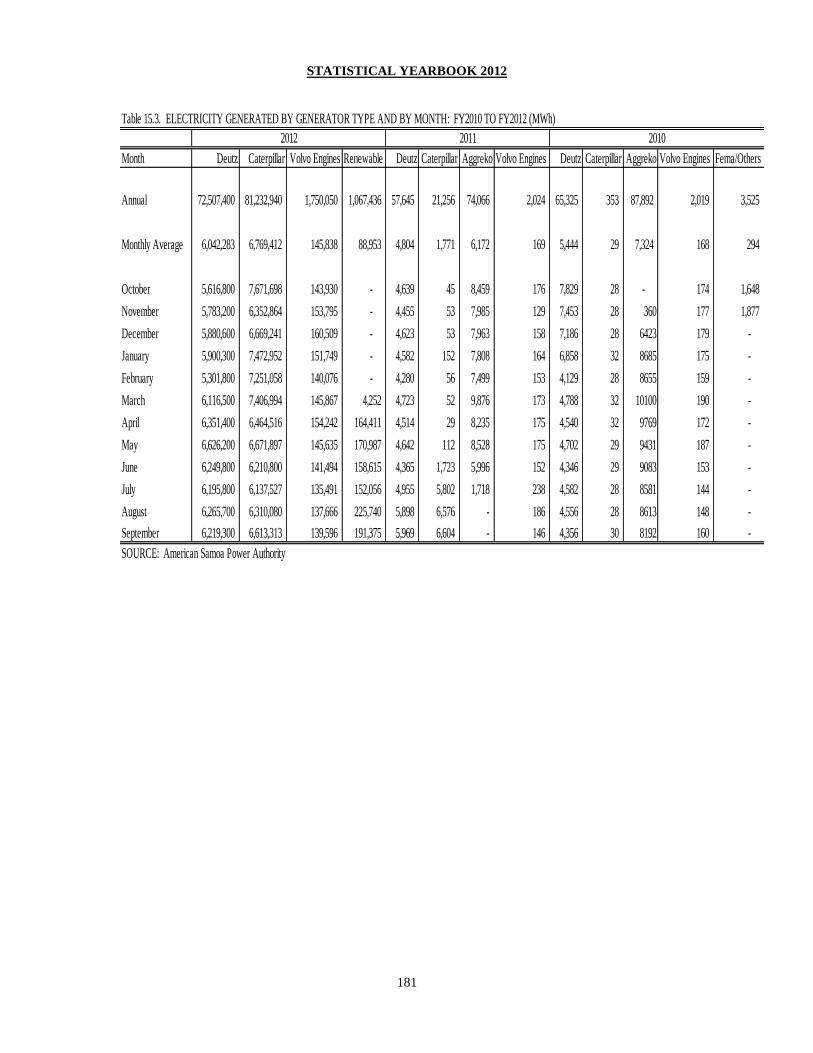
STATISTICAL YEARBOOK 2012
181
Table 15.3. ELECTRICITY GENERATED BY GENERATOR TYPE AND BY MONTH: FY2010 TO FY2012 (MWh)
Month Deutz Caterpillar Volvo Engines Renewable Deutz Caterpillar Aggreko Volvo Engines Deutz Caterpillar Aggreko Volvo Engines Fema/Others
Annual 72,507,400 81,232,940 1,750,050 1,067,436 57,645 21,256 74,066 2,024 65,325 353 87,892 2,019 3,525
Monthly Average 6,042,283 6,769,412 145,838 88,953 4,804 1,771 6,172 169 5,444 29 7,324 168 294
October 5,616,800 7,671,698 143,930 - 4,639 45 8,459 176 7,829 28 - 174 1,648
November 5,783,200 6,352,864 153,795 - 4,455 53 7,985 129 7,453 28 360 177 1,877
December 5,880,600 6,669,241 160,509 - 4,623 53 7,963 158 7,186 28 6423 179 -
January 5,900,300 7,472,952 151,749 - 4,582 152 7,808 164 6,858 32 8685 175 -
February 5,301,800 7,251,058 140,076 - 4,280 56 7,499 153 4,129 28 8655 159 -
March 6,116,500 7,406,994 145,867 4,252 4,723 52 9,876 173 4,788 32 10100 190 -
April 6,351,400 6,464,516 154,242 164,411 4,514 29 8,235 175 4,540 32 9769 172 -
May 6,626,200 6,671,897 145,635 170,987 4,642 112 8,528 175 4,702 29 9431 187 -
June 6,249,800 6,210,800 141,494 158,615 4,365 1,723 5,996 152 4,346 29 9083 153 -
July 6,195,800 6,137,527 135,491 152,056 4,955 5,802 1,718 238 4,582 28 8581 144 -
August 6,265,700 6,310,080 137,666 225,740 5,898 6,576 - 186 4,556 28 8613 148 -
September 6,219,300 6,613,313 139,596 191,375 5,969 6,604 - 146 4,356 30 8192 160 -
SOURCE: American Samoa Power Authority
2012 2011 2010

STATISTICAL YEARBOOK 2012
182
Table 15.4. FUEL CONSUMPTION EFFICIENCY: FY2003 TO FY2012
Total Fuel Fuel Total Fuel Fuel Total Fuel Fuel Total Fuel Fuel Total Fuel Fuel
generation consumed efficiency generation consumed efficiency generation consumed efficiency generation consumed efficiency generation consumed efficiency
Month (MWh) (1,000 gal.) (kWh/gal) (MWh) (1,000 gal.) (kWh/gal) (MWh) (1,000 gal.) (kWh/gal) (MWh) (1,000 gal.) (kWh/gal) (MWh) (1,000 gal.) (kWh/gal)
Total 155,490 11,060 156,558 10,892 159,113 11,105 178,396 11,816 188,449 12,617
Average 12,958 922 14.06 13,046 908 14.38 13,259 925 14.34 14,866 985 15.10 15,704 1,051 14.95
October 13,432 958 14.0 13,432 942 14.25 9,679 660 14.67 15,374 1015 15.14 16,661 1,048 15.90
November 12,290 891 13.8 12,290 887 13.85 9,895 683 14.49 15,337 1013 15.14 16,095 1,096 14.69
December 12,710 917 13.9 12,710 905 14.04 13,817 956 14.45 15,193 1003 15.14 16,247 1,071 15.17
January 13,525 969 14.0 13,525 886 15.26 15,749 1092 14.42 15,548 1026 15.15 15,897 1,067 14.90
February 12,693 916 13.9 12,693 847 14.99 12,971 883 14.69 13,781 914 15.08 15,594 1,061 14.70
March 13,669 977 14.0 13,674 970 14.10 15,111 1068 14.15 15,252 1013 15.05 16,245 1,036 15.68
April 12,970 913 14.2 13,135 920 14.28 14,511 1016 14.28 15,002 1000 15.00 15,276 1,086 14.07
May 13,444 954 14.1 13,615 951 14.32 14,349 995 14.42 15,217 1010 15.06 16,151 1,023 15.79
June 12,602 895 14.1 12,761 903 14.13 13,611 957 14.22 14,288 944 15.13 14,826 1,080 13.73
July 12,469 872 14.3 12,621 862 14.64 13,336 949 14.05 14,643 971 15.09 15,216 985 15.45
August 12,713 899 14.1 12,939 903 14.33 13,345 947 14.09 15,065 997 15.11 15,492 1,026 15.10
September 12,972 899 14.4 13,164 915 14.38 12,738 899 14.17 13,695 908 15.09 14,749 1,038 14.21
Continued below.
Table 15.4. FUEL CONSUMPTION EFFICIENCY: FY2003 TO FY2012 (Continued)
Total Fuel Fuel Total Fuel Fuel Total Fuel Fuel Total Fuel Fuel Total Fuel Fuel
generation consumed efficiency generation consumed efficiency generation consumed efficiency generation consumed efficiency generation consumed efficiency
Month (MWh) (1,000 gal.) (kWh/gal) (MWh) (1,000 gal.) (kWh/gal) (MWh) (1,000 gal.) (kWh/gal) (MWh) (1,000 gal.) (kWh/gal) (MWh) (1,000 gal.) (MWh/gal)
Total 185,155 12,303 188,657 12,499 188,974 12,479 187,591 12360 187,892 12,396
Average 15,430 1,025 15.07 15,721 1,042 15.09 15,748 1,040 15.14 15,633 1,030 15.18 15,658 1,033 15.16
October 15,882 1,030 15.42 16,174 1,070 15.11 16,166 1,067 15.16 15,806 1,030 15.35 15,364 1,009 15.23
November 15,435 1,055 14.63 16,276 1,056 15.42 16,134 1,057 15.27 15,479 1,019 15.19 15,584 1,026 15.19
December 15,965 1,030 15.50 16,211 1,071 15.13 16,147 1,097 14.72 15,983 1,055 15.15 16,061 1,059 15.17
January 15,300 1,058 14.46 15,718 1,044 15.05 17,243 1,096 15.74 14,448 949 15.22 16,574 1,096 15.12
February 14,672 1,016 14.44 14,258 937 15.21 14,567 956 15.24 14,896 985 15.12 15,005 986 15.22
March 16,266 979 16.62 16,981 1,121 15.15 16,966 1,130 15.02 16,619 1,116 14.89 16,541 1,099 15.05
April 14,945 1,088 13.74 15,430 1,043 14.79 15,847 1,048 15.12 16,215 1,072 15.13 15,806 1,054 15.00
May 15,555 1,002 15.53 16,019 1,075 14.90 16,183 1,042 15.53 16,107 1,040 15.49 16,442 1,083 15.18
June 14,914 1,021 14.61 15,238 1,009 15.10 14,658 982 14.93 15,671 1,028 15.24 14,803 966 15.32
July 14,982 987 15.18 15,142 999 15.15 14,089 971 14.51 15,445 1,019 15.16 15,195 1,000 15.20
August 15,562 1,001 15.55 15,813 1,044 15.14 15,202 1,011 15.03 15,442 1,028 15.02 15,205 1,004 15.14
September 15,677 1,036 15.13 15,397 1,030 14.94 15,772 1,022 15.43 15,480 1,019 15.19 15,312 1,014 15.10
Source: American Samoa Power Authority
FY2009FY2012 FY2011 FY'2010 FY2008
FY2007 FY2006 FY2005 FY2004 2003

STATISTICAL YEARBOOK 2012
183
Table 15.5. AVERAGE WEIGHTED FUEL COSTS PER GALLON AND FUEL SURCHARGES PER KWH: FY2002 TO FY2012
FY2007 FY2006 FY 2005 FY2004 FY2003 FY2002
Average Fuel Average Fuel Average Fuel Average Fuel Average Fuel Average Fuel Average Fuel Average Fuel Average Fuel Average Fuel Average Fuel
Weighted Surcharge Weighted Surcharge Weighted Surcharge Weighted Surcharge Weighted Surcharge Weighted Surcharge Weighted Surcharge Weighted Surcharge Weighted Surcharge Weighted Surcharge Weighted Surcharge
fuel cost cost fuel cost cost fuel cost cost fuel cost cost fuel cost cost fuel cost cost fuel cost cost fuel cost cost fuel cost cost fuel cost cost fuel cost cost
Month (/gal) (/kWh) (/gal) (/kWh) (/gal) (/kWh) (/gal) (/kWh) (/gal) (/kWh) (/gal) (/kWh) (/gal) (/kWh) (/gal) (/kWh) (/gal) (/kWh) (/gal) (/kWh) (/gal) (/kWh)
Average $3.774 $0.303 $3.381 $0.272 $2.700 $0.217 $2.622 $0.211 $3.723 $0.299 $2.447 .. $2.370 .. $1.858 $0.144 $1.336 $0.108 $1.128 $0.090 $0.944 $0.076
October 3.76 0.302 2.80 0.225 2.51 0.202 4.09 0.329 2.802 0.225 2.716 .. 2.182 .. 1.636 0.131 1.17 $0.094 1.015 $0.082 $0.992 $0.080
November 3.73 0.299 2.78 0.224 2.54 0.204 3.72 0.299 2.953 0.237 2.479 .. 2.312 .. 1.758 0.138 1.162 $0.093 1.07 $0.086 $0.981 $0.079
December 3.69 0.296 2.90 0.233 2.59 0.208 3.07 0.246 3.242 0.260 2.315 .. 2.405 .. 1.819 0.146 1.182 $0.095 1.084 $0.087 $0.923 $0.074
January 3.82 0.307 2.96 0.238 2.69 0.216 2.56 0.206 3.333 0.267 2.236 .. 2.263 .. 1.703 0.137 1.122 $0.098 1.066 $0.086 $0.845 $0.068
February 3.75 0.301 3.14 0.252 2.65 0.213 2.26 0.182 3.278 0.263 2.313 .. 2.119 .. 1.642 0.132 1.319 $0.106 1.134 $0.091 $0.813 $0.065
March 3.83 0.308 3.22 0.259 2.72 0.218 2.13 0.171 3.354 0.269 2.252 .. 2.161 .. 1.678 0.125 1.378 $0.111 1.221 $0.098 $0.832 $0.067
April 3.91 0.314 3.51 0.282 2.66 0.214 2.54 0.204 3.688 0.296 2.269 .. 2.245 .. 1.816 0.138 1.373 $0.110 1.29 $0.104 $0.891 $0.072
May 4.02 0.323 3.79 0.304 2.76 0.222 1.97 0.158 4.004 0.321 2.360 .. 2.266 .. 1.944 0.147 1.396 $0.112 1.215 $0.098 $0.957 $0.077
June 3.99 0.321 4.06 0.326 2.93 0.235 2.07 0.166 4.443 0.356 2.520 .. 2.450 .. 1.958 0.148 1.447 $0.116 1.102 $0.088 $0.996 $0.080
July 3.80 0.305 3.79 0.305 2.82 0.226 2.21 0.177 4.732 0.380 2.589 .. 2.697 .. 2.036 0.154 1.464 $0.118 1.087 $0.087 $1.016 $0.082
August 3.48 0.279 3.80 0.305 2.78 0.223 2.48 0.199 4.76 0.382 2.606 .. 2.678 .. 2.126 0.161 1.472 $0.118 1.109 $0.088 $1.063 $0.085
September 3.51 0.282 3.81 0.306 2.75 0.221 2.38 0.191 4.09 0.328 2.703 .. 2.667 .. 2.182 0.165 1.542 $0.124 1.144 $0.092 $1.012 $0.081
SOURCE: American Samoa Power Authority
FY2008FY20092012 2011 2010

STATISTICAL YEARBOOK 2012
184
Table 15.6. ELECTRICITY SALES BY NUMBER OF METERS, AND BY CUSTOMER CLASS: FY2002 TO FY2012
Customer class 2012 2011 2010 2009 2008 2007 2006 2005 2004 2003 2002
Number of meters 12,177 12,067 11,884 11,880 11,928 11,715 11,570 11,307 11,003 11,016 10,325
Residential 10,748 10,630 10,475 10,453 10,478 10,253 10,117 9,860 9,607 9,650 8,987
Commercial 850 863 843 871 887 904 918 920 888 896 885
Large power 4 7 5 9 14 6 6 6 6 6 6
Government 435 430 425 407 406 407 389 383 367 332 307
ASPA 140 137 136 140 143 145 140 138 135 132 140
Total MWh sold, (millions) 134.4 136.3 141.9 159.0 167.0 161.7 167.6 167.3 166.3 165.4 156.1
Residential 39.9 41.8 45.3 43 45 47.0 47.9 48.3 46.2 45.3 42.6
Commercial 37.2 37.1 40.6 42 45 47.7 47.8 48.3 47.3 47.4 43.6
Large power 22.5 22.4 20.6 37 41 31.3 36.1 36.3 40.1 42.0 39.9
Government 24.8 25.4 26.4 27 26 26.5 26.6 25.9 24.5 23.0 22.3
ASPA 9.9 9.6 8.9 10 10 9.2 9.2 8.5 8.2 7.7 7.7
SOURCE: American Samoa Power Authority

STATISTICAL YEARBOOK 2012
185
Table 15.7. ELECTRICITY CONSUMPTION BY CUSTOMER CLASS: FY2010 TO FY2012
Month Total Residential CommercialLarge power ASG ASPA Total Residential CommercialLarge power ASG ASPA Total Residential CommercialLarge power ASG ASPA
Total 134,425,561 39,934,515 37,198,122 22,538,797 24,812,325 9,941,802 136,280,691 41,801,664 37,082,571 22,366,028 25,445,388 9,585,040 141,869,780 45,269,012 40,648,995 20,587,329 26,416,195 8,948,249
Monthly Average 11,202,130 3,327,876 3,099,844 1,878,233 2,067,694 828,484 11,356,724 3,483,472 3,090,214 1,863,836 2,120,449 798,753 11,822,482 3,772,418 3,387,416 1,715,611 2,201,350 745,687
October 11,598,680 3,224,648 3,035,484 2,328,855 2,163,694 845,999 11,600,176 3,498,609 3,009,575 2,055,473 2,266,813 769,706 9,487,803 3,465,361 2,974,981 175,790 2,191,413 680,258
November 10,493,923 3,200,144 2,968,131 1,612,656 2,032,895 680,097 11,567,922 3,592,450 3,158,529 1,687,850 2,303,313 825,780 8,764,966 3,423,038 2,682,507 990 2,053,349 605,082
December 11,252,262 3,537,761 3,084,358 1,532,006 2,253,241 844,896 11,298,407 3,619,941 3,089,558 1,460,854 2,325,438 802,616 11,632,567 3,590,638 3,383,404 1,751,390 2,195,042 712,093
January 11,725,475 3,598,617 3,213,032 1,848,882 2,185,657 879,287 11,962,579 3,736,554 3,207,740 1,970,302 2,213,783 834,200 12,512,074 3,807,557 3,627,372 2,180,790 2,172,515 723,840
February 10,916,541 3,302,356 3,005,809 1,820,283 2,019,927 768,166 10,362,202 3,160,428 2,844,873 1,878,205 1,950,040 528,656 12,746,619 3,962,820 3,631,546 1,948,790 2,273,167 930,296
March 11,102,482 3,392,681 3,000,873 1,813,005 2,122,488 773,435 10,875,252 3,348,863 2,954,910 1,866,202 1,994,826 710,451 11,786,163 3,791,381 3,330,445 1,948,590 2,107,934 607,813
April 11,624,933 3,427,238 3,052,720.00 2,157,255 2,120,687 867,033 12,667,504 3,866,410 3,334,781 2,200,821 2,317,404 948,088 13,692,770 4,170,368 3,806,001 2,429,190 2,438,674 848,537
May 11,356,755 3,463,633 3,156,564.00 1,812,163 2,077,058 847,337 12,039,503 3,740,156 3,218,027 1,934,050 2,209,719 937,551 13,240,820 4,314,472 3,703,357 1,903,190 2,557,062 762,739
June 11,748,407 3,465,975 3,325,358.00 1,862,403 2,214,068 880,603 11,447,851 3,502,810 3,250,960 1,826,509 2,122,600 744,972 12,460,071 3,903,824 3,565,159 2,014,590 2,287,140 689,358
July 10,847,401 3,031,327 2,993,693.00 2,273,464 1,735,706 813,211 11,334,553 3,351,728 2,948,548 2,123,261 1,971,034 939,982 12,260,304 3,704,286 3,352,147 2,346,439 1,997,440 859,992
August 10,725,080 3,138,946 3,167,153.00 1,788,619 1,771,317 859,045 10,128,811 3,176,309 2,926,930 1,593,927 1,768,038 663,607 11,921,176 3,660,531 3,432,963 1,993,190 2,042,773 791,719
September 11,033,622 3,151,189 3,194,947.00 1,689,206 2,115,587 882,693 10,995,931 3,207,406 3,138,140 1,768,574 2,002,380 879,431 11,364,448 3,474,737 3,159,113 1,894,390 2,099,686 736,522
NOTE: Unit of energy is kilowatt hour (kWh).
SOURCE: American Samoa Power Authority
FY2012 FY2011 FY2010

STATISTICAL YEARBOOK 2012
186
Table 15.8. WATER PRODUCTION VERSUS ELECTRICITY COST: FY2008 to FY2012
Month 2012 2011 2010 2009 2008 2012 2011 2010 2009 2008 2012 2011 2010 2009 2008 2012 2011 2010 2009 2008 2012 2011 2010 2009 2008
October 29 30 31 30 35 12.95 13.64 12.41 12.66 12.36 29 30 31 32 28 265.6 263.3 184.6 .. 243 1.22 1.70 0.76 .. 1.22
November 30 29 30 28 28 11.96 8.18 13.09 12.37 12.24 30 29 30 31 32 267.1 203.5 197.6 133 303 1.29 1.41 0.77 0.88 2.45
December 32 32 30 35 35 15.00 14.39 12.41 12.65 12.35 32 32 30 29 29 277.3 - 175.2 159 168 1.29 - 0.75 1.12 1.20
January 32 32 31 28 35 13.28 12.37 12.37 12.68 11.76 32 32 31 32 31 266.2 207.8 257.7 208 214 1.21 1.21 0.63 1.21 1.18
February 29 28 31 28 28 14.12 12.24 11.37 12.79 12.05 29 28 31 29 29 233.6 124.5 214.9 137 199 1.12 1.33 1.14 1.14 1.15
March 29 28 21 28 28 11.62 12.31 12.25 12.63 11.47 29 28 21 29 29 235.8 187.4 131.6 146 243 1.47 1.14 0.60 1.15 1.32
April 30 32 35 35 35 13.56 12.65 12.32 12.94 12.77 30 32 35 28 29 270.9 266.4 194.8 115 204 1.25 1.21 0.81 1.13 1.21
May 30 31 32 28 28 12.37 12.07 11.80 13.22 12.49 30 31 32 33 32 274.6 290.9 175.1 170 289 1.24 1.18 0.75 1.08 1.18
June 32 31 32 28 28 13.28 13.29 11.47 12.93 11.98 32 31 32 29 31 286.0 237.4 166.2 168 221 1.34 1.51 0.74 1.31 1.17
July 29 30 31 35 35 12.27 13.52 11.76 13.20 11.98 29 30 31 29 29 255.7 299.7 212.1 164 287 1.23 1.33 0.88 1.12 1.20
August 31 30 31 28 28 12.64 10.73 12.51 13.54 12.19 31 30 31 34 32 272.5 202.2 189.3 158 341 1.29 1.08 0.81 1.13 1.21
September 32 32 31 35 28 13.22 12.5 12.24 12.37 11.99 32 32 31 29 31 270.8 275.2 176.1 .. 298 1.25 0.98 0.76 .. 1.19
NOTE: Water production and electricity costs are based on billing days.
SOURCE: American Samoa Power Authority
Daily Average Cost $'000 Production Reporting Days
Average Daily Water Production
(MGD) Sales Billing Days Total Electrical Costs $'000

STATISTICAL YEARBOOK 2012
187
Table 15.9. WATER SALES BY CLASS: FY2008 to FY2012
Water Sales (MGD)
Month 2012 2011 2010 2009 2008 2012 2011 2010 2009 2008 2012 2011 2010 2009 2008 2012 2011 2010 2009 2008 2012 2011 2010 2009 2008
October 4.63 4.83 6.01 7.74 7.85 375.60 144.96 374.65 253.8 176.52 $419,359.51 $429,176.29 $331,790.20 $271,676.31 $295,081.88 $269,350.82 $241,997.42 $174,021.52 $114,187.14 $282,315.73 $698,527.11 $671,174 $505,812 $385,863.45 $577,397.61
November 4.53 4.38 6.34 6.44 8.05 358.90 127.14 407.24 217.9 190.38 $461,953.66 $476,409.46 $333,944.39 $277,488.81 $317,030.46 $261,776.12 $220,258.43 $151,179.32 $148,104.67 $263,435.74 $723,729.78 $696,668 $485,124 $425,593.48 $580,466.20
December 4.62 4.20 6.39 6.31 6.93 480.10 134.09 385.29 204.5 168.10 $490,527.70 $497,396.44 $331,949.51 $270,506.27 $273,419.42 $291,215.70 $221,030.57 $148,351.57 $143,838.33 $206,316.18 $781,743.40 $718,427 $480,301 $414,344.60 $479,735.60
January 4.63 7.91 6.15 7.07 7.80 407.20 145.98 360.25 238.7 173.06 $497,294.35 $353,334.58 $291,317.59 $277,694.50 $300,983.96 $260,032.84 $172,622.36 $159,019.88 $201,487.31 $204,508.76 $757,327.19 $525,957 $450,337 $479,181.81 $505,492.72
February 4.12 7.41 6.33 7.13 7.90 409.90 133.53 471.43 219.5 180.57 $463,944.41 $316,510.84 $290,219.65 $248,250.68 $289,623.11 $242,414.80 $171,901.35 $152,437.01 $188,820.01 $246,461.00 $706,359.21 $488,412 $442,657 $437,070.69 $536,084.11
March 4.68 8.01 5.73 6.92 7.20 336.90 135.09 299.23 204.5 173.20 $447,314.84 $319,841.50 $271,342.46 $243,873.94 $280,349.46 $256,828.28 $174,820.94 $148,128.89 $192,496.12 $226,868.54 $704,143.12 $494,662 $419,471 $436,370.06 $507,218.00
April 4.27 7.68 5.74 7.48 7.80 406.80 154.29 447.39 270.20 177.62 $457,619.55 $387,998.89 $287,431.78 $235,778.19 $282,786.58 $247,474.28 $205,827.97 $159,643.09 $200,824.51 $242,206.94 $705,093.83 $593,827 $447,075 $436,602.70 $524,993.52
May 4.15 4.62 5.93 7.76 8.00 371.10 143.39 326.24 223.7 199.00 $465,188.35 $455,779.30 $301,931.23 $269,891.78 $315,684.57 $238,341.36 $215,772.88 $145,604.68 $195,511.22 $292,044.09 $703,529.71 $671,552 $447,536 $465,403.00 $607,728.66
June 4.56 4.51 6.13 7.66 7.85 425.10 139.96 332.55 215 166.20 $481,116.98 $454,227.12 $278,428.86 $254,738.25 $318,365.04 $234,270.33 $218,518.45 $150,228.21 $195,447.56 $225,748.08 $715,387.31 $672,746 $428,657 $450,185.81 $544,113.12
July 4.71 4.75 5.97 8.00 8.02 384.70 142.54 451.36 274.1 179.86 $435,300.24 $427,893.51 $360,854.14 $243,644.63 $316,655.96 $289,466.62 $232,542.65 $167,321.29 $190,416.37 $289,741.78 $724,766.86 $660,436 $528,175 $434,061.00 $606,397.74
August 4.34 4.29 5.89 6.11 8.01 391.77 128.60 404.03 208.3 184.62 $427,045.59 $421,173.81 $362,135.54 $283,604.03 $353,358.40 $264,866.28 $193,366.24 $180,852.76 $204,325.23 $292,168.98 $691,911.87 $614,540 $542,988 $487,929.26 $645,527.38
September 4.43 4.26 5.66 .. 7.99 423.82 136.34 369.58 .. 172.69 $453,648.70 $433,647.86 $340,462.87 $242,843.10 $341,173.96 $262,756.98 $209,439.41 $168,807.22 $188,672.85 $271,803.06 $716,405.68 643,087 509,270 $431,515.95 $612,977.02
NOTE: Water Dollar Sales in Million Gallons per Day (MGD) or Million Gallons (MG).
SOURCE: American Samoa Power Authority
Water Sales (MG) Residential Sales $ Commercial & Industrial Sales $ Total Sales $
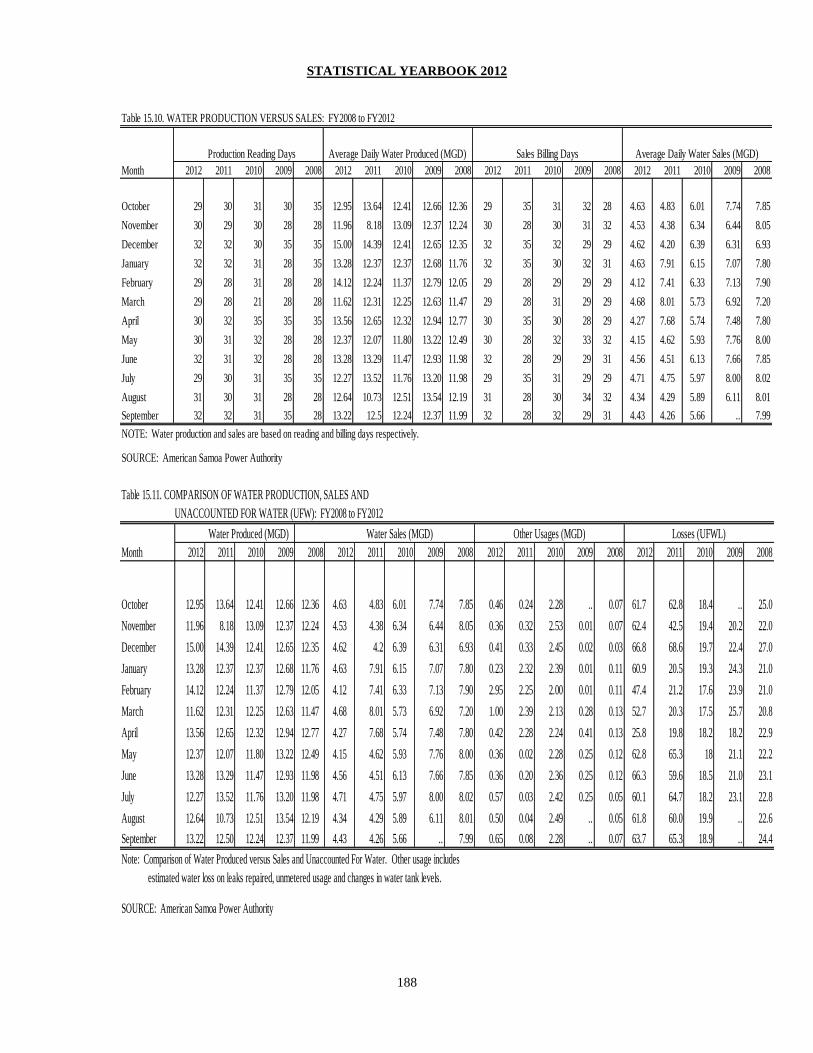
STATISTICAL YEARBOOK 2012
188
Table 15.10. WATER PRODUCTION VERSUS SALES: FY2008 to FY2012
Month 2012 2011 2010 2009 2008 2012 2011 2010 2009 2008 2012 2011 2010 2009 2008 2012 2011 2010 2009 2008
October 29 30 31 30 35 12.95 13.64 12.41 12.66 12.36 29 35 31 32 28 4.63 4.83 6.01 7.74 7.85
November 30 29 30 28 28 11.96 8.18 13.09 12.37 12.24 30 28 30 31 32 4.53 4.38 6.34 6.44 8.05
December 32 32 30 35 35 15.00 14.39 12.41 12.65 12.35 32 35 32 29 29 4.62 4.20 6.39 6.31 6.93
January 32 32 31 28 35 13.28 12.37 12.37 12.68 11.76 32 35 30 32 31 4.63 7.91 6.15 7.07 7.80
February 29 28 31 28 28 14.12 12.24 11.37 12.79 12.05 29 28 29 29 29 4.12 7.41 6.33 7.13 7.90
March 29 28 21 28 28 11.62 12.31 12.25 12.63 11.47 29 28 31 29 29 4.68 8.01 5.73 6.92 7.20
April 30 32 35 35 35 13.56 12.65 12.32 12.94 12.77 30 35 30 28 29 4.27 7.68 5.74 7.48 7.80
May 30 31 32 28 28 12.37 12.07 11.80 13.22 12.49 30 28 32 33 32 4.15 4.62 5.93 7.76 8.00
June 32 31 32 28 28 13.28 13.29 11.47 12.93 11.98 32 28 29 29 31 4.56 4.51 6.13 7.66 7.85
July 29 30 31 35 35 12.27 13.52 11.76 13.20 11.98 29 35 31 29 29 4.71 4.75 5.97 8.00 8.02
August 31 30 31 28 28 12.64 10.73 12.51 13.54 12.19 31 28 30 34 32 4.34 4.29 5.89 6.11 8.01
September 32 32 31 35 28 13.22 12.5 12.24 12.37 11.99 32 28 32 29 31 4.43 4.26 5.66 .. 7.99
NOTE: Water production and sales are based on reading and billing days respectively.
SOURCE: American Samoa Power Authority
Production Reading Days Average Daily Water Produced (MGD) Sales Billing Days Average Daily Water Sales (MGD)
Table 15.11. COMPARISON OF WATER PRODUCTION, SALES AND
UNACCOUNTED FOR WATER (UFW): FY2008 to FY2012
Water Produced (MGD)
Month 2012 2011 2010 2009 2008 2012 2011 2010 2009 2008 2012 2011 2010 2009 2008 2012 2011 2010 2009 2008
October 12.95 13.64 12.41 12.66 12.36 4.63 4.83 6.01 7.74 7.85 0.46 0.24 2.28 .. 0.07 61.7 62.8 18.4 .. 25.0
November 11.96 8.18 13.09 12.37 12.24 4.53 4.38 6.34 6.44 8.05 0.36 0.32 2.53 0.01 0.07 62.4 42.5 19.4 20.2 22.0
December 15.00 14.39 12.41 12.65 12.35 4.62 4.2 6.39 6.31 6.93 0.41 0.33 2.45 0.02 0.03 66.8 68.6 19.7 22.4 27.0
January 13.28 12.37 12.37 12.68 11.76 4.63 7.91 6.15 7.07 7.80 0.23 2.32 2.39 0.01 0.11 60.9 20.5 19.3 24.3 21.0
February 14.12 12.24 11.37 12.79 12.05 4.12 7.41 6.33 7.13 7.90 2.95 2.25 2.00 0.01 0.11 47.4 21.2 17.6 23.9 21.0
March 11.62 12.31 12.25 12.63 11.47 4.68 8.01 5.73 6.92 7.20 1.00 2.39 2.13 0.28 0.13 52.7 20.3 17.5 25.7 20.8
April 13.56 12.65 12.32 12.94 12.77 4.27 7.68 5.74 7.48 7.80 0.42 2.28 2.24 0.41 0.13 25.8 19.8 18.2 18.2 22.9
May 12.37 12.07 11.80 13.22 12.49 4.15 4.62 5.93 7.76 8.00 0.36 0.02 2.28 0.25 0.12 62.8 65.3 18 21.1 22.2
June 13.28 13.29 11.47 12.93 11.98 4.56 4.51 6.13 7.66 7.85 0.36 0.20 2.36 0.25 0.12 66.3 59.6 18.5 21.0 23.1
July 12.27 13.52 11.76 13.20 11.98 4.71 4.75 5.97 8.00 8.02 0.57 0.03 2.42 0.25 0.05 60.1 64.7 18.2 23.1 22.8
August 12.64 10.73 12.51 13.54 12.19 4.34 4.29 5.89 6.11 8.01 0.50 0.04 2.49 .. 0.05 61.8 60.0 19.9 .. 22.6
September 13.22 12.50 12.24 12.37 11.99 4.43 4.26 5.66 .. 7.99 0.65 0.08 2.28 .. 0.07 63.7 65.3 18.9 .. 24.4
Note: Comparison of Water Produced versus Sales and Unaccounted For Water. Other usage includes
estimated water loss on leaks repaired, unmetered usage and changes in water tank levels.
SOURCE: American Samoa Power Authority
Losses (UFWL)Water Sales (MGD) Other Usages (MGD)
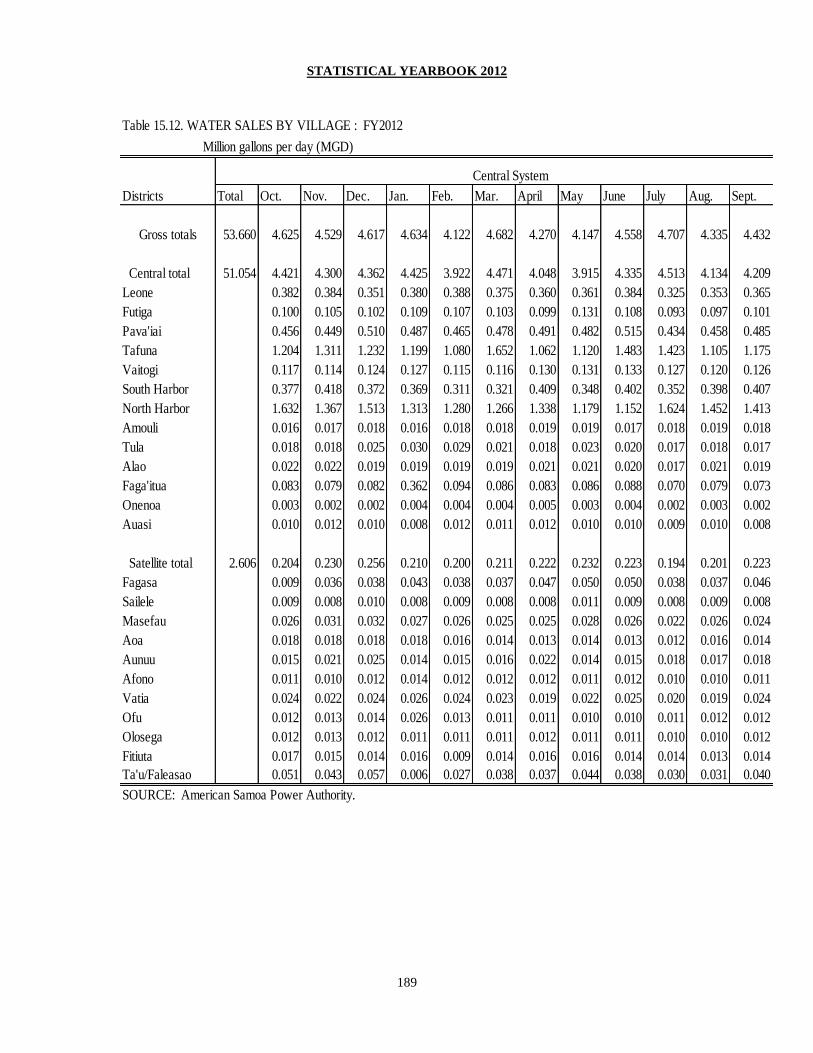
STATISTICAL YEARBOOK 2012
189
Table 15.12. WATER SALES BY VILLAGE : FY2012
Million gallons per day (MGD)
Districts Total Oct. Nov. Dec. Jan. Feb. Mar. April May June July Aug. Sept.
Gross totals 53.660 4.625 4.529 4.617 4.634 4.122 4.682 4.270 4.147 4.558 4.707 4.335 4.432
Central total 51.054 4.421 4.300 4.362 4.425 3.922 4.471 4.048 3.915 4.335 4.513 4.134 4.209
Leone 0.382 0.384 0.351 0.380 0.388 0.375 0.360 0.361 0.384 0.325 0.353 0.365
Futiga 0.100 0.105 0.102 0.109 0.107 0.103 0.099 0.131 0.108 0.093 0.097 0.101
Pava'iai 0.456 0.449 0.510 0.487 0.465 0.478 0.491 0.482 0.515 0.434 0.458 0.485
Tafuna 1.204 1.311 1.232 1.199 1.080 1.652 1.062 1.120 1.483 1.423 1.105 1.175
Vaitogi 0.117 0.114 0.124 0.127 0.115 0.116 0.130 0.131 0.133 0.127 0.120 0.126
South Harbor 0.377 0.418 0.372 0.369 0.311 0.321 0.409 0.348 0.402 0.352 0.398 0.407
North Harbor 1.632 1.367 1.513 1.313 1.280 1.266 1.338 1.179 1.152 1.624 1.452 1.413
Amouli 0.016 0.017 0.018 0.016 0.018 0.018 0.019 0.019 0.017 0.018 0.019 0.018
Tula 0.018 0.018 0.025 0.030 0.029 0.021 0.018 0.023 0.020 0.017 0.018 0.017
Alao 0.022 0.022 0.019 0.019 0.019 0.019 0.021 0.021 0.020 0.017 0.021 0.019
Faga'itua 0.083 0.079 0.082 0.362 0.094 0.086 0.083 0.086 0.088 0.070 0.079 0.073
Onenoa 0.003 0.002 0.002 0.004 0.004 0.004 0.005 0.003 0.004 0.002 0.003 0.002
Auasi 0.010 0.012 0.010 0.008 0.012 0.011 0.012 0.010 0.010 0.009 0.010 0.008
Satellite total 2.606 0.204 0.230 0.256 0.210 0.200 0.211 0.222 0.232 0.223 0.194 0.201 0.223
Fagasa 0.009 0.036 0.038 0.043 0.038 0.037 0.047 0.050 0.050 0.038 0.037 0.046
Sailele 0.009 0.008 0.010 0.008 0.009 0.008 0.008 0.011 0.009 0.008 0.009 0.008
Masefau 0.026 0.031 0.032 0.027 0.026 0.025 0.025 0.028 0.026 0.022 0.026 0.024
Aoa 0.018 0.018 0.018 0.018 0.016 0.014 0.013 0.014 0.013 0.012 0.016 0.014
Aunuu 0.015 0.021 0.025 0.014 0.015 0.016 0.022 0.014 0.015 0.018 0.017 0.018
Afono 0.011 0.010 0.012 0.014 0.012 0.012 0.012 0.011 0.012 0.010 0.010 0.011
Vatia 0.024 0.022 0.024 0.026 0.024 0.023 0.019 0.022 0.025 0.020 0.019 0.024
Ofu 0.012 0.013 0.014 0.026 0.013 0.011 0.011 0.010 0.010 0.011 0.012 0.012
Olosega 0.012 0.013 0.012 0.011 0.011 0.011 0.012 0.011 0.011 0.010 0.010 0.012
Fitiuta 0.017 0.015 0.014 0.016 0.009 0.014 0.016 0.016 0.014 0.014 0.013 0.014
Ta'u/Faleasao 0.051 0.043 0.057 0.006 0.027 0.038 0.037 0.044 0.038 0.030 0.031 0.040
SOURCE: American Samoa Power Authority.
Central System
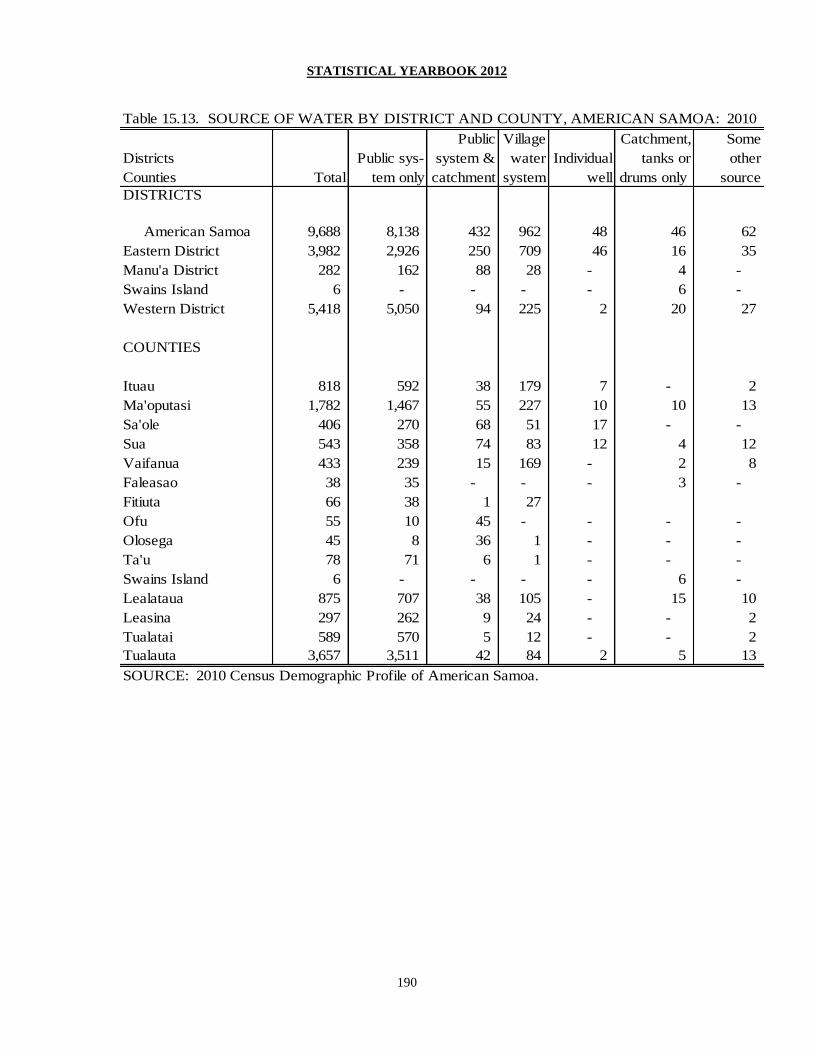
STATISTICAL YEARBOOK 2012
190
Table 15.13. SOURCE OF WATER BY DISTRICT AND COUNTY, AMERICAN SAMOA: 2010
Public Village Catchment, Some
Districts Public sys- system & water Individual tanks or other
Counties Total tem only catchment system well drums only source
DISTRICTS
American Samoa 9,688 8,138 432 962 48 46 62
Eastern District 3,982 2,926 250 709 46 16 35
Manu'a District 282 162 88 28 - 4 -
Swains Island 6 - - - - 6 -
Western District 5,418 5,050 94 225 2 20 27
COUNTIES
Ituau 818 592 38 179 7 - 2
Ma'oputasi 1,782 1,467 55 227 10 10 13
Sa'ole 406 270 68 51 17 - -
Sua 543 358 74 83 12 4 12
Vaifanua 433 239 15 169 - 2 8
Faleasao 38 35 - - - 3 -
Fitiuta 66 38 1 27
Ofu 55 10 45 - - - -
Olosega 45 8 36 1 - - -
Ta'u 78 71 6 1 - - -
Swains Island 6 - - - - 6 -
Lealataua 875 707 38 105 - 15 10
Leasina 297 262 9 24 - - 2
Tualatai 589 570 5 12 - - 2
Tualauta 3,657 3,511 42 84 2 5 13
SOURCE: 2010 Census Demographic Profile of American Samoa.

STATISTICAL YEARBOOK 2012
191
Section Sixteen
NATIONAL ACCOUNTS
This section on national accounts was added to include GDP for American Samoa as released
by the Bureau of Economic Analysis.
The Bureau of Economic Analysis (BEA) under the U.S. Department of Commerce, through
the Statistical Improvement Program funded by the Office of Insular Affairs (OIA) of the
U.S. Department of the Interior has been developing formal methodologies for measuring the
GDP of American Samoa and other Island Areas (Guam, CNMI and U.S. Virgin Islands).
BEA has released annual estimates of gross domestic product (GDP) for American Samoa
from 2002-2012 since 2010. The latest GDP release is for 2011 and 2012. According to
BEA, gross domestic product in 2011 and 2012 was $648 million and $725 million
respectively. Real GDP, which is GDP adjusted to remove price changes, was $516 million
(2011) and $504 million (2012). Per capita GDP was $3,991 (2011) and $9,164 (2012).

STATISTICAL YEARBOOK 2012
192
T16.1. GROSS DOMESTIC PRODUCT: 2002 TO 2012
2012 2011 2010 2009 2008 2007 2006 2005 2004 2003 2002
Gross Domestic Product 725 648 642 725 618 575 546 550 545 561 549
Personal consumption expenditures 434 432 421 407 411 383 375 367 356 332 312
Goods 200 207 211 202 210 194 190 189 185 166 155
Durable goods 22 23 24 23 28 23 23 24 26 21 20
Nondurable goods 178 184 186 179 183 171 167 165 159 145 135
Services 238 228 216 209 203 189 186 181 172 164 156
Net foreign travel -4 -3 -5 -4 -3 -1 -1 -3 -1 1 1
Private fixed investment 24 22 22 17 20 21 20 21 17 12 12
Change in private inventories 0 -3 -5 -6 -17 -8 -3 -6 8 9 5
Net exports of goods and services -96 -168 -134 4 -65 -66 -95 -81 -86 -41 -18
Exports 487 339 368 536 646 512 504 507 470 522 527
Goods 458 311 340 509 621 488 477 480 442 495 503
Services 29 28 28 26 25 24 26 27 28 27 25
Imports 583 507 503 532 711 578 599 589 555 563 545
Goods 515 442 442 472 641 515 533 525 488 494 487
Services 68 65 60 60 70 62 66 64 68 69 58
Government consumption
expenditures and gross investment 363 365 337 304 268 245 250 250 250 249 238
Federal 22 23 23 29 21 17 19 24 26 20 10
Territorial 341 343 315 275 247 228 231 225 224 229 227
Note: Revisions for previous years are in bold-face. Detail may not add up to total because of rounding.
SOURCE: Bureau of Economic Analysis, U.S. Department of Commerce, Gross Domestic Product Estimates for American Samoa.
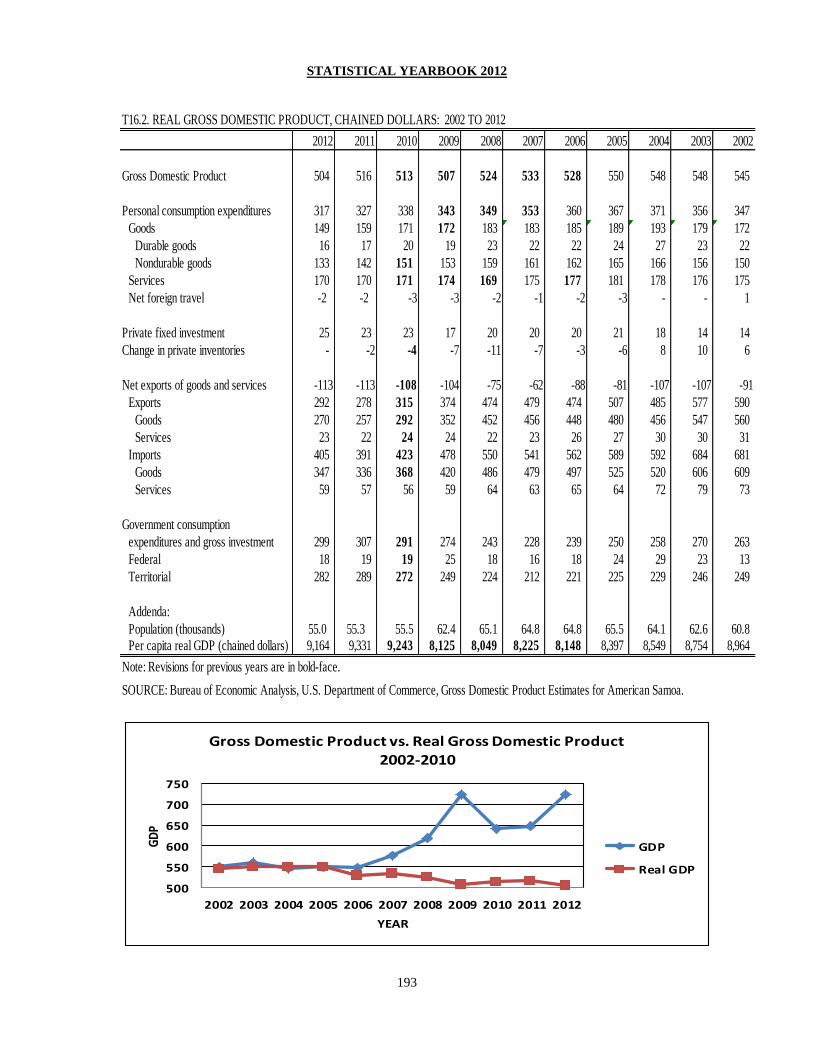
STATISTICAL YEARBOOK 2012
193
T16.2. REAL GROSS DOMESTIC PRODUCT, CHAINED DOLLARS: 2002 TO 2012
2012 2011 2010 2009 2008 2007 2006 2005 2004 2003 2002
Gross Domestic Product 504 516 513 507 524 533 528 550 548 548 545
Personal consumption expenditures 317 327 338 343 349 353 360 367 371 356 347
Goods 149 159 171 172 183 183 185 189 193 179 172
Durable goods 16 17 20 19 23 22 22 24 27 23 22
Nondurable goods 133 142 151 153 159 161 162 165 166 156 150
Services 170 170 171 174 169 175 177 181 178 176 175
Net foreign travel -2 -2 -3 -3 -2 -1 -2 -3 - - 1
Private fixed investment 25 23 23 17 20 20 20 21 18 14 14
Change in private inventories - -2 -4 -7 -11 -7 -3 -6 8 10 6
Net exports of goods and services -113 -113 -108 -104 -75 -62 -88 -81 -107 -107 -91
Exports 292 278 315 374 474 479 474 507 485 577 590
Goods 270 257 292 352 452 456 448 480 456 547 560
Services 23 22 24 24 22 23 26 27 30 30 31
Imports 405 391 423 478 550 541 562 589 592 684 681
Goods 347 336 368 420 486 479 497 525 520 606 609
Services 59 57 56 59 64 63 65 64 72 79 73
Government consumption
expenditures and gross investment 299 307 291 274 243 228 239 250 258 270 263
Federal 18 19 19 25 18 16 18 24 29 23 13
Territorial 282 289 272 249 224 212 221 225 229 246 249
Addenda:
Population (thousands) 55.0 55.3 55.5 62.4 65.1 64.8 64.8 65.5 64.1 62.6 60.8Per capita real GDP (chained dollars) 9,164 9,331 9,243 8,125 8,049 8,225 8,148 8,397 8,549 8,754 8,964
Note: Revisions for previous years are in bold-face.
SOURCE: Bureau of Economic Analysis, U.S. Department of Commerce, Gross Domestic Product Estimates for American Samoa.
500
550
600
650
700
750
2002 2003 2004 2005 2006 2007 2008 2009 2010 2011 2012
GD
P
YEAR
Gross Domestic Product vs. Real Gross Domestic Product
2002-2010
GDP
Real GDP
STATISTICAL YEARBOOK 2012
194
TO: Director, Department of Commerce
American Samoa Government
Pago Pago, American Samoa 96799
FROM: _____________________________
SUBJECT: Comments and Suggestions to improve the Statistical
Yearbook (please attach additional pages if needed)
Comments:
_______________________________________________________________________
_______________________________________________________________________
_______________________________________________________________________
_______________________________________________________________________
_______________________________________________________________________
_______________________________________________________________________
_______________________________________________________________________
Suggestions:
_______________________________________________________________________
_______________________________________________________________________
_______________________________________________________________________
_______________________________________________________________________
_______________________________________________________________________
_______________________________________________________________________
_______________________________________________________________________
NOTE: Please write your phone number (_________________) so we may contact you
for needed clarification of your comments and suggestions.
Please tear out and send or deliver to the above address. Thank you.