statistical yearbook of the food and agricultural ... · part 1 inputs agricultural investment...
TRANSCRIPT
PART 1
Water
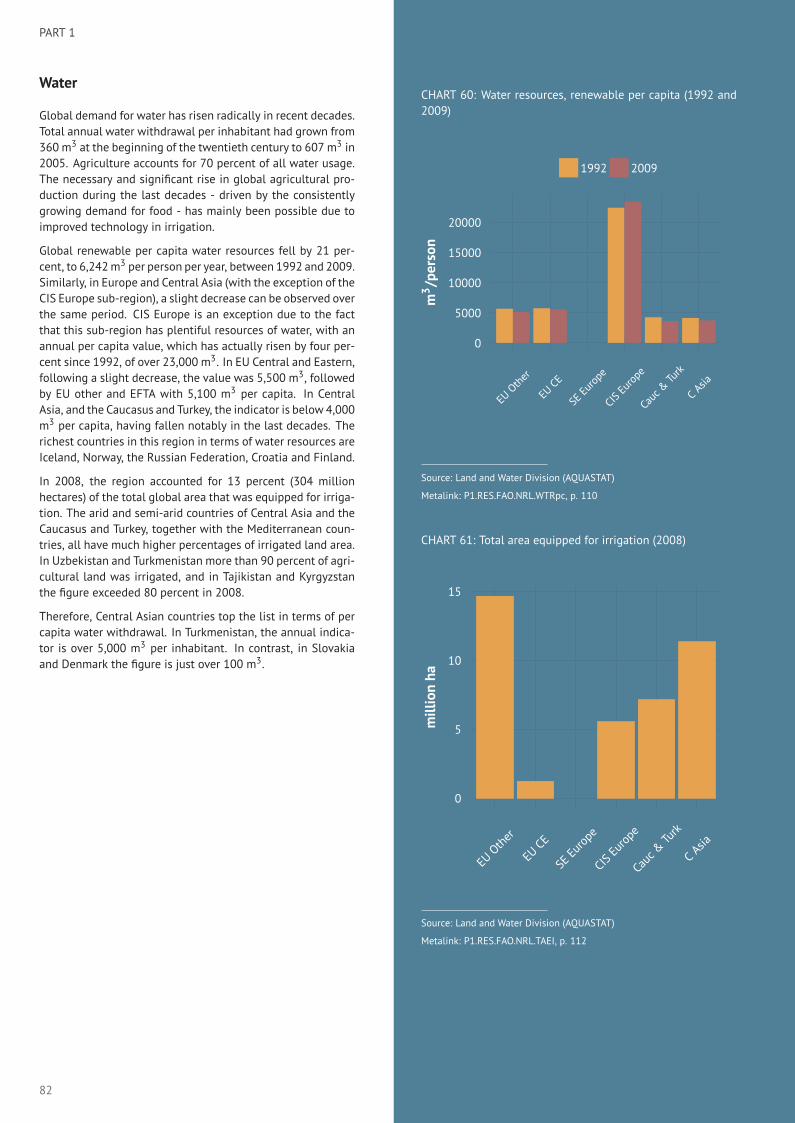
Global demand for water has risen radically in recent decades.Total annual water withdrawal per inhabitant had grown from360 m3 at the beginning of the twentieth century to 607 m3 in2005. Agriculture accounts for 70 percent of all water usage.The necessary and significant rise in global agricultural pro-duction during the last decades - driven by the consistentlygrowing demand for food - has mainly been possible due toimproved technology in irrigation.
Global renewable per capita water resources fell by 21 per-cent, to 6,242m3 per person per year, between 1992 and 2009.Similarly, in Europe and Central Asia (with the exception of theCIS Europe sub-region), a slight decrease can be observed overthe same period. CIS Europe is an exception due to the factthat this sub-region has plentiful resources of water, with anannual per capita value, which has actually risen by four per-cent since 1992, of over 23,000 m3. In EU Central and Eastern,following a slight decrease, the value was 5,500 m3, followedby EU other and EFTA with 5,100 m3 per capita. In CentralAsia, and the Caucasus and Turkey, the indicator is below 4,000m3 per capita, having fallen notably in the last decades. Therichest countries in this region in terms of water resources areIceland, Norway, the Russian Federation, Croatia and Finland.
In 2008, the region accounted for 13 percent (304 millionhectares) of the total global area that was equipped for irriga-tion. The arid and semi-arid countries of Central Asia and theCaucasus and Turkey, together with the Mediterranean coun-tries, all have much higher percentages of irrigated land area.In Uzbekistan and Turkmenistan more than 90 percent of agri-cultural land was irrigated, and in Tajikistan and Kyrgyzstanthe figure exceeded 80 percent in 2008.
Therefore, Central Asian countries top the list in terms of percapita water withdrawal. In Turkmenistan, the annual indica-tor is over 5,000 m3 per inhabitant. In contrast, in Slovakiaand Denmark the figure is just over 100 m3.
CHART 60: Water resources, renewable per capita (1992 and2009)
0
5000
10000
15000
20000
EUOther
EUCE
SEEurope
CISEurope
Cauc&Turk
C Asia
m3 /person
1992 2009
Source: Land and Water Division (AQUASTAT)
Metalink: P1.RES.FAO.NRL.WTRpc, p. 110
CHART 61: Total area equipped for irrigation (2008)
0
5
10
15
EUOther
EUCE
SEEurope
CISEurope
Cauc&Turk
C Asia
millionha
Source: Land and Water Division (AQUASTAT)
Metalink: P1.RES.FAO.NRL.TAEI, p. 112
82

WATER
MAP 38: Total water withdrawal per capita (m3, 2005)
No Data < 300 300 − 400 400 − 600 600 − 850 > 850
Source: Land and Water Division (AQUASTAT)
Metalink: P4.ENV.FAO.NRL.WAT.TWWpc, p. 112
MAP 39: Average precipitation in depth (mm/year, 2000-2010*)
No Data < 500 500 − 600 600 − 700 700 − 1000 > 1000*
Source: Land and Water Division (AQUASTAT)
Metalink: P4.ENV.FAO.ACQ.CLIM.APD, p. 102
83
PART 1
Inputs
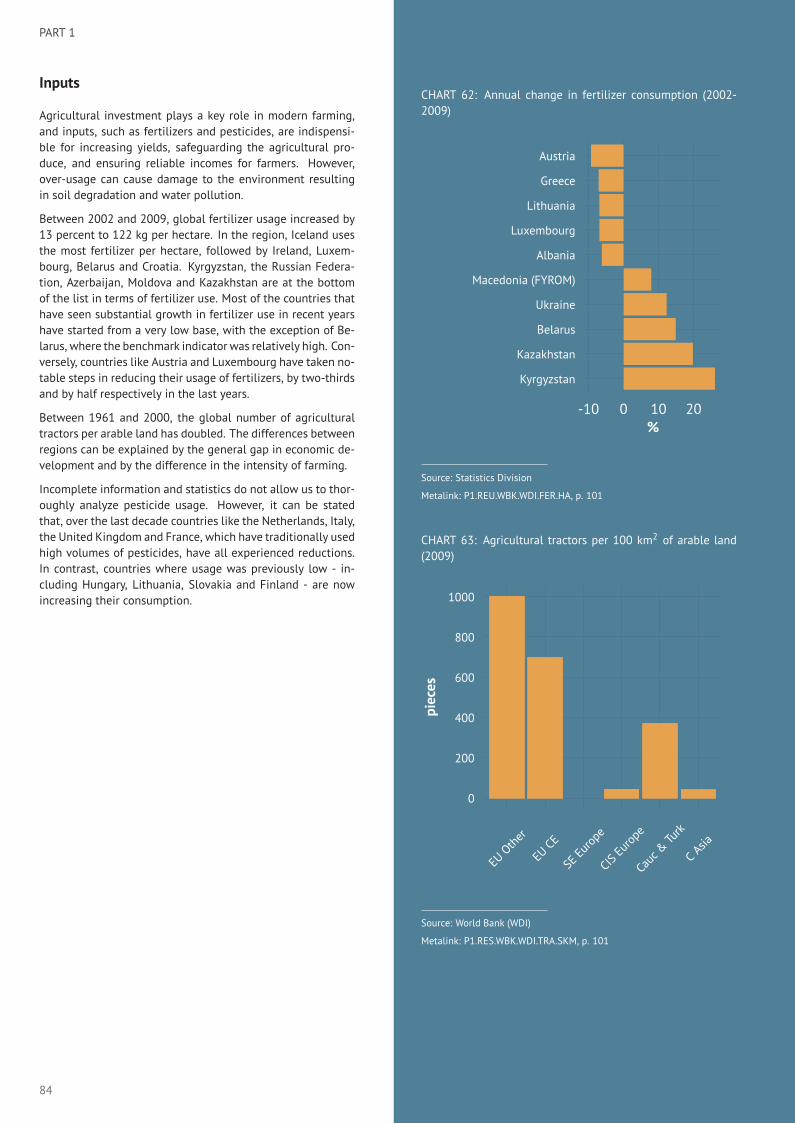
Agricultural investment plays a key role in modern farming,and inputs, such as fertilizers and pesticides, are indispensi-ble for increasing yields, safeguarding the agricultural pro-duce, and ensuring reliable incomes for farmers. However,over-usage can cause damage to the environment resultingin soil degradation and water pollution.
Between 2002 and 2009, global fertilizer usage increased by13 percent to 122 kg per hectare. In the region, Iceland usesthe most fertilizer per hectare, followed by Ireland, Luxem-bourg, Belarus and Croatia. Kyrgyzstan, the Russian Federa-tion, Azerbaijan, Moldova and Kazakhstan are at the bottomof the list in terms of fertilizer use. Most of the countries thathave seen substantial growth in fertilizer use in recent yearshave started from a very low base, with the exception of Be-larus, where the benchmark indicator was relatively high. Con-versely, countries like Austria and Luxembourg have taken no-table steps in reducing their usage of fertilizers, by two-thirdsand by half respectively in the last years.
Between 1961 and 2000, the global number of agriculturaltractors per arable land has doubled. The differences betweenregions can be explained by the general gap in economic de-velopment and by the difference in the intensity of farming.
Incomplete information and statistics do not allow us to thor-oughly analyze pesticide usage. However, it can be statedthat, over the last decade countries like the Netherlands, Italy,the United Kingdom and France, which have traditionally usedhigh volumes of pesticides, have all experienced reductions.In contrast, countries where usage was previously low - in-cluding Hungary, Lithuania, Slovakia and Finland - are nowincreasing their consumption.
CHART 62: Annual change in fertilizer consumption (2002-2009)
Kyrgyzstan
Kazakhstan
Belarus
Ukraine
Macedonia (FYROM)
Albania
Luxembourg
Lithuania
Greece
Austria
-10 0 10 20%
Source: Statistics Division
Metalink: P1.REU.WBK.WDI.FER.HA, p. 101
CHART 63: Agricultural tractors per 100 km2 of arable land(2009)
0
200
400
600
800
1000
EUOther
EUCE
SEEurope
CISEurope
Cauc&Turk
C Asia
pieces
Source: World Bank (WDI)
Metalink: P1.RES.WBK.WDI.TRA.SKM, p. 101
84

INPUTS
MAP 40: Fertilizer consumption, kilograms per hectare of arable land (kg/ha, 2009)
No Data < 50 50 − 100 100 − 150 150 − 200 > 200
Source: World Bank (WDI)
Metalink: P1.RES.WBK.WDI.FER.HA, p. 105
MAP 41: Pesticide use, kilograms per hectare of arable and permanent crops (kg/ha, 2009)
No Data < 1 1 − 1.5 1.5 − 3 3 − 8 > 8
Source: Statistics Division
Metalink: P1.RES.FAO.ESS.PES.TON.SHL, p. 109
85

PART 1
Pollution
Agriculture has to serve an increasing demand for food whilethose involved in agriculture must ensure that the negativeimpacts that the sector has on the environment do not in-crease. This is one of the great challenges of the 21st century.Agriculture affects air quality and the atmosphere, ground andsurface water, and it can pollute and degrade the soil. Theagricultural sector is responsible for about 30 percent of totalglobal anthropogenic emissions of greenhouse gases such ascarbon dioxide, methane, nitrous oxide and ammonia.
The region of Europe and Central Asia contributes 12 percentto global agricultural methane emissions and 16 percent tothose of nitrous oxide. Not surprisingly, countries with largeagricultural land areas and intensive farming such as the Rus-sian Federation, France, Germany, United Kingdom and Turkeynegatively contribute with the highest emissions.
Globally, agricultural activities accounted for 43 percent ofmethane emissions in 2005. In the sub-regions of EU otherand EFTA, and South Eastern Europe this same percentage isreflected; while in Central Asia, Caucasus and Turkey, and EUCentral and Eastern agriculture is responsible for between 27and 30 percent of methane emissions. In CIS Europe the fig-ure is 12 percent. Generally, countries with intensive farmingwith large numbers of livestock, and a high proportion of agri-cultural land, will produce higher methane emissions. So, forexample, Ireland and Luxembourg have much higher agricul-tural methane emissions than a country like Norway.
Fertilizer use and cattle breeding are responsible for most ofthe nitrous oxide emissions resulting from agriculture. Glob-ally, two thirds of nitrous oxide emissions come from the agri-cultural sector. In Central Asia, agriculture accounts for 72 per-cent of these nitrous oxide emissions, while in CIS Europe itaccounts for 48 percent. In the EU other and EFTA and in SouthEastern Europe the percentage is below the global indicator.More than the 80 percent of the nitrous oxide emissions inIreland, Tajikistan, Lithuania, Uzbekistan and Armenia resultsfrom agricultural activities.
CHART 64: Agricultural nitrous oxide and methane emissions,share of world total (2005)
0
2
4
6
8
EUOther
EUCE
SEEurope
CISEurope
Cauc&Turk
C Asia
%
Agricultural methaneemissions
Agricultural nitrousoxide emissions
Source: World Bank (WDI)
Metalink: P4.ENV.WBK.WDI.POL.AMTHEAB.SC, p. 101
• Ireland, a country with a high proportion ofagricultural land and large numbers of live-stock, has significantly high rates of agricul-tural methane and nitrous oxide emissions.
86

POLLUTION
MAP 42: Agricultural nitrous oxide emissions, share of total emissions (%, 2005)
No Data < 50 50 − 60 60 − 65 65 − 75 > 75
Source: World Bank (WDI)
Metalink: P4.ENV.WBK.WDI.POL.ANOE, p. 101
MAP 43: Agricultural methane emissions, share of total emissions (%, 2005)
No Data < 30 30 − 35 35 − 45 45 − 55 > 55
Source: World Bank (WDI)
Metalink: P4.ENV.WBK.WDI.POL.AMTHE, p. 101
87

PART 1
Organic agriculture
Although on a global scale, organic farming is growing dy-namically, it still only makes up a small proportion of totalagricultural production. In 2009, nearly 30 million hectares ofland were being cultivated with organic crops. The majority ofthis land is to be found in Oceania, Europe and Latin America.Finding a balanced share of organic farming vis-à-vis conven-tional farming in the future will be a notable challenge. Whileconventional farming is putting increasing pressure on theenvironment, an ever increasing global population means anever growing demand for food which, in turn, requires higheragricultural productivity and yields. While organic farming en-sures that farming is more sustainable, it may not be able tomeet the ever growing demand for food, since its yields canbe substantially lower than those of conventional farming.
The region accounted for 26 percent of global land under or-ganic crops (in 2009). The EU other and EFTA sub-region ac-counted for 18 percent of this, EU Central and Eastern for 5.4percent and the Caucasus and Turkey for the final two per-cent. The leading countries in organic production are Spain,Italy, the United Kingdom and France. The prominent role thatthe EU other and EFTA sub-region has played in developingorganic farming on a global scale cannot be understated; in2004, it had three quarters of the total organic farming landof this region, although this share has fallen significantly sincethen.
In 2010, organic land accounted for 0.6 percent of total globalagricultural land. In the EU other and EFTA sub-region thisshare of organic land was 3.9 percent of total agricultural land.In EU Central and Eastern it was 3.1 percent and in Caucasusand Turkey it was 1.1 percent. At 12.7 percent, Sweden has thelargest share of organic land, followed by Estonia, the CzechRepublic, Latvia and Italy.
CHART 65: Organic agriculture area, share of world total(2009)
0
5
10
15
EUOther
EUCE
SEEurope
CISEurope
Cauc&Turk
C Asia
%
Source: Statistics Division (FAOSTAT)
Metalink: P4.ENV.FAO.BIO.ORGAN.HA.SC, p. 108
• The region accounts for 26 percent of globalorganic land
• Sweden has highest proportion of organicland (12.7 percent)
88

ORGANIC AGRICULTURE
MAP 44: Organic agriculture area (thousand ha, 2009)
No Data < 20 20 − 100 100 − 150 150 − 400 > 400
Source: Statistics Division (FAOSTAT)
Metalink: P4.ENV.FAO.BIO.ORGAN.HA, p. 108
MAP 45: Organic agriculture area, share of agricultural area (%, 2009)
No Data < 2 2 − 3 3 − 5 5 − 8 > 8
Source: Statistics Division (FAOSTAT)
Metalink: P4.ENV.FAO.BIO.ORGAN.HA.SHL, p. 108
89

TABLE 19: Water and irrigationWater
resourcesTotal water withdrawal % of freshwater resources withdrawn Irrigation Average
renewable volume per capita total byagriculture
potential equippedfor precipitation
m3/person millionm3/yr
m3 % % thousandha
thousandha
mm/year
2009 2005 2005 2005 2005 2008 2008 2000-2010
WORLD 6242.0 3941055 607 9.3 6.5 304398 208004
Central Asia 3729.4 11319 1841
Kazakhstan 6919.0 34197 2254 31.2 26.1 3768 3556 250
Kyrgyzstan 4379.0 10080 1999 43.7 40.9 2247 1077 533
Tajikistan 2356.0 11960 1853 74.8 68.6 755 719 691
Turkmenistan 4964.0 24907 5246 100.8 97.2 2353 1744 161
Uzbekistan 1858.0 59808 2305 118.6 107.9 4915 4223 206
Caucasus & Turkey 3605.1 7116 2628
Armenia 2518.0 2827 922 36.4 23.9 666 274 562
Azerbaijan 3825.0 12211 1422 35.2 26.9 3200 1426 447
Georgia 14479.0 1621 362 2.6 1.7 725 433 1026
Turkey 2973.0 40100 588 18.8 13.9 8500 4983 593
CIS Europe 23379.5 5520 2093
Belarus 6019.0 4242 432 7.3 1.4 131 618
Republic of Moldova 3233.0 1789 475 15.4 6.5 1500 312 450
Russian Federation 31510.0 66200 460 1.5 0.3 29000 4346 460
Ukraine 3054.0 37744 804 27.0 14.1 5500 731 565
South Eastern Europe
Albania 13060.0 1853 590 4.4 2.5 340 1485
Bosnia and Herzegovina 9952.0 3 1028
Croatia 23917.0 631 142 0.6 0.0 3 1113
Macedonia, FYR 3111.0 1028 504 16.1 2.0 128 619
Montenegro
Serbia 4121
EU Central & Eastern 5543.8 1203 7020
Bulgaria 2824.0 6119 791 28.7 4.7 105 608
Czech Republic 1260.0 1709 167 13.0 0.3 39 677
Estonia 9545.0 1792 1331 14.0 0.0 150 4 626
Hungary 10398.0 5590 554 5.4 0.3 141 589
Latvia 15679.0 384 167 1.1 0.1 1 641
Lithuania 7453.0 2375 695 9.5 0.3 200 1 656
Poland 1610.0 11959 313 19.4 1.9 116 600
Romania 9839.0 6876 316 3.2 0.6 5500 615 637
Slovakia 9189.0 688 127 1.4 0.0 172 824
Slovenia 15746.0 942 471 3.0 0.0 9 1162
EU other & EFTA 5130.1 14645 18360
Austria 9283.0 3403 413 4.4 0.1 117 1110
Belgium 1717.0 6216 597 34.0 0.2 23 847
Cyprus 716.0 184 178 23.6 20.4 37 46 498
Denmark 1086.0 660 122 11.0 4.0 435 703
Finland 20592.0 1634 312 1.5 0.0 77 536
France 3379.0 31618 518 15.0 1.9 2642 867
Germany 1869.0 32299 391 21.0 0.1 485 700
Greece 6555.0 9471 847 12.8 11.4 1555 652
Ireland 11786.0 850 204 1.6 0.0 0 1118
Italy 3175.0 45395 774 23.7 10.5 3951 832
Luxembourg 6225.0 65 143 2.1 0.0 0 934
Malta 122.0 54 132 106.7 37.6 2 3 560
Netherlands 5496.0 10606 650 11.7 0.1 457 778
Portugal 6446.0 8904 844 13.0 9.0 584 854
Spain 2443.0 32461 748 29.1 17.6 3818 636
Sweden 18688.0 2616 290 1.5 0.1 160 624
United Kingdom 2375.0 12990 215 8.8 0.9 152 1220
Iceland 537975.0 165 556 0.1 0.0 1940
Norway 79024.0 2939 636 0.8 0.2 115 1414
Switzerland 7020.0 2557 345 4.8 0.1 25 1537
Israel 245.0 1954 296 109.8 63.4 225 435
90

TABLE 20: Inputs and agricultural emissionsTractors Fertilizer use per ha Pesticide use per ha Methane emissions Nitrous oxide emissions
x100 km2-arableland
of arable land of arab and perm crops land total, CO2equivalent
by agricul-ture, shareof total
total, CO2equivalent
by agricul-ture, shareof total
pieces kg/ha kg/ha kg/ha kg/ha thousandkt
% million mt %
2000-2008 2002 2009 2000 2009 1990-2005* 1990-2005* 1990-2005* 1990-2005*
WORLD 107.8 122.1 7136 42.6 2852.5 66.2
Central Asia 122 29.9 34.8 72.1
Kazakhstan 1.0 2.4 0.2 47 25.3 17.6 62.5
Kyrgyzstan 7.1 21.0 0.5 0.2 4 72.3 1.5 72.6
Tajikistan 47.2 4 68.6 1.4 86.9
Turkmenistan 28 21.6 4.3 78.1
Uzbekistan 193.3 40 33.7 10.0 84.2
Caucasus & Turkey 108 27.6 38.0 66.9
Armenia 34.5 29.3 0.8 3 36.7 0.6 81.6
Azerbaijan 10.4 13.6 0.3 37 13.6 2.6 77.5
Georgia 33.0 43.0 4 50.8 2.0 56.9
Turkey 72.8 96.5 2.5 1.6 64 33.6 32.8 66.4
CIS Europe 48.6 648 11.8 114.7 47.7
Belarus 89.8 136.0 281.1 11 70.9 11.7 72.9
Republic of Moldova 197.6 8.1 9.4 1.3 1.1 3 29.4 0.8 73.5
Russian Federation 30.0 13.6 15.6 563 9.1 76.1 44.3
Ukraine 103.3 15.9 29.7 2.1 70 23.3 26.1 45.6
South Eastern Europe 18 45.1 10.3 61.3
Albania 121.9 85.3 45.5 2 70.8 1.0 78.4
Bosnia and Herzegovina 32.7 24.5 3 42.4 1.2 57.8
Croatia 257.0 246.8 4 33.3 2.9 52.4
Macedonia, FYR 30.9 56.9 0.5 0.2 1 46.6 0.6 63.9
Montenegro 0.0
Serbia 17.7 133.8 8 43.7 4.6 63.6
EU Central & Eastern 696.6 143 27.1 70.9 55.1
Bulgaria 172.3 113.8 167.4 11 18.9 4.2 48.1
Czech Republic 81.7 123.3 2.7 11 33.6 8.9 36.9
Estonia 44.1 69.5 0.4 1.3 2 30.5 0.9 60.5
Hungary 122.2 80.0 1.7 2.7 8 33.6 7.0 60.1
Latvia 50.6 64.9 0.6 3 27.7 1.3 77.4
Lithuania 631.8 110.2 45.4 0.4 2.6 6 33.8 2.5 86.0
Poland 1246.0 116.2 144.6 0.7 2.9 70 21.9 30.2 57.7
Romania 200.4 34.8 48.5 1.0 0.7 24 36.0 11.5 56.2
Slovakia 154.6 83.1 95.5 1.8 2.3 4 39.0 3.4 37.7
Slovenia 403.5 241.9 13.8 5.9 3 32.1 1.2 70.4
EU other & EFTA 415 44.4 264.0 56.4
Austria 234.0 83.1 3.2 3.3 9 48.6 4.4 52.5
Belgium 21.7 10 56.7 6.6 44.3
Cyprus 159.7 181.9 20.0 18.7 1 44.0 0.3 65.5
Denmark 97.6 103.2 2.8 1.3 8 65.2 6.3 73.4
Finland 136.5 108.0 1.0 1.5 10 20.7 7.1 41.7
France 210.4 148.3 10.0 3.7 77 47.7 49.1 66.8
Germany 220.1 181.4 5.9 6.5 68 43.8 56.6 52.2
Greece 156.4 83.7 3.0 7 50.0 6.0 58.2
Ireland 597.0 477.3 3.5 4.2 15 76.7 7.5 90.5
Italy 171.1 135.5 14.1 11.4 41 39.8 28.6 43.7
Luxembourg 1039.7 581.1 301.8 1 81.3 0.5 60.3
Malta 103.2 81.5 40.3 0 28.6 0.1 39.8
Netherlands 428.8 240.9 24.1 18.1 21 43.4 14.6 39.5
Portugal 194.2 159.1 12.9 13.0 12 35.4 6.0 43.8
Spain 825.1 164.5 96.9 2.1 36 56.8 26.5 62.6
Sweden 99.9 69.4 1.3 0.7 11 28.1 5.9 60.2
United Kingdom 319.1 239.2 9.1 7.0 66 38.2 30.6 60.0
Iceland 16464.3 2686.0 2671.4 0.9 0 53.5 0.4 79.7
Norway 205.6 191.3 0.8 1.3 17 12.6 4.7 39.0
Switzerland 195.9 190.4 7.2 10.1 5 67.6 2.4 59.3
Israel 251.9 189.5 4 31.2 1.8 53.0
91

PART 1
92