statistics 2013 scoring guidelines - college...
TRANSCRIPT
AP® STATISTICS 2013 SCORING GUIDELINES
© 2013 The College Board. Visit the College Board on the Web: www.collegeboard.org
Question 4 Intent of Question The primary goal of this question was to assess students’ ability to identify, set up, perform, and interpret the results of an appropriate hypothesis test to address a particular question. More specific goals were to assess students’ ability to (1) state appropriate hypotheses; (2) identify the appropriate statistical test procedure and check appropriate conditions for inference; (3) calculate the appropriate test statistic and p-value; and (4) draw an appropriate conclusion, with justification, in the context of the study. Solution Step 1: States a correct pair of hypotheses.
The null hypothesis is that fruit and vegetable consumption is independent of (that is, it is not associated with) age group for the population of adults in the United States. The alternative hypothesis is that fruit and vegetable consumption is not independent of (that is, it is associated with) age group for the population of adults in the United States.
Step 2: Identifies a correct test procedure (by name or by formula) and checks appropriate conditions.
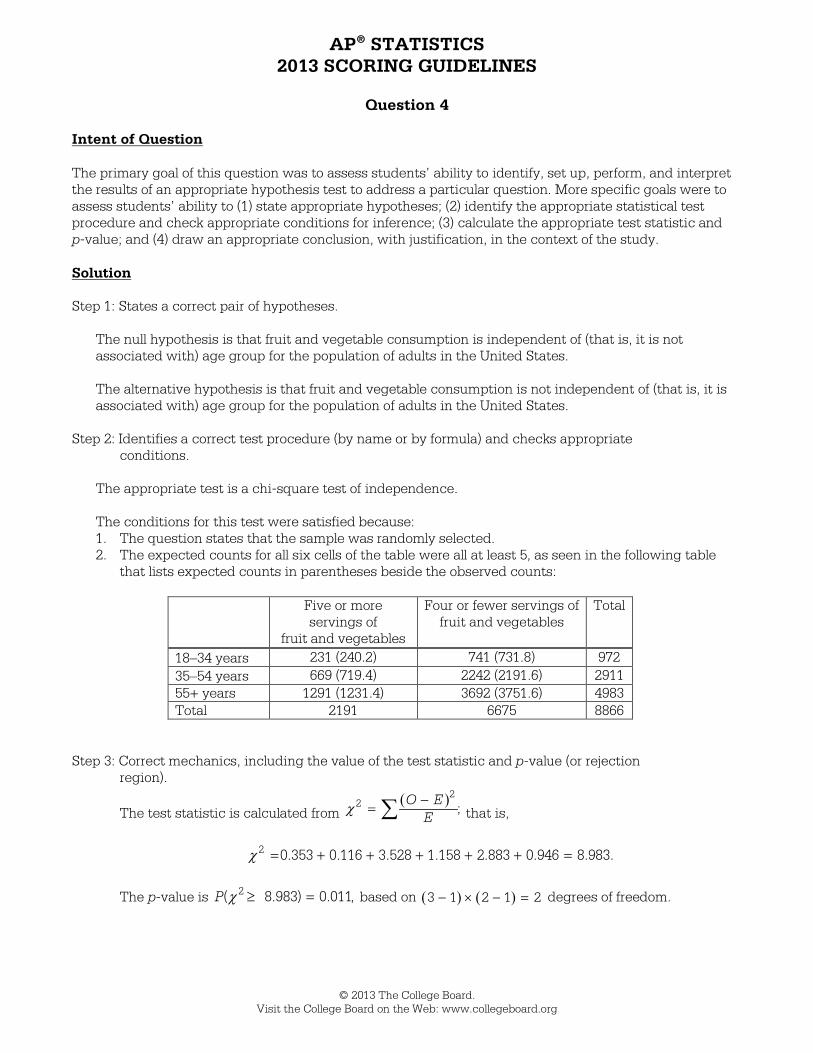
The appropriate test is a chi-square test of independence. The conditions for this test were satisfied because: 1. The question states that the sample was randomly selected. 2. The expected counts for all six cells of the table were all at least 5, as seen in the following table
that lists expected counts in parentheses beside the observed counts:
Five or more servings of
fruit and vegetables
Four or fewer servings of fruit and vegetables
Total
18–34 years 231 (240.2) 741 (731.8) 972 35–54 years 669 (719.4) 2242 (2191.6) 2911 55+ years 1291 (1231.4) 3692 (3751.6) 4983 Total 2191 6675 8866
Step 3: Correct mechanics, including the value of the test statistic and p-value (or rejection region).
The test statistic is calculated from ( )22 ;O E
Eχ −= ∑ that is,
χ = + + + + + =2 0.353 0.116 3.528 1.158 2.883 0.946 8.983.
The p-value is χ ≥ =2( 8.983) 0.011,P based on ( ) ( )3 1 2 1 2− × − = degrees of freedom.
AP® STATISTICS 2013 SCORING GUIDELINES
© 2013 The College Board. Visit the College Board on the Web: www.collegeboard.org
Question 4 (continued)
Step 4: States a correct conclusion in the context of the study, using the result of the statistical test.
Because the p-value is very small (for instance, much smaller than α = 0.05 ), we would reject the null hypothesis at the 0.05 level and conclude that the sample data provide strong evidence that there is an association between age group and consumption of fruits and vegetables for adults in the United States. In particular, older (55+ years of age) people were more likely to eat five or more servings of fruits and vegetables, and middle-aged people (35–54 years of age) were less likely to eat five or more servings of fruits and vegetables.
Scoring Each of steps 1, 2, 3, and 4 were scored as essentially correct (E), partially correct (P), or incorrect (I). Step 1 is scored as follows:
Essentially correct (E) if the response correctly states both hypotheses with at least one in context.
Partially correct (P) if the response correctly states both hypotheses but not in context, OR the hypotheses were reversed with at least one stated in context.
Incorrect (I) if the response does not meet the criteria for E or P.
Notes:
• If the hypotheses contain language that suggests that the response refers to the sample data, step
1 is scored as incorrect (I).
• If the null and alternative hypotheses were correctly stated in terms of population proportions, step 1 is scored essentially correct (E):
1 2 30H : p pp = = , where ip is the population proportion of adults at the indicated age group, 1, 2, or 3, who eat at least 5 servings of fruits and vegetables. H :a At least one of the population proportions, 1 2 3, ,p p p , differs from the other two OR H :a The population proportions for the three age groups were not the same
Step 2 is scored as follows:
Essentially correct (E) if the response correctly includes the following three components:
1. Identifies a chi-square test of independence by name or by formula for the chi-square test statistic.
2. States AND verifies the random sampling condition. 3. States AND verifies the technical condition that all expected counts were greater than 5.
AP® STATISTICS 2013 SCORING GUIDELINES
© 2013 The College Board. Visit the College Board on the Web: www.collegeboard.org
Question 4 (continued)
Partially correct (P) if the response correctly includes two of the three components listed above. Incorrect (I) if the response does not meet the criteria for E or P.
Notes:
• If the response identifies the test procedure as a chi-square test of homogeneity of proportions, step 2 does not receive credit for component 1.
• If the response identifies the correct test procedure but gives an incorrect formula for the test statistic, then this is considered a contradiction and does not meet the criteria for component 1.
• Stating the condition that the expected counts must be greater than 5 is not in itself sufficient
for satisfying component 3; the condition must be checked by reporting expected counts, or minimally reporting the value of the smallest expected count and indicating that it is at least 5.
• If the response includes an incorrect technical condition, such as “ ≥ 30n ” or “normality,” then
this will be considered a parallel solution and credit will not be granted for component 3.
• If the response states and verifies the condition that 80 percent of all expected counts must be ≥ 5 and all expected counts must be≥ 1, then the response can receive credit for component 3.
Step 3 is scored as follows:
Essentially correct (E) if the response correctly calculates the following two components: 1. Test statistic 2. p-value or critical value
Partially correct (P) if the response correctly calculates one of the two components listed above. Incorrect (I) if the response does not meet the criteria for E or P. Notes:
• When a response has an error in one calculation, future calculations were considered correct if they follow correctly from the initial miscalculation.
• The correct critical value is 5.99 for a significance level of 0.05. Step 4 is scored as follows:
Essentially correct (E) if the response correctly includes the following three components: 1. A correct conclusion 2. Justification of the conclusion based on linkage between the p-value and conclusion (or linkage
between test statistic and critical value) 3. The conclusion is stated in context
AP® STATISTICS 2013 SCORING GUIDELINES
© 2013 The College Board. Visit the College Board on the Web: www.collegeboard.org
Question 4 (continued) Partially correct (P) if the response includes a correct conclusion and one of the other two components listed above. Incorrect (I) if the response does not provide a correct conclusion or is missing both linkage and context.
Notes:
• If the conclusion is consistent with an incorrect p-value from step 3, stated in context, and has justification based on linkage to the p-value, then step 4 is scored as E.
• To meet the criteria for component 1, the conclusion must be consistent with the hypotheses. • If the response does not have linkage between the p-value and conclusion, then in order to
meet the criteria for component 1, the conclusion must be correct based on a 0.05 level of significance.
• If no significance level, ,α is given, then in order to meet the criteria for the linkage component, the solution must explain how the conclusion follows from the p-value such as saying: “Because the p-value is small, we reject the null hypothesis” or “Because the p-value is large, we do not reject the null hypothesis.”
• A p-value interpretation, in terms of the probability of obtaining a sample result as or more extreme as the observed result if the null hypothesis were true, does not in itself meet the criteria for the linkage component. A response with an incorrect interpretation of the p-value lowers the score one level (that is, from E to P, or from P to I)
• A response that states the alternative hypothesis has been proven lowers the score one level (that is, from E to P, or from P to I)
• A response including incorrect statistical language lowers the score one level (that is, from E to P, or from P to I)
Each essentially correct (E) step counts as 1 point, and a partially correct (P) step in counts as ½ point.
4 Complete Response 3 Substantial Response
2 Developing Response
1 Minimal Response If a response is between two scores (for example, 2½ points), use a holistic approach to determine whether to score up or down, depending on the strength of the response and communication.

© 2013 The College Board. Visit the College Board on the Web: www.collegeboard.org.

© 2013 The College Board. Visit the College Board on the Web: www.collegeboard.org.
© 2013 The College Board. Visit the College Board on the Web: www.collegeboard.org.

AP® STATISTICS 2013 SCORING COMMENTARY
© 2013 The College Board. Visit the College Board on the Web: www.collegeboard.org.
Question 4 Overview The primary goals of this question were to assess students’ ability to identify, set up, perform, and interpret the results of an appropriate hypothesis test to address a particular question. More specific goals were to assess students’ ability to (1) state appropriate hypotheses; (2) identify the appropriate statistical test procedure and check appropriate conditions for inference; (3) calculate the appropriate test statistic and p-value; and (4) draw an appropriate conclusion, with justification, in the context of the study. Sample: 4A Score: 4 The hypotheses are correctly stated in context. Although the hypotheses do not clearly indicate that they refer to the population of all adults in the United States, they do not explicitly refer to the sample observations either; therefore, the hypotheses are considered complete. The hypotheses would be improved if the response clearly stated the hypotheses in the context of the population. Step 1 was scored as essentially correct. The student clearly indicates that a chi-square test for association is the appropriate test procedure, satisfying one component of step 2. The second component of step 2 requires the student to state and verify the condition that the sampling must be done randomly. The student states the condition and clearly indicates that the condition has been met by writing that the stem of the problem states that this condition has been met. Thus, the second component is satisfied. The third component requires the student to state and verify that all expected counts are greater than five. The student calculates the smallest expected count of 240.2 and states that the smallest expected count is greater than five, satisfying the third component of step 2. The criteria for all three components of step 2 are satisfied and step 2 was scored as essentially correct. The correct chi-square test statistic with a corresponding p-value is given, satisfying both components of step 3. Step 3 was scored as essentially correct. The correct conclusion is stated that there is an association between age group and whether or not a person consumes at least five servings of fruits and vegetables per day for adults in the United States. The conclusion is justified by stating that the p-value of 0.0112 is smaller than the level of significance, and the conclusion is given in context. All three components of step 4 are satisfied and step 4 was scored as essentially correct. Because all four steps were scored as essentially correct, the response earned a score of 4. Sample: 4B Score: 3 The hypotheses are correctly stated in context. Although the hypotheses do not clearly indicate that they refer to the population of all adults in the United States, they do not explicitly refer to the sample observations either; therefore, the hypotheses are considered complete. The hypotheses would be improved if the response clearly stated the hypotheses in the context of the population. Step 1 was scored as essentially correct. The correct test procedure is identified as a chi-square test of association. The formula for the chi-square is also correctly stated. The first component of step 2 is satisfied by both name and formula, although only one of these identifications is required. The response does not indicate anywhere that random sampling is a necessary condition for inference; therefore, the second component is not satisfied. The response states that all cells have values greater than one and no more than 20 percent of the cells have values less than five. However, it is not clear whether the student is referring to the observed cells or the expected cells, and the student has not verified that the expected counts follow this pattern by either displaying the expected counts or stating and commenting that the minimum expected count is greater than five. The criterion for the third component of step 2 is not met. Only one component of step 2 is met, and step 2 was scored as incorrect.
AP® STATISTICS 2013 SCORING COMMENTARY
© 2013 The College Board. Visit the College Board on the Web: www.collegeboard.org.
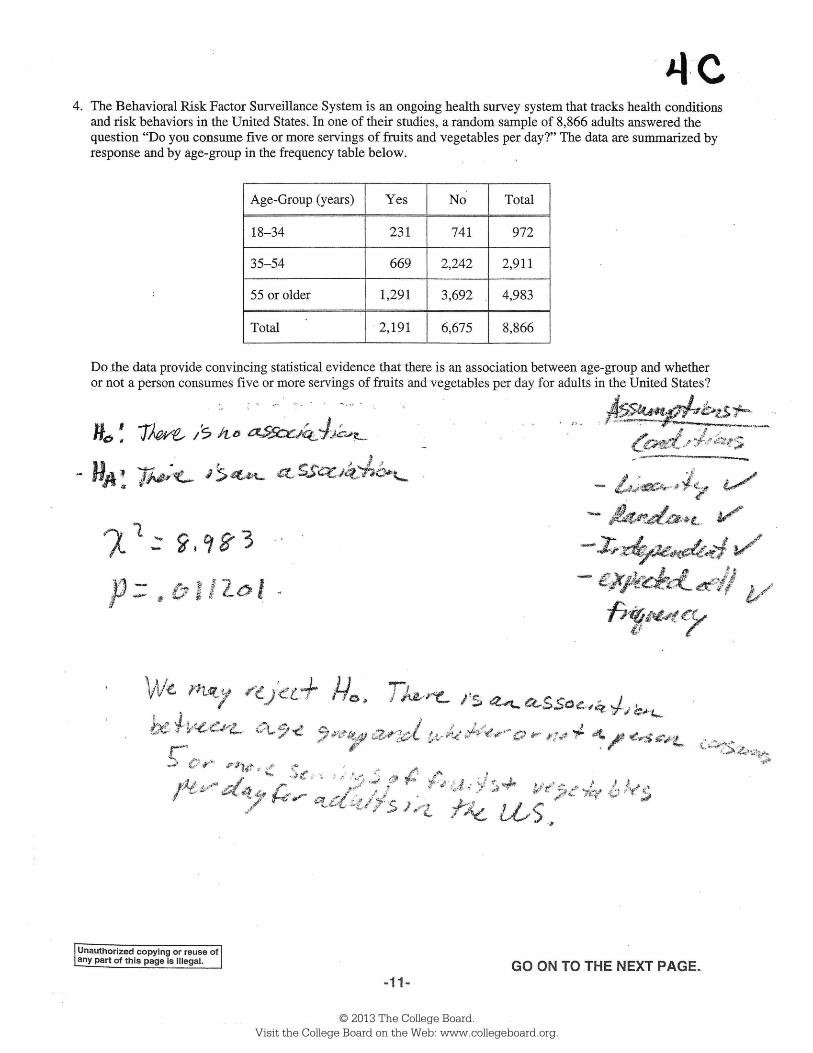
Question 4 (continued) Both the test statistic and the p-value are correctly stated. So step 3 was scored as essentially correct. The notation leading to the p-value expresses clear communication. The conclusion correctly states in context that there is an association between the two variables. The conclusion is justified by stating that the p-value of 0.0112 is significant at the 5 percent level; however, this is considered weak justification because no comparison of the p-value to the level of significance is given. All three components of step 4 are satisfied and step 4 was scored as essentially correct. Because three steps were scored as essentially correct and one step was scored as incorrect, the response earned a score of 3. Sample: 4C Score: 2 The hypotheses are correctly stated but lack context. Due to the lack of context, step 1 was scored as partially correct. The correct test procedure is not identified by name or formula, and the first component of step 2 is not satisfied. The response indicates that “random” is a condition and has verified this condition by placing a check mark next to it. Although this satisfies the second component, it is considered minimal weak communication. The response says “expected cell” followed by a check mark, but the student does not indicate that all expected counts must be greater than or equal to five and does not verify that this condition has been satisfied; the third component is not satisfied. In addition, the response states “linearity” as a condition. The inclusion of this word in itself prevents the response from satisfying the third component even if the expected counts had been verified. Only one of three components is satisfied, which resulted in a score of incorrect for step 2. Step 3 includes the minimum amount of communication required by stating the correct test statistic and p-value, resulting in a score of essentially correct. Step 4 has the correct conclusion stated in context; however, the conclusion is not justified by linkage to the p-value, and the response does not satisfy the second component. Step 4 was scored as partially correct. Because one step was scored as essentially correct, two steps were scored as partially correct, and one step was scored as incorrect, the response earned a score of 2.