statistics 2015 - vfa.de · statistics 2015 the pharmaceutical industry in germany . 2 ... al...
TRANSCRIPT

1
Statistics 2015The Pharmaceutical Industryin Germany
2
Foreword 1
People 2
Medicine 4
Research 8
The International Pharmaceutical Market 12
The German Pharmaceutical Market 16
Germany 20
The vfa 22
Contents
The vfa is the trade association of the research-based pharmaceuticalcompanies in Germany. It represents the interests of 47 leading glob-al pharmaceutical companies and their more than 100 subsidiariesand affiliates in the areas of health, research, and economic policy.The vfa member companies make up about two-thirds of the Germanpharmaceutical market and employ more than 77,000 people in Germany, of which approximately 16,000 are engaged in research and development.

2014 was an extraordinary year for medical innovations in Germany: With 49 new medications, researchbased pharmaceutical companies successfully guided to approval more new therapy options than in the past 25 years!
Millions of patients now have better chances that their illnesses can be cured or alleviated. The vfa member companies are thus meeting the demands they have put on themselves. If all continues to goes well, the next few years can bring further breakthroughs with diseases that are thus far poorly treated or not yet treated at all. The company pipelines bode well (pp. 5 – 7)!
The production situation is also encouraging: Germany is again one of the world’s leading countries in terms of pharmaceutical exports. In fact, twothirds of all drugs produced in Germany are exported. Companies in Germany produce pharmaceuticals and deliver them to the entire world, including to the everstronger markets of Asia, Africa, and Latin America (pp. 13, 20).
The German pharmaceutical market, however, is showing little momentum. Although the lowering of the statutory rebate from 16% to 7% again led to an increase in revenue for companies in the domestic market, a price freeze and other regulatory measures have curbed the industry’s contribution to the national economy (p. 17).
All this despite the fact that almost no other industry in Germany has a higher net value added per employee than the pharmaceutical industry. We are also far ahead in terms of research investment. Each day, researchbased pharmaceutical companies invest more than EUR 14 million in the research of new products. One in five of our companies’ employees works in research and development. Our companies’ increased investment in fixed assets is incontrovertible proof that they see Germany as a country with lasting potential (p. 22).
A futureoriented sector like the researchbased pharmaceutical industry is good for patients, the national economy, and society alike. A good framework is essential to maintaining this advantage. Thus, continuing to provide new and better medications in the future will require an alliance of all those involved.
Birgit FischerCEO of vfa
Dear readers,

2
1900
20 25 30 35 40 45 50 55 60 65 70 75 80 85
1950
2010
1900−2000: The century of longer life expectancyGlobal life expectancy at birth, in years
USA
Population per country (proportional)
ChinaIndia
Japan
Australia
Indonesia
Iran
JapanChina
India
Indonesia
Iran
Japan
Australia
China
India
Indonesia
Australia
Kenya Algeria
Nigeria
South Africa
Kenya
Algeria
NigeriaSouth Africa
Kenya
AlgeriaNigeria South Africa
Russia
Italy
France
United Kingdom
Germany
Russia
Italy France
United Kingdom
Germany
Russia
Italy
France
United Kingdom
Germany
Mexico
ColombiaArgentina
Mexico
Colombia
Brazil
Argentina
USA
MexicoColombiaBrazil
Argentina
USA
Iran
Brazil
All over the world, people can thank medical progress for living longer than their predecessors, with the exception of those living in regions beset with war or other crises. Over recent decades, there has been a significant increase in life expectancy in emerging and developing countries, while those living in industrialized countries have also added years to their lives.
Ever better medicines have played a key role, yet there are many known illnesses that remain untreatable: Only around a third of the approximately 30,000 diseases known today can be adequately treated.
The researchbased pharmaceutical companies of the vfa have accepted the challenge of researching and developing new medicines to combat the ever growing number of diseases so that more people around the globe can receive suitable treatments and live longer and better lives.
People

3
1900
20 25 30 35 40 45 50 55 60 65 70 75 80 85
1950
2010
1900−2000: The century of longer life expectancyGlobal life expectancy at birth, in years
USA
Population per country (proportional)
ChinaIndia
Japan
Australia
Indonesia
Iran
JapanChina
India
Indonesia
Iran
Japan
Australia
China
India
Indonesia
Australia
Kenya Algeria
Nigeria
South Africa
Kenya
Algeria
NigeriaSouth Africa
Kenya
AlgeriaNigeria South Africa
Russia
Italy
France
United Kingdom
Germany
Russia
Italy France
United Kingdom
Germany
Russia
Italy
France
United Kingdom
Germany
Mexico
ColombiaArgentina
Mexico
Colombia
Brazil
Argentina
USA
MexicoColombiaBrazil
Argentina
USA
Iran
Brazil
Above all, the lowering of cardiovascular mortality through medical and pharmaceutical progress has resulted in a significant increase in life expectancy in countries with higher incomes.
MaleFemale
Life expectancy trends in GermanyIn years
Source: destatis
2010/12
2005/07
82.8
77.7
82.3
2000/02 81.2
1995/97 80.2
1990/92 79.3
76.9
75.4
74.1
72.9
60 65 7570 80 85
Gain from lowering cardiovascular mortality
Greatest gains in life expectancy from a lower rate of cardiovascular mortality
6
5
4
2
3
1
01980 2011
Increased life expectancy in countries with higher incomes
Source: Colin D Mathers, et al., “Causes of international increases in older age life expectancy“, Lancet, Volume 385, No. 9967, pp. 540–548, February 7, 2015; Di Chiara A, Vanuzzo D.; “Does surveillance impact on cardiovascular prevention?”, Eur Heart J 2009; 30: 1027-1029
65%
In years, from age 60
Thanks in part to new pharmaceuticals, average life expectancy in Germany has increased by threeandahalf years for women and almost five years for men over the past 20 years. For instance, several drugs specifically designed to target tumors have signi ficantly extended, in part, the average lifespan for many patients diagnosed with cancer.
The challenge of disease Some figures about medical needs
30,000known illnesses worldwide
120,000new cases of Alzheimer’s each year (in Germany, and rising)
175new or reoccurring pathogens in the past 30 years
Illnesses withoutadequate treatmentoptions (approx. 2/3)
Adequately treatableillnesses (approx. 1/3)
Source: vfa

4
Milestones in pharmaceutical development
Medicine
All information relates to the year in which the drug was first marketed internationally or received approval for the stated application; covering innovations since approx. 1980.
In the last year, Germany introduced 49 new drugs with new active ingredients – a record number. There were also drugs that were introduced in new dosage forms. Above all, these numbers include drugs to treat severe and lifethreating illnesses such as cancer, infections, and pulmonary diseases. For patients with rare diseases, there were more new medications – socalled orphan drugs – than ever before.
In the coming years, we expect more significant advancements in numerous areas of medicine. Various cancer drugs figure heavily among those that could be approved by 2019. As life expectancy increases in Germany, so does the incidence of cancer.
First antibody therapy for breast cancer metastasis
Multi-drug resistant malaria cured with a new combination of drugs
Medication against the risk of HIV infection for children during birth
First drug to reduce relapse rates for multiple sclerosis (MS)
Drug combinations to prevent people infected with HIV from developing AIDS
First orally administered drug to treat erectile dysfunction
First antibody preparation against a specific cancer
(non-Hodgkin's lymphoma)
Chance to cure hepatitis C using a combination of drugs
First drug that can transform chronic myelogenous leukemia into a chronic illness
First so-called ACE inhibitors for lowering blood pressure
First genetically engineered drugs: human insulin
First anti-hormone drug against the recurrence of breast cancer
Fight against the tropical worm illness “river blindness”
First EPO preparation for overcoming anemia in dialysis patients
New drug replaces surgery for ulcers
First “pen” for on-demand, self-injection of a drug (insulin) by the patient
1980 1981 1982 1983 1984 1985 1986 1987 1988 1989 1990 1991 1992 1993 1994 1995 1996 1997 1998 1999 2000 20011985 2002 2003 2004 2005Continued on page 6
1 Systemic hormones, unless assigned to other applications (q.v.)2 Including sex hormones, excluding anti-infectives3 Including hormones, excluding anti-infectives4 Including hormones (insulin)5 Including hormones
Muscular/Skeletal 8%
Respiratory tract 3 6%
Infection 8%
Urinary tract 2 6%
Hormones 1 6%
Other 10%
26% Cardiovascular 5
18% Nervous system
12% Metabolism 4
Prescription drugs and their applicationsPackages sold by retail pharmacies in Germany in 2014
Source: vfa
More than a quarter of all medicines dispensed in Germany are focused on combating cardiovascular diseases.

5
Milestones in pharmaceutical development
First antibody therapy for breast cancer metastasis
Multi-drug resistant malaria cured with a new combination of drugs
Medication against the risk of HIV infection for children during birth
First drug to reduce relapse rates for multiple sclerosis (MS)
Drug combinations to prevent people infected with HIV from developing AIDS
First orally administered drug to treat erectile dysfunction
First antibody preparation against a specific cancer
(non-Hodgkin's lymphoma)
Chance to cure hepatitis C using a combination of drugs
First drug that can transform chronic myelogenous leukemia into a chronic illness
First so-called ACE inhibitors for lowering blood pressure
First genetically engineered drugs: human insulin
First anti-hormone drug against the recurrence of breast cancer
Fight against the tropical worm illness “river blindness”
First EPO preparation for overcoming anemia in dialysis patients
New drug replaces surgery for ulcers
First “pen” for on-demand, self-injection of a drug (insulin) by the patient
1980 1981 1982 1983 1984 1985 1986 1987 1988 1989 1990 1991 1992 1993 1994 1995 1996 1997 1998 1999 2000 20011985 2002 2003 2004 2005Continued on page 6
Essential medicinesListed active ingredients
Source: WHO
1st WHO Essential Drug List (1977)
17th WHO Essential Drug List (2011)
208
359
Only six percent of medical prescriptions in Germany involve patented drugs.
The World Health Organization maintains a list of essential drugs sorted by active ingredients. Since 1977, the number of essential drugs has nearly doubled according to WHO.
Patented drugs (2014)Medical prescriptions in Germany
Source: vfa
6% patented
Market launches of drugs with new molecular entities in Germany (2014)Number (not including biosimilars)
Source: Pharmazeutische Zeitung (through 2002), vfa (since 2003)
19921990 1994 1996 1998 2000 2002 2004 2006 2008 2010 2012 2014
49
2925 26
44
31 29
17
23
30 28
36
2726 2423
34
21
36 36
27 27
36
28 27
On average, researchbased pharmaceutical companies introduce more than 25 innovative drugs for patient care in Germany each year. 2014 was a particularly good year in this regard.
6
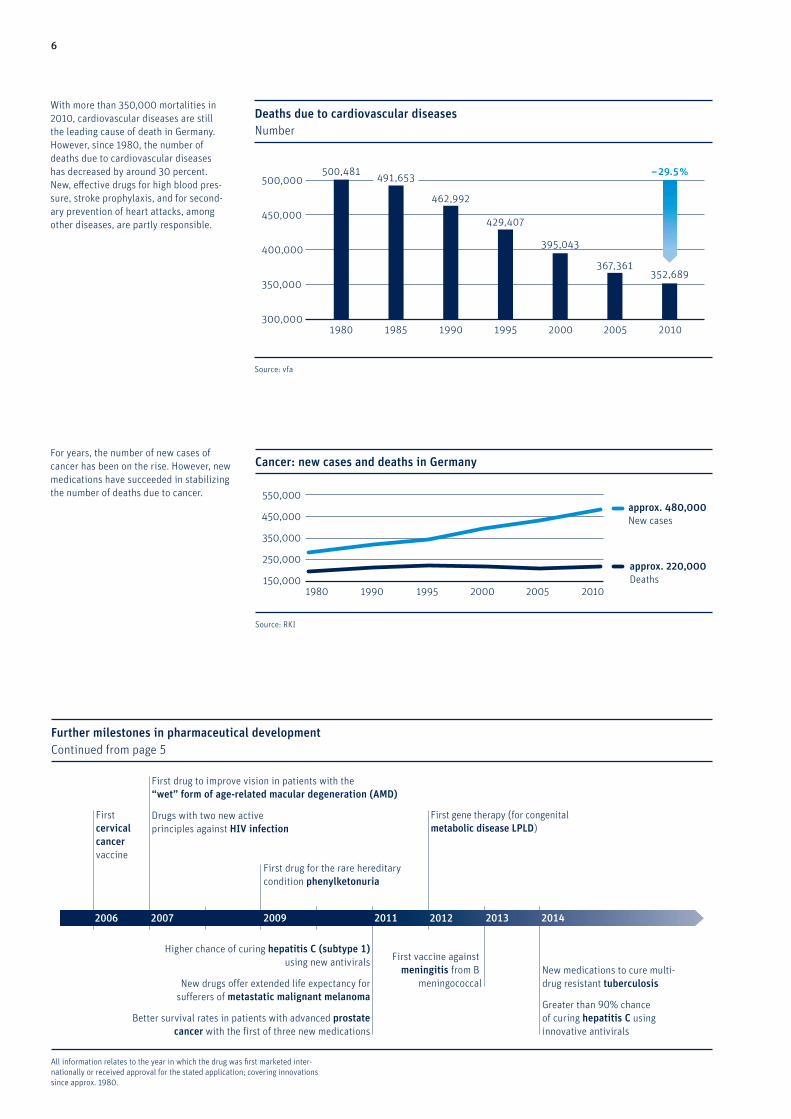
Cancer: new cases and deaths in Germany
Source: RKI
150,000
250,000
350,000
1980 1990 1995 2000 20102005
450,000
550,000approx. 480,000New cases
approx. 220,000Deaths
For years, the number of new cases of cancer has been on the rise. However, new medications have succeeded in stabilizing the number of deaths due to cancer.
Further milestones in pharmaceutical development Continued from page 5
All information relates to the year in which the drug was first marketed internationally or received approval for the stated application; covering innovations since approx. 1980.
First vaccine against meningitis from B
meningococcal
First drug to improve vision in patients with the “wet” form of age-related macular degeneration (AMD)
Drugs with two new active principles against HIV infection
New medications to cure multi-drug resistant tuberculosis
Greater than 90% chance of curing hepatitis C using innovative antivirals
First cervical cancer vaccine
First drug for the rare hereditary condition phenylketonuria
Higher chance of curing hepatitis C (subtype 1) using new antivirals
New drugs offer extended life expectancy for sufferers of metastatic malignant melanoma
Better survival rates in patients with advanced prostate cancer with the first of three new medications
First gene therapy (for congenital metabolic disease LPLD)
2006 2007 2008 2009 2010 2011 2012 2013 2014
Deaths due to cardiovascular diseasesNumber
Source: vfa
500,000
450,000
400,000
350,000
300,0001980 1985 1990 1995 2000 2005 2010
500,481491,653
462,992
429,407
395,043
367,361352,689
–29.5%
With more than 350,000 mortalities in 2010, cardiovascular diseases are still the leading cause of death in Germany. However, since 1980, the number of deaths due to cardiovascular diseases has decreased by around 30 percent. New, effective drugs for high blood pressure, stroke prophylaxis, and for second ary prevention of heart attacks, among other diseases, are partly responsible.

7
Marketing authorizations for medications with orphan drug status¹ (number in the European Union)
¹ Before 2000: drugs that would have qualified for the status
1998 2000 2002
European Orphan Drug Regulation in effect since 2000
2004 2006 2008 2010 2012 2014
Source: vfa
15
3
1 1 1
34
56
4
9
13
6
9
4
11
7 7
Diseases of the central nervous system1 5
49 medications with new molecular entities in 2014 and their applications
1 Excluding infections and cancerSource: vfa
11 Infectious diseases
5 Pulmonary diseases1
1 Muscular disorders
4 Diabetes2 Other metabolic
disorders
Cancer 8
Tissue repair 1
Gastrointestinal diseases1 3
3 Coagulation disorders
Anesthesia 1
Urological diseases1 3
Cardiovascular diseases 2
In 2014, infectious diseases and cancer were the therapy areas for which the most new drugs were approved.
84 medications with orphan drug status are currently authorized (a continually updated list can be found at www.vfa.de/orphans).
Pharmaceutical projects of vfa companies promising approval by 2019 Distribution in various medical fields; total number of projects: 328
2
Projects in the field of osteoporosis
2
Projects in the field of female-specific diseases
3
Projects in the field of eye diseases
25
Projects in the field of cardiovascular diseases
9
Projects in the field of type 2 diabetes
5
Projects in the field of chronic obstructive
pulmonary diseases
111 Projects in the field of cancer
50 Projects in the field of
infectious diseases
4 Projects in the field of
other metabolic disorders
7 Projects in the field of other diseases of the nervous system¹
24 Projects in
other fields of medicine
As of: August 2015Source: vfa¹ Not including cancer
58 Projects in the field of inflammatory disorders
6 Projects in the field of blood abnormalities
12
Projects in the field of pain
4
Projects in the field of neurodegenerative diseases
6Projects in the field of mental illnesses

8
vfa member companies are currently conducting research projects on more than 120 different illnesses, including common diseases such as type 2 diabetes and prostate cancer, rare diseases such as cystic fibrosis and congenital metabolic disorders, as well as diseases such as Ebola and Schistosomiasis, which occur almost exclusively in emerging and developing countries.
Yet, the path to a new drug is long: From the initial concept to approval, the process takes on average 13.5 years. And of the small number of newly invented drugs that are selected for human trials, only every ninth drug receives final approval. This is why almost no other sector invests as much time and money in research as the researchbased pharmaceutical companies: over USD 100 billion in 2013 alone.
Research
Development costs for a new pharmaceutical1
In USD million
0 500 1,000 1,500
1999 610
2001 802
1997 429
1993 359
1991 231
¹Failures and costs of long-term capital commitment includedSources: Di Masi J., et al., Tufts University (1991); Office of Technology Assessment (1993); Myers and Howe (1997);Office of Health Economics & Lehman Brothers (1999); Tufts University (2001); “The current state of innovationin the pharmaceutical industry” (Report for the European Commission, June 2008)
2005 970 to 1,600
More than half of the costs in 2005 were for clinical development, especially on logistically expensive, multinational phase III studies.
100% = All advanced-stage drug projects of vfa companies according to a vfa survey for the stated year.Only projects that could achieve approval within 4.5 years were included.
Distribution of vfa-member projects across various therapy areas (selection)
Source: vfa
0%
10%
20%
30%
2003 20112005 2007 201520132009
34%Cancer
3%Type 2 diabetes
18%Inflammatory diseases
15%Infectious diseases
8%Cardiovascular diseases
2%Mental illnesses
Onethird of all projects are focused on improving cancer therapy.

9
1.6 active ingredients
8.6 active ingredients
4.6 active ingredients
Year
1.1 active ingredients
Approved after an average of 13.5 years
Only a few active ingredients prove successful
12.4 active ingredients
Submitted for approval Examination of documents by the EMA or other regulatory authorities
Clinical phase III Trials with usually thousands of patients
Clinical phase IITrials with a few patients
Clinical phase 1 Tests on healthy people to ascertain tolerability
Preclinical development Test tube and animal studies on efficacy and the possibility of harmful side effects
13
1
0
2
3
4
5
6
8
9
10
11
7
12
On average5,000 to 10,000
active ingredients¹
1 active ingredient
ResearchMulti-stage optimization of active ingredient, test tube efficacy tests,very occasionally in animal studies
According to Paul, S.M., et al.: Nature Reviews Drug Discovery 9, pp. 203–214 (2010)¹ These are newly synthesized during the research phase; vfa estimate.
It takes an average of 13.5 years for a drug to go from concept to approval. Even then, many projects make it to the final stages of clinical development, only to fail.

10
India 3%
In USD billion Share (2013)
3% Other
7% Germany
37% USA
China 4%
Japan 16%
Europe w/o Germany 30%
R&D expendituresWorldwide
2013: provisional dataSource: EFPIA, PhRMA, vfa
2000
47
2005
72
2010
100
108
2013105 15 20 250
Germany’s strongest industries in terms of researchShare of R&D personnel and R&D expenditures
R&D personnel as a percent of employees
R&D expenditures as a percent of revenue
Pharmaceutical research companies (vfa)
21
14
As of: 2013Source: destatis, Stifterverband, vfa
14
12
Aircraft and spacecraft construction
11
7
Electrical engineering
7
3
Manufacture of chemical products
3
4Mechanical engineering
2
2
2
2
Information and communications technology
Business-related services
12Manufacture of cars and car parts 7
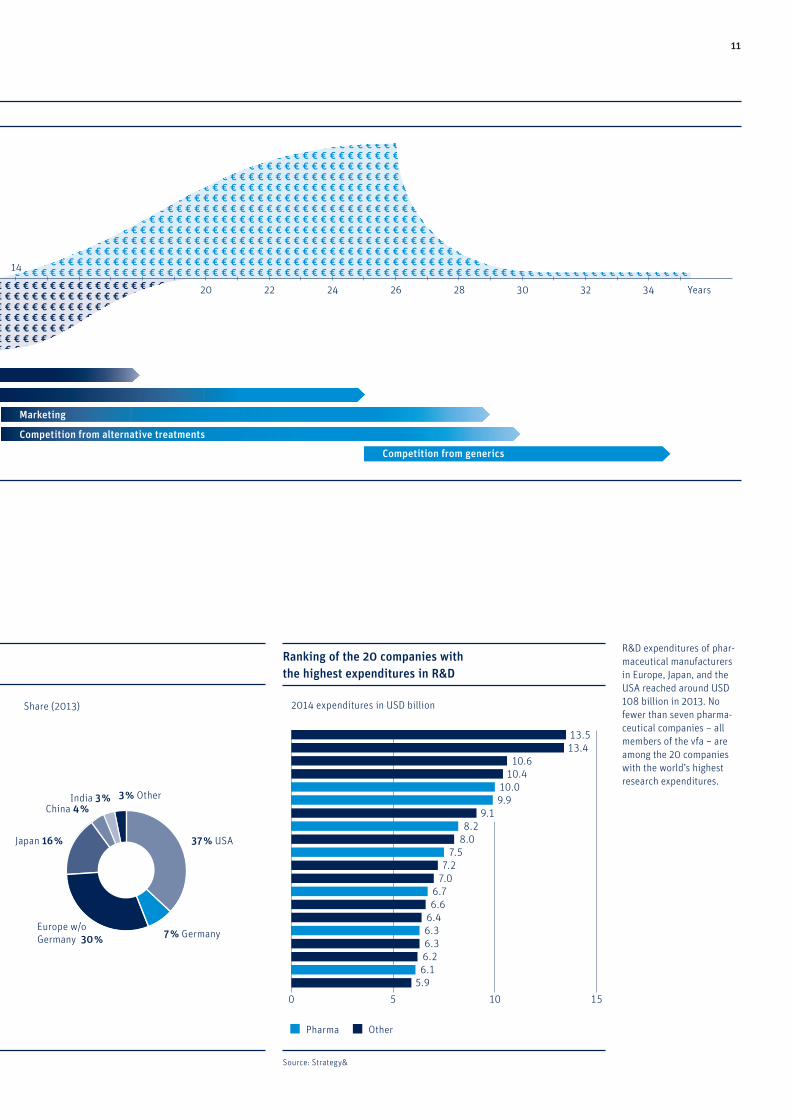
A new drug only receives market authorization after an average of 13.5 years of research and development. Only then does it begin to generate revenue, with only a short span of its 20year patent protection remaining. During the marketing phase, the drug is subject to additional development costs: for licensing requirements, for further development of the drug for children, and for other clinical and noninterventional studies to improve the application of the drug.Early on, the drug must already compete with other drugs for the same application. And when its patent protection expires, all other capable producers can copy the drug (with a socalled generic or – in the case of biopharmaceuticals – a biosimilar). The original manufacturer is left with severely diminished revenue, yet its invention and application expertise remain a lasting contribution to medical science.
€ € € € € € € € € € € € € € € € € € € € € € € € € € € € € € € € € € € € € € € € € € € € € € € € € € € € € € € € € € € € € € € € € € € € € € € € € € € € € € € € € € € € € € € € € € € € € € € € € € € € € € € € € € € € € € € € € € € € € € € € € € € € € € € € € € € € € € € € € € € € € € € € € € € € € € € € € € € € € € € € € € € € € € € € € € € € € € € € € € € € € € € € € € € € € € € € € € € € € € € € € € € € € € € € € € € € € € € € € € € € € € € € € € € € € € € € € € € € € € € € € € € € € € € € € € € € € € € € € € € € € € € € € € € € € € € € € € € € € € € € € € € € € € € € € € € € € € € € € € € € € € € € € € € € € € € € € € € € € € € € € € € € € € € € € € € € € € € € € € € € € € € € € € € € € € € € € € € € € € € € € € € € € € € € € € € € € € € € € € € € € € € € € € € € € € € € € € € € € € € € € € € € € € € € € € € € € € € € € € € € € € € € € € € € € € € € € € € € € € € € € € € € € € € € € € € € € € € € € € € € € € € € € € € € € € € € € € € € € € € € € € € € € € € € € € € € € € € € € € € € € € € € € € € € € € € € € € € € € € € € € € € € € € € € € € € € € € € € € € € € € € € € € € € € € € € € € € € € € € € € € € € € € € € € € € € € € € € € € € € € € € € € € € € € € € € € € € € € € € € € € € € € € € € € € € € € € € € € € € € € € € € € € € € € € € € € € € € € € € € € € € € € € € € € € € € € € € € € € € € € € € € € € € € € € € € € € € € € € € € € € € € € € € € € € € € € € € € € € € € € € € € € € € € € € € € € € € € € € € € € € € € € € € € € € € € € € € € € € € € € € € € € € € € € € € € € € € € € € € € € € € € € € € € € € € € € € € € € € € € € € € € € € € € € € € € € € € € € € € € € € € € € € € € € € € € € € € € € € € € € € € € € € € € € € € € € € € € € € € € € € € € € € € € € € € € € € € € € € € € € € € € € € € € € € € € € € € € € € € € € € € € € € € € € € € € € € € € € € € € € € € € € € € € € € € € € € € € € € € € € € € € € € € € € € € € € € € € € € € € € € € € € € € € € € € € € € € € € € € € € € € € € € € € € € € € € € € € € € € € € € € € € € € € € € € € € € € € € € € € € € € € € € € € € € € € € € € € € € € € € € € € € € € € € € € € € € € € € € € € € € € € € € € € € € € € € € € € € € € € € € € € € € € € € € € € € € € € € € € € € € € € € € € € € € € € € € € € € € € € € € € € € € € € € € € € € € € € € € € € € € € € € € € € € € € € € € € € € € € € € € € € € € € € € € € € € € € € € € € € € € € € € € € € € € € € € € € € € € € € € € € € € € € € € € € € € € € € € € € € € € € € € € € € € € € € € € € € € € € € € € € € € € € € € € € € € € € € € € € € € € € € € € € € € € € € € € € € € € € € € € € € € € € € € € € € € € € € € € € € € € € € € € € € € € € € € € € € € € € € € € € € € € € € € € € € € € € € € € € € € € € € € € € € € € € € € € € € € € € € € € € € € € € € € € € € € € € € € € € € € € € € € € € € € € € € € € € € € € € € € € € € € € € € € € € € € € € € € € € € € € € € € € € € € € € € € € € € € € € € € € € € € € € € € € € € € € € € € € € € € € € € € € € € € € € € € € € € € € € € € € € € € € € € € € € € € € € € € € € € € € € € € € € € € € € € € € € € € € € € € € € € € € € € € € € € € € € € € € € € € € € € € € € € € € € € € € € € € € € € € € € € € € € € € € € € € € € € € € € € € € € € € € € € € € € € € € € € € € € € € € € € € € € € € € € € € € € € € € € € € € €
€ € € € € € € € € € € € € € € € € € € € € € € € € € € € € € € € € € € € € € € € € € € € € € € € € € € € € € € € € € € € € € € € € € € € € € € € € € € € € € € € € € € € € € € € € € € € € € € € € € € € € € € € € € € € € € € € € € € € € € € € € € € € € € € € € € € € € € € € € € € € € € € € € € € € € € € € € € € € € € € € € € € € € € € € € € € € € € € € € € € € € € € € € € € € € € € € € € € € € € € € € € € € € € € € € € € € € € € € € € € € € € € € € € € € € € € € € € € € € € € € € € € € € € € € € € € € € € € € € € € € € € € € € € € € € € € € € € € € € € € € € € € € € € € € € € € € € € € € € € € € € € € € € € € € € € € € € € € € € € € € € € € € € € € € € € € € € € € € € € € € € € € € € € € € € € € € € € € € € € € € € € € € € € € € € € € € € € € € € € € € € € € € € € € € € € € € € € € € € € € € € € € € € € € € € € € € € € € € € € € € € € € € € € € € € € € € € € € € € € € € € € € € € € € € € € € € € € € € € € € € € € € € € € € € € € € € € € € € € € € € € € € € € € € € € € € € € € € € € € € € € € € € € € € € € € € € € € € € € € € € € € € € € € € € € € € € € € € € € € € € € € € € € € € € € € € € € € € € € € € € € € € € € € € € € € € € € € € € € € € € € € € € € € € € € € € € € € € € € € € € € € € € € € € € € € € € € € € € € € € € € € € € € € € € € € € € € € € € € € € € € € € € € € € € € € € € € € € € € € € € € € € € € € € € € € € € € € € € € € € € € € € € € € € € € € € € € € € € € € € € € € € € € € € € € € € € € € € € € € € € € € € € € € € € € € € € € € € € € € € € € € € € € € € € € € € € € € € € € € € € € € € € € € € € € € € € € € € € € € € € € € € € € € € € € € € € € € € € € € € € € € € € € € € € € € € € € € € € € € € € € € € € € € € € € € € € € € € € € € € € € € € € € € € € € € € € € € € € € € € € € € € € € € € € € € € € € € € € € € € € € € € € € € € € € € € € € € € € € € € € € € € € € € € € € € € € € € € € € € € € € € € € € € € € € € € € € € € € € € € € € € € € € € € € € € € € € € € € € € € € € € € € € € € € € € € € € € € € € € € € € € € € € € € € € € € € € € € € € € € € € € € € € € € € € € € € € € € € € € € € € € € € € € € € € € € € € € € € € € € € € € € € € € € € € € € € € € € € € € € € € € € € € € € € € € € € € € € € € € € € € € € € € € € € € € € € € € € € € € € € € € € € € € € € € € € € € € € € € € € € € € € € € € € € € € € € € € € € € € € € € € € € € € € € € € € € € € € € € € € € € € € € € € € € € € € € € € € € € € € € € € € € € € € € € € € € € € € € € € € € € € € € € € € € € € € € € € € € € € € € € € € € € € € € € € € € € € € € € € € € € € € € € € € € € € € € € € € € € € € € € € € € € € € € € € € € € € € € € € € € € € € € € € € € € € € € € € € € € € € € € € € € € € € € € € € € € € € € € € € € € € € € € € € € € € € € € € € € € € € € € € € € € € € € € € € € € € € € € € € € € € € € € € € € € € € € € € € € € € € € € € € € € € € € € € € € € € € € € € € € € € € € € € € € € € € € € € € € € € € € € € € € € € € € € € € € € € € € € € € € € € € € € € € € € € € € € € € € € € € € € € € € € € € € € € € € € € € € € € € € € € € € € € € € € € € € € € € € € € € € € € € € € € € € € € € € € € € € € € € € € € € € € € € € € € € € € € € € € € € € € € € € € € € € € € € € € € € € € € € € € € € € € € € € € € € € € € € € € € € € € € € € € € € € € € € € € € € € € € € € € €
Years
0 2 4 6
Lifecycle of a drug
26242220 28
8
30 32 34
Research
Patent protection (20 years)
Competition from alternative treatments
Marketing
Competition from generics
SalesCost of research and development
10 12 14
€€
Source: vfa
Research expenditures of pharmaceutical manufacturers worldwide again increased significantly in 2013. With 7 percent, Germany’s R&D expenditures are higher than those of all other countries except the USA and Japan.
In terms of the percentage of employees that work in R&D and R&D expenditure, researchbased pharmaceutical manufacturers are among the most researchintensive sectors in Germany. Only aircraft and spacecraft manufacturing has similarly high levels of research.
11
India 3%
In USD billion Share (2013)
3% Other
7% Germany
37% USA
China 4%
Japan 16%
Europe w/o Germany 30%
R&D expendituresWorldwide
2013: provisional dataSource: EFPIA, PhRMA, vfa
2000
47
2005
72
2010
100
108
2013
R&D expenditures of pharmaceutical manufacturers in Europe, Japan, and the USA reached around USD 108 billion in 2013. No fewer than seven pharmaceutical companies – all members of the vfa – are among the 20 companies with the world’s highest research expenditures.
0 5 10 15
Ranking of the 20 companies with the highest expenditures in R&D
2014 expenditures in USD billion
Source: Strategy&
OtherPharma
13.513.4
10.6
10.09.9
9.18.2
8.07.5
7.27.0
6.66.46.36.36.26.1
5.9
10.4
6.7
€ € € € € € € € € € € € € € € € € € € € € € € € € € € € € € € € € € € € € € € € € € € € € € € € € € € € € € € € € € € € € € € € € € € € € € € € € € € € € € € € € € € € € € € € € € € € € € € € € € € € € € € € € € € € € € € € € € € € € € € € € € € € € € € € € € € € € € € € € € € € € € € € € € € € € € € € € € € € € € € € € € € € € € € € € € € € € € € € € € € € € € € € € € € € € € € € € € € € € € € € € € € € € € € € € € € € € € € € € € € € € € € € € € € € € € € € € € € € € € € € € € € € € € € € € € € € € € € € € € € € € € € € € € € € € € € € € € € € € € € € € € € € € € € € € € € € € € € € € € € € € € € € € € € € € € € € € € € € € € € € € € € € € € € € € € € € € € € € € € € € € € € € € € € € € € € € € € € € € € € € € € € € € € € € € € € € € € € € € € € € € € € € € € € € € € € € € € € € € € € € € € € € € € € € € € € € € € € € € € € € € € € € € € € € € € € € € € € € € € € € € € € € € € € € € € € € € € € € € € € € € € € € € € € € € € € € € € € € € € € € € € € € € € € € € € € € € € € € € € € € € € € € € € € € € € € € € € € € € € € € € € € € € € € € € € € € € € € € € € € € € € € € € € € € € € € € € € € € € € € € € € € € € € € € € € € € € € € € € € € € € € € € € € € € € € € € € € € € € € € € € € € € € € € € € € € € € € € € € € € € € € € € € € € € € € € € € € € € € € € € € € € € € € € € € € € € € € € € € € € € € € € € € € € € € € € € € € € € € € € € € € € € € € € € € € € € € € € € € € € € € € € € € € € € € € € € € € € € € € € € € € € € € € € € € € € € € € € € € € € € € € € € € € € € € € € € € € € € € € € € € € € € € € € € € € € € € € € € € € € € € € € € € € € € € € € € € € € € € € € € € € € € € € € € € € € € € € € € € € € € € € € € € € € € € € € € € € € € € € € € € € € € € € € € € € € € € € € € € € € € € € € € € € € € € € € € € € € € € € € € € € € € € € € € € € € € € € € € € € € € € € € € € € € € € € € € € € € € € € € € € € € € € € € € € € € € € € € € € € € € € € € € € € € € € € € € € € € € € € € € € € € € € € € € € € € € € € € € € € € € € € € € € € € € € € € € € € € € € € € € € € € € € € € € € € € € € € € € € € € € € € € € € € € € € € € € € € € € € € € € € € € € € € € € € € € € € € € € € € € € € € € € € € € € € € € € € € € € € € € € € € € € € € € € € € € € € € € € € € € € € € € € € € € € € € € € € € € € € € € € € € € € € € € € € € € € € € € € € € € € € € € € € € € € € € € € € € € € € € € € € € € € € € € € € € € € € € € € € € € € € € € € € € € € € € € € € € € € € € € € € € € € € € € € € € € € € € € € € € € € € € € € € € € € € € € € € € € € € € € € € € € € € € € € € € € € € € € € € € € € € € € € € € € € € € € € € € € € € € € € € € € € € € € € € € € € € € € € € € € € € € € € € € € € € € € € € € € € € € € € € € € € € € € € € € € € € € € € € € € € € € € € € € € € € € € € € € € € € € € € € € € € € € € € € € € € € € € € € € € € € € € € € € € € € € € € € € € € € € € € € € € € € € € € € € € € € € € € € € € € € € € € € € € € € € € € € € € € € € € € € € € € € € € € € € € € € € € € € € € € € € € € € € € € € € € € € € € € € € € € € € € € € € € € € € € € € € € € € € € € € € € € € € € € € € € € € € € € € € € € € € € € € € € € € € € € € € € € € € € € € € € € € € € € € € € € € € € € € € € € € € € € € € € € € € € € € € € € € € € € € € € € € € € € € € € € € € € € € € € € € €
€ € € € € € € € € € € € € € € € € € € € € € € € € € € € € € € € € € € € € € € € € € € € € € € € € € € € € € € € € € € € € € € € € € € € € € € € € € € € € € € € € € € € € € € € € € € € € € € € € € € € € € € € € € € € € € € € € € € € € € € € € € € € € € € € € € € € € € € € € € € € € € € € € € € € € € € € € € € € € € € € € € € € € € € € € € € € € € € € € € € € € € € € € € € € € € € € € € € € € € € € € € € € € € € € € € € € € € € € € € € € € € € € € € € € € € € € € € € € € € € € € € € € € € € € € € € € € € € € € € € € € € € € € € € € € € € € € € € € € € € € € € € € € € € € € € € € € € € € € € € € € € € € € € € € € € € € € € € € € € € € € € € € € € € € € € € € € € € € € € € € € € € € € € € € € € € € € € € € € € € € € € € € € € € € € € € € € € € € € € € € € € € € € € € € € € € € € € € € € € € € € € € € € € € € € € € € € € € € € € € € € € € € € € € € € € € € € € € € € € € € € € € € € € € € € € € € € € € € € € € € € € € € € € € € € € € € € € € € € € € € € € € € € € € € € € € € € € € € € € € € € € € € € € € € € € € € € € € € € € € € € € € € € € € € € € € € € € € € € € € € € € € € € € € € € € € € € € € € € € € € € € € € € € € € € € € € € € € € € € € € € € € € € € € € € € € € € € € € € € € € € € € € € € € € € € € € € € € € € € € € € € € € € € € € € € € € € € € € € € € € € € € € € € € € € € € € € € € € € € € € € € € € € € € € € € € € € € € € € € € € € € € € € € € € € € € € € € € € € € € € € € € € € € € € € € € € € € € € € € € € € € € € € € € € € € € € € € € € € € € € € € € € € € € € € € € € € € € € € € € € € € € € € € € € € € € € € € € € € € € € € € € € € € € € € € € € € € € € € € € € € € € € € € € € € € € € € € € € € € € € € € € € € € € € € € € € € € € € € € € € € € € € € € € € € € € € € € € € € € € € € € € € € € € € € € € € € € € € € € € € € € € € € € € € € € € € € € € € € € € € € € € € € € € € € € € € € € € € € € € € € € € € € € € € € € € € € € € € € € € € € € € € € € € € € € € € € € € € € € € € € € € € € € € € € € € € € € € € € € € € € € € € € € € € € € € € € € € € € € € € € € € € € € € € € € € € € € € € € € € € € € € € € € € € € € € € € € € € € € € € € € € € € € € € € € € € € € € € € € € € € € € € € € € € € € € € € € € € € € € € € € € € € € € € € € € € € € € € € € € € € € € € € € € € € € € € € € € € € € € € € € € € € € € € € € € € € € € € € € € € € € € € € € € € € € € € € € € € € € € € € € € € € € € € € € € € € € € € € € € € € € € € € € € € € € € € € € € € € € € € € € € € € € € € € € € € € € € € € € € € € € € € € € € € € € € € € € € € € € € € € € € € € € € € € € € € € € € € € € € € € € € € € € € € € € € € € € € € € € € € € € € € € € € € € € € € € € € € € € € € € € € € € € € € € € € € € € € € € € € € € € € € € € € € € € € € € € € € € € € € € € € € € € € € € € € € € € € € € € € € € € € € € € € € € € € € € € € € € € € € € € € € € € € € € € € € € € € € € € € € € € € € € € € € € € € € € € € € € € € € € € € € € € € € € € € € € € € € € € € € € € € € € € € € € € € € € € € € € € € € € € € € € € € € € € € € € € € € € € € € € € € € € € € € € € € € € € € € € € € € € € € € € € € € € € € € € € € € € € € € € € € € € € € € € € € € € € € € € € € € € € € € € € € € € € € € € € € € € € € € € € € € € € € € € € € € € € € € € € € € € € € € € € € € € € € € € € € € € € € € € €
Years
0 2 4 6
Lifecycle of a drug
26242220 28
8
30 32 34
Research
Patent protection (20 years)
Competition from alternative treatments
Marketing
Competition from generics
SalesCost of research and development
10 12 14
€€
Source: vfa
12
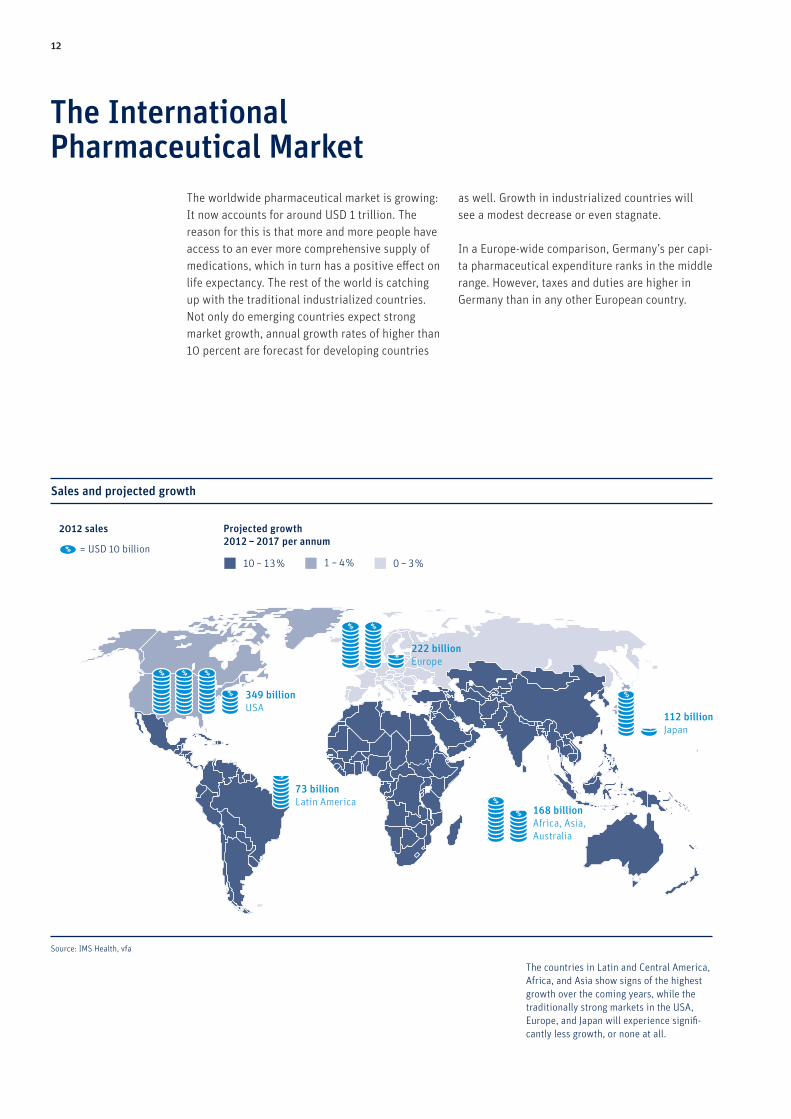
The worldwide pharmaceutical market is growing: It now accounts for around USD 1 trillion. The reason for this is that more and more people have access to an ever more comprehensive supply of medications, which in turn has a positive effect on life expectancy. The rest of the world is catching up with the traditional industrialized countries. Not only do emerging countries expect strong market growth, annual growth rates of higher than 10 percent are forecast for developing countries
as well. Growth in industrialized countries will see a modest decrease or even stagnate.
In a Europewide comparison, Germany’s per capita pharmaceutical expenditure ranks in the middle range. However, taxes and duties are higher in Germany than in any other European country.
The countries in Latin and Central America, Africa, and Asia show signs of the highest growth over the coming years, while the traditionally strong markets in the USA, Europe, and Japan will experience significantly less growth, or none at all.
349 billionUSA
222 billionEurope
168 billionAfrica, Asia, Australia
73 billionLatin America
112 billionJapan
Sales and projected growth
Source: IMS Health, vfa
2012 sales Projected growth2012 − 2017 per annum
10 − 13% 1 − 4% 0 − 3%= USD 10 billion
The International Pharmaceutical Market

13
International pharmaceutical market
In USD billion
Sales at manufacturer prices for pharmacies; Source: IMS Health, vfa
Share (2013)
0 400200 800600 1,000
2013 989
2010 891
2005 611
2000 365
34% USA
19% Europe (w/o Germany)
Germany 5%
Other 32%
Japan 10%
2000 2015 2030
44% USA
26% Europe
Rest of the world 19%
Japan 11%
36% USA
23% Europe
Rest of the world 29%
Japan 12%
29% USA
20% Europe
Rest of the world 41%
Japan 10%
The rise of “pharmerging markets”Share of global sales
Source: vfa
The share of the “big three” – USA, Europe, and Japan – will continue to decrease. The rest of the world, which currently accounts for more than a quarter of sales, will grow in importance.
Gilead Sciences23.7
Novartis51.3
Pfizer44.9
Sanofi40.0
Roche37.6
Merck & Co.36.6
Johnson&Johnson
36.4
AstraZeneca33.3
GlaxoSmithKline31.5
Teva26.0
Source: IMS Health
The largest pharmaceutical companies in 2014
Sales in USD billion (only pharmaceutical sales)
Global pharmaceutical sales have almost tripled since 2000. The USA, with around 34 percent, is still the world’s largest single market, followed by Europe and Japan. However, the share of the “big three” is decreasing. The rest of the world combined accounts for over 30 percent of sales, perhaps even more considering the unreliability of data. The Latin American and Asian markets are developing most strongly.
The world’s eight largest pharmaceutical companies are members of the vfa. Sales, and thus rankings, have decreased in recent years due to corporate mergers and patent expiration.

14
As of: 2014Source: vfa
Iceland 25.5% Denmark, Norway 25% Bulgaria 20% Germany 19%Czech Rep. 15% Latvia 12% Finland, Italy, Austria, Slovakia 10% Slovenia 9.5% Estonia, Romania 9% Poland, Serbia, Turkey 8% Greece 6.5% Belgium, Netherlands, Portugal 6% Lithuania, Croatia, Hungary, Cyprus 5% Spain 4% Luxemburg 3% Switzerland 2.5% France 2.1% Ireland, Malta, Sweden, United Kingdom 0%
No data
Value added tax on pharmaceuticalsEuropean comparison
Pricing structure in EuropeShare in percent
0 20 40 60 80 100
Sweden
Ireland
Poland
Portugal
Czech Rep.
Switzerland
Belgium
Greece
France
Spain
Netherlands
Austria
Italy
Denmark
Finland
Germany
Prescribed or reimbursed pharmaceuticals; as of 2013 (Germany 2014)Source: EFPIA, Pharmaceutical associations of European countries, vfa
Manufacturer Wholesaler Pharmacies Taxes and discounts
68 6 22 4
65 5 26 4
70 5 25
80 173
68 6 20 6
68 3 23 6
61 7 26 6
60 6 25 9
60 2 28 10
59
57
50
4
3
13
24
24
16
324 14
69 3 15 13
70
70
7 17 6
73 20
65 3 25 7
With a manufacturer’s share of 50 percent of the retail price, Germany is located at the bottom of a European ranking. With the combined statutory rebates for manufacturers and pharmacies, duties amount to 32 percent of the end price, the highest such rate in Europe. In most other European countries, tax burdens for pharmaceuticals are reduced or altogether waived.

15
21 3
Pharmaceutical expenditures
As of: 2015Source: OECD
2.26Hungary Japan 2.12Slovakia 2.01USA 1.95Canada 1.78France 1.65Italy 1.63Portugal 1.62Germany 1.55Spain 1.49Belgium 1.46Ireland 1.44Czech Rep. 1.40Poland 1.38Switzerland 1.22Austria 1.22Finland 1.19Iceland 1.18Estonia 1.12Sweden 1.11Netherlands 0.86
Denmark 0.66Luxemburg 0.61
0.67Norway
500 1,000
1,034USACanada 761Japan 756Switzerland 696Germany 678Ireland 652France 622Belgium 606Italy 572Austria 549Slovakia 533Hungary 527Iceland Sweden Spain Finland Portugal Norway Czech Rep. Luxemburg
Poland Estonia Denmark 288
0 0
Netherlands
10 20 40300
Slovakia 26.5Poland 21.6Japan 21.1Czech Rep. 19.7Estonia 18.8Italy 18.6Ireland 17.8Portugal 17.5Canada 17.5Spain 16.7France 15.1Belgium 14.2Germany 14.1Finland 13.8 Iceland 13.5Austria 12.1USA 11.9Switzerland 11.0Sweden 10.1Luxemburg 9.2Netherlands 7.7Norway 7.5Denmark 6.3
Hungary 30.6
498496489475
438437
403
397331
401
290
As a percentage of gross domestic product
Per capita in USD, adjusted for purchasing power
As a percentage of total healthcare expenditures
Source: ÖBIG, Lauer-Taxe (as of: May 2015)* DNK, SWE, FIN, CZE, AUT, SVK, GRC, ITA, ESP, PRT, FRA, BEL, IRL, GBR, NLD
Prices for new medications in a European comparisonNegotiated reimbursement prices for 63 new drugs in Germanyin comparison to the prices in 15 European countries* (100% = average price)
0 4 8 12 16 20 24 28 32 36 40 44 48 52 56 60
150 %
175 %
125 %
100 %
75 %
50 %
25 %
Range of prices in the 15 countries under comparison*
Price in Germany (negotiated selling price for the pharmaceutical company in compliance with the Lauer-Taxe)
In an international comparison, Germany ranks in the middletoupper range for per capita expenditures on pharmaceuticals. When taking into account economic performance (measured as gross domestic product) or other healthcare spending, Germany falls into the middle range of the comparison scale.
Since the introduction of the AMNOG in 2011, in most cases the reimbursement amounts for newly introduced drugs are below average in a European comparison, while some even fall at the bottom of the comparison scale.

16
Total health expenditures in Germany rise hand in hand with increased expenditures on drugs. The lowering of the elevated mandatory discount in 2014 from 16 percent to 7 percent is reflected in a boost in company sales, which rose from EUR 16 billion to EUR 18 billion. After inpatient treatment and officebased doctor’s care, pharmaceuticals are the third largest expenditure item for the statutory health insurance system.
And this despite an overall trend of continually decreasing prices: While other expenditures for private consumption have risen almost 25 percent since 2000, drugs have become cheaper by about 15 percent over the same period.
Contractual and statutory discounts totaled almost EUR 5 billion in 2014.
The local pharmacy is still the mostimportant source for pharmaceuticals.On average, threequarters of the costis covered by statutory health insurers.
84% Local pharmacies
8% Other distribution channels
Hospitals 8%
How do drugs reach the patients?
Source: destatis
5% Other financial contributors
Private households/organizations 16%
72% Statutory health insurers
Financing of pharmaceuticals
Source: destatis
Private health insurers 7%
1 32
TestingDrugs are tested for efficacy, safety, and technicalquality before being submitted for approval. Thisincludes required tests with cell cultures andanimals, then on healthy individuals, and finallyon patients.
ApprovalExperts at the relevant authorities examine theresults of all laboratory tests, animal tests, andstudies as well as the technical quality (e.g.purity) of the drug. If the result of their reviewis positive, the drug is approved.
Market launchThe drug enters the market and can beprescribed to patients. Doctors, manufacturers,and authorities monitor for any possible, rareside effects. The package insert is constantlyupdated.
4
Benefit analysisA scientific review determines whether a drug hasany additional benefits over and above comparabletherapies as well as the extent of these additionalbenefits.
5
Price settingWithin six months after receiving a decision indirect negotiations with the National Associationof Statutory Health Insurance Funds, pharmaceuti-cal companies must agree on a SHI refund as thediscount on the pharmaceutical manufacturerprice for drugs that have been deemed – through a
benefit analysis by the Federal JointCommittee (G-BA) – to have an additionalbenefit as well as for drugs that have noadditional benefits and cannot be assignedto any particular reference price group.
How does a new drug enter the market?
Source: vfa
The German Pharmaceutical Market

17
After the temporarily elevated discount expired, the statutory rebates decreased to EUR 1.64 billion in 2014. However, the additional contractual rebates subsequently rose by EUR 300 million to EUR 3.15 billion in 2014 (provisional data). Discount agreements are increasingly being concluded for patented innovations.
The pharmaceutical manufacturer receives half of the list price of a prescribed medication. The other half is split between sales tax, the discounts – which must be accorded by the pharmaceutical companies and the pharmacies of the statutory health insurance system – and the compensation for the services of the pharmacy and wholesaler.
Wholesale 3.5%
16.0% Taxes
13.3% Pharmaceutical company discounts
14.1% Pharmacies
2.8% Pharmacy discounts
Pharmaceutical companies 50.3%
Price structure in the SHI pharmaceutical market in 2014Percent share of the retail price (list price) in pharmacies
Source: InsightHealth, vfa
Manufacturer sales in the SHI pharmaceutical marketIn EUR billion at pharmaceutical company prices
18
20
22
24
16
14
Gross Net sales
Source: InsightHealth, Federal Ministry of Health, vfa
Discounts
2006 2007 2008 2009 2010 2011 2012 20142013
Discounts provided by pharmaceutical companiesIn EUR billion
2
3
5
4
6
1
Contractual discounts Statutory discounts
2008 2009 2012 2013 20142010 20110
Source: Federal Ministry of Health, IGES, vfa
1 32
TestingDrugs are tested for efficacy, safety, and technicalquality before being submitted for approval. Thisincludes required tests with cell cultures andanimals, then on healthy individuals, and finallyon patients.
ApprovalExperts at the relevant authorities examine theresults of all laboratory tests, animal tests, andstudies as well as the technical quality (e.g.purity) of the drug. If the result of their reviewis positive, the drug is approved.
Market launchThe drug enters the market and can beprescribed to patients. Doctors, manufacturers,and authorities monitor for any possible, rareside effects. The package insert is constantlyupdated.
4
Benefit analysisA scientific review determines whether a drug hasany additional benefits over and above comparabletherapies as well as the extent of these additionalbenefits.
5
Price settingWithin six months after receiving a decision indirect negotiations with the National Associationof Statutory Health Insurance Funds, pharmaceuti-cal companies must agree on a SHI refund as thediscount on the pharmaceutical manufacturerprice for drugs that have been deemed – through a
benefit analysis by the Federal JointCommittee (G-BA) – to have an additionalbenefit as well as for drugs that have noadditional benefits and cannot be assignedto any particular reference price group.
How does a new drug enter the market?
Source: vfa

18
192
75
4042434949
Source: IGES
Rheumato
id arthrit
is
Multiple
scler
osis
Viral in
fections
Age-re
lated
macu
lar
degen
eratio
n
Vaccines
Incre
ased pro
pensit
y for
platele
t aggre
gatio
n
Hyper
tensio
n
Acid-re
lated
disord
ers
Epilepsy
Pain
Consumption-related spending increases in 2014 based on health disordersChanges in sales in EUR million
= EUR 10 million
91
141126
33% Hospital care
18% Office-based doctor's care
Pharmaceuticals 17%
Remedies and medical devices 6%
Other services 20%
Administrative costs, etc. 6%
Share in percent
Changes since 2010 in percent
Expenditures in the Statutory Health Insurance System in 2014
Provisional data; data includes additional payments by insured patientsSource: BMG
Total expenditures
Hospital care
Office-based doctor's care
Pharmaceuticals
Remedies and medical devices
Administrative costs, etc.
Other services
0 5 10 15 20 25
15.6
16.5
13.5
10.4
24.3
19.4
11.0
At around EUR 65 billion, one third of all SHI expenditures – a total of EUR 198 billion – goes to hospital care. Expenditures for officebased doctor’s care (EUR 36 billion; 18 percent) and pharmaceuticals (EUR 32 billion; 17 percent) together make up another third. Administrative costs constitute EUR 10 billion (6 percent). In 2013, pharmaceutical expenditures were only marginally higher than in 2010, while all other service areas became significantly more expensive.
Most increases in consumptionrelated spending are connected to the treatment of severe and chronic illnesses, especially for rheumatic diseases, multiple sclerosis, and metabolic disorders.

19
Price trends
2000 = 100
Source: destatis, WIdO
859095
100105110115
125120
SHI pharma-ceuticals
Private consumption (total)
20142000 ’01 ’02 ’03 ’04 ’05 ’06 ’07 ’08 ’09 ’10 ’11 ’12 ’13
501998 2000 2002 2004 2006 2008 2010 2012
55
60
65
70
75
80
85
90
Generic drugs in the SHI marketShare of the generics-eligible market (in percent)
Source: “Arzneiverordnungs-Report” (through 2007), SHI quick drug data (since 2008)
Sales
Prescriptions
2014
When patents expire, the imitation products of other manufacturers (generic drugs) can be authorized for marketing alongside the original pharmaceuticals. In Germany, 86 percent of SHI prescriptions and 46 percent of sales are generated in this socalled genericseligible market.
Germany has evolved into the world’s most genericsfriendly country. Original products often lose almost their entire market share to generic drugs within a few months after a patent expires. An average of 87 percent of prescriptions and 76 percent of sales in the genericseligible market were generated by imitation products in 2013.
Since the introduction of indirect price regulation based on reference prices, more and more drugs have been subject to this measure. Almost 80 percent of all pharmaceuticals prescribed in Germany must currently adhere to this regulation. However, the share of pharmaceutical sales subject to reference prices has decreased in recent years, above all due to persistent reductions in reference prices.
As of December 2014, a total of around 32,000 pharmaceutical products were subject to the regulation. As a result, the statutory health insurance funds saved around EUR 6.9 billion in 2014.
Pharmaceutical prices hardly changed up until 2003, at which point they began to decrease significantly. Pharmaceuticals are now 15 percent cheaper than they were in 2000. In contrast, overall prices for consumer goods and services for private consumption have increased by almost 24 percent since 2000.
30
35
40
45
50
55
60
65
80
75
70
90
85
Reference prices in the SHI marketShare in percent
Source: GKV, vfa, GamSi (since 2006)
Sales
Prescriptions
2002 2004 2006 2008 2010 2012 2014

20
GermanyGermany’s pharmaceutical industry continues to rely predominantly on exports: Of all the drugs manufactured in Germany, almost twothirds are now exported. Production has increased by almost 5 percent in the past year. The industry is among the most productive economic sectors: The net value added per employee is EUR 115,000, a figure significantly higher than in comparable industries within Germany.
After the USA, Germany is now the world’s most important location for industryfunded clinical trials and has become a major financier and driver of innovation for academic institutions.
Production of pharmaceutical products in Germany
EUR billion
2014: provisional dataSource: destatis
2022242628
3230
Change over the previous year (in percent)
–5
0
5
10
15
2.30.2 0.8
4.6
10.6
1.6–2.5
8.4
3.5 2.84.8
0.2
2002 201420122010200820062004
2002 201420122010200820062004
5
Due to various types of regulations, the domestic pharmaceutical market has lost its significance for German pharmaceutical manufacturers in the long term. However, the export market has become ever more important. The export share of drugs produced in Germany has more than doubled over the last 15 years. Only in the last two years have domestic sales regained some significance.
In 2014, pharmaceuticals worth EUR 30.5 billion were produced in Germany – an increase of 5 percent over the previous year.
60
40
20
0
Export share of pharmaceutical manufacturersin Germany
Foreign sales as a percentage of total sales
2014: provisional dataSource: destatis
30.5
1995
47.9
2000
62.5
2010 2014
65.9
2005
53.3
Manufacturing sector
Pharmaceutical sector
120
110
100
902002 2006 20142008 2010 20122000 2004
Producer pricesFor pharmaceutical products
2000 = 100
Source: destatis
In 2014, producer prices for pharmaceutical products consistently remained at a low level. Pharmaceutical drugs are now less expensive than they were in 2000, whereas prices for other industrial products have risen by 20 percent since 2000.

21
2013
2014
Employees in the pharmaceutical industry
Rhineland-Palatinate 2013: Employee total includes Bremen (for statistical reasons)Source: destatis
11,879
n.a.n.a.
27,368
27,549
12,141
11,962
1,614
1,5983,052
2,992
1,0664,452
4,623
8,9859,1
514,844
4,912
5,6535,924
7,504
7,811
1,192
1,228
19,739
20,448
11,279
626n.a.
n.a.
Rhineland-Palatinate
Saarland
Baden-Wuerttemberg
North Rhine-Westphalia
Thuringia Saxony
BrandenburgSaxony-Anhalt
Berlin
Mecklenburg-Western Pomerania
Lower Saxony
Schleswig-Holstein
Bavaria
Hamburg
Hessen
With capital spending at only 3.1 percent of sales, the pharmaceutical industry is below the average for industry as a whole in 2013. Governmental interventions in recent years, including the price freeze at 2009 levels and mandatory rebates of up to 16 percent, are significant factors in this development.
Net added value per employee in EUR 1,000
As of: 2013Source: destatis
Pharmaceutical industry
Chemical industry
Automobile manufacturing
83
Mechanical engineering
70
Electrical engineering
70
Manufacturing industry (total)
66
120100806040200
115
Added value
93
2 431
As of: 2013Source: destatis
As a percent of sales
3.8
3.7
3.2
Automobile manufacturing
Chemical industry
Manufacture of DV equipment, electronic and optical products
Manufacturing industry (total)
Pharmaceutical industry
Mechanical engineering 2.7
0
Capital expenditures
3.8
3.1
Japan 307
Poland 274
Number of industry-initiated clinical studies:A country comparison
Source: vfa, based on the study register of clincaltrials.gov; as of: August 2015
Germany 693
3,250
3,000
2,750
750
500
250
0
2009 2010 2011 2012 2013 2014
USA 2,903
UK 664
France 519
India 78
Russia 206
Spain 441
Italy 355
China 242
The net added value of EUR 115,000 per employee in 2013 makes the pharmaceutical industry one of the best performing and most productive sectors in Germany.

22
The vfaThe number of people employed at vfa member companies rose significantly over the past year after a slight decline in 2014. Although the number of employees involved in research and development again showed a modest decrease, they still represent a high share (over 20 percent) of
the total workforce of the companies. On the other hand, investments in buildings and machinery (longterm assets such as research laboratories and production facilities) rose sharply again and have reached 2005 levels.
The researchbased pharmaceutical companies of the vfa have been a stabilizing factor during the economic crisis. Again in 2014, investment in longterm fixedassets increased significantly over the previous year (from EUR 1.12 billion to EUR 1.27 billion).
R&D expenditures of vfa member companiesIn EUR billion
2014 5.1
2013 5.6
0 1 32 4 5
2014: provisional dataSource: Stifterverband, vfa
2012 5.3
2011 4.9
2010 5.1
2005 4.2
Employees of vfa member companiesNumber
2014: provisional dataSource: vfa member survey, Stifterverband
2014 77,576
2013
2012 77,070
2011 77,533
2010 78,133
2005 91,922
18,266
18,287
18,005
15,943
76,014
Employees (total) R&D employees
0 20,000 60,00040,000 80,000
16,328
16,083
2014 1,270
0 500 1.000 1,500
Capital expenditures of vfa member companiesIn EUR million
Data after 2013 based on membership status on January 1, 2015; 2014: provisional dataSource: vfa member survey, Stifterverband
2012 920
2011 907
2010 1,065
2005 1,270
2013 1,116
23
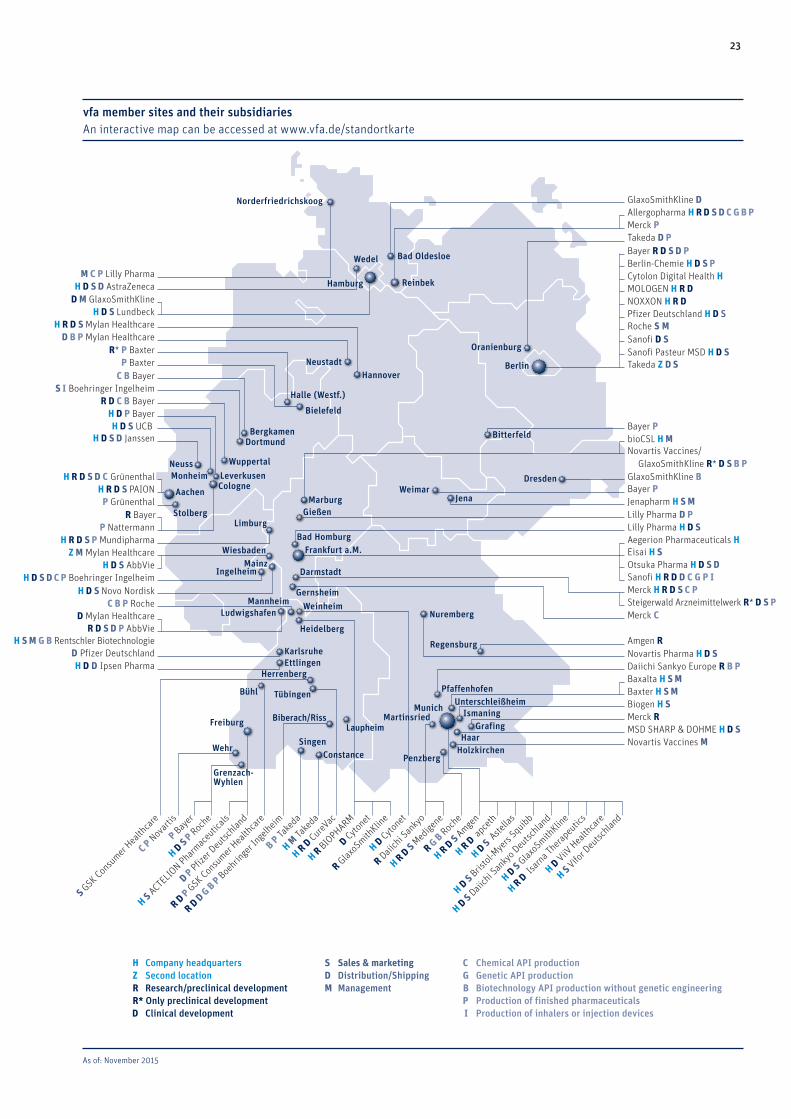
H Company headquarters Z Second location R Research/preclinical development R* Only preclinical development D Clinical development
S Sales & marketing D Distribution/Shipping M Management
C Chemical API production G Genetic API production B Biotechnology API production without genetic engineering P Production of finished pharmaceuticals I Production of inhalers or injection devices
As of: November 2015
H D S D C P Boehringer Ingelheim
Bayer P
MSD SHARP & DOHME H D SNovartis Vaccines M
M C P Lilly PharmaH D S D AstraZeneca
Sanofi Pasteur MSD H D STakeda Z D S
Bayer P GlaxoSmithKline B
Novartis Vaccines/GlaxoSmithKline R* D S B P
bioCSL H M
Merck H R D S C P
Merck C
Novartis Pharma H D SAmgen R
Baxalta H S M
Biogen H S Baxter H S M
Merck R
R* P Baxter
C B BayerS I Boehringer Ingelheim
R D C B BayerH D P BayerH D S UCB
H D S D Janssen
P GrünenthalH R D S PAION
P NattermannH R D S P Mundipharma
H D S AbbVie
H D S Novo Nordisk
Z M Mylan Healthcare
R D S D P AbbVieD Mylan Healthcare
P Bayer
C P Novarti
s
S GSK Consumer
Health
care
H D S P Roche
H S ACTELION Pharm
aceu
ticals
D P Pfizer
Deutsc
hland
R D P GSK Consumer
Health
care
R D D G B P Boehrin
ger I
ngelheim
B P Take
da
H M Ta
keda
H R D CureVac
D Cytonet
R GlaxoSmith
Kline
H D Cytonet
R Daiich
i San
kyo
R G B Roche
H R D S Amgen
H R D apce
th
H D S Aste
llas
H D S Bristol-M
yers
Squibb
H D S Daiich
i San
kyo Deu
tschlan
d
H D S GlaxoSmith
Kline
H R D Isarn
a Thera
peutic
s
H S Vifor D
eutsc
hland
H D ViiV Hea
lthca
re
R Bayer
H S M G B Rentschler Biotechnologie
D M GlaxoSmithKlineH D S Lundbeck
H R D S Mylan HealthcareD B P Mylan Healthcare
P Baxter
Norderfriedrichskoog
Bad Oldesloe
ReinbekHamburg
Wedel
NeustadtHannover
BergkamenDortmund
Wuppertal
Leverkusen
Stolberg
Aachen
MonheimNeuss
Limburg
Wiesbaden
IngelheimMainz
LudwigshafenMannheim
Heidelberg
Gernsheim
Darmstadt
Frankfurt a.M.Bad Homburg
GießenMarburg
KarlsruheEttlingen
Herrenberg
TübingenBühl
Freiburg
Wehr
Grenzach-Wyhlen
Biberach/RissLaupheim
SingenConstance
MunichMartinsried
Penzberg
HaarGrafing
Ismaning
Pfaffenhofen
Regensburg
Nuremberg
Dresden
JenaWeimar
Bitterfeld
Berlin
Oranienburg
Holzkirchen
Weinheim
Unterschleißheim
Halle (Westf.)
Bielefeld
Steigerwald Arzneimittelwerk R* D S P
Lilly Pharma D PLilly Pharma H D SAegerion Pharmaceuticals HEisai H S
Jenapharm H S M
Otsuka Pharma H D S DSanofi H R D D C G P I
H R D S D C Grünenthal
C B P Roche
H R D S Med
igene
Daiichi Sankyo Europe R B P
H R BIOPHARM
Sanofi D SRoche S M
Cytolon Digital Health H
GlaxoSmithKline DAllergopharma H R D S D C G B PMerck PTakeda D PBayer R D S D PBerlin-Chemie H D S P
MOLOGEN H R DNOXXON H R D Pfizer Deutschland H D S
D Pfizer DeutschlandH D D Ipsen Pharma
vfa member sites and their subsidiariesAn interactive map can be accessed at www.vfa.de/standortkarte
Cologne

24
Member companies Associate members

Imprint
Published byVerband Forschender Arzneimittelhersteller e.V.(German Association of Research-Based Pharmaceutical Companies)Hausvogteiplatz 1310117 Berlin, Germany
PrintingRuksaldruckBerlin, Germany
Designadlerschmidt kommunikationsdesignBerlin, Germany
Photo credits Title: Getty ImagesP. 1: vfa
UpdatedNovember 2015
For more information, please visit:www.vfa.de
We look forward to your feedback. Please direct any questions or comments to: [email protected]

vfaHausvogteiplatz 13 10117 Berlin, GermanyPhone +49 30 206 040Fax +49 30 206 04222www.vfa.de