statistics 52w high/low (myr) pay-tv, radio, publications
TRANSCRIPT
1.13
July 14, 2021
Bro
adcast
ing
Mala
ysi
a
THIS REPORT HAS BEEN PREPARED BY MAYBANK INVESTMENT BANK BERHAD
SEE PAGE 11 FOR IMPORTANT DISCLOSURES AND ANALYST CERTIFICATIONS
PP16832/01/2013 (031128)
Tear Sheet Insert
Yin Shao Yang [email protected] (603) 2297 8916
Astro Malaysia (ASTRO MK)
Will losing streak to pirates turn for the better?
Maintain BUY with tad higher MYR1.36 DCF-based TP
A 24 May 2021 ruling that the sale of TV boxes with pirated content is
illegal is a potentially positive turning point for ASTRO. Every MYR100m
of TV subscription revenue recouped will accrete MYR51m to our
earnings estimates and 10sen to our TP. Our FY22E/FY23E/FY24E core net
profit estimates are raised a tad by +10%/+4%/+4% on lower-than-
expected depreciation and amortisation. Consequently, our DCF-based TP
is raised by only 2% to MYR1.36. Maintain BUY call.
Lost ¼ of TV subscription revenue in the last 5 years
ASTRO’s TV subscription revenue peaked at MYR4.4b in FY1/16A but
dwindled by 26% to MYR3.2b five years later. Fortunately, core net profit
dwindled by a narrower 20% due to aggressive cost rationalisation. The
aforementioned was largely due to more Malaysians buying TV boxes with
pirated content while terminating their legitimate ASTRO accounts. TV
boxes with pirated content are sold openly on e-commerce platforms like
Lazada and Shopee and Facebook Marketplace.
24 May 2021 ruling a positive turning point?
The Intellectual Property High Court Kuala Lumpur ruled on 24 May 2021
that the sale of TV boxes with pirated content is illegal. With this ruling,
ASTRO is approaching e-commerce and social media platforms to cease
the sale of TV boxes with pirated content especially theirs. It is hoped
that Malaysians who terminated their ASTRO accounts in favour of TV
boxes will eventually re-subscribe to ASTRO should TV boxes be
increasingly difficult to source.
A lot of upside should anti-piracy efforts succeed
We estimate that every MYR100m of TV subscription revenue that ASTRO
recoups will accrete MYR51m to our core net profit estimates and 10sen
to our DCF-based TP. In the event that ASTRO recoups all, albeit
unlikely, of the MYR1.1b TV subscription revenue it lost over the last 5
years, we estimate that the accretion to our core net profit estimates
will be a whopping c.MYR550m and accretion to our DCF-based TP will be
c.MYR1.10.
Share Price MYR 1.13
12m Price Target MYR 1.36 (+26%)
Previous Price Target MYR 1.33
BUY
Company Description
Statistics
52w high/low (MYR)
3m avg turnover (USDm)
Free float (%)
Issued shares (m)
Market capitalisation
Major shareholders:
41.3%
20.7%
8.7%
5,215
1.9
Astro Malaysia is an integrated consumer media
entertainment group in Malaysia with operations in
Pay-TV, Radio, Publications and Digital Media.
Krishnan Tatparanandam Ananda
Khazanah Nasional Bhd.
Harapan Terus Sdn. Bhd.
1.25/0.72
35.5
MYR5.9B
USD1.4B
Price Performance
50
60
70
80
90
100
110
120
130
140
0.70
0.80
0.90
1.00
1.10
1.20
1.30
1.40
1.50
1.60
Jul-19 Oct-19 Jan-20 Apr-20 Jul-20 Oct-20 Jan-21 Apr-21
Astro Malaysia - (LHS, MYR)
Astro Malaysia / Kuala Lumpur Composite Index - (RHS, %)
-1M -3M -12M
Absolute (%) (2) 13 39
Relative to index (%) 2 19 46
Source: FactSet
FYE Jan (MYR m) FY20A FY21A FY22E FY23E FY24E
Revenue 4,912 4,360 4,212 4,330 4,452
EBITDA 1,723 1,472 1,304 1,443 1,418
Core net profit 656 534 419 503 507
Core FDEPS (sen) 12.6 10.2 8.0 9.6 9.7
Core FDEPS growth(%) 16.3 (18.7) (21.7) 20.0 0.8
Net DPS (sen) 7.5 8.0 6.0 7.0 7.0
Core FD P/E (x) 9.5 8.3 14.1 11.8 11.7
P/BV (x) 7.3 4.1 5.0 4.5 4.0
Net dividend yield (%) 6.3 9.4 5.3 6.2 6.2
ROAE (%) 90.9 55.8 37.1 40.1 36.4
ROAA (%) 10.5 8.9 7.4 9.0 9.5
EV/EBITDA (x) 5.5 4.9 6.5 5.8 5.3
Net gearing (%) (incl perps) 339.1 239.2 201.0 174.6 107.6
Consensus net profit - - 559 574 590
MKE vs. Consensus (%) - - (24.9) (12.3) (14.0)
July 14, 2021 2
Astro Malaysia
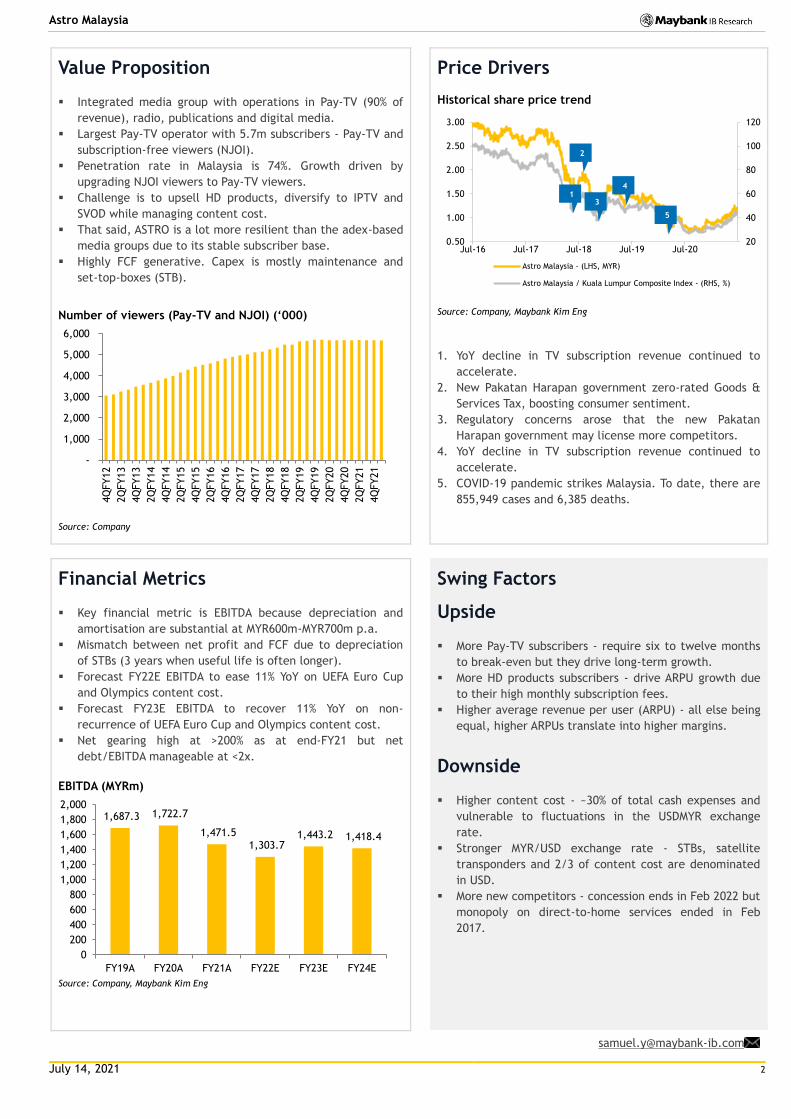
Value Proposition
Integrated media group with operations in Pay-TV (90% of
revenue), radio, publications and digital media.
Largest Pay-TV operator with 5.7m subscribers - Pay-TV and
subscription-free viewers (NJOI).
Penetration rate in Malaysia is 74%. Growth driven by
upgrading NJOI viewers to Pay-TV viewers.
Challenge is to upsell HD products, diversify to IPTV and
SVOD while managing content cost.
That said, ASTRO is a lot more resilient than the adex-based
media groups due to its stable subscriber base.
Highly FCF generative. Capex is mostly maintenance and
set-top-boxes (STB).
Number of viewers (Pay-TV and NJOI) (‘000)
Source: Company
Price Drivers
Historical share price trend
Source: Company, Maybank Kim Eng
1. YoY decline in TV subscription revenue continued to
accelerate.
2. New Pakatan Harapan government zero-rated Goods &
Services Tax, boosting consumer sentiment.
3. Regulatory concerns arose that the new Pakatan
Harapan government may license more competitors.
4. YoY decline in TV subscription revenue continued to
accelerate.
5. COVID-19 pandemic strikes Malaysia. To date, there are
855,949 cases and 6,385 deaths.
Financial Metrics
Key financial metric is EBITDA because depreciation and
amortisation are substantial at MYR600m-MYR700m p.a.
Mismatch between net profit and FCF due to depreciation
of STBs (3 years when useful life is often longer).
Forecast FY22E EBITDA to ease 11% YoY on UEFA Euro Cup
and Olympics content cost.
Forecast FY23E EBITDA to recover 11% YoY on non-
recurrence of UEFA Euro Cup and Olympics content cost.
Net gearing high at >200% as at end-FY21 but net
debt/EBITDA manageable at <2x.
EBITDA (MYRm)
Source: Company, Maybank Kim Eng
Swing Factors
Upside
More Pay-TV subscribers - require six to twelve months
to break-even but they drive long-term growth.
More HD products subscribers - drive ARPU growth due
to their high monthly subscription fees.
Higher average revenue per user (ARPU) - all else being
equal, higher ARPUs translate into higher margins.
Downside
Higher content cost - ~30% of total cash expenses and
vulnerable to fluctuations in the USDMYR exchange
rate.
Stronger MYR/USD exchange rate - STBs, satellite
transponders and 2/3 of content cost are denominated
in USD.
More new competitors - concession ends in Feb 2022 but
monopoly on direct-to-home services ended in Feb
2017.
-
1,000
2,000
3,000
4,000
5,000
6,000
4Q
FY12
2Q
FY13
4Q
FY13
2Q
FY14
4Q
FY14
2Q
FY15
4Q
FY15
2Q
FY16
4Q
FY16
2Q
FY17
4Q
FY17
2Q
FY18
4Q
FY18
2Q
FY19
4Q
FY19
2Q
FY20
4Q
FY20
2Q
FY21
4Q
FY21
20
40
60
80
100
120
0.50
1.00
1.50
2.00
2.50
3.00
Jul-16 Jul-17 Jul-18 Jul-19 Jul-20
Astro Malaysia - (LHS, MYR)
Astro Malaysia / Kuala Lumpur Composite Index - (RHS, %)
1,687.3 1,722.7
1,471.5
1,303.7 1,443.2 1,418.4
0
200
400
600
800
1,000
1,200
1,400
1,600
1,800
2,000
FY19A FY20A FY21A FY22E FY23E FY24E
1
2
3
5
4
July 14, 2021 3
Astro Malaysia
Risk Rating & Score¹ 16.1 (Low)
Score Momentum² +0.0
Last Updated 14 Apr 2021
Controversy Score³ (Updated: 10 Aug 2016)
1 – Customer Incidents – Quality & Safety
Business Model & Industry Issues
Being a media company, ASTRO does not have a large environmental footprint. That said, we opine that it has a large positive
social footprint.
We note three social positives:- (i) ASTRO broadcasts thousands of hours of public service announcements every year; (ii)
ASTRO is a major provider of education to the less privileged; and (iii) ASTRO is a major employer of local talent.
In our opinion, ASTRO’s large positive social footprint not only puts it in good stead to renew its concession come Feb 2022
but also cements its position as the leading media company in Malaysia.
To be sure, ASTRO does carry out related party transactions (RPT) as it leases satellite transponders from MEASAT Global
which is 70%-owned by Ananda Krishnan.
That said, we do not believe the aforementioned RPTs are detrimental to minority shareholders. All in all, we rate ASTRO’s
ESG credential as commendable.
Material E issues
Generated 1.7m kWH of renewable energy in CY20 from
solar panels, equating to 964 tCO2e of GHG avoidance.
Usage of solar panels helped reduce greenhouse gas
emissions by 2% to 25,423 tCO2e in CY20.
Its usage also helped reduce electricity and energy
consumption by 2% to 33m kWh in CY20.
Installed 13,500 litre capacity rainwater harvesting system
and motion-sensor water taps and toilet flushing systems.
Key G metrics and issues
BOD comprises 3 Independent Non-Executive Directors
(INED) (including Chairman) and 5 Non-Independent Non-
Executive Directors (NINED).
Largest shareholder, Usaha Tegas which is owned by
Ananda Krishnan, represented by 2 NINEDs.
Major shareholders, Khazanah Nasional and Employees
Provident Fund, represented by 1 NINED each.
3 of the 8 BOD members are women. 40% of senior
management are women.
FY1/21 directors’ remuneration accounted for 3% of
FY1/21 net profit.
PricewaterhouseCoopers PLT is the independent auditor.
They have been appointed for >10 years.
There are 3 BOD level committees and they are all
chaired by INEDs.
Audit & Risk Committee comprises 2 INEDs and 1 NINED.
Nomination, Remuneration & Corporate Governance
Committee comprises 2 INEDs and 1 NINED.
Strategy & Business Transformation Committee comprises
2 INEDs and 2 NINEDs.
Only major RPT entered into is the leasing of satellite
transponders from MEASAT Global which is 70%-owned by
Ananda Krishnan.
That said, base fee rate of USD2m per transponder per
year has not changed in >10 years.
Other than the above, there have been no large related
party transactions.
Occasionally fined by the Malaysian Communications and
Multimedia Commission (MCMC).
That said, the fines were for infractions which were
minor, in our view.
Suffered two data breaches in 2018 and 2019 but they
compromised <2% of its customers’ details.
Took steps to improve the security measures of their
information technology network.
Also reported the data breaches to the MCMC,
Department of Personal Data Protection and police.
Material S issues
Broadcasted c.16,000 hours of public service
announcements in FY1/21.
Invested >MYR320m to commission and produce c.9,000
hours of local content in FY1/21.
Provides complimentary access to 16 learning channels to
all government schools, 76 paediatric and oncology wards
and schools in hospitals in Malaysia.
Provides hostel accommodation for students proximate to
three remote schools in Sabah and Sarawak.
Provides complimentary access to three 24-hour academic
learning channels on its Pay-TV and NJOI platforms.
Holds Astro Kem Badminton annually to unearth and
cultivate badminton prodigies.
Also hosts the national Astro Junior Championships, an
Under 15 mixed team badminton competition.
Made available complimentary channels to customers and
streaming service to all Malaysians during the MCO.
Suspended disconnections during MCO, provided rebates
and offered instalment plans and account suspensions.
Invested 22,415 hours to upskill and reskill employees in
FY1/21, averaging 5 hours per employee.
Ratio of male: female employees balanced. Of its 4,490
employees as at end-FY1/21, 51% are women.
Invested MYR4m in community projects in FY1/21.
¹Risk Rating & Score - derived by Sustainalytics and assesses the company’s exposure to unmanaged ESG risks. Scores range between 0 - 50 in order of increasing severity with low/high scores & ratings representing negligible/significant risk to the company’s enterprise value, respectively, from ESG-driven financial impacts. ²Score Momentum - indicates changes to the company's score since the last update – a negative integer indicates a company’s improving risk score; a positive integer indicates a deterioration. ³Controversy Score - reported periodically by Sustainalytics in the event of material ESG-related incident(s), with the impact severity scores of these events ranging from Category 0-5 (0 - no reports; 1 - negligible risks; ...; 5 - poses serious risks & indicative of potential structural deficiencies at the company).
July 14, 2021 4
Astro Malaysia
Lost ¼ of TV subscription revenue in the last 5 years
Over the last three months, ASTRO has been making ‘waves’ by announcing that
not only is it tying up with international subscription video on demand (SVOD)
operators, Disney+Hotstar and Netflix (NFLX US, Not Rated); it also launched its
own standalone SVOD product, Sooka that targets Malay ‘millennials’. Yet, we
gather that most of the investment community overlooked an equally, if not
more, important development on 24 May 2021 when the Intellectual Property
High Court Kuala Lumpur ruled that the sale of TV boxes with pirated content is
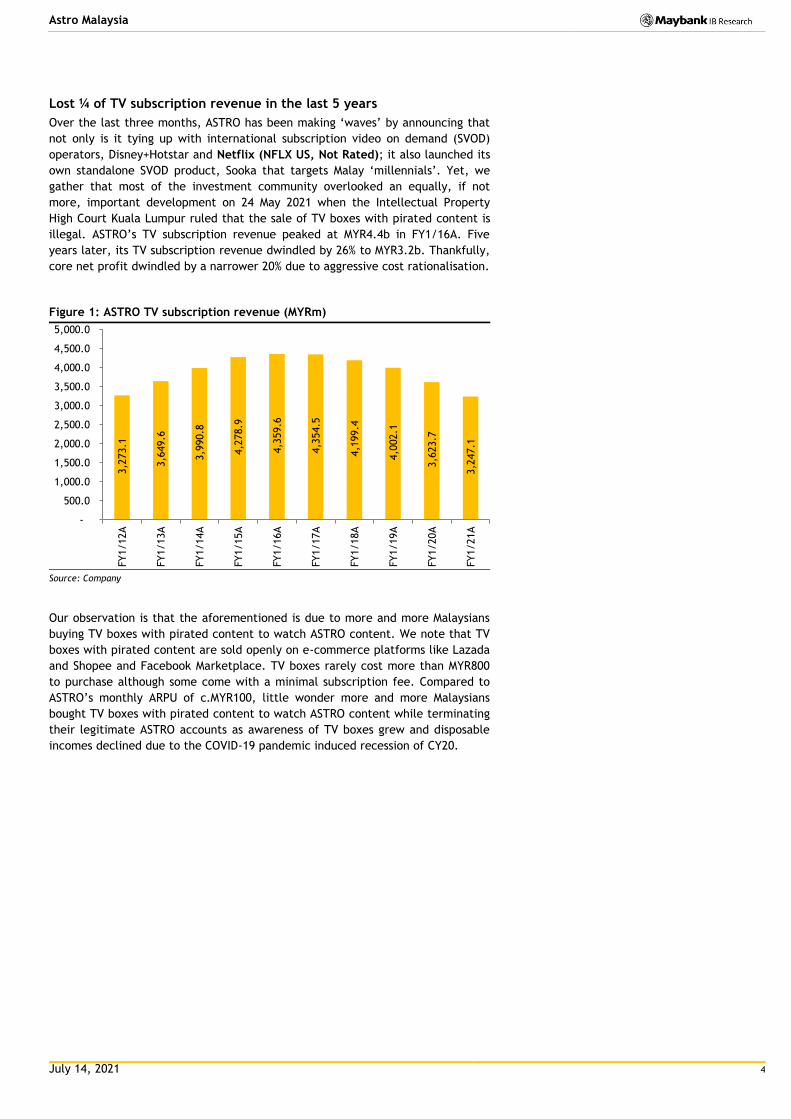
illegal. ASTRO’s TV subscription revenue peaked at MYR4.4b in FY1/16A. Five
years later, its TV subscription revenue dwindled by 26% to MYR3.2b. Thankfully,
core net profit dwindled by a narrower 20% due to aggressive cost rationalisation.
Figure 1: ASTRO TV subscription revenue (MYRm)
Source: Company
Our observation is that the aforementioned is due to more and more Malaysians
buying TV boxes with pirated content to watch ASTRO content. We note that TV
boxes with pirated content are sold openly on e-commerce platforms like Lazada
and Shopee and Facebook Marketplace. TV boxes rarely cost more than MYR800
to purchase although some come with a minimal subscription fee. Compared to
ASTRO’s monthly ARPU of c.MYR100, little wonder more and more Malaysians
bought TV boxes with pirated content to watch ASTRO content while terminating
their legitimate ASTRO accounts as awareness of TV boxes grew and disposable
incomes declined due to the COVID-19 pandemic induced recession of CY20.
3,2
73.1
3,6
49.6
3,9
90.8
4,2
78.9
4,3
59.6
4,3
54.5
4,1
99.4
4,0
02.1
3,6
23.7
3,2
47.1
-
500.0
1,000.0
1,500.0
2,000.0
2,500.0
3,000.0
3,500.0
4,000.0
4,500.0
5,000.0
FY1/12A
FY1/13A
FY1/14A
FY1/15A
FY1/16A
FY1/17A
FY1/18A
FY1/19A
FY1/20A
FY1/21A
July 14, 2021 5
Astro Malaysia
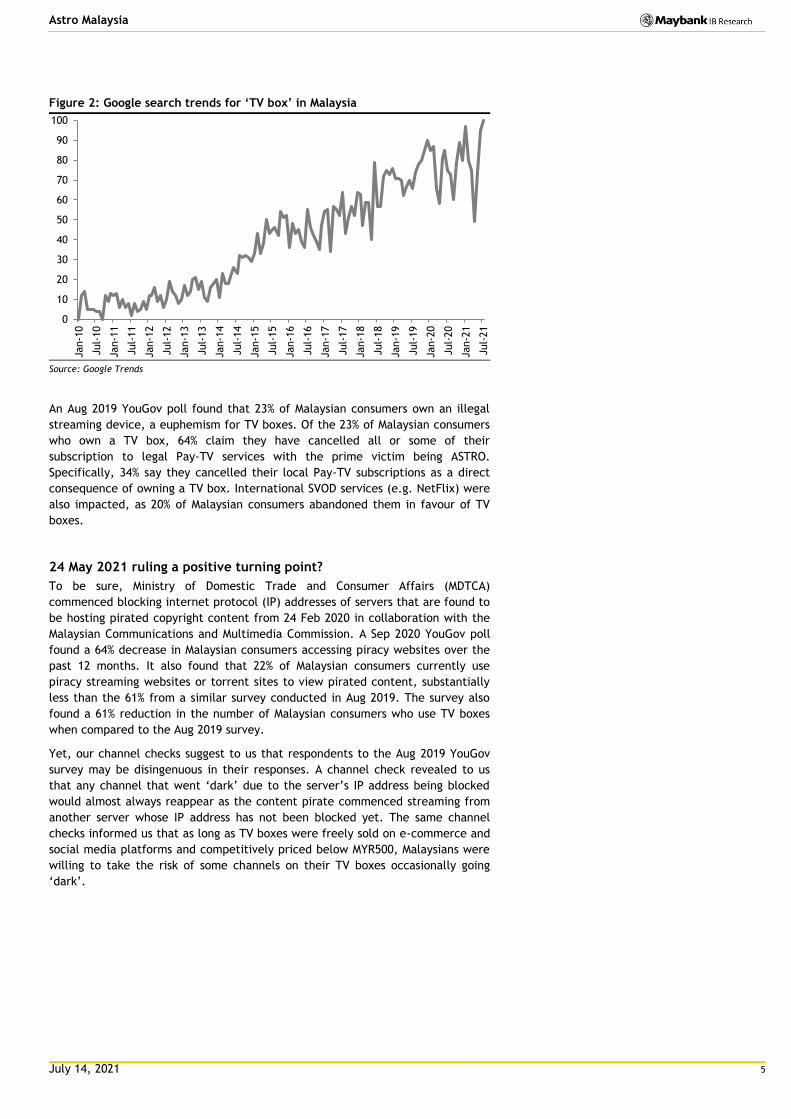
Figure 2: Google search trends for ‘TV box’ in Malaysia
Source: Google Trends
An Aug 2019 YouGov poll found that 23% of Malaysian consumers own an illegal
streaming device, a euphemism for TV boxes. Of the 23% of Malaysian consumers
who own a TV box, 64% claim they have cancelled all or some of their
subscription to legal Pay-TV services with the prime victim being ASTRO.
Specifically, 34% say they cancelled their local Pay-TV subscriptions as a direct
consequence of owning a TV box. International SVOD services (e.g. NetFlix) were
also impacted, as 20% of Malaysian consumers abandoned them in favour of TV
boxes.
24 May 2021 ruling a positive turning point?
To be sure, Ministry of Domestic Trade and Consumer Affairs (MDTCA)
commenced blocking internet protocol (IP) addresses of servers that are found to
be hosting pirated copyright content from 24 Feb 2020 in collaboration with the
Malaysian Communications and Multimedia Commission. A Sep 2020 YouGov poll
found a 64% decrease in Malaysian consumers accessing piracy websites over the
past 12 months. It also found that 22% of Malaysian consumers currently use
piracy streaming websites or torrent sites to view pirated content, substantially
less than the 61% from a similar survey conducted in Aug 2019. The survey also
found a 61% reduction in the number of Malaysian consumers who use TV boxes
when compared to the Aug 2019 survey.
Yet, our channel checks suggest to us that respondents to the Aug 2019 YouGov
survey may be disingenuous in their responses. A channel check revealed to us
that any channel that went ‘dark’ due to the server’s IP address being blocked
would almost always reappear as the content pirate commenced streaming from
another server whose IP address has not been blocked yet. The same channel
checks informed us that as long as TV boxes were freely sold on e-commerce and
social media platforms and competitively priced below MYR500, Malaysians were
willing to take the risk of some channels on their TV boxes occasionally going
‘dark’.
0
10
20
30
40
50
60
70
80
90
100
Jan-1
0
Jul-
10
Jan-1
1
Jul-
11
Jan-1
2
Jul-
12
Jan-1
3
Jul-
13
Jan-1
4
Jul-
14
Jan-1
5
Jul-
15
Jan-1
6
Jul-
16
Jan-1
7
Jul-
17
Jan-1
8
Jul-
18
Jan-1
9
Jul-
19
Jan-2
0
Jul-
20
Jan-2
1
Jul-
21
July 14, 2021 6
Astro Malaysia
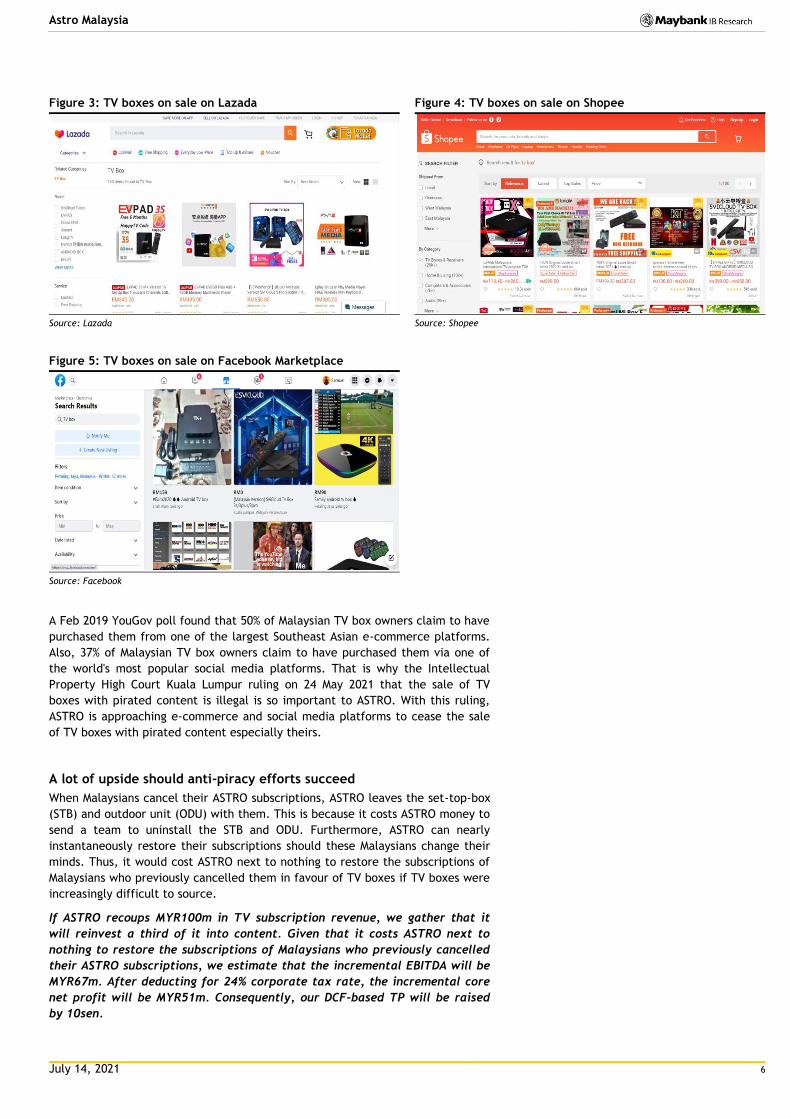
Figure 3: TV boxes on sale on Lazada
Source: Lazada
Figure 4: TV boxes on sale on Shopee
Source: Shopee
Figure 5: TV boxes on sale on Facebook Marketplace
Source: Facebook
A Feb 2019 YouGov poll found that 50% of Malaysian TV box owners claim to have
purchased them from one of the largest Southeast Asian e-commerce platforms.
Also, 37% of Malaysian TV box owners claim to have purchased them via one of
the world's most popular social media platforms. That is why the Intellectual
Property High Court Kuala Lumpur ruling on 24 May 2021 that the sale of TV
boxes with pirated content is illegal is so important to ASTRO. With this ruling,
ASTRO is approaching e-commerce and social media platforms to cease the sale
of TV boxes with pirated content especially theirs.
A lot of upside should anti-piracy efforts succeed
When Malaysians cancel their ASTRO subscriptions, ASTRO leaves the set-top-box
(STB) and outdoor unit (ODU) with them. This is because it costs ASTRO money to
send a team to uninstall the STB and ODU. Furthermore, ASTRO can nearly
instantaneously restore their subscriptions should these Malaysians change their
minds. Thus, it would cost ASTRO next to nothing to restore the subscriptions of
Malaysians who previously cancelled them in favour of TV boxes if TV boxes were
increasingly difficult to source.
If ASTRO recoups MYR100m in TV subscription revenue, we gather that it
will reinvest a third of it into content. Given that it costs ASTRO next to
nothing to restore the subscriptions of Malaysians who previously cancelled
their ASTRO subscriptions, we estimate that the incremental EBITDA will be
MYR67m. After deducting for 24% corporate tax rate, the incremental core
net profit will be MYR51m. Consequently, our DCF-based TP will be raised
by 10sen.
July 14, 2021 7
Astro Malaysia
Over the last 5 years, ASTRO lost MYR1.1.b in TV subscription revenue. In the
event that it recoups all of it, we estimate that the incremental core net profit
will be a whopping c.MYR550m and accretion to our DCF-based TP will be
c.MYR1.10. Essentially, ASTRO’s share price will double if it recoups all the TV
subscription revenue it lost over the last 5 years. That said, we are unsure if this
is achievable given that the advent of 5G technology will likely make it easier for
ASTRO’s content to be pirated some other hitherto unknown way. We have heard
of interesting anecdotes of pirates simulcasting major sporting events directly to
viewers’ hand phones without the need for a TV box.
For now, our FY22E/FY23E/FY24E EBITDA estimates are relatively unchanged at
+0%/-2%/-2% on housekeeping changes. Our FY22E/FY23E/FY24E core net profit
estimates are raised a tad by +10%/+4%/+4% only on lower-than-expected
depreciation and amortisation. Consequently, our DCF-based TP is raised by only
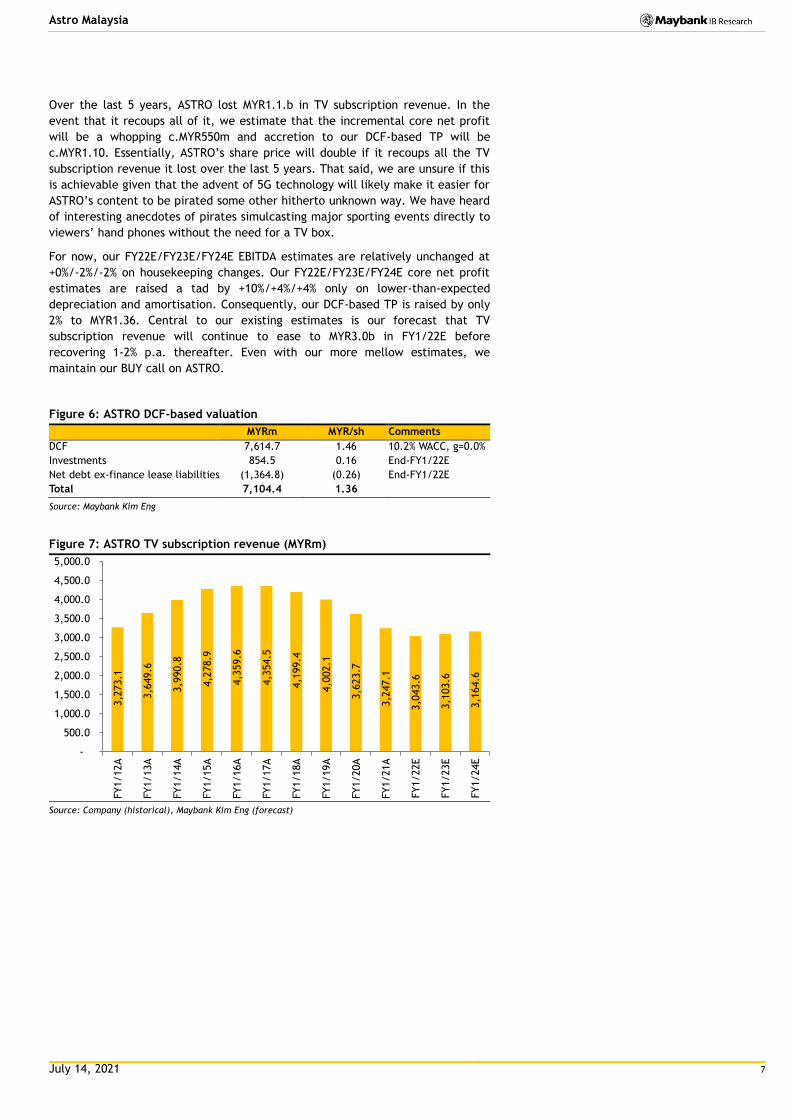
2% to MYR1.36. Central to our existing estimates is our forecast that TV
subscription revenue will continue to ease to MYR3.0b in FY1/22E before
recovering 1-2% p.a. thereafter. Even with our more mellow estimates, we
maintain our BUY call on ASTRO.
Figure 6: ASTRO DCF-based valuation
MYRm MYR/sh Comments
DCF 7,614.7 1.46 10.2% WACC, g=0.0%
Investments 854.5 0.16 End-FY1/22E
Net debt ex-finance lease liabilities (1,364.8) (0.26) End-FY1/22E
Total 7,104.4 1.36
Source: Maybank Kim Eng
Figure 7: ASTRO TV subscription revenue (MYRm)
Source: Company (historical), Maybank Kim Eng (forecast)
3,2
73.1
3,6
49.6
3,9
90.8
4,2
78.9
4,3
59.6
4,3
54.5
4,1
99.4
4,0
02.1
3,6
23.7
3,2
47.1
3,0
43.6
3,1
03.6
3,1
64.6
-
500.0
1,000.0
1,500.0
2,000.0
2,500.0
3,000.0
3,500.0
4,000.0
4,500.0
5,000.0
FY1/12A
FY1/13A
FY1/14A
FY1/15A
FY1/16A
FY1/17A
FY1/18A
FY1/19A
FY1/20A
FY1/21A
FY1/22E
FY1/23E
FY1/24E
July 14, 2021 8
Astro Malaysia
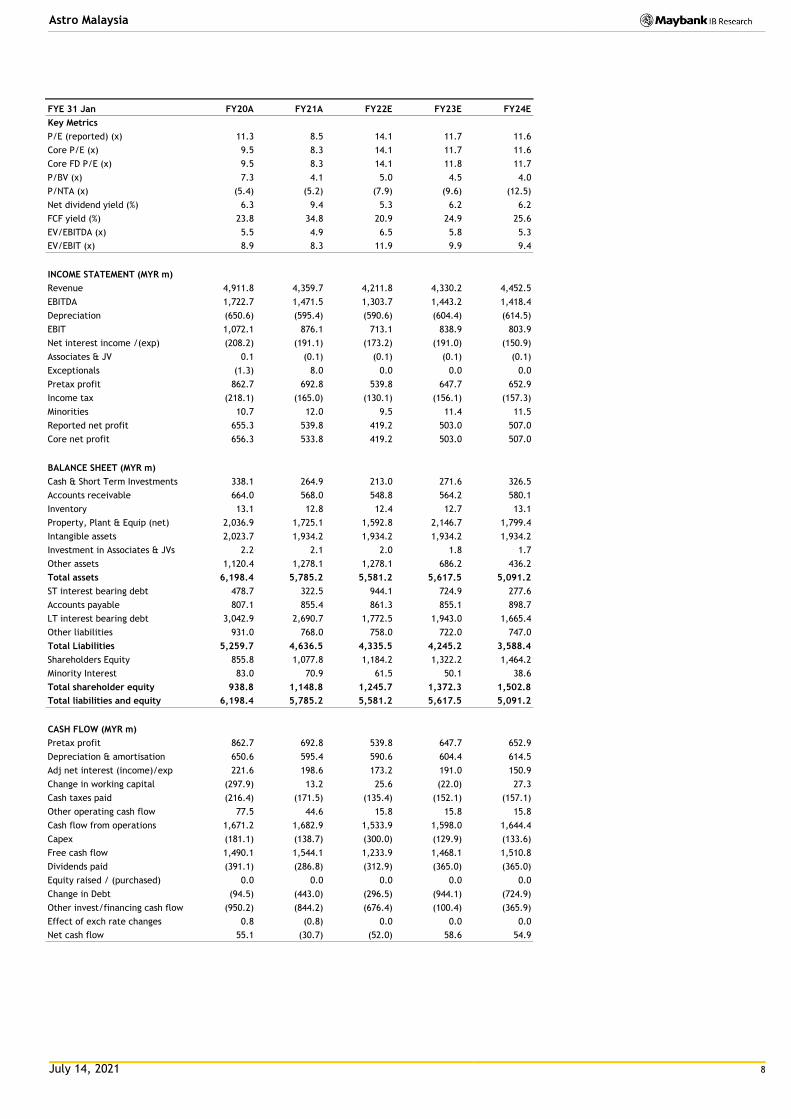
FYE 31 Jan FY20A FY21A FY22E FY23E FY24E
Key Metrics
P/E (reported) (x) 11.3 8.5 14.1 11.7 11.6
Core P/E (x) 9.5 8.3 14.1 11.7 11.6
Core FD P/E (x) 9.5 8.3 14.1 11.8 11.7
P/BV (x) 7.3 4.1 5.0 4.5 4.0
P/NTA (x) (5.4) (5.2) (7.9) (9.6) (12.5)
Net dividend yield (%) 6.3 9.4 5.3 6.2 6.2
FCF yield (%) 23.8 34.8 20.9 24.9 25.6
EV/EBITDA (x) 5.5 4.9 6.5 5.8 5.3
EV/EBIT (x) 8.9 8.3 11.9 9.9 9.4
INCOME STATEMENT (MYR m)
Revenue 4,911.8 4,359.7 4,211.8 4,330.2 4,452.5
EBITDA 1,722.7 1,471.5 1,303.7 1,443.2 1,418.4
Depreciation (650.6) (595.4) (590.6) (604.4) (614.5)
EBIT 1,072.1 876.1 713.1 838.9 803.9
Net interest income /(exp) (208.2) (191.1) (173.2) (191.0) (150.9)
Associates & JV 0.1 (0.1) (0.1) (0.1) (0.1)
Exceptionals (1.3) 8.0 0.0 0.0 0.0
Pretax profit 862.7 692.8 539.8 647.7 652.9
Income tax (218.1) (165.0) (130.1) (156.1) (157.3)
Minorities 10.7 12.0 9.5 11.4 11.5
Reported net profit 655.3 539.8 419.2 503.0 507.0
Core net profit 656.3 533.8 419.2 503.0 507.0
BALANCE SHEET (MYR m)
Cash & Short Term Investments 338.1 264.9 213.0 271.6 326.5
Accounts receivable 664.0 568.0 548.8 564.2 580.1
Inventory 13.1 12.8 12.4 12.7 13.1
Property, Plant & Equip (net) 2,036.9 1,725.1 1,592.8 2,146.7 1,799.4
Intangible assets 2,023.7 1,934.2 1,934.2 1,934.2 1,934.2
Investment in Associates & JVs 2.2 2.1 2.0 1.8 1.7
Other assets 1,120.4 1,278.1 1,278.1 686.2 436.2
Total assets 6,198.4 5,785.2 5,581.2 5,617.5 5,091.2
ST interest bearing debt 478.7 322.5 944.1 724.9 277.6
Accounts payable 807.1 855.4 861.3 855.1 898.7
LT interest bearing debt 3,042.9 2,690.7 1,772.5 1,943.0 1,665.4
Other liabilities 931.0 768.0 758.0 722.0 747.0
Total Liabilities 5,259.7 4,636.5 4,335.5 4,245.2 3,588.4
Shareholders Equity 855.8 1,077.8 1,184.2 1,322.2 1,464.2
Minority Interest 83.0 70.9 61.5 50.1 38.6
Total shareholder equity 938.8 1,148.8 1,245.7 1,372.3 1,502.8
Total liabilities and equity 6,198.4 5,785.2 5,581.2 5,617.5 5,091.2
CASH FLOW (MYR m)
Pretax profit 862.7 692.8 539.8 647.7 652.9
Depreciation & amortisation 650.6 595.4 590.6 604.4 614.5
Adj net interest (income)/exp 221.6 198.6 173.2 191.0 150.9
Change in working capital (297.9) 13.2 25.6 (22.0) 27.3
Cash taxes paid (216.4) (171.5) (135.4) (152.1) (157.1)
Other operating cash flow 77.5 44.6 15.8 15.8 15.8
Cash flow from operations 1,671.2 1,682.9 1,533.9 1,598.0 1,644.4
Capex (181.1) (138.7) (300.0) (129.9) (133.6)
Free cash flow 1,490.1 1,544.1 1,233.9 1,468.1 1,510.8
Dividends paid (391.1) (286.8) (312.9) (365.0) (365.0)
Equity raised / (purchased) 0.0 0.0 0.0 0.0 0.0
Change in Debt (94.5) (443.0) (296.5) (944.1) (724.9)
Other invest/financing cash flow (950.2) (844.2) (676.4) (100.4) (365.9)
Effect of exch rate changes 0.8 (0.8) 0.0 0.0 0.0
Net cash flow 55.1 (30.7) (52.0) 58.6 54.9
July 14, 2021 9
Astro Malaysia
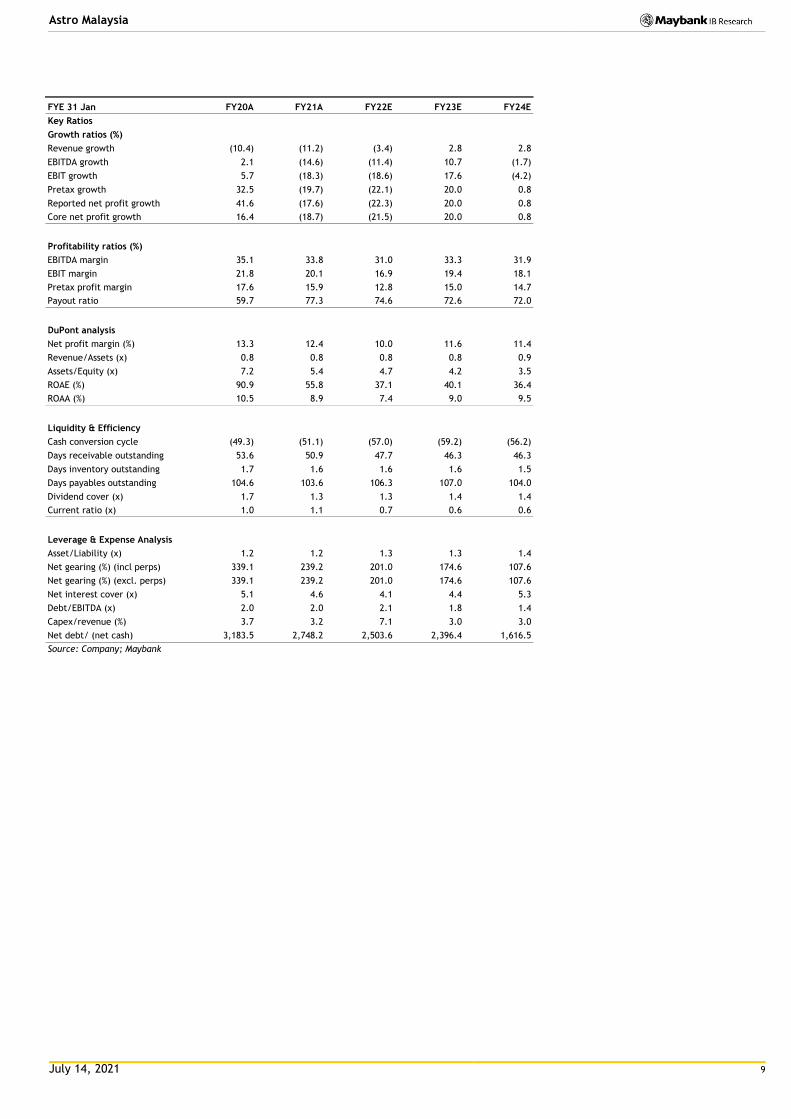
FYE 31 Jan FY20A FY21A FY22E FY23E FY24E
Key Ratios
Growth ratios (%)
Revenue growth (10.4) (11.2) (3.4) 2.8 2.8
EBITDA growth 2.1 (14.6) (11.4) 10.7 (1.7)
EBIT growth 5.7 (18.3) (18.6) 17.6 (4.2)
Pretax growth 32.5 (19.7) (22.1) 20.0 0.8
Reported net profit growth 41.6 (17.6) (22.3) 20.0 0.8
Core net profit growth 16.4 (18.7) (21.5) 20.0 0.8
Profitability ratios (%)
EBITDA margin 35.1 33.8 31.0 33.3 31.9
EBIT margin 21.8 20.1 16.9 19.4 18.1
Pretax profit margin 17.6 15.9 12.8 15.0 14.7
Payout ratio 59.7 77.3 74.6 72.6 72.0
DuPont analysis
Net profit margin (%) 13.3 12.4 10.0 11.6 11.4
Revenue/Assets (x) 0.8 0.8 0.8 0.8 0.9
Assets/Equity (x) 7.2 5.4 4.7 4.2 3.5
ROAE (%) 90.9 55.8 37.1 40.1 36.4
ROAA (%) 10.5 8.9 7.4 9.0 9.5
Liquidity & Efficiency
Cash conversion cycle (49.3) (51.1) (57.0) (59.2) (56.2)
Days receivable outstanding 53.6 50.9 47.7 46.3 46.3
Days inventory outstanding 1.7 1.6 1.6 1.6 1.5
Days payables outstanding 104.6 103.6 106.3 107.0 104.0
Dividend cover (x) 1.7 1.3 1.3 1.4 1.4
Current ratio (x) 1.0 1.1 0.7 0.6 0.6
Leverage & Expense Analysis
Asset/Liability (x) 1.2 1.2 1.3 1.3 1.4
Net gearing (%) (incl perps) 339.1 239.2 201.0 174.6 107.6
Net gearing (%) (excl. perps) 339.1 239.2 201.0 174.6 107.6
Net interest cover (x) 5.1 4.6 4.1 4.4 5.3
Debt/EBITDA (x) 2.0 2.0 2.1 1.8 1.4
Capex/revenue (%) 3.7 3.2 7.1 3.0 3.0
Net debt/ (net cash) 3,183.5 2,748.2 2,503.6 2,396.4 1,616.5
Source: Company; Maybank
July 14, 2021 10
Astro Malaysia
Research Offices
ECONOMICS
Suhaimi ILIAS Chief Economist Malaysia | Philippines | Global (603) 2297 8682 [email protected]
CHUA Hak Bin Regional Thematic Macroeconomist (65) 6231 5830 [email protected]
LEE Ju Ye Singapore | Thailand | Indonesia (65) 6231 5844 [email protected]
Linda LIU Singapore | Vietnam | Cambodia | Myanmar | Laos (65) 6231 5847 [email protected]
Dr Zamros DZULKAFLI (603) 2082 6818 [email protected]
Ramesh LANKANATHAN (603) 2297 8685 [email protected]
FX
Saktiandi SUPAAT Head of FX Research (65) 6320 1379 [email protected]
Christopher WONG (65) 6320 1347 [email protected]
TAN Yanxi (65) 6320 1378 [email protected]
Fiona LIM (65) 6320 1374 [email protected]
STRATEGY
Anand PATHMAKANTHAN
ASEAN (603) 2297 8783 [email protected]
FIXED INCOME
Winson PHOON, ACA (65) 6340 1079 [email protected]
SE THO Mun Yi (603) 2074 7606 [email protected]
REGIONAL EQUITIES
Anand PATHMAKANTHAN Head of Regional Equity Research (603) 2297 8783 [email protected]
WONG Chew Hann, CA Head of ASEAN Equity Research (603) 2297 8686 [email protected]
ONG Seng Yeow Research, Technology & Innovation (65) 6231 5839 [email protected]
MALAYSIA
Anand PATHMAKANTHAN Head of Research (603) 2297 8783 [email protected] • Strategy
WONG Chew Hann (603) 2297 8686
[email protected] • Non-Bank Financials (stock exchange) • Construction & Infrastructure
Desmond CH’NG, BFP, FCA (603) 2297 8680 [email protected] • Banking & Finance
LIAW Thong Jung (603) 2297 8688 [email protected] • Oil & Gas Services- Regional • Automotive
ONG Chee Ting, CA (603) 2297 8678 [email protected] • Plantations - Regional
YIN Shao Yang, CPA (603) 2297 8916 [email protected] • Gaming – Regional • Media • Aviation • Non-Bank Financials
TAN Chi Wei, CFA (603) 2297 8690 [email protected] • Power • Telcos
WONG Wei Sum, CFA (603) 2297 8679 [email protected] • Property • Glove
Kevin WONG (603) 2082 6824 [email protected] • REITs • Technology
Jade TAM (603) 2297 8687 [email protected] • Consumer Staples & Discretionary
Fahmi FARID (603) 2297 8676 [email protected] • Software
TEE Sze Chiah Head of Retail Research (603) 2082 6858 [email protected]
Nik Ihsan RAJA ABDULLAH, MSTA, CFTe (603) 2297 8694 [email protected] • Chartist
Amirah AZMI (603) 2082 8769 [email protected] • Retail Research
INDIA
Jigar SHAH Head of Research (91) 22 4223 2632 [email protected] • Strategy • Oil & Gas • Automobile • Cement
Neerav DALAL (91) 22 4223 2606 [email protected] • Software Technology • Telcos
Vikram RAMALINGAM (91) 22 4223 2607 [email protected] • Automobile • Media
SINGAPORE
Thilan WICKRAMASINGHE Head of Research (65) 6231 5840 [email protected] • Banking & Finance - Regional • Consumer
CHUA Su Tye (65) 6231 5842 [email protected] • REITs - Regional
LAI Gene Lih, CFA (65) 6231 5832 [email protected] • Technology • Healthcare
Kareen CHAN (65) 6231 5926 [email protected] • Transport • Telcos • Consumer
Eric ONG (65) 6231 5924 [email protected] • SMIDs
Matthew SHIM (65) 6231 5929 [email protected]
• Retail Research
PHILIPPINES
Jacqui de JESUS Head of Research (63) 2 8849 8840 [email protected] • Strategy • Conglomerates
Rachelleen RODRIGUEZ, CFA (63) 2 8849 8843 [email protected] • Banking & Finance • Transport • Telcos
Benedict CLEMENTE (63) 2 8849 8846 [email protected] • Utilities
Daphne SZE (63) 2 8849 8847 [email protected] • Consumer
VIETNAM
Quan Trong Thanh Head of Research (84 28) 44 555 888 ext 8184 [email protected] • Banks
Hoang Huy, CFA (84 28) 44 555 888 ext 8181 [email protected] • Strategy • Technology
Le Nguyen Nhat Chuyen (84 28) 44 555 888 ext 8082 [email protected] • Oil & Gas
Nguyen Thi Sony Tra Mi (84 28) 44 555 888 ext 8084 [email protected] • Consumer
Tyler Manh Dung Nguyen (84 28) 44 555 888 ext 8085 [email protected] • Utilities • Property
Tran Thi Thu Thao (84 28) 44 555 888 ext 8180 [email protected] • Industrials
Nguyen Thi Ngan Tuyen Head of Retail Research (84 28) 44 555 888 ext 8081 [email protected] • Retail Research
Nguyen Thanh Lam (84 28) 44 555 888 ext 8086 [email protected] • Technical Analysis
INDONESIA
Isnaputra ISKANDAR Head of Research (62) 21 8066 8680 [email protected] • Strategy • Metals & Mining • Cement • Autos • Consumer • Utility
Rahmi MARINA (62) 21 8066 8689 [email protected] • Banking & Finance
Willy GOUTAMA (62) 21 8066 8500 [email protected] • Consumer
Farah OKTAVIANI (62) 21 8066 8691 [email protected] • Construction
THAILAND
Maria LAPIZ Head of Institutional Research
Dir (66) 2257 0250 | (66) 2658 6300 ext 1399 [email protected] • Strategy • Consumer • Materials • Services
Jesada TECHAHUSDIN, CFA (66) 2658 6300 ext 1395 [email protected] • Banking & Finance
Kaushal LADHA, CFA (66) 2658 6300 ext 1392 [email protected] • Oil & Gas – Regional • Petrochemicals - Regional • Utilities
Vanida GEISLER, CPA (66) 2658 6300 ext 1394 [email protected] • Property • REITs
Yuwanee PROMMAPORN (66) 2658 6300 ext 1393 Yuwanee.P @maybank-ke.co.th • Services • Healthcare
Ekachai TARAPORNTIP Head of Retail Research (66) 2658 5000 ext 1530 [email protected]
Surachai PRAMUALCHAROENKIT (66) 2658 5000 ext 1470 [email protected] • Auto • Conmat • Contractor • Steel
Suttatip PEERASUB (66) 2658 5000 ext 1430 [email protected] • Food & Beverage • Commerce
Jaroonpan WATTANAWONG (66) 2658 5000 ext 1404 [email protected] • Transportation • Small cap
Thanatphat SUKSRICHAVALIT (66) 2658 5000 ext 1401 [email protected] • Media • Electronics
Wijit ARAYAPISIT (66) 2658 5000 ext 1450 [email protected] • Strategist
Theerasate PROMPONG
(66) 2658 5000 ext 1400 [email protected] • Equity Portfolio Strategist
Apiwat TAVESIRIVATE (66) 2658 5000 ext 1310 [email protected] • Chartist and TFEX
July 14, 2021 11
Astro Malaysia
APPENDIX I: TERMS FOR PROVISION OF REPORT, DISCLAIMERS AND DISCLOSURES
DISCLAIMERS This research report is prepared for general circulation and for information purposes only and under no circumstances should it be considered or intended as an offer to sell or a solicitation of an offer to buy the securities referred to herein. Investors should note that values of such securities, if any, may fluctuate and that each security’s price or value may rise or fall. Opinions or recommendations contained herein are in form of technical ratings and fundamental ratings. Technical ratings may differ from fundamental ratings as technical valuations apply different methodologies and are purely based on price and volume-related information extracted from the relevant jurisdiction’s stock exchange in the equity analysis. Accordingly, investors’ returns may be less than the original sum invested. Past performance is not necessarily a guide to future performance. This report is not intended to provide personal investment advice and does not take into account the specific investment objectives, the financial situation and the particular needs of persons who may receive or read this report. Inves tors should therefore seek financial, legal and other advice regarding the appropriateness of investing in any securities or the investment strategies discussed or recommended in this report.
The information contained herein has been obtained from sources believed to be reliable but such sources have not been independently verified by Maybank Investment Bank Berhad, its subsidiary and affiliates (collectively, “MKE”) and consequently no representation is made as to the accuracy or completeness of this report by MKE and it should not be relied upon as such. Accordingly, MKE and its officers, directors, associates, connected parties and/or employees (collectively, “Representatives”) shall not be liable for any direct, indirect or consequential losses or damages that may arise from the use or reliance of this report. Any information, opinions or recommendations contained herein are subject to change at any time, without prior notice.
This report may contain forward looking statements which are often but not always identified by the use of words such as “anticipate”, “believe”, “estimate”, “intend”, “plan”, “expect”, “forecast”, “predict” and “project” and statements that an event or result “may”, “will”, “can”, “should”, “could” or “might” occur or be achieved and other similar expressions. Such forward looking statements are based on assumptions made and information currently available to us and are subject to certain risks and uncertainties that could cause the actual results to differ materially from those expressed in any forward looking statements. Readers are cautioned not to place undue relevance on these forward-looking statements. MKE expressly disclaims any obligation to update or revise any such forward looking statements to reflect new information, events or circumstances af ter the date of this publication or to reflect the occurrence of unanticipated events.
MKE and its officers, directors and employees, including persons involved in the preparation or issuance of this report, may, to the extent permitted by law, from time to time participate or invest in financing transactions with the issuer(s) of the securities mentioned in this report, perform services for or solicit business from such issuers, and/or have a position or holding, or other material interest, or effect transactions, in such securities or options thereon, or other investments related thereto. In addition, it may make markets in the securities mentioned in the material presented in this report. One or more directors, officers and/or employees of MKE may be a director of the issue rs of the securities mentioned in this report to the extent permitted by law.
This report is prepared for the use of MKE’s clients and may not be reproduced, altered in any way, transmitted to, copied or distributed to any other party in whole or in part in any form or manner without the prior express written consent of MKE and MKE and its Representatives accepts no liability whatsoever for the actions of third parties in this respect.
This report is not directed to or intended for distribution to or use by any person or entity who is a citizen or resident of or located in any locality, state, country or other jurisdiction where such distribution, publication, availability or use would be contrary to law or regulation. This report is for distribution only under such circumstances as may be permitted by applicable law. The securities described herein may not be eligible for sale in all jurisdictions or to certain categories of investors. Without prejudice to the foregoing, the reader is to note that additional disclaimers, warnings or qualifications may apply based on geographical location of the person or entity receiving this report.
Malaysia Opinions or recommendations contained herein are in the form of technical ratings and fundamental ratings. Technical ratings may differ from fundamental ratings as technical valuations apply different methodologies and are purely based on price and volume-related information extracted from Bursa Malaysia Securities Berhad in the equity analysis.
Singapore This report has been produced as of the date hereof and the information herein may be subject to change. Maybank Kim Eng Research Pte. Ltd. (“Maybank KERPL”) in Singapore has no obligation to update such information for any recipient. For distribution in Singapore, recipients of this report are to contact Maybank KERPL in Singapore in respect of any matters arising from, or in connection with, this report. If the recipient of this report is not an accredited investor, expert investor or i nstitutional investor (as defined under Section 4A of the Singapore Securities and Futures Act), Maybank KERPL shall be legally liable for the contents of this report, with such liability being limited to the extent (if any) as permitted by law.
Thailand Except as specifically permitted, no part of this presentation may be reproduced or distributed in any manner without the pr ior written permission of Maybank Kim Eng Securities (Thailand) Public Company Limited. Maybank Kim Eng Securities (Thailand) Public Company Limited (“MBKET”) accepts no liability whatsoever for the actions of third parties in this respect.
Due to different characteristics, objectives and strategies of institutional and retail investors, the research products of MBKET Institutional and Retail Research departments may differ in either recommendation or target price, or both. MBKET reserves the rights to disseminate MBKET Retail Research reports to institutional investors who have requested to receive it. If you are an authorised recipient, you hereby tacitly acknowledge that the research reports from MBKET Retail Research are first pr oduced in Thai and there is a time lag in the release of the translated English version.
The disclosure of the survey result of the Thai Institute of Directors Association (“IOD”) regarding corporate governance is made pursuant to the policy of the Office of the Securities and Exchange Commission. The survey of the IOD is based on the information of a company listed on the Stock Exchange of Thailand and the market for Alternative Investment disclosed to the public and able to be accessed by a general public investor. The result, therefore, is from the perspective of a third party. It is not an evaluation of operation and is not based on inside information. The survey result is as of the date appearing in the Corporate Governance Report of Thai Listed Companies. As a result, the survey may be changed after that date. MBKET does not confirm nor certify the accuracy of such survey result.
The disclosure of the Anti-Corruption Progress Indicators of a listed company on the Stock Exchange of Thailand, which is assessed by Thaipat Institute, is made in order to comply with the policy and sustainable development plan for the listed companies of the Office of the Securities and Exchange Commission. Tha ipat Institute made this assessment based on the information received from the listed company, as stipulated in the form for the assessment of Anti-corruption which refers to the Annual Registration Statement (Form 56-1), Annual Report (Form 56-2), or other relevant documents or reports of such listed company. The assessment result is therefore made from the perspective of Thaipat Institute that is a third party. It is not an assessment of operation and is not based on any inside information. Since this assessment is only the assessment result as of the date appearing in the assessment result, it may be changed after that date or when there is any change to the relevant information. Nevertheless, MBKET does not confirm, verify, or certify the accuracy and completeness of the assessment result.
US This third-party research report is distributed in the United States (“US”) to Major US Institutional Investors (as defined in Rule 15a-6 under the Securities Exchange Act of 1934, as amended) only by Maybank Kim Eng Securities USA Inc (“Maybank KESUSA”), a broker-dealer registered in the US (registered under Section 15 of the Securities Exchange Act of 1934, as amended). All responsibility for the distribution of this report by Maybank KESUSA in the US shall be borne by Maybank KESUSA. This report is not directed at you if MKE is prohibited or restricted by any legislation or regulation in any jurisdiction from making it available to you. You should satisfy yourself before reading it that Maybank KESUSA is permitted to provide research material concerning investments to you under relevant legislation and regulations. All U.S. persons receiving and/or accessing this report and wishing to effect transactions in any security mentioned within must do so with: Maybank Kim Eng Securities USA Inc. 400 Park Avenue, 11th Floor, New York, New York 10022, 1-(212) 688-8886 and not with, the issuer of this report.
July 14, 2021 12
Astro Malaysia
Disclosure of Interest
Malaysia: MKE and its Representatives may from time to time have positions or be materially interested in the securities referred to he rein and may further act as market maker or may have assumed an underwriting commitment or deal with such securities and may also perform or seek to perform investment banking services, advisory and other services for or relating to those companies. Singapore: As of 14 July 2021, Maybank KERPL and the covering analyst do not have any interest in any companies recommended in this research report. Thailand: MBKET may have a business relationship with or may possibly be an issuer of derivative warrants on the securities /companies mentioned in the research report. Therefore, Investors should exercise their own judgment before making any investment decisions. MBKET, its associates, directors, connec ted parties and/or employees may from time to time have interests and/or underwriting commitments in the securities mentioned in this report. Hong Kong: As of 14 July 2021, KESHK and the authoring analyst do not have any interest in any companies recommended in this research report. India: As of 14 July 2021, and at the end of the month immediately preceding the date of publication of the research report, KESI, authoring analyst or their associate / relative does not hold any financial interest or any actual or beneficial ownership in any shares or having any conflict of interest in the sub ject companies except as otherwise disclosed in the research report.
In the past twelve months KESI and authoring analyst or their associate did not receive any compensation or other benefits fr om the subject companies or third party in connection with the research report on any account what so ever except as otherwise disclosed in the research report.
MKE may have, within the last three years, served as manager or co-manager of a public offering of securities for, or currently may make a primary market in issues of, any or all of the entities mentioned in this report or may be providing, or have provided within the previous 12 months, significant advice or investment services in relation to the investment concerned or a related investment and may receive compensation for the services provided from the companies covered in this report.
OTHERS
Analyst Certification of Independence
The views expressed in this research report accurately reflect the analyst’s personal views about any and all of the subject securities or issuers; and no part of the research analyst’s compensation was, is or will be, directly or indirectly, related to the specific recommendations or views expressed in the report.
Reminder
Structured securities are complex instruments, typically involve a high degree of risk and are intended for sale only to sophisticated investors who are capable of understanding and assuming the risks involved. The market value of any structured security may be affected by changes in economic, financial and political factors (including, but not limited to, spot and forward interest and exchange rates), time to maturity, market conditions and volatility and the credit quality of any issuer or reference issuer. Any investor interested in purchasing a structured product should conduct its own analysis of the product and consult with its own professional advisers as to the risks involved in making s uch a purchase.
No part of this material may be copied, photocopied or duplicated in any form by any means or redistributed without the prior consent of MKE.
UK This document is being distributed by Maybank Kim Eng Securities (London) Ltd (“Maybank KESL”) which is authorized and regulated, by the Financial Conduct Authority and is for Informational Purposes only. This document is not intended for distribution to anyone defined as a Retail Client under the Financial Services and Markets Act 2000 within the UK. Any inclusion of a third party link is for the recipients convenience only, and that the firm does not take any responsibility for its comments or accuracy, and that access to such links is at the individuals own risk. Nothing in this report should be considered as constituting legal, accounting or tax advice, and that f or accurate guidance recipients should consult with their own independent tax advisers.
DISCLOSURES
Legal Entities Disclosures Malaysia: This report is issued and distributed in Malaysia by Maybank Investment Bank Berhad (15938- H) which is a Participating Organization of Bursa Malaysia Berhad and a holder of Capital Markets and Services License issued by the Securities Commission in Malaysia. Singapore: This report is distributed in Singapore by Maybank KERPL (Co. Reg No 198700034E) which is regulated by the Monetary Authority of Singapore. Indonesia: PT Maybank Kim Eng Securities (“PTMKES”) (Reg. No. KEP-251/PM/1992) is a member of the Indonesia Stock Exchange and is regulated by the Financial Services Authority (Indonesia). Thailand: MBKET (Reg. No.0107545000314) is a member of the Stock Exchange of Thailand and is regulated by the Ministry of Finance and the Securities and Exchange Commission. Philippines: Maybank ATRKES (Reg. No.01-2004-00019) is a member of the Philippines Stock Exchange and is regulated by the Securities and Exchange Commission. Vietnam: Maybank Kim Eng Securities Limited (License Number: 117/GP-UBCK) is licensed under the State Securities Commission of Vietnam. Hong Kong: KESHK (Central Entity No AAD284) is regulated by the Securities and Futures Commission. India: Kim Eng Securities India Private Limited (“KESI”) is a participant of the National Stock Exchange of India Limited and the Bombay Stock Exchange and is regulated by Securities and Exchange Board of India (“SEBI”) (Reg. No. INZ000010538). KESI is also registered with SEBI as Category 1 Merchant Banker (Reg. No. INM 000011708) and as Research Analyst (Reg No: INH000000057) US: Maybank KESUSA is a member of/ and is authorized and regulated by the FINRA – Broker ID 27861. UK: Maybank KESL (Reg No 2377538) is authorized and regulated by the Financial Conduct Authority.
July 14, 2021 13
Astro Malaysia
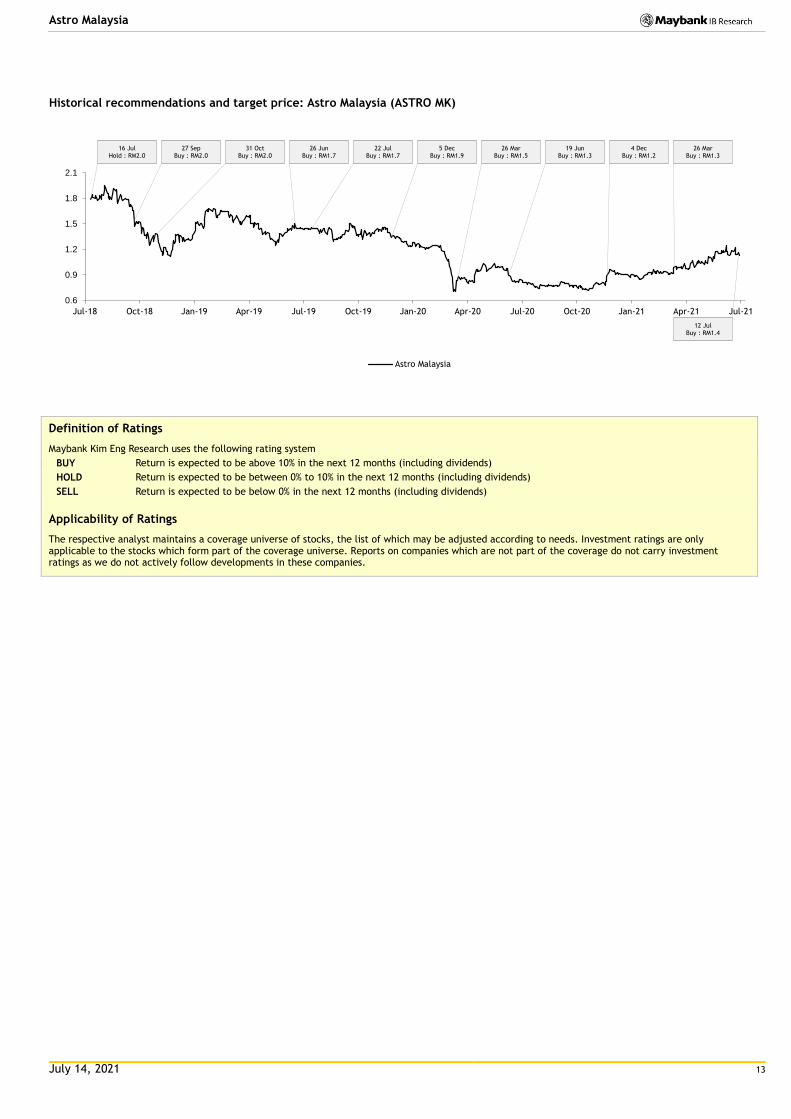
Historical recommendations and target price: Astro Malaysia (ASTRO MK)
Definition of Ratings
Maybank Kim Eng Research uses the following rating system
BUY Return is expected to be above 10% in the next 12 months (including dividends)
HOLD Return is expected to be between 0% to 10% in the next 12 months (including dividends)
SELL Return is expected to be below 0% in the next 12 months (including dividends)
Applicability of Ratings
The respective analyst maintains a coverage universe of stocks, the list of which may be adjusted according to needs. Investment ratings are only applicable to the stocks which form part of the coverage universe. Reports on companies which are not part of the coverage do not carry investment ratings as we do not actively follow developments in these companies.
0.6
0.9
1.2
1.5
1.8
2.1
Jul-18 Oct-18 Jan-19 Apr-19 Jul-19 Oct-19 Jan-20 Apr-20 Jul-20 Oct-20 Jan-21 Apr-21 Jul-21
Astro Malaysia
16 Jul Hold : RM2.0
27 Sep Buy : RM2.0
31 Oct Buy : RM2.0
26 Jun Buy : RM1.7
22 Jul Buy : RM1.7
5 Dec Buy : RM1.9
26 Mar Buy : RM1.5
19 Jun Buy : RM1.3
4 Dec Buy : RM1.2
26 Mar Buy : RM1.3
12 Jul Buy : RM1.4
July 14, 2021 14
Astro Malaysia
Malaysia Maybank Investment Bank Berhad
(A Participating Organisation of
Bursa Malaysia Securities Berhad)
33rd Floor, Menara Maybank,
100 Jalan Tun Perak,
50050 Kuala Lumpur
Tel: (603) 2059 1888;
Fax: (603) 2078 4194
Singapore Maybank Kim Eng Securities Pte Ltd
Maybank Kim Eng Research Pte Ltd
50 North Canal Road
Singapore 059304
Tel: (65) 6336 9090
London Maybank Kim Eng Securities
(London) Ltd
PNB House
77 Queen Victoria Street
London EC4V 4AY, UK
Tel: (44) 20 7332 0221
Fax: (44) 20 7332 0302
New York Maybank Kim Eng Securities USA
Inc
400 Park Avenue, 11th Floor
New York, New York 10022,
U.S.A.
Tel: (212) 688 8886
Fax: (212) 688 3500
Stockbroking Business:
Level 8, Tower C, Dataran Maybank,
No.1, Jalan Maarof
59000 Kuala Lumpur
Tel: (603) 2297 8888
Fax: (603) 2282 5136
Hong Kong Kim Eng Securities (HK) Ltd
28/F, Lee Garden Three,
1 Sunning Road, Causeway Bay,
Hong Kong
Tel: (852) 2268 0800
Fax: (852) 2877 0104
Indonesia PT Maybank Kim Eng Securities
Sentral Senayan III, 22nd Floor
Jl. Asia Afrika No. 8
Gelora Bung Karno, Senayan
Jakarta 10270, Indonesia
Tel: (62) 21 2557 1188
Fax: (62) 21 2557 1189
India Kim Eng Securities India Pvt Ltd
1101, 11th floor, A Wing, Kanakia
Wall Street, Chakala, Andheri -
Kurla Road, Andheri East,
Mumbai City - 400 093, India
Tel: (91) 22 6623 2600
Fax: (91) 22 6623 2604
Philippines Maybank ATR Kim Eng Securities Inc.
17/F, Tower One & Exchange Plaza
Ayala Triangle, Ayala Avenue
Makati City, Philippines 1200
Tel: (63) 2 8849 8888
Fax: (63) 2 8848 5738
Thailand Maybank Kim Eng Securities
(Thailand) Public Company Limited
999/9 The Offices at Central World,
20th - 21st Floor,
Rama 1 Road Pathumwan,
Bangkok 10330, Thailand
Tel: (66) 2 658 6817 (sales)
Tel: (66) 2 658 6801 (research)
Vietnam Maybank Kim Eng Securities Limited
4A-15+16 Floor Vincom Center Dong
Khoi, 72 Le Thanh Ton St. District 1
Ho Chi Minh City, Vietnam
Tel : (84) 844 555 888
Fax : (84) 8 38 271 030
Saudi Arabia In association with
Anfaal Capital
Ground Floor, KANOO Building
No.1 - Al-Faisaliyah,Madina Road,
P.O.Box 126575 Jeddah 21352
Kingdom of Saudi Arabia
Tel: (966) 920023423
South Asia Sales Trading Kevin Foy
Regional Head Sales Trading
Tel: (65) 6636-3620
US Toll Free: 1-866-406-7447
North Asia Sales Trading Andrew Lee
Tel: (852) 2268 0283
US Toll Free: 1 877 837 7635
Indonesia Iwan Atmadjaja [email protected] (62) 21 8066 8555
London Greg Smith [email protected] Tel: (44) 207-332-0221
New York James Lynch [email protected] Tel: (212) 688 8886
India Sanjay Makhija [email protected] Tel: (91)-22-6623-2629
Philippines Keith Roy [email protected] Tel: (63) 2 848-5288
www.maybank-ke.com | www.maybank-keresearch.com