statistics difficulty: hard
TRANSCRIPT
Head to savemyexams.co.uk for more awesome resources
Question Paper 4
StatisticsDifficulty: Hard
Time allowed: 107 minutes
Score: /93
Percentage: /100
Grade Boundaries:
CIE IGCSE Maths (0580)
CIE IGCSE Maths (0980)
Level IGCSE
Subject Maths (0580/0980)
Exam Board CIE
Topic Statistics
Paper Paper 4
Difficulty Hard
Booklet Question Paper 4
A* A B C D
>83% 67% 51% 41% 31%
9 8 7 6 5 4
>95% 87% 80% 69% 58% 46%
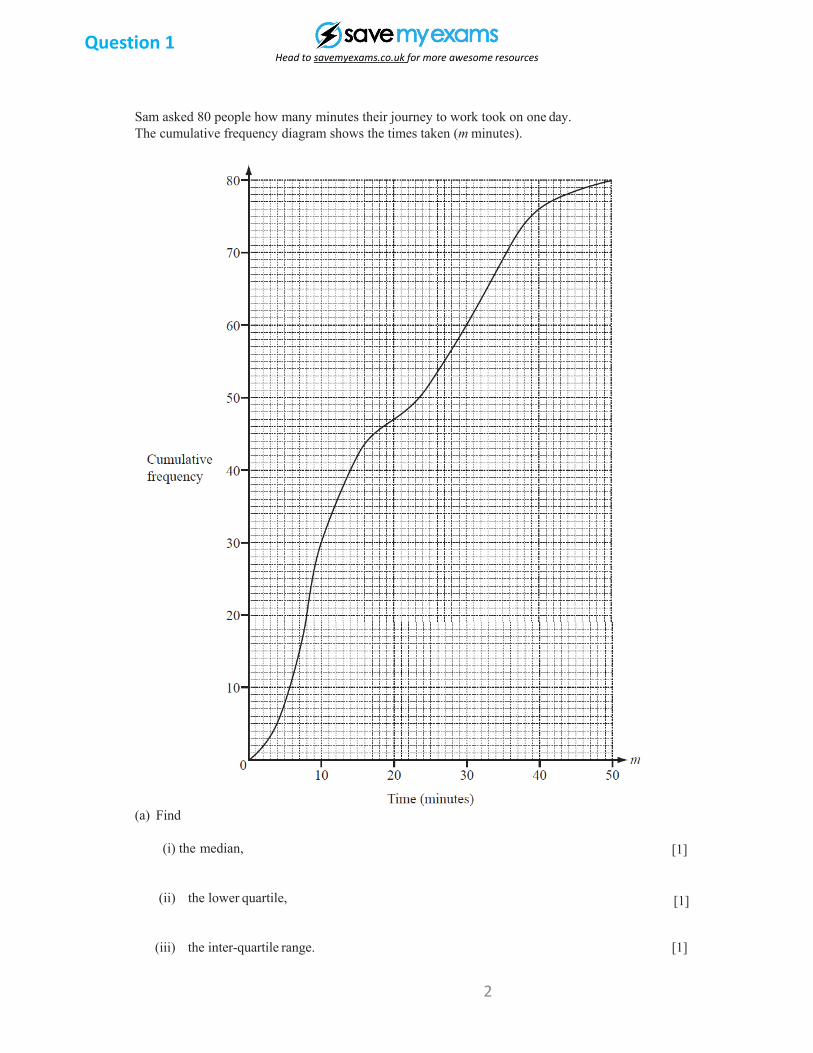
9 Sam asked 80 people how many minutes their journey to work took on one day. The cumulative frequency diagram shows the times taken (m minutes).
(a) Find
(i) the median,
(ii) the lower quartile,
(iii) the inter-quartile range. [1]
[1]
[1]
Question 1
2
Head to savemyexams.co.uk for more awesome resources
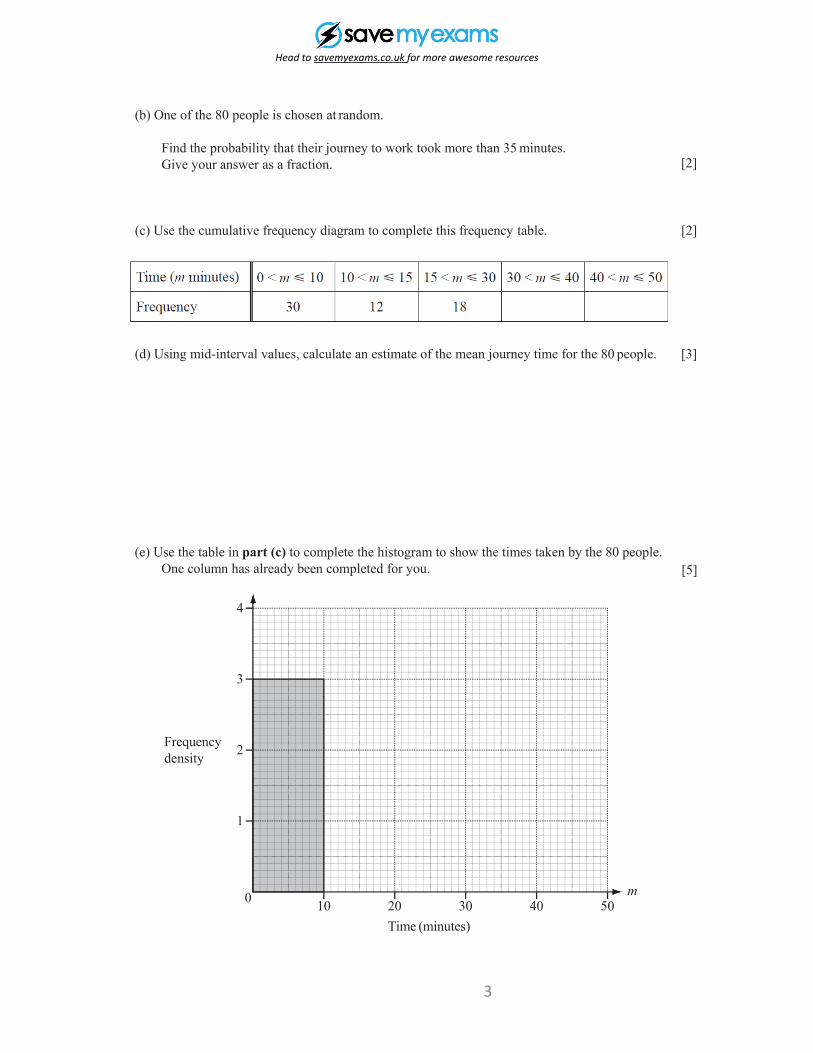
(b) One of the 80 people is chosen at random.
Find the probability that their journey to work took more than 35 minutes. Give your answer as a fraction.
(c) Use the cumulative frequency diagram to complete this frequency table. [2]
(d) Using mid-interval values, calculate an estimate of the mean journey time for the 80 people.
(e) Use the table in part (c) to complete the histogram to show the times taken by the 80 people. One column has already been completed for you.
Frequency density
4
3
2
1
0 10 20 30Time (minutes)
40 50m
[2]
[5]
[3]
3
Head to savemyexams.co.uk for more awesome resources
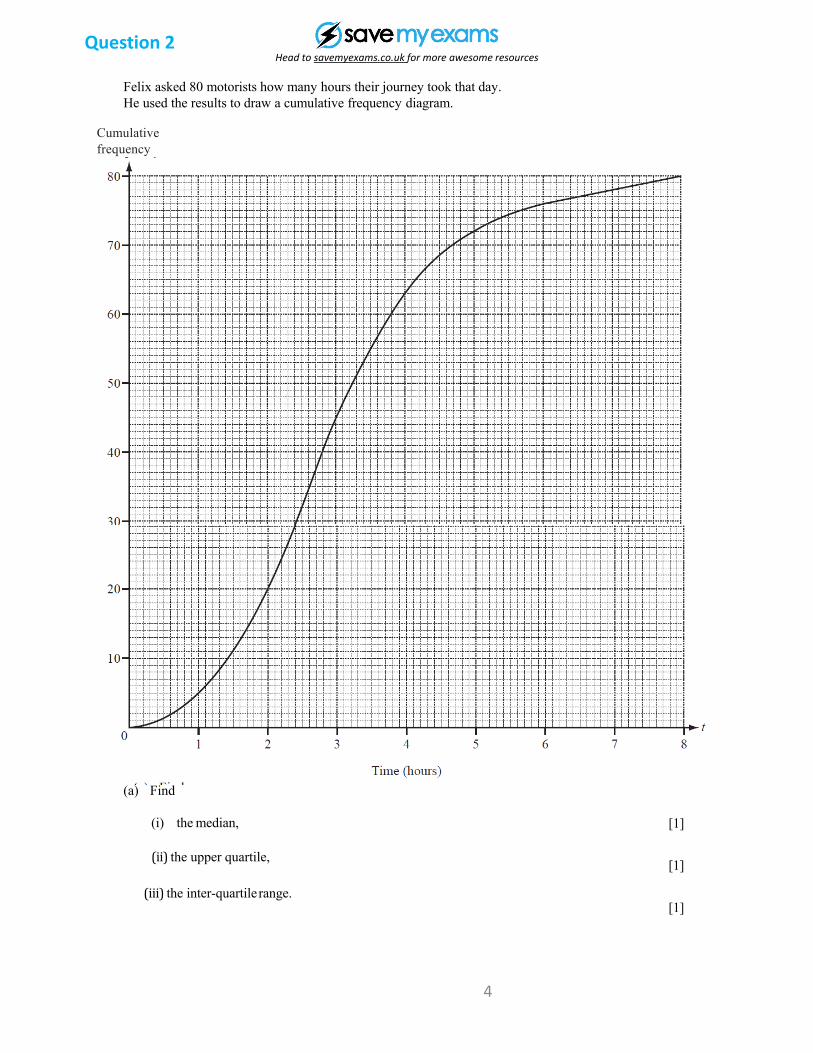
Felix asked 80 motorists how many hours their journey took that day. He used the results to draw a cumulative frequency diagram.
Cumulative frequency
(a) Find
(i) the median, [1]
(ii) the upper quartile, [1]
(iii) the inter-quartile range.[1]
Question 2
4
Head to savemyexams.co.uk for more awesome resources
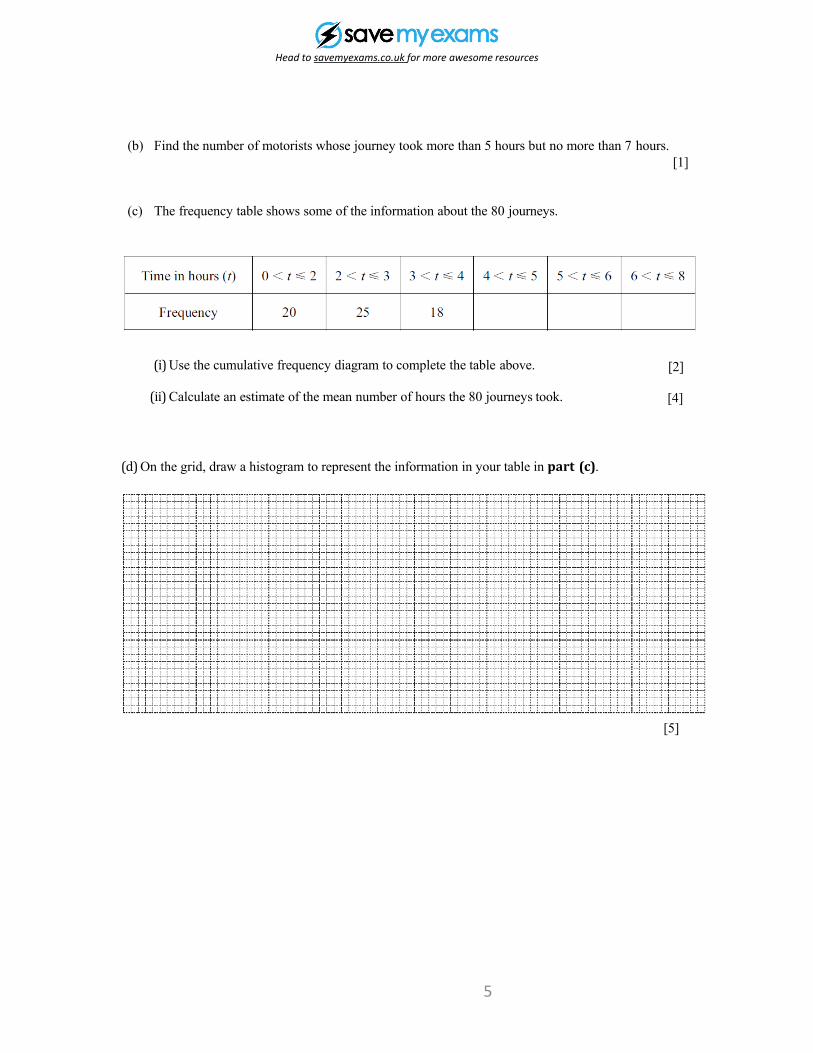
(b) Find the number of motorists whose journey took more than 5 hours but no more than 7 hours.[1]
(c) The frequency table shows some of the information about the 80 journeys.
(i) Use the cumulative frequency diagram to complete the table above. [2]
(ii) Calculate an estimate of the mean number of hours the 80 journeys took. [4]
(d) On the grid, draw a histogram to represent the information in your table in part (c).
[5]
5
Head to savemyexams.co.uk for more awesome resources
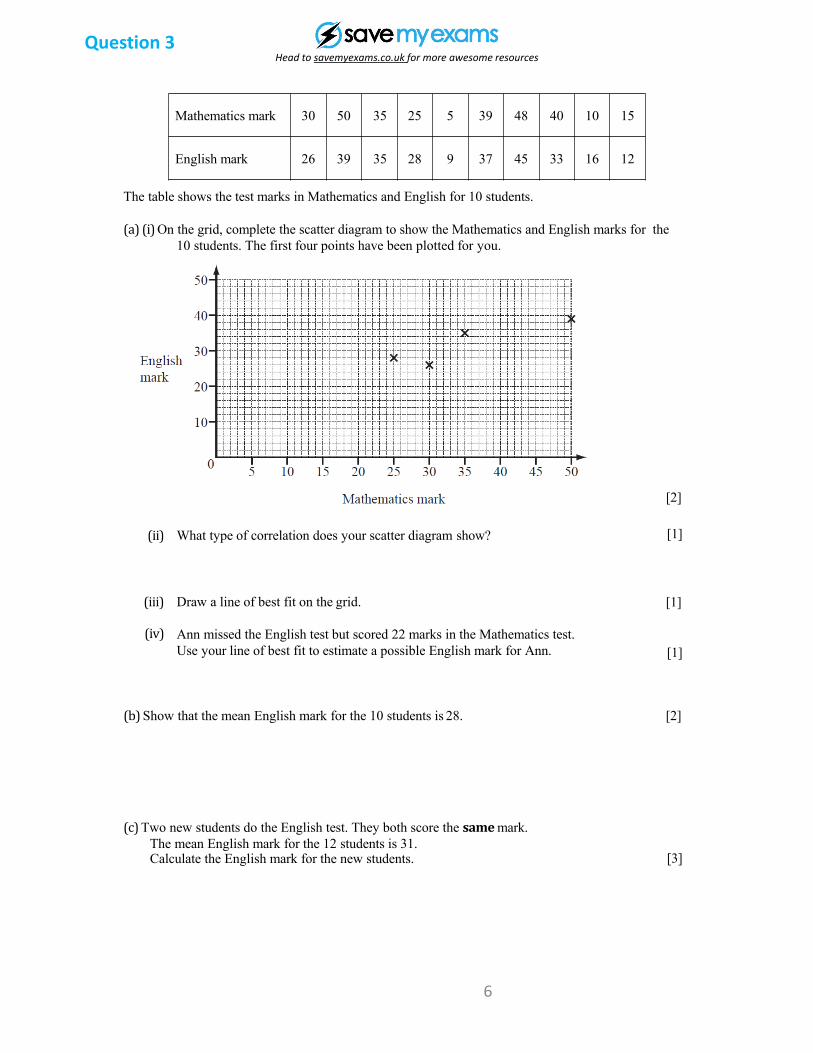
Mathematics mark 30 50 35 25 5 39 48 40 10 15
English mark 26 39 35 28 9 37 45 33 16 12
The table shows the test marks in Mathematics and English for 10 students.
(a) (i) On the grid, complete the scatter diagram to show the Mathematics and English marks for the 10 students. The first four points have been plotted for you.
[2]
(ii) What type of correlation does your scatter diagram show? [1]
(iii) Draw a line of best fit on the grid. [1]
(iv) Ann missed the English test but scored 22 marks in the Mathematics test. Use your line of best fit to estimate a possible English mark for Ann. [1]
(b) Show that the mean English mark for the 10 students is 28. [2]
(c) Two new students do the English test. They both score the samemark. The mean English mark for the 12 students is 31.Calculate the English mark for the new students. [3]
Question 3
6
Head to savemyexams.co.uk for more awesome resources
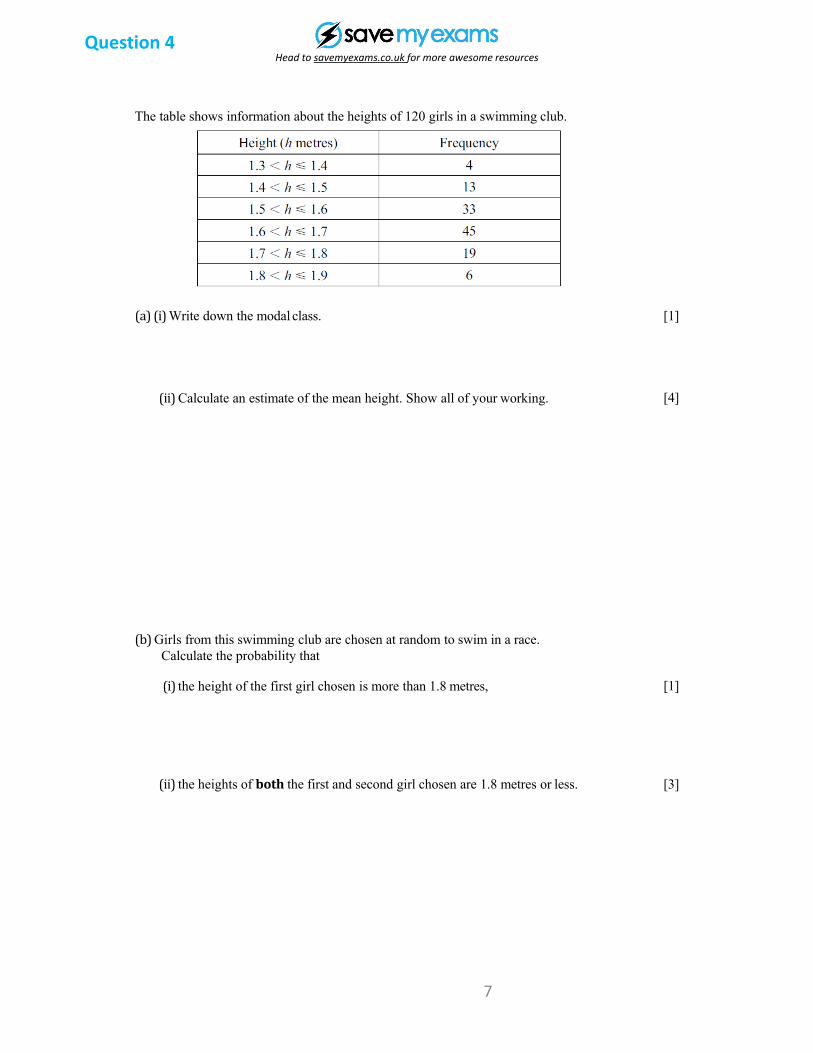
3 The table shows information about the heights of 120 girls in a swimming club.
(a) (i) Write down the modal class. [1]
(ii) Calculate an estimate of the mean height. Show all of your working. [4]
(b) Girls from this swimming club are chosen at random to swim in a race. Calculate the probability that
(i) the height of the first girl chosen is more than 1.8 metres, [1]
(ii) the heights of both the first and second girl chosen are 1.8 metres or less. [3]
Question 4
7
Head to savemyexams.co.uk for more awesome resources
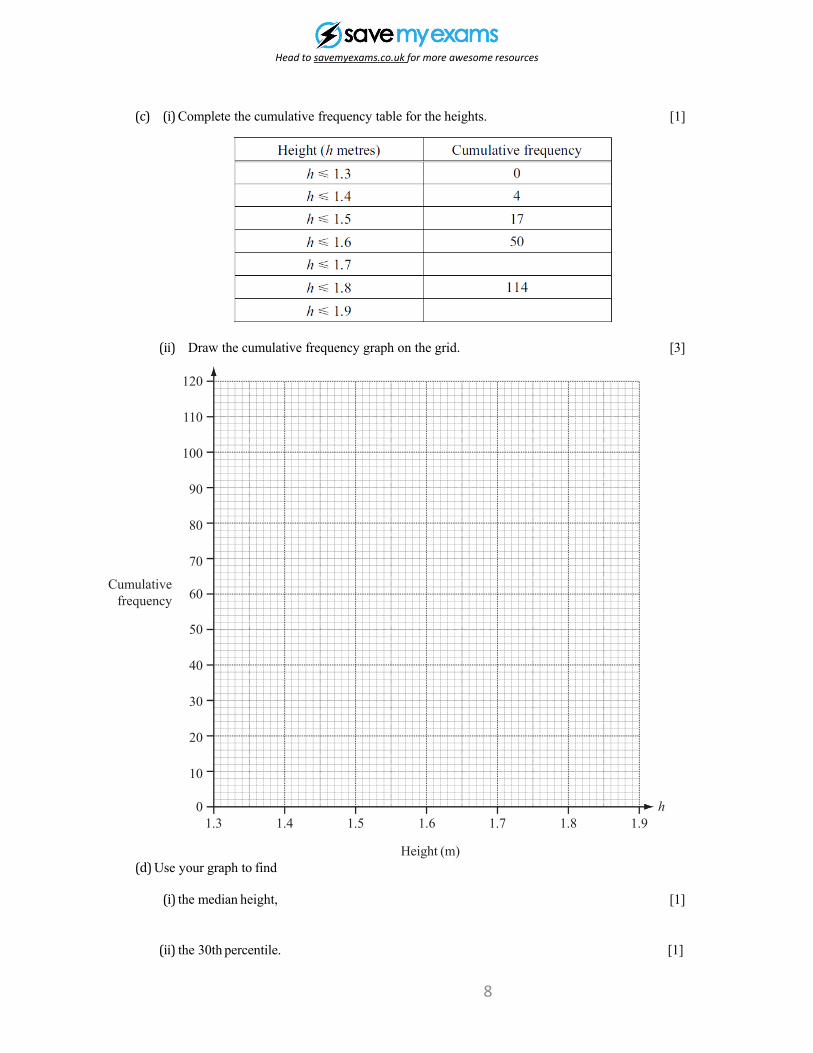
(c) (i) Complete the cumulative frequency table for the heights. [1]
(ii) Draw the cumulative frequency graph on the grid.
120
110
100
90
80
70
60
50
40
30
20
10
01.3 1.4 1.5 1.7 1.8 1.9
h1.6
Height (m)
Cumulative frequency
[3]
(d) Use your graph to find
(i) the median height, [1]
(ii) the 30th percentile. [1]
8
Head to savemyexams.co.uk for more awesome resources
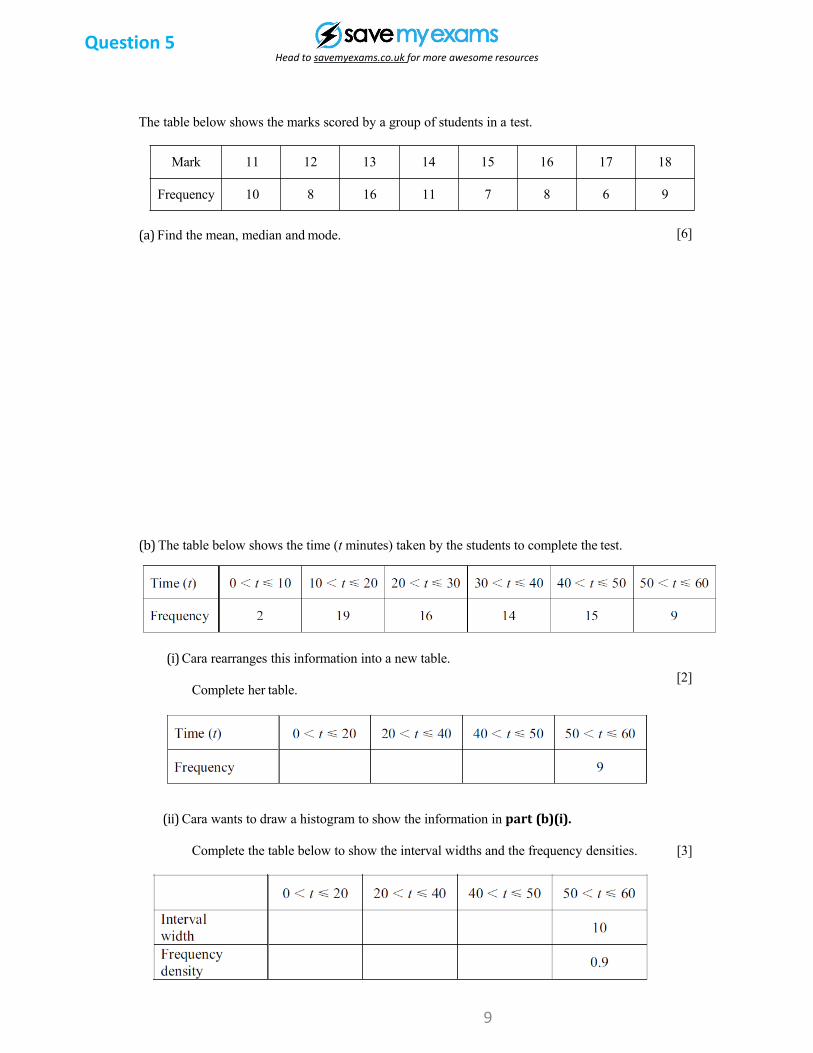
8 The table below shows the marks scored by a group of students in a test.
Mark 11 12 13 14 15 16 17 18
Frequency 10 8 16 11 7 8 6 9
(a) Find the mean, median and mode. [6]
(b) The table below shows the time (t minutes) taken by the students to complete the test.
(i) Cara rearranges this information into a new table.
Complete her table.[2]
(ii) Cara wants to draw a histogram to show the information in part (b)(i).
Complete the table below to show the interval widths and the frequency densities. [3]
Question 5
9
Head to savemyexams.co.uk for more awesome resources
(c) Some of the students were asked how much time they spent revising for the test.
10 students revised for 2.5 hours, 12 students revised for 3 hours and n students revised for 4 hours.
The mean time that these students spent revising was 3.1 hours.
Find n.
Showallyour working. [4]
10
Head to savemyexams.co.uk for more awesome resources
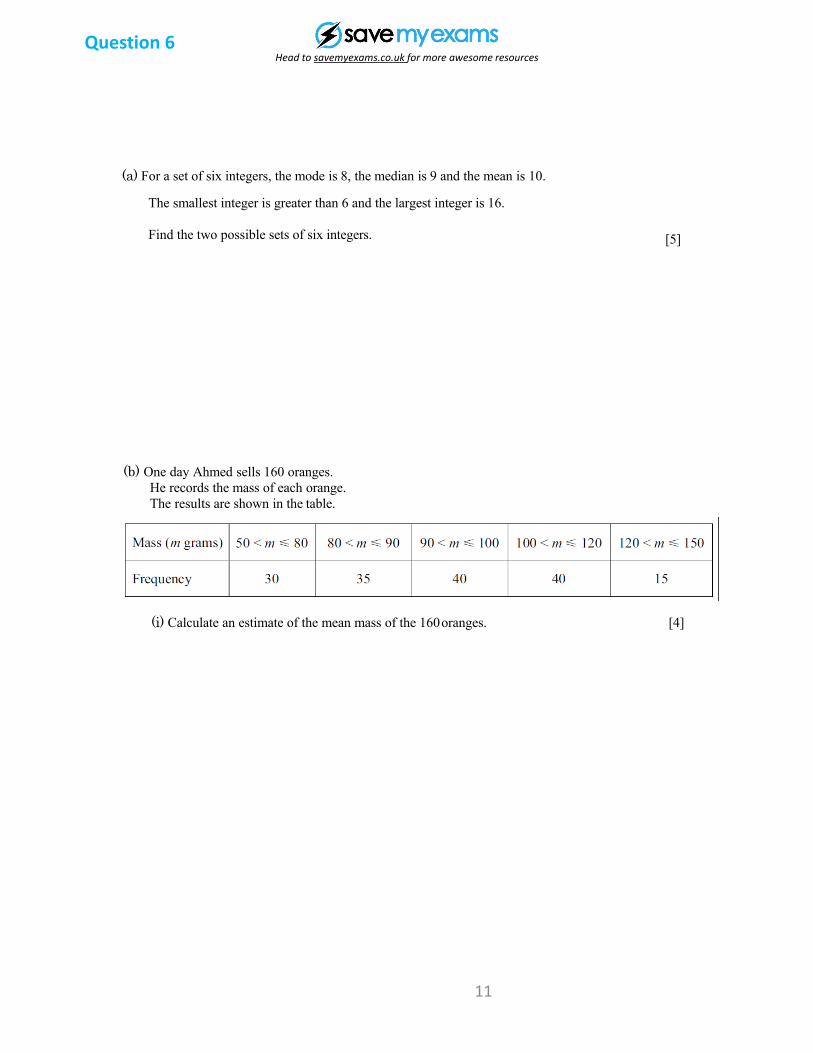
(a) For a set of six integers, the mode is 8, the median is 9 and the mean is 10.
The smallest integer is greater than 6 and the largest integer is 16.
Find the two possible sets of six integers. [5]
(b) One day Ahmed sells 160 oranges. He records the mass of each orange. The results are shown in the table.
(i) Calculate an estimate of the mean mass of the 160oranges. [4]
Question 6
11
Head to savemyexams.co.uk for more awesome resources
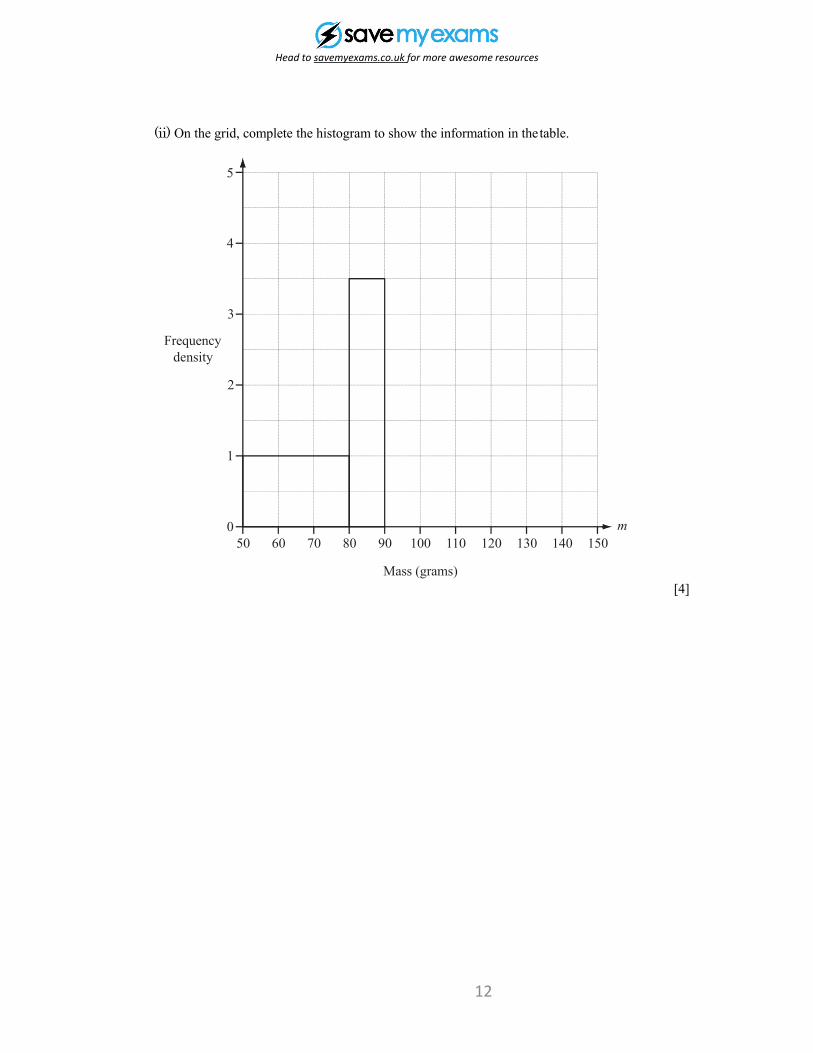
(ii) On the grid, complete the histogram to show the information in thetable.
5
4
1
0 m
3
Frequency density
2
50 60 70 80 90 100 110 120 130 140 150
Mass (grams)[4]
12
Head to savemyexams.co.uk for more awesome resources
150 155 160 175 180 185 1900
0 165 170
Height (cm)
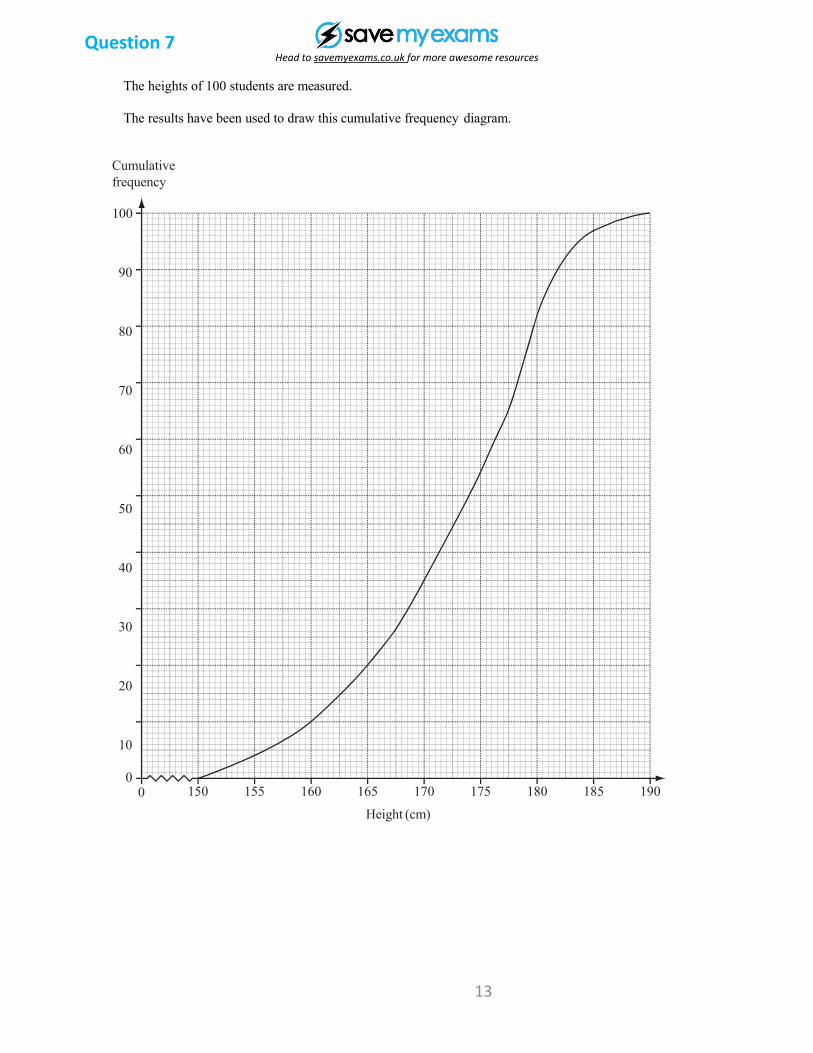
The heights of 100 students are measured.
The results have been used to draw this cumulative frequency diagram.
Cumulative frequency
100
90
80
70
60
50
40
30
20
10
Question 7
13
Head to savemyexams.co.uk for more awesome resources
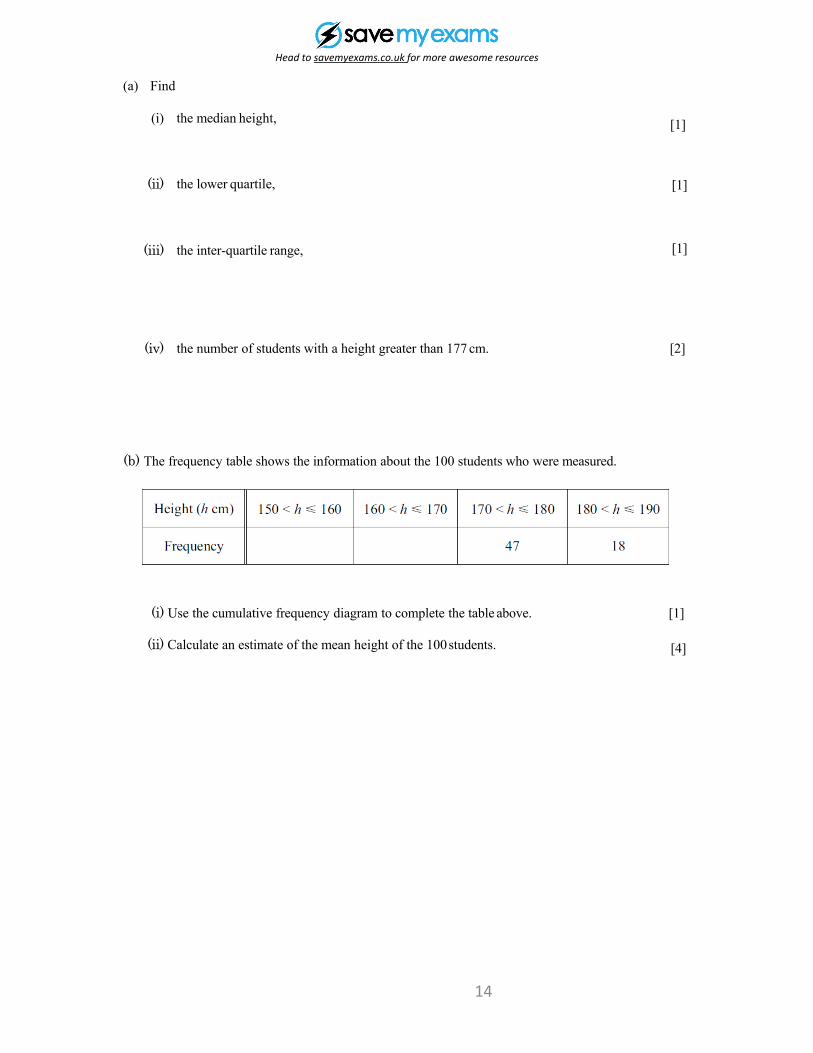
(a) Find
(i) the median height, [1]
(ii) the lower quartile, [1]
(iii) the inter-quartile range, [1]
(iv) the number of students with a height greater than 177 cm. [2]
(b) The frequency table shows the information about the 100 students who were measured.
(i) Use the cumulative frequency diagram to complete the table above. [1]
(ii) Calculate an estimate of the mean height of the 100students. [4]
14
Head to savemyexams.co.uk for more awesome resources