statistics of filipino children 4th quarter of 2008 juvenile delinquency
DESCRIPTION
Statistics of Filipino Children 4th Quarter of 2008 Juvenile DelinquencyTRANSCRIPT

0022-3603
JOURNAL OF PHILIPPINE STATISTICS VOLUME 59 NUMBER 4 FOURTH QUARTER 2008
Feature Article
Statistics on Filipino Children
Republic of the Philippines NATIONAL STATISTICS OFFICE
Manila
A Quarterly Issue
ii
REPUBLIC OF THE PHILIPPINES
HER EXCELLENCY PRESIDENT GLORIA MACAPAGAL-ARROYO
NATIONAL STATISTICS OFFICE
CARMELITA N. ERICTA Administrator
PAULA MONINA G. COLLADO
Deputy Administrator
ISSN 0022-3603
PREFACE
The Journal of Philippine Statistics (JPS) is a quarterly publication of the National Statistics Office (NSO). It furnishes data users with statistical information on the socioeconomic development of the country in accordance with the NSO’s mission of providing timely, accurate, and reliable information as bases for plans, policies and decisions, and as inputs to academic pursuits, researches, and development projects.
The statistical series contained in this publication are updated for continuity and for comparative analysis whenever possible. Tabular data usually cover two or more periods for maximum comparability.
This issue presents the latest available statistics on population and housing; labor and employment; travel and tourism; social welfare, and community development; education and culture; health, nutrition and vital statistics; and defense, crime and delinquency.
Featured in this issue are statistics on the Filipino Children. This is in recognition of the vital role of the Filipino child within the Filipino family and in the society as a whole.
Most of the statistics shown here were taken from surveys and censuses conducted by the NSO and other offices, as well as from administrative forms or records compiled by various agencies. Acknowledgment, therefore, is extended to all secondary data sources without whose cooperation and support, the consolidation of information and the publication of this journal would not have been possible.
Manila, Philippines December 2008

C O N T E N T S
Page
Preface…...……………………………………………………………… iii Contents…...……………………………………………………………… v Statistical Tables…...…………………………………………………… vii
Feature Article
Statistics on Filipino Children…………………………... ….. 1
Section I - POPULATION AND HOUSING …………………………….. 13
Lucena City: Results from the 2007 Census of Population…………………………………….………….. 13
Private Building Construction StatisticsSecond Quarter 2008 …………………………………………… 16
Section II - LABOR AND EMPLOYMENT ……………………………… 30
Labor Force Survey: July 2008 …………………………… 30
Labor Relations and Concerns …………………………….. 34
Section III - TRAVEL AND TOURISM …………………………………… 46
Visitor Arrivals to the Philippines: 2008………………………… 46
Section IV - SOCIAL WELFARE AND COMMUNITYDEVELOPMENT ……………………………………………. 55
Familiies Served: 2008…………………………………….. 57
Disadvantaged Children Served: 2008….…………………… 57
Disadvantaged and Abused Children Served 2008……………………………………………………….. 58
Youth Served: 2008……………………………………… 59
Welfare and Protection of Disadvantaged Women2008……………………………………………………….. 59
Persons with Disabilities: 2008……………………………….… 60
Old Persons Served: 2008...……………………………….…. 61
CONTENTS - Concluded

Page
Section V - EDUCATION AND CULTURE …………………………….. 73
Education Indicators: School Years 2004-2005and 2005-2006 ……………………………….………………… 73
Promotion of Arts and Culture………………………………… 76
Section VI - HEALTH, NUTRITION, AND VITAL STATISTICS ……….. 80
Health and Vital Indicators: 2008……...…….………………… 80
Under Five Mortality (Preliminary Results from the 2008National Demographic and Health Survey)…………………… 81
Half of the Women in the Philippines Practice FamilyPlanning (Preliminary Results from the 2008 NationalDemographic and Health Survey…………………………….. 82
Nutrition and Health Status of Filipino Adults (Resultsfrom the National Nutrition and Health Survey 2003-2004)………………………………………………… 82
Section VII - DEFENSE, CRIME, AND DELINQUENCY ……………….. 89Crime Indicators: 2008…………………………………………. 89
Human Rights Violation Among Indigenous Peoples (IPs) ………………………………………………. 92
Page
Feature Article
Statistics on Filipino Children…………………………... …..
1 Status of local councils for the protection of children2007…………………………………………………………… 8
2 Government expenditure programme by sector2002-2006………………………………………………………… 8
3 Selected INGO budgetary allocations for children2001-2006………………………………………………………… 9
4 Plan Philippines: budgetary allocation for children…………. 9
5 Percentage of mothers by knowledge of children's rights: 2007……...………………………………………………… 10
6 Estimated population of Filipino children: 2001-2005………… 10
7 Number of reported cases of child abuse servedby DSWD by type of abuse: 2001-2006……………………… 11
8 Education indicators in public primary schools2002-2006………………………………………………………… 11
9 TVET enrolees, graduates, and employment2001-2004………………………………………………………… 11
10 Children with disabilities by age group and type of disability: 2000………………………………………………… 12
Section I - POPULATION AND HOUSING
1.1 Total population, household population, and number of households of top ten barangays: 2007…………………… 21
1.2 Household population by age group and sex and sex ratio: 2007…………………………………………….. 21
1.3 Household population ten years old and over by marital status and sex: 2007……………………………….. 22
1.4 Household population 5 years old and over by highesteducational attainment and sex: 2007………………………. 22
S T A T I S T I C A L T A B L E S

Page
1.5 Household population 5 to 24 years old who were attending school by age group and sex: 2007………… 23
1.6 Occupied housing units by construction materials of the roof and outer walls: 2007……………………………… 23
1.7 Number, floor area, and value of building constructionby type of building, and region: second quarter 2008 ….... 25
1.8 Number of residential building construction startedfloor area, and value of construction by type of buildingand region: second quarter 2008 …………………………… 26
1.9 Number of non-residential building construction startedfloor area, and value of construction by type of buildingand region: second quarter 2008 …………………………… 27
1.10 Number of commercial building construction started floor area, and value of construction by type of buildingand region: second quarter 2008 …………………………… 28
1.11 Number of industrial building construction startedfloor area, and value of construction by type of buildingand region: second quarter 2008 …………………………… 29
Section II - LABOR AND EMPLOYMENT
2.1 Employed persons by industry, occupation, class of worker and hours worked: July 2008 ……..…………….. 37
2.2 Underemployed persons by hours worked and industryand unemployed persons by age group, sex and highest grade completed: July 2008 and July 2009………………….. 38
2.3 Rates of labor force participation, employmentunemployment and underemployment by regionJuly 2008………………………………………………………… 40
2.4 Strike and lockout notices and actual strikes and lockoutsJanuary to September 2007 and 2008 ………………………… 41
2.5 Strike and lockout notices, actual strikes and lockouts and preventive mediation cases by region: January to September 2008……………………………………………… 42
STATISTICAL TABLES - Continued

Page
2.6 Preventive mediation cases and voluntary arbitrationcases: January to September 2007 and 2008 ……………… 44
2.7 Original and appealed mediation-arbitration cases and money claims: January to September 2007 and 2008…………………………. ……………………………… 45
Section III - TRAVEL AND TOURISM
3.1 Visitor arrivals by country of residence2007 and 2008……………………..……………………. 49
3.2 Visitor arrivals by country of residenceDecember 2007 and 2008…. ………………………………… 51
3.3 Top ten travel markets: 2007 and 2008……………………… 53
3.4 Average occupancy rates of hotels in Metro Manilaby classification: fourth quarter 2007 and 2008……………… 54
Section IV - SOCIAL WELFARE AND COMMUNITY DEVELOPMENT
4.1 Number of families served by program or project or service and by region: 2007 and 2008……………………. 62
4.2 Number of disadvantaged children served, by programproject or service by region and by sex: 2008 and 2007…. 63
4.3 Number of child abuse cases served by program or project service by region and by sex: 2008 and 2007…… 66
4.4 Number of youth served by program or projector service by region and by sex: 2008 and 2007……………… 66
4.5 Number of children in conflict with the law (CICL) served by program, project or service by region and by sex: 2008 and 2007……………………………………… 67
4.6 Number of women served by program or projector service by region: 2008 and 2007…………………………… 69
4.7 Number of persons with disabilities (PWDs) served by program or project or service by region and by sex2008 and 2007…………………………………………………. 70
STATISTICAL TABLES - Continued

Page
4.8 Number of senior citizens (SCs) served by programproject or service by region and by sex: 2008 and 2007………………………………………………………… 72
Section V - EDUCATION AND CULTURE
5.1 Net participation rate in public elementary schoolsschool years 2004-2005 and 2005-2006 ……………………… 78
5.2 Net participation rate in public secondary schoolsschool years 2004-2005 and 2005-2006……………………… 78
5.3 Cohort survival rate in public elementray schoolsschool years 2004-2005 and 2005-2006………………… 79
5.4 Cohort survival rate in public secondary schoolsschool years 2004-2005 and 2005-2006……………………… 79
Section VI - HEALTH, NUTRITION, AND VITAL STATISTICS
6.1 Trends in childhood mortality rates with standard errors and confidence intervals……………………………………….. 86
6.2 Selected maternal care indicators: 2003 and 2008………… 86
6.3 Percentage of children age 13-23 months who received specific vaccines at any time before the survey: 2003 and 2008……………..……………………… 86
6.4 Contraceptive prevalence rates with standard errors and confidence interval: 1998, 2003 and 2008…….……….. 87
6.5 Percent distribution of currently married women by contraceptive method used: 2003 and 2008……………… 87
6.6 Mean and prevalence of dyslipidemia among adults 20 years old and over: 2003-2004……………………….. 88
6.7 Means and distribution of adults to fasting blood sugar (FBS) by age: 2003-2004……………………………………… 88
STATISTICAL TABLES - Continued

Page
Section VII - DEFENSE, CRIME, AND DELINQUENCY
7.1 Total crime volume and efficiency rate by regionthird quarter 2007 and 2008 …………………………….... 97
7.2 Index and non-index crimes by regionthird quarter 2007 and 2008 …………………………….... 97
7.3 Crime against persons by regionthird quarter 2007 and 2008 …………………………….... 98
7.4 Crime against property by regionthird quarter 2007 and 2008 …………………………….... 99
7.5 Population and location of indigenous people by region2000……………………………………………………………. 99
7.6 Areas of human rights violations of indigenous people2003……………………………………………………………… 105
STATISTICAL TABLES - Concluded
1
Feature Article
Statistics on Filipino Children
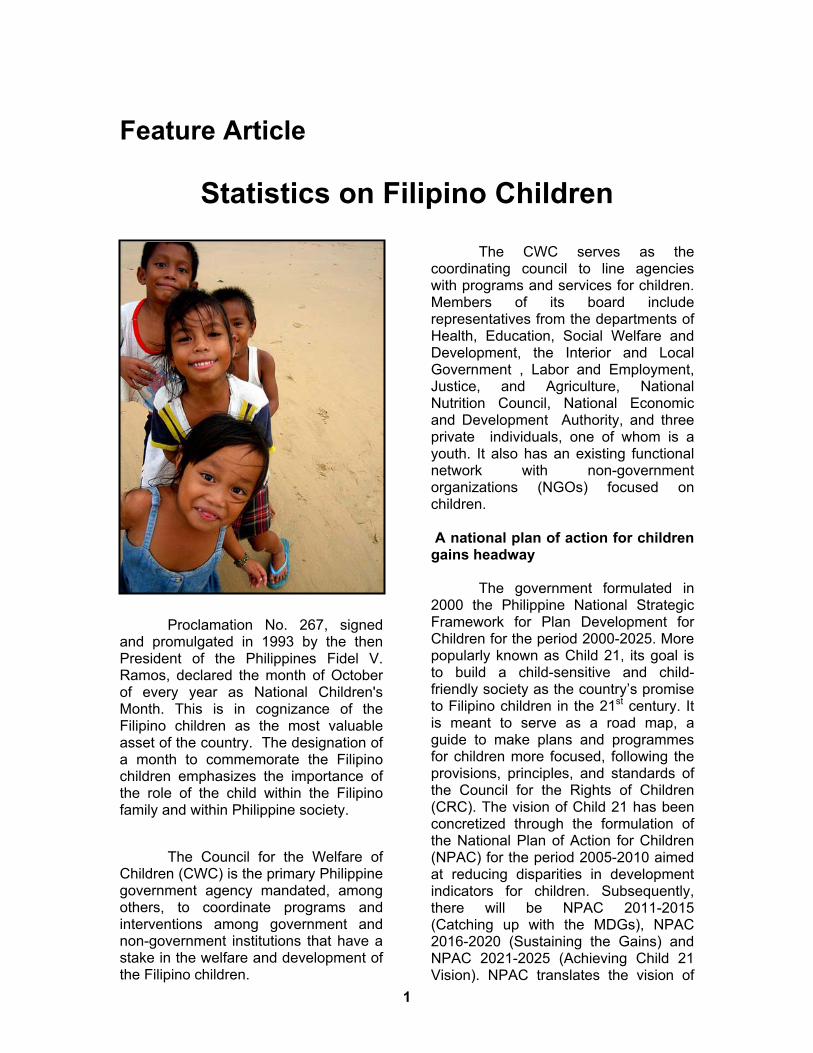
Proclamation No. 267, signed
and promulgated in 1993 by the then President of the Philippines Fidel V. Ramos, declared the month of October of every year as National Children's Month. This is in cognizance of the Filipino children as the most valuable asset of the country. The designation of a month to commemorate the Filipino children emphasizes the importance of the role of the child within the Filipino family and within Philippine society. The Council for the Welfare of Children (CWC) is the primary Philippine government agency mandated, among others, to coordinate programs and interventions among government and non-government institutions that have a stake in the welfare and development of the Filipino children.
The CWC serves as the coordinating council to line agencies with programs and services for children. Members of its board include representatives from the departments of Health, Education, Social Welfare and Development, the Interior and Local Government , Labor and Employment, Justice, and Agriculture, National Nutrition Council, National Economic and Development Authority, and three private individuals, one of whom is a youth. It also has an existing functional network with non-government organizations (NGOs) focused on children. A national plan of action for children gains headway The government formulated in 2000 the Philippine National Strategic Framework for Plan Development for Children for the period 2000-2025. More popularly known as Child 21, its goal is to build a child-sensitive and child-friendly society as the country’s promise to Filipino children in the 21st century. It is meant to serve as a road map, a guide to make plans and programmes for children more focused, following the provisions, principles, and standards of the Council for the Rights of Children (CRC). The vision of Child 21 has been concretized through the formulation of the National Plan of Action for Children (NPAC) for the period 2005-2010 aimed at reducing disparities in development indicators for children. Subsequently, there will be NPAC 2011-2015 (Catching up with the MDGs), NPAC 2016-2020 (Sustaining the Gains) and NPAC 2021-2025 (Achieving Child 21 Vision). NPAC translates the vision of

2 JOURNAL OF PHILIPPINE STATISTICS
Child 21 into “clear, actionable and time-bound plan within a shorter, five-year time frame “taking into consideration the World Fit for Children (WFC) goals and the child-related Millennium Development Goals (MDGs) and, of course, the principles, provisions, and standards of the CRC. A Comprehensive Programme on Child Protection (CPCP), an elaboration of the child protection component of NPAC was launched on 18 June 2007. The CPCP aims to build a protective and caring environment for children as the overall approach to protecting Filipino children from various forms of abuse, exploitation, and violence. Children’s Month focuses on the theme Bright Child This year’s celebration of the National Children’s Month focuses on the theme Bright Child: sa tamang pag-aaruga, kinabukasan ay maginhawa. Activities of the different partner and member agencies gear towards addressing support and implementation, in full range, of the health, nutrition, early education, and social services programs that will provide for the basic holistic needs of the young children from birth to age six and to promote their optimum growth and development. Definition of Terms
Children may be defined as persons below 18 years of age or one over said age, and who upon evaluation of a qualified physician, psychologist, or psychiatrist, is found to be incapable of taking care of himself fully because of a physical or mental disability or condition or of protecting himself from abuse (Republic Act 7610).
The 2000 Census of Population
and Housing (CPH) conducted by the
National Statistics Office (NSO) included among children, persons whose ages were zero to 17 years.
The United Nations Convention
on the Rights of the Child adopted a more holistic view of the child as strategy by using a life cycle that can apply across all sectors. The life cycle includes the following:
• Prenatal period (unborn) -
the period of conception lasting approximately nine months. A single cell develops into a complex organism with a complete brain and behavioral capabilities. Mother's nourishment, health, well-being (physical, emotional, psychological), and safety directly affect the unborn child. Brain development is affected by the mother's nutrition
• Infancy (zero to two years old) - from birth to about 24 months. The child is dependent on parents especially the mother for love, nutrition, and stimulation. Loving, nurturing , and supportive parents are needed for survival and development of the child
• Early childhood (three to five years old) - child explores the environment of the home and develops interpersonal and socialization skills; psychomotor development occurs. Parents and other care givers enrich the child's world
• Childhood (six to twelve
years old) - change from home to school affects the child's perspective and contributes to his or her development. Schools redirect behavioral patterns through the preferences of teachers and institution's culture
• Adolescence (13 to 17 years old) - a period of transition and rapid physical changes. The pursuit of

STATISTICS ON FILIPINO CHILDREN 3
independence and identity are preeminent. More and more time is spent outside the family and increased peer influence becomes evident.
Analysis of Tables
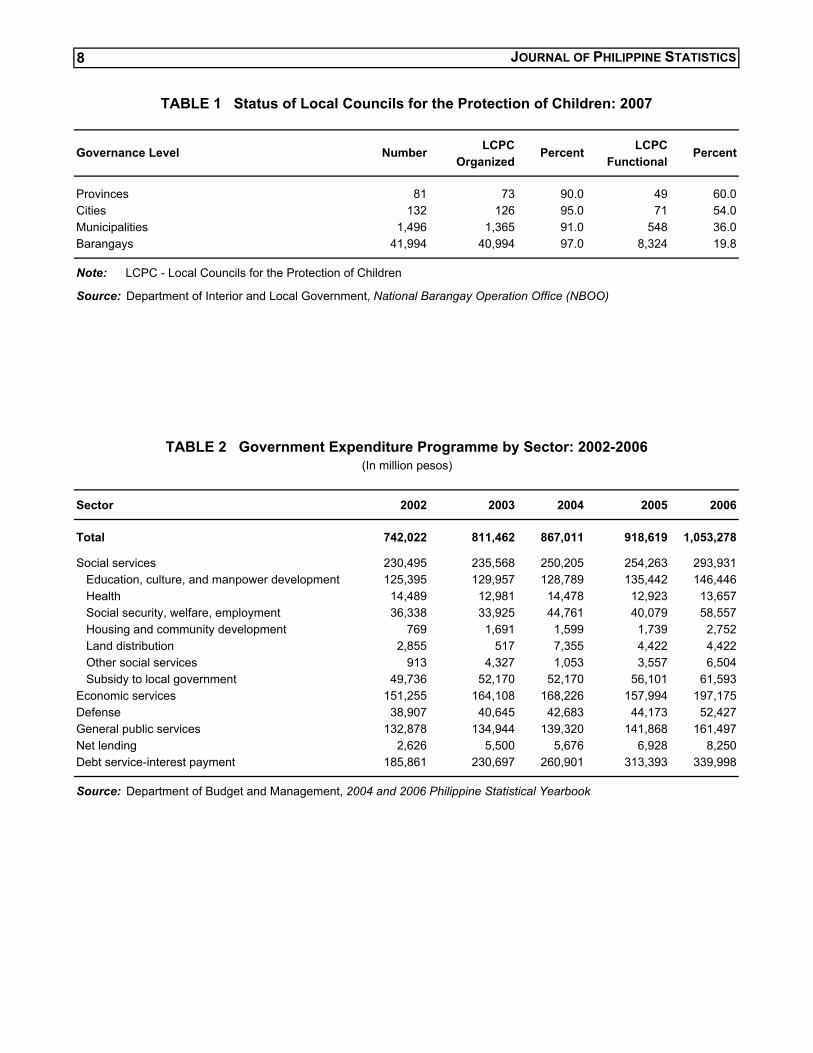
Local councils for the protection of children are organized all over the country In accordance with guidelines developed by the Department of Interior and Local Government (DILG), local councils for the protection of children (LCPC) at provincial, municipal, city, and barangay levels have been organized, activated, and strengthened to serve as institutional mechanisms for coordinating and monitoring CRC implementation at the local level. Data from the National Barangay Operations Office (NBOO) of the DILG as of August 2007 show that 73 out of 81 provinces (90.0%), 126 out of 132 cities (95.0%), 1,365 of 1,496 municipalities and 40,994 barangays have organized LCPCs. However, these LCPCs are in varying levels of functionality. Only 60.0 percent of provinces, 54.0 percent of cities, 36.0 percent of municipalities, and 19.8 percent of barangays have functional LCPCs. To achieve a higher rate of
functionality of the LCPCs requires, among others, a sustained community organizing strategy and process. An LCPC is considered functional if it meets regularly and has minutes of meetings, has an action plan and an approved budget for children, and renders an annual report on children. The DILG, through its field offices, monitors the functionality of the local councils (Table 1). Government spends more for social services and children’s programme
The government is challenged by a continuing development and human rights issue. While allocating more than 30.0 percent of its national budget to debt-servicing, still much is to be desired for its social services and children’s programmes. Data on government expenditure programme by sector show that social expenditure increased by 8.5 percent from PhP230.5 billion in 2002 to PhP250.2 billion in 2004 and again increased by 17.4 percent from PhP250.2 billion in 2004 to PhP293.9 billion in 2006. However, the share of social services in the total expenditures has been declining from 31.1 percent in 2002 to 28.9 percent in 2004 and then to 27.9 percent in 2006.
FIGURE 1 Government Expenditure Programme by Sector: 2002-2006
0
50,000
100,000
150,000
200,000
250,000
300,000
350,000
400,000
Secto r
2002 2003 2004 2005 2006
Num
ber (
In p
esos
)
400
350
300
250
200
150
100
50
0
Am
ount
(In
billi
on p
esos
)

4 JOURNAL OF PHILIPPINE STATISTICS
On the other hand, debt-service interest payment increased by 40.4 percent from PhP185.8 billion in 2002 to PhP260.9 billion in 2004 and again increased by 30.3 percent from PhP260.9 billion in 2004 to PhP339.9 billion in 2006 (Table 2). International organizations are partners in children advocacies International nongovernment organizations (INGO) are partners of the government in addressing the unmet needs and unfulfilled rights of Filipino children. Their investments provide substantial augmentation to government funds for children. In terms of their allocations for children, for example, Plan Philippines invested a total of US33,584,529 dollars for children in the period 2001-2006 distributed among clusters of child rights (Tables 3 and 4). More than half of Filipino mothers are aware of their children’s rights The 2007 Multiple Indicators Cluster Survey (MICS) conducted by the NSO (with support from the UNICEF) in 24 provinces and cities asked mothers
about their knowledge of children’s rights. It revealed that more than 50.0 percent of mothers are aware of their children’s rights to education and health; and 40.0 percent recognize the importance of the family to the child. On the other hand, the rights of the child to birth registration; to special protection from abuse, exploitation and violence; and to be able to express his or her views received very low recognition (16.7%, 18.4%, and 11.8% respectively) among the mothers. Generally, the data imply a continuing challenge for massive dissemination and popularization of the convention on the Rights of the Child and it’s Optional Protocols particularly in remote rural communities, conflict-affected barangays, communities of Muslims and indigenous peoples, and urban slums and informal settlements in the major urban centers (Table 5). Children population in 2005 is estimated at 38.2 million The 2000 census found that 43.4 percent of the Philippine population was below 18 years old. The next general census of population in August 2007
FIGURE 2 Estimated Population of Filipino Children: 2001-2005
0
5,000,000
10,000,000
15,000,000
20,000,000
25,000,000
30,000,000
35,000,000
40,000,000
45,000,000
2001 2002 2003 2004 2005
Year
Both SexesM aleFemale
45
40
35
30
25
20
15
10
5
0

STATISTICS ON FILIPINO CHILDREN 5
has released preliminary and partial results. Assuming the same proportion, the estimated population of persons 0-19 years old was 38.2 million as of 2005. Of this number, 19.5 million were male and 18.7 were female. Table 6 shows the estimated child population by age and gender for a five-year period, 2001-2005. The population of persons 0-19 years old increased from 35.9 million in the year 2000 to 36.4 million in 2001, 36.8 million in 2002, 37.3 million in 2003, 37.8 million in 2004 and 38.2 million in 2005 showing a yearly increase of about half a million children and young people (Table 6).
DSWD reports lessening cases of child abuse The DSWD revealed that the number of reported cases of child abuse has been declining from 9,197 in 2004 to 8,336 in 2005 and 7,606 in 2006. However, these number may not represent the entire picture. The downward trend may not necessarily indicate a decrease in the number of child abuse cases. In the past two years, about 40.0 percent of the reported cases were sexual abuse (rape, incest, acts of lasciviousness) and sexual exploitation (child prostitution, pedophilia, and pornography). Reported cases of physical abuse and maltreatment at home and in schools remain high. Child trafficking and violence against children still remain largely unreported. The nature of other forms of child abuse and exploitation such as child pornography and corporal punishment is likewise little understood and requires massive advocacy and awareness-raising among families, communities, LGU officials, and service providers (Table 7).
NGOs report increasing number of child abuse cases
Aside from DSWD reports, data from the Child Protection Unit (CPU) Network show an increasing number of reported cases of child abuse. In 2004, the CPU Network recorded 3,797 cases in 17 member CPUs. This number increased to 4,034 in 2005 and 4,120 in 2006. For the three-year period of 2004-2006, 70.0 percent of reported cases were sexual abuse. Other NGOs that have their own data on child abuse are Bantay Bata, Center for the Prevention and Treatment of Child Sexual Abuse (CPTCSA).
Basic education outcomes decline in 2005
The basic education outcomes show declining rates for net enrolment, completion, and achievement in primary schools based on data for the period 2002-2005. However, in 2006, data show some improvement. In 2002, net enrolment was reported at 83.3 percent
FIGURE 3 Education Outcomes in Public Primary Schools
2005-2006
0.0
10.0
20.0
30.0
40.0
50.0
60.0
70.0
80.0
90.0
B asic educatio n o utco mes
2006
2005
Basic education outcomes

6 JOURNAL OF PHILIPPINE STATISTICS
which declined to 76.9 percent (-6.4 percentage points) in 2005 which again rose to 84.4 percent or an increase of 7.6 percentage points (Table 8). Proportion of children TVET graduates employed increases There are about 1,400 technical- vocational education and training (TVET) schools or centers, 80.0 percent of which are in the private sector. There are only 200 state-run TVET institutions. The National Technical Education and Skills Development Plan for the period 2000-2004 noted that half of programmes offered by TVET schools and centers have not met the minimum standards set by the Technical Education and Skills Development Authority (TESDA). The major issues affecting TVET include poor quality of training, internal efficiency of TVET schools, inadequacy of laboratory equipment, and mismatches of TVET graduates with employment opportunities.
The period 2001 to 2004 showed marked increases in the indicators. Those enroled in these training centers rose to more than 848 thousand in 2004 from only 637 thousand in 2001 or by 33.0 percent. Graduates who numbered 385 thousand went up to 513 thousand for an increase of 25.0 percent. As to those who got employed, from more than half in 2000, it rose to 60.0 percent in 2004 (Table 9).
Given the population of children 15-18 years old (8.01 total, 4.01 million males, and 3.9 million females) who are most likely to undergo technical-vocational education and training, the above figures indicate the big gap in reaching this population group. Yet the potentials of TVET are great particularly
in the development of adolescents and young people in the prevention as well as rehabilitation of children in need of special protection (as in out-of-school youth, children in conflict with the law, children affected by armed conflict, and even children victims of sexual abuse, trafficking, and commercial sexual exploitation).
About 21.0 percent of physically challenged Filipinos are children
The National Council for the Welfare of Disabled Persons (NCWDP) estimated about 8.0 million Filipinos were afflicted with disabilities based on the assumption of the World Health Organization (WHO) that 10.0 percent of every country’s given population has some form of disability. On the other hand, the NSO in its Census of Population in 2000 estimated that there were 948,098 persons with disabilities or a mere 1.2 percent of the population (75.3 million) that same year. Seventy percent of these disabled persons were found in rural and remote areas of the country. Children comprised 191,680 (21.0%) of the total disabled (Table 10). Number of children in conflict with the law decreases Children in conflict with the law (CICL) are likewise vulnerable to abuse and violence and other instances of human rights violations. Based on reports of the DSWD, there are approximately 10,000 CICL who are provided services by the department annually. More than 1,200 CICL are being served in the 11 regional rehabilitation centers for youth (RRCY) and about 9,000 are provided community-based interventions by local social welfare and development offices. Most or 90.0 percent of CICL are males. The majority of these children are in the

STATISTICS ON FILIPINO CHILDREN 7
14-17 age group who come from poverty-stricken families, and have minimal education. The Philippine National Police (PNP), on the other hand reports that crimes committed by CICL are mostly property-related and are therefore linked to conditions of deprivation and poverty experienced by the children. More than 70.0 percent of the crimes committed by children are non-serious crimes that could be best handled through non-judicial measures. Unfortunately, children are oftentimes detained with adults in cells that are overcrowded and where sanitation is poor, food is inadequate and health care and educational programmes are non-existent. The delays in the hearing of cases in court and the tendency of judges to order detention of children even for petty offenses work to the disadvantage of the children. The passage of Republic Act 9344 or the Juvenile Justice and Welfare Act (JJWA) of 2006 are a great leap forward in improving the legal and judicial protection of children.
The number of children detained with adults has decreased. As of September 2006, there were 1,102 CICL detained in jails managed by the Bureau of Jail Management and Penology (BJMP). Efforts have been made to provide for completely separate detention facilities for these children but this has been fully achieved only in Metro Manila and in Cebu City (Operation Second Chance).
The Juvenile Justice and Welfare Council (JJWC) which was created under RA 9344 to oversee the implementation of the law and to advise the President on all matters and policies relating to juvenile justice and welfare – showed that the number of CICL decreased from 5,297 in December 2006 to 1,392 in June 2007 or by 75.0 percent (Table 11).
8 JOURNAL OF PHILIPPINE STATISTICS
LCPC LCPCOrganized Functional
Provinces 81 73 90.0 49 60.0Cities 132 126 95.0 71 54.0Municipalities 1,496 1,365 91.0 548 36.0Barangays 41,994 40,994 97.0 8,324 19.8
Note: LCPC - Local Councils for the Protection of Children
Source: Department of Interior and Local Government, National Barangay Operation Office (NBOO)
Sector 2002 2003 2004 2005 2006
Total 742,022 811,462 867,011 918,619 1,053,278
Social services 230,495 235,568 250,205 254,263 293,931 Education, culture, and manpower development 125,395 129,957 128,789 135,442 146,446 Health 14,489 12,981 14,478 12,923 13,657 Social security, welfare, employment 36,338 33,925 44,761 40,079 58,557 Housing and community development 769 1,691 1,599 1,739 2,752 Land distribution 2,855 517 7,355 4,422 4,422 Other social services 913 4,327 1,053 3,557 6,504 Subsidy to local government 49,736 52,170 52,170 56,101 61,593Economic services 151,255 164,108 168,226 157,994 197,175Defense 38,907 40,645 42,683 44,173 52,427General public services 132,878 134,944 139,320 141,868 161,497Net lending 2,626 5,500 5,676 6,928 8,250Debt service-interest payment 185,861 230,697 260,901 313,393 339,998
Source: Department of Budget and Management, 2004 and 2006 Philippine Statistical Yearbook
TABLE 2 Government Expenditure Programme by Sector: 2002-2006(In million pesos)
TABLE 1 Status of Local Councils for the Protection of Children: 2007
Governance Level Number Percent Percent
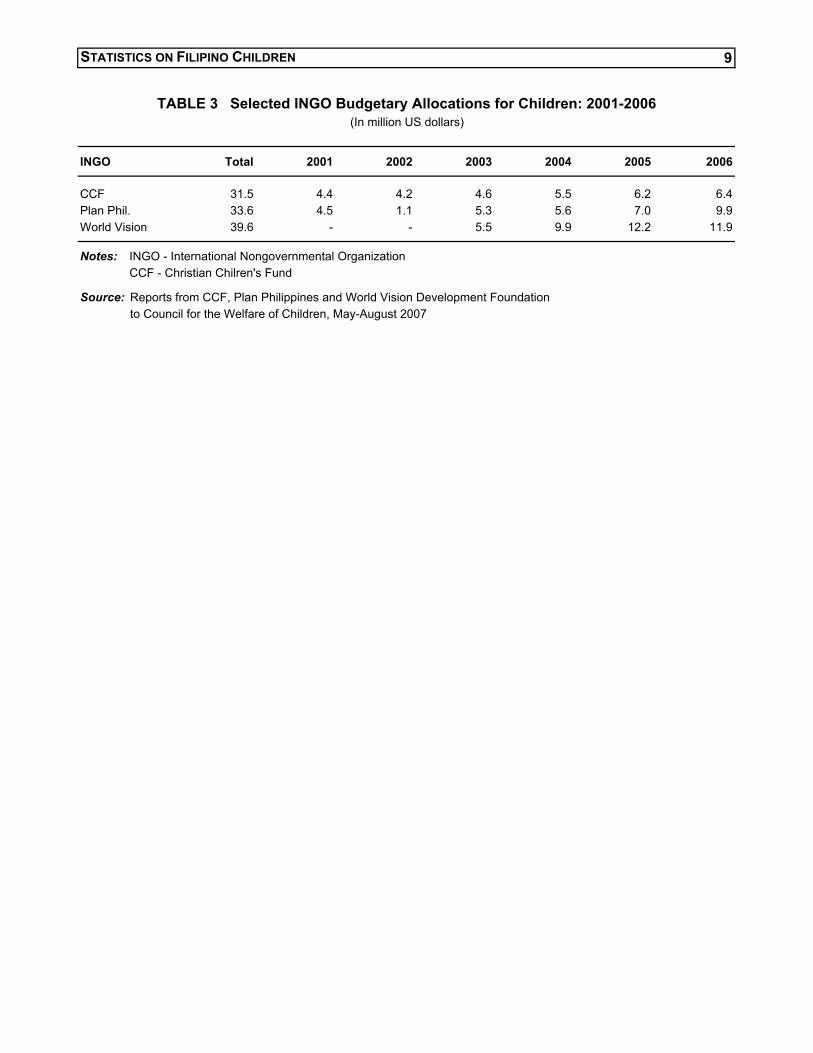
STATISTICS ON FILIPINO CHILDREN 9
INGO Total 2001 2002 2003 2004 2005 2006
CCF 31.5 4.4 4.2 4.6 5.5 6.2 6.4Plan Phil. 33.6 4.5 1.1 5.3 5.6 7.0 9.9World Vision 39.6 - - 5.5 9.9 12.2 11.9
Notes: INGO - International Nongovernmental OrganizationNote: CCF - Christian Chilren's Fund
Source: Reports from CCF, Plan Philippines and World Vision Development FoundationSource: to Council for the Welfare of Children, May-August 2007
TABLE 3 Selected INGO Budgetary Allocations for Children: 2001-2006(In million US dollars)

Cluster of Rights Total 2001 2002 2003 2004 2005 2006
Grand Total 33,584,529 4,519,968 1,144,825 5,303,663 5,606,749 7,028,967 9,980,357
General measures of implementation
(governance, capacitybuilding) 2,549,599 178,145 27,267 235,543 393,158 831,137 884,349
General principles (governance local levelchildren's participation) 66,770,461 819,747 141,987 776,391 1,100,542 1,644,537 2,287,257
Civil rights and freedoms (birth registration) 3,357,296 79,292 86,860 450,888 487,070 779,552 1,473,634
Family environment and alternatve care
(ECCD interventionsparenting, seminarsfamily counseling) 2,809,042 501,207 159,748 550,842 559,010 404,875 633,360
Basic health and welfare (health, water and sanitationadolescent health) 8,327,014 1,303,980 285,985 1,707,901 1,551,333 1,399,820 2,077,995
Education, leisure and cultural activities
(basic education, ALS) 5,263,257 849,641 266,221 936,078 1,003,523 1,140,540 1,067,254Special protection measures
(emergency, traffickingchild abuse, livelihood) 4,507,860 787,956 176,757 646,020 512,113 828,506 1,556,508
Source: Plan Philippines report submitted to the Council for the Welfare of Children, May 2006
TABLE 4 Plan Philippines: Budgetary Allocation for Children(In US dollars)

JOURNAL OF PHILIPPINE STATISTICS
Categories of Child Rights Percent
To be born, to have a name and nationality 16.7To have a family who will love and care for the child 40.0To live in a peaceful community and a wholesome environment 19.4To have adequate food and a healthy and active body 52.7To obtain good education and develop the child's potential 57.8To be given opportunities for play and leisure 34.2To be protected against abuse, exploitation, neglect, violence and danger 18.4To be defended and given asssitance by the government 3.0To be able to express the child's view 11.8Cannot specify rights 10.4
Note: CPC - Council for the Protection of Children
Source: National Statistics Office, 2007 Mutiple Indicators Cluster Survey
Age Group 2001 2002 2003 2004 2005
Both Sexes0-4 10,105,011 10,178,688 10,252,366 10,326,245 10,399,9235-9 9,444,200 9,559,539 9,674,878 9,790,533 9,905,87210-14 8,799,361 8,922,811 9,046,260 9,170,048 9,293,49815-19 8,071,179 8,215,201 8,359,222 8,503,638 8,647,659
Male0-4 5,162,926 5,201,300 5,239,674 5,278,153 5,316,5275-9 4,862,309 4,909,684 4,957,058 5,004,563 5,051,93710-14 4,508,217 4,579,359 4,650,500 4,721,837 4,792,97915-19 4,091,422 4,173,154 4,254,885 4,336,841 4,418,572
Female0-4 4,942,085 4,977,388 5,012,692 5,048,092 5,083,3965-9 4,581,891 4,949,855 4,717,820 4,785,970 4,853,93510-14 4,291,144 4,343,452 4,395,760 4,448,211 4,500,51915-19 3,979,757 4,042,047 4,104,337 4,166,797 4,229,087
Source: National Statistics Office, 2000 Census-based Population Projections
TABLE 5 Percentage of Mothers by Knowledge of Children's Rights: 2007
TABLE 6 Estimated Population of Filipino Children: 2001-2005
10

STATISTICS ON FILIPINO CHILDREN 11
Type of Abuse 2001 2002 2003 2004 2005 2006
Total 9,448 10,045 1,044 9,197 8,336 7,606
Abandoned 985 1,079 1,134 1,026 936 1,039Neglected 2,285 2,549 2,560 2,627 2,420 1,267Sexually abused 3,980 4,129 4,097 3,416 2,939 2,803
Rape 2,192 2,259 2,395 1,981 1,634 1,526Incest 1,245 1,332 1,189 1,084 1,018 921Acts of lasciviousness 543 538 513 351 287 356
Sexually exploited 249 284 311 348 267 244Victims of pedophilia 21 32 51 43 19 7Victims of prostitution 224 245 247 294 242 236Victims of pornography 4 7 13 11 6 1
or maltreated 1,445 1,440 1,370 1,214 1,009 796Victims of child labor 412 358 268 333 268 231Illegal recruitment 21 21 30 54 24 14Child trafficking 29 95 66 135 102 146Abduction - - - - -Victims of armed conflict 42 90 208 44 371 66
Source: Department of Social Welfare and Development
Basic Education Outcomes 2002 2003 2004 2005 2006
Net enrolment 83.30 81.70 79.53 78.86 84.44Cohort survival rate 69.47 63.57 64.87 62.58 68.70Achievement rate 58.73 54.66 59.94
Sources: Departement of Education, Basic Education Information System and National Education TestingSources: and Research Center
Number Enrolled/Graduated/Employed 2001 2002 2003 2004
Number enroled 637,500 701,300 771,400 848,500Number graduated 385,000 424,200 466,600 513,300Proportion of graduates employed 52.00 53.00 55.00 60.00
Source: Technical Education and Skills Development Authority
TABLE 7 Number of Reported Cases of Child Abuse Served by DSWD by Type
Physically abused
TABLE 8 Education Indicators in Public Primary Schools: 2002-2006
TABLE 9 TVET Enrolees, Graduates, and Employment: 2001-2004
of Abuse: 2001-2006

JOURNAL OF PHILIPPINE STATISTICS
Type of Disability Under 1 1-4 5-9 10-14 15-19
Total 5,906 30,260 53,345 59,532 52,826
Total blindness 428 2,041 3,455 2,921 2,798Partial blindness 716 3,260 4,449 4,646 4,272Low vision 817 3,776 4,716 5,864 6,089Total deafness 260 1,526 3,683 4,387 3,589Partial deafness 193 1,079 2,322 2,707 2,230Hard of hearing 46 331 992 1,312 1,001Oral defect 797 3,575 7,071 7,482 5,895Loss of one or both arms or hands 674 2,822 3,515 3,258 3,021Loss of one or both legs or feet 150 1,019 2,952 2,884 2,785Quadriplegic 206 2,517 5,524 5,498 4,402Mentally retarded 199 2,439 7,793 10,743 9,077Mentally ill 1,195 4,516 4,644 5,638 5,680Multiple impairment 225 1,359 2,229 2,232 1,987
Source: National Statistics Office, 2001 Special Report on Persons with Disability
TABLE 10 Children with Disabilities by Age Group and Type of Disability: 2000
12
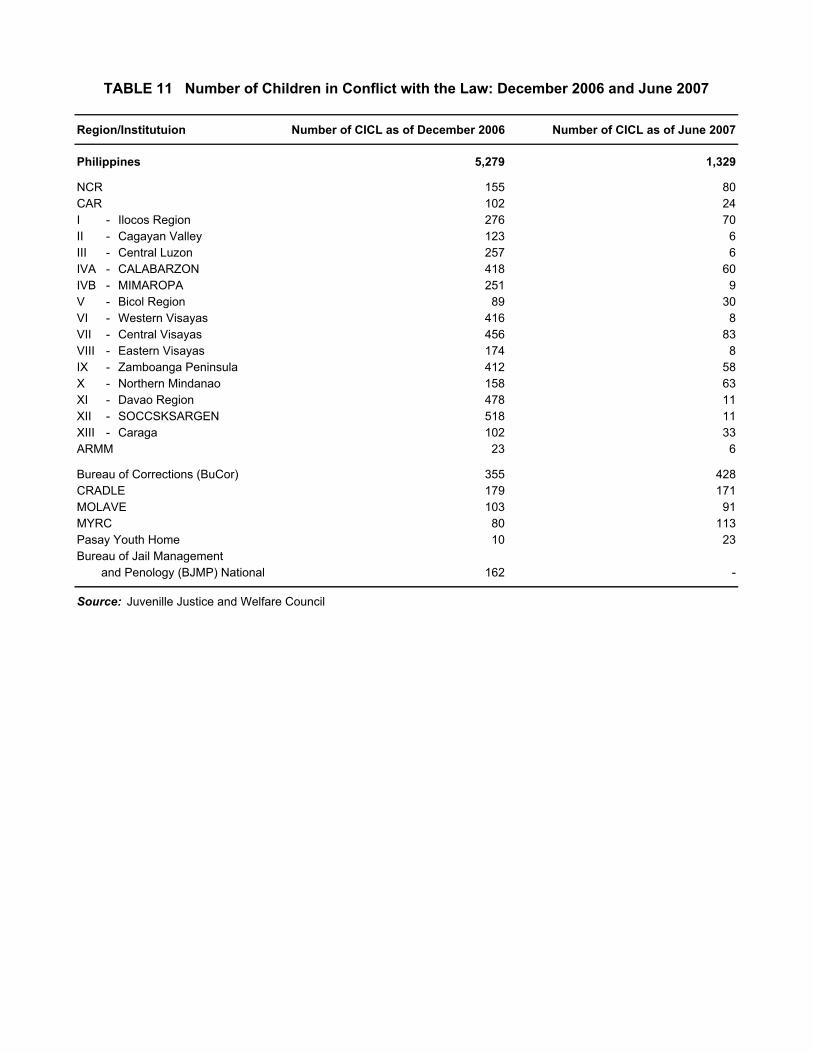
Region/Institutuion Number of CICL as of December 2006 Number of CICL as of June 2007
5,279 1,329
NCR 155 80CAR 102 24I - Ilocos Region 276 70II - Cagayan Valley 123 6III - Central Luzon 257 6IVA - CALABARZON 418 60IVB - MIMAROPA 251 9V - Bicol Region 89 30VI - Western Visayas 416 8VII - Central Visayas 456 83VIII - Eastern Visayas 174 8IX - Zamboanga Peninsula 412 58X - Northern Mindanao 158 63XI - Davao Region 478 11XII - SOCCSKSARGEN 518 11XIII - Caraga 102 33ARMM 23 6
Bureau of Corrections (BuCor) 355 428CRADLE 179 171MOLAVE 103 91MYRC 80 113Pasay Youth Home 10 23Bureau of Jail Management
and Penology (BJMP) National 162 -
Source: Juvenille Justice and Welfare Council
TABLE 11 Number of Children in Conflict with the Law: December 2006 and June 2007
Philippines

13
Section I – POPULATION AND HOUSING
Lucena City: Results from the 2007 Census of Population
Introduction
The population in an area changes in consequence, as people are born, people die, and that people move from one place to place. Hence, there are three components in population change: births, deaths, and migration.
In August 2007, the National Statistics Office (NSO) conducted the 2007 Census of Population. This nationwide undertaking was the 12th population census conducted in the country.
Like the previous censuses, the 2007 Census of Population is designed to take an inventory of the total population in the Philippines and to collect information about their characteristics. The census of
population is the source of information on the size and distribution of the population as well as information about the demographic, social, economic, and cultural characteristics. These information are vital for making rational plans and programs for national and local development. Using 12:01 in the morning of August 1, 2007 as reference period, all persons were enumerated in their usual place of residence, which is the geographic place (street, barangay, sitio, municipality, or province) where the persons usually reside.
Definition of Terms
Growth rate – the rate at which the population is increasing or decreasing in a given year due to natural increase and net migration, expressed as a percentage of the base population Household – a social unit consisting of persons or a group of persons who sleep in the same housing unit and have common arrangements in the preparation and consumption of food Institutional population – the population enumerated in institutional living quarters or institutions such as jails or prisons, military camps, convents or seminaries, mental hospitals, leprosaria, and the like Total population – the sum of household population and institutional population Average household size – the average number of persons who live in the household, computed as the household

14 JOURNAL OF PHILIPPINE STATISTICS
population in a given area divided by the corresponding total number of households in that area Sex ratio – the ratio of males to females in a given population, expressed as the number of males per 100 females Median age – the age at which exactly half of the population is younger than that age and the other half is older than it Overall dependency ratio – the ratio of persons in the dependent ages (under 15 years and over 64 years) to persons in the working ages (15 to 64 years).
Analysis of Tables
Total population rises to 236,390 persons
The total population of Lucena City as of August 1, 2007 was 236,390 persons, an increase of 40,315 persons over its total population of 196,075 persons in 2000. This 2007 figure translated to an annual population growth rate of 2.61 percent for the period 2000 to
2007. This was 0.49 percentage point higher than the 2.12 percent annual population growth rate recorded from 1995 to 2000 (Table 1.1). Gulang-gulang is most populated barangay Of this highly urbanized city's 33 barangays, Barangay Gulang-gulang (11.2 percent) was the most populated, followed by Ibabang Dupay (10.7 percent), and Ibabang Iyam (9.6 percent). Barangay 6-Poblacion (0.4 percent) was the least populated barangay (Table 1.1). Average household size is about five members
The number of households increased by 8,985 from 40,261 in 2000 to 49,246 in 2007 (Table 1.1). Household population likewise increased to 234,935 persons in 2007 from 195,248 persons in 2000 (Table 1.2). These figures resulted to an average household size of 4.8 persons in 2007, almost the same average household size (4.9 persons) recorded in 2000.
Sex ratio increases to 99 males per 100 females
FIGURE 1 Total Population of Top 10 Barangays
Lucena City: 2007
Total Population
FIGURE 2 Age-Sex Pyramid of Household Population Lucena City: 2007
Age
Gro
up
Percent to household population

POPULATION AND HOUSING 15
Of the household population, females (50.2 percent) outnumbered their male counterparts (49.8 percent) for a sex ratio of 99 males for every 100 females. In 2000, the sex ratio was computed at 98 males per 100 females (Table 1.2).
Median age remains at 21 years
The household population of Lucena City posted a median age of 21 years in 2007, which means that one half of the city’s household population was below 21 years old. This was the same as the median age recorded in 2000.
About one in every three persons
(35.6%) were under 15 years old. The highest share was noted in age group under 5 years (12.4%), followed by age group 5-9 years (11.8%), and 10-14 years (11.5%). Males dominated the household population in age groups 0-14 years, 20-24 years, and 30-39 years while females outnumbered the males in the remaining age groups (Table 1.2).
There are more female voters than male voters In 2007, the city’s voting-age population (18 years and over) accounted for 57.7 percent of the household population. This was slightly higher than the proportion of voting-age population (57.0 percent) registered in 2000. Moreover, the proportion of female voters (51.1 percent) was higher than that of the males (48.9 percent). Overall dependency ratio declines to 64 per 100 working population
The proportion of young dependents (0 to 14 years) to household population was 35.6 percent, while the old dependents (65 years and over) posted a share of 3.4 percent. The working-age population (15 to 64 years), on the other hand, accounted for 61.0 percent of the household population.
The overall dependency ratio for Lucena City was 63.9, or about 64 dependents (58 young and 6 old dependents) for every 100 working-age population. The dependency ratio in 2007 was lower than the dependency ratio registered in 2000 which was 65.7 per 100 working-age population.
About two in every five persons are single
In 2007, about two fifths (44.4 percent) of the household population 10 years old and over were single, while 41.9 percent were married. Comparing these with the 2000 figures, a lower proportion of single persons (40.7 percent) and higher proportion of married persons (46.3 percent) were observed in 2000. The rest (13.7 percent) of the household population 10 years old and over were either widowed, divorced or separated, had common-law or live-in arrangement, or had unknown marital status.
Males dominated the single (52.6
percent of single persons) population 10 years old and over. The rest of the categories for marital status were dominated by females (Table 1.3).
More females pursue higher education than males
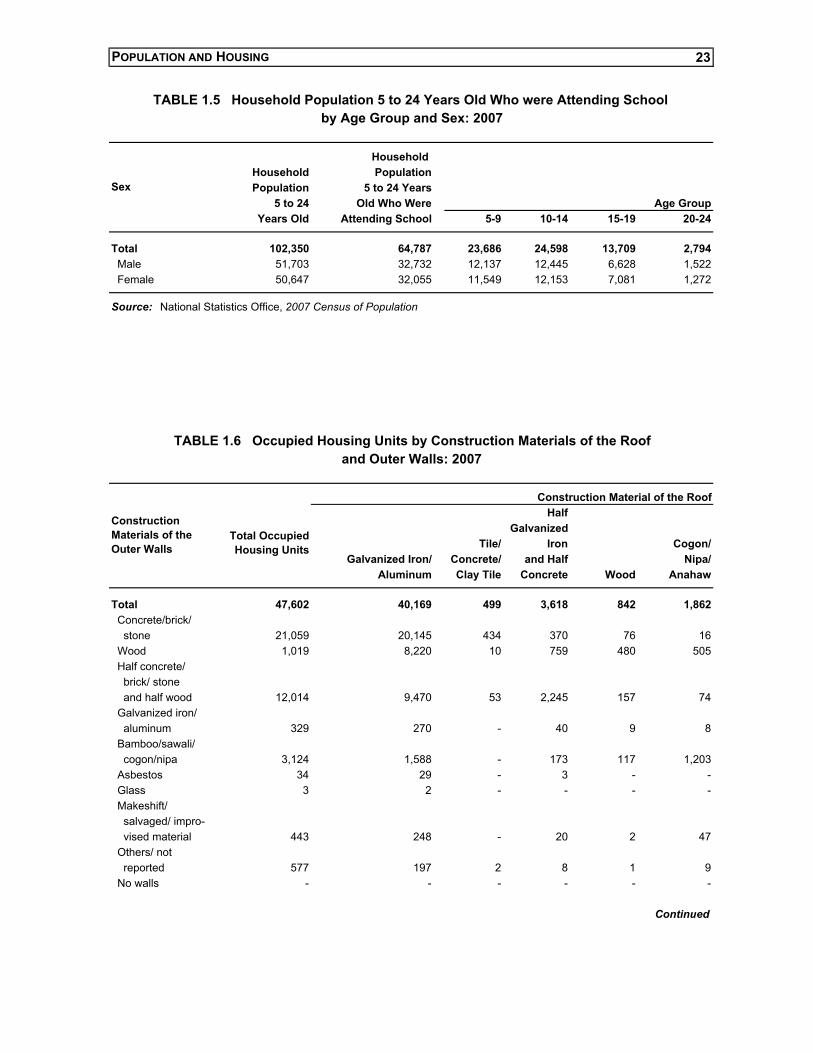
Of the total household population five years old and over, 32.9 percent had attended or completed elementary education, 34.4 percent reached high school, 9.3 percent were college undergraduates, and 8.3 percent were academic degree holders. Majority of the academic degree holders (54.9 percent) and those with post baccalaureate courses (55.7 percent) were females.
In 2007, 63.3 percent of the
household population 5 to 24 years old attended school at anytime during School Year 2007 to 2008. Of these, there was an almost equal proportion of males (50.5%) and females (49.5%).

16 JOURNAL OF PHILIPPINE STATISTICS
Five persons occupy a housing unit
The total occupied housing units in Lucena City numbered 47,602 in 2007. This translated to a ratio of 103 households for every 100 occupied housing units, or five persons per occupied housing unit. The same ratio was derived during the 2000 Census.
There are more occupied housing units with strong materials of roofs and outer walls
Most of the occupied housing units in the province in 2007 had outer walls made of concrete/brick/stone (44.2 percent), up by 8.3 percentage points from the proportion of the same type of housing units in 2000. Meanwhile, majority (84.4 percent) of the occupied housing units in 2007 had roofs made of galvanized iron/aluminum, indicating an increase of 4.6 percentage points from the 2000 figure (Table 1.6).
Private Building Construction Statistics Second Quarter 2008 Scope and Coverage
Private construction statistics from approved building permits relate to data on new constructions and additions, alterations, and repairs of residential and non-residential buildings and other structures undertaken in all regions and provinces of the country.
Sources of Information
Data were taken from the original application forms of approved building permits collected by NSO field personnel from local building officials nationwide.
Limitations
Data on private building constructions refer to those proposed to be constructed or construction work started during the reference period and not to construction work completed during the reference period.
The completeness of the number
of building permits collected relies on the applications filed and approved by the offices of Local Building Officials (LBOs). Hence, private building constructions without approved building permits are not included in the tabulation of data. Definition of Terms Building permit – a written authorization granted by the LBO to an applicant allowing him to proceed with the construction of a specific project after plans, specifications, and other pertinent documents have been found to be in conformity with the National Building Code (PD 1096) Building – any independent, free standing structure comprising of one or more rooms or other spaces, covered by a roof and enclosed with external walls or dividing walls, which extend the foundation to the roof Residential building – a building for which its major parts or more than half of its gross floor area is built for dwelling purposes; this type of building can be of the single type, duplex, an apartment and/or accessoria, and residential condominium Single house – a complete structure intended for a single family Duplex – a structure intended for two households with complete living facilities for each; a single structure divided into

POPULATION AND HOUSING 17
two dwelling units by a wall extending from the floor to the ceiling Apartment – a structure, usually of two storeys, made up of independent living quarters, with independent entrances from internal walls and courts Accessoria – a one-or two-floor structure divided into several dwelling units, each dwelling unit having its own separate entrance from the outside Residential condominium – a structure, usually of several storeys, consisting of multiple dwelling units Other residential constructions – consist of school or company staff houses, living quarters for drivers and maids, and guardhouses Non-residential building – this type includes commercial, industrial, agricultural, and institutional buildings Additions or alterations and repairs – construction works by which the utility of building or structure is raised or at least renewed, or which materially extends the normal life of the building or structure
Demolitions – the systematic dismantling or destruction of a building or structure or in part Street furniture - street structures consisting of monuments, waiting sheds benches, plant boxes, lampposts, electric poles, and telephone poles Floor area of building – the sum of the area of each floor of the building measured to the outer surface of the outer walls including the area of lobbies, cellars, elevator shafts, and all communal
spaces in multidwellings; areas of balconies are excluded Total value of construction – the sum of the cost of building, electrical, mechanical, plumbing, and others; the value is derived from the approved building permit and represents the estimated value of the building or structure when completed.
Analysis of Tables
Approved building permits up 9.3 percent
Approved building permits
nationwide were recorded at 25,145 during the second quarter of 2008, representing an increase of 9.3 percent compared with 23,003 applications received during the same period of 2007.
An increase in applications was
observed for both residential and nonresidential building construction. Residential building construction went up by 16.9 percent to 18,451 from 15,781 approved building permits during the same quarter of 2007. Nonresidential
FIGURE 3 Number of Building Construction by Type
Second Quarter 2007 and 2008
0
2,000
4,000
6,000
8,000
10,000
12,000
14,000
16,000
18,000
20,000
Resident ial Nonresident ial Addit ions alterat ions
repair
Type of building
Num
ber (
In th
ousa
nd)
2nd Qtr. 2008
2nd Qtr. 2007
20
18
16
14
12
10
8
6
4
2
0
Valu
e (In
bill
ion
peso
s)

18 JOURNAL OF PHILIPPINE STATISTICS
constructions, likewise, increased by 7.5 percent to 2,707 from 2,518 recorded during the same quarter of 2007.
However, combined approved
building permits for additions, alteration and repairs decreased by 15.2 percent to 3,987 from 4,704 approved building permits.
Regionwise, the number of
approved building permits was highest in CALABARZON (Region IV-A) with 5,096 applications or 20.3 percent of total. This was followed by the National Capital Region (NCR) with 4,184 applications or 16.7 percent of the total (Figure 4).
Six (6) provinces registered
approved building permits exceeding more than a thousand mark. These were Bulacan (1,377), Cavite (1,719), Laguna (1,014), Rizal (1,108), Cebu (1,069), and Davao del Sur (1,077).
Total value of construction during
the second quarter of 2008 was estimated at PhP38.3 billion. This figure represents an increase of 29.1 percent from PhP29.7 billion recorded during the same period of
2007.
Value of construction for
residential buildings rose by 36.5 percent to PhP18.3 billion, from PhP13.4 billion recorded during the same period of 2007.
Value of non-residential building construction, likewise, went up by 19.4 percent to PhP16.9 billion from PhP14.1 billion recorded during the same quarter of 2007.
Moreover, combined value for additions, alterations and repairs, estimated at PhP3.1 billion jumped by 46.9 percent from PhP2.1 billion registered during the same quarter of the previous year.
Regionwise, value of construction
in the National Capital Region (NCR) consistently remained highest at PhP20.2 billion, accounting for 52.8 percent share of the total value. CALABARZON and Central Luzon followed a far second and third with shares of 11.8 percent (PhP4.5 billion) and 8.3 percent (PhP3.2 billion), respectively (Table 1.7).
FIGURE 4 Number of Approved Building Permits by Type of Construction Second Quarter 2007 and 2008
FIGURE 5 Value of Construction by Type of Building
Second Quarter 2007 and 2008
0.0
2.0
4.0
6.0
8.0
10.0
12.0
14.0
16.0
18.0
20.0
Residential Nonresidential Additions alterations
repair
Type of building
Valu
e (In
bill
ions
)
2nd Qtr. 20082nd Qtr. 2007
Valu
e ( I
n bi
llion
pes
os)

POPULATION AND HOUSING 19
Average cost per square meter of residential building construction is P7,624
Total value of construction for residential buildings reached PhP18.3 billion with a total floor area of 2.4 million square meters translated to an average cost of PhP7,624 per square meter (Table 1.8).
Majority of residential building construction were for single type residential units with 16,375 approved building permits or 88.7 percent of the total. This type of residential building construction had a total floor area of 1.9 million square meters and an aggregate value of PhP13.0 billion bringing an average cost of PhP6,970 per square meter.
Apartment or accessoria ranked second with 1,442 applications representing 7.8 percent of total residential construction. The total floor area reported for this type was 410.2 thousand square meters with an estimated construction value of PhP4.3 billion or an average cost of P10,556 per square meter (Figure 6).
Average cost per square meter of non-residential building construction is P10,110
Aggregate value of non-residential building construction was estimated at PhP16.9 billion during the second quarter of 2008. The corresponding total floor area was recorded at 1.7 million square meters, translated to an average cost of PhP10,110 per square meter (Table 1.9).
Commercial type of building comprised the bulk or 60.0 percent of the total, with 1,625 approved building permits. Value of construction for this type reached PhP13.0 billion with the total floor area of 1.1 million square meters or an average cost of PhP12,029 per square meter.
Institutional building construction came next with 441 approved building permits (16.3%), total floor area of 297.3 thousand square meters and construction value of PhP2.4 billion.
Agricultural type of non-residential building construction had the least number of approved building permits with 117 or 4.3 percent of the total. Value of construction for this type reached PhP0.1 billion covering a total floor area of 44.5
Residential/Condo and Others
(0.2%)
Duplex (3.2%)
Apartment/ Accessoria
(7.8%)
Value Number
FIGURE 6 Number and Value of Residential Building Construction by Type Second Quarter 2008
Residential/Condo and Others (4.1%)
Duplex (1.4%)
Apartment/ Accessoria
(23.7%)
Single
(70.8%)
Total P18.3B

20 JOURNAL OF PHILIPPINE STATISTICS
thousand square meters or an average cost of PhP3,274 per square meter (Figure 7).
Value
FIGURE 7 Number and Value of Non-residential Building Construction by Type Second Quarter 2008
Commercial (60.0%)
Number
Institutional (16.3%)
Others (10.1%)
Agricultural (4.3%) Industrial
(9.3%)
Institutional (14.1%)
Agricultural (0.9%)
Others (1.6%)
Industrial (6.2%)
Commercial (77.1%)
TOTAL 2,707

POPULATION AND HOUSING 21
Total Household Number Population Population of Households
Lucena City 236,390 234,935 49,246Gulang-gulang 26,550 26,435 5,334Ibabang Dupay 25,355 25,328 5,778Ibabang Iyam 22,753 22,751 4,645Dalahican 21,302 21,302 4,429Cotta 19,596 19,570 3,889Ilayang Iyam 11,914 11,909 2,449Market View 11,720 11,720 2,348Isabang 9,676 9,568 2,081Mayao Crossing 8,904 8,799 1,672Mayao Kanluran 8,243 8,243 1,716
Source: National Statistics Office, 2007 Census of Population
Both Sexes Male Female Sex Ratio
Total 234,935 116,888 118,047 99.0
Under 1 6,362 3,239 3,123 103.71-4 22,668 11,540 11,128 103.75-9 27,648 14,298 13,350 107.110-14 26,945 13,834 13,111 105.515-19 25,831 12,515 13,316 94.020-24 21,926 11,056 10,870 101.725-29 19,523 9,678 9,845 98.330-34 16,146 8,137 8,009 101.635-39 15,379 7,695 7,684 100.140-44 13,150 6,492 6,658 97.545-49 11,202 5,555 5,647 98.450-54 9,190 4,563 4,627 98.655-59 6,583 3,172 3,411 93.060--64 4,447 2,012 2,435 82.665-69 3,124 1,297 1,827 71.070-74 2,162 928 1,234 75.275-79 1,395 514 881 58.380 and over 1,254 363 891 40.7
Source: National Statistics Office, 2007 Census of Population
Age Group
Barangay
TABLE 1.1 Total Population, Household Population, and Number of Households of Top 10 Barangays: 2007
TABLE 1.2 Household Population by Age Group and Sex and Sex Ratio: 2007

JOURNAL OF PHILIPPINE STATISTICS
Both Sexes Male Female
Total 178,257 87,811 90,446Single 79,198 41,670 37,528Married 74,754 38,846 37,908Widowed 8,002 1,626 6,376Divorced/Separated 245 874 1,671Common Law/Live-in 12,479 6,161 6,318Unknown 1,279 634 645
Source: National Statistics Office, 2007 Census of Population
Both Sexes Male Female
Total 205,905 102,109 103,976No grade completed 9,093 4,755 4,338Preschool 5,058 2,670 2,388Elementary 67,669 35,224 32,445High school 70,911 34,356 36,555Post secondary 6,906 3,471 3,435College undergraduate 19,157 9,474 9,683Academic degree holder 17,137 7,724 9,413Post baccalaureate 447 198 249Not stated 9,527 4,237 5,290
Source: National Statistics Office, 2007 Census of Population
Marital Status
TABLE 1.3 Household Population Ten Years Old and Over by Marital Status and Sex
22
Highest Educational Attainment
2007
Attainment and Sex: 2007TABLE 1.4 Household Population 5 Years Old and Over by Highest Educational
POPULATION AND HOUSING 23
Household Household PopulationPopulation 5 to 24 Years
5 to 24 Old Who Were Age GroupYears Old Attending School 5-9 10-14 15-19 20-24
Total 102,350 64,787 23,686 24,598 13,709 2,794 Male 51,703 32,732 12,137 12,445 6,628 1,522 Female 50,647 32,055 11,549 12,153 7,081 1,272
Source: National Statistics Office, 2007 Census of Population
Construction Material of the RoofHalf
GalvanizedTile/ Iron Cogon/
Galvanized Iron/ Concrete/ and Half Nipa/Aluminum Clay Tile Concrete Wood Anahaw
Total 47,602 40,169 499 3,618 842 1,862 Concrete/brick/ stone 21,059 20,145 434 370 76 16 Wood 1,019 8,220 10 759 480 505 Half concrete/ brick/ stone and half wood 12,014 9,470 53 2,245 157 74 Galvanized iron/ aluminum 329 270 - 40 9 8 Bamboo/sawali/ cogon/nipa 3,124 1,588 - 173 117 1,203 Asbestos 34 29 - 3 - - Glass 3 2 - - - - Makeshift/ salvaged/ impro- vised material 443 248 - 20 2 47 Others/ not reported 577 197 2 8 1 9 No walls - - - - - -
Continued
and Outer Walls: 2007
Total Occupied Housing Units
Construction Materials of the Outer Walls
TABLE 1.5 Household Population 5 to 24 Years Old Who were Attending School by Age Group and Sex: 2007
Sex
TABLE 1.6 Occupied Housing Units by Construction Materials of the Roof

24 JOURNAL OF PHILIPPINE STATISTICS
Table 1.6 -- Concluded
Construction Material of the RoofMakeshift/Salvaged/ Asbestos/ Not
Improvised Materials Others Reported
Total 163 60 389 Concrete/brick/ stone 1 3 14 Wood 21 7 17 Half concrete/ brick/ stone and half wood 4 1 10 Galvanized iron/ aluminum 1 - 1 Bamboo/sawali/ cogon/nipa 13 22 8 Asbestos - 2 - Glass - - 1 Makeshift/ salvaged/ impro- vised material 123 2 1 Others/ not reported - 23 337 No walls - - -
Source: National Statistics Office, 2007 Census of Population
Construction Materials of the Outer Walls

POPULATION AND HOUSING 25
Num- Floor Num- Floor Num- Floorber Area ber Area ber Area
25,145 4,267,452 38,276,263 18,451 2,401,417 18,308,549 2,707 1,670,150 16,885,735
NCR 4,184 1,490,649 20,215,521 2,321 698,453 7,150,856 681 707,644 11,139,026CAR 234 79,449 487,903 196 59,025 346,150 19 17,682 115,805I - Ilocos Region 1,681 169,195 1,127,886 1,359 138,031 886,175 132 25,125 180,789II - Cagayan Valley 604 70,619 474,193 430 43,298 278,534 59 27,171 185,882III - Central Luzon 3,771 469,915 3,168,855 2,996 281,315 1,858,378 370 162,404 1,128,706IVA - CALABARZON 5,096 538,953 4,521,900 4,353 433,878 3,460,400 227 88,754 770,626IVB - MIMAROPA 338 41,417 348,262 224 28,172 198,215 90 12,564 115,211V - Bicol Region 415 70,252 417,857 287 49,972 277,418 44 18,307 95,551VI - Western Visayas 1,074 178,891 1,240,832 754 101,585 371,842 146 66,603 349,550VII - Central Visayas 2,106 461,328 2,099,211 1,794 216,388 1,046,951 219 241,517 10,033,111VIII - Eastern Visayas 544 90,768 514,174 326 30,663 187,575 125 56,272 299,778IX - Zamboanga Peninsula 448 69,559 306,079 302 27,080 154,256 51 41,811 137,489X - Northern Mindanao 1,555 157,508 822,721 1,042 104,764 551,423 119 46,156 209,373XI - Davao Region 2,037 262,414 1,778,421 1,390 123,887 818,114 257 110,148 810,870XII - SOCCSKSARGEN 464 63,511 433,085 272 29,729 192,496 108 31,841 207,368XIII - Caraga 594 53,024 319,355 405 35,177 169,760 60 16,151 136,394ARMM - - - - - - - - -
Value
TABLE 1.7 Number, Floor Area, and Value of Building Constructionby Type of Building, and Region: Second Quarter 2008
(Floor Area in Square Meters, Value in Thousand Pesos)
Philippines
RegionTotal Residential
Value Value
Nonresidential
Num- Floor Num- Num- Num-ber Area ber ber ber
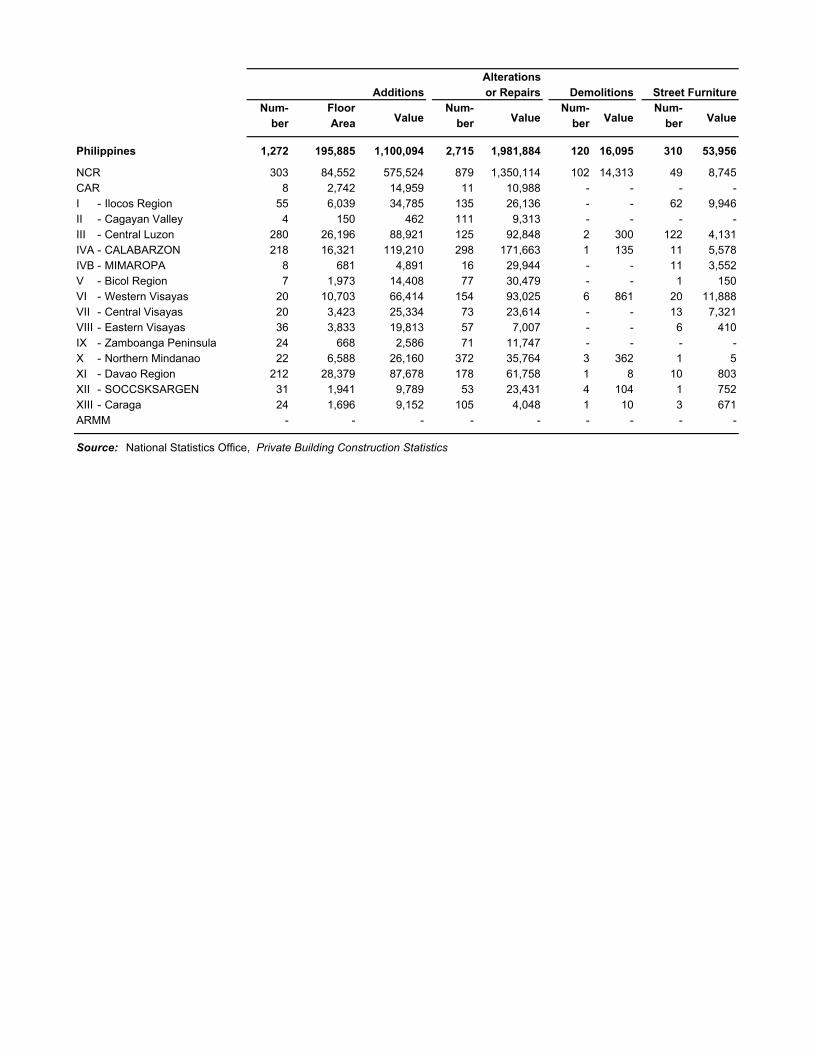
Philippines 1,272 195,885 1,100,094 2,715 1,981,884 120 16,095 310 53,956
NCR 303 84,552 575,524 879 1,350,114 102 14,313 49 8,745CAR 8 2,742 14,959 11 10,988 - - - -I - Ilocos Region 55 6,039 34,785 135 26,136 - - 62 9,946II - Cagayan Valley 4 150 462 111 9,313 - - - -III - Central Luzon 280 26,196 88,921 125 92,848 2 300 122 4,131IVA - CALABARZON 218 16,321 119,210 298 171,663 1 135 11 5,578IVB - MIMAROPA 8 681 4,891 16 29,944 - - 11 3,552V - Bicol Region 7 1,973 14,408 77 30,479 - - 1 150VI - Western Visayas 20 10,703 66,414 154 93,025 6 861 20 11,888VII - Central Visayas 20 3,423 25,334 73 23,614 - - 13 7,321VIII - Eastern Visayas 36 3,833 19,813 57 7,007 - - 6 410IX - Zamboanga Peninsula 24 668 2,586 71 11,747 - - - -X - Northern Mindanao 22 6,588 26,160 372 35,764 3 362 1 5XI - Davao Region 212 28,379 87,678 178 61,758 1 8 10 803XII - SOCCSKSARGEN 31 1,941 9,789 53 23,431 4 104 1 752XIII - Caraga 24 1,696 9,152 105 4,048 1 10 3 671ARMM - - - - - - - - -
Source: National Statistics Office, Private Building Construction Statistics
Value ValueValue Value
AlterationsAdditions or Repairs Demolitions Street Furniture

26 JOURNAL OF PHILIPPINE STATISTICS
Num- Floor Num- Floor Num- Floorber Area ber Area ber Area
18,451 2,401,417 18,308,549 16,375 1,860,525 12,967,146 591 46,190 260,893
NCR 2,321 698,453 7,150,856 1,777 377,908 3,140,726 51 9,639 77,962CAR 196 59,025 346,150 129 17,389 122,037 1 144 639I - Ilocos Region 1,359 138,031 886,175 1,343 135,932 869,938 4 524 2,873II - Cagayan Valley 430 43,298 278,534 392 40,065 263,680 - - -III - Central Luzon 2,996 281,315 1,858,378 2,073 221,589 1,563,366 372 14,116 66,928IVA - CALABARZON 4,353 433,878 3,460,400 4,056 400,114 3,239,525 82 7,640 46,763IVB - MIMAROPA 224 28,172 198,215 204 25,487 179,348 2 257 2,019V - Bicol Region 287 49,972 277,418 270 47,500 259,626 7 892 8,260VI - Western Visayas 754 101,585 731,842 737 90,449 639,820 8 1,331 8,039VII - Central Visayas 1,794 216,388 1,046,951 1,743 179,774 850,916 22 7,689 29,906VIII - Eastern Visayas 326 30,663 187,575 296 28,998 174,334 21 693 6,307IX - Zamboanga Peninsula 302 27,080 154,256 301 26,800 153,638 - - -X - Northern Mindanao 1,390 104,764 551,423 1,016 99,002 515,023 15 706 2,323XI - Davao Region 272 123,887 818,114 1,380 108,451 654,025 4 2,122 7,732XII - SOCCSKSARGEN 405 29,729 192,496 263 27,997 180,145 1 89 790XIII - Caraga 35,177 169,760 395 33,070 160,992 1 348 348ARMM - - - - - - - - -
Num- Floor Num- Floor Num- Floorber Area ber Area ber Area
1,442 410,256 4,330,487 9 79,760 719,900 34 4,686 30,121
NCR 489 266,461 3,551,539 4 44,445 380,628 - - -CAR 62 34,460 142,687 2 6,660 77,728 2 372 3,058I - Ilocos Region 11 1,530 13,070 - - - 1 45 292II - Cagayan Valley 38 3,233 14,854 - - - - - -III - Central Luzon 549 45,534 227,242 - - - 2 76 841IVA - CALABARZON 206 25,071 167,544 - - - 9 1,053 6,566IVB - MIMAROPA 8 946 10,635 - - - 10 1,482 6,212V - Bicol Region 2 522 938 - - - 8 1,058 8,592VI - Western Visayas 9 9,805 83,982 - - - - - -VII - Central Visayas 28 13,262 58,283 1 15,663 107,845 - - -VIII - Eastern Visayas 8 730 4,196 - - - 1 242 2,737IX - Zamboanga Peninsula 1 280 618 - - - - - -X - Northern Mindanao 10 4,698 32,256 - - - 1 358 1,820XI - Davao Region 4 322 2,657 2 12,992 153,698 - - -XII - SOCCSKSARGEN 8 1,643 11,560 - - - - - -XIII - Caraga 9 1,759 8,419 - - - - - -ARMM - - - - - - - - -
Source: National Statistics Office, Private Building Construction Statistics
Value Value Value
Philippines
Philippines
Apartment or Accessoria Residential Condominium Others
Region ValueValue Value
TABLE 1.8 Number of Residential Building Construction Started, Floor Area, and Valueof Construction by Type of Building and Region: Second Quarter 2008
(Floor Area in Square Meters, Value in Thousand Pesos)
Total Single Duplex or Quadruplex

POPULATION AND HOUSING 27
Num- Floor Num- Floor Num- Floorber Area ber Area ber Area
2,707 1,670,150 16,885,735 1,625 1,083,011 13,027,800 251 245,324 1,054,459
NCR 681 707,644 11,139,026 520 624,776 10,080,125 31 22,722 245,620CAR 19 17,682 115,805 6 7,474 40,737 1 232 1,142I - Ilocos Region 132 25,125 180,789 74 13,725 102,053 8 2,143 13,924II - Cagayan Valley 59 27,171 185,882 30 9,164 59,424 5 2,715 13,305III - Central Luzon 370 162,404 1,128,706 188 72,030 507,404 26 21,996 69,366IVA - CALABARZON 227 88,754 770,626 106 30,524 246,629 37 24,367 190,174IVB - MIMAROPA 90 12,564 115,211 62 8,326 76,513 5 885 2,089V - Bicol Region 44 18,307 95,551 36 16,961 83,977 - - -VI - Western Visayas 146 66,603 349,550 90 40,275 209,869 16 14,056 36,571VII - Central Visayas 219 241,517 1,003,311 147 100,749 649,686 21 87,617 137,762VIII - Eastern Visayas 125 56,272 299,778 52 41,788 201,652 11 1,668 9,817IX - Zamboanga Peninsula 51 41,811 137,489 37 30,471 78,656 5 1,978 15,220X - Northern Mindanao 119 46,156 209,373 40 11,225 80,647 22 9,005 43,659XI - Davao Region 257 110,148 810,870 148 53,661 495,582 42 43,578 204,091XII - SOCCSKSARGEN 108 31,841 207,368 63 16,329 81,333 10 7,801 62,695XIII - Caraga 60 16,151 136,394 26 5,503 33,506 11 4,561 9,017ARMM - - - - - - - - -
Institutional AgriculturalNum- Floor Num- Floor
ber Area ber Area
441 297,280 2,390,478 117 44,535 145,801 273 267,195
NCR 48 60,146 690,360 - - - 82 122,920CAR 12 9,976 73,924 - - - - -I - Ilocos Region 24 5,189 43,847 18 4,068 13,219 8 7,744II - Cagayan Valley 18 12,665 103,767 3 2,627 5,357 3 4,027III - Central Luzon 80 66,427 505,765 30 1,951 16,570 46 29,600IVA - CALABARZON 62 33,196 303,467 3 667 1,938 19 28,417IVB - MIMAROPA 13 3,340 27,088 1 13 170 9 9,349V - Bicol Region 7 1,346 10,524 - - - 1 1,050VI - Western Visayas 19 12,267 81,638 1 5 130 20 21,341VII - Central Visayas 28 50,639 202,520 9 2,512 6,361 14 6,980VIII - Eastern Visayas 54 12,816 83,323 - - - 8 4,984IX - Zamboanga Peninsula 4 1,998 13,231 2 7,364 28,320 3 2,061X - Northern Mindanao 15 3,701 21,114 34 22,195 59,709 8 4,242XI - Davao Region 29 11,176 101,296 10 1,733 6,144 28 3,755XII - SOCCSKSARGEN 20 6,472 43,193 4 1,239 7,190 11 12,955XIII - Caraga 8 5,926 85,416 2 161 689 13 7,764ARMM - - - - - - - -
Source: National Statistics Office, Private Building Construction Statistics
Philippines
Philippines
Others
Value Value Number Value
TABLE 1.9 Number of New Non-residential Building Construction Started, Floor Area and Valueof Construction by Type of Building and Region: Second Quarter 2008
(Floor Area in Square Meters, Value in Thousand Pesos)
RegionTotal Commercial Industrial
Value ValueValue

28 JOURNAL OF PHILIPPINE STATISTICS
Num- Floor Num- Floor Num- Floorber Area ber Area ber Area
1,625 1,083,011 13,027,800 52 14,570 114,807 200 235,179 6,653,112
NCR 520 624,776 10,080,125 10 2,385 21,323 21 180,954 6,198,166CAR 6 7,474 40,737 - - - 1 210 1,332I - Ilocos Region 74 13,725 102,053 6 3,953 34,297 15 1,165 8,675II - Cagayan Valley 30 9,164 59,424 1 860 14,446 1 1,325 2,815III - Central Luzon 188 72,030 507,404 7 1,095 6,605 12 7,361 59,589IVA - CALABARZON 106 30,524 246,629 4 446 3,641 13 12,828 120,675IVB - MIMAROPA 62 8,326 76,511 1 57 551 39 2,635 24,031V - Bicol Region 36 16,961 83,977 3 533 3,201 4 2,063 10,787VI - Western Visayas 90 40,275 209,869 - - - 12 3,024 16,377VII - Central Visayas 147 100,749 649,686 7 3,604 15,706 38 12,222 130,323VIII - Eastern Visayas 52 41,788 201,652 2 238 3,152 9 3,414 25,518IX - Zamboanga Peninsula 37 30,471 78,655 1 56 400 2 441 2,721X - Northern Mindanao 40 11,255 80,647 1 - 807 4 1,293 5,309XI - Davao Region 148 53,661 495,582 4 769 7,662 17 2,980 30,502XII - SOCCSKSARGEN 63 16,329 81,333 5 574 3,010 7 1,893 7,696XIII - Caraga 26 5,503 33,506 - - - 5 1,371 8,586ARMM - - - - - - - - -
Num- Floor Num- Floor Num- Floorber Area ber Area ber Area
585 577,049 4,521,066 551 200,761 1,286,263 237 55,452 452,549
NCR 345 386,023 3,259,834 102 40,332 432,885 42 15,082 167,915CAR 3 7,153 38,704 1 105 604 1 6 95I - Ilocos Region 7 1,438 11,867 28 4,292 21,022 18 2,877 26,189II - Cagayan Valley 3 542 5,000 25 6,437 37,163 - - -III - Central Luzon 56 20,464 170,812 72 36,503 209,918 41 6,607 60,477IVA - CALABARZON 17 8,257 70,146 44 4,120 24,225 28 4,873 27,938IVB - MIMAROPA 4 994 14,337 7 2,189 22,687 11 2,451 14,903V - Bicol Region 16 11,220 57,678 9 2,503 9,209 4 642 3,100VI - Western Visayas 18 9,397 65,392 40 25,174 113,022 20 2,680 15,077VII - Central Visayas 19 56,238 216,323 67 24,200 221,828 16 4,485 65,504VIII - Eastern Visayas 20 35,869 153,424 16 1,726 14,512 5 541 5,043IX - Zamboanga Peninsula 6 2,303 16,920 21 26,409 51,228 7 1,262 7,386X - Northern Mindanao 20 7,192 58,054 12 2,153 13,609 3 617 2,865XI - Davao Region 32 24,464 344,567 72 18,069 85,260 23 7,379 27,588XII - SOCCSKSARGEN 15 3,653 25,972 24 5,133 20,779 12 5,076 23,873XIII - Caraga 4 1,842 12,027 11 1,416 8,304 6 874 4,587ARMM - - - - - - - - -
Source: National Statistics Office, Private Building Construction Statistics
Store
TABLE 1.10 Number of Commercial Building Construction Started, Floor Area, and Valueof Construction by Type of Building, by Region and Province: Second Quarter 2008
(Floor Area in Square Meters, Value in Thousand Pesos)
Region Total Banks Hotel, Motel, and the Like
Value
Philippines
Value Value
Others
Value Value Value
Philippines
Condominium or Office Building
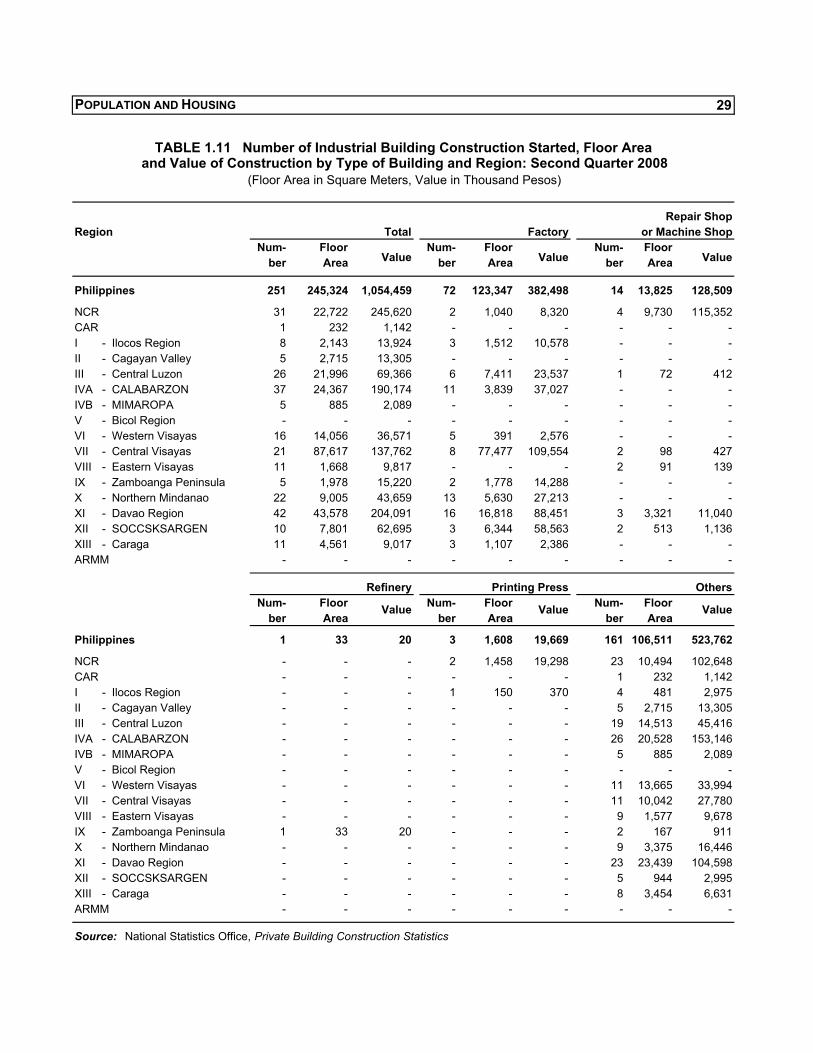
POPULATION AND HOUSING 29
Repair ShopRegion
Num- Floor Num- Floor Num- Floorber Area ber Area ber Area
251 245,324 1,054,459 72 123,347 382,498 14 13,825 128,509
NCR 31 22,722 245,620 2 1,040 8,320 4 9,730 115,352CAR 1 232 1,142 - - - - - -I - Ilocos Region 8 2,143 13,924 3 1,512 10,578 - - -II - Cagayan Valley 5 2,715 13,305 - - - - - -III - Central Luzon 26 21,996 69,366 6 7,411 23,537 1 72 412IVA - CALABARZON 37 24,367 190,174 11 3,839 37,027 - - -IVB - MIMAROPA 5 885 2,089 - - - - - -V - Bicol Region - - - - - - - - -VI - Western Visayas 16 14,056 36,571 5 391 2,576 - - -VII - Central Visayas 21 87,617 137,762 8 77,477 109,554 2 98 427VIII - Eastern Visayas 11 1,668 9,817 - - - 2 91 139IX - Zamboanga Peninsula 5 1,978 15,220 2 1,778 14,288 - - -X - Northern Mindanao 22 9,005 43,659 13 5,630 27,213 - - -XI - Davao Region 42 43,578 204,091 16 16,818 88,451 3 3,321 11,040XII - SOCCSKSARGEN 10 7,801 62,695 3 6,344 58,563 2 513 1,136XIII - Caraga 11 4,561 9,017 3 1,107 2,386 - - -ARMM - - - - - - - - -
Num- Floor Num- Floor Num- Floorber Area ber Area ber Area
1 33 20 3 1,608 19,669 161 106,511 523,762
NCR - - - 2 1,458 19,298 23 10,494 102,648CAR - - - - - - 1 232 1,142I - Ilocos Region - - - 1 150 370 4 481 2,975II - Cagayan Valley - - - - - - 5 2,715 13,305III - Central Luzon - - - - - - 19 14,513 45,416IVA - CALABARZON - - - - - - 26 20,528 153,146IVB - MIMAROPA - - - - - - 5 885 2,089V - Bicol Region - - - - - - - - -VI - Western Visayas - - - - - - 11 13,665 33,994VII - Central Visayas - - - - - - 11 10,042 27,780VIII - Eastern Visayas - - - - - - 9 1,577 9,678IX - Zamboanga Peninsula 1 33 20 - - - 2 167 911X - Northern Mindanao - - - - - - 9 3,375 16,446XI - Davao Region - - - - - - 23 23,439 104,598XII - SOCCSKSARGEN - - - - - - 5 944 2,995XIII - Caraga - - - - - - 8 3,454 6,631ARMM - - - - - - - - -
Source: National Statistics Office, Private Building Construction Statistics
TABLE 1.11 Number of Industrial Building Construction Started, Floor Area and Value of Construction by Type of Building and Region: Second Quarter 2008
(Floor Area in Square Meters, Value in Thousand Pesos)
Philippines
Total Factory or Machine Shop
Philippines
Value ValueValue
Refinery Printing Press Others
Value Value Value

30
Labor Force Survey July 2008
Concepts and Definitions
The Labor Force Survey (LFS) is a nationwide survey of households conducted quarterly by the National Statistics Office (NSO) to gather data on demographic and socioeconomic characteristics of the population. Data presented are based on the preliminary results of the July 2008 round of the LFS.
For comparative purposes, aside from the July 2008 results, the textual tables presented herein contain final estimates of the survey conducted in July 2007.
The reference period used in the
survey is the past seven days preceding the date of visit of the enumerator.
The concepts and definitions
used in the survey can be found in the regular NSO - Integrated Survey of
Households (ISH) Bulletin. Some are given below:
Labor force – the population 15
years old and over which contributes to the production of goods and services in the country; comprises the employed and unemployed
Employed – persons in the labor
force who are reported as either at work or with a job or business although not at work; persons at work are those who did some work, even for an hour during the reference period
Unemployed – persons in the
labor force who have no job or business during the reference period and are reportedly looking for work; their desire to work is sincere and they are, therefore, serious about working; also included are persons without a job or business who are reportedly not looking for work because of the belief that no work was available or because of temporary illness, bad weather, or other valid reasons
Underemployed – employed
persons who express the desire to have additional hours of work in their present job or an additional job, or have a new job with longer working hours
Labor force participation rate
(LFPR) – ratio of total labor force to the total household population 15 years old and over
Employment rate – proportion of
employed persons to the total labor force
Unemployment rate – proportion of unemployed persons to the total labor force
Section II - LABOR AND EMPLOYMENT
LABOR AND EMPLOYMENT 31
Underemployment rate – proportion of underemployed persons to total employed persons.
Analysis of Tables
Employment rate remains stable at 92.6 percent
The employment rate estimated
for July 2008 was 92.6 percent. This implies that nine in every 10 persons in the labor force were employed in July 2008. The current figure is not significantly different from the July 2007 rate which is 92.2 percent (Table 2.3). Labor force participation rate rises to 63.6 percent
The July 2008 LFS also revealed
that the labor force participation rate is 64.3 percent. This means that the size of the labor force in July 2008 was approximately 37.3 million out of the estimated 58.1 million population 15 years and older for that period. Compared to the labor force participation rate in July 2007 (63.6%), the July 2008 rate is higher (Table 2.3).
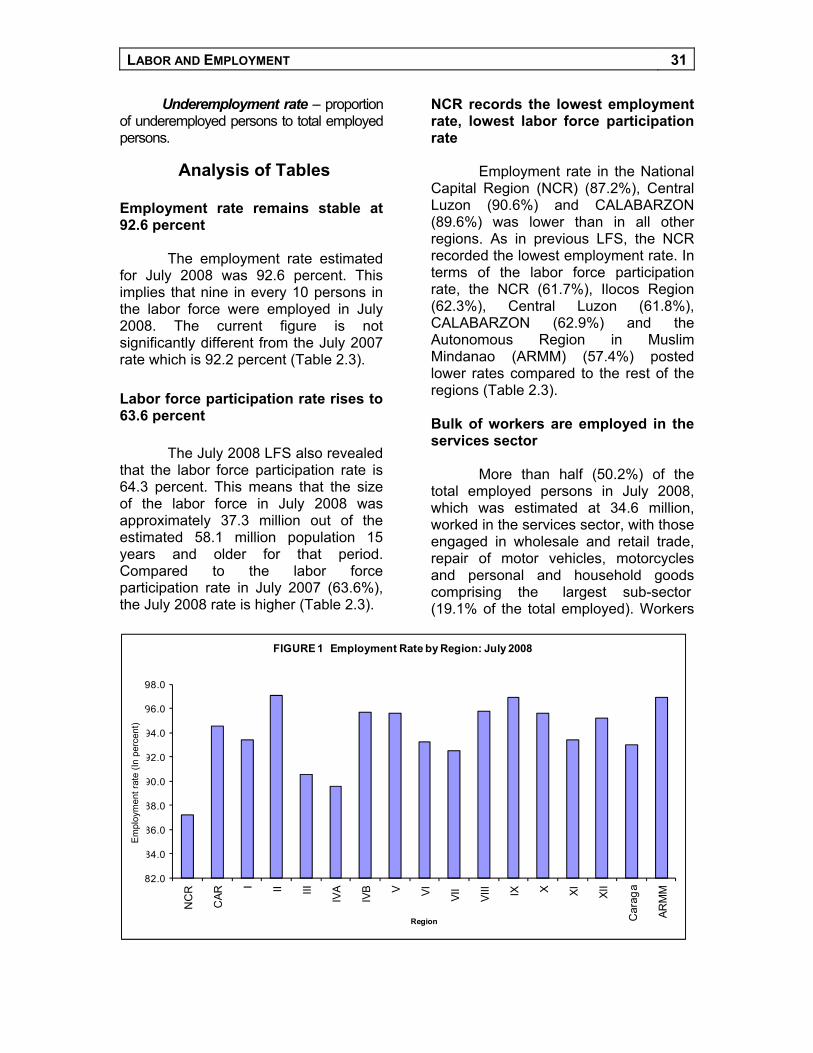
NCR records the lowest employment rate, lowest labor force participation rate
Employment rate in the National
Capital Region (NCR) (87.2%), Central Luzon (90.6%) and CALABARZON (89.6%) was lower than in all other regions. As in previous LFS, the NCR recorded the lowest employment rate. In terms of the labor force participation rate, the NCR (61.7%), Ilocos Region (62.3%), Central Luzon (61.8%), CALABARZON (62.9%) and the Autonomous Region in Muslim Mindanao (ARMM) (57.4%) posted lower rates compared to the rest of the regions (Table 2.3).
Bulk of workers are employed in the services sector
More than half (50.2%) of the
total employed persons in July 2008, which was estimated at 34.6 million, worked in the services sector, with those engaged in wholesale and retail trade, repair of motor vehicles, motorcycles and personal and household goods comprising the largest sub-sector (19.1% of the total employed). Workers
82.0
84.0
86.0
88.0
90.0
92.0
94.0
96.0
98.0
NC
R
CAR
I II III
IVA
IVB V VI VII
VIII IX X XI XII
Car
aga
ARM
M
Num
ber
(In p
erce
nt)
Region
FIGURE 1 Employment Rate by Region: July 2008
Em
ploy
men
t rat
e (In
per
cent
)

32 JOURNAL OF PHILIPPINE STATISTICS
in the agriculture sector comprised 35.0 percent of the total employed, with workers in agriculture; hunting and forestry making up the largest sub-sector (30.9% of the total employed). Only 14.8 percent of the total employed were in the industry sector, with the manufacturing sub-sector making up the largest percentage (8.5% of the total employed) (Table 2.1).
Laborers and unskilled workers comprise the biggest group
Among the various occupation
groups, laborers and unskilled workers comprised the largest group, posting 32.4 percent of the total employed persons in July 2008. Farmers, forestry workers and fishermen were the second largest group, accounting for 17.7 percent of the total employed population (Table 2.1).
FIGURE 2 Labor Force Participation Rate by Region: July 2008
0.0
10.0
20.0
30.0
40.0
50.0
60.0
70.0
80.0
Region
Labo
rFor
cePa
rtic
ipat
ion
Rat
e(In
perc
ent)
FIGURE 3 Employed Persons by Occupation Group: July 2008
-
5.0
10.0
15.0
20.0
25.0
30.0
35.0
Labor er s andunski l led wor ker s
Far mer s, f or estr ywor ker s, andf isher men
Of f icials ofgover nment andspecial inter estor ganizations,
cor por ateexecutives,manager s,managing
pr opr ietor s andsuper visor s
Ser vice wor ker sand shop andmar ket sales
wor ker s
Tr ades and r elatedwor ker s
Plant and machineoper ator s andassembler s
Cler ks Pr of essionals Technicians andassociate
pr of essionals
Specialoccupations
Ty pe of oc c upa t i on
FIGURE 3 Employed Persons by Occupation Group: July 2008
Type of occupation
Num
ber
(In p
erce
nt)
Laborers Farmers Officials of Service Trade and Plant Clerks Professionals Technicians Special unskilled forestry government workers related and machine and associate occu- workers workers and special and shop workers operators professionals pations and interest orga- market assemblers fishermen nization, cor- porate executives managers, managing pro- praetors and supervisors
Type of occupation
0.0
10.0
20.0
30.0
40.0
50.0
60.0
70.0
80.0
NC
R
CA
R I II III
IVA
IVB V VI
VII VIII IX X X
I
XII
Car
aga
AR
MM
Num
ber (
In p
erce
nt)
Region
FIGURE 2 Labor Force Participation Rate by Region: July 2008
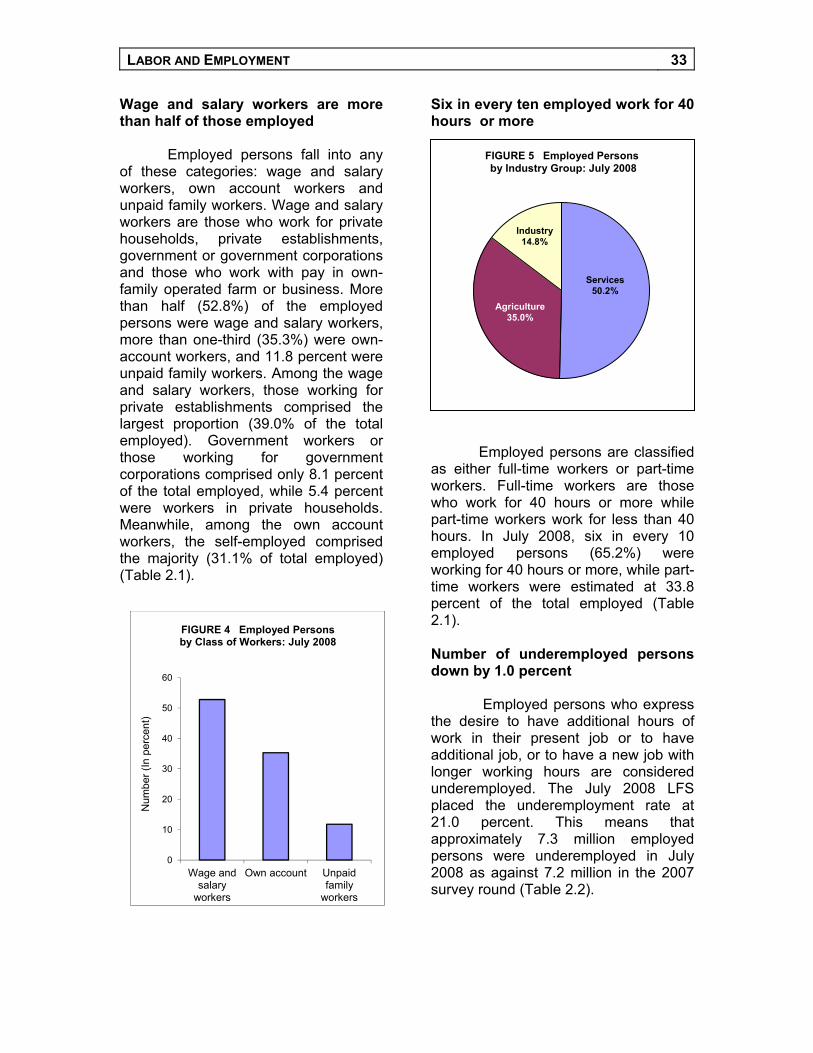
LABOR AND EMPLOYMENT 33
Wage and salary workers are more than half of those employed
Employed persons fall into any
of these categories: wage and salary workers, own account workers and unpaid family workers. Wage and salary workers are those who work for private households, private establishments, government or government corporations and those who work with pay in own-family operated farm or business. More than half (52.8%) of the employed persons were wage and salary workers, more than one-third (35.3%) were own-account workers, and 11.8 percent were unpaid family workers. Among the wage and salary workers, those working for private establishments comprised the largest proportion (39.0% of the total employed). Government workers or those working for government corporations comprised only 8.1 percent of the total employed, while 5.4 percent were workers in private households. Meanwhile, among the own account workers, the self-employed comprised the majority (31.1% of total employed) (Table 2.1).
Six in every ten employed work for 40 hours or more
Employed persons are classified
as either full-time workers or part-time workers. Full-time workers are those who work for 40 hours or more while part-time workers work for less than 40 hours. In July 2008, six in every 10 employed persons (65.2%) were working for 40 hours or more, while part-time workers were estimated at 33.8 percent of the total employed (Table 2.1). Number of underemployed persons down by 1.0 percent
Employed persons who express
the desire to have additional hours of work in their present job or to have additional job, or to have a new job with longer working hours are considered underemployed. The July 2008 LFS placed the underemployment rate at 21.0 percent. This means that approximately 7.3 million employed persons were underemployed in July 2008 as against 7.2 million in the 2007 survey round (Table 2.2).
FIGURE 5 Employed Persons by Industry Group: July 2008
Services 50.2%
Agriculture 35.0%
Industry 14.8%
0
10
20
30
40
50
60
Wage and salary
workers
Own account Unpaid family
workers
Num
ber (
In p
erce
nt)
FIGURE 4 Employed Persons by Class of Workers: July 2008
34 JOURNAL OF PHILIPPINE STATISTICS
More than half (55.8%) of the
total underemployed were reported as visibly underemployed or working for less than 40 hours during the reference week. Those working for 40 hours or more accounted for 42.7 percent of the total underemployed. Most of the underemployed were working in the agriculture sector (46.9%) and services sector (38.2%). The underemployed in the industry sector accounted for 14.9 percent (Table 2.2). Unemployment rate down to 7.4 percent
The unemployment rate in July
2008 was estimated at 7.4 percent compared to 7.8 percent recorded in July 2007. Among the regions, the highest unemployment rate was recorded in the NCR at 12.8 percent. The next highest rates were posted in CALABARZON (10.4%) and Central Luzon (9.4%).
The number of unemployed was higher among males (61.7%) than among females (38.3%). By age group, for every 10 unemployed persons, five (51.8%) belonged to age group 15-24 years while three (28.5%) were in the age group 25 - 34.
Across educational groups,
among the unemployed, the high school graduates comprised more than one-third (34.1%), the college undergraduates comprised about one-fifth (20.8%), while the college graduates, 19.5 percent (Table 2.3). Labor Relations and Concerns
The labor sector faces a lot of legitimate concerns that need to be addressed. Displaced workers left and right, retrenchment, strikes and lockouts
and even closures of establishments are just some of the bleak features in the labor scenario. However, with the determination of the current dispensation to provide the push and the help, a more encouraging atmosphere might be in stead.
The Department of Labor and Employment (DOLE) takes the lead in formulating and directing the nation’s labor policies and programs. Its mission includes the promotion of social justice and protection of human rights and respect for human dignity in labor by ensuring workers’ protection and welfare. The department also aims to promote full employment and manpower development as well as to maintain industrial peace through enhancement of workers’ participation in policymaking.
Source of Information
This section presents an overview of the current labor condition in the country. Data presented were derived from the DOLE. Analyses were based on 2007 and preliminary 2008 figures culled by DOLE’s Bureau of Labor and Employment Statistics (BLES). Definition of Terms
Strike notice - the notification filed by a duly registered labor union with respective National Conciliation and Mediation Board (NCMB) regional branches about its intention to go on strike because of alleged commission by the employer of unfair labor practice acts or because of deadlock in collective bargaining negotiations
Actual strike - any temporary
stoppage of work by the concerted action of employees as a result of an industrial or labor dispute; may include

LABOR AND EMPLOYMENT 35
slowdown, mass leave, attempts to damage, destroy or sabotage plant equipment and facilities and similar activities
Lockout - the temporary refusal
of an employer to furnish work for his employees as a result of an industrial or labor dispute; it comprises shutdown, mass retrenchment and dismissal without previous written clearance from the Secretary of Labor and Employment or his duly authorized representatives
Mandays lost - computed by
multiplying the number of workers involved in the strike or lockout by the total number of working days lost or idled due to strike or lockout
Disposition rate - the ratio of
the total cases disposed to the total number of cases handled
Settlement rate - the ratio of the
total cases settled to the total number of cases handled
Preventive mediation case -
subject of a formal or informal request for conciliation and mediation assistance sought by either or both parties to avoid the occurrence of actual labor dispute
Voluntary arbitration - the
mode of settling labor-management disputes by which the parties select a competent, trained, and impartial person who shall decide on the merits of the case and whose decision is final, executory, and unappealable
Conciliation case - an actual or
existing labor dispute, which is subject of a notice of strike or lockout or actual strike or lockout case, filed with the appropriate NCMB regional branches
Conciliation or mediation -
mode of settlement bringing together the two parties in a dispute to come to
negotiations and settlement of the dispute.
Analysis of Tables New strike and lockout notices increase by 9.6 percent
Preliminary figures for January to September of 2008 showed an increase in new strike and lockout notices filed compared to January to September 2007’s tally. From 264 notices filed, the number rose to 292 for a 9.6 percent increase.
Cases handled, including pending notices, totaled 336, a decrease of 20.0 percent from 419 cases recorded in January to September of 2007. The settlement rate stood at 72.3 percent, which is 16.3 percentage points higher than in January to September of 2007. Workers involved in newly filed notices were down by 5.1 percent from 59,000 to 56,000 in the period under review (Table 2.4). Mandays lost from actual strikes and lockouts almost quadruple
There were only five handled cases of actual strikes and lockouts in January to September 2008; however, mandays lost due to these strikes reached 33,000. This was 312.5 percent or almost quadruple of the mandays lost during the same period in 2007 recorded at 8,000.
Involved workers in these new strikes declared rose by 58.0 percent from 472 in January to September of 2007 to 1,115 in the same period of 2008 (Table 2.4).
. NCR accounts for more than half of total strike and lockout notices

36 JOURNAL OF PHILIPPINE STATISTICS
Preliminary data from the NCMB showed that in January to September of 2008, NCR accounted for 180 (54.0%) of all new strike and lockout notices filed. CALABARZON was second with 76 notices (23.0%) while Central Visayas had 23 notices (6.8%) to place third. MIMAROPA and Eastern Visayas did not register any strike and lockout notice (Table 2.5). NCR records bulk of mandays lost from on-going strikes
In the period under review, mandays lost from on-going strikes reached 32,611. Of this figure, NCR had 13,600 (42.0%) while Davao Region was a close second with 13,500 mandays lost (41.4%). CALABARZON and Central Visayas share the remaining 16.6 percent with 4,338 and 1,173 mandays lost, respectively (Table 2.5). Workers involved in preventive mediation cases decrease by 12.4 percent
Table 2.6 shows that the total number of original preventive mediation cases filed decreased minimally by less than a quarter of a percent. Workers involved in preventive mediation cases filed consequently dropped by 12.4 percent from 105,000 to 92,000 in the period under review.
Pending voluntary arbitration
cases also declined by 9.0 percent while the disposition rate slid by 12.1 percentage points to 18.0 percent from 30.1 percent in January to September of 2007.
Original mediation-arbitration cases handled increase by 70.1 percent
There were 407 original mediation-arbitration cases handled by the Bureau of Labor Relations (BLR) in January to September of 2008. This
figure was a 70.1-percent increase from January to September 2007’s 239 cases. Despite the huge leap in the number of cases, the disposition rate increased by 22.1 percentage points from 44.8 to 66.9 percent (Table 2.7).
Disposed appealed mediation-arbitration cases rise by 28.1 percentage points
In January to September of 2007 and 2008 the number of pending and beginning appealed mediation-arbitration cases was 51 and 53, respectively. Handled cases reached 139. Of which, 77 cases or 55.4 percent were disposed. A notable improvement from the 27.3 percent disposition rate recorded in the same period of 2007 (Table 2.7). BLR grants P35.5 million worth of benefits
Handled cases of money claims increased by 28.2 percent from 4,062 in January to September of 2007 to 3,547 in January to September of 2008. The BLR granted P35.5 million worth of benefits to 4,424 workers. The number of workers benefited was down by 3.2 percent from 4,568 workers, while the disposition rate was up 21.9 percentage points in the period under review (Table 2.7).

LABOR AND EMPLOYMENT 37
Selected Indicators July 2008
Employed personsNumber (in thousands) 34,597
Industry SectorTotal 100.0 Agriculture 35.0 Agriculture, hunting and forestry 30.9 Fishing 4.1Industry 14.8 Mining and quarrying 0.4 Manufacturing 8.5 Electricity, gas and water 0.4 Construction 5.4 Services 50.2 Wholesale and retail trade, repair of motor vehicles, motorcycles and personal and household goods 19.1 Hotels and restaurants 2.8 Transport, storage, and communication 7.3 Financial Intermediation 1.1 Real estate, renting, and business activities 2.8
TABLE 2.1 Employed Persons by Industry, Occupation, Class of Worker
(In percent) and Hours Worked: July 2008
Public administration and defense, compulsory social security 5.0 Education 3.1 Health and social work 1.1 Other community, social, and personal service activities 2.4 Private households with employed persons 5.4 Extra-territorial organizations and bodies 0.0
OccupationTotal 100.0 Officials of government and special interest organizations,
corporate executives, managers, managing proprietorsand supervisors 13.0
Professionals 4.4 Technicians and associate professionals 2.6 Clerks 4.9 Service workers and shop and market sales workers 9.9 Farmers, forestry workers, and fishermen 17.7 Trades and related workers 8.1 Plant and machine operators and assemblers 6.5 Laborers and unskilled workers 32.4 Special occupations 0.5
Class of workerTotal 100.0 Wage and salary workers 52.8
Continued
38 JOURNAL OF PHILIPPINE STATISTICS
Table 2.1 -- Concluded
Selected Indicators July 2008
Private household 5.4 Private establishment 39.0 Government/government corporation 8.1 With pay (family-owned business) 0.4 Own account 35.3 Self employed 31.1 Employer 4.2 Unpaid family workers 11.8
Hours workedTotal 100.0 Working:
Less than 40 hours 33.8 40 hours and over 65.2
Did not work 1.0 Mean hours worked 42.5
Notes: Estimates for July 2009 are preliminary and may change. Figures were estimated using the 2000 Census-based Population Projections.
Source: National Statistics Office, July 2008 Labor Force Survey
Selected Indicators July 2008 July 2007
Underemployed personsNumber (in thousands) 7,275 7,327
Hours workedTotal 100.0 100.0 Worked less than 40 hours 55.8 50.9Worked 40 hours and over 42.7 48.1Did not work 1.5 1.0
Industry sectorTotal 100.0 100.0 Agriculture 46.9 44.4 Industry 14.9 15.3 Services 38.2 40.3
Unemployed personsNumber (in thousands) 2,750 2,824
Continued
TABLE 2.2 Underemployed Persons by Hours Worked and Industry, and Unemployed Persons by Age Group, Sex, and Highest Grade Completed: July 2008 and July 2009
(In percent)

LABOR AND EMPLOYMENT 39
Table 2.2 -- Concluded
Selected Indicators July 2008 July 2007
Age groupTotal 100.0 100.015 - 24 51.8 51.125 - 34 28.5 28.735 - 44 9.3 10.445 - 54 6.4 6.055 - 64 3.2 3.365 and Over 0.7 0.6
Male 61.7 62.1 Female 38.3 37.9
Highest grade completedTotal 100.0 100.0 No grade completed 0.6 0.8 Elementary 13.7 14.3 Undergraduate 6.3 6.8 Graduate 7.4 7.5 High school 45.5 45.5 Undergraduate 11.3 14.1 Graduate 34.1 31.4 College 40.3 39.4 Undergraduate 20.8 19.9 Graduate 19.5 19.5
Notes: Estimates for July 2009 are preliminary and may change. Figures were estimated using the 2000 Census-based Population Projections.
Source: National Statistics Office, July 2008 Labor Force Survey

JOURNAL OF PHILIPPINE STATISTICS
Employment Unemployment UnderemploymentRegion Rate Rate Rate
Philippines 64.3 92.6 7.4 21.0
NCR 61.7 87.2 12.8 14.2CAR 67.7 94.6 5.4 23.5I - Ilocos Region 62.3 93.4 6.6 16.4II - Cagayan Valley 66.8 97.1 2.9 18.1III - Central Luzon 61.8 90.6 9.4 9.2IVA - CALABARZON 62.9 89.6 10.4 17.4IVB - MIMAROPA 69.6 95.7 4.3 26.8V - Bicol Region 66.1 95.6 4.4 35.8VI - Western Visayas 64.9 93.3 6.7 27.7VII - Central Visayas 64.9 92.5 7.5 17.4VIII - Eastern Visayas 65.8 95.8 4.2 30.8IX - Zamboanga Peninsula 65.6 96.9 3.1 29.9X - Northern Mindanao 70.8 95.6 4.4 25.8XI - Davao Region 65.8 93.4 6.6 21.8XII - SOCCSKSARGEN 66.8 95.2 4.8 26.6Caraga 65.5 93.0 7.0 29.3ARMM 57.4 96.9 3.1 18.0
Notes: Estimates for July 2009 are preliminary and may change. Figures were estimated using the 2000 Census-based Population Projections.
Source: National Statistics Office, July 2008 Labor Force Survey
Labor Force Participation Rate
40
TABLE 2.3 Rates of Labor Force Participation, Employment, Unemployment
(In percent)and Underemployment by Region: July 2008

41
Indicator January-September2008p January-September 2007
Strike and lockout notices
Cases pending, beginning 44 56New notices filed 292 264Cases handled 336 419Cases disposed 282 270
Settled 243 232Assumed jurisdiction by the Secretary 10 18Certified for compulsory arbitration 20 13Treated as preventive mediation case - -Other modes of disposition 9 3
Materialized into actual strikes or lockouts 4 4Workers involved in new notices filed (000) 56 59Disposition rate (%) 83.9 71.6Settlement rate (%) 72.3 56.0
Actual strikes and lockouts
Cases pending, beginning - -New strikes declared 1 5 4Cases handled 5 5Work normalized 4 4
Settled 2 2Assumed jurisdiction by the Secretary - 1Certified for compulsory arbitration 1 -Other modes of disposition 1 -
Workers involved in new strikes declared 1,115 472Mandays lost from on-going strikes (000) 33 8Disposition rate (%) 80.0 66.7Settlement rate (%) 40.0 33.3
Notes: Details may not add up to totals due to rounding.
1 Includes actual strikes and lockouts without notices. p Preliminary
Source: Department of Labor and Employment, National Conciliation and Mediation Board
TABLE 2.4 Strike and Lockout Notices and Actual Strikes and LockoutsJanuary to September 2007 and 2008
LABOR AND EMPLOYMENT

JOURNAL OF PHILIPPINE STATISTICS
I II III IV-A IV-B VIndicator Philippines NCR CAR Ilocos Cagayan Central CALABARZON MIMAROPA Bicol
Region Valley Luzon Region
Strike/lockout notices
Pending, beginning 44 22 1 2 - 2 12 - -New notices filed 292 158 3 10 3 16 64 - 1Cases handled 336 180 4 12 3 18 76 - 1Cases disposed 282 142 4 12 3 16 66 - 1
Cases settled 243 126 3 8 3 16 55 - 1Cases which materialized into
actual strikes or lockouts 4 2 - - - - - - -Workers involved in new notices filed 56,618 33,736 15 339 322 3,002 11,551 - 200Disposition rate (%) 83.9 78.9 100.0 100.0 100.0 88.9 86.8 - 100.0Settlement rate (%) 72.3 70.0 75.0 66.7 100.0 88.9 72.4 - 100.0
Actual strikes and lockouts
Pending, beginning - - - - - - - - -New strikes declared 5 2 - - - - 1 - -Cases handled 5 2 - - - - 1 - -Work normalized 4 1 - - - - 1 - -
Cases settled 2 - - - - - 1 - -Workers involved in new
strikes declared 1,115 305 - - - - 241 - -Mandays lost from on-going strikes 32,611 13,600 - - - - 4,338 - -Disposition rate (%) 80.0 50.0 - - - 100.0 - -Settlement rate (%) 40.0 - - - - - 100.0 - -
Preventive mediation cases
Pending, beginning 33 12 2 - 1 - 7 - -Original preventive mediation
cases filed 404 189 12 8 1 23 75 - 4Strike notices treated as preventive
mediation cases 3 2 - - - - - - -Cases handled 440 203 14 8 2 23 82 - 4Strikes prevented 377 173 10 8 2 23 82 - 4
Cases settled 354 166 8 8 1 18 61 - 4Workers involved in preventive
mediation cases filed 77,377 21,929 7,225 749 120 7,300 16,615 - 137Disposition rate (%) 85.7 85.2 71.4 100.0 100.0 82.6 82.9 - 100.0Settlement rate (%) 80.5 81.8 57.1 100.0 50.0 78.3 74.4 - 100.0
Continued
TABLE 2.5 Strike and Lockout Notices, Actual Strikes and Lockouts and Preventive MediationCases by Region: January to September 2008
(Preliminary)
42

43
Table 2.5 -- Concluded
VI VII VIII IX X XI XII XIIIIndicator Western Central Eastern Zamboanga Northern Davao SOCCSKSARGEN Caraga
Visayas Visayas Visayas Peninsula Mindanao Region
Strike and lockout notices
Pending, beginning 1 4 - - - - - -New notices filed 2 19 - 1 4 8 1 2Cases handled 3 23 - 1 4 8 1 2Cases disposed 2 20 - 1 4 8 1 2
Cases settled 1 15 - 1 4 7 1 2Cases which materialized into
actual strikes or lockouts - 1 - - - 1 - -Workers involved in new
notices filed 264 2,569 - 117 454 2,779 43 1,227Disposition rate (%) 66.7 87.0 - 100.0 100.0 100.0 100.0 100.0Settlement rate (%) 33.3 65.2 - 100.0 100.0 87.5 100.0 100.0
Actual strikes and lockouts
Pending, beginning - - - - - - - -New strikes declared - 1 - - - 1 - -Cases handled - 1 - - - 1 - -Work normalized - 1 - - - 1 - -
Cases settled - 1 - - - - - -Workers involved in new
strikes declared - 69 - - - 500 - -Mandays lost from on-going strikes - 1,173 - - - 13,500 - -Disposition rate (%) - 100.0 - - - 100.0 - -Settlement rate (%) - 100.0 - - - - - -
Preventive mediation cases
Pending, beginning 2 3 - - 2 2 1 1Original preventive mediation
cases filed 13 3 5 3 12 38 4 9Strike notices treated as preventive
mediation cases - 1 - - - - - -Cases handled 15 12 5 3 14 40 5 10Cases disposed 12 9 5 3 12 37 5 10
Cases settled 12 7 5 3 12 35 5 9Workers involved in preventive
mediation cases filed 2,076 2,259 273 966 1,681 10,149 1,047 4,851Disposition rate (%) 80.0 75.0 100.0 100.0 85.7 92.5 100.0 100.0Settlement rate (%) 80.0 58.3 100.0 100.0 85.7 87.5 100.0 90.0
Note: New strikes declared include actual strikes/lockouts without notices.
Source: Department of Labor and Employment, National Conciliation and Mediation Board
LABOR AND EMPLOYMENT

JOURNAL OF PHILIPPINE STATISTICS
Indicator January-September 2008 January-September 2007
Preventive mediation cases
Cases pending, beginning 56 58Original preventive mediation cases filed 409 408Strike notices treated as preventive
mediation cases 4 1Cases handled 557 567Cases disposed 380 382
Settled 360 365Assumed jurisdiction by the Secretary 1 -Certified for compulsory arbitration - -Referred to compulsory arbitration - -Referred to voluntary arbitration - -Materialized into notices of strikes and lockouts and actual strikes and lockouts 15 11Other modes of disposition 4 6
Workers involved in preventive mediation cases filed (000) 92 105
Disposition rate (%) 66.7 67.9Settlement rate (%) 62.1 65.6
Voluntary arbitration cases
Cases pending, beginning 114 125New cases facilitated/monitored 119 117Total cases facilitated/monitored 161 163Cases disposed 103 113
Decided 82 99Settled amicably 10 4Withdrawn/dropped 11 10
Disposition rate (%) 18.0 30.1
Notes : Details may not add up to totals due to rounding.
Definitions: Disposition rate (%) = Cases disposed/cases handled x 100. Settlement rate (%) = Cases settled/cases handled x 100. Voluntary arbitration - mode of settling labor-management disputes by which the parties select a competent, trained and impartial person who shall decide on the merits of the cases and whose decision is final, executory and unappealable.
Source: Department of Labor and Employment, National Conciliation and Mediation Board
TABLE 2.6 Preventive Mediation Cases and Voluntary Arbitration CasesJanuary to September 2007 and 2008
(Preliminary)
44

45
Indicator January-September 2008P January-September 2007
Original med-arbitration cases (BLR and DOLE Regional offices)
Cases pending, beginning 96 146Cases newly filed 311 278Cases handled 407 239Cases disposed 276 107 Petitions granted 156 62 Withdrawn/dismissed 120 45Disposition rate (%) 67.8 44.8
Appealed med-arbitration cases (BLR and OS)
Cases pending, beginning 51 53Cases newly filed 88 97Cases handled 139 88Cases disposed 77 24Disposition rate (%) 55.4 27.3
Money claims (DOLE regional offices)
Cases pending, beginning 7431 7101
New cases filed 3,803 3,677Cases handled 4,546 3,547Cases disposed 3,666 3,547Disposition rate (%) 80.6 58.7Workers benefited 4,424 4,568Amount of benefits (In million pesos) 35.5 32.4
Notes : Details may not add up to totals due to rounding.
Source: Bureau of Labor Relations (BLR), Statistical and Performance Reporting System (SPRS), Office of the Secretary (OS)
LABOR AND EMPLOYMENT
1 Revised based on inventory of cases.
TABLE 2.7 Original and Appealed Mediation-Arbitration Cases and Money ClaimsJanuary to September 2007 and 2008
P Preliminary

46
Section III – TRAVEL AND TOURISM STATISTICS
` Visitor Arrivals to the Philippines: 2008
For the past years, the government’s stance in developing a more sustainable tourism industry has certainly paid off. Not only has the Philippines become one of the most frequently visited tourist spots in Asia, today’s revitalized industry also provides additional jobs for Filipinos while being able to safeguard the integrity of local diversity and culture.
The Department of Tourism (DOT)
takes the lead in furthering the position of the country as a favored travel destination. Along with other agencies and organizations, it aims to break down fundamental barriers to tourism growth and works to minimize the impediments to realizing a better tourism scenario.
Recently, Boracay Island, the
Philippines' tropical haven is hailed once again as one of the best beaches in the world. This was according to Grazia, a weekly Australian magazine featuring the high life of fashion, celebrity life, and travel around the globe.
In the fourth quarter of 2008,
Boracay tourist arrivals have reached a 5.6 percent growth rate. According to DOT Region VI, tourism receipts to the island totaled to PhP10.6 billion from January to November 2008, which just proves that its crystal-clear waters and fine white sand is a constant favorite among nature and adventure seekers from all throughout.
Known for its fine white sand and crystal blue waters, Boracay Island in Malay, Aklan is hailed as one of the world’s best beaches.
Source of Information Statistics presented in this section
deal on the travel of visitors to the Philippines taken from arrival and departure cards and shipping manifests, as well as occupancy reports of accredited hotels in Metro Manila submitted to the DOT.
Definition of Terms
Visitor – any person visiting the Philippines for any reason other than following an occupation renumerated from within the country and whose residence is not the Philippines (World Tourism Organization)
There are two types of visitors under this definition, namely tourist and excursionist, defined as follows:

TRAVEL AND TOURISM STATISTICS 47
Tourist – temporary visitor staying
at least 24 hours in the country for a purpose classified as either holiday (recreation, leisure, sport, and visit to family, friends or relatives), business, official mission, convention, or health reasons
Excursionist – temporary visitor staying less than 24 hours in the country.
Based on the above definitions, the following are included in the visitor headcount:
♦ Aliens entering the country for a
temporary stay not exceeding one year and for purposes other than immigration, permanent residence or employment for renumeration in the country and
♦ Filipino nationals or overseas Filipinos residing permanently abroad who are on temporary stay in the Philippines not exceeding one year. These exclude overseas contract workers.
However, the following are
excluded in the visitor headcount: ♦ Transit visitors and change-plane
passengers who remain in the premises of the port of entry terminal
♦ Aliens with prearranged employment for renumeration in the Philippines, and aliens studying in the country regardless of length of stay
♦ Filipinos living abroad, regardless of length of stay overseas who are not permanent residents abroad
♦ Immigrants or aliens (expatriates) who are permanently residing in the Philippines
♦ Filipino overseas contract workers on home visits and
♦ Returning residents of the Philippines.
Analysis of Tables Visitor arrivals increase by 1.5 percent
For 2008, aggregate visitor
arrivals reached 3.14 million. This was a 1.5 percent increase from the 3.09 million arrivals recorded in 2007 (Table 3.1). Asian visitors comprise more than half of total visitor arrivals
DOT’s arrival statistics showed
Asia leading other continents as it accounted for 1.71 million or 54.4 percent of the total arrivals in 2008. However, this showing is marked by a 1.8 percent decrease from 2007’s 1.74 million arrivals. Despite three of four Asian regions recording increased arrival figures, East Asia’s which arrival figures declined by 4.2 percent affected the continent’s aggregate arrival volume. East Asia accounts for bulk of the arrival figure for the continent at 1.37 million.
Arrivals from North America totaled 681,922 or 21.7 percent of the

48 JOURNAL OF PHILIPPINE STATISTICS
total to register in second. Among its countries, the United States of America had the lion’s share of arrivals with 578,246 or 18.4 percent of the aggregate visitor arrivals. North America’s arrival growth rate stood at 1.5 percent relative to 2007’s 671,744 arrivals.
Europe with 318,971 arrivals,
registered third with 10.2 percent share of the total arrivals. It marked a 7.6 percent growth from 2007’s 296,443 arrivals.
South America posted the highest
increase in arrival figures with 3,505, a 10.3 percent increase from the 3,177 arrivals recorded in 2007 (Table 3.1). Overseas Filipino arrivals increase by 8.0 percent
Overseas Filipinos, who composed 6.2 percent of the total arrival figure increased by 8.0 percent in the period under review. From 180,739 in 2007 it rose to 195,287 arrivals in 2008 (Table 3.1). Month-on-month growth rate declines by 6.1 percent
The month-on-month growth rate
for December 2007 and December 2008 declined by 6.1 percent. It was a marked decrease in the total volume of visitors from almost all regions as well as returning overseas Filipinos that pulled the growth rate down. Africa recorded the biggest drop at 22.0 percent while Europe posted the only surge with a growth rate of 26.8 percent (Table 3.2). Top ten travel markets account for 75.2 percent of total arrivals
The country’s top ten travel markets performed fairly in 2008 as seven
out of the 10 countries in the list marked increases in arrival volume. The 3.14 million arrivals from these countries accounted for 75.2 percent of the total arrival figure.
Korea remained as the biggest
travel market as it accounted for 611,629 arrivals or a 19.5 percent share. The United States came close with 578,246 arrivals (18.4% share) to register second. Japan was third with 359,306 arrivals (11.4 % share) though it registered the biggest drop in arrival volume among the travel markets at 9.0 percent.
Canada became the country’s eighth largest travel market as it posted the biggest growth at 12.1 percent. Its 91,308 arrivals in 2007 surged to 102,381 in 2008.
United Kingdom was at the bottom
of the top travel market list with 87,422 arrivals (2.8% share) despite posting a 9.7 percent growth in arrival volume. Countries excluded from the list brought in a substantial 779,623 arrivals or 24.8 percent share of the total arrivals (Table 3.2).

TRAVEL AND TOURISM 49
Number of Arrivals
Country of Residence Increase/(Decrease)
GRAND TOTAL 3,139,422 3,091,993 1.5
Overseas Filipinos* 195,287 180,739 8.0
Asia 1,708,306 1,738,976 (1.8)
ASEAN 254,077 235,615 7.8Brunei 3,456 3,040 13.7Cambodia 1,834 1,665 10.2Indonesia 27,830 25,535 9.0Laos 814 782 4.1Malaysia 69,676 65,695 6.1Myanmar 5,116 4,559 12.2Singapore 100,177 94,008 6.6Thailand 31,499 29,655 6.2Vietnam 13,675 10,676 28.1
East Asia 1,370,059 1,430,077 (4.2)China 163,689 157,601 3.9Hong Kong 116,653 111,948 4.2Japan 359,306 395,012 (9.0)Korea 611,629 653,310 (6.4)Taiwan 118,782 112,206 5.9
South Asia 43,662 37,596 16.1Bangladesh 1,924 1,785 7.8India 31,135 27,341 13.9Iran 3,196 2,166 47.6Nepal 1,246 1,075 15.9Pakistan 2,405 1,757 36.9Sri Lanka 3,756 3,472 8.2
Middle East 40,508 35,688 13.5Bahrain 2,928 2,699 8.5Egypt 751 715 5.0Israel 3,893 3,929 (0.9)Jordan 538 502 7.2Kuwait 3,952 2,995 32.0Saudi Arabia 17,515 16,358 7.1United Arab Emirates 10,931 8,490 28.8
North America 681,922 671,744 1.5Canada 102,381 91,308 12.1Mexico 1,295 1,453 (10.9)United States of America 578,246 578,983 (0.1)
Continued
TABLE 3.1 Visitor Arrivals by Country of Residence
Percent
2007 and 2008
2008 2007
JOURNAL OF PHILIPPINE STATISTICS
Table 3.1 -- Continued
Number of ArrivalsCountry of Residence Increase/
(Decrease)
South America 3,505 3,177 10.3Argentina 594 524 13.4Brazil 1,594 1,634 (2.4)Colombia 511 415 23.1Peru 446 376 18.6Venezuela 360 228 57.9
Europe 318,971 296,443 7.6
Western Europe 134,663 128,199 5.0Austria 10,120 9,682 4.5Belgium 9,143 8,090 13.0France 22,891 19,273 18.8Germany 55,303 55,894 (1.1)Luxembourg 494 405 22.0Netherlands 18,527 17,705 4.6Switzerland 18,185 17,150 6.0
Northern Europe 136,260 124,684 9.3Denmark 11,890 11,882 0.1Finland 2,954 2,477 19.3Ireland 5,176 4,681 10.6Norway 14,963 12,925 15.8Sweden 13,855 13,049 6.2United Kingdom 87,422 79,670 9.7
Southern Europe 31,229 28,961 7.8Greece 1,914 1,722 11.1Italy 15,136 14,382 5.2Portugal 990 998 (0.8)Spain 12,946 11,666 11.0Union of Serbia and Montenegro** 243 193 25.9
Eastern Europe 16,819 14,599 15.2Commonwealth of Independent States 3,611 4,690 (23.0)Russian Federation*** 10,959 8,163 34.3 Total (CIS and Russia) 14,570 12,853 13.4Poland 2,249 1,746 28.8
Australasia/Pacific 174,583 163,403 6.8Australia 121,514 112,466 8.0Guam 40,364 39,409 2.4Nauru 13 11 18.2New Zealand 10,672 10,254 4.1Papua New Guinea 2,020 1,263 59.9
Continued
2008 2007
Percent
50

TRAVEL AND TOURISM 51
Table 3.1 -- Concluded
Number of ArrivalsCountry of Residence Increase/
(Decrease)
Africa 3,317 3,090 7.3
Nigeria 777 703 10.5South Africa 2,540 2,387 6.4
Others and unspecifiedresidences 53,531 34,421 55.5
Notes: * - Philippine passport holders permanently residing abroad; excludes overseas Filipino workers. ** - Prior to April 2003, statistics from this country includes, Slovenia, Croatia, Bosnia, and Macedonia. *** - Prior to July 2006, Russia arrivals were lumped under "CIS" and prior to August 2006, Estonia, Latvia and Turkmenistan ariivals were lumped under "CIS"
Source : Department of Tourism
2008 2007
Percent

December 2008 December 2007 PercentCountry of Residence Percent Percent Increase/
Volume to Total Volume to Total (Decrease)
GRAND TOTAL 301,175 100.0 320,812 100.0 (6.1)
Overseas Filipinos* 25,043 8.3 25,347 7.9 (1.2)
Asia 136,314 45.3 153,731 47.9 (11.3) ASEAN 20,880 6.9 18,505 5.8 12.8
Brunei 480 0.2 348 0.1 37.9 Cambodia 139 0.0 123 0.0 13.0 Indonesia 2,210 0.7 2,042 0.6 8.2 Laos 65 - 55 - 18.2 Malaysia 6,141 2.0 5,240 1.6 17.2 Myanmar 384 0.1 359 0.1 7.0 Singapore 8,437 2.8 7,207 2.2 17.1 Thailand 2,170 0.7 2,381 0.7 (8.9)Vietnam 854 0.3 750 0.2 13.9
East Asia 109,473 36.3 129,608 40.4 (15.5)China 11,291 3.7 14,096 4.4 (19.9)Hong Kong 9,861 3.3 8,703 2.7 13.3 Japan 28,840 9.6 30,794 9.6 (6.3)Korea 51,794 17.2 66,912 20.9 (22.6)Taiwan 7,687 2.6 9,103 2.8 (15.6)
South Asia 3,106 1.0 2,925 0.9 6.2 Bangladesh 111 0.0 126 0.0 (11.9)India 2,160 0.7 2,072 0.6 4.2 Iran 217 0.1 139 0.0 56.1
Continued
TABLE 3.2 Visitor Arrivals by Country of Residence: December 2007 and 2008

JOURNAL OF PHILIPPINE STATISTICS
Table 3.2 -- Continued
December 2007 December 2006 PercentCountry of Residence Percent Percent Increase/
Volume to Total Volume to Total (Decrease)
Nepal 120 - 123 - (2.4)Pakistan 189 0.1 125 0.0 51.2 Sri Lanka 309 0.1 340 0.1 (9.1)
Middle East 2,855 0.9 2,693 0.8 6.0 Bahrain 282 0.1 211 0.1 33.6 Egypt 55 - 52 - 5.8 Israel 351 0.1 311 0.1 12.9 Jordan 46 - 46 - 0.0 Kuwait 311 0.1 235 0.1 32.3 Saudi Arabia 867 0.3 1,077 0.3 (19.5)United Arab Emirates 943 0.3 761 0.2 23.9
North America 73,627 24.4 75,150 23.4 (2.0)Canada 15,868 5.3 16,217 5.1 (2.2)Mexico 89 0.0 77 0.0 15.6 United States of America 57,670 19.1 58,856 18.3 (2.0)
South America 295 0.1 299 0.1 (1.3)
Argentina 44 - 46 - (4.3)Brazil 139 0.0 156 0.0 (10.9)Colombia 56 - 36 - 55.6 Peru 30 - 45 - (33.3)Venezuela 26 - 16 - 62.5
Europe 37,892 12.6 38,719 12.1 26.8
Western Europe 15,444 5.1 15,384 4.8 0.4Austria 1,286 0.4 1,354 0.4 (5.0)Belgium 973 0.3 863 0.3 12.7France 2,530 0.8 2,227 0.7 13.6Germany 6,289 2.1 6,515 2.0 (3.5)Luxembourg 50 - 71 - (29.6)Netherlands 2,009 0.7 2,177 0.7 (7.7)Switzerland 2,307 0.8 2,177 0.7 6.0
Northern Europe 16,889 5.6 18,158 5.7 (7.0)Denmark 1,688 0.6 1,754 0.5 (3.8)Finland 424 0.1 358 0.1 18.4Ireland 600 0.2 544 0.2 10.3Norway 1,939 0.6 2,040 0.6 (5.0)Sweden 2,468 0.8 2,684 0.8 (8.0)United Kingdom 9,770 3.2 10,778 3.4 (9.4)
Southern Europe 3,565 1.2 3,464 1.1 2.9Greece 192 0.1 144 0.0 33.3Italy 1,927 0.6 1,798 0.6 7.2Portugal 91 - 80 - 13.8 Spain 1,331 0.4 1,406 0.4 (5.3)Union of Serbia and Montenegro** 24 - 36 - (33.3)
Continued
52

TRAVEL AND TOURISM 53
Table 3.2 -- Concluded
December 2007 December 2006 PercentCountry of Residence Percent Percent Increase/
Volume to Total Volume to Total (Decrease)
Eastern Europe 1,994 0.7 1,713 0.5 16.4 Commonwealth of Independent States 374 0.1 385 0.1 (2.9)Russian Federation*** 1,396 0.2 1,147 0.2 21.7 Total (CIS and Russia) 1,770 0.3 1,532 0.3 15.5 Poland 224 0.1 181 0.1 23.8
Australasia/Pacific 23,774 7.9 23,966 7.5 (0.8)
Australia 18,279 6.1 18,056 5.6 1.2 Guam 3,559 1.2 4,070 1.3 (12.6)Nauru - - 3 - 100.0 New Zealand 1,664 0.6 1,708 0.5 (2.6)Papua New Guinea 272 0.1 129 0.1 110.9
Africa 323 0.1 414 0.1 (22.0)
Nigeria 69 - 73 - (5.5)South Africa 254 0.1 341 0.1 (25.5)
Others and unspecifiedresidences 3,907 1.3 3,186 1.0 22.6
Notes: * - Philippine passport holders permanently residing abroad; excludes overseas Filipino workers.
*** - Prior to July 2006, Russia arrivals were lumped under "CIS" and prior to August 2006, Estonia, Latvia and Turkmenistan ariivals were lumped under "CIS"
Source : Department of Tourism
** - Prior to April 2003, statistics from this country includes, Slovenia, Croatia, Bosnia, and Macedonia.

2008 2007Percentto Total Rank Volume
Total 3,139,422 100.0 3,091,993 1.5
Korea 611,629 19.5 1 653,310 (6.4)United States of America 578,246 18.4 2 578,983 (0.1)Japan 359,306 11.4 3 395,012 (9.0)China 163,689 5.2 4 157,601 3.9Australia 121,514 3.9 5 111,948 8.5Taiwan 118,782 3.8 6 112,466 5.6Hong Kong 116,653 3.7 7 112,206 4.0Canada 102,381 3.3 8 91,308 12.1Singapore 100,177 3.2 9 94,008 6.6United Kingdom 87,422 2.8 10 79,670 9.7Other Countries 779,623 24.8 705,481 10.5
Source : Department of Tourism
TABLE 3.3 Top Ten Travel Markets: 2007 and 2008
Volume
Percent Increase/ Decrease
Country

54 JOURNAL OF PHILIPPINE STATISTICS
Overall AverageFourth Quarter Fourth Quarter
2008 2007
Occupancy Rates 66.39 70.10 (5.30)Length of stay (in Nights) 2.36 2.41 (2.11)
De luxe Occupancy Rates 66.85 75.65 (11.63) Length of stay 2.66 2.59 2.84
First Class Occupancy Rates 67.43 73.80 (8.63) Length of stay 2.53 2.63 (4.05)
Standard Occupancy Rates 68.38 71.22 (3.99) Length of stay 2.43 2.47 (1.49)
Economy Occupancy Rates 62.89 59.74 5.28 Length of stay 1.81 1.95 (6.85)
Source : Department of Tourism
TABLE 3.4 Average Occupancy Rates of Hotels in Metro Manila by ClassificationFourth Quarter 2007 and 2008
DifferenceClassification

55
Introduction
All government agencies and non-
government organizations (NGOs) are mandated to spearhead programs, projects, and services for the welfare of the more-often-neglected sectors of society.
On the forefront of these agencies
and organizations is an Inter-Agency Committee chaired by the Department of Social Welfare and Development (DSWD) tasked to oversee the foregoing thrusts that seek to promote the rights and full participation of these neglected sectors.
The DSWD is mandated to provide social protection, assistance, and augmentation needs to disadvantaged individuals, families, groups, and communities. It is also incumbent on the agency to provide support to local
government units (LGUs), non-government organizations (NGOs), other national government agencies (NGAs), people’s organizations (POs), and other members of the civil society to effectively implement programs, projects, and services to these marginalized sectors of the society.
Child and youth welfare programs of the government are specifically led by the Bureau of Child and Youth Welfare (BCYW) which cares for the abandoned, neglected, disturbed, and the exploited and abused youth. Among the services accorded the disadvantaged youth offenders, child prostitutes, and street children are the following: • Psychosocial recovery and social
reintegration of sexually abused and exploited children - reintegration of child victims to the family and the community • The Child Help Intervention and
Protective Services (CHIPS) offer crisis intervention and therapy; its services can be accessed in all 17 regions via hotlines provided and also through the Bantay Bata program. • Assistance to disadvantaged
children of mixed parentage in the form of skills training, livelihood assistance, psychological interventions, and assistance relative to their citizenship. Department arrangements enable a number of disadvantaged transnational children like Amerasians to locate foreigner parents, or at best, to reunite children with their parents abroad. This service facilitates children’s reintegration into the community
Section IV - SOCIAL WELFARE AND COMMUNITY DEVELOPMENT
56 JOURNAL OF PHILIPPINE STATISTICS
• Community-based rehabilitation for children in conflict with the law affords diverse options to prevent juvenile offenders from breaking the law • Sulong Dunong sa Kabataan assists
youths to finish high school or head into technical or vocational livelihood training • Local and intercountry adoption and
alternative family care services nurture abandoned and neglected children by placing them in the care of foster parents. With adoption, abandoned and unregistered children earn the right to the family name and nationality of foster parents • Devolved services for children and
youths look after preschoolers in day care centers and provide them supplemental feeding. They also service street children and delinquent youths with medical attention, livelihood opportunities, and counseling services • Retained Community-Based
Program
Child Care and Placement Services. These services provide alternative parental care to abandoned, neglected, and abused children, thus, restoring their right to a family, name, and nationality. Particular interventions employed under these services include local adoption, intercountry adoption, temporary parental care through foster care, and legal guardianship. Adoption is a socio-legal process which enables a child, who cannot be reared by his biological or natural parents, to acquire a legal status wherein he can benefit from new relationship with a permanent family. Local adoption is adoption within the country. Intercountry adoption is adoption outside the country. Foster care is the provision of planned substitute parental care for a
child by a licensed foster family when his or her biological parents cannot care for him for a certain period of time. Legal guardianship is a socio-legal process of providing substitute parental care through the appointment of a legal guardian of the child and his property until child reaches the age of majority. Protective Custody. This is a service provided to children whose parents are unable to provide the required protection and whose conditions demonstrate observable evidence of injurious effects of the failure to meet the children’s basic needs. Immediate intervention is provided to a child who is abandoned, neglected, physically or sexually abused or exploited, to prevent further abuse and exploitation, and to assist the child and family to overcome the trauma of such experiences.
Other than these programs for the youth and children, the DSWD also provides support to the disadvantaged and marginalized women sector of the society.
Services for women-in-especially difficult-circumstances (WEDC) were launched in response to the emerging needs of women in this sector. This is to empower them to avoid high-risk, violent, and dangerous incidents as well as to equip and prepare them physically and emotionally as they return to their families. Marginalized families, on the other hand, become beneficiaries under the following services by program or project:
• Locally-Funded Project Comprehensive and Integrated Delivery of Social Services (CIDSS) is a propoor program which seeks to
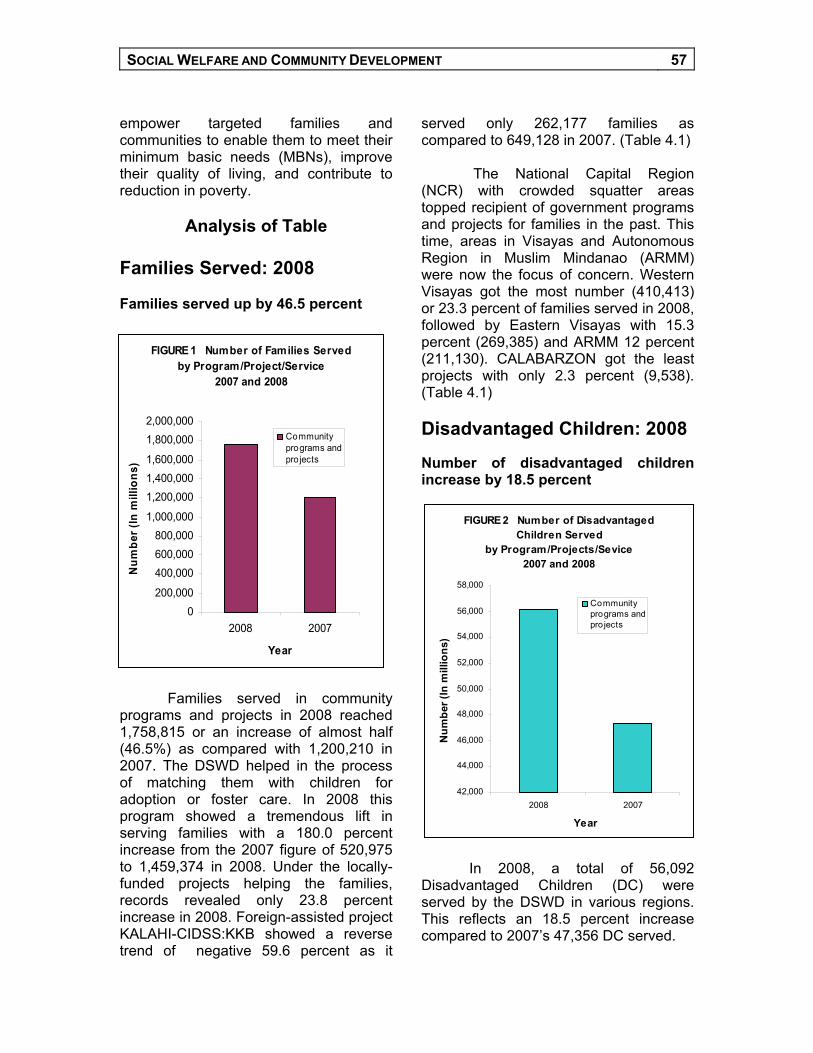
SOCIAL WELFARE AND COMMUNITY DEVELOPMENT 57
empower targeted families and communities to enable them to meet their minimum basic needs (MBNs), improve their quality of living, and contribute to reduction in poverty.
Analysis of Table
Families Served: 2008
Families served up by 46.5 percent
Families served in community programs and projects in 2008 reached 1,758,815 or an increase of almost half (46.5%) as compared with 1,200,210 in 2007. The DSWD helped in the process of matching them with children for adoption or foster care. In 2008 this program showed a tremendous lift in serving families with a 180.0 percent increase from the 2007 figure of 520,975 to 1,459,374 in 2008. Under the locally-funded projects helping the families, records revealed only 23.8 percent increase in 2008. Foreign-assisted project KALAHI-CIDSS:KKB showed a reverse trend of negative 59.6 percent as it
served only 262,177 families as compared to 649,128 in 2007. (Table 4.1)
The National Capital Region
(NCR) with crowded squatter areas topped recipient of government programs and projects for families in the past. This time, areas in Visayas and Autonomous Region in Muslim Mindanao (ARMM) were now the focus of concern. Western Visayas got the most number (410,413) or 23.3 percent of families served in 2008, followed by Eastern Visayas with 15.3 percent (269,385) and ARMM 12 percent (211,130). CALABARZON got the least projects with only 2.3 percent (9,538). (Table 4.1) Disadvantaged Children: 2008 Number of disadvantaged children increase by 18.5 percent
In 2008, a total of 56,092
Disadvantaged Children (DC) were served by the DSWD in various regions. This reflects an 18.5 percent increase compared to 2007’s 47,356 DC served.
FIGURE 1 Number of Families Served by Program/Project/Service
2007 and 2008
0200,000
400,000600,000800,000
1,000,000
1,200,0001,400,0001,600,000
1,800,0002,000,000
2008 2007
Year
Num
ber (
In m
illio
ns)
Community programs andpro jects
FIGURE 2 Number of Disadvantaged Children Served
by Program/Projects/Sevice2007 and 2008
42,000
44,000
46,000
48,000
50,000
52,000
54,000
56,000
58,000
2008 2007
Year
Num
ber (
In m
illio
ns)
Community programs andpro jects
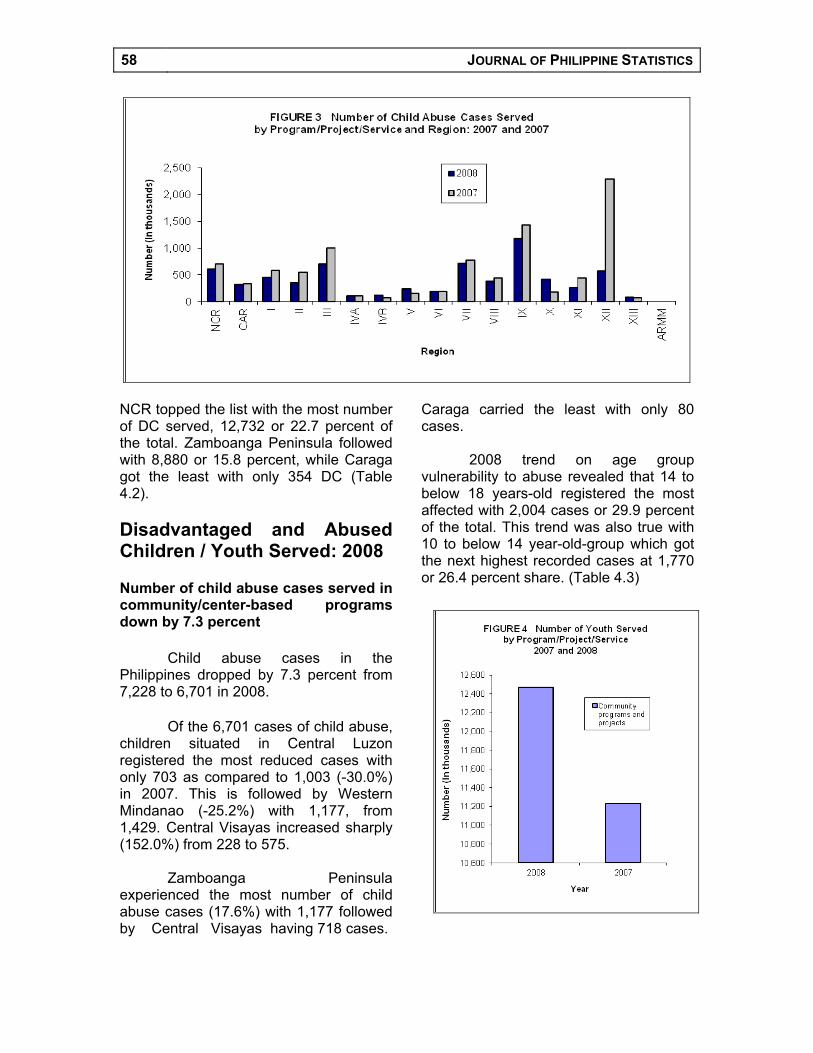
58 JOURNAL OF PHILIPPINE STATISTICS
NCR topped the list with the most number of DC served, 12,732 or 22.7 percent of the total. Zamboanga Peninsula followed with 8,880 or 15.8 percent, while Caraga got the least with only 354 DC (Table 4.2). Disadvantaged and Abused Children / Youth Served: 2008 Number of child abuse cases served in community/center-based programs down by 7.3 percent
Child abuse cases in the Philippines dropped by 7.3 percent from 7,228 to 6,701 in 2008.
Of the 6,701 cases of child abuse,
children situated in Central Luzon registered the most reduced cases with only 703 as compared to 1,003 (-30.0%) in 2007. This is followed by Western Mindanao (-25.2%) with 1,177, from 1,429. Central Visayas increased sharply (152.0%) from 228 to 575.
Zamboanga Peninsula
experienced the most number of child abuse cases (17.6%) with 1,177 followed by Central Visayas having 718 cases.
Caraga carried the least with only 80 cases.
2008 trend on age group
vulnerability to abuse revealed that 14 to below 18 years-old registered the most affected with 2,004 cases or 29.9 percent of the total. This trend was also true with 10 to below 14 year-old-group which got the next highest recorded cases at 1,770 or 26.4 percent share. (Table 4.3)

SOCIAL WELFARE AND COMMUNITY DEVELOPMENT 59
Youth Served: 2008
Youth served posts an increase of 11.0 percent
Youth served in the community
and center-based programs during the year 2008 reached 12,468, or an increase of 11.0 percent as compared to 11,233 served in 2007. Of all regions covered by these programs, Zamboanga Peninsula got the highest with 10,444 or about 83.8 percent served. Other regions showed minimal number of youth served. (Table 4.4)
Davao region got the most children in conflict with law
Of the total (2,362) children in
conflict with the law, 55.2 percent or 1,304 were served in community based programs while 44.8 percent or 1,058 were served in centers or institutions.
Most offenders (1,749) or 74
percent came from no age bracket offenders followed by 14 to below 18 with
569 or 24.1 percent. There were probably more
reported cases of youth offenders considering that these figures came only from the DSWD in community-and-center based programs.
Regional records showed that
Davao Region has the most youth offenders when it shared 272 or 10.6 percent who came in conflict with the law. Central Visayas came so close as second offenders with 256 or 9.9 percent share. The least share went to Bicol with only 35 offenders. (Table 4.5)
Welfare and Protection of Disadvantaged Women 2008 Assisted women reflect a decrease of 19.6 percent
Women numbering 13,564 were
served by the community- and center-based programs during the year 2008.
FIGURE 5 NUmber of Children in Conflict w ith the Law (CICL) Served by Program/Project/Service
2007 and 2007
2,100
2,200
2,300
2,400
2,500
2,600
2,700
2,800
2008 2007
Year
Num
ber (
In th
ousa
nds)
Community programs andpro jects
FIGURE 6 Number of Women Served by Program/Project/Service
2007 and 2008
0
2,000
4,000
6,000
8,000
10,000
12,000
14,000
16,000
18,000
2008 2007
Year
Num
ber (
In th
ousa
nds)
Community programs andpro jects

60 JOURNAL OF PHILIPPINE STATISTICS
Compared to 2007 (16,880) served, It reflected a decrease of 19.6 percent.
Among regions, Davao Region or
Southern Mindanao got the most number of beneficiaries with 3,946 or 29.1 percent of the total women served in 2008. This was followed by Zamboanga Peninsula with 2,553 or 18.8 percent and Northern Mindanao with 1,273 or 9.4 percent (Table 4.6).
Persons with Disabilities: 2008 Introduction
Enabling acts were issued to raise
the level of awareness of the general public and policymakers on ageing, on the needs of persons with disabilities (PWDs), and on the prevention of discrimination and abuse of older persons (OPs). All government agencies and nongovernment organizations (NGOs) are mandated to spearhead programs, projects, and services for their welfare, thus bringing these more-often-neglected sectors into the mainstream of society.
On the forefront of these agencies and organizations are an Inter-Agency Committee chaired by the DSWD tasked to oversee the foregoing thrusts that seek to promote the rights, full participation, and equality for OPs and PWDs. Moreover, Batas Pambansa 344, otherwise known as the Accessibility Law, provides for friendly facilities for the OPs and PWDs such as:
• Well-lit government buildings • Readable sign boards • Specially-built and -designed
comfort rooms • Ramps • Improved architectural designs of
government buildings to facilitate access of OPs and PWDs
• Nonformal education • Livelihood • Vocational skills training for
employment purposes • Care-giving training for family
members • Counseling, professional guidance
and family therapy • Specialized skills training
for professionals and service providers
• Protection and safety program.
Persons with disabilities (PWDs) increase by 14.4 percent
The community- and center-based programs of the DSWD served a total of 4,538 persons with disabilities (PWDs) during the year 2008. This reflected a decrease of 11.4 percent as compared with those served (5,120) in 2007.
During this period, performance of community-based programs implemented by DSWD’s Crisis Intervention Units (CIUs) in serving PWDs showed 5.3 percent decrease from the previous figure of 361 to 342 in 2008.
.
FIGURE 7 Number of Persons With Disabilities (PWDs) Served by Program/Project/Service
2007 and 2008
4,200
4,300
4,400
4,500
4,600
4,700
4,800
4,900
5,000
5,100
5,200
2008 2007
Year
Num
ber (
In th
ousa
nds)
Community programs andpro jects

SOCIAL WELFARE AND COMMUNITY DEVELOPMENT 61
The same trend was shown by the center/institution-based program, which revealed a 11.8 percent decrease of the PWDs (4,759) served compared to 4,196 in 2007. Of the total number of disabled persons served by both community- and center-based program/services, the biggest share went to NCR with 3,777 or 83.2 percent of the total PWDs served. Other regions have minimal performances as compared to the NCR high record. (Table 4.7)
Older Persons Served: 2008
This discussion includes data on senior citizens served by DSWD through the following services by program or project:
Locally-Funded Project Older Persons as Volunteer Resource. Under the social mobilization (SOCMOB) project of PWDs, senior citizens (SCs) and their families, SCs are being trained and mobilized to render volunteer work on counseling services, sociocultural and environmental concerns, spiritual life enrichment, and other community services.
Residential Services for Older
Persons. This includes data on the number of OPs or elderlies served in homes for elderly.
Senior citizens served increase by 65.9 percent
A total of 5,453 senior citizens were served during 2008 by the community- and center or institution-based programs. This resulted to an increase of 65.9 percent over the 3,286 served during the year 2007.
DSWD served 4,676 SCs under community-based programs. This was higher than those served in the center or institution-based programs (777 SCs) or by 85.7 percent.
Regional tally showed NCR
topped the list with 2,511 SCs served (Table 4.8).
FIGURE 8 Number of Senior Citizens (SCs) Served by Program/Project/Service
2007 and 2008
0
1,000
2,000
3,000
4,000
5,000
6,000
2008 2007
Year
Num
ber (
In th
ousa
nds)
Community programsand pro jects
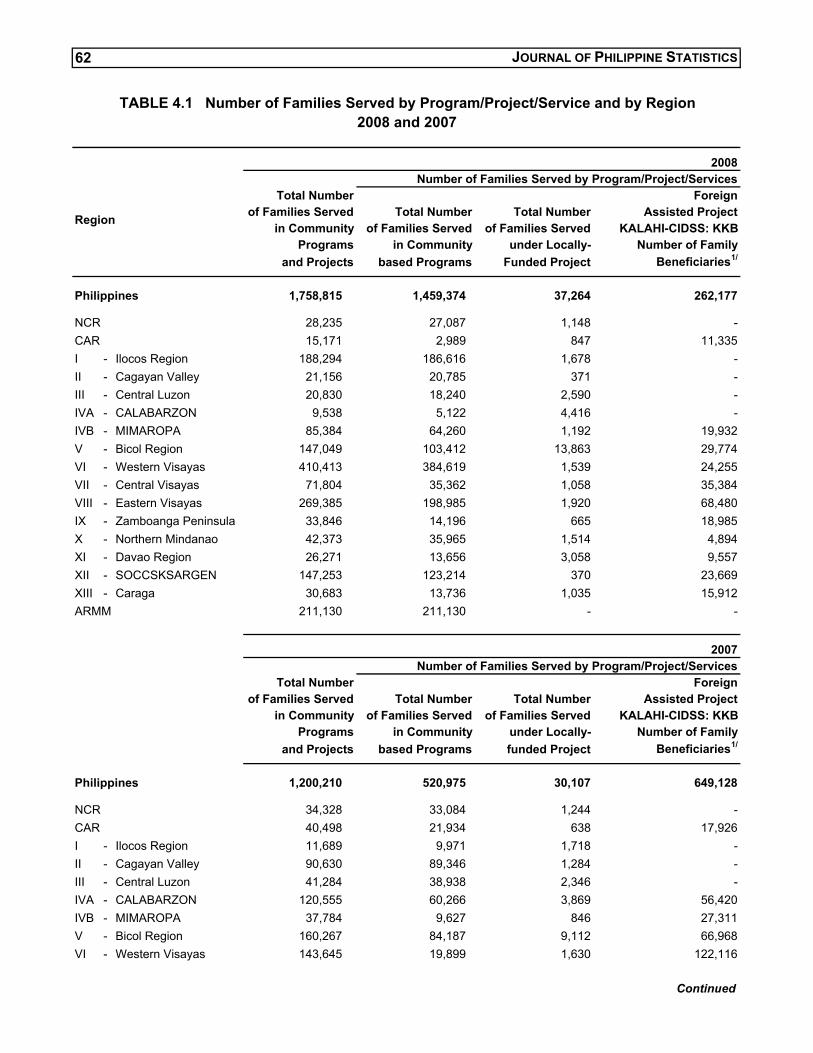
JOURNAL OF PHILIPPINE STATISTICS
2008Number of Families Served by Program/Project/Services
ForeignTotal Number Assisted Project
of Families Served KALAHI-CIDSS: KKBunder Locally- Number of Family
Funded Project Beneficiaries1/
1,758,815 1,459,374 37,264 262,177
NCR 28,235 27,087 1,148 -CAR 15,171 2,989 847 11,335I - Ilocos Region 188,294 186,616 1,678 -II - Cagayan Valley 21,156 20,785 371 -III - Central Luzon 20,830 18,240 2,590 -IVA - CALABARZON 9,538 5,122 4,416 -IVB - MIMAROPA 85,384 64,260 1,192 19,932V - Bicol Region 147,049 103,412 13,863 29,774VI - Western Visayas 410,413 384,619 1,539 24,255VII - Central Visayas 71,804 35,362 1,058 35,384VIII - Eastern Visayas 269,385 198,985 1,920 68,480IX - Zamboanga Peninsula 33,846 14,196 665 18,985X - Northern Mindanao 42,373 35,965 1,514 4,894XI - Davao Region 26,271 13,656 3,058 9,557XII - SOCCSKSARGEN 147,253 123,214 370 23,669XIII - Caraga 30,683 13,736 1,035 15,912ARMM 211,130 211,130 - -
2007Number of Families Served by Program/Project/Services
ForeignTotal Number Assisted Project
of Families Served KALAHI-CIDSS: KKBunder Locally- Number of Familyfunded Project Beneficiaries1/
1,200,210 520,975 30,107 649,128
NCR 34,328 33,084 1,244 -CAR 40,498 21,934 638 17,926I - Ilocos Region 11,689 9,971 1,718 -II - Cagayan Valley 90,630 89,346 1,284 -III - Central Luzon 41,284 38,938 2,346 -IVA - CALABARZON 120,555 60,266 3,869 56,420IVB - MIMAROPA 37,784 9,627 846 27,311V - Bicol Region 160,267 84,187 9,112 66,968VI - Western Visayas 143,645 19,899 1,630 122,116
Continued
Philippines
of Families Servedin Community
62
Philippines
Programs
of Families Servedin Community
based Programs
Programs
Total Numberof Families Served
and Projects
Total Numberin Community
TABLE 4.1 Number of Families Served by Program/Project/Service and by Region2008 and 2007
and Projects based Programs
Region
in Community
Total NumberTotal Number
of Families Served

SOCIAL WELFARE AND COMMUNITY DEVELOPMENT 63
Table 4.1 -- Concluded
2007Number of Families Served by Program/Project/Services
ForeignTotal Number Assisted Project
of Families Served KALAHI-CIDSS: KKBunder Locally- Number of Familyfunded Project Beneficiaries1/
VII - Central Visayas 49,191 10,895 941 37,355VIII - Eastern Visayas 107,142 3,597 1,475 102,070IX - Zamboanga Peninsula 75,347 16,959 330 58,058X - Northern Mindanao 43,538 9,503 2,135 31,900XI - Davao Region 61,578 23,268 1,834 36,476XII - SOCCSKSARGEN 89,054 34,650 90 54,314XIII - Caraga 60,961 22,132 615 38,214ARMM 32,719 32,719 - -
Notes: KALAHI-CIDSS: KKB - Kapit-Bisig Laban sa Kahirapan-Comprehensive and Integrated Delivery of Social Services: Kapangyarihan at Kaunlaran sa Barangay. It covers 4,229 barangay in 184 municipalities, 42 provinces across 12 regions. 1/ Number of family beneficiaries as estimated from the number of households that benefited from KALAHI-CIDSS: KKB Project.
Sources: Department of Social Welfare and Development
of Families Servedin Community
Total NumberRegion Total Number
Programsof Families Served
in Communityand Projects based Programs

2008Total Number of Children Served Total Number of Childrenin Community and Center-based Served in Community-
Programs Based Programs
56,092 47,567
NCR 12,732 9,920CAR 1,334 1,239I - Ilocos Region 1,823 1,635II - Cagayan Valley 1,150 1,072III - Central Luzon 5,283 4,829IVA - CALABARZON 4,923 4,832IVB - MIMAROPA 6,834 6,834V - Bicol Region 1,112 969VI - Western Visayas 1,900 1,821VII - Central Visayas 3,880 3,607VIII - Eastern Visayas 896 726IX - Zamboanga Peninsula 8,880 5,475
Continued
TABLE 4.2 Number of Disadvantaged Children Served by Program/Project/Serviceby Region: 2008 and 2007
Philippines
Region

64 JOURNAL OF PHILIPPINE STATISTICS
Table 4.2 -- Continued
2008Total Number of Children Served Total Number of Childrenin Community and Center-based Served in Community-
Programs based Programs
X - Northern Mindanao 1,619 1,306XI - Davao Region 1,998 1,838XII - SOCCSKSARGEN 1,374 1,179XIII - Caraga 354 285ARMM
2008Total Number of Children Served in Centers/Institution-based Programs
8,525
NCR 2,812CAR 95I - Ilocos Region 188II - Cagayan Valley 78III - Central Luzon 454IVA - CALABARZON 91IVB - MIMAROPA -V - Bicol Region 143VI - Western Visayas 79VII - Central Visayas 273VIII - Eastern Visayas 170IX - Zamboanga Peninsula 3,405X - Northern Mindanao 313XI - Davao Region 160XII - SOCCSKSARGEN 195XIII - Caraga 69ARMM -
2007Total Number of Children Served Total Number of Childrenin Community and Center-based Served in Community-
Programs based Programs
47,356 40,029
NCR 12,446 9,317CAR 811 691I - Ilocos Region 2,788 2,664II - Cagayan Valley 1,175 1,098
Continued
Philippines
Region
Philippines

SOCIAL WELFARE AND COMMUNITY DEVELOPMENT 65
Table 4.2 -- Continued
2007Total Number of Children Served Total Number of Childrenin Community and Center-based Served in Community-
Programs based Programs
III - Central Luzon 5,656 5,148IVA - CALABARZON 5,026 4,944IVB - MIMAROPA 1,634 1,634V - Bicol Region 866 749VI - Western Visayas 1,625 1,545VII - Central Visayas 3,701 3,443VIII - Eastern Visayas 1,319 1,183IX - Zamboanga Peninsula 5,509 3,395X - Northern Mindanao 1,425 1,267XI - Davao Region 2,146 1,867XII - SOCCSKSARGEN 947 847XIII - Caraga 282 237ARMM - -
2007Total Number of Children Served in Centers/Institution-based Programs
3,528 7,327
NCR 1,840 3,129CAR 45 120I - Ilocos Region 32 124II - Cagayan Valley 30 77III - Central Luzon 243 508IVA - CALABARZON 4 82IVB - MIMAROPA - -V - Bicol Region 44 117VI - Western Visayas 11 80VII - Central Visayas 32 258VIII - Eastern Visayas 136IX - Zamboanga Peninsula 2,114X - Northern Mindanao 158XI - Davao Region 279XII - SOCCSKSARGEN 100XIII - Caraga 45ARMM -
Source: Department of Social Welfare and Development
Philippines
Region

66 JOURNAL OF PHILIPPINE STATISTICS
2008 2007Number of Child Abuse Cases Served Number of Child Abuse Cases Served
6,701 7,228
NCR 611 701CAR 320 331I - Ilocos Region 456 579II - Cagayan Valley 354 544III - Central Luzon 703 1,003IVA - CALABARZON 103 106IVB - MIMAROPA 121 71V - Bicol Region 233 149VI - Western Visayas 191 189VII - Central Visayas 718 778VIII - Eastern Visayas 381 442IX - Zamboanga Peninsula 1,177 1,429X - Northern Mindanao 416 172XI - Davao Region 262 441XII - SOCCSKSARGEN 575 2,287XIII - Caraga 80 65ARMM - -
Source: Department of Social Welfare and Development
2008Total Number Total Number
of Youth Served of Youth Total Numberin Community Served in of Youth Served
and Center- Community- in Centers/Institution-based Programs based Programs based Programs
12,468 6,174 6,294
NCR 262 241 21CAR 40 40 -I - Ilocos Region 182 75 107II - Cagayan Valley 17 17 -III - Central Luzon 99 - 99IVA - CALABARZON 192 15 177IVB - MIMAROPA - - -V - Bicol Region 58 32 26VI - Western Visayas 102 50 52VII - Central Visayas 412 208 204VIII - Eastern Visayas 70 1 69IX - Zamboanga Peninsula 10,444 5,162 5,282X - Northern Mindanao 360 281 79XI - Davao Region 152 - 152XII - SOCCSKSARGEN 23 23 -XIII - Caraga 55 29 26ARMM - - -
Continued
TABLE 4.3 Number of Child Abuse Cases Served by Program/Project/Serviceby Region: 2008 and 2007
Region
Region
Philippines
by Region and by Sex: 2008 and 2007
Philippines
TABLE 4.4 Number of Youth Served by Program/Project/Service

SOCIAL WELFARE AND COMMUNITY DEVELOPMENT 67
Table 4.4 -- Concluded
2007Total Number Total Number
of Youth Served of Youth Total Numberin Community Served in of Youth Served
and Center- Community- in Centers/Institution-based Programs based Programs based Programs
11,233 4,649 6,584
NCR 1,343 12 1,331CAR 4 4 -I - Ilocos Region 245 136 109II - Cagayan Valley 4 4 -III - Central Luzon 111 - 111IVA - CALABARZON 311 103 208IVB - MIMAROPA 125 125 -V - Bicol Region 123 103 20VI - Western Visayas 62 2 60VII - Central Visayas 744 473 271VIII - Eastern Visayas 149 74 75IX - Zamboanga Peninsula 7,358 3,166 4,192X - Northern Mindanao 197 162 35XI - Davao Region 336 185 151XII - SOCCSKSARGEN 18 18 -XIII - Caraga 103 82 21ARMM - - -
Source: Department of Social Welfare and Development
2008Total Number of CICL Served Total Number of CICL
in Community and Center-based Served in Community-Programs based Programs
2,362 1,304
NCR 54 -CAR 115 115I - Ilocos Region 168 61II - Cagayan Valley 74 70III - Central Luzon 225 127IVA - CALABARZON 187 10IVB - MIMAROPA 49 49V - Bicol Region 35 8VI - Western Visayas 128 76VII - Central Visayas 256 120
Continued
Region
Philippines
Philippines
TABLE 4.5 Number of Children in Conflict with the Law (CICL) Served by ProgramProject/Service by Region: 2008 and 2007
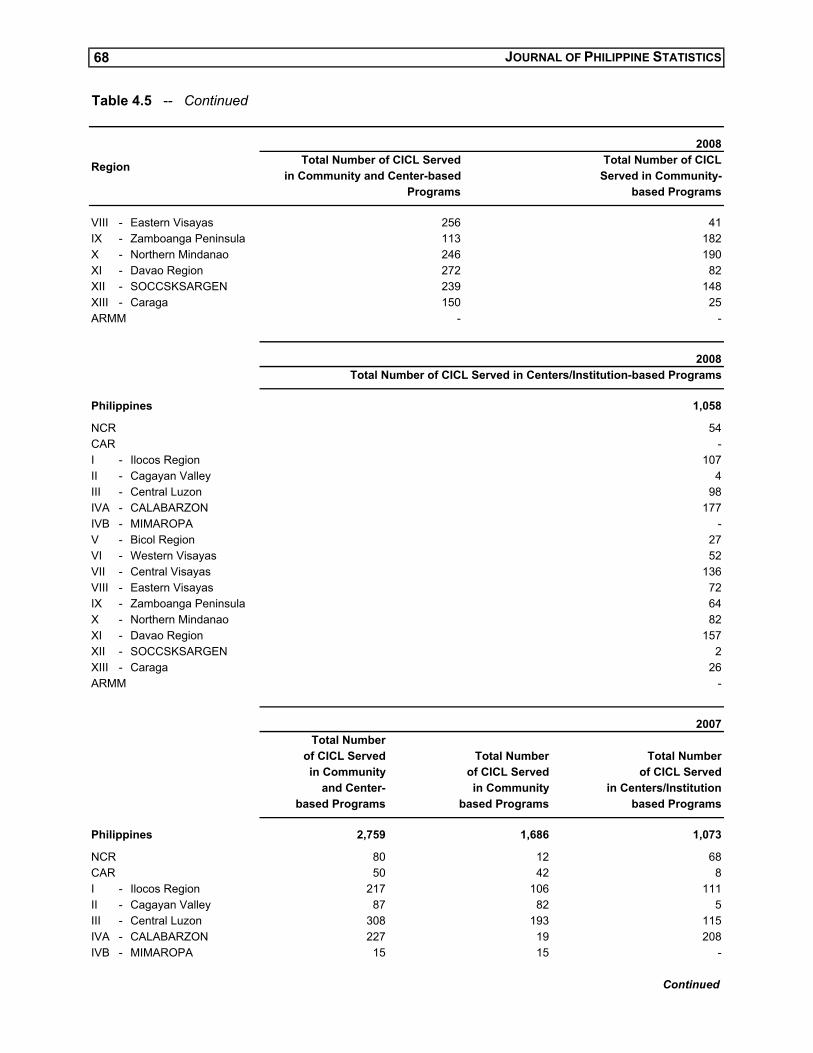
68 JOURNAL OF PHILIPPINE STATISTICS
Table 4.5 -- Continued
2008Total Number of CICL Served Total Number of CICL
in Community and Center-based Served in Community-Programs based Programs
VIII - Eastern Visayas 256 41IX - Zamboanga Peninsula 113 182X - Northern Mindanao 246 190XI - Davao Region 272 82XII - SOCCSKSARGEN 239 148XIII - Caraga 150 25ARMM - -
2008Total Number of CICL Served in Centers/Institution-based Programs
1,058
NCR 54CAR -I - Ilocos Region 107II - Cagayan Valley 4III - Central Luzon 98IVA - CALABARZON 177IVB - MIMAROPA -V - Bicol Region 27VI - Western Visayas 52VII - Central Visayas 136VIII - Eastern Visayas 72IX - Zamboanga Peninsula 64X - Northern Mindanao 82XI - Davao Region 157XII - SOCCSKSARGEN 2XIII - Caraga 26ARMM -
2007Total Number
of CICL Served Total Number Total Numberin Community of CICL Served of CICL Served
and Center- in Community in Centers/Institutionbased Programs based Programs based Programs
2,759 1,686 1,073
NCR 80 12 68CAR 50 42 8I - Ilocos Region 217 106 111II - Cagayan Valley 87 82 5III - Central Luzon 308 193 115IVA - CALABARZON 227 19 208IVB - MIMAROPA 15 15 -
Continued
Region
Philippines
Philippines

SOCIAL WELFARE AND COMMUNITY DEVELOPMENT 69
Table 4.5 -- Concluded
2007Total Number
of CICL Served Total Number Total Numberin Community of CICL Served of CICL Served
and Center- in Community in Centers/Institutionbased Programs based Programs based Programs
V - Bicol Region 74 54 20VI - Western Visayas 76 16 60VII - Central Visayas 280 167 113VIII - Eastern Visayas 173 96 77IX - Zamboanga Peninsula 213 138 75X - Northern Mindanao 326 291 35XI - Davao Region 363 206 157XII - SOCCSKSARGEN 247 247 -XIII - Caraga 23 2 21ARMM - - -
Source: Department of Social Welfare and Development
2008otal Number of WomenServed in Community Total Number of Women Total Number of Women
and Center-based Served in Community Served in Center- Programs Programs based Programs
13,564 10,624 2,940
NCR 1,619 311 1,308CAR 667 637 30I - Ilocos Region 204 140 64II - Cagayan Valley 723 700 23III - Central Luzon 788 722 66IVA - CALABARZON 120 103 17IVB - MIMAROPA 43 43 -V - Bicol Region 199 186 132VI - Western Visayas 52 29 23VII - Central Visayas 568 416 152VIII - Eastern Visayas 218 197 21IX - Zamboanga Peninsula 2,553 1,444 1,109X - Northern Mindanao 1,273 1,211 62XI - Davao Region 3,946 3,986 50XII - SOCCSKSARGEN 502 502 -XIII - Caraga 89 87 2ARMM - - -
Continued
TABLE 4.6 Number of Women Served by Program/Project/Serviceby Region: 2008 and 2007
Region
Region
Philippines

70 JOURNAL OF PHILIPPINE STATISTICS
Table 4.6 -- Concluded
2007otal Number of WomenServed in Community Total Number of Women Total Number of Women
and Center-based Served in Community Served in Center- Programs Programs based Programs
16,880 13,165 3,715
NCR 3,372 1,764 1,608CAR 382 344 38I - Ilocos Region 283 149 134II - Cagayan Valley 473 470 3III - Central Luzon 1,037 1,007 30IVA - CALABARZON 67 54 13IVB - MIMAROPA 85 85 -V - Bicol Region 596 581 15VI - Western Visayas 78 56 22VII - Central Visayas 2,405 2,216 189VIII - Eastern Visayas 635 610 25IX - Zamboanga Peninsula 3,775 2,229 1,546X - Northern Mindanao 688 666 22XI - Davao Region 2,360 2,292 68XII - SOCCSKSARGEN 593 593 -XIII - Caraga 51 49 2ARMM - - -
Source: Department of Social Welfare and Development
2008Total Number Total Number Total Number
of PWDs Served of PWDs of PWDsin Community Served in Served in
and Center- Community- Centers/Institutionbased-Programs based Programs based Programs
4,538 342 4,196
NCR 3,777 61 3,716CAR 42 42 -I - Ilocos Region 113 10 10II - Cagayan Valley 19 19 -III - Central Luzon 4 4 -IVA - CALABARZON 49 49 -IVB - MIMAROPA - - -V - Bicol Region 50 50 -VI - Western Visayas - - -VII - Central Visayas 162 81 81VIII - Eastern Visayas 4 4 -
Continued
Philippines
Region
Philippines
Service by Region: 2008 and 2007
Region
TABLE 4.7 Number of Persons With Disabilities (PWDs) Served by Program/Project

SOCIAL WELFARE AND COMMUNITY DEVELOPMENT 71
Table 4.7 -- Concluded
2008Total Number Total Number Total Number
of PWDs Served of PWDs of PWDsin Community Served in Served in
and Center- Community- Centers/Institutionbased-Programs based Programs based Programs
IX - Zamboanga Peninsula 185 5 108X - Northern Mindanao - - -XI - Davao Region 7 7 -XII - SOCCSKSARGEN 116 - 116XIII - Caraga 10 10 -ARMM - - -
2007Total Number Total Number Total Number
of PWDs Served of PWDs of PWDsin Community Served in Served in
and Center- Community- Centers/Institutionbased-Programs based Programs based Programs
5,120 361 4,759
NCR 4,205 3 4,202CAR 62 62 -I - Ilocos Region 80 2 78II - Cagayan Valley 11 11 -III - Central Luzon 46 6 40IVA - CALABARZON 100 100 -IVB - MIMAROPA 4 4 -V - Bicol Region 109 109 -VI - Western Visayas - - -VII - Central Visayas 214 19 195VIII - Eastern Visayas 7 7 -IX - Zamboanga Peninsula 148 3 145X - Northern Mindanao - - -XI - Davao Region - - -XII - SOCCSKSARGEN 99 - 99XIII - Caraga 35 35 -ARMM - - -
Source: Department of Social Welfare and Development
Region
Philippines
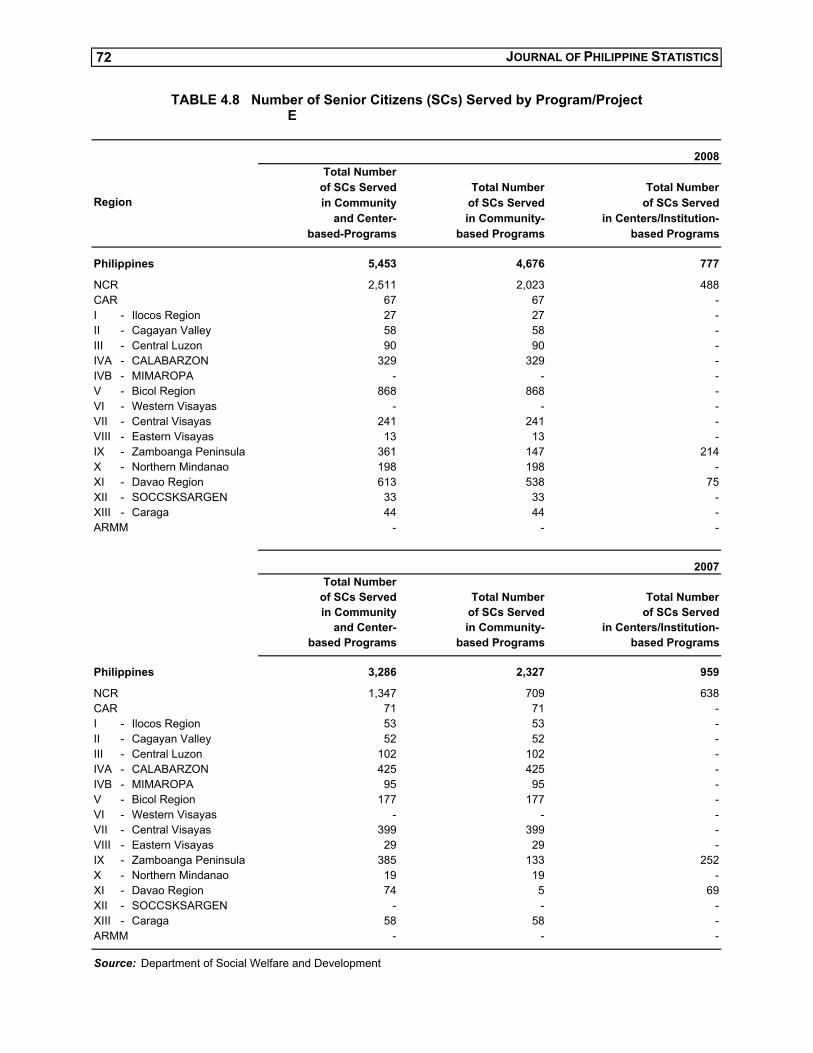
72 JOURNAL OF PHILIPPINE STATISTICS
2008Total Number
of SCs Served Total Number Total Numberin Community of SCs Served of SCs Served
and Center- in Community- in Centers/Institution-based-Programs based Programs based Programs
5,453 4,676 777
NCR 2,511 2,023 488CAR 67 67 -I - Ilocos Region 27 27 -II - Cagayan Valley 58 58 -III - Central Luzon 90 90 -IVA - CALABARZON 329 329 -IVB - MIMAROPA - - -V - Bicol Region 868 868 -VI - Western Visayas - - -VII - Central Visayas 241 241 -VIII - Eastern Visayas 13 13 -IX - Zamboanga Peninsula 361 147 214X - Northern Mindanao 198 198 -XI - Davao Region 613 538 75XII - SOCCSKSARGEN 33 33 -XIII - Caraga 44 44 -ARMM - - -
2007Total Number
of SCs Served Total Number Total Numberin Community of SCs Served of SCs Served
and Center- in Community- in Centers/Institution-based Programs based Programs based Programs
3,286 2,327 959
NCR 1,347 709 638CAR 71 71 -I - Ilocos Region 53 53 -II - Cagayan Valley 52 52 -III - Central Luzon 102 102 -IVA - CALABARZON 425 425 -IVB - MIMAROPA 95 95 -V - Bicol Region 177 177 -VI - Western Visayas - - -VII - Central Visayas 399 399 -VIII - Eastern Visayas 29 29 -IX - Zamboanga Peninsula 385 133 252X - Northern Mindanao 19 19 -XI - Davao Region 74 5 69XII - SOCCSKSARGEN - - -XIII - Caraga 58 58 -ARMM - - -
Source: Department of Social Welfare and Development
Philippines
TABLE 4.8 Number of Senior Citizens (SCs) Served by Program/ProjectE
Region
Philippines

73
Education Indicators School Years 2004-2005 and 2005-2006
Introduction Education plays a remarkable role in growing economies. As businesses become increasingly education-based, learning or instruction carries a greater burden in improving skill and competitiveness of the people. In the Philippines, the elementary education program is created to give six years of basic literacy, numeric thinking, and work skills to improve the children’s learning capabilities and values. Graduates of the elementary course are accepted to the secondary course. This level is the continuation of general education given in the elementary level and helps as a preparation for vocational or college education. Those who have completed secondary education can be admitted to the collegiate or university level.
Public education is entirely subsidized by the national government as mandated by the Constitution while private schools are run by independent entities. Two government bodies supervise the country’s educational system. The Department of Education (DepEd) administers preschool, elementary, and secondary schools while the Commission on Higher Education (CHED) manages tertiary and other higher education institutions. Various indicators assess the capability of the Philippine educational system in terms of objectivity, competency, and sufficient delivery. Indicators such as net participation rate, cohort survival rate, teacher-pupil ratio, number of teachers, and number of public and private schools are used every school year to measure system improvement. Definition of Terms Net participation rate at the elementary level – the proportion of the number of enrollees 7-12 years old to population 7-12 years old
Net participation rate at the secondary level – the proportion of the number of enrollees 13-16 years old to the population 13-16 years old Cohort survival rate at the elementary level – the proportion of enrollees at the beginning grade which
Section V - EDUCATION AND CULTURE
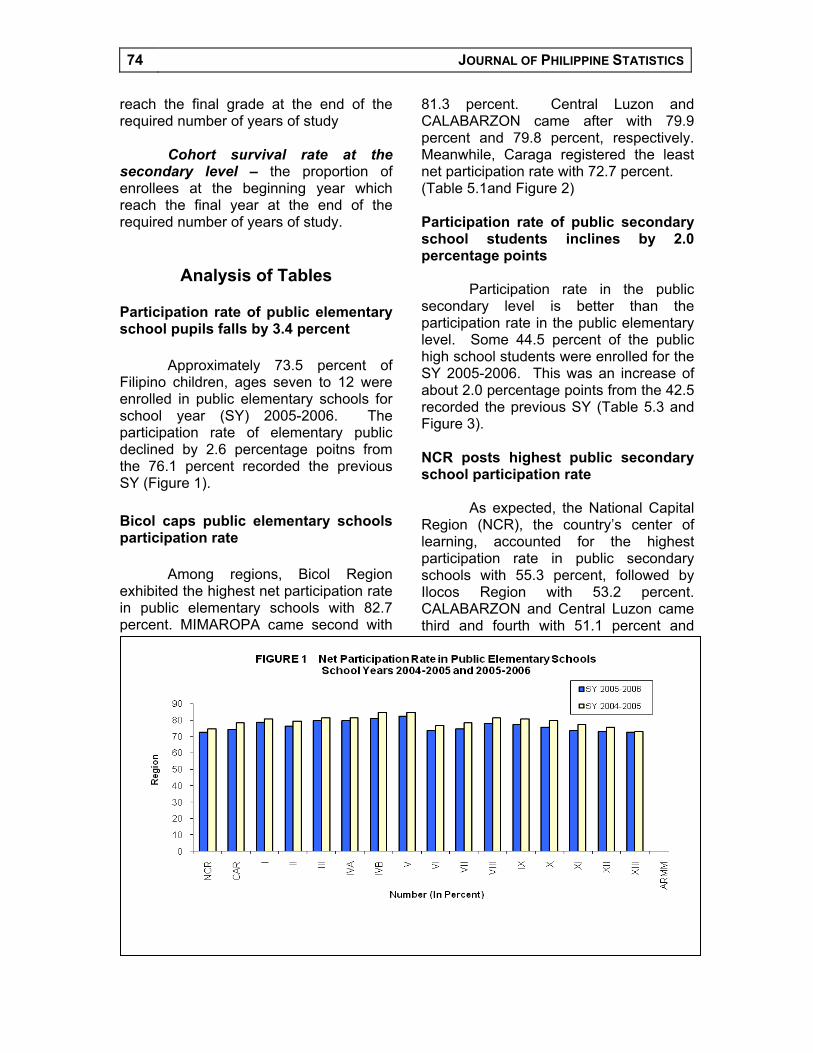
74 JOURNAL OF PHILIPPINE STATISTICS
reach the final grade at the end of the required number of years of study Cohort survival rate at the secondary level – the proportion of enrollees at the beginning year which reach the final year at the end of the required number of years of study.
Analysis of Tables Participation rate of public elementary school pupils falls by 3.4 percent Approximately 73.5 percent of Filipino children, ages seven to 12 were enrolled in public elementary schools for school year (SY) 2005-2006. The participation rate of elementary public declined by 2.6 percentage poitns from the 76.1 percent recorded the previous SY (Figure 1). Bicol caps public elementary schools participation rate Among regions, Bicol Region exhibited the highest net participation rate in public elementary schools with 82.7 percent. MIMAROPA came second with
81.3 percent. Central Luzon and CALABARZON came after with 79.9 percent and 79.8 percent, respectively. Meanwhile, Caraga registered the least net participation rate with 72.7 percent. (Table 5.1and Figure 2) Participation rate of public secondary school students inclines by 2.0 percentage points Participation rate in the public secondary level is better than the participation rate in the public elementary level. Some 44.5 percent of the public high school students were enrolled for the SY 2005-2006. This was an increase of about 2.0 percentage points from the 42.5 recorded the previous SY (Table 5.3 and Figure 3). NCR posts highest public secondary school participation rate As expected, the National Capital Region (NCR), the country’s center of learning, accounted for the highest participation rate in public secondary schools with 55.3 percent, followed by Ilocos Region with 53.2 percent. CALABARZON and Central Luzon came third and fourth with 51.1 percent and
FIGURE 1 Net Participation Rate in Public Elementary SchoolsSchool Years 2004-2005 and 2005-2006
0
10
20
30
40
50
60
70
80
90
N umber ( In P ercent)
SY 2005-2006
SY 2004-2005
Region
Num
ber (
In p
erce
nt)

EDUCATION AND CULTURE 75
50.1 percent, respectively. Northern Mindanao, on the other hand, showed the least with 37.8 percent (Table 5.2 and Figure 4). Cohort survival rate in public elementary school level diminishes by 3.5 percent Based on the DepEd’s report, 63 out of 100 Filipino first graders in the public school (62.6%) reached the sixth grade in SY 2005-2006, or a 2.3 percentage point decrease from the 64.9 percent registered the previous SY.
The top three regions with the highest rates were Ilocos Region with 80.9 percent or a 3.8 percentage points increase from the 77.13 percent recorded previously, followed by NCR with 73.6 percent or a 1.4 percentage points decrease from that of 74.7 percent, and Central Luzon with 71.9 percent or a 1.62 percentage points decrease from the 73.5 registered the former SY. Meanwhile, SOCCSKSARGEN had the least with 45.6 percent in SY 2005-2006 or a 1.74 percentage points few reflected the previous SY. (Table 5.3)
FIGURE 2 Net Participation Rate in Secondary SchoolsSchool Years 2004-2005 and 2005-2006
0.00
10.00
20.00
30.00
40.00
50.00
60.00
R egio n
SY 2005-2006SY 2004-2005
FIGURE 3 Cohort Survival Rate in Public Elementary SchoolsSchool Years 2004-2005 and 2005-2006
0
10
20
30
40
50
60
70
80
90
Region
Num
ber (
In p
erce
nt)
SY 2005-2006SY 2004-2005

76 JOURNAL OF PHILIPPINE STATISTICS
Cohort survival rate of public secondary school students short by 6.3 percentage points In the public secondary school level, 55 out of 100 first year high school students (55.0%) in current SY reached fourth year high school. This is 6.34 percentage points lower than the 61.3 percent revealed the previous SY. Across regions, the highest cohort survival rate was recorded in Ilocos Region with 69.6 percent or a mere 0.9 percentage points increase from the 68.7 percent it registered the previous SY. NCR followed with 60.8 percent or 5.91 percentage points less than the 66.7 percent recorded previously. On third place was Cagayan Valley with 60.2 percent or a decrease of 0.1 percentage points from that of 60.3 percent noted the previous SY. All other regions had lower than 60.0 percent cohort survival rate. The two school years saw Eastern Visayas and Central Luzon illustrating dwindling cohort survival rates with 9.89
percentage points and 0.14 percentage points losses. (Table 5.4)
Promotion of Arts and Culture The promotion of arts and culture brings to the awareness of the masses the symbolic and expansive powers in appreciation.
The National Commission for Culture and the Arts (NCCA) is the overall policymaking, coordinating, and grant-giving agency for the preservation, development, and promotion of Philippine arts and culture.
Philippine International Arts Festival: 2008
February is commonly known as the month of love, but for 18 years now, through Presidential Decree No. 683 in 1991, it has slowly acquired an additional significance in the country, having been declared as the National Arts Month.
FIGURE 4 Cohort Survival Rate in Secondary SchoolsSchool Years 2004-2005 and 2005-2006
0.00
10.00
20.00
30.00
40.00
50.00
60.00
70.00
80.00
R egio n
SY 2005-2006SY 2004-2005

EDUCATION AND CULTURE 77
The NCCA, the country’s premier institution tasked for the promotion of arts and culture, organized the National Arts Month (NAM) with a series of festivities and activities mounted throughout the country. In 2008, the celebration took a leap by going international under the name Philippine International Arts Festival (PIAF). The PIAF featured the talents and performances of the many artists and art groups in the seven disciplines of art namely: music, literature, architecture, dance, visual arts, cinema, and dramatic arts. Selected artists from different countries joined the local artists in the participation in the different PIAF events, to wit: 1. PA(ng)LABAS. A variation of traveling exhibition, lecture-forum, and film showing which aimed to examine both the medium of film and the form and style of architecture as they relate to the development of film media, architecture, and urban landscape 2. Walai-Vernacular Architecture of Mindanao. An architectural drawing and photography exhibit of the vernacular houses of Mindanao culled from the Walai Pangampong project, complemented with a lecture series, ritual dances, and craft works associated with house building and construction, and a model replica of selected indigenous structure 3. Sinerehiyon. A showcase of nascent cinema from the regions – from the highlands in and around Baguio to the heart of Bicolandia that is Naga City; across the thriving Visayas cities of Cebu, Bacolod, and Iloilo, and through Mindanao between Cagayan de Oro and Davao
4. Sayaw Pinoy. A touring dance concert bringing together different dance forms and featuring local dance troupes of the host cities and municipalities and professional dance companies in the country 5. Tanghal! The 3rd National University Theater Festival. Hosted by Colegio de San Juan de Letran-Calamba featured university-based theater groups from Luzon, Visayas, Mindanao, and NCR in cooperation with the Lusong Luzon Arts and Culture Network 6. Taboan: Philippine Writers Festival. Assembled writers from all the regions and across generations who interacted with one another and with their audience on issues pertaining to their craft or the situation of writing in the country 7. Organik Muzik. A series of four concerts showing the metamorphosis of elements of Philippine music from village roots to urban manifestations, from Cordillera traditions to Kadangyan’s world music, from Leyteño siday to Junior Kilat’s reggae Binisaya, from GAMABA Awardee Samaon Sulaiman’s virtuoso kutyapi-playing to the hard-driving neo-ethnic rock of Popong Landero, from flights of Balagtasan to the acid-jazz rants of Lourd de Veyra and Radioactive Sago. Musical innovator Joey Ayala weaves the journey towards an orderly whole 8. Philippine Visual Arts Fest ’08. A convergence of selected various Filipino and international artists from the different regions of the country. It featured the talents and performances of the artists and groups in the visual arts whose trainings, competitions, and creative expressions it has invested with the past year or so.

78 JOURNAL OF PHILIPPINE STATISTICS
2005-2006 2004-2005
73.51 76.06
NCR 72.94 74.85CAR 74.57 78.48I - Ilocos Region 78.76 80.92II - Cagayan Valley 76.51 79.62III - Central Luzon 79.89 81.54IVA - CALABARZON 79.83 81.65IVB - MIMAROPA 81.34 85.11V - Bicol Region 82.70 85.07VI - Western Visayas 73.68 76.93VII - Central Visayas 74.69 78.48VIII - Eastern Visayas 78.29 81.70IX - Zamboanga Peninsula 77.49 80.93X - Northern Mindanao 75.81 79.81XI - Davao Region 73.71 77.46XII - SOCCSKSARGEN 73.21 75.77XIII - Caraga 72.72 73.10ARMM - -
Source: Department of Education
2005-2006 2004-2005
44.50 42.50
NCR 55.26 52.04CAR 40.34 39.88I - Ilocos Region 53.22 51.24II - Cagayan Valley 46.78 45.46III - Central Luzon 50.12 48.01IVA - CALABARZON 51.06 48.88IVB - MIMAROPA 46.50 42.84V - Bicol Region 45.58 43.44VI - Western Visayas 47.15 45.59VII - Central Visayas 40.82 39.13VIII - Eastern Visayas 43.38 40.47IX - Zamboanga Peninsula 41.33 39.30X - Northern Mindanao 37.78 35.40XI - Davao Region 39.18 38.55XII - SOCCSKSARGEN 40.30 38.78XIII - Caraga 40.72 38.64ARMM - -
Source: Department of Education and Commission on Higher Education
TABLE 5.1 Net Participation Rate in Public Elementary Schools
Philippines
School Years 2004-2005 and 2005-2006
Region
TABLE 5.2 Net Participation Rate in Public Secondary Schools School Years 2004-2005 and 2005-2006
Region
Philippines

EDUCATION AND CULTURE 79
2007 2006Assessed Certified % Certified Assessed Certified % Certified
398,711 293,219 73.5 257,796 160,941 62.4
NCR 114,490 110,296 96.3 89,774 79,811 88.9CAR 12,630 8,440 66.8 8,559 5,089 59.5I - Ilocos Region 39,141 20,571 52.6 13,536 6,091 45.0II - Cagayan Valley 20,927 13,008 62.2 11,789 4,057 34.4III - Central Luzon 24,259 18,703 77.1 15,800 11,592 73.4IVA - CALABARZON 22,302 14,998 67.2 16,013 9,504 59.4IVB - MIMAROPA 8,862 5,429 61.3 5,349 1,972 36.9V - Bicol Region 22,839 13,633 59.7 6,335 2,545 40.2VI - Western Visayas 6,598 4,322 65.5 21,660 8,648 39.9VII - Central Visayas 25,026 13,740 54.9 14,627 9,113 62.3VIII - Eastern Visayas 35,076 23,982 68.4 8,578 7,089 82.6IX - Zamboanga Peninsula 17,040 11,260 66.1 11,212 2,547 22.7X - Northern Mindanao 11,236 9,420 83.8 5,094 2,534 49.7XI - Davao Region 9,160 554 60.6 11,826 5,080 43.0XII - SOCCSKSARGEN 15,204 9,534 62.7 8,680 3,485 40.1XIII - Caraga 13,402 10,037 74.9 8,964 1,784 19.9ARMM 519 292 56.3 - - -
Source: Technical Education and Skills Development Authority
by Region: 2006 and 2007TABLE 5.3 Number of Persons Assessed and Certified for Skills Competency
Region
Philippines
Pre-school ElementaryTotal Public Private Total Public Private
2006-2007 961,397 561,207 400,190 13,145,210 12,096,656 1,048,5542005-2006 911,899 524,075 387,824 12,913,845 11,982,462 931,383
SecondaryTotal Public Private
2006-2007 6,363,002 5,072,210 1,290,7922005-2006 6,267,015 4,979,030 1,287,792
Source: Department of Education
TABLE 5.4 Enrolment in Public and Private Schools by Level of EducationSY 2005-2006 and 2006-2007
School Year

80
Level of EducationElementary Secondary
SY 2006-2007 SY 2005-2006 SY 2006-2007 SY 2005-2006
342,346 341,784 130,606 126,077
NCR 28,909 29,050 19,153 17,204CAR 8,422 7,589 2,581 2,646I - Ilocos Region 21,078 20,990 8,573 8,487II - Cagayan Valley 14,340 14,278 5,111 5,049III - Central Luzon 33,143 32,756 12,307 11,865IVA - CALABARZON 33,793 33,283 13,204 12,669IVB - MIMAROPA 12,091 11,994 4,444 4,418V - Bicol Region 26,127 26,080 9,259 9,021VI - Western Visayas 31,544 32,070 13,019 12,830VII - Central Visayas 23,449 24,674 8,298 7,958VIII - Eastern Visayas 21,105 21,011 6,265 6,139IX - Zamboanga Peninsula 15,931 15,792 5,118 4,960X - Northern Mindanao 17,312 17,259 5,461 5,351XI - Davao Region 16,305 16,254 6,046 6,084XII - SOCCSKSARGEN 14,215 14,087 5,322 5,181XIII - Caraga 11,220 11,137 3,731 3,599ARMM1 13,362 13,480 2,714 2,616
Note: Teachers in the government sector include those holding position titles of Master Teachers I-II and Teachers I-IIINote: 1 Created as a region on August 1, 1989
Source: Department of Education
Region
Philippines
TABLE 5.5 Number of Teachers in Public Schools by Region and by Level of EducationSY 2005-2006 and 2006-2007
JOURNAL OF PHILIPPINE STATISTICS

80
Health and Vital Indicators 2008
Introduction
The Department of Health (DOH) is the principal health agency in the Philippines. It is responsible for ensuring access to basic public health services to all Filipinos through the provision of quality health care and regulation of providers of health goods and services. Given the mandate, DOH is both a stakeholder in the health sector and a policy and regulatory body for health. As a major player, DOH is a technical resource, a catalyst for health policy and a political sponsor and advocate for health issues.
Furthermore, the DOH
collaborates with other government and non-government entities in the conduct of surveys, the results of which become part and parcel of benchmarks necessary for the formulation of policies in health programs and advocacies.
On the other hand, the
production of vital statistics comprises a system of operations in which the registration of vital events is an important component. The system begins with the registration followed by the processing and controlling of vital records and ends with the compilation and analysis of vital statistics.
Under Commonwealth Act (CA)
591, the Bureau of Census, now the National Statistics Office (NSO) is mandated to generate general purpose statistics and to carry out and administer the Civil Registration Act.
Definition of Terms
Health may refer to the
soundness and general well-being of body and mind. Securing good health for people is one way of ensuring welfare and development for the country as a whole. It is, therefore, imperative upon the government to make provisions and invest in health welfare activities.
Vital statistics, on the other hand, are derived from information obtained at the time when the occurrences of vital events and their
Section VI – HEALTH, NUTRITION AND VITAL STATISTICS
HEALTH, NUTRITION AND VITAL STATISTICS 81
characteristics are inscribed in a civil register. Vital acts and events include births, deaths, fetal deaths, marriages, and all such events that have something to do with an individual's entrance and departure from life together with the changes in civil status that may occur to a person during his lifetime. Recording of these events in the civil register is known as vital or civil registration and the resulting documents are called vital records. Under Five Mortality (Preliminary Results from the 2008 National Demographic and Health Survey)
The 2008 National Democratic and Health Survey (NDHS) is a nationally representative survey of almost 14,000 households and 14,000 women ages 15-49, conducted from August 7 to September 27, 2008. The 2008 NDHS is the ninth in a series of demographic surveys undertaken by the National Statistics Office (NSO) at five-year intervals since 1968. The United States Agency for International Development (USAID) provided assistance for some activities during the preparatory and processing phases of the 2008 NDHS. Macro International provided technical assistance to the project. Thirty-four in a thousand live births die before age five In the Philippines, for every 1,000 live births, 34 die before reaching the age of five years. This was reported by the NDHS conducted in 2008 by the NSO. Under-five mortality rate in the country had declined gradually, from 54
deaths per 1,000 live births during the period 1988-1992 to 40 deaths per 1,000 live births in the period 1998-2002, and further down to its current level at 34 deaths per a thousand live births (Table1). The infant mortality rate in the country also declined, from 35 infant deaths per 1,000 live births in the period 1993-1997 to 25 deaths per 1,000 live births in 2003-2007 (Table 1). Under-five mortality rate down by 37.0 percent The Millennium Development Goals (MDG) agreed in 2000 by 189 nations, including the Philippines, calls for a reduction of the under-five mortality rate by two-thirds or 67.0 percent between 1990 and 2015. Using the 1993 NDS under-five mortality rate of 54 deaths per 1,000 live births as base estimate, the Philippines should aim at reducing the under-five mortality rate to 18 deaths or less per thousand live births by 2015. The 2008 NDHS estimate (34 deaths per 1,000 live births) represents a decrease of only 37.0 percent from the base estimate. Maternal and child health program implementers need to redouble efforts to achieve the desired MDG target on under-five mortality rate (Table 2). More women receive maternal care Preliminary results of the 2008 NDHS indicate some improvement in maternal care. About 91.0 percent of women with at least one live birth in the 5 years prior to the 2008 NDHS had received antenatal care from a health professional compared to 88.0 percent of the women based on the 2003 NDHS (Table 2). There is marked increase in births delivered by a health professional
Among all births in the five years preceding the 2008 NDHS, 62.0 percent
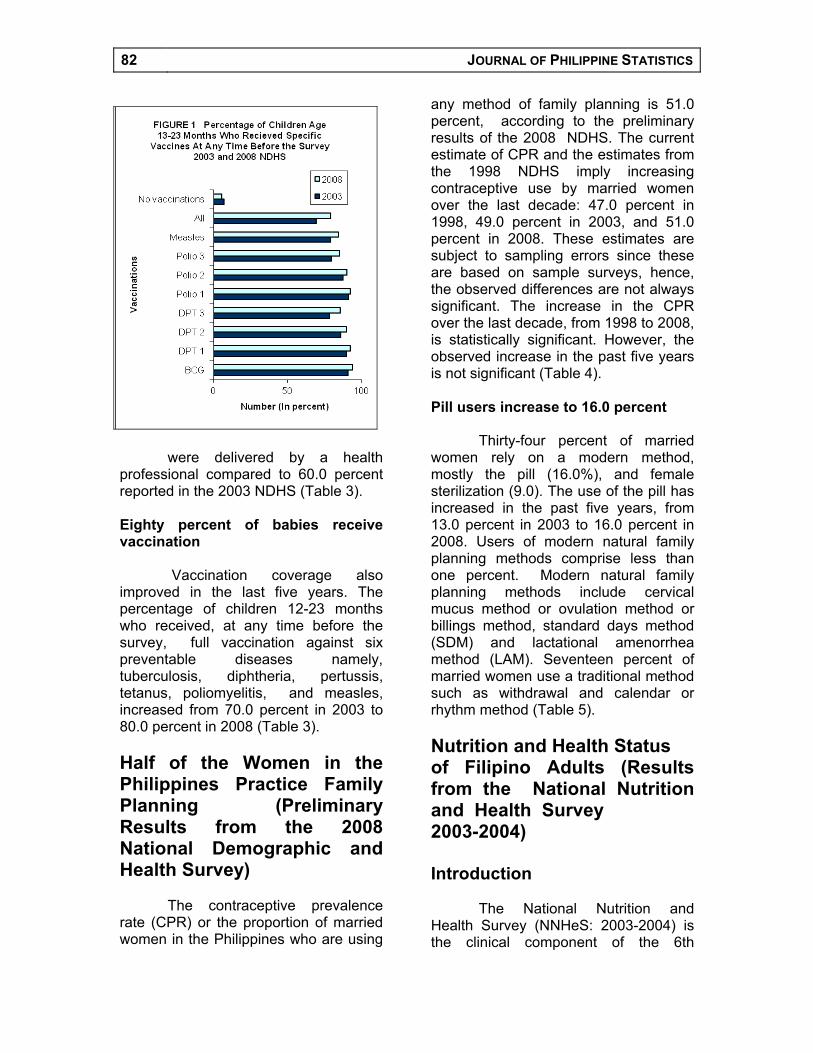
82 JOURNAL OF PHILIPPINE STATISTICS
were delivered by a health
professional compared to 60.0 percent reported in the 2003 NDHS (Table 3). Eighty percent of babies receive vaccination
Vaccination coverage also
improved in the last five years. The percentage of children 12-23 months who received, at any time before the survey, full vaccination against six preventable diseases namely, tuberculosis, diphtheria, pertussis, tetanus, poliomyelitis, and measles, increased from 70.0 percent in 2003 to 80.0 percent in 2008 (Table 3). Half of the Women in the Philippines Practice Family Planning (Preliminary Results from the 2008 National Demographic and Health Survey)
The contraceptive prevalence rate (CPR) or the proportion of married women in the Philippines who are using
any method of family planning is 51.0 percent, according to the preliminary results of the 2008 NDHS. The current estimate of CPR and the estimates from the 1998 NDHS imply increasing contraceptive use by married women over the last decade: 47.0 percent in 1998, 49.0 percent in 2003, and 51.0 percent in 2008. These estimates are subject to sampling errors since these are based on sample surveys, hence, the observed differences are not always significant. The increase in the CPR over the last decade, from 1998 to 2008, is statistically significant. However, the observed increase in the past five years is not significant (Table 4). Pill users increase to 16.0 percent
Thirty-four percent of married
women rely on a modern method, mostly the pill (16.0%), and female sterilization (9.0). The use of the pill has increased in the past five years, from 13.0 percent in 2003 to 16.0 percent in 2008. Users of modern natural family planning methods comprise less than one percent. Modern natural family planning methods include cervical mucus method or ovulation method or billings method, standard days method (SDM) and lactational amenorrhea method (LAM). Seventeen percent of married women use a traditional method such as withdrawal and calendar or rhythm method (Table 5). Nutrition and Health Status of Filipino Adults (Results from the National Nutrition and Health Survey 2003-2004) Introduction
The National Nutrition and Health Survey (NNHeS: 2003-2004) is the clinical component of the 6th

HEALTH, NUTRITION AND VITAL STATISTICS 83
National Nutrition Survey (6th NNS) conducted by the Food and Nutrition Research Institute of the Department of Science and Technology (FNRI-DOST). The NNHeS:2003-2004 is the second successful collaborative undertaking of FNRI-DOST with 14 other Medical Specialty Associations, the DOH, and the Department of Adult Medicine and Clinical Epidemiology of the UP College of Medicine, Philippine General Hospital.
This nationwide survey was
undertaken to determine the national prevalence of 20 nutrition-related and lifestyle diseases and 14 risk factors among Filipinos 20 years old and above.
A total of 4,753 adults from the
2,636 randomly selected households covered in the 2003 Family Income and Expenditure Survey (FIES) and the 6th NNS of FNRI-DOST were included in the survey.
The study used the four (4) pronged approach of anthropometric, biochemical, clinical and dietary assessment methodologies. 1. Dyslipidemia and Diabetes - Blood samples were drawn by venipuncture after 8-10 hours fasting using an enzymatic colorimetric method for analysis of total cholesterol, LDL-c, HDL-c, triglycerides and fasting blood sugar (FBS). Prevalence of dyslipidemia and diabetes were determined using the cut-offs recommended by the World Health Organization (WHO) and American Diabetes Association respectively 2. Hypertension - Blood pressure was taken using a conventional mercury sphygmomanometer. Systolic and diastolic blood pressures were taken from both arms in the morning before blood extraction
FIGURE 2 Percent Distribution of Currently Married Women by Contraceptive Method Used: 2003 and 2008
0.0
10.0
20.0
30.0
40.0
50.0
60.0
M e t hod
20032008
Method
Num
ber (
In p
erce
nt)
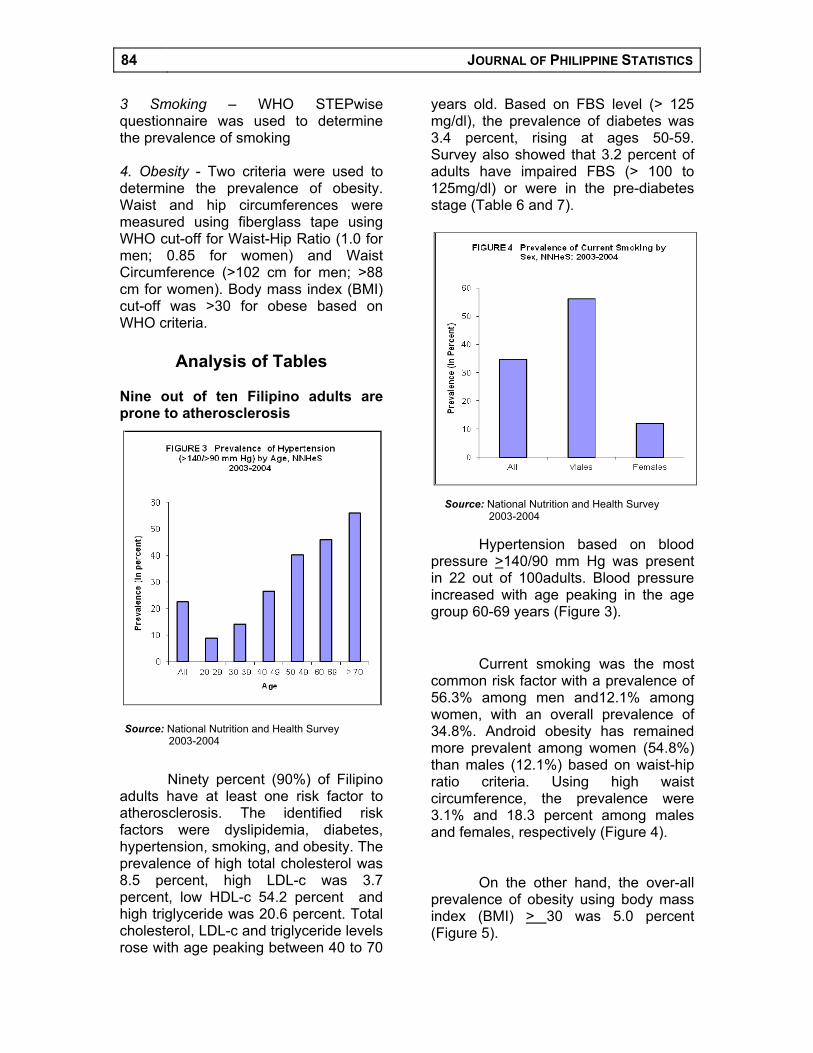
84 JOURNAL OF PHILIPPINE STATISTICS
3 Smoking – WHO STEPwise questionnaire was used to determine the prevalence of smoking 4. Obesity - Two criteria were used to determine the prevalence of obesity. Waist and hip circumferences were measured using fiberglass tape using WHO cut-off for Waist-Hip Ratio (1.0 for men; 0.85 for women) and Waist Circumference (>102 cm for men; >88 cm for women). Body mass index (BMI) cut-off was >30 for obese based on WHO criteria.
Analysis of Tables
Nine out of ten Filipino adults are prone to atherosclerosis
Ninety percent (90%) of Filipino
adults have at least one risk factor to atherosclerosis. The identified risk factors were dyslipidemia, diabetes, hypertension, smoking, and obesity. The prevalence of high total cholesterol was 8.5 percent, high LDL-c was 3.7 percent, low HDL-c 54.2 percent and high triglyceride was 20.6 percent. Total cholesterol, LDL-c and triglyceride levels rose with age peaking between 40 to 70
years old. Based on FBS level (> 125 mg/dl), the prevalence of diabetes was 3.4 percent, rising at ages 50-59. Survey also showed that 3.2 percent of adults have impaired FBS (> 100 to 125mg/dl) or were in the pre-diabetes stage (Table 6 and 7).
Hypertension based on blood pressure >140/90 mm Hg was present in 22 out of 100adults. Blood pressure increased with age peaking in the age group 60-69 years (Figure 3).
Current smoking was the most common risk factor with a prevalence of 56.3% among men and12.1% among women, with an overall prevalence of 34.8%. Android obesity has remained more prevalent among women (54.8%) than males (12.1%) based on waist-hip ratio criteria. Using high waist circumference, the prevalence were 3.1% and 18.3 percent among males and females, respectively (Figure 4).
On the other hand, the over-all
prevalence of obesity using body mass index (BMI) > 30 was 5.0 percent (Figure 5).
FIGURE 3 Prevalence of Hypertension (>140/>90 mm Hg) by Age, NNHeS
2003-2004
0
10
20
30
40
50
60
All 20-29 30-39 40-49 50-49 60-69 > 70
A ge
FIGURE 3 Prevalence of Hypertension (>140/>90 mm Hg) by Age
2003-2004
Age
Source: National Nutrition and Health Survey 2003-2004
FIGURE 4 Prevalence of Current Smoking by Sex, NNHeS: 2003-2004
0
10
20
30
40
50
60
All M ales Females
FIGURE 4 Prevalence of Current Smoking by Sex: 2003-2004
Source: National Nutrition and Health Survey 2003-2004

HEALTH, NUTRITION AND VITAL STATISTICS 85
Smoking is the most common lifestyle risk factor The initial NNHeS: 2003-2004 results has determined the prevalence of 5 nutrition-related and lifestyle risk factors, namely 1) dyslipidemia 2) diabetes 3) hypertension 4) smoking 5) obesity.
Based on the results, prevalence of dyslipidemia and diabetes were relatively low while prevalence of hypertension remained relatively high. Smoking is the most common lifestyle risk factor. Android obesity using both WHR and WC was more prevalent among women than men. Thus, the NNHeS 2003-2004 data may be used as basis in policy and program formulation for the prevention and control of nutrition-related and lifestyle diseases and risk factors. Moreover, the data will serve as basis for intensifying advocacy in the promotion of healthy lifestyle among the general population.
FIGURE 5 Prevalence of Anroid Obesity
based on WHO Criteria for Waist-Hip-Ratio (WHR) and Waist Circumference (WC),
NNHeS: 2003-2004
0
10
20
30
40
50
60
WC WHR
M alesFemales
FIGURE 5 Prevalence of Anroid Obesity based on WHO Criteria for Waist-Hip-Ratio
(WHR) and Waist Circumference (WC) 2003-2004
Source: National Nutrition and Health Survey 2003-2004

86 JOURNAL OF PHILIPPINE STATISTICS
Infant Mortality Under-five Mortality95% 95%
Confidence Interval Confidence IntervalRate Standard Lower Upper Rate Standard Lower Upper
Error Bound Bound Error Bound Bound
1993 1998-1992 33.6 - - - 54.2 - - -1994 1993-1997 35.1 2.3 30.5 39.7 48.4 2.8 42.7 542003 1998-2002 28.7 2.3 24.1 33.3 39.9 2.8 34.4 462008 2003-2007 24.9 2.1 20.7 29.1 33.5 2.5 28.6 39
Source : National Statistics Office, 1993 National Demographic Survey, 1998, 2003 and 2008 National Demographic Source : and Health Surveys
Indicators 2003 2008
in the 5 years before the survey who received antenatal care for the youngest child from a health professional1 87.6 91.0
Precentage delivered by a health professional among all births in the 5 years before the survey 59.8 61.8
Percentage delivered in a health facility among all births in the 5 years before the survey 37.9 43.8
Source : National Statistics Office, 2003 and 2008 National Demographic and Health Surveys
Vaccinations 2003 2008
BCG 90.8 93.9DPT 1 89.9 92.5DPT 2 85.9 89.6DPT 3 78.9 85.5Polio 1 91.3 92.4Polio 2 87.3 90.0Polio 3 79.8 85.2Measles 79.7 84.44All 69.8 79.5No vaccinations 7.3 5.6
Source : National Statistics Office, 2003 and 2008 National Demographic and Health Surveys
At Any Time Before the Survey: 2003 and 2008TABLE 6.3 Percentage of Children Age 13-23 Months Who Received Specific Vaccines
TABLE 6.1 Trends in Childhood Mortality Rates with Standard Errors and Confidence Intervals
Survey Year
Approximate Calendar
Year
TABLE 6.2 Selected Maternal Care Indicators: 2003 and 2008
Percentage of women age 15-49 with one or more live births
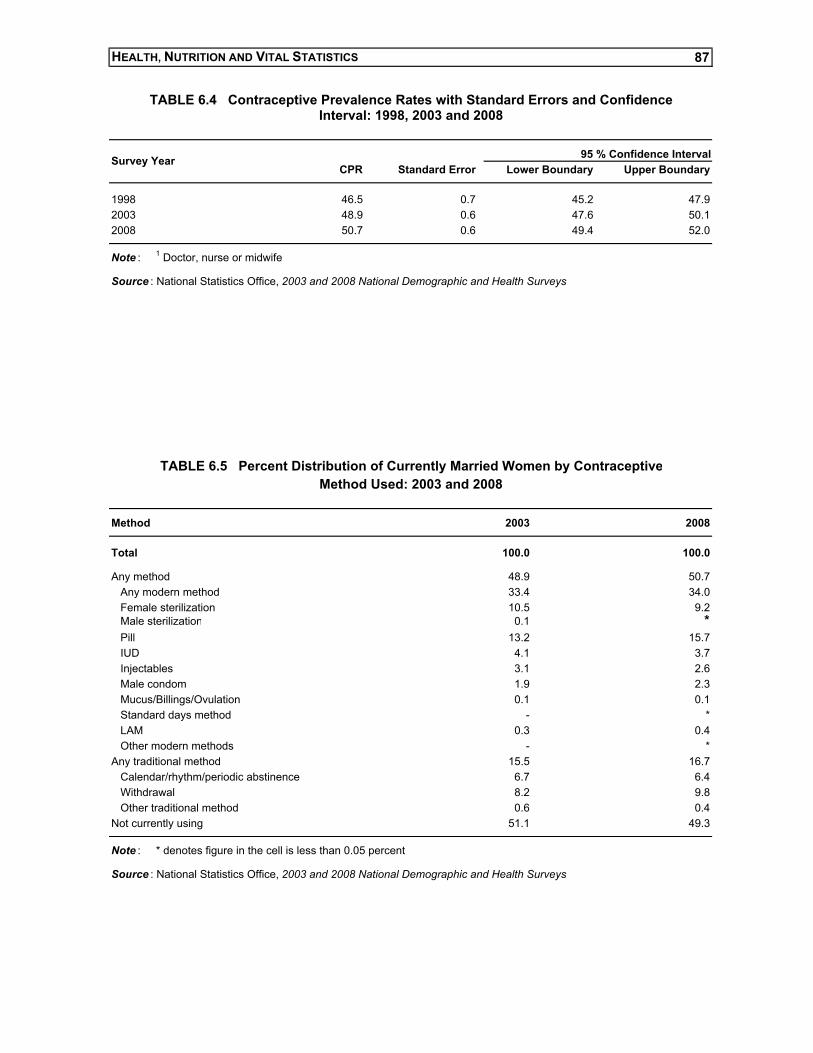
HEALTH, NUTRITION AND VITAL STATISTICS 87
95 % Confidence IntervalCPR Standard Error Lower Boundary Upper Boundary
1998 46.5 0.7 45.2 47.92003 48.9 0.6 47.6 50.12008 50.7 0.6 49.4 52.0
Note : 1 Doctor, nurse or midwife
Source : National Statistics Office, 2003 and 2008 National Demographic and Health Surveys
Method 2003 2008
Total 100.0 100.0
Any method 48.9 50.7 Any modern method 33.4 34.0 Female sterilization 10.5 9.2 Male sterilization 0.1 * Pill 13.2 15.7 IUD 4.1 3.7 Injectables 3.1 2.6 Male condom 1.9 2.3 Mucus/Billings/Ovulation 0.1 0.1 Standard days method - * LAM 0.3 0.4 Other modern methods - *Any traditional method 15.5 16.7 Calendar/rhythm/periodic abstinence 6.7 6.4 Withdrawal 8.2 9.8 Other traditional method 0.6 0.4Not currently using 51.1 49.3
Note : * denotes figure in the cell is less than 0.05 percent
Source : National Statistics Office, 2003 and 2008 National Demographic and Health Surveys
TABLE 6.4 Contraceptive Prevalence Rates with Standard Errors and ConfidenceInterval: 1998, 2003 and 2008
Survey Year
Method Used: 2003 and 2008TABLE 6.5 Percent Distribution of Currently Married Women by Contraceptive

88 JOURNAL OF PHILIPPINE STATISTICS
Blood level (mg/dl) Mean Level (mg/dL)
Total cholesterol ( >240) 184.4LDL-cholesterol ( > 190) 119.4HDL-cholesterol (< 40) 41.4Triglycerides ( > 200) 118.0
Sources : Food and Nutrition Research Instritute of the Department of Science and TechnologySource : 2003 National Nutrition and Health Survey (NNHeS)
Percent Distribution of Fasting Blood Sugar or Glucose Level
Mean 100 101-125 >125
20-29 74.2 98.1 1.2 0.730-39 78.6 95.8 2.1 2.040-49 84.8 90.1 5.0 4.950-49 91.2 85.4 5.7 8.960-69 85.7 88.1 5.6 6.3> 70 84.2 88.7 6.2 5.1
Sources : Food and Nutrition Research Instritute of the Department of Science and TechnologySource : 2003 National Nutrition and Health Survey (NNHeS)
Age
TABLE 6.6 Mean and Prevalence of Dyslipidemia Among Adults 20 Years Oldand Over: 2003-2004
TABLE 6.7 Means and Distribution of Adults to Fasting Blood Sugar (FBS) by Age2003-2004

89
Section VII - DEFENSE, CRIME AND DELINQUENCY
Crime Indicators Third Quarter 2008
Introduction
The government agency mandated to enforce the law, to prevent and control crimes, to maintain peace and order, and to ensure public safety and internal security with the active support of the community is the Philippine National Police (PNP).
The PNP's priority, namely the
campaigns against illegal drugs, illegal gambling, terrorism, street crimes, kidnapping, bank robberies, hi-jacking, carnapping, wanted persons and criminal gangs, as well as the accounting of firearms, and insurgency or communist terrorists find substance in the data presented in the following discussion.
The Revised Penal Code of
1990 classified crimes either as public
or private. Public crimes are those that directly endanger the society and its constituents such as those committed against national security, laws of the state, public order, public interest, and public morals, including drug-related offenses and those committed by public officers in the performance of their duty as civil servants. Private crimes, on the other hand, are those that afflict individuals or persons directly but endanger society on the whole, such as crimes against persons (destruction of life, parricide, murder, homicide, infanticide and abortion, and physical injuries); personal liberty and security; and crimes against property, chastity, and honor.
In measuring crime volume, a
distinct classification is used. Crimes are classified into index and non-index categories. Index crimes are those of serious nature which occur with marked frequency and regularity. Crimes against persons and crimes against property being normally reported to police authorities exemplify index crimes. Non-index crimes, on the other hand, are those with no marked regularity, hence, seldom find report in police files.
Analysis of Tables
Crime volume up 2.5 percent A total of 17,124 crimes were reported in the third quarter of 2008 against the 16,710 in the same period of 2007. Volume went up by 414 incidents or by 2.5 percent. Efficiency recorded was also higher, 89.9 percent of the
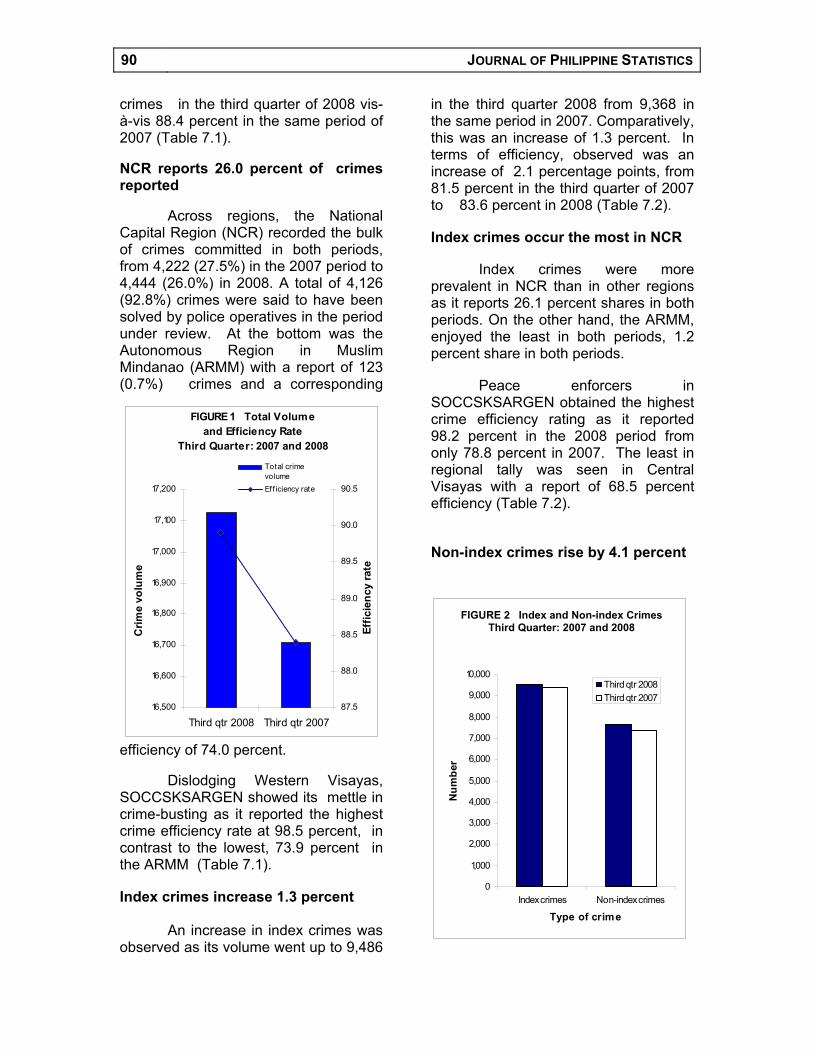
90 JOURNAL OF PHILIPPINE STATISTICS
crimes in the third quarter of 2008 vis-à-vis 88.4 percent in the same period of 2007 (Table 7.1). NCR reports 26.0 percent of crimes reported Across regions, the National Capital Region (NCR) recorded the bulk of crimes committed in both periods, from 4,222 (27.5%) in the 2007 period to 4,444 (26.0%) in 2008. A total of 4,126 (92.8%) crimes were said to have been solved by police operatives in the period under review. At the bottom was the Autonomous Region in Muslim Mindanao (ARMM) with a report of 123 (0.7%) crimes and a corresponding
efficiency of 74.0 percent.
Dislodging Western Visayas, SOCCSKSARGEN showed its mettle in crime-busting as it reported the highest crime efficiency rate at 98.5 percent, in contrast to the lowest, 73.9 percent in the ARMM (Table 7.1). Index crimes increase 1.3 percent An increase in index crimes was observed as its volume went up to 9,486
in the third quarter 2008 from 9,368 in the same period in 2007. Comparatively, this was an increase of 1.3 percent. In terms of efficiency, observed was an increase of 2.1 percentage points, from 81.5 percent in the third quarter of 2007 to 83.6 percent in 2008 (Table 7.2). Index crimes occur the most in NCR Index crimes were more prevalent in NCR than in other regions as it reports 26.1 percent shares in both periods. On the other hand, the ARMM, enjoyed the least in both periods, 1.2 percent share in both periods. Peace enforcers in SOCCSKSARGEN obtained the highest crime efficiency rating as it reported 98.2 percent in the 2008 period from only 78.8 percent in 2007. The least in regional tally was seen in Central Visayas with a report of 68.5 percent efficiency (Table 7.2). Non-index crimes rise by 4.1 percent
FIGURE 1 Total Volume and Efficiency Rate
Third Quarter: 2007 and 2008
16,500
16,600
16,700
16,800
16,900
17,000
17,100
17,200
Third qtr 2008 Third qtr 2007
Crim
e vo
lum
e
87.5
88.0
88.5
89.0
89.5
90.0
90.5
Effic
ienc
y ra
te
Total crimevolumeEff iciency rate
FIGURE 2 Index and Non-index Crimes
Third Quarter 2008 and 2009
0
1,000
2,000
3,000
4,000
5,000
6,000
7,000
8,000
9,000
10,000
Index crimes Non-index crimes
Type of crime
Num
ber
Third qtr 2008Third qtr 2007
FIGURE 2 Index and Non-index Crimes Third Quarter: 2007 and 2008

DEFENSE, CRIME, AND DELINQUENCY 91
By nomenclature, non-index crimes do not occur regularly, hence, they number less than index crimes. An increase of more than 4.0 percent in such crimes was observed in the period under review. Efficiency rates remained stable at 97.8 percent from only 97.2 percent (Table 7.2). NCR, again, registered the bulk of non-index crimes with 25.8 percent share of the total in that period of 2008. The ARMM reported the least in this category, from only 46 in 2007 to 31 in 2008, all of third quarter (Table 7.2). Crimes against persons trim by more than 1.0 percent
Crime situation against persons improved as volume went down by more than 1.0 percent in the period under review. Reported lion-sharer at 50.1 percent was physical injury. Murder was second with 25.8 percent share, homicide 10.8 percent, while the least went to rape at 13.3 percent.
By region, it was in the NCR where the bulk of these crimes took place, 17.0 percent of the total. The ARMM had the least with a report of 1.4 percent share (Table 7.3). Crimes against property up 5.2 percent Volume of crimes committed against property increased by more than 5.0 percent in the 2008 period-under-review, with theft garnering the bulk at 2,263 or 57.0 percent.
NCR reported the biggest
crime volume of this kind in both periods, 1,531 (38.53%) in 2008 and 1,560 (41.3%) in 2007. At the cellar was ARMM with a crime report of 13 cases (0.3%) from ten (0.6%) (Table 7.4).
FIGURE 3 Crime Against Persons Second Quarter 2008 and 2007
-
500
1,000
1,500
2,000
2,500
3,000
M urder Homicide Physicalinjury
Rape
Number
Type
of c
rime
Third qtr 2008Third qtr 2007
FIGURE 3 Crime Against Persons Third Quarter: 2007 and 2008
FIGURE 4 Crime versus Property Second Quarter 2008 and 2007
-
500
1,000
1,500
2,000
2,500
Robbery Theft
Type of crime
Num
ber
Third qtr 2008
Third qtr 2007
FIGURE 4 Crime versus Property Third Quarter: 2007 and 2008
92 JOURNAL OF PHILIPPINE STATISTICS
Human Rights Violation among Indigenous Peoples (IPs)
The information contained in this report was gathered by the Indigenous Peoples Rights Monitor (formerly Indigenous Peoples Human Rights Watch) from a series of national and regional conferences and workshops of indigenous peoples since 2004, and through written and verbal testimonies of victims of human rights violations and their families, focus group discussions with indigenous community members and leaders, fact–finding missions, and other methods. Information from the following groups has also been included: Kalipunan ng mga Katutubong Mamayan ng Pilipinas (National Federation of Indigenous Peoples of the Philippines), Cordillera Human Rights Alliance, Cordillera People’s Alliance, Legal Rights Center, Tebtebba Foundation, Philippine Indigenous Peoples Links (PIPLINKS), among others. There are framework and instruments for the promotion and protection of human rights
The Philippine Government is a signatory to the United Nations (UN) Human Rights instruments, including the Covenant on Civil and Political Rights, the Covenant on Economic, Social and Cultural Rights, and the Covenant on the Elimination of Racial Discrimination. It has also supported the UN Declaration on the Rights of Indigenous Peoples.
The Philippine Constitution has a Bill of Rights for the respect of civil and political rights. The Commission on Human Rights (CHR) was also created as the monitoring body of human rights cases.
The government’s Indigenous Peoples Rights Act (IPRA) for to the recognition of the rights of indigenous peoples was enacted in October 1997. The Free Prior and Informed Consent (FPIC) of indigenous peoples was made a requirement for any project or activities implemented in indigenous territories, or any project that may have adverse impacts on them.
Soon after its enactment, the constitutionality of IPRA was challenged in court. The law was upheld by the Supreme Court in December 2000 with an affirmation of the prior right of the State over natural resources, while indigenous peoples have stewardship rights over their land and resources. On the other hand, laws that violate the collective rights of indigenous peoples are also being implemented such as the Mining Act of 1995 which allows 100 percent foreign ownership of mineral lands and the eviction of indigenous communities; the National Integrated Protected Area Systems ( NIPAS) which provides restrictions to indigenous peoples in their own ancestral domains declared as National Parks; the Forestry Code which declares lands with 18 per cent in slope as public lands, thus making indigenous communities in mountainous areas squatters in their own lands. There are about 10 to 15 million IPs
IPs in the Philippines are estimated to be 12-15 million, or 15 percent of the total population. They occupy more than 10 million hectares of the total landmass of 30 million hectares. IPs are one of the most impoverished sectors in the country and suffer from multiple types of human rights violations.
This section will cover three
areas of human rights violations: politically motivated killings,
DEFENSE, CRIME, AND DELINQUENCY 93
militarization of the ancestral territories of IPs, and the violation of their collective rights to land and natural resources. There are political killings of IPs and continuing threats to indigenous leaders and community members asserting their collective rights
Since the Arroyo administration took power in 2001, Indigenous Peoples Rights Monitor (IPR Monitor) has documented 120 extra-judicial killings of indigenous peoples. These killings have occurred in several regions of the country, with the Lumads of Mindanao and the Igorots of the Cordillera being the most targeted groups. While the victims represent many different professions, NGO workers, local government officials, church workers, and members of indigenous leadership structures have been especially targeted because of their political beliefs or their defense of their collective rights against government projects and policies. The 120 victims include 13 women, four of whom were pregnant, and 16 minors.
The systematic extra judicial
killings of indigenous peoples and the continuing threats to indigenous leaders have additional adverse social impacts. These incidents have resulted in more conflicts, fear and mistrust among indigenous communities, which is weakening indigenous systems of cooperation and solidarity. Because of the chilling effect of the killings, it also weakened the indigenous people’s movement for the respect and recognition of their collective rights. IPs fear an escalating militarization of territories
IPs in the Philippines also suffers from militarization of their territories, resulting to the violation of their
individual and collective rights. Militarization of indigenous communities includes the permanent physical basing of the Philippine military within ancestral territories; regular conduct of military operations, including unwarranted searches of houses; imposition of food blockades, curfews and other restrictions; interrogation and harassment of suspected rebels; and the forced recruitment of IPs into para-military forces. Even with the provision for the Free, Informed and Prior Consent (FIPC) of IPs for any military operation and sustained activities in IP territories, this is blatantly ignored and violated by the military.
The largest military base on indigenous territory is Camp Peralta, a 33,310 hectare base that has been constructed on Tumanduk ancestral lands in Panay, Western Visayas. Despite the presence of 14,000 indigenous residents, the military uses the base to conduct war games and weapons testing.
Internal armed conflict and the increasing number of large-scale development projects have led the government to station troops in indigenous territories. Indigenous peoples frequently suffer from harassment because of suspected association with the New People’s Army, a communist rebel group. Because of the rugged terrain and poor infrastructure of many indigenous territories, rebel groups are often active in these areas. Consequently, the military often incorrectly associates rebel activity with indigenous peoples. The military often accuses groups of men engaged in indigenous hunting practices of involvement in rebel activities because they carry weapons. Four hunters have been killed by the military from 2003-2006 in separate incidents in the Cordillera Administrative

94 JOURNAL OF PHILIPPINE STATISTICS
Region because they were suspected to be rebel soldiers.
Further exacerbating the problems of militarization within indigenous areas has been the government’s establishment of paramilitary groups, known as Civilian Armed Forces Geographical Units (CAFGUs). In some areas, the military has established recruitment quotas, such as in Kalinga Province, which has led to the forced recruitment of indigenous peoples into paramilitary groups. The military has also exploited the lack of jobs and tribal land disputes and other conflicts to draw recruits into the paramilitary force. This has become an effective strategy for divide and rule, further weakening the unity, cohesion and cooperation of indigenous communities. It has also led to the creation of government-supported vigilante groups such as in San Luis, Agusan Del Sur, Bukidnon and North Cotabato in Mindanao. There is reported violation of the collective rights of IPs to their land and resources (cases of worsening development aggression)
The widespread implementation of extractive industries and other development projects in indigenous territories without their consent is out rightly violating their collective rights and is worsening their marginalized situation. This includes corporate mining, large dams and other energy projects, massive agri-business, eco-tourism, among others, which are also seriously undermining the peace, security and development of indigenous communities. Their adverse impact include the destruction of livelihoods, the environment, land, resources and properties and has also caused conflicts, divisions and the erosion of indigenous socio-political systems. Inspite of the widespread opposition of
indigenous communities to corporate mining, the Philippine government opened more than five million hectares of ancestral land for mineral exploitation by local and multinational mining companies under the Mining Act of 1995. Of the 23 mining projects given priority status by the Arroyo administration in 2006, 18 fall within indigenous lands.
Further, seven “priority” large dams are to be built in locations that will directly affect indigenous communities. The development of extractive industries such as dams, geothermal plants and large mines typically leads to militarization of the surrounding areas by both military and paramilitary groups to secure “development sites” and neutralize opposition of affected communities. In Talaingod, Davao del Norte, in Mindanao, soldiers deployed near a dam construction site forced fifty families to evacuate and then occupied their homes in November 2005. Likewise, the conversion of ancestral land to agri-business such as palm oil, abaca, coffee, temperate vegetables and other crops is now directly threatening the food security of indigenous peoples, and is weakening indigenous systems of resource management and conservation. Compounding this problem is the conversion of several ancestral lands into eco-tourism projects, managed by non-indigenous business interest groups or by profiteers.
Given the drive for resource extraction and exploitation, the government and private corporations have failed miserably to adequately implement and follow the provisions of the FPIC in development and resource extraction projects and in military activities in IP territories. Fraudulent FPIC certificates have been presented by mining corporations which was accepted by the National Commission of
DEFENSE, CRIME, AND DELINQUENCY 95
Indigenous Peoples (NCIP) such as in the case of the TVI-Pacific in Zamboanga del Norte, among others. In exchange for land concessions to extractive industries, indigenous peoples are often promised jobs and basic social services. Such efforts exploit their impoverished state, effectively asking indigenous peoples to trade off their land and resources in order to be provided basic services enjoyed by other citizens. This act is not only discriminatory but also underscores the government’s neglect, if not denial, of basic social services to indigenous communities while at the same time violating the collective rights of IPs over their land and resources. Philippine government reports on its compliance record reasons out on its inability to comply with international human rights instruments
Based on the Philippine Reports of the Official Missions of the UN Special Rapporteurs Prof. Rodolfo Stavenhagen and Prof. Philip Alston, there is reluctance on the part of the Philippine government to fully acknowledge the extent and seriousness of the human rights situation of the country. In spite of the recommendations made by the UN Special Rapporteurs to abate the worsening human rights situation, there are no clear mechanisms on how the government will decisively implement these recommendations to arrest the escalating cases of human rights violations across the country.
Even with the implementation of the Indigenous Peoples Rights Act (IPRA), the collective rights of indigenous peoples especially to their ancestral land rights continue to be violated with the situation even worsening. One major reason is the conflicting laws and policies pertaining
to ownership, control, management and development of land and resources. Another is the lack of political will on the part of the government to protect and respect the rights of indigenous peoples over the vested interest of corporations, big business, landlords and politicians. There is also an absence of accountability mechanisms for the officials and staff of the NCIP and other government agencies which are proven to be involved in the manipulation of FPIC, accepting bribes or being negligent in their sworn duties and obligations in upholding the rights and interest of indigenous peoples. Recommendations to the Philippine government or authorities 1. To acknowledge the Philippine Reports of the UN Special Rapporteurs, Professor Rodolfo Stavenhagen and Professor Philip Alston, and fully implement their recommendations with urgency and priority 2. To review IPRA and other laws in conflict with IPRA and the UN Declaration on the Rights of Indigenous Peoples (UNDRIP) in order to ensure the respect and recognition of the collective rights of indigenous peoples. Towards this end, laws and policies in violation of the collective rights of indigenous peoples shall be repealed 3. To establish an independent body to certify whether the conduct of FPIC was done in accordance with the principles, substance and processes as defined by UN Permanent Forum on Indigenous Issues (UNPFii) 4. To establish a complaint mechanism to address the violation related to FPIC and appropriate measures for redress 5. To conduct regular dialogues with indigenous leaders and families of
96 JOURNAL OF PHILIPPINE STATISTICS
victims on concrete measures undertaken to address human rights violations of indigenous peoples and to discuss key issues related to the respect for the rights of indigenous peoples. Recommendations to the international community to assist the Philippine Government /authorities 1. To assist the Philippine government in implementing the recommendations as stated in the Philippine Reports of the UN Special Rapporteurs
2. To provide technical and other forms of support to the Philippine government for their implementation of the UN Declaration on the Rights of Indigenous Peoples (UNDRIP). Mechanism for follow up 1. To establish a mechanism, with direct participation of indigenous experts, that will monitor and coordinate efforts in addressing the human rights situation of indigenous peoples under the Human Rights Council.

DEFENSE, CRIME, AND DELINQUENCY 97
Third Quarter 2008 Third Quarter 2007
Efficiency EfficiencyRate Rate
Philippines 17,124 15,396 89.91 16,710 14,771 88.40
NCR 4,444 4,126 92.84 4,595 4,222 91.88CAR 248 229 92.34 375 341 90.93I - Ilocos Region 865 790 91.33 803 703 87.55II - Cagayan Valley 393 352 89.57 448 399 89.06III - Central Luzon 1,309 1,150 87.85 1,374 1,197 87.12IVA - CALABARZON 1,485 1,367 92.05 1,420 1,264 89.01IVB - MIMAROPA 396 369 93.18 311 290 93.25V - Bicol Region 614 562 91.53 493 450 91.28VI - Western Visayas 747 698 93.44 778 728 93.57VII - Central Visayas 2,283 1,814 79.46 2,116 1,755 82.94VIII - Eastern Visayas 605 555 91.74 603 546 90.55IX - Zamboanga Peninsula 444 369 83.11 524 483 92.18X - Northern Mindanao 885 821 92.77 853 770 90.27XI - Davao Region 1,383 1,248 90.24 907 721 79.49XII - SOCCSKSARGEN 546 538 98.53 594 511 86.03Caraga 354 317 89.55 319 233 73.04ARMM 123 91 73.98 197 158 80.20
Source: Philippine National Police
Index Crimes
Third Quarter 2008 Third Quarter 2007
Efficiency EfficiencyRate Rate
Philippines 9,486 7,930 83.60 9,368 7,638 81.53
NCR 2,468 2,224 90.11 2,449 2,166 88.44CAR 182 163 89.56 236 204 86.44I - Ilocos Region 383 308 80.42 362 269 74.31II - Cagayan Valley 200 161 80.50 223 174 78.03III - Central Luzon 632 503 79.59 591 465 78.68IVA - CALABARZON 739 629 85.12 780 635 81.41IVB - MIMAROPA 195 169 86.67 180 160 88.89V - Bicol Region 376 328 87.23 309 268 86.73VI - Western Visayas 517 471 91.10 492 445 90.45VII - Central Visayas 1,440 987 68.54 1,309 955 72.96VIII - Eastern Visayas 365 317 86.85 378 322 85.19IX - Zamboanga Peninsula 317 243 76.66 367 329 89.65X - Northern Mindanao 503 451 89.66 462 391 84.63XI - Davao Region 523 392 74.95 469 291 62.05XII - SOCCSKSARGEN 335 329 98.21 373 294 78.82Caraga 219 185 84.47 237 155 65.40ARMM 92 70 76.09 151 115 76.16
Continued
TABLE 7.2 Index and Non-index Crimes by RegionThird Quarter 2007 and 2008
Solved
Region
Volume Solved Volume
TABLE 7.1 Total Crime Volume and Efficiency Rate by RegionThird Quarter 2007 and 2008
SolvedRegion
Volume Solved Volume

JOURNAL OF PHILIPPINE STATISTICS
Table 7.2 -- Concluded
Non-index Crimes
Third Quarter 2008 Third Quarter 2007
Efficiency EfficiencyRate Rate
Philippines 7,638 7,466 97.75 7,342 7,133 97.15NCR 1,976 1,902 96.26 2,146 2,056 95.81CAR 66 66 100.00 139 137 98.56I - Ilocos Region 482 482 100.00 441 434 98.41II - Cagayan Valley 193 191 98.98 225 225 100.00III - Central Luzon 677 647 95.75 783 732 93.49IVA - CALABARZON 746 738 98.93 640 629 98.28IVB - MIMAROPA 201 200 99.50 131 130 99.24V - Bicol Region 238 234 98.32 184 182 98.91VI - Western Visayas 230 227 98.70 286 283 98.95VII - Central Visayas 843 827 98.10 807 800 99.13VIII - Eastern Visayas 240 238 99.17 225 224 99.56IX - Zamboanga Peninsula 127 126 99.21 157 154 98.09X - Northern Mindanao 382 370 96.86 391 379 96.93XI - Davao Region 860 856 99.53 438 430 98.17XII - SOCCSKSARGEN 211 209 99.05 221 217 98.19XIII - Caraga 135 132 97.78 82 78 95.12ARMM 31 21 67.78 46 43 93.48
Source: Philippine National Police
Volume Solved
98
Region
Volume Solved

Crime Against Persons
Third Quarter 2008 Third Quarter 2007
Physical PhysicalInjury Injury
Philippines 5,514 1,424 593 2,763 734 5,594 1,565 702 2,739 588
NCR 937 112 53 696 76 889 136 73 614 66CAR 119 17 13 65 24 164 23 24 90 27I - Ilocos Region 277 67 37 133 40 267 71 27 128 41II - Cagayan Valley 150 35 21 68 26 156 59 39 53 5III - Central Luzon 377 106 58 148 65 354 102 49 155 48IVA - CALABARZON 478 140 91 199 48 512 155 113 201 43IVB - MIMAROPA 157 45 16 62 34 151 43 27 56 25V - Bicol Region 261 76 32 73 80 227 73 36 77 41VI - Western Visayas 375 97 54 139 85 392 92 62 165 73VII - Central Visayas 703 105 39 502 57 709 123 62 477 47VIII - Eastern Visayas 289 96 47 126 20 306 125 41 116 24IX - Zamboanga Peninsula 248 69 38 123 18 264 78 22 144 20X - Northern Mindanao 288 127 19 100 42 258 87 45 96 30XI - Davao Region 373 135 26 143 69 360 162 27 118 53XII - SOCCSKSARGEN 221 75 26 94 26 272 78 24 136 34XIII - Caraga 182 71 22 72 17 183 85 17 73 8ARMM 79 51 1 20 7 130 73 14 40 3
Source: Philippine National Police
Rape
TABLE 7.3 Crime Against Persons by Region: Third Quarter 2007 and 2008
RegionHomicide Rape Total Murder HomicideMurderTotal

DEFENSE, CRIME, AND DELINQUENCY 99
Crime Against Property
Third Quarter 2008 Third Quarter 2007
Total
Philippines 3,972 1,709 2,263 3,774 1,616 2,158
NCR 1,531 670 861 1,560 732 828CAR 63 26 37 72 21 51I - Ilocos Region 106 37 69 95 43 52II - Cagayan Valley 50 31 19 67 30 37III - Central Luzon 255 142 113 237 129 108IVA - CALABARZON 261 128 133 268 121 147IVB - MIMAROPA 38 23 15 29 18 11V - Bicol Region 115 53 62 82 38 44VI - Western Visayas 142 61 81 100 51 49VII - Central Visayas 737 266 471 600 206 394VIII - Eastern Visayas 76 28 48 72 34 38IX - Zamboanga Peninsula 69 46 23 103 27 76X - Northern Mindanao 215 71 144 204 61 143XI - Davao Region 150 59 91 109 42 67XII - SOCCSKSARGEN 114 37 77 101 33 68Caraga 37 22 15 54 19 35ARMM 13 9 4 21 11 10
Source: Philippine National Police
Theft
Region
Robbery Theft
TABLE 7.4 Crime Against Property by Region: Third Quarter 2007 and 2008
Total Robbery

Population/Group
Abelling/ Aborlin
Adasen Aeta Aeta-Abiyan
Aeta-Remontado Agta Alangan
Mangyan Applai
Philippines 29,963 11,174 90,588 20,786 33,666 117,481 79,231 178,294
NCR - - - - - - - -CAR - 11,174 932 - - 794 - 169,915I - Ilocos Region - - 170 - - 170 - 6,148II - Cagayan Valley - - 1,829 - - 1,829 - 2,017III - Central Luzon 29,963 - 87,657 - - 87,657 - 214IV - Southern Tagalog - - - - 33,666 11,239 79,231 -V - Bicol Region - - - 20,786 - 15,792 - -VI - Western Visayas - - - - - - - -VII - Central Visayas - - - - - - - -VIII - Eastern Visayas - - - - - - - -IX - Zamboanga Peninsula - - - - - - - -
Continued
Region
TABLE 7.5 Population and Location of Indigenous People by Region: 2000

DEFENSE, CRIME, AND DELINQUENCY 105
Table 7.5 -- Concluded
Population/GroupYakan Yogad
Philippines 120,165 64,098
NCR - -CAR - 374I - Ilocos Region - -II - Cagayan Valley - 63,724III - Central Luzon - -IV - Southern Tagalog - -V - Bicol Region - -VI - Western Visayas - -VII - Central Visayas - -VIII - Eastern Visayas - -IX - Zamboanga Peninsula 120,165 -X - Northern Mindanao - -XI - Davao Region - -XII - SOCCSKSARGEN - -Caraga - -ARMM - -
Sources: National Statistics Office, 2000 Census of PopulationSources: National Commission for Indigenous People
Area Number
Politically motivated killings 120Militarization of ancestral territories 5Collective rights to land and natural resources 18
Sources: National Commission for Indigenous People
TABLE 7.6 Areas of Human Rights Violations of Indigenous People: 2003
Region